AVNET INC
10-Ks and 10-Qs
|
|
|
|
|
|
|
|
|
|
|
|
|
|
|
|
|
|
|
|
|
|
|
|
|
|
|
|
|
|
|
|
|
|
|
|
|
|
|
|
|
|
|
|
|
|
|
|
|
|
|
|
|
|
|
|
|
|
|
UNITED STATES SECURITIES AND EXCHANGE COMMISSION
Washington, D.C. 20549
__________________________________________________
Form 10-K
|
þ
|
|
ANNUAL REPORT PURSUANT TO SECTION 13 OR 15(d) OF THE SECURITIES EXCHANGE ACT OF 1934
|
For the fiscal year ended
June 28, 2014
or
|
o
|
|
TRANSITION REPORT PURSUANT TO SECTION 13 OR 15(d) OF THE SECURITIES EXCHANGE ACT OF 1934
|
For the transition period from
to
Commission file number 1-4224
Avnet, Inc.
(Exact name of registrant as specified in its charter)
|
New York
(State or other jurisdiction of incorporation or organization)
|
11-1890605
(I.R.S. Employer Identification No.)
|
|
2211 South 47th Street,
Phoenix, Arizona
(Address of principal executive offices)
|
85034
(Zip Code)
|
Registrant’s telephone number, including area code (480) 643-2000
Securities registered pursuant to Section 12(b) of the Act:
|
Title of Each Class
|
Name of Each Exchange on Which Registered
|
|
|
Common Stock
|
New York Stock Exchange
|
|
Securities registered pursuant to Section 12(g) of the Act:
None
Indicate by check mark if the registrant is a well-known seasoned issuer, as defined in Rule 405 of the Securities Act. Yes
þ
No
o
Indicate by check mark if the registrant is not required to file reports pursuant to Section 13 or Section 15(d) of the Act. Yes
o
No
þ
Indicate by check mark whether the registrant (1) has filed all reports required to be filed by Section 13 or 15(d) of the Securities Exchange Act of 1934 during the preceding 12 months (or for such shorter period that the registrant was required to file such reports), and (2) has been subject to such filing requirements for the past 90 days. Yes
þ
No
o
Indicate by check mark whether the registrant has submitted electronically and posted on its corporate Web site, if any, every Interactive Data File required to be submitted and posted pursuant to Rule 405 of Regulation S-T during the preceding 12 months (or for such shorter period that the registrant was required to submit and post such files). Yes
þ
No
o
Indicate by check mark if disclosure of delinquent filers pursuant to Item 405 of Regulation S-K is not contained herein, and will not be contained, to the best of registrant’s knowledge, in definitive proxy or information statements incorporated by reference in Part III of this Form 10-K or any amendment to this Form 10-K.
þ
Indicate by check mark whether the registrant is a large accelerated filer, an accelerated filer, a non-accelerated filer, or a smaller reporting company. See the definitions of “large accelerated filer,” “accelerated filer” and “smaller reporting company” in Rule 12b-2 of the Exchange Act.
|
Large accelerated filer
þ
|
Accelerated filer
o
|
Non-accelerated filer
o
(Do not check if a smaller reporting company)
|
Smaller reporting company
o
|
Indicate by check mark whether the registrant is a shell company (as defined in Rule 12b-2 of the Exchange Act). Yes
o
No
þ
The aggregate market value (approximate) of the registrant’s common equity held by non-affiliates based on the closing price of a share of the registrant’s common stock for New York Stock Exchange composite transactions on
December 27, 2013
(the last business day of the registrant’s most recently completed second fiscal quarter) was
$5,951,617,754
.
As of
July 25, 2014
, the total number of shares outstanding of the registrant’s Common Stock was
138,259,004
shares, net of treasury shares.
DOCUMENTS INCORPORATED BY REFERENCE
Portions of the registrant’s definitive proxy statement (to be filed pursuant to Reg. 14A) relating to the Annual Meeting of Shareholders anticipated to be held on
November 6, 2014
are incorporated herein by reference in Part III of this Report.
1
TABLE OF CONTENTS
|
|
Page
|
|
|
|
|
|
|
|
|
|
|
|
|
|
|
|
|
|
|
|
|
|
|
|
|
|
|
|
|
|
|
|
|
|
|
|
|
|
|
|
|
|
|
|
|
|
|
|
|
|
|
|
|
|
|
|
|
|
|
|
|
|
|
|
|
|
|
|
|
|
2
Avnet, Inc., incorporated in New York in 1955, together with its consolidated subsidiaries (the “Company” or “Avnet”), is a global value-added distributor of electronic components, enterprise computer and storage products, IT solutions and services and embedded subsystems. Avnet creates a vital link in the technology supply chain that connects the world’s leading electronic component and computer product manufacturers and software developers with a global customer base of original equipment manufacturers (“OEMs”), electronic manufacturing services (“EMS”) providers, original design manufacturers (“ODMs”), systems integrators ("SIs"), independent software vendors ("ISVs") and value-added resellers (“VARs”). Avnet distributes electronic components, computer products and software, as received from its suppliers or through a customized solution, and offers assembly and other value-added services. In addition, Avnet provides engineering design, materials management and logistics services, system integration and configuration and supply chain services customized to meet specific requirements of customers and suppliers.
Organizational Structure
Avnet has two primary operating groups — Electronics Marketing (“EM”) and Technology Solutions (“TS”). Both operating groups have operations in each of the three major economic regions of the world: the Americas; Europe, the Middle East and Africa (“EMEA”); and Asia/Pacific, consisting of Asia, Australia and New Zealand (“Asia” or “Asia/Pac”). Each operating group has its own management team led by a group president and includes regional presidents and senior executives within the operating group who manage various functions within the businesses. Each operating group also has distinct financial reporting that is evaluated at the corporate level on which operating decisions and strategic planning for the Company as a whole are made. Divisions ("business units") exist within each operating group that serve primarily as sales and marketing units to further streamline the sales and marketing efforts within each operating group and enhance each operating group’s ability to work with its customers and suppliers, generally along more specific product lines or geographies. However, each business unit relies heavily on the support services provided by the operating group as well as centralized support at the corporate level.
Avnet’s operating groups and their sales by region are as follows:
|
Region
|
Fiscal 2014 Sales
|
Percentage of Sales
|
||||
|
|
(Billions)
|
|
|
|||
|
EM Americas
|
$
|
4.8
|
|
17.6
|
%
|
|
|
EM EMEA
|
5.1
|
|
18.5
|
|
||
|
EM Asia
|
6.6
|
|
24.0
|
|
||
|
Total EM
|
16.5
|
|
60.1
|
|
||
|
TS Americas
|
6.1
|
|
22.1
|
|
||
|
TS EMEA
|
3.2
|
|
11.5
|
|
||
|
TS Asia
|
1.7
|
|
6.3
|
|
||
|
Total TS
|
11.0
|
|
39.9
|
|
||
|
Total Avnet
|
$
|
27.5
|
|
100.0
|
%
|
|
A description of each operating group is presented below. Further financial information by operating group and region is provided in Note 16 to the consolidated financial statements appearing in Item 15 of this Report.
Electronics Marketing
EM markets and sells semiconductors, interconnect, passive and electromechanical devices (“IP&E”) and embedded products for the world’s leading electronic component manufacturers. With a global reach that extends to more than 70 countries, EM's products and services cater to a diverse customer base serving many end-markets including automotive, communications, computer hardware and peripherals, industrial and manufacturing, medical equipment, and defense and aerospace. EM also offers an array of value-added services that help customers evaluate, design-in and procure electronic components throughout the lifecycle of their technology products and systems. By working with EM, customers and suppliers can accelerate their time to market and realize cost efficiencies in both the design and manufacturing process.
3
EM Design Chain Services
EM offers design chain services that provide engineers with a host of technical design solutions that serve as an extension of their sales force making it economically viable to reach a customer segment that seeks complex products and technologies. With access to a suite of design tools and engineering services from any point in the design cycle, customers can get product specifications along with evaluation kits and reference designs that enable a broad range of applications from concept through detailed design including new product introduction. EM also offers engineering and technical resources deployed globally to support product design, bill of materials development, design services and technical education and training. By utilizing EM’s design chain services, customers can optimize their component selection and accelerate their time to market. The extensive technology line card EM offers provides access to a diverse range of global customers.
EM Supply Chain Services
EM supply chain services provide end-to-end solutions focused on OEMs, EMS providers and electronic component manufacturers, enabling them to optimize supply chains on a local, regional or global basis. By combining internal competencies in global warehousing and logistics, finance, information technology and asset management with its global footprint and extensive partner relationships, EM’s supply chain services develop a deeper level of engagement with its customers. These customers can continuously manage their supply chains to meet the demands of a competitive environment globally without a commensurate investment in physical assets, systems and personnel. With proprietary planning tools and a variety of inventory management solutions, EM can provide unique solutions that meet a customer’s just-in-time requirements and minimize risk in a variety of scenarios including lean manufacturing, demand flow and outsourcing.
Embedded Solutions
In the Americas, Avnet Embedded provides embedded computing solutions including technical design, integration and assembly to developers of application-specific computing solutions in the non-PC market. Customers include OEMs targeting the medical, telecommunications, industrial and digital editing markets.
In EMEA, MSC Technologies provides solutions for intelligent embedded and innovative display solutions primarily targeting industrial applications. The business unit sells touch and passive displays and offers customer-specific display solutions based on in-house technologies. In addition, the business unit develops and manufactures standard board and industrial subsystems and application-specific devices that enable it to produce specialized systems tailored to specific customer requirements.
EM Sales and Marketing Divisions
Each of EM’s regions has sales and marketing business units that generally focus on a specific customer segment, particular product lines or a specific geography. The business units offer access to one of the industry’s broadest line cards and convenient one-stop shopping with an emphasis on responsiveness, engineering support, on-time delivery and quality. Certain specialty services are made available to the individual business units through common support service units. Customers are further supported by a sophisticated e-Commerce platform, Avnet Express, which includes a host of powerful functions such as parametric search capabilities for component part selection, bill of material optimization and component cross-referencing. The site enables end-to-end online service from part and inventory searches, price checking and ordering to online payment. EM Americas addresses the needs of its customers and suppliers through focused channels to service small- to medium-sized customers, global customers, defense and aerospace customers and contract manufacturers. In EMEA, business units, which are organized by semiconductors, IP&E and embedded products and supply chain services, address customers on both a pan-European and regional basis. EM Asia goes to market with sales and marketing business units within China, South Asia, Australia, New Zealand and Taiwan. EM Japan has sales and marketing business units to serve Japanese OEMs in Japan, Southeast Asia and China. All regions within EM provide the design chain services and supply chain services described above.
Technology Solutions
As a leading global IT solutions distributor, TS focuses on the value-added distribution of enterprise computing servers and systems, software, storage, services and complex solutions from the world’s foremost technology manufacturers. TS partners with its customers and suppliers to create and deliver effective data center and IT lifecycle solutions that solve the business challenges of end-user customers around the world. TS serves a number of customer segments, from VARs, SIs and ISVs to worldwide OEMs. It also serves non-PC OEMs requiring embedded systems and solutions including engineering, product prototyping, integration and other value-added services. In addition, TS provides the latest hard disk drives, microprocessor, motherboard and DRAM module technologies to manufacturers of general-purpose computers and system builders. The operating group has dedicated sales and marketing teams serving these customer segments.
4
Customers rely on TS' supplier relationships and experienced sales, marketing, technical and financial experts to help them identify and capitalize on business opportunities in high-growth technologies, vertical markets and geographies to close deals quickly and profitably. Suppliers rely on TS' technology expertise and global scale and scope to broaden their customer base and grow sales in markets around the world. TS' ecosystem of highly-trained and knowledgeable VARs serve as extensions of suppliers' sales forces to deliver complex IT solutions. Through its dedicated practices, Avnet's SolutionsPath® provides partners with the education, tools, resources and skills needed around core data center technologies: big data and analytics, cloud, converged infrastructure, mobility, storage and security and networking. Additionally, Avnet provides select partners with the specialization required to successfully sell these solutions into high-growth vertical markets including energy, finance, government, healthcare and retail.
Avnet Services
Avnet Services is a global business unit within TS. Its industry experts provide a robust portfolio of businesses, IT lifecycle, education, cloud and managed solutions. These experts sell and deliver complex IT solutions to a variety of channel partners, including VARs, ISVs, SIs and OEMs. These solutions may include any combination of services, software, and hardware. The Avnet Services team specializes in, but is not limited to, infrastructure and application management, business commerce and analytics, cloud enablement, big data, aftermarket and IT lifecycle services, and multilingual vendor accredited training. To continue to meet customer expectations in an evolving IT ecosystem, the Avnet Services team is focused on delivering solutions that expand customers' product delivery capabilities, extend their reach and resources, and enhance project success and return on investment for deployments through the entire IT lifecycle.
TS continues to seek out investments in geographic, technology and vertical markets with high growth potential via strategic, value-creating acquisitions and organic local market development. These investments ensure that TS has the critical scale and local market expertise in place when and where its customers and suppliers want to do business so that they can capture opportunities quickly and with less risk and cost.
Foreign Operations
As noted in the operating group discussions, Avnet has significant operations in all three major economic regions of the world: the Americas, EMEA and Asia/Pac. The percentage of Avnet’s consolidated sales by region is presented in the following table:
|
|
Percentage of Sales for Fiscal Year
|
|||||||
|
Region
|
2014
|
|
2013
|
|
2012
|
|
||
|
Americas
|
40
|
%
|
42
|
%
|
45
|
%
|
||
|
EMEA
|
30
|
|
29
|
|
29
|
|
||
|
Asia/Pac
|
30
|
|
29
|
|
26
|
|
||
|
|
100
|
%
|
100
|
%
|
100
|
%
|
||
Avnet’s foreign operations are subject to a variety of risks. These risks are discussed further under
Risk Factors
in Item 1A and under
Quantitative and Qualitative Disclosures About Market Risk
in Item 7A of this Report. Additionally, the specific translation impacts of foreign currency fluctuations, most notably the Euro, on the Company’s consolidated financial statements are further discussed in
Management’s Discussion and Analysis of Financial Condition and Results of Operations
in Item 7 of this Report.
Acquisitions
Avnet has historically pursued a strategic acquisition program to further its strategic objectives and support key business initiatives. This program was a significant factor in Avnet becoming one of the largest value-added distributors of electronic components, enterprise computer and storage products, IT services and embedded subsystems. Avnet expects to continue to pursue strategic acquisitions to expand its market presence, increase its scale and scope, and increase its product or service offerings.
During fiscal
2014
, the Company completed
three
acquisitions with aggregate annualized sales of approximately
$492.0 million
. See Item 7.
Management’s Discussion and Analysis of Financial Condition and Results of Operations
in Part II of this Form 10-K for additional information on acquisitions completed during fiscal
2014
,
2013
and
2012
.
5
Major Products
One of Avnet’s competitive strengths is the breadth and quality of the suppliers whose products it distributes.
IBM
products accounted for approximately
13%
,
12%
and
11%
of the Company’s consolidated sales during fiscal
2014
,
2013
and
2012
, respectively, and was the only supplier from which sales of its products exceeded 10% of consolidated sales. Listed in the table below are the major product categories and the Company’s approximate sales of each during the past three fiscal years:
|
|
Years Ended
|
||||||||||
|
June 28,
2014 |
June 29,
2013 |
June 30,
2012 |
|||||||||
|
|
(Millions)
|
||||||||||
|
Semiconductors
|
$
|
13,160.9
|
|
$
|
13,720.8
|
|
$
|
13,461.6
|
|
||
|
Computer products
|
10,571.6
|
|
9,346.0
|
|
9,984.4
|
|
|||||
|
Connectors
|
794.7
|
|
687.6
|
|
667.5
|
|
|||||
|
Passives, electromechanical and other
|
2,972.5
|
|
1,704.5
|
|
1,594.0
|
|
|||||
|
|
$
|
27,499.7
|
|
$
|
25,458.9
|
|
$
|
25,707.5
|
|
||
Competition & Markets
The electronic components and computer products industries continue to be extremely competitive and are subject to rapid technological advances. The Company’s major competitors include Arrow Electronics, Inc., Future Electronics and World Peace Group, and, to a lesser extent, Ingram Micro, Inc. and Tech Data Corp. There are also certain smaller, specialized competitors who generally focus on narrower regions, markets, products or particular sectors. In addition, the Company may compete with its own suppliers that maintain a direct salesforce. As a result of these factors, Avnet must remain competitive in its pricing of goods and services.
A key competitive factor in the electronic component and computer product distribution industry is the need to carry a sufficient amount of inventory to meet customers’ rapid delivery requirements. To minimize its exposure related to valuation of inventory on hand, the majority of the Company’s products are purchased pursuant to non-exclusive distributor agreements, which typically provide certain protections for product obsolescence and price erosion. These agreements are generally cancelable upon 30 to 180 days’ notice and, in most cases, provide for inventory return privileges upon cancellation. In addition, the Company enhances its competitive position by offering a variety of value-added services, which entail the performance of services and/or processes tailored to individual customer specifications and business needs such as point of use replenishment, testing, assembly, supply chain management and materials management. For the year ended
June 28, 2014
, service sales constituted less than 10% of the Company's total sales.
A competitive advantage is the size of the Company's supplier base. Because of the number of Avnet’s suppliers, many customers can simplify their procurement process and make all of their required purchases from Avnet, rather than purchasing from several different vendors.
Seasonality
Historically, Avnet’s business has not been materially impacted by seasonality, with the exception of a relatively minor impact on consolidated results from the growth in sales at the TS business during the December quarter primarily driven by the calendar year end selling and buying patterns of key suppliers and customers, respectively.
Number of Employees
At
June 28, 2014
, Avnet had approximately
19,000
employees.
Available Information
The Company files its annual report on Form 10-K, quarterly reports on Form 10-Q, current reports on Form 8-K, proxy statements and other documents with the U.S. Securities and Exchange Commission (“SEC”) under the Securities Exchange Act of 1934. A copy of any document the Company files with the SEC is available for review at the SEC’s public reference room, 100 F Street, N.E., Washington, D.C. 20549. The public may obtain information on the public reference room by calling the SEC at 1-800-SEC-0330. The Company’s SEC filings are also available to the public on the SEC’s website at
http://www.sec.gov
and through the New York Stock Exchange (“NYSE”), 20 Broad Street, New York, New York 10005, on which the Company’s common stock is listed.
6
A copy of any of the Company’s filings with the SEC, or any of the agreements or other documents that constitute exhibits to those filings, can be obtained by request directed to the Company at the following address and telephone number:
Avnet, Inc.
2211 South 47
th
Street
Phoenix, Arizona 85034
(480) 643-2000
Attention: Corporate Secretary
The Company also makes these filings available, free of charge, through its website (see “Avnet Website” below).
Avnet Website
In addition to the information about Avnet contained in this Report, extensive information about the Company can be found at
www.avnet.com
, including information about its management team, products and services and corporate governance practices.
The corporate governance information on the website includes the Company’s Corporate Governance Guidelines, the Code of Conduct and the charters for each of the committees of Avnet’s Board of Directors. In addition, amendments to the Code of Conduct, committee charters and waivers granted to directors and executive officers under the Code of Conduct, if any, will be posted in this area of the website. These documents can be accessed at
www.avnet.com
under the “Investor Relations — Corporate Governance” caption. Printed versions of the Corporate Governance Guidelines, Code of Conduct and charters of the Board committees can be obtained, free of charge, by writing to the Company at the address listed above in “Available Information.”
In addition, the Company’s Annual Report on Form 10-K, Quarterly Reports on Form 10-Q, Current Reports on Form 8-K and amendments to those reports, if any, filed or furnished pursuant to Section 13(a) or 15(d) of Securities Exchange Act of 1934, as well as Section 16 filings made by any of the Company’s executive officers or directors with respect to Avnet common stock, are available on the Company’s website (
www.avnet.com
under the “Investor Relations — SEC Filings” caption) as soon as reasonably practicable after the report is electronically filed with, or furnished to, the Securities and Exchange Commission.
These details about Avnet’s website and its content are only for information. The contents of the Company’s website are not, nor shall they be deemed to be, incorporated by reference in this Report.
Forward-Looking Statements and Risk Factors
This Report contains forward-looking statements with respect to the financial condition, results of operations and business of Avnet. These statements are generally identified by words like “believes,” “plans,” “expects,” “anticipates,” “should,” “will,” “may,” “estimates” or similar expressions. Forward-looking statements are subject to numerous assumptions, risks and uncertainties. Except as required by law, Avnet does not undertake any obligation to update any forward-looking statements, whether as a result of new information, future events or otherwise. Factors that may cause actual results to differ materially from those contained in the forward-looking statements include those discussed below.
The factors discussed below make the Company’s operating results for future periods difficult to predict and, therefore, prior results are not necessarily indicative of results to be expected in future periods. Any of the below factors, or any other factors discussed elsewhere in this Report, may have an adverse effect on the Company’s financial results, operations, prospects and liquidity. The Company’s operating results have fluctuated in the past and likely will continue to do so. If the Company’s operating results fall below its forecasts and the expectations of public market analysts and investors, the trading price of the Company’s common stock will likely decrease.
Economic weakness and uncertainty could adversely affect the Company’s results and prospects.
The Company's financial results, operations and prospects depend significantly on worldwide economic conditions, the demand for its products and services, and the financial condition of its customers and suppliers. Economic weakness and uncertainty have in the past resulted, and may result in the future, in decreased revenues, margins, earnings and asset impairments, including goodwill and other intangible assets. Economic weakness and uncertainty may also lead the Company to take restructuring actions and reduce associated expenses in response to decreased revenues or margins. The Company may not be able to adequately adjust its cost structure in a timely fashion, which may adversely impact its profitability. Economic weakness and uncertainty also make it more difficult for the Company to manage inventory levels and/or collect customer receivables, which may result in reduced access to liquidity and higher financing costs.
7
The electronic components and computer industries are highly competitive and if the Company fails to compete effectively, its revenues, gross profit margins and prospects may decline.
The market for the Company's products and services is very competitive and subject to rapid technological advances, new market entrants, non-traditional competitors, changes in industry standards and changes in customer needs. Not only does the Company compete with other global distributors, it also competes for customers with regional distributors and some of the Company's own suppliers that maintain direct sales efforts. The Company's failure to maintain and enhance its competitive position could adversely affect its business and prospects. Furthermore, the Company's efforts to compete in the marketplace could cause deterioration of gross profit margins and, thus, overall profitability.
The size of the Company's competitors vary across market sectors, as do the resources the Company has allocated to the sectors and geographic areas in which it does business. Therefore, some competitors may have greater resources or a more extensive customer base than the Company has in one or more of its market sectors and geographic areas, which may result in the Company not being able to effectively compete in certain markets which could impact the Company's profitability and prospects.
An industry down-cycle in semiconductors could significantly affect the Company's operating results as a large portion of revenues and gross profit come from sales of semiconductors, which is a highly cyclical industry.
The semiconductor industry historically has experienced periodic fluctuations in product supply and demand, often associated with changes in technology and manufacturing capacity, and is generally considered to be highly cyclical. During each of the last three fiscal years, sales of semiconductors represented approximately 50% of the Company's consolidated revenues, and the Company's revenues, particularly those of EM, closely follow the strength or weakness of the semiconductor industry. While the Company attempts to identify changes in market conditions as soon as possible, the dynamics of the industry make prediction of and timely reaction to such changes difficult. Future downturns in the technology industry, particularly in the semiconductor sector, could adversely affect the Company's operating results and negatively impact the Company's ability to maintain its current profitability levels.
Failure to maintain its relationships with key suppliers could adversely affect the Company’s sales.
One of the Company's competitive strengths is the breadth and quality of the suppliers whose products the Company distributes. However, sales of products and services from one of the Company's suppliers, IBM, accounted for approximately 13% of the Company's consolidated revenues in fiscal 2014. Management expects IBM products and services to continue to account for roughly a similar percentage of the Company's consolidated sales in fiscal 2015. The Company's contracts with its suppliers, including those with IBM, vary in duration and are generally terminable by either party at will upon notice. To the extent IBM or other primary suppliers significantly reduce their volume of business with the Company in the future, because of a product shortage, an unwillingness to do business with Avnet, or otherwise, the Company's business and relationships with its customers could be negatively affected because its customers depend on the Company's distribution of electronic components and computer products from the industry's leading suppliers. In addition, suppliers’ strategy shifts or performance issues may negatively affect the Company’s financial results. Further, to the extent that any of the Company's key suppliers modify the terms of their contracts including, without limitation, the terms regarding price protection, rights of return, rebates or other terms that protect or enhance the Company's gross margins, it could negatively affect the Company's results of operations, financial condition or liquidity.
The Company's non-U.S. locations represent a significant portion of its revenue and, consequently, the Company is exposed to risks associated with operating internationally.
During fiscal
2014
,
2013
and
2012
approximately
65%
,
63%
and
61%
, respectively, of the Company's sales came from its operations outside the United States. As a result of the Company's international operations, in particular those in emerging and developing economies, the Company's operations are subject to a variety of risks that are specific to international operations, including, but not limited to, the following:
|
•
|
potential restrictions on the Company's ability to repatriate funds from its foreign subsidiaries;
|
|
•
|
foreign currency and interest rate fluctuations and the impact on the Company's reported results of operations;
|
|
•
|
import and export duties and value-added taxes;
|
|
•
|
compliance with foreign and domestic import and export regulations, data privacy regulations, business licensing requirements, environmental regulations and anti-corruption laws, the failure of which could result in severe penalties including monetary fines, criminal proceedings and suspension of import or export privileges;
|
8
|
•
|
complex and changing tax laws and regulations;
|
|
•
|
regulatory requirements and prohibitions that differ between jurisdictions;
|
|
•
|
economic and political instability, terrorism and potential military conflicts or civilian unrest;
|
|
•
|
fluctuations in freight costs, limitations on shipping and receiving capacity, and other disruptions in the transportation and shipping infrastructure;
|
|
•
|
natural disasters and health concerns;
|
|
•
|
differing environmental regulations and employment practices and labor issues; and
|
|
•
|
the risk of non-compliance with local laws.
|
In addition to the cost of compliance, the potential criminal penalties for violations of export regulations and anti-corruption laws by the Company or its third-party agents create heightened risks for the Company's international operations. In the event that a governing regulatory body determined that the Company had violated applicable import or export regulations or anti-corruption laws, the Company could be fined significant sums, incur sizable legal defense costs and/or its import or export capabilities could be restricted, which could have a material and adverse effect on the Company's business. Additionally, allegations that the Company has violated a governmental regulation may negatively impact the Company's reputation, which may result in customers or suppliers being unwilling to do business with the Company. While the Company has adopted measures designed to ensure compliance with these laws, the Company cannot be assured that such measures will be adequate or that its business will not be materially and adversely impacted in the event of an alleged violation.
The Company's acquisition strategy may not produce the expected benefits, which may adversely affect the Company's results of operations.
Avnet has made, and expects to continue to make, strategic acquisitions or investments in companies around the world to further its strategic objectives and support key business initiatives. Acquisitions and investments involve risks and uncertainties, some of which may differ from those associated with Avnet's historical operations. The risks relating to such acquisitions and investments include, but are not limited to, risks relating to expanding into emerging markets and business areas, adding additional product lines and services, incurring costs or liabilities associated with the companies acquired and diverting management's attention from existing business operations. As a result, the Company's profitability may be negatively impacted. In addition, the Company may not be successful in integrating the acquired businesses or the integration may be more difficult, costly or time-consuming than anticipated. Further, any litigation relating to a potential acquisition will result in an increase in the expenses associated with the acquisition or cause a delay in completing the acquisition, thereby impacting the Company's profitability. The Company may experience disruptions that could, depending on the size of the acquisition, have an adverse effect on its business, especially where an acquisition target may have pre-existing non-compliance or pre-existing deficiencies or material weaknesses in internal controls as those terms are defined under relevant SEC rules and regulations. Furthermore, the Company may not realize all of the anticipated benefits from its acquisitions, which could adversely affect the Company's financial performance.
Major disruptions to the Company’s logistics capability could have a material adverse impact on the Company’s operations.
The Company's global logistics services are operated through specialized, centralized or outsourced distribution centers around the globe. The Company also depends almost entirely on third-party transportation service providers for the delivery of products to its customers. A major interruption or disruption in service at one or more of its distribution centers for any reason (such as natural disasters, pandemics, or significant disruptions of services from the Company’s third-party transportation providers) could cause cancellations or delays in a significant number of shipments to customers and, as a result, could have a severe impact on the Company's business, operations and financial performance.
If the Company’s internal information systems fail to function properly or experience a security breach, or if the Company is unsuccessful in the implementation, integration or upgrade of information systems, its business operations could suffer.
The Company's expanding operations put increasing pressure on the Company's information systems to facilitate the day-to-day operations of the business and to produce timely, accurate and reliable information on financial and operational results. Currently, the Company's global operations are tracked with multiple information systems, some of which are subject to ongoing IT projects designed to streamline or optimize the Company's global information systems. There is no guarantee that the Company will be successful at all times in these efforts or that there will not be implementation or integration difficulties that will adversely affect the Company's ability to complete business transactions timely or the accurate and timely recording and reporting of financial
9
data. A failure of any of these information systems in a way described above or material difficulties in upgrading these information systems could have an adverse effect on the Company's business and its compliance with reporting obligations under federal securities laws.
In addition, the Company's information technology may be subject to cybersecurity breaches, computer hacking or other general system failures. Maintaining and operating these systems requires continuous investments. A security breach could result in sensitive data being lost, manipulated or exposed to unauthorized persons or to the public. Such a breach may harm the Company’s reputation and business prospects and subject the Company to legal claims if there is loss, disclosure or misappropriation of or access to the Company’s business partners' information. As threats related to cybersecurity breaches develop and grow, the Company may also find it necessary to make further investments to protect its data and infrastructure, which may impact the Company’s profitability.
Declines in the value of the Company's inventory or unexpected order cancellations by the Company's customers could adversely affect its business, results of operations, financial condition and liquidity.
The electronic components and computer products industries are subject to rapid technological change, new and enhanced products, changes in customer needs and changes in industry standards, which can contribute to a decline in value or obsolescence of inventory. Regardless of the general economic environment, it is possible that prices will decline due to a decrease in demand or an oversupply of products and, as a result of the price declines, there may be greater risk of declines in inventory value. Although it is the policy of many of the Company's suppliers to offer distributors like Avnet certain protections from the loss in value of inventory (such as price protection and limited rights of return), the Company cannot be assured that such policies will fully compensate for the loss in value, or that the vendors will choose to, or be able to, honor such agreements, some of which are not documented and, therefore, subject to the discretion of the vendor. In addition, the majority of the Company's sales are made pursuant to individual purchase orders, rather than through long-term sales contracts. Where there is a contract, such contract is generally terminable at will upon notice. The Company cannot be assured that unforeseen new product developments, declines in the value of the Company's inventory or unforeseen order cancellations by its customers will not adversely affect the Company's business, results of operations, financial condition or liquidity.
Substantial defaults by the Company's customers on its accounts receivable or the loss of significant customers could have a significant negative impact on the Company's business, results of operations, financial condition or liquidity.
A significant portion of the Company's working capital consists of accounts receivable from customers. If customers responsible for a significant amount of accounts receivable were to cease doing business, direct their business elsewhere, become insolvent or otherwise unable to pay the amount they owe the Company, or were to become unwilling or unable to make such payments in a timely manner, the Company's business, results of operations, financial condition or liquidity could be adversely affected. An economic or industry downturn could adversely affect the collectability of these accounts receivable, which could result in longer payment cycles, increased collection costs and defaults in excess of management's expectations. A significant deterioration in the Company's ability to collect on accounts receivable could also impact the cost or availability of financing under its accounts receivable securitization program (see
Financing
Transactions
appearing in Item 7 of this Report).
The Company may not have adequate or cost-effective liquidity or capital resources.
The Company's ability to satisfy its cash needs and implement its capital allocation strategy depends on its ability to generate cash from operations and to access the financial markets, both of which are subject to general economic, financial, competitive, legislative, regulatory and other factors that are beyond the Company's control.
The Company may need to satisfy its cash needs through external financing. However, external financing may not be available on acceptable terms or at all. As of
June 28, 2014
, Avnet had total debt outstanding of approximately $2.1 billion under various notes, secured borrowings and committed and uncommitted lines of credit with financial institutions. The Company needs cash to make interest payments on, and to repay, this indebtedness and for general corporate purposes, such as funding its ongoing working capital and capital expenditure needs. Under the terms of any external financing, the Company may incur higher than expected financing expenses and become subject to additional restrictions and covenants. Any material increase in the Company's financing costs could have a material adverse effect on its profitability.
Under certain of its credit facilities, the Company is required to maintain certain specified financial ratios and meet certain tests. If the Company fails to meet these financial ratios and/or tests, it may be unable to continue to utilize these facilities. If the Company is unable to utilize these facilities, it may not have sufficient cash available to make interest payments on and repay indebtedness and for general corporate needs. General economic or business conditions, domestic and foreign, may be less favorable than management expects and could adversely impact the Company's sales or its ability to collect receivables from its customers, which may impact access to the Company's securitization program.
10
The agreements governing some of the Company's financings contain various covenants
and restrictions that limit the discretion of management in operating its business
and could prevent engaging in some activities that may be beneficial to the
Company's business.
The agreements governing the Company's financing, including its credit facility and the indentures governing the Company's outstanding notes, contain various covenants and restrictions that, in certain circumstances, limit the Company's ability, and the ability of certain subsidiaries, to:
|
•
|
grant liens on assets;
|
|
•
|
make restricted payments (including, under certain circumstances, paying dividends on common stock or redeeming or repurchasing common stock);
|
|
•
|
make certain investments;
|
|
•
|
merge, consolidate or transfer all or substantially all of the Company’s assets;
|
|
•
|
incur additional debt; or
|
|
•
|
engage in certain transactions with affiliates.
|
As a result of these covenants and restrictions, the Company may be limited in the future in how it conducts its business and may be unable to raise additional debt, repurchase common stock, pay a dividend, compete effectively or make further investments.
The Company may become involved in intellectual property disputes that could cause it to incur substantial costs, divert the efforts of management or require it to pay substantial damages or licensing fees.
From time to time, the Company receives notifications alleging infringements of intellectual property rights allegedly held by others relating to the Company's business or the products or services it sells. Litigation with respect to patents or other intellectual property matters could result in substantial costs and diversion of management and other resources and could have an adverse effect on the Company's operations. Further, the Company may be obligated to indemnify and defend its customers if the products or services the Company sells are alleged to infringe any third party's intellectual property rights. While the Company may be able to seek indemnification from its suppliers for itself and its customers against such claims, there is no assurance that it will be successful in obtaining such indemnification or that the Company will be fully protected against such claims. In addition, the Company is exposed to potential liability for technology that it develops for which it has no indemnification protections. If an infringement claim is successful, the Company may be required to pay damages or seek royalty or license arrangements, which may not be available on commercially reasonable terms. The Company may have to stop selling certain products or services, which could affect its ability to compete effectively.
Failure to comply with the requirements of environmental regulations could adversely affect the Company’s business.
The Company is subject to various federal, state, local and foreign laws and regulations addressing environmental and other impacts from product disposal, use of hazardous materials in products, recycling of products at the end of their useful life and other related matters. While the Company strives to ensure it is in full compliance with all applicable regulations, certain of these regulations impose liability without fault. Additionally, the Company may be held responsible for the prior activities of an entity it acquired. Failure to comply with these regulations could result in substantial costs, fines and civil or criminal sanctions, as well as third-party claims for property damage or personal injury. Further, environmental laws may become more stringent over time, imposing greater compliance costs and increasing risks and penalties associated with violations.
Tax legislation initiatives or challenges to the Company's tax positions could impact the Company's results of operations and financial condition.
As a multinational corporation, the Company is subject to the tax laws and regulations of the United States and many foreign jurisdictions. From time to time, regulations may be enacted that could adversely affect the Company's tax positions. There can be no assurance that the Company’s effective tax rate and the resulting cash flow will not be adversely affected by these potential changes in regulations. The tax laws and regulations of the various countries where the Company has operations are extremely complex and subject to varying interpretations. Although the Company believes that its historical tax positions are sound and consistent with applicable laws, regulations and existing precedent, there can be no assurance that these tax positions will not be challenged by relevant tax authorities or that the Company would be successful in any such challenge.
11
If the Company fails to maintain effective internal controls, it may not be able to report its financial results accurately or timely, or prevent or detect fraud, which could have an adverse effect on the Company’s business or the market price of the Company's securities.
Effective internal controls over financial reporting are necessary for the Company to provide reasonable assurance with respect to its financial reports and to effectively prevent or detect fraud. If the Company cannot provide reasonable assurance with respect to its financial reports and effectively prevent or detect fraud, its brand and operating results could be harmed. Internal controls over financial reporting may not prevent or detect misstatements because of its inherent limitations, including the possibility of human error, the circumvention or overriding of controls, or fraud. Therefore, even effective internal controls cannot provide absolute assurance with respect to the preparation and fair presentation of financial statements. In addition, projections of any evaluation of effectiveness of internal controls over financial reporting to future periods are subject to the risk that the internal controls may become inadequate because of changes in conditions, or that the degree of compliance with the policies or procedures may deteriorate. If the Company fails to maintain the adequacy of its internal controls, including any failure to implement required new or improved internal controls, or if the Company experiences difficulties in their implementation, the Company's business and operating results could be harmed, the Company may be subject to sanctions or investigations by regulatory authorities, and the Company could fail to meet its reporting obligations, which could have an adverse effect on its business or the market price of the Company's securities.
Item 1B.
Unresolved Staff Comments
Not applicable.
The Company owns and leases approximately
1.7 million
and
7.1 million
square feet of space, respectively, of which approximately
37%
is located in the United States. The following table summarizes certain of the Company’s key facilities.
|
Location
|
Sq. Footage
|
Leased or Owned
|
Primary Use
|
||||
|
Groveport, Ohio
|
580,000
|
|
Leased
|
TS warehousing, integration and value-added operations
|
|||
|
Chandler, Arizona
|
400,000
|
|
Owned
|
EM warehousing and value-added operations
|
|||
|
Tongeren, Belgium
|
390,000
|
|
Owned
|
EM and TS warehousing and value-added operations
|
|||
|
Poing, Germany
|
370,000
|
|
Leased
|
EM warehousing, value-added operations and offices
|
|||
|
Poing, Germany
|
300,000
|
|
Owned
|
EM warehousing, value-added operations and offices
|
|||
|
Chandler, Arizona
|
230,000
|
|
Leased
|
EM warehousing, integration and value-added operations
|
|||
|
Nettetal, Germany
|
200,000
|
|
Owned
|
EM and TS warehousing and value-added operations
|
|||
|
Hong Kong, China
|
180,000
|
|
Leased
|
EM warehousing and value-added operations
|
|||
|
Duluth, Georgia
|
180,000
|
|
Leased
|
TS warehousing, integration and value-added operations
|
|||
|
Phoenix, Arizona
|
180,000
|
|
Leased
|
Corporate and EM headquarters
|
|||
|
Tempe, Arizona
|
130,000
|
|
Leased
|
TS headquarters
|
|||
As a result primarily of certain former manufacturing operations, Avnet has incurred and may have future liability under various federal, state and local environmental laws and regulations, including those governing pollution and exposure to, and the handling, storage and disposal of, hazardous substances. For example, under the Comprehensive Environmental Response, Compensation and Liability Act of 1980, as amended (“CERCLA”) and similar state laws, Avnet is and may be liable for the costs of cleaning up environmental contamination on or from certain of its current or former properties, and at off-site locations where the Company disposed of wastes in the past. Such laws may impose joint and several liability. Typically, however, the costs for cleanup at such sites are allocated among potentially responsible parties based upon each party’s relative contribution to the contamination, and other factors.
Pursuant to SEC regulations, including but not limited to Item 103 of Regulation S-K, the Company regularly assesses the status of and developments in pending environmental legal proceedings to determine whether any such proceedings should be identified specifically in this discussion of legal proceedings, and has concluded that no particular pending environmental legal
12
proceeding requires public disclosure. Based on the information known to date, management believes that the Company has appropriately accrued in its consolidated financial statements for its share of the estimated costs of environmental matters.
The Company is also party to various other lawsuits, claims, investigations and other legal proceedings arising from time to time in the normal course of business. While litigation is subject to inherent uncertainties, management currently believes that the ultimate outcome of these proceedings, individually and in the aggregate, will not have a material adverse effect on the Company’s financial position, liquidity or results of operations.
Not applicable.
13
Market price per share
The Company’s common stock is listed on the New York Stock Exchange under the symbol AVT. Quarterly high and low stock closing prices (as reported for the New York Stock Exchange composite transactions) and dividends declared (none in fiscal 2013) for the last two fiscal years were:
|
|
2014
|
2013
|
||||||||||||||||
|
Fiscal Quarters
|
High
|
Low
|
Dividends Declared
|
High
|
Low
|
|||||||||||||
|
1st
|
$
|
41.73
|
|
$
|
33.97
|
|
$
|
0.15
|
|
$
|
33.51
|
|
$
|
28.91
|
|
|||
|
2nd
|
43.43
|
|
38.77
|
|
0.15
|
|
31.62
|
|
27.01
|
|
||||||||
|
3rd
|
46.17
|
|
39.32
|
|
0.15
|
|
36.86
|
|
30.61
|
|
||||||||
|
4th
|
47.50
|
|
41.68
|
|
0.15
|
|
35.39
|
|
31.54
|
|
||||||||
In August 2013, the Company's Board of Directors initiated a quarterly cash dividend of $0.15 per share of outstanding common stock. The declaration and payment of future dividends will be at the discretion of the Board of Directors and will be dependent upon the Company's financial condition, results of operations, capital requirements, and such other factors as the Board of Directors deems relevant. In addition, certain of the Company's debt facilities may restrict the declaration and payment of dividends, depending upon the Company's then current compliance with certain covenants.
Record Holders
As of
July 25, 2014
, there were
2,918
registered holders of record of Avnet’s common stock.
Equity Compensation Plan Information as of
June 28, 2014
|
Plan Category
|
(a)
Number of Securities
to be Issued Upon Exercise of Outstanding Options, Warrants and Rights |
|
(b)
Weighted-Average
Exercise Price of Outstanding Options, Warrants and Rights |
(c)
Number of Securities
Remaining Available for Future Issuance Under Equity Compensation Plans (Excluding Securities Reflected in Column (a)) |
|
|||
|
Equity compensation plans approved by security holders
|
4,599,384
|
|
(1)
|
$30.84
|
6,371,765
|
|
(2)
|
|
______________________
|
(1)
|
Includes
1,809,176
shares subject to options outstanding,
2,001,887
restricted incentive shares and
788,321
performance shares awarded but not yet vested or vested but not yet delivered.
|
|
(2)
|
Does not include
375,741
shares available for future issuance under the Employee Stock Purchase Plan, which is a non-compensatory plan.
|
Stock Performance Graphs and Cumulative Total Returns
The graph below compares the cumulative 5-year total return of holders of Avnet, Inc.’s common stock with the cumulative total returns of the S&P 500 index and certain of Avnet’s peer companies ("peer group") in the electronics and information technology distribution industry. The graph tracks the performance of a hypothetical $100 investment in Avnet’s common stock, in the peer group, and the S&P 500 index (with the reinvestment of all dividends) from June 27, 2009 to
June 28, 2014
. The companies comprising the peer group that Avnet has historically used are: Agilysys, Inc., Anixter International, Inc., Arrow Electronics, Inc., Ingram Micro, Inc., Insight Enterprises, Inc., Scansource, Inc., Synnex Corp. and Tech Data Corp.
14
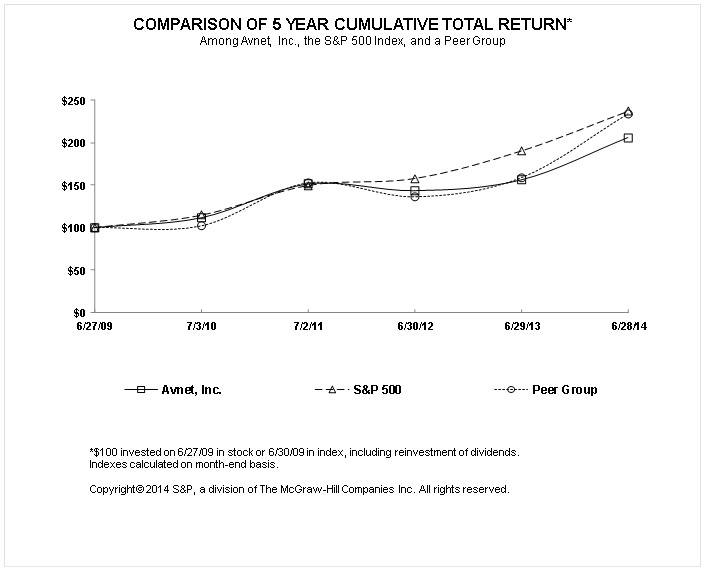
|
6/27/2009
|
7/3/2010
|
7/2/2011
|
6/30/2012
|
6/29/2013
|
6/28/2014
|
||||||
|
Avnet, Inc.
|
$100.00
|
$111.43
|
$151.25
|
$143.40
|
$156.13
|
$206.06
|
|||||
|
S&P 500
|
100.00
|
114.43
|
149.55
|
157.70
|
190.18
|
236.98
|
|||||
|
Peer Group
|
100.00
|
101.92
|
152.62
|
136.23
|
158.70
|
234.03
|
|||||
The stock price performance included in this graph is not necessarily indicative of future stock price performance. The Company does not make or endorse any predictions as to future stock performance. The performance graph is furnished solely to accompany this Report and is not being filed for purposes of the Securities Exchange Act of 1934, as amended, and is not to be incorporated by reference into any filing of the Company, whether made before or after the date hereof, regardless of any general incorporation language in such filing.
Issuer Purchases of Equity Securities
In August 2011, the Company's Board of Directors (the "Board") approved the repurchase of up to
$500.0 million
of the Company's common stock through a share repurchase program. During August 2012, the Board approved an additional
$250.0 million
for the share repurchase program. With this increase, the Company may repurchase up to a total of
$750.0 million
of the Company's common stock under the share repurchase program. The following table includes, if any, the Company's monthly purchases of Avnet's common stock during the fourth quarter ended
June 28, 2014
, under the share repurchase program, which is part of a publicly announced plan, and purchases made on the open market to obtain shares for the Company's Employee Stock Purchase Plan (“ESPP”), which is not part of a publicly announced plan:
15
|
Period
|
Total Number
of Shares Purchased
(1)
|
Average Price Paid per Share
|
Total Number of
Shares Purchased
as Part of Publicly
Announced Plans
or Programs
|
Approximate Dollar
Value of Shares That
May Yet Be Purchased
Under the Plans
or Programs
|
|||||||
|
April
|
3,800
|
|
$47.18
|
—
|
|
$223,223,000
|
|||||
|
May
|
180,774
|
|
$41.82
|
176,074
|
|
$215,860,000
|
|||||
|
June
|
—
|
|
—
|
|
—
|
|
$215,860,000
|
||||
______________________
|
(1)
|
Consists of purchases of Avnet's common stock associated with the Company's ESPP as follows: 3,800 shares in April and
|
4,700 shares in May.
|
|
Years Ended
|
|
||||||||||||||||||
|
June 28,
2014 |
June 29,
2013 |
June 30,
2012 |
July 2,
2011 |
July 3,
2010 |
||||||||||||||||
|
|
(Millions, except for per share and ratio data)
|
|
||||||||||||||||||
|
Income:
|
|
|
|
|
|
|
|
|
|
|||||||||||
|
Sales
|
$
|
27,499.7
|
|
$
|
25,458.9
|
|
|
$
|
25,707.5
|
|
|
$
|
26,534.4
|
|
|
$
|
19,160.2
|
|
|
|
|
Gross profit
|
3,225.7
|
|
|
2,979.8
|
|
|
3,050.6
|
|
|
3,107.8
|
|
|
2,280.2
|
|
|
|||||
|
Operating income
(a)
|
789.9
|
|
626.0
|
|
|
884.2
|
|
930.0
|
|
635.6
|
|
|||||||||
|
Income tax expense
(b)
|
155.5
|
|
99.2
|
|
|
223.8
|
|
201.9
|
|
174.7
|
|
|||||||||
|
Net income
(c)
|
545.6
|
|
450.1
|
|
|
567.0
|
|
669.1
|
|
410.4
|
|
|||||||||
|
Financial Position:
|
|
|
|
|
|
|
|
|
||||||||||||
|
Working capital
(d)
|
3,975.4
|
|
|
3,535.4
|
|
|
3,455.7
|
|
|
3,749.5
|
|
|
3,190.6
|
|
|
|||||
|
Total assets
|
11,255.5
|
|
|
10,474.7
|
|
|
10,167.9
|
|
|
9,905.6
|
|
|
7,782.4
|
|
|
|||||
|
Long-term debt
|
1,213.8
|
|
|
1,207.0
|
|
|
1,272.0
|
|
|
1,273.5
|
|
|
1,243.7
|
|
|
|||||
|
Shareholders’ equity
|
4,890.2
|
|
|
4,289.1
|
|
|
3,905.7
|
|
|
4,056.1
|
|
|
3,009.1
|
|
|
|||||
|
Per Share:
|
|
|
|
|
|
|
|
|
||||||||||||
|
Basic earnings
|
3.95
|
|
3.26
|
|
3.85
|
|
4.39
|
|
2.71
|
|
||||||||||
|
Diluted earnings
|
3.89
|
|
3.21
|
|
3.79
|
|
4.34
|
|
2.68
|
|
||||||||||
|
Cash dividends paid
|
0.60
|
|
|
—
|
|
|
—
|
|
|
—
|
|
|
—
|
|
||||||
|
Book value per diluted share
|
34.90
|
|
|
30.64
|
|
|
26.12
|
|
|
26.28
|
|
|
19.66
|
|
|
|||||
|
Ratios:
|
|
|
|
|
|
|
|
|
||||||||||||
|
Operating income as a percentage of sales
|
2.9
|
%
|
2.5
|
%
|
3.4
|
%
|
3.5
|
%
|
3.3
|
%
|
||||||||||
|
Net income as a percentage of sales
|
2.0
|
%
|
1.8
|
%
|
2.2
|
%
|
2.5
|
%
|
2.1
|
%
|
||||||||||
|
Return on capital
|
11.4
|
%
|
10.6
|
%
|
12.9
|
%
|
15.2
|
%
|
14.0
|
%
|
||||||||||
|
Quick ratio
|
1.2:1
|
|
|
1.2:1
|
|
|
1.2:1
|
|
|
1.2:1
|
|
|
1.4:1
|
|
|
|||||
|
Working capital
(d)
|
1.8:1
|
|
|
1.7:1
|
|
|
1.7:1
|
|
|
1.8:1
|
|
|
1.9:1
|
|
|
|||||
|
Total debt to capital
|
29.8
|
%
|
32.3
|
%
|
35.4
|
%
|
27.2
|
%
|
29.8
|
%
|
||||||||||
|
(a)
|
All fiscal years presented include restructuring, integration and other expenses, which totaled $94.6 million before tax, $70.8 million after tax and $0.50 per share on a diluted basis in fiscal 2014, $149.5 million before tax, $116.4 million after tax and $0.83 per share on a diluted basis in fiscal 2013, $73.6 million before tax, $53.0 million after tax and $0.35 per share on a diluted basis in fiscal 2012, $77.2 million before tax, $56.2 million after tax and $0.36 per share on a diluted basis in fiscal 2011 and $25.4 million before tax, $18.8 million after tax and $0.12 per share on a diluted basis in fiscal 2010.
|
|
(b)
|
Certain fiscal years presented included the impact of tax benefits primarily due to the release of valuation allowances net of additional reserves including $43.8 million and $0.31 per share on a diluted basis in fiscal 2014, $50.4 million and $0.36
|
16
per share on a diluted basis in fiscal 2013, $8.6 million and $0.06 per share on a diluted basis in fiscal 2012, and $32.9 million and $0.21 per share on a diluted basis in fiscal 2011.
|
(c)
|
All fiscal years presented were impacted by other expense or income amounts that impact the comparability between years including a gain on legal settlement of $22.1 million before tax, $13.5 million after tax and $0.09 per share on a diluted basis in fiscal 2014, a gain on bargain purchase and other of $31.0 million before and after tax and $0.22 per share on a diluted basis in fiscal 2013, a gain on bargain purchase and other of $2.9 million before tax, $3.5 million after tax and $0.02 per share on a diluted basis in fiscal 2012, a gain on bargain purchase and other of $22.7 million before tax, $25.7 million after tax and $0.17 per share on a diluted basis in fiscal 2011, and a gain on sale of assets of $8.8 million before tax, $5.4 million after tax and $0.03 per share on a diluted basis in fiscal 2010.
|
|
(d)
|
This calculation of working capital is defined as current assets less current liabilities.
|
Summary of quarterly results (unaudited):
|
First
Quarter
|
Second
Quarter
|
Third
Quarter
|
Fourth
Quarter
|
Year(a)
|
||||||||||||||||
|
|
(Millions, except per share amounts)
|
|||||||||||||||||||
|
2014
(b)
|
|
|
|
|
|
|||||||||||||||
|
Sales
|
$
|
6,345.5
|
|
$
|
7,421.9
|
|
$
|
6,683.6
|
|
$
|
7,048.7
|
|
$
|
27,499.7
|
|
|||||
|
Gross profit
|
735.2
|
|
848.6
|
|
804.9
|
|
837.0
|
|
3,225.7
|
|
||||||||||
|
Net income
|
120.6
|
|
124.9
|
|
113.9
|
|
186.3
|
|
545.6
|
|
||||||||||
|
Diluted earnings per share
|
0.86
|
|
0.89
|
|
0.81
|
|
1.33
|
|
3.89
|
|
||||||||||
|
2013
(c)
|
|
|
|
|
|
|||||||||||||||
|
Sales
|
$
|
5,870.1
|
|
$
|
6,699.5
|
|
$
|
6,298.7
|
|
$
|
6,590.7
|
|
$
|
25,459.0
|
|
|||||
|
Gross profit
|
684.4
|
|
768.5
|
|
756.0
|
|
770.9
|
|
2,979.8
|
|
||||||||||
|
Net income
|
100.3
|
|
137.5
|
|
86.2
|
|
126.1
|
|
450.1
|
|
||||||||||
|
Diluted earnings per share
|
0.70
|
|
0.99
|
|
0.62
|
|
0.91
|
|
3.21
|
|
||||||||||
______________________
|
(a)
|
Quarters may not total to the year due to rounding.
|
|
(b)
|
First quarter of fiscal
2014
results were impacted by restructuring, integration and other expenses of $12.1 million before tax, $8.8 million after tax and $0.06 per share on a diluted basis and a gain on legal settlement of $19.1 million before tax, $11.7 million after tax and $0.08 per share on a diluted basis related to an award payment received. Second quarter results were impacted by restructuring, integration and other expenses of $28.4 million before tax, $21.7 million after tax and $0.15 per share on a diluted basis and an income tax expense of $8.2 million primarily related to certain items impacting the effective income tax rate. Third quarter results were impacted by restructuring, integration and other expenses of $26.1million before tax, $19.3 million after tax and $0.14 per share on a diluted basis. Fourth quarter results were impacted by restructuring, integration and other expenses of $28.0 million before tax, $20.9 million after tax and $0.15 per share on a diluted basis and an income tax benefit of $58.2 million and $0.41 per share on a diluted basis as a result of the release of valuation allowances against certain deferred tax assets.
|
|
(c)
|
First quarter of fiscal
2013
results were impacted by restructuring, integration and other expenses of
$37.4 million
before tax,
$27.1 million
after tax and
$0.19
per share on a diluted basis, a gain on bargain purchase of
$31.3 million
before and after tax and
$0.22
per share on a diluted basis related to the acquisition of Internix, Inc., and an income tax benefit of
$12.2 million
primarily related to a favorable settlement of an income tax audit. Second quarter results were impacted by restructuring, integration and other expenses of
$24.9 million
before tax,
$19.9 million
after tax and
$0.14
per share on a diluted basis and an income tax benefit of
$17.4 million
related to a favorable audit settlement of a U.S. income tax audit for an acquired company. Third quarter results were impacted by restructuring, integration and other expenses of
$27.3 million
before tax,
$25.8 million
after tax and
$0.18
per share on a diluted basis and an income tax expense of
$13.4 million
primarily related to the increase to a valuation allowance against existing deferred tax assets and increases to tax reserves. Fourth quarter results were impacted by restructuring, integration and other expenses of
$59.8 million
before tax,
$43.6 million
after tax and
$0.31
per share on a diluted basis and a net tax benefit of
$34.2 million
for the release of valuation allowances and the release of existing reserves due to audit settlement and statute expiration, partially offset by the establishment of tax reserves against deferred tax assets that were determined to be unrealizable.
|
17
Item 7.
Management’s Discussion and Analysis of Financial Condition and Results of Operations
For an understanding of Avnet and the significant factors that influenced the Company’s performance during the past three fiscal years, the following discussion should be read in conjunction with the description of the business appearing in Item 1 of this Report and the consolidated financial statements, including the related notes and schedule, and other information appearing in Item 15 of this Report. The Company operates on a “52/53 week” fiscal year. Fiscal
2014
,
2013
and
2012
all contained 52 weeks.
There are references to the impact of foreign currency translation in the discussion of the Company’s results of operations. When the U.S. Dollar strengthens and the stronger exchange rates of the current year are used to translate the results of operations of Avnet’s subsidiaries denominated in foreign currencies, the resulting impact is a decrease in U.S. Dollars of reported results. Conversely, when the U.S. Dollar weakens and the weaker exchange rates of the current year are used to translate the results of operations of Avnet’s subsidiaries denominated in foreign currencies, the resulting impact is an increase in U.S. Dollars of reported results. In the discussion that follows, results excluding this impact, primarily for EMEA, are referred to as “excluding the translation impact of changes in foreign currency exchange rates” or “constant currency.”
In addition to disclosing financial results that are determined in accordance with generally accepted accounting principles in the U.S. (“GAAP”), the Company also discloses certain non-GAAP financial information, including:
|
•
|
Sales, income or expense items excluding the translation impact of changes in foreign currency exchange rates, as discussed above.
|
|
•
|
Sales adjusted for certain items that impact the year-over-year analysis, which includes the impact of acquisitions by adjusting Avnet’s prior periods to include the sales of acquired businesses as if the acquisitions had occurred at the beginning of the earliest period presented. In addition, the prior year sales are adjusted for (i) divestitures by adjusting Avnet’s prior periods to exclude the sales of divested businesses as if the divestitures had occurred at the beginning of the earliest period presented, and (ii) the transfer of a portion of Avnet’s reverse logistics operations and a regional computing components operation at the beginning of fiscal 2014 from the Electronics Marketing (“EM”) operating group to the Technology Solutions (“TS”) operating group. Sales taking into account the combination of these adjustments are referred to as “organic sales.”
|
|
•
|
Operating income excluding (i) restructuring, integration and other expenses (see
Restructuring, Integration and Other Expenses
in this MD&A) and (ii) amortization of acquired intangible assets and other. Operating income excluding such amounts is referred to as adjusted operating income.
|
The reconciliation of operating income to adjusted operating income is presented in the following table:
|
|
Years Ended
|
||||||||||
|
June 28,
2014 |
June 29,
2013 |
June 30,
2012 |
|||||||||
|
|
(Thousands)
|
||||||||||
|
GAAP operating income
|
$
|
789,940
|
|
$
|
625,981
|
|
$
|
884,165
|
|
||
|
Restructuring, integration and other expenses
|
94,623
|
|
149,501
|
|
73,585
|
|
|||||
|
Amortization of intangible assets and other
|
46,783
|
|
32,370
|
|
27,785
|
|
|||||
|
Adjusted operating income
|
$
|
931,346
|
|
$
|
807,852
|
|
$
|
985,535
|
|
||
Management believes that providing this additional information is useful to the reader to better assess and understand operating performance, especially when comparing results with prior periods or forecasting performance for future periods, primarily because management typically monitors the business both including and excluding these adjustments to GAAP results. Management also uses these non-GAAP measures to establish operational goals and, in some cases, for measuring performance for compensation purposes. However, analysis of results on a non-GAAP basis should be used as a complement to, and in conjunction with, results presented in accordance with GAAP.
Results of Operations
Executive Summary
Sales for fiscal
2014
were
$27.50 billion
, an increase of
8.0%
from fiscal
2013
sales of
$25.46 billion
. Organic sales increased
5.2%
year over year. EM sales of
$16.54 billion
increased
9.6%
over fiscal 2013 and organic sales in constant currency increased
8.2%
year over year. This increase in organic sales was primarily related to growth in the EMEA and Asia regions. TS sales of
$10.96 billion
increased
5.7%
over fiscal 2013 and organic sales in constant currency remained flat year over year.
18
Gross profit margin of
11.7%
increased
3
basis points over the prior year. EM gross profit margin remained flat year over year with increases in the western regions being offset by declines in the Asia region primarily due to a higher amount of high- volume fulfillment type sales compared to fiscal 2013. TS gross profit margin also remained flat year over year. The overall increase in Avnet gross profit margin was due primarily to increases in sales and gross profit at EM EMEA driven in part by a recent acquisition.
Consolidated operating income margin was
2.9%
as compared with
2.5%
in fiscal 2013. Both periods included restructuring, integration and other expenses and the amortization of intangible assets. Excluding these amounts from both periods, adjusted operating income margin was
3.4%
of sales in fiscal
2014
as compared to
3.2%
of sales in fiscal 2013. EM operating income margin increased
31
basis points year over year to
4.5%
. The increase in EM operating income margin was primarily due to increases at EM Americas and EM Asia due primarily to a combination of reduced operating expenses as a result of recent restructuring and cost reduction initiatives as well as improved operating leverage. TS operating income margin remained flat year over year at
2.9%
, with improvements at TS Asia being offset by declines in the western regions.
Three-Year Analysis of Sales: By Operating Group and Geography
|
|
Years Ended
|
Percent Change
|
||||||||||||||||||||||||
|
June 28,
2014 |
% of
Total
|
June 29,
2013 |
% of
Total
|
June 30,
2012 |
% of
Total
|
2014 to 2013
|
2013 to 2012
|
|||||||||||||||||||
|
|
(Dollars in millions)
|
|||||||||||||||||||||||||
|
Sales by Operating Group:
|
|
|
|
|
|
|
|
|||||||||||||||||||
|
EM Americas
|
$
|
4,844.9
|
|
17.6
|
%
|
$
|
5,263.8
|
|
20.7
|
%
|
$
|
5,678.7
|
|
22.1
|
%
|
(8.0
|
)%
|
(7.3
|
)%
|
|||||||
|
EM EMEA
|
5,094.9
|
|
18.5
|
|
4,096.0
|
|
16.1
|
|
4,203.3
|
|
16.4
|
|
24.4
|
|
(2.6
|
)
|
||||||||||
|
EM Asia
|
6,604.6
|
|
24.0
|
|
5,734.6
|
|
22.5
|
|
5,051.1
|
|
19.6
|
|
15.2
|
|
13.5
|
|
||||||||||
|
Total EM
|
16,544.4
|
|
60.1
|
|
15,094.4
|
|
59.3
|
|
14,933.1
|
|
58.1
|
|
9.6
|
|
1.1
|
|
||||||||||
|
TS Americas
|
6,084.6
|
|
22.1
|
|
5,452.8
|
|
21.4
|
|
5,820.6
|
|
22.6
|
|
11.6
|
|
(6.3
|
)
|
||||||||||
|
TS EMEA
|
3,151.2
|
|
11.5
|
|
3,181.9
|
|
12.5
|
|
3,205.6
|
|
12.5
|
|
(1.0
|
)
|
(0.7
|
)
|
||||||||||
|
TS Asia
|
1,719.5
|
|
6.3
|
|
1,729.8
|
|
6.8
|
|
1,748.2
|
|
6.8
|
|
(0.6
|
)
|
(1.1
|
)
|
||||||||||
|
Total TS
|
10,955.3
|
|
39.9
|
|
10,364.5
|
|
40.7
|
|
10,774.4
|
|
41.9
|
|
5.7
|
|
(3.8
|
)
|
||||||||||
|
Total Avnet, Inc.
|
$
|
27,499.7
|
|
|
$
|
25,458.9
|
|
|
$
|
25,707.5
|
|
|
8.0
|
%
|
(1.0
|
)%
|
||||||||||
|
Sales by Geographic Area:
|
|
|
|
|
|
|
|
|||||||||||||||||||
|
Americas
|
$
|
10,929.5
|
|
39.7
|
%
|
$
|
10,716.6
|
|
42.1
|
%
|
$
|
11,499.3
|
|
44.8
|
%
|
2.0
|
%
|
(6.8
|
)%
|
|||||||
|
EMEA
|
8,246.1
|
|
30.0
|
|
7,277.9
|
|
28.6
|
|
7,408.9
|
|
28.8
|
|
13.3
|
|
(1.8
|
)
|
||||||||||
|
Asia/Pacific
|
8,324.1
|
|
30.3
|
|
7,464.4
|
|
29.3
|
|
6,799.3
|
|
26.4
|
|
11.5
|
|
9.8
|
|
||||||||||
|
|
$
|
27,499.7
|
|
|
$
|
25,458.9
|
|
|
$
|
25,707.5
|
|
|
|
|
||||||||||||
Sales
Items Impacting Year-over-Year Sales Comparisons
During the past three fiscal years, the Company acquired several businesses impacting both operating groups, as presented in the following table. To facilitate more meaningful year-over-year comparisons, the discussions that follow include organic sales as well as sales on a reported basis.
19
|
Acquired Business
|
Group & Region
|
Approximate
Annualized Sales (1) |
Acquisition Date
|
|||||
|
|
|
(Millions)
|
|
|||||
|
Fiscal 2014
|
||||||||
|
MSC Investoren GmbH
|
EM EMEA
|
$
|
461
|
|
October 2013
|
|||
|
Nisko Semiconductors, Ltd.
|
EM EMEA
|
18
|
|
August 2013
|
||||
|
Seamless Technologies, Inc.
|
TS Americas
|
13
|
|
July 2013
|
||||
|
Total fiscal 2014
|
$
|
492
|
|
|||||
|
Fiscal 2013
|
||||||||
|
RTI Holdings
|
EM Asia
|
$
|
78
|
|
April 2013
|
|||
|
TSSLink, Inc.
|
TS Americas
|
10
|
|
December 2012
|
||||
|
Universal Semiconductor, Inc.
|
EM Americas
|
75
|
|
December 2012
|
||||
|
Genilogix
|
TS Americas
|
23
|
|
November 2012
|
||||
|
Brightstar Partners, Inc.
|
TS Americas
|
14
|
|
November 2012
|
||||
|
Magirus AG
|
TS EMEA
|
633
|
|
October 2012
|
||||
|
Tekdata Interconnections, Limited
|
EM EMEA
|
10
|
|
October 2012
|
||||
|
Internix, Inc.
|
EM Asia
|
264
|
|
August 2012
|
||||
|
C.R.G. Electronics, Ltd.
|
EM EMEA
|
24
|
|
August 2012
|
||||
|
Pepperweed Consulting
|
TS Americas
|
12
|
|
August 2012
|
||||
|
Mattelli Limited
|
TS EMEA
|
1
|
|
July 2012
|
||||
|
Altron GmbH & Co KG
|
EM EMEA
|
34
|
|
July 2012
|
||||
|
Total fiscal 2013
|
$
|
1,178
|
|
|||||
|
Fiscal 2012
|
||||||||
|
Ascendant Technology
|
TS Americas & TS EMEA
|
$
|
86
|
|
April 2012
|
|||
|
Nexicore Services
|
TS Americas
|
85
|
|
April 2012
|
||||
|
Controlling interest in a non-wholly owned entity
|
EM Americas
|
62
|
|
January 2012
|
||||
|
Pinnacle Data Systems
|
TS Americas
|
27
|
|
January 2012
|
||||
|
Canvas Systems
|
TS Americas & TS EMEA
|
118
|
|
January 2012
|
||||
|
Unidux Electronics Limited (Singapore)
|
EM Asia
|
145
|
|
January 2012
|
||||
|
Round2 Technologies
|
TS Americas
|
54
|
|
January 2012
|
||||
|
DE2 SAS
|
EM EMEA
|
11
|
|
November 2011
|
||||
|
JC Tally Trading Co. & Shanghai FR International Trading
|
EM Asia
|
99
|
|
August 2011
|
||||
|
Prospect Technology
|
EM Asia
|
142
|
|
August 2011
|
||||
|
Amosdec SAS
|
TS EMEA
|
83
|
|
July 2011
|
||||
|
Total fiscal 2012
|
$
|
912
|
|
|||||
______________________
|
(1)
|
Represents the approximate annual sales for the acquired businesses’ most recent fiscal year prior to acquisition by Avnet and based upon average foreign currency exchange rates for such fiscal year.
|
20
Fiscal
2014
Comparison to Fiscal
2013
The table below provides the comparison of reported fiscal
2014
and
2013
sales for the Company and its operating groups to organic sales (as defined earlier in this MD&A) to allow readers to better assess and understand the Company’s sales performance by operating group. Organic sales includes the effects of a divestiture of a small business in TS Asia in December 2012 and the exit of a small business in EM Americas in April 2013 that generated combined annual sales of approximately $20.0 million.
|
Sales as Reported
|
Acquisition/Divested Sales
|
Transfer of Operations from EM to TS
(1)
|
Organic Sales
|
2014 to 2013 Organic Sales Change
|
||||||||||||||
|
|
(Dollars in millions)
|
|||||||||||||||||
|
EM
|
$
|
16,544.4
|
|
$
|
119.9
|
|
$
|
—
|
|
$
|
16,664.3
|
|
9.1
|
%
|
||||
|
TS
|
10,955.3
|
|
—
|
|
—
|
|
10,955.3
|
|
(0.2
|
)
|
||||||||
|
Fiscal 2014
|
$
|
27,499.7
|
|
$
|
119.9
|
|
$
|
—
|
|
$
|
27,619.6
|
|
5.2
|
|
||||
|
EM
|
$
|
15,094.4
|
|
$
|
627.1
|
|
$
|
(443.2
|
)
|
$
|
15,278.3
|
|
||||||
|
TS
|
10,364.5
|
|
166.2
|
|
443.2
|
|
10,973.9
|
|
||||||||||
|
Fiscal 2013
|
$
|
25,458.9
|
|
$
|
793.3
|
|
$
|
—
|
|
$
|
26,252.2
|
|
||||||
______________________
|
(1)
|
To adjust reported sales for the impact of certain operations transferred from EM to TS at the beginning of fiscal 2014.
|
Consolidated sales for fiscal
2014
were
$27.50 billion
, an increase of
8.0%
, or
$2.04 billion
, from fiscal 2013 consolidated sales of
$25.46 billion
. Organic sales (as defined earlier in this MD&A) increased
5.2%
year over year and increased
4.8%
in constant currency. The organic sales increase was primarily due to organic growth at EM as discussed further below.
EM sales of
$16.54 billion
for fiscal
2014
increased
9.6%
from fiscal 2013 sales of
$15.09 billion
. EM organic sales in constant currency increased
8.2%
year over year. On a regional basis, the Americas organic sales remained flat year over year. In EMEA, there was strong growth with organic sales increasing 8.8% in constant currency. Asia organic sales increased
13.0%
year over year, which was primarily due to increased high-volume fulfillment type sales in fiscal 2014. The higher growth rate in Asia resulted in a regional shift in the mix of sales toward Asia, which represented approximately 40% of total EM sales in fiscal 2014 compared to approximately 38% in fiscal 2013. Such regional mix shift had a corresponding impact on fiscal 2014 EM gross profit margin and operating expense margin.
TS sales of
$10.96 billion
for fiscal
2014
increased
5.7%
from fiscal 2013 sales of
$10.36 billion
. Organic sales remained flat year over year in constant dollars. In the Americas region, year-over-year organic sales increased
2.7%
, offset by organic sales declines of
8.8%
in constant currency at TS EMEA. On a product level, growth in hardware, software and services were partially offset by declines in servers and computing components.
Fiscal
2013
Comparison to Fiscal
2012
The table below provides the comparison of reported fiscal
2013
and
2012
sales for the Company and its operating groups to organic sales to allow readers to better assess and understand the Company’s sales performance by operating group.
|
Sales as Reported
|
Acquisition Sales
|
Organic Sales
|
2013 to 2012 Organic Sales Change
|
|||||||||||
|
|
(Dollars in millions)
|
|||||||||||||
|
EM
|
$
|
15,094.4
|
|
$
|
148.4
|
|
$
|
15,242.8
|
|
(2.5
|
)%
|
|||
|
TS
|
10,364.5
|
|
153.8
|
|
10,518.3
|
|
(9.0
|
)
|
||||||
|
Fiscal 2013
|
$
|
25,458.9
|
|
$
|
302.2
|
|
$
|
25,761.1
|
|
(5.3
|
)
|
|||
|
EM
|
$
|
14,933.1
|
|
$
|
707.6
|
|
$
|
15,640.7
|
|
|
||||
|
TS
|
10,774.4
|
|
789.2
|
|
11,563.6
|
|
|
|||||||
|
Fiscal 2012
|
$
|
25,707.5
|
|
$
|
1,496.8
|
|
$
|
27,204.3
|
|
|
||||
21
Consolidated sales for fiscal
2013
were
$25.46 billion
, a decrease of
1.0%
, or
$248.6 million
, from fiscal 2012 consolidated sales of
$25.71 billion
. Organic sales decreased
5.3%
year over year and declined
4.2%
in constant currency. The organic sales decline was primarily due to the organic sales decline at TS.
EM sales of
$15.09 billion
for fiscal
2013
increased
1.1%
from fiscal 2012 sales of
$14.93 billion
. EM organic sales in constant currency decreased
1.2%
year over year primarily related to the Americas region, which (i) experienced weaker demand and (ii) exited the lower margin commercial components business. On a regional basis, the Americas organic sales decreased
10.0%
year over year primarily due to the decision to exit the lower margin commercial components business. For EMEA, despite the ongoing recessionary trends in the region, organic sales were relatively flat year over year in constant currency. Asia organic sales increased
6.5%
year over year, which was primarily due to a higher volume of fulfillment sales in fiscal 2013. The higher growth rate in Asia resulted in a regional shift in the mix of sales between the Asia region and the western regions, which negatively impacted EM's overall gross profit and operating income margins.
TS sales of
$10.36 billion
for fiscal
2013
decreased
3.8%
from fiscal 2012 sales of
$10.77 billion
. Organic sales declined
8.3%
year over year in constant dollars primarily due to weaker sales in the western regions. In the Americas region, year-over-year organic sales decreased
8.5%
, and organic sales in EMEA decreased
11.7%
in constant currency. On a product level, declines in servers and hardware were partially offset by growth in storage, services, and software.
Gross Profit and Gross Profit Margins
Consolidated gross profit in fiscal
2014
was
$3.23 billion
, an increase of
$245.9 million
, or
8.3%
, from fiscal 2013 and an increase of
2.4%
on an organic basis in constant currency. Gross profit margin of
11.7%
remained essentially flat, increasing by
3
basis points over the prior year. EM gross profit margin remained flat year over year primarily related to increases in the western regions being offset by declines in Asia. The decline in Asia gross margin was primarily due to the effects of a higher volume of fulfillment sales in fiscal 2014. With respect to regional mix, the Asia region contributed
39.9%
of EM sales in fiscal 2014 from
38.0%
in fiscal 2013, attributable to higher growth rates in Asia including the impact of an increase in fulfillment sales. TS gross profit margin remained flat year over year, with improvements in the EMEA region being offset by a decline in the Americas.
Consolidated gross profit in fiscal
2013
was
$2.98 billion
, a decrease of
$70.8 million
, or
2.3%
, from fiscal 2012. Gross profit margin of
11.7%
decreased
17
basis points over fiscal 2012. EM gross profit margin declined
52
basis points year over year primarily related to declines in gross margins in the EMEA region and a higher mix of sales from the Asia region. The decline in EMEA gross margin was primarily due to the effects of market pressures associated with relatively short product lead times. With respect to regional mix, the Asia region contributed
38.0%
of EM sales in fiscal 2013 from
33.8%
in fiscal 2012, attributable to higher growth rates in Asia, the effects of the acquisition of Internix, Inc. in Japan, and lower growth rates in the western regions. TS gross profit margin improved
24
basis points year over year, primarily driven by the Americas and EMEA regions offset by a decrease in Asia.
Selling, General and Administrative Expenses
Selling, general and administrative expenses (“SG&A expenses”) were
$2.34 billion
in fiscal
2014
, an increase of
$136.8 million
, or
6.2%
, from fiscal 2013. This increase consisted primarily of an increase of approximately $138.0 million related to expenses from businesses acquired, and to a lesser extent from an approximately $18.0 million increase related to the translation impact of changes in foreign currency exchange rates. These increases were partially offset by a decrease related to recent restructuring and cost reduction actions net of SG&A expense increases related to inflation. In fiscal
2014
, SG&A expenses as a percentage of sales were
8.5%
and as a percentage of gross profit were
72.6%
as compared with
8.7%
and
74.0%
, respectively, in fiscal
2013
. SG&A expenses as a percentage of gross profit at EM decreased
241
basis points year over year due primarily to the benefits of recent restructuring and cost savings actions and from an increase in gross profit, partially offset by increases associated with recently acquired businesses that were not fully integrated for the entire fiscal 2014 and the effects of inflation and other factors. SG&A expenses as a percentage of gross profit at TS decreased
15
basis points from fiscal 2013 due primarily to the benefits of recent restructuring and costs savings actions and the increase in gross profit, partially offset by the increases associated with recently acquired businesses and the effects of inflation and other factors.
SG&A expenses were
$2.20 billion
in fiscal
2013
, an increase of
$111.5 million
, or
5.3%
, from fiscal 2012. This increase consisted of an increase of approximately $184.4 million related to expenses from businesses acquired and the effects of inflation and other factors, which increased the Company's SG&A expenses by an estimated $61.0 million. These increases were partially offset by a decrease of approximately $100.0 million related to recent restructuring and cost reduction actions and a decrease of approximately $33.9 million related to the translation impact of changes in foreign currency exchange rates. In fiscal
2013
, SG&A expenses as a percentage of sales were
8.7%
and as a percentage of gross profit were
74.0%
as compared with
8.1%
and
68.6%
, respectively, in fiscal
2012
. SG&A expenses as a percentage of gross profit at EM increased
522
basis points year over year, primarily due to the effects of recent acquisitions as the related cost savings had not yet been fully attained and due to declines in
22
total gross profit dollars relative to operating expenses. SG&A expenses as a percentage of gross profit at TS increased
346
basis points year over year due primarily to the effects of the decrease in sales as previously described and, to a lesser extent, the effects of recent acquisitions as certain cost synergies had not yet been attained.
Restructuring, Integration and Other Expenses
During fiscal 2014, the Company took certain actions in an effort to reduce future operating costs including activities necessary to achieve planned synergies from recently acquired businesses. In addition, the Company incurred integration and other costs primarily associated with acquired or divested businesses and for the consolidation of facilities. As a result, during fiscal 2014 the Company recorded restructuring, integration and other expenses of
$94.6 million
. Restructuring expenses of
$65.7 million
consisted of
$53.3 million
for severance,
$11.6 million
for facility exit costs and asset impairments, and
$0.9 million
for other restructuring expenses. Integration and other costs including acquisition costs were
$20.5 million
and
$8.8 million
, respectively. The Company also recorded a net benefit of
$0.3 million
for changes in estimates for restructuring liabilities established in prior years. The after tax impact of restructuring, integration, and other expenses was
$70.8 million
and
$0.50
per share on a diluted basis.
Severance expense recorded in fiscal
2014
related to the reduction, or planned reduction, of over
1,100
employees, primarily in operations, sales and business support functions, in connection with cost reduction actions taken in both operating groups, including reductions in recently acquired or integrated businesses. Facility exit costs primarily consisted of liabilities for remaining lease obligations and the impairment of long-lived assets for facilities and information technology systems the Company ceased using. Other restructuring costs related primarily to other miscellaneous restructuring and exit costs. Of the
$65.7 million
in restructuring expenses recorded during fiscal
2014
,
$41.3 million
related to EM,
$23.1 million
related to TS and
$1.3 million
related to corporate business support functions.
During the fourth quarter of fiscal 2014, the Company incurred restructuring expenses related to certain actions intended to achieve planned synergies from recent acquisitions and to reduce future operating costs. The Company also incurred integration and other costs primarily related to costs associated with recently acquired businesses and restructuring related actions. As a result, the Company recorded restructuring, integration and other expenses of $28.0 million during the quarter, including restructuring costs of $19.6 million, integration costs of $8.1 million, other costs of $1.9 million and a benefit for changes in estimates for costs associated with previous restructuring actions of $1.6 million. The tax-effected impact of restructuring, integration and other expenses for the fourth quarter of fiscal 2014 was $20.9 million and $0.15 per share on a diluted basis. When all such restructuring actions are substantially complete, which is expected to occur by the second quarter of fiscal 2015, the Company expects to realize approximately $30.0 million to $35.0 million in annualized operating cost benefits. When realized, the annualized cost savings are expected to benefit the EM operating group by approximately $10.0 million and the TS operating group by approximately $20.0 million to $25.0 million.
Integration costs are primarily related to the integration of acquired businesses, integration of regional business units and incremental costs incurred as part of the consolidation, relocation and closure of warehouse and office facilities. Integration costs include consulting costs for information technology system and business operation integration assistance, facility moving costs, legal fees, travel, meeting, marketing and communication costs that are incrementally incurred as a result of such integration activities. Also included in integration costs are incremental salary costs specific to integration, consolidation and closure activities. Other costs consists primarily of professional fees incurred for acquisitions, additional costs incurred for businesses divested or exited in current or prior periods, any ongoing facilities operating costs associated with the consolidation, relocation and closure of facilities once such facilities have been vacated or substantially vacated, and other miscellaneous costs that relate to restructuring, integration and other expenses. Integration and other costs in fiscal
2014
were comprised of many different costs, none of which were individually material.
During fiscal
2013
, the Company took certain restructuring actions to reduce costs in both operating groups in response to then current market conditions and incurred acquisition and integration costs primarily associated with recently acquired businesses. As a result, the Company recorded restructuring, integration and other expenses of
$149.5 million
. Restructuring expenses of
$120.0 million
consisted of
$73.3 million
for severance,
$34.4 million
for facility exit costs and asset impairments, and
$12.3 million
for other restructuring expenses. Integration costs were
$35.7 million
and other costs were a net benefit of
$3.2 million
. The Company also recorded a benefit of
$3.1 million
for changes in estimates for restructuring liabilities established in prior years. The after tax impact of restructuring, integration, and other expenses was
$116.4 million
and
$0.83
per share on a diluted basis.
During fiscal
2012
, the Company took certain restructuring actions to reduce costs in both operating groups in response to then current market conditions and incurred acquisition and integration costs primarily associated with recently acquired businesses. As a result, the Company recorded restructuring, integration and other expenses of
$73.6 million
. Restructuring expenses of
$50.3 million
consisted of
$33.2 million
for severance,
$12.0 million
for facility exit costs and asset impairments, and
$5.1 million
for
23
other restructuring expenses. Integration costs and other costs primarily associated with acquisitions were
$9.4 million
and
$17.2 million
, respectively. The Company also recorded a benefit of
$3.3 million
for changes in estimates for restructuring liabilities established in prior years. The after tax impact of restructuring, integration and other expenses was
$53.0 million
and
$0.35
per share on a diluted basis.
See Note 17, "Restructuring, integration and other expenses" to the Company's consolidated financial statements included in this Annual Report on Form 10-K for additional information related to restructuring, integration and other expenses.
Operating Income
During fiscal
2014
, the Company had operating income of
$789.9 million
, representing a
26.2%
increase as compared with fiscal 2013 operating income of
$626.0 million
. Consolidated operating income margin was
2.9%
as compared with
2.5%
in fiscal 2013. Both years included restructuring, integration and other expenses and the amortization of intangible assets. Excluding these amounts from both years, adjusted operating income was
$931.3 million
, or
3.4%
of sales, in fiscal
2014
representing a 15.3% increase as compared with
$807.9 million
, or
3.2%
of sales, in fiscal 2013. EM operating income of
$747.9 million
increased
17.7%
year over year, led by EM EMEA with higher sales and operating income compared to fiscal 2013, and with all EM regions delivering increased operating income in comparison to fiscal 2013. EM's operating income margin increased
31
basis points year over year to
4.5%
. The increase in EM operating income margin was primarily due to increases at EM Americas and EM Asia due primarily to a combination of reduced operating expenses as a result of recent restructuring and cost reduction initiatives as well as improved operating leverage, partially offset by increases in operating expenses at EM EMEA from a recent acquisition, from which all synergies have not yet been realized. TS operating income of
$317.8 million
increased
6.2%
year over year and operating income margin remained essentially flat at
2.9%
, with improvements at TS Asia being offset by declines in the western regions. Corporate net operating expenses were
$134.4 million
in fiscal
2014
as compared with
$126.9 million
in fiscal
2013
.
During fiscal
2013
, the Company generated operating income of
$626.0 million
, down
29.2%
, as compared with
$884.2 million
in fiscal 2012. Consolidated operating income margin was
2.5%
as compared with
3.4%
in fiscal 2012. Both years included restructuring, integration and other expenses and the amortization of intangible assets. Excluding these amounts from both years, adjusted operating income was
$807.9 million
, or
3.2%
of sales, in fiscal
2013
as compared with
$985.5 million
, or
3.8%
of sales, in fiscal 2012. EM operating income of
$635.6 million
was down
16.3%
year over year and operating income margin decreased
88
basis points year over year to
4.2%
. The decline in EM operating income margin was primarily due to lower gross profit margin as previously mentioned, which resulted in lower operating income in the western regions, offset partially by the benefits of restructuring and cost reduction actions taken. TS operating income of
$299.1 million
decreased
11.7%
year over year and operating income margin decreased
26
basis points to
2.9%
due primarily to the effects of the decline in sales, as previously described and, to a lesser extent, the effects of recent acquisitions. Corporate operating expenses were
$126.9 million
in fiscal
2013
as compared with
$112.9 million
in fiscal
2012
.
Interest Expense
Interest expense for fiscal
2014
was
$104.8 million
, a decrease of
$2.8 million
, or
2.6%
, compared with fiscal
2013
. The decrease in interest expense was primarily due to the repayment at maturity of $300.0 million of 5.875% Notes at the end of the third quarter of fiscal 2014 and a corresponding lower average borrowing rate. This decrease was partially offset by higher average outstanding debt during fiscal
2014
compared to fiscal
2013
.
Interest expense for fiscal
2013
was
$107.7 million
, an increase of
$16.8 million
, or
18.5%
, compared with fiscal 2012. The increase in interest expense was primarily due to a higher average debt in fiscal 2013, which was impacted by the $350.0 million of 4.875% Notes issued during the second quarter of fiscal 2013.
See
Financing Transactions
for further discussion of the Company's outstanding debt.
Other Income (Expense), net
During fiscal
2014
, the Company recognized
$6.1 million
of other expense as compared with
$0.1 million
in fiscal 2013. The increase in other expense in fiscal 2014 is primarily is attributable to fiscal 2013 benefiting from a realized gain on the sale of marketable securities and to a lesser extent higher interest income compared to fiscal 2013. Fiscal 2014 and fiscal 2013 had similar amounts of net foreign currency exchange losses and both years were impacted by the devaluation of the Venezuelan currency.
During fiscal
2013
, the Company recognized
$0.1 million
of other expense as compared with other expense of
$5.4 million
in fiscal 2012. The decrease in other expense was primarily attributable to lower foreign currency exchange losses in fiscal 2013
24
compared to fiscal 2012. Included in other expense for fiscal 2013 is a realized gain on the sale of marketable securities partially offset by foreign currency losses due to the devaluation of the Venezuelan currency during fiscal 2013.
25
Gain on Legal Settlement, Bargain Purchase and Other
During fiscal 2014, the Company received award payments and recognized a gain on legal settlement of $22.1 million before tax, $13.5 million after tax and $0.09 per share on a diluted basis.
During fiscal 2013, the Company recognized a gain on bargain purchase and other of
$31.0 million
before tax, which consisted of (i) a gain on bargain purchase related to the acquisition of Internix of
$32.7 million
before and after tax and
$0.23
per share on a diluted basis, which was partially offset by (ii) a loss of
$1.7 million
before and after tax and
$0.01
per share on a diluted basis as a result of the divestiture of a small business in the TS Asia region.
During fiscal 2012, the Company recognized a gain on bargain purchase related to the acquisition of Unidux of
$4.3 million
before and after tax and
$0.03
per share on a diluted basis. In addition, the Company recognized other expenses of
$1.4 million
before tax,
$0.9 million
after tax and
$0.01
per share on a diluted basis related to the impairment of an investment in a small technology company and the write-off of certain deferred financing costs associated with the early termination of a credit facility.
Income Tax Provision
Avnet’s effective tax rate on income before income taxes was
22.2%
in fiscal
2014
as compared with an effective tax rate of
18.1%
in fiscal
2013
. Included in the fiscal
2014
effective tax rate is a net tax benefit of
$43.8 million
, which is comprised primarily of (i) a tax benefit of
$33.4 million
for the release of valuation allowances against deferred tax assets that were determined to be realizable, primarily related to a legal entity in EMEA (discussed further below), and (ii) a net tax benefit of
$7.0 million
resulting from losses related to an investment in a foreign subsidiary. The fiscal
2014
effective tax rate is higher than the fiscal
2013
effective tax rate primarily due to a lower amount of tax benefits from audit settlements in fiscal 2014 as compared to fiscal 2013, partially offset by a greater tax benefit from the valuation allowances released in fiscal 2014 as compared with the amount released in fiscal 2013.
As of the end of fiscal 2014, the Company had a partial valuation allowance against significant net operating loss carry-forward deferred tax assets related to a legal entity in EMEA due to, among several other factors, a history of losses in that entity. In recent fiscal years, such entity has been experiencing improved earnings, which required the partial release of the valuation allowance to the extent the entity has projected future taxable income. In fiscal 2014 and fiscal 2013, the Company determined a portion of the valuation allowance for such legal entity was no longer required due to the expected continuation of improved earnings in the foreseeable future and, as a result, the Company's effective tax rate was reduced upon the partial release of the valuation allowance, net of the U.S. tax expense. In fiscal 2014 and 2013, the valuation allowance released associated with this EMEA legal entity was
$33.6 million
and
$27.1 million
, respectively, net of the U.S. tax expense associated with the release. Excluding the benefit in both fiscal years related to the release of the tax valuation allowance associated with such EMEA legal entity, the effective tax rate for fiscal
2014
and fiscal 2013 would have been
27.0%
and
23.0%
, respectively.
The Company will continue to evaluate the need for a valuation allowance against these deferred tax assets and will adjust the valuation allowance as deemed appropriate which, if reduced, could result in a significant decrease to the effective tax rate in the period of the adjustment.
Avnet’s effective tax rate on income before income taxes was
18.1%
in fiscal
2013
compared with an effective tax rate of
28.3%
in fiscal
2012
. The fiscal
2013
effective tax rate is lower than the fiscal
2012
effective tax rate primarily due to the fiscal 2013 effective tax rate including a net tax benefit of $50.4 million, which is comprised of (i) a tax benefit of $41.6 million for the reversal of previously established valuation allowances against deferred tax assets that were now determined to be realizable, a portion of which related to a legal entity in EMEA (discussed further above), (ii) net favorable audit settlements resulting in a benefit of $33.2 million, partially offset by (iii) a tax expense of $24.4 million primarily related to the establishment of a valuation allowance against deferred tax assets that were determined to be unrealizable during fiscal 2013.
Avnet's effective tax rate is primarily a function of the tax rates in the numerous jurisdictions in which it does business applied to the mix of income before taxes. The effective tax rate may vary year over year as a result of changes in tax requirements in these jurisdictions, management's evaluation of its ability to generate sufficient taxable income to offset net operating loss carry-forwards and the establishment of liabilities for unfavorable outcomes of tax positions taken on certain matters that are common to multinational enterprises and the actual outcome of those matters.
Net Income
As a result of the factors described in the preceding sections of this MD&A, the Company’s net income in fiscal
2014
was
$545.6 million
, or
$3.89
per share on a diluted basis, compared with net income of
$450.1 million
, or
$3.21
per share on a diluted basis, in fiscal
2013
and
$567.0 million
, or
$3.79
per share on a diluted basis, in fiscal
2012
.
26
Liquidity and Capital Resources
Cash Flows
Cash Flows from Operating Activities
The Company generated
$237.4 million
of cash from its operating activities in fiscal
2014
as compared to a cash generation of
$696.2 million
in fiscal
2013
. These operating cash flows are comprised of: (i) cash flows generated from net income, adjusted for the impact of non-cash and other items, which includes depreciation and amortization expenses, deferred income taxes, stock-based compensation expense and other non-cash items (primarily, provisions for doubtful accounts and periodic pension costs) and (ii) cash flows used for, or generated from, working capital and other, excluding cash and cash equivalents. Cash used for working capital and other was
$564.3 million
during fiscal
2014
, including increases in receivables of
$306.9 million
, inventories of
$226.1 million
, and a decrease in accrued expenses and other of
$80.0 million
, partially offset by an increase in accounts payable of
$48.7 million
. Receivables and inventories days on hand has not changed significantly from the end of fiscal 2013.
During fiscal
2013
, the Company generated
$696.2 million
of cash from operating activities as compared with
$528.7 million
in fiscal
2012
. Cash generated by working capital and other was
$47.5 million
during fiscal
2013
, resulting from a decrease in inventories of
$225.7 million
, partially offset by a decrease in accounts payable and accrued expenses and other of
$78.8 million
and
$5.2 million
, respectively, and an increase in receivables of
$94.2 million
. During fiscal 2013, net days outstanding and receivables days on hand did not change significantly from the end of fiscal 2012.
Cash Flows from Financing Activities
During fiscal
2014
, the Company repaid upon maturity the $300.0 million of 5.875% Notes due in March 2014. The Company received proceeds of
$38.8 million
and
$255.0 million
from net borrowings of bank and other debt, and the accounts receivable securitization program, respectively. In addition, during fiscal
2014
, the Company used
$82.8 million
and
$8.6 million
of cash to pay quarterly cash dividends on common stock and to repurchase common stock under the Company's share repurchase program.
During fiscal
2013
, the Company repaid
$490.9 million
under the accounts receivable securitization program and its revolving credit facility. The Company also received net proceeds of $349.3 million from the issuance of $350 million of 4.875% Notes due December 1, 2022. In addition, during fiscal 2013, the Company used
$207.2 million
of cash to repurchase common stock under the Company's share repurchase program.
During fiscal
2012
, the Company received proceeds of
$595.8 million
, primarily from borrowings under the accounts receivable securitization program and bank credit facilities. In addition, the Company used
$318.3 million
of cash to repurchase common stock under the Company's share repurchase program.
Other financing activities, net, during fiscal
2014
,
2013
and
2012
were primarily a result of cash received for the exercise of stock options and the associated excess tax benefit.
Cash Flows from Investing Activities
During fiscal
2014
, the Company used
$116.9 million
of cash for acquisitions, net of cash acquired, and
$123.2 million
for capital expenditures primarily related to information system development costs and computer hardware and software purchases.
During fiscal
2013
, the Company used
$262.3 million
of cash for acquisitions, net of cash acquired, and
$97.4 million
for capital expenditures primarily related to information system development costs and computer hardware and software purchases.
During fiscal
2012
, the Company used
$313.2 million
of cash for acquisitions, net of cash acquired, and
$128.7 million
for capital expenditures primarily related to information system development costs and computer hardware and software expenditures.
Capital Structure
The Company uses a variety of financing arrangements, both short-term and long-term, to fund its operations in addition to cash generated from operations. The Company also uses diversified sources of funding so that it does not become overly dependent on one source and to achieve lower cost of funding through these different alternatives. These financing arrangements include public bonds, short-term and long-term bank loans and an accounts receivable securitization program. For a detailed description of the Company’s external financing arrangements outstanding at
June 28, 2014
, refer to Note 7 to the consolidated financial statements appearing in Item 15 of this Report.
27
The following table summarizes the Company’s capital structure as of the end of fiscal
2014
with a comparison with the end of fiscal
2013
:
|
June 28,
2014 |
% of Total Capitalization
|
June 29,
2013 |
% of Total
Capitalization
|
||||||||||
|
|
(Dollars in thousands)
|
||||||||||||
|
Short-term debt
|
$
|
865,088
|
|
12.4
|
%
|
$
|
838,190
|
|
13.2
|
%
|
|||
|
Long-term debt
|
1,213,814
|
|
17.4
|
|
1,206,993
|
|
19.1
|
|
|||||
|
Total debt
|
2,078,902
|
|
29.8
|
|
2,045,183
|
|
32.3
|
|
|||||
|
Shareholders’ equity
|
4,890,193
|
|
70.2
|
|
4,289,125
|
|
67.7
|
|
|||||
|
Total capitalization
|
$
|
6,969,095
|
|
100.0
|
|
$
|
6,334,308
|
|
100.0
|
|
|||
Financing Transactions
During fiscal 2014, the Company had a
five-year
$1.00 billion
senior unsecured revolving credit facility (the "2012 Credit Facility") with a syndicate of banks, which expires in
November 2016
. Under the 2012 Credit Facility, the Company may select from various interest rate options, currencies and maturities. There were $12.0 million in borrowings outstanding under the 2012 Credit Facility as of
June 28, 2014
and $6.7 million as of
June 29, 2013
.
In August 2013, the Company amended and extended its accounts receivable securitization program (the “Program”) with a group of financial institutions to allow the Company to sell, on a revolving basis, an undivided interest of up to $800.0 million in eligible receivables while retaining a subordinated interest in a portion of the receivables. The Program does not qualify for sale accounting treatment and, as a result, any borrowings under the Program are recorded as debt on the consolidated balance sheets. The Program has a
one-year
term that expires at the end of
August 2014
, at which time it is expected to be renewed for another one to two years on comparable terms. There were
$615.0 million
in borrowings outstanding under the Program as of
June 28, 2014
and
$360.0
as of
June 29, 2013
. Interest on borrowings is calculated using a base rate or a commerical paper rate plus a spread of 0.35%. The facility fee is
0.35%
.
Notes outstanding at
June 28, 2014
consisted of:
|
•
|
$250.0 million of 6.00% Notes due September 1, 2015
|
|
•
|
$300.0 million of 6.625% Notes due September 15, 2016
|
|
•
|
$300.0 million of 5.875% Notes due June 15, 2020
|
|
•
|
$350.0 million of 4.875% Notes due December 1, 2022
|
The Company also has several small lines of credit and other forms of bank debt in various foreign locations to fund the short-term working capital, foreign exchange, overdraft and letter of credit needs of its wholly owned subsidiaries in EMEA, Asia, Latin America and Canada. Avnet generally guarantees its subsidiaries’ obligations under these facilities. Outstanding borrowings under such forms of debt as of the end of fiscal 2014 was
$253.7 million
.
Covenants and Conditions
The Program requires the Company to maintain certain minimum interest coverage and leverage ratios in order to continue utilizing the Program. The Program also contains certain covenants relating to the quality of the receivables sold. If these conditions are not met, the Company may not be able to borrow any additional funds and the financial institutions may consider this an amortization event, as defined in the Program agreements, which would permit the financial institutions to liquidate the accounts receivables sold to cover any outstanding borrowings. Circumstances that could affect the Company’s ability to meet the required covenants and conditions of the Program include the Company’s ongoing profitability and various other economic, market and industry factors. Management does not believe that the covenants under the Program limit the Company’s ability to pursue its intended business strategy or its future financing needs. The Company was in compliance with all covenants of the Program as of
June 28, 2014
.
The 2012 Credit Facility contains certain covenants with various limitations on debt incurrence, share repurchases, dividends, investments and capital expenditures and also includes financial covenants requiring the Company to maintain minimum interest coverage and leverage ratios. Management does not believe that the covenants in the 2012 Credit Facility limit the Company’s
28
ability to pursue its intended business strategy or its future financing needs. The Company was in compliance with all covenants of the 2012 Credit Facility as of
June 28, 2014
.
See
Liquidity
below for further discussion of the Company’s availability under these various facilities.
Liquidity
The Company had cash and cash equivalents of
$929.0 million
as of
June 28, 2014
, of which
$815.4 million
was held outside the U.S. As of
June 29, 2013
, the Company had cash and cash equivalents of
$1.01 billion
, of which
$918.4 million
was held outside of the U.S.
As of
June 28, 2014
, the Company had a combined total borrowing capacity of
$1.80 billion
under the 2012 Credit Facility and the Program. There were
$12.0 million
in borrowings outstanding and
$2.0 million
in letters of credit issued under the 2012 Credit Facility and
$615.0 million
outstanding under the Program. During fiscal
2014
, the Company had an average daily balance outstanding under the 2012 Credit Facility of approximately
$7.0 million
and
$534.0 million
under the Program. During fiscal
2013
, the Company had an average daily balance outstanding under the 2012 Credit Facility of approximately
$5.0 million
and
$570.0 million
under the Program.
Liquidity is subject to many factors, such as normal business operations as well as general economic, financial, competitive, legislative, and regulatory factors that are beyond the Company’s control. Cash balances generated and held in foreign locations are used for ongoing working capital, capital expenditure needs and to support acquisitions. These balances are currently expected to be permanently reinvested outside the United States. If these funds were needed for general corporate use in the United States, the Company would incur significant income taxes to repatriate cash held in foreign locations, but only to the extent the repatriated cash is in excess of any outstanding intercompany loans due to Avnet, Inc. from foreign subsidiaries. In addition, local government regulations may restrict the Company’s ability to move funds among various locations under certain circumstances. Management does not believe such restrictions would limit the Company’s ability to pursue its intended business strategy.
During fiscal
2014
, the Company utilized
$116.9 million
of cash, net of cash acquired, for acquisitions. The Company has made, and expects to continue to make, strategic investments through acquisition activity to the extent the investments strengthen Avnet’s competitive position and/or meet management’s return on capital thresholds.
In addition to continuing to make investments in acquisitions, as of
June 28, 2014
, the Company may repurchase up to an aggregate of
$215.9 million
of the Company’s common stock through a $750.0 million share repurchase program approved by the Board of Directors in prior years. The Company plans to repurchase stock from time to time at the discretion of management, subject to strategic considerations, market conditions and other factors. The Company may terminate or limit the share repurchase program at any time without prior notice. The timing and actual number of shares purchased will depend on a variety of factors such as share price, corporate and regulatory requirements, and prevailing market conditions. Since the beginning of the repurchase program through the end of fiscal
2014
, the Company has repurchased
18.1 million
shares at an average market price of
$29.51
per share for total cost of
$534.1 million
. Shares repurchased were retired. Additionally, the Company currently expects to pay quarterly cash dividends on shares of its common stock, subject to approval of the Board of Directors. During fiscal
2014
, the Company paid cash dividends of
$82.8 million
on its common stock or $0.15 per share on a quarterly basis.
In July 2014, subsequent to the end of fiscal 2014, the Company terminated the 2012 Credit Facility and entered into a five-year $1.25 billion senior unsecured revolving credit facility (the "2014 Credit Facility") with a syndicate of banks, consisting of revolving credit facilities and the issuance of up to $150.0 million of letters of credit. Subject to certain conditions, the 2014 Credit Facility may be increased up to $1.50 billion. Under the 2014 Credit Facility, the Company may select from various interest rate options, currencies and maturities. The 2014 Credit Facility contains certain covenants, which are substantially similar to those covenants contained in the 2012 Credit Facility. The 2014 Credit Facility is scheduled to mature in July 2019.
During periods of weakening demand in the electronic component and enterprise computer solutions industry, the Company typically generates cash from operating activities. Conversely, the Company is more likely to use operating cash flows for working capital requirements during periods of higher growth.
Management believes that Avnet’s available borrowing capacity, its current cash on hand and the Company’s expected ability to generate operating cash flows in the future will be sufficient to meet its future liquidity needs. The Company also may issue debt or equity securities in the future and management believes the Company will have adequate access to the capital markets, if needed.
The following table highlights the Company’s liquidity and related ratios for the past two fiscal years:
29
COMPARATIVE ANALYSIS — LIQUIDITY
|
|
Years Ended
|
|||||||||
|
June 28,
2014 |
June 29,
2013 |
Percentage
Change
|
||||||||
|
|
(Dollars in millions)
|
|||||||||
|
Current Assets
|
$
|
8,954.2
|
|
$
|
8,356.9
|
|
7.1
|
%
|
||
|
Quick Assets
|
6,149.5
|
|
5,878.3
|
|
4.6
|
|
||||
|
Current Liabilities
|
4,978.8
|
|
4,821.4
|
|
3.3
|
|
||||
|
Working Capital
(1)
|
3,975.4
|
|
3,535.4
|
|
12.4
|
|
||||
|
Total Debt
|
2,078.9
|
|
2,045.2
|
|
1.6
|
|
||||
|
Total Capital (total debt plus total shareholders’ equity)
|
6,969.1
|
|
6,334.3
|
|
10.0
|
|
||||
|
Quick Ratio
|
1.2:1
|
|
1.2:1
|
|
|
|||||
|
Working Capital Ratio
|
1.8:1
|
|
1.7:1
|
|
|
|||||
|
Debt to Total Capital
|
29.8
|
%
|
32.3
|
%
|
|
|||||
______________________
|
(1)
|
This calculation of working capital is defined as current assets less current liabilities.
|
The Company’s quick assets (consisting of cash and cash equivalents and receivables) increased
4.6%
from
June 29, 2013
to
June 28, 2014
primarily due to an increase in receivables as a result of the corresponding year-over-year increase in sales, partially offset by a decrease in cash and cash equivalents. These factors, when combined with an increase in inventories and prepaid and other current assets, led to an increase in current assets of
7.1%
. Current liabilities increased
3.3%
primarily due to an increase in accounts payable, short-term debt, and accrued expenses and other. As a result of the factors noted above, total working capital increased by
12.4%
during fiscal
2014
. Total debt increased by
1.6%
, primarily due to the increase in borrowings under bank credit facilities, total capital increased
10.0%
and the debt to total capital ratio decreased to
29.8%
.
Long-Term Contractual Obligations
The Company has the following contractual obligations outstanding as of
June 28, 2014
(in millions):
|
Total
|
Due in Less
Than 1 Year
|
Due in
1-3 Years
|
Due in
4-5 Years
|
Due After
5 Years
|
|||||||||||||||
|
Long-term debt, including amounts due
within one year
(1)
|
$
|
2,080.9
|
|
$
|
865.1
|
|
$
|
565.8
|
|
$
|
—
|
|
$
|
650.0
|
|
||||
|
Interest expense on long-term notes
(2)
|
$
|
304.5
|
|
$
|
79.7
|
|
$
|
96.5
|
|
$
|
69.4
|
|
$
|
58.9
|
|
||||
|
Operating leases
|
$
|
377.5
|
|
$
|
91.3
|
|
$
|
125.0
|
|
$
|
69.2
|
|
$
|
92.0
|
|
||||
______________________
|
(1)
|
Excludes discount on long-term notes.
|
|
(2)
|
Represents interest expense due on long-term notes with fixed interest rates and variable debt assuming the same interest rate as of the end of fiscal 2014.
|
At
June 28, 2014
, the Company had an estimated liability for income tax contingencies of
$128.2 million
, which is not included in the above table. Cash payments associated with the settlement of these liabilities that are expected to be paid within the next 12 months is
$7.8 million
. The settlement period for the remaining amount of the unrecognized tax benefits, including related accrued interest and penalties, cannot be determined and therefore was not included in the table. The Company does not currently have any material long-term commitments for purchases of inventories from suppliers or for capital expenditures.
30
Critical Accounting Policies
The Company’s consolidated financial statements have been prepared in accordance with GAAP. The preparation of these consolidated financial statements requires the Company to make estimates and assumptions that affect the reported amounts of assets, liabilities, sales and expenses. These estimates and assumptions are based upon the Company’s continuous evaluation of available information including historical results and anticipated future events. Actual results may differ materially from these estimates.
The Securities and Exchange Commission defines critical accounting policies as those that are, in management’s view, most important to the portrayal of the Company’s financial condition and results of operations and that require significant judgments and estimates. Management believes the Company’s most critical accounting policies relate to:
Valuation of Receivables
The Company maintains an allowance for doubtful accounts for estimated losses primarily resulting from customer defaults. Bad debt expense and the related allowance for doubtful accounts is determined based upon historic customer default experience as well as the Company’s regular assessment of the financial condition of its customers. Therefore, if actual collection experience or the financial condition of customers were to change, management would evaluate whether adjustments to the allowance for doubtful accounts are necessary.
Valuation of Inventories
Inventories are recorded at the lower of cost (first in — first out) or estimated market value. The Company’s inventories include high-technology components, embedded systems and computing technologies sold into rapidly changing, cyclical and competitive markets wherein such inventories may be subject to declines in market value or technological obsolescence.
The Company regularly evaluates inventories for excess, obsolescence or other factors that may render inventories less marketable. Write-downs are recorded so that inventories reflect the approximate net realizable value and take into account the Company’s contractual provisions with its suppliers, which may provide certain protections to the Company for product obsolescence and price erosion in the form of rights of return and price protections. Because of the large number of products and suppliers and the complexity of managing the process around price protections and stock rotations, estimates are made regarding reductions to the value of inventories. Additionally, assumptions about future demand, market conditions and decisions to discontinue certain product lines impact the evaluation of whether to write-down inventories. If assumptions about future demand change or actual market conditions are less favorable than those assumed by management, management would evaluate whether additional write-downs of inventories are required. In any case, actual net realizable values could be different from those currently estimated.
Accounting for Income Taxes
Management's judgment is required in determining income tax expense, measuring deferred tax assets and liabilities and the valuation allowances recorded against net deferred tax assets. The recoverability of the Company's net operating loss carry-forwards is dependent upon its ability to generate sufficient future taxable income in certain jurisdictions. In addition, the Company considers historic levels of income, expectations and risk associated with estimates of future taxable income and ongoing prudent and feasible tax planning strategies in assessing the need for valuation allowances. Should the Company determine that it is not able to realize all or part of its deferred tax assets in the future, additional valuation allowances may be recorded against the deferred tax assets with a corresponding increase to income tax expense in the period such determination is made. Similarly, should the Company determine that it is able to realize all or part of its deferred tax assets that have an associated valuation allowance established, the Company may release a valuation allowance with a corresponding benefit to income tax expense in the period such determination is made.
The Company establishes contingent liabilities for potentially unfavorable outcomes of positions taken on certain tax matters. These liabilities are based on management's assessment of whether a tax benefit is more likely than not to be sustained upon examination by tax authorities. There may be differences between the anticipated and actual outcomes of these matters that may result in changes in estimates to such liabilities. To the extent such changes in estimates are necessary, the Company's effective tax rate may potentially fluctuate as a result. In accordance with the Company's accounting policy, accrued interest and penalties related to unrecognized tax benefits are recorded as a component of income tax expense.
In determining the Company's effective tax rate, management considers current tax regulations in the numerous jurisdictions in which it operates, and exercises judgment for interpretation and application. Changes to such tax regulations or disagreements with the Company's interpretation or application by tax authorities in any of the Company's major jurisdictions may have a significant impact on the Company's income tax expense.
31
Restructuring, Integration and Impairment Expenses
The Company has been subject to the financial impact of integrating acquired businesses and expenses related to business restructurings, including those related to businesses acquired and in response to market conditions. In connection with such events, management is required to make estimates about the financial impact of such restructuring and integration activities that are inherently uncertain. Accrued liabilities are established based on estimates to cover the cost of severance, facility consolidation and closure, lease termination fees, inventory adjustments based upon acquisition-related termination of supplier agreements and/or the re-evaluation of the acquired working capital assets (primarily inventories and receivables), and the impairment of long-lived assets. Actual amounts incurred could be different from those estimated.
Additionally, in assessing goodwill for impairment, the Company is required to make significant assumptions about the future cash flows and overall performance of its reporting units. The Company is also required to make judgments regarding the evaluation of changes in events or circumstances that would more likely than not reduce the fair value of any of its reporting units below their carrying value, the results of which would determine whether an interim goodwill impairment test must be performed. Should these assumptions or judgments change in the future based upon market conditions or should the structure of the Company’s reporting units change based upon changes in business strategy, the Company may be required to perform an interim impairment test which may result in a goodwill impairment charge.
During fiscal
2014
,
2013
and
2012
, the Company performed its annual goodwill impairment test and determined there was no goodwill impairment at any of its reporting units. The Company does not believe there were any reporting units that were at risk of failing the fiscal 2014 goodwill impairment test. However, in fiscal
2014
there were two reporting units for which the estimated fair value was not substantially in excess of the current carrying value of the reporting unit. The percentage by which the estimated fair value exceeded carrying value was approximately
10%
for TS Asia,which has less than 4% of the Company's total goodwill and approximately 15% for TS EMEA, which has less than 15% of the Company's total goodwill.
In order to estimate the fair value of its reporting units, the Company uses a combination of an income approach, specifically a discounted cash flow methodology, and a market approach. The discounted cash flow methodology includes market participant assumptions for, among other factors, forecasted sales, gross profit margins, operating profit margins, cash flows, perpetual growth rates and long-term discount rates, all of which require significant judgments and estimates by management which are inherently uncertain. These assumptions, judgments and estimates may change in the future based upon market conditions or other events and could result in a goodwill impairment charge.
Contingencies and Litigation
From time to time, the Company may become a party to, or otherwise be involved in, various lawsuits, claims, investigations and other legal proceedings in the ordinary course of conducting its business. While litigation is subject to inherent uncertainties, management does not anticipate that any current matters will have a material adverse impact on the Company’s financial condition, liquidity or results of operations.
Revenue Recognition and Related Policies
The Company does not consider revenue recognition to be a critical accounting policy due to the nature of its business because revenues are generally recognized when persuasive evidence of an arrangement exists, delivery has occurred or services have been rendered, the sales price is fixed or determinable and collectability is reasonably assured. Generally, these criteria are met upon the actual shipment or delivery of products or services to the customer depending upon the underlying sales terms. Accordingly, although management makes certain estimates related to possible returns of products from customers, discounts and rebates, such amounts do not require significant judgments or assumptions.
Provisions for sales returns are estimated based on historical sales returns experience, credit memo experience and other known factors. Provisions are made for discounts and rebates, which are primarily timing or volume-specific, and are generally based on historical trends and anticipated customer buying patterns. Finally, revenues from maintenance contracts, which are deferred and recognized as sales over the life of the maintenance agreement, are not material to the consolidated results of operations of the Company.
The Company evaluates the criteria outlined in ASC Topic 605-45,
Principal Agent Considerations
, in determining whether it is appropriate to record the gross amount of revenues and related costs or the net amount (gross fees less related cost of sales or services) depending upon whether the Company is the principal or agent for certain sales arrangements. Generally, transactions that qualify for net accounting treatment consist of the sale of supplier service contracts for which the Company has no continuing involvement or the performance of logistics services to deliver product for which the Company is not the primary obligor.
32
The Company must also make estimates related to the recognition of consideration received from suppliers for price protection, product rebates, marketing/promotional activities, or any other programs. Consideration received or due from these supplier programs are recognized when earned under the terms and conditions of the supplier programs as adjustments to product costs, or selling, general and administrative expenses depending upon the nature and contractual requirements related to the consideration received. Some of these supplier programs may extend over one or more reporting periods.
Recently Issued Accounting Pronouncements
See Note 1 in the
Notes to Consolidated Financial Statements
contained in Item 15 of this Report for the discussion of recently issued accounting pronouncements.
The Company seeks to reduce earnings and cash flow volatility associated with changes in interest rates and foreign currency exchange rates by entering into financial arrangements, from time to time, which are intended to provide an economic hedge against all or a portion of the risks associated with such volatility. The Company continues to have exposure to such risks to the extent they are not hedged.
The following table sets forth the scheduled maturities of the Company’s debt outstanding at
June 28, 2014
(dollars in millions):
|
|
Fiscal Year
|
||||||||||||||||||||||||||
|
|
2015
|
2016
|
2017
|
2018
|
2019
|
Thereafter
|
Total
|
||||||||||||||||||||
|
Liabilities:
|
|
|
|
|
|
|
|
||||||||||||||||||||
|
Fixed rate debt
(1)
|
$
|
159.7
|
|
$
|
252.6
|
|
$
|
301.3
|
|
$
|
—
|
|
$
|
—
|
|
$
|
650.0
|
|
$
|
1,363.6
|
|
||||||
|
Floating rate debt
|
$
|
705.4
|
|
$
|
12.0
|
|
$
|
—
|
|
$
|
—
|
|
$
|
—
|
|
$
|
—
|
|
$
|
717.4
|
|
||||||
______________________
|
(1)
|
Excludes discounts on long-term notes.
|
The following table sets forth the carrying value and fair value of the Company’s debt and the average interest rate at
June 28, 2014
and June 29, 2013 (dollars in millions):
|
Carrying Value at June 28, 2014
|
Fair Value at June 28, 2014
|
Carrying Value at June 29, 2013
|
Fair Value at June 29, 2013
|
||||||||||||
|
Liabilities:
|
|
|
|
|
|||||||||||
|
Fixed rate debt
(1)
|
$
|
1,363.6
|
|
$
|
1,474.7
|
|
$
|
1,562.6
|
|
$
|
1,645.1
|
|
|||
|
Average interest rate
|
5.4
|
%
|
5.8
|
%
|
|||||||||||
|
Floating rate debt
|
$
|
717.4
|
|
$
|
717.4
|
|
$
|
485.2
|
|
$
|
485.2
|
|
|||
|
Average interest rate
|
1.1
|
%
|
1.1
|
%
|
|||||||||||
______________________
|
(1)
|
Excludes discounts on long-term notes. Fair value was estimated primarily based upon quoted market prices for the Company's long-term notes.
|
Many of the Company’s subsidiaries purchase and sell products in currencies other than their functional currencies. This subjects the Company to the risks associated with fluctuations in foreign currency exchange rates. The Company reduces this risk by utilizing natural hedging (i.e., offsetting receivables and payables) as well as by creating offsetting positions through the use of derivative financial instruments, primarily forward foreign exchange contracts typically with maturities of less than sixty days ("economic hedges"). The Company continues to have exposure to foreign currency risks to the extent they are not hedged. The Company adjusts any economic hedges to fair value through the consolidated statements of operations primarily within "other income (expense), net." Therefore, the changes in valuation of the underlying items being economically hedged are offset by the changes in fair value of the forward foreign exchange contracts. The amounts representing the fair value of foreign exchange contracts, based upon level 2 criteria under the fair value hierarchy, are classified in the captions “other current assets” or “accrued expenses and other,” as applicable, in the accompanying consolidated balance sheets and were not material as of June 28, 2014 and June 29, 2013. The Company did not have material gains or losses related to the forward foreign exchange contracts during fiscal 2014 and 2013. A hypothetical 10% change in currency exchange rates under the contracts outstanding at
June 28, 2014
33
would result in an increase or decrease of approximately
$50.0 million
to the fair value of the forward foreign exchange contracts, which would generally be offset by an opposite effect on the underlying exposure being economically hedged.
The financial statements and supplementary data are listed under Item 15 of this Report.
None.
34
Disclosure Controls and Procedures
The Company’s management, including its Chief Executive Officer and Chief Financial Officer, have evaluated the effectiveness of the Company’s disclosure controls and procedures (as such term is defined in Rules 13a-15(e) and 15d-15(e) under the Securities Exchange Act of 1934 (the “Exchange Act”)) as of the end of the reporting period covered by this report on Form 10-K. Based on such evaluation, the Chief Executive Officer and Chief Financial Officer have concluded that, as of the end of the period covered by this report on Form 10-K, the Company’s disclosure controls and procedures are effective such that material information required to be disclosed by the Company in the reports that it files or submits under the Exchange Act is recorded, processed, summarized and reported, within the time periods specified by the Securities and Exchange Commission’s rules and forms and is accumulated and communicated to management, including the Company’s principal executive officer and principal financial officer, as appropriate to allow timely decisions regarding required disclosure.
During the fourth quarter of fiscal
2014
, there were no changes to the Company’s internal control over financial reporting (as defined in Rule 13a-15(f) of the Exchange Act) that have materially affected, or are reasonably likely to materially affect, the Company’s internal control over financial reporting.
Management’s Report on Internal Control Over Financial Reporting
The Company’s management, including its Chief Executive Officer and Chief Financial Officer, is responsible for establishing and maintaining adequate internal control over financial reporting as defined in Rules 13a-15(f) and 15(d)-15(f) under the Exchange Act. The Company’s internal control over financial reporting is designed to provide reasonable assurance regarding the reliability of financial reporting and the preparation of financial statements for external purposes in accordance with generally accepted accounting principles in the United States of America. Because of inherent limitations, internal control over financial reporting may not prevent or detect misstatements. Also, controls may become inadequate because of changes in conditions, or the degree of compliance with policies or procedures may deteriorate. Management conducted an evaluation of the effectiveness of the Company’s internal control over financial reporting as of
June 28, 2014
. In making this assessment, management used the 1992 framework established in
Internal Control — Integrated Framework
issued by the Committee of Sponsoring Organizations of the Treadway Commission and concluded that the Company maintained effective internal control over financial reporting as of
June 28, 2014
.
The Company’s independent registered public accounting firm, KPMG LLP, has audited the effectiveness of the Company’s internal controls over financial reporting as of
June 28, 2014
, as stated in its audit report which is included herein.
Not applicable.
35
Item 10.
Directors, Executive Officers and Corporate Governance
The information called for by Item 10 is incorporated in this Report by reference to the Company’s definitive proxy statement relating to the Annual Meeting of Stockholders anticipated to be held on
November 6, 2014
.
Item 11.
Executive Compensation
The information called for by Item 11 is incorporated in this Report by reference to the Company’s definitive proxy statement relating to the Annual Meeting of Stockholders anticipated to be held on
November 6, 2014
.
Item 12.
Security Ownership of Certain Beneficial Owners and Management and Related Stockholder Matters
The information called for by Item 12 is incorporated in this Report by reference to the Company’s definitive proxy statement relating to the Annual Meeting of Stockholders anticipated to be held on
November 6, 2014
.
Item 13.
Certain Relationships and Related Transactions, and Director Independence
The information called for by Item 13 is incorporated in this Report by reference to the Company’s definitive proxy statement relating to the Annual Meeting of Shareholders anticipated to be held on
November 6, 2014
.
Item 14.
Principal Accounting Fees and Services
The information called for by Item 14 is incorporated in this Report by reference to the Company’s definitive proxy statement relating to the Annual Meeting of Stockholders anticipated to be held on
November 6, 2014
.
36
Item 15.
Exhibits and Financial Statement Schedules
a. The following documents are filed as part of this Report:
|
|
Page
|
|
|
1.
|
Consolidated Financial Statements:
|
|
|
Avnet, Inc. and Subsidiaries Consolidated Financial Statements:
|
|
|
|
|
|
|
|
|
|
|
|
|
|
|
|
|
|
|
|
|
|
|
|
2.
|
Financial Statement Schedule:
|
|
|
|
|
|
|
|
|
|
|
Schedules other than that above have been omitted because they are not applicable or the required information is shown in the financial statements or notes thereto
|
|
|
|
|
|
|
|
3.
|
Exhibits
|
|
37
SIGNATURES
Pursuant to the requirements of Section 13 or 15(d) of the Securities Exchange Act of 1934, the Registrant has duly caused this Report to be signed on its behalf by the undersigned, thereunto duly authorized.
|
|
AVNET, INC.
(Registrant)
|
|
|
Date: August 8, 2014
|
By:
|
/s/ RICHARD HAMADA
|
|
|
|
Richard Hamada
|
|
|
|
Chief Executive Officer and Director
|
KNOW ALL MEN BY THESE PRESENTS, that each person whose signature appears below hereby authorizes and appoints each of Richard Hamada and Kevin Moriarty his or her attorneys-in-fact, for him or her in any and all capacities, to sign any amendments to this Report, and to file the same, with exhibits thereto, and other documents in connection therewith, with the Securities and Exchange Commission, hereby ratifying and confirming all that said attorneys-in-fact, or their substitute, may do or cause to be done by virtue hereof.
Pursuant to the requirements of the Securities Exchange Act of 1934, this Report has been signed below by the following persons on behalf of the Registrant and in the capacities indicated on
August 8, 2014
.
|
Signature
|
|
Title
|
|
/s/ RICHARD HAMADA
|
|
Chief Executive Officer and Director
(Principal Executive Officer)
|
|
Richard Hamada
|
|
|
|
/s/ WILLIAM H. SCHUMANN, III
|
|
Chairman of the Board and Director
|
|
William H. Schumann, III
|
|
|
|
/s/ WILLIAM J. AMELIO
|
|
Director
|
|
William J. Amelio
|
|
|
|
/s/ J. VERONICA BIGGINS
|
|
Director
|
|
J. Veronica Biggins
|
|
|
|
/s/ MICHAEL A. BRADLEY
|
Director
|
|
|
Michael A. Bradley
|
||
|
/s/ R. KERRY CLARK
|
|
Director
|
|
R. Kerry Clark
|
|
|
|
/s/ JAMES A. LAWRENCE
|
|
Director
|
|
James A. Lawrence
|
|
|
|
/s/ FRANK R. NOONAN
|
|
Director
|
|
Frank R. Noonan
|
|
|
|
/s/ RAY M. ROBINSON
|
|
Director
|
|
Ray M. Robinson
|
|
|
|
/s/ KEVIN MORIARTY
|
|
Senior Vice President, Chief Financial Officer
(Principal Financial and Accounting Officer)
|
|
Kevin Moriarty
|
||
38
Report of Independent Registered Public Accounting Firm
The Board of Directors and Shareholders
Avnet, Inc.:
We have audited the accompanying consolidated balance sheets of Avnet, Inc. and subsidiaries (the Company) as of
June 28, 2014
and
June 29, 2013
, and the related consolidated statements of operations, comprehensive income, shareholders' equity, and cash flows for each of the years in the three-year period ended
June 28, 2014
. In connection with our audits of the consolidated financial statements, we have also audited the financial statement schedule for each of the years in the three-year period ended
June 28, 2014
, as listed in the accompanying index. We also have audited the Company's internal control over financial reporting as of
June 28, 2014
, based on the criteria established in
Internal Control - Integrated Framework
(1992) issued by the Committee of Sponsoring Organizations of the Treadway Commission (COSO). The Company's management is responsible for these consolidated financial statements, for maintaining effective internal control over financial reporting, and for its assessment of the effectiveness of internal control over financial reporting, included in the accompanying
Management's Report on Internal Control over Financial Reporting
. Our responsibility is to express an opinion on these consolidated financial statements, an opinion on the financial statement schedule and an opinion on the Company's internal control over financial reporting based on our audits.
We conducted our audits in accordance with the standards of the Public Company Accounting Oversight Board (United States). Those standards require that we plan and perform the audits to obtain reasonable assurance about whether the financial statements are free of material misstatement and whether effective internal control over financial reporting was maintained in all material respects. Our audits of the consolidated financial statements included examining, on a test basis, evidence supporting the amounts and disclosures in the financial statements, assessing the accounting principles used and significant estimates made by management, and evaluating the overall financial statement presentation. Our audit of internal control over financial reporting included obtaining an understanding of internal control over financial reporting, assessing the risk that a material weakness exists, and testing and evaluating the design and operating effectiveness of internal control based on the assessed risk. Our audits also included performing such other procedures as we considered necessary in the circumstances. We believe that our audits provide a reasonable basis for our opinions.
A company's internal control over financial reporting is a process designed to provide reasonable assurance regarding the reliability of financial reporting and the preparation of financial statements for external purposes in accordance with generally accepted accounting principles. A company's internal control over financial reporting includes those policies and procedures that (1) pertain to the maintenance of records that, in reasonable detail, accurately and fairly reflect the transactions and dispositions of the assets of the company; (2) provide reasonable assurance that transactions are recorded as necessary to permit preparation of financial statements in accordance with generally accepted accounting principles, and that receipts and expenditures of the company are being made only in accordance with authorizations of management and directors of the company; and (3) provide reasonable assurance regarding prevention or timely detection of unauthorized acquisition, use, or disposition of the company's assets that could have a material effect on the financial statements.
Because of its inherent limitations, internal control over financial reporting may not prevent or detect misstatements. Also, projections of any evaluation of effectiveness to future periods are subject to the risk that controls may become inadequate because of changes in conditions, or that the degree of compliance with the policies or procedures may deteriorate.
In our opinion, the consolidated financial statements referred to above present fairly, in all material respects, the financial position of Avnet, Inc. and subsidiaries as of
June 28, 2014
and
June 29, 2013
, and the results of their operations and their cash flows for each of the years in the three-year period ended
June 28, 2014
, in conformity with U.S. generally accepted accounting principles. Also in our opinion, the related financial statement schedule for each of the years in the three-year period ended
June 28, 2014
, when considered in relation to the basic consolidated financial statements taken as a whole, presents fairly, in all material respects, the information set forth therein. Furthermore, in our opinion, Avnet, Inc. maintained, in all material respects, effective internal control over financial reporting as of
June 28, 2014
, based on the criteria established in
Internal Control - Integrated Framework
(1992) issued by the Committee of Sponsoring Organizations of the Treadway Commission.
/s/ KPMG LLP
Phoenix, Arizona
August 8, 2014
39
AVNET, INC. AND SUBSIDIARIES
|
June 28,
2014 |
June 29,
2013 |
||||||
|
|
(Thousands, except share amounts)
|
||||||
|
ASSETS
|
|
|
|||||
|
Current assets:
|
|
|
|||||
|
Cash and cash equivalents
|
$
|
928,971
|
|
$
|
1,009,343
|
|
|
|
Receivables, less allowances of $96,382 and $95,656, respectively
|
5,220,528
|
|
4,868,973
|
|
|||
|
Inventories
|
2,613,363
|
|
2,264,341
|
|
|||
|
Prepaid and other current assets
|
191,337
|
|
214,221
|
|
|||
|
Total current assets
|
8,954,199
|
|
8,356,878
|
|
|||
|
Property, plant and equipment, net
|
534,999
|
|
492,606
|
|
|||
|
Goodwill
|
1,348,468
|
|
1,261,288
|
|
|||
|
Intangible assets, net
|
184,308
|
|
172,212
|
|
|||
|
Other assets
|
233,543
|
|
191,696
|
|
|||
|
Total assets
|
$
|
11,255,517
|
|
$
|
10,474,680
|
|
|
|
LIABILITIES AND SHAREHOLDERS’ EQUITY
|
|
|
|||||
|
Current liabilities:
|
|
|
|||||
|
Short-term debt
|
$
|
865,088
|
|
$
|
838,190
|
|
|
|
Accounts payable
|
3,402,369
|
|
3,278,152
|
|
|||
|
Accrued expenses and other
|
711,369
|
|
705,102
|
|
|||
|
Total current liabilities
|
4,978,826
|
|
4,821,444
|
|
|||
|
Long-term debt
|
1,213,814
|
|
1,206,993
|
|
|||
|
Other liabilities
|
172,684
|
|
157,118
|
|
|||
|
Total liabilities
|
6,365,324
|
|
6,185,555
|
|
|||
|
Commitments and contingencies (Note 13)
|
|
|
|||||
|
Shareholders’ equity:
|
|
|
|||||
|
Common stock $1.00 par; authorized 300,000,000 shares; issued 138,285,825 shares and
137,126,784 shares, respectively
|
138,286
|
|
137,127
|
|
|||
|
Additional paid-in capital
|
1,355,663
|
|
1,320,901
|
|
|||
|
Retained earnings
|
3,257,407
|
|
2,802,966
|
|
|||
|
Accumulated other comprehensive income
|
139,512
|
|
28,895
|
|
|||
|
Treasury stock at cost, 36,836 shares and 38,238 shares, respectively
|
(675
|
)
|
(764
|
)
|
|||
|
Total shareholders’ equity
|
4,890,193
|
|
4,289,125
|
|
|||
|
Total liabilities and shareholders’ equity
|
$
|
11,255,517
|
|
$
|
10,474,680
|
|
|
See notes to consolidated financial statements.
40
AVNET, INC. AND SUBSIDIARIES
|
|
Years Ended
|
||||||||||
|
June 28,
2014 |
June 29,
2013 |
June 30,
2012 |
|||||||||
|
|
(Thousands, except share amounts)
|
||||||||||
|
Sales
|
$
|
27,499,654
|
|
$
|
25,458,924
|
|
$
|
25,707,522
|
|
||
|
Cost of sales
|
24,273,923
|
|
22,479,123
|
|
22,656,965
|
|
|||||
|
Gross profit
|
3,225,731
|
|
2,979,801
|
|
3,050,557
|
|
|||||
|
Selling, general and administrative expenses
|
2,341,168
|
|
2,204,319
|
|
2,092,807
|
|
|||||
|
Restructuring, integration and other expenses
|
94,623
|
|
149,501
|
|
73,585
|
|
|||||
|
Operating income
|
789,940
|
|
625,981
|
|
884,165
|
|
|||||
|
Other (expense) income, net
|
(6,092
|
)
|
(74
|
)
|
(5,442
|
)
|
|||||
|
Interest expense
|
(104,823
|
)
|
(107,653
|
)
|
(90,859
|
)
|
|||||
|
Gain on legal settlement, bargain purchase and other (Notes 2 and 13)
|
22,102
|
|
31,011
|
|
2,918
|
|
|||||
|
Income before income taxes
|
701,127
|
|
549,265
|
|
790,782
|
|
|||||
|
Income tax expense
|
155,523
|
|
99,192
|
|
223,763
|
|
|||||
|
Net income
|
$
|
545,604
|
|
$
|
450,073
|
|
$
|
567,019
|
|
||
|
Earnings per share:
|
|
|
|
||||||||
|
Basic
|
$
|
3.95
|
|
$
|
3.26
|
|
$
|
3.85
|
|
||
|
Diluted
|
$
|
3.89
|
|
$
|
3.21
|
|
$
|
3.79
|
|
||
|
Shares used to compute earnings per share:
|
|
|
|
||||||||
|
Basic
|
137,991
|
|
137,951
|
|
147,278
|
|
|||||
|
Diluted
|
140,119
|
|
140,003
|
|
149,553
|
|
|||||
|
Cash dividends paid per common share
|
$
|
0.60
|
|
$
|
—
|
|
$
|
—
|
|
||
See notes to consolidated financial statements.
41
AVNET, INC. AND SUBSIDIARIES
CONSOLIDATED STATEMENTS OF COMPREHENSIVE INCOME
|
Years Ended
|
|||||||||||
|
June 28, 2014
|
June 29, 2013
|
June 30, 2012
|
|||||||||
|
(Thousands)
|
|||||||||||
|
Net income
|
$
|
545,604
|
|
$
|
450,073
|
|
$
|
567,019
|
|
||
|
Other comprehensive income (loss), net of tax:
|
|||||||||||
|
Foreign currency translation adjustments and other
|
108,754
|
|
44,597
|
|
(370,415
|
)
|
|||||
|
Pension adjustments, net
|
1,863
|
|
30,130
|
|
(52,628
|
)
|
|||||
|
Total comprehensive income
|
$
|
656,221
|
|
$
|
524,800
|
|
$
|
143,976
|
|
||
See notes to consolidated financial statements.
42
AVNET, INC. AND SUBSIDIARIES
CONSOLIDATED STATEMENTS OF SHAREHOLDERS’ EQUITY
Years Ended
June 28, 2014
,
June 29, 2013
and
June 30, 2012
|
Common
Stock
|
Additional
Paid-In
Capital
|
Retained
Earnings
|
Accumulated
Other
Comprehensive
Income (Loss)
|
Treasury
Stock
|
Total
Shareholders’
Equity
|
||||||||||||||||||
|
|
(Thousands)
|
||||||||||||||||||||||
|
Balance, July 2, 2011
|
$
|
152,835
|
|
$
|
1,233,209
|
|
$
|
2,293,510
|
|
$
|
377,211
|
|
$
|
(695
|
)
|
$
|
4,056,070
|
|
|||||
|
Net income
|
—
|
|
—
|
|
567,019
|
|
—
|
|
—
|
|
567,019
|
|
|||||||||||
|
Translation adjustments
|
—
|
|
—
|
|
—
|
|
(370,415
|
)
|
—
|
|
(370,415
|
)
|
|||||||||||
|
Pension liability adjustments, net of tax of $32,382
|
—
|
|
—
|
|
—
|
|
(52,628
|
)
|
—
|
|
(52,628
|
)
|
|||||||||||
|
Repurchases of common stock (Note 4)
|
(11,270
|
)
|
—
|
|
(314,671
|
)
|
—
|
|
—
|
|
(325,941
|
)
|
|||||||||||
|
Stock-based compensation, including related tax benefits of $4,442
|
1,021
|
|
30,608
|
|
—
|
|
—
|
|
(2
|
)
|
31,627
|
|
|||||||||||
|
Balance, June 30, 2012
|
142,586
|
|
1,263,817
|
|
2,545,858
|
|
(45,832
|
)
|
(697
|
)
|
3,905,732
|
|
|||||||||||
|
Net income
|
—
|
|
—
|
|
450,073
|
|
—
|
|
—
|
|
450,073
|
|
|||||||||||
|
Translation adjustments
|
—
|
|
—
|
|
—
|
|
44,597
|
|
—
|
|
44,597
|
|
|||||||||||
|
Pension liability adjustments, net of tax of $19,062
|
—
|
|
—
|
|
—
|
|
30,130
|
|
—
|
|
30,130
|
|
|||||||||||
|
Repurchases of common stock (Note 4)
|
(6,620
|
)
|
—
|
|
(192,965
|
)
|
—
|
|
—
|
|
(199,585
|
)
|
|||||||||||
|
Stock-based compensation, including related tax benefits of $4,110
|
1,161
|
|
33,291
|
|
—
|
|
—
|
|
(67
|
)
|
34,385
|
|
|||||||||||
|
Acquisition of non-controlling interest (Note 2)
|
—
|
|
23,793
|
|
—
|
|
—
|
|
—
|
|
23,793
|
|
|||||||||||
|
Balance, June 29, 2013
|
137,127
|
|
1,320,901
|
|
2,802,966
|
|
28,895
|
|
(764
|
)
|
4,289,125
|
|
|||||||||||
|
Net income
|
—
|
|
—
|
|
545,604
|
|
—
|
|
—
|
|
545,604
|
|
|||||||||||
|
Translation adjustments
|
—
|
|
—
|
|
—
|
|
108,754
|
|
—
|
|
108,754
|
|
|||||||||||
|
Pension liability adjustments, net of tax of $5,013
|
—
|
|
—
|
|
—
|
|
1,863
|
|
—
|
|
1,863
|
|
|||||||||||
|
Cash dividends
|
—
|
|
—
|
|
(82,755
|
)
|
—
|
|
—
|
|
(82,755
|
)
|
|||||||||||
|
Repurchases of common stock (Note 4)
|
(208
|
)
|
(8,408
|
)
|
(8,616
|
)
|
|||||||||||||||||
|
Stock-based compensation, including related tax benefits of $8,432
|
1,367
|
|
34,762
|
|
—
|
|
—
|
|
89
|
|
36,218
|
|
|||||||||||
|
Balance, June 28, 2014
|
$
|
138,286
|
|
$
|
1,355,663
|
|
$
|
3,257,407
|
|
$
|
139,512
|
|
$
|
(675
|
)
|
$
|
4,890,193
|
|
|||||
See notes to consolidated financial statements.
43
AVNET, INC. AND SUBSIDIARIES
|
|
Years Ended
|
||||||||||
|
June 28,
2014 |
June 29,
2013 |
June 30,
2012 |
|||||||||
|
|
(Thousands)
|
||||||||||
|
Cash flows from operating activities:
|
|
|
|
||||||||
|
Net income
|
$
|
545,604
|
|
$
|
450,073
|
|
$
|
567,019
|
|
||
|
Non-cash and other reconciling items:
|
|
|
|
||||||||
|
Depreciation
|
92,464
|
|
88,333
|
|
73,551
|
|
|||||
|
Amortization
|
44,724
|
|
32,343
|
|
27,785
|
|
|||||
|
Deferred income taxes
|
(15,644
|
)
|
(10,019
|
)
|
11,782
|
|
|||||
|
Stock-based compensation
|
45,916
|
|
43,677
|
|
35,737
|
|
|||||
|
Gain on bargain purchase and other (Note 2)
|
—
|
|
(31,011
|
)
|
(2,918
|
)
|
|||||
|
Other, net
|
88,687
|
|
75,327
|
|
66,263
|
|
|||||
|
Changes in (net of effects from businesses acquired):
|
|
|
|
||||||||
|
Receivables
|
(306,873
|
)
|
(94,203
|
)
|
72,267
|
|
|||||
|
Inventories
|
(226,141
|
)
|
225,667
|
|
133,178
|
|
|||||
|
Accounts payable
|
48,651
|
|
(78,834
|
)
|
(319,094
|
)
|
|||||
|
Accrued expenses and other, net
|
(79,970
|
)
|
(5,156
|
)
|
(136,852
|
)
|
|||||
|
Net cash flows provided by operating activities
|
237,418
|
|
696,197
|
|
528,718
|
|
|||||
|
Cash flows from financing activities:
|
|
|
|
||||||||
|
Issuance of notes in a public offering, net of issuance costs
|
—
|
|
349,258
|
|
—
|
|
|||||
|
Repayment of notes
|
(300,000
|
)
|
—
|
|
—
|
|
|||||
|
Borrowings (repayments) under accounts receivable securitization
program, net
|
255,000
|
|
(310,000
|
)
|
510,000
|
|
|||||
|
Borrowings (repayments) under bank facilities and other debt, net
|
38,765
|
|
(180,941
|
)
|
85,816
|
|
|||||
|
Repurchases of common stock (Note 4)
|
(8,616
|
)
|
(207,192
|
)
|
(318,333
|
)
|
|||||
|
Dividends paid on common stock
|
(82,755
|
)
|
—
|
|
—
|
|
|||||
|
Other, net
|
9,109
|
|
4,792
|
|
5,590
|
|
|||||
|
Net cash flows (used for) provided by financing activities
|
(88,497
|
)
|
(344,083
|
)
|
283,073
|
|
|||||
|
Cash flows from investing activities:
|
|
|
|
||||||||
|
Purchases of property, plant and equipment
|
(123,242
|
)
|
(97,379
|
)
|
(128,652
|
)
|
|||||
|
Acquisitions of businesses, net of cash acquired
|
(116,882
|
)
|
(262,306
|
)
|
(313,218
|
)
|
|||||
|
Cash proceeds from divestitures, net of cash divested
|
—
|
|
3,613
|
|
—
|
|
|||||
|
Other, net
|
2,666
|
|
3,018
|
|
1,046
|
|
|||||
|
Net cash flows used for investing activities
|
(237,458
|
)
|
(353,054
|
)
|
(440,824
|
)
|
|||||
|
Effect of exchange rate changes on cash and cash equivalents
|
8,165
|
|
3,419
|
|
(39,437
|
)
|
|||||
|
Cash and cash equivalents:
|
|
|
|
||||||||
|
— (decrease) increase
|
(80,372
|
)
|
2,479
|
|
331,530
|
|
|||||
|
— at beginning of year
|
1,009,343
|
|
1,006,864
|
|
675,334
|
|
|||||
|
— at end of year
|
$
|
928,971
|
|
$
|
1,009,343
|
|
$
|
1,006,864
|
|
||
Additional cash flow information (Note 15)
See notes to consolidated financial statements.
44
1. Summary of significant accounting policies
Principles of consolidation
— The accompanying consolidated financial statements include the accounts of Avnet, Inc. and all of its majority-owned and controlled subsidiaries (the "Company" or "Avnet"). All intercompany accounts and transactions have been eliminated.
Reclassifications
— Certain prior period amounts have been reclassified to conform to the current-period presentation.
Fiscal year
— The Company operates on a “52/53 week” fiscal year, which ends on the Saturday closest to June 30th. Fiscal
2014
,
2013
, and
2012
all contained
52
weeks. Unless otherwise noted, all references to “fiscal
2014
” or any other “year” shall mean the Company’s fiscal year.
Management estimates
— The preparation of financial statements in conformity with generally accepted accounting principles in the United States ("GAAP") requires management to make estimates and assumptions that affect certain reported amounts of assets and liabilities, disclosure of contingent assets and liabilities at the date of the financial statements and the reported amounts of sales and expenses during the reporting period. Actual results could differ materially from those estimates.
Cash and cash equivalents
— The Company considers all highly liquid investments with an original maturity of three months or less to be cash equivalents.
Inventories
— Inventories, comprised principally of finished goods, are stated at cost (first-in, first-out) or market, whichever is lower. The Company regularly reviews the cost of inventory against its estimated market value, considering any rights of return or price protection provided by the Company’s suppliers, and records a lower of cost or market write-down if any inventories have a cost in excess of their estimated market value.
Investments
— Investments in joint ventures and entities ("ventures") in which the Company has an ownership interest of
greater than 50%
and exercises control over the ventures are consolidated in the accompanying consolidated financial statements. Non-controlling interests in the years presented are not material and, as a result, are included in the caption “accrued expenses and other” in the accompanying consolidated balance sheets. Investments in ventures in which the Company exercises significant influence but not control are accounted for using the equity method. Investments in ventures in which the Company’s ownership interest is
less than 20%
and over which the Company does not exercise significant influence are accounted for using the cost method. The Company monitors ventures for events or circumstances that indicate that the fair value of a venture is less than its carrying value, in which case the Company would further review the venture to determine if it is other-than-temporarily impaired. During fiscal 2014, 2013 and 2012 the Company did not have any material investments in ventures.
Depreciation , amortization and useful lives
— The Company reports property, plant and equipment at cost, less accumulated depreciation. Cost includes the price paid to acquire or construct the assets, required installation costs, interest capitalized during the construction period, and any expenditure that substantially adds to the value of or substantially extends the useful life of an existing asset. Additionally, the Company capitalizes qualified costs related to software obtained or developed for internal use. Software obtained for internal use has generally been enterprise-level business and finance software that is customized to meet the Company’s specific operational requirements. The Company begins depreciation and amortization ("depreciation") for property, plant and equipment when an asset is both in the location and condition for its intended use.
Depreciation of property, plant, and equipment is generally provided for by the straight-line method over the estimated useful lives of the long-lived assets. The estimated useful lives for property, plant, and equipment are typically as follows: buildings —
30
years; machinery, fixtures and equipment —
2
-
10
years; information technology hardware and software —
2
-
10
years; and leasehold improvements — over the applicable
remaining lease term or useful life if shorter
.
The Company amortizes intangible assets acquired in business combinations using the straight-line method over the estimated economic lives of the intangible assets from the date of acquisition, which is generally between
2
-
10
years.
Long-lived assets impairment
— Long-lived assets, including property, plant and equipment and intangible assets, are reviewed for impairment whenever events or changes in circumstances indicate that the carrying amount of an asset group may not be recoverable. An impairment is recognized when the estimated undiscounted cash flows expected to result from the use of the asset group and its eventual disposition is less than its carrying amount. An impairment is measured as the amount by which
45
AVNET, INC. AND SUBSIDIARIES
NOTES TO CONSOLIDATED FINANCIAL STATEMENTS — (Continued)
an asset group's net book value exceeds its estimated fair value. For purposes of recognition and measurement of an impairment loss, long-lived assets are grouped with other assets and liabilities at the lowest level for which identifiable cash flows are largely
independent of the cash flows of other assets and liabilities. The Company considers a long-lived asset to be abandoned when it has ceased use of such abandoned asset and if the Company has no intent to use or repurpose the asset in the future. The Company continually evaluates the carrying value and the remaining economic useful life of all long-lived assets and will adjust the carrying value and the related depreciation and amortization period if and when appropriate.
Goodwill
— Goodwill represents the excess of the purchase price of acquired businesses over the estimated fair value assigned to the individual assets acquired and liabilities assumed. The Company does not amortize goodwill, but instead tests goodwill for impairment at least annually in the fourth quarter and, if necessary, records any impairment resulting from such impairment testing. Impairment testing is performed at the reporting unit level, and the Company has identified six reporting units, defined as each of the three regions (Americas, EMEA, and Asia Pacific) within the Company’s two reportable segments. The Company will perform an impairment test between scheduled annual tests if facts and circumstances indicate that it is more likely than not that the fair value of a reporting unit that has goodwill is less than its carrying value.
In performing goodwill impairment testing, the Company may first make a qualitative assessment of whether it is more-likely-than-not that a reporting unit’s fair value is less than its carrying value to determine whether it is necessary to perform the two-step goodwill impairment test. If the qualitative assessment indicates it is more-likely-than-not that a reporting unit’s fair value is not greater than its carrying value, the Company must perform a two-step impairment test. The Company defines the fair value of a reporting unit as the price that would be received to sell the reporting unit as a whole in an orderly transaction between market participants at the measurement date. To determine fair value of a reporting unit, the Company primarily uses the income approach methodology of valuation, which includes the discounted cash flow method, and the market approach methodology of valuation, which considers values of comparable businesses to estimate the fair values of the Company’s reporting units.
Significant management judgment is required when estimating the fair value of the Company’s reporting units from a market participant perspective including the forecasting of future operating results, the discount rates and expected future growth rates used in the discounted cash flow method of valuation, and in the selection of comparable businesses that are used in the market approach. If the estimated fair value of the reporting unit exceeds the carrying value assigned to that reporting unit, goodwill is not impaired and no further analysis is required.
If the carrying value assigned to a reporting unit exceeds its estimated fair value in the first step, then the Company is required to perform the second step of the impairment test. In this step, the Company assigns the fair value of the reporting unit calculated in the first step to all of the assets and liabilities of that reporting unit, as if a market participant just acquired the reporting unit in a business combination. The excess of the fair value of the reporting unit determined in the first step of the impairment test over the total amount assigned to the assets and liabilities in the second step of the impairment test represents the implied fair value of goodwill. If the carrying value of a reporting unit’s goodwill exceeds the implied fair value of goodwill, the Company would record an impairment loss equal to the difference. If there is no such excess then all goodwill for a reporting unit is considered impaired.
Foreign currency translation
— The assets and liabilities of foreign operations are translated into U.S. Dollars at the exchange rates in effect at the balance sheet date, with the related translation adjustments reported as a separate component of shareholders’ equity and comprehensive income. Results of operations are translated using the average exchange rates prevailing throughout the period. Transactions denominated in currencies other than the functional currency of the Avnet subsidiaries that are party to the transactions (primarily trade receivables and payables) are translated at exchange rates in effect at the balance sheet date or upon settlement of the transaction. Gains and losses from such translation are recorded in the consolidated statements of operations as a component of “other income (expense), net.” In fiscal
2014
,
2013
and
2012
, gains or losses on foreign currency translation were not material.
Income taxes
— The Company follows the asset and liability method of accounting for income taxes. Deferred income tax assets and liabilities are recognized for the estimated future tax impact of differences between the financial statement carrying amounts of assets and liabilities and their respective tax bases. Deferred income tax assets and liabilities are measured using enacted tax rates in effect for the year in which those temporary differences are expected to be recovered or settled. The effect on deferred income tax assets and liabilities of a change in tax rates is recognized in earnings in the period in which the new rate is enacted. Based upon historical and estimated levels of future taxable income and analysis of other key factors, the Company may increase or decrease a valuation allowance against its deferred tax assets, as deemed necessary, to state such assets at their estimated net realizable value.
46
AVNET, INC. AND SUBSIDIARIES
NOTES TO CONSOLIDATED FINANCIAL STATEMENTS — (Continued)
The Company establishes contingent liabilities for potentially unfavorable outcomes of positions taken on certain tax matters. These liabilities are based on management’s assessment of whether a tax benefit is more likely than not to be sustained upon examination by tax authorities. There may be differences between the estimated and actual outcomes of these matters that may result in future changes in estimates to such contingent liabilities. To the extent such changes in estimates are required, the Company’s effective tax rate may potentially fluctuate as a result. In accordance with the Company's accounting policies, accrued interest and penalties related to unrecognized tax benefits are recorded as a component of income tax expense.
Self-insurance
— In the United States, the Company is primarily self-insured for workers’ compensation, medical, and general, product and automobile liability costs; however, the Company also has stop-loss insurance policies in place to limit the Company’s exposure to individual and aggregate claims made. Liabilities for these programs are estimated based upon outstanding claims and claims estimated to be incurred but not yet reported based upon historical loss experience. These estimates are subject to variability due to changes in trends of losses for outstanding claims and incurred but not recorded claims, including external factors such as future inflation rates, benefit level changes and claim settlement patterns.
Revenue recognition
—Revenue from the sale of products or services is recognized when persuasive evidence of an arrangement exists, delivery has occurred or services have been rendered, the sales price is fixed or determinable and collectability is reasonably assured. Generally, these criteria are met upon either shipment or delivery to customers, depending upon the sales terms. Most of the Company’s product sales come from products Avnet purchases from a supplier and holds in inventory. A portion of the Company’s sales are products shipped directly from its suppliers to its customers ("drop-ship"). In such drop-ship arrangements, Avnet negotiates the price with the customer, pays the supplier directly for the products shipped and bears credit risk of collecting payment from its customers. Furthermore, in such drop-shipment arrangements, the Company bears responsibility for accepting returns of products from the customer even if the Company, in turn, has a right to return the products to the original supplier if the products are defective. Under these sales terms, the Company serves as the principal with the customer and, therefore, recognizes the gross sale and cost of sale of the product upon shipment by the supplier.
In addition, the Company has certain contractual relationships with a limited number of its customers and suppliers whereby Avnet assumes an agency relationship in the transaction. In such arrangements, the Company recognizes the net fee associated with serving as an agent in sales with no associated cost of sales.
Revenues from maintenance contracts are recognized ratably over the life of the contracts, generally ranging from one to three years.
Revenues are recorded net of discounts, rebates and estimated returns. Provisions are made for discounts and rebates, which are primarily timing or volume specific, and are estimated based on historical trends and anticipated customer buying patterns. Provisions for returns and other sales adjustments are estimated based on historical sales returns experience, credit memo experience and other known factors.
Vendor allowances and consideration
—
Consideration received from suppliers for price protection, product rebates, marketing/promotional activities, or any other programs are recorded when earned under the terms and conditions of such supplier programs as adjustments to product costs or selling, general and administrative expenses depending upon the nature and contractual requirements related to the consideration received. Some of these supplier programs may extend over one or more reporting periods and may require management to make estimates.
Comprehensive income
— Comprehensive income represents net income for the year adjusted for certain changes in shareholders’ equity. Accumulated comprehensive income items impacting comprehensive income typically include currency translation and the impact of the Company’s pension liability adjustments, net of tax (see Note 4).
Stock-based compensation
—The Company measures stock-based payments at fair value and generally recognizes the associated operating expense in the consolidated statement of operations over the requisite service period (see Note 12). A stock-based payment is considered vested for accounting expense attribution purposes when the employee's retention of the award is no longer contingent on providing continued service. Accordingly, the Company recognizes all stock-based compensation expense for an award on the grant date for awards granted to retirement eligible employees or over the period from the grant date to the date retirement eligibility is achieved, if less than the stated requisite service period. The expense attribution approach for retirement eligible employees does not affect the overall amount of compensation expense recognized, but instead accelerates the recognition of expense.
Restructuring and Exit Activities
—
The Company accounts for employee termination benefits that represent a one-time benefit in accordance with ASC 420, Exit or Disposal Cost Obligations. If applicable, the Company records such costs into operating
47
AVNET, INC. AND SUBSIDIARIES
NOTES TO CONSOLIDATED FINANCIAL STATEMENTS — (Continued)
expense over the terminated employee’s future service period beyond any minimum retention period. Other costs associated with restructuring or exit activities may include contract termination costs including operating leases and impairments of long-lived
assets, which are expensed in accordance with ASC 420 and ASC 360, respectively.
Business Combinations
—
The Company accounts for business acquisitions using the acquisition method of accounting and records any identifiable definite-lived intangible assets separate from goodwill. Intangible assets are recorded at their fair value based on estimates as of the date of acquisition. Goodwill is recorded as the residual amount of the purchase price consideration less the fair value assigned to the individual identifiable assets acquired and liabilities assumed as of the date of acquisition. Contingent consideration, which represents an obligation of the acquirer to transfer additional assets or equity interests to the former owner as part of the exchange if specified future events occur or conditions are met, is accounted for at the acquisition date fair value either as a liability or as equity depending on the terms of the acquisition agreement.
Concentration of credit risk
— Financial instruments that potentially subject the Company to a concentration of credit risk principally consist of cash and cash equivalents and trade accounts receivable. The Company invests its excess cash primarily in overnight Eurodollar time deposits and institutional money market funds with the highest rated financial institutions. To reduce credit risk, management performs ongoing credit evaluations of its customers’ financial condition and, in some instances, has obtained credit insurance coverage to reduce such risk. The Company maintains reserves for potential credit losses from customers, but has not historically experienced any material losses related to individual customers or groups of customers in any particular end market or geographic area.
Fair value
— The Company measures financial assets and liabilities at fair value based upon an exit price, representing the amount that would be received on the sale of an asset or paid to transfer a liability, in an orderly transaction between market participants. Accounting standards require inputs used in valuation techniques for measuring fair value on a recurring or non-recurring basis be assigned to a hierarchical level as follows: Level 1 are observable inputs that reflect quoted prices for identical assets or liabilities in active markets. Level 2 are observable market-based inputs or unobservable inputs that are corroborated by market data and Level 3 are unobservable inputs that are not corroborated by market data. During fiscal 2014, 2013, and 2012, there were no transfers of assets measured at fair value between the three levels of fair value hierarchy. The carrying amounts of the Company’s financial instruments, including cash and cash equivalents, receivables and accounts payable approximate their fair values at
June 28, 2014
due to the short-term nature of these assets and liabilities. At
June 28, 2014
and
June 29, 2013
, the Company had
$19.7 million
and
$2.1 million
, respectively, of cash equivalents that were measured at fair value based upon Level 1 criteria. See Note 7 for further discussion of the fair value of the Company’s long-term debt and Note 10 for a discussion of the fair value of the Company's pension plan assets.
Derivative financial instruments
— Many of the Company’s subsidiaries purchase and sell products in currencies other than their functional currencies. This subjects the Company to the risks associated with fluctuations in foreign currency exchange rates. The Company reduces this risk by utilizing natural hedging (i.e., offsetting receivables and payables) as well as by creating offsetting positions through the use of derivative financial instruments, primarily forward foreign exchange contracts typically with maturities of less than 60 days ("economic hedges"). The Company continues to have exposure to foreign currency risks to the extent they are not economically hedged. The Company adjusts any economic hedges to fair value through the consolidated statements of operations primarily within "other income (expense), net." Therefore, the changes in valuation of the underlying items being economically hedged are offset by the changes in fair value of the forward foreign exchange contracts. The amounts representing the fair value of forward foreign exchange contracts, based upon Level 2 criteria under the fair value hierarchy, are classified in the captions “other current assets” or “accrued expenses and other,” as applicable, in the accompanying consolidated balance sheets and were not material as of June 28, 2014 and June 29, 2013. The Company did not have material gains or losses related to the forward foreign exchange contracts during fiscal
2014
and fiscal
2013
.
The Company does not hedge its investments in its foreign operations. The Company does not enter into derivative financial instruments for trading or speculative purposes and monitors the financial stability and credit standing of its counterparties.
Accounts receivable securitization
— The Company has an accounts receivable securitization program whereby the Company sells certain receivables and retains a subordinated interest and servicing rights to those receivables. The securitization program does not qualify for sales accounting and is accounted for as a secured financing as discussed further in Note 3.
Recently issued accounting pronouncements
— In July 2013, the Financial Accounting Standards Board ("FASB") issued Accounting Standards Update No. 2013-11, Presentation of an Unrecognized Tax Benefit When a Net Operating Loss Carryforward, a Similar Tax Loss, or a Tax Credit Carryforward Exists ("ASU 2013-11"). ASU 2013-11 requires the netting of unrecognized tax benefits ("UTBs") against a deferred tax asset for a loss or other carryforward that would apply in settlement of the uncertain tax
48
AVNET, INC. AND SUBSIDIARIES
NOTES TO CONSOLIDATED FINANCIAL STATEMENTS — (Continued)
positions. UTBs are required to be netted against all available same-jurisdiction loss or other tax carryforwards, rather than only against carryforwards that are created by the UTBs. ASU 2013-11 is effective for years, including interim periods within those years, beginning after December 15, 2013. The adoption of ASU 2013-11 in the first quarter of fiscal 2015 is not expected to have a material impact on the Company's consolidated financial statements.
In April 2014, the FASB issued Accounting Standards Update No. 2014-08,
Reporting Discontinued Operations and Disclosures of Disposals of Components of an Entity
("ASU 2014-08"), which changes the criteria for determining which disposals should be presented as discontinued operations and the related disclosure requirements. ASU 2014-08 is effective for the Company on a prospective basis in the first quarter of fiscal 2016 with early adoption permitted for disposals (or classifications as held for sale) that have not been reported in financial statements previously issued. The adoption of ASU 2014-08 in the first quarter of fiscal 2016 is not expected to have a material impact on the Company's consolidated financial statements.
In May 2014, the FASB issued Accounting Standards Update No. 2014-09,
Revenue from Contracts with Customers
("ASU 2014-09"), to supersede nearly all existing revenue recognition guidance under GAAP. The core principles of ASU 2014-09 are to recognize revenues when promised goods or services are transferred to customers in an amount that reflects the consideration that is expected to be received for those goods or services. Application of the requirements of ASU 2014-09 may require more judgment and estimates within the revenue recognition process compared to existing GAAP. ASU 2014-09 is effective for the Company in the first quarter of fiscal 2018 using either of two acceptable adoption methods: (i) retrospective adoption to each prior reporting period presented with the option to elect certain practical expedients as defined within ASU 2014-09; or (ii) adoption with the cumulative effect of initially applying ASU 2014-09 recognized at the date of initial application and providing certain additional disclosures as defined within ASU 2014-09. The Company is currently evaluating the potential impact of the future adoption of ASU 2014-09 on its consolidated financial statements.
2. Acquisitions and divestitures
2014
Acquisitions
During fiscal
2014
, the Company acquired
three
businesses with historical annualized sales of approximately
$492.0 million
. Cash paid for acquisitions during fiscal 2014 was
$116.9 million
, net of cash acquired and contingent consideration. The Company has not disclosed the pro-forma impact of the fiscal 2014 acquisitions as such impact was not material.
The gross consideration for the acquisitions was
$219.7 million
, which consisted of the following (in thousands):
|
Cash paid
|
$
|
181,645
|
|
|
|
Contingent consideration
|
38,081
|
|
||
|
Total consideration
|
$
|
219,726
|
|
|
The contingent consideration arrangements stipulate that the Company pay up to a maximum of approximately
$50.0 million
of additional consideration to the former shareholders of the acquired businesses based upon the achievement of certain future operating results. The Company estimated the fair value of the contingent consideration using an income approach, which is based on significant inputs, primarily forecasted future operating results of the acquired businesses, not observable in the market and thus represents a Level 3 measurement as defined in ASC 820. The Company adjusts the fair value of contingent consideration within operating expenses as a result of the passage of time and if there are changes to the inputs used in the income approach.
The Company has not yet completed its evaluation and determination of the fair value of certain assets and liabilities acquired, primarily (i) the final assessment of working capital acquired and liabilities assumed, and (ii) the final valuation of certain income tax accounts. The Company expects these final valuations and assessments will be completed by the first quarter of fiscal 2015, which may result in adjustments to the preliminary values presented in the following table:
49
AVNET, INC. AND SUBSIDIARIES
NOTES TO CONSOLIDATED FINANCIAL STATEMENTS — (Continued)
|
Acquisition
Method Values |
||||
|
(Thousands)
|
||||
|
Cash
|
$
|
64,763
|
|
|
|
Receivables
|
36,216
|
|
||
|
Inventories
|
95,202
|
|
||
|
Other current assets
|
6,597
|
|
||
|
Property, plant and equipment and other non-current assets
|
28,155
|
|
||
|
Intangible assets
|
53,502
|
|
||
|
Total identifiable assets acquired
|
284,435
|
|
||
|
Accounts payable, accrued liabilities and other current liabilities
|
(66,848
|
)
|
||
|
Short-term debt
|
(45,942
|
)
|
||
|
Other long-term liabilities
|
(14,535
|
)
|
||
|
Total identifiable liabilities assumed
|
(127,325
|
)
|
||
|
Net identifiable assets acquired
|
157,110
|
|
||
|
Goodwill
|
62,616
|
|
||
|
Net assets acquired
|
$
|
219,726
|
|
|
Goodwill of
$52.0 million
was assigned to the Electronics Marketing ("EM") reportable segment and goodwill of
$10.6 million
was assigned to the Technology Solutions ("TS") reportable segment. The goodwill recognized is attributable primarily to expected synergies of the acquired businesses. The amount of goodwill that is expected to be deductible for income tax purposes is not material. The Company periodically adjusts the value of goodwill to reflect changes that occur as a result of adjustments to the preliminary purchase price allocation during the measurement periods following the dates of acquisition.
The Company has recognized restructuring, integration, and other expenses associated with fiscal
2014
and other recent acquisitions, which are described further in Note 17.
2013
Acquisitions
During fiscal
2013
, the Company acquired
12
businesses with aggregate annualized sales of approximately
$1.18 billion
for a total consideration of
$309.0 million
, which consisted of the following (in thousands):
|
Cash paid
|
$
|
297,484
|
|
|
|
Contingent consideration
|
11,467
|
|
||
|
Total consideration
|
$
|
308,951
|
|
|
The contingent consideration arrangements stipulate the Company pay up to a maximum of approximately
$22.2 million
of additional consideration to the former shareholders of the acquired businesses upon the achievement of certain operating results. The Company estimated the fair value of the contingent consideration using an income approach which is based on significant inputs not observable in the market and thus represents a Level 3 measurement as defined in ASC 820. The Company adjusts the fair value of contingent consideration within operating expenses as a result of the passage of time and if there are changes to the inputs used in the income approach.
Cash paid for acquisitions during fiscal
2013
was
$262.3 million
, net of cash acquired, contingent consideration and purchase price holdback reserves.
50
AVNET, INC. AND SUBSIDIARIES
NOTES TO CONSOLIDATED FINANCIAL STATEMENTS — (Continued)
The following table summarizes the estimated fair values of the assets acquired and liabilities assumed at the respective acquisition dates (in thousands):
|
Cash
|
$
|
29,276
|
|
|
|
Receivables
|
226,743
|
|
||
|
Inventories
|
91,791
|
|
||
|
Other current assets
|
33,689
|
|
||
|
Property, plant and equipment
|
25,311
|
|
||
|
Other assets
|
47,292
|
|
||
|
Total identifiable assets acquired
|
454,102
|
|
||
|
Accounts payable, accrued liabilities and other current liabilities
|
(157,986
|
)
|
||
|
Long-term debt
|
(66,367
|
)
|
||
|
Other long-term liabilities
|
(45,640
|
)
|
||
|
Total identifiable liabilities assumed
|
(269,993
|
)
|
||
|
Net identifiable assets acquired
|
184,109
|
|
||
|
Goodwill
|
157,521
|
|
||
|
Bargain purchase recognized
|
(32,679
|
)
|
||
|
Net assets acquired
|
$
|
308,951
|
|
|
Goodwill of
$62.0 million
was assigned to the EM reportable segment and goodwill of
$95.5 million
was assigned to the TS reportable segment. The goodwill recognized is attributable primarily to expected synergies and the assembled workforce of the acquired businesses. The amount of goodwill that is expected to be deductible for income tax purposes is not significant. The Company periodically adjusts the value of goodwill to reflect changes that occur as a result of adjustments to the preliminary purchase price allocation during the measurement periods following the dates of acquisition.
Included in "Other assets" in the above table is
$35.2 million
of identifiable intangible assets (see Note 6) substantially all related to customer relationships.
Supplemental information on an unaudited pro forma basis, as if the fiscal 2013 acquisitions had been consummated as of July 3, 2011, is presented as follows:
|
Pro Forma Results For Years Ended
|
||||||||
|
June 29, 2013
|
June 30, 2012
|
|||||||
|
(Millions)
|
||||||||
|
Sales
|
$
|
25,771
|
|
$
|
26,872
|
|
||
|
Net income
|
$
|
454
|
|
$
|
587
|
|
||
With respect to the businesses acquired during fiscal
2013
, the Company is unable to determine the amount of sales and earnings of each business subsequent to their respective acquisition dates as each business has been integrated into the Company.
Internix, Inc., a company publicly traded on the Tokyo Stock Exchange, was acquired in the first quarter of fiscal 2013 through a tender offer. After assessing the fair value of the identifiable assets acquired and liabilities assumed, the consideration paid was below fair value even though the price paid per share represented a premium to the trading levels at that time. During fiscal 2013, the Company recognized a gain on bargain purchase related to Internix of
$32.7 million
before and after tax and
$0.23
per share on a diluted basis.
In addition to the acquisitions described above, during fiscal 2013, the Company acquired the remaining non-controlling interest in a consolidated subsidiary for a purchase price that was less than its carrying value. The Company has reflected the difference between the purchase price and the carrying value of the non-controlling interest as additional paid-in capital in the accompanying consolidated statement of shareholders' equity for fiscal 2013.
51
AVNET, INC. AND SUBSIDIARIES
NOTES TO CONSOLIDATED FINANCIAL STATEMENTS — (Continued)
2012
Acquisitions
During fiscal
2012
, the Company acquired
11
businesses with aggregate annualized sales of approximately
$912.0 million
for total consideration of
$413.6 million
, which consisted of the following (in thousands):
|
Cash paid
|
$
|
390,410
|
|
|
|
Contingent consideration
|
23,175
|
|
||
|
Total consideration
|
$
|
413,585
|
|
|
The contingent consideration arrangements stipulate the Company pay up to a maximum of approximately
$124 million
of additional consideration to the former shareholders of the acquired businesses upon the achievement of certain operating results. The Company estimated the fair value of the contingent consideration using an income approach which is based on significant inputs not observable in the market and thus represents a Level 3 measurement as defined in ASC 820. The Company adjusts the fair value of contingent consideration within operating expenses as a result of the passage of time and if there are changes to the inputs used in the income approach.
Cash paid for acquisitions during fiscal
2012
was
$313.2 million
, net of cash acquired, contingent consideration and purchase price holdback reserves.
The following table summarizes the estimated fair values of the assets acquired and liabilities assumed at the respective acquisition dates (in thousands):
|
Cash
|
$
|
75,016
|
|
|
|
Receivables
|
132,195
|
|
||
|
Inventories
|
59,463
|
|
||
|
Other current assets
|
23,936
|
|
||
|
Property, plant and equipment
|
9,729
|
|
||
|
Other assets
|
104,368
|
|
||
|
Total identifiable assets acquired
|
404,707
|
|
||
|
Accounts payable, accrued liabilities and other current liabilities
|
(230,747
|
)
|
||
|
Other long-term liabilities
|
(2,483
|
)
|
||
|
Total liabilities assumed
|
(233,230
|
)
|
||
|
Net identifiable assets acquired
|
171,477
|
|
||
|
Goodwill
|
246,425
|
|
||
|
Bargain purchase recognized
|
(4,317
|
)
|
||
|
Net assets acquired
|
$
|
413,585
|
|
|
Goodwill of
$180.0 million
was assigned to the EM reportable segment and goodwill of
$66.4 million
was assigned to the TS reportable segment. The amount of goodwill that is expected to be deductible for income tax purposes is not significant. The Company periodically adjusts the value of goodwill to reflect changes that occur as a result of adjustments to the preliminary purchase price allocation during the measurement periods following the dates of acquisition.
Included in "Other assets" in the above table is
$93.3 million
of identifiable intangible assets (see Note 6).
Supplemental information on an unaudited pro forma basis, as if the acquisitions had been consummated as of July 3, 2011, is presented as follows:
52
AVNET, INC. AND SUBSIDIARIES
NOTES TO CONSOLIDATED FINANCIAL STATEMENTS — (Continued)
|
Pro Forma Results For Year Ended
|
||||
|
June 30, 2012
|
||||
|
(Millions)
|
||||
|
Sales
|
$
|
26,052
|
|
|
|
Net income
|
$
|
568
|
|
|
With respect to the businesses acquired during fiscal
2012
, the Company is unable to determine the amount of sales and earnings of each business subsequent to their respective acquisition dates as each business has been integrated into the Company.
Unidux Electronic Limited, a Singapore publicly traded company, was acquired in January 2012 through a tender offer. After assessing the fair value of the identifiable assets acquired and liabilities assumed, the consideration paid was below fair value even though the price paid per share represented a premium to the trading levels at that time. Accordingly, the Company recognized a gain on bargain purchase of
$4.3 million
before and after tax and
$0.03
per share on a diluted basis.
Divestitures
During fiscal 2013, the Company divested a small business in TS Asia for which it recognized a loss of
$1.7 million
before and after tax and
$0.01
per share on a diluted basis, which was classified within "Gain on legal settlement, bargain purchase and other."
During fiscal 2012, the Company recognized a loss of
$1.4 million
before tax,
$0.9 million
after tax and
$0.01
per diluted share classified within "Gain on legal settlement, bargain purchase and other" in the consolidated statements of operations related to the impairment of an investment in a small technology company and the write-off of certain deferred financing costs associated with the early termination of a credit facility.
3. Accounts receivable securitization
Pursuant to the Company's accounts receivable securitization agreement (the “Program”) with a group of financial institutions, as amended, the Company may sell, on a revolving basis, an undivided interest of up to
$800.0 million
in eligible U.S. receivables while retaining a subordinated interest in the receivables sold. The eligible receivables are sold through a wholly-owned bankruptcy-remote special purpose entity ("SPE") that is consolidated for financial reporting purposes as the Company is the primary beneficiary of the SPE. Such eligible receivables are not directly available to satisfy potential claims of the Company’s creditors. As the Program does not qualify for sales accounting, the receivables and related short-term debt obligation remains on the Company’s consolidated balance sheets. The Program has a
one-year
term that expires at the end of
August 2014
, at which time it is expected to be renewed for another one to two years on comparable terms. The Program contains certain covenants, all of which the Company was in compliance with as of
June 28, 2014
. There were
$615.0 million
in borrowings outstanding under the Program as of
June 28, 2014
and
$360.0 million
as of
June 29, 2013
. Interest on borrowings is calculated using a base rate or a commercial paper rate plus a spread of
0.35%
. The facility fee is
0.35%
.
4. Shareholders' equity
Accumulated comprehensive income (loss)
The following table includes the balances within accumulated other comprehensive income (loss):
|
June 28,
2014 |
June 29,
2013 |
June 30,
2012 |
|||||||||
|
|
(Thousands)
|
||||||||||
|
Accumulated translation adjustments and other
|
$
|
244,149
|
|
$
|
135,395
|
|
$
|
90,798
|
|
||
|
Accumulated pension liability adjustments, net of income taxes
|
(104,637
|
)
|
(106,500
|
)
|
(136,630
|
)
|
|||||
|
Total accumulated other comprehensive income (loss)
|
$
|
139,512
|
|
$
|
28,895
|
|
$
|
(45,832
|
)
|
||
Comprehensive income (loss) includes foreign currency translation adjustments and pension liability adjustments. Amounts reclassified out of accumulated comprehensive income (loss), net of tax, to operating expenses during fiscal 2014, 2013 and 2012 substantially all related to net periodic pension costs as discussed further in Note 10.
53
AVNET, INC. AND SUBSIDIARIES
NOTES TO CONSOLIDATED FINANCIAL STATEMENTS — (Continued)
Share repurchase program
In August 2012, the Company's Board of Directors amended the Company's existing share repurchase program to authorize the repurchase of up to
$750.0 million
of common stock in the open market or through privately negotiated transactions. The timing and actual number of shares repurchased will depend on a variety of factors such as price, corporate and regulatory requirements, and prevailing market conditions. During fiscal
2014
, the Company repurchased
0.2 million
shares under this program at an average market price of
$41.46
per share for a total cost of
$8.6 million
. Repurchased shares were retired. Since the beginning of the repurchase program through the end of fiscal
2014
, the Company has repurchased
18.1 million
shares at an aggregate cost of
$534.1 million
, and
$215.9 million
remains available for future repurchases under the share repurchase program.
Common stock dividend
In May 2014, the Company's Board of Directors approved a dividend of
$0.15
per common share to the shareholders of record on June 3, 2014. Dividend payments of
$20.7 million
were made in June 2014.
During fiscal 2014, the Company has paid dividends of
$0.60
per common share and
$82.8 million
in total.
5. Property, plant and equipment, net
Property, plant and equipment are recorded at cost and consist of the following:
|
June 28, 2014
|
June 29, 2013
|
||||||
|
|
(Thousands)
|
||||||
|
Buildings
|
$
|
132,291
|
|
$
|
141,886
|
|
|
|
Machinery, fixtures and equipment
|
266,416
|
|
213,317
|
|
|||
|
Information technology hardware and software
|
699,466
|
|
628,026
|
|
|||
|
Leasehold improvements
|
118,907
|
|
102,301
|
|
|||
|
Depreciable property, plant and equipment, gross
|
1,217,080
|
|
1,085,530
|
|
|||
|
Accumulated depreciation
|
(783,485
|
)
|
(691,980
|
)
|
|||
|
Depreciable property, plant and equipment, net
|
433,595
|
|
393,550
|
|
|||
|
Land
|
31,730
|
|
24,834
|
|
|||
|
Construction in progress
|
69,674
|
|
74,222
|
|
|||
|
Property, plant and equipment, net
|
$
|
534,999
|
|
$
|
492,606
|
|
|
Depreciation expense related to property, plant and equipment was
$92.5 million
,
$88.3 million
and
$73.6 million
in fiscal
2014
,
2013
and
2012
, respectively.
54
AVNET, INC. AND SUBSIDIARIES
NOTES TO CONSOLIDATED FINANCIAL STATEMENTS — (Continued)
6. Goodwill and intangible assets
The following table presents the change in goodwill balances by reportable segment for fiscal year
2014
. All of the accumulated impairment was recognized in fiscal 2009.
|
Electronics
Marketing
|
Technology
Solutions
|
Total
|
|||||||||
|
|
(Thousands)
|
||||||||||
|
Gross goodwill
|
$
|
1,646,940
|
|
$
|
994,082
|
|
$
|
2,641,022
|
|
||
|
Accumulated impairment
|
(1,045,110
|
)
|
(334,624
|
)
|
(1,379,734
|
)
|
|||||
|
Carrying value at June 29, 2013
|
601,830
|
|
659,458
|
|
1,261,288
|
|
|||||
|
Additions
|
51,994
|
|
10,622
|
|
62,616
|
|
|||||
|
Adjustments
|
2,039
|
|
552
|
|
2,591
|
|
|||||
|
Foreign currency translation
|
12,594
|
|
9,379
|
|
21,973
|
|
|||||
|
Carrying value at June 28, 2014
|
$
|
668,457
|
|
$
|
680,011
|
|
$
|
1,348,468
|
|
||
|
Gross goodwill
|
$
|
1,713,567
|
|
$
|
1,014,635
|
|
$
|
2,728,202
|
|
||
|
Accumulated impairment
|
(1,045,110
|
)
|
(334,624
|
)
|
(1,379,734
|
)
|
|||||
|
Carrying value at June 28, 2014
|
$
|
668,457
|
|
$
|
680,011
|
|
$
|
1,348,468
|
|
||
The goodwill additions are a result of businesses acquired during fiscal
2014
(see Note 2) and goodwill adjustments represent the net purchase accounting adjustments for acquisitions during the related measurement periods.
Goodwill represents the excess of the purchase price of acquired businesses over the estimated fair value assigned to the individual assets acquired and liabilities assumed. The Company is required to test goodwill for impairment at least annually as of the first day of its fiscal fourth quarter. The Company will perform an impairment test between required annual tests if facts and circumstances indicate that it is more likely than not that the fair value of a reporting unit that has goodwill is less than its carrying value. Once goodwill has been assigned to a reporting unit, for accounting purposes, the goodwill is no longer directly associated with the underlying acquisitions that the goodwill originated from, but rather the reporting unit to which it has been assigned. During Fiscal 2014, 2013 and 2012 the Company elected to perform the first-step of the two-step goodwill impairment test instead of first performing a qualitative goodwill impairment test.
The first step in a two-step impairment test is the comparison of the fair value of a reporting unit with its carrying amount, including goodwill. Based upon the Company’s annual impairment tests performed for fiscal
2014
,
2013
and
2012
, there was
no
impairment of goodwill in the respective fiscal years.
The following table presents the Company’s identifiable intangible assets, which have a weighted average life of approximately
8
years for each fiscal year presented:
|
June 28, 2014
|
June 29, 2013
|
||||||||||||||||||||||
|
Gross Acquired Amount
|
Accumulated Amortization
|
Net Book Value
|
Gross Acquired Amount
|
Accumulated Amortization
|
Net Book Value
|
||||||||||||||||||
|
(Thousands)
|
|||||||||||||||||||||||
|
Customer relationships
|
$
|
319,496
|
|
$
|
(155,604
|
)
|
$
|
163,892
|
|
$
|
276,107
|
|
$
|
(109,946
|
)
|
$
|
166,161
|
|
|||||
|
Trade name
|
5,993
|
|
(1,555
|
)
|
4,438
|
|
3,320
|
|
(480
|
)
|
2,840
|
|
|||||||||||
|
Other
|
18,833
|
|
(2,855
|
)
|
15,978
|
|
4,177
|
|
(966
|
)
|
3,211
|
|
|||||||||||
|
$
|
344,322
|
|
$
|
(160,014
|
)
|
$
|
184,308
|
|
$
|
283,604
|
|
$
|
(111,392
|
)
|
$
|
172,212
|
|
||||||
55
AVNET, INC. AND SUBSIDIARIES
NOTES TO CONSOLIDATED FINANCIAL STATEMENTS — (Continued)
Intangible asset amortization expense was
$44.7 million
,
$32.3 million
and
$27.8 million
for fiscal
2014
,
2013
and
2012
respectively. The following table presents the estimated future amortization expense for the next five fiscal years and thereafter (in thousands):
|
Fiscal Year
|
Amortization Expense
|
|
|
|
2015
|
$
|
41,458
|
|
|
2016
|
35,512
|
|
|
|
2017
|
33,478
|
|
|
|
2018
|
24,900
|
|
|
|
2019
|
20,756
|
|
|
|
Thereafter
|
28,204
|
|
|
|
Total
|
$
|
184,308
|
|
7. External financing
Short-term debt consists of the following:
|
June 28, 2014
|
June 29, 2013
|
||||||
|
|
(Thousands)
|
||||||
|
Bank credit facilities and other
|
$
|
250,088
|
|
$
|
178,240
|
|
|
|
Accounts receivable securitization program (Note 3)
|
615,000
|
|
360,000
|
|
|||
|
Current portion of long-term debt
|
—
|
|
299,950
|
|
|||
|
Short-term debt
|
$
|
865,088
|
|
$
|
838,190
|
|
|
Bank credit facilities consist of various committed and uncommitted lines of credit and other forms of bank debt with financial institutions utilized primarily to support the working capital requirements of foreign operations. The weighted average interest rate on the bank credit facilities was
3.2%
and
4.3%
at the end of fiscal
2014
and
2013
, respectively. The interest rate on the accounts receivable securitization program was 0.6% at the end of fiscal 2014 and 2013.
Long-term debt consists of the following:
|
June 28, 2014
|
June 29, 2013
|
||||||
|
|
(Thousands)
|
||||||
|
2012 Credit Facility
|
$
|
12,000
|
|
$
|
6,700
|
|
|
|
6.000% Notes due September 1, 2015
|
250,000
|
|
250,000
|
|
|||
|
6.625% Notes due September 15, 2016
|
300,000
|
|
300,000
|
|
|||
|
5.875% Notes due June 15, 2020
|
300,000
|
|
300,000
|
|
|||
|
4.875% Notes due December 1, 2022
|
350,000
|
|
350,000
|
|
|||
|
Other long-term debt
|
3,867
|
|
2,879
|
|
|||
|
Subtotal
|
1,215,867
|
|
1,209,579
|
|
|||
|
Unamortized discount on notes
|
(2,053
|
)
|
(2,586
|
)
|
|||
|
Long-term debt
|
$
|
1,213,814
|
|
$
|
1,206,993
|
|
|
At the end of fiscal 2014, the Company had a
five-year
$1.00 billion
senior unsecured revolving credit facility (the "2012 Credit Facility") with a syndicate of banks, which expires in
November 2016
. Under the 2012 Credit Facility, the Company may select from various interest rate options, currencies and maturities. The 2012 Credit Facility contains certain covenants, all of which the Company was in compliance with as of
June 28, 2014
. At
June 28, 2014
, there were letters of credit aggregating to
$2.0 million
outstanding which represents a utilization of the 2012 Credit Facility capacity but are not recorded in the consolidated balance sheet as the letters of credit are not debt. At
June 29, 2013
, there were letters of credit aggregating
$2.3 million
outstanding.
56
AVNET, INC. AND SUBSIDIARIES
NOTES TO CONSOLIDATED FINANCIAL STATEMENTS — (Continued)
In July 2014, subsequent to the end of fiscal 2014, the Company terminated the 2012 Credit Facility and entered into a five-year
$1.25 billion
senior unsecured revolving credit facility (the "2014 Credit Facility") with a syndicate of banks, consisting of revolving credit facilities and the issuance of up to
$150.00 million
of letters of credit. Subject to certain conditions, the 2014 Credit Facility may be increased up to
$1.50 billion
. Under the 2014 Credit Facility, the Company may select from various interest rate options, currencies and maturities. The 2014 Credit Facility contains certain covenants, which are substantially similar to those covenants contained in the 2012 Credit Facility. The 2014 Credit Facility is scheduled to mature in July 2019.
Aggregate debt maturities for the next five fiscal years and thereafter are as follows (in thousands):
|
2015
|
$
|
865,088
|
|
|
2016
|
264,547
|
|
|
|
2017
|
301,286
|
|
|
|
2018
|
34
|
|
|
|
2019
|
—
|
|
|
|
Thereafter
|
650,000
|
|
|
|
Subtotal
|
2,080,955
|
|
|
|
Discount on notes
|
(2,053
|
)
|
|
|
Total debt
|
$
|
2,078,902
|
|
At
June 28, 2014
, the carrying value and fair value of the Company’s debt was
$2.08 billion
and
$2.19 billion
, respectively. Fair value was estimated primarily based upon quoted market prices for the Company's long-term notes. At June 29, 2013, the carrying value and fair value of the Company’s debt was
$2.05 billion
and
$2.13 billion
, respectively. Fair value was estimated primarily based upon quoted market prices for the Company's long-term notes.
8. Accrued expenses and other
Accrued expenses and other consist of the following:
|
June 28, 2014
|
June 29, 2013
|
||||||
|
|
(Thousands)
|
||||||
|
Accrued salaries and benefits
|
$
|
339,885
|
|
$
|
304,606
|
|
|
|
Accrued operating costs
|
117,556
|
|
92,306
|
|
|||
|
Accrued interest and banking costs
|
32,878
|
|
42,096
|
|
|||
|
Accrued restructuring costs (Note 17)
|
40,917
|
|
46,522
|
|
|||
|
Accrued income taxes
|
40,829
|
|
54,039
|
|
|||
|
Accrued other
|
139,304
|
|
165,533
|
|
|||
|
Total accrued expenses and other
|
$
|
711,369
|
|
$
|
705,102
|
|
|
9. Income taxes
The components of income tax expense (“tax provision”) are indicated in the table below. The tax provision for deferred income taxes results from temporary differences arising principally from net operating losses, inventories valuation, receivables valuation, certain accrued amounts and depreciation and amortization, net of any changes to valuation allowances.
57
AVNET, INC. AND SUBSIDIARIES
NOTES TO CONSOLIDATED FINANCIAL STATEMENTS — (Continued)
|
|
Years Ended
|
||||||||||
|
June 28, 2014
|
June 29, 2013
|
June 30, 2012
|
|||||||||
|
|
(Thousands)
|
||||||||||
|
Current:
|
|
|
|
||||||||
|
Federal
|
$
|
71,714
|
|
$
|
17,212
|
|
$
|
94,237
|
|
||
|
State and local
|
8,038
|
|
7,034
|
|
19,466
|
|
|||||
|
Foreign
|
91,415
|
|
84,965
|
|
98,278
|
|
|||||
|
Total current taxes
|
171,167
|
|
109,211
|
|
211,981
|
|
|||||
|
Deferred:
|
|
|
|
||||||||
|
Federal
|
11,305
|
|
2,619
|
|
6,896
|
|
|||||
|
State and local
|
3,810
|
|
2,390
|
|
758
|
|
|||||
|
Foreign
|
(30,759
|
)
|
(15,028
|
)
|
4,128
|
|
|||||
|
Total deferred taxes
|
(15,644
|
)
|
(10,019
|
)
|
11,782
|
|
|||||
|
Income tax expense
|
$
|
155,523
|
|
$
|
99,192
|
|
$
|
223,763
|
|
||
The tax provision is computed based upon income before income taxes from both U.S. and foreign operations. U.S. income before income taxes was
$235.4 million
,
$174.0 million
and
$320.3 million
and foreign income before income taxes was
$465.7 million
,
$375.3 million
and
$470.4 million
in fiscal
2014
,
2013
and
2012
, respectively.
Reconciliations of the federal statutory tax rate to the effective tax rates are as follows:
|
|
Years Ended
|
|||||||
|
June 28, 2014
|
June 29, 2013
|
June 30, 2012
|
||||||
|
Federal statutory rate
|
35.0
|
%
|
35.0
|
%
|
35.0
|
%
|
||
|
State and local income taxes, net of federal benefit
|
1.3
|
|
1.1
|
|
1.8
|
|
||
|
Foreign tax rates, net of valuation allowances
|
(9.3
|
)
|
(7.2
|
)
|
(5.4
|
)
|
||
|
Release of valuation allowance, net of U.S. tax expense
|
(4.8
|
)
|
(6.4
|
)
|
(2.8
|
)
|
||
|
Change in contingency reserves
|
(0.1
|
)
|
0.4
|
|
0.5
|
|
||
|
Tax audit settlements
|
(0.6
|
)
|
(6.0
|
)
|
(1.0
|
)
|
||
|
Other, net
|
0.7
|
|
1.2
|
|
0.2
|
|
||
|
Effective tax rate
|
22.2
|
%
|
18.1
|
%
|
28.3
|
%
|
||
Foreign tax rates represents the impact of the difference between foreign and federal statutory rates applied to foreign income or loss and also include the impact of valuation allowances established against the Company's otherwise realizable foreign deferred tax assets, which are primarily loss carry-forwards.
Avnet’s effective tax rate on income before income taxes was
22.2%
in fiscal
2014
as compared with an effective tax rate of
18.1%
in fiscal
2013
. Included in the fiscal
2014
effective tax rate is a net tax benefit of
$43.8 million
, which is comprised primarily of (i) a tax benefit of
$33.4 million
for the release of valuation allowances against deferred tax assets that were determined to be realizable, primarily related to a legal entity in EMEA (discussed further below), and (ii) a net tax benefit of
$7.0 million
resulting from losses related to an investment in a foreign subsidiary. The fiscal
2014
effective tax rate is higher than the fiscal
2013
effective tax rate primarily due to a lower amount of tax benefits from audit settlements in fiscal 2014 as compared to fiscal 2013, partially offset by a greater tax benefit from the valuation allowances released in fiscal 2014 as compared with the amount released in fiscal 2013.
The Company applies the guidance in ASC 740, which requires management to use its judgment to the appropriate weighting of all available evidence when assessing the need for the establishment or the release of valuation allowances. As part of this analysis, the Company examines all available evidence on a jurisdiction by jurisdiction basis and weighs the positive and negative evidence when determining the need for full or partial valuation allowances. The evidence considered for each jurisdiction includes, among other items: (i) the historic levels of income or losses over a range of time periods, which may extend beyond the most recent three fiscal years depending upon the historical volatility of income in an individual jurisdiction; (ii) expectations and
58
AVNET, INC. AND SUBSIDIARIES
NOTES TO CONSOLIDATED FINANCIAL STATEMENTS — (Continued)
risk associated with underlying estimates of future taxable income, including considering the historical trend of down-cycles in the semiconductor and related industries; and (iii) prudent and feasible tax planning strategies.
As of the end of fiscal 2014, the Company had a partial valuation allowance against significant net operating loss carry-forward deferred tax assets related to a legal entity in EMEA due to, among several other factors, a history of losses in that entity. In recent fiscal years, such entity has been experiencing improved earnings, which required the partial release of the valuation allowance to the extent the entity has projected future taxable income. In fiscal 2014 and fiscal 2013, the Company determined a portion of the valuation allowance for such legal entity was no longer required due to the expected continuation of improved earnings in the foreseeable future and, as a result, the Company's effective tax rate was reduced upon the partial release of the valuation allowance, net of the U.S. tax expense. In fiscal 2014 and 2013, the valuation allowance released associated with this EMEA legal entity was
$33.6 million
and
$27.1 million
, respectively, net of the U.S. tax expense associated with the release. Excluding the benefit in both fiscal years related to the release of the tax valuation allowance associated with such EMEA legal entity, the effective tax rate for fiscal
2014
and fiscal 2013 would have been
27.0%
and
23.0%
, respectively.
ASC 740 requires a preponderance of positive evidence in order to reach a conclusion to release all or a portion of a valuation allowance when negative evidence exists. The Company will continue to evaluate the need for a valuation allowance against these deferred tax assets and will adjust the valuation allowance as deemed appropriate which, if reduced, could result in a significant decrease to the effective tax rate in the period of the adjustment.
No
provision for U.S. income taxes has been made for approximately
$2.77 billion
of cumulative unremitted earnings of foreign subsidiaries at
June 28, 2014
because those earnings are expected to be permanently reinvested outside the U.S. A hypothetical calculation of the deferred tax liability, assuming those earnings were remitted, is not practicable.
The significant components of deferred tax assets and liabilities, included primarily in “other assets” on the consolidated balance sheets, are as follows:
|
June 28,
2014 |
June 29,
2013 |
||||||
|
|
(Thousands)
|
||||||
|
Deferred tax assets:
|
|
|
|||||
|
Federal, state and foreign tax loss carry-forwards
|
$
|
336,334
|
|
$
|
333,940
|
|
|
|
Inventories valuation
|
$
|
18,442
|
|
$
|
19,509
|
|
|
|
Receivables valuation
|
26,022
|
|
27,185
|
|
|||
|
Various accrued liabilities and other
|
(1,673
|
)
|
33,031
|
|
|||
|
|
379,125
|
|
413,665
|
|
|||
|
Less — valuation allowance
|
(182,123
|
)
|
(230,821
|
)
|
|||
|
|
197,002
|
|
182,844
|
|
|||
|
Deferred tax liabilities:
|
|
|
|||||
|
Depreciation and amortization of property, plant and equipment
|
(46,294
|
)
|
(50,469
|
)
|
|||
|
Net deferred tax assets
|
$
|
150,708
|
|
$
|
132,375
|
|
|
The change in valuation allowances from fiscal
2013
to fiscal
2014
was primarily due to (i) a net reduction of
$52.7 million
primarily due to the above mentioned release of a valuation allowance in EMEA,
$33.4 million
of which impacted the effective tax rate while the remainder was offset in deferred income taxes, and (ii) a net expense of
$4.1 million
primarily related to rate changes on valuation allowances previously established in various foreign jurisdictions.
As of
June 28, 2014
, the Company had foreign net operating loss carry-forwards of approximately
$1.25 billion
, of which
$6.2 million
will expire during fiscal 2015 and 2016, substantially all of which have full valuation allowances,
$278.4 million
have expiration dates ranging from fiscal
2017 to 2034
and the remaining
$961.3 million
have no expiration date. The carrying value of the Company’s foreign net operating loss carry-forwards is dependent upon the Company’s ability to generate sufficient future taxable income in certain foreign tax jurisdictions. In addition, the Company considers historic levels of income or losses, expectations and risk associated with estimates of future taxable income and ongoing prudent and feasible tax planning strategies in assessing a tax valuation allowance.
59
AVNET, INC. AND SUBSIDIARIES
NOTES TO CONSOLIDATED FINANCIAL STATEMENTS — (Continued)
Estimated liabilities for unrecognized tax benefits are included in “accrued expenses and other” and “other liabilities” on the consolidated balance sheets. These contingent liabilities relate to various tax matters that result from uncertainties in the application of complex income tax regulations in the numerous jurisdictions in which the Company operates. The change in such liabilities during fiscal
2014
is primarily due to favorable audit settlements, which are included in the “reductions for tax positions taken in prior periods” caption in the following table. As of
June 28, 2014
, unrecognized tax benefits were
$128.2 million
, of which approximately
$112.2 million
, if recognized, would favorably impact the effective tax rate and the remaining balance would be substantially offset by valuation allowances. As of
June 29, 2013
, unrecognized tax benefits were
$123.9 million
, of which approximately
$117.7 million
, if recognized, would favorably impact the effective tax rate, and the remaining balance would be substantially offset by valuation allowances. The estimated liability for unrecognized tax benefits included accrued interest expense and penalties of
$25.3 million
and
$25.0 million
, net of applicable state tax benefit, as of the end of fiscal
2014
and
2013
, respectively.
Reconciliations of the beginning and ending liability balances for unrecognized tax benefits are as follows:
|
June 28, 2014
|
June 29, 2013
|
||||||
|
|
(Thousands)
|
||||||
|
Balance at beginning of year
|
$
|
123,930
|
|
$
|
146,626
|
|
|
|
Additions for tax positions taken in prior periods, including interest
|
15,966
|
|
11,732
|
|
|||
|
Reductions for tax positions taken in prior periods, including interest
|
(880
|
)
|
(33,776
|
)
|
|||
|
Additions for tax positions taken in current period
|
8,364
|
|
7,445
|
|
|||
|
Reductions related to settlements with taxing authorities
|
(14,250
|
)
|
(9,064
|
)
|
|||
|
Reductions related to the lapse of applicable statutes of limitations
|
(7,571
|
)
|
(2,812
|
)
|
|||
|
Adjustments related to foreign currency translation
|
2,662
|
|
3,779
|
|
|||
|
Balance at end of year
|
$
|
128,221
|
|
$
|
123,930
|
|
|
The evaluation of income tax positions requires management to estimate the ability of the Company to sustain its position and estimate the final benefit to the Company. To the extent that these estimates do not reflect the actual outcome there could be an impact on the consolidated financial statements in the period in which the position is settled, the applicable statutes of limitations expire or new information becomes available as the impact of these events are recognized in the period in which they occur. It is difficult to estimate the period in which the amount of a tax position will change as settlement may include administrative and legal proceedings whose timing the Company cannot control. The effects of settling tax positions with tax authorities and statute expirations may significantly impact the estimate for unrecognized tax benefits. Within the next twelve months, management estimates that approximately
$21.5 million
of these liabilities for unrecognized tax benefits will be settled by the expiration of the statutes of limitations or through through agreement with the tax authorities for tax positions related to valuation matters and positions related to acquired entities; such matters are common to multinational companies. The expected cash payment related to the settlement of these contingencies is
$7.8 million
.
The Company conducts business globally and consequently files income tax returns in numerous jurisdictions including those listed in the following table. It is also routinely subject to audit in these and other countries. The Company is no longer subject to audit in its major jurisdictions for periods prior to fiscal year 2008. The years remaining subject to audit, by major jurisdiction, are as follows:
|
Jurisdiction
|
Fiscal Year
|
|
|
United States (federal and state)
|
2012 - 2014
|
|
|
Belgium
|
2010 - 2014
|
|
|
Germany, Taiwan and United Kingdom
|
2009 -2014
|
|
|
Netherlands, Singapore and Hong Kong
|
2008 -2014
|
|
10. Pension and retirement plans
Pension Plan
The Company’s noncontributory defined benefit pension plan (the “Plan”) covers substantially all domestic employees. Employees are eligible to participate in the Plan following the first year of service during which they worked at least
1,000
hours. The Plan provides defined benefits pursuant to a cash balance feature whereby a participant accumulates a benefit based upon a
60
AVNET, INC. AND SUBSIDIARIES
NOTES TO CONSOLIDATED FINANCIAL STATEMENTS — (Continued)
percentage of current salary, which varies with age, and interest credits. The Company uses its fiscal year end as the measurement date for determining pension expense and benefit obligations for each fiscal year. The disclosures below do not include the pension plans of certain non-U.S. subsidiaries and other defined benefit plans, which are not considered material.
The following table outlines changes in benefit obligations, plan assets and the funded status of the Plan as of the end of fiscal
2014
and
2013
:
|
June 28,
2014 |
June 29,
2013 |
||||||
|
|
(Thousands)
|
||||||
|
Changes in benefit obligations:
|
|
|
|||||
|
Benefit obligations at beginning of year
|
$
|
391,880
|
|
$
|
375,156
|
|
|
|
Service cost
|
36,733
|
|
36,920
|
|
|||
|
Interest cost
|
17,155
|
|
14,653
|
|
|||
|
Actuarial loss (gain)
|
34,726
|
|
(13,545
|
)
|
|||
|
Benefits paid
|
(23,327
|
)
|
(21,304
|
)
|
|||
|
Benefit obligations at end of year
|
$
|
457,167
|
|
$
|
391,880
|
|
|
|
Changes in plan assets:
|
|
|
|||||
|
Fair value of plan assets at beginning of year
|
$
|
365,373
|
|
$
|
301,449
|
|
|
|
Actual return on plan assets
|
67,914
|
|
45,228
|
|
|||
|
Benefits paid
|
(23,327
|
)
|
(21,304
|
)
|
|||
|
Contributions
|
40,000
|
|
40,000
|
|
|||
|
Fair value of plan assets at end of year
|
$
|
449,960
|
|
$
|
365,373
|
|
|
|
Funded status of the plan recognized as a non-current liability
|
$
|
(7,207
|
)
|
$
|
(26,507
|
)
|
|
|
Amounts recognized in accumulated other comprehensive income:
|
|
|
|||||
|
Unrecognized net actuarial losses
|
$
|
158,103
|
|
$
|
173,069
|
|
|
|
Unamortized prior service credits
|
(6,050
|
)
|
(7,623
|
)
|
|||
|
|
$
|
152,053
|
|
$
|
165,446
|
|
|
|
Other changes in plan assets and benefit obligations recognized in other comprehensive income:
|
|
|
|||||
|
Net actuarial gain
|
$
|
(2,280
|
)
|
$
|
(30,870
|
)
|
|
|
Amortization of net actuarial losses
|
(12,686
|
)
|
(14,898
|
)
|
|||
|
Amortization of prior service credits
|
1,573
|
|
1,573
|
|
|||
|
|
$
|
(13,393
|
)
|
$
|
(44,195
|
)
|
|
The Plan was amended effective June 1, 2012 to improve pre-retirement death benefits so that the pre-retirement death benefits will be payable without regard to marital status, and will be based on
100%
of the participant's vested cash account. The increase in liability was recognized as a prior service cost and amortization began in fiscal year 2013.
Included in accumulated other comprehensive income at
June 28, 2014
is pre-tax expense of
$158.1 million
of net actuarial losses which have not yet been recognized in net periodic pension cost, of which
$13.0 million
is expected to be recognized as a component of net periodic pension cost during fiscal
2015
. Also included is a pre-tax benefit of
$6.1 million
of prior service credits which have not yet been recognized in net periodic pension costs, of which
$1.6 million
is expected to be recognized as a component of net periodic pension costs during fiscal
2015
.
Weighted average assumptions used to calculate actuarial present values of benefit obligations are as follows:
|
2014
|
2013
|
||
|
Discount rate
|
4.00%
|
4.50%
|
|
61
AVNET, INC. AND SUBSIDIARIES
NOTES TO CONSOLIDATED FINANCIAL STATEMENTS — (Continued)
The discount rate selected by the Company for the Plan reflects the current rate at which the underlying liability could be settled at the measurement date as of June 28, 2014. The selected discount rate is based primarily upon an average rate determined by matching the expected cash outflows of the Plan to a yield curve constructed from a portfolio of highly rated (minimum AA rating) fixed-income debt instruments with maturities consistent with the expected cash outflows.
Weighted average assumptions used to determine net benefit costs are as follows:
|
2014
|
2013
|
||
|
Discount rate
|
4.50%
|
4.00%
|
|
|
Expected return on plan assets
|
8.50%
|
8.50%
|
|
Components of net periodic pension cost during the last three fiscal years are as follows:
|
|
Years Ended
|
||||||||||
|
June 28,
2014 |
June 29,
2013 |
June 30,
2012 |
|||||||||
|
|
(Thousands)
|
||||||||||
|
Service costs
|
$
|
36,733
|
|
$
|
36,920
|
|
$
|
28,380
|
|
||
|
Interest costs
|
17,155
|
|
14,653
|
|
14,925
|
|
|||||
|
Expected return on plan assets
|
(30,908
|
)
|
(27,905
|
)
|
(26,938
|
)
|
|||||
|
Recognized net actuarial losses
|
12,686
|
|
14,898
|
|
9,680
|
|
|||||
|
Amortization of prior service credits
|
(1,573
|
)
|
(1,573
|
)
|
(1,875
|
)
|
|||||
|
Net periodic pension cost
|
$
|
34,093
|
|
$
|
36,993
|
|
$
|
24,172
|
|
||
The Company made
$40.0 million
of contributions in fiscal
2014
and fiscal
2013
and expects to make approximately $40.0 million of contributions in fiscal 2015.
Benefit payments are expected to be paid to Plan participants as follows for the next five fiscal years and the aggregate for the five years thereafter (in thousands):
|
2015
|
$
|
31,997
|
|
|
2016
|
26,982
|
|
|
|
2017
|
30,786
|
|
|
|
2018
|
34,646
|
|
|
|
2019
|
39,082
|
|
|
|
2020 through 2024
|
273,509
|
|
|
The Plan’s assets are held in trust and were allocated as follows as of the measurement date at the end of fiscal
2014
and
2013
:
|
2014
|
2013
|
||||
|
Equity securities
|
75
|
%
|
75
|
%
|
|
|
Fixed income debt securities
|
24
|
%
|
24
|
%
|
|
|
Cash and cash equivalents
|
1
|
%
|
1
|
%
|
|
The general investment objectives of the Plan are to maximize returns through a diversified investment portfolio in order to earn annualized returns that meet the long-term cost of funding the Plan’s pension obligations while maintaining reasonable and prudent levels of risk. The target rate of return on Plan assets is currently
8.5%
, which represents the average rate of earnings expected on the funds invested or to be invested to provide for the benefits included in the benefit obligation. This assumption has been determined by combining expectations regarding future rates of return for the investment portfolio along with the historical and expected distribution of investments by asset class and the historical rates of return for each of those asset classes. The mix of equity securities is typically diversified to obtain a blend of domestic and international investments covering multiple industries. The Plan assets do not include any material investments in Avnet common stock. The Plan’s investments in debt
62
AVNET, INC. AND SUBSIDIARIES
NOTES TO CONSOLIDATED FINANCIAL STATEMENTS — (Continued)
securities are also diversified across both public and private fixed income securities. The Company’s current target allocation for the investment portfolio is for equity securities, both domestic and international, to represent approximately
76.0%
of the portfolio with a policy for minimum investment in equity securities of approximately
60.0%
of the portfolio and a maximum of approximately
92.0%
. The majority of the remaining portfolio of investments is to be invested in fixed income debt securities.
The following table sets forth the fair value of the Plan's investments as of
June 28, 2014
:
|
Level 1
|
Level 2
|
Level 3
|
Total
|
|||||||||||||
|
(Thousands)
|
||||||||||||||||
|
Cash and cash equivalents
|
$
|
3,025
|
|
$
|
—
|
|
$
|
—
|
|
$
|
3,025
|
|
||||
|
Equities:
|
||||||||||||||||
|
U.S. common stocks
|
—
|
|
267,741
|
|
—
|
|
267,741
|
|
||||||||
|
International common stocks
|
—
|
|
71,273
|
|
—
|
|
71,273
|
|
||||||||
|
Fixed Income:
|
||||||||||||||||
|
U.S. government agencies
|
—
|
|
10,439
|
|
—
|
|
10,439
|
|
||||||||
|
U.S. corporate bonds
|
—
|
|
97,482
|
|
—
|
|
97,482
|
|
||||||||
|
Total
|
$
|
3,025
|
|
$
|
446,935
|
|
$
|
—
|
|
$
|
449,960
|
|
||||
The following table sets forth the fair value of the Plan's investments as of
June 29, 2013
:
|
Level 1
|
Level 2
|
Level 3
|
Total
|
|||||||||||||
|
(Thousands)
|
||||||||||||||||
|
Cash and cash equivalents
|
$
|
3,032
|
|
$
|
—
|
|
$
|
—
|
|
$
|
3,032
|
|
||||
|
Equities:
|
||||||||||||||||
|
U.S. common stocks
|
—
|
|
219,225
|
|
—
|
|
219,225
|
|
||||||||
|
International common stocks
|
—
|
|
56,458
|
|
—
|
|
56,458
|
|
||||||||
|
Fixed Income:
|
||||||||||||||||
|
U.S. government agencies
|
—
|
|
10,004
|
|
—
|
|
10,004
|
|
||||||||
|
U.S. corporate bonds
|
—
|
|
76,654
|
|
—
|
|
76,654
|
|
||||||||
|
Total
|
$
|
3,032
|
|
$
|
362,341
|
|
$
|
—
|
|
$
|
365,373
|
|
||||
The fair value of Plan’s investments in equity and fixed income investments are stated at unit value, or the equivalent of net asset value, which is a practical expedient for estimating the fair values of those investments. Each of these investments may be redeemed daily without notice and there were no material unfunded commitments as of
June 28, 2014
.
The fixed income investments provide a steady return with medium volatility and assist with capital preservation and income generation. The equity investments have higher expected volatility and return than the fixed income investments.
11. Operating leases
The Company leases many of its operating facilities and is also committed under lease agreements for transportation and operating equipment. Rent expense charged to operating expenses during the last three fiscal years is as follows:
|
|
Years Ended
|
||||||||||
|
June 28,
2014 |
June 29,
2013 |
June 30,
2012 |
|||||||||
|
|
(Thousands)
|
||||||||||
|
Rent expense under operating leases
|
$
|
106,620
|
|
$
|
94,087
|
|
$
|
92,624
|
|
||
The aggregate future minimum operating lease commitments, principally for buildings, in fiscal
2015
through
2019
and thereafter, are as follows (in thousands):
63
AVNET, INC. AND SUBSIDIARIES
NOTES TO CONSOLIDATED FINANCIAL STATEMENTS — (Continued)
|
2015
|
$
|
91,242
|
|
|
2016
|
69,823
|
|
|
|
2017
|
55,204
|
|
|
|
2018
|
39,359
|
|
|
|
2019
|
29,846
|
|
|
|
Thereafter
|
92,015
|
|
|
|
Total
|
$
|
377,489
|
|
The preceding table includes the remaining operating lease commitments that are included as a component of the Company’s restructuring liabilities (see Note 17).
12. Stock-based compensation
The Company measures all stock-based payments at fair value and recognizes related expense within operating expenses in the consolidated statements of operations over the requisite service period (generally the vesting period). During fiscal
2014
,
2013
, and
2012
, the Company recorded stock-based compensation expense of
$45.9 million
,
$43.7 million
and
$35.7 million
, respectively, for all forms of stock-based compensation awards.
Stock plan
At
June 28, 2014
, the Company had
11.3 million
shares of common stock reserved for stock-based awards, which consisted of
1.8 million
for stock options granted but not yet vested and vested but not yet exercised,
6.4 million
available for future awards under plans approved by shareholders,
2.8 million
for restricted stock incentive and performance shares granted but not yet vested, and
0.4 million
shares available for future award under the Company's Employee Stock Purchase Plan ("ESPP").
Stock options
Stock option grants have a contractual life of
ten years
, vest in
25% increments on each anniversary of the grant date
, commencing with the first anniversary, and require an exercise price of
100%
of the fair market value at the date of grant. Stock-based compensation expense associated with stock options during fiscal
2014
,
2013
and
2012
was
$4.7 million
,
$4.0 million
and
$3.1 million
, respectively.
The fair value of stock options is estimated as of the date of grant using the Black-Scholes model based on the assumptions in the following table. The assumption for the expected term is based on evaluations of historical and expected future employee exercise behavior. The risk-free interest rate is based on U.S. Treasury rates as of the date of grant with maturity dates approximately equal to the expected term at the grant date. The historical volatility of Avnet’s common stock is used as the basis for the volatility assumption. The Company estimates dividend yield based upon expectations of future dividends as of the grant date.
|
|
Years Ended
|
|||||||
|
June 28,
2014 |
June 29,
2013 |
June 30,
2012 |
||||||
|
Expected term (years)
|
6.0
|
|
6.0
|
|
6.0
|
|
||
|
Risk-free interest rate
|
1.7
|
%
|
0.9
|
%
|
1.2
|
%
|
||
|
Weighted average volatility
|
34.3
|
%
|
35.0
|
%
|
33.7
|
%
|
||
|
Dividend yield
|
1.5
|
%
|
0.0
|
%
|
0.0
|
%
|
||
64
AVNET, INC. AND SUBSIDIARIES
NOTES TO CONSOLIDATED FINANCIAL STATEMENTS — (Continued)
The following is a summary of the changes in outstanding options for fiscal
2014
:
|
|
Shares
|
Weighted
Average
Exercise Price
|
Weighted Average
Remaining Contractual Life |
|||||
|
Outstanding at June 29, 2013
|
2,579,188
|
|
$
|
26.65
|
|
70 Months
|
||
|
Granted
|
417,692
|
|
39.04
|
|
109 Months
|
|||
|
Exercised
|
(1,185,004
|
)
|
24.65
|
|
40 Months
|
|||
|
Forfeited or expired
|
(2,700
|
)
|
17.47
|
|
3 Months
|
|||
|
Outstanding at June 28, 2014
|
1,809,176
|
|
$
|
30.84
|
|
81 Months
|
||
|
Exercisable at June 28, 2014
|
820,520
|
|
$
|
27.40
|
|
61 Months
|
||
The weighted-average grant-date fair values of stock options granted during fiscal
2014
,
2013
and
2012
were
$11.45
,
$11.33
and
$9.67
, respectively.
At
June 28, 2014
, the aggregate intrinsic value of all outstanding stock option awards was
$23.3 million
and all exercisable stock options awards was
$13.4 million
.
The following is a summary of the changes in non-vested stock options for the fiscal year ended
June 28, 2014
:
|
Shares
|
Weighted
Average
Grant-Date
Fair Value
|
|||||
|
Non-vested stock options at June 29, 2013
|
944,290
|
|
$
|
10.21
|
|
|
|
Granted
|
417,692
|
|
11.45
|
|
||
|
Vested
|
(373,326
|
)
|
9.87
|
|
||
|
Forfeited
|
—
|
|
—
|
|
||
|
Non-vested stock options at June 28, 2014
|
988,656
|
|
$
|
10.86
|
|
|
As of
June 28, 2014
, there was
$2.6 million
of total unrecognized compensation cost related to stock options, which is expected to be recognized over a weighted-average period of
2.2
years. The total fair value of shares vested, as of the vesting dates, during fiscal
2014
,
2013
and
2012
were
$3.7 million
,
$3.4 million
and
$3.6 million
, respectively.
Cash received from stock option exercises during fiscal
2014
,
2013
and
2012
totaled
$4.7 million
,
$2.1 million
, and
$2.4 million
, respectively. The impact of these cash receipts is included in “Other, net” as financing activity in the accompanying consolidated statements of cash flows.
Restricted incentive shares
Delivery of restricted incentive shares, and the associated compensation expense, is spread equally over the vesting period and is generally subject to the employee’s continued service and employment by the Company, except for employees who are retirement eligible. As of
June 28, 2014
,
2.0 million
shares previously awarded have not yet vested. Stock-based compensation expense associated with restricted incentive shares was
$34.4 million
,
$26.8 million
and
$21.0 million
for fiscal years
2014
,
2013
and
2012
, respectively.
65
AVNET, INC. AND SUBSIDIARIES
NOTES TO CONSOLIDATED FINANCIAL STATEMENTS — (Continued)
The following is a summary of the changes in non-vested restricted incentive shares for the fiscal year ended
June 28, 2014
:
|
Shares
|
Weighted
Average
Grant-Date
Fair Value
|
|||||
|
Non-vested restricted incentive shares at June 29, 2013
|
2,009,510
|
|
$
|
29.62
|
|
|
|
Granted
|
1,060,152
|
|
39.05
|
|
||
|
Vested
|
(972,420
|
)
|
31.33
|
|
||
|
Forfeited
|
(95,355
|
)
|
$
|
33.54
|
|
|
|
Non-vested restricted incentive shares at June 28, 2014
|
2,001,887
|
|
$
|
33.60
|
|
|
As of
June 28, 2014
, there was
$51.7 million
of total unrecognized compensation expense related to non-vested restricted incentive shares, which is expected to be recognized over a weighted-average period of
2.3
years. The total fair value of restricted incentive shares vested during fiscal
2014
,
2013
and
2012
was
$30.5 million
,
$25.4 million
and
$19.5 million
, respectively.
Performance shares
Eligible employees, including Avnet’s executive officers, may receive a portion of their long-term stock-based incentive compensation through the performance share program, which allows for the vesting of shares based upon achievement of certain performance-based criteria (“Performance Share Program”). The Performance Share Program provides for the vesting to each grantee of a number of shares of Avnet’s common stock at the end of a
three-year
period based upon the Company’s achievement of certain performance goals established by the Compensation Committee of the Board of Directors for each Performance Share Program three-year period. The performance goals consist of measures of economic profit and total shareholder return.
During fiscal
2014
,
2013
and
2012
, the Company granted
0.2 million
,
0.3 million
and
0.3 million
performance shares, respectively, of which approximately
none
have been forfeited. The actual amount of performance shares vested at the end of each three-year period is measured based upon the level of achievement of the defined performance goals and can range from
0%
to
200%
of the initial award grant. During fiscal
2014
,
2013
and
2012
, the Company recognized stock-based compensation expense associated with the Performance Share Program of
$5.8 million
,
$11.9 million
and
$10.5 million
, respectively.
Director stock-based compensation
Non-employee directors are awarded shares equal to a fixed dollar amount of Avnet common stock upon their re-election each year, as part of their director compensation. Directors may elect to receive this compensation in the form of common stock or they may elect to defer their compensation to be paid in common stock at a later date. During fiscal
2014
,
2013
and
2012
, compensation expense associated with the outside director stock-based compensation plan was
$1.0 million
,
$1.0 million
and
$1.1 million
, respectively.
Employee stock purchase plan
The Company has an Employee Stock Purchase Plan ("ESPP") under the terms of which eligible employees of the Company are allowed to purchase shares of Avnet common stock at a price equal to
95%
of the fair market value on the last day of each monthly offering period. The ESPP is not compensatory based on its terms.
The Company has a policy of repurchasing shares on the open market to satisfy shares purchased by employees under the ESPP, and expects future repurchases during fiscal
2015
to be similar to the number of shares repurchased during fiscal
2014
, based on current estimates of participation in the ESPP program. During each of fiscal
2014
,
2013
and
2012
,
0.06 million
shares of common stock were purchased under the ESPP program.
13. Commitments and contingencies
Bell
During fiscal 2011, the Company recognized a contingent liability for potential unpaid import duties associated with the acquisition of Bell. Prior to the acquisition of Bell by Avnet, Customs and Border Protection (“CBP”) initiated a review of the importing process at one of Bell’s subsidiaries and identified compliance deficiencies. Subsequent to the acquisition of Bell by Avnet, CBP began a compliance audit. The Company evaluated projected duties, interest and penalties that potentially may be
66
AVNET, INC. AND SUBSIDIARIES
NOTES TO CONSOLIDATED FINANCIAL STATEMENTS — (Continued)
imposed as a result of the audit and recognized a contingent liability of
$10.0 million
which was recorded to goodwill in fiscal 2011. Depending on the ultimate resolution of the matter with CBP, the Company estimates that the range of the potential exposure associated with the liability may be up to
$73.0 million
; however, the Company believes the contingent liability recorded is a reasonable estimate of the liability based upon the facts currently available at this time.
LCD Class Action Settlement
The Company filed a proof of claim in the settlement of a class action proceeding that sought damages from certain manufacturers of LCD flat panel displays. A settlement was reached in the proceedings and in the first quarter of fiscal 2014 the federal district judge overseeing the proceeding issued an order approving the distribution of settlement funds to the class claimants and the Company received an award payment of
$19.1 million
. In the third quarter of fiscal 2014, the federal district judge overseeing the proceedings issued an order approving a final distribution of funds and the Company received a final award payment of
$3.0 million
. The total award of
$22.1 million
is classified within "gain on legal settlement, bargain purchase and other" in the consolidated statements of operations.
Other
From time to time, the Company may become a party to, or be otherwise involved in various lawsuits, claims, investigations and other legal proceedings arising in the ordinary course of conducting its business. While litigation is subject to inherent uncertainties, management does not anticipate that any ongoing matters will have a material adverse effect on the Company’s financial condition, liquidity or results of operations.
14. Earnings per share
|
|
Years Ended
|
||||||||||
|
June 28,
2014 |
June 29,
2013 |
June 30,
2012 |
|||||||||
|
|
(Thousands, except per share data)
|
||||||||||
|
Numerator:
|
|
|
|
||||||||
|
Net income
|
$
|
545,604
|
|
$
|
450,073
|
|
$
|
567,019
|
|
||
|
Denominator:
|
|
|
|
||||||||
|
Weighted average common shares for basic earnings per share
|
137,991
|
|
137,951
|
|
147,278
|
|
|||||
|
Net effect of dilutive stock options, restricted incentive shares and performance shares
|
2,128
|
|
2,052
|
|
2,275
|
|
|||||
|
Weighted average common shares for diluted earnings per share
|
140,119
|
|
140,003
|
|
149,553
|
|
|||||
|
Basic earnings per share
|
$
|
3.95
|
|
$
|
3.26
|
|
$
|
3.85
|
|
||
|
Diluted earnings per share
|
$
|
3.89
|
|
$
|
3.21
|
|
$
|
3.79
|
|
||
None
of the Company's outstanding stock options were excluded from the calculation of diluted earnings per share in fiscal
2014
. Options to purchase
0.6 million
and
0.2 million
shares for fiscal years
2013
and
2012
, respectively, were excluded from the calculations of diluted earnings per shares because the exercise price for those options was above the average market price of the Company’s stock during such fiscal years. Inclusion of these options in the respective diluted earnings per share calculations would have had an anti-dilutive effect.
67
AVNET, INC. AND SUBSIDIARIES
NOTES TO CONSOLIDATED FINANCIAL STATEMENTS — (Continued)
15. Additional cash flow information
The "Other, net" component of non-cash and other reconciling items within operating activities in the consolidated statements of cash flows consisted of the following:
|
|
Years Ended
|
||||||||||
|
June 28,
2014 |
June 29,
2013 |
June 30,
2012 |
|||||||||
|
|
(Thousands)
|
||||||||||
|
Provision for doubtful accounts receivable
|
$
|
17,943
|
|
$
|
30,802
|
|
$
|
35,632
|
|
||
|
Periodic pension cost (Note 10)
|
34,093
|
|
36,993
|
|
24,172
|
|
|||||
|
Other, net
|
36,651
|
|
7,532
|
|
6,459
|
|
|||||
|
Total
|
$
|
88,687
|
|
$
|
75,327
|
|
$
|
66,263
|
|
||
Interest and income taxes paid during the last three fiscal years were as follows:
|
|
Years Ended
|
||||||||||
|
June 28,
2014 |
June 29,
2013 |
June 30,
2012 |
|||||||||
|
|
(Thousands)
|
||||||||||
|
Interest
|
$
|
111,608
|
|
$
|
106,735
|
|
$
|
89,529
|
|
||
|
Income taxes
|
$
|
181,117
|
|
$
|
141,196
|
|
$
|
192,717
|
|
||
The Company includes book overdrafts as part of accounts payable on its consolidated balance sheets and reflects changes in such balances as part of cash flows from operating activities in its consolidated statements of cash flows.
16. Segment information
Electronics Marketing and Technology Solutions are the Company's reportable segments ("operating groups").
EM markets and sells semiconductors and interconnect, passive and electromechanical devices and embedded products. EM markets and sells its products and services to a diverse customer base serving many end-markets including automotive, communications, computer hardware and peripheral, industrial and manufacturing, medical equipment, and defense and aerospace. EM also offers an array of value-added services that help customers evaluate, design-in and procure electronic components throughout the lifecycle of their technology products and systems. By working with EM, customers and suppliers can accelerate their time to market and realize cost efficiencies in both the design and manufacturing process.
As a leading global IT solutions distributor, TS focuses on the value-added distribution of enterprise computing servers and systems, software, storage, services and complex solutions from the world’s foremost technology manufacturers. TS partners with its customers and suppliers to create and deliver effective data center and IT lifecycle solutions that solve the business challenges of end-user customers locally and around the world. TS serves a number of customer segments, from VARs, system integrators and independent software vendors to the worldwide OEM market for computing technology and non-PC OEMs requiring embedded systems and solutions including engineering, product prototyping, integration and other value-added services. TS also provides the latest hard disk drives, microprocessor, motherboard and DRAM module technologies to manufacturers of general-purpose computers and system builders.
At the beginning of fiscal 2014, the Company began excluding amortization expense associated with acquired intangible assets from the operating income of the EM and TS operating groups in order to measure such operating results consistent with how many technology companies measure operating performance and given that such amortization expense is non-cash in nature. As a result of this change, prior period segment information has been recast to conform to the new measure of profitability used during fiscal 2014. The change in the measure of operating group profitability did not impact the determination of the Company’s operating groups or the previously reported consolidated financial results.
68
AVNET, INC. AND SUBSIDIARIES
NOTES TO CONSOLIDATED FINANCIAL STATEMENTS — (Continued)
At the beginning of fiscal 2014, a portion of the Company's reverse logistics operations, which was previously included in the EM operating group, was combined within the TS operating group. The Company also combined its regional computing components operations within EM and TS into a single global organization within TS. As a result of these changes, sales, operating income and assets previously reported in the EM operating group in fiscal 2013 have been included within the TS operating group in fiscal 2014. The Company does not view the amount of sales, operating income, or assets of such transferred operations to be a material change to the composition of its operating groups for financial reporting purposes. Sales related to such transferred operations reported in the EM operating group in fiscal 2013 were
$443.3 million
. The transfer of such operations between operating groups did not impact the determination of the Company’s operating groups or the previously reported consolidated financial results.
69
AVNET, INC. AND SUBSIDIARIES
NOTES TO CONSOLIDATED FINANCIAL STATEMENTS — (Continued)
|
|
Years Ended
|
||||||||||
|
June 28,
2014 |
June 29,
2013 |
June 30,
2012 |
|||||||||
|
|
(Millions)
|
||||||||||
|
Sales:
|
|
|
|
||||||||
|
Electronics Marketing
|
$
|
16,544.4
|
|
$
|
15,094.4
|
|
$
|
14,933.1
|
|
||
|
Technology Solutions
|
10,955.3
|
|
10,364.5
|
|
10,774.4
|
|
|||||
|
|
$
|
27,499.7
|
|
$
|
25,458.9
|
|
$
|
25,707.5
|
|
||
|
Operating income (loss):
|
|
|
|
||||||||
|
Electronics Marketing
|
$
|
747.9
|
|
$
|
635.7
|
|
$
|
759.6
|
|
||
|
Technology Solutions
|
317.8
|
|
299.1
|
|
338.9
|
|
|||||
|
Corporate
|
(134.4
|
)
|
(126.9
|
)
|
(112.9
|
)
|
|||||
|
|
931.3
|
|
807.9
|
|
985.6
|
|
|||||
|
Restructuring, integration and other expenses (Note 17)
|
(94.6
|
)
|
(149.5
|
)
|
(73.6
|
)
|
|||||
|
Amortization of acquired intangible assets and other
|
(46.8
|
)
|
(32.4
|
)
|
(27.8
|
)
|
|||||
|
|
$
|
789.9
|
|
$
|
626.0
|
|
$
|
884.2
|
|
||
|
Assets:
|
|
|
|
||||||||
|
Electronics Marketing
|
$
|
6,840.2
|
|
$
|
6,316.3
|
|
$
|
6,024.3
|
|
||
|
Technology Solutions
|
4,140.2
|
|
3,838.4
|
|
3,738.5
|
|
|||||
|
Corporate
|
275.1
|
|
320.0
|
|
405.1
|
|
|||||
|
|
$
|
11,255.5
|
|
$
|
10,474.7
|
|
$
|
10,167.9
|
|
||
|
Capital expenditures:
|
|
|
|
||||||||
|
Electronics Marketing
|
$
|
38.0
|
|
$
|
24.1
|
|
$
|
58.5
|
|
||
|
Technology Solutions
|
43.8
|
|
26.6
|
|
41.3
|
|
|||||
|
Corporate
|
41.4
|
|
46.7
|
|
28.8
|
|
|||||
|
|
$
|
123.2
|
|
$
|
97.4
|
|
$
|
128.6
|
|
||
|
Depreciation & amortization expense:
|
|
|
|
||||||||
|
Electronics Marketing
|
$
|
48.8
|
|
$
|
51.8
|
|
$
|
38.9
|
|
||
|
Technology Solutions
|
59.0
|
|
47.3
|
|
39.2
|
|
|||||
|
Corporate
|
29.4
|
|
21.6
|
|
23.2
|
|
|||||
|
|
$
|
137.2
|
|
$
|
120.7
|
|
$
|
101.3
|
|
||
|
Sales, by geographic area:
|
|
|
|
||||||||
|
Americas
(1)
|
$
|
10,929.5
|
|
$
|
10,716.6
|
|
$
|
11,499.3
|
|
||
|
EMEA
(2)
|
8,246.1
|
|
7,277.9
|
|
7,408.9
|
|
|||||
|
Asia/Pacific
(3)
|
8,324.1
|
|
7,464.4
|
|
6,799.3
|
|
|||||
|
|
$
|
27,499.7
|
|
$
|
25,458.9
|
|
$
|
25,707.5
|
|
||
|
Property, plant and equipment, net, by geographic area:
|
|
|
|
||||||||
|
Americas
(4)
|
$
|
306.2
|
|
$
|
283.0
|
|
$
|
278.5
|
|
||
|
EMEA
(5)
|
199.4
|
|
177.9
|
|
150.8
|
|
|||||
|
Asia/Pacific
|
29.4
|
|
31.7
|
|
31.9
|
|
|||||
|
|
$
|
535.0
|
|
$
|
492.6
|
|
$
|
461.2
|
|
||
______________________
|
(1)
|
Includes sales in the United States of
$9.68 billion
,
$9.43 billion
and
$10.00 billion
for fiscal
2014
,
2013
and
2012
, respectively.
|
|
(2)
|
Includes sales in Germany and the United Kingdom of
$3.31 billion
and
$1.36 billion
, respectively, for fiscal
2014
. Includes sales in Germany and the United Kingdom of
$2.78 billion
and
$1.22 billion
, respectively, for fiscal
2013
. Includes sales in Germany and the United Kingdom of
$2.60 billion
and
$1.40 billion
, respectively, for fiscal
2012
.
|
70
AVNET, INC. AND SUBSIDIARIES
NOTES TO CONSOLIDATED FINANCIAL STATEMENTS — (Continued)
|
(3)
|
Includes sales of
$2.63 billion
,
$2.93 billion
and
$1.19 billion
in Taiwan, China (including Hong Kong) and Singapore, respectively, for fiscal
2014
. Includes sales of
$2.28 billion
,
$2.44 billion
and
$1.16 billion
in Taiwan, China (including Hong Kong) and Singapore, respectively, for fiscal
2013
. Includes sales of
$1.90 billion
,
$2.30 billion
and
$1.20 billion
in Taiwan, China (including Hong Kong) and Singapore, respectively, for fiscal
2012
.
|
|
(4)
|
Includes property, plant and equipment, net, of
$298.1 million
,
$273.4 million
and
$266.7 million
in the United States for fiscal
2014
,
2013
and
2012
, respectively.
|
|
(5)
|
Includes property, plant and equipment, net, of
$95.5 million
,
$61.0 million
, and
$12.6 million
in Germany, Belgium and the United Kingdom, respectively, for fiscal
2014
. Fiscal
2013
includes property, plant and equipment, net, of
$92.7 million
in Germany,
$45.1 million
in Belgium and
$13.1 million
in the United Kingdom. Fiscal
2012
includes property, plant and equipment, net, of
$90.6 million
in Germany,
$26.4 million
in Belgium and
$17.3 million
in the United Kingdom.
|
Listed in the table below are the Company's major product categories and the related sales for each of the past three fiscal years:
|
|
Years Ended
|
||||||||||
|
June 28,
2014 |
June 29,
2013 |
June 30,
2012 |
|||||||||
|
|
(Millions)
|
||||||||||
|
Semiconductors
|
$
|
13,160.9
|
|
$
|
13,720.8
|
|
$
|
13,461.6
|
|
||
|
Computer products
|
10,571.6
|
|
9,346.0
|
|
9,984.4
|
|
|||||
|
Connectors
|
794.7
|
|
687.6
|
|
667.5
|
|
|||||
|
Passives, electromechanical and other
|
2,972.5
|
|
1,704.5
|
|
1,594.0
|
|
|||||
|
|
$
|
27,499.7
|
|
$
|
25,458.9
|
|
$
|
25,707.5
|
|
||
17. Restructuring, integration and other expenses
Fiscal 2014
During fiscal 2014, the Company took certain actions in an effort to reduce future operating costs including activities necessary to achieve planned synergies from recently acquired businesses. In addition, the Company incurred integration and other costs primarily associated with acquired or divested businesses and for the consolidation of facilities. The following table presents the restructuring, integration and other expenses incurred during fiscal
2014
:
|
|
Year Ended
|
||
|
|
June 28, 2014
|
||
|
|
(Thousands)
|
||
|
Restructuring expenses
|
$
|
65,749
|
|
|
Integration costs
|
20,455
|
|
|
|
Other costs including acquisition costs
|
8,767
|
|
|
|
Changes in estimates for prior year restructuring liabilities
|
(348
|
)
|
|
|
Restructuring, integration and other expenses before tax
|
$
|
94,623
|
|
|
Restructuring, integration and other expenses after tax
|
$
|
70,773
|
|
|
Restructuring, integration and other expenses per share on a diluted basis
|
$
|
0.50
|
|
71
AVNET, INC. AND SUBSIDIARIES
NOTES TO CONSOLIDATED FINANCIAL STATEMENTS — (Continued)
The activity related to the restructuring liabilities established during fiscal
2014
is presented in the following table:
|
Severance
|
Facility
Exit Costs and Asset Impairments
|
Other
|
Total
|
||||||||||||
|
|
(Thousands)
|
||||||||||||||
|
Fiscal 2014 restructuring expenses
|
$
|
53,260
|
|
$
|
11,608
|
|
$
|
881
|
|
$
|
65,749
|
|
|||
|
Cash payments
|
(29,191
|
)
|
(3,028
|
)
|
(9
|
)
|
(32,228
|
)
|
|||||||
|
Non-cash amounts
|
(260
|
)
|
(4,906
|
)
|
(538
|
)
|
(5,704
|
)
|
|||||||
|
Other, principally foreign currency translation
|
(65
|
)
|
23
|
|
10
|
|
(32
|
)
|
|||||||
|
Balance at June 28, 2014
|
$
|
23,744
|
|
$
|
3,697
|
|
$
|
344
|
|
$
|
27,785
|
|
|||
Severance expense recorded in fiscal
2014
related to the reduction, or planned reduction, of over
1,100
employees, primarily in operations, sales and business support functions, in connection with cost reduction actions taken in both operating groups, including reductions in recently acquired or integrated businesses. Facility exit costs primarily consists of liabilities for remaining lease obligations and the impairment of long-lived assets for facilities and information technology systems the Company has ceased using. Other restructuring costs related primarily to other miscellaneous restructuring and exit costs. Of the
$65.7 million
in restructuring expenses recorded during fiscal
2014
,
$41.3 million
related to EM,
$23.1 million
related to TS and
$1.3 million
related to corporate business support functions. As of
June 28, 2014
, management expects the majority of the remaining severance, facility exit costs and other liabilities to be paid by the end of fiscal 2015.
Integration costs are primarily related to the integration of acquired businesses, integration of regional business units and incremental costs incurred as part of the consolidation, relocation and closure of warehouse and office facilities. Integration costs include consulting costs for information technology system and business operation integration assistance, facility moving costs, legal fees, travel, meeting, marketing and communication costs that are incrementally incurred as a result of such integration activities. Also included in integration costs are incremental salary costs specific to integration, consolidation and closure activities. Other costs consists primarily of professional fees incurred for acquisitions, additional costs incurred for businesses divested or exited in current or prior periods, any ongoing facilities operating costs associated with the consolidation, relocation and closure of facilities once such facilities have been vacated or substantially vacated, and other miscellaneous costs that relate to restructuring, integration and other expenses. Integration and other costs in fiscal
2014
were comprised of many different costs, none of which were individually material.
Fiscal 2013
During fiscal 2013, the Company incurred restructuring expenses related to various restructuring actions intended to reduce costs in response to the then current market conditions. The following table presents the restructuring, integration and other expenses incurred during fiscal 2013:
|
|
Year Ended
|
||
|
|
June 29, 2013
|
||
|
|
(Thousands)
|
||
|
Restructuring expenses
|
$
|
120,048
|
|
|
Integration costs
|
35,742
|
|
|
|
Other costs including acquisition costs
|
(3,224
|
)
|
|
|
Changes in estimates for prior year restructuring liabilities
|
(3,065
|
)
|
|
|
Restructuring, integration and other expenses before tax
|
$
|
149,501
|
|
|
Restructuring, integration and other expenses after tax
|
$
|
116,382
|
|
|
Restructuring, integration and other expenses per share on a diluted basis
|
$
|
0.83
|
|
72
AVNET, INC. AND SUBSIDIARIES
NOTES TO CONSOLIDATED FINANCIAL STATEMENTS — (Continued)
The fiscal
2014
activity related to the remaining restructuring liabilities established during fiscal 2013 is presented in the following table:
|
Severance
|
Facility
Exit Costs and Asset Impairments |
Other
|
Total
|
||||||||||||
|
|
(Thousands)
|
||||||||||||||
|
Balance at June 29, 2013
|
$
|
25,254
|
|
$
|
16,211
|
|
$
|
370
|
|
$
|
41,835
|
|
|||
|
Cash payments
|
(20,137
|
)
|
(7,672
|
)
|
(326
|
)
|
(28,135
|
)
|
|||||||
|
Changes in estimates, net
|
(2,283
|
)
|
(1,601
|
)
|
963
|
|
(2,921
|
)
|
|||||||
|
Non-cash amounts
|
—
|
|
928
|
|
(485
|
)
|
443
|
|
|||||||
|
Other, principally foreign currency translation
|
166
|
|
408
|
|
89
|
|
663
|
|
|||||||
|
Balance at June 28, 2014
|
$
|
3,000
|
|
$
|
8,274
|
|
$
|
611
|
|
$
|
11,885
|
|
|||
Of the
$120.0 million
in restructuring expenses recorded during fiscal 2013,
$68.9 million
related to EM,
$48.0 million
related to TS and
$3.1 million
related to corporate business support functions. As of
June 28, 2014
, management expects the majority of the remaining severance, facility exit and other liabilities to be utilized by the end of fiscal
2015
.
Integration costs incurred related primarily to the integration of acquired businesses and incremental costs incurred as part of the consolidation and closure of certain office and warehouse facilities.
Other costs incurred during fiscal 2013 related primarily to professional fees for advisory services and legal and accounting due diligence procedures and other legal costs associated with acquisitions. Included in other costs is a benefit of
$11.2 million
related to a change in estimate for a contingent consideration liability for which payment was no longer expected.
Fiscal 2012
During fiscal 2012, the Company incurred expenses to reduce costs, including costs related to the acquisition and integration activities associated with acquired businesses as follows:
|
|
Year Ended
|
||
|
|
June 30, 2012
|
||
|
|
(Thousands)
|
||
|
Restructuring expenses
|
$
|
50,253
|
|
|
Integration costs
|
9,392
|
|
|
|
Other costs including acquisition costs
|
17,226
|
|
|
|
Changes in estimates for prior year restructuring liabilities
|
(3,286
|
)
|
|
|
Restructuring, integration and other expenses before tax
|
$
|
73,585
|
|
|
Restructuring, integration and other expenses after tax
|
$
|
52,963
|
|
|
Restructuring, integration and other expenses per share on a diluted basis
|
$
|
0.35
|
|
Of the
$50.3 million
in restructuring expenses recorded during fiscal 2012,
$27.5 million
related to EM and
$22.8 million
related to TS.
Integration costs incurred related primarily to the integration of acquired businesses and incremental costs incurred as part of the consolidation and closure of certain office and warehouse facilities.
Other costs incurred during fiscal 2012 related primarily to professional fees for advisory and broker services, legal and accounting due diligence, and other legal costs associated with acquisitions. Other costs also included
$6.7 million
for legal claims associated with acquired and divested businesses.
73
AVNET, INC. AND SUBSIDIARIES
NOTES TO CONSOLIDATED FINANCIAL STATEMENTS — (Continued)
As of June 29, 2013, there was
$4.7 million
of restructuring liabilities remaining related to restructuring actions taken in fiscal years 2012 and prior, the majority of which relates to facility exit costs. The remaining balance for such historical restructuring liabilities as of June 28, 2014 was
$1.2 million
, which is expected to be paid by the end of fiscal
2016
.
74
SCHEDULE II
AVNET, INC. AND SUBSIDIARIES
VALUATION AND QUALIFYING ACCOUNTS
Years Ended
June 28, 2014
,
June 29, 2013
and
June 30, 2012
|
Account Description
|
Balance at Beginning of Period
|
Charged to Expense (Income)
|
|
Charged to Other Accounts
|
|
Deductions
|
|
Balance at End of Period
|
||||||||||||
|
|
(Thousands)
|
|||||||||||||||||||
|
Fiscal 2014
|
|
|
|
|
|
|
|
|
||||||||||||
|
Allowance for doubtful accounts
|
$
|
95,656
|
|
$
|
17,943
|
|
|
$
|
—
|
|
|
$
|
(17,217
|
)
|
(a)
|
$
|
96,382
|
|
||
|
Valuation allowance on foreign tax loss carry-forwards (Note 9)
|
230,821
|
|
(52,719
|
)
|
(b)
|
4,021
|
|
(c)
|
—
|
|
|
182,123
|
|
|||||||
|
Fiscal 2013
|
|
|
|
|
|
|
|
|
||||||||||||
|
Allowance for doubtful accounts
|
106,319
|
|
30,802
|
|
|
—
|
|
|
(41,465
|
)
|
(a)
|
95,656
|
|
|||||||
|
Valuation allowance on foreign tax loss carry-forwards (Note 9)
|
244,093
|
|
(41,572
|
)
|
(d)
|
28,300
|
|
(e)
|
—
|
|
|
230,821
|
|
|||||||
|
Fiscal 2012
|
|
|
|
|
|
|
|
|
||||||||||||
|
Allowance for doubtful accounts
|
107,739
|
|
35,632
|
|
|
—
|
|
(37,052
|
)
|
(a)
|
106,319
|
|
||||||||
|
Valuation allowance on foreign tax loss carry-forwards (Note 9)
|
310,772
|
|
(30,785
|
)
|
|
(35,894
|
)
|
(f)
|
—
|
|
|
244,093
|
|
|||||||
|
(a)
|
Uncollectible receivables written off.
|
|
(b)
|
Represents a reduction primarily due to the release of valuation allowance in EMEA, of which
$39.6 million
impacted the effective tax rate offset by
$6.0 million
, which impacted deferred taxes associated with the release of the valuation allowance (see Note 9).
|
|
(c)
|
Primarily related to rate changes on valuation allowances previously established in various foreign jurisdictions.
|
|
(d)
|
Represents a reduction primarily due to the release of valuation allowance in EMEA, of which
$31.9 million
impacted the effective tax rate offset by
$4.8 million
, which impacted deferred taxes associated with the release of the valuation allowance (see Note 9).
|
|
(e)
|
Primarily related to additional valuation allowances for newly acquired companies and companies with a history of losses.
|
|
(f)
|
Primarily relates to the translation impact of changes in foreign currency exchange rates and acquired valuation allowances.
|
75
INDEX TO EXHIBITS
|
Exhibit
Number
|
Exhibit
|
|
|
|
|
|
|
3.1
|
|
Restated Certificate of Incorporation of the Company (incorporated herein by reference to the Company's Current Report on Form 8-K dated February 12, 2001, Exhibit 3(i)).
|
|
|
|
|
|
3.2
|
|
By-laws of the Company, effective May 9, 2014 (incorporated herein by reference to the Company's Current Report on Form 8-K dated May 9, 2014, Exhibit 3.1).
|
|
|
|
|
|
4.1
|
|
Indenture dated as of March 5, 2004, by and between the Company and JP Morgan Trust Company, National Association (incorporated herein by reference to the Company’s Current Report on Form 8-K dated March 5, 2004, Exhibit 4.1).
|
|
|
|
|
|
4.2
|
|
Officers' Certificate dated August 19, 2005, establishing the terms of the 6.00% Notes due 2015 (incorporated herein by reference to the Company's Current Report on Form 8-K dated August 15, 2005, Exhibit 4.2).
|
|
|
|
|
|
4.3
|
|
Officers' Certificate dated September 12, 2006, establishing the terms of the 6.625% Notes due 2016 (incorporated herein by reference to the Company's Current Report on Form 8-K dated September 12, 2006, Exhibit 4.2).
|
|
|
|
|
|
4.4
|
|
Officers’ Certificate dated March 7, 2007, establishing the terms of the 5 7/8% Notes due 2014 (incorporated herein by reference to the Company’s Current Report on Form 8-K dated March 7, 2007, Exhibit 4.2).
|
|
|
|
|
|
4.5
|
|
Indenture dated as of June 22, 2010, between the Company and Wells Fargo Bank, National Association, as Trustee, providing for the issuance of Debt Securities in one or more series (incorporated herein by reference to the Company’s Current Report on Form 8-K dated June 18, 2010, Exhibit 4.1).
|
|
|
|
|
|
4.6
|
|
Officers’ Certificate establishing the terms of the 5.875% Notes due 2020 (incorporated herein by reference to the Company’s Current Report on Form 8-K dated June 18, 2010, Exhibit 4.2).
|
|
|
|
|
|
4.7
|
Officers' Certificate establishing the terms of the 4.875% Notes due 2022 (incorporated herein by reference to the Company's Current Report on Form 8-K dated November 20, 2012, Exhibit 4.1).
|
|
|
|
|
Note: The total amount of securities authorized under any other instrument that defines the rights of holders of the Company’s long-term debt does not exceed 10% of the total assets of the Company and its subsidiaries on a consolidated basis. Therefore, these instruments are not required to be filed as exhibits to this Report. The Company agrees to furnish copies of such instruments to the Commission upon request.
|
|
|
|
|
|
|
|
Executive Compensation Plans and Arrangements
|
|
|
|
|
|
10.1
|
|
2011 Amended and Restated Employment Agreement between the Company and Richard Hamada (incorporated herein by reference to the Company’s Current Report on Form 8-K dated February 14, 2011, Exhibit 10.2).
|
|
|
|
|
|
10.2
|
|
Form of Employment Agreement by and between the Company and Gerry Fay and Erin Lewin (incorporated herein by reference to the Registrant's Form 10-K for the fiscal year ended June 29, 2013, Exhibit 10.3).
|
|
|
|
|
|
10.3
|
Employment Agreement by and between the Company and Phillip Gallagher (incorporated herein by reference to the Registrant's Form 10-Q for the period ended December 28, 2013, Exhibit 10.2).
|
|
|
|
|
|
|
10.4
|
|
Employment Agreement by and between Kevin Moriarty and the Company (incorporated herein by reference to the Company's Current Report on Form 8-K dated September 1, 2013, Exhibit 10.1).
|
|
|
|
|
|
10.5
|
Employment Agreement by and between the Company and Steve Phillips (incorporated herein by reference to the Company's Current Report on Form 8-K dated December 19, 2008, Exhibit 10.2).
|
|
|
10.6
|
|
Employment Agreement by and between the Company and Harley Feldberg (incorporated herein by reference to the Company’s Annual Report on Form 10-K for the fiscal year ended June 29, 2013, Exhibit 10.5).
|
|
10.7
|
Form of Change of Control Agreement between the Company Richard Hamada, Gerry Fay, Erin Lewin, Kevin Moriarty and Steve Phillips (incorporated herein by reference to the Company’s Current Report on Form 8-K dated February 14, 2011, Exhibit 10.3).
|
|
|
10.8
|
Form of Change of Control Agreement between the Company and each of Harley Feldberg, Phillip Gallagher and MaryAnn Miller, (incorporated herein by reference to the Company's Current Report on Form 8-K dated December 19, 2008, Exhibit 10.3).
|
|
76
|
Exhibit
Number
|
Exhibit
|
|
|
|
|
|
|
10.9
|
Avnet 1996 Incentive Stock Option Plan (incorporated herein by reference to the Company’s Registration Statement on Form S-8, Registration No. 333-17271, Exhibit 99).
|
|
|
|
|
|
|
10.10
|
Amended and Restated Avnet 1997 Stock Option Plan (incorporated herein by reference to the Company’s Current Report on Form 8-K dated August 29, 2006, Exhibit 10.1).
|
|
|
|
|
|
|
10.11
|
Retirement Plan for Outside Directors of Avnet, Inc., (Amended and Restated Effective Generally as of January 1, 2009) (incorporated herein by reference to the Company’s Current Report on Form 8-K dated August 13, 2010, Exhibit 10.1).
|
|
|
|
|
|
|
10.12
|
Avnet, Inc. Deferred Compensation Plan for Outside Directors (Amended and Restated Effective Generally as of January 1, 2009) (incorporated herein by reference to the Company’s Current Report on Form 8-K dated August 13, 2010, Exhibit 10.2).
|
|
|
|
|
|
|
10.13
|
Avnet Supplemental Executive Officers’ Retirement Plan (2013 Restatement) (incorporated herein by reference to the Registrant's Form 10-K for the fiscal year ended June 29, 2013, Exhibit 10.13).
|
|
|
10.14
|
Avnet Restoration Plan (2013 Restatement) (incorporated herein by reference to the Registrant's Form 10-K for the fiscal year ended June 29, 2013, Exhibit 10.14).
|
|
|
|
|
|
|
10.15
|
Avnet 1999 Stock Option Plan (incorporated herein by reference to the Company’s Current Report on Form 8-K dated August 29, 2006 Exhibit 10.2).
|
|
|
|
|
|
|
10.16
|
Avnet, Inc. 2003 Stock Compensation Plan (Amended and Restated Effective Generally as of January 1, 2009) (incorporated herein by reference to the Company’s Current Report on Form 8-K dated August 13, 2010, Exhibit 10.4).
|
|
|
|
|
|
|
10.17
|
Avnet, Inc. 2003 Stock Compensation Plan:
|
|
|
|
(a) Form of nonqualified stock option agreement
|
|
|
|
(b) Form of nonqualified stock option agreement for non-employee director
|
|
|
|
(c) Form of incentive stock option agreement
|
|
|
|
(d) Form of performance stock unit term sheet
|
|
|
|
|
|
|
|
(incorporated herein by reference to the Company’s Current Report on Form 8-K dated August 29, 2006, Exhibit 10.3).
|
|
|
|
|
|
|
10.18
|
Avnet, Inc. 2006 Stock Compensation Plan (Amended and Restated Effective Generally as of January 1, 2009) (incorporated herein by reference to the Company’s Current Report on Form 8-K dated August 13, 2010, Exhibit 10.5).
|
|
|
|
|
|
|
10.19
|
Avnet, Inc. 2006 Stock Compensation Plan:
|
|
|
|
(a) Form of nonqualified stock option agreement
|
|
|
|
(b) Form of nonqualified stock option agreement for non-employee director
|
|
|
|
(c) Form of performance stock unit term sheet (revised effective August 13, 2009 by (f) below)
|
|
|
|
(d) Form of incentive stock option agreement
|
|
|
|
(e) Long Term Incentive Letter
|
|
|
|
|
|
|
|
(incorporated herein by reference to the Company’s Current Report on Form 8-K dated May 16, 2007, Exhibit 99.1).
|
|
|
|
|
|
|
|
(f) Form of performance stock unit term sheet (incorporated herein by reference to the Company’s Current Report on Form 8-K dated August 19, 2009, Exhibit 99.1).
|
|
|
|
|
|
|
10.20
|
Avnet, Inc. 2010 Stock Compensation Plan (incorporated herein by reference to Exhibit 10.1 to the Company’s Registration Statement on Form S-8, Registration No. 333-171291).
|
|
|
|
|
|
|
10.21
|
|
Avnet, Inc. 2010 Stock Compensation Plan:
|
|
|
|
(a) Form of nonqualified stock option agreement
|
|
|
|
(b) Form of incentive stock option agreement
|
|
|
|
(c) Form of performance stock unit term sheet
|
|
|
|
(d) Form of restricted stock unit term sheet
|
|
|
|
|
77
|
Exhibit
Number
|
Exhibit
|
|
|
|
|
(incorporated herein by reference to the Company’s Current Report on Form 8-K dated August 10, 2012, Exhibit 10.1).
|
|
|
|
|
|
10.22
|
Avnet, Inc. 2013 Stock Compensation and Incentive Plan (incorporated herein by reference to the Registrant's Current Report on Form 8-K dated November 8, 2013, Exhibit 10.1).
|
|
|
10.23
|
*
|
Avnet, Inc. 2013 Stock Compensation and Incentive Plan:
|
|
(a) Form of incentive stock option agreement
|
||
|
(b) Form of nonqualified stock option agreement
|
||
|
(c) Form of performance stock unit term sheet
|
||
|
(d) Form of restricted stock unit term sheet
|
||
|
10.24
|
|
Avnet Deferred Compensation Plan (Amended and Restated Effective Generally as of January 1, 2009) (incorporated herein by reference to the Company’s Current Report on Form 8-K dated August 13, 2010, Exhibit 10.6).
|
|
|
|
|
|
10.25
|
Amendment No. 1 to Avnet Deferred Compensation Plan (Amended and Restated Effective Generally as of January 1, 2009) (incorporated herein by reference to the Company's Annual Report on Form 10-K for the fiscal year ended July 2, 2011, Exhibit 10.21).
|
|
|
|
|
|
|
10.26
|
|
Form of Indemnity Agreement. The Company enters into this form of agreement with each of its directors and officers (incorporated herein by reference to the Company’s Quarterly Report on Form 10-Q for the period ended April 1, 2006, Exhibit 10.1).
|
|
|
|
|
|
10.27
|
|
Form option agreements for stock option plans (incorporated herein by reference to the Company’s Current Report on Form 8-K dated September 8, 2004, Exhibit 10.4).
|
|
|
|
(a) Non-Qualified stock option agreement for 1999 Stock Option Plan
|
|
|
|
(b) Incentive stock option agreement for 1999 Stock Option Plan
|
|
|
|
(c) Incentive stock option agreement for 1996 Stock Option Plan
|
|
|
|
(d) Non-Qualified stock option agreement for 1995 Stock Option Plan
|
|
|
|
|
|
|
|
Bank Agreements
|
|
|
|
|
|
10.28
|
|
Securitization Program
|
|
|
|
|
|
|
|
(a) Receivables Sale Agreement, dated as of June 28, 2001 between Avnet, Inc., as Originator, and Avnet Receivables Corporation as Buyer (incorporated herein by reference to the Company’s Current Report on Form 8-K dated September 26, 2002, Exhibit 10J).
|
|
|
|
|
|
|
|
(b) Amendment No. 1, dated as of February 6, 2002, to Receivables Sale Agreement in 10.27(a) above (incorporated herein by reference to the Company’s Current Report on Form 8-K dated September 26, 2002, Exhibit 10K).
|
|
|
|
|
|
|
|
(c) Amendment No. 2, dated as of June 26, 2002, to Receivables Sale Agreement in 10.27(a) above (incorporated herein by reference to the Company’s Current Report on Form 8-K dated September 26, 2002, Exhibit 10L).
|
|
|
|
|
|
|
|
(d) Amendment No. 3, dated as of November 25, 2002, to Receivables Sale Agreement in 10.27(a) above (incorporated herein by reference to the Company’s Current Report on Form 8-K dated December 17, 2002, Exhibit 10B).
|
|
|
|
|
|
|
|
(e) Amendment No. 4, dated as of December 12, 2002, to Receivables Sale Agreement in 10.27(a) above (incorporated herein by reference to the Company’s Current Report on Form 8-K dated December 17, 2002, Exhibit 10E).
|
|
|
|
|
|
|
|
(f) Amendment No. 5, dated as of August 15, 2003, to Receivables Sale Agreement in 10.27(a) above (incorporated herein by reference to the Company’s Current Report on Form 8-K dated September 15, 2003, Exhibit 10C).
|
|
|
|
|
|
|
|
(g) Amendment No. 6, dated as of August 3, 2005, to Receivables Sale Agreement in 10.27(a) above (incorporated herein by reference to the Company’s Current Report on Form 8-K dated September 13, 2005, Exhibit 10.1).
|
|
|
|
|
78
|
Exhibit
Number
|
Exhibit
|
|
|
|
|
(h) Amendment No. 7, dated as of August 29, 2007, to Receivables Sale Agreement in 10.27(a) above (incorporated herein by reference to the Company’s Current Report on Form 8-K dated August 13, 2010, Exhibit 10.7).
|
|
|
|
|
|
|
|
(i) Amendment No. 8, dated as of August 26, 2010, to Receivables Sale Agreement in 10.27(a) above (incorporated herein by reference to the Company’s Current Report on Form 8-K dated September 1, 2010, Exhibit 10.2).
|
|
|
|
|
|
|
|
(j) Second Amended and Restated Receivables Purchase Agreement dated as of August 26, 2010 among Avnet Receivables Corporation, as Seller, Avnet, Inc., as Servicer, the Financial Institutions party thereto and JPMorgan Chase Bank, N.A. as Agent (incorporated herein by reference to the Company’s Current Report on Form 8-K dated September 1, 2010, Exhibit 10.1).
|
|
|
|
|
|
|
|
(k) Amendment No. 1, dated as of December 28, 2010, to the Second Amended and Restated Receivables Purchase Agreement in 10.27(j) above (incorporated herein by reference to the Company’s Quarterly Report on Form 10-Q for the period ended October 1, 2011, Exhibit 10.2).
|
|
|
|
|
|
|
(l) Amendment No. 2, dated as of August 25, 2011, to the Second Amended and Restated Receivables Purchase Agreement in 10.27(j) above (incorporated herein by reference to the Company's Current Report on Form 8-K dated August 26, 2011, Exhibit 10.1).
|
|
|
(m) Amendment No. 3 dated as of March 7, 2012, to the Second Amended and Restated Receivables Purchase Agreement in 10.27(j) above (incorporated herein by reference to the Company's Quarterly Report on Form 10-Q for the period ended March 31, 2012, Exhibit 10.1).
|
||
|
|
|
|
|
(n) Amendment No. 4 dated as of August 23, 2012, to the Second Amended and Restated Receivables Purchase Agreement in 10.27(j) above (incorporated herein by reference to the Company's Current Report on Form 8-K dated August 24, 2012, Exhibit 10.1).
|
||
|
(o) Amendment No. 5 dated as of August 22, 2013 to the Second Amended and Restated Receivables Purchase Agreement (incorporated herein by reference to the Company's Current Report on Form 8-K dated August 22, 2013, Exhibit 10.1).
|
||
|
10.29
|
|
Credit Agreement dated as of November 18, 2011 among Avnet, Inc., Bank of America, N.A., as Administrative Agent, and each lender thereto (incorporated herein by reference to the Company’s Current Report on Form 8-K dated November 22, 2011, Exhibit 10.1).
|
|
|
|
|
|
12.1
|
*
|
Ratio of Earnings to Fixed Charges.
|
|
|
|
|
|
21
|
*
|
List of subsidiaries of the Company as of June 29, 2013.
|
|
|
|
|
|
23.1
|
*
|
Consent of KPMG LLP.
|
|
|
|
|
|
31.1
|
*
|
Certification pursuant to Section 302 of the Sarbanes-Oxley Act of 2002.
|
|
|
|
|
|
31.2
|
*
|
Certification pursuant to Section 302 of the Sarbanes-Oxley Act of 2002.
|
|
|
|
|
|
32.1
|
**
|
Certification pursuant to Section 906 of the Sarbanes-Oxley Act of 2002.
|
|
|
|
|
|
32.2
|
**
|
Certification pursuant to Section 906 of the Sarbanes-Oxley Act of 2002.
|
|
|
|
|
|
101.INS
|
**
|
XBRL Instance Document.
|
|
|
|
|
|
101.SCH
|
**
|
XBRL Taxonomy Extension Schema Document.
|
|
|
|
|
|
101.CAL
|
**
|
XBRL Taxonomy Extension Calculation Linkbase Document.
|
|
|
|
|
|
101.LAB
|
**
|
XBRL Taxonomy Extension Label Linkbase Document.
|
|
|
|
|
|
101.PRE
|
**
|
XBRL Taxonomy Extension Presentation Linkbase Document.
|
|
|
|
|
|
101.DEF
|
**
|
XBRL Taxonomy Extension Definition Linkbase Document.
|
|
*
|
Filed herewith.
|
|
|
|
|
**
|
Furnished herewith.
|
79
TABLE OF CONTENTS
Part IItem 1. BusinessItem 1A. Risk FactorsItem 1B. Unresolved Staff CommentsItem 2. PropertiesItem 3. Legal ProceedingsItem 4. Mine Safety DisclosuresPart IIItem 5. Market For Registrant S Common Equity, Related Stockholder Matters and Issuer Purchases Of Equity SecuritiesItem 6. Selected Financial DataItem 7. Management S Discussion and Analysis Of Financial Condition and Results Of OperationsItem 7A. Quantitative and Qualitative Disclosures About Market RiskItem 8. Financial Statements and Supplementary DataItem 9. Changes in and Disagreements with Accountants on Accounting and Financial DisclosureItem 9A. Controls and ProceduresItem 9B. Other InformationPart IIIItem 10. Directors, Executive Officers and Corporate GovernanceItem 11. Executive CompensationItem 12. Security Ownership Of Certain Beneficial Owners and Management and Related Stockholder MattersItem 13. Certain Relationships and Related Transactions, and Director IndependenceItem 14. Principal Accounting Fees and ServicesPart IVItem 15. Exhibits and Financial Statement Schedules