UNITED STATES SECURITIES AND EXCHANGE COMMISSION
Washington, D.C. 20549
FORM
10-K
☒ ANNUAL REPORT PURSUANT TO SECTION 13 OR 15(d) OF THE SECURITIES EXCHANGE ACT OF 1934
For the fiscal year ended
December 31, 2019
☐ TRANSITION REPORT PURSUANT TO SECTION 13 OR 15(d) OF THE SECURITIES EXCHANGE ACT OF 1934
For the transition period from __________ to __________
Commission file number:
001-38912

Avantor, Inc.
(Exact name of registrant as specified in its charter)
|
Delaware
|
82-2758923
|
|
(State or other jurisdiction of incorporation or organization)
|
(I.R.S. employer identification no.)
|
Radnor Corporate Center, Building One, Suite 200
100 Matsonford Road
Radnor, Pennsylvania 19087
(Address of principal executive offices) (zip code)
(610) 386-1700
(Registrant’s telephone number, including area code)
Securities registered pursuant to Section 12(b) of the Act:
|
Title of each class
|
Trading symbol
|
Exchange on which registered
|
||
|
Common Stock, $0.01 par value
|
AVTR
|
New York Stock Exchange
|
||
|
6.250% Series A Mandatory Convertible Preferred Stock, $0.01 par value
|
AVTR PRA
|
New York Stock Exchange
|
||
Securities registered pursuant to Section 12(g) of the Act:
None
Indicate
by check mark if the registrant is a well-known seasoned issuer, as defined in Rule 405 of the Securities Act.
☐ Yes ☒
No
Indicate by check mark if the registrant is not required to file reports pursuant to Section 13 or Section 15(d) of the Act.
☐ Yes ☒
No
Indicate by check mark whether the registrant (1) has filed all reports required to be filed by Section 13 or 15(d) of the Securities Exchange Act of 1934 during the preceding 12 months (or for such shorter period that the registrant was required to file such reports), and (2) has been subject to such filing requirements for the past 90 days. ☒
Yes
☐ No
Indicate by check mark whether the registrant has submitted electronically every Interactive Data File required to be submitted pursuant to Rule 405 of Regulation S-T (§232.405 of this chapter) during the preceding 12 months (or for such shorter period that the registrant was required to submit such files). ☒
Yes
☐ No
Indicate by check mark whether the registrant is a large accelerated filer, an accelerated filer, a non-accelerated filer, a smaller reporting company, or an emerging growth company. See the definitions of “large accelerated filer,” “accelerated filer,” “smaller reporting company,” and “emerging growth company” in Rule 12b-2 of the Exchange Act. ☐ Large Accelerated Filer ☐ Accelerated Filer ☒
Non-accelerated Filer
☐ Smaller reporting company ☐ Emerging growth company
If an emerging growth company, indicate by check mark if the registrant has elected not to use the extended transition period for complying with any new or revised financial accounting standards provided pursuant to Section 13(a) of the Exchange Act. ☐
Indicate by check mark whether the registrant is a shell company (as defined in Rule 12b-2 of the Exchange Act). ☐ Yes ☒ No
The aggregate market value of common stock held by our non-affiliates at June 30,
2019
was
$10,857,025,862
.
On
January 31, 2020
,
572,905,391
shares of common stock, $0.01 par value per share, were outstanding.
DOCUMENTS INCORPORATED BY REFERENCE
Portions of our definitive proxy statement for our 2020 annual meeting of stockholders will be filed with the SEC on or before 120 days after our 2019 fiscal year-end and are incorporated by reference into Part III of this report.
Avantor, Inc. and subsidiaries
Form 10-K for the fiscal year ended
December 31, 2019
Table of contents
|
Page
|
||
i
Glossary
|
Description
|
|
|
we, us, our
|
Avantor, Inc. and its subsidiaries
|
|
Legacy Avantor Plan
|
the Avantor Funding, Inc. (f/k/a Avantor, Inc.) Equity Incentive Plan
|
|
Vail Plan
|
the Avantor, Inc. (f/k/a Vail Holdco Corp) Equity Incentive Plan
|
|
2019 Plan
|
the Avantor, Inc. 2019 Equity Incentive Plan
|
|
AMEA
|
Asia, Middle-East and Africa
|
|
AOCI
|
accumulated other comprehensive income or loss
|
|
APAC
|
Asia Pacific
|
|
BIS
|
the Bureau of Industry and Security
|
|
CERCLA
|
the Comprehensive Environmental Response Compensation and Liability Act
|
|
cGMP
|
Current Good Manufacturing Practice
|
|
DDTC
|
Directorate of Defense Trade controls
|
|
DEA
|
Drug Enforcement Administration
|
|
DHHS
|
Department of Health and Human Service
|
|
EMA
|
European Medicines Agency
|
|
EPA
|
the U.S. Environmental Protection Agency
|
|
ERP
|
enterprise resource planning system
|
|
EU
|
European Union
|
|
EURIBOR
|
the basic rate of interest used in lending between banks on the European Union interbank market
|
|
FASB
|
the Financial Accounting Standards Board of the United States
|
|
FCPA
|
the United States Foreign Corrupt Practices Act
|
|
FDA
|
United States Food and Drug Administration
|
|
GAAP
|
United States generally accepted accounting principles
|
|
GDPR
|
the General Data Protection Regulation
|
|
Goldman Sachs
|
an investment banking firm and its affiliates
|
|
high single-digit
|
7 - 9%
|
|
IPO
|
initial public offering
|
|
ISO
|
International Organization for Standardization or international equivalents
|
|
ITAR
|
the International Traffic In Arms Regulations
|
ii
|
Description
|
|
|
LIBOR
|
the basic rate of interest used in lending between banks on the London interbank market
|
|
low double-digit
|
10 - 19%
|
|
low single-digit
|
1 - 3%
|
|
Management EBITDA
|
earnings before interest, income taxes, depreciation, amortization and certain other items, our segment profitability measurement under GAAP
|
|
MCPS
|
6.250% Series A Mandatory Convertible Preferred Stock
|
|
mid single-digit
|
4 - 6%
|
|
NCI
|
noncontrolling interest
|
|
New Mountain Capital
|
a private equity investor and its affiliates
|
|
NuSil
|
NuSil Acquisition Corp, NuSil Investments LLC and subsidiaries, a business organization with which we merged in 2016
|
|
NuSil Investors
|
NuSil LLC and NuSil 2.0 LLC, former owners of NuSil that are controlled by its former management
|
|
NYSE
|
the New York Stock Exchange
|
|
OFAC
|
the U.S. Department of The Treasury’s Office of Foreign Assets Control
|
|
OSHA
|
the U.S. Occupational Safety & Health Administration
|
|
PSP Investments
|
a pension investment manager and its affiliates
|
|
Registration Statement
|
our registration statement on Form S-1 (File No. 333-229578), as amended
|
|
RSU
|
restricted stock unit
|
|
SAR
|
stand alone appreciation right
|
|
SEC
|
the United States Securities and Exchange Commission
|
|
SG&A expenses
|
selling, general and administrative expenses
|
|
specialty procurement
|
product sales related to customer procurement services
|
|
VWR
|
VWR Corporation and its subsidiaries, a company we acquired in November 2017
|
iii
Cautionary factors regarding forward-looking statements
This report contains forward-looking statements. All statements other than statements of historical fact included in this report are forward-looking statements. Forward-looking statements discuss our current expectations and projections relating to our financial condition, results of operations, plans, objectives, future performance and business. These statements may be preceded by, followed by or include the words “aim,” “anticipate,” “believe,” “estimate,” “expect,” “forecast,” “intend,” “likely,” “outlook,” “plan,” “potential,” “project,” “projection,” “seek,” “can,” “could,” “may,” “should,” “would,” “will,” the negatives thereof and other words and terms of similar meaning.
Forward-looking statements are inherently subject to risks, uncertainties and assumptions; they are not guarantees of performance. You should not place undue reliance on these statements. We have based these forward-looking statements on our current expectations and projections about future events. Although we believe that our assumptions made in connection with the forward-looking statements are reasonable, we cannot assure you that the assumptions and expectations will prove to be correct.
You should understand that the following important factors, in addition to those discussed under Item 1A, “Risk Factors,” could affect our future results and could cause those results or other outcomes to differ materially from those expressed or implied in our forward-looking statements:
|
•
|
disruptions to our operations;
|
|
•
|
competition from other industry providers;
|
|
•
|
our ability to implement our growth strategy;
|
|
•
|
our ability to anticipate and respond to changing industry trends;
|
|
•
|
adverse trends in consumer, business, and government spending;
|
|
•
|
our dependence on sole or limited sources for some essential materials and components;
|
|
•
|
our ability to successfully value and integrate acquired businesses;
|
|
•
|
our products’ satisfaction of applicable quality criteria, specifications and performance standards;
|
|
•
|
our ability to maintain our relationships with key customers;
|
|
•
|
our ability to maintain our relationships with distributors;
|
|
•
|
our ability to maintain consistent purchase volumes under purchase orders;
|
|
•
|
our ability to maintain and develop relationships with drug manufacturers and contract manufacturing organizations;
|
iv
|
•
|
the impact of new laws, regulations, or other industry standards;
|
|
•
|
changes in the interest rate environment that increase interest on our borrowings;
|
|
•
|
adverse impacts from currency exchange rates or currency controls imposed by any government in major areas where we operate or otherwise;
|
|
•
|
our ability to implement and improve processing systems and prevent a compromise of our information systems;
|
|
•
|
our ability to protect our intellectual property and avoid third-party infringement claims;
|
|
•
|
exposure to product liability and other claims in the ordinary course of business;
|
|
•
|
our ability to develop new products responsive to the markets we serve;
|
|
•
|
the availability of raw materials;
|
|
•
|
our ability to avoid negative outcomes related to the use of chemicals;
|
|
•
|
our ability to maintain highly skilled employees;
|
|
•
|
adverse impact of impairment charges on our goodwill and other intangible assets;
|
|
•
|
fluctuations and uncertainties related to doing business outside the United States;
|
|
•
|
our ability to obtain and maintain required regulatory clearances or approvals may constrain the commercialization of submitted products;
|
|
•
|
our ability to comply with environmental, health and safety laws and regulations, or the impact of any liability or obligation imposed under such laws or regulations;
|
|
•
|
our substantial indebtedness could adversely affect our financial condition and prevent us from fulfilling our debt or contractual obligations;
|
|
•
|
our ability to generate sufficient cash flows or access sufficient additional capital to meet our debt obligations or to fund our other liquidity needs; and
|
|
•
|
our ability to maintain an adequate system of internal control over financial reporting.
|
All forward-looking statements attributable to us or persons acting on our behalf are expressly qualified in their entirety by the foregoing cautionary statements. In addition, all forward-looking statements speak only as of the date of this report. We undertake no obligations to update or revise publicly any forward-looking statements, whether as a result of new information, future events or otherwise other than as required under the federal securities laws.
v
PART I
|
Item 1.
|
Business
|
Our mission is to set science in motion to create a better world.
We are a leading global provider of mission critical products and services to customers in the biopharma, healthcare, education & government, and advanced technologies & applied materials industries. Our comprehensive offerings, which include materials & consumables, equipment & instrumentation and services & specialty procurement, are relied upon by our customers, often on a recurring basis, because they are frequently specified into their research, development and production processes. These processes are commonly organized into “workflows” that define the activities our customers perform each day. We collaborate closely with our customers to enable them to develop new innovative products, lower their development and production costs, improve product or process performance characteristics, and enhance the safety and reliability of the drugs, devices and other products they produce. In addition to relying on our products, many customers depend upon our services. Our local presence combined with our global infrastructure enable and promote successful relationships with our customers and connect us to over
225,000
of their locations in over
180
countries.
Our 115-year legacy began in 1904 with the founding of the J.T. Baker Chemical Company. In 2010, we were acquired by New Mountain Capital from Covidien plc. Since then, we have expanded through a series of global acquisitions. In 2016, we merged with NuSil, a leading supplier of high-purity silicone products for the medical device and aerospace industries that was founded in 1985. In 2017, we acquired VWR, a global manufacturer and distributor of laboratory and production products and services founded in 1852. VWR now represents the primary ordering platform for our customers.
Avantor, Inc. was incorporated in Delaware in May 2017 in anticipation of the VWR acquisition. We completed our initial public offering through Avantor, Inc. and listed its shares on the New York Stock Exchange in May 2019.
1
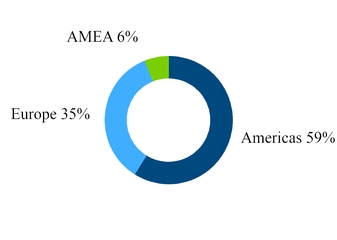
Business segments
We report financial results in three geographic segments based on customer location: the Americas, Europe and AMEA. The following chart presents net sales for each of those segments during
2019
:
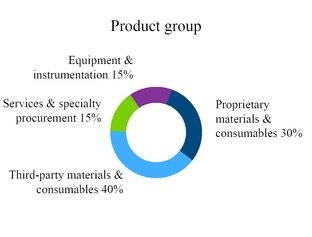
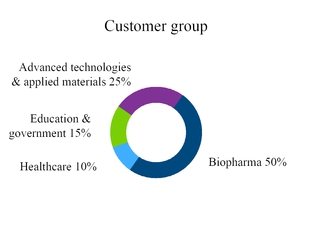
Within each of our geographic segments, we sell materials & consumables, equipment & instrumentation and services & specialty procurement to customers in the biopharma, healthcare, education & government and advanced technologies & applied materials industries. We work with customers across these sophisticated, science-driven industries that require innovation and adherence to the most demanding technical and regulatory requirements. The following charts present the approximate mix of net sales for each of these groups during
2019
:
2
Products and services
Our portfolio includes a comprehensive range of products and services that allows us to create customized and integrated solutions for our customers. Approximately
85%
of our net sales were from product and service offerings that we consider to be recurring in nature. Our products and services are as follows:
|
•
|
Materials & consumables
include ultra-high purity chemicals and reagents, lab products and supplies, highly specialized formulated silicone materials, customized excipients, customized single-use assemblies, process chromatography resins and columns, analytical sample prep kits and education and microbiology and clinical trial kits. Some of these are proprietary products that we make while others are created by third-parties.
|
|
•
|
Equipment & instrumentation
include filtration systems, virus inactivation systems, incubators, analytical instruments, evaporators, ultra-low-temperature freezers, biological safety cabinets and critical environment supplies; and
|
|
•
|
Services & specialty procurement
include onsite lab and production, clinical, equipment, procurement and sourcing and biopharmaceutical material scale-up and development services.
|
In aggregate, we provide approximately six million products, including products we make as well as products from core suppliers across the globe. We manufacture products that meet or exceed the demanding requirements of our customers across a number of highly-regulated industries. Our high-purity and ultra-high purity products, such as our J.T.Baker brand chemicals, are trusted by life sciences and electronic materials customers around the world and can be manufactured at purity levels as stringent as one part-per-trillion. Similarly, our NuSil brand of high-purity, customized silicones has been trusted for more than thirty years by leading medical device manufacturers and aerospace companies.
We complement our products with a range of value-added services. Each day, our onsite service associates work side-by-side with our customers to support their workflows. Our traditional service offerings focus on the needs of laboratory scientists and include procurement, logistics, chemical and equipment tracking and glassware autoclaving. In addition, we offer more complex and value-added scientific research support services such as DNA extraction, bioreactor servicing, clinical and biorepository services and compound management. We deliver these services in part through over
1,300
associates who are co-located with customers, working side-by-side with their scientists every day.
Customers
We benefit from longstanding customer relationships, and approximately
36%
of our
2019
net sales came from customers that have had relationships with us for 15 years or more. We also have a diverse customer base with no single end customer comprising more than
4%
of net sales.
3
Suppliers
We sell proprietary products we make and third-party products sourced from approximately
4,000
product suppliers located across the globe. Our supplier relationships are based on contracts that vary in geographic scope, duration, product and service type, and some include exclusivity provisions. Those relationships may include distribution, sales and marketing support as well as servicing of instruments and equipment. Many of our supplier relationships have been in place for more than twenty years.
Sales channels
We serve customers throughout the Americas, Europe and AMEA. We reach our customers in these regions through a well-trained global sales force, comprehensive websites and targeted catalogs. Our sales force is comprised of approximately
3,600
sales and sales support professionals, including over
300
sales specialists selected for their in-depth industry and product knowledge. Our sales professionals include native speakers for each of the countries in which we operate, allowing us to have high impact interactions with our customers across the globe.
Our online customer portal plays a vital role in how we conduct business with our customers. In
2019
, approximately
51%
of our net sales came from our digital channels. Our websites utilize search analytics and feature personalized search tools, customer specific web solutions and enhanced data that optimize our customers’ online purchasing experience and better integrate our customers’ processes with our own. Our websites are designed to integrate acquisitions, drive geographical expansion and serve segmented market needs with relative ease.
Infrastructure
We have over 200 facilities strategically located throughout the globe that include manufacturing, distribution, service, research & technology and sales centers.
We operate
28
global manufacturing facilities, including
13
facilities that are cGMP compliant and
12
facilities that have been registered with the FDA or comparable foreign regulatory authorities. Our facilities are strategically located in North America, Europe and the AMEA region to facilitate supply chain efficiency and proximity to customers. Our manufacturing capabilities include: (i) an ability to quickly change specifications depending on customer needs; (ii) our flexible unit operations, which allow for production scalability, from laboratory pre-clinical development to large-volume commercialization; (iii) proprietary purification technologies designed to ensure lot-to-lot consistency through ultra-low impurity levels; (iv) rigorous analytical quality control testing; and (v) robust regulatory and quality control procedures.
Information technology
We have a highly automated suite of ERP systems that promote standardization and provide business insight. Our global web infrastructure provides seamless integration with our customers and suppliers. These ERP platforms support rapid development and deployment of enhancements
4
so that we may quickly adapt to meet the technology needs of our customers and seamlessly integrate new acquisitions. We have made significant investments to implement common ERP and online platforms that enhance the customer experience and employ network and data security architecture. Since the launch of our online customer portal through
December 31, 2019
, we had approximately
25.5 million
user sessions across
1.5 million
registered users.
Competition
We operate in a highly competitive environment with a diverse and fragmented base of competitors, many of whom focus on specific regions, customers, and/or segments. We focus on service and delivery, breadth of product line, customization capabilities, price, customer support, online capabilities and the ability to meet the special and local needs of our customers.
Competition is driven not only by the product quality and purity across each of these industries, but also by the adaptability of the supplier as a developmental and commercial partner. We rely on our scale, expertise, deep customer access, depth of product and value-added service offerings, marketing strategies and sales force, acquisition strategy, financial profile and management team to deliver superior solutions to our customers and provide extensive market channel access to our suppliers.
Employees
As of
December 31, 2019
, we had approximately
12,000
employees. We believe that our relations with our employees are good. As of
December 31, 2019
, approximately
6%
of our employees in North America were represented by unions, and a majority of our employees in Europe were represented by workers’ councils or unions.
Intellectual property
We rely on intellectual property rights, nondisclosure and other contractual provisions and technical measures to protect our offerings, services and intangible assets. Much of our intellectual property is know-how and asset configurations that we treat as trade secrets. These proprietary rights are important to our ongoing operations. In some instances, we may license our technology to third parties or may elect to license intellectual property from others. We have applied in the United States and certain foreign countries for registration of a number of trademarks, service marks and patents, some of which have been registered and issued. We also hold common law rights in various trademarks and service marks. Other than our Avantor, VWR, J.T.Baker and NuSil trademarks, we do not consider any particular patent, trademark, license, franchise or concession to be material to our overall business.
Working capital
We maintain adequate levels of working capital to support our business needs. There are no unusual industry practices or requirements relating to working capital items. In addition, our sales and payment terms are generally similar to those of our competitors.
5
Backlog
We do not maintain a significant order backlog because we ordinarily manufacture and fulfill product and service orders quickly.
Seasonality
Our business is not seasonal, but some of our proprietary products have exhibited cyclical customer demand in prior periods. We believe that this is caused by factors unique to those particular product markets such as customer manufacturing schedules, inventory levels in the supply chain and government approval processes. As a result, we may see fluctuations across periods as the timing of our customers’ demand for these products may change.
Government contracts
We conduct business with various government agencies and government contractors. As such, we are subject to certain laws and regulations applicable to companies doing business with the government, as well as with those concerning government contracts. Failure to address or comply with these laws and regulations could harm our business by leading to a renegotiation of profits or termination of the contract at the election of the government agency. We believe we are in compliance in all material respects with such laws and regulations, and no government contract is of such a magnitude as to have a material adverse effect on our financial results.
Government regulation
Our facilities that engage in the manufacturing, packaging, distribution and other biopharmaceutical and biomaterials product lines, as well as many of our products themselves, are subject to extensive ongoing regulation by U.S. governmental authorities, the EMA and other global regulatory authorities. Certain of our subsidiaries are required to register with these agencies, or to apply for permits and/or licenses with, and must comply with the operating, cGMP, quality and security standards of applicable domestic and foreign regulators, including the FDA, the DEA, the Bureau of Alcohol, Tobacco, Firearms and Explosives, DHHS, the equivalent agencies of European Union member states, and comparable foreign, state and local agencies, as well as various accrediting bodies, each depending upon the type of operation and the locations of storage or sale of the products manufactured or services provided by those subsidiaries.
In order to maintain certain certifications of quality and safety standards for our manufacturing facilities and operations, we must comply with numerous regulatory systems, standards, guidance and other requirements, as appropriate, including, but not limited to, ICH Q7, the guidelines of the International Pharmaceutical Excipients Council, European in vitro diagnostic medical device directives, United States Pharmacopeia / National Formulary, as well as the European, British, Japan, India and Chinese Pharmacopeia, the Food Chemicals Codex and controlled substances regulations.
6
In addition, our operations, and some of the products we offer, are subject to a number of complex and stringent laws and regulations governing the production, handling, transportation and distribution of chemicals, drugs and other similar products. We are subject to various federal, state, local, foreign and transnational laws, regulations and recommendations, both in the United States and abroad, relating to safe working conditions, good laboratory and distribution practices, and the safe and proper use, transportation and disposal of hazardous or potentially hazardous substances. In addition, U.S. and international import and export laws and regulations, including those enforced by the U.S. Departments of Commerce, State and Treasury, OFAC and BIS, require us to abide by certain standards relating to the cross-border transit of finished goods, raw materials and supplies and the handling of related information. Our logistics activities must comply with the rules and regulations of the Department of Transportation, the department of Homeland Security, Department of Commerce, Department of Defense, and the Federal Aviation Administration and similar foreign agencies. We are also subject to various other laws and regulations concerning the conduct of our foreign operations, including the Foreign Corrupt Practices Act and other anti-bribery laws as well as laws pertaining to the accuracy of our internal books and records.
The costs associated with complying with the various applicable federal, state, local, foreign and transnational regulations could be significant, and the failure to comply with such legal requirements could have an adverse effect on our reputation, results of operations and financial condition. See Item 1A, “Risk Factors—Risks Related to Regulation.” We are subject to audits by the FDA and other similar foreign regulatory bodies. To date, we have had no instances of noncompliance that have had a material impact on our operations.
In addition to the regulations described above, as part of our aerospace and military offerings, we are registered with the DDTC as a manufacturer and exporter of goods controlled by ITAR, and we are subject to strict export control and prior approval requirements related to these goods. In connection with our NuSil brand products, we have one ITAR site registration and one ITAR product registration, and we maintain control systems which enable ITAR compliance. With respect to our electronics materials products, we adhere to applicable industry guidelines which set stringent quality criteria for our products, and we are subject to import and export regulations and other restrictions regarding the safe use of these products as well.
Environmental matters
We are subject to various laws and governmental regulations concerning environmental, safety and health matters, including employee safety and health, in the United States and other countries. U.S. federal environmental legislation that affects us includes the Toxic Substances Control Act, the Resource Conservation and Recovery Act, the Clean Air Act, the Clean Water Act, the Safe Drinking Water Act, and CERCLA. These laws and regulations govern, among other things, air emissions, wastewater discharges, the use, handling and disposal of hazardous substances and wastes, soil and groundwater contamination and the general health and safety of our associates and the communities in which we operate. We are also subject to regulation by OSHA concerning employee safety and health matters. The EPA, OSHA, and other federal and
7
foreign or local agencies have the authority to promulgate regulations that may impact our operations.
Under CERCLA, and analogous statutes in local and foreign jurisdictions, current and former owners and operators of contaminated land are strictly liable for the investigation and remediation of the land and for natural resource damages that may result from releases of hazardous substances at or from the property. Liability under CERCLA and analogous laws is strict, unlimited, joint, several, retroactive, may be imposed regardless of fault and may relate to historical activities or contamination not caused by the current owner or operator. It is possible that facilities that we acquire or have acquired may expose us to environmental liabilities associated with historical site conditions that have not yet been discovered.
In addition to the federal environmental laws that govern our operations, various states have been delegated certain authority under the aforementioned federal statutes as well as having authority over these matters under state laws. Many state and local governments have adopted environmental and employee safety and health laws and regulations, some of which are similar to federal requirements.
A number of our operations involve, in varying degrees, the handling, manufacturing, use or sale of substances that are or could be classified as toxic or hazardous materials within the meaning of applicable laws. Consequently, some risk of environmental harm is inherent in our operations and products, as it is with other companies engaged in similar businesses. For additional information about environmental matters, see note
12
to our audited financial statements beginning on page F-1 of this report.
Available information
We file or furnish annual, quarterly and current reports, proxy statements and other documents with or to the SEC. The public can obtain any documents that we file with or furnish to the SEC at www.sec.gov.
You may also access our press releases, financial information and reports filed with or furnished to the SEC through our own website at www.avantorsciences.com. Copies of any documents on our website may be obtained free of charge, and reports filed with or furnished to the SEC will be available as soon as reasonably practicable after they are filed with or furnished to the SEC. The information found on our website is not part of this or any other report filed with or furnished to the SEC.
8
Item 1A. Risk factors
Risks related to our business and our industry
Significant interruptions in our operations could harm our business, financial condition and results of operations.
Manufacturing, distribution, service and logistics problems can and do arise, and any such problems could have a significant impact on our operating results. Accordingly, any significant disruptions to the operations of our manufacturing or distribution centers or logistics providers for any reason, including labor relations issues, power interruptions, severe weather, fire or other circumstances beyond our control could cause our operating expenses to increase without coverage or compensation or seriously harm our ability to fulfill our customers’ orders or deliver products on a timely basis, or both. We must also maintain sufficient production capacity in order to meet anticipated customer demand, which carries fixed costs that we may not be able to offset if orders slow, which would adversely affect our operating margins. If we are unable to manufacture our products consistently, in sufficient quantities, and on a timely basis, our net sales, gross margins and our other operating results will be materially and adversely affected. Prompt shipment of our products is also very important to our business. We have experienced problems with or delays in our production, shipping and logistics capabilities that resulted in delays in our ability to ship finished products, and there can be no assurance that we will not encounter such problems in the future. If we experience significant delays in our manufacturing, shipping or logistics processes, we could damage our customer relationships, cause disruption to our customers and adversely affect our business, financial condition and operating results.
We compete in highly competitive markets. Failure to compete successfully could adversely affect our business, financial condition and results of operations.
We face competition across our products and the markets in which we operate. We compete on several fronts, both domestically and internationally, including competing with other companies that provide similar offerings. Competition is driven by proprietary technologies and know-how, capabilities, consistency of operational performance, quality, supply chain control, price, value and speed. Our competitors range from regional companies, which may be able to more quickly respond to customers’ needs because of geographic proximity, to large multinational companies, which may have greater financial, marketing, operational and research and development resources than we do. Such greater resources may allow our competitors to respond more quickly with new, alternative or emerging technologies.
In addition, consolidation trends in the biopharma and healthcare industries have served to create fewer customer accounts and to concentrate purchasing decisions for some customers, resulting in increased pricing pressures. The entry into the market by manufacturers in low-cost manufacturing locations also creates increased pricing and competitive pressures, particularly in developing markets, which may impede our goal to grow in those markets. Failure to anticipate and respond to competitors’ actions may adversely affect our results of operations and financial condition.
9
It may be difficult for us to implement our strategies for improving growth.
We plan to continue expanding our commercial sales operations and scope and complexity of our business both domestically and internationally, while maintaining our commercial operations and administrative activities. For example, we intend to pursue the following growth strategies: (i) increase integration of our products and services into customers’ workflows; (ii) develop new products and services; (iii) expand in geographies expected to have outsized growth; (iv) continue to enhance our global online platform; (v) increase commercial excellence and operational efficiency to drive margin expansion; and (vi) pursue strategic acquisitions to expand our platform. However, our ability to manage our business and conduct our global operations while also pursuing the aforementioned growth strategies requires considerable management attention and resources and is subject to the challenges of supporting a rapidly growing business in an environment of multiple languages, cultures and customs, legal and regulatory systems, alternative dispute systems and commercial markets.
Our failure to implement these strategies in a cost-effective and timely manner could have an adverse effect on our business, results of operations and financial condition.
Part of our growth strategy is to pursue strategic acquisitions, which will subject us to a variety of risks that could harm our business.
As part of our business strategy, we intend to continue to review, pursue and complete selective acquisition opportunities. There can be no assurances that we will be able to complete suitable acquisitions for a variety of reasons, including the identification of and competition for acquisition targets, the need for regulatory approvals, the inability of the parties to agree to the structure or purchase price of the transaction and the inability to finance the transaction on commercially acceptable terms. In addition, any completed acquisition will subject us to a variety of other risks, including:
|
•
|
acquisitions may have an adverse effect on our business relationships with existing or future suppliers and other business partners, in particular, to the extent we consummate acquisitions that vertically integrate portions of our business;
|
|
•
|
we may assume substantial actual or contingent liabilities, known and unknown;
|
|
•
|
acquisitions may not meet our expectations of future financial performance;
|
|
•
|
we may experience delays or reductions in realizing expected synergies;
|
|
•
|
we may incur substantial unanticipated costs or encounter other problems associated with acquired businesses or devote time and capital investigating a potential acquisition and not complete the transaction;
|
|
•
|
we may be unable to achieve our intended objectives for the transaction; and
|
|
•
|
we may not be able to retain the key personnel, customers and suppliers of the acquired business.
|
10
These factors related to our acquisition strategy, among others, could have an adverse effect on our business, financial condition and results of operations.
We may not be able to integrate mergers or acquisitions successfully into our existing business, or realize anticipated cost savings or synergies, if any, from those transactions, which could adversely affect our business.
Our ability to realize the benefits we anticipate from our mergers and acquisitions activities, including anticipated cost savings and additional sales opportunities, will depend in large part upon whether we are able to integrate such businesses efficiently and effectively. Integration is an ongoing process and we may not be able to fully integrate such businesses smoothly or successfully and the process may take longer than expected. Further, the integration of certain operations and the differences in operational culture following mergers and acquisitions activity will continue to require the dedication of significant management resources, which may distract management’s attention from day-to-day business operations. There may also be unasserted claims or assessments that we failed or were unable to discover or identify in the course of performing due diligence investigations of target businesses. If we are unable to successfully integrate the operations of acquired businesses into our business, we may be unable to realize the sales growth, cost synergies and other anticipated benefits we expect to achieve as a result of such transactions and our business, results of operations and cash flow could be adversely affected.
Our business, financial condition and results of operations may be harmed if our customers discontinue or spend less on research, development, production or other scientific endeavors.
Our customers include companies in the biopharma, healthcare, education & government and advanced technologies & applied materials industries. Many factors, including public policy spending priorities, available resources and product and economic cycles, have a significant effect on the capital spending policies of these entities. Fluctuations in the research and development budgets of our customers could have a significant effect on the demand for our products. Our customers determine their research and development budgets based on several factors, including the need to develop new products, continued availability of governmental and other funding, competition and the general availability of resources. If research and development budgets are reduced, the impact could eventually adversely affect our overall business.
11
The customers we serve have and will continue to experience significant industry-related changes that could adversely affect our business.
Many of the customers we serve have experienced significant industry-related changes in the last several years and are expected to continue to experience significant changes, including reductions in governmental payments for biopharmaceutical products, expirations of significant patents, adverse changes in legislation or regulations regarding the delivery or pricing of general healthcare services or mandated benefits, and increased requirements on quality. General industry changes include:
|
•
|
development of large and sophisticated group purchasing organizations and on-line auction sites that increase competition for and reduce spending on laboratory products;
|
|
•
|
consolidation of biopharmaceutical companies resulting in a rationalization of research expenditures;
|
|
•
|
increased regulatory scrutiny over drug production requiring safer raw materials;
|
|
•
|
customers’ purchasing the products that we supply directly from our suppliers; and
|
|
•
|
significant reductions in development and production activities.
|
Some of our customers have implemented or may in the future implement certain measures described above in an effort to control and reduce costs. The ability of our customers to develop new products to replace sales decreases attributable to expirations of significant patents, along with the impact of other past or potential future changes in the industries we serve, may result in our customers significantly reducing their purchases of products from us or the prices they are willing to pay for those products. While we believe we are able to adapt our business to maintain existing customer relationships and develop new customer relationships if we are unsuccessful or untimely in these efforts, our results of operations may suffer.
We may be adversely affected by global and regional economic and political conditions.
We conduct operations around the globe. The prospects, strength and sustainability of the current environment remain uncertain as does the possibility of an economic downturn in the United States and other countries. The uncertainty or deterioration of the global economic environment could adversely affect us. Customers or suppliers may experience cash flow problems, and as a result, customers may modify, delay or cancel plans to purchase our products and services. Suppliers may significantly and rapidly increase their prices or reduce their output. Any inability of current and/or potential customers to purchase and/or pay for our products due to, among other things, declining economic conditions as a result of inflation, rising interest rates, changes in spending patterns at biopharma, healthcare, education & government and advanced technologies & applied materials companies and the effects of governmental initiatives to manage economic conditions may have a negative impact on our consolidated results of operations, financial condition and cash flows. Overall demand for our products could be reduced as a result of a global economic recession or political unrest, especially in such areas as
12
the biopharma, healthcare, education & government and advanced technologies & applied materials industries.
Sales and earnings could also be affected by our ability to manage the risks and uncertainties associated with the application of trade protection measures, regional political instability, war, terrorist activities, severe or prolonged adverse weather conditions and natural disasters as well as health epidemics and pandemics. For example, the ongoing coronavirus outbreak since the beginning of 2020 has resulted in increased travel restrictions and extended shutdown of certain businesses in the region, as well as reports of dramatically reduced economic activity in the region, which may impact our operations particularly in the AMEA region. These or any further political or governmental developments or health concerns in China or other countries in which we operate could result in social, economic and labor instability, which could have a material adverse effect on the continuity of our business, including with respect to the availability of raw materials for production, as well as our financial condition and results of operations.
The United Kingdom’s decision to leave the European Union (“Brexit”) could adversely affect our business.
During the second quarter of 2016, the United Kingdom voted by referendum to exit the European Union, commonly referred to as “Brexit.” On January 31, 2020, the United Kingdom ceased to be part of the European Union. The impact of the United Kingdom’s departure from, and future relationship with, the European Union are uncertain. Brexit has and continues to create general economic uncertainty in the United Kingdom and European Union. The effects of Brexit could have an adverse impact on our business, results of operations and financial condition. The withdrawal could, among other potential outcomes, adversely affect the tax, tax treaty, currency, operational, legal and regulatory regimes to which our business operations and suppliers in the region are subject. The withdrawal could also, among other potential outcomes, disrupt the free movement of goods, services and people between the United Kingdom and the European Union and significantly disrupt trade between the United Kingdom and the European Union and other parties. Further, uncertainty around and developments regarding these and related issues has contributed to deteriorating market conditions and could further adversely impact consumer and investor confidence and the economy of the United Kingdom and the economies of other countries in which we operate, and cause significant volatility in currency exchange rates.
Our offerings are highly complex, and, if our products do not satisfy applicable quality criteria, specifications and performance standards, we could experience lost net sales, delayed or reduced market acceptance of our products, increased costs and damage to our reputation.
The high-purity materials and customized solutions we offer are highly exacting and complex due to demanding customer specifications and stringent regulatory and industry requirements. Our operating results depend on our ability to execute and, when necessary, improve our global quality control systems, including our ability to effectively train and maintain our employees with respect to quality control. A failure of our global quality control systems could result in problems with facility operations or preparation or provision of defective or non-compliant
13
products. In each case, such problems could arise for a variety of reasons, including equipment malfunction, failure to follow specific protocols and procedures, problems with raw materials, or environmental factors and damage to, or loss of, manufacturing operations. Although many of our products are tested prior to shipment, defects or errors nevertheless occur and we have product recalls from time to time. Such problems could affect production of a particular batch or series of batches of products, requiring the destruction of such products or a halt of facility production altogether. Nearly all of our products are subsequently incorporated into products sold to end users by our customers, and we have no control over the manufacture and production of such products.
Our success depends on our customers’ confidence that we can provide reliable, high-quality products. We believe that customers in our target markets are likely to be particularly sensitive to product defects and errors. Our reputation and the public image of our products and technologies may be impaired if our products fail to perform as expected or fail to meet applicable quality criteria, specifications or performance standards. If our products experience, or are perceived to experience, a material defect or error, this could result in loss or delay of net sales, damaged reputation, diversion of development resources, and increased insurance or warranty costs, any of which could harm our business. Such defects or errors could also result in our inability to timely deliver products to our customers, which in turn could cause disruption to our customers’ production of their products, narrowing the scope of the use of our products and ultimately hindering our or their success in relevant markets. Even after any underlying concerns or problems are resolved, any lingering concerns in our target markets regarding our technology, product defects or performance standards could continue to result in lost net sales, delayed market acceptance and damaged reputation, among other things. If problems in preparation or manufacture of a product or failures to meet required quality standards for that product or other product defects are not discovered before such product is released to our customers, we may be subject to adverse regulatory and legal actions, including recalls, product seizures, injunctions to halt manufacture and distribution, restrictions on our operations, civil sanctions, including monetary sanctions, and criminal actions. In addition, such problems or failures subject us to other litigation claims, including claims from our customers for reimbursement for the cost of lost or damaged raw materials or end products, disposal of defective products, production line clean out and consequential damages, the cost of which could be significant.
The loss of a significant number of customers or a reduction in orders from a significant number of customers could reduce our net sales and harm our operating results.
Our operating results could be negatively affected by the loss of revenue from a significant number of our customers, including direct distributors and end users. Though we often include pricing and volume incentives in our contracts, our customers are generally not obligated to purchase any fixed quantities of products, and they may stop placing orders with us at any time. If a significant number of customers purchase fewer of our products, defer orders or fail to place additional orders with us, our sales could decline, and our operating results may not meet our expectations. In addition, if those customers order our products, but fail to pay on time or at all, our liquidity and operating results could be adversely affected.
14
Our contracts generally do not contain minimum purchase requirements, and we sell primarily on a purchase order basis. Therefore, our sales are subject to changes in demand from our customers, and these changes have been material in the past. The level and timing of orders placed by our customers vary for a number of reasons, including individual customer strategies, the introduction of new technologies, the desire of our clients to reduce their exposure to any single supplier and general economic conditions. If we are unable to anticipate and respond to the demands of our clients, we may lose clients because we have an inadequate supply of raw materials with which to manufacture our products or insufficient capacity in our sites. Alternatively, we may have excess inventory or excess capacity. Either of these factors may have a material adverse effect on our business, financial position and operating results.
Though we do generate a portion of our net sales from long-term contracts, the majority of these contracts are non-exclusive and do not require a minimum purchase volume. This makes it difficult to estimate our customers’ demand for our products and our raw material needs. In addition, though we believe customers in our markets display a significant amount of loyalty to their supplier of a particular product, we may not be able to renew a contract on favorable pricing terms if our competitors reduce their prices in order to procure business, or if a customer insists that we lower the price charged under the contract being renewed in order to retain the contract. The loss of sales obtained through long-term contracts or the reduced profitability of such sales could adversely affect our results of operations, cash flows and liquidity.
We are subject to risks associated with doing business globally, which may harm our business.
We have global operations and derive a portion of our net sales from customers outside the United States. Accordingly, our international operations or those of our international customers could be substantially affected by a number of risks arising with operating an international business, including:
|
•
|
limitations on repatriation of earnings;
|
|
•
|
taxes on imports;
|
|
•
|
the possibility that unfriendly nations or groups could boycott our products;
|
|
•
|
general economic and political conditions in the markets we operate in;
|
|
•
|
foreign currency exchange rate fluctuations;
|
|
•
|
potential increased costs associated with overlapping tax structures;
|
|
•
|
potential increased reliance on third parties within less developed markets;
|
|
•
|
potential trade restrictions, tariffs and exchange controls;
|
|
•
|
more limited protection for intellectual property rights in some countries;
|
|
•
|
difficulties and costs associated with staffing and managing foreign operations;
|
15
|
•
|
unexpected changes in regulatory requirements;
|
|
•
|
difficulties in complying with a wide variety of foreign laws and regulations;
|
|
•
|
the risk that certain governments may adopt regulations or take other actions that would have a direct adverse impact on our business and market opportunities, including nationalization of private enterprise;
|
|
•
|
violations of anti-bribery and anti-corruption laws, such as the FCPA;
|
|
•
|
violations of economic sanctions laws, such as the regulations enforced by OFAC;
|
|
•
|
longer accounts receivable cycles in certain foreign countries, whether due to cultural differences, exchange rate fluctuation or other factors;
|
|
•
|
the credit risk of local customers and distributors;
|
|
•
|
limitations on our ability to enforce legal rights and remedies with third parties or partners outside the United States;
|
|
•
|
import and export licensing requirements and other restrictions, such as those imposed by OFAC, BIS, DDTC and comparable regulatory agencies and policies of foreign governments; and
|
|
•
|
changes to our distribution networks.
|
Changes in exchange rates can adversely affect our net sales, profits and cash flows.
We report our consolidated financial results in U.S. dollars. Approximately
45%
of net sales for the year ended
December 31, 2019
were generated from operations outside the United States and denominated in foreign currencies (principally the euro, the British pound sterling and the Canadian dollar). Fluctuations in the relative values of currencies occur from time to time and could adversely affect our operating results. Specifically, during times of a strengthening U.S. dollar, our reported international sales and earnings will be reduced because the local currency will convert into fewer U.S. dollars. In addition, currency fluctuations may affect the comparability of our results of operations between financial periods.
Further, we have a substantial amount of euro denominated indebtedness. Fluctuations in the exchange rate between U.S. dollars and euros may have a material adverse effect on our ability to repay such indebtedness. See Item 7A. “Quantitative and qualitative disclosures about market risk.”
16
Our business depends on our ability to use and access information systems, and any failure to successfully maintain these systems or implement new systems to handle our changing needs could materially harm our operations.
We depend on standardized procedures and multiple information systems, including our online customer portal and distribution and enterprise resource systems, for our operations, customer service and quality and safety procedures. Furthermore, we rely on information technology systems to process, transmit, store and protect electronic information, including confidential customer, supplier, employee or other business information. Through our online customer portal, we collect and store confidential information that customers provide in order to, among other things, purchase products and services and register on our website.
We utilize commercially available third-party technology solutions, software and software systems with some proprietary configurations. We also store data using third-party cloud services. Our information systems are subject to damage or interruption from power outages, computer and telecommunications failures, computer viruses, security breaches, vandalism, catastrophic events, natural disasters, terrorist attacks, hackers and other security issues as well as human error. If our information systems are damaged, fail to work properly or otherwise become unavailable, we may incur substantial costs to repair or replace them, and we may experience a loss of critical information, customer disruption and interruptions or delays in our ability to perform essential functions and implement new and innovative services. If the cloud service providers we use were to experience unplanned downtime, delays or other issues delivering data to our information technology systems, this could significantly and adversely impact business operations. A compromise of our information systems or those with which we interact could harm our reputation and expose us to regulatory actions and claims from customers and other persons, any of which could adversely affect our business, financial position and results of operations.
In addition, we may not have the necessary resources to enhance existing information systems or implement new systems where necessary to handle our increasing volume and changing needs, and may experience unanticipated delays, complications and expenses in implementing and integrating our systems. Any interruptions in operations would adversely affect our ability to properly allocate resources and timely deliver our products, which could result in customer dissatisfaction. The failure to successfully implement and maintain information systems could have an adverse effect on our ability to obtain new business, retain existing business and maintain or increase our sales and profit margins.
In recent years, information security risks have generally increased because of the proliferation of new technologies and the increased sophistication and activities of perpetrators of cyberattacks. In addition to exploiting technical vulnerabilities, the perpetrators of cyberattacks may seek to gain access to user credentials through “phishing” and “spear phishing” attacks. A failure in or breach of our operational or information systems, or those of our third-party service providers, as a result of cyberattacks or information security breaches, regardless of whether the failure or breach is attributable to a vulnerability in our systems, could disrupt our business and/or our supply chain, result in the improper disclosure or misuse of our or our customers’
17
confidential or proprietary information, damage our reputation, subject us to claims and/or increase our costs. We may be required to expend additional resources to continue to enhance our information security measures and/or to investigate and remediate any information security vulnerabilities.
The GDPR, which went into effect in the EU on May 25, 2018, applies to the collection, use, retention, security, processing, and transfer of personally identifiable information of residents of countries in the European Economic Area. The GDPR created a range of new compliance obligations, and imposes significant fines and sanctions for violations. It is possible that the GDPR may be interpreted or applied in a manner that is adverse to us or otherwise inconsistent with our practices; or that the EU authorities may hold that we are not in full compliance with the GDPR’s requirements.
Any failure, or perceived failure, by us to comply with the GDPR, or with any applicable regulatory requirements or orders, including but not limited to privacy, data protection, information security, or consumer protection-related privacy laws and regulations, in one or more jurisdictions within the EU or elsewhere, could: result in proceedings or actions against us by governmental entities or individuals; subject us to significant fines, penalties, and/or judgments; require us to change our business practices; limit access to our products and services in certain countries, incur substantial costs (even if we ultimately prevail) or otherwise adversely affect our business.
Our inability to protect our intellectual property could adversely affect our business. In addition, third parties may claim that we infringe their intellectual property, and we could suffer significant litigation or licensing expenses as a result.
We rely on a variety of intellectual property rights, including patents, trademarks, copyrights and trade secrets, to protect our proprietary technology and products. We place considerable emphasis on obtaining patent or maintaining trade secret protection for significant new technologies, products and processes because of the length of time and expense associated with bringing new products and processes through the development process and to the market. Our success depends, in part, on our ability to develop and maintain trade secrets, or obtain and enforce patent protection, for our products and processes both in the United States and internationally.
We rely on trade secrets and proprietary know-how to protect our products and processes, in part, by confidentiality agreements with our customers, collaborators, employees and consultants. We cannot be certain, however, that these agreements will not be breached, including a breach by a customer or collaborator involving reverse-engineering of our products or the use or disclosure of our trade secrets or know-how, or that adequate remedies will be available in the event of any breach. We cannot guarantee that our trade secrets and other proprietary and confidential information will not be disclosed or that competitors will not otherwise gain access to or independently develop our trade secrets. If a competitor lawfully obtained or independently developed any of our trade secrets, we would have no right to prevent such competitor from using that technology or information to compete with us. Monitoring unauthorized uses and disclosures is difficult, and we do not know whether the steps we have taken to protect our
18
proprietary technologies will be effective. Furthermore, enforcing a claim that a party illegally disclosed or misappropriated a trade secret is difficult, expensive and time-consuming, and the outcome is unpredictable, in part because some courts both within and outside the United States may be less willing or unwilling to protect trade secrets. Any misappropriation, disclosure or independent development of our trade secrets could harm our competitive position.
We own numerous U.S. and foreign patents and patent applications, and we expect to file additional applications, as appropriate, for patents covering certain of our products and processes. Patents may not be issued for any pending or future patent applications owned by or licensed to us, and the claims allowed under any issued patents may not be sufficiently broad to protect our technology. Any issued patents owned by or licensed to us may be challenged, invalidated or circumvented, and the rights under these patents may not provide us with competitive advantages. In addition, competitors may design around our technology or develop competing technologies. Intellectual property rights may also be unavailable or limited in some foreign countries, which could make it easier for competitors to capture increased market position. Moreover, pursuing patent protection in all jurisdictions would be prohibitively expensive, and we will not have the benefit of any such protection in jurisdictions where we do not pursue and obtain patents. We could incur substantial costs to defend ourselves in suits brought against us or in suits in which we may assert our patent rights against others. An unfavorable outcome of any such litigation could adversely affect our business and results of operations.
We may need to spend significant resources monitoring and enforcing our intellectual property rights and we may not be able to prove infringement by third parties. Our competitive position may be harmed if we cannot enforce our intellectual property rights. In some circumstances, we may choose to not pursue enforcement for business reasons. In addition, competitors might avoid infringement by designing around our intellectual property rights or by developing non-infringing competing technologies. Intellectual property rights and our ability to enforce them may be unavailable or limited in some countries, which could make it easier for competitors to capture market share and could result in lost revenues.
We may be subject to claims that former employees, collaborators or other third parties have an interest in our patents or other intellectual property as an inventor or co-inventor, or that an employee, consultant, or other third party performed work for us that conflicts with that person’s obligations to a third party. While it is generally our policy to require our employees and contractors who may be involved in the creation, conception or development of intellectual property to execute agreements assigning such intellectual property to us, we may be unsuccessful in executing such an agreement with each party who, in fact, creates, conceives or develops intellectual property that we regard as our own, or a court may determine that such agreement was insufficient to assign such intellectual property to us. In some cases, when we perform certain services for a customer, the customer may own rights in resulting intellectual property, if any, generated in the course of performing those services. Disputes may arise with respect to such arrangements and our, and the customer’s, rights in such intellectual property. Litigation may be necessary to defend against any of these and other claims challenging inventorship or ownership. If we fail in defending or asserting any such claims, in addition to
19
paying monetary damages, we may lose valuable intellectual property rights, such as exclusive ownership of, or right to use, valuable intellectual property. Even if we are successful in defending or asserting such claims, litigation could result in substantial costs and be a distraction to management and other employees.
We cannot be certain that our products and our business do not or will not infringe the intellectual property rights of a third party. Third parties may assert claims against us to the effect that we are infringing on their intellectual property rights. Such claims are costly, regardless of their merit, divert the attention of management, and outcomes are uncertain, all of, which could adversely affect our business, financial condition and results of operations. In addition, parties making these claims could secure a judgment awarding substantial damages, as well as injunctive or other equitable relief against us and those to whom we have sold the allegedly infringing products, which could require us to design around the infringement, and/or effectively block our ability to make, use, sell, distribute, or market our products in the United States or other countries. In the event that a claim relating to intellectual property is asserted against us, or third parties not affiliated with us hold pending or issued patents that relate to our products or technology, we may seek licenses to such intellectual property or challenge those patents. However, we may be unable to obtain these licenses on commercially reasonable terms, if at all, and our challenge of the patents may be unsuccessful. Our failure to obtain the necessary licenses or other rights could prevent the sale, manufacture, or distribution of our products and, therefore, could adversely affect our business, financial condition and results of operations.
Our trademarks are valuable assets and if we are unable to protect them from infringement our business prospects may be harmed.
Our brands, particularly our J.T.Baker, NuSil and VWR brands, are valuable assets. Therefore, we actively manage our trademark portfolio, including by maintaining registrations for long-standing trademarks and applying to obtain trademark registrations for new brands. We also police our trademark portfolio against infringement. Our efforts to protect and defend our trademarks may fall short or be unsuccessful against competitors or other third parties for a variety of reasons. To the extent that third parties or distributors sell products that are counterfeit versions of our branded products, our customers could inadvertently purchase products that are inferior. This could cause them to refrain from purchasing our brands in the future and in turn could impair our brand equity and adversely affect our sales.
We are subject to product liability and other claims in the ordinary course of business.
Our business involves risk of product liability, intellectual property claims and other claims in the ordinary course of business arising from the products that we source from various manufacturers or produce ourselves. Furthermore, there may be product liability risks that are unknown or which become known in the future. Substantial, complex or extended litigation on any claim could cause us to incur significant costs and distract our management. For example, lawsuits by governmental authorities, employees, shareholders, suppliers, collaborators, distributors, customers, competitors or others with protected intellectual property could be very costly and substantially disrupt our business. Our exposure to such claims may increase as we seek to increase the geographic scope of our sourcing and sales activities and to the extent that
20
we expand our manufacturing operations. We maintain insurance policies and in some cases, our suppliers, customers and predecessors of acquired companies have indemnified us against certain claims. We cannot assure you that our insurance coverage or indemnification agreements will be available in all pending or any future cases brought against us. Furthermore, our ability to recover under any insurance or indemnification arrangements is subject to the terms and conditions of such insurance or indemnification agreement, as well as the financial viability of our and such third parties’ insurers, as well as legal enforcement under the local laws governing these arrangements. Insurance coverage in general or coverage for certain types of liabilities, such as product liability in developing markets, may not be readily available for purchase or cost-effective for us to purchase. Furthermore, many of our insurance policies are subject to high deductibles and retentions. Accordingly, we could be subject to uninsured and unindemnified future liabilities requiring us to provide additional reserves to address such liabilities. An unfavorable result in a case for which adequate insurance or indemnification is not available could adversely affect our business, financial condition and results of operations.
We are also involved in various disputes, litigation and regulatory matters incidental to and in the ordinary course of our business, including employment matters, commercial disputes, government compliance matters, environmental matters, and other matters arising out of the normal conduct of our business. We intend to vigorously defend ourselves in such matters. While the impact of this litigation has or may be immaterial, there can be no assurance that the impact of the pending and any future claims will not be material to our business, financial condition or results of operations in the future.
We must develop new products, adapt to rapid and significant technological change and respond to introductions of new products by competitors to remain competitive.
We sell our products in industries that are characterized by significant technological changes, frequent new product and technology introductions and enhancements and evolving industry standards. As a result, our customers’ needs are rapidly evolving. If we do not appropriately innovate and invest in new technologies, our offerings may become less desirable in the markets we serve, and our customers could move to new technologies offered by our competitors or make products themselves. Though we believe customers in our markets display a significant amount of loyalty to their supplier of a particular product, we also believe that because of the initial time investment required by many of our customers to reach a purchasing decision for a new product, it may be difficult to regain that customer once the customer purchases a product from a competitor. Without the timely introduction of new products, services and enhancements, our offerings will likely become less competitive over time, in which case our competitive position, net sales and operating results could suffer. Accordingly, we focus significant efforts and resources on the development and identification of new technologies, products and services that are attractive to and gain acceptance in the markets we serve and further broaden our offerings. To the extent we fail to timely introduce new and innovative products or services, adequately predict our customers’ needs or fail to obtain desired levels of market acceptance, our business may suffer.
21
Our business, financial condition and results of operations depend upon the availability of raw materials.
Our operations depend upon our ability to obtain high-quality raw materials meeting our specifications and other requirements at reasonable prices, including various active pharmaceutical ingredients, components, compounds, excipients and other raw materials, many of which are sole-sourced due to market or customer demands. Our ability to maintain an adequate supply of such materials and components could be impacted by the availability and price of those raw materials and maintaining relationships with key suppliers. While we may seek to minimize the impact of price increases and potential shortages by, among other things, entering into long-term supply agreements, increasing our own prices and implementing cost-saving measures, our earnings and cash flows could be adversely affected in the event these measures are insufficient to cover our costs. Our dependency upon regular deliveries from particular suppliers of components and raw materials means that interruptions or stoppages in such deliveries could adversely affect our operations until arrangements with alternate suppliers, to the extent any alternate suppliers acceptable to us and, if applicable, to our customers, even exist. If this occurs, we could expend substantial expense and time in re-establishing relationships with third-party suppliers that meet the appropriate quality, cost and regulatory requirements needed for commercially viable manufacture of our products or in re-designing our products to incorporate different components and raw materials that are available from third-party suppliers. If we are unable to obtain the materials we need at reasonable prices or at all, we may not be able to produce certain of our products at a marketable price or at all. If our supply of raw materials and key components is adversely affected, we could impact our customers’ ability to produce their products, damage our relationship with current and prospective customers and our operating results and financial condition could be adversely affected.
Moreover, we are dependent upon the ability of our suppliers to provide materials and components that meet our specifications, quality standards, other applicable criteria, and delivery schedules. Our suppliers’ failure to provide expected raw materials or components that meet such criteria could adversely affect production schedules and contract profitability.
The continued supply of materials from our suppliers is subject to a number of risks including:
|
•
|
the destruction of or damage to our suppliers’ facilities or their distribution infrastructure;
|
|
•
|
work stoppages or strikes by our suppliers’ employees;
|
|
•
|
the failure of our suppliers to provide materials of the requisite quality or in compliance with strict specifications;
|
|
•
|
the failure of essential equipment at our suppliers’ plants;
|
|
•
|
the failure of our suppliers to satisfy U.S. and international import and export control laws for goods that we purchase from them;
|
22
|
•
|
the failure of our suppliers to meet regulatory standards, including cGMP, where applicable;
|
|
•
|
the failure, shortage or delay in the delivery of raw materials to our suppliers;
|
|
•
|
contractual amendments and disputes with our suppliers; and
|
|
•
|
inability of our suppliers to perform as a result of the weakened global economy or otherwise.
|
If we experience problems with suppliers, we may not be able to find acceptable alternatives, and any such alternatives could result in increased costs for us and possible forward losses on certain contracts. Even if acceptable alternatives are found, the process of locating and securing such alternatives might be disruptive to our business, might lead to termination of our supply agreements with our customers, and might disrupt the operations of our customers leading to potential claims.
Our business, financial condition and results of operations depend upon maintaining our relationships with suppliers.
We offer products from a wide range of suppliers. While there is generally more than one source of supply for most of the categories of third-party materials & consumables and equipment & instrumentation that we sell, we currently do not manufacture the majority of our products and are dependent on these suppliers for access to those products.
Our ability to sustain our gross margins has been, and will continue to be, dependent in part upon our ability to obtain favorable terms from our suppliers. These terms may change from time to time, and such changes could adversely affect our gross margins over time. In addition, our results of operations and cash flows could be adversely impacted by the acceleration of payment terms to our suppliers and/or the imposition of more restrictive credit terms and other contractual requirements.
Some of our competitors are increasing their manufacturing operations both internally and through acquisitions of manufacturers, including manufacturers that supply products to us. In addition, we manufacture certain products that may compete directly with products we source from our suppliers. To date, we have not experienced an adverse impact on our ability to continue to source products from manufacturers that have been vertically integrated or otherwise compete with us, although there is no assurance that we will not experience such an impact in the future.
The loss of one or more of our large suppliers, including as a result of consolidation, a material reduction in their supply of products or provision of services to us, extended disruptions or interruptions in their operations or material changes in the terms we obtain from them, could have a material adverse effect on our business, financial condition and results of operations.
23
Our use of chemicals and chemical processes is subject to inherent risk.
We use chemical ingredients in the manufacture of certain of our products. Due to the nature of the manufacturing process itself, there is a risk of incurring liability for damages caused by or during the storage or manufacture of both the chemical ingredients and the finished products. The processes used in certain of our facilities typically involve large volumes of solvents and chemicals, creating the potential for fires, spills and other safety or environmental impacts. If any of these risks materialize, it could result in significant remediation and other costs, potential adverse regulatory actions and liabilities, any of which could have an adverse effect on our business, results of operations and financial condition.
In addition, the manufacturing, use, storage, and distribution of chemicals are subject to threats including terrorism. We have several high-risk chemical facilities that possess materials that could be stolen and used to make weapons. We could also be subject to an attack on our high-risk facilities that could cause a significant number of deaths and injuries. As a result, many people, including our employees, could be harmed. Such an occurrence could also harm the environment, our reputation and disrupt our operations.
We are highly dependent on our senior management and key employees. Competition for our employees is intense, and we may not be able to attract and retain the highly skilled employees that we need to support our business and our intended future growth.
Our success largely depends on the skills, experience and continued efforts of our management, including our Chief Executive Officer and our senior leadership. The replacement of any member of our management team would likely involve the expenditure of significant time and financial resources, and the loss of any such individual may significantly delay or prevent the achievement of our business objectives. As we continue to grow, our success also depends on our ability to attract, motivate and retain highly qualified individuals. Competition for senior management and other key personnel in our industry is intense, and the pool of suitable candidates is limited. If qualified personnel become scarce or difficult to attract or retain in our industry for compensation-related or other reasons, we could experience higher labor, recruiting or training costs. Further, new hires may require significant training and time before they achieve full productivity and may not become as productive as we expect. The failure to attract, retain and properly motivate members of our senior management team and other key employees, or to find suitable replacements for them in the event of death, illness or their desire to pursue other professional opportunities, could have a negative effect on our operating results.
We may incur impairment charges on our goodwill, other intangible assets or other assets that would reduce our earnings.
We are required under generally accepted accounting principles to test goodwill and indefinite-lived intangible assets for impairment at least annually and to review our finite-lived intangible assets, including other assets acquired through merger and acquisition activity, for impairment when events or changes in circumstance indicate the carrying value may not be recoverable.
24
Factors that could lead to impairment of goodwill, indefinite-lived intangible assets, and finite-lived intangible assets in the future (including goodwill or assets acquired via acquisitions) include significant adverse changes in the business climate and actual or projected operating results and declines in the financial condition of our business. We have recorded and may be required in the future to record additional charges to earnings if our goodwill, other intangible assets or other assets become impaired. Any such charge would adversely impact our financial results.
Our reputation, ability to do business and financial statements may be impaired by improper conduct by any of our employees, agents or business partners.
We cannot provide assurance that our internal controls and compliance systems will always protect us from acts committed by employees, agents or business partners of ours (or of businesses we acquire or partner with) that would violate U.S. and/or non-U.S. laws, including the laws governing payments to government officials, bribery, fraud, kickbacks and false claims, pricing, sales and marketing practices, conflicts of interest, competition, export and import compliance, money laundering and data privacy. In particular, the FCPA, the U.K. Bribery Act and similar anti-bribery laws in other jurisdictions generally prohibit companies and their intermediaries from making improper payments for the purpose of obtaining or retaining business, and we operate in many parts of the world that have experienced corruption to some degree. Any such improper actions or allegations of such acts could damage our reputation and subject us to civil or criminal investigations in the United States and in other jurisdictions and related shareholder lawsuits, could lead to substantial civil and criminal, monetary and nonmonetary penalties and could cause us to incur significant legal and investigatory fees. In addition, the government may seek to hold us liable as a successor for violations committed by companies in which we invest or that we acquire. We also rely on our suppliers to adhere to our supplier standards of conduct, and material violations of such standards of conduct could occur that could have a material effect on our business, reputation and financial statements.
The indemnification provisions of acquisition agreements by which we have acquired companies may not fully protect us and as a result we may face unexpected liabilities.
Certain of the acquisition agreements by which we have acquired companies require the former owners to indemnify us against certain liabilities related to the operation of the company before we acquired it. In most of these agreements, however, the liability of the former owners is limited and certain former owners may be unable to meet their indemnification responsibilities. We cannot assure you that these indemnification provisions will protect us fully or at all, and as a result we may face unexpected liabilities that adversely affect our financial statements.
Government or private civil antitrust actions could harm our business, results of operations, financial condition and cash flows.
The antitrust laws prohibit, among other things, any joint conduct among competitors that would lessen competition in the marketplace. We believe that we are in compliance with the legal requirements imposed by the antitrust laws. However, a governmental or private civil action alleging the improper exchange of information, or unlawful participation in price maintenance or
25
other unlawful or anticompetitive activity, even if unfounded, could be costly to defend and could harm our business, results of operations, financial condition and cash flows.
Changes in tax law relating to multinational corporations could adversely affect our tax position.
The U.S. Congress, government agencies in non-U.S. jurisdictions where we and our affiliates do business, and the Organisation for Economic Cooperation and Development, or OECD, have recently focused on issues related to the taxation of multinational corporations. One example is in the area of “base erosion and profit shifting,” where profits are claimed to be earned for tax purposes in low-tax jurisdictions, or payments are made between affiliates from a jurisdiction with high tax rates to a jurisdiction with lower tax rates. The OECD has released several components of its comprehensive plan to create an agreed set of international rules for addressing base erosion and profit shifting.
Due to the potential for changes to tax laws and regulations or changes to the interpretation thereof (including regulations and interpretations pertaining to recent tax reform in the United States), the ambiguity of tax laws and regulations, the subjectivity of factual interpretations, the complexity of our intercompany arrangements, uncertainties regarding the geographic mix of earnings in any particular period, and other factors, our estimates of effective tax rate and income tax assets and liabilities may be incorrect and our financial statements could be adversely affected. The impact of the factors referenced in the first sentence of this paragraph may be substantially different from period-to-period.
In addition, the amount of income taxes we pay is subject to ongoing audits by U.S. federal, state and local tax authorities and by non-U.S. tax authorities. If audits result in payments or assessments different from our reserves, our future results may include unfavorable adjustments to our tax liabilities and our financial statements could be adversely affected. Any further significant changes to the tax system in the United States or in other jurisdictions (including changes in the taxation of international income as further described below) could adversely affect our financial statements.
Certain of our businesses rely on relationships with collaborative partners and other third parties for development, supply and marketing of certain products and potential products, and such collaborative partners or other third parties could fail to perform sufficiently.
We believe that for certain of our businesses, success in penetrating target markets depends in part on their ability to develop and maintain collaborative relationships with other companies. Relying on collaborative relationships is risky because, among other things, our collaborative partners may (i) not devote sufficient resources to the success of our collaborations; (ii) fail to obtain regulatory approvals necessary to continue the collaborations in a timely manner; (iii) be acquired by other companies and terminate our collaborative partnership or become insolvent; (iv) compete with us; (v) disagree with us on key details of the collaborative relationship; (vi) have insufficient capital resources; and (vii) decline to renew existing collaborations on acceptable terms. Because these and other factors may be beyond our control, the development or commercialization of our products involved in collaborative partnerships may be delayed or
26
otherwise adversely affected. If we or any of our collaborative partners terminate a collaborative arrangement, we may be required to devote additional resources to product development and commercialization or we may need to cancel some development programs, which could adversely affect our business and financial statements.
Risks related to regulation
We are required to comply with a wide variety of laws and regulations, and are subject to regulation by various federal, state and foreign agencies, and our failure to comply with existing and future regulatory requirements could adversely affect our results of operations and financial condition.
We compete in markets in which we and our customers are subject to federal, state, local, international and transnational laws and regulations, including the operating, quality and security standards of the FDA, various state health departments, the DHHS, similar bodies of the EU and its member states and other comparable agencies around the world, and, in the future, any changes to such laws and regulations could adversely affect us. We develop, configure and market our products to meet customer needs driven by those regulations. Among other rules affecting us, we are subject to laws and regulations concerning cGMP and product safety. Our subsidiaries may be required to register for permits and/or licenses with, and may be required to comply with, the laws and regulations of the FDA, the DHHS, the DEA, foreign agencies including the EMA, and other various state health departments and/or comparable state and foreign agencies as well as certain accrediting bodies depending upon the types of operations and locations of distribution and sale of the products manufactured or services provided by those subsidiaries. Any significant change in regulations could reduce demand for our products or increase our expenses. For example, many of our products are marketed to the biopharma industry for use in discovering, developing and manufacturing drugs, or are sold as raw materials or components to drug device manufacturers or for use in the manufacture of implantable devices. Changes in the domestic or foreign regulation of drug discovery, development or manufacturing processes or medical device manufacturing processes, or adverse findings concerning any health effects associated with these products, could have an adverse effect on the demand for these products and could also result in legal liability and claims.
Our operations are subject to a broad array of regulatory requirements globally. In particular, certain portions of our business must satisfy domestic and international standards in the medical, biopharmaceutical and other health sciences areas involving products and technologies which impact human health and safety. In addition, some of our operations must meet governmental requirements in terms of contracting, sourcing, financial accounting standards, product testing and reporting. We are required to comply with economic sanctions laws, which may affect our transactions with certain customers, business partners and other persons and entities. There are also business operations that produce products regulated by import/export regulations because their actual or potential use is considered sensitive and involves substantial licensing and record-keeping obligations. In addition, we are registered with the DDTC, as a manufacturer and exporter of goods controlled by ITAR, and we are subject to strict export control and prior approval requirements related to these goods. Our failure to comply with ITAR and other export
27
control laws and regulations, as well as economic sanctions, could result in penalties, loss, or suspension of contracts or other consequences. Any of these could adversely affect our operations and financial condition. Failure by us or by our customers to meet one or more of these various regulatory obligations could have adverse consequences in the event of material non-compliance. Compliance with relevant sanctions and export control laws could restrict our access to, and increase the cost of obtaining, certain products and at times could interrupt our supply of imported inventory or our ability to service certain customers. Conversely, compliance with these regulatory obligations may require us to incur significant expenses.
Although we believe that we comply in all material respects with applicable laws and regulations, there can be no assurance that a regulatory agency or tribunal would not reach a different conclusion concerning the compliance of our operations with applicable laws and regulations. In addition, there can be no assurance that we will be able to maintain or renew existing permits, licenses or other regulatory approvals or obtain, without significant delay, future permits, licenses or other approvals needed for the operation of our businesses. Any noncompliance by us with applicable laws and regulations or the failure to maintain, renew or obtain necessary permits and licenses could have an adverse effect on our results of operations and financial condition. Furthermore, loss of a permit, license or other approval in any one portion of our business may have indirect consequences in other portions of our business if regulators or customers, for example cease doing business with such other portion due to fears that such loss is a sign of broader concerns about our ability to deliver products or services of sufficient quality.
Violation of government regulations or quality programs could harm demand for our products or services.
Some of our testing procedures and products, as well as some of the products manufactured by our customers which incorporate our products, are regulated by the FDA, the EMA and other comparable local, state, federal, foreign and transnational regulatory authorities. As applicable, we and our customers may be required to comply with laws and regulations enforced by the FDA and comparable state and foreign agencies. Failure to comply with these laws and regulations can lead to agency action, including warning letters, product recalls, product seizures, monetary sanctions, injunctions to halt manufacturing or distribution, restrictions on our operations, withdrawal of existing or denial of pending approvals, permits or registrations, including those relating to products or facilities, debarment consent decrees and civil and criminal sanctions. To the extent these agencies were to take enforcement action, such action may be publicly available, and such publicity could harm our ability to sell these regulated products globally and may harm our reputation. In addition, such actions could limit the ability of our customers to obtain regulatory clearance or approval for their products in the United States or abroad and/or our customers may incur significant costs in obtaining or maintaining such regulatory clearances or approvals in the United States or abroad. In addition, any such failure relating to the products we provide exposes us to direct and third-party product liability claims as well as contractual claims from our customers, including claims for reimbursement for lost or damaged products, as well as potential recall liability, which costs could be significant. Customers may also claim loss of profits due to lost or delayed sales, although our direct contracts with end customers typically
28
place limits on such claims. There can be no assurance that any such contractual limitation will be applicable or sufficient or fully enforced in any given situation.
Additionally, some of our customers use our products in the manufacturing or testing processes for their drug and medical device products, and such end-products may be regulated by the FDA under pharmaceutical cGMP for drugs and Quality System Regulations for medical devices, or by the Centers for Medicare and Medicaid Services under the Clinical Laboratory Improvement Amendments. The customer is ultimately responsible for all compliance requirements relating to the manufacture and sale of their end-products; however, our customers rely on us to provide products in compliance with laws and regulations enforced by the FDA and comparable state and foreign agencies. Should any non-compliance be related to the products we sell, we could lose sales and customers and be exposed to liability claims.
Many of our facilities are either FDA-registered or the international equivalent or cGMP manufacturing sites. As such, these facilities are subject to periodic inspections by the FDA and/or foreign regulatory authorities to determine compliance with applicable regulations. Any failure to comply with these regulations could require us to implement costly remedial measures, institute product recalls, cease manufacturing products or commence manufacturing at an alternative facility, if available, until such issues are remediated. In addition, certain of our facilities are certified to ISO, including ISO 13485, ISO 9001, AS9100, ISO 22000 and/or ISO 14001. These standards are voluntary quality management system standards, the maintenance of which indicates to customers certain quality and operational norms. Customers may rely on contractual assurances that we make with respect to ISO certificates to transact business. Failure to comply with these ISO standards can lead to observations of non-compliance or even suspension of ISO or AS certifications or EC Declarations of Conformity Certificates by the registrar. If we were to lose ISO or AS certifications or EC Declarations of Conformity, we could lose sales and customers to competitors or other suppliers. We are also subject to periodic inspections or audits by our customers. If these audits or inspections identify issues or the customer perceives there are issues, the customer may decide to cease purchasing products from us which could adversely affect our business.
If we violate a government-mandated or voluntary quality program, we may incur additional expense to come back into compliance with such government mandated or voluntary standards. That expense may be material and we may not have anticipated that expense in our financial forecasts. Our financial results could suffer as a result of such increased expenses.
We are subject to environmental, health and safety laws and regulations, and costs to comply with such laws and regulations, or any liability or obligation imposed under such laws or regulations, could negatively impact our business, financial condition and results of operations.
We are subject to a broad range of foreign, federal, state and local environmental, health and safety laws and regulations, including those of the EPA, OSHA and equivalent local, state, and foreign regulatory agencies in each of the jurisdictions in which we operate. These laws and regulations govern, among other things: air emissions; wastewater discharges; the manufacturing, handling, disposal and transport of hazardous materials and solid waste; the
29
manufacturing, processing and selling of chemical substances; the investigation and remediation of soil and groundwater contamination and otherwise relating to health and safety of our employees; and the protection of the environment and natural resources. Further, as our global operations have involved and continue to involve the manufacturing, handling, transport and distribution of materials that are, or could be classified as toxic or hazardous, there is a risk of contamination and environmental damage inherent in our operations and the products we manufacture, handle, transport and distribute. Our environmental, health and safety liabilities and obligations may result in significant capital expenditures and other costs, which could negatively impact our business, financial condition and results of operations. We may be fined or penalized by regulators for failing to comply with environmental, health and safety laws and regulations. For example, the EPA inspected our Phillipsburg, New Jersey facility in March 2017 and June 2017, and in April 2018 notified us of potential liabilities under the Toxic Substances Control Act and the Emergency Planning and Community Right to Know Act, and proposed that we pay civil penalties. See Item 3, “Legal Proceedings.” In addition, contamination resulting from our current or past operations or from past uses of land that we own or operate may trigger investigation or remediation obligations, which may have an adverse effect on our business, financial condition and results of operations. We cannot be certain that identification of presently unidentified environmental, health and safety conditions, new regulations, more vigorous enforcement by regulatory authorities or other unanticipated events will not arise in the future and give rise to additional environmental liabilities, business interruptions, compliance costs or penalties which could have an adverse effect on our business, financial condition and results of operations. In addition, environmental, health and safety laws and regulations are constantly evolving and it is not possible to predict accurately the effect they, or any new regulations or legislation may have in future periods.
We currently incur costs and may incur additional costs related to remediation of alleged environmental damage associated with past or current waste disposal practices or other hazardous materials handling at property that we currently own or operate, or formerly owned or operated, or facilities to which we arranged for the disposal of hazardous substances. Our liabilities arising from past or future releases of, or exposures to, hazardous substances may exceed our estimates or adversely affect our financial statements and reputation and we may be subject to additional claims for cleanup or other environmental claims in the future based on our past, present or future business activities, or that we will be able to recover any costs under any indemnifications that we have. For additional information regarding environmental matters, see note
12
to the consolidated financial statements beginning on page F-1 of this report.
Risks related to our indebtedness
Our substantial indebtedness could adversely affect our financial condition and prevent us from fulfilling our debt or contractual obligations.
Through our subsidiaries, we have a substantial amount of indebtedness, which requires us to make significant interest and principal payments. As of
December 31, 2019
, we had indebtedness of
$5,249.4 million
and
$416.7 million
of additional borrowing capacity under our credit
30
facilities. Our high level of debt could have important consequences to us including the following:
|
•
|
making it more difficult for us to satisfy our debt or contractual obligations;
|
|
•
|
exposing us to the risk of increased interest rates as certain of our borrowings, including borrowings under our senior secured credit facilities, are at variable rates of interest;
|
|
•
|
restricting us from making strategic acquisitions or causing us to make non-strategic divestitures;
|
|
•
|
requiring us to dedicate a substantial portion of our cash flow from operations to payments on our indebtedness, which would reduce the funds available for working capital, capital expenditures, investments, acquisitions and other general corporate purposes;
|
|
•
|
limiting our flexibility in planning for, or reacting to, changes in our business, future business opportunities and the industry in which we operate;
|
|
•
|
placing us at a competitive disadvantage compared to any of our less leveraged competitors;
|
|
•
|
increasing our vulnerability to a downturn in our business and both general and industry-specific adverse economic conditions; and
|
|
•
|
limiting our ability to obtain additional financing at a favorable cost of borrowing, or at all, or to dispose of assets to raise funds, to fund future working capital, capital expenditures, investments, acquisitions or other general corporate requirements.
|
Any of the above-listed factors could have an adverse effect on our business, financial condition and results of operations and our ability to meet our payment obligations.
Our debt agreements contain restrictions on our ability to operate our business and to pursue our business strategies, and our failure to comply with, cure breaches of, or obtain waivers for covenants could result in an acceleration of the due date of our indebtedness.
The agreements governing our senior secured credit facilities, the notes and the receivables facility contain, and agreements governing future debt issuances may contain, covenants that restrict our ability to finance future operations or capital needs, to respond to changing business and economic conditions or to engage in other transactions or business activities that may be important to our growth strategy or otherwise important to us. The agreements governing our existing indebtedness restrict, subject to certain exceptions, among other things, Avantor Funding, Inc.’s ability and the ability of its subsidiaries to:
|
•
|
incur additional indebtedness and guarantee indebtedness;
|
|
•
|
create or incur liens;
|
31
|
•
|
make investments and loans;
|
|
•
|
engage in mergers, consolidations or sales of all or substantially all of our assets;
|
|
•
|
pay dividends or make other distributions, in respect of, or repurchase or redeem, capital stock;
|
|
•
|
prepay, redeem or repurchase certain debt;
|
|
•
|
engage in certain transactions with affiliates;
|
|
•
|
sell or otherwise dispose of assets;
|
|
•
|
sell stock of our subsidiaries;
|
|
•
|
enter into agreements restricting our and our subsidiaries ability to pay dividends; and
|
|
•
|
amend, modify, waive or supplement certain subordinated indebtedness to the extent such amendments would be materially adverse to lenders.
|
In addition, any future financing arrangements entered into by us or any of our subsidiaries may contain similar restrictions. As a result of these covenants and restrictions, through our subsidiaries we are and will be limited in how we conduct our business, and we may be unable to raise additional debt or equity financing to compete effectively or to take advantage of new business opportunities. In addition, Avantor Funding, Inc. is required to maintain specified financial ratios and satisfy other financial condition tests. See Item 7, “Management’s discussion and analysis of financial condition and results of operations — Liquidity and capital resources — Indebtedness.” The terms of any future indebtedness we or our subsidiaries may incur could include more restrictive covenants. We cannot assure you that we will be able to maintain compliance with these covenants in the future and, if we fail to do so, that we will be able to obtain waivers from the lenders and/or amend the covenants.
Our or our subsidiaries’ failure to comply with the restrictive covenants described above as well as others contained in our or our subsidiaries’ future debt instruments from time to time could result in an event of default, which, if not cured or waived, could result in our being required to repay these borrowings before their maturity. If we are forced to refinance these borrowings on less favorable terms or cannot refinance these borrowings, our results of operations and financial condition could be adversely affected. If we were unable to repay or otherwise refinance these borrowings, the lenders under our senior secured credit facilities and/or the collateral agent under our senior secured notes could proceed against the collateral granted to them to secure such indebtedness, which could force us into bankruptcy or liquidation. Any such acceleration may also constitute a termination event under our receivables facility, which could result in the amount outstanding under that facility becoming due and payable. Any acceleration of amounts due under our debt agreements, or the exercise by the applicable lenders or agent of their rights under the related security documents, would likely have a material adverse effect on our business.
32
Despite our current level of indebtedness, we and our subsidiaries may still be able to incur substantially more debt.
We and our subsidiaries may be able to incur significant additional indebtedness in the future. Although our credit agreement and indentures contain restrictions on the incurrence of additional indebtedness, these restrictions are subject to a number of qualifications and exceptions, and the additional indebtedness incurred in compliance with these restrictions could be substantial. If new debt is added to our current debt levels, the related risks that we now face could intensify.
We may be unable to generate sufficient cash flow to satisfy our significant debt service obligations, which could have a material adverse effect on our business, financial condition and results of operations.
Our ability to service our indebtedness and to refinance our indebtedness will depend on our ability to generate cash in the future and is subject to general economic, financial, competitive, legislative, regulatory and other factors that are beyond our control. If our business does not generate sufficient cash flow from operations, in the amounts projected or at all, or if future borrowings are not available to us in amounts sufficient to fund our other liquidity needs, our business, financial condition and results of operations could be materially adversely affected.
If we cannot generate sufficient cash flow from operations to service our indebtedness in the future, we may need to refinance all or a portion of our indebtedness on or before maturity, sell assets, delay capital expenditures or seek additional equity. The terms of our existing or future debt agreements may also restrict us from effecting any of these alternatives. Any refinancing of our debt could be at higher interest rates and may require us to comply with more onerous covenants, which could further restrict our business operations. Further, changes in the credit and capital markets, including market disruptions and interest rate fluctuations, may increase the cost of financing, make it more difficult to obtain favorable terms, or restrict our access to these sources of future liquidity. In addition, any failure to make required payments on our outstanding indebtedness would likely result in a reduction of our credit rating, which could harm our ability to incur additional indebtedness on commercially reasonable terms or at all. Our inability to generate sufficient cash flow to satisfy our debt service obligations, or to refinance or restructure our obligations on commercially reasonable terms or at all, could have a material adverse effect on our business, financial condition and results of operations, as well as on our ability to satisfy our obligations in respect of our indebtedness.
An increase in interest rates may negatively impact our operating results and financial condition.
Certain of our borrowings, including borrowings under our senior secured credit facilities and our receivables facility, to the extent the interest rate is not fixed, are at variable rates of interest. An increase in interest rates would have a negative impact on our results of operations by causing an increase in interest expense.
Our total interest expense was
$440.0 million
in
2019
and
$523.8 million
in
2018
.
33
Our ability to repay our indebtedness is affected by the cash flow generated by our subsidiaries.
Our subsidiaries own substantially all of our assets and conduct substantially all of our operations. Accordingly, repayment of our indebtedness will be dependent on the generation of cash flow by our subsidiaries and their ability to make such cash available to us, by dividend, debt repayment or otherwise. Our subsidiaries may not be able to, or may not be permitted to, make distributions to enable us or Avantor Funding, Inc. to make payments in respect of our indebtedness. Each subsidiary is a distinct legal entity and, under certain circumstances, legal and contractual restrictions may limit our ability to obtain cash from our subsidiaries. While our credit agreement and indentures limit the ability of our subsidiaries to incur consensual restrictions on their ability to pay dividends or make other intercompany payments to us, these limitations are subject to certain qualifications and exceptions.
Risks related to ownership of our stock
Our stock price may be volatile or may decline regardless of our operating performance, and you may not be able to resell shares of our common stock at or above the price you paid or at all, and you could lose all or part of your investment as a result.
You may not be able to resell your shares at or above the price at which you purchased them due to a number of factors such as those listed in “—Risks related to our business” and the following:
|
•
|
results of operations that vary from the expectations of securities analysts and investors;
|
|
•
|
results of operations that vary from those of our competitors;
|
|
•
|
changes in expectations as to our future financial performance, including financial estimates and investment recommendations by securities analysts and investors;
|
|
•
|
changes in economic conditions for companies in our industry;
|
|
•
|
changes in market valuations of, or earnings and other announcements by, companies in our industry;
|
|
•
|
declines in the market prices of stocks generally, particularly those of companies in our industry;
|
|
•
|
additions or departures of key management personnel;
|
|
•
|
strategic actions by us or our competitors;
|
|
•
|
announcements by us, our competitors or our suppliers of significant contracts, price reductions, new products or technologies, acquisitions, joint marketing relationships, joint ventures, other strategic relationships or capital commitments;
|
|
•
|
changes in preference of our customers;
|
34
|
•
|
changes in general economic or market conditions or trends in our industry or the economy as a whole;
|
|
•
|
changes in business or regulatory conditions;
|
|
•
|
future sales of our common stock or other securities;
|
|
•
|
investor perceptions of or the investment opportunity associated with our common stock relative to other investment alternatives;
|
|
•
|
the public’s response to press releases or other public announcements by us or third parties, including our filings with the SEC;
|
|
•
|
announcements relating to litigation or governmental investigations;
|
|
•
|
guidance, if any, that we provide to the public, any changes in this guidance or our failure to meet this guidance;
|
|
•
|
the development and sustainability of an active trading market for our stock;
|
|
•
|
changes in accounting principles; and
|
|
•
|
other events or factors, including those resulting from informational technology system failures and disruptions, natural disasters, war, acts of terrorism or responses to these events.
|
Furthermore, the stock market may experience extreme volatility that, in some cases, may be unrelated or disproportionate to the operating performance of particular companies. These broad market and industry fluctuations may adversely affect the market price of our common stock, regardless of our actual operating performance. In addition, price volatility may be greater if the public float and trading volume of our common stock is low.
In the past, following periods of market volatility, stockholders have instituted securities class action litigation. If we were to become involved in securities litigation, it could have a substantial cost and divert resources and the attention of executive management from our business regardless of the outcome of such litigation.
The outstanding shares of MCPS may adversely affect the market price of our common stock.
The market price of our common stock is likely to be influenced by the outstanding shares of MCPS. For example, the market price of our common stock could become more volatile and could be depressed by:
|
•
|
investors’ anticipation of the potential resale in the market of a substantial number of additional shares of our common stock received upon conversion of the MCPS;
|
35
|
•
|
possible sales of our common stock by investors who view the MCPS as a more attractive means of equity participation in us than owning shares of our common stock; and
|
|
•
|
hedging or arbitrage trading activity that may develop involving the MCPS and our common stock.
|
Certain rights of the holders of the MCPS could delay or prevent an otherwise beneficial takeover or takeover attempt of us.
Certain rights of the holders of the MCPS could make it more difficult or more expensive for a third party to acquire us. For example, if a fundamental change, as defined in the Registration Statement, were to occur on or prior to May 15, 2022, holders of the MCPS may have the right to convert their MCPS, in whole or in part, at an increased conversion rate and will also be entitled to receive a make-whole amount equal to the present value of all remaining dividend payments on their MCPS as described in the certificate of designations governing the MCPS. These features of the MCPS could increase the cost of acquiring us or otherwise discourage a third party from acquiring us or removing incumbent management.
Our common stock ranks junior to the MCPS with respect to the payment of dividends and amounts payable in the event of our liquidation, dissolution or winding-up of our affairs.
Our common stock ranks junior to the MCPS with respect to the payment of dividends and amounts payable in the event of our liquidation, dissolution or winding-up of our affairs. This means that, unless accumulated and unpaid dividends have been declared and paid, or set aside for payment, on all outstanding shares of the MCPS for all preceding dividend periods, no dividends may be declared or paid on our common stock and we will not be permitted to purchase, redeem or otherwise acquire any of our common stock, subject to limited exceptions. Likewise, in the event of our voluntary or involuntary liquidation, dissolution or winding-up of our affairs, no distribution of our assets may be made to holders of our common stock until we have paid to holders of the MCPS a liquidation preference equal to $50.00 per share plus accumulated and unpaid dividends.
Holders of the MCPS have the right to elect two directors in the case of certain dividend arrearages.
Whenever dividends on any shares of the MCPS have not been declared and paid for the equivalent of six or more dividend periods, whether or not for consecutive dividend periods, the authorized number of directors on our Board of Directors will, at the next annual meeting of stockholders or at a special meeting of stockholders, if any, automatically be increased by two and the holders of such shares of the MCPS voting together as a single class with holders of other series of our voting preferred stock then outstanding will be entitled, at our next annual meeting of stockholders or at a special meeting of stockholders, if any, to vote for the election of a total of two additional members of our Board of Directors, subject to certain terms and limitations. This right to elect directors will dilute the representation of the holders of our common stock on our Board of Directors and may adversely affect the market price of our common stock.
36
Because we have no current plans to pay cash dividends on our common stock, you may not receive any return on investment unless you sell your common stock for a price greater than that which you paid for it.
We have no current plans to pay cash dividends on our common stock. The declaration, amount and payment of any future dividends on our common stock will be at the sole discretion of our Board of Directors. Our Board of Directors may take into account general and economic conditions, our financial condition and results of operations, our available cash and current and anticipated cash needs, capital requirements, contractual, legal, tax and regulatory restrictions and implications on the payment of dividends by us to our stockholders or by our subsidiaries to us, including restrictions under our credit agreement and other indebtedness we may incur, and such other factors as our Board of Directors may deem relevant. In addition, no dividends may be declared or paid on our common stock unless accumulated and unpaid dividends on the MCPS have been declared and paid, or set aside for payment, on all outstanding shares of the MCPS for all preceding dividend periods.
As a result, you may not receive any return on an investment in our common stock unless you sell our common stock for a price greater than your purchase price.
We are a holding company with no operations of our own and, as such, we depend on our subsidiaries for cash to fund all of our operations and expenses, including future dividend payments, if any.
Our operations are conducted entirely through our subsidiaries and our ability to generate cash to meet our debt service obligations or to make future dividend payments, if any, is highly dependent on the earnings and the receipt of funds from our subsidiaries via dividends or intercompany loans. We do not currently expect to declare or pay dividends on our common stock for the foreseeable future; however, to the extent that we determine in the future to pay dividends on our common stock, the agreements governing our indebtedness restrict the ability of our subsidiaries to pay dividends or otherwise transfer assets to us. See note
25
to the consolidated financial statements beginning on page F-1 of this report.
If securities or industry analysts do not publish research or reports about our business or if they downgrade our stock or our sector, our stock price and trading volume could decline.
The trading market for our common stock relies in part on the research and reports that industry or financial analysts publish about us or our business. We do not control these analysts. Furthermore, if one or more of the analysts who do cover us downgrade our stock or our industry, or change their views regarding the stock of any of our competitors, or publish inaccurate or unfavorable research about our business, the price of our stock could decline. If one or more of these analysts stop covering us or fail to publish reports on us regularly, we could lose visibility in the market, which in turn could cause our stock price or trading volume to decline.
37
Maintaining the requirements of being a public company may strain our resources, divert management’s attention and affect our ability to attract and retain qualified board members.
In the second quarter of 2019, we completed our IPO. As a public company, we incur significant legal, regulatory, finance, accounting, investor relations and other expenses that we did not incur as a private company, including costs associated with public company governance and reporting requirements. We also have incurred and will continue to incur costs associated with our compliance with the Sarbanes-Oxley Act of 2002 and the Dodd-Frank Wall Street Reform and Consumer Protection Act, as well as rules and regulations implemented by the SEC and costs in connection with continued listing on the NYSE. Our efforts to comply with these rules and regulations have significantly increased our legal and financial compliance costs and have made some activities more time-consuming or costly. Our management devotes a substantial amount of time to ensure that we comply with all of these requirements, diverting the attention of management away from revenue-producing activities. The expenses incurred by public companies generally for reporting and corporate governance purposes have been increasing. These laws and regulations also could make it more difficult or costly for us to obtain certain types of insurance, including director and officer liability insurance, and we may be forced to accept reduced policy limits and coverage or incur substantially higher costs to obtain the same or similar coverage. These laws and regulations could also make it more difficult for us to attract and retain qualified persons to serve on our Board of Directors, our board committees or as our executive officers. Furthermore, if we are unable to satisfy our obligations as a public company, we could be subject to delisting of our common stock and the MCPS, fines, sanctions and other regulatory action and potentially civil litigation.
Failure to comply with requirements to design, implement and maintain effective internal control over financial reporting could have a material adverse effect on our business and stock price,
and any failure to maintain financial controls could result in our financial statements becoming unreliable
.
As a public company, we have significant requirements for enhanced financial reporting and internal controls. We have made, and will continue to make, changes to our internal controls and procedures for financial reporting and accounting systems to meet our reporting obligations as a public company. The process of designing and implementing effective internal controls is a continuous effort that requires us to anticipate and react to changes in our business and the economic and regulatory environments and to expend significant resources to maintain a system of internal controls that is adequate to satisfy our reporting obligations as a public company. The measures we take may not be sufficient to satisfy our obligations as a public company, and if we are unable to establish or maintain appropriate internal financial reporting controls and procedures, it could cause us to fail to meet our reporting obligations on a timely basis, result in material misstatements in our consolidated financial statements and harm our results of operations.
In connection with the implementation of the necessary procedures and practices related to internal control over financial reporting, we may identify deficiencies that we may not be able to
38
remediate in time to meet the deadline imposed by the Sarbanes-Oxley Act of 2002 for compliance with the requirements of Section 404. In addition, we may encounter problems or delays in completing the remediation of any deficiencies identified by our independent registered public accounting firm in connection with the issuance of their attestation report.
Our testing, or the subsequent testing by our independent registered public accounting firm, may reveal deficiencies in our internal controls over financial reporting that are deemed to be material weaknesses which could result in a material misstatement of our annual or quarterly consolidated financial statements or disclosures that may not be prevented or detected.
We may not be able to conclude on an ongoing basis that we have effective internal control over financial reporting in accordance with Section 404 or our independent registered public accounting firm may not issue an unqualified opinion. If either we are unable to conclude that we have effective internal control over financial reporting or our independent registered public accounting firm is unable to provide us with an unqualified opinion, investors could lose confidence in our reported financial information, which could have a material adverse effect on the trading price of our common stock.
Future sales, or the perception of future sales, by us or our existing stockholders in the public market could cause the market price for our common stock to decline.
Sales of a substantial number of shares of our common stock in the public market, or the perception that such sales could occur, could substantially decrease the market price of shares of our common stock. These sales, or the possibility that these sales may occur, also might make it more difficult for us to sell equity securities in the future at a time and at a price that we deem appropriate.
As of
December 31, 2019
, we had
572.8 million
shares of our common stock outstanding. Of the outstanding shares, the
233.1 million
shares sold in the IPO are freely tradable without restriction or further registration under the Securities Act, except that any shares held by our affiliates, as that term is defined under Rule 144 of the Securities Act, or Rule 144, including our directors, executive officers and other affiliates (including New Mountain Capital and Goldman Sachs).
The
185.3 million
shares of common stock held by affiliates of New Mountain Capital, affiliates of Goldman Sachs and certain of our directors and executive officers as of
December 31, 2019
, representing
32%
of the total outstanding shares of our common stock are “restricted securities” within the meaning of Rule 144 and subject to certain restrictions on resale. Restricted securities may be sold in the public market only if they are registered under the Securities Act or are sold pursuant to an exemption from registration such as Rule 144.
In addition, pursuant to a registration rights agreement, New Mountain Capital, Goldman Sachs and certain other stockholders have the right, subject to certain conditions, to require us to register the sale of their shares of our common stock under the Securities Act. By exercising its registration rights and selling a large number of shares, New Mountain Capital and Goldman Sachs could cause the prevailing market price of our common stock to decline. Certain of our other stockholders have “piggyback” registration rights with respect to future registered offerings
39
of our common stock. As of
December 31, 2019
, the shares of common stock covered by registration rights would represent approximately
50%
of our total common stock outstanding. Registration of any of these outstanding shares of common stock would result in such shares becoming freely tradable without compliance with Rule 144 upon effectiveness of the registration statement.
44.5 million
shares of our common stock subject to our outstanding stock options or shares of our common stock subject to issuance under the Legacy Avantor Plan, the Vail Plan and our 2019 Plan have been registered with a registration statement on Form S-8 and will be available for sale in the open market, subject to limitations in the stockholders agreement. As of
December 31, 2019
, there were stock options outstanding to purchase a total of
22.7 million
shares of our common stock, and
5.2 million
shares of our common stock were subject to restricted stock units. In addition, as of
December 31, 2019
,
16.6 million
shares of common stock were reserved for future issuance under the 2019 Plan.
As restrictions on resale end, or if the existing stockholders exercise their registration rights, the market price of our shares of common stock could drop significantly if the holders of these shares sell them or are perceived by the market as intending to sell them. These factors could also make it more difficult for us to raise additional funds through future offerings of our shares of common stock or other securities.
In the future, we may also issue our securities in connection with investments or acquisitions. The amount of shares of our common stock issued in connection with an investment or acquisition could constitute a material portion of our then-outstanding shares of our common stock. Any issuance of additional securities in connection with investments or acquisitions may result in additional dilution to you.
Concentrations of shareholder control could have adverse impacts
Certain of our shareholders, including affiliates of New Mountain Capital and affiliates of Goldman Sachs, have considerable influence over us as a result of their share ownership. This concentration could lead to conflicts of interest and difficulties for non-insider investors effecting corporate changes, and could adversely affect our Company’s share price. These shareholders (and their affiliates) and certain of our directors and officers, acting together, hold approximately
32%
of our issued and outstanding shares as of
December 31, 2019
and have the ability to influence all matters submitted to our shareholders for approval (including the election and removal of directors and any merger, consolidation or sale of all or substantially all of our assets). In addition, in connection with the IPO, we entered into an investor rights agreement with an affiliate of New Mountain Capital, which agreement provides for the ability of New Mountain Capital to nominate members to our Board of Directors. Accordingly, this concentration of ownership may have the effect of delaying, deferring or preventing a change in control of our Company, impeding a merger, consolidation, takeover or other business combination involving us or discouraging a potential acquirer from making a tender offer or otherwise attempting to obtain control of us, which in turn could have a material adverse effect on the market price of our shares. The issuance of stock options and warrants could lead to greater concentration of share ownership among insiders and could lead to dilution of share
40
ownership which could lead to depressed share prices. In addition, New Mountain Capital and shareholders affiliated with Goldman Sachs may have different interests than other public investors.
Anti-takeover provisions in our organizational documents could delay or prevent a change of control.
Certain provisions of our amended and restated certificate of incorporation and amended and restated bylaws may have an anti-takeover effect and may delay, defer or prevent a merger, acquisition, tender offer, takeover attempt, or other change of control transaction that a stockholder might consider in its best interest, including those attempts that might result in a premium over the market price for the shares held by our stockholders. These provisions provide for, among other things:
|
•
|
a classified Board of Directors, as a result of which our Board of Directors is divided into three classes, with each class serving for staggered terms, with successors to the class of directors whose term expires at the first and second annual meetings of stockholders following the date of the IPO, as applicable, elected for a term expiring at the third annual meeting of stockholders following the date of the IPO;
|
|
•
|
the ability of our Board of Directors to issue one or more series of preferred stock;
|
|
•
|
advance notice requirements for nominations of directors by stockholders and for stockholders to include matters to be considered at our annual meetings;
|
|
•
|
certain limitations on convening special stockholder meetings;
|
|
•
|
the removal of directors either with or without cause and only upon the affirmative vote of the holders of at least 66
⅔
% of the shares of common stock entitled to vote generally in the election of directors; and
|
|
•
|
that certain provisions may be amended only by the affirmative vote of at least 66
⅔
% in voting power of all outstanding shares of stock entitled to vote generally in the election of directors, voting together as a single class.
|
These anti-takeover provisions could make it more difficult for a third party to acquire us, even if the third party’s offer may be considered beneficial by many of our stockholders. As a result, our stockholders may be limited in their ability to obtain a premium for their shares.
Our Board of Directors is authorized to issue and designate shares of our preferred stock in additional series without stockholder approval.
Our amended and restated certificate of incorporation authorizes our Board of Directors, without the approval of our stockholders, to issue
75.0 million
shares of our preferred stock (including
25.0 million
shares of MCPS), subject to limitations prescribed by applicable law, rules and regulations and the provisions of our amended and restated certificate of incorporation, as shares of preferred stock in series, to establish from time to time the number of shares to be included in
41
each such series and to fix the designation, powers, preferences and rights of the shares of each such series and the qualifications, limitations or restrictions thereof. The powers, preferences and rights of these additional series of preferred stock may be senior to or on parity with our common stock, which may reduce its value.
Our amended and restated certificate of incorporation provides, subject to limited exceptions, that state and federal courts (as appropriate) located within the State of Delaware will be the sole and exclusive forum for certain stockholder litigation matters, which could limit our stockholders’ ability to obtain a favorable judicial forum for disputes with us or our directors, officers, employees or stockholders.
Our amended and restated certificate of incorporation provides that unless we consent to the selection of an alternative forum, the state or federal courts (as appropriate) located within the State of Delaware shall, to the fullest extent permitted by law, be the sole and exclusive forum for any (i) derivative action or proceeding brought on behalf of our company, (ii) action asserting a claim of breach of a fiduciary duty owed by any director, officer, or other employee or stockholder of our company to us or our stockholders, creditors or other constituents, (iii) action against us or any of our directors or officers involving a claim or defense arising pursuant to any provision of the Delaware General Corporation Law or our amended and restated certificate of incorporation or our amended and restated bylaws, (iv) action against us or any director or officer of the Company involving a claim or defense implicating the internal affairs doctrine, or (v) action against us or any of our directors or officers involving a claim or defense arising pursuant to the Exchange Act or the Securities Act. It is possible that these exclusive forum provisions may be challenged in court and may be deemed unenforceable in whole or in part. Our exclusive forum provision shall not relieve the company of its duties to comply with the federal securities laws and the rules and regulations thereunder, and our stockholders will not be deemed to have waived our compliance with these laws, rules and regulations.
Any person or entity purchasing or otherwise acquiring any interest in shares of our capital stock shall be deemed to have notice of and consented to the forum provisions in our amended and restated certificate of incorporation. This choice of forum provision may limit a stockholder’s ability to bring a claim in a judicial forum that it finds favorable for disputes with us or any of our directors, officers, other employees or stockholders which may discourage lawsuits with respect to such claims. Alternatively, if a court were to find the choice of forum provision contained in our amended and restated certificate of incorporation to be inapplicable or unenforceable in an action, we may incur additional costs associated with resolving such action in other jurisdictions, which could harm our business, operating results and financial condition.
|
Item 1B.
|
Unresolved staff comments
|
Not applicable.
42
|
Item 2.
|
Properties
|
The following table sets forth information about our key properties at
December 31, 2019
:
|
(in thousands of square feet)
|
Size
|
Principal use
|
Status
|
|||
|
Americas:
|
||||||
|
Visalia, California
|
503
|
|
Distribution and offices
|
Owned
|
||
|
Phillipsburg, New Jersey
|
500
|
|
Manufacturing and offices
|
Owned
|
||
|
Paris, Kentucky
|
420
|
|
Manufacturing and distribution
|
Owned
|
||
|
Bridgeport, New Jersey
|
369
|
|
Distribution and offices
|
Owned
|
||
|
Batavia, Illinois
|
360
|
|
Distribution and offices
|
Owned
|
||
|
West Henrietta, New York
|
339
|
|
Assembly, distribution and offices
|
Owned
|
||
|
Carpinteria, California
|
270
|
|
Manufacturing, research & technology and offices
|
Leased
|
||
|
Solon, Ohio
|
255
|
|
Manufacturing, distribution and offices
|
Leased
|
||
|
Rochester, New York
|
205
|
|
Assembly and distribution
|
Leased
|
||
|
Sparks, Nevada
|
182
|
|
Manufacturing
|
Leased
|
||
|
Sterling, Virginia
|
174
|
|
Biostorage, warehousing and offices
|
Leased
|
||
|
Suwanee, Georgia
|
169
|
|
Distribution and offices
|
Leased
|
||
|
Bakersfield, California
|
165
|
|
Manufacturing and research & technology
|
Leased
|
||
|
Leesburg, Virginia
|
155
|
|
Biostorage and warehousing
|
Leased
|
||
|
Radnor, Pennsylvania
|
150
|
|
Corporate headquarters
|
Leased
|
||
|
Buford, Georgia
|
130
|
|
Customized kitting and distribution
|
Leased
|
||
|
Manati, Puerto Rico
|
130
|
|
Distribution and offices
|
Owned
|
||
|
Denver, Colorado
|
130
|
|
Distribution
|
Leased
|
||
|
Missouri City, Texas
|
120
|
|
Distribution
|
Leased
|
||
|
Irving, Texas
|
118
|
|
Manufacturing
|
Leased
|
||
|
Mississauga, Ontario, Canada
|
114
|
|
Distribution and offices
|
Leased
|
||
|
Mexico City, Mexico
|
100
|
|
Manufacturing and distribution
|
Owned
|
||
|
Overland, Missouri
|
90
|
|
Manufacturing and distribution
|
Leased
|
||
|
Claremont, California
|
86
|
|
Customized kitting and distribution
|
Leased
|
||
|
Ecatepec, Mexico
|
80
|
|
Manufacturing and distribution
|
Leased
|
||
|
Devens, Massachusetts
|
70
|
|
Manufacturing, distribution and offices
|
Leased
|
||
|
Aurora, Ohio
|
65
|
|
Manufacturing
|
Leased
|
||
43
|
(in thousands of square feet)
|
Size
|
Principal use
|
Status
|
|||
|
Tualatin, Oregon
|
56
|
|
Distribution
|
Leased
|
||
|
Franklin, Massachusetts
|
55
|
|
Distribution
|
Leased
|
||
|
Bethlehem, Pennsylvania
|
50
|
|
Manufacturing, distribution and offices
|
Leased
|
||
|
Bridgewater, New Jersey
|
36
|
|
Research & technology
|
Leased
|
||
|
Chester, Connecticut
|
35
|
|
Manufacturing and distribution
|
Leased
|
||
|
Chino, California
|
32
|
|
Equipment design and manufacturing
|
Leased
|
||
|
Allentown, Pennsylvania
|
12
|
|
Offices
|
Leased
|
||
|
Europe:
|
||||||
|
Briare, France
|
303
|
|
Distribution, repackaging and mixing
|
Owned
|
||
|
Bruchsal, Germany
|
219
|
|
Distribution
|
Owned
|
||
|
Gliwice, Poland
|
213
|
|
Manufacturing and distribution
|
Leased
|
||
|
Leuven, Belgium
|
207
|
|
Distribution and manufacturing
|
Owned
|
||
|
Lutterworth, United Kingdom
|
185
|
|
Distribution
|
Leased
|
||
|
Karlskoga, Sweden
|
131
|
|
Distribution
|
Leased
|
||
|
Stříbrná Skalice, Czech Republic
|
94
|
|
Custom kitting, distribution and offices
|
Leased
|
||
|
Dublin, Ireland
|
77
|
|
Distribution
|
Leased
|
||
|
Barcelona, Spain
|
73
|
|
Distribution
|
Leased
|
||
|
Debrecen, Hungary
|
68
|
|
Distribution
|
Leased
|
||
|
Søborg, Denmark
|
66
|
|
Distribution and offices
|
Leased
|
||
|
Darmstadt, Germany
|
56
|
|
Offices
|
Leased
|
||
|
Fontenay-Sous-Bois, France
|
56
|
|
Offices
|
Leased
|
||
|
Chorley, United Kingdom
|
27
|
|
Distribution, service and offices
|
Leased
|
||
|
AMEA:
|
||||||
|
Perth, Australia
|
90
|
|
Manufacturing, distribution and offices
|
Leased
|
||
|
Panoli, India
|
80
|
|
Manufacturing
|
Leased
|
||
|
Singapore
|
74
|
|
Distribution
|
Leased
|
||
|
Coimbatore, India
|
63
|
|
Service center
|
Leased
|
||
|
Shanghai, China
|
39
|
|
Research & technology and offices
|
Leased
|
||
|
Hyderabad, India
|
26
|
|
Warehouse
|
Leased
|
||
|
Dehradun, India
|
23
|
|
Manufacturing
|
Leased
|
||
|
Mumbai, India
|
18
|
|
Research & technology
|
Leased
|
||
|
Gurgaon, India
|
15
|
|
Offices
|
Leased
|
||
|
Chubei City, Taiwan
|
14
|
|
Research & technology and offices
|
Leased
|
||
|
Gwanggyo, Korea
|
2
|
|
Laboratory
|
Leased
|
||
|
Seoul, Korea
|
1
|
|
Offices
|
Leased
|
||
|
Item 3.
|
Legal proceedings
|
In April 2018 the EPA notified us of potential liabilities under the Toxic Substances Control Act and the Emergency Planning and Community Right to Know Act that were identified in March
44
2017 and June 2017 inspections of our Phillipsburg, New Jersey facility. The alleged violations relate to our failure to timely file reports regarding the Phillipsburg facility. We have also become aware of additional potential liabilities under the Toxic Substances Control Act relating to failure to timely file reports regarding the Paris, Kentucky facility, and relating to export shipments of elemental mercury, which we have voluntarily disclosed to the EPA. We have taken steps to correct these errors and have filed amended reports. The EPA has proposed total civil penalties of
$1.5 million
relating to these issues. While we are cooperating with the EPA and pursuing a negotiated resolution, we cannot predict with certainty the amount of penalties that may ultimately be imposed.
For additional information regarding legal proceedings and matters, see note
12
to our consolidated financial statements beginning on page F-1 of this report, which information is incorporated into this item by reference.
|
Item 4.
|
Mine safety disclosures
|
Not applicable.
45
Information about our executive officers
The following table sets forth certain information regarding our executive officers at
January 31, 2020
:
|
Age
|
Position
|
||
|
Michael Stubblefield
|
47
|
Director, President and Chief Executive Officer
|
|
|
Thomas Szlosek
|
56
|
Executive Vice President and Chief Financial Officer
|
|
|
James Bramwell
|
53
|
Executive Vice President, Strategic Partners
|
|
|
Gerard Brophy
|
54
|
Executive Vice President, Biopharma Production
|
|
|
Christophe Couturier
|
54
|
Executive Vice President, Services, Strategy and Business Transformation
|
|
|
Tanya Foxe
|
48
|
Executive Vice President, Global Operations and Supply Chain
|
|
|
Sven Henrichwark
|
53
|
Executive Vice President, APAC
|
|
|
Eric McAllister
|
55
|
Executive Vice President and Chief Human Resources Officer
|
|
|
Justin Miller
|
53
|
Executive Vice President, General Counsel and Secretary
|
|
|
Mark Murray
|
49
|
Executive Vice President, Biomaterials and Advanced Technologies
|
|
|
Devashish Ohri
|
53
|
Executive Vice President, IMEA
|
|
|
Frederic Vanderhaegen
|
52
|
Executive Vice President, Europe
|
|
|
Michael Wondrasch
|
51
|
Executive Vice President and Chief Information Officer
|
|
Unless indicated to the contrary, the business experience summaries provided below describe positions held by the named individuals during the last five years.
Michael Stubblefield
became our President and Chief Executive Officer in 2014. In addition, Mr. Stubblefield also serves as a Director. Prior to joining us, Mr. Stubblefield was a Senior Expert for the Chemicals Practice of McKinsey & Company, a management consulting firm, from 2013 to 2014.
Thomas Szlosek
is our Executive Vice President and Chief Financial Officer, a position he has held since December 2018. Mr. Szlosek previously served as the Senior Vice President and Chief Financial Officer of Honeywell International, Inc., a diversified technology and manufacturing company, from April 2014 to August 2018. Mr. Szlosek is also a Certified Public Accountant.
James Bramwell
is our Executive Vice President, Strategic Partners, a position he has held since November 2017. Prior to his current role, Mr. Bramwell served as Senior Vice President, Strategic Partners and Global Export of VWR, a position he held from March 2016 to November 2017. From June 2008 until March 2016, Mr. Bramwell served as VWR’s Senior Vice President, Strategic Partners.
Gerard Brophy
is our Executive Vice President, Biopharma Production, a position he has held since July 2018. Dr. Brophy joined us from GE Healthcare, a medical technology and life sciences company where he spent more than 14 years in a variety of senior level positions, most
46
recently as the Head of Cell Therapy, Life Sciences from January 2017 to July 2018, and Chief Technology Officer, Life Sciences from April 2013 to January 2017.
Christophe Couturier
is our Executive Vice President, Services, Strategy and Business Transformation, a position he has held since April 2018. Prior to joining Avantor, Mr. Couturier served as chief executive officer of Salicornia, LLC, a personal consulting company, from September 2017 to April 2018 and, before Salicornia, as chief financial officer at OvaScience, a biotechnology company, from September 2016 to July 2017. Prior to OvaScience, Mr. Couturier spent more than 12 years at Millipore Sigma, a life science and high technology company, where he held a variety of services, merger integration, general management, finance and consulting positions.
Tanya Foxe
is our Executive Vice President, Global Operations and Supply Chain, a position she has held since September 2019. Prior to joining us, Ms. Foxe acted as Global Senior Vice President, Supply Chain, Medical Devices and Strategic Initiatives at Johnson & Johnson, a diversified manufacturer and research and development company in the healthcare field, from February 2014 to September 2019.
Sven Henrichwark
is our Executive Vice President, APAC, a position he has held since January 2019. Prior to joining Avantor, Mr. Henrichwark led medical technology investment activities for SPRIM Ventures from June 2019 to January 2020, and before SPRIM, served as chief executive officer of Echosens, a medical technology company from June 2018 to May 2019. Mr. Henrichwark also spent more than 12 years at GE Healthcare, a medical technology and life sciences company, including General Manager, Business Operations & Service for APAC. He also was General Manager, Global Commercial Bioprocess for GE Life Sciences, where he led commercial activities for biomanufacturing and the protein science business.
Eric McAllister
is our Executive Vice President and Chief Human Resources Officer, a position he has held since March 2017. Prior to joining us, Mr. McAllister acted as Senior Vice President, Human Resources for Westinghouse Electric Company, a supplier of safe and innovative nuclear technology, where he led the global human resources and security organizations from 2014 to February 2017.
Justin Miller
is our Executive Vice President, General Counsel and Secretary, a position he has held since December 2017. Prior to joining us, Mr. Miller was Of Counsel at Ballard Spahr LLP from December 2015 to December 2017. Prior to Ballard Spahr, Mr. Miller spent 20 years at DuPont, a science company, in a number of leadership positions within the legal group, serving most recently as Associate General Counsel and Chief Litigation Counsel from 2013 to 2015.
Mark Murray
is our Executive Vice President, Biomaterials and Advanced Technologies, a position he has held since January 2020. Prior to joining us, Mr. Murray spent 13 years at Celanese, a global chemicals manufacturer, in a number of leadership positions including, most recently, Vice President of Global Sales for its material solutions business as well as leader of its global emulsions and ethylene vinyl acetate performance polymers businesses.
47
Devashish Ohri
is our Executive Vice President, AMEA, a position he has held since 2014. Prior to joining us, Mr. Ohri acted as Managing Director, South Asia for Life Technologies, a biotechnological company, from 2010 to 2014.
Frederic Vanderhaegen
is our Executive Vice President, Europe, a position he has held since October 2018. Mr. Vanderhaegen joined us from Ortho Clinical Diagnostics, an in vitro diagnostics company, where he served as Vice President and General Manager, EMEA from June 2015 to October 2018. Prior to Ortho Clinical Diagnostics, Mr. Vanderhaegen acted as Vice President of Sales at Beckman Coulter, a company that develops, manufactures and markets diagnostic systems for complex biomedical testing, from October 2012 to June 2015.
Michael Wondrasch
is our Executive Vice President and Chief Information Officer, a position he has held since April 2018. Prior to joining us, Mr. Wondrasch served as Global Chief Technology Officer at Bunge, an agribusiness and food ingredient company, from January 2017 to April 2018. Prior to Bunge, Mr. Wondrasch was Senior Vice President and Chief Technology Officer at Pepsico, a food, snack and beverages company, from July 2013 to December 2016.
PART II
|
Item 5.
|
Market for registrant’s common equity, related stockholder matters and issuer purchases of equity securities
|
Principal markets for common stock
Our common stock is listed on the NYSE under the symbol “AVTR.” The following table presents the low and high sales prices of our common stock for each of the full quarterly periods since our IPO:
|
Low
|
High
|
||||||
|
Third quarter 2019
|
$
|
13.44
|
|
$
|
19.59
|
|
|
|
Fourth quarter 2019
|
13.33
|
|
18.85
|
|
|||
Holders of common stock
On
January 31, 2020
, we had
87
holders of record of our common stock. This does not include holdings in street or nominee names.
Dividends
We currently do not expect to pay any dividends on our common stock. Additionally, our subsidiaries are party to certain debt agreements that would restrict their ability to fund future dividend payments to our common stockholders. For more information, see note
25
to our consolidated financial statements beginning on page F-1 of this report.
48
Stock performance graph
The following graph compares the return on a $100 investment in our common stock made on May 17, 2019, the day we first began trading on the NYSE, with a $100 investment also made on May 17, 2019 in the S&P MidCap 400 Index and the S&P MidCap 400 Health Care Index. The S&P MidCap 400 Index is a broad equity market index of companies having market capitalization similar to ours. The S&P MidCap 400 Health Care Index is an industry-specific equity market index that we believe closely aligns to us based on the following: (i) the index follows companies of a similar size to us in terms of net sales and market capitalization; (ii) the index includes health care distributors, the segment of the Global Industry Classification Standard that we believe most closely aligns to us; and (iii) the index includes companies in the biopharma and healthcare industries, two of our primary customer groups that together comprise over half of our net sales.
The information in this section is not “soliciting material,” is not deemed “filed” with the SEC and is not to be incorporated by reference in any of our filings under the Securities Act of 1933, as amended, or the Securities Exchange Act of 1934, as amended, whether made before or after the date of this Annual Report on Form 10-K, except to the extent that we specifically incorporate such information by reference. The stock performance shown below is not necessarily indicative of future performance.
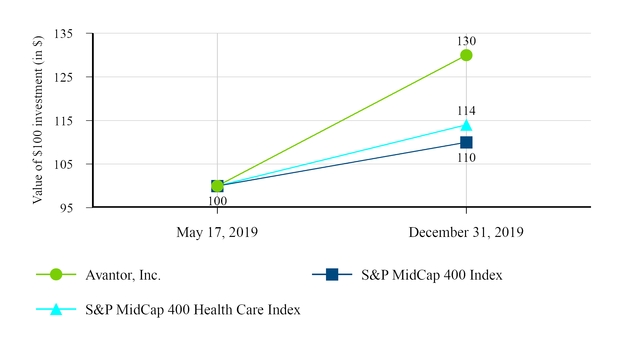
Unregistered sales of equity securities
During the three months ended December 31, 2019, we issued an aggregate of 1.0 million shares of common stock to warrant holders who exercised outstanding warrants pursuant to the
49
warrants' cash exercise mechanism. The cash proceeds received from the exercises was not material.
These warrants had an exercise price of $0.002 per share. The warrants were originally issued to holders of our series A preferred stock in connection with our acquisition of VWR in 2017.
The securities were issued in reliance upon the exemption from registration provided under Section 4(a)(2) of the Securities Act of 1933, as amended, as transactions not involving a public offering due to lack of general solicitation or advertising, the status and knowledge of the warrant holders and publicly available information about us and our operations.
50
|
Item 6.
|
Selected financial data
|
|
(in millions except per share data)
|
Year ended December 31,
|
||||||||||||||||||
|
2019
|
2018
|
2017
|
2016
|
2015
|
|||||||||||||||
|
Statement of operations data:
|
(1,2,3)
|
(4)
|
(1,3,4,5,6)
|
(1,3,6)
|
|||||||||||||||
|
Net sales
|
$
|
6,040.3
|
|
$
|
5,864.3
|
|
$
|
1,247.4
|
|
$
|
691.3
|
|
$
|
636.9
|
|
||||
|
Cost of sales
|
4,119.6
|
|
4,044.5
|
|
814.6
|
|
371.6
|
|
374.7
|
|
|||||||||
|
Gross profit
|
1,920.7
|
|
1,819.8
|
|
432.8
|
|
319.7
|
|
262.2
|
|
|||||||||
|
Selling, general and administrative expenses
|
1,368.9
|
|
1,405.3
|
|
449.7
|
|
281.5
|
|
199.4
|
|
|||||||||
|
Fees to New Mountain Capital
|
—
|
|
1.0
|
|
193.5
|
|
28.3
|
|
2.5
|
|
|||||||||
|
Operating income (loss)
|
551.8
|
|
413.5
|
|
(210.4
|
)
|
9.9
|
|
60.3
|
|
|||||||||
|
Interest expense
|
(440.0
|
)
|
(523.8
|
)
|
(200.9
|
)
|
(60.4
|
)
|
(30.8
|
)
|
|||||||||
|
Loss on extinguishment of debt
|
(73.7
|
)
|
—
|
|
(56.4
|
)
|
(19.9
|
)
|
—
|
|
|||||||||
|
Other income (expense), net
|
2.5
|
|
(3.5
|
)
|
7.5
|
|
(0.2
|
)
|
0.3
|
|
|||||||||
|
Income (loss) before income taxes
|
40.6
|
|
(113.8
|
)
|
(460.2
|
)
|
(70.6
|
)
|
29.8
|
|
|||||||||
|
Income tax (expense) benefit
|
(2.8
|
)
|
26.9
|
|
314.9
|
|
(10.1
|
)
|
(17.1
|
)
|
|||||||||
|
Net income (loss)
|
$
|
37.8
|
|
$
|
(86.9
|
)
|
$
|
(145.3
|
)
|
$
|
(80.7
|
)
|
$
|
12.7
|
|
||||
|
Per share data:
|
|||||||||||||||||||
|
(Loss) earnings:
|
|||||||||||||||||||
|
Basic
|
$
|
(0.84
|
)
|
$
|
(2.69
|
)
|
$
|
(2.75
|
)
|
$
|
(0.28
|
)
|
$
|
0.14
|
|
||||
|
Diluted
|
(0.84
|
)
|
(2.69
|
)
|
(2.75
|
)
|
(0.28
|
)
|
0.13
|
|
|||||||||
|
Distributions paid
|
—
|
|
—
|
|
10.02
|
|
0.80
|
|
—
|
|
|||||||||
|
Balance sheet data at period end:
|
|||||||||||||||||||
|
Cash and cash equivalents
|
$
|
186.7
|
|
$
|
184.7
|
|
$
|
185.4
|
|
$
|
62.9
|
|
$
|
51.9
|
|
||||
|
Total assets
|
9,773.3
|
|
9,911.6
|
|
10,446.5
|
|
1,135.8
|
|
1,150.4
|
|
|||||||||
|
Total current liabilities
|
1,074.5
|
|
1,096.2
|
|
1,104.3
|
|
135.9
|
|
103.3
|
|
|||||||||
|
Total long-term liabilities
|
6,236.6
|
|
8,007.8
|
|
8,372.6
|
|
1,510.5
|
|
623.4
|
|
|||||||||
|
Total redeemable equity
|
—
|
|
3,859.3
|
|
3,589.8
|
|
—
|
|
1,038.0
|
|
|||||||||
|
Total stockholders’ equity (deficit)
|
2,462.2
|
|
(3,051.7
|
)
|
(2,620.2
|
)
|
(510.6
|
)
|
(614.3
|
)
|
|||||||||
|
Cash flow data:
|
|||||||||||||||||||
|
Net cash provided by (used in) operating activities
|
$
|
354.0
|
|
$
|
200.5
|
|
$
|
(167.5
|
)
|
$
|
72.9
|
|
$
|
124.6
|
|
||||
|
Net cash used in investing activities
|
(42.1
|
)
|
(23.2
|
)
|
(6,676.0
|
)
|
(29.9
|
)
|
(35.4
|
)
|
|||||||||
|
Net cash (used in) provided by financing activities
|
(307.8
|
)
|
(170.3
|
)
|
6,965.0
|
|
(43.5
|
)
|
(87.6
|
)
|
|||||||||
51
|
(1)
|
Earnings or loss per share, redeemable equity, stockholders’ equity or deficit, and net cash provided by or used in financing activities are not comparable across the periods because we recapitalized our equity in 2019 in connection with the IPO, in 2017 in connection with the VWR acquisition and in 2016 in connection with a merger with NuSil. We also raised significant amounts of new capital in 2019 and 2017. See note
14
to the consolidated financial statements beginning on page F-1 of this report.
|
|
(2)
|
Total assets and total long-term liabilities are not comparable across the periods because on January 1, 2019, we adopted a new lease accounting standard and elected to present comparable periods under the prior lease accounting standard. On the adoption date, we recognized
$155.0 million
of operating lease assets and
$162.5 million
of operating lease liabilities. See note
3
to the consolidated financial statements beginning on page F-1 of this report.
|
|
(3)
|
Interest expense and the loss on extinguishment of debt are not comparable across the periods due to the debt refinancings that occurred in 2019, 2017 and 2016. See note
13
to the consolidated financial statements beginning on page F-1 of this report.
|
|
(4)
|
Income tax expense or benefit is not comparable across the periods because in 2017, tax reform legislation was enacted in the United States. The new legislation included a significant reduction of the U.S. federal corporate tax rate and a significant one-time transition tax on undistributed foreign earnings and profits. See note
19
to the consolidated financial statements beginning on page F-1 of this report.
|
|
(5)
|
Most financial data is not comparable across the periods because on November 21, 2017 we acquired VWR. In accordance with GAAP, VWR’s financial results are only included prospectively since the acquisition date.
|
|
(6)
|
Fees to New Mountain Capital are not comparable across the periods due to a transaction fee of
$180.0 million
in 2017 related to the VWR acquisition and transaction fees of
$12.5 million
in 2017 and
$27.3 million
in 2016 related to debt refinancings.
|
|
Item 7.
|
Management’s discussion and analysis of financial condition and results of operations
|
This discussion contains forward-looking statements that reflect our plans, estimates and beliefs. Our actual results may differ materially from those contained in or implied by any forward-looking statements. See “Cautionary factors regarding forward-looking statements.”
Overview
We are a leading global provider of mission critical products and services to customers in the biopharmaceutical, healthcare, education & government and advanced technologies & applied materials industries. We have global operations and an extensive product portfolio. We strive to
52
enable customer success through innovation, cGMP manufacturing and comprehensive service offerings. The depth and breadth of our portfolio provides our customers a comprehensive range of products and services and allows us to create customized and integrated solutions for our customers.
In
2019
, we recorded net sales of
$6,040.3 million
, net income of
$37.8 million
and Adjusted EBITDA of
$1,031.2 million
. We also generated net sales growth of
3.0%
and organic net sales growth of
5.1%
, each compared to the same period in 2018. See “Reconciliations of non-GAAP measures” for a reconciliation of net income to Adjusted EBITDA and “Results of operations” for a reconciliation of net sales growth to organic net sales growth.
Trends affecting our business and results of operations
The following trends have affected our recent operating results, and they may also continue to affect our performance and financial condition in future periods.
Our IPO generated significant proceeds and certain costs
In the second quarter of 2019, we completed our IPO. The IPO generated net proceeds of
$4,235.6 million
after deducting underwriting discounts, commissions and other offering costs of
$132.1 million
. The IPO also satisfied a performance condition for certain of our stock options, which caused us to immediately recognize of
$26.9 million
of expense.
We simplified our capital structure and reduced our borrowings
Proceeds from the IPO, supplemented by operating cash flows, enabled us to simplify our equity capitalization, reduce debt levels and ultimately enabled us to lower the interest rates on our indebtedness. These actions reduced our interest burden and improved our operating cash flows and earnings in 2019, and we expect those improvements to continue into future periods.
We redeemed all of our outstanding series A preferred stock for
$2,630.9 million
using proceeds from the IPO. Furthermore, all shares of junior convertible preferred stock automatically converted into shares of our common stock. The redemption of series A preferred stock eliminated the accumulation of yield thereon, which has positively impacted our income available to common stockholders and will continue to do so in future periods.
We used the remaining net proceeds from the IPO and operating cash flows to repay $1.9 billion of outstanding indebtedness. This reduction in borrowings improved our credit profile, which enabled us to amend our debt in June 2019 and January 2020 to reduce the interest rate margins under the senior secured credit facilities. This has reduced our interest expense and cash paid for interest and will continue to do so in future periods.
We reduced our expenses through a global restructuring program
We have generated significant cost and commercial synergies across our business from the global restructuring program we initiated in the fourth quarter of 2017. Under that program, we are permitted to spend up to
$215 million
over a three-year period to optimize our sales, gross
53
margins and operating costs. As a result of the program, we have combined sales and marketing resources, eliminated redundant corporate functions, optimized procurement and our manufacturing footprint, and implemented best practices throughout the organization.
From inception of the program through
December 31, 2019
, we have recognized
$118.8 million
of charges and have spent
$8.3 million
on capital projects. Through
December 31, 2019
, we believe that we have generated over
$180 million
of annualized cost synergies, which we believe will favorably impact our results in 2020 and beyond.
Our AMEA region is experiencing significant growth
In
2019
, net sales grew by nearly
15%
in the AMEA region. Our largest customers in this region are in the biopharma and advanced technologies & applied materials industries. We believe that local demand for our products and solutions in these regions is being driven by the expansion of our customers’ presence, an inadequate local supplier base and a significant increase in local government investment to support innovation in the industries we serve. We expect that the AMEA region will continue to generate significant growth for us in future periods.
We are investing in a differentiated innovation model
We are engaging with our customers early in their product development cycles to advance their programs from research and discovery through development and commercialization. These projects include enhancing product purity and performance characteristics, improving product packaging and streamlining workflows. We are also developing new products in emerging areas of science such as cell and gene therapy.
Changes in foreign currency exchange rates are impacting our financial condition and results of operations
We have substantial operations overseas whose financial condition and results of operations have been and will continue to be impacted by changes in the exchange rate of the U.S. dollar into other currencies. See Item 7A, “Quantitative and qualitative disclosures about market risk.”
Key indicators of performance and financial condition
To evaluate our performance, we monitor a number of key indicators. As appropriate, we supplement our results of operations determined in accordance with GAAP with certain non-GAAP measures that we believe are useful to investors, creditors and others in assessing our performance. These measurements should not be considered in isolation or as a substitute for reported GAAP results because they may include or exclude certain items as compared to similar GAAP-based measurements, and such measurements may not be comparable to similarly-titled measurements reported by other companies. Rather, these measurements should be considered as an additional way of viewing aspects of our operations that provide a more complete understanding of our business.
54
The key indicators that we monitor are as follows:
|
•
|
Net sales, gross margin, operating income
and
net income or loss
. These measures are discussed in the section entitled “Results of operations;”
|
|
•
|
Organic net sales growth
, which is a non-GAAP measure discussed in the section entitled “Results of operations.” Organic net sales growth eliminates from our reported net sales the impacts of earnings from any acquired or disposed businesses and changes in foreign currency exchange rates. We believe that this measurement is useful to investors as a way to measure and evaluate our underlying commercial operating performance consistently across our segments and the periods presented. This measurement is used by our management for the same reason. Reconciliations to the change in reported net sales, the most directly comparable GAAP financial measure, are included in the section entitled “Results of operations.”
|
|
•
|
Adjusted EBITDA and Adjusted EBITDA margin
, which are non-GAAP measures discussed in the section entitled “Results of operations.” Adjusted EBITDA is used by investors to measure and evaluate our operating performance exclusive of interest expense, income tax expense, depreciation, amortization and certain infrequently occurring items. Adjusted EBITDA margin is Adjusted EBITDA divided by net sales as determined under GAAP. We believe that these measurements are useful to investors as a way to analyze the underlying trends in our core business consistently across the periods presented. A reconciliation of net income or loss, the most directly comparable GAAP financial measure, to Adjusted EBITDA is included in the section entitled “Reconciliations of non-GAAP measures;”
|
|
•
|
Management EBITDA
, which is a non-GAAP measure discussed in the section entitled “Results of operations.” Management EBITDA is used by our management to measure and evaluate the internal operating performance of our business segments. It is also the basis for calculating management incentive compensation programs. Management EBITDA is our Adjusted EBITDA further adjusted for other items that are not used to measure internal operating performance. We believe that this measurement is useful to investors as a way to analyze the underlying trends in our core business, including at the segment level, consistently across the periods presented and also to evaluate performance under management incentive compensation programs. A reconciliation of net income or loss, the most directly comparable GAAP financial measure, to Management EBITDA is included in the section entitled “Reconciliations of non-GAAP measures;” and
|
|
•
|
Cash flows from operating activities
, which we discuss in the section entitled “Liquidity and capital resources—Historical cash flows.”
|
Results of operations
We present results of operations in the same way that we manage our business, evaluate our performance and allocate our resources. We also provide discussion of net sales and Management
55
EBITDA by geographic segment based on customer location: Americas, Europe and AMEA. Corporate costs are managed on a standalone basis and not allocated to segments.
Years ended December
3
1,
2019
and
2018
Executive summary
|
(dollars in millions)
|
Year ended December 31,
|
Change
|
|||||||||
|
2019
|
2018
|
||||||||||
|
Net sales
|
$
|
6,040.3
|
|
$
|
5,864.3
|
|
$
|
176.0
|
|
||
|
Gross margin
|
31.8
|
%
|
31.0
|
%
|
80 bps
|
|
|||||
|
Operating income
|
$
|
551.8
|
|
$
|
413.5
|
|
$
|
138.3
|
|
||
|
Net income (loss)
|
37.8
|
|
(86.9
|
)
|
124.7
|
|
|||||
|
Adjusted EBITDA
|
1,031.2
|
|
945.3
|
|
85.9
|
|
|||||
|
Adjusted EBITDA margin
|
17.1
|
%
|
16.1
|
%
|
100 bps
|
|
|||||
Net sales growth, gross margin improvement, reduced operating costs, lower interest expense and an improved tax rate each contributed to strong performance in 2019 compared to 2018. The net sales growth was driven by strength in biopharma, which contributed to the mid single-digit organic net sales growth in Americas and Europe and to the low double-digit organic net sales growth in AMEA. These factors were partially offset by unfavorable foreign currency translation. The gross margin improvement reflected increased volume, better prices relative to cost inflation and the absence of one-time factors related to 2018. This was offset by unfavorable manufacturing variances and lower supplier rebates. In addition to these factors, the growth in operating income included net operating expense reductions that were the result of productivity improvements partially offset by strategic spending in the AMEA region. The change from net loss to net income and the improvements in Adjusted EBITDA and Adjusted EBITDA margin were for reasons similar to the growth in operating income.
Net sales
|
(in millions)
|
Year ended December 31,
|
Reconciliation of net sales growth to organic net sales growth
|
|||||||||||||||||
|
Net sales growth
|
Foreign currency impact
|
Organic net sales growth
|
|||||||||||||||||
|
2019
|
2018
|
||||||||||||||||||
|
Americas
|
$
|
3,584.8
|
|
$
|
3,460.9
|
|
$
|
123.9
|
|
$
|
(6.5
|
)
|
$
|
130.4
|
|
||||
|
Europe
|
2,102.0
|
|
2,095.3
|
|
6.7
|
|
(113.9
|
)
|
120.6
|
|
|||||||||
|
AMEA
|
353.5
|
|
308.1
|
|
45.4
|
|
(2.9
|
)
|
48.3
|
|
|||||||||
|
Total
|
$
|
6,040.3
|
|
$
|
5,864.3
|
|
$
|
176.0
|
|
$
|
(123.3
|
)
|
$
|
299.3
|
|
||||
Net sales increased $176.0 million or 3.0%, which included $123.3 million or 2.1% of unfavorable foreign currency impact. Organic net sales growth was $299.3 million or 5.1% and was caused by more favorable pricing and volume growth.
56
In Americas, net sales increased $123.9 million or 3.6%, which included $6.5 million or 0.2% of unfavorable foreign currency impact. Organic net sales growth was $130.4 million or 3.8% and was caused by more favorable pricing and volume growth. Additional information by end market (with approximate percentage of total net sales) is as follows:
|
•
|
Biopharma (50%)
— Sales grew in the high-single digits. We gained new customers and experienced low double-digit volume growth from customer spending on research and development, as well as mid-single-digit growth from biopharma production.
|
|
•
|
Healthcare (10%)
— We experienced low single-digit contraction due to a less favorable mix of product sales and a challenging comparison to the prior year driven by our proprietary materials.
|
|
•
|
Education and government (15%)
— We experienced low single-digit growth driven by new customer wins, partially offset by a normalization of customized inventory production after a significant ramp-up in 2018 related to a key customer win.
|
|
•
|
Advanced technologies & applied materials (25%)
— Sales were flat year over year, with strength in the aerospace and defense and microelectronics industries that did not overcome the generally flat industrial sector.
|
In Europe, net sales increased $6.7 million or 0.3%, which included $113.9 million or 5.4% of unfavorable foreign currency impact. Organic net sales growth was $120.6 million or 5.7%, due nearly in equal parts to volume growth and favorable pricing. Additional information by end market (with approximate percentage of total net sales) is as follows:
|
•
|
Biopharma (40%)
— We experienced low double-digit growth broadly across strategic customer accounts and new customer wins. This was driven by lab chemicals, which continued to be a strong driver of growth, our biopharma production capabilities and specialty procurement.
|
|
•
|
Healthcare (10%)
— We experienced mid single-digit growth due to strong sales of proprietary materials. This was partially offset by a contraction in equipment & instrumentation.
|
|
•
|
Education & government (15%)
— Sales were essentially flat due to fewer growth opportunities and increased competitive pressure in the market, specifically in our chemicals offerings.
|
|
•
|
Advanced technologies & applied materials (35%)
— We experienced mid single-digit growth due to growth in third-party chemicals and consumables, which was partially offset by softness in equipment & instrumentation.
|
57
In AMEA, net sales increased $45.4 million or 14.7% due to strong volume growth in the biopharma end market. Additional information by end market (with approximate percentage of total net sales) is as follows:
|
•
|
Biopharma (45%)
— We experienced over 30% growth driven by our chromatography resin products as well as strong growth with key biopharma production customers in Korea, China and India.
|
|
•
|
Advanced technologies & applied materials (40%)
— We experienced mid single-digit growth driven by higher sales of third-party materials & consumables, which was partially offset by a reduction in electronic materials due to a significant order in 2018 that did not repeat.
|
Gross margin
|
Year ended December 31,
|
Change
|
||||||
|
2019
|
2018
|
||||||
|
Gross margin
|
31.8
|
%
|
31.0
|
%
|
80 bps
|
||
The increase in gross margin included 50 basis points from more favorable prices relative to cost inflation and 10 basis points of favorable product mix, reflecting sales of our higher margin proprietary materials. The increase also included 50 basis points due to the absence of higher product costs in 2018 for (i) the step-up of VWR inventory in purchase accounting, and (ii) restructuring of a discontinued product line that resulted in $20.2 million of inventory adjustments. These factors were partially offset by 30 basis points from unfavorable manufacturing absorption due to system integration initiatives at our manufacturing facilities and lower supplier rebates due to increased thresholds in certain rebate agreements.
The global restructuring program contributed a total of $85.1 million to 2019 gross profit and included more favorable prices relative to cost inflation, product cost reductions and productivity improvements from leaner footprints and operating practices.
Operating income
|
(in millions)
|
Year ended December 31,
|
Change
|
|||||||||
|
2019
|
2018
|
||||||||||
|
Gross profit
|
$
|
1,920.7
|
|
$
|
1,819.8
|
|
$
|
100.9
|
|
||
|
Operating expenses
|
1,368.9
|
|
1,406.3
|
|
(37.4
|
)
|
|||||
|
Operating income
|
$
|
551.8
|
|
$
|
413.5
|
|
$
|
138.3
|
|
||
Operating income increased primarily from higher gross profit, as previously discussed, as well as a reduction of operating expenses from lower restructuring charges, realized cost synergies from the global restructuring program, favorable foreign currency translation and lower annual incentive compensation expense. These decreases were partially offset by additional stock-based compensation expense triggered by the completion of our IPO, investments in AMEA,
58
incremental public company expenses and inflationary impacts. Our investments in AMEA are designed to support long-term growth and were made in sales and marketing, supply chain facilities and a new innovation center in China.
Net income or loss
|
(in millions)
|
Year ended December 31,
|
Change
|
|||||||||
|
2019
|
2018
|
||||||||||
|
Operating income
|
$
|
551.8
|
|
$
|
413.5
|
|
$
|
138.3
|
|
||
|
Interest expense
|
(440.0
|
)
|
(523.8
|
)
|
83.8
|
|
|||||
|
Loss on extinguishment of debt
|
(73.7
|
)
|
—
|
|
(73.7
|
)
|
|||||
|
Other income (expense), net
|
2.5
|
|
(3.5
|
)
|
6.0
|
|
|||||
|
Income tax (expense) benefit
|
(2.8
|
)
|
26.9
|
|
(29.7
|
)
|
|||||
|
Net income (loss)
|
$
|
37.8
|
|
$
|
(86.9
|
)
|
$
|
124.7
|
|
||
Net loss changed to net income primarily due to higher operating income, as previously discussed, and lower interest expense, which were partially offset by a loss on extinguishment of debt and a change from income tax benefit to expense. Interest expense declined with the application of IPO proceeds and operating cash flows to reduce outstanding borrowings, as well as interest rate margin reductions from the repricing of our term loans in June 2019. This was substantially offset by the non-cash loss on extinguishment of debt. The income tax benefit changed to expense following the change from pre-tax loss to pre-tax income.
Adjusted EBITDA and Management EBITDA
For reconciliations of Adjusted EBITDA and Management EBITDA to net income or loss, see “Reconciliations of non-GAAP measures.”
|
(in millions)
|
Year ended December 31,
|
Change
|
|||||||||
|
2019
|
2018
|
||||||||||
|
Adjusted EBITDA
|
$
|
1,031.2
|
|
$
|
945.3
|
|
$
|
85.9
|
|
||
|
Adjusted EBITDA margin
|
17.1
|
%
|
16.1
|
%
|
100 bps
|
||||||
|
Management EBITDA:
|
|||||||||||
|
Americas
|
726.8
|
|
651.6
|
|
75.2
|
|
|||||
|
Europe
|
364.6
|
|
349.6
|
|
15.0
|
|
|||||
|
AMEA
|
85.8
|
|
73.8
|
|
12.0
|
|
|||||
|
Corporate
|
(77.2
|
)
|
(69.0
|
)
|
(8.2
|
)
|
|||||
|
Total
|
$
|
1,100.0
|
|
$
|
1,006.0
|
|
$
|
94.0
|
|
||
Adjusted EBITDA increased $85.9 million, or 9.1%, which included an unfavorable foreign currency translation impact of $18.1 million, or 1.9%. The remaining growth of $104.0 million, or 11.0%, was for reasons similar to the Management EBITDA growth discussed below.
59
I
n the Americas, the growth in Management EBITDA was driven by the improvements to net sales previously discussed, more favorable prices relative to cost inflation, productivity improvements and cost reductions.
In Europe, the growth in Management EBITDA was driven by volume growth and more favorable prices relative to cost inflation in our biopharma and other proprietary offerings, partially offset by relatively lower sales of equipment & instrumentation. The growth in Management EBITDA also reflected operating expense savings primarily related to headcount reduction and facility footprint optimization. These factors were substantially offset by an unfavorable foreign currency translation impact.
In AMEA, Management EBITDA was favorably impacted by an increase in gross profit driven by sales growth, which was offset by an increase to operating expenses due to targeted investments in customer facing sales and marketing functions to support the growth in this strategic region, new supply chain facilities and an innovation center in China to better serve our markets.
In Corporate, Management EBITDA was reduced primarily related to increases in public company compliance as a result of our IPO and investments into our global business center as we continue to grow our offshore capabilities.
Year ended December 31,
2017
A discussion and analysis covering the year ended
December 31, 2017
is included in the Registration Statement.
60
Reconciliations of non-GAAP measures
The following table presents the reconciliation of net income or loss to non-GAAP measures:
|
(in millions)
|
Year ended December 31,
|
||||||||||
|
2019
|
2018
|
2017
|
|||||||||
|
Net income (loss)
|
$
|
37.8
|
|
$
|
(86.9
|
)
|
$
|
(145.3
|
)
|
||
|
Interest expense
(1)
|
440.0
|
|
523.8
|
|
200.9
|
|
|||||
|
Income tax expense (benefit)
(1)
|
2.8
|
|
(26.9
|
)
|
(314.9
|
)
|
|||||
|
Depreciation and amortization
(1)
|
398.9
|
|
404.6
|
|
99.2
|
|
|||||
|
Net foreign currency loss from financing activities
(2)
|
1.9
|
|
6.5
|
|
5.5
|
|
|||||
|
Gain on derivative instruments
(3)
|
—
|
|
—
|
|
(9.6
|
)
|
|||||
|
Other stock-based compensation expense (benefit)
(4)
|
36.8
|
|
(0.7
|
)
|
26.6
|
|
|||||
|
Restructuring and severance charges
(5)
|
24.3
|
|
81.2
|
|
29.6
|
|
|||||
|
Purchase accounting adjustments
(6)
|
(10.7
|
)
|
(1.0
|
)
|
41.8
|
|
|||||
|
Loss on extinguishment of debt
(7)
|
73.7
|
|
—
|
|
56.4
|
|
|||||
|
Transaction fees to New Mountain Capital
(8)
|
—
|
|
—
|
|
192.5
|
|
|||||
|
VWR transaction, integration and planning expenses
(9)
|
22.5
|
|
36.2
|
|
73.7
|
|
|||||
|
Other
(10)
|
3.2
|
|
8.5
|
|
33.1
|
|
|||||
|
Adjusted EBITDA
|
1,031.2
|
|
945.3
|
|
289.5
|
|
|||||
|
Ongoing stock-based compensation expense
(11)
|
31.1
|
|
19.1
|
|
21.6
|
|
|||||
|
Write-offs of working capital and other assets
(12)
|
29.2
|
|
22.1
|
|
—
|
|
|||||
|
Long-term incentive plan
(13)
|
4.3
|
|
9.6
|
|
3.2
|
|
|||||
|
Other
(14)
|
4.2
|
|
9.9
|
|
9.7
|
|
|||||
|
Management EBITDA
|
$
|
1,100.0
|
|
$
|
1,006.0
|
|
$
|
324.0
|
|
||
|
(1)
|
Represents amounts as determined under GAAP.
|
|
(2)
|
See note
5
to our consolidated financial statements beginning on page F-1 of this report.
|
|
(3)
|
See note
21
to our consolidated financial statements beginning on page F-1 of this report.
|
|
(4)
|
Represents expenses primarily related to remeasuring SARs at fair value on a recurring basis, the vesting of performance stock options with the completion of our IPO and the modification of stock-based awards caused by the legal entity restructuring in November 2017.
|
|
(5)
|
See note
11
to our consolidated financial statements beginning on page F-1 of this report.
|
|
(6)
|
Represents reversals of the short-term impact of purchase accounting adjustments on earnings. The most significant adjustment in 2019 was a normalization of expense for prepaid customer rebates that were derecognized in purchase accounting. The most
|
61
significant adjustment in 2017 was an increase to cost of sales that resulted from valuing VWR’s inventory at fair value in purchase accounting.
|
(7)
|
See note
13
to our consolidated financial statements beginning on page F-1 of this report.
|
|
(8)
|
See note
23
to our consolidated financial statements beginning on page F-1 of this report.
|
|
(9)
|
Represents direct expenses incurred to consummate the acquisition of VWR and other expenses incurred related to the planning and integration of VWR.
|
|
(10)
|
The following table presents the components of other adjustments to Adjusted EBITDA:
|
|
(in millions)
|
Year ended December 31,
|
||||||||||
|
2019
|
2018
|
2017
|
|||||||||
|
Unconsummated equity offering
|
$
|
—
|
|
$
|
—
|
|
$
|
19.9
|
|
||
|
NuSil integration expenses
|
—
|
|
—
|
|
5.1
|
|
|||||
|
Executive departures
|
—
|
|
4.5
|
|
—
|
|
|||||
|
Impairment charges
|
—
|
|
2.9
|
|
5.0
|
|
|||||
|
Debt refinancing fees
|
—
|
|
—
|
|
3.1
|
|
|||||
|
Other transaction expenses
|
3.2
|
|
1.1
|
|
—
|
|
|||||
|
Total
|
$
|
3.2
|
|
$
|
8.5
|
|
$
|
33.1
|
|
||
|
(11)
|
Primarily represents expense related to stock options, RSUs and optionholder awards that vest based on continuing employee service.
|
|
(12)
|
Substantially represents the reduction of inventory to net realizable value in accordance with GAAP, but also includes immaterial write-offs of trade accounts receivable and property, plant and equipment.
|
|
(13)
|
Represents cost of cash-based compensation programs awarded to key employees that vest at the end of three-year periods through December 31, 2020 with continuing service.
|
|
(14)
|
Represents expenses related to business performance improvement programs, non-recurring tax payments, customer rebates, non-cash pension charges, consulting projects, advisory fees and other immaterial items.
|
Liquidity and capital resources
We fund short-term cash requirements primarily from operating cash flows and unused availability under our credit facilities. Most of our long-term financing is from indebtedness.
Our most significant contractual obligations are scheduled principal and interest payments for indebtedness. We also have obligations to make payments under operating leases, to purchase certain products and services and to fund defined benefit plan obligations primarily outside of the United States. In addition to contractual obligations, we use cash to fund capital expenditures,
62
taxes and dividends on MCPS. We have also used significant amounts of cash to pay debt refinancing fees and to fund distributions in 2017. We do not anticipate such significant distributions going forward due to new restrictions imposed by our indebtedness. Changes in working capital may be a source or a use of cash depending on our operations during the period.
We expect to fund our long-term capital needs with cash generated by operations and availability under our credit facilities. Although we believe that these sources will provide sufficient liquidity for us to meet our long-term capital needs, our ability to fund these needs will depend to a significant extent on our future financial performance, which will be subject in part to general economic, competitive, financial, regulatory and other factors that are beyond our control.
We believe that cash generated by operations, together with available liquidity under our credit facilities, will be adequate to meet our current and expected needs for cash prior to the maturity of our debt, although no assurance can be given in this regard.
Liquidity
The following table presents our primary sources of liquidity:
|
(in millions)
|
December 31, 2019
|
||||||||||
|
Receivables facility
|
Revolving credit facility
|
Total
|
|||||||||
|
Unused availability under credit facilities:
|
|||||||||||
|
Current availability
|
$
|
250.0
|
|
$
|
250.0
|
|
$
|
500.0
|
|
||
|
Undrawn letters of credit outstanding
|
(12.5
|
)
|
(15.3
|
)
|
(27.8
|
)
|
|||||
|
Outstanding borrowings
|
(55.5
|
)
|
—
|
|
(55.5
|
)
|
|||||
|
Unused availability
|
$
|
182.0
|
|
$
|
234.7
|
|
416.7
|
|
|||
|
Cash and cash equivalents
|
186.7
|
|
|||||||||
|
Total liquidity
|
$
|
603.4
|
|
||||||||
Our liquidity needs change daily. We manage liquidity needs by utilizing our credit line availability and also by monitoring working capital levels. Some of our credit line availability also depends upon maintaining a sufficient borrowing base of eligible accounts receivable. We believe that we have sufficient capital resources to meet our daily liquidity needs. As of
December 31, 2019
, we were in compliance with all of our debt covenants.
At
December 31, 2019
,
$161.4 million
or
86%
of our cash and cash equivalents was held by our non-U.S. subsidiaries and may be subject to certain taxes upon repatriation, primarily where foreign withholding taxes apply.
63
Historical cash flows
The following table presents a summary of cash provided by (used in) various activities:
|
(in millions)
|
Year ended December 31,
|
Change
|
|||||||||
|
2019
|
2018
|
||||||||||
|
Operating activities:
|
|||||||||||
|
Working capital changes*
|
$
|
(134.9
|
)
|
$
|
(95.1
|
)
|
$
|
(39.8
|
)
|
||
|
All other
|
488.9
|
|
295.6
|
|
193.3
|
|
|||||
|
Total
|
354.0
|
|
200.5
|
|
153.5
|
|
|||||
|
Investing activities
|
(42.1
|
)
|
(23.2
|
)
|
(18.9
|
)
|
|||||
|
Financing activities
|
(307.8
|
)
|
(170.3
|
)
|
(137.5
|
)
|
|||||
|
Capital expenditures
|
(51.6
|
)
|
(37.7
|
)
|
(13.9
|
)
|
|||||
|
*
|
Working capital includes accounts receivable, inventory and accounts payable.
|
Cash flows from operating activities increased
$153.5 million
in
2019
primarily due to an increase of operating income and a reduction in cash for paid interest. This was partially offset by growth in working capital and an increase in cash paid for taxes.
Investing activities used
$18.9 million
of additional cash in
2019
, reflecting an increase in capital spending and fewer proceeds from the sale of capital assets.
Financing activities used
$137.5 million
of additional cash in
2019
due to significant offsetting factors. The $2,630.9 million redemption of our series A preferred stock and $1,878.6 million repayment of debt was substantially offset by $
4,235.6 million
of IPO proceeds. Of our debt repayments, we funded $1,606.2 million with proceeds from the IPO and $272.4 million with operating cash flows.
A discussion and analysis of historical cash flows covering the year ended December 31,
2017
is included in the Registration Statement.
Indebtedness
A significant portion of our long-term financing is from indebtedness. The purpose of this section is to disclose how certain features of our indebtedness influence our liquidity and capital resources. Additional detail about the terms of our indebtedness may be found in note
13
to our consolidated financial statements beginning on page F-1 of this report.
Our credit facilities provide us access to up to $500 million of additional cash
We have entered into a receivables facility and a revolving credit facility that provide us access to cash to fund short-term business needs. See the section entitled “Liquidity” for additional information.
64
Our indebtedness restricts us from paying dividends to common stockholders
The acquisition of VWR was partially funded by the issuance of debt by Avantor Inc.’s wholly-owned subsidiary, Avantor Funding, Inc. Certain of those debt agreements prevent Avantor Funding, Inc. from paying dividends or making other payments to Avantor, Inc., subject to limited exceptions. At
December 31, 2019
and
2018
, substantially all of Avantor, Inc.’s net assets were subject to those restrictions.
Our senior secured credit facilities require or may require us to make certain principal repayments prior to maturity
We began repaying the term loans on March 31, 2018 in required quarterly installments of
€1.0 million
for the euro portion and
$2.0 million
for the U.S dollar portion, with the balance due on the maturity date. We have generated sufficient cash flow to make all required historical payments, and we expect that our cash flows will continue to be sufficient to make future payments.
We are required to make additional prepayments if: (i) we generate excess cash flows, as defined, at specified percentages that decline if certain net leverage ratios are achieved; or (ii) we receive cash proceeds from certain types of asset sales or debt issuances. No additional required prepayments have become due since the inception of the credit facilities.
We are subject to certain financial covenants that, if not met, could put us in default of our debt agreements
The receivables facility and our senior secured credit facilities contain certain other customary covenants, including a financial covenant. That covenant becomes applicable in periods when we have drawn more than
35%
of our revolving credit facility. When applicable, we may not have total borrowings in excess of a pro forma net leverage ratio, as defined. This covenant was not applicable at
December 31, 2019
, and our historical net leverage has been well in excess of the covenant requirement.
65
Contractual obligations
The following table presents our contractual obligations at
December 31, 2019
:
|
(in millions)
|
Payments due by period
|
||||||||||||||||||
|
Total
|
Less than a year
|
1-3 years
|
3-5 years
|
More than 5 years
|
|||||||||||||||
|
Debt:
|
|||||||||||||||||||
|
Principal
(1)(2)
|
$
|
5,249.4
|
|
$
|
93.5
|
|
$
|
64.9
|
|
$
|
3,040.2
|
|
$
|
2,050.8
|
|
||||
|
Interest
(1)
|
1,748.6
|
|
347.1
|
|
686.7
|
|
632.4
|
|
82.4
|
|
|||||||||
|
Operating leases
|
160.0
|
|
39.1
|
|
61.7
|
|
40.8
|
|
18.4
|
|
|||||||||
|
Purchase obligations
(3)
|
500.5
|
|
126.4
|
|
246.0
|
|
128.1
|
|
—
|
|
|||||||||
|
Other liabilities:
|
|||||||||||||||||||
|
Underfunded defined benefit plans
(4)
|
138.7
|
|
4.7
|
|
10.0
|
|
12.0
|
|
112.0
|
|
|||||||||
|
Transition tax payments
(5)
|
65.0
|
|
6.2
|
|
12.4
|
|
27.1
|
|
19.3
|
|
|||||||||
|
Other
|
9.9
|
|
4.1
|
|
1.6
|
|
0.4
|
|
3.8
|
|
|||||||||
|
Total
|
$
|
7,872.1
|
|
$
|
621.1
|
|
$
|
1,083.3
|
|
$
|
3,881.0
|
|
$
|
2,286.7
|
|
||||
|
(1)
|
Includes finance lease liabilities. To calculate payments for principal and interest, we assumed that variable interest rates, foreign currency exchange rates and outstanding borrowings under credit facilities were unchanged from
December 31, 2019
through maturity. For the variable interest rates and principal amounts used, see note
13
to our consolidated financial statements beginning on page F-1 of this report.
|
|
(2)
|
Our senior secured credit facilities would require us to accelerate our principal repayments should we generate excess cash flows, as defined, in future periods.
|
|
(3)
|
Purchase obligations for certain products and services are made in the normal course of business to meet operating needs.
|
|
(4)
|
Represents our obligation to fund defined benefit plans with obligations in excess of plan assets. The total obligation is equal to the aggregate excess of the discounted benefit obligation over the fair value of plan assets for all underfunded plans. The payments due in less than one year are estimated using actuarial methods. The payments due for all other years are estimated by distributing the remaining funding status to future periods in the same way as benefit payments are expected to be made by the plans following actuarial methods.
|
|
(5)
|
Represents our transition tax obligation due over eight years to transition to the modified territorial tax system under new U.S. income tax legislation.
|
66
Off-balance sheet arrangements
We do not use special purpose entities or have any other material off-balance sheet financing arrangements except for our receivables facility and letters of credit. We enter into these arrangements for ordinary business reasons and believe that they are governed by ordinary commercial terms. For more information, see note
13
to our consolidated financial statements beginning on page F-1 of this report.
Critical accounting policies and estimates
The preparation of financial statements in conformity with GAAP requires us to make estimates and assumptions that affect the amounts reported throughout the financial statements. Those estimates and assumptions are based on our best estimates and judgment. We evaluate our estimates and assumptions on an ongoing basis using historical experience and known facts and circumstances. We adjust our estimates and assumptions when we believe the facts and circumstances warrant an adjustment. As future events and their effects cannot be determined with precision, actual results could differ significantly from those estimates.
We consider the policies and estimates discussed below to be critical to an understanding of our financial statements because their application places the most significant demands on our judgment. Specific risks for these critical accounting policies are described in the following sections. For all of these policies, we caution that future events rarely develop exactly as forecast, and such estimates naturally require adjustment.
Our discussion of critical accounting policies and estimates is intended to supplement, not duplicate, our summary of significant accounting policies so that readers will have greater insight into the uncertainties involved in these areas. For a summary of all of our significant accounting policies, see note
2
to our consolidated financial statements beginning on page F-1 of this report.
Testing goodwill and other intangible assets for impairment
As a result of the VWR acquisition, we carry significant amounts of goodwill and other intangible assets on our consolidated balance sheet. At
December 31, 2019
, the combined carrying value of goodwill and other intangible assets, net of accumulated amortization and impairment charges, was
$7.0 billion
or
72%
of our total assets.
67
Required annual assessment
On October 1 of each year, we perform annual impairment testing of our goodwill and indefinite-lived intangible assets, or more frequently whenever an event or change in circumstance occurs that would require reassessment of the recoverability of those assets. The impairment analysis for goodwill and indefinite-lived intangible assets consists of an optional qualitative test potentially followed by a quantitative analysis. These measurements rely upon significant judgment from management described as follows:
|
•
|
The qualitative analysis for goodwill and indefinite-lived intangible assets requires us to identify potential factors that may result in an impairment and estimate whether they would warrant performance of a quantitative test;
|
|
•
|
The quantitative goodwill impairment test requires us to estimate the fair value of our reporting units. We estimate the fair value of each reporting unit using a weighted average of three valuation methods based on discounted cash flows, market multiples and market references. These valuation methods require management to make various assumptions, including, but not limited to, future profitability, cash flows, discount rates, weighting of valuation methods and the selection of comparable publicly traded companies; and
|
|
•
|
The quantitative test for indefinite-lived intangible assets is determined using a discounted cash flow method that incorporates an estimated royalty rate, an estimated discount rate and certain other assumptions.
|
Our estimates are based on historical trends, management’s knowledge and experience and overall economic factors, including projections of future earnings potential. Developing future cash flows in applying the income approach requires us to evaluate our intermediate to longer-term strategies, including, but not limited to, estimates about net sales growth, operating margins, capital requirements, inflation and working capital management. The development of appropriate rates to discount the estimated future cash flows requires the selection of risk premiums, which can materially impact the present value of future cash flows. Selection of an appropriate peer group under the market approach involves judgment, and an alternative selection of guideline companies could yield materially different market multiples. Weighing the different value indications involves judgment about their relative usefulness and comparability to the reporting unit.
We did not record any impairment charges as a result of our October 1,
2019
impairment testing. Each reporting unit had a fair value that was substantially in excess of the carrying value.
Determination of operating segments and reporting units
Prior to October 1, 2018, we determined that we had three operating segments aligned to product groups. On October 1, 2018, following the acquisition of VWR, we reorganized our management team and implemented new processes to report three geographic operating segments to our chief operating decision maker: Americas, Europe and AMEA. Our operating segments were
68
considered reporting units for the purpose of performing our October 1, 2018 annual impairment test. We have since developed additional reporting processes for our segment managers and accordingly, on October 1, 2019, determined that the Americas operating segment should be divided into two reporting units: Americas sciences and Americas silicones.
The determination of operating segments and reporting units requires us to exercise significant judgment, especially in determining (i) the basis of segmentation used by our Chief Executive Officer and segment management at various points in time across the reporting periods; and (ii) whether components of operating segments are economically similar and therefore aggregated. Determining one basis of segmentation versus another fundamentally changes the way economic and other changes will impact individual reporting units; an impairment could be recognized under one basis but not another, or the impairment could be of different magnitudes. If we make a judgment that reporting units are economically dissimilar, we will establish more reporting units which could put us at a greater risk of recognizing a goodwill impairment.
Accounting for changes to income tax laws
Income tax laws change from time to time. The effect of a change in tax law on deferred tax assets and liabilities is recognized as a cumulative adjustment to income tax expense or benefit in the period of enactment. The effect of a change in tax law on the income tax expense or benefit itself is recognized prospectively for the applicable tax years.
In December 2017, tax reform legislation was enacted in the United States. The new legislation included a broad range of corporate tax reforms, some of which were very complex. The new legislation caused us to recognize a provisional income tax benefit of $126.7 million for 2017 and an additional benefit of $29.5 million when we finalized our accounting for tax reform in 2018. Additional details are included in note
19
to the consolidated financial statements beginning on page F-1 of this report.
Estimating valuation allowances on deferred tax assets
We are required to estimate the degree to which tax assets and loss carryforwards will result in a future income tax benefit, based on our expectations of future profitability by tax jurisdiction. We provide a valuation allowance for deferred tax assets that we believe will more likely than not go unutilized. If it becomes more likely than not that a deferred tax asset will be realized, we reverse the related valuation allowance and recognize an income tax benefit for the amount of the reversal. At
December 31, 2019
, our valuation allowance on deferred tax assets was
$193.9 million
,
$160.0 million
of which relates to foreign net operating loss carry forwards that are not expected to be realized.
We must make assumptions and judgments to estimate the amount of valuation allowance to be recorded against our deferred tax assets, which take into account current tax laws and estimates of the amount of future taxable income, if any. Changes to any of the assumptions or judgments could cause our actual income tax obligations to differ from our estimates.
69
Accounting for uncertain tax positions
In the ordinary course of business, there is inherent uncertainty in quantifying our income tax positions. We assess income tax positions for all years subject to examination based upon our evaluation of the facts, circumstances and information available at the reporting date. For those tax positions where it is more likely than not that a tax benefit will be sustained, we have recorded an amount having greater than 50% likelihood of being realized upon ultimate settlement with a taxing authority assumed to have full knowledge of all relevant information. For those income tax positions where it is not more likely than not that a tax benefit will be sustained, no tax benefit has been recognized in the financial statements. Our reserve for uncertain tax positions was
$83.6 million
at
December 31, 2019
, exclusive of penalties and interest. Where applicable, associated interest expense has also been recognized as a component of the provision for income taxes.
We operate in numerous countries under many legal forms and, as a result, we are subject to the jurisdiction of numerous domestic and non-U.S. tax authorities, as well as to tax agreements and treaties among these governments. Determination of taxable income in any jurisdiction requires the interpretation of the related tax laws and regulations and the use of estimates and assumptions regarding significant future events, such as the amount, timing and character of deductions and the sources and character of income and tax credits. Changes in tax laws, regulations, agreements and treaties, currency exchange restrictions or our level of operations or profitability in each taxing jurisdiction could have an impact upon the amount of current and deferred tax balances and hence our net income.
We file tax returns in each tax jurisdiction that requires us to do so. Should tax return positions not be sustained upon audit, we could be required to record an income tax provision. Should previously unrecognized tax benefits ultimately be sustained, we could be required to record an income tax benefit.
Calculating expense for long-term compensation arrangements
Our employees have received various long-term compensation awards, including stock options, RSUs, SARs and cash-based awards. We calculate expense for some of those awards using fair value estimates based on unobservable inputs. Additionally, some of those awards contain performance conditions. We assess the probability of achieving those performance conditions, and in cases where partial or exceptional performance affects the size of the award, we also estimate the projected achievement level.
Expense for stock options is determined on the grant date and recognized ratably over their vesting term. We estimate the grant date fair value of stock options using the Black-Scholes model. This model requires us to make various assumptions, with the most significant assumption currently being the volatility of our stock price. A public quotation was first established for our common stock in May 2019, which does not provide adequate historical basis to reasonably estimate the expected volatility of our common stock over their more than six-year expected life. Instead, we estimate volatility based on historical stock price trends of a peer company set. The fair value of our awards would have differed had we selected different peer
70
companies or used a different technique to estimate volatility. Increasing our expected volatility assumption by 5% for all stock options at the date of grant would have increased our 2019 stock-based compensation expense by
$4.9 million
. Prior to the IPO, we were also required to estimate the fair value of our common stock, which was another critical accounting policy and estimate discussed further below.
Expense for some of our awards is impacted by performance conditions related to future earnings or achieving a company milestone such as an IPO. For these awards, we must assess whether the condition is probable of being achieved and, in some cases, estimate the relative performance level. If we change our assessments or estimates, or if actual earnings differ from our estimates, we will be required to recognize a cumulative adjustment in that period to remeasure all of the expense recognized to-date. During 2019, we recognized
$26.9 million
of expense upon achievement of our IPO, which was not considered probable prior to its consummation. At
December 31, 2019
, we also had outstanding unvested awards with performance conditions based on future earnings achievement. A $10 million increase or decrease to our estimate of future earnings would have caused us to recognize an additional
$0.2 million
of expense or
$9.7 million
of benefit during 2019, respectively.
Expense for SARs was adjusted each period based on changes in their fair value until their settlement in November 2019. Prior to the IPO, this calculation depended upon estimating the fair value of our common stock, another critical accounting policy and estimate discussed further below. From the IPO through November 2019, the value of our common stock was determined by reference to quoted stock prices and was not subject to any significant judgment.
Estimating the fair value of our common stock prior to the IPO
Prior to the IPO, we were required to estimate the fair value of our common stock to determine, among other things, the expense associated with our stock-based compensation awards. The fair value of our common stock was determined by management using input from an independent third-party valuation analysis. The assumptions we used in the valuation models were based on future expectations combined with our judgment about applicable assumptions.
We estimated the fair value of our common stock using a weighted average of three valuation methods in the same way as described for the critical accounting policy and estimate entitled “Testing goodwill and other intangible assets for impairment.”
Changes to the estimates and assumptions used would have changed the amount of stock-based compensation recognized in each of the periods presented. For example, a 10% increase to the valuation of our common stock used from November 21, 2017 to the date of our IPO would have increased 2019 stock-based compensation expense by
$6.2 million
.
Estimating the net realizable value of inventories
We value our inventories at the lower of cost or net realizable value. We regularly review quantities of inventories on hand and compare these amounts to the expected use of each product or product line, which can require us to make significant judgments. If our judgments prove to be
71
incorrect, we may be required to record a charge to cost of sales to reduce the carrying amount of inventory on hand to net realizable value. As with any significant estimate, we cannot be certain of future events which may cause us to change our judgments.
In December 2018, we determined that market conditions had deteriorated for a specialty product line we formerly manufactured and divested as part of our global restructuring program. As a result, we no longer believed that we would be able to recover any of the cost of the manufactured inventory still on hand. We recorded a non-cash restructuring loss of
$20.2 million
in the fourth quarter of 2018 to reduce the value of those inventories to zero.
Estimating the fair value of assets acquired from VWR
In November 2017, we acquired VWR for a purchase price of
$6.6 billion
. To account for the acquisition, we were required to allocate the purchase price to the assets acquired and liabilities assumed based on their individual fair values with the excess allocated to goodwill.
Estimating those fair values required the use of significant unobservable inputs, or level 3 measurements. Determining these inputs required us to make significant assumptions and judgments. Those estimates have impacted nearly all captions on our consolidated balance sheets and the amount of net sales, cost of sales, depreciation, amortization and income tax expense on our statements of operations. Using different estimates or assumptions would have materially affected our results in 2017 and subsequent periods. For example:
|
•
|
A one percent decrease to the rate we used to discount future cash flows would have increased the fair value of finite-lived intangible assets by
$580 million
and increased annual amortization by
$25 million
; and
|
|
•
|
An overall one-year decrease to our estimates of remaining useful lives would have increased annual amortization of our customer relationships by
$11 million
and annual depreciation of our property, plant and equipment by
$17 million
.
|
All purchase accounting estimates were determined as of the acquisition date and are not adjusted for future developments. However, any differences between acquisition-date estimates and actual future results could impact other subsequent accounting under GAAP, such as the results of future impairment tests.
|
Item 7A.
|
Quantitative and qualitative disclosures about market risk
|
Foreign currency exchange risk
Although we report our results and financial condition in U.S. dollars, a significant portion of our operating and financing activities are denominated in foreign currencies, principally the euro but also many others.
Our U.S. subsidiaries carry significant amounts of euro-denominated debt. This does not result in any material risks from an earnings perspective because the exposure from these instruments is substantially hedged by offsetting exposures from intercompany borrowing arrangements. From
72
a cash flow perspective, we have the risk of paying more or less cash for any optional or mandatory repayments of our euro-denominated debt that may not be offset with equivalent cash repayments of our intercompany borrowings. For example, an optional debt repayment of €100 million on
December 31, 2019
with a 10% weakening of the U.S. dollar would have caused us to pay an additional
$11.2 million
to extinguish that debt.
Changes to foreign currency exchange rates could favorably or unfavorably affect the translation of our foreign operating results. For example, during times of a strengthening U.S. dollar, our reported international sales and earnings will be reduced because local currencies will translate into fewer U.S. dollars. For the year ended
December 31, 2019
, a 10% strengthening of the U.S. dollar compared to all other currencies would have increased net income by
$2.6 million
(due to our foreign subsidiaries reporting an aggregate net loss) and decreased Adjusted EBITDA by
$38.0 million
.
Interest rate risk
We carry a significant amount of debt that exposes us to interest rate risk. A portion of our debt consists of variable-rate instruments. We have also issued fixed-rate secured and unsecured notes. None of our other financial instruments are subject to material interest rate risk.
At
December 31, 2019
, we had borrowings of
$1.1 billion
under our credit facilities. Borrowings under these facilities bear interest at variable rates based on prevailing LIBOR and EURIBOR rates in the financial markets. Changes to those market rates affect both the amount of cash we pay for interest and our reported interest expense. Our euro term loans include a zero percent floor on EURIBOR, which has been negative, so the floor provides a partial hedge of our variable interest rate risk on that loan. At
December 31, 2019
, a 100 basis point increase to the applicable variable rates of interest would have increased the amount of interest by
$9.5 million
per annum.
Our senior secured notes and senior unsecured notes bear interest at fixed rates, so their fair value will increase if interest rates fall and decrease if interest rates rise. At
December 31, 2019
, a 100 basis point decrease in the market rate of interest for the notes would have increased their aggregate fair value by
$202.0 million
.
|
Item 8.
|
Financial statements and supplementary data
|
The information required by this item is included at the end of this report beginning on page F-1.
|
Item 9.
|
Changes in and disagreements with accountants on accounting and financial disclosure
|
None.
|
Item 9A.
|
Control and procedures
|
This annual report does not include a report of management’s assessment regarding internal control over financial reporting or an attestation report of our independent registered public
73
accounting firm due to a transition period established by rules of the Securities and Exchange Commission for newly public companies.
Management’s evaluation of disclosure controls and procedures
Our management, with the participation of our Chief Executive Officer and Chief Financial Officer, evaluated the effectiveness of our disclosure controls and procedures as of
December 31, 2019
. Based on this evaluation, our Chief Executive Officer and Chief Financial Officer concluded that, as of
December 31, 2019
, our disclosure controls and procedures were effective in providing reasonable assurance that information required to be disclosed by us in the reports that we file or submit under the Securities Exchange Act of 1934 is recorded, processed, summarized, reported, accumulated and communicated to our management, including our Chief Executive Officer and Chief Financial Officer, as appropriate to allow timely decisions regarding required disclosure.
Changes in internal control over financial reporting
There have been no changes to our internal control over financial reporting during the fiscal quarter ended
December 31, 2019
that have materially affected or are reasonably likely to materially affect our internal control over financial reporting.
|
Item 9B.
|
Other information
|
None.
PART III
See Part I, “Information about our executive officers” for information about our executive officers, which is incorporated by reference herein. The other information required by Part III is incorporated herein by reference to our definitive proxy statement for our 2020 annual meeting of stockholders.
|
Item 10.
|
Directors, executive officers and corporate governance
|
The information with respect to executive officers required by this item is included in Part I of this annual report. All other information required by this Item will be contained in our proxy statement for the 2020 annual meeting of stockholders to be filed with the SEC not later than 120 days after our 2019 fiscal year end (the “2020 Proxy Statement”).
|
Item 11.
|
Executive compensation
|
The information required by this Item is incorporated by reference to the applicable information in our 2020 Proxy Statement.
74
|
Item 12.
|
Security ownership of certain beneficial owners and management and related stockholder matters
|
The information required by this Item is incorporated by reference to the applicable information in our 2020 Proxy Statement.
|
Item 13.
|
Certain relationships and related transactions, and director independence
|
The information required by this Item is incorporated by reference to the applicable information in our 2020 Proxy Statement.
|
Item 14.
|
Principal accounting fees and services
|
The information required by this Item is incorporated by reference to the applicable information in our 2020 Proxy Statement.
PART IV
|
Item 15.
|
Exhibits, financial statement schedules
|
The following documents are filed as part of this report.
Financial statements
Consolidated financial statements at
December 31, 2019
and
2018
and for each of the three years in the period ended
December 31, 2019
are included at the end of this report beginning on page F-1.
Financial statement schedules
Schedule I, “Condensed financial information of registrant,” is included in note
25
to the consolidated financial statements beginning on page F-1 of this report.
Schedule II, “Valuation and qualifying accounts,” is included in note
26
to the consolidated financial statements beginning on page F-1 of this report.
Exhibits
See the index beginning on page E-1 of this report.
|
Item 16.
|
Form 10-K summary
|
Not provided.
75
SIGNATURES
Pursuant to the requirements of Section 13 or 15(d) of the Securities Exchange Act of 1934, the registrant has duly caused this report to be signed on its behalf by the undersigned, thereunto duly authorized.
|
Avantor, Inc.
|
|||
|
Date: February 14, 2020
|
By:
|
/s/ Steven Eck
|
|
|
Name:
|
Steven Eck
|
||
|
Title:
|
Senior Vice President and Chief Accounting Officer (Principal Accounting Officer)
|
||
Pursuant to the requirements of the Securities Exchange Act of 1934, this report has been signed below by the following persons on behalf of the registrant and in the capacities and on the dates indicated.
|
/s/ Michael Stubblefield
|
Director, President and Chief Executive Officer
|
February 14, 2020
|
||
|
Michael Stubblefield
|
||||
|
/s/ Thomas A. Szlosek
|
Executive Vice President and Chief Financial Officer
|
February 14, 2020
|
||
|
Thomas A. Szlosek
|
||||
|
/s/ Steven Eck
|
Senior Vice President and Chief Accounting Officer
|
February 14, 2020
|
||
|
Steven Eck
|
||||
Directors:
|
Rajiv Gupta
|
Jo Natauri
|
|
Juan Andres
|
Jonathan Peacock
|
|
Thomas Connolly
|
Rakesh Sachdev
|
|
Matthew Holt
|
Christi Shaw
|
|
Andre Moura
|
|
By Justin Miller pursuant to a power of attorney executed by the directors listed above, which has been filed as an exhibit hereto.
|
/s/ Justin Miller
|
|
Justin Miller, Attorney in fact
|
|
February 14, 2020
|
76
EXHIBIT INDEX
|
Exhibit no.
|
Description
|
Location of exhibits
|
||||||
|
Form
|
Exhibit no.
|
Filing date
|
||||||
|
2.1
|
S-1/A
|
2.1
|
4/5/2019
|
|||||
|
3.1
|
8-K
|
3.1
|
5/21/2019
|
|||||
|
3.2
|
8-K
|
3.2
|
5/21/2019
|
|||||
|
3.3
|
8-K
|
3.3
|
5/21/2019
|
|||||
|
4.1
|
*
|
|||||||
|
4.2
|
S-1/A
|
4.1
|
4/5/2019
|
|||||
|
4.3
|
S-1/A
|
4.2
|
4/5/2019
|
|||||
|
10.1
|
S-1/A
|
10.1
|
4/10/2019
|
|||||
|
10.2
|
S-1/A
|
10.2
|
4/10/2019
|
|||||
E-1
|
Exhibit no.
|
Description
|
Location of exhibits
|
||||||
|
Form
|
Exhibit no.
|
Filing date
|
||||||
|
10.3
|
8-K
|
10.1
|
6/18/2019
|
|||||
|
10.4
|
8-K
|
10.1
|
1/27/2020
|
|||||
|
10.5
|
S-1/A
|
10.3
|
4/10/2019
|
|||||
|
10.6
|
S-1/A
|
10.4
|
4/10/2019
|
|||||
E-2
|
Exhibit no.
|
Description
|
Location of exhibits
|
||||||
|
Form
|
Exhibit no.
|
Filing date
|
||||||
|
10.7
|
S-1/A
|
10.5
|
4/10/2019
|
|||||
|
10.8
|
S-1/A
|
10.6
|
4/10/2019
|
|||||
|
10.9
|
S-1/A
|
10.7
|
4/10/2019
|
|||||
|
10.10
|
S-1/A
|
10.8
|
4/10/2019
|
|||||
|
10.11
|
8-K
|
10.1
|
5/21/2019
|
|||||
|
10.12
|
S-1/A
|
10.10
|
4/10/2019
|
|||||
|
10.13
|
S-1/A
|
10.11
|
4/10/2019
|
|||||
|
10.14^
|
S-1/A
|
10.12
|
4/5/2019
|
|||||
|
10.15^
|
S-1/A
|
10.13
|
4/25/2019
|
|||||
|
10.16^
|
S-1/A
|
10.14
|
4/5/2019
|
|||||
|
10.17^
|
S-1/A
|
10.15
|
4/25/2019
|
|||||
E-3
|
Exhibit no.
|
Description
|
Location of exhibits
|
||||||
|
Form
|
Exhibit no.
|
Filing date
|
||||||
|
10.18^
|
S-1/A
|
10.17
|
5/3/2019
|
|||||
|
10.19^
|
8-K
|
10.2
|
5/21/2019
|
|||||
|
10.20^
|
S-1/A
|
10.25
|
4/25/2019
|
|||||
|
10.21^
|
S-1/A
|
10.26
|
4/25/2019
|
|||||
|
10.22^
|
S-1/A
|
10.27
|
4/25/2019
|
|||||
|
10.23^
|
8-K
|
10.3
|
5/21/2019
|
|||||
|
10.24^
|
S-8
|
4.4
|
11/14/2019
|
|||||
|
10.25^
|
S-1/A
|
10.16
|
4/25/2019
|
|||||
|
10.26^
|
S-1/A
|
10.17
|
4/5/2019
|
|||||
|
10.27^
|
S-1/A
|
10.18
|
4/5/2019
|
|||||
|
10.28^
|
*
|
|||||||
|
10.29^
|
*
|
|||||||
|
10.30^
|
*
|
|||||||
|
10.31^
|
S-1/A
|
10.19
|
4/10/2019
|
|||||
E-4
|
Exhibit no.
|
Description
|
Location of exhibits
|
||||||
|
Form
|
Exhibit no.
|
Filing date
|
||||||
|
10.32^
|
S-1/A
|
10.20
|
4/25/2019
|
|||||
|
10.33^
|
S-1/A
|
10.21
|
4/25/2019
|
|||||
|
10.34
|
S-1/A
|
10.23
|
4/25/2019
|
|||||
|
14
|
Code of ethics
|
#
|
||||||
|
21
|
*
|
|||||||
|
23
|
*
|
|||||||
|
24
|
*
|
|||||||
|
31.1
|
*
|
|||||||
|
31.2
|
*
|
|||||||
|
32.1
|
**
|
|||||||
|
32.2
|
**
|
|||||||
|
101
|
XBRL exhibits
|
*
|
||||||
|
*
|
Filed herewith
|
|
**
|
Furnished herewith
|
|
#
|
Our Code of Ethics and Conduct can be found on our website (www.avantorsciences.com) by clicking on “Investors,” “Governance” and then “Code of Ethics.”
|
|
^
|
Indicates management contract or compensatory plan, contract or arrangement.
|
E-5
Avantor, Inc. and subsidiaries
Index to consolidated financial statements
|
Page
|
|
F-1
REPORT OF INDEPENDENT REGISTERED PUBLIC ACCOUNTING FIRM
To the stockholders and the Board of Directors of Avantor, Inc.
Opinion on the Financial Statements
We have audited the accompanying consolidated balance sheets of Avantor, Inc. and subsidiaries (the “Company”) as of
December 31, 2019
and
2018
, the related consolidated statements of operations, comprehensive income or loss, stockholders’ equity or deficit, and cash flows for each of the three years in the period ended
December 31, 2019
, and the related notes (collectively referred to as the “financial statements”). In our opinion, the financial statements present fairly, in all material respects, the financial position of the Company as of
December 31, 2019
and
2018
, and the results of its operations and its cash flows for each of the three years in the period ended
December 31, 2019
, in conformity with accounting principles generally accepted in the United States of America.
Change in Accounting Principle
As discussed in Note
3
to the financial statements, effective January 1, 2019, the Company adopted the Financial Accounting Standards Board’s new standard related to leases using the modified retrospective approach.
Basis for Opinion
These financial statements are the responsibility of the Company’s management. Our responsibility is to express an opinion on the Company’s financial statements based on our audits. We are a public accounting firm registered with the Public Company Accounting Oversight Board (United States) (PCAOB) and are required to be independent with respect to the Company in accordance with the U.S. federal securities laws and the applicable rules and regulations of the Securities and Exchange Commission and the PCAOB.
We conducted our audits in accordance with the standards of the PCAOB. Those standards require that we plan and perform the audit to obtain reasonable assurance about whether the financial statements are free of material misstatement, whether due to error or fraud. The Company is not required to have, nor were we engaged to perform, an audit of its internal control over financial reporting. As part of our audits, we are required to obtain an understanding of internal control over financial reporting but not for the purpose of expressing an opinion on the effectiveness of the Company’s internal control over financial reporting. Accordingly, we express no such opinion.
Our audits included performing procedures to assess the risks of material misstatement of the financial statements, whether due to error or fraud, and performing procedures that respond to those risks. Such procedures included examining, on a test basis, evidence regarding the amounts and disclosures in the financial statements. Our audits also included evaluating the accounting principles used and significant estimates made by management, as well as evaluating the overall
F-2
presentation of the financial statements. We believe that our audits provide a reasonable basis for our opinion
.
/s/ Deloitte & Touche LLP
Philadelphia, Pennsylvania
February 14, 2020
We have served as the Company’s auditor since 2010.
F-3
Avantor, Inc. and subsidiaries
Consolidated balance sheets
|
(in millions)
|
December 31,
|
||||||
|
2019
|
2018
|
||||||
|
Assets
|
|||||||
|
Current assets:
|
|||||||
|
Cash and cash equivalents
|
$
|
186.7
|
|
$
|
184.7
|
|
|
|
Accounts receivable, net of allowances of $18.6 and $10.9
|
988.8
|
|
931.2
|
|
|||
|
Inventory
|
711.2
|
|
671.1
|
|
|||
|
Other current assets
|
134.8
|
|
112.6
|
|
|||
|
Total current assets
|
2,021.5
|
|
1,899.6
|
|
|||
|
Property, plant and equipment, net of accumulated depreciation of $307.8 and $225.8
|
557.0
|
|
598.6
|
|
|||
|
Other intangible assets, net (see note 10)
|
4,220.2
|
|
4,565.7
|
|
|||
|
Goodwill
|
2,769.4
|
|
2,784.7
|
|
|||
|
Other assets
|
205.2
|
|
63.0
|
|
|||
|
Total assets
|
$
|
9,773.3
|
|
$
|
9,911.6
|
|
|
The accompanying notes are an integral part of these consolidated financial statements
F-4
Avantor, Inc. and subsidiaries
Consolidated balance sheets (continued)
|
(in millions)
|
December 31,
|
||||||
|
2019
|
2018
|
||||||
|
Liabilities and equity
|
|||||||
|
Current liabilities:
|
|||||||
|
Current portion of debt
|
$
|
93.5
|
|
$
|
142.4
|
|
|
|
Accounts payable
|
560.2
|
|
557.4
|
|
|||
|
Employee-related liabilities
|
114.3
|
|
144.9
|
|
|||
|
Accrued interest
|
74.2
|
|
76.6
|
|
|||
|
Other current liabilities
|
232.3
|
|
174.9
|
|
|||
|
Total current liabilities
|
1,074.5
|
|
1,096.2
|
|
|||
|
Debt, net of current portion
|
5,023.0
|
|
6,782.3
|
|
|||
|
Deferred income tax liabilities
|
785.4
|
|
907.5
|
|
|||
|
Other liabilities
|
428.2
|
|
318.0
|
|
|||
|
Total liabilities
|
7,311.1
|
|
9,104.0
|
|
|||
|
Commitments and contingencies, see note 12
|
|
|
|||||
|
Redeemable equity:
|
|||||||
|
Series A preferred stock at redemption value, zero and 2.3 shares outstanding
|
—
|
|
2,297.3
|
|
|||
|
Junior convertible preferred stock, zero and 1.7 shares outstanding
|
—
|
|
1,562.0
|
|
|||
|
Total redeemable equity
|
—
|
|
3,859.3
|
|
|||
|
Stockholders’ equity (deficit):
|
|||||||
|
Mandatory convertible preferred stock including paid-in capital, 20.7 and 0.0 shares outstanding
|
1,003.7
|
|
—
|
|
|||
|
Common stock including paid-in capital, 572.8 and 132.8 shares outstanding
|
1,748.1
|
|
(2,746.8
|
)
|
|||
|
Accumulated deficit
|
(203.7
|
)
|
(238.4
|
)
|
|||
|
Accumulated other comprehensive loss
|
(85.9
|
)
|
(66.5
|
)
|
|||
|
Total stockholders’ equity (deficit)
|
2,462.2
|
|
(3,051.7
|
)
|
|||
|
Total liabilities and equity
|
$
|
9,773.3
|
|
$
|
9,911.6
|
|
|
The accompanying notes are an integral part of these consolidated financial statements
F-5
Avantor, Inc. and subsidiaries
Consolidated statements of operations
|
(in millions, except per share data)
|
Year ended December 31,
|
||||||||||
|
2019
|
2018
|
2017
|
|||||||||
|
Net sales
|
$
|
6,040.3
|
|
$
|
5,864.3
|
|
$
|
1,247.4
|
|
||
|
Cost of sales
|
4,119.6
|
|
4,044.5
|
|
814.6
|
|
|||||
|
Gross profit
|
1,920.7
|
|
1,819.8
|
|
432.8
|
|
|||||
|
Selling, general and administrative expenses
|
1,368.9
|
|
1,405.3
|
|
449.7
|
|
|||||
|
Fees to New Mountain Capital
|
—
|
|
1.0
|
|
193.5
|
|
|||||
|
Operating income (loss)
|
551.8
|
|
413.5
|
|
(210.4
|
)
|
|||||
|
Interest expense
|
(440.0
|
)
|
(523.8
|
)
|
(200.9
|
)
|
|||||
|
Loss on extinguishment of debt
|
(73.7
|
)
|
—
|
|
(56.4
|
)
|
|||||
|
Other income (expense), net
|
2.5
|
|
(3.5
|
)
|
7.5
|
|
|||||
|
Income (loss) before income taxes
|
40.6
|
|
(113.8
|
)
|
(460.2
|
)
|
|||||
|
Income tax (expense) benefit
|
(2.8
|
)
|
26.9
|
|
314.9
|
|
|||||
|
Net income (loss)
|
$
|
37.8
|
|
$
|
(86.9
|
)
|
$
|
(145.3
|
)
|
||
|
Net income (loss)
|
$
|
37.8
|
|
$
|
(86.9
|
)
|
$
|
(145.3
|
)
|
||
|
Net loss attributable to noncontrolling interests
|
—
|
|
—
|
|
(32.6
|
)
|
|||||
|
Net income (loss) attributable to Avantor, Inc.
|
37.8
|
|
(86.9
|
)
|
(112.7
|
)
|
|||||
|
Accumulation of yield on preferred stock
|
(152.5
|
)
|
(269.5
|
)
|
(27.8
|
)
|
|||||
|
Adjustments of preferred stock to redemption value
|
(220.4
|
)
|
—
|
|
(274.4
|
)
|
|||||
|
Net loss available to common stockholders of Avantor, Inc.
|
$
|
(335.1
|
)
|
$
|
(356.4
|
)
|
$
|
(414.9
|
)
|
||
|
Loss per share information, basic and diluted:
|
|||||||||||
|
Loss per share
|
$
|
(0.84
|
)
|
$
|
(2.69
|
)
|
$
|
(2.75
|
)
|
||
|
Weighted average shares outstanding
|
401.2
|
|
132.7
|
|
151.1
|
|
|||||
The accompanying notes are an integral part of these consolidated financial statements
F-6
Avantor, Inc. and subsidiaries
Consolidated statements of comprehensive income or loss
|
(in millions)
|
Year ended December 31,
|
||||||||||
|
2019
|
2018
|
2017
|
|||||||||
|
Net income (loss)
|
$
|
37.8
|
|
$
|
(86.9
|
)
|
$
|
(145.3
|
)
|
||
|
Other comprehensive (loss) income:
|
|||||||||||
|
Foreign currency translation — unrealized (loss) gain
|
(3.3
|
)
|
(82.7
|
)
|
71.0
|
|
|||||
|
Derivative instruments:
|
|||||||||||
|
Unrealized (loss) gain
|
(1.4
|
)
|
3.0
|
|
0.3
|
|
|||||
|
Reclassification of (gain) loss into earnings
|
(0.9
|
)
|
(1.9
|
)
|
0.1
|
|
|||||
|
Defined benefit plans:
|
|||||||||||
|
Unrealized (loss) gain
|
(18.9
|
)
|
(16.9
|
)
|
2.2
|
|
|||||
|
Reclassification of (gain) loss into earnings
|
(0.6
|
)
|
2.3
|
|
(3.2
|
)
|
|||||
|
Other comprehensive (loss) income before income taxes
|
(25.1
|
)
|
(96.2
|
)
|
70.4
|
|
|||||
|
Income tax benefit
|
5.7
|
|
3.3
|
|
0.1
|
|
|||||
|
Other comprehensive (loss) income
|
(19.4
|
)
|
(92.9
|
)
|
70.5
|
|
|||||
|
Comprehensive income (loss)
|
18.4
|
|
(179.8
|
)
|
(74.8
|
)
|
|||||
|
Comprehensive loss attributable to noncontrolling interests
|
—
|
|
—
|
|
(29.4
|
)
|
|||||
|
Comprehensive income (loss) attributable to Avantor, Inc.
|
$
|
18.4
|
|
$
|
(179.8
|
)
|
$
|
(45.4
|
)
|
||
The accompanying notes are an integral part of these consolidated financial statements
F-7
Avantor, Inc. and subsidiaries
Consolidated statements of stockholders’ equity or deficit
|
(in millions)
|
Stockholders’ equity (deficit) of Avantor, Inc.
|
NCI
|
Total
|
|||||||||||||||||||||||
|
Common stock including paid-in capital
|
Accumulated deficit
|
AOCI
|
Total
|
|||||||||||||||||||||||
|
Shares
|
Amount
|
|||||||||||||||||||||||||
|
Balance on December 31, 2016
|
229.9
|
|
$
|
(338.8
|
)
|
$
|
(5.7
|
)
|
$
|
(30.4
|
)
|
$
|
(374.9
|
)
|
$
|
(135.7
|
)
|
$
|
(510.6
|
)
|
||||||
|
Issuances, net of issuance costs
|
—
|
|
90.8
|
|
—
|
|
—
|
|
90.8
|
|
—
|
|
90.8
|
|
||||||||||||
|
Distributions
|
—
|
|
(1,539.5
|
)
|
—
|
|
—
|
|
(1,539.5
|
)
|
(162.4
|
)
|
(1,701.9
|
)
|
||||||||||||
|
Comprehensive (loss) income
|
—
|
|
—
|
|
(112.7
|
)
|
67.3
|
|
(45.4
|
)
|
(29.4
|
)
|
(74.8
|
)
|
||||||||||||
|
Stock-based compensation expense
|
—
|
|
31.6
|
|
—
|
|
—
|
|
31.6
|
|
0.2
|
|
31.8
|
|
||||||||||||
|
Accumulation of yield on preferred stock
|
—
|
|
(27.8
|
)
|
—
|
|
—
|
|
(27.8
|
)
|
—
|
|
(27.8
|
)
|
||||||||||||
|
Adjustments of preferred stock to redemption value
|
—
|
|
(274.4
|
)
|
—
|
|
—
|
|
(274.4
|
)
|
—
|
|
(274.4
|
)
|
||||||||||||
|
Effects of legal entity restructuring, see note 14
|
(97.3
|
)
|
(432.2
|
)
|
(37.9
|
)
|
(10.5
|
)
|
(480.6
|
)
|
327.0
|
|
(153.6
|
)
|
||||||||||||
|
Other
|
—
|
|
—
|
|
—
|
|
—
|
|
—
|
|
0.3
|
|
0.3
|
|
||||||||||||
|
Balance on December 31, 2017
|
132.6
|
|
$
|
(2,490.3
|
)
|
$
|
(156.3
|
)
|
$
|
26.4
|
|
$
|
(2,620.2
|
)
|
$
|
—
|
|
$
|
(2,620.2
|
)
|
||||||
The accompanying notes are an integral part of these consolidated financial statements
F-8
Avantor, Inc. and subsidiaries
Consolidated statements of stockholders’ equity or deficit (continued)
|
(in millions)
|
MCPS including paid-in capital
|
Common stock including paid-in capital
|
Accumulated deficit
|
AOCI
|
Total
|
||||||||||||||||||||
|
Shares
|
Amount
|
Shares
|
Amount
|
||||||||||||||||||||||
|
Balance on December 31, 2017
|
—
|
|
$
|
—
|
|
132.6
|
|
$
|
(2,490.3
|
)
|
$
|
(156.3
|
)
|
$
|
26.4
|
|
$
|
(2,620.2
|
)
|
||||||
|
Cumulative effect of adopting new accounting standard, see note 3
|
—
|
|
—
|
|
—
|
|
—
|
|
4.8
|
|
—
|
|
4.8
|
|
|||||||||||
|
Comprehensive loss
|
—
|
|
—
|
|
—
|
|
—
|
|
(86.9
|
)
|
(92.9
|
)
|
(179.8
|
)
|
|||||||||||
|
Stock-based compensation expense
|
—
|
|
—
|
|
—
|
|
13.0
|
|
—
|
|
—
|
|
13.0
|
|
|||||||||||
|
Accumulation of yield on preferred stock
|
—
|
|
—
|
|
—
|
|
(269.5
|
)
|
—
|
|
—
|
|
(269.5
|
)
|
|||||||||||
|
Exercise of stock options
|
—
|
|
—
|
|
0.2
|
|
—
|
|
—
|
|
—
|
|
—
|
|
|||||||||||
|
Balance on December 31, 2018
|
—
|
|
—
|
|
132.8
|
|
(2,746.8
|
)
|
(238.4
|
)
|
(66.5
|
)
|
(3,051.7
|
)
|
|||||||||||
|
Cumulative effect of adopting new accounting standar
d, see note 3
|
—
|
|
—
|
|
—
|
|
—
|
|
(3.1
|
)
|
—
|
|
(3.1
|
)
|
|||||||||||
|
Issuances, net of issuance costs
|
20.7
|
|
1,003.7
|
|
238.1
|
|
3,231.9
|
|
—
|
|
—
|
|
4,235.6
|
|
|||||||||||
|
Conversion of junior convertible preferred stock
|
—
|
|
—
|
|
194.5
|
|
1,562.0
|
|
—
|
|
—
|
|
1,562.0
|
|
|||||||||||
|
Comprehensive income (loss)
|
—
|
|
—
|
|
—
|
|
—
|
|
37.8
|
|
(19.4
|
)
|
18.4
|
|
|||||||||||
|
Stock-based compensation expense
|
—
|
|
—
|
|
—
|
|
64.4
|
|
—
|
|
—
|
|
64.4
|
|
|||||||||||
|
Accumulation of yield on preferred stock
|
—
|
|
—
|
|
—
|
|
(152.5
|
)
|
—
|
|
—
|
|
(152.5
|
)
|
|||||||||||
|
Adjustments of preferred stock to redemption value
|
—
|
|
—
|
|
—
|
|
(220.4
|
)
|
—
|
|
—
|
|
(220.4
|
)
|
|||||||||||
|
Exercise of stock options
|
—
|
|
—
|
|
0.4
|
|
0.7
|
|
—
|
|
—
|
|
0.7
|
|
|||||||||||
|
Exercise of warrants
|
—
|
|
—
|
|
7.0
|
|
—
|
|
—
|
|
—
|
|
—
|
|
|||||||||||
|
Award reclassification, see note 17
|
—
|
|
—
|
|
—
|
|
8.8
|
|
—
|
|
—
|
|
8.8
|
|
|||||||||||
|
Balance on December 31, 2019
|
20.7
|
|
$
|
1,003.7
|
|
572.8
|
|
$
|
1,748.1
|
|
$
|
(203.7
|
)
|
$
|
(85.9
|
)
|
$
|
2,462.2
|
|
||||||
The accompanying notes are an integral part of these consolidated financial statements
F-9
Avantor, Inc. and subsidiaries
Consolidated statements of cash flows
|
(in millions)
|
Year ended December 31,
|
||||||||||
|
2019
|
2018
|
2017
|
|||||||||
|
Cash flows from operating activities:
|
|||||||||||
|
Net income (loss)
|
$
|
37.8
|
|
$
|
(86.9
|
)
|
$
|
(145.3
|
)
|
||
|
Reconciling adjustments:
|
|||||||||||
|
Depreciation and amortization
|
398.9
|
|
404.6
|
|
99.2
|
|
|||||
|
Stock-based compensation expense
|
67.9
|
|
18.4
|
|
48.2
|
|
|||||
|
Other restructuring charges (see note 11)
|
10.4
|
|
28.4
|
|
—
|
|
|||||
|
Provision for accounts receivable and inventory
|
35.1
|
|
25.7
|
|
5.1
|
|
|||||
|
Deferred income tax benefit
|
(106.7
|
)
|
(103.9
|
)
|
(430.6
|
)
|
|||||
|
Effect of one-time transition tax
|
—
|
|
(35.8
|
)
|
107.0
|
|
|||||
|
Amortization of deferred financing costs
|
33.5
|
|
41.4
|
|
11.7
|
|
|||||
|
Loss on extinguishment of debt
|
73.7
|
|
—
|
|
56.4
|
|
|||||
|
Changes in assets and liabilities:
|
|||||||||||
|
Accounts receivable
|
(68.9
|
)
|
(83.4
|
)
|
14.1
|
|
|||||
|
Inventory
|
(71.1
|
)
|
(41.1
|
)
|
19.7
|
|
|||||
|
Accounts payable
|
5.1
|
|
29.4
|
|
31.8
|
|
|||||
|
Other assets and liabilities
|
(51.7
|
)
|
1.3
|
|
7.0
|
|
|||||
|
Other, net
|
(10.0
|
)
|
2.4
|
|
8.2
|
|
|||||
|
Net cash provided by (used in) operating activities
|
354.0
|
|
200.5
|
|
(167.5
|
)
|
|||||
|
Cash flows from investing activities:
|
|||||||||||
|
Capital expenditures
|
(51.6
|
)
|
(37.7
|
)
|
(25.2
|
)
|
|||||
|
Cash paid for acquisitions, net of cash acquired
|
—
|
|
—
|
|
(6,660.7
|
)
|
|||||
|
Other
|
9.5
|
|
14.5
|
|
9.9
|
|
|||||
|
Net cash used in investing activities
|
$
|
(42.1
|
)
|
$
|
(23.2
|
)
|
$
|
(6,676.0
|
)
|
||
The accompanying notes are an integral part of these consolidated financial statements
F-10
Avantor, Inc.
Consolidated statements of cash flows (continued)
|
(in millions)
|
Year ended December 31,
|
||||||||||
|
2019
|
2018
|
2017
|
|||||||||
|
Cash flows from financing activities:
|
|||||||||||
|
Proceeds from issuance of stock, net of issuance costs
|
4,235.6
|
|
—
|
|
3,049.0
|
|
|||||
|
Redemption of series A preferred stock
|
(2,630.9
|
)
|
—
|
|
—
|
|
|||||
|
Debt borrowings
|
1.3
|
|
35.7
|
|
9,249.5
|
|
|||||
|
Debt repayments
|
(1,878.6
|
)
|
(185.5
|
)
|
(3,290.6
|
)
|
|||||
|
Cash paid for debt financing costs
|
—
|
|
—
|
|
(318.6
|
)
|
|||||
|
Payments of dividends on MCPS
|
(31.3
|
)
|
—
|
|
—
|
|
|||||
|
Distributions
|
—
|
|
—
|
|
(1,701.9
|
)
|
|||||
|
Payments of contingent consideration
|
(4.6
|
)
|
(20.5
|
)
|
(22.7
|
)
|
|||||
|
Other
|
0.7
|
|
—
|
|
0.3
|
|
|||||
|
Net cash (used in) provided by financing activities
|
(307.8
|
)
|
(170.3
|
)
|
6,965.0
|
|
|||||
|
Effect of currency rate changes on cash
|
(2.5
|
)
|
(7.8
|
)
|
1.0
|
|
|||||
|
Net change in cash and cash equivalents
|
1.6
|
|
(0.8
|
)
|
122.5
|
|
|||||
|
Cash, cash equivalents and restricted cash, beginning of year
|
187.7
|
|
188.5
|
|
66.0
|
|
|||||
|
Cash, cash equivalents and restricted cash, end of year
|
$
|
189.3
|
|
$
|
187.7
|
|
$
|
188.5
|
|
||
The accompanying notes are an integral part of these consolidated financial statements
F-11
Avantor, Inc. and subsidiaries
Notes to consolidated financial statements
|
1
.
|
Nature of operations and presentation of financial statements
|
We are a global manufacturer and distributor that provides products and services to customers in the biopharmaceutical, healthcare, education & government and advanced technologies & applied materials industries.
Basis of presentation
The accompanying financial statements are those of Avantor, a business organization that had two different parent companies during the periods presented. Avantor, Inc. is the parent company for periods since November 21, 2017, and Avantor Funding, Inc. is the parent company for periods prior to November 21, 2017.
For the periods presented, all share and per share information has been adjusted for a stock split that occurred in connection with our IPO.
We restructured our legal entity organization in connection with the acquisition of VWR on November 21, 2017. VWR has been consolidated with us prospectively since then. The legal entity reorganization eliminated a noncontrolling interest that existed prior to the acquisition.
The financial statements reflect the adoptions of a new revenue recognition standard at January 1, 2018 and a new lease standard at January 1, 2019. Information about these new accounting standards is disclosed in note
3
.
Principles of consolidation
All intercompany balances and transactions have been eliminated from the financial statements.
Reclassifications
In 2019, we changed our presentation of disaggregated net sales (see note
6
) to depict the product line categories that are regularly used by management. Product sales associated with our service offerings, referred to as specialty procurement, have been reclassified from third party materials & consumables and combined with net sales from services into the services & specialty procurement product line for all periods presented.
In 2019, we changed our presentation of the statement of operations by reclassifying the loss on extinguishment of debt out of interest expense onto a standalone line.
Use of estimates
The preparation of financial statements in conformity with GAAP requires us to make estimates and assumptions that affect the amounts reported throughout the financial statements. Actual results could differ from those estimates.
F-12
We have provided additional disclosures about the following significant estimates for which it is at least reasonably possible that a change in estimate will occur in the near term:
|
•
|
The fair value of reporting units tested for impairment in note
5
;
|
|
•
|
The valuation allowance on deferred tax assets in note
19
;
|
|
•
|
Assumptions used to measure our defined benefit plans in note
16
;
|
|
•
|
The likelihood of occurrence of loss contingencies in note
12
; and
|
|
•
|
Other accounts measured at fair value based on unobservable inputs in note
21
.
|
|
2
.
|
Summary of significant accounting policies
|
Earnings or loss per share
Basic earnings or loss per share is computed by dividing net income or loss available to common stockholders by the weighted average number of common shares outstanding during the reporting period. In historical periods, junior convertible preferred stock and warrants were accounted for under a two-class method, but for all periods presented, those instruments were excluded from the calculation because they did not participate in losses.
Diluted earnings per share is computed based on the weighted average number of common shares outstanding increased by the number of additional shares that would have been outstanding had the potentially dilutive common shares been issued and reduced by the number of shares we could have repurchased with the proceeds from the issuance of the potentially dilutive shares. Variable conversion ratios are determined as of period end. Preferred dividends are added back to net income or loss available to common stockholders provided that the preferred securities are not anti-dilutive to the calculation.
In periods of net loss available to common stockholders, diluted calculations are equal to basic calculations because the inclusion of dilutive shares would be anti-dilutive.
Segment reporting
We report
three
geographic segments based on customer location: Americas, Europe and AMEA. Our operating segments are the same as our reportable segments. Our Chief Executive Officer, who is our chief operating decision maker, evaluates segment profitability using Management EBITDA.
None of our customers contributed more than 10% to our net sales. We determined that disclosing net sales for groups of similar products was impracticable prior to January 1, 2018, but implementation of the new revenue recognition standard made this practicable beginning January 1, 2018.
F-13
We disclose geographic data for our two largest countries as a percentage of consolidated net sales, the United States and Germany. No other countries were individually material. We also disclose certain regional data because of differences in geopolitical and / or competitive conditions. We disclose property and equipment by geographic area because many of these assets cannot be readily moved and are illiquid, subjecting them to geographic risk. None of our other long-lived assets are subject to significant geopolitical risk. We do not manage total assets on a segment basis. Segment information about interest expense, income tax expense or benefit and other significant non-cash items are not disclosed because they are not included in the segment profitability measurement nor are they otherwise provided to our chief operating decision maker on a regular basis.
Cash and cash equivalents
Cash equivalents are comprised of highly-liquid investments with original maturities of three months or less. Bank overdrafts are classified as current liabilities, and changes to bank overdrafts are presented as a financing activity on our consolidated statements of cash flows.
Accounts receivable and allowance for doubtful accounts
Substantially all of our accounts receivable are trade accounts that are recorded at the invoiced amount and generally do not bear interest. Accounts receivable are presented net of an allowance representing our estimate of amounts that will not be collected. We consider many factors in estimating our reserve including the age of our receivables, historical collections experience, customer types, creditworthiness and economic trends. Account balances are written off against the allowance when we determine it is probable that the receivable will not be recovered.
Inventory
Inventory consists of merchandise inventory related to our distribution business and finished goods, raw materials and work in process related to our manufacturing business. Goods are removed from inventory as follows:
|
•
|
Merchandise inventory purchased by certain U.S. subsidiaries using the LIFO method.
|
|
•
|
All other merchandise inventory using the first-in, first-out method.
|
|
•
|
Manufactured inventories using an average cost method.
|
Inventory is valued at the lower of cost or net realizable value. Cost for manufactured goods is determined using standard costing methods to estimate raw materials, labor and overhead consumed. Variances from actual cost are recorded to inventory at period-end. Cost for other inventory is based on amounts invoiced by suppliers plus freight. If net realizable value is less than carrying value, we reduce the carrying amount to net realizable value and record a loss in cost of sales.
F-14
Property, plant and equipment
Property, plant and equipment are stated at cost. Depreciation is recognized using the straight-line method over estimated useful lives of
three
to
40 years
for buildings and related improvements,
three
to
20 years
for machinery and equipment and
three
to
10 years
for capitalized software. Leasehold improvements are depreciated on a straight-line basis over the shorter of the estimated useful lives of the assets or the estimated remaining life of the lease. Depreciation is classified as cost of sales or selling, general and administrative expense based on the use of the underlying asset.
Software development costs are capitalized as property, plant and equipment once the preliminary project stage is completed and management commits to funding the project if it is probable that the project will be completed for its intended use. Preliminary project planning and training costs related to software are expensed as incurred.
Impairment of long-lived assets
Long-lived assets include property, plant and equipment, finite-lived intangible assets and certain other assets. For impairment testing purposes, long-lived assets may be grouped with working capital and other types of assets or liabilities if they generate cash flows on a combined basis.
We evaluate long-lived assets or asset groups for impairment whenever events or changes in circumstances indicate a potential inability to recover their carrying amounts. Impairment is determined by comparing their carrying value to their estimated undiscounted future cash flows. If assets or asset groups are impaired, the loss is measured as the amount by which their carrying values exceed their fair values.
Goodwill and other intangible assets
Goodwill represents the excess of the price of an acquired business over the aggregate fair value of its net assets. Other intangible assets consist of both finite-lived and indefinite-lived intangible assets.
Goodwill and other indefinite-lived intangible assets are tested annually for impairment on October 1 of each year. Goodwill impairment testing is performed at the reporting unit level. Our reporting units since
October 1, 2019
have been Americas sciences, Americas silicones, Europe and AMEA. From October 1, 2018 to September 30, 2019, our reporting units were Americas, Europe and AMEA. Prior to October 1, 2018, we had three reporting units based on product lines. The changes to the reporting units are discussed further in note
10
.
All of our intangible assets, including goodwill, are tested for impairment whenever an impairment indicator arises. Examples of impairment indicators include unexpected adverse business conditions, economic factors, unanticipated technological changes or competitive activities, loss of key personnel and acts or anticipated acts by governments and courts.
F-15
The impairment analysis for goodwill and indefinite-lived intangible assets consists of an optional qualitative assessment potentially followed by a quantitative analysis. If we determine that the carrying value of a reporting unit or an indefinite-lived intangible asset exceeds its fair value, an impairment charge is recorded for the excess.
Indefinite-lived intangible assets are not amortized. Annually, we evaluate whether these assets continue to have indefinite lives, considering whether they have any legal, regulatory, contractual, competitive or economic limitations and whether they are expected to contribute to the generation of cash flows indefinitely.
Finite-lived intangible assets are amortized over their estimated useful lives on a straight-line basis, with customer relationships amortized over lives of
ten
to
20 years
, the VWR tradename amortized over a life of
6.4 years
and other finite-lived intangible assets amortized over lives of
two
to
20 years
. Amortization is classified in selling, general and administrative expenses. We reevaluate the estimated useful lives of our finite-lived intangible assets annually.
Finite-lived intangible assets are evaluated for impairment in the same way as described in the policy entitled “Impairment of long-lived assets.”
Restructuring and severance charges
We have implemented various restructuring and severance plans. Those plans are designed to improve gross margins and reduce operating costs over time. We typically incur upfront charges to implement those plans related to employee severance, facility closure and other actions:
|
•
|
Employee severance and related
— Employee severance programs can be voluntary or involuntary. Voluntary severances are recorded at their reasonably estimated amount when associates accept severance offers. Involuntary severances covered by plan or statute are recorded at estimated amounts when probable and reasonably estimable. Significant judgment is required to determine probability and whether the amount can be reasonably estimated. Involuntary severances requiring continuing service are measured at fair value as of the termination date and recognized on a straight-line basis over the service period. Other involuntary severances are recognized at fair value on the date we notify associates of the severance plan.
|
|
•
|
Facility closure
— On the date we cease using a facility, facility lease assets are tested for impairment in the same way as other long-lived assets.
|
|
•
|
Other
— Other charges may be incurred to write down assets, divest businesses or for other reasons and are accounted for under applicable GAAP as described elsewhere in these policies.
|
Restructuring and severance charges are classified as selling, general and administrative expenses. Accrued restructuring and severance charges are classified as employee-related current liabilities if we anticipate settlement within one year, otherwise they are included in other liabilities.
F-16
Contingencies
Our business exposes us to various contingencies including compliance with environmental laws and regulations, legal exposures related to the manufacture and sale of products and other matters. Loss contingencies are reflected in the financial statements based on our assessments of their expected outcome or resolution:
|
•
|
They are recognized as liabilities on our balance sheet if the potential loss is probable and the amount can be reasonably estimated.
|
|
•
|
They are disclosed if the potential loss is material and considered at least reasonably possible.
|
Significant judgment is required to determine probability and whether the amount can be reasonably estimated. Due to uncertainties related to these matters, accruals are based only on the information available at the time. As additional information becomes available, we reassess potential liabilities and may revise our previous estimates.
Debt
Borrowings under lines of credit are stated at their face amount. Borrowings under term debt are stated at their face amounts net of unamortized deferred financing costs, including any original issue discounts or premiums.
The accounting for financing costs depends on whether debt is newly issued, extinguished or modified. That determination is made on an individual lender basis. When new debt is issued, financing costs and discounts are deferred and recognized as interest expense through maturity of the debt. When debt is extinguished, unamortized deferred financing costs and discounts are written off and presented as a loss on extinguishment of debt. When debt is modified, new financing costs and prior unamortized deferred financing costs may be either (i) immediately recognized as interest expense or selling, general and administrative expense or (ii) deferred and recognized as interest expense through maturity of the modified debt, depending on the type of cost and whether the modification was substantial or insubstantial.
Borrowings and repayments under lines of credit are short-term in nature and presented on the statement of cash flows on a net basis.
Equity
Redeemable equity includes ownership interests that are redeemable or become redeemable in a way that is not solely within our control. Redeemable equity is: (i) initially recorded at fair value, net of issuance costs, and (ii) subsequently stated at its redemption value unless the redemption feature is triggered by a contingency that is not probable of occurring. Any such adjustments are offset to common stock including paid-in capital and included in net income or loss available to common stockholders. Redeemable equity is presented between the liabilities and stockholders’ equity or deficit sections of the balance sheet.
F-17
Stockholders’ equity or deficit comprises nonredeemable ownership interests in MCPS and common stock. Our accounting policies for these instruments are as follows:
|
•
|
MCPS is classified as permanent equity and initially recorded at fair value, net of issuance costs. Accrued but unpaid MCPS dividends are classified as other current liabilities with a corresponding reduction to common stock including paid-in capital.
|
|
•
|
Common stock is presented at par value plus additional paid-in amounts, net of issuance costs. Distributions are accounted for as reductions to common stock including paid-in capital and are classified as financing activities on the statement of cash flows.
|
|
•
|
Upon issuance, paid-in capital is allocated among host stock instruments and detachable warrants on a relative fair value basis.
|
Costs directly associated with new equity issuances are recorded as other current assets until the issuances are completed or abandoned. If the issuance is completed, the costs are reclassified to stockholders’ equity and presented as a reduction of proceeds received. If the issuance is abandoned, the costs are reclassified to SG&A expenses. Costs associated with secondary equity offerings under a registration rights agreement are recorded as SG&A expenses.
Disclosures about certain classes of stock are provided in the footnotes and not stated separately on the balance sheet or statement of stockholders’ deficit when those presentations are not deemed to be material.
During 2017, a portion of the consolidated comprehensive loss of Avantor Holdings LP was allocated to the noncontrolling interest based on its ownership percentage. Distributions and other changes to stockholders’ deficit, such as those arising from stock-based compensation, were attributed to the noncontrolling interest based on actual amounts.
Revenue recognition
We recognize revenue by applying a five-step process: (i) identify the contract with a customer, (ii) identify the performance obligation in the contract, (iii) determine the transaction price, (iv) allocate the transaction price to the performance obligations and (v) recognize revenue as the performance obligations are satisfied by transferring control of the performance obligation through delivery of a promised product or service to a customer.
Control of a performance obligation may transfer to the customer either at a point in time or over time depending on an evaluation of the specific facts and circumstances for each contract, including the terms and conditions of the contract as agreed with the customer, as well as the nature of the products or services to be provided. The substantial majority of our net sales are recognized at a point in time based upon the delivery of products to customers pursuant to purchase orders. We recognize service revenues and sales of certain of our custom-manufactured products over time as control passes to the customer concurrent with our performance. We are able to fulfill most purchase orders rapidly, and service and custom-manufacturing cycles are short. As a result, we do not record material contract assets or liabilities.
F-18
We have elected to use the practical expedient not to adjust the transaction price of a contract for the effects of a significant financing component if, at the inception of the contract, we expect that the period between when we transfer a promised good or service to a customer and when the customer pays for that good or service will be one year or less.
Some customer contracts include variable consideration, such as rebates, some of which depend upon our customers meeting specified performance criteria, such as a purchasing level over a period of time. We use judgment to estimate the value of these pricing arrangements at each reporting date and record contract assets or liabilities to the extent that estimated values are recognized at a different time than the revenue for the related products. When estimating variable consideration, we also apply judgment when considering the probability of whether a reversal of revenue could occur and only recognize revenue subject to this constraint.
The only significant costs we incur to obtain contracts are related to sales commissions. These commissions are primarily based on purchase order amounts, not recoverable and not applicable to periods greater than one year. We elected to apply the practical expedient to expense these costs as incurred as if the amortization period of the asset that would have otherwise been recognized is one year or less.
Performance obligations following the delivery of products, such as rights of return and warranties, are not material. No other types of revenue arrangements were material to our consolidated financial statements.
Classification of expenses — cost of sales
Cost of sales includes the cost of the product, depreciation of production assets, supplier rebates, shipping and receiving charges and inventory adjustments. For manufactured products, the cost of the product includes direct and indirect manufacturing costs, plant administrative expenses and the cost of raw materials consumed in the manufacturing process.
Classification of expenses — selling, general and administrative
Selling, general and administrative expenses include personnel and facility costs, amortization of intangible assets, depreciation of non-production assets, research and development costs, advertising expense, promotional charges and other charges related to our global operations. Research and development expenses were not material for the periods presented.
Employee benefit plans
Some of our employees participate in defined benefit plans that we sponsor. We present these plans as follows due to their differing geographies, characteristics and actuarial assumptions:
|
•
|
U.S. plans
— Two plans based in the United States, one of which we acquired from VWR in 2017. Another plan acquired from VWR was merged with ours in 2018. The U.S. plans are frozen with no accrual of future pension benefits for participating employees.
|
F-19
|
•
|
Non-U.S. plans
— Eight plans for our employees around the world that we acquired from VWR in 2017, most of which continue to accrue future pension benefits.
|
|
•
|
Medical plan
— A post-retirement medical plan for certain employees in the United States. The medical plan is frozen with no accrual of future pension benefits for participating employees.
|
We sponsor a number of other defined benefit plans around the world that are not material individually or in the aggregate and therefore are not included in our disclosures. Defined contribution and other employee benefit plans are also not material.
The cost of our defined benefit plans is incurred systematically over expected employee service periods. We use actuarial methods and assumptions to determine expense each period and the value of projected benefit obligations. Actuarial changes in the projected value of defined benefit obligations are deferred to AOCI and recognized in earnings systematically over future periods. The portion of cost attributable to continuing employee service is included in selling, general and administrative expenses. The rest of the cost is included in other income or expense, net.
Stock-based compensation expense
Some of our management and directors are compensated with stock-based awards. Stock-based compensation expense is included in SG&A expenses on the statement of operations.
Stock options and RSUs
We measure the expense of stock options and RSUs based on their grant-date fair values. These awards typically vest with continuing service, so expense is recognized on a straight-line basis from the date of grant through the end of the requisite service period. We recognize forfeitures of unvested awards as they occur by reversing any expense previously recorded in the period of forfeiture. We issue new shares of common stock upon exercise or vesting of awards.
The grant-date fair value of stock options is measured using the Black-Scholes pricing model using assumptions based on the terms of each stock option agreement, the expected behavior of grant recipients and peer company data. We have limited historical data about our own awards upon which to base our assumptions. Expected volatility is calculated based on the observed equity volatility for a peer group over a period of time equal to the expected life of the stock options. The risk-free interest rate is based on U.S. Treasury observed market rates continuously compounded over the duration of the expected life. The expected life of stock options is estimated as the midpoint of the weighted average vesting period and the contractual term.
The grant-date fair value of RSUs is measured as the quoted closing price of our common stock on the grant date.
F-20
Optionholder awards
Optionholder awards are rights for holders of stock options to receive cash with continuing service. Those rights are granted by our board of directors in accordance with anti-dilution provisions contained in the stock option agreements.
We account for optionholder awards as a modification of stock options. On the modification date, we estimate the value of the anti-dilution clause included in the grant-date fair value of stock options. We reclassify this amount from the grant-date fair value of the equity award to the value of the optionholder award and add any additional amount needed to arrive at the total grant-date fair value of the optionholder award, which is its cash value. That value is recognized as expense on a straight-line basis over the same remaining schedule as the underlying stock options.
Optionholder expense is classified as stock-based compensation because its value is based in part on a portion of the underlying stock option that was reclassified from equity. Optionholder award liabilities are payable in cash the quarter after each vesting date and are classified as other current liabilities.
SARs
SARs were issued to our employees by a NuSil investor. Prior to their settlement in November 2019 (see note
17
), these awards were accounted as contributed capital in a manner similar to how a parent accounts for a contribution to an equity-method investee. The contributed capital was required to be remeasured at fair value at the end of each reporting period. That contribution was included in the noncontrolling interest until it was derecognized in November 2017 in connection with a legal entity restructuring. Since then through November 2019, the contribution had been included within the common stock including paid-in capital. Changes to the fair value of the contributed capital were recognized as adjustments to stock-based compensation expense each period.
We estimated the fair value of SARs by measuring the equity value of the issuer of the SARs using ordinary valuation techniques. The applicable portion of the equity value was then allocated to the SARs based on their relative participation rights.
Award modifications
When stock-based compensation arrangements are modified, we treat the modification as an exchange of the original award for a new award and immediately recognize expense for the incremental value of the new award. The incremental value is measured as the excess of the fair value of new awards over the fair value of the original awards, each based on circumstances and assumptions as of the modification date. Fair value is measured using the same methods previously described.
F-21
Income taxes
Our worldwide income is subject to the income tax regulations of many governments. Income tax expense is calculated using an estimated global rate with recognition of deferred tax assets and liabilities for expected temporary differences between taxable and reported income. Deferred tax assets and liabilities are measured using the enacted tax rates expected to apply to taxable income when those temporary differences are expected to reverse. We record a valuation allowance to reduce deferred tax assets to the amount that is more likely than not to be realized.
Income tax regulations change from time to time. The effect of a change in tax law on deferred tax assets and liabilities is recognized as a cumulative adjustment to income tax expense or benefit in the period of enactment. The effect of a change in tax law on the income tax expense or benefit itself is recognized prospectively for the applicable tax years.
Income tax regulations can be complex, requiring us to interpret tax law and take positions. Upon audit, tax authorities may challenge our positions. We regularly assess the outcome of potential examinations and only recognize positions that are more likely than not to be sustained. Recognized income tax positions are measured at the largest amount that is more likely than not of being realized. Changes in recognition or measurement are reflected in the period in which a change in judgment occurs, as a result of information that arises or when a tax position is effectively settled. We recognize accrued interest and penalties related to unrecognized tax benefits as a component of income tax expense in our consolidated financial statements.
Business combinations
The purchase price of an acquired business is allocated to the individual assets acquired and liabilities assumed based on their fair values at the date of acquisition. Those fair values are determined using income, cost and market approaches, most of which depend upon significant inputs that are not observable in the market, or level 3 measurements. The excess of purchase price over the fair value of assets acquired and liabilities assumed is allocated to goodwill. Costs associated with business combinations are expensed as incurred.
The purchase price for some business combinations includes consideration that is contingent on the achievement of net sales or earnings targets by the acquired business. Contingent consideration is measured initially and on a recurring basis at fair value. Payments to settle the acquisition-date fair value of contingent consideration are presented as financing activities on the statement of cash flows; any payments in excess of the acquisition-date fair value are presented as operating activities.
F-22
Fair value measurements
Fair value is defined as the price that would be received to sell an asset or paid to transfer a liability in an orderly transaction between market participants at a measurement date. We classify fair value measurements based on the lowest of the following levels that is significant to the measurement:
|
•
|
Level 1
— Quoted prices in active markets for identical assets or liabilities
|
|
•
|
Level 2
— Inputs that are observable for the asset or liability, either directly or indirectly through market corroboration, for substantially the full term of the asset or liability
|
|
•
|
Level 3
— Inputs that are unobservable for the asset or liability based on our evaluation of the assumptions market participants would use in pricing the asset or liability
|
We exercise considerable judgment when estimating fair value, particularly when evaluating what assumptions market participants would likely make. The use of different assumptions or estimation methodologies could have a material effect on the estimated fair values.
Foreign currency translation
Our operations span the globe, so we are impacted by changes in foreign currency exchange rates. We determine the functional currency of our subsidiaries based upon the primary currency used to generate and expend cash, which is usually the currency of the country in which the subsidiary is located. For subsidiaries with functional currencies other than the U.S. dollar, assets and liabilities are translated into U.S. dollars using period-end exchange rates, and revenues, expenses, income and losses of our subsidiaries are translated into U.S. dollars using monthly average exchange rates. The resulting foreign currency translation gains or losses are deferred as AOCI and reclassified to earnings only upon sale or liquidation of those businesses.
Gains and losses related to the remeasurement of debt and intercompany financing into functional currencies are reported in earnings as other income or expense, net. Gains and losses associated with the remeasurement of operating assets and liabilities into functional currencies are reported within the applicable component of operating income.
Leases
We primarily enter into real estate leases for manufacturing, warehousing and commercial office space to support our global operations. We also enter into vehicle and equipment leases to support those operations.
We determine if an arrangement is a lease at inception. Short-term leases, defined as having an initial term of twelve months or less, are expensed as incurred and not recorded on the balance sheet. We record the value of all other leased property and the related obligations as assets and liabilities on the balance sheet. Information about the amount and classification of lease assets and liabilities is included in note
22
.
F-23
At inception, lease assets and liabilities are measured at the present value of future lease payments over the lease term. As most of our leases do not provide an implicit rate, we exercise judgment in selecting the incremental borrowing rate based on the information available at inception to determine the present value of future payments. Operating lease assets are further adjusted for lease incentives and initial direct costs.
Our lease terms may include options to extend or terminate the lease. We exercise judgment to calculate the term of those leases when extension or termination options are present and include such options in the calculation of the lease term when it is reasonably certain that we will exercise those options. Operating lease expense is recognized on a straight-line basis over the lease term, except for variable rent which is expensed as incurred. Short-term lease and variable rent expense was immaterial to the financial statements and has been included within operating lease expense. Finance lease expense includes depreciation, which is recognized on a straight-line basis over the expected life of the leased asset, and an immaterial amount of interest expense.
Some of our lease agreements include both lease and non-lease components. We account for those components separately for real estate leases and as a combined single lease component for all other types of leases.
|
3
.
|
New accounting standards
|
New tax standard
In December 2019, the FASB issued a new standard to simplify the accounting for income taxes by removing certain exceptions to the existing guidance and also providing for additional clarification. The standard is effective on January 1, 2021 and we are currently evaluating its impact.
New lease standard
In February 2016, the FASB issued a new standard related to leases. The most significant change for us was the recognition of new assets and liabilities for leases classified as operating leases. The standard also expanded disclosures about the amount, timing, and uncertainty of cash flows arising from leases. Our accounting for finance leases was substantially unchanged. Those new disclosures are provided in notes
2
and
22
.
We adopted the standard effective January 1, 2019 using a modified retrospective transition approach whereby the new standard was applied to all leases existing at January 1, 2019 with a cumulative effect adjustment recorded in equity representing the cumulative earnings effect of this new standard. We elected to utilize the package of practical expedients permitted under the transition guidance in the standard which allowed us to not reassess (i) whether any expired or existing contracts contain leases, (ii) historical lease classification and (iii) initial direct costs.
The most significant impacts upon adoption were: (i) a
$3.1 million
cumulative effect adjustment that increased accumulated deficit and (ii) recognition of
$155.0 million
of operating lease assets and
$162.5 million
of operating lease liabilities. Other impacts were immaterial and included
F-24
adjustments to existing finance lease assets and liabilities, recognition of deferred income tax assets and a similar amount of deferred income tax liabilities, and derecognition of prepaid rent expense assets.
New revenue recognition standard
In May 2014, the FASB issued a comprehensive new revenue recognition standard. The standard provides a new model for revenue recognition that supersedes most prior guidance and requires more disclosures about revenue, including the components of revenue that are communicated to investors. We adopted the new guidance on January 1, 2018 using a modified retrospective method applied to contracts that were not completed as of that date. On the adoption date, we: (i) recorded a
$4.8 million
cumulative effect adjustment to decrease accumulated deficit, (ii) established
$13.0 million
of contract assets, classified as other current assets, and derecognized
$6.5 million
of custom-manufactured inventory where control had passed to the customer and (iii) recognized a
$1.7 million
deferred tax liability. New disclosures required under this guidance are included in notes
2
and
6
.
New credit losses standard
In June 2016, the FASB issued a new standard that modifies the recognition of credit losses related to financial assets. Under the new standard, an entity must measure and record its total expected credit losses, rather than recording such losses when it is considered probable that they have occurred, as was required under the previous standard. The guidance is effective on January 1, 2020, and we do not expect that it will have a material impact to our financial position or results of operations.
Other
There were no other new accounting standards that we expect to have a material impact to our financial position or results of operations upon adoption.
|
4
.
|
Loss per share
|
For all periods presented, basic and diluted loss per share calculations were the same because we reported a net loss available to common stockholders. As a result, the following potentially dilutive instruments were excluded from those calculations:
|
(in millions)
|
Year ended December 31,
|
|||||||
|
2019
|
2018
|
2017
|
||||||
|
MCPS
|
62.9
|
|
—
|
|
—
|
|
||
|
Stock-based awards
|
27.2
|
|
21.1
|
|
19.6
|
|
||
|
Total
|
90.1
|
|
21.1
|
|
19.6
|
|
||
F-25
|
5
.
|
Risks and uncertainties
|
Remeasurement of foreign-denominated debt and intercompany borrowings
Our operations span the globe. To fund those operations, we have entered into significant euro-denominated indebtedness (see note
13
), and we have also established significant intercompany borrowings among our subsidiaries that are denominated in various currencies. Changes in foreign currency exchange rates, particularly the euro, have required us to record gains and losses, some of which have been significant, to remeasure the debt and the intercompany borrowings into functional currencies of the subsidiaries holding them. Those historical changes are disclosed in note
18
.
On July 11, 2019, we completed an intercompany recapitalization that is intended to mitigate substantially all of our net euro financing exposure in future periods. We still expect to record gains and losses related to intercompany borrowings denominated in other currencies. Historically, the remeasurement of borrowings denominated in currencies other than the euro has not been material
.
Impairment testing
On
October 1, 2019
, we performed quantitative annual impairment testing of goodwill for each of our reporting units. We did not record any impairment charges. Each reporting unit had a fair value that was substantially in excess of its carrying value.
Unfavorable changes to forecasted results and other assumptions used to determine fair values of reporting units or long-lived assets could present a risk of impairment in future periods. We have not recorded any material impairments during the periods presented.
Collective bargaining arrangements
As of
December 31, 2019
, less than
6%
of our employees in North America were represented by unions, and a majority of our employees in Europe are represented by workers’ councils or unions.
|
6
.
|
Segment financial information
|
We report based on three geographic segments based on customer location: Americas, Europe and AMEA. Each segment manufactures and distributes solutions for the life sciences and advanced technologies & applied materials industries. Corporate costs are managed on a standalone basis and not allocated to segments.
F-26
The following tables present information by reportable segment:
|
(in millions)
|
Net sales
Year ended December 31,
|
Management EBITDA
Year ended December 31,
|
|||||||||||||||||||||
|
2019
|
2018
|
2017
|
2019
|
2018
|
2017
|
||||||||||||||||||
|
Americas
|
$
|
3,584.8
|
|
$
|
3,460.9
|
|
$
|
688.1
|
|
$
|
726.8
|
|
$
|
651.6
|
|
$
|
196.8
|
|
|||||
|
Europe
|
2,102.0
|
|
2,095.3
|
|
381.4
|
|
364.6
|
|
349.6
|
|
103.4
|
|
|||||||||||
|
AMEA
|
353.5
|
|
308.1
|
|
177.9
|
|
85.8
|
|
73.8
|
|
43.3
|
|
|||||||||||
|
Corporate
|
—
|
|
—
|
|
—
|
|
(77.2
|
)
|
(69.0
|
)
|
(19.5
|
)
|
|||||||||||
|
Total
|
$
|
6,040.3
|
|
$
|
5,864.3
|
|
$
|
1,247.4
|
|
$
|
1,100.0
|
|
$
|
1,006.0
|
|
$
|
324.0
|
|
|||||
|
(in millions)
|
Capital expenditures
Year ended December 31,
|
Depreciation and amortization
Year ended December 31,
|
|||||||||||||||||||||
|
2019
|
2018
|
2017
|
2019
|
2018
|
2017
|
||||||||||||||||||
|
Americas
|
$
|
32.8
|
|
$
|
20.4
|
|
$
|
16.5
|
|
$
|
249.7
|
|
$
|
252.2
|
|
$
|
75.4
|
|
|||||
|
Europe
|
12.7
|
|
14.0
|
|
6.3
|
|
141.0
|
|
145.7
|
|
19.8
|
|
|||||||||||
|
AMEA
|
6.1
|
|
3.3
|
|
2.4
|
|
8.2
|
|
6.7
|
|
4.0
|
|
|||||||||||
|
Total
|
$
|
51.6
|
|
$
|
37.7
|
|
$
|
25.2
|
|
$
|
398.9
|
|
$
|
404.6
|
|
$
|
99.2
|
|
|||||
The amounts above exclude inter-segment activity because it is not material. All of the net sales for each segment are from external customers.
F-27
The following table presents the reconciliation of Management EBITDA from net income or loss:
|
(in millions)
|
Year ended December 31,
|
||||||||||
|
2019
|
2018
|
2017
|
|||||||||
|
Net income (loss)
|
$
|
37.8
|
|
$
|
(86.9
|
)
|
$
|
(145.3
|
)
|
||
|
Interest expense
|
440.0
|
|
523.8
|
|
200.9
|
|
|||||
|
Income tax expense (benefit)
|
2.8
|
|
(26.9
|
)
|
(314.9
|
)
|
|||||
|
Depreciation and amortization
|
398.9
|
|
404.6
|
|
99.2
|
|
|||||
|
Net foreign currency loss from financing activities
|
1.9
|
|
6.5
|
|
5.5
|
|
|||||
|
Gain on derivative instruments
|
—
|
|
—
|
|
(9.6
|
)
|
|||||
|
Stock-based compensation expense
|
67.9
|
|
18.4
|
|
48.2
|
|
|||||
|
Restructuring and severance charges
|
24.3
|
|
81.2
|
|
29.6
|
|
|||||
|
Purchase accounting adjustments
|
(10.7
|
)
|
(1.0
|
)
|
41.8
|
|
|||||
|
Loss on extinguishment of debt
|
73.7
|
|
—
|
|
56.4
|
|
|||||
|
Fees to New Mountain Capital
|
—
|
|
1.0
|
|
193.5
|
|
|||||
|
VWR integration and planning expenses
|
22.5
|
|
36.2
|
|
73.7
|
|
|||||
|
Write-offs of working capital and other assets
|
29.2
|
|
22.1
|
|
—
|
|
|||||
|
Long-term incentive plan
|
4.3
|
|
9.6
|
|
3.2
|
|
|||||
|
Other
|
7.4
|
|
17.4
|
|
41.8
|
|
|||||
|
Management EBITDA
|
$
|
1,100.0
|
|
$
|
1,006.0
|
|
$
|
324.0
|
|
||
The following table presents net sales by product line:
|
(in millions)
|
Year ended December 31,
|
||||||
|
2019
|
2018
|
||||||
|
Proprietary materials & consumables
|
$
|
2,008.5
|
|
$
|
1,933.9
|
|
|
|
Third party materials & consumables
|
2,395.6
|
|
2,364.9
|
|
|||
|
Services & specialty procurement
|
735.6
|
|
663.5
|
|
|||
|
Equipment & instrumentation
|
900.6
|
|
902.0
|
|
|||
|
Total
|
$
|
6,040.3
|
|
$
|
5,864.3
|
|
|
F-28
The following table presents information by geographic area:
|
(in millions)
|
Net sales
Year ended December 31,
|
Property, plant and equipment, net
December 31,
|
|||||||||||||||||
|
2019
|
2018
|
2017
|
2019
|
2018
|
|||||||||||||||
|
United States
|
$
|
3,330.9
|
|
$
|
3,126.5
|
|
$
|
631.8
|
|
$
|
373.4
|
|
$
|
398.5
|
|
||||
|
Germany
|
464.4
|
|
507.6
|
|
78.8
|
|
19.4
|
|
19.8
|
|
|||||||||
|
Other countries in Europe
|
1,637.6
|
|
1,587.7
|
|
299.4
|
|
113.1
|
|
124.0
|
|
|||||||||
|
All other countries
|
607.4
|
|
642.5
|
|
237.4
|
|
51.1
|
|
56.3
|
|
|||||||||
|
Total
|
$
|
6,040.3
|
|
$
|
5,864.3
|
|
$
|
1,247.4
|
|
$
|
557.0
|
|
$
|
598.6
|
|
||||
|
7
.
|
Supplemental disclosures of cash flow information
|
The following tables present supplemental disclosures of cash flow information:
|
(in millions)
|
December 31,
|
||||||
|
2019
|
2018
|
||||||
|
Cash and cash equivalents
|
$
|
186.7
|
|
$
|
184.7
|
|
|
|
Restricted cash classified as other assets
|
2.6
|
|
3.0
|
|
|||
|
Total
|
$
|
189.3
|
|
$
|
187.7
|
|
|
|
(in millions)
|
Year ended December 31,
|
||||||||||
|
2019
|
2018
|
2017
|
|||||||||
|
Cash flows from operating activities:
|
|||||||||||
|
Cash paid for income taxes, net
|
$
|
112.3
|
|
$
|
65.6
|
|
$
|
31.5
|
|
||
|
Cash paid for interest
|
410.4
|
|
481.3
|
|
137.2
|
|
|||||
|
Cash paid under operating leases
|
44.1
|
|
*
|
|
*
|
|
|||||
|
Cash paid under finance leases
|
4.9
|
|
*
|
|
*
|
|
|||||
|
Cash flows from financing activities:
|
|||||||||||
|
Cash paid under finance leases
|
5.5
|
|
*
|
|
*
|
|
|||||
|
*
|
Disclosures have been provided prospectively since January 1, 2019 in accordance with the new lease standard disclosed in note
3
.
|
F-29
The following table presents the classification on the statements of cash flows of contingent consideration payments:
|
(in millions)
|
Year ended December 31,
|
||||||||||
|
2019
|
2018
|
2017
|
|||||||||
|
Operating activities, other reconciling adjustments
|
$
|
—
|
|
$
|
1.9
|
|
$
|
1.0
|
|
||
|
Financing activities
|
4.6
|
|
20.5
|
|
22.7
|
|
|||||
|
Total
|
$
|
4.6
|
|
$
|
22.4
|
|
$
|
23.7
|
|
||
|
8
.
|
Inventory
|
The following table presents components of inventory:
|
(dollars in millions)
|
December 31,
|
||||||
|
2019
|
2018
|
||||||
|
Merchandise inventory
|
$
|
445.2
|
|
$
|
409.0
|
|
|
|
Finished goods
|
104.4
|
|
122.9
|
|
|||
|
Raw materials
|
125.1
|
|
105.2
|
|
|||
|
Work in process
|
36.5
|
|
34.0
|
|
|||
|
Total
|
$
|
711.2
|
|
$
|
671.1
|
|
|
|
Inventory under the LIFO method:
|
|||||||
|
Percentage of total inventory
|
31
|
%
|
32
|
%
|
|||
|
Excess of current cost over carrying value
|
$
|
4.3
|
|
$
|
2.4
|
|
|
|
9
.
|
Property, plant and equipment
|
The following table presents the components of property, plant and equipment:
|
(in millions)
|
December 31,
|
||||||
|
2019
|
2018
|
||||||
|
Buildings and related improvements
|
$
|
340.4
|
|
$
|
329.1
|
|
|
|
Machinery, equipment and other
|
344.3
|
|
341.0
|
|
|||
|
Software
|
92.1
|
|
77.1
|
|
|||
|
Land
|
45.8
|
|
47.2
|
|
|||
|
Assets not yet placed into service
|
42.2
|
|
30.0
|
|
|||
|
Property, plant and equipment, gross
|
864.8
|
|
824.4
|
|
|||
|
Accumulated depreciation
|
(307.8
|
)
|
(225.8
|
)
|
|||
|
Property, plant and equipment, net
|
$
|
557.0
|
|
$
|
598.6
|
|
|
Depreciation was
$86.6 million
in
2019
,
$83.3 million
in
2018
and
$34.0 million
in
2017
.
F-30
|
10
.
|
Goodwill and other intangible assets
|
The following tables present changes in goodwill by segment:
|
(in millions)
|
Year ended December 31, 2019
|
||||||||||||||
|
Americas
|
Europe
|
AMEA
|
Total
|
||||||||||||
|
Beginning balance, net
|
$
|
1,604.7
|
|
$
|
1,150.0
|
|
$
|
30.0
|
|
$
|
2,784.7
|
|
|||
|
Currency translation
|
5.8
|
|
(17.7
|
)
|
(0.3
|
)
|
(12.2
|
)
|
|||||||
|
Other
|
(0.9
|
)
|
(2.2
|
)
|
—
|
|
(3.1
|
)
|
|||||||
|
Ending balance, net
|
1,609.6
|
|
1,130.1
|
|
29.7
|
|
2,769.4
|
|
|||||||
|
Accumulated impairment losses
|
21.0
|
|
6.7
|
|
11.1
|
|
38.8
|
|
|||||||
|
Ending balance, gross
|
$
|
1,630.6
|
|
$
|
1,136.8
|
|
$
|
40.8
|
|
$
|
2,808.2
|
|
|||
|
(in millions)
|
Year ended December 31, 2018
|
||||||||||||||||||
|
Not allocated
|
Americas
|
Europe
|
AMEA
|
Total
|
|||||||||||||||
|
Beginning balance, net
|
$
|
2,847.3
|
|
$
|
—
|
|
$
|
—
|
|
$
|
—
|
|
$
|
2,847.3
|
|
||||
|
Reporting unit allocation
|
(2,803.0
|
)
|
1,609.4
|
|
1,164.0
|
|
29.6
|
|
—
|
|
|||||||||
|
Currency translation
|
(41.9
|
)
|
(5.7
|
)
|
(14.0
|
)
|
0.4
|
|
(61.2
|
)
|
|||||||||
|
Other
|
(2.4
|
)
|
1.0
|
|
—
|
|
—
|
|
(1.4
|
)
|
|||||||||
|
Ending balance, net
|
—
|
|
1,604.7
|
|
1,150.0
|
|
30.0
|
|
2,784.7
|
|
|||||||||
|
Accumulated impairment losses
|
—
|
|
21.0
|
|
6.7
|
|
11.1
|
|
38.8
|
|
|||||||||
|
Ending balance, gross
|
$
|
—
|
|
$
|
1,625.7
|
|
$
|
1,156.7
|
|
$
|
41.1
|
|
$
|
2,823.5
|
|
||||
On October 1, 2018, we established new reporting units aligned to our geographic segments: Americas, Europe and AMEA. The reporting unit allocation shown in the table above illustrates how goodwill was initially allocated to the geographic reporting units on a relative fair value basis.
On October 1, 2019, we determined that the Americas reporting unit should be divided into Americas sciences and Americas silicones. This change in the reporting units did not affect the allocation of goodwill to the Americas segment.
F-31
The following table presents the components of other intangible assets:
|
(in millions)
|
December 31, 2019
|
December 31, 2018
|
|||||||||||||||||||||
|
Gross value
|
Accumulated amortization
|
Carrying value
|
Gross value
|
Accumulated amortization
|
Carrying value
|
||||||||||||||||||
|
Customer relationships
|
$
|
4,547.7
|
|
$
|
641.3
|
|
$
|
3,906.4
|
|
$
|
4,572.3
|
|
$
|
412.5
|
|
$
|
4,159.8
|
|
|||||
|
VWR trade name
|
264.3
|
|
123.3
|
|
141.0
|
|
266.3
|
|
65.4
|
|
200.9
|
|
|||||||||||
|
Other
|
182.8
|
|
102.3
|
|
80.5
|
|
194.0
|
|
81.3
|
|
112.7
|
|
|||||||||||
|
Total finite-lived
|
$
|
4,994.8
|
|
$
|
866.9
|
|
4,127.9
|
|
$
|
5,032.6
|
|
$
|
559.2
|
|
4,473.4
|
|
|||||||
|
Indefinite-lived
|
92.3
|
|
92.3
|
|
|||||||||||||||||||
|
Total
|
$
|
4,220.2
|
|
$
|
4,565.7
|
|
|||||||||||||||||
Amortization was
$312.3 million
in
2019
,
$321.3 million
in
2018
and
$65.2 million
in
2017
.
The following table presents estimated future amortization:
|
(in millions)
|
December 31, 2019
|
||
|
2020
|
$
|
306.4
|
|
|
2021
|
259.4
|
|
|
|
2022
|
256.0
|
|
|
|
2023
|
243.8
|
|
|
|
2024
|
243.8
|
|
|
|
Thereafter
|
2,818.5
|
|
|
|
Total
|
$
|
4,127.9
|
|
|
11
.
|
Restructuring and severance
|
The following table presents restructuring and severance charges by plan:
|
(in millions)
|
Year ended December 31,
|
||||||||||
|
2019
|
2018
|
2017
|
|||||||||
|
2017 restructuring program
|
$
|
23.0
|
|
$
|
78.3
|
|
$
|
17.5
|
|
||
|
Other
|
1.3
|
|
2.9
|
|
12.1
|
|
|||||
|
Total
|
$
|
24.3
|
|
$
|
81.2
|
|
$
|
29.6
|
|
||
2017 restructuring program
The 2017 restructuring program is a three-year,
$215 million
program designed to optimize our sales, gross margins and operating costs. The spending currently includes an estimated
$55 million
for capital expenditures and an estimated
$135 million
for employee severance and related costs, facility closures and other charges. The program includes combining sales and marketing resources, eliminating redundant corporate functions, optimizing procurement and our
F-32
manufacturing footprint, and implementing best practices throughout the organization. We expect all synergies and cost savings to be fully realized by 2021.
The following table presents information about charges under the 2017 restructuring program:
|
(in millions)
|
Year ended December 31,
|
December 31, 2019
|
|||||||||||||||||||||
|
Charges incurred to date
|
Expected remaining charges
|
Total expected charges
|
|||||||||||||||||||||
|
2019
|
2018
|
2017
|
|||||||||||||||||||||
|
Employee severance and related
|
$
|
11.7
|
|
$
|
48.7
|
|
$
|
17.5
|
|
$
|
77.9
|
|
$
|
12.1
|
|
$
|
90.0
|
|
|||||
|
Facility closure
|
0.9
|
|
1.2
|
|
—
|
|
2.1
|
|
2.9
|
|
5.0
|
|
|||||||||||
|
Other
|
10.4
|
|
28.4
|
|
—
|
|
38.8
|
|
1.2
|
|
40.0
|
|
|||||||||||
|
Total
|
$
|
23.0
|
|
$
|
78.3
|
|
$
|
17.5
|
|
$
|
118.8
|
|
$
|
16.2
|
|
$
|
135.0
|
|
|||||
|
Americas
|
$
|
12.1
|
|
$
|
37.4
|
|
$
|
3.2
|
|
$
|
52.7
|
|
$
|
8.3
|
|
$
|
61.0
|
|
|||||
|
Europe
|
9.8
|
|
39.1
|
|
1.5
|
|
50.4
|
|
1.6
|
|
52.0
|
|
|||||||||||
|
AMEA
|
—
|
|
0.8
|
|
—
|
|
0.8
|
|
0.2
|
|
1.0
|
|
|||||||||||
|
Corporate
|
1.1
|
|
1.0
|
|
12.8
|
|
14.9
|
|
6.1
|
|
21.0
|
|
|||||||||||
|
Total
|
$
|
23.0
|
|
$
|
78.3
|
|
$
|
17.5
|
|
$
|
118.8
|
|
$
|
16.2
|
|
$
|
135.0
|
|
|||||
Other charges in the table above were to write-down the carrying value of assets we plan to close or sell under the program, the largest of which were charges of
$10.0 million
in 2019 to write-down finite-lived intangible assets related to a discontinued product line and
$20.2 million
in 2018 to record on-hand stock of a discontinued product at net realizable value. Other charges in 2018 also include expense related to a voluntary early retirement program under one of our pension plans in the United States. These charges do not impact the accrued restructuring charges shown in the following table.
The following table presents changes to accrued employee severance and related charges under the 2017 restructuring program, which are primarily classified as employee-related current liabilities:
|
(in millions)
|
Year ended December 31,
|
||||||||||
|
2019
|
2018
|
2017
|
|||||||||
|
Beginning balance
|
$
|
33.6
|
|
$
|
15.0
|
|
$
|
—
|
|
||
|
Charges
|
11.7
|
|
48.7
|
|
17.5
|
|
|||||
|
Cash payments
|
(29.1
|
)
|
(29.2
|
)
|
(2.5
|
)
|
|||||
|
Currency translation
|
(0.4
|
)
|
(0.9
|
)
|
—
|
|
|||||
|
Ending balance
|
$
|
15.8
|
|
$
|
33.6
|
|
$
|
15.0
|
|
||
F-33
|
12
.
|
Commitments and contingencies
|
Our business involves commitments and contingencies related to compliance with environmental laws and regulations, the manufacture and sale of products and litigation. The ultimate resolution of contingencies is subject to significant uncertainty, and it is reasonably possible that contingencies could be decided unfavorably for us.
Environmental laws and regulations
Our environmental liabilities are subject to changing governmental policy and regulations, discovery of unknown conditions, judicial proceedings, method and extent of remediation, existence of other potentially responsible parties and future changes in technology. We believe that known and unknown environmental matters, if not resolved favorably, could have a material effect on our financial position, liquidity and profitability.
Mallinckrodt indemnification
In 2010, New Mountain Capital acquired us from Covidien plc in accordance with a stock purchase agreement dated May 25, 2010. At that time, we were organized as Mallinckrodt Baker, Inc. or MBI. Pursuant to the terms of that agreement, we are entitled to various levels of indemnification with respect to environmental liabilities involving the former MBI operations. In 2013, in connection with the Covidien plc divestiture of Mallinckrodt Group S.a.r.l and Mallinckrodt LLC, together “Mallinckrodt,” and by a second amendment to the stock purchase agreement dated June 6, 2013, but effective upon the consummation of the divestiture, Covidien plc assigned its obligations as described herein to Mallinckrodt, and Mallinckrodt assumed those obligations from Covidien plc. As a result of the stock purchase agreement and assignment, Mallinckrodt is contractually obligated to indemnify and defend us for all off-site environmental liabilities (for example, Superfund or CERCLA liabilities) arising from the pre-closing disposal of chemicals or wastes by former MBI operations.
In connection with environmental liabilities arising from pre-closing noncompliance with environmental laws, Mallinckrodt is contractually obligated to reimburse us for a percentage of the total liability, with such reimbursements made through disbursements from a
$30.0 million
environmental escrow established at the time of the closing. Specifically, Mallinckrodt will be responsible for reimbursement of
80%
of the total costs up to
$40.0 million
of such environmental liabilities. Mallinckrodt will then be responsible for reimbursement of
50%
of the next
$40.0 million
of such environmental liabilities. If such environmental liabilities exceed $80.0 million in the aggregate, Mallinckrodt will be responsible for reimbursement of
100%
of such liabilities up to the next
$30.0 million
in the aggregate. Currently, reimbursements are 80% of the amounts spent by us, with reimbursements and settlements to date exceeding
$12.0 million
. In addition, in connection with operation and maintenance activities required pursuant to administrative consent orders and subsequently issued remedial action permits involving our Phillipsburg, New Jersey, facility, amounts in excess of a small annual threshold are also subject to reimbursement, currently at the
80%
level.
F-34
Other noteworthy matters
The New Jersey Department of Environmental Protection has ordered us to remediate groundwater conditions near our plant in Phillipsburg, New Jersey. This matter is covered by the indemnification arrangement previously described. At
December 31, 2019
, our accrued obligation under this order is
$3.7 million
, which is calculated based on expected cash payments discounted at rates ranging from
1.5%
in 2019 to
2.4%
in 2045. The undiscounted amount of that obligation is
$4.7 million
.
In 2016, we assessed the environmental condition of our chemical manufacturing site in Gliwice, Poland. Our assessment revealed specific types of soil and groundwater contamination throughout the site. We are also monitoring the condition of a closed landfill on that site. These matters are not covered by our indemnification arrangement because they relate to an operation we subsequently acquired. At
December 31, 2019
, our balance sheet includes a liability of
$3.6 million
for remediation and monitoring costs. That liability is estimated primarily on expected remediation payments discounted through 2020 and is not materially different than its undiscounted amount.
Manufacture and sale of products
Our business involves risk of product liability, patent infringement and other claims in the ordinary course of business arising from the products that we produce ourselves or obtain from our suppliers, as well as from the services we provide. Our exposure to such claims may increase to the extent that we expand our manufacturing operations or service offerings.
We maintain insurance policies to protect us against these risks, including product liability insurance. In many cases the suppliers of products we distribute have indemnified us against such claims. Our insurance coverage or indemnification agreements with suppliers may not be adequate in all pending or any future cases brought against us. Furthermore, our ability to recover under any insurance or indemnification arrangements is subject to the financial viability of our insurers, our suppliers and our suppliers’ insurers, as well as legal enforcement under the local laws governing the arrangements.
We have entered into indemnification agreements with customers of our self-manufactured products to protect them from liabilities and losses arising from our negligence, willful misconduct or sale of defective products. To date, we have not incurred material costs to defend lawsuits or settle claims related to these indemnification provisions.
Litigation
At
December 31, 2019
, there was no outstanding litigation that we believe would result in material losses if decided against us, and we do not believe that there are any unasserted matters that are reasonably possible to result in a material loss.
F-35
|
13
.
|
Debt
|
In January 2020, we amended our senior secured credit facilities. The amendment reduced the annual interest rate margins on our term loans by
0.75%
. The cost to complete the amendment was not material.
The following table presents information about our debt:
|
(dollars in millions)
|
December 31, 2019
|
December 31, 2018
|
||||||||||
|
Interest terms
|
Rate
|
Amount
|
||||||||||
|
Receivables facility
|
LIBOR plus 1.50%
|
3.26
|
%
|
$
|
55.5
|
|
$
|
104.0
|
|
|||
|
Senior secured credit facilities:
|
||||||||||||
|
Euro term loans
|
EURIBOR plus 3.25%
|
3.25
|
%
|
391.8
|
|
1,078.0
|
|
|||||
|
U.S. dollar term loans
|
LIBOR plus 3.00%
|
4.70
|
%
|
677.2
|
|
1,838.9
|
|
|||||
|
4.75% secured notes
|
fixed rate
|
4.75
|
%
|
561.2
|
|
572.5
|
|
|||||
|
6% secured notes
|
fixed rate
|
6.00
|
%
|
1,500.0
|
|
1,500.0
|
|
|||||
|
9% unsecured notes
|
fixed rate
|
9.00
|
%
|
2,000.0
|
|
2,000.0
|
|
|||||
|
Finance lease liabilities
|
59.2
|
|
66.3
|
|
||||||||
|
Other
|
4.5
|
|
3.2
|
|
||||||||
|
Total debt, gross
|
5,249.4
|
|
7,162.9
|
|
||||||||
|
Less: unamortized deferred financing costs
|
(132.9
|
)
|
(238.2
|
)
|
||||||||
|
Total debt
|
$
|
5,116.5
|
|
$
|
6,924.7
|
|
||||||
|
Classification on balance sheets:
|
||||||||||||
|
Current portion of debt
|
$
|
93.5
|
|
$
|
142.4
|
|
||||||
|
Debt, net of current portion
|
5,023.0
|
|
6,782.3
|
|
||||||||
The following table presents mandatory future repayments of debt principal:
|
(in millions)
|
December 31, 2019
|
||
|
2020
|
$
|
93.5
|
|
|
2021
|
32.8
|
|
|
|
2022
|
32.1
|
|
|
|
2023
|
31.7
|
|
|
|
2024
|
3,008.5
|
|
|
|
Thereafter
|
2,050.8
|
|
|
|
Total debt, gross
|
$
|
5,249.4
|
|
F-36
Credit facilities
The following table presents availability under our credit facilities:
|
(in millions)
|
December 31, 2019
|
||||||||||
|
Receivables facility
|
Revolving credit facility
|
Total
|
|||||||||
|
Current availability
|
$
|
250.0
|
|
$
|
250.0
|
|
$
|
500.0
|
|
||
|
Undrawn letters of credit outstanding
|
(12.5
|
)
|
(15.3
|
)
|
(27.8
|
)
|
|||||
|
Outstanding borrowings
|
(55.5
|
)
|
—
|
|
(55.5
|
)
|
|||||
|
Unused availability
|
$
|
182.0
|
|
$
|
234.7
|
|
$
|
416.7
|
|
||
Current availability under the receivables facility depends upon maintaining a sufficient borrowing base of eligible accounts receivable. At
December 31, 2019
,
$416.6 million
of accounts receivable were available as collateral under the facility.
Receivables facility
The receivables facility is with a commercial bank, functions like a line of credit and matures on November 21, 2020. Borrowings are secured by accounts receivable which are sold by certain of our domestic subsidiaries to a special-purpose consolidated subsidiary. As a result, those receivables are not available to satisfy the claims of other creditors. We bear the risk of collection on those receivables and account for the receivables facility as a secured borrowing.
The receivables facility includes representations and covenants that we consider usual and customary, including a financial covenant. That covenant becomes applicable for periods in which we have drawn more than
35%
of our revolving credit facility under the senior secured credit facilities. When applicable, we may not have total borrowings in excess of a pro forma net leverage ratio, as defined. This covenant was not applicable at
December 31, 2019
.
Senior secured credit facilities
The senior secured credit facilities consist of a
$250.0 million
revolving credit facility that expires on
November 21, 2022
, a
€1,000.0 million
euro term loan facility that matures on
November 21, 2024
and a
$1,953.1 million
U.S. dollar term loan facility that matures on
November 21, 2024
. The revolving credit facility allows us to issue letters of credit and also to issue short term notes. Borrowings under the facilities are guaranteed by substantially all of our domestic subsidiaries and secured by substantially all of their assets except for the accounts receivable that secure the receivables facility.
The senior secured credit facilities bear interest at variable rates. The margin on the revolving credit facility declines if certain net leverage ratios are achieved. Various other immaterial fees are payable under the facilities.
We began repaying the term loans on March 31, 2018 in required quarterly installments of
€1.0 million
for the euro portion and
$2.0 million
for the U.S dollar portion, with the balance due on
F-37
the maturity date. We are required to make additional prepayments if: (i) we generate excess cash flows, as defined, at specified percentages that decline if certain net leverage ratios are achieved; or (ii) we receive cash proceeds from certain types of asset sales or debt issuances. No additional required prepayments have become due since the inception of the credit facilities. We may also prepay the term loans at our option. In 2019 and 2018, we made optional prepayments of
$657.1 million
and
$54.9 million
, respectively, of euro term loans and
$1,150.7 million
and
$94.8 million
, respectively, of U.S. dollar term loans. In connection with the 2019 optional prepayments, we incurred a loss on extinguishment of debt of
$73.7 million
primarily caused by the proportional write-off of unamortized deferred financing costs related to the term loans.
The senior secured credit facilities contain certain other customary covenants, including a financial covenant. That covenant becomes applicable in periods when we have drawn more than
35%
of our revolving credit facility. When applicable, we may not have total borrowings in excess of a pro forma net leverage ratio, as defined. This covenant was not applicable at
December 31, 2019
.
Since inception of the senior secured credit facilities, we have been able to reduce our interest rate margins twice due to improvements in our credit profile. The costs to complete those amendments were not material.
Prior credit facilities
In 2017, we were party to various credit facilities which had been amended or refinanced at various times to fund mergers, acquisitions, distributions and costs associated with those activities. As a result of those amendments and refinancings, we paid fees of
$318.6 million
,
$273.5 million
of which was deferred and is being recognized as interest expense through the maturity dates of our debt. We also incurred a loss on extinguishment of debt of
$56.4 million
in 2017. Those fees exclude transaction fees paid to New Mountain Capital (see note
23
).
Secured and unsecured notes
We have issued
€500.0 million
of secured notes at 4.75% due
October 1, 2024
,
$1,500.0 million
of secured notes at 6% due
October 1, 2024
and
$2,000.0 million
of unsecured notes at 9% that are due
October 1, 2025
. Interest on the notes is payable semi-annually in arrears on April 1 and October 1. The secured notes are guaranteed and secured in the same way as the senior secured credit facilities. Each note features optional redemption at varying prices based on form and timing.
The indentures governing the notes include representations and covenants that we consider usual and customary.
F-38
|
14
.
|
Equity
|
Our equity capitalization has changed significantly during the past three years. The following timeline illustrates the key events that resulted in those changes:
|
Avantor Funding, Inc.
|
Avantor, Inc.
prior to the IPO
|
Avantor, Inc.
following the IPO
|
|||||
|
November 21, 2017
|
May 17, 2019
|
||||||
|
Legal restructuring and VWR acquisition
|
IPO and related events
|
||||||
Avantor, Inc. following the IPO
The following table presents the equity capitalization of Avantor, Inc. following the IPO:
|
(shares in millions)
|
Par value per share
|
Shares authorized
|
||||
|
Undesignated preferred stock
|
$
|
0.01
|
|
50.0
|
|
|
|
MCPS
|
0.01
|
|
25.0
|
|
||
|
Common stock
|
0.01
|
|
750.0
|
|
||
MCPS
MCPS accrues cumulative dividends at a rate of
6.250%
per annum on the liquidation preference of
$50
per share. Accrued cumulative dividends in arrears as of
December 31, 2019
was
$8.0 million
, and we paid a dividend of
$31.3 million
during the year ended
December 31, 2019
. Each share of MCPS converts into between
3.0395
and
3.5714
shares of common stock, depending upon the average trading price of our common stock leading up to the conversion date and subject to customary anti-dilution adjustments. The MCPS converts:
|
•
|
Automatically on May 15, 2022;
|
|
•
|
Following the occurrence of a change of control or certain other defined events, in which case holders are also entitled to receive a make-whole dividend equal to the present value of all remaining dividends that would have accumulated through May 15, 2022; and
|
|
•
|
At any time at the option of the holder at the minimum conversion rate of
3.0395
.
|
The holders have the right to appoint two additional members to the board of directors if dividends on the MCPS have not been declared or paid for the equivalent of six or more dividend periods. The holders do not have any other voting rights.
F-39
In the event of any bankruptcy, liquidation, dissolution or winding up of the Company, the holders are entitled to a liquidation preference of
$50
in cash per share before any payment or distribution is made to holders of common stock.
Common stock
Each share of common stock entitles the holder to one vote for applicable matters. Holders are entitled to receive dividends declared by the board of directors and a pro rata share of assets available for distribution after satisfaction of the rights of the preferred stockholders.
Initial public offering and related events
In 2019, we completed an IPO of our common stock and MCPS. We sold
238.1 million
shares of common stock at a price per share of
$14
, resulting in net proceeds of
$3,231.9 million
after deducting underwriting discounts, commissions and other offering costs of
$100.8 million
. We also sold
20.7 million
shares of MCPS at a price per share of
$50
, resulting in net proceeds of
$1,003.7 million
after deducting underwriting discounts, commissions and other offering costs of
$31.3 million
.
In connection with the closing of our IPO, we filed an amended and restated certificate of incorporation to effect a
five
-for-one split of our common stock and authorize the classes of stock noted above. All shares of common stock, stock-based instruments and per share data included in these financial statements give effect to the stock split.
Redemption of series A preferred stock
In connection with the IPO, we redeemed all outstanding series A preferred stock at an aggregate redemption price of
$2,630.9 million
. The series A preferred stock redemption price was equal to the sum of their
$2,410.5 million
liquidation preference on such shares of series A preferred stock and a make-whole premium of
$220.4 million
.
In connection with the redemption, we eliminated the authorized shares designated as series A preferred stock, making those shares available for other preferred stock designations.
Conversion of junior convertible preferred stock
As a result of the completion of our IPO, all outstanding shares of junior convertible preferred stock automatically converted into
194.5 million
shares of common stock. The number of shares of common stock received upon conversion of the junior convertible preferred stock was based on the
$2,722.5 million
million liquidation preference of such stock divided by the IPO price per share of common stock.
In connection with the conversion, we eliminated the authorized shares designated as junior convertible preferred stock, making those shares available for other preferred stock designations.
F-40
Avantor, Inc. prior to the IPO
The following table presents the equity capitalization of Avantor, Inc. prior to the IPO:
|
(shares in millions)
|
Par value per share
|
Shares authorized
|
||||
|
Series A preferred stock
|
$
|
0.01
|
|
25.0
|
|
|
|
Junior convertible preferred stock
|
0.01
|
|
5.0
|
|
||
|
Undesignated preferred stock
|
0.01
|
|
10.0
|
|
||
|
Common stock
|
0.002
|
|
2,675.0
|
|
||
|
Class B stock
|
0.01
|
|
0.3
|
|
||
Series A preferred stock
In 2017, we issued
2.0 million
shares of series A preferred stock and detachable warrants to purchase
7.0 million
shares of common stock for cash proceeds of
$2,000.0 million
. Those proceeds were reduced for issuance costs of
$183.6 million
, resulting in net proceeds of
$1,816.4 million
. The net proceeds were then allocated to the series A preferred stock and the warrants based on their relative fair value. As a result,
$1,725.6 million
was allocated to the series A preferred stock, and
$90.8 million
was allocated to the warrants and recorded as an addition to common stock including paid-in capital.
The series A preferred stock was redeemable upon the occurrence of an event that was not within our control and therefore presented as redeemable equity. Holders of the series A preferred stock were also entitled to receive quarterly cumulative dividends payable in additional shares of series A preferred stock at a rate of
12.5%
.
F-41
The following table presents the changes in the series A preferred stock:
|
(in millions)
|
Year ended December 31, 2019
|
Year ended
December 31, 2018
|
Year ended
December 31, 2017
|
||||||||||||||||||
|
Shares
|
Amount
|
Shares
|
Amount
|
Shares
|
Amount
|
||||||||||||||||
|
Beginning balance
|
2.3
|
|
$
|
2,297.3
|
|
2.0
|
|
$
|
2,027.8
|
|
$
|
—
|
|
$
|
—
|
|
|||||
|
Issuances, net of issuance costs and warrant value
|
—
|
|
—
|
|
—
|
|
—
|
|
2.0
|
|
1,725.6
|
|
|||||||||
|
Adjustment to redemption value
|
0.2
|
|
220.4
|
|
—
|
|
—
|
|
—
|
|
274.4
|
|
|||||||||
|
Accumulation of yield
|
0.1
|
|
113.2
|
|
0.3
|
|
269.5
|
|
—
|
|
27.8
|
|
|||||||||
|
Redemption
|
(2.6
|
)
|
(2,630.9
|
)
|
—
|
|
—
|
|
—
|
|
—
|
|
|||||||||
|
Ending balance
|
—
|
|
$
|
—
|
|
2.3
|
|
$
|
2,297.3
|
|
2.0
|
|
$
|
2,027.8
|
|
||||||
Junior convertible preferred stock
In 2017, we issued
1.3 million
shares of junior convertible preferred stock for cash proceeds of
$1,320.6 million
. The proceeds were reduced for issuance costs of
$88.0 million
resulting in net proceeds of
$1,232.6 million
. We issued an additional
0.4 million
shares in exchange for legacy equity interests in connection with the November 2017 legal entity restructuring discussed below.
The junior convertible preferred stock was convertible with no limit on the possible number of shares to be issued, so settlement in shares could not be assured. Accordingly, we presented the junior convertible preferred stock as redeemable equity. It was not subsequently remeasured at redemption value because redemption was not deemed probable. Holders were entitled to participate in dividends and distributions as declared by the board of directors on an if-converted basis with the holders of the warrants and common stock.
In connection with our IPO, each share converted into shares of common stock as described above.
F-42
The following table presents the changes in junior convertible preferred stock:
|
(in millions)
|
Year ended December 31, 2019
|
Year ended
December 31, 2018
|
Year ended
December 31, 2017
|
|||||||||||||||||
|
Shares
|
Amount
|
Shares
|
Amount
|
Shares
|
Amount
|
|||||||||||||||
|
Beginning balance
|
1.7
|
|
$
|
1,562.0
|
|
1.7
|
|
$
|
1,562.0
|
|
—
|
|
$
|
—
|
|
|||||
|
Issuance, net of issuance costs
|
—
|
|
—
|
|
—
|
|
—
|
|
1.3
|
|
1,232.6
|
|
||||||||
|
Effects of legal entity restructuring
|
—
|
|
—
|
|
—
|
|
—
|
|
0.4
|
|
329.4
|
|
||||||||
|
Conversion
|
(1.7
|
)
|
(1,562.0
|
)
|
—
|
|
—
|
|
—
|
|
—
|
|
||||||||
|
Ending balance
|
—
|
|
$
|
—
|
|
1.7
|
|
$
|
1,562.0
|
|
1.7
|
|
$
|
1,562.0
|
|
|||||
Warrants
As noted above, in 2017 we issued
7.0 million
detachable warrants with the series A preferred stock. Holders of warrants were entitled to participate in dividends and distributions as declared by the board of directors on an if-converted basis with the holders of outstanding shares of junior convertible preferred stock and common stock. Each warrant was exercisable for a share of common stock at a price of
$0.002
per share. During 2019, all outstanding warrants were exercised.
Class B stock
Shares of class B stock had no voting or economic rights and were convertible into common shares upon a change of control or a qualified initial public offering if a certain performance threshold was met. Since the performance threshold was not met at the time of our IPO, the shares of class B stock were canceled in 2019.
Legal entity restructuring
The purpose of the November 2017 legal entity restructuring was to create a new capital structure for new debt and equity investors to fund the VWR acquisition. A new parent was formed for this purpose named Avantor, Inc., as previously described. The legal entity restructuring also simplified the corporate structure. The effects of the legal entity restructuring are explained as follows:
|
•
|
Exchange of legacy common stock and noncontrolling interest —
Common shares of Avantor Funding, Inc. and the noncontrolling interest were exchanged for shares of junior convertible preferred stock and common stock of Avantor, Inc. As a result, a legacy noncontrolling interest was derecognized.
|
|
•
|
Deferred tax effects —
We increased common stock including paid-in capital and reduced our deferred income tax liabilities to derecognize the temporary differences related to the
|
F-43
noncontrolling interest, which included an outside basis difference adjustment, a step-up basis adjustment and an adjustment to a net operating loss carryforward.
The following table presents the financial effects of the November 2017 legal entity restructuring as summarized on the statement of stockholders’ equity or deficit:
|
Avantor, Inc. stockholders’ deficit
|
NCI
|
Total
|
|||||||||||||||||||||
|
(in millions)
|
Common stock including paid-in capital
|
Accum-ulated deficit
|
AOCI
|
Total
|
|||||||||||||||||||
|
Exchange of legacy common stock
|
$
|
(329.4
|
)
|
$
|
—
|
|
$
|
—
|
|
$
|
(329.4
|
)
|
$
|
—
|
|
$
|
(329.4
|
)
|
|||||
|
Exchange of legacy non-controlling interest
|
(278.6
|
)
|
(37.9
|
)
|
(10.5
|
)
|
(327.0
|
)
|
327.0
|
|
—
|
|
|||||||||||
|
Deferred tax effects
|
175.8
|
|
—
|
|
—
|
|
175.8
|
|
—
|
|
175.8
|
|
|||||||||||
|
Total
|
$
|
(432.2
|
)
|
$
|
(37.9
|
)
|
$
|
(10.5
|
)
|
$
|
(480.6
|
)
|
$
|
327.0
|
|
$
|
(153.6
|
)
|
|||||
|
15
.
|
Accumulated other comprehensive income or loss
|
The following table presents changes in the components of AOCI:
|
(in millions)
|
Foreign currency translation
|
Derivative instruments
|
Defined benefit plans
|
Total
|
|||||||||||
|
Balance on December 31, 2016
|
$
|
(47.3
|
)
|
$
|
—
|
|
$
|
3.2
|
|
$
|
(44.1
|
)
|
|||
|
Unrealized gain
|
71.0
|
|
0.3
|
|
2.2
|
|
73.5
|
|
|||||||
|
Reclassification of loss (gain) into earnings
|
—
|
|
0.1
|
|
(3.2
|
)
|
(3.1
|
)
|
|||||||
|
(Decrease) increase due to income taxes
|
—
|
|
(0.1
|
)
|
0.2
|
|
0.1
|
|
|||||||
|
Balance on December 31, 2017
|
23.7
|
|
0.3
|
|
2.4
|
|
26.4
|
|
|||||||
|
Unrealized (loss) gain
|
(82.7
|
)
|
3.0
|
|
(16.9
|
)
|
(96.6
|
)
|
|||||||
|
Reclassification of (gain) loss into earnings
|
—
|
|
(1.9
|
)
|
2.3
|
|
0.4
|
|
|||||||
|
(Decrease) increase due to income taxes
|
—
|
|
(0.3
|
)
|
3.6
|
|
3.3
|
|
|||||||
|
Balance on December 31, 2018
|
(59.0
|
)
|
1.1
|
|
(8.6
|
)
|
(66.5
|
)
|
|||||||
|
Unrealized loss
|
(3.3
|
)
|
(1.4
|
)
|
(18.9
|
)
|
(23.6
|
)
|
|||||||
|
Reclassification of gain into earnings
|
—
|
|
(0.9
|
)
|
(0.6
|
)
|
(1.5
|
)
|
|||||||
|
Increase due to income taxes
|
—
|
|
0.7
|
|
5.0
|
|
5.7
|
|
|||||||
|
Balance on December 31, 2019
|
$
|
(62.3
|
)
|
$
|
(0.5
|
)
|
$
|
(23.1
|
)
|
$
|
(85.9
|
)
|
|||
The reclassifications and income tax effects shown above were immaterial to the financial statements. The reclassifications were made to either cost of sales or selling, general and administrative expense depending upon the nature of the underlying transaction.
F-44
In the table above, the balances shown at December 31, 2016 and the activity shown for 2017 include AOCI related to a noncontrolling interest. As a result, the totals for that date and period do not agree to the corresponding amounts in the AOCI column on the statement of stockholders’ equity or deficit because those amounts do not include AOCI related to the noncontrolling interest.
|
16
.
|
Employee benefit plans
|
We sponsor many defined benefit plans across the globe. Those plans have resulted in significant obligations to pay benefits to current and former employees, many of which are at least partially funded with plan assets. Unless required otherwise, we typically seek to freeze the growth of defined benefit plans and close them to new participants. Defined benefit plans do not materially impact our earnings, and as a result, certain disclosures have been omitted.
The following table presents changes in benefit obligations and plan assets and the funded status of our plans:
|
(in millions)
|
U.S. pension plans
Year ended December 31,
|
Non-U.S. pension plans
Year ended December 31,
|
U.S. medical plan
Year ended December 31,
|
||||||||||||||||||||
|
2019
|
2018
|
2019
|
2018
|
2019
|
2018
|
||||||||||||||||||
|
Benefit obligation:
|
|||||||||||||||||||||||
|
Beginning balance
|
$
|
203.3
|
|
$
|
221.4
|
|
$
|
219.5
|
|
$
|
291.0
|
|
$
|
16.6
|
|
$
|
18.6
|
|
|||||
|
Service cost
|
2.9
|
|
3.1
|
|
3.7
|
|
4.5
|
|
0.2
|
|
0.3
|
|
|||||||||||
|
Interest cost
|
8.0
|
|
7.7
|
|
4.7
|
|
5.2
|
|
0.6
|
|
0.6
|
|
|||||||||||
|
Employee contributions
|
—
|
|
—
|
|
1.0
|
|
4.2
|
|
—
|
|
0.1
|
|
|||||||||||
|
Actuarial loss (gain)
|
29.2
|
|
(12.8
|
)
|
34.6
|
|
(13.3
|
)
|
(1.4
|
)
|
(1.4
|
)
|
|||||||||||
|
Benefits paid
|
(14.6
|
)
|
(18.5
|
)
|
(7.0
|
)
|
(5.9
|
)
|
(0.5
|
)
|
(0.5
|
)
|
|||||||||||
|
Settlements and curtailments
|
—
|
|
—
|
|
(0.9
|
)
|
(52.1
|
)
|
—
|
|
—
|
|
|||||||||||
|
Currency translation
|
—
|
|
—
|
|
2.9
|
|
(11.8
|
)
|
—
|
|
—
|
|
|||||||||||
|
Other
|
—
|
|
2.4
|
|
(0.4
|
)
|
(2.3
|
)
|
—
|
|
(1.1
|
)
|
|||||||||||
|
Ending balance
|
228.8
|
|
203.3
|
|
258.1
|
|
219.5
|
|
15.5
|
|
16.6
|
|
|||||||||||
|
Fair value of plan assets:
|
|||||||||||||||||||||||
|
Beginning balance
|
223.2
|
|
262.8
|
|
132.3
|
|
191.2
|
|
—
|
|
—
|
|
|||||||||||
|
Return (loss) on plan assets
|
46.9
|
|
(21.9
|
)
|
13.2
|
|
(0.9
|
)
|
—
|
|
—
|
|
|||||||||||
|
Employer contributions
|
0.5
|
|
0.8
|
|
3.8
|
|
3.8
|
|
0.5
|
|
0.5
|
|
|||||||||||
|
Employee contributions
|
—
|
|
—
|
|
1.0
|
|
4.2
|
|
—
|
|
—
|
|
|||||||||||
|
Benefits paid
|
(14.6
|
)
|
(18.5
|
)
|
(7.0
|
)
|
(5.9
|
)
|
(0.5
|
)
|
(0.5
|
)
|
|||||||||||
|
Settlements and curtailments
|
—
|
|
—
|
|
—
|
|
(51.9
|
)
|
—
|
|
—
|
|
|||||||||||
|
Currency translation
|
—
|
|
—
|
|
4.4
|
|
(7.7
|
)
|
—
|
|
—
|
|
|||||||||||
|
Other
|
—
|
|
—
|
|
(0.5
|
)
|
(0.5
|
)
|
—
|
|
—
|
|
|||||||||||
|
Ending balance
|
256.0
|
|
223.2
|
|
147.2
|
|
132.3
|
|
—
|
|
—
|
|
|||||||||||
|
Funded status at end of year
|
$
|
27.2
|
|
$
|
19.9
|
|
$
|
(110.9
|
)
|
$
|
(87.2
|
)
|
$
|
(15.5
|
)
|
$
|
(16.6
|
)
|
|||||
F-45
The following table presents other balance sheet information for defined benefit plans:
|
(in millions)
|
U.S. pension plans
December 31,
|
Non-U.S. pension plans
December 31,
|
U.S. medical plan
December 31,
|
||||||||||||||||||||
|
2019
|
2018
|
2019
|
2018
|
2019
|
2018
|
||||||||||||||||||
|
Accumulated benefit obligation
|
$
|
222.0
|
|
$
|
196.4
|
|
$
|
249.6
|
|
$
|
211.6
|
|
$
|
15.5
|
|
$
|
16.6
|
|
|||||
|
Amounts recorded in balance sheet:
|
|||||||||||||||||||||||
|
Other assets
|
$
|
37.9
|
|
$
|
29.6
|
|
$
|
1.7
|
|
$
|
5.4
|
|
$
|
—
|
|
$
|
—
|
|
|||||
|
Other current liabilities
|
(0.7
|
)
|
(0.5
|
)
|
(0.4
|
)
|
(1.8
|
)
|
(0.8
|
)
|
(0.8
|
)
|
|||||||||||
|
Other liabilities
|
(10.0
|
)
|
(9.2
|
)
|
(112.2
|
)
|
(90.8
|
)
|
(14.7
|
)
|
(15.8
|
)
|
|||||||||||
|
Funded status
|
$
|
27.2
|
|
$
|
19.9
|
|
$
|
(110.9
|
)
|
$
|
(87.2
|
)
|
$
|
(15.5
|
)
|
$
|
(16.6
|
)
|
|||||
|
Components of AOCI, excluding tax effects:
|
|||||||||||||||||||||||
|
Actuarial (loss) gain
|
$
|
(16.9
|
)
|
$
|
(22.1
|
)
|
$
|
(21.4
|
)
|
$
|
4.1
|
|
$
|
7.3
|
|
$
|
6.7
|
|
|||||
|
Prior service (loss) gain
|
—
|
|
—
|
|
(0.6
|
)
|
(0.1
|
)
|
0.6
|
|
0.8
|
|
|||||||||||
The following table presents the assumptions used to determine the benefit obligation:
|
U.S. pension plans
December 31, |
Non-U.S. pension plans
December 31, |
U.S. medical plan
December 31, |
|||||||||||||||
|
2019
|
2018
|
2019
|
2018
|
2019
|
2018
|
||||||||||||
|
Discount rate
|
3.3
|
%
|
4.4
|
%
|
1.4
|
%
|
2.3
|
%
|
3.3
|
%
|
4.2
|
%
|
|||||
|
Annual rate of salary increase
|
—
|
|
—
|
|
2.4
|
%
|
2.5
|
%
|
—
|
|
—
|
|
|||||
|
Health care cost trends:
|
|||||||||||||||||
|
Initial rate
|
n/a
|
|
n/a
|
|
n/a
|
|
n/a
|
|
5.8
|
%
|
6.8
|
%
|
|||||
|
Ultimate rate
|
n/a
|
|
n/a
|
|
n/a
|
|
n/a
|
|
4.5
|
%
|
4.5
|
%
|
|||||
|
Year ultimate rate is reached
|
n/a
|
|
n/a
|
|
n/a
|
|
n/a
|
|
2037
|
|
2031
|
|
|||||
The effect of a one percent increase or decrease to health care cost trends at December 31, 2019 was not material to our benefit obligations.
F-46
The following table presents future benefits expected to be paid:
|
(in millions)
|
December 31, 2019
|
||||||||||
|
U.S. pension plans
|
Non-U.S. pension plans
|
U.S. medical plan
|
|||||||||
|
2020
|
$
|
14.3
|
|
$
|
7.5
|
|
$
|
0.8
|
|
||
|
2021
|
14.2
|
|
7.5
|
|
0.8
|
|
|||||
|
2022
|
13.4
|
|
7.2
|
|
0.9
|
|
|||||
|
2023
|
13.2
|
|
8.4
|
|
1.0
|
|
|||||
|
2024
|
13.0
|
|
7.8
|
|
1.0
|
|
|||||
|
2025 – 2029
|
66.3
|
|
41.9
|
|
5.1
|
|
|||||
We do not expect to make any material contributions to our defined benefit plans in
2020
.
The following table presents the allocation of plan assets:
|
(in millions)
|
December 31, 2019
|
December 31, 2018
|
|||||||||||||||||||||||||||||
|
Total
|
Level 1
|
Level 2
|
Level 3
|
Total
|
Level 1
|
Level 2
|
Level 3
|
||||||||||||||||||||||||
|
U.S. plans:
|
|||||||||||||||||||||||||||||||
|
Cash
|
$
|
3.0
|
|
$
|
3.0
|
|
$
|
—
|
|
$
|
—
|
|
$
|
1.2
|
|
$
|
1.2
|
|
$
|
—
|
|
$
|
—
|
|
|||||||
|
Fixed income
|
215.1
|
|
—
|
|
215.1
|
|
—
|
|
153.5
|
|
—
|
|
153.5
|
|
—
|
|
|||||||||||||||
|
Equity
|
37.9
|
|
37.9
|
|
—
|
|
—
|
|
68.5
|
|
22.9
|
|
42.0
|
|
3.6
|
|
|||||||||||||||
|
Total
|
$
|
256.0
|
|
$
|
40.9
|
|
$
|
215.1
|
|
$
|
—
|
|
$
|
223.2
|
|
$
|
24.1
|
|
$
|
195.5
|
|
$
|
3.6
|
|
|||||||
|
Non-U.S. plans:
|
|||||||||||||||||||||||||||||||
|
Cash
|
$
|
1.3
|
|
$
|
0.1
|
|
$
|
1.2
|
|
$
|
—
|
|
$
|
2.3
|
|
$
|
0.9
|
|
$
|
1.4
|
|
—
|
|
||||||||
|
Fixed income
|
33.1
|
|
—
|
|
33.1
|
|
—
|
|
34.2
|
|
—
|
|
34.2
|
|
—
|
|
|||||||||||||||
|
Equity
|
32.1
|
|
—
|
|
32.1
|
|
—
|
|
25.2
|
|
—
|
|
25.2
|
|
—
|
|
|||||||||||||||
|
Other
|
47.1
|
|
—
|
|
47.1
|
|
—
|
|
37.0
|
|
—
|
|
37.0
|
|
—
|
|
|||||||||||||||
|
Insurance contracts
|
33.6
|
|
—
|
|
—
|
|
33.6
|
|
33.6
|
|
—
|
|
—
|
|
33.6
|
|
|||||||||||||||
|
Total
|
$
|
147.2
|
|
$
|
0.1
|
|
$
|
113.5
|
|
$
|
33.6
|
|
$
|
132.3
|
|
$
|
0.9
|
|
$
|
97.8
|
|
$
|
33.6
|
|
|||||||
For the U.S. plans, our primary investment strategy is to match the duration of plan assets with benefit obligations. This strategy, utilizing diversified fixed income funds, attempts to hedge the rate used to discount pension obligations. The fixed income funds invest in long duration investment grade corporate bonds primarily across industrial, financial and utilities sectors and is managed by a single institution. Surplus assets are invested in equity funds. We estimate the expected long-term rate of return on plan assets considering prior performance, the mix of assets and expectations for the long-term returns on those asset classes. Assets measured using Level 3 inputs were not material to the portfolio.
For the non-U.S. plans, in many cases we enter into insurance contracts to guarantee payment of benefits for an annual fee. Otherwise, our primary investment strategy is to seek a return on plan
F-47
assets sufficient to achieve our long-term funding objectives. To seek this return, we invest significantly in global equity funds and secondarily in fixed income funds to mitigate inflation and interest rate risk. These funds primarily invest in inflation-linked and other types of government bonds. We estimate the expected long-term rate of return on plan assets in a similar manner to the U.S. plans.
The following table presents changes to plan assets of non-U.S. plans that were measured using unobservable inputs:
|
(in millions)
|
Year ended December 31,
|
||||||
|
2019
|
2018
|
||||||
|
Beginning balance
|
$
|
33.6
|
|
$
|
82.4
|
|
|
|
Purchases
|
3.1
|
|
6.4
|
|
|||
|
Actual returns
|
(0.3
|
)
|
1.2
|
|
|||
|
Settlements
|
(2.9
|
)
|
(54.8
|
)
|
|||
|
Currency translation
|
0.1
|
|
(1.6
|
)
|
|||
|
Ending balance
|
$
|
33.6
|
|
$
|
33.6
|
|
|
|
17
.
|
Stock-based compensation
|
The following table presents components of stock-based compensation expense:
|
(in millions)
|
Classification
|
Year ended December 31,
|
|||||||||||
|
2019
|
2018
|
2017
|
|||||||||||
|
Stock options
|
Equity
|
$
|
42.4
|
|
$
|
13.6
|
|
$
|
23.7
|
|
|||
|
RSUs
|
Equity
|
13.0
|
|
0.3
|
|
3.3
|
|
||||||
|
Optionholder awards
|
Liability
|
2.4
|
|
5.2
|
|
15.6
|
|
||||||
|
SARs
|
Equity
|
9.0
|
|
(0.9
|
)
|
4.8
|
|
||||||
|
Other
|
Liability
|
1.1
|
|
0.2
|
|
0.8
|
|
||||||
|
Total
|
$
|
67.9
|
|
$
|
18.4
|
|
$
|
48.2
|
|
||||
|
Balance sheet classification:
|
|||||||||||||
|
Equity
|
$
|
64.4
|
|
$
|
13.0
|
|
$
|
31.8
|
|
||||
|
Liability
|
3.5
|
|
5.4
|
|
16.4
|
|
|||||||
At
December 31, 2019
, unvested awards have remaining expense of
$79.4 million
to be recognized over a weighted average period of
1.9 years
.
Our stock-based compensation awards have been issued under a succession of plans sponsored by the ultimate parent of our business, which is currently Avantor, Inc. In connection with the IPO, we adopted the 2019 Plan. The 2019 Plan provides for up to
23.5 million
shares of common stock to be issued in the form of stock options, restricted stock units or other equity-based awards or cash-based awards. The 2019 Plan also provides for 1% annual increases to the number of shares of common stock available for issuance unless reduced by our Board of
F-48
Directors. At
December 31, 2019
,
16.6 million
shares were available for future issuance. The 2019 Plan will automatically terminate on May 17, 2029, and no award may be granted after this date.
Stock options
The following table presents information about outstanding stock options:
|
(options and intrinsic value in millions)
|
Number of options
|
Weighted average exercise price per option
|
Aggregate intrinsic value
|
Weighted average remaining term
|
||||||||
|
Balance on December 31, 2018
|
21.0
|
|
$
|
15.12
|
|
|||||||
|
Granted
|
3.7
|
|
14.26
|
|
||||||||
|
Exercised
|
(0.4
|
)
|
1.84
|
|
||||||||
|
Forfeited
|
(1.6
|
)
|
17.28
|
|
||||||||
|
Balance on December 31, 2019
|
22.7
|
|
15.04
|
|
$
|
127.0
|
|
7.0 years
|
||||
|
Expected to vest
|
7.1
|
|
18.41
|
|
15.4
|
|
8.7 years
|
|||||
|
Exercisable
|
15.6
|
|
13.51
|
|
111.6
|
|
6.2 years
|
|||||
The options granted in 2019 were primarily issued in connection with the IPO. They will vest annually over
four years
, subject to the recipient continuously providing service to us through each such date.
Stock options outstanding on December 31, 2018 primarily consisted of the following:
|
•
|
Stock options granted in 2018 and late 2017 vest
60%
based on service conditions and vested
40%
based on performance conditions. The service conditions are vesting in equal annual installments over
four years
. The performance conditions related to the completion of a qualified initial public offering or a change of control, which was achieved in 2019 upon completion of our IPO. We recognized the entire grant date fair value of those options upon completion of the IPO, resulting in
$26.9 million
of expense during 2019.
|
|
•
|
Stock options granted prior to late 2017 generally vested or are vesting in equal annual installments over
four years
.
|
All options expire
ten
years after the date of grant and are settled in shares.
F-49
The following table presents weighted-average information about stock options granted:
|
Year ended December 31,
|
|||||||||||
|
2019
|
2018
|
2017
|
|||||||||
|
Grant date fair value per option
|
$
|
4.85
|
|
$
|
5.53
|
|
$
|
4.61
|
|
||
|
Assumptions used to determine grant date fair value:
|
|||||||||||
|
Expected stock price volatility
|
30
|
%
|
51
|
%
|
45
|
%
|
|||||
|
Risk free interest rate
|
2.1
|
%
|
2.9
|
%
|
2.2
|
%
|
|||||
|
Expected dividend rate
|
nil
|
|
nil
|
|
nil
|
|
|||||
|
Expected life of options
|
6.3 years
|
|
6.3 years
|
|
6.3 years
|
|
|||||
The following table presents other information about stock options:
|
(in millions)
|
Year ended December 31,
|
||||||||||
|
2019
|
2018
|
2017
|
|||||||||
|
Fair value of options vested
|
$
|
42.4
|
|
$
|
47.4
|
|
$
|
29.0
|
|
||
|
Intrinsic value of options exercised
|
5.4
|
|
2.0
|
|
83.6
|
|
|||||
|
Tax benefit of options exercised
|
1.3
|
|
0.5
|
|
33.5
|
|
|||||
We modified stock options under predecessor plans in 2017 in connection with a legal entity restructuring and certain distributions that occurred in that year. Those options were ultimately converted into Avantor, Inc. stock options on a
one
-for-one basis. Stock-based compensation expense in 2017 includes
$18.4 million
from the modification of those options due to acceleration of vesting terms, reductions of exercise prices and increases in the fair value of Avantor.
RSUs
The following table presents information about unvested RSUs:
|
(awards in millions)
|
Number of awards
|
Weighted average grant date fair value per award
|
||||
|
Balance on December 31, 2018
|
0.1
|
|
$
|
11.41
|
|
|
|
Granted
|
5.6
|
|
14.04
|
|
||
|
Vested
|
—
|
|
11.31
|
|
||
|
Forfeited
|
(0.5
|
)
|
14.01
|
|
||
|
Balance on December 31, 2019
|
5.2
|
|
13.97
|
|
||
F-50
Substantially all of the RSUs granted in 2019 were in connection with our IPO. We granted
3.6 million
RSUs having a grant date fair value equal to our
$14
offering price. The RSUs are vesting annually over
four
years, subject to the recipient continuously providing service to us through each such date. Also included in 2019 grants are the conversion of long-term cash incentive awards originally granted in 2018 and 2017 into
1.8 million
RSUs. Those RSUs also had a grant date fair value equal to our
$14
offering price.
50%
of those RSUs vest on December 31, 2020, subject to the recipient continuously providing service to us through such date, and
50%
vest upon achievement of a specified earnings target in addition to that service condition. The conversion was accounted for following the guidance for modifications of stock-based awards with no incremental compensation cost recognized as a result of the conversion. The conversion also resulted in the
$8.8 million
reclassification of a long-term incentive plan liability into equity.
RSUs did not have a material impact to our stock-based compensation expense prior to our 2019 IPO. Similarly, the fair value of RSUs vesting from 2017 to 2019 was not material.
Optionholder awards
Employee-related liabilities at December 31, 2019 include
$0.9 million
for optionholder awards, all of which will be settled in cash during 2020. We paid cash of
$4.6 million
in
2019
,
$6.3 million
in
2018
and
$19.3 million
in
2017
to settle vested awards under this program, and we expect to pay an additional
$1.4 million
in 2020.
SARs
SARs were fully-vested rights for the holder to receive cash from a NuSil investor, whose primary asset was shares of our equity. The SARs were issued to our employees by a NuSil investor many years ago. These awards were accounted as contributed capital in a manner similar to how a parent accounts for a contribution to an equity-method investee. The contribution was required to be remeasured at fair value at the end of each reporting period, resulting in the recognition of expense or benefit each period as the value of our equity changed over time.
In November 2019, the NuSil investor settled the SARs, which froze the value of the capital contribution and ended the requirement to remeasure the contribution prospectively. We were not required to pay any cash upon settlement of those awards.
F-51
|
18
.
|
Other income or expense, net
|
The following table presents the components of other income or expense, net:
|
(in millions)
|
Year ended December 31,
|
||||||||||
|
2019
|
2018
|
2017
|
|||||||||
|
Net foreign currency loss from financing activities
|
$
|
(1.9
|
)
|
$
|
(6.5
|
)
|
$
|
(5.5
|
)
|
||
|
Income related to defined benefit plans
|
5.1
|
|
3.4
|
|
3.4
|
|
|||||
|
Net gain on settlement of derivatives, see note 21
|
—
|
|
—
|
|
9.6
|
|
|||||
|
Other
|
(0.7
|
)
|
(0.4
|
)
|
—
|
|
|||||
|
Other income (expense), net
|
$
|
2.5
|
|
$
|
(3.5
|
)
|
$
|
7.5
|
|
||
Most of the net foreign currency remeasurement loss from financing activities was caused by the weakening of the U.S. dollar on historical, unhedged intercompany loan positions as disclosed in note
5
. The income related to defined benefit plans includes expected returns on defined benefit plan assets, partially offset by interest cost on defined benefit plan obligations.
|
19
.
|
Income taxes
|
The following table presents detail about captions appearing on the statements of operations:
|
(in millions)
|
Year ended December 31,
|
||||||||||
|
2019
|
2018
|
2017
|
|||||||||
|
Income (loss) before income taxes:
|
|||||||||||
|
United States
|
$
|
26.0
|
|
$
|
(78.4
|
)
|
$
|
(441.8
|
)
|
||
|
Foreign
|
14.6
|
|
(35.4
|
)
|
(18.4
|
)
|
|||||
|
Total
|
$
|
40.6
|
|
$
|
(113.8
|
)
|
$
|
(460.2
|
)
|
||
|
Current income tax expense:
|
|||||||||||
|
Federal
|
$
|
(36.6
|
)
|
$
|
(25.4
|
)
|
$
|
(101.1
|
)
|
||
|
State
|
(15.3
|
)
|
(5.4
|
)
|
(0.3
|
)
|
|||||
|
Foreign
|
(57.6
|
)
|
(46.2
|
)
|
(14.3
|
)
|
|||||
|
Subtotal
|
$
|
(109.5
|
)
|
$
|
(77.0
|
)
|
$
|
(115.7
|
)
|
||
|
Deferred income tax benefit:
|
|||||||||||
|
Federal
|
$
|
28.9
|
|
$
|
64.5
|
|
$
|
349.8
|
|
||
|
State
|
19.4
|
|
3.7
|
|
22.9
|
|
|||||
|
Foreign
|
58.4
|
|
35.7
|
|
57.9
|
|
|||||
|
Subtotal
|
106.7
|
|
103.9
|
|
430.6
|
|
|||||
|
Income tax (expense) benefit
|
$
|
(2.8
|
)
|
$
|
26.9
|
|
$
|
314.9
|
|
||
F-52
The following table reconciles the income tax provision calculated at the United States federal corporate rate to the amounts presented in the statements of operations:
|
(in millions)
|
Year ended December 31,
|
||||||||||
|
2019
|
2018
|
2017
|
|||||||||
|
Income (loss) before income taxes
|
$
|
40.6
|
|
$
|
(113.8
|
)
|
$
|
(460.2
|
)
|
||
|
United States federal corporate rate
|
21
|
%
|
21
|
%
|
35
|
%
|
|||||
|
Income tax (expense) benefit at federal corporate rate
|
(8.5
|
)
|
23.9
|
|
161.1
|
|
|||||
|
State income taxes, net of federal benefit
|
3.3
|
|
(2.3
|
)
|
15.8
|
|
|||||
|
Transaction costs
|
—
|
|
—
|
|
(16.1
|
)
|
|||||
|
Rate changes related to U.S. tax reform
|
—
|
|
(21.5
|
)
|
285.5
|
|
|||||
|
Rate changes related to foreign jurisdictions
|
14.0
|
|
—
|
|
53.5
|
|
|||||
|
Effect of one-time transition tax under U.S. tax reform
|
—
|
|
51.0
|
|
(158.8
|
)
|
|||||
|
Foreign taxes
|
(3.1
|
)
|
—
|
|
(4.1
|
)
|
|||||
|
Valuation allowance
|
(7.6
|
)
|
(23.7
|
)
|
(12.8
|
)
|
|||||
|
Changes to uncertain tax positions
|
(3.7
|
)
|
(5.6
|
)
|
0.8
|
|
|||||
|
Foreign-derived intangible income
|
5.0
|
|
3.7
|
|
—
|
|
|||||
|
Other, net
|
(2.2
|
)
|
1.4
|
|
(10.0
|
)
|
|||||
|
Income tax (expense) benefit
|
$
|
(2.8
|
)
|
$
|
26.9
|
|
$
|
314.9
|
|
||
In 2017, tax reform legislation was enacted in the United States. The new legislation included a broad range of corporate tax reforms including: (i) a reduction of the U.S. federal corporate tax rate from
35%
to
21%
; (ii) a one-time transition tax on undistributed foreign earnings and profits; (ii) ongoing anti-base erosion provisions designed to tax foreign earnings generated without a large fixed asset base; and (iv) new limitations on deductions for interest expense and net operating losses.
As a result of the new legislation, we recognized provisional one-time income tax effects in 2017 and finalized the provisional accounting in 2018 based on new transition tax rules and interpretations issued that year, as shown in the table above. After the utilization of tax attributes such as net operating loss carryforwards, our transition tax payable was
$65.0 million
at
December 31, 2019
.
F-53
Deferred taxes
The following table presents the components of deferred tax assets and liabilities:
|
(in millions)
|
December 31,
|
||||||
|
2019
|
2018
|
||||||
|
Deferred tax assets:
|
|||||||
|
Reserves and accrued expenses
|
$
|
54.0
|
|
$
|
50.1
|
|
|
|
Pension, postretirement, and environmental liabilities
|
18.1
|
|
16.6
|
|
|||
|
Net operating loss and research and development carryforwards
|
312.8
|
|
291.6
|
|
|||
|
Other
|
14.8
|
|
13.3
|
|
|||
|
Deferred tax assets, gross
|
399.7
|
|
371.6
|
|
|||
|
Less: valuation allowances
|
(193.9
|
)
|
(197.8
|
)
|
|||
|
Deferred tax assets, net
|
205.8
|
|
173.8
|
|
|||
|
Deferred tax liabilities:
|
|||||||
|
Intangibles
|
(927.2
|
)
|
(1,014.8
|
)
|
|||
|
Property, plant and equipment
|
(56.3
|
)
|
(57.6
|
)
|
|||
|
Other
|
—
|
|
—
|
|
|||
|
Deferred tax liabilities
|
(983.5
|
)
|
(1,072.4
|
)
|
|||
|
Net deferred tax liability
|
$
|
(777.7
|
)
|
$
|
(898.6
|
)
|
|
|
Classification on balance sheets:
|
|||||||
|
Other assets
|
$
|
7.7
|
|
$
|
8.9
|
|
|
|
Deferred income tax liabilities
|
(785.4
|
)
|
(907.5
|
)
|
|||
The (decrease) increase to the valuation allowance was
$(3.9) million
in
2019
,
$13.9 million
in
2018
and
$181.1 million
in
2017
. The significant 2017 increase resulted from the VWR acquisition.
At
December 31, 2019
,
$160.0 million
of the valuation allowances presented above relate to foreign net operating loss carryforwards that are not expected to be realized. We evaluate the realization of deferred tax assets by considering such factors as the reversal of existing taxable temporary differences, expected profitability by tax jurisdiction and available carryforward periods. The extent and timing of any such reversals will influence the extent of tax benefits recognized in a particular year. Should applicable losses, credits and deductions ultimately be realized, the resulting reduction in the valuation allowance would generally be recognized as an income tax benefit.
Uncertain tax positions
We file federal income tax returns in the United States and other tax returns in various states and international jurisdictions. In the normal course of business, we are subject to examination by taxing authorities throughout the world. We provide reserves for positions that are more likely than not to be overturned by a tax authority upon examination. Tax years are subject to
F-54
examination in the United States since 2006 at federal level and since 2008 for certain states and in certain international jurisdictions since 2008.
The following table reflects changes to the reserve for uncertain tax positions, excluding accrued interest and penalties:
|
(in millions)
|
Year ended December 31,
|
||||||||||
|
2019
|
2018
|
2017
|
|||||||||
|
Beginning balance
|
$
|
84.3
|
|
$
|
79.6
|
|
$
|
10.7
|
|
||
|
Additions:
|
|||||||||||
|
Acquisitions
|
—
|
|
—
|
|
64.3
|
|
|||||
|
Tax positions related to the current year
|
3.1
|
|
6.9
|
|
6.4
|
|
|||||
|
Tax positions related to prior years
|
2.5
|
|
0.5
|
|
0.1
|
|
|||||
|
Currency translation
|
—
|
|
—
|
|
0.5
|
|
|||||
|
Reductions:
|
|||||||||||
|
Tax positions related to prior years
|
(4.4
|
)
|
(0.2
|
)
|
(0.6
|
)
|
|||||
|
Settlements with taxing authorities
|
(0.3
|
)
|
—
|
|
(0.6
|
)
|
|||||
|
Lapse of statutes of limitations
|
(1.4
|
)
|
(1.3
|
)
|
(1.2
|
)
|
|||||
|
Currency translation
|
(0.2
|
)
|
(1.2
|
)
|
—
|
|
|||||
|
Ending balance
|
$
|
83.6
|
|
$
|
84.3
|
|
$
|
79.6
|
|
||
Accrued interest and penalties related to the reserve for uncertain tax positions were
$7.1 million
at December 31, 2019,
$4.7 million
at December 31, 2018 and
$1.8 million
at December 31, 2017. We believe that it is reasonably possible that the reserve for uncertain tax positions could decrease by up to
$8.1 million
over the next twelve months.
The development of reserves for uncertain tax positions requires judgments about tax issues, potential outcomes and the timing of settlement discussions with tax authorities. If we were to prevail on all uncertain tax positions, we would recognize an income tax benefit.
Other matters
Undistributed earnings of foreign subsidiaries that are deemed to be permanently invested amount to
$2,802.1 million
at
December 31, 2019
. In addition to the one-time transition tax imposed on all accumulated foreign undistributed earnings through December 31, 2017, undistributed earnings of foreign subsidiaries as of
December 31, 2019
may still be subject to certain taxes upon repatriation, primarily where foreign withholding taxes apply. We assert indefinite reinvestment related to investments in foreign subsidiaries. It is not practicable to calculate the unrecognized deferred tax liability on undistributed foreign earnings due to the complexity of the hypothetical calculation.
At
December 31, 2019
, we had federal net operating loss carryforwards of
$97.6 million
that primarily expire in 2038 and state net operating loss carryforwards of
$191.6 million
that expire
F-55
at various times through 2038. In addition, we had foreign net operating loss carryforwards of
$658.2 million
, which predominantly have indefinite expirations.
|
20
.
|
Business combinations
|
The following table presents cash paid for acquisitions, net of cash acquired:
|
(in millions)
|
Year ended December 31, 2017
|
||
|
VWR
|
$
|
6,579.8
|
|
|
Other
|
80.9
|
|
|
|
Total
|
$
|
6,660.7
|
|
VWR
On November 21, 2017, we acquired VWR. We determined that we were the accounting acquirer because: (i) we obtained control of VWR by transferring cash to purchase all of VWR’s issued and outstanding shares of common stock, and (ii) we satisfied all but one of the other qualitative criteria provided under GAAP.
VWR was a global manufacturer and distributor of laboratory and production products and services. We acquired VWR to improve our access to certain customers and geographies, to create a robust offering for the entire biopharmaceutical value chain and to generate significant cost synergies. We incurred transaction costs of
$40.7 million
in 2017 to complete the acquisition, excluding fees paid to New Mountain Capital and to refinance our debt and equity. The transaction costs are included in selling, general and administrative expenses on our statement of operations.
F-56
The following table presents the allocation of the purchase price to the assets acquired and liabilities assumed:
|
(in millions)
|
November 21, 2017
|
||
|
Accounts receivable
|
$
|
784.9
|
|
|
Inventory
|
585.3
|
|
|
|
Other current assets
|
24.3
|
|
|
|
Property, plant and equipment
|
457.1
|
|
|
|
Goodwill
|
2,581.3
|
|
|
|
Other intangible assets
|
4,534.1
|
|
|
|
Other assets
|
69.3
|
|
|
|
Accounts payable
|
(455.1
|
)
|
|
|
Other current liabilities
|
(295.8
|
)
|
|
|
Finance lease liabilities
|
(67.9
|
)
|
|
|
Deferred income tax liabilities
|
(1,486.0
|
)
|
|
|
Other liabilities
|
(151.7
|
)
|
|
|
Total
|
$
|
6,579.8
|
|
The purchase price was allocated to identifiable assets acquired and liabilities assumed based on their fair value. The fair value of inventory was determined using a comparative sales method that stated inventory at its expected selling price less estimated selling costs and a reasonable profit on the selling effort, a level 3 measurement. The fair value of property, plant and equipment was determined at the individual asset level using a combination of cost, sales and income approaches, which we consider to be level 3 measurements. The fair value of other intangible assets was determined as follows:
|
•
|
Customer relationships were valued using the income approach, a level 3 measurement that assumed a weighted-average discount rate of
9.9%
and a customer retention rate of
98%
.
|
|
•
|
The VWR trade name was valued using the relief-from-royalty method, a level 3 measurement that assumed a weighted-average royalty rate of
2.2%
.
|
|
•
|
Other identifiable intangible assets were valued primarily using a replacement cost method, a level 3 measurement.
|
The fair values of all other identifiable assets acquired and liabilities assumed were primarily based on their carrying values, which we consider to be level 2 measurements.
The purchase price for VWR was higher than the fair value of the acquired identifiable assets, resulting in goodwill, due to the value of anticipated commercial and cost synergies, the existence of intangible assets not recognizable under GAAP and other market factors. On October 1, 2018, we allocated goodwill of
$1,412.1 million
to the Americas,
$1,156.9 million
to
F-57
Europe and
$12.3 million
to AMEA based on measurements performed on the acquisition date. We did not record any goodwill that we expect to be deductible for tax purposes.
The following table presents information about acquired identifiable intangible assets:
|
(dollars in millions)
|
Fair value
|
Weighted average estimated life
|
|||
|
Customer relationships
|
$
|
4,160.0
|
|
20.0 years
|
|
|
VWR trade name
|
270.0
|
|
6.4 years
|
||
|
Other
|
104.1
|
|
7.9 years
|
||
|
Total
|
$
|
4,534.1
|
|
18.9 years
|
|
Our 2017 results included net sales of
$552.0 million
and operating loss of
$39.4 million
from VWR.
The following table presents unaudited supplemental pro forma financial information as if the VWR acquisition had occurred on January 1, 2016:
|
(in millions)
|
Year ended December 31, 2017
|
||
|
Net sales
|
$
|
5,398.7
|
|
|
Net loss
|
(120.8
|
)
|
|
The pro forma financial information presented above has been prepared by combining our historical results and the historical results of VWR and further reflects the effect of purchase accounting adjustments. These results do not purport to be indicative of the results of operations which actually would have resulted had the acquisitions occurred on the date indicated above, or that may result in the future, and does not reflect potential synergies.
Other
Except for their impact on investing cash flows, no other business combinations nor their related costs were material individually or in the aggregate.
|
21
.
|
Financial instruments and fair value measurements
|
Our financial instruments include cash and cash equivalents, accounts receivable, accounts payable, debt, contingent consideration arrangements and derivatives.
F-58
Assets and liabilities for which fair value is only disclosed
The carrying amount of cash and cash equivalents was the same as its fair value and is a level 1 measurement. The carrying amounts for trade accounts receivable and accounts payable approximated fair value due to their short-term nature and are level 2 measurements.
The following table presents the gross amounts, which exclude unamortized deferred financing costs, and the fair values of debt instruments:
|
(in millions)
|
December 31, 2019
|
December 31, 2018
|
|||||||||||||
|
Gross amount
|
Fair value
|
Gross amount
|
Fair value
|
||||||||||||
|
Receivables facility
|
$
|
55.5
|
|
$
|
55.5
|
|
$
|
104.0
|
|
$
|
104.0
|
|
|||
|
Senior secured credit facilities:
|
|||||||||||||||
|
Euro term loans
|
391.8
|
|
397.4
|
|
1,078.0
|
|
1,063.2
|
|
|||||||
|
U.S. dollar term loans
|
677.2
|
|
685.2
|
|
1,838.9
|
|
1,786.0
|
|
|||||||
|
4.75% secured notes
|
561.2
|
|
599.7
|
|
572.5
|
|
581.2
|
|
|||||||
|
6% secured notes
|
1,500.0
|
|
1,603.2
|
|
1,500.0
|
|
1,467.8
|
|
|||||||
|
9% unsecured notes
|
2,000.0
|
|
2,241.7
|
|
2,000.0
|
|
1,998.5
|
|
|||||||
|
Finance lease liabilities
|
59.2
|
|
59.2
|
|
66.3
|
|
66.3
|
|
|||||||
|
Other
|
4.5
|
|
4.5
|
|
3.2
|
|
3.2
|
|
|||||||
|
Total
|
$
|
5,249.4
|
|
$
|
5,646.4
|
|
$
|
7,162.9
|
|
$
|
7,070.2
|
|
|||
The fair values of debt instruments are based on standard pricing models that take into account the present value of future cash flows, and in some cases private trading data, which are level 2 measurements.
Recurring fair value measurements with significant unobservable inputs
Certain of the business acquisitions we completed entitle the sellers to contingent consideration based on sales or earnings during a period of time following the acquisition.
The following table presents changes to contingent consideration liabilities:
|
(in millions)
|
Year ended December 31,
|
||||||
|
2019
|
2018
|
||||||
|
Beginning balance
|
$
|
4.4
|
|
$
|
25.7
|
|
|
|
Acquisitions
|
—
|
|
—
|
|
|||
|
Changes to estimated fair value
|
—
|
|
1.5
|
|
|||
|
Cash payments
|
(4.6
|
)
|
(22.4
|
)
|
|||
|
Currency translation
|
0.2
|
|
(0.4
|
)
|
|||
|
Ending balance
|
$
|
—
|
|
$
|
4.4
|
|
|
F-59
We estimated the fair value of contingent consideration on a recurring basis using the average of probability-weighted potential payments specified in the purchase agreements, which were level 3 measurements. Changes to the estimated fair value were recorded as earnings within selling, general and administrative expenses. The significant assumptions used in these calculations include forecasted results and the estimated likelihood for each performance scenario.
Derivatives and hedging activities
We engage in hedging activities to reduce our exposure to foreign currency exchange rates. Our hedging activities are designed to manage specific risks according to our strategies, as summarized below, which may change from time to time. Our hedging activities consist of the following:
|
•
|
Hedges of forecasted debt extinguishment
— In 2017, we entered into foreign currency forward contracts to partially hedge foreign currency risks associated with the anticipated repayment of VWR’s euro-denominated debt in connection with our acquisition of VWR;
|
|
•
|
Economic hedges
— We experience foreign currency exchange rate effects on our euro-denominated term loans and notes that move oppositely from a portfolio of euro-denominated intercompany loans. The currency effects for these non-derivative instruments are recorded through earnings in the period of change and significantly offset one another; and
|
|
•
|
Other hedging activities
— Some of our subsidiaries hedge short-term foreign-denominated business transactions and intercompany financing transactions using foreign currency forward contracts. These activities were not material to our consolidated financial statements.
|
Hedge of forecasted debt extinguishment
From August to November 2017, we entered into a series of foreign currency forward contracts with Goldman Sachs as previously described. None of these contracts were designated as hedges, so no amounts were deferred to AOCI. All of the contracts were settled in 2017.
The following table presents the classification and the amount of gain recognized in earnings:
|
(in millions)
|
Income statement classification
|
Year ended December 31, 2017
|
|||
|
Foreign currency forward contracts
|
Other income or expense, net
|
$
|
9.6
|
|
|
F-60
|
22
.
|
Leases
|
The following table presents lease assets and liabilities and their balance sheet classification:
|
(in millions)
|
Classification
|
December 31, 2019
|
|||
|
Operating leases:
|
|||||
|
Lease assets
|
Other assets
|
$
|
132.3
|
|
|
|
Current portion of liabilities
|
Other current liabilities
|
33.1
|
|
||
|
Liabilities, net of current portion
|
Other liabilities
|
106.6
|
|
||
|
Finance leases:
|
|||||
|
Lease assets
|
Property, plant and equipment, net
|
53.6
|
|
||
|
Current portion of liabilities
|
Current portion of debt
|
2.8
|
|
||
|
Liabilities, net of current portion
|
Debt, net of current portion
|
56.4
|
|
||
The following tables present information about lease expense:
|
(in millions)
|
Year ended December 31,
|
||||||||||
|
2019
|
2018
|
2017
|
|||||||||
|
(1,2)
|
(3)
|
(3)
|
|||||||||
|
Operating lease expense
|
$
|
55.1
|
|
$
|
48.4
|
|
$
|
13.4
|
|
||
|
Finance lease expense
|
10.3
|
|
|||||||||
|
Total
|
$
|
65.4
|
|
||||||||
|
(1)
|
Operating lease expense for 2019 includes
$5.3 million
classified as cost of sales and
$49.8 million
classified as SG&A expenses.
|
|
(2)
|
Finance lease expense consists primarily of amortization of finance lease assets that is classified as SG&A expenses.
|
|
(3)
|
Operating lease expense for 2018 and 2017 is presented in accordance with the prior lease accounting standard, see note
3
.
|
|
December 31, 2019
|
||
|
Weighted average remaining lease term:
|
||
|
Operating leases
|
5.3 years
|
|
|
Finance leases
|
16.5 years
|
|
|
Weighted average discount rate:
|
||
|
Operating leases
|
5.3
|
%
|
|
Finance leases
|
8.3
|
%
|
F-61
The following table presents future payments due under leases reconciled to lease liabilities:
|
(in millions)
|
December 31, 2019
|
||||||
|
Operating leases
|
Finance leases
|
||||||
|
2020
|
$
|
39.1
|
|
$
|
7.8
|
|
|
|
2021
|
34.4
|
|
6.8
|
|
|||
|
2022
|
27.3
|
|
6.0
|
|
|||
|
2023
|
23.2
|
|
5.5
|
|
|||
|
2024
|
17.6
|
|
5.5
|
|
|||
|
Thereafter
|
18.4
|
|
87.1
|
|
|||
|
Total undiscounted lease payments
|
160.0
|
|
118.7
|
|
|||
|
Difference between undiscounted and discounted lease payments
|
(20.3
|
)
|
(59.5
|
)
|
|||
|
Lease liabilities
|
$
|
139.7
|
|
$
|
59.2
|
|
|
The following table presents future payments under leases at December 31, 2018, the last balance sheet presented under the prior lease accounting standard:
|
(in millions)
|
December 31, 2018
|
||||||
|
Operating leases
|
Finance leases
|
||||||
|
2019
|
$
|
44.2
|
|
$
|
9.2
|
|
|
|
2020
|
34.1
|
|
8.0
|
|
|||
|
2021
|
29.2
|
|
7.1
|
|
|||
|
2022
|
25.7
|
|
6.3
|
|
|||
|
2023
|
20.9
|
|
5.4
|
|
|||
|
Thereafter
|
58.9
|
|
92.5
|
|
|||
|
Total payments
|
$
|
213.0
|
|
128.5
|
|
||
|
Imputed interest
|
(62.2
|
)
|
|||||
|
Present value of payments
|
$
|
66.3
|
|
||||
|
23
.
|
Related party disclosures
|
Related parties include our owners, directors, executive management and other parties that can exert influence on us. Transactions with related parties cannot be presumed to be carried out on an arm’s-length basis. Related party transactions exclude transactions eliminated in consolidation, compensation arrangements and other transactions occurring in the ordinary course of business.
F-62
The following table presents information about related parties during the periods presented:
|
Became related party
|
Ceased to be related party
|
||
|
New Mountain Capital
|
August 2010
|
ongoing
|
|
|
Goldman Sachs
|
November 2017
|
ongoing
|
|
|
NuSil Investors
|
September 2016
|
November 2017
|
|
|
PSP Investments
|
November 2017
|
May 2019
|
|
New Mountain Capital
New Mountain Capital became a related party in 2010 when they became our parent. They no longer have a controlling interest in us but continue to hold more than 10% of our common stock.
Through the date of our IPO, we were party to advisory agreements with New Mountain Capital. Under those agreements, we were required to pay New Mountain Capital (i) an annual advisory fee of
$1.0 million
; (ii) a fee equal to
2%
of the value of any acquisitions or financing transactions greater than a certain amount; and (iii) reimbursement of certain immaterial out-of-pocket expenses. The advisory agreement automatically terminated in connection with our IPO, with no transaction fee paid for the offering and no advisory fees paid in 2019.
The following table presents the expense we incurred under the advisory agreements:
|
(in millions)
|
Year ended December 31,
|
||||||
|
2018
|
2017
|
||||||
|
Annual advisory fees
|
$
|
1.0
|
|
$
|
1.0
|
|
|
|
Transaction fees:
|
|||||||
|
VWR acquisition
|
—
|
|
180.0
|
|
|||
|
Debt refinancings
|
—
|
|
12.5
|
|
|||
|
Total
|
$
|
1.0
|
|
$
|
193.5
|
|
|
Additionally, we paid New Mountain Capital distributions of
$1,278.9 million
in 2017. No distributions were paid to New Mountain Capital in 2018 or 2019.
Goldman Sachs
Goldman Sachs became a related party in 2017 in connection with our acquisition of VWR when they obtained control of more than 10% of our common stock.
Since 2017, Goldman Sachs has served as administrative agent of our senior secured credit facilities and a lender under our revolving credit facility. Fees and interest paid to Goldman Sachs have not been material to date.
F-63
In 2019, Goldman Sachs acted as co-lead book-running manager for our IPO. In exchange for these services, Goldman Sachs received an aggregate underwriter discount of
$24.5 million
. Goldman Sachs purchased shares of common stock in the IPO valued at
$70.0 million
. Goldman Sachs also received proceeds of
$429.5 million
upon the redemption of our series A preferred stock and from repayment of term loans held under our senior secured credit facilities. Goldman Sachs also executed our June 2019 debt repricing for which they did not receive any material fees. As of
December 31, 2019
, Goldman Sachs held
$4.6 million
of term loans under our senior secured credit facilities.
In 2018, Goldman Sachs executed our November debt repricing for an immaterial fee.
In 2017 near the time of the VWR acquisition, we engaged Goldman Sachs in two capacities:
|
•
|
Goldman Sachs served as our financial advisor for the VWR acquisition and the financial structuring to fund the acquisition. For the financial advisory and structuring services provided, Goldman Sachs was paid fees totaling
$165.0 million
. We also agreed to offer Goldman Sachs the right to act as (i) a lead book-running manager in the event of a future initial public offering or (ii) a financial advisor in the case of another type of sale or disposition. In accordance with that arrangement, we offered, and Goldman Sachs accepted our offer, to become a co-lead book-running manager for the initial public offering described in note
14
.
|
|
•
|
Goldman Sachs acted as placement agent, initial purchaser and joint lead arranger, joint book runner and administrative agent in connection with the issuance of our junior convertible preferred stock, our series A preferred stock and our secured and unsecured notes as well as with the establishment of our senior secured credit facilities, respectively. For these services, Goldman Sachs was paid underwriting, commitment, placement and other fees of
$88.5 million
.
|
In 2017 prior to the VWR acquisition, we entered into a series of foreign currency forward contracts with Goldman Sachs as described further in note
21
. We settled all of those contracts and realized an aggregate gain of
$9.6 million
in 2017.
NuSil Investors
The NuSil Investors became a related party in September 2016 in connection with our merger with NuSil because they held more than 10% of our common stock. They ceased to be a related party in November 2017 when their ownership was diluted below 10% in connection with the legal entity restructuring for the VWR acquisition.
The NuSil Investors sponsored two of our stock-based compensation plans described in note
17
. We did not engage in any other transactions with the NuSil Investors outside of the legal entity restructurings and distributions.
F-64
PSP Investments
PSP Investments became a related party in November 2017 in connection with the financing for the VWR acquisition because it controlled one of our board seats.
In 2019, following the IPO, PSP Investments received proceeds of
$302.5 million
upon redemption of our series A preferred stock and ceased to be a related party once it lost control of its board seat.
In 2017, we paid legal fees of
$0.6 million
on behalf of PSP Investments related to the financial structuring to fund the VWR acquisition.
|
24
.
|
Unaudited quarterly financial information
|
|
(in millions, except per share information)
|
First quarter
|
Second quarter
|
Third quarter
|
Fourth quarter
|
|||||||||||
|
Year ended December 31, 2019:
|
(1,2)
|
(3)
|
|||||||||||||
|
Net sales
|
$
|
1,480.1
|
|
$
|
1,532.4
|
|
$
|
1,503.8
|
|
$
|
1,524.0
|
|
|||
|
Gross profit
|
475.2
|
|
491.1
|
|
474.0
|
|
480.4
|
|
|||||||
|
Net (loss) income
|
(6.2
|
)
|
(48.7
|
)
|
22.1
|
|
70.6
|
|
|||||||
|
Net (loss) income available to common stockholders
|
(78.0
|
)
|
(317.3
|
)
|
5.7
|
|
54.5
|
|
|||||||
|
(Loss) earnings per share:
|
|||||||||||||||
|
Basic
|
(0.59
|
)
|
(0.98
|
)
|
0.01
|
|
0.10
|
|
|||||||
|
Diluted
|
(0.59
|
)
|
(0.98
|
)
|
0.01
|
|
0.09
|
|
|||||||
|
Year ended December 31, 2018:
|
|||||||||||||||
|
Net sales
|
1,418.3
|
|
1,477.9
|
|
1,494.2
|
|
1,473.9
|
|
|||||||
|
Gross profit
|
440.3
|
|
468.0
|
|
478.7
|
|
432.8
|
|
|||||||
|
Net (loss) income
|
(41.2
|
)
|
(26.9
|
)
|
34.5
|
|
(53.3
|
)
|
|||||||
|
Net loss available to common stockholders
|
(104.5
|
)
|
(93.1
|
)
|
(34.4
|
)
|
(124.4
|
)
|
|||||||
|
Loss per share:
|
|||||||||||||||
|
Basic
|
(0.79
|
)
|
(0.70
|
)
|
(0.26
|
)
|
(0.94
|
)
|
|||||||
|
Diluted
|
(0.79
|
)
|
(0.70
|
)
|
(0.26
|
)
|
(0.94
|
)
|
|||||||
|
(1)
|
Net loss, net loss available to common stockholders and loss per share in the second quarter of 2019 included: (i)
$70.2 million
of the total
$73.7 million
loss on extinguishment of debt incurred during 2019 (see note
13
); and (ii)
$26.9 million
of expense for performance-based stock options (see note
17
); which were partially offset by (iii) related income tax benefits.
|
|
(2)
|
Net loss available to common stockholders and loss per share in the second quarter of 2019 included a
$220.4 million
adjustment of series A preferred stock to redemption value (see note
14
).
|
F-65
|
(3)
|
Net income, net loss available to common stockholders and loss per share in the third quarter of 2018 included
$48.8 million
of the total
$51.0 million
benefit for 2018 to adjust the provisional accounting for U.S. tax reform legislation (see note
19
).
|
|
25
.
|
Condensed unconsolidated financial information of Avantor, Inc.
|
Pursuant to SEC regulations, the following presents condensed unconsolidated financial information of the registrant, Avantor, Inc., since November 21, 2017.
Avantor, Inc. was organized on May 3, 2017 and had no operations or holdings until the acquisition of VWR on November 21, 2017. At that time, Avantor, Inc. was added as the parent of our consolidated group in connection with our November 2017 legal entity restructuring (see note
14
). The acquisition of VWR was partially funded by the issuance of debt by Avantor, Inc.’s wholly-owned subsidiary Avantor Funding, Inc. Certain of those debt agreements prevent Avantor Funding, Inc. from paying dividends or making other payments to Avantor, Inc., subject to limited exceptions. At December 31, 2019 and 2018, substantially all of Avantor, Inc.’s net assets were subject to those restrictions.
The following condensed unconsolidated financial statements should be read in conjunction with our consolidated financial statements and notes thereto because certain applicable disclosures are provided there. In these condensed unconsolidated financial statements, all of our subsidiaries are wholly-owned for the periods presented and presented as investments of Avantor, Inc. under the equity method. Under that method, the equity interest in subsidiaries’ assets and liabilities is stated as a net noncurrent asset at historical cost on the balance sheet.
No statements of operations are included because Avantor, Inc. only had equity in the earnings or loss of its subsidiaries for the periods presented in amounts equal to our consolidated net income or loss. No statement of cash flows is presented for the year ended December 31, 2018 because Avantor Inc. had no cash activity on a stand-alone basis in that year.
F-66
Avanto
r, Inc.
Conden
sed unconsolidated balance sheets
|
(in millions)
|
December 31,
|
||||||
|
2019
|
2018
|
||||||
|
Assets
|
|||||||
|
Investment in unconsolidated subsidiaries
|
$
|
2,462.2
|
|
$
|
807.6
|
|
|
|
Total assets
|
$
|
2,462.2
|
|
$
|
807.6
|
|
|
|
Equity
|
|||||||
|
Redeemable equity:
|
|||||||
|
Series A preferred stock at redemption value, zero and 2.3 shares outstanding
|
$
|
—
|
|
$
|
2,297.3
|
|
|
|
Junior convertible preferred stock, zero and 1.7 shares outstanding
|
—
|
|
1,562.0
|
|
|||
|
Total redeemable equity
|
—
|
|
3,859.3
|
|
|||
|
Stockholders’ equity (deficit):
|
|||||||
|
Mandatory convertible preferred stock including paid-in capital, 20.7 and 0.0 shares outstanding
|
1,003.7
|
|
—
|
|
|||
|
Common stock including paid-in capital, 572.8 and 132.8 shares outstanding
|
1,748.1
|
|
(2,746.8
|
)
|
|||
|
Accumulated deficit
|
(203.7
|
)
|
(238.4
|
)
|
|||
|
Accumulated other comprehensive loss
|
(85.9
|
)
|
(66.5
|
)
|
|||
|
Total stockholders’ equity (deficit)
|
2,462.2
|
|
(3,051.7
|
)
|
|||
|
Total equity
|
$
|
2,462.2
|
|
$
|
807.6
|
|
|
Ava
ntor, Inc.
Conde
nsed unconsolidated statements of cash flows
|
(in millions)
|
Year ended December 31, 2019
|
Forty days ended December 31, 2017
|
|||||
|
Cash flows from financing activities:
|
|||||||
|
Proceeds from issuance of stock, net of issuance costs
|
$
|
4,235.6
|
|
$
|
3,049.0
|
|
|
|
Redemption of series A preferred stock
|
(2,630.9
|
)
|
—
|
|
|||
|
Payments of dividends on MCPS
|
(31.3
|
)
|
—
|
|
|||
|
Contribution to unconsolidated subsidiaries
|
(1,574.1
|
)
|
(3,049.0
|
)
|
|||
|
Other
|
0.7
|
|
—
|
|
|||
|
Net cash from financing activities
|
—
|
|
—
|
|
|||
|
Cash, cash equivalents and restricted cash at beginning of period
|
—
|
|
—
|
|
|||
|
Cash, cash equivalents and restricted cash at end of period
|
$
|
—
|
|
$
|
—
|
|
|
F-67
|
26
.
|
Valuation and qualifying accounts
|
The following table presents changes to our valuation and qualifying accounts:
|
(in millions)
|
Allowance for doubtful accounts receivable
|
Valuation allowances on deferred tax assets
|
|||||
|
Balance on December 31, 2016
|
$
|
7.3
|
|
$
|
2.8
|
|
|
|
Acquisitions
|
—
|
|
81.2
|
|
|||
|
Charged to costs and expenses
|
0.8
|
|
99.9
|
|
|||
|
Deductions
(1)
|
(0.9
|
)
|
—
|
|
|||
|
Currency translation
|
0.1
|
|
—
|
|
|||
|
Balance on December 31, 2017
|
7.3
|
|
183.9
|
|
|||
|
Charged to costs and expenses
|
3.6
|
|
18.8
|
|
|||
|
Other additions
(1)
|
0.6
|
|
—
|
|
|||
|
Currency translation
|
(0.6
|
)
|
(4.9
|
)
|
|||
|
Balance on December 31, 2018
|
10.9
|
|
197.8
|
|
|||
|
Charged to costs and expenses
|
5.9
|
|
—
|
|
|||
|
Other additions
(1)
|
2.0
|
|
—
|
|
|||
|
Deductions
|
—
|
|
(0.5
|
)
|
|||
|
Currency translation
|
(0.2
|
)
|
(3.4
|
)
|
|||
|
Balance on December 31, 2019
|
$
|
18.6
|
|
$
|
193.9
|
|
|
|
(1)
|
For the allowance for doubtful accounts, deductions represent bad debts charged off, net of recoveries, and other additions represent recoveries, net of bad debts charged off.
|
F-68
TABLE OF CONTENTS
Part IItem 1. BusinessItem 1A. Risk FactorsItem 1B. Unresolved Staff CommentsItem 2. PropertiesItem 3. Legal ProceedingsItem 4. Mine Safety DisclosuresPart IIItem 5. Market For Registrant S Common Equity, Related Stockholder Matters and Issuer Purchases Of Equity SecuritiesItem 6. Selected Financial DataItem 7. Management S Discussion and Analysis Of Financial Condition and Results Of OperationsItem 7A. Quantitative and Qualitative Disclosures About Market RiskItem 8. Financial Statements and Supplementary DataItem 9. Changes in and Disagreements with Accountants on Accounting and Financial DisclosureItem 9A. Control and ProceduresItem 9B. Other InformationPart IIIItem 10. Directors, Executive Officers and Corporate GovernanceItem 11. Executive CompensationItem 12. Security Ownership Of Certain Beneficial Owners and Management and Related Stockholder MattersItem 13. Certain Relationships and Related Transactions, and Director IndependenceItem 14. Principal Accounting Fees and ServicesPart IVItem 15. Exhibits, Financial Statement SchedulesItem 16. Form 10-k Summary