AVALO THERAPEUTICS, INC.
10-Ks and 10-Qs
|
|
|
|
|
|
|
|
|
|
|
|
|
|
|
|
|
|
|
|
|
|
|
|
|
|
|
|
|
|
|
|
|
|
|
|
|
|
|
|
|
UNITED STATES
SECURITIES AND EXCHANGE COMMISSION
Washington, DC 20549
FORM 10‑Q
|
þ
|
QUARTERLY REPORT PURSUANT TO SECTION 13 OR 15(d) OF THE SECURITIES EXCHANGE ACT OF 1934
|
|
for the quarterly period ended March 31, 2020
|
|
|
OR
|
|
|
☐
|
TRANSITION REPORT PURSUANT TO SECTION 13 OR 15(d) OF THE SECURITIES EXCHANGE ACT OF 1934
|
COMMISSION FILE NUMBER: 001-37590
CERECOR INC.
(Exact name of registrant as specified in its charter)
|
Delaware
(State of incorporation)
|
45-0705648
(I.R.S. Employer Identification No.)
|
|
540 Gaither Road, Suite 400
Rockville, Maryland 20850
(Address of principal executive offices)
|
(410) 522‑8707
(Registrant’s telephone number,
including area code)
|
Securities registered pursuant to Section 12(b) of the Act:
|
Title of each class
|
Trading Symbol
|
Name of each exchange on which registered
|
|
Common Stock, $0.001 par value
|
CERC
|
Nasdaq Capital Market
|
Indicate by check mark whether the registrant (1) has filed all reports required to be filed by Section 13 or 15(d) of the Securities Exchange Act of 1934 during the preceding 12 months (or for such shorter period that the registrant was required to file such reports), and (2) has been subject to such filing requirements for the past 90 days. Yes
þ
No ☐
Indicate by check mark whether the registrant has submitted electronically every Interactive Data File required to be submitted pursuant to Rule 405 of Regulation S‑T (§232.405 of this chapter) during the preceding 12 months (or for such shorter period that the registrant was required to submit such files). Yes
þ
No ☐
Indicate by check mark whether the registrant is a large accelerated filer, an accelerated filer, a non‑accelerated filer, a smaller reporting company, or an emerging growth company. See the definitions of “large accelerated filer,” “accelerated filer,” “smaller reporting company,” and "emerging growth company" in Rule 12b‑2 of the Exchange Act.
|
Large accelerated filer
¨
|
Accelerated filer
þ
|
|
|
Non-accelerated filer
¨
|
Smaller reporting company
þ
|
|
|
Emerging growth company
þ
|
||
If an emerging growth company, indicate by check mark if the registrant has elected not to use the extended transition period for complying with any new or revised financial accounting standards provided pursuant to Section 13(a) of the Exchange Act.
þ
Indicate by check mark whether the registrant is a shell company (as defined in Rule 12b‑2 of the Exchange Act). Yes
¨
No
þ
As of May 4, 2020, the registrant had 59,606,018 shares of common stock outstanding.
CERECOR INC.
FORM 10-Q
For the Quarter Ended
March 31, 2020
TABLE OF CONTENTS
|
|
|
|
|
|
|
|
|
|
|
|
|
Page
|
|
|
|
|
|
||
|
|
|
||||
|
|
|
|
|
|
|
|
|
|
|
|||
|
|
|
|
|
|
|
|
|
|
a)
|
|
||
|
|
|
|
|
|
|
|
|
|
b)
|
|
||
|
|
|
|
|
|
|
|
|
|
c)
|
|
||
|
d)
|
|||||
|
|
|
|
|
||
|
|
|
e)
|
|
||
|
|
|
|
|
|
|
|
|
|
||||
|
|
|
|
|
|
|
|
|
|
||||
|
|
|
|
|
|
|
|
|
|
||||
|
|
|||||
|
|
|
|
|
|
|
|
|
|
||||
|
|
|
|
|
|
|
|
|
|
||||
|
|
|
||||
|
|
|
|
|
||
|
|
|
||||
2
PART I - FINANCIAL INFORMATION
Item 1. Financial Statements.
CERECOR INC. and SUBSIDIARIES
Condensed Consolidated Balance Sheets
|
March 31, 2020
|
December 31, 2019
|
|||||||
|
(unaudited)
|
||||||||
|
Assets
|
|
|
||||||
|
Current assets:
|
|
|
||||||
|
Cash and cash equivalents
|
$
|
5,659,384
|
|
$
|
3,609,438
|
|
||
|
Accounts receivable, net
|
2,194,983
|
|
1,001,645
|
|
||||
|
Other receivables
|
2,063,981
|
|
4,240,572
|
|
||||
|
Inventory, net
|
16,276
|
|
21,334
|
|
||||
|
Prepaid expenses and other current assets
|
777,442
|
|
706,968
|
|
||||
|
Restricted cash, current portion
|
64,643
|
|
17,535
|
|
||||
|
Investment in Aytu
|
14,708,768
|
|
7,628,947
|
|
||||
|
Current assets of discontinued operations
|
—
|
|
497,577
|
|
||||
|
Total current assets
|
25,485,477
|
|
17,724,016
|
|
||||
|
Property and equipment, net
|
1,416,832
|
|
1,447,663
|
|
||||
|
Intangible assets, net
|
2,695,675
|
|
2,426,258
|
|
||||
|
Goodwill
|
14,409,088
|
|
14,409,088
|
|
||||
|
Restricted cash, net of current portion
|
112,549
|
|
101,945
|
|
||||
|
Total assets
|
$
|
44,119,621
|
|
$
|
36,108,970
|
|
||
|
Liabilities and stockholders’ equity
|
|
|
||||||
|
Current liabilities:
|
|
|
||||||
|
Accounts payable
|
$
|
2,725,998
|
|
$
|
2,077,524
|
|
||
|
Accrued expenses and other current liabilities
|
6,194,205
|
|
5,640,252
|
|
||||
|
Income taxes payable
|
—
|
|
551,671
|
|
||||
|
Current liabilities of discontinued operations
|
6,409,668
|
|
3,891,012
|
|
||||
|
Total current liabilities
|
15,329,871
|
|
12,160,459
|
|
||||
|
Royalty obligation
|
2,000,000
|
|
—
|
|
||||
|
Deferred tax liability, net
|
106,701
|
|
85,981
|
|
||||
|
Other long-term liabilities
|
1,094,307
|
|
1,111,965
|
|
||||
|
Long-term liabilities of discontinued operations
|
—
|
|
1,755,000
|
|
||||
|
Total liabilities
|
18,530,879
|
|
15,113,405
|
|
||||
|
Stockholders’ equity:
|
|
|
||||||
|
Common stock—$0.001 par value; 200,000,000 shares authorized at March 31, 2020 and December 31, 2019; 59,560,252 and 44,384,222 shares issued and outstanding at March 31, 2020 and December 31, 2019, respectively
|
59,560
|
|
44,384
|
|
||||
|
Preferred stock—$0.001 par value; 5,000,000 shares authorized at March 31, 2020 and December 31, 2019; 1,257,143 and 2,857,143 shares issued and outstanding at March 31, 2020 and December 31, 2019, respectively
|
1,257
|
|
2,857
|
|
||||
|
Additional paid-in capital
|
160,935,648
|
|
135,238,941
|
|
||||
|
Accumulated deficit
|
(135,407,723
|
)
|
(114,290,617
|
)
|
||||
|
Total stockholders’ equity
|
25,588,742
|
|
20,995,565
|
|
||||
|
Total liabilities and stockholders’ equity
|
$
|
44,119,621
|
|
$
|
36,108,970
|
|
||
See accompanying notes to the unaudited condensed consolidated financial statements.
3
CERECOR INC. and SUBSIDIARIES
Condensed Consolidated Statements of Operations (Unaudited)
|
Three Months Ended
|
||||||||
|
|
March 31,
|
|||||||
|
|
2020
|
2019
|
||||||
|
Revenues:
|
||||||||
|
Product revenue, net
|
$
|
2,753,865
|
|
$
|
2,576,369
|
|
||
|
Total revenues, net
|
2,753,865
|
|
2,576,369
|
|
||||
|
Operating expenses:
|
||||||||
|
Cost of product sales
|
66,558
|
|
752,548
|
|
||||
|
Research and development
|
4,767,750
|
|
3,401,189
|
|
||||
|
Acquired in-process research and development
|
25,549,344
|
|
—
|
|
||||
|
General and administrative
|
2,675,613
|
|
2,675,610
|
|
||||
|
Sales and marketing
|
676,527
|
|
396,276
|
|
||||
|
Amortization expense
|
430,583
|
|
334,748
|
|
||||
|
Change in fair value of contingent consideration
|
—
|
|
20,940
|
|
||||
|
Total operating expenses
|
34,166,375
|
|
7,581,311
|
|
||||
|
Loss from continuing operations
|
(31,412,510
|
)
|
(5,004,942
|
)
|
||||
|
Other income (expense):
|
||||||||
|
Change in fair value of Investment in Aytu
|
7,079,821
|
|
—
|
|
||||
|
Change in fair value of warrant liability and unit purchase option liability
|
11,280
|
|
(47,577
|
)
|
||||
|
Other expense, net
|
—
|
|
(9,400
|
)
|
||||
|
Interest income, net
|
9,790
|
|
30,217
|
|
||||
|
Total other income (expense), net from continuing operations
|
7,100,891
|
|
(26,760
|
)
|
||||
|
Loss from continuing operations before taxes
|
(24,311,619
|
)
|
(5,031,702
|
)
|
||||
|
Income tax (benefit) expense
|
(2,156,855
|
)
|
130,672
|
|
||||
|
Loss from continuing operations
|
$
|
(22,154,764
|
)
|
$
|
(5,162,374
|
)
|
||
|
Income (loss) from discontinued operations, net of tax
|
1,037,658
|
|
(2,291,674
|
)
|
||||
|
Net loss
|
$
|
(21,117,106
|
)
|
$
|
(7,454,048
|
)
|
||
|
Net (loss) income per share of common stock, basic and diluted:
|
||||||||
|
Continuing operations
|
$
|
(0.36
|
)
|
$
|
(0.09
|
)
|
||
|
Discontinued operations
|
0.02
|
|
(0.04
|
)
|
||||
|
Net loss per share of common stock, basic and diluted
|
$
|
(0.34
|
)
|
$
|
(0.13
|
)
|
||
|
Net (loss) income per share of preferred stock, basic and diluted:
|
||||||||
|
Continuing operations
|
$
|
(1.78
|
)
|
$
|
(0.46
|
)
|
||
|
Discontinued operations
|
0.08
|
|
(0.21
|
)
|
||||
|
Net loss per share of preferred stock, basic and diluted
|
$
|
(1.70
|
)
|
$
|
(0.67
|
)
|
||
See accompanying notes to the unaudited condensed consolidated financial statements.
4
CERECOR INC. and SUBSIDIARIES
Condensed Consolidated Statements of Cash Flows (Unaudited)
|
|
Three Months Ended March 31,
|
|||||||
|
|
2020
|
2019
|
||||||
|
Operating activities
|
|
|
||||||
|
Net loss
|
$
|
(21,117,106
|
)
|
$
|
(7,454,048
|
)
|
||
|
Adjustments to reconcile net loss used in operating activities:
|
||||||||
|
Depreciation and amortization
|
453,016
|
|
1,098,478
|
|
||||
|
Stock-based compensation
|
1,116,323
|
|
596,693
|
|
||||
|
Acquired in-process research and development, including transaction costs
|
25,549,344
|
|
—
|
|
||||
|
Deferred taxes
|
20,720
|
|
5,941
|
|
||||
|
Amortization of inventory fair value associated with acquisition of TRx and Avadel's pediatric products
|
—
|
|
22,603
|
|
||||
|
Change in fair value of Investment in Aytu
|
(7,079,821
|
)
|
—
|
|
||||
|
Change in fair value of warrant liability and unit purchase option liability
|
(11,280
|
)
|
47,577
|
|
||||
|
Change in value of Guarantee
|
(1,755,000
|
)
|
—
|
|
||||
|
Change in fair value of contingent consideration
|
—
|
|
180,402
|
|
||||
|
Other
|
—
|
|
21,412
|
|
||||
|
Changes in assets and liabilities:
|
||||||||
|
Accounts receivable, net
|
(695,761
|
)
|
439,159
|
|
||||
|
Other receivables
|
(1,962,812
|
)
|
(62,014
|
)
|
||||
|
Inventory, net
|
5,058
|
|
41,195
|
|
||||
|
Prepaid expenses and other assets
|
22,676
|
|
281,051
|
|
||||
|
Accounts payable
|
250,970
|
|
(196,671
|
)
|
||||
|
Income taxes payable
|
(551,671
|
)
|
(217,608
|
)
|
||||
|
Accrued expenses and other liabilities
|
(141,873
|
)
|
2,074,278
|
|
||||
|
Lease liability, net
|
157,143
|
|
—
|
|
||||
|
Net cash used in operating activities
|
(5,740,074
|
)
|
(3,121,552
|
)
|
||||
|
Investing activities
|
|
|
||||||
|
Net cash paid in merger with Aevi
|
(1,250,650
|
)
|
—
|
|
||||
|
Purchase of property and equipment
|
—
|
|
(165,969
|
)
|
||||
|
Net cash used in investing activities
|
(1,250,650
|
)
|
(165,969
|
)
|
||||
|
Financing activities
|
|
|
||||||
|
Proceeds from exercise of stock options and warrants
|
74,207
|
|
94,177
|
|
||||
|
Proceeds from registered direct offering, net
|
5,136,184
|
|
—
|
|
||||
|
Proceeds from sale of shares pursuant to common stock private placement, net
|
3,887,991
|
|
—
|
|
||||
|
Proceeds from underwritten public offering, net
|
—
|
|
8,975,960
|
|
||||
|
Payment of contingent consideration
|
—
|
|
(228,678
|
)
|
||||
|
Payment of long-term debt
|
—
|
|
(24,342
|
)
|
||||
|
Net cash provided by financing activities
|
9,098,382
|
|
8,817,117
|
|
||||
|
Increase in cash, cash equivalents and restricted cash
|
2,107,658
|
|
5,529,596
|
|
||||
|
Cash, cash equivalents, and restricted cash at beginning of period
|
3,728,918
|
|
10,746,756
|
|
||||
|
Cash, cash equivalents, and restricted cash at end of period
|
$
|
5,836,576
|
|
$
|
16,276,352
|
|
||
|
Supplemental disclosures of cash flow information
|
|
|
||||||
|
Cash paid for interest
|
$
|
—
|
|
$
|
262,500
|
|
||
|
Cash paid for taxes
|
$
|
316,000
|
|
$
|
378,025
|
|
||
|
Supplemental disclosures of non-cash activities
|
||||||||
|
Issuance of common stock in Aevi Merger
|
$
|
15,495,578
|
|
$
|
—
|
|
||
|
Leased asset obtained in exchange for new operating lease liability
|
$
|
—
|
|
$
|
743,025
|
|
||
5
The following table provides a reconciliation of cash, cash equivalents and restricted cash reported within the condensed consolidated balance sheets that sum to the total of the same such amounts shown in the condensed consolidated statements of cash flows:
|
March 31,
|
||||||||
|
2020
|
2019
|
|||||||
|
Cash and cash equivalents
|
$
|
5,659,384
|
|
$
|
16,121,388
|
|
||
|
Restricted cash, current
|
64,643
|
|
77,846
|
|
||||
|
Restricted cash, non-current
|
112,549
|
|
77,118
|
|
||||
|
Total cash, cash equivalents and restricted cash
|
$
|
5,836,576
|
|
$
|
16,276,352
|
|
||
See accompanying notes to the unaudited condensed consolidated financial statements.
6
CERECOR INC. and SUBSIDIARIES
Condensed Consolidated Statements of Changes in Stockholders’ Equity (Unaudited)
|
|
Common stock
|
Preferred Stock
|
Additional paid‑in
|
Accumulated
|
Total stockholders’
|
||||||||||||||||||||
|
|
Shares
|
Amount
|
Shares
|
Amount
|
capital
|
deficit
|
equity
|
||||||||||||||||||
|
Three Months Ended March 31, 2019
|
|||||||||||||||||||||||||
|
Balance, December 31, 2018
|
40,804,189
|
|
$
|
40,804
|
|
2,857,143
|
|
$
|
2,857
|
|
$
|
119,082,157
|
|
$
|
(98,218,070
|
)
|
$
|
20,907,748
|
|
||||||
|
Issuance of shares of common stock in underwritten public offering, net of offering costs
|
1,818,182
|
|
1,818
|
|
—
|
|
8,974,142
|
|
—
|
|
8,975,960
|
|
|||||||||||||
|
Exercise of stock options and warrants
|
31,288
|
|
31
|
|
—
|
|
94,146
|
|
—
|
|
94,177
|
|
|||||||||||||
|
Stock-based compensation
|
—
|
|
—
|
|
596,693
|
|
—
|
|
596,693
|
|
|||||||||||||||
|
Restricted Stock Units vested during period
|
100,000
|
|
101
|
|
—
|
|
(101
|
)
|
—
|
|
—
|
|
|||||||||||||
|
Net loss
|
—
|
|
—
|
|
—
|
|
(7,454,048
|
)
|
(7,454,048
|
)
|
|||||||||||||||
|
Balance, March 31, 2019
|
42,753,659
|
|
$
|
42,754
|
|
2,857,143
|
|
$
|
2,857
|
|
$
|
128,747,037
|
|
$
|
(105,672,118
|
)
|
$
|
23,120,530
|
|
||||||
|
Three Months Ended March 31, 2020
|
|||||||||||||||||||||||||
|
Balance, December 31, 2019
|
44,384,222
|
|
$
|
44,384
|
|
2,857,143
|
|
$
|
2,857
|
|
$
|
135,238,941
|
|
$
|
(114,290,617
|
)
|
$
|
20,995,565
|
|
||||||
|
Conversion of preferred stock to common stock
|
8,000,000
|
|
8,000
|
|
(1,600,000
|
)
|
(1,600
|
)
|
(6,400
|
)
|
—
|
|
—
|
|
|||||||||||
|
Issuance of shares related to Aevi Merger
|
3,893,361
|
|
3,894
|
|
—
|
|
15,491,684
|
|
—
|
|
15,495,578
|
|
|||||||||||||
|
Issuance of shares pursuant to registered direct offering, net of offering costs
|
1,306,282
|
|
1,306
|
|
—
|
|
5,134,878
|
|
—
|
|
5,136,184
|
|
|||||||||||||
|
Issuance of shares pursuant to common stock private placement, net of offering costs
|
1,951,219
|
|
1,951
|
|
—
|
|
3,886,040
|
|
—
|
|
3,887,991
|
|
|||||||||||||
|
Exercise of stock options and warrants
|
25,168
|
|
25
|
|
—
|
|
74,182
|
|
—
|
|
74,207
|
|
|||||||||||||
|
Stock-based compensation
|
—
|
|
—
|
|
1,116,323
|
|
—
|
|
1,116,323
|
|
|||||||||||||||
|
Net loss
|
—
|
|
—
|
|
—
|
|
(21,117,106
|
)
|
(21,117,106
|
)
|
|||||||||||||||
|
Balance, March 31, 2020
|
59,560,252
|
|
$
|
59,560
|
|
1,257,143
|
|
$
|
1,257
|
|
$
|
160,935,648
|
|
$
|
(135,407,723
|
)
|
$
|
25,588,742
|
|
||||||
See accompanying notes to the unaudited condensed consolidated financial statements.
7
CERECOR INC. and SUBSIDIARIES
Notes to Unaudited Condensed Consolidated Financial Statements
1. Business
Cerecor Inc. (the "Company" or "Cerecor") is a biopharmaceutical company focused on becoming a leader in development and commercialization of treatments for rare pediatric and orphan diseases. The Company is advancing an emerging clinical-stage pipeline of innovative therapies that address unmet patient needs within rare pediatric and orphan diseases. The Company's pediatric rare disease pipeline is led by CERC-801, CERC-802 and CERC-803 ("CERC-800 compounds"), which are therapies for inherited metabolic disorders known as Congenital Disorders of Glycosylation ("CDGs"). The U.S. Food and Drug Administration ("FDA") granted Rare Pediatric Disease Designation ("RPDD") and Orphan Drug Designation ("ODD") to all
three
CERC-800 compounds, thus potentially qualifying the Company to receive a Priority Review Voucher ("PRV") upon approval of each New Drug Application ("NDA"). Each PRV may be sold or transferred an unlimited number of times. The Company plans to leverage the 505(b)(2) NDA pathway for all
three
compounds to accelerate development and approval. Additionally, CERC-801 and CERC-802 were granted Fast Track Designation ("FTD") from the FDA, which can help facilitate and potentially expedite development of each compound.
The Company is also developing CERC-002, CERC-006 and CERC-007. CERC-007 is an anti-IL-18 monoclonal antibody being developed for the treatment of autoimmune inflammatory diseases such as Adult Onset Stills Disease ("AOSD") and Multiple Myeloma. CERC-006 is a dual mTOR inhibitor being developed for the treatment of complex Lymphatic Malformations. CERC-002 is an anti-LIGHT (
L
ymphotoxin-like, exhibits
I
nducible expression, and competes with HSV
G
lycoprotein D for
H
VEM, a receptor expressed by
T
lymphocytes) monoclonal antibody being developed for the treatment of Pediatric-onset Crohn's Disease.
The Company continues to explore strategic alternatives for its sole commercialized product, Millipred®, an oral prednisolone indicated across a wide variety of inflammatory conditions. The Company has been in discussions with Simon Pedder, a member of its Board of Directors, about potentially transferring its non-core neurology pipeline assets, CERC-301 and CERC-406, to a new company to be formed by Dr. Pedder, although it has not agreed to binding terms, and any such transaction might not happen until the third quarter of 2020, if at all.
On February 3, 2020, the Company consummated its two-step merger (the "Merger") with Aevi Genomic Medicine, Inc. ("Aevi") in accordance with the terms of the Agreement and Plan of Merger and Reorganization (the "Merger Agreement") dated December 5, 2019. The Merger consideration included stock valued at approximately
$15.5 million
, resulting in the issuance of approximately
3.9 million
shares of Cerecor common stock to Aevi stockholders, forgiveness of a
$4.1 million
loan that Cerecor loaned Aevi in December 2019 (the "Aevi Loan"), and contingent value rights ("CVRs") for up to an additional
$6.5 million
in subsequent payments based on development milestones. As part of the Merger, Cerecor acquired CERC-002, CERC-006 and CERC-007, expanding Cerecor's pipeline to six clinical stage assets being developed for rare pediatric and orphan diseases. Effective upon the consummation of the Merger, Cerecor entered into an employment agreement with Aevi CEO Mike Cola for him to serve as Cerecor's Chief Executive Officer and an employment agreement with Aevi CSO Dr. Garry Neil for him to serve as Cerecor's Chief Medical Officer, and appointed Mike Cola and Dr. Sol Barer to the Company's Board of Directors. Dr. Neil was promoted to Cerecor's Chief Scientific Officer in March 2020. See Note 6 for more information.
During the fourth quarter of 2019, the Company entered into, and closed on, an asset purchase agreement (the "Aytu Purchase Agreement") with Aytu BioScience, Inc. (“Aytu”) to sell the Company’s rights, title and interest in, assets relating to its pediatric portfolio, namely Aciphex
®
Sprinkle™, Cefaclor for Oral Suspension, Karbinal™ ER, Flexichamber™, Poly-Vi-Flor
®
and Tri-Vi-Flor™ (the "Pediatric Portfolio"), as well as the corresponding commercial infrastructure consisting of the right to offer employment to Cerecor’s sales force and the assignment of supporting commercial contracts (the "Aytu Divestiture"). Aytu paid consideration of
$4.5 million
in cash and approximately
9.8 million
shares of Aytu convertible preferred stock (the "Investment"), and assumed certain of the Company’s liabilities, including the Company’s payment obligations payable to Deerfield CSF, LLC of
$15.1 million
and other liabilities of
$11.0 million
. The Company recognized a gain of
$8.0 million
upon the closing of the Aytu Divestiture for the year ended December 31, 2019. As a result of the sale of the Pediatric Portfolio, the Pediatric Portfolio met all conditions required in order to be classified as discontinued operations. Therefore, operating results from the Pediatric Portfolio are reported within income (loss) from discontinued operations, net of tax for all periods presented. In addition, assets and liabilities related to the Pediatric Portfolio are reported as assets and liabilities of discontinued operations in the accompanying condensed consolidated balance sheets as of March 31, 2020 and December 31, 2019. See Note 3 for more information regarding the Aytu Divestiture and its accounting treatment, including the nature of the Company's involvement subsequent to the divestiture.
8
Cerecor was incorporated in 2011, commenced operations in the second quarter of 2011 and completed an initial public offering in October 2015.
Liquidity
In February 2020, the Company closed on a registered direct offering with institutional investors of
1,306,282
shares of the Company's common stock at a purchase price of
$3.98
per share. The Company's largest stockholder, Armistice Capital, LLC ("Armistice"), whose Chief Investment Officer Steve Boyd is a Cerecor director, participated in the offering by purchasing
1,256,282
shares of common stock from the Company. The net proceeds of the offering were approximately
$5.0 million
. In March 2020, the Company entered into a securities purchase agreement with Armistice pursuant to which the Company sold
1,951,219
shares of the Company’s common stock for a purchase price of
$2.05
per share, which represents the closing stock price the day prior to entering into the agreement. Net proceeds of the private placement were approximately
$3.9 million
. Additionally, in April 2020, the Company converted its shares of Aytu preferred stock that were acquired in the fourth quarter of 2019 and subsequently sold that common stock, which generated net proceeds of approximately
$12.8 million
.
In order to meet its cash flow needs, the Company applies a disciplined decision-making methodology as it evaluates the optimal allocation of the Company's resources between investing in the Company's existing pipeline assets and acquisitions or in-licensing of new assets. For the three months ended March 31, 2020, Cerecor generated a net loss of
$21.1 million
and negative cash flow from operations of
$5.7 million
. As of March 31, 2020, Cerecor had an accumulated deficit of
$135.4 million
and a balance of
$5.7 million
in cash and cash equivalents.
The accompanying condensed consolidated financial statements have been prepared assuming the Company will continue as a going concern; however, the Company expects to incur additional losses in the future in connection with research and development activities and will require additional financing to fund its operations and to continue to execute its strategy. The Company plans to use its current cash on hand, which includes the cash generated from the sale of Aytu common shares in April 2020, the anticipated cash flows from the Company's profits from Millipred product sales and/or the potential proceeds from a possible out-license or sale of Millipred to a third party to offset costs related to its pipeline assets, business development, and costs associated with its organizational infrastructure; however, Cerecor expects to continue to incur significant expenses and operating losses for the immediate future as it continues to invest in the Company's pipeline assets. The Company’s ability to continue as a going concern through 2020 is dependent upon the Company’s ability to raise additional equity and/or debt capital, sell assets and obtain government funding; however, there can be no assurance that it will be able to do so nor that such activities will generate sufficient amounts on terms acceptable to the Company.
Over the long term, the Company's ultimate ability to achieve and maintain profitability will be dependent on, among other things, the development, regulatory approval, and commercialization of its pipeline assets, and the potential sale of any PRVs it receives, in order to support its cost structure and pipeline asset development.
These conditions raise substantial doubt about the Company’s ability to continue as a going concern within one year after the date that the financial statements are issued. To alleviate these conditions, the Company monetized its investment in Aytu generating net proceeds of
$12.8 million
in April 2020 and is evaluating the potential out-licensing or sale of Millipred, its non-core neurology pipeline assets and/or some combination of rights to future PRV sales, equity or debt financings, collaborations, other out-licensing arrangements, strategic alliances, federal and private grants, marketing, other distribution or licensing arrangements, or the sale of current or future assets. If the Company raises additional funds through collaborations, strategic alliances or licensing arrangements with third parties, the Company might have to relinquish valuable rights to its technologies, future revenue streams, research programs or product candidates. If the Company is not able to secure adequate additional funding, the Company may be forced to make reductions in spending, extend payment terms with suppliers, liquidate assets where possible or suspend or curtail planned programs. Due to the uncertainty regarding future financings and/or other potential options to raise additional funds, management has concluded that substantial doubt exists with respect to the Company’s ability to continue as a going concern within one year after the date that the financial statements are issued.
2. Basis of Presentation and Significant Accounting Policies
Basis of Presentation
The Company’s unaudited condensed consolidated financial statements have been prepared in accordance with U.S. generally accepted accounting principles (“GAAP”). Any reference in these notes to applicable guidance is meant to refer to the authoritative GAAP as found in the Accounting Standards Codification (“ASC”) and Accounting Standards Updates (“ASU”) of the Financial Accounting Standards Board (“FASB”).
9
In the opinion of management, the accompanying unaudited condensed consolidated financial statements include all adjustments, consisting of normal recurring adjustments, which are necessary to present fairly the Company’s financial position, results of operations, and cash flows. The condensed consolidated balance sheet at December 31, 2019 has been derived from audited financial statements at that date. The interim results of operations are not necessarily indicative of the results that may occur for the full fiscal year. Certain information and footnote disclosure normally included in the financial statements prepared in accordance with GAAP have been condensed or omitted pursuant to instructions, rules, and regulations prescribed by the United States Securities and Exchange Commission (“SEC”). Certain prior period amounts have been reclassified to conform to the current year presentation, as described below.
The Company believes that the disclosures provided herein are adequate to make the information presented not misleading when these unaudited condensed consolidated financial statements are read in conjunction with the
December 31, 2019
audited consolidated financial statements.
Significant Accounting Policies
During the three months ended March 31, 2020, there were no significant changes to the Company’s summary of significant accounting policies contained in the Company’s Annual Report on Form 10-K for the year ended December 31, 2019, as filed with the SEC on March 11, 2020, except for the recently adopted accounting standards described below.
Recently Adopted Accounting Pronouncements
Financial Instruments - Credit Losses
In June 2016, the FASB issued ASU No. 2016-13, “Financial Instruments - Credit Losses (Topic 326): Measurement of Credit Losses on Financial Instruments” ("ASU 2016-13"). This guidance applies to all entities and impacts how entities account for credit losses for most financial assets and other instruments. For available-for-sale debt securities, entities will be required to recognize an allowance for credit losses rather than a reduction to the carrying value of the asset. For trade receivables, loans and held-to-maturity debt securities, entities will be required to estimate lifetime expected credit losses. This guidance is effective for fiscal years beginning after December 15, 2019 and interim periods therein.
Upon adoption of the new standard on January 1, 2020, the Company began recognizing an allowance using a forward-looking approach to estimate the expected credit loss related to financial assets. The Company began monitoring the financial performance and creditworthiness of its customers so that it can properly assess and respond to changes in the customers’ credit profiles. Over
95%
of sales were generated from three major industry wholesalers for the three months ended March 31, 2020. Additionally, pursuant to the new standard, at each reporting period, the Company adjusts the Guarantee liability through earnings based on expected credit losses in accordance with Topic 326. The Company evaluated the impact of the adoption of this standard on its financial statements, concluding there was no significant impact on the Company's results of operations, financial position, cash flows or disclosures.
Fair Value Measurements
In August 2018, the FASB issued ASU No. 2018-13, "Fair Value Measurement (Topic 820): Disclosure Framework - Changes to the Disclosure Requirements for Fair Value Measurement." This new standard modifies certain disclosure requirements on fair value measurements. This new standard became effective for the Company on January 1, 2020. The Company evaluated the impact of the adoption of this new standard on its financial statements, concluding there was no significant impact.
Income Tax Simplification
In December 2019, the FASB issued ASU 2019-12, "Income Taxes (Topic 740)(ASU 2019-12)", which provides final guidance that simplifies the accounting for income taxes by eliminating certain exceptions to the guidance in ASC 740 related to the approach for intra-period tax allocation that is applicable to the Company, the methodology for calculating income taxes in an interim period and the recognition of deferred tax liabilities for outside basis differences among other changes. For public business entities, the amendments in this update are effective for fiscal years, and interim periods within those fiscal years, beginning after December 15, 2020. Early adoption of the amendments is permitted, including adoption in any interim period for public business entities for periods for which financial statements have not yet been issued. An entity that elects early adoption must adopt all the amendments in the same period. The Company elected to early adopt the ASU 2019-12 as of January 1, 2020. Management concluded that the adoption of the new standard did not have a material impact to income taxes reported on the financial statements for the three months ended March 31, 2020.
10
3. Aytu Divestiture
Overview of Sale of Pediatric Portfolio and Related Commercial Infrastructure to Aytu BioScience
On October 10, 2019, the Company entered into the Aytu Purchase Agreement to sell the Company’s rights, title and interest in, assets relating to its Pediatric Portfolio, namely Aciphex
®
Sprinkle™ , Cefaclor for Oral Suspension, Karbinal™ ER, Flexichamber™ , Poly-Vi-Flor
®
and Tri-Vi-Flor™ as well as the corresponding commercial infrastructure consisting of the right to offer employment to Cerecor’s sales force and the assignment of supporting commercial contracts. The Aytu Divestiture closed on November 1, 2019. Aytu paid consideration of
$4.5 million
in cash and approximately
9.8 million
shares of Aytu convertible preferred stock, and assumed certain of the Company’s liabilities, including the Company’s payment obligations payable to Deerfield CSF, LLC of
$15.1 million
and certain other liabilities of
$11.0 million
primarily related to contingent consideration, Medicaid rebates and sales returns. In addition, Aytu assumed future contractual obligations under existing license agreements associated with the Pediatric Portfolio. Armistice, a significant stockholder of the Company and Armistice's Chief Investment Officer, Steve Boyd, serves on each company's board of directors.
Upon closing the Aytu Divestiture, Cerecor terminated all of its sales force personnel, which included those offered employment by Aytu, as well as any remaining sales force personnel. Additionally, Cerecor retained all rights to Millipred
®
. Pursuant to a transition services agreement entered into between Aytu and Cerecor, Aytu is managing Millipred
®
commercial operations
for a monthly fee of
$12,000
for up to
18 months
or until the Company establishes an independent commercial infrastructure for the product.
Deerfield Guarantee
On November 1, 2019, in conjunction with the closing of the Aytu Divestiture, the Company entered into a Guarantee in favor of Deerfield CSF, LLC ("Deerfield"), which guarantees the payment by Aytu of the assumed liabilities to Deerfield, which includes the debt obligation ("Fixed Payment Guarantee") and the contingent consideration related to future potential royalties on Avadel's pediatric products ("Deferred Payment Guarantee"), collectively referred to as the "Guarantee". Additionally, on November 1, 2019, the Company entered into a Contribution Agreement with Armistice and Avadel that governs contribution rights and obligations of the Company, Armistice and Avadel with respect to amounts that are paid by Armistice and Avadel to Deerfield under certain guarantees made by Armistice and Avadel to Deerfield.
The debt obligation assumed by Aytu consists of fixed monthly payments to Deerfield of
$0.1 million
until January 2021 and an additional balloon payment of
$15.0 million
to Deerfield on January 31, 2021. Therefore, Cerecor's Fixed Payment Guarantee will end on January 31, 2021, upon the
$15.0 million
balloon payment being made to Deerfield. The contingent consideration assumed by Aytu consists of quarterly deferred payments equal to
15%
of net sales of certain Pediatric Portfolio paid in arrears each quarter until the earlier of (i) February 5, 2026, or (ii) when
$12.5 million
in aggregate deferred payments have been paid to Deerfield. Of the contingent consideration,
$3.2 million
was paid to Deerfield prior to the Aytu Divestiture and therefore as of November 1, 2019, Aytu was responsible for the remaining
$9.3 million
. Aytu is required to pay an amount equal to at least
$0.1 million
per month except the monthly Deferred Payment due on January 31, 2020 will be at least
$0.2 million
. Cerecor's Deferred Payment Guarantee will end upon the earlier of (i) February 5, 2026, or (ii) upon
$12.5 million
in aggregate deferred payments has been paid to Deerfield. Cerecor is required to make payment under the Guarantee upon demand by Deerfield, which Deerfield can demand at any time if all or any part of the fixed payments and/or deferred payments are not paid by Aytu when due or upon breach of a covenant. As of March 31, 2020, the maximum potential amount of future payments under the Guarantee was
$24.5 million
, consisting of
$15.9 million
for the Fixed Payment Guarantee and
$8.6 million
for the Deferred Payment Guarantee.
The fair value of the Guarantee, which relates to the Company's obligation to make future payments if Aytu defaults, was determined at the time of the divestiture as the difference between (i) the estimated fair value of the debt and contingent payments, respectively, using Cerecor's estimated cost of debt and (ii) the estimated fair value of the debt and contingent payments, respectively, using Aytu's estimated cost of debt. Subsequent to the close of the Aytu Divestiture, at each reporting period, the value of the Guarantee is determined based on the expected credit loss of the Guarantee with changes recorded in income (loss) from discontinued operations, net of tax within the consolidated statements of operations. As of March 31, 2020, Aytu's credit rating significantly improved as a result of recent developments to Aytu's business, including but not limited to, recent financings and expansion of its revenue products that substantially enhanced Aytu's cash position and its ability to meet its financial commitments. Based on these facts, management concluded that the expected credit loss of the Guarantee was de minimis as of March 31, 2020 and thus a
$1.8 million
gain on the change in value was recognized in income from discontinued operations, net of tax within the accompanying condensed consolidated statement of operations for the three months ended March 31, 2020.
Discontinued Operations
11
As a result of the sale of the Pediatric Portfolio, the operating results from the Pediatric Portfolio are reported as loss from discontinued operations, net of tax in the accompanying condensed consolidated statements of operations. Accordingly, the accompanying condensed consolidated financial statements for the three months ended March 31, 2020 and 2019 reflect the operations and related assets and liabilities of the Pediatric Portfolio as a discontinued operation.
The following tables summarizes the assets and liabilities of the discontinued operations as of March 31, 2020 and December 31, 2019:
|
|
March 31, 2020
|
December 31,
|
||||||
|
|
(unaudited)
|
2019
|
||||||
|
Assets
|
|
|
||||||
|
Current assets:
|
|
|
||||||
|
Accounts receivable, net
|
$
|
—
|
|
$
|
497,577
|
|
||
|
Total current assets of discontinued operations
|
—
|
|
497,577
|
|
||||
|
Liabilities
|
|
|
||||||
|
Current liabilities:
|
||||||||
|
Accounts payable
|
—
|
|
387,975
|
|
||||
|
Accrued expenses and other current liabilities
|
6,409,668
|
|
3,503,037
|
|
||||
|
Total current liabilities of discontinued operations
|
6,409,668
|
|
3,891,012
|
|
||||
|
Other long-term liabilities
|
—
|
|
1,755,000
|
|
||||
|
Total long-term liabilities of discontinued operations
|
—
|
|
1,755,000
|
|
||||
Subsequent to the closing of the Aytu Divestiture on November 1, 2019, Cerecor retains continuing involvement with the divested Pediatric Portfolio mainly surrounding collection of accounts receivable associated with sales of Pediatric Portfolio, future sales returns made after November 1, 2019 relating to sales of the Pediatric Portfolio prior to the close date of the Aytu Divestiture and the Deerfield Guarantee (discussed in detail above).
Pursuant to the Aytu Purchase Agreement, Aytu assumed sales returns of the Pediatric Portfolio made after the closing date of November 1, 2019 and primarily relating to sales prior to November 1, 2019 only to the extent such post-Closing sales returns exceed
$2.0 million
and are less than
$2.8 million
(in other words, Aytu will only assume
$0.8 million
of such returns). Therefore, Cerecor is liable for future sales returns of the Pediatric Portfolio sold prior to November 1, 2019 in excess of the
$0.8 million
assumed by Aytu. As of March 31, 2020, the Company estimated its sales return reserve from discontinued operations to be
$2.4 million
, which is included above in accrued expenses and other current liabilities from discontinued operations. Changes in the Company's estimate of sales returns related to the Pediatric Portfolio is included within discontinued operations on the statement of operations and is shown within product sales, net in the table summarizing the results of discontinued operations below. In future periods, as additional information becomes available to the Company, the Company expects to recognize expense (or a benefit) related to actual sales returns of the Pediatric Portfolio in excess (or less than) the returns reserve recorded as of November 1, 2019, which will be recognized within discontinued operations. The Company expects this involvement to continue until sales returns are no longer accepted on sales of the Pediatric Portfolio made prior to November 1, 2019, which, in line with the products' return policies, returns on these products may be accepted through 2023. Additionally, Cerecor and Aytu are in process of transitioning the collection of accounts receivables associated with post-divestiture sales of the divested Pediatric Portfolio from Cerecor to Aytu. Cash received by Cerecor related to post-divestiture sales is remitted to Aytu on a quarterly basis until the accounts receivable collection process is fully transitioned to Aytu. As of March 31, 2020, Cerecor accrued a
$3.9 million
liability within accrued expenses and other current liabilities related to cash it will remit to Aytu related to post-divestiture sales. The Company expects this involvement to continue until the second quarter of 2020.
The following table summarizes the results of discontinued operations for the three months ended March 31, 2020 and 2019:
12
|
|
Three Months Ended March 31,
|
|||||||
|
|
2020
|
2019
|
||||||
|
Product revenue, net
|
$
|
(717,342
|
)
|
$
|
2,835,074
|
|
||
|
Operating expenses:
|
||||||||
|
Cost of product sales
|
—
|
|
1,195,344
|
|
||||
|
General and administrative
|
—
|
|
41,374
|
|
||||
|
Sales and marketing
|
—
|
|
2,712,626
|
|
||||
|
Amortization expense
|
—
|
|
744,099
|
|
||||
|
Change in fair value of contingent consideration
|
—
|
|
159,462
|
|
||||
|
Total operating expenses
|
—
|
|
4,852,905
|
|
||||
|
Other income (expense):
|
||||||||
|
Change in value of Guarantee
|
1,755,000
|
|
—
|
|
||||
|
Interest expense, net
|
—
|
|
(238,158
|
)
|
||||
|
Total other income (expense)
|
1,755,000
|
|
(238,158
|
)
|
||||
|
Income (loss) from discontinued operations before tax
|
1,037,658
|
|
(2,255,989
|
)
|
||||
|
Income tax expense
|
—
|
|
35,685
|
|
||||
|
Income (loss) from discontinued operations, net of tax
|
$
|
1,037,658
|
|
$
|
(2,291,674
|
)
|
||
The significant non-cash operating items from the discontinued operations for the three months ended March 31, 2020 and 2019 are contained below. There were no non-cash investing items from the discontinued operations for the three months ended March 31, 2020 and 2019.
|
|
Three Months Ended March 31,
|
|||||||
|
|
2020
|
2019
|
||||||
|
Operating activities
|
||||||||
|
Amortization
|
$
|
—
|
|
$
|
744,099
|
|
||
|
Stock-based compensation, excluding amount included within gain on sale of Pediatric Portfolio
|
—
|
|
49,364
|
|
||||
|
Change in fair value of contingent consideration liability
|
—
|
|
159,462
|
|
||||
|
Change in value of Guarantee
|
(1,755,000
|
)
|
—
|
|
||||
4. Revenue from Contracts with Customers
The Company generates substantially all of its revenue from sales of prescription drugs to its customers. Revenue from sales of prescription drugs was
$2.8 million
and
$2.6 million
for the three months ended March 31, 2020 and 2019, respectively.
As is typical in the pharmaceutical industry, the Company sells its prescription drugs in the United States primarily through wholesale distributors and a specialty contracted pharmacy. Wholesale distributors account for substantially all of the Company’s net product revenues and trade receivables. In addition, the Company earns revenue from sales of its prescription drugs directly to retail pharmacies. For the three months ended March 31, 2020, the Company’s three largest customers accounted for approximately
39%
,
32%
, and
27%
of the Company's total net product revenues from sale of prescription drugs from continuing operations.
5. Net Loss Per Share
The Company computes earnings per share ("EPS") using the two-class method. The two-class method of computing EPS is an earnings allocation formula that determines EPS for common stock and any participating securities according to dividends declared and participation rights in undistributed earnings. The Company has two classes of stock outstanding, common stock and preferred stock. The preferred stock was issued in December 2018, upon Armistice exercising warrants to acquire an aggregate of
2,857,143
shares of the Series B Convertible Preferred Stock ("convertible preferred stock"). The convertible preferred stock has the same rights and preferences as the Company’s common stock, other than being non-voting, and is convertible into shares of common stock on a 1-for-
5
ratio. During the first quarter of 2020, Armistice converted
1.6 million
shares of Series B Convertible Preferred Stock into
8.0
13
million
shares of Cerecor's common stock. Under the two-class method, the convertible preferred stock is considered a separate class of stock for EPS purposes and therefore basic and diluted EPS is provided below for both common stock and preferred stock.
EPS for common stock and EPS for preferred stock is computed by dividing the sum of distributed earnings and undistributed earnings for each class of stock by the weighted average number of shares outstanding for each class of stock for the period. In applying the two-class method, undistributed earnings are allocated to common stock and preferred stock based on the weighted average shares outstanding during the period, which assumes the convertible preferred stock has been converted to common stock.
Diluted net (loss) income per share includes the potential dilutive effect of common stock equivalents as if such securities were converted or exercised during the period, when the effect is dilutive. Common stock equivalents include: (i) outstanding stock options and restricted stock units, which are included under the "treasury stock method" when dilutive; (ii) common stock to be issued upon the assumed conversion of the Company's unit purchase option (the "UPO") shares, which are included under the "if-converted method" when dilutive; and (iii) common stock to be issued upon the exercise of outstanding warrants, which are included under the "treasury stock method" when dilutive. Because the impact of these items is generally anti-dilutive during periods of net loss, there is no difference between basic and diluted loss per common share for periods with net losses. In periods of net loss, losses are allocated to the participating security only if the security has not only the right to participate in earnings, but also a contractual obligation to share in the Company's losses.
The following table sets forth the computation of basic and diluted net loss per share of common stock and preferred stock for the three
months ended March 31, 2020
and
2019
, which includes both classes of participating securities:
|
Three Months Ended
|
||||||||||||||||
|
|
March 31, 2020
|
|||||||||||||||
|
Common stock
|
Preferred stock
|
|||||||||||||||
|
Continuing Operations
|
Discontinued Operations
|
Continuing Operations
|
Discontinued Operations
|
|||||||||||||
|
Numerator:
|
||||||||||||||||
|
Allocation of undistributed net (loss) income
|
$
|
(19,204,480
|
)
|
$
|
899,476
|
|
$
|
(2,950,284
|
)
|
$
|
138,182
|
|
||||
|
Denominator:
|
||||||||||||||||
|
Weighted average shares
|
53,934,760
|
|
53,934,760
|
|
1,657,143
|
|
1,657,143
|
|
||||||||
|
Basic and diluted net (loss) income per share
|
$
|
(0.36
|
)
|
$
|
0.02
|
|
$
|
(1.78
|
)
|
$
|
0.08
|
|
||||
|
Three Months Ended
|
||||||||||||||||
|
|
March 31, 2019
|
|||||||||||||||
|
Common stock
|
Preferred stock
|
|||||||||||||||
|
Continuing Operations
|
Discontinued Operations
|
Continuing Operations
|
Discontinued Operations
|
|||||||||||||
|
Numerator:
|
||||||||||||||||
|
Allocation of undistributed net loss
|
$
|
(3,835,249
|
)
|
$
|
(1,702,538
|
)
|
$
|
(1,327,125
|
)
|
$
|
(589,136
|
)
|
||||
|
Denominator:
|
||||||||||||||||
|
Weighted average shares
|
41,284,168
|
|
41,284,168
|
|
2,857,143
|
|
2,857,143
|
|
||||||||
|
Basic and diluted net loss per share
|
$
|
(0.09
|
)
|
$
|
(0.04
|
)
|
$
|
(0.46
|
)
|
$
|
(0.21
|
)
|
||||
The following outstanding securities have been excluded from the computation of diluted weighted shares outstanding for the three months ended
March 31, 2020
and
2019
, as they could have been anti-dilutive:
14
|
|
Three Months Ended
|
|||
|
March 31,
|
||||
|
|
2020
|
2019
|
||
|
Stock options
|
7,712,680
|
4,345,305
|
||
|
Warrants on common stock
|
4,024,708
|
4,024,708
|
||
|
Restricted Stock Units
|
267,500
|
345,000
|
||
|
Underwriters' unit purchase option
|
40,000
|
40,000
|
||
6. Asset Acquisition
Aevi Merger
On February 3, 2020, the Company consummated its two-step merger with Aevi, in accordance with the terms of the Merger Agreement dated December 5, 2019, by and between Cerecor, Genie Merger Sub, Inc., a Delaware corporation and wholly owned subsidiary of Cerecor (“Merger Sub”), Second Genie Merger Sub, LLC (“Second Merger Sub”), a Delaware limited liability company and wholly owned subsidiary of Cerecor, and Aevi. On February 3, 2020, Merger Sub merged with and into Aevi, with Aevi as the surviving corporation, and as part of the same transaction, Aevi then merged with and into Second Merger Sub, with Second Merger Sub as the surviving entity. The surviving entity from the second merger was renamed Aevi Genomic Medicine, LLC and is disregarded as an entity separate from Cerecor for U.S. federal income tax purposes. Cerecor retained its public reporting and current NASDAQ listing status. Effective upon the consummation of the Merger, Cerecor entered into an employment agreement with Aevi CEO Mike Cola for him to serve as Cerecor's Chief Executive Officer and an employment agreement with Aevi CSO Dr. Garry Neil for him to serve as Cerecor's Chief Medical Officer, and appointed Mike Cola and Dr. Sol Barer to the Company's Board of Directors. Dr. Neil was promoted to Cerecor's Chief Scientific Officer in March 2020. Additionally, the Company extended employment agreements to seven other individuals who were previously employed by Aevi.
The Merger consideration included stock valued at approximately
$15.5 million
, resulting in the issuance of approximately
3.9 million
shares of Cerecor common stock to Aevi stockholders, forgiveness of a
$4.1 million
loan that Cerecor loaned Aevi in December 2019 contingent value rights for up to an additional
$6.5 million
in subsequent payments based on certain development milestones, payable in either shares of the Company's common stock or in cash at the election of the Company, and transaction costs of
$1.5 million
.
The fair value of the common stock transferred at closing was approximately
$15.5 million
using the Company's closing stock price on February 3, 2020. The assets acquired consisted primarily of
$24.0 million
of acquired in-process research and development ("IPR&D"),
$0.3 million
of cash and
$0.7 million
of assembled workforce. The Company assumed net liabilities of
$5.1 million
. The Company recorded this transaction as an asset purchase as opposed to a business combination as management concluded that substantially all the value received was related to one group of similar identifiable assets which was the IPR&D for two early phase therapies for rare and orphan diseases (CERC-006 and CERC-007). The Company considered these assets similar due to similarities in the risks of development, stage of development, regulatory pathway, patient populations and economics of commercialization. The fair value of the IPR&D was immediately recognized as acquired in-process research and development expense in the Company's consolidated statement of operations because the IPR&D asset has no alternate use due to the stage of development. The
$1.5 million
of transaction costs incurred were recorded to acquired IPR&D expense. The assembled workforce asset was recorded to intangible assets and will be amortized over an estimated useful life of
two years
.
The contingent consideration of up to an additional
$6.5 million
relates to
two
future development milestones. The first milestone is the enrollment of a patient in a Phase II study related to CERC-002, CERC-006 or CERC-007 prior to February 3, 2022. If this milestone is met, the Company is required to make a milestone payment of
$2.0 million
. The second milestone is the receipt of a NDA approval for either CERC-006 or CERC-007 from the FDA on or prior to February 3, 2025. If this milestone is met, the Company is required to make a milestone payment of
$4.5 million
. All milestones are payable in either shares of the Company's common stock or cash, at the election of the Company. The contingent consideration related to the development milestones will be recognized if and when such milestones are probable and can be reasonably estimated. As of the consummation of the Merger on February 3, 2020 and as of March 31, 2020,
no
contingent consideration related to the development milestone has been recognized. The Company will continue to monitor the development milestones at each reporting period.
7. Fair Value Measurements
ASC No. 820,
Fair Value Measurements and Disclosures
(“ASC 820”), defines fair value as the price that would be received to sell an asset, or paid to transfer a liability, in the principal or most advantageous market in an orderly transaction between market participants on the measurement date. The fair value standard also establishes a three‑level hierarchy, which requires an entity to maximize
15
the use of observable inputs and minimize the use of unobservable inputs when measuring fair value. The valuation hierarchy is based upon the transparency of inputs to the valuation of an asset or liability on the measurement date. The three levels are defined as follows:
|
•
|
Level 1—inputs to the valuation methodology are quoted prices (unadjusted) for an identical asset or liability in an active market.
|
|
•
|
Level 2—inputs to the valuation methodology include quoted prices for a similar asset or liability in an active market or model‑derived valuations in which all significant inputs are observable for substantially the full term of the asset or liability.
|
|
•
|
Level 3—inputs to the valuation methodology are unobservable and significant to the fair value measurement of the asset or liability.
|
The following table presents, for each of the fair value hierarchy levels required under ASC 820, the Company’s assets and liabilities that are measured at fair value on a recurring basis:
|
|
March 31, 2020
|
|||||||||||
|
|
Fair Value Measurements Using
|
|||||||||||
|
|
Quoted prices in
|
Significant other
|
Significant
|
|||||||||
|
|
active markets for
|
observable
|
unobservable
|
|||||||||
|
|
identical assets
|
inputs
|
inputs
|
|||||||||
|
|
(Level 1)
|
(Level 2)
|
(Level 3)
|
|||||||||
|
Assets
|
|
|
|
|||||||||
|
Investments in money market funds*
|
$
|
4,436,860
|
|
$
|
—
|
|
$
|
—
|
|
|||
|
Investment in Aytu
|
$
|
—
|
|
$
|
14,708,768
|
|
$
|
—
|
|
|||
|
Liabilities
|
||||||||||||
|
Warrant liability**
|
$
|
—
|
|
$
|
—
|
|
$
|
760
|
|
|||
|
Unit purchase option liability**
|
$
|
—
|
|
$
|
—
|
|
$
|
2,014
|
|
|||
|
|
December 31, 2019
|
|||||||||||
|
|
Fair Value Measurements Using
|
|||||||||||
|
|
Quoted prices in
|
Significant other
|
Significant
|
|||||||||
|
|
active markets for
|
observable
|
unobservable
|
|||||||||
|
|
identical assets
|
inputs
|
inputs
|
|||||||||
|
|
(Level 1)
|
(Level 2)
|
(Level 3)
|
|||||||||
|
Assets
|
|
|
|
|||||||||
|
Investments in money market funds*
|
$
|
2,240,230
|
|
$
|
—
|
|
$
|
—
|
|
|||
|
Investment in Aytu
|
$
|
—
|
|
$
|
7,628,947
|
|
$
|
—
|
|
|||
|
Liabilities
|
||||||||||||
|
Warrant liability**
|
$
|
—
|
|
$
|
—
|
|
$
|
3,460
|
|
|||
|
Unit purchase option liability**
|
$
|
—
|
|
$
|
—
|
|
$
|
10,594
|
|
|||
*Investments in money market funds are reflected in cash and cash equivalents on the accompanying condensed consolidated balance sheets.
**Warrant liability and UPO liability are reflected in accrued expenses and other current liabilities on the accompanying condensed consolidated balance sheets.
As of March 31, 2020 and December 31, 2019, the Company’s financial instruments included cash and cash equivalents, restricted cash, accounts receivable, accounts payable, accrued expenses and other current liabilities, warrant liability, and the underwriters' unit purchase option liability. The carrying amounts reported in the accompanying condensed consolidated financial statements for cash and cash equivalents, restricted cash, accounts receivable, accounts payable, accrued expenses, and other current liabilities approximate their respective fair values because of the short-term nature of these accounts.
Level 2 Valuation
16
As part of the consideration for the Aytu Divestiture, Aytu issued to Cerecor
9,805,845
shares of Aytu Series G Convertible Preferred Stock (the "Aytu Series G Preferred Stock" or "Aytu Preferred Stock"). Subsequent to the initial measurement, at each reporting period, the Investment in Aytu is remeasured at the current fair value with the change in fair value recorded to other income, net in the accompanying statements of operations. As of March 31, 2020, the Investment in Aytu was
$14.7 million
, representing a change in fair value of
$7.1 million
from December 31, 2019.
In light of changing market conditions and conversations with Aytu’s management beginning in the first quarter of 2020, on April 10, 2020, Cerecor was permitted to convert the Aytu Preferred Stock into
9,805,845
shares of Aytu’s common stock (the “Aytu Common Shares”), and subsequently sold all of the Aytu Common Shares in a series of transactions in April, pursuant to an effective registration statement, which generated net proceeds of approximately
$12.8 million
.
Level 3 Valuation
The tables presented below are a summary of changes in the fair value of the Company’s Level 3 valuations for the warrant liability, UPO liability and contingent consideration for the three
months ended March 31, 2020
and
2019
:
|
|
Warrant
|
Unit purchase
|
Contingent
|
|
||||||||||||
|
|
liability
|
option liability
|
consideration
|
Total
|
||||||||||||
|
Balance at December 31, 2019
|
$
|
3,460
|
|
$
|
10,594
|
|
$
|
—
|
|
$
|
14,054
|
|
||||
|
Change in fair value
|
(2,700
|
)
|
(8,580
|
)
|
—
|
|
(11,280
|
)
|
||||||||
|
Balance at March 31, 2020
|
$
|
760
|
|
$
|
2,014
|
|
$
|
—
|
|
$
|
2,774
|
|
||||
|
|
Warrant
|
Unit purchase
|
Contingent
|
|
||||||||||||
|
|
liability
|
option liability
|
consideration
|
Total
|
||||||||||||
|
Balance at December 31, 2018
|
$
|
2,950
|
|
$
|
7,216
|
|
$
|
1,256,210
|
|
$
|
1,266,376
|
|
||||
|
Change in fair value
|
14,800
|
|
32,777
|
|
20,940
|
|
68,517
|
|
||||||||
|
Balance at March 31, 2019
|
$
|
17,750
|
|
$
|
39,993
|
|
$
|
1,277,150
|
|
$
|
1,334,893
|
|
||||
In 2014, the Company issued warrants to purchase
625,208
shares of convertible preferred stock. Upon the closing of the Company's initial public offering ("IPO") in October 2015 these warrants became warrants to purchase
22,328
shares of common stock, in accordance with their terms. The warrants expire in October 2020. The warrants represent a freestanding financial instrument that is indexed to an obligation, which the Company refers to as the warrant liability. The warrant liability is marked-to-market each reporting period with the change in fair value recorded to other income, net in the accompanying statements of operations until the warrants are exercised, expire or other facts and circumstances lead the warrant liability to be reclassified to stockholders’ equity. The fair value of the warrant liability is estimated using a Black-Scholes option-pricing model. The significant assumptions used in preparing the option pricing model for valuing the warrant liability as of
March 31, 2020
, include (i) volatility of
87.8%
, (ii) risk free interest rate of
0.15%
, (iii) strike price of
$8.40
, (iv) fair value of common stock of
$2.48
, and (v) expected life of
0.6
years.
The underwriters’ UPO was issued to the underwriters of the Company's IPO in 2015 and provides the underwriters the option to purchase up to a total of
40,000
units. The units underlying the UPO will be, immediately upon exercise, separated into shares of common stock, underwriters’ Class A warrants and underwriters’ Class B warrants (such warrants together referred to as the Underwriters’ Warrants). The Underwriters’ Warrants were warrants to purchase shares of common stock. The Class B warrants expired in April 2017 and the Class A warrants expired in October 2018, while the UPO expires in October 2020. The Company classifies the UPO as a liability, as it is a freestanding marked-to-market derivative instrument that is precluded from being classified in stockholders’ equity. The UPO liability is marked-to-market each reporting period with the change in fair value recorded to other income, net in the accompanying statements of operations until the UPO is exercised, expires or other facts and circumstances lead the UPO to be reclassified to stockholders’ equity. The fair value of the UPO liability is estimated using a Black-Scholes option-pricing model. The significant assumptions used in preparing the simulation model for valuing the UPO as of
March 31, 2020
, include (i) volatility of
87.8%
, (ii) risk free interest rate of
0.15%
, (iii) unit strike price of
$7.47
, (iv) fair value of underlying equity of
$2.48
, and (v) expected life of
0.6
years.
The Company's historical business acquisition of TRx involved the potential for future payment of consideration that is contingent upon the achievement of operational and commercial milestones. The fair value of contingent consideration was determined at the acquisition date utilizing unobservable inputs such as the estimated amount and timing of projected cash flows, the probability of success
17
(achievement of the contingent event) and the risk-adjusted discount rate used to present value the probability-weighted cash flows. Subsequent to the acquisition date, at each reporting period, the contingent consideration liabilities were remeasured at the current fair value with changes recorded in the consolidated statement of operations.
The consideration for the TRx acquisition included certain potential contingent payments. First, pursuant to the TRx Purchase Agreement, the Company would have been required to pay
$3.0 million
to the sellers if the gross profit related to TRx products equaled or exceeded
$12.6 million
in 2018. The Company did not achieve this contingent event in 2018 and therefore
no
value was assigned to the contingent payout as of December 31, 2018. Additionally, the Company was required to pay the following: (1)
$2.0 million
upon the transfer of the Ulesfia NDA to the Company ("NDA Transfer Milestone"), and (2)
$2.0 million
upon FDA approval of a new dosage of Ulesfia ("FDA Approval Milestone"). However, as part of the settlement the Company entered into during the second quarter of 2019 with Lachlan Pharmaceuticals, an Irish company controlled by the previous owners of TRx, the Company gave up its right to sell Ulesfia, except for a limited amount of inventory on hand until that inventory is sold or expired. As a result, the Settlement released the Company from the potential contingent payments related to the NDA Transfer Milestone and FDA Approval Milestone and therefore
no
value was assigned to the
two
milestones as of March 31,2020. The estimated fair value of the NDA Transfer Milestone and NDA Approval Milestone was
$1.3 million
as of March 31, 2019 (prior to entering into the settlement during the second quarter of 2019).
Effective upon the consummation of the Aevi Merger on February 3, 2020, Cerecor entered into an employment agreement with Aevi CEO Mike Cola for him to serve as Cerecor's Chief Executive Officer and an employment agreement with Aevi CSO Dr. Garry Neil for him to serve as Cerecor's Chief Medical Officer. Additionally, the Company extended employment agreements to seven other individuals who were previously employed by Aevi. As a result, the Company recognized an assembled workforce intangible asset of
$0.7 million
which is a Level 3 non-recurring fair value measurement. The Company utilized the replacement cost method to estimate the fair value of the assembled workforce, which considers the costs Cerecor would have incurred to replace a comparable workforce to the workforce acquired from Aevi. Such costs include, but are not limited to, recruiting costs, training costs and cost of lost productivity. The replacement costs were estimated based on a percentage of each employee's salary. The assembled workforce intangible asset will be amortized over a useful life of
two years
.
No
other changes in valuation techniques or inputs occurred during the three months ended March 31, 2020 and 2019.
No
transfers of assets between Level 1 and Level 2 of the fair value measurement hierarchy occurred during the three months ended March 31, 2020 and 2019.
8. Accrued Expenses and Other Current Liabilities
Accrued expenses and other current liabilities as of March 31, 2020 and December 31, 2019 consisted of the following:
|
|
As of
|
|||||||
|
|
March 31, 2020
|
December 31, 2019
|
||||||
|
Research and development expenses
|
$
|
1,873,361
|
|
$
|
920,901
|
|
||
|
Compensation and benefits
|
1,413,014
|
|
1,591,964
|
|
||||
|
General and administrative
|
1,035,454
|
|
120,056
|
|
||||
|
Sales and marketing
|
207,950
|
|
360,016
|
|
||||
|
Sales returns and allowances
|
1,361,410
|
|
2,284,175
|
|
||||
|
Medicaid rebates
|
95,410
|
|
118,271
|
|
||||
|
Other
|
207,606
|
|
244,869
|
|
||||
|
Total accrued expenses and other current liabilities
|
$
|
6,194,205
|
|
$
|
5,640,252
|
|
||
During the first quarter of 2020, the Company and an executive entered into a Separation Agreement (the "Separation Agreement") in which the executive resigned his employment at the Company, effective June 30, 2020 (the "Termination Date"). Following the Termination Date and subject to the executive entering into a release at that time, the executive will receive continued payments of his base salary for a total of nine months, which resulted in an accrual of
$0.3 million
recognized in accrued expenses and other current liabilities on the Company's accompanying condensed consolidated balance sheet as of March 31, 2020 and is shown within the compensation and benefits line above. Additionally, the executive's unvested stock options as of his Termination Date will immediately vest and be exercisable until 90 days following the Termination Date and his outstanding Restricted Stock Units will immediately vest.
9. Capital Structure
18
According to the Company's amended and restated certificate of incorporation, the Company is authorized to issue
two
classes of stock, common stock and preferred stock. At March 31, 2020, the total number of shares of capital stock the Company was authorized to issue was
205,000,000
of which
200,000,000
was common stock and
5,000,000
was
preferred stock. All shares of common and
preferred stock have a par value of
$0.001
per share.
On December 26, 2018, the Company filed a Certificate of Designation of Preferences of Series B Non-Voting Convertible Preferred Stock ("Series B Convertible Preferred Stock" or "convertible preferred stock") of Cerecor Inc. (the “Certificate of Designation of the Series B Preferred Stock”) classifying and designating the rights, preferences and privileges of the Series B Convertible Preferred Stock. The Certificate of Designation of the Series B Convertible Preferred Stock authorized
2,857,143
shares of convertible preferred stock. The Series B Convertible Preferred Stock converts to shares of common stock on a 1-for-
5
ratio and has the same rights, preferences, and privileges as common stock other than it holds no voting rights.
Convertible Preferred Stock
December 2018 Armistice Private Placement
On December 27, 2018, the Company entered into a series of transactions as part of a private placement with its largest stockholder, Armistice, whose Chief Investment Officer, Steve Boyd, is a Cerecor director, in order to generate cash to continue to develop its pipeline assets and for general corporate purposes. The transactions are considered one transaction for accounting purposes. As part of the transaction, the Company exchanged common stock warrants issued on April 27, 2017 to Armistice for the purchase up to
14,285,714
shares of the Company’s common stock at an exercise price of
$0.40
per share (the "original warrants") for like-kind warrants to purchase up to
2,857,143
shares of the Company's newly designated Series B Convertible Preferred Stock with an exercise price of
$2.00
per share (the "exchanged warrants"). Armistice immediately exercised the exchanged warrants and acquired an aggregate of
2,857,143
shares of the convertible preferred stock. Net proceeds of the transaction were approximately
$5.7 million
for the year ended December 31, 2018. In order to provide Armistice an incentive to exercise the exchanged warrants, the Company also entered into a securities purchase agreement with Armistice in December 2018 pursuant to which the Company issued warrants for
4,000,000
shares of common stock of the Company with a term of
5.5 years
and an exercise price of
$12.50
per share (the "incentive warrants").
During the first quarter of 2020, Armistice converted
1,600,000
shares of Series B Convertible Preferred Stock (of its
2,857,143
million shares of convertible preferred stock) into
8,000,000
shares of Cerecor's common stock.
Voting
Holders of the Company's convertible preferred stock are not entitled to vote.
Dividends
The holders of convertible preferred stock are entitled to receive dividends, if any, as may be declared from time to time by the board of directors out of legally available funds.
Liquidation
In the event of the Company’s liquidation, dissolution or winding up, holders of the Company’s convertible preferred stock will be entitled to share ratably in the net assets legally available for distribution to stockholders after the payment of all debts and other liabilities.
Rights and Preferences
Each share of convertible preferred stock converts to shares of common stock on a 1-for-
5
ratio. There are no other preemptive or subscription rights and there are
no
redemption or sinking fund provisions applicable to the Company’s common stock.
Common Stock
March 2020 Financing
On March 17, 2020, the Company entered into a securities purchase agreement with Armistice pursuant to which the Company sold
1,951,219
shares of the Company’s common stock for a purchase price of
$2.05
per share, which represents the closing stock price the day prior to entering into the agreement. Net proceeds of the private placement were approximately
$3.9 million
.
19
February 2020 Financing
On February 6, 2020, the Company closed on a registered direct offering with certain institutional investors for the sale by the Company of
1,306,282
shares of the Company's common stock at a purchase price of
$3.98
per share, which represents the closing stock price the day prior to entering into the agreement. Armistice participated in the offering by purchasing
1,256,282
shares of common stock from the Company. The net proceeds of the offering were approximately
$5 million
.
Aevi Merger
On February 3, 2020, under the terms of the Aevi Merger noted above in Note 6, the Company issued
3.9 million
shares of common stock.
September 2019 Armistice Private Placement
On September 4, 2019, the Company entered into a securities purchase agreement with Armistice, pursuant to which the Company sold
1,200,000
shares of the Company’s common stock for a purchase price of
$3.132
per share, which represents the average closing price of the Common Stock on Nasdaq for the
five
trading days immediately preceding September 4, 2019. Net proceeds of the private placement were approximately
$3.7 million
.
March 2019 Common Stock Offering
On March 8, 2019, the Company closed on an underwritten public offering of common stock for
1,818,182
shares of common stock of the Company, at a price to the public of
$5.50
per share. Armistice participated in the offering by purchasing
363,637
shares of common stock of the Company from the underwriter at the public price. The net proceeds were approximately
$9.0 million
.
Voting
Common stock is entitled to
one
vote for each share held of record on all matters submitted to a vote of the stockholders, including the election of directors, and does not have cumulative voting rights. Accordingly, the holders of a majority of the shares of common stock entitled to vote in any election of directors can elect all of the directors standing for election.
Dividends
The holders of common stock are entitled to receive dividends, if any, as may be declared from time to time by the board of directors out of legally available funds.
Liquidation
In the event of the Company’s liquidation, dissolution or winding up, holders of the Company’s common stock will be entitled to share ratably in the net assets legally available for distribution to stockholders after the payment of all debts and other liabilities.
Rights and Preferences
Holders of the Company’s common stock have
no
preemptive, conversion or subscription rights, and there are
no
redemption or sinking fund provisions applicable to the Company’s common stock.
Common Stock Warrants
At
March 31, 2020
, the following common stock warrants were outstanding:
|
Number of shares
|
Exercise price
|
Expiration
|
||||
|
underlying warrants
|
per share
|
date
|
||||
|
22,328*
|
$
|
8.40
|
|
October 2020
|
||
|
2,380*
|
$
|
8.68
|
|
May 2022
|
||
|
4,000,000
|
$
|
12.50
|
|
June 2024
|
||
|
4,024,708
|
|
|
||||
20
*Accounted for as a liability instrument (see Note 7)
10. Stock-Based Compensation
2016 Equity Incentive Plan
On April 5, 2016, the Company’s board of directors adopted the 2016 Equity Incentive Plan (the “2016 Plan”) as the successor to the 2015 Omnibus Plan (the “2015 Plan”). The 2016 Plan was approved by the Company’s stockholders and became effective on May 18, 2016 (the “2016 Plan Effective Date”). Upon the 2016 Plan Effective Date, the 2016 Plan reserved and authorized up to
600,000
additional shares of common stock for issuance, as well as
464,476
unallocated shares remaining available for grant of new awards under the 2015 Plan. An Amended and Restated 2016 Equity Incentive Plan (the "2016 Amended Plan") was approved by the Company's stockholders in May 2018, which increased the share reserve by an additional
1.4 million
shares. A Second Amended and Restated 2016 Equity Incentive Plan (the "2016 Second Amended Plan") was approved by the Company's stockholders in August 2019 which increased the share reserve by an additional
850,000
shares. During the term of the 2016 Second Amended Plan, the share reserve will automatically increase on the first trading day in January of each calendar year by an amount equal to
4%
of the total number of outstanding shares of common stock of the Company on the last trading day in December of the prior calendar year. As of
March 31, 2020
, there were
3,425,288
shares available for future issuance under the 2016 Second Amended Plan.
Option grants expire after
ten
years. Employee options typically vest over
three
or
four
years. Options granted to directors typically vest over
one
or
three
years. Directors may elect to receive stock options in lieu of board compensation, which vest immediately. For stock options granted to employees and non-employee directors, the estimated grant date fair market value of the Company’s stock-based awards is amortized ratably over the individuals’ service periods, which is the period in which the awards vest. Stock-based compensation expense includes expense related to stock options, restricted stock units and employee stock purchase plan shares. The amount of stock-based compensation expense recognized for the three months ended
March 31, 2020
and
2019
was as follows:
|
|
Three Months Ended March 31,
|
|||||||
|
|
2020
|
|
2019
|
|||||
|
Research and development
|
$
|
381,769
|
|
$
|
57,376
|
|
||
|
General and administrative
|
679,600
|
|
469,125
|
|
||||
|
Sales and marketing
|
54,954
|
|
20,828
|
|
||||
|
Total stock-based compensation, continuing operations
|
1,116,323
|
|
547,329
|
|
||||
|
Total stock-based compensation, discontinued operations
|
—
|
|
49,364
|
|
||||
|
Total stock-based compensation
|
$
|
1,116,323
|
|
$
|
596,693
|
|
||
Stock options with service-based vesting conditions
The Company has granted awards that contain service-based vesting conditions. The compensation cost for these options is recognized on a straight-line basis over the vesting periods. A summary of option activity for the three
months ended March 31, 2020
is as follows:
|
|
Options Outstanding
|
||||||||||||
|
|
Number of shares
|
Weighted average exercise price per share
|
Weighted average grant date fair value per share
|
Weighted average remaining contractual term (in years)
|
|||||||||
|
Balance at December 31, 2019
|
4,180,606
|
|
$
|
4.80
|
|
$
|
2.67
|
|
7.9
|
||||
|
Granted
|
3,550,583
|
|
$
|
3.97
|
|
$
|
2.51
|
|
|||||
|
Exercised
|
(25,168
|
)
|
$
|
2.95
|
|
$
|
1.90
|
|
|||||
|
Forfeited
|
(125,000
|
)
|
$
|
5.28
|
|
$
|
2.85
|
|
|||||
|
Expired
|
(168,341
|
)
|
$
|
6.16
|
|
$
|
3.35
|
|
|||||
|
Balance at March 31, 2020
|
7,412,680
|
|
$
|
4.37
|
|
$
|
2.58
|
|
8.5
|
||||
|
Exercisable at March 31, 2020
|
2,104,285
|
|
$
|
4.43
|
|
$
|
2.50
|
|
5.9
|
||||
21
In February 2020, the Company granted options to purchase
2.4 million
shares of common stock as inducement option grants, pursuant to NASDAQ Listing Rule 5635(c)(4), to certain executives who joined the Company in connection with the Aevi Merger. Additionally, on February 3, 2020, the Company granted
0.5 million
options with service-based vesting conditions at an exercise price of
$3.98
per share to a non-employee board member, who was appointed to Cerecor's Board of Directors upon the consummation of the Aevi Merger. Finally, on February 3, 2020, the Company granted approximately
0.5 million
options with service-based vesting conditions at an exercise price of
$3.98
per share to other employees who joined the Company in connection with the Aevi Merger. Additionally, in March 2020, our Chief Executive Officer entered into an amended employment agreement in which his base salary in cash was reduced from an annual rate of
$450,000
to an annual rate of
$35,568
(the "Reduction"). In consideration for the Reduction, the Company will grant stock options, which vest immediately, to be approved by the independent Compensation Committee at regularly scheduled Compensation Committee meetings, for the purchase of a number of shares of the Company’s common stock with a total value (based on the Black-Scholes valuation methodology) based on a pro rata total annual value of
$414,432
since the last Compensation Committee meeting.
The aggregate intrinsic value of stock options is calculated as the difference between the exercise price of the stock options and the fair value of the Company’s common stock for those stock options that had exercise prices lower than the fair value of the Company’s common stock. As of
March 31, 2020
, the aggregate intrinsic value of options outstanding and currently exercisable was
$0.6 million
and
$0.5 million
, respectively. There were
69,046
options that vested during the three
months ended March 31, 2020
with a weighted average exercise price of
$3.34
per share. The total grant date fair value of shares which vested during the three
months ended March 31, 2020
was
$0.1 million
.
The Company recognized stock-based compensation expense of
$0.8 million
related to stock options with service-based vesting conditions for the three months ended March 31, 2020. At March 31, 2020, there was
$11.6 million
of total unrecognized compensation cost related to unvested service-based vesting condition awards. The unrecognized compensation cost is expected to be recognized over a weighted-average period of
3.3
years.
Stock options with market-based vesting conditions
The Company has granted awards that contain market-based vesting conditions. The following table summarizes the Company's market-based option activity for the three
months ended March 31, 2020
:
|
|
Options Outstanding
|
||||||||||||
|
|
Number of shares
|
Weighted average exercise price per share
|
Weighted average remaining contractual term (in years)
|
Aggregate intrinsic value (1)
|
|||||||||
|
Balance at December 31, 2019
|
300,000
|
|
$
|
4.98
|
|
9.4
|
|||||||
|
Granted
|
—
|
|
|
|
|||||||||
|
Balance at March 31, 2020
|
300,000
|
|
$
|
4.98
|
|
9.2
|
$
|
—
|
|
||||
|
Exercisable at March 31, 2020
|
—
|
|
|||||||||||
(1) The aggregate intrinsic value in the above table represents the total pre-tax amount that a participant would receive if the option had been exercised on the last day of the respective fiscal period. Options with a market value less than its exercise value are not included in the intrinsic value amount.
The Company recognized stock-based compensation expense of
$0.1 million
related to stock options with market-based based vesting conditions for the three months ended March 31, 2020. At
March 31, 2020
, there was
$0.7 million
of total unrecognized compensation cost related to unvested market-based vesting conditions awards. This compensation cost is expected to be recognized over a weighted-average period of
1.7
years. Subsequent to the first quarter of 2020, the outstanding market based options were forfeited due to the resignation of an executive.
Stock-based compensation assumptions
The following table shows the assumptions used to compute stock-based compensation expense for stock options granted to employees and members of the board of directors under the Black-Scholes valuation model for the three
months ended March 31, 2020
:
22
|
Service-based options
|
|
|
|
Expected dividend yield
|
|
—%
|
|
Expected volatility
|
|
69.9% - 71.5%
|
|
Expected life (in years)
|
|
5.0 - 6.25
|
|
Risk-free interest rate
|
|
0.37 - 1.48%
|
Restricted Stock Units
The Company has granted restricted stock units ("RSU") to certain employees. The Company measures the fair value of the restricted awards using the stock price on the date of the grant. The restricted shares typically vest annually over a
four
-year period beginning on the first anniversary of the award. The following table summarizes the Company's RSU activity for the three months ended March 31, 2020:
|
|
RSUs Outstanding
|
||||||
|
|
Number of shares
|
Weighted average grant date fair value
|
|||||
|
Unvested RSUs at December 31, 2019
|
267,500
|
|
$
|
4.92
|
|
||
|
Granted
|
—
|
|
|
|
|||
|
Unvested RSUs at March 31, 2020
|
267,500
|
|
|||||
The Company recognized stock-based compensation expense of
$0.2 million
related to RSUs for the three months ended March 31, 2020. At
March 31, 2020
, there was
$1.0 million
of total unrecognized compensation cost related to the RSU grants. This compensation cost is expected to be recognized over a weighted-average period of
1.8
years.
Employee Stock Purchase Plan
On April 5, 2016, the Company’s board of directors approved the 2016 Employee Stock Purchase Plan (the “ESPP”). The ESPP was approved by the Company’s stockholders and became effective on May 18, 2016 (the “ESPP Effective Date”).
Under the ESPP, eligible employees can purchase common stock through accumulated payroll deductions at such times as are established by the administrator. The ESPP is administered by the compensation committee of the Company’s board of directors. Under the ESPP, eligible employees may purchase stock at
85%
of the lower of the fair market value of a share of the Company’s common stock (i) on the first day of an offering period or (ii) on the purchase date. Eligible employees may contribute up to
15%
of their earnings during the offering period. The Company’s board of directors may establish a maximum number of shares of the Company’s common stock that may be purchased by any participant, or all participants in the aggregate, during each offering or offering period. Under the ESPP, a participant may not accrue rights to purchase more than
$25,000
of the fair market value of the Company’s common stock for each calendar year in which such right is outstanding.
Upon the ESPP Effective Date, the Company reserved and authorized up to
500,000
shares of common stock for issuance under the ESPP. On January 1 of each calendar year, the aggregate number of shares that may be issued under the ESPP shall automatically increase by a number equal to the lesser of (i)
1%
of the total number of shares of the Company’s capital stock outstanding on December 31 of the preceding calendar year, and (ii)
500,000
shares of the Company’s common stock, or (iii) a number of shares of the Company’s common stock as determined by the Company’s board of directors or compensation committee. The number of shares increased by
443,842
on January 1, 2020. As of
March 31, 2020
,
1,562,724
shares remained available for issuance.
In accordance with the guidance in ASC 718-50,
Employee Stock Purchase Plans
, the ability to purchase shares of the Company’s common stock at the lower of the offering date price or the purchase date price represents an option and, therefore, the ESPP is a compensatory plan under this guidance. Accordingly, stock-based compensation expense is determined based on the option’s grant-date fair value and is recognized over the requisite service period of the option. The Company used the Black-Scholes valuation model and recognized stock-based compensation expense of
$36,160
for the three months ended March 31, 2020.
Subsequent Equity Grants
23
On April 9, 2020, the Company granted
1.1 million
options with service-based vesting conditions at an exercise price of
$2.57
per share to its employees as part of its annual stock option award. One-quarter of the shares awarded will vest on the first anniversary of the grant date and the remaining three-quarters of the shares will vest in equal monthly installments over the following 36 months. Subsequent to April 9, 2020,
0.4 million
of the
1.1 million
options granted were forfeited as a result of an executive's resignation.
11. Income Taxes
The Company recognized an income tax benefit of
$2.2 million
for the three months ended March 31, 2020 and income tax expense of
$0.1 million
for the three months ended March 31, 2019. The expense recognized for the three months ended March 31, 2019 was a result of interest on an unpaid tax liability related to the 2017 tax year and state taxes. The discrete benefit recognized for the three months ended March 31, 2020 was a result of a current year tax law change and the ability of the Company to now carry back certain losses. On March 27, 2020, President Trump signed into law the Coronavirus Aid, Relief and Economic Security Act (the "CARES Act"). The CARES Act provided both stimulus measures and a number of business tax provisions. The tax provisions included temporary changes regarding the utilization and five year carry back of losses generated in 2018, 2019 and 2020, temporary changes regarding interest deductions, technical corrections from prior tax legislation related to qualified improvement property, and various other measures. As of March 31, 2020, the Company intended to file (and subsequently filed in April 2020) a refund claim with the Internal Revenue Service related to its 2017 tax liability by carrying back losses not previously claimed. Accordingly, the Company has recognized a discrete tax benefit of
$2.2 million
for the three months ended March 31, 2020.
12. Leases
The Company occupies
two
leased properties as of March 31, 2020. The first leased property serves as the Company's corporate headquarters located in Rockville, Maryland ("Headquarters' Lease"). See below for more information regarding the Headquarters' Lease.
Upon consummation of the Aevi Merger on February 3, 2020, the Company also occupied leased administrative office space in Wayne, Pennsylvania, which expired on April 30, 2020. The monthly rent payment for this lease was
$12,050
.
Corporate Headquarters' Lease
The annual base rent for the Headquarters' Lease is
$161,671
, subject to annual
2.5%
increases over the term of the lease. The lease provides for a rent abatement for a period of
12 months
following the Company's date of occupancy. The lease has an initial term of
10 years
from the date the Company makes its first annual fixed rent payment, which occurred in January 2020. The Company has the option to extend the lease
two
times, each for a period of
five years
, and may terminate the lease as of the sixth anniversary of the first annual fixed rent payment, upon the payment of a termination fee. As of the lease commencement date, it was not reasonably certain that the Company will exercise the renewal periods or early terminate the lease and therefore the end date of the lease for accounting purposes is January 31, 2030. The remaining term of the lease at March 31, 2020 was
9.8
years.
Supplemental balance sheet information related to the lease is as follows:
|
|
As of
|
|||||||
|
|
March 31, 2020
|
December 31, 2019
|
||||||
|
Property and equipment, net
|
$
|
710,230
|
|
$
|
718,626
|
|
||
|
Other current liabilities
|
$
|
166,403
|
|
$
|
155,815
|
|
||
|
Other long-term liabilities
|
$
|
1,094,307
|
|
$
|
1,111,965
|
|
||
The operating lease ROU asset is included in property and equipment and the lease liability is included in accrued expenses and other current liabilities and other long-term liabilities in our condensed consolidated balance sheets. In order to determine the present value of lease payments, the Company utilized a discount rate of
7.7%
. This rate was determined based on available information of the rate of interest the Company would pay to borrow on a collateralized basis at an amount equal to the lease payments in a similar economic environment over a similar term on the transition date.
The components of lease expense for the three months ended March 31, 2020 and 2019 were as follows:
24
|
|
Three Months Ended March 31,
|
|||||||
|
2020
|
2019
|
|||||||
|
Operating lease cost*
|
$
|
54,508
|
|
$
|
54,506
|
|
||
*Includes short-term leases, which are immaterial.
The following table shows a maturity analysis of the operating lease liability as of March 31, 2020:
|
|
||||
|
|
Undiscounted Cash Flows
|
|||
|
April 1, 2020 through December 31, 2020
|
$
|
124,285
|
|
|
|
2021
|
169,510
|
|
||
|
2022
|
173,748
|
|
||
|
2023
|
178,092
|
|
||
|
2024
|
182,544
|
|
||
|
2025
|
187,108
|
|
||
|
Thereafter
|
813,638
|
|
||
|
Total lease payments
|
$
|
1,828,925
|
|
|
|
Less implied interest
|
$
|
(568,215
|
)
|
|
|
Total
|
$
|
1,260,710
|
|
|
13. Commitments and Contingencies
Litigation
Litigation - General
The Company may become party to various contractual disputes, litigation, and potential claims arising in the ordinary course of business. The Company currently does not believe that the resolution of such matters will have a material adverse effect on its financial position or results of operations except as otherwise disclosed in this report.
TRx 2018 Target Gross Profit Dispute
As part of the TRx Acquisition, pursuant to the TRx Purchase Agreement, the Company was required to pay
$3.0 million
to the TRx Sellers (or "former TRx owners") if the gross profit, as defined in the TRx Purchase Agreement, related to TRx products equaled or exceeded
$12.6 million
in 2018. The Company believes it did not achieve this contingent event in 2018 and therefore, no amount is due to the former TRx owners. However, during the second quarter of 2019, the former TRx owners disputed the Company's calculation of gross profit under the TRx Purchase Agreement, arguing the Company met the
$12.6 million
target in 2018. Pursuant to the TRx Purchase Agreement, the dispute was submitted to an independent accounting firm for resolution during the third quarter of 2019. The dispute was resolved on October 8, 2019, with the independent accounting firm ruling in favor of the Company.
However, on December 19, 2019, Cerecor received a letter from an attorney on behalf of the former TRx owners dated December 18, 2019 that enclosed a draft complaint seeking relief against Cerecor and one of the members of its board of directors. The letter further threatened that if an immediate discussion regarding a settlement did not occur, that the lawsuit would be filed on December 24, 2019. However, as of the date of this filing, no lawsuit has been filed, and the parties have agreed to a pre-lawsuit mediation tentatively set for June 2020. The proposed complaint indicates that the former TRx owners would seek the following relief: (a)
$3.0 million
on the grounds that commercially reasonable efforts to sell the acquired TRx products would have resulted in the gross profit earn-out target being reached; (b) that the
$3.0 million
amount be trebled as a result of Cerecor's alleged improper conduct; (c)
$9.2 million
as a result of alleged losses resulting from the alleged improper treatment of the former TRx owners as affiliates; and (d) the removal of any restrictions on the former TRx owners shares of common stock in Cerecor. Cerecor disputes that the former TRx owners are entitled to the relief sought and intends to vigorously defend against any lawsuit filed on behalf of the former TRx owners. A loss in this matter is possible in a range of
$0
to
$18.2 million
. As a loss in this matter is not considered probable, there has been no accrual recorded as of March 31, 2020.
Karbinal Royalty Make-Whole Provision
25
On February 16, 2018, in connection with the acquisition of Avadel's pediatric products, the Company entered into a supply and distribution agreement with TRIS Pharma (the "Karbinal Agreement"). As part of this agreement, the Company had an annual minimum sales commitment, which is based on a commercial year that spans from August 1 through July 31, of
70,000
units through 2033. The Company was required to pay TRIS a royalty make whole payment (“Make-Whole Payments”) of
$30
for each unit under the
70,000
units annual minimum sales commitment through 2033.
As a part of the Aytu Divestiture, which closed on November 1, 2019, the Company assigned all payment obligations, including the Make-Whole Payments, under the Karbinal Agreement (collectively, the “TRIS Obligations”) to Aytu. However, under the original license agreement, the Company could ultimately be liable for TRIS Obligations to the extent Aytu fails to make the required payments. The future Make-Whole Payments to be made by Aytu are unknown as the amount owed to TRIS is dependent on the number of units sold.
Millipred License and Supply Agreement
The Company has a License and Supply Agreement for Millipred with Watson Laboratories, Inc., which is now part of Teva Pharmaceutical Industries Ltd. ("Teva"). Pursuant to the License and Supply Agreement, the Company is required to make license payments of
$75,000
in February and August of each year through April 2021, and purchases inventory on an ad-hoc basis. The License and Supply Agreement expires on April 1, 2021, however if neither party terminates the agreement prior to April 1, 2021, then the agreement will automatically renew for successive
one
-year periods. Effective upon the consummation of the Merger, Cerecor appointed Dr. Sol Barer to the Company's Board of Directors. Dr. Barer also serves as Teva's Chairman of the Board.
Possible future milestone proceeds for out-licensed compounds
CERC-611 License Assignment
On August 8, 2019, the Company entered into an assignment of license agreement (the “Assignment Agreement”) with ES Therapeutics, LLC (“ES Therapeutics”), a wholly-owned subsidiary of Armistice, a significant stockholder of the Company. Pursuant to the Assignment Agreement, the Company assigned and transferred its rights, title, interest, and obligations with respect to CERC-611 to ES Therapeutics. The Company initially licensed the compound from Eli Lilly Company ("Lilly") in September 2016. Under the Assignment Agreement, Armistice paid the Company an upfront payment of
$0.1 million
. The Company recognized the payment as license and other revenue for the year ended December 31, 2019. The Assignment Agreement also provides for: (a) a
$7.5 million
milestone payment to the Company upon cumulative net sales of licensed products reaching
$750.0 million
; and (b) a
$12.5 million
milestone payment to the Company upon cumulative net sales of licensed products reaching
$1.3 billion
. The Assignment Agreement also released the Company of obligations related to CERC-611, including the
$1.3 million
contingent payment to Lilly upon the first subject dosage of CERC-611 in a multiple ascending dose study. The Assignment Agreement also releases the Company from additional potential future payments due to Lilly upon achievement of certain development and commercialization milestones, including the first commercial sale, and milestone payments and royalty on net sales upon commercialization of the compound.
CERC-501 Sale to Janssen
In August 2017, the Company sold its worldwide rights to CERC-501 to Janssen Pharmaceuticals, Inc. (“Janssen”) in exchange for initial gross proceeds of
$25.0 million
. There is a potential future
$20.0 million
regulatory milestone payment to the Company upon acceptance of an NDA for any indication. The terms of the agreement provide that Janssen will assume ongoing clinical trials and be responsible for any new development and commercialization of CERC-501.
Possible future milestone payments
OSI Products Royalty Agreement
As discussed in detail in Note 6, on February 3, 2020, the Company consummated a Merger with Aevi. Effective upon the consummation of the Merger, Cerecor entered into an employment agreement with Mike Cola for him to serve as Cerecor's Chief Executive Officer and with Dr. Garry Neil for him to serve as Cerecor's Chief Medical Officer.
Prior to Cerecor entering into the Merger Agreement, in July 2019, Aevi entered into a royalty agreement with Mike Cola, our current Chief Executive Officer, Joseph J. Grano, Jr., Kathleen Jane Grano, Joseph C. Grano, The Grano Children's Trust, Joseph C. Grano, trustee and LeoGroup Private Investment Access, LLC on behalf of Garry A. Neil, our current Chief Medical Officer, in exchange for a one-time aggregate payment of
$2 million
(the “Royalty Agreement”). Collectively, the investors will be entitled to an
26
aggregate amount equal to a low-single digit percentage of the aggregate net sales of Astellas' second generation mTORC1/2 inhibitor, CERC-006 (the “OSI Products”). At any time beginning
three years
after the date of the first public launch of an OSI Product, Cerecor may exercise, at its sole discretion, a buyout option that terminates any further obligations under the Royalty Agreement in exchange for a payment to Investors of an aggregate of
75%
of the net present value of the royalty payments. A majority of the independent members of the board of directors and the audit committee of Aevi approved the Royalty Agreement.
Cerecor assumed this Royalty Agreement upon closing of the Merger with Aevi and it is recorded within royalty obligation within the Company's accompanying condensed consolidated balance sheet as of March 31, 2020. Because there is a significant related party relationship between the Company and the Investors, the Company treated its obligation to make royalty payments under the Royalty Agreement as an implicit obligation to repay the funds advanced by the Investors. As the Company makes royalty payments in accordance with the Royalty Agreement, it will reduce the liability balance. At the time that such royalty payments become probable and estimable, and if such amounts exceed the liability balance, the Company will impute interest accordingly on a prospective basis based on such estimates, which would result in a corresponding increase in the liability balance.
Aevi Merger possible future milestone payments
As detailed in Note 6, on February 3, 2020, the Company consummated its merger with Aevi, thus acquiring three early stage compounds for rare and orphan diseases (CERC-002, CERC-006 and CERC-007) and one other preclinical orphan disease compound, CERC-005. Consideration for the transaction included approximately
3.9 million
shares of Cerecor common stock to Aevi stockholders, forgiveness of a
$4.1 million
loan that Cerecor loaned Aevi in December 2019, and certain contingent development milestones worth up to an additional
$6.5 million
.
The contingent consideration of up to an additional
$6.5 million
relates to
two
future development milestones. The first milestone is the enrollment of a patient in a Phase II study related to CERC-002, CERC-006 or CERC-007 prior to February 3, 2022. If this milestone is met, the Company is required to make a milestone payment of
$2.0 million
. The second milestone is the receipt of a NDA approval for either CERC-006 or CERC-007 from the FDA on or prior to February 3, 2025. If this milestone is met, the Company is required to make a milestone payment of
$4.5 million
. All milestones are payable in either shares of the Company's common stock or cash, at the election of the Company.
The contingent consideration related to the development milestones will be recognized if and when such milestones are probable and can be reasonably estimated. As of the consummation of the Merger on February 3, 2020 and as of March 31, 2020,
no
contingent consideration related to the development milestone has been recognized. The Company will continue to monitor the development milestones at each reporting period.
Ichorion Asset Acquisition possible future milestone payments
On September 24, 2018, the Company acquired Ichorion Therapeutics, Inc. (the "Ichorion Acquisition") thus acquiring
three
compounds for inherited metabolic disorders known as CDGs (CERC-801, CERC-802 and CERC-803) and
one
other preclinical orphan disease compound, CERC-913, for the treatment of mitochondrial DNA Depletion Syndrome. Consideration for the transaction included approximately
5.8 million
shares of the Company’s common stock (adjusted for estimated working capital) and certain contingent development milestones worth up to an additional
$15.0
million. The Company recorded this transaction as an asset acquisition.
The contingent consideration of up to an additional
$15.0 million
relates to
three
future development milestones for the acquired compounds. The first milestone is the first product being approved for marketing by the FDA on or prior to December 31, 2021. If this milestone is met, the Company is required to make a milestone payment of
$6.0 million
. The second milestone is the second product being approved for marketing by the FDA on or prior to December 31, 2021. If this milestone is met, the Company is required to make a milestone payment of
$5.0 million
. The third milestone is a protide molecule being approved by the FDA on or prior to December 31, 2023. If this milestone is met, the Company is required to make a milestone payment of
$4.0 million
. All milestones are payable in either shares of the Company's common stock or cash, at the election of the Company.
The contingent consideration related to the development milestones will be recognized if and when such milestones are probable and can be reasonably estimated. As of March 31, 2020,
no
contingent consideration related to the development milestone has been recognized. The Company will continue to monitor the development milestones at each reporting period.
27
Item 2. Management’s Discussion and Analysis of Financial Condition and Results of Operations
This Quarterly Report on Form 10-Q and the information incorporated herein by reference contain forward-looking statements that involve a number of risks and uncertainties, as well as assumptions that, if they never materialize or prove incorrect, could cause our results to differ materially from those expressed or implied by such forward-looking statements. Forward-looking statements can be identified by the use of forward-looking words such as “believes,” “expects,” “may,” “might,” “will,” “plans,” “intends,” “estimates,” “could,” “should,” “would,” “continue,” “seeks,” “aims,” “projects,” “predicts,” “pro forma,” “anticipates,” “potential” or other similar words (including their use in the negative), or by discussions of future matters such as the development of product candidates or products, technology enhancements, possible changes in legislation, and other statements that are not historical. Although our forward-looking statements reflect the good faith judgment of our management, these statements can only be based on facts and factors currently known by us. Consequently, forward-looking statements are inherently subject to risks and uncertainties, and actual results and outcomes may differ materially from results and outcomes discussed in the forward-looking statements. Factors that could cause or contribute to these differences include those below and elsewhere in this Quarterly Report on Form 10-Q, particularly in Part II – Item 1A, “Risk Factors,” as well as in our Annual Report on Form 10-K filed with the Securities and Exchange Commission, or SEC, on March 11, 2020, and in our other filings with the SEC. Statements made herein are as of the date of the filing of this Quarterly Report on Form 10-Q with the SEC and should not be relied upon as of any subsequent date. Unless otherwise required by applicable law, we do not undertake, and we specifically disclaim any obligation to update any forward-looking statements to reflect occurrences, developments, unanticipated events or circumstances after the date of such statement.
The following discussion and analysis of our financial condition and results of operations should be read in conjunction with our unaudited financial statements and related notes that appear in Item 1 of this Quarterly Report on Form 10-Q and with our audited financial statements and related notes for the year ended December 31, 2019 appearing in our Annual Report on Form 10-K filed with the SEC on March 11, 2020.
Overview
Cerecor Inc. (the "Company" or "Cerecor") is a biopharmaceutical company focused on becoming a leader in development and commercialization of treatments for rare pediatric and orphan diseases. The Company is advancing an emerging clinical-stage pipeline of innovative therapies that address unmet patient needs within rare pediatric and orphan diseases. The Company's pediatric rare disease pipeline is led by CERC-801, CERC-802 and CERC-803 ("CERC-800 compounds"), which are therapies for inherited metabolic disorders known as Congenital Disorders of Glycosylation ("CDGs"). The U.S. Food and Drug Administration ("FDA") granted Rare Pediatric Disease designation ("RPDD") and Orphan Drug Designation ("ODD") to all three CERC-800 compounds, thus potentially qualifying the Company to receive a Priority Review Voucher ("PRV") upon approval of each New Drug Application ("NDA"). Each PRV may be sold or transferred an unlimited number of times. The Company plans to leverage the 505(b)(2) NDA pathway for all three compounds to accelerate development and approval. Additionally, CERC-801 and CERC-802 were granted Fast Track Designation ("FTD") from the FDA, which can help facilitate and potentially expedite development of each compound.
The Company is also developing CERC-002, CERC-006 and CERC-007. CERC-007 is an anti-IL-18 monoclonal antibody being developed for the treatment of autoimmune inflammatory diseases such as Adult Onset Stills Disease ("AOSD") and Multiple Myeloma. CERC-006 is a dual mTOR inhibitor being developed for the treatment of complex Lymphatic Malformations. CERC-002 is an anti-LIGHT (
L
ymphotoxin-like, exhibits
I
nducible expression, and competes with HSV
G
lycoprotein D for
H
VEM, a receptor expressed by
T
lymphocytes) monoclonal antibody being developed for the treatment of Pediatric-onset Crohn's Disease.
The Company continues to explore strategic alternatives for its sole commercialized product, Millipred®, an oral prednisolone indicated across a wide variety of inflammatory conditions. The Company has been in discussions with Simon Pedder, a member of its Board of Directors, about potentially transferring its non-core neurology pipeline assets, CERC-301 and CERC-406, to a new company to be formed by Dr. Pedder, although it has not agreed to binding terms, and any such transaction might not happen until the third quarter of 2020, if at all.
Recent Developments
Aevi Merger
On February 3, 2020, the Company consummated its two-step merger (the "Merger") with Aevi Genomic Medicine, Inc. ("Aevi") in accordance with the terms of the Agreement and Plan of Merger and Reorganization (the "Merger Agreement") dated December 5, 2019. The Merger consideration included stock valued at approximately $15.5 million, resulting in the issuance of
28
approximately 3.9 million shares of Cerecor common stock to Aevi stockholders, forgiveness of a $4.1 million loan that Cerecor loaned Aevi in December 2019 (the "Aevi Loan"), and contingent value rights ("CVRs") for up to an additional $6.5 million in subsequent payments based on certain development milestones. As part of the Merger, Cerecor acquired CERC-002, CERC-006 and CERC-007, expanding Cerecor's pipeline to six clinical stage assets being developed for rare pediatric and orphan diseases. Effective upon the consummation of the Merger, Cerecor entered into an employment agreement with Aevi CEO Mike Cola for him to serve as Cerecor's Chief Executive Officer and an employment agreement with Aevi CSO Dr. Garry Neil for him to serve as Cerecor's Chief Medical Officer, and appointed Mike Cola and Dr. Sol Barer to the Company's Board of Directors. See Note 6 of the accompanying condensed consolidated financial statements for more information.
New Leadership Appointments
In April 2020, the Company appointed Dr. Sol J. Barer to the Chairman of the Board and Dr. Suzanne Bruhn and Mr. Joseph Miller to the Board. In March 2020, the Company promoted Dr. Garry Neil to Chief Scientific Officer and Dr. Jeffrey Wilkins to Chief Medical Officer. The Company believes the additions to the Board of Directors and Officer promotions will provide valuable insights and guidance as the Company continues to transform into a leader in development and commercialization of treatments for rare pediatric orphan diseases.
In April 2020, Dr. Simon Pedder resigned as the Company's Executive Chairman, however he remains on the Board of Directors. In March 2020, Dr. Pericles Calias, Ph.D. resigned as Chief Scientific Officer, however will remain an employee of the Company until June 30, 2020. Finally, in April 2020, Mr. Miller resigned in his role as Chief Financial Officer, but, as discussed above, joined the Company's Board of Directors and Mr. Christopher Sullivan was named the Company's Interim Chief Financial Officer.
Sale of Aytu Shares
In April 2020, the Company converted its shares of Aytu Preferred Stock into approximately 9.8 million shares of common and sold that common stock for net proceeds of approximately $12.8 million.
Recent Financings
On March 17, 2020, the Company entered into a securities purchase agreement with Armistice Capital, LLC ("Armistice"), whose Chief Investment Officer Steve Boyd is a Cerecor director, pursuant to which the Company sold 1,951,219 shares of the Company’s common stock for a purchase price of $2.05 per share, which represents the closing stock price the day prior to entering into the agreement. Net proceeds of the private placement were approximately $3.9 million.
On February 6, 2020, the Company closed on a registered direct offering with certain institutional investors for the sale by the Company of 1,306,282 shares of the Company's common stock at a purchase price of $3.98 per share, which represents the closing stock price the day prior to entering into the agreement. Armistice participated in the offering by purchasing 1,256,282 shares of common stock from the Company. The net proceeds of the offering were approximately $5 million.
Research and Development Update
In March 2020, the Company announced that it will explore the role of an inflammatory cytokine, LIGHT, in patients with COVID-19 induced Acute Respiratory Distress to determine if CERC-002, anti-LIGHT monoclonal antibody, can treat patients infected by COVID-19 who develop
acute respiratory distress syndrome ("
ARDS") or acute lung injury ("ALI"). The Company subsequently initiated a biomarker study to evaluate the role of LIGHT in the development of ARDS and ALI in hospitalized COVID-19 patients.
In March 2020, the Company paused its Phase 1b open-label, multi-center, dose-escalation proof-of-concept study for CERC-002 for the treatment of Pediatric-onset Crohn's Disease due to a moratorium placed on endoscopy as a result of COVID-19. The Company plans to resume the trial when the moratorium on endoscopy is lifted.
The following chart summarizes key information about our emerging clinical-stage rare disease pipeline and anticipated research & development milestones:
29
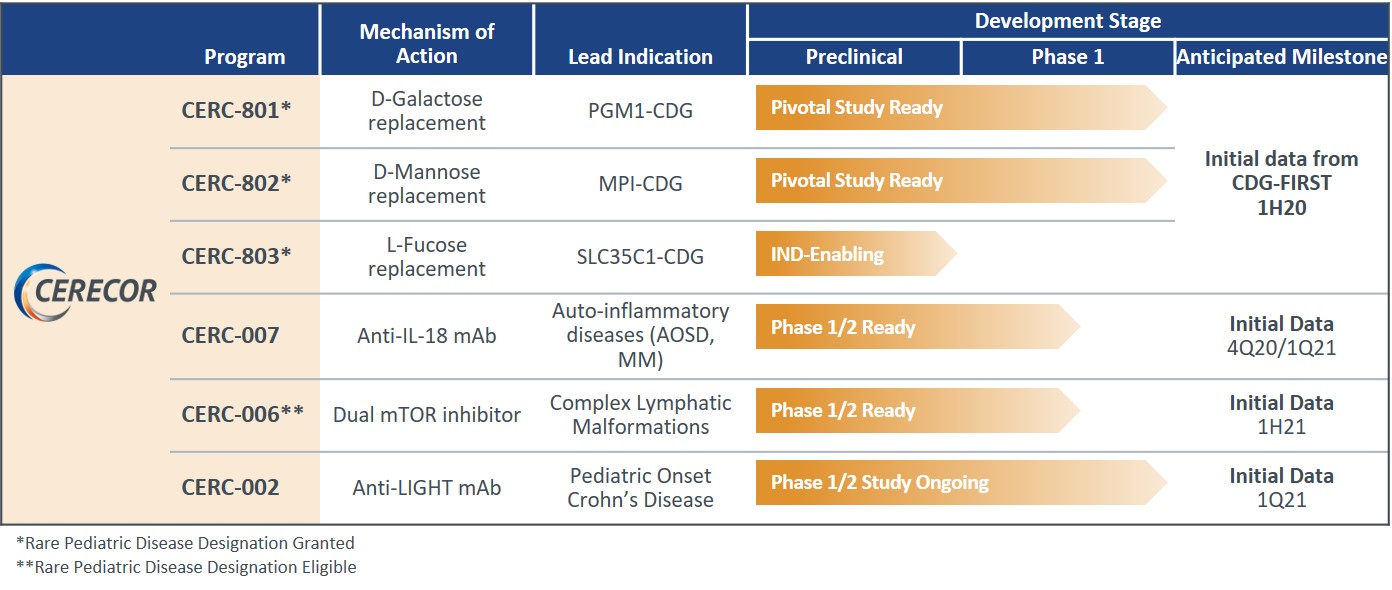
Our Strategy
Our strategy for increasing shareholder value includes:
|
•
|
Advancing our pipeline of compounds through development and to regulatory approval;
|
|
•
|
Acquiring or licensing rights to targeted, complementary differentiated preclinical and clinical stage assets;
|
|
•
|
Developing the go-to-market strategy to quickly and effectively market, launch, and distribute each of our assets that receive marketing approval;
|
|
•
|
Opportunistically out-licensing rights to indications or geographies; and
|
|
•
|
Opportunistically out-licensing rights or sale of non-core assets.
|
Results of Operations
During the fourth quarter of 2019, the Company sold its rights, titles and interest in, assets relating to its Pediatric Portfolio as well as the corresponding commercial infrastructure consisting of the right to offer employment to Cerecor’s sales force and the assignment of supporting commercial contracts, retaining as our only commercial product, Millipred, an oral prednisolone indicated across a wide variety of inflammatory conditions. As a result of the Aytu Divestiture, the Pediatric Portfolio met all conditions required in order to be classified as discontinued operations. Accordingly, unless otherwise noted, the following section focuses on results of operations from continuing operations only for all periods discussed.
Comparison of the
Three Months Ended March 31, 2020
and
2019
Product Revenue, net
Net product revenue was $2.8 million for the three months ended March 31, 2020, which was relatively consistent with the net product revenue for the three months ended March 31, 2019 of $2.6 million.
Cost of Product Sales
Cost of product sales were
$0.1 million
for the
three months ended March 31, 2020
, as compared to
$0.8 million
for the three months ended March 31, 2019. The decrease in cost of product sales was mainly driven by a shift in product mix. Most notably, cost of product sales for the three months ended March 31, 2019 was primarily comprised of minimum royalty obligations related to the Ulesfia product, which is no longer sold by the Company as a result of a settlement agreement the Company entered into during the second quarter of 2019.
Research and Development Expenses
The following table summarizes our research and development expenses for the
three months ended March 31, 2020
and
2019
:
30
|
|
Three Months Ended March 31,
|
|||||||
|
|
2020
|
2019
|
||||||
|
|
(in thousands)
|
|||||||
|
Preclinical expenses
|
$
|
1,245
|
|
$
|
879
|
|
||
|
Clinical expenses
|
596
|
|
1,590
|
|
||||
|
CMC expenses
|
1,166
|
|
435
|
|
||||
|
Internal expenses not allocated to programs:
|
||||||||
|
Salaries, benefits and related costs
|
1,313
|
|
435
|
|
||||
|
Stock-based compensation expense
|
382
|
|
57
|
|
||||
|
Other
|
66
|
|
5
|
|
||||
|
|
$
|
4,768
|
|
$
|
3,401
|
|
||
Research and development expenses increased $1.4 million for the
three months ended March 31, 2020
compared to the same period in 2019. The overall increase is driven by an increase in research and development activities in the current year as the Company expanded its pipeline assets as a result of the Aevi Merger and continued to develop its existing pipeline assets during the quarter. Specifically, as part of the Aevi Merger, which closed in the first quarter of 2020, Cerecor acquired CERC-002, CERC-006 and CERC-007, expanding Cerecor's pipeline to six clinical stage assets.
Chemistry, Manufacturing, and Controls ("CMC") expenses increased $0.7 million for the
three months ended March 31, 2020
compared to the same period in 2019 due to additional spending on manufacturing to support clinical development as a result of the additional assets acquired as part of the Aevi Merger. Preclinical expenses increased $0.4 million primarily due to additional spending related to the Aevi Merger. These increases were partially offset by a $1.0 million decrease in clinical expenses driven by minimal spend on clinical development of CERC-301 as the Company began exploring strategic alternatives for the asset during 2019.
Salaries, benefits and related costs increased by $0.9 million compared to the same period in 2019 mainly due to an increase in headcount as a result of the Aevi Merger and salary-related costs needed to grow our research and development activities as we continue to invest in our expanded pipeline. Additionally, the Company recognized $0.3 million of severance within salaries, benefits and related costs for the three months ended March 31, 2020 related a separation agreement entered into with a research and development executive during the first quarter of 2020. There was no severance for the three months ended March 31, 2019. Stock-based compensation increased by $0.3 million mainly due to an increase in stock option grants as a result of the increased headcount as a result of the Aevi Merger.
Acquired In-Process Research and Development Expenses
On February 3, 2020, the Company consummated its merger with Aevi, which was recorded as an asset acquisition in the first quarter of 2020. As a result, the Company acquired
$25.5 million
of in-process research and development ("IPR&D") for two clinical stage pipeline assets for rare and orphan diseases (CERC-006 and CERC-007). The fair value of the IPR&D was immediately recognized as acquired in-process research and development expense as the IPR&D asset has no other alternate use due to the stage of development. There was no acquired in-process research and development expense for the three months ended March 31, 2019.
General and Administrative Expenses
The following table summarizes our general and administrative expenses for the
three months ended March 31, 2020
and
2019
:
31
|
|
Three Months Ended March 31,
|
|||||||
|
|
2020
|
2019
|
||||||
|
|
(in thousands)
|
|||||||
|
Salaries, benefits and related costs
|
$
|
1,012
|
|
$
|
1,230
|
|
||
|
Legal, consulting and other professional expenses
|
784
|
|
887
|
|
||||
|
Stock-based compensation expense
|
706
|
|
469
|
|
||||
|
Other
|
174
|
|
90
|
|
||||
|
|
$
|
2,676
|
|
$
|
2,676
|
|
||
General and administrative expenses were
$2.7 million
for the
three months ended March 31, 2020
, which is consistent with the general and administrative expenses for the
three months ended March 31, 2019
. Salaries, benefits and related costs decreased by $0.2 million as a result of the Company covering the tax burden of the first year's vesting of an executive's restricted stock units which vested in the first quarter of 2019. Such expense was not repeated for the three months ended March 31, 2020. This decrease was mainly offset by a $0.2 million increase in stock-based compensation expense, which was driven by an increase in stock option grants in the current quarter as a result of options granted on April 1, 2019 as part of the Company's previous year's annual grant and as a result of the increased headcount as a result of the Aevi Merger which was consummated during the first quarter of 2020.
Sales and Marketing Expenses
The following table summarizes our sales and marketing expenses for the
three months ended March 31, 2020
and
2019
:
|
|
Three Months Ended March 31,
|
|||||||
|
|
2020
|
2019
|
||||||
|
|
(in thousands)
|
|||||||
|
Salaries, benefits and related costs
|
$
|
134
|
|
$
|
185
|
|
||
|
Stock-based compensation expense
|
55
|
|
21
|
|
||||
|
Advertising and marketing expense
|
481
|
|
190
|
|
||||
|
Other
|
7
|
|
—
|
|
||||
|
|
$
|
677
|
|
$
|
396
|
|
||
Sales and marketing expenses of continuing operations consist of expenses related to advertising and marketing initiatives to support the go-to-market strategy of our pipeline assets and the respective salaries and stock-based compensation to support such initiatives. The overall $0.3 million increase for the three months ended March 31, 2020 as compared to the same period in 2019 was primarily driven by a $0.3 million increase in advertising and marketing expense related to market research in preparation to quickly and effectively market, launch, and distribute each of our pipeline assets, if any, that receive marketing approval in the future.
Amortization Expense
The following table summarizes our amortization expense for the
three months ended March 31, 2020
and
2019
:
|
|
Three Months Ended March 31,
|
|||||||
|
|
2020
|
2019
|
||||||
|
|
(in thousands)
|
|||||||
|
Amortization of intangible assets
|
$
|
431
|
|
$
|
335
|
|
||
Amortization expense of the continuing operations relates to the amortization of the Company's acquired Millipred product marketing rights, and amortization of the assembled workforces acquired as part of the Ichorion Acquisition and Aevi Merger. As a result of the asset acquisition accounting related to the Aevi Merger recognized in the first quarter of 2020, the Company recorded an assembled workforce intangible asset of $0.7 million, which was assigned a two-year useful life. Therefore, the $0.1 million increase to amortization expense for the three months ended March 31, 2020 as compared to the prior period was primarily driven by the recognition of two months of amortization expense of the assembled workforce acquired as part of the Aevi Merger.
32
Other Income (Expense), Net
The following table summarizes our other income (expense), net for the
three months ended March 31, 2020
and
2019
:
|
|
Three Months Ended March 31,
|
|||||||
|
|
2020
|
2019
|
||||||
|
|
(in thousands)
|
|||||||
|
Change in fair value of Investment in Aytu
|
$
|
7,080
|
|
$
|
—
|
|
||
|
Change in fair value of warrant liability and unit purchase option liability
|
11
|
|
(48
|
)
|
||||
|
Other expense, net
|
—
|
|
(9
|
)
|
||||
|
Interest income, net
|
10
|
|
30
|
|
||||
|
$
|
7,101
|
|
$
|
(27
|
)
|
|||
Other income, net increased $7.1 million for the three months ended March 31, 2020 as compared to the prior period. This increase was primarily driven by the $7.1 million gain on change in the fair value of the Company's Investment in Aytu. As consideration of the Aytu Divestiture on November 1, 2019, the Company received 9,805,845 shares of Aytu Series G Preferred Stock. Subsequent to the initial measurement, at each reporting period, the Investment in Aytu is remeasured at the current fair value with the change in fair value recorded to other income, net in the accompanying statements of operations. As of March 31, 2020, the Investment of Aytu was
$14.7 million
, representing a change in fair value of $7.1 million from December 31, 2019.
Income Tax (Benefit) Expense
The following table summarizes our income tax expense for the
three months ended March 31, 2020
and
2019
:
|
|
Three Months Ended March 31,
|
|||||||
|
|
2020
|
2019
|
||||||
|
|
(in thousands)
|
|||||||
|
Income tax (benefit) expense
|
$
|
(2,157
|
)
|
$
|
131
|
|
||
The Company recognized income tax benefit of
$2.2 million
for the three months ended March 31, 2020 and income tax expense of
$0.1 million
for the three months ended March 31, 2019. The expense recognized for the three months ended March 31, 2019 was a result of interest on an unpaid tax liability related to the 2017 tax year and state taxes. The discrete benefit recognized for the three months ended March 31, 2020 benefit was a result of a current year tax law change and the ability of the Company to now carry back certain losses. On March 27, 2020, President Trump signed into law the Coronavirus Aid, Relief and Economic Security Act (the "CARES Act"). The CARES Act provided both stimulus measures and a number of business tax provisions. The tax provisions included temporary changes regarding the utilization and five year carry back of losses generated in 2018, 2019 and 2020, temporary changes regarding interest deductions, technical corrections from prior tax legislation related to qualified improvement property, and various other measures. As of March 31, 2020, the Company intended to file (and subsequently filed in April 2020) a refund claim with the Internal Revenue Service (the "IRS") related to its 2017 tax liability by carrying back losses not previously claimed and thus recognized a tax benefit of $2.2 million for the three months ended March 31, 2020.
Liquidity and Capital Resources
In February 2020, the Company closed on a registered direct offering with institutional investors of
1,306,282
shares of the Company's common stock at a purchase price of
$3.98
per share. The Company's largest stockholder, Armistice Capital, LLC ("Armistice"), whose Chief Investment Officer Steve Boyd is a Cerecor director, participated in the offering by purchasing
1,256,282
shares of common stock from the Company. The net proceeds of the offering were approximately
$5.0 million
. In March 2020, the Company entered into a securities purchase agreement with Armistice pursuant to which the Company sold
1,951,219
shares of the Company’s common stock for a purchase price of
$2.05
per share, which represents the closing stock price the day prior to entering into the agreement. Net proceeds of the private placement were approximately
$3.9 million
. Additionally, in April 2020, the Company converted its shares of Aytu preferred stock that were acquired in the fourth quarter of 2019 and subsequently sold that common stock, which generated net proceeds of approximately $12.8 million.
In order to meet its cash flow needs, the Company applies a disciplined decision-making methodology as it evaluates the optimal allocation of the Company's resources between investing in the Company's existing pipeline assets and acquisitions or in-licensing of new assets. For the three months ended March 31, 2020, Cerecor generated a net loss of
$21.1 million
and negative
33
cash flow from operations of
$5.7 million
. As of March 31, 2020, Cerecor had an accumulated deficit of
$135.4 million
and a balance of
$5.7 million
in cash and cash equivalents.
The accompanying condensed consolidated financial statements have been prepared assuming the Company will continue as a going concern; however, the Company expects to incur additional losses in the future in connection with research and development activities and will require additional financing to fund its operations and to continue to execute its strategy. The Company plans to use its current cash on hand, which includes the cash generated from the sale of Aytu common shares in April 2020, the anticipated cash flows from the Company's profits from Millipred product sales and/or the potential proceeds from a possible out-license or sale of Millipred to a third party to offset costs related to its pipeline assets, business development, and costs associated with its organizational infrastructure; however, Cerecor expects to continue to incur significant expenses and operating losses for the immediate future as it continues to invest in the Company's pipeline assets. The Company’s ability to continue as a going concern through 2020 is dependent upon the Company’s ability to raise additional equity and/or debt capital, sell assets and obtain government funding; however, there can be no assurance that it will be able to do so nor that such activities will generate sufficient amounts on terms acceptable to the Company.
Over the long term, the Company's ultimate ability to achieve and maintain profitability will be dependent on, among other things, the development, regulatory approval, and commercialization of its pipeline assets, and the potential sale of any PRVs it receives, in order to support its cost structure and pipeline asset development.
These conditions raise substantial doubt about the Company’s ability to continue as a going concern within one year after the date that the financial statements are issued. To alleviate these conditions, the Company monetized its investment in Aytu generating net proceeds of $12.8 million in April 2020 and is evaluating the potential out-licensing or sale of Millipred, its non-core neurology pipeline assets and/or some combination of rights to future PRV sales, equity or debt financings, collaborations, other out-licensing arrangements, strategic alliances, federal and private grants, marketing, other distribution or licensing arrangements, or the sale of current or future assets. If the Company raises additional funds through collaborations, strategic alliances or licensing arrangements with third parties, the Company might have to relinquish valuable rights to its technologies, future revenue streams, research programs or product candidates. If the Company is not able to secure adequate additional funding, the Company may be forced to make reductions in spending, extend payment terms with suppliers, liquidate assets where possible or suspend or curtail planned programs. Due to the uncertainty regarding future financings and/or other potential options to raise additional funds, management has concluded that substantial doubt exists with respect to the Company’s ability to continue as a going concern within one year after the date that the financial statements are issued.
Uses of Liquidity
The Company uses cash to fund research and development expenses related to its rare pediatric and orphan disease pipeline, business development and costs associated with its organizational infrastructure.
Cash Flows
The following table summarizes our cash flows for the three
months ended March 31, 2020
and
2019
:
|
|
Three Months Ended March 31,
|
|||||||
|
|
2020
|
2019
|
||||||
|
|
(in thousands)
|
|||||||
|
Net cash provided by (used in):
|
|
|
||||||
|
Operating activities
|
$
|
(5,740
|
)
|
$
|
(3,122
|
)
|
||
|
Investing activities
|
(1,251
|
)
|
(166
|
)
|
||||
|
Financing activities
|
9,098
|
|
8,817
|
|
||||
|
Net increase in cash and cash equivalents
|
$
|
2,107
|
|
$
|
5,529
|
|
||
Net cash used in operating activities
Net cash used in operating activities was
$5.7 million
for the three
months ended March 31, 2020
, consisting primarily of a net loss of
$21.1 million
, which was driven by increased research and development activities as the Company continued to fund its pipeline of development assets, and non-cash adjustments to reconcile net loss to net cash used in operating activities including a $7.1 million gain related to the change in fair value of the Investment in Aytu and a $1.8 million gain related to the change in value of the Guarantee. This decrease was offset by the following non-cash adjustments: non-cash acquired IPR&D expense of $25.5 million and
34
non-cash stock-based compensation of $1.1 million. Additionally, changes in net assets, increased by a net $2.9 million, mainly driven by a $2.0 million increase in other receivables. Other receivables increased mainly due to a $2.2 million income tax receivable.
Net cash used in operating activities was $3.1 million for the three months ended March 31, 2019 and consisted primarily of a net loss of $7.5 million, offset by depreciation and amortization of $1.1 million, non-cash stock-based compensation expense of $0.6 million, and changes in working capital, primarily, an increase in accrued expenses of $2.0 million, largely related to the contractual minimum obligations. The net loss for the three months ended March 31, 2019 was driven by increased research and development activities incurred as the Company continued to fund its pipeline of development assets and also by increased sales and marketing expenses incurred to support commercial sales activities.
Net cash used in investing activities
Net cash used in investing activities was $1.3 million for the three months ended March 31, 2020 and consisted primarily of transaction costs incurred as part of the Aevi Merger, partially offset by the cash acquired as part of the merger.
Net cash used in investing activities was
$0.2 million
for the three
months ended March 31, 2020
and consisted primarily of the purchase of property and equipment in connection with the Company occupying its corporate headquarters during the first quarter of 2019.
Net cash provided by financing activities
Net cash provided by financing activities was
$9.1 million
for the three
months ended March 31, 2020
and consisted primarily of net proceeds of
$5.1 million
from a registered direct offering with certain institutional investors, which included Armistice, that closed in February 2020 for the sale of 1,306,282 shares of common stock of the Company, at a price of $3.98 per share. The Company also received
$3.9 million
from a private placement of equity securities with Armistice during March 2020.
Net cash provided by financing activities was $8.8 million for the three months ended March 31, 2019 and consisted primarily of net proceeds of approximately $9.0 million from the underwritten public offering of common stock for 1,818,182 shares of common stock of the Company, at a price to the public of $5.50 per share. The increase was partially offset by $0.2 million payment of contingent consideration related to the Avadel acquisition.
Critical Accounting Policies, Estimates, and Assumptions
This Management’s Discussion and Analysis of Financial Condition and Results of Operations is based on our unaudited condensed consolidated financial statements, which have been prepared in accordance with GAAP. In preparing the financial statements in conformity with GAAP, the Company makes estimates and assumptions that have an impact on assets, liabilities, revenue and expenses reported. These estimates can also affect supplemental information disclosed by us, including information about contingencies, risk, and financial condition. In our unaudited condensed consolidated financial statements, estimates are used for, but not limited to, revenue recognition, cost of product sales, stock-based compensation, fair value measurements (including those relating to the Guarantee and Investment in Aytu), cash flows used in management's going concern assessment, income taxes, goodwill, and other intangible assets and clinical trial accruals. The Company believes, given current facts and circumstances, our estimates and assumptions are reasonable, adhere to GAAP and are consistently applied. Inherent in the nature of an estimate or assumption is the fact that actual results may differ from estimates, and estimates may vary as new facts and circumstances arise. Our most critical accounting estimates and assumptions are included in our Annual Report on Form 10-K for the year ended December 31, 2019 filed with the SEC on March 11, 2020 except for the recently adopted accounting standards described in Note 2 to our unaudited condensed consolidated financial statements included elsewhere in this Quarterly Report on Form 10-Q. There have been no material changes to our critical accounting policies during the three months ended March 31, 2020
Off‑Balance Sheet Arrangements
We do not have any off‑balance sheet arrangements, as defined by applicable SEC rules and regulations.
Recently Adopted Accounting Pronouncements
See Item 1 of Part I, “Notes to Unaudited Financial Statements,” Note 2, of this Quarterly Report on Form 10-Q.
JOBS Act
35
The JOBS Act contains provisions that, among other things, reduce reporting requirements for an “emerging growth company.” As an emerging growth company, we have elected to not take advantage of the extended transition period afforded by the JOBS Act for the implementation of new or revised accounting standards and, as a result, will comply with new or revised accounting standards on the relevant dates on which adoption of such standards is required for non‑emerging growth companies.
36
Item 3. Quantitative and Qualitative Disclosures About Market Risk.
Interest Rate Risk
As a smaller reporting company, we are not required to provide the information required by this Item.
Item 4. Controls and Procedures.
Evaluation of Disclosure Controls and Procedures
As required by Rule 13a-15(b) and Rule 15d-15(b) of the Exchange Act, our management, including our principal executive officer and our principal financial officer, conducted an evaluation as of the end of the period covered by this Quarterly Report on Form 10-Q of the effectiveness of the design and operation of our disclosure controls and procedures. In designing and evaluating our disclosure controls and procedures, our management recognizes that any controls and procedures, no matter how well designed and operated, can provide only reasonable assurance of achieving the desired control objectives. Based on that evaluation, our principal executive officer and principal financial officer concluded that our disclosure controls and procedures were effective at the reasonable assurance level as of the end of the period covered by this Quarterly Report on Form 10-Q.
Disclosure controls and procedures include, without limitation, controls and procedures designed to ensure that information required to be disclosed by us in the reports we file or submit under the Exchange Act is accumulated and communicated to our management, including our principal executive officer and principal financial officer, as appropriate to allow timely decisions regarding required disclosure.
Changes in Internal Control Over Financial Reporting
There were no changes in our internal control over financial reporting identified in management’s evaluation pursuant to Rules 13a-15(d) or 15d-15(d) of the Exchange Act during the period covered by this Quarterly Report on Form 10-Q that materially affected, or are reasonably likely to materially affect, our internal control over financial reporting.
37
PART II – OTHER INFORMATION
Item 1. Legal Proceedings.
In November 2017, Cerecor acquired TRx Pharmaceuticals, LLC ("TRx") and its wholly-owned subsidiaries, including Zylera Pharmaceuticals, LLC, and its franchise of commercial medications (the "TRx Acquisition"). TRx was owned by Fremantle LLC ("Fremantle") and LRS International, LLC ("LRS", and collectively, the "former TRx owners"). A portion of the consideration for TRx Acquisition included shares of Cerecor common stock. The TRx Acquisition also included certain earn-outs for the former TRx owners for Cerecor achieving gross profit targets in the sales of the TRx acquired products. Currently, the former TRx owners beneficially own more than 10% of Cerecor's outstanding common stock.
On December 19, 2019, Cerecor, through its law firm, received a letter from an attorney on behalf of the former TRx owners dated December 18, 2019, which enclosed a draft complaint seeking relief against Cerecor and one of the members of its board of directors. The letter further threatened that if an immediate discussion regarding a settlement did not occur, that the lawsuit would be filed on December 24, 2019. However, as of the date of this filing, no lawsuit has been filed, and the parties have agreed to a pre-lawsuit mediation tentatively set for June 2020. The proposed complaint indicates that the former TRx owners would seek the following relief: (a) $3,000,000 on the grounds that commercially reasonable efforts to sell the acquired TRx products would have resulted in the gross profit earn-out target being reached; (b) that the $3,000,000 amount be trebled as a result of Cerecor's alleged improper conduct; (c) $9,200,000 as a result of alleged losses resulting from the alleged improper treatment of the former TRx owners as affiliates; and (d) the removal of any restrictions on the former TRx owners' shares of common stock in Cerecor. Cerecor disputes that the former TRx owners are entitled to the relief sought and intends to vigorously defend against any lawsuit filed on behalf of the former TRx owners.
Item 1A. Risk Factors.
In addition to the other information set forth in this Quarterly Report on Form 10-Q, you should carefully consider the factors discussed in Part I, “Item 1A. Risk Factors” in our Annual Report on Form 10-K for the year ended December 31, 2019, filed with the SEC on March 11, 2020 , which could materially affect our business, financial condition, or future results. The information presented below updates, and should be read in conjunction with, the risk factors and information disclosed in our Form 10-K. Except as presented below, there have been no material changes from the risk factors described in our Form 10-K. The risks described in our Annual Report on Form 10-K and below are not the only risks facing our company. Additional risks and uncertainties not currently known to us or that we currently deem to be immaterial also may materially adversely affect our business, financial condition, or future results of operations and the trading price of our common stock.
A pandemic, epidemic or outbreak of an infectious disease in the United States or elsewhere may adversely affect our business.
If a pandemic, epidemic or outbreak of an infectious disease occurs in the United States or elsewhere, our business may be adversely affected. In December 2019, a novel strain of coronavirus, COVID-19, was identified in Wuhan, China. This virus continues to spread globally and, as of March 2020, has spread to over 100 countries, including the United States. The spread of COVID-19 from China to other countries has resulted in the World Health Organization declaring the outbreak of COVID-19 as a “pandemic,” or a worldwide spread of a new disease, on March 11, 2020. Many countries around the world have imposed quarantines and restrictions on travel and mass gatherings to slow the spread of the virus. Employers (including us) are also required to prepare and increase as much as possible the capacity and arrangement for employees to work remotely. In addition, on March 11, 2020, the President of the United States issued a proclamation to restrict travel to the United States from foreign nationals who have recently been in certain European countries. We are still assessing the effect on our business, from the spread of COVID-19 and the actions implemented by the governments of the United States and elsewhere across the globe.
The spread of an infectious disease, including COVID-19, may also result in the inability of our suppliers to deliver supplies to us on a timely basis. Such events may result in a period of business disruption, and in reduced operations, any of which could materially affect our business, financial condition and results of operations. As of the date of this Quarterly Report on Form 10-Q, we do not know the extent to which COVID-19 will impact our business. These impacts will depend on future developments, which are highly uncertain and cannot be predicted, including new information which may emerge concerning the severity of COVID-19 and the actions to contain COVID-19 or treat its impact, among others.
With respect to the COVID-19 outbreak specifically, such outbreak could also potentially affect the business of the FDA, or other health authorities, which could result in delays in meetings related to planned clinical trials and ultimately of reviews and approvals of our product candidates. The spread of COVID-19 may also slow potential enrollment of clinical trials and reduce the number of eligible patients for future clinical trials. The COVID-19 outbreak and mitigation measures also have had and may continue
38
to have an adverse impact on global economic conditions which could have an adverse effect on our business and financial condition, including impairing our ability to raise capital when needed. The extent to which the COVID-19 outbreak impacts our business and operations will depend on future developments that are highly uncertain and cannot be predicted, including new information that may emerge concerning the severity of the virus and the actions to contain its impact.
The recent outbreak of COVID-19 may materially and adversely affect our clinical trial operations and our financial results.
The recent outbreak of COVID-19 originated in Wuhan, China, in December 2019 and has since spread to multiple countries, including the United States and several European countries where we expected to initiate enrollment for future clinical trials. The extent to which COVID-19 may impact our clinical trial operations will depend on future developments, which are highly uncertain and cannot be predicted with confidence, such as the duration of the outbreak, the severity of COVID-19, or the effectiveness of actions to contain and treat for COVID-19. The continued spread of COVID-19 globally could adversely impact our clinical trial operations in the United States and in Europe, including our ability to recruit and retain patients and principal investigators and site staff who, as healthcare providers, may have heightened exposure to COVID-19 if an outbreak occurs in their geography. In addition, if the FDA elects to delay face-to-face meetings for an extended period of time, we may have to delay the initiation of any additional clinical trials for which we require additional approval from the FDA, or, if we are seeking to commercialize our product candidates, such delay could force us to delay commercialization. Any decision by the FDA to delay meeting with us in light of COVID-19 could have a material adverse effect on our scheduled clinical trials or on our efforts to obtain commercialization approval, which could increase our operating expenses and have a material adverse effect on our financial results.
Moreover, COVID-19 may also affect employees of third-party contract research organizations located in affected geographies that we rely upon to carry out such enrollments and trials. Any negative impact COVID-19 has to patient enrollment or treatment could cause costly delays to clinical trial activities, which could adversely affect our ability to obtain regulatory approval for and to commercialize our product candidates, increase our operating expenses, and have a material adverse effect on our financial results.
39
Item 6. Exhibits.
|
Exhibit
Number
|
Description of Exhibit
|
|
|
10.1
|
||
|
10.2#
|
||
|
10.3#
|
||
|
10.4
|
||
|
10.5#+
|
||
|
10.6
|
||
|
10.7
|
||
|
10.8#
|
||
|
10.9*
|
||
|
10.10
|
||
|
10.11*
|
||
|
10.12*
|
||
|
10.13*
|
||
|
10.14*
|
||
40
|
10.15
|
||
|
10.16
|
|
|
|
10.17
|
||
|
10.18
|
||
|
10.19
|
||
|
10.20*
|
||
|
10.21
|
||
|
10.22
|
||
|
10.23*
|
||
|
10.24*
|
||
|
31.1+
|
||
|
31.2+
|
||
|
32.1+†
|
||
|
101.INS
|
XBRL Instance Document.
|
|
|
101.SCH
|
XBRL Taxonomy Extension Schema Document.
|
|
41
|
101.CAL
|
XBRL Taxonomy Extension Calculation Linkbase Document.
|
|
|
101.DEF
|
XBRL Taxonomy Extension Definition Linkbase Document.
|
|
|
101.LAB
|
XBRL Taxonomy Extension Label Linkbase Document.
|
|
|
101.PRE
|
XBRL Taxonomy Extension Presentation Linkbase Document.
|
|
# Management contract or compensatory agreement.
* Portions of this exhibit have been omitted pursuant to a request for confidential treatment on file with the Securities and Exchange Commission.
+ Filed herewith.
† This certification is being furnished solely to accompany this Quarterly Report pursuant to 18 U.S.C. Section 1350, and is not being filed for purposes of Section 18 of the Securities Exchange Act of 1934, as amended, and is not to be incorporated by reference into any filing of the registrant, whether made before or after the date hereof, regardless of any general incorporation language in such filing.
42
|
SIGNATURES
|
|||
|
Pursuant to the requirements of the Securities and Exchange Act of 1934, the registrant has duly caused this report to be signed on its behalf by the undersigned thereunto duly authorized.
|
|||
|
Cerecor Inc.
|
|||
|
|
|||
|
Date: May 7, 2020
|
/s/ Christopher Sullivan
|
||
|
Christopher Sullivan
|
|||
|
Interim Chief Financial Officer
|
|||
|
(on behalf of the registrant and as the registrant’s principal financial officer and principal accounting officer)
|
|||
43
TABLE OF CONTENTS
Part I - Financial InformationItem 1. Financial StatementsItem 2. Management S Discussion and Analysis Of Financial Condition and Results Of OperationsItem 3. Quantitative and Qualitative Disclosures About Market RiskItem 4. Controls and ProceduresPart II Other InformationItem 1. Legal ProceedingsItem 1A. Risk FactorsItem 6. Exhibits