AMERICAN WATER WORKS COMPANY, INC.
10-Ks and 10-Qs
|
|
|
|
|
|
|
|
|
|
|
|
|
|
|
|
|
|
|
|
|
|
|
|
|
|
|
|
|
|
|
|
|
|
|
|
|
|
|
|
|
|
|
|
|
|
|
|
|
|
|
|
|
|
|
|
UNITED STATES
SECURITIES AND EXCHANGE COMMISSION
Washington, D.C. 20549
FORM 10-K
|
|
|
☒
|
ANNUAL REPORT PURSUANT TO SECTION 13 OR 15(d) OF THE SECURITIES EXCHANGE ACT OF 1934
|
For the fiscal year ended
December 31, 2017
OR
|
☐
|
TRANSITION REPORT PURSUANT TO SECTION 13 OR 15(d) OF THE SECURITIES EXCHANGE ACT OF 1934
|
For the transition period from
to
Commission file: number 001-34028
AMERICAN WATER WORKS COMPANY, INC.
(Exact name of registrant as specified in its charter)
|
Delaware
|
51-0063696
|
|
(State or other jurisdiction of incorporation or organization)
|
(I.R.S. Employer Identification No.)
|
|
1025 Laurel Oak Road, Voorhees, NJ
|
08043
|
|
(Address of principal executive offices)
|
(Zip Code)
|
(856) 346-8200
(Registrant’s telephone number, including area code)
Securities registered pursuant to Section 12(b) of the Act:
|
Title of each class
|
Name of each exchange on which registered
|
|
|
Common stock, par value $0.01 per share
|
New York Stock Exchange, Inc.
|
|
Securities registered pursuant to Section 12(g) of the Act: None.
Indicate by check mark if the registrant is a well-known seasoned issuer, as defined in Rule 405 of the Securities Act. Yes
☒
No
☐
Indicate by check mark if the registrant is not required to file reports pursuant to Section 13 or Section 15(d) of the Act. Yes
☐
No
☒
Indicate by check mark whether the registrant (1) has filed all reports required to be filed by Section 13 or 15(d) of the Securities Exchange Act of 1934 during the preceding 12 months (or for such shorter period that the registrant was required to file such reports), and (2) has been subject to such filing requirements for the past 90 days. Yes
☒
No
☐
Indicate by check mark whether the registrant has submitted electronically and posted on its corporate Web site, if any, every Interactive Data File required to be submitted and posted pursuant to Rule 405 of Regulation S-T (§ 232.405 of this chapter) during the preceding 12 months (or for such shorter period that the registrant was required to submit and post such files). Yes
☒
No
☐
Indicate by check mark if disclosure of delinquent filers pursuant to Item 405 of Regulation S-K is not contained herein, and will not be contained, to the best of registrant’s knowledge, in definitive proxy or information statements incorporated by reference in Part III of this Form 10-K or any amendment to this Form 10-K.
☐
Indicate by check mark whether the registrant is a large accelerated filer, an accelerated filer, a non-accelerated filer, a smaller reporting company, or an emerging growth company. See the definitions of “large accelerated filer,” “accelerated filer,” “smaller reporting company,” and “emerging growth company” in Rule 12b-2 of the Exchange Act.:
|
Large accelerated filer
|
|
☒
|
|
Accelerated filer
|
|
☐
|
|
Non-accelerated filer
|
|
☐
|
(do not check if a smaller reporting company)
|
Smaller reporting company
|
|
☐
|
|
Emerging growth company
|
☐
|
|||||
If an emerging growth company, indicate by check mark if the registrant has elected not to use the extended transition period for complying with any new or revised financial accounting standards provided pursuant to Section 13(a) of the Exchange Act.
☐
Indicate by check mark whether the registrant is a shell company (as defined in Rule 12b-2 of the Act). Yes
☐
No
☒
State the aggregate market value of the voting and non-voting common equity held by non-affiliates computed by reference to the price at which the common equity was last sold, or the average bid and asked price of such common equity, as of the last business day of the registrant’s most recently completed second fiscal quarter.
Common Stock, $0.01 par value—
$12,477,500,000
as of June 30,
2017
(solely for purposes of calculating this aggregate market value, American Water has defined its affiliates to include (i) those persons who were, as of June 30,
2017
, its executive officers, directors or known beneficial owners of more than 10% of its common stock, and (ii) such other persons who were deemed, as of June 30,
2017
, to be controlled by, or under common control with, American Water or any of the persons described in clause (i) above).
Indicate the number of shares outstanding of each of the registrant’s classes of common stock as of the latest practicable date: Common Stock, $0.01 par value per share—
178,551,923
shares as of
February 15, 2018
.
DOCUMENTS INCORPORATED BY REFERENCE
Portions of the American Water Works Company, Inc. definitive proxy statement for the
2018
Annual Meeting of Stockholders to be filed with the Securities and Exchange Commission within 120 days after
December 31, 2017
are incorporated by reference into Part III of this report.
TABLE OF CONTENTS
|
|
|
Page
|
|
|
|
|
|
Item 1.
|
||
|
Item 1A.
|
||
|
Item 1B.
|
||
|
Item 2.
|
||
|
Item 3.
|
||
|
Item 4.
|
||
|
|
|
|
|
Item 5.
|
||
|
Item 6.
|
||
|
Item 7.
|
||
|
Item 7A.
|
||
|
Item 8.
|
||
|
Item 9.
|
||
|
Item 9A.
|
||
|
Item 9B.
|
||
|
|
|
|
|
Item 10.
|
||
|
Item 11.
|
||
|
Item 12.
|
||
|
Item 13.
|
||
|
Item 14.
|
||
|
|
|
|
|
Item 15.
|
||
|
Item 16.
|
||
FORWARD-LOOKING STATEMENTS
We have made statements in
Item 1—Business
,
Item 1A—Risk Factors
, and
Item 7—Management’s Discussion and Analysis of Financial Condition and Results of Operations
, and in other sections of this Form 10-K, or incorporated certain statements by reference into this Form 10-K, that are forward-looking statements within the meaning of Section 27A of the Securities Act of 1933, as amended, Section 21E of the Securities Exchange Act of 1934, as amended (the “Exchange Act”), and the Private Securities Litigation Reform Act of 1995. In some cases, these forward-looking statements can be identified by words with prospective meanings such as “intend,” “plan,” “estimate,” “believe,” “anticipate,” “expect,” “predict,” “project,” “assume,” “forecast,” “likely,” “uncertain,” “outlook,” “future,” “pending,” “goal,” “objective,” “potential,” “continue,” “seek to,” “may,” “can,” “should,” “will” and “could” or the negative of such terms or other variations or similar expressions. Forward-looking statements may relate to, among other things, our future financial performance, including our operation and maintenance (“O&M”) efficiency ratio, cash flows, our growth and portfolio optimization strategies, our projected capital expenditures and related funding requirements, our ability to repay debt, our projected strategy to finance current operations and growth initiatives, the impact of legal proceedings and potential fines and penalties, business process and technology improvement initiatives, trends in our industry, regulatory, legislative, tax policy or legal developments or rate adjustments, including rate case filings, filings for infrastructure surcharges and filings to address regulatory lag.
Forward-looking statements are predictions based on our current expectations and assumptions regarding future events. They are not guarantees or assurances of any outcomes, financial results or levels of activity, performance or achievements, and you are cautioned not to place undue reliance upon them. These forward-looking statements are subject to a number of estimates and assumptions, and known and unknown risks, uncertainties and other factors. Our actual results may vary materially from those discussed in the forward-looking statements included herein as a result of the factors discussed under
Item 1A—Risk Factors
, and the following important factors:
|
•
|
the decisions of governmental and regulatory bodies, including decisions to raise or lower customer rates;
|
|
•
|
the timeliness and outcome of regulatory commissions’ actions concerning rates, capital structure, authorized return on equity, capital investment, system acquisitions, taxes, permitting and other decisions;
|
|
•
|
changes in customer demand for, and patterns of use of, water, such as may result from conservation efforts;
|
|
•
|
limitations on the availability of our water supplies or sources of water, or restrictions on our use thereof, resulting from allocation rights, governmental or regulatory requirements and restrictions, drought, overuse or other factors;
|
|
•
|
changes in laws, governmental regulations and policies, including with respect to environmental, health and safety, water quality and emerging contaminants, public utility and tax regulations and policies, and impacts resulting from U.S., state and local elections;
|
|
•
|
weather conditions and events, climate variability patterns, and natural disasters, including drought or abnormally high rainfall, prolonged and abnormal ice or freezing conditions, strong winds, coastal and intercoastal flooding, earthquakes, landslides, hurricanes, tornadoes, wildfires, electrical storms and solar flares;
|
|
•
|
the outcome of litigation and similar governmental proceedings, investigations or actions, including matters related to the Freedom Industries chemical spill in West Virginia and the preliminarily approved global class action settlement agreement related to this chemical spill;
|
|
•
|
our ability to appropriately maintain current infrastructure, including our operational and information technology (“IT”) systems, and manage the expansion of our business;
|
|
•
|
exposure or infiltration of our critical infrastructure, operational technology and IT systems, including the disclosure of sensitive or confidential information contained therein, through physical or cyber attacks or other means;
|
|
•
|
our ability to obtain permits and other approvals for projects;
|
|
•
|
changes in our capital requirements;
|
|
•
|
our ability to control operating expenses and to achieve efficiencies in our operations;
|
|
•
|
the intentional or unintentional actions of a third party, including contamination of our water supplies or water provided to our customers;
|
|
•
|
our ability to obtain adequate and cost-effective supplies of chemicals, electricity, fuel, water and other raw materials that are needed for our operations;
|
|
•
|
our ability to successfully meet growth projections for our business and capitalize on growth opportunities, including our ability to, among other things, acquire and integrate water and wastewater systems into our regulated operations, and enter into contracts and other agreements with, or otherwise obtain, new customers in our market-based businesses;
|
|
•
|
risks and uncertainties associated with contracting with the U.S. government, including ongoing compliance with applicable government procurement and security regulations;
|
1
|
•
|
cost overruns relating to improvements in or the expansion of our operations;
|
|
•
|
our ability to maintain safe work sites;
|
|
•
|
our exposure to liabilities related to environmental laws and similar matters resulting from, among other things, water and wastewater service provided to customers, including, for example, our water service and management solutions that are focused on customers in the natural gas exploration and production market;
|
|
•
|
changes in general economic, political, business and financial market conditions;
|
|
•
|
access to sufficient capital on satisfactory terms and when and as needed to support operations and capital expenditures;
|
|
•
|
fluctuations in interest rates;
|
|
•
|
restrictive covenants in or changes to the credit ratings on us or our current or future debt that could increase our financing costs or funding requirements or affect our ability to borrow, make payments on debt or pay dividends;
|
|
•
|
fluctuations in the value of benefit plan assets and liabilities that could increase our cost and funding requirements;
|
|
•
|
changes in federal or state general, income and other tax laws, including any further rules, regulations, interpretations and guidance by the U.S. Department of the Treasury and state or local taxing authorities (collectively, the “Related Interpretations”) related to the enactment of the Tax Cuts and Jobs Act (the “TCJA”), the availability of tax credits and tax abatement programs, and our ability to utilize our U.S. federal and state income tax net operating loss (“NOL”) carryforwards;
|
|
•
|
migration of customers into or out of our service territories;
|
|
•
|
the use by municipalities of the power of eminent domain or other authority to condemn our systems, or the assertion by private landowners of similar rights against us;
|
|
•
|
difficulty or inability to obtain insurance, our inability to obtain insurance at acceptable rates and on acceptable terms and conditions, or our inability to obtain reimbursement under existing insurance programs for any losses sustained;
|
|
•
|
the incurrence of impairment charges related to our goodwill or other assets;
|
|
•
|
labor actions, including work stoppages and strikes;
|
|
•
|
the ability to retain and attract qualified employees;
|
|
•
|
civil disturbances or terrorist threats or acts, or public apprehension about future disturbances or terrorist threats or acts; and
|
|
•
|
the impact of new, and changes to existing, accounting standards.
|
These forward-looking statements are qualified by, and should be read together with, the risks and uncertainties set forth above and the risk factors included in
Item 1A—Risk Factors
and other statements contained in this Form 10-K, and you should refer to such risks, uncertainties and risk factors in evaluating such forward-looking statements. Any forward-looking statements we make speak only as of the date this Form 10-K was filed with the United States Securities and Exchange Commission (“SEC”). Except as required by the federal securities laws, we do not have any obligation, and we specifically disclaim any undertaking or intention, to publicly update or revise any forward-looking statements, whether as a result of new information, future events, changed circumstances or otherwise. New factors emerge from time to time, and it is not possible for us to predict all such factors. Furthermore, it may not be possible to assess the impact of any such factor on our businesses, either viewed independently or together, or the extent to which any factor, or combination of factors, may cause results to differ materially from those contained in any forward-looking statement. The foregoing factors should not be construed as exhaustive.
2
|
ITEM 1.
|
BUSINESS
|
Our Company
With a history dating back to
1886
, American Water is the largest and most geographically diverse, publicly-traded water and wastewater utility company in the United States, as measured by both operating revenues and population served. A holding company originally incorporated in Delaware in
1936
, we employ approximately
6,900
professionals who provide drinking water, wastewater and other related services to an estimated
15 million
people in
46
states, the District of Columbia and Ontario, Canada. The largest component of the Company’s business includes rate regulated subsidiaries that provide water and wastewater services, collectively presented as our “
Regulated Businesses
.” We conduct the majority of our business through the
Regulated Businesses
segment. We also operate several market-based businesses that provide a broad range of related and complementary water and wastewater services within
four
operating segments that individually do not meet the criteria of a reportable segment in accordance with generally accepted accounting principles in the United States (“GAAP”). These
four
, non-reportable operating segments are collectively presented as our “
Market-Based Businesses
,” which is consistent with how management assesses the results of these businesses.
Throughout this
Annual Report on Form 10-K
(this “Form 10-K”), unless the context otherwise requires, references to “we,” “us,” “our,” the “Company,” and “American Water” mean American Water Works Company, Inc. and its subsidiaries, taken together as a whole. References to “parent company” mean American Water Works Company, Inc., without its subsidiaries.
Regulated Businesses
Our primary business involves the ownership of utilities that provide water and wastewater services to residential, commercial, industrial, public authority, fire service and sale for resale customers. Our utilities operate in approximately
1,600
communities in
16
states in the United States, with approximately
3.4 million
active customer connections to our water and wastewater networks. Services provided by our utilities are generally subject to economic regulation by certain state utility commissions or other entities engaged in utility regulation, collectively referred to as Public Utility Commissions (“PUCs” or “Regulators”). Certain federal, state and local governments also regulate environmental, health and safety, and water quality matters. We report the results of the services provided by our utilities in our
Regulated Businesses
segment. Operating revenues for our
Regulated Businesses
were
$2,958 million
for
2017
,
$2,871 million
for
2016
and
$2,743 million
for
2015
, accounting for
88%
,
87%
and
87%
, respectively, of the Company’s total operating revenues for the same periods.
The following table geographically summarizes our
Regulated Businesses
’ operating revenues and the number of customers we serve by type of service, each as of and for the year ended
December 31, 2017
:
|
Operating Revenues (In millions)
|
Number of Customers (In thousands)
|
|||||||||||||||||||||||||
|
|
Water (a)
|
Wastewater
|
Total
|
% of Total
|
Water
|
Wastewater
|
Total
|
% of Total
|
||||||||||||||||||
|
New Jersey
|
$
|
698
|
|
$
|
41
|
|
$
|
739
|
|
25.0
|
%
|
639
|
|
48
|
|
687
|
|
20.5
|
%
|
|||||||
|
Pennsylvania
|
617
|
|
44
|
|
661
|
|
22.3
|
%
|
658
|
|
64
|
|
722
|
|
21.5
|
%
|
||||||||||
|
Illinois
|
284
|
|
20
|
|
304
|
|
10.3
|
%
|
284
|
|
33
|
|
317
|
|
9.5
|
%
|
||||||||||
|
Missouri
|
280
|
|
9
|
|
289
|
|
9.8
|
%
|
466
|
|
13
|
|
479
|
|
14.3
|
%
|
||||||||||
|
Indiana
|
222
|
|
—
|
|
222
|
|
7.5
|
%
|
302
|
|
—
|
|
302
|
|
9.0
|
%
|
||||||||||
|
California
|
219
|
|
3
|
|
222
|
|
7.5
|
%
|
175
|
|
3
|
|
178
|
|
5.3
|
%
|
||||||||||
|
West Virginia
|
143
|
|
1
|
|
144
|
|
4.9
|
%
|
166
|
|
1
|
|
167
|
|
5.0
|
%
|
||||||||||
|
Total - Top Seven States
(b)
|
2,463
|
|
118
|
|
2,581
|
|
87.3
|
%
|
2,690
|
|
162
|
|
2,852
|
|
85.1
|
%
|
||||||||||
|
Other states
(c)
|
353
|
|
24
|
|
377
|
|
12.7
|
%
|
470
|
|
31
|
|
501
|
|
14.9
|
%
|
||||||||||
|
Total Regulated Businesses
|
$
|
2,816
|
|
$
|
142
|
|
$
|
2,958
|
|
100.0
|
%
|
3,160
|
|
193
|
|
3,353
|
|
100.0
|
%
|
|||||||
|
(a)
|
Includes Other operating revenues, consisting primarily of fees, miscellaneous service charges and rents.
|
|
(b)
|
Our “Top Seven States” are determined based upon operating revenues.
|
|
(c)
|
Includes our utilities in the following states: Georgia, Hawaii, Iowa, Kentucky, Maryland, Michigan, New York, Tennessee and Virginia.
|
See
Item 7—Management’s Discussion and Analysis of Financial Condition and Results of Operations
and
Note 19—Segment Information
in the Notes to Consolidated Financial Statements for additional information.
3
Customers
Our
Regulated Businesses
have a large and geographically diverse customer base. A customer is defined as a person, business, municipality or any other entity that purchases our water or wastewater services as of the last business day of a reporting period. One single customer may purchase our services for use by multiple individuals or businesses, as is the case in many homes, apartment complexes, businesses and governmental entities.
The vast majority of our regulated water customers are metered, which allows us to measure and bill for our customers’ water usage, typically on a monthly basis. We employ a variety of methods of customer meter reading to monitor consumption. These methods range from meters with mechanical registers where consumption is manually recorded by meter readers, to meters with electronic registers capable of transmitting consumption data to proximity devices (touch read) or via radio frequency to mobile or fixed network data collectors. Our wastewater customers are billed either a flat rate or based upon their water consumption.
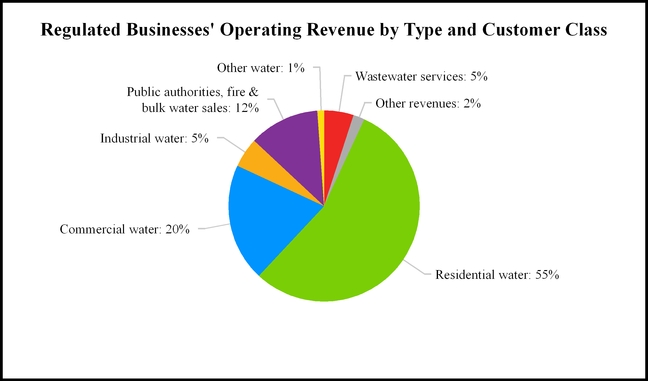
Residential customers make up a substantial portion of our customer base in all of the states in which we operate. We also serve: (i) commercial customers, such as hospitals, food and beverage providers and energy suppliers; (ii) industrial customers, such as large-scale manufacturers, mining and production operations; and (iii) public authorities, such as government buildings and other public sector facilities, including schools. In addition, we supply water through our distribution systems to public fire hydrants for firefighting purposes, to private fire customers for use in fire suppression systems in office buildings and other facilities, and to other water utilities and community water systems in the form of bulk water supplies for distribution to their own customers.
The following chart depicts the allocation of our
Regulated Businesses
’ operating revenue by type, including a breakout of the total water services revenues by class of customer, for the year ended
December 31, 2017
:
4
The following table summarizes the number of water and wastewater customers we served by class as of December 31:
|
|
2017
|
2016
|
2015
|
||||||||||||||
|
(In thousands)
|
Water
|
Wastewater
(a)
|
Water
|
Wastewater
|
Water
|
Wastewater
|
|||||||||||
|
Residential
|
2,872
|
|
182
|
|
2,846
|
|
171
|
|
2,829
|
|
133
|
|
|||||
|
Commercial
|
221
|
|
11
|
|
220
|
|
10
|
|
219
|
|
8
|
|
|||||
|
Industrial
|
4
|
|
—
|
|
4
|
|
—
|
|
4
|
|
—
|
|
|||||
|
Public & other
|
63
|
|
—
|
|
61
|
|
—
|
|
60
|
|
—
|
|
|||||
|
Total
|
3,160
|
|
193
|
|
3,131
|
|
181
|
|
3,112
|
|
141
|
|
|||||
|
(a)
|
In 2017, we acquired substantially all of the wastewater collection and treatment system assets of the Municipal Authority of the City of McKeesport, Pennsylvania (the “McKeesport system”). This acquisition included approximately
22,000
customer equivalents in total; comprised of
11,000
customer connections, which are reflected in the 2017 residential customer count in the table above, as well as service to an additional
11,000
customers under bulk contracts to
13
municipalities in Allegheny County, Pennsylvania.
|
Customer growth in our
Regulated Businesses
is primarily driven by: (i) adding new customers to our customer base through acquisitions of water and/or wastewater utility systems; (ii) organic population growth (or decline) in our authorized service areas; and (iii) sale of water to other water utilities and community water systems.
Capital Investment
On an annual basis, approximately
2 trillion
gallons of treated water are lost in the United States through more than
240,000
main breaks at an estimated cost of
$2.6 billion
. This represents approximately
20%
of all treated water in the country. In addition, every year approximately
900 billion
gallons of untreated sewage is discharged into the country’s rivers and streams. The aging water and wastewater infrastructure in the United States is in need of replacement and modernization. In 2017, the American Society of Civil Engineers published its
Report Card for America’s Infrastructure,
in which it gave the drinking water industry a grade of “D” and the wastewater infrastructure a grade of “D+,” primarily because much of the infrastructure is nearing the end of its useful life. As documented in the American Water Works Association’s (the “AWWA”)
Buried No Longer: Confronting America’s Water Infrastructure Challenge
, restoring the country’s existing water systems as they reach the end of their useful lives and expanding them to serve a growing population will cost at least $1 trillion between 2011 and 2035, if we are to maintain current levels of water service. In addition, increased regulation related to water quality and the management of water and wastewater residuals’ discharges, which began with the passage of the Clean Water Act in 1972 and the Safe Drinking Water Act in 1974, is also a primary driver for the need to modernize.
To address the growing infrastructure needs in the areas we serve, we plan to invest
$7.2 billion
over the next five years, including a range of
$1.4 billion
to
$1.5 billion
in 2018, for capital improvements to our Regulated Businesses’ water and wastewater infrastructure, largely aimed for pipe replacement and upgrading aging water and wastewater treatment facilities. We have proactively doubled our pipe renewal rate over a five year period, from 2011 to 2016, from a 250 year replacement cycle to a 120 year replacement cycle, which we anticipate will enable us to replace nearly 2,000 miles of mains and collection pipes over the next five years. In addition, during this same five year period, capital investment in treatment plants, storage tanks and other key, above-ground facilities has increased over 10%, further addressing aging infrastructure and emerging regulatory compliance needs.
Economic Regulation and Rate Making
Our
Regulated Businesses
operate under a regulatory compact whereby, in exchange for exclusive rights to provide water and wastewater services in defined service territories, we have an obligation to serve customers within those territories requesting service, within reasonable limits. In return for agreeing to invest capital into our water and wastewater systems, we are given the opportunity to recover our costs of doing business and earn a reasonable rate of return on our investments.
The operations of our
Regulated Businesses
are generally subject to economic regulation by PUCs in the state in which they operate, with the primary responsibility of the PUCs to promote the overall public interest by balancing the interest of customers and utility investors. Specific authority might differ from state to state, but in most states PUCs approve rates charged to customers, accounting treatments, long-term financing programs and cost of capital, capital expenditures, O&M expenses, taxes, transactions and affiliate relationships, reorganizations and mergers and acquisitions. Regulatory policies vary from state to state and could potentially change over time. These policies will affect the timing, as well as the extent, of recovery of expenses and the realized return on invested capital.
5
The process to obtain approval for a change in rates generally occurs by way of a rate case filed by the utility with the PUC on a periodic basis. The timing of rate case filings is typically determined by either periodic requirements in the regulatory jurisdiction or by the utility’s need to increase its revenue to recover capital investment costs, changes in operating revenues, operating costs or other market conditions. Our rate case management program is guided by the principles of obtaining timely recovery of capital investment costs, recognition of declining sales resulting from reduced consumption and appropriate recovery of utility operating and maintenance costs, including costs incurred for compliance with environmental regulations. The program attempts to minimize “regulatory lag,” the time between the occurrence of an event that triggers a change in the utility’s revenue requirement and its recognition in rates. It is, for example, the time between when an investment in plant is placed into service for the benefit of the customer and when the Company can begin earning a return of and on the investment through the ratemaking process. It also applies to the lag in the recognition in rate recovery of changes in expenses and revenues.
Our
Regulated Businesses
support regulatory practices at the PUCs and state legislatures that mitigate the adverse impact of regulatory lag. Examples of approved regulatory practices include:
|
Regulatory Practices
|
Description
|
States Allowed
|
||
|
Infrastructure replacement surcharges
|
Allows rates to change periodically, outside a general rate proceeding, to reflect recovery of investments made to replace infrastructure necessary to sustain safe, reliable services for our customers. These mechanisms typically involve periodic filings and reviews, to ensure transparency.
|
IA, IL, IN, MO, NJ, NY, PA, TN, VA, WV
|
||
|
Future test year
|
A test period used for setting rates, that begins with the date new rates are effective. This allows current or projected revenues, expenses and investments to be collected on a timelier basis.
|
CA, HI, IL, IN, KY, NY, PA, TN, VA
|
||
|
Hybrid test year
|
Allows an update to historical data for “known and measurable” changes that occur subsequent to the historical test year.
|
IA, MD, MO, NJ, WV
|
||
|
Utility plant recovery mechanisms
|
Allows recovery of the full return on utility plant costs during the construction period, instead of capitalizing an allowance for funds used during construction. In addition, some states allow the utility to seek pre-approval of certain capital projects and associated costs. In this pre-approval process, the PUC may assess the prudency of such projects.
|
CA, IL, KY, NY, PA, TN, VA
|
||
|
Expense mechanisms
|
Allows changes in certain operating expenses, which may fluctuate based on conditions beyond the utility’s control, to be recovered outside of a general rate proceeding or deferred until the next general rate proceeding.
|
CA, IL, MD, MO, NJ, NY, PA, TN, VA, WV
|
||
|
Revenue stability mechanisms
|
Separates a water utility’s cost recovery from the amount of water it sells to recover its fixed costs and on-going infrastructure investment needs. Such a mechanism adjusts rates periodically to ensure that a utility’s revenue will be sufficient to cover its costs regardless of sales volume, including recognition of declining sales resulting from reduced consumption, while providing an incentive for customers to use water more efficiently.
|
CA, IL, NY
|
||
|
Consolidated tariffs
|
Use of a unified rate structure for water systems owned and operated by a single utility, which may or may not be physically interconnected. The consolidated tariff pricing structure may be used fully or partially in a state and is generally used to prioritize capital investments and moderate the impact of periodic fluctuations in local costs while lowering administrative costs for customers. Pennsylvania also permits a blending of water and wastewater revenue requirements.
|
IA, IL, IN, KY, MD, MO, NJ, PA, VA, WV
|
||
We pursue or seek enhancement to these regulatory practices to facilitate efficient recovery of our costs and investments in order to continue to provide safe, reliable and affordable services to our customers. The ability to seek regulatory treatment as described above does not guarantee that the state PUCs will accept our proposal in the context of a particular rate case, and these practices may reduce, but not eliminate, regulatory lag associated with traditional rate making processes. It is also our strategy to expand their use in areas where they may not currently apply.
6
Acquisitions and Strategic Growth
The U.S. water and wastewater industries include investor-owned systems as well as municipal systems that are owned and operated by local governments or governmental subdivisions. Both industries are highly fragmented. According to the Environmental Protection Agency (“EPA”), approximately
84%
of the United States water market is served by municipal systems and approximately
98%
of the country’s wastewater systems are government owned. The EPA also estimates that there are approximately
50,000
community water systems and approximately
20,000
community wastewater systems in the United States, with over half of the community water systems serving a population of
500
or less. This large number of relatively small, fragmented water and wastewater systems may result in inefficiencies in the marketplace, since such utilities may not have the operating expertise, financial and technological capability or economies of scale to provide services or raise capital as efficiently as larger utilities. Larger utilities that have greater access to capital are generally more capable of making mandated and other necessary infrastructure upgrades to their water and wastewater systems. In addition, water and wastewater utilities with large customer bases, spread across broad geographic regions, may more easily absorb the impact of significant variations in precipitation and temperatures, such as droughts, excessive rain and cool or warm temperatures in specific areas. Larger utilities generally are able to spread support services over a larger customer base, thereby reducing the costs to serve each customer. Since many administrative and support activities can be efficiently centralized to gain economies of scale, companies that participate in industry consolidation have the potential to improve operating efficiencies, lower costs per unit and improve service at the same time.
A fundamental aspect of our growth strategy is to pursue acquisitions of small and medium water and/or wastewater systems of between 1,000 and 30,000 customer connections, in close geographic proximity to areas where we operate our
Regulated Businesses
. The close proximity of acquisition opportunities to our regulated footprint allows us to integrate and manage the acquired systems and operations primarily using our existing management and to achieve operational efficiencies and prioritize capital investment needs. Our current customer mix of
94%
water and
6%
wastewater also presents strategic opportunities for wastewater growth and systems consolidation, adding wastewater customers where we already serve water customers. We intend to continue to expand our regulated footprint geographically by acquiring water and wastewater systems in our existing markets and, if appropriate, pursue acquisition opportunities in certain domestic markets where we do not currently operate our
Regulated Businesses
. Before entering new regulated markets, we will evaluate the business and regulatory climates to ensure that we will have the opportunity to achieve an appropriate rate of return on our investment while maintaining our high standards for providing safe, reliable and affordable services to our customers, as well as a line of sight to grow our base customers to a significant level to attain efficiencies after entering the new market.
More stringent environmental, health and safety, and water quality regulations, the amount of infrastructure in need of significant capital investment and financial challenges are driving more municipalities to consider selling their water and wastewater assets. For example, in 2015, New Jersey enacted the Water Infrastructure Protection Act, which allows municipalities with a water or wastewater system that meets certain emergent conditions, to allow it to sell the system on an expedited basis without a referendum. Also, in 2017, New Jersey enacted the Water Quality Accountability Act, which sets new operational standards for all water utilities in New Jersey, including municipal and investor-owned utilities. This law imposes new requirements in areas such as cybersecurity, asset management, water quality reporting, remediation of notices of violation, and hydrant and valve maintenance.
We also support full optionality for municipalities, including state legislation that enables the consolidation of the largely fragmented water and wastewater industries through fair market valuations of purchased property and the consolidation of water and wastewater rates. Our
Regulated Businesses
in California, Illinois, Indiana, Missouri, New Jersey and Pennsylvania have access to fair market value legislation for private sector investment in public sector systems. Fair market value assessment of water and wastewater systems is an alternative to the traditional depreciated original cost method of valuation, providing municipalities with a fair and objective purchase price that is more reflective of the assets’ value, while the utility has increased assurance of recovering investment over the life of the assets. Ultimately, we believe that many communities could benefit from receiving safe and reliable water and wastewater service from an experienced utility with proven access to capital and financial, technical, and managerial resources.
Consolidated tariffs use a unified rate structure for systems owned and operated by a single utility, which may or may not be physically interconnected. Consolidated tariff pricing moderates the impact of periodic fluctuations in local costs and promotes a more universal water infrastructure investment in the state. As a result, consolidated tariffs can make it easier to incorporate new systems into an existing utility and can ensure economies of scale for even the smallest of systems and prioritize capital needs across the state. Overall, this brings cost-effective, higher quality services to a larger number of citizens. Ten of our regulated subsidiaries currently have some form of consolidated tariff pricing, including Illinois, Indiana, Iowa, Kentucky, Maryland, Missouri, New Jersey, Pennsylvania, Virginia, and West Virginia.
7
Competition
In our
Regulated Businesses
, we generally do not face direct competition in our existing markets because: (i) we operate in those markets pursuant to certificates of public convenience and necessity (or similar authorizations) issued by state PUCs; and (ii) the high cost of constructing a new water and wastewater system in an existing market creates a high barrier to market entry. However, our
Regulated Businesses
do face competition from governmental agencies, other investor-owned utilities, large industrial customers with the ability to provide their own water supply/treatment process and strategic buyers that are entering new markets and/or making strategic acquisitions. When pursuing acquisitions, our largest investor-owned competitors, based on a comparison of operating revenues and population served, are Aqua America, Inc., Suez North America, American States Water Company and California Water Service Group. From time to time, we also face competition from infrastructure funds, multi-utility companies and others, such as Algonquin Power and Utilities Corp. and Corix.
Condemnation and Eminent Domain
All or portions of our
Regulated Businesses
’ utility assets could be acquired by state, municipal or other government entities through one or more of the following methods: (i) eminent domain (also known as condemnation); (ii) the right of purchase given or reserved by a municipality or political subdivision when the original certificate of public convenience and necessity was granted; and (iii) the right of purchase given or reserved under the law of the state in which the utility subsidiary was incorporated or from which it received its certificate. The acquisition consideration related to such a proceeding initiated by a local government may be determined consistent with applicable eminent domain law, or may be negotiated or fixed by appraisers as prescribed by the law of the state or in the particular franchise or charter.
Furthermore, the law in certain jurisdictions in which our
Regulated Businesses
operate, including, for example, California, provides for eminent domain rights allowing private property owners to seek just compensation against a public utility, if a public utility’s infrastructure has been determined to be a substantial cause of damage to that property. In these actions, the plaintiff would not have to prove that the public utility acted negligently. These actions have occurred in connection with events such as floods, mudslides and debris flow, broken water mains, landslides and wild and brush fires.
Water Supply and Wastewater Services
Our
Regulated Businesses
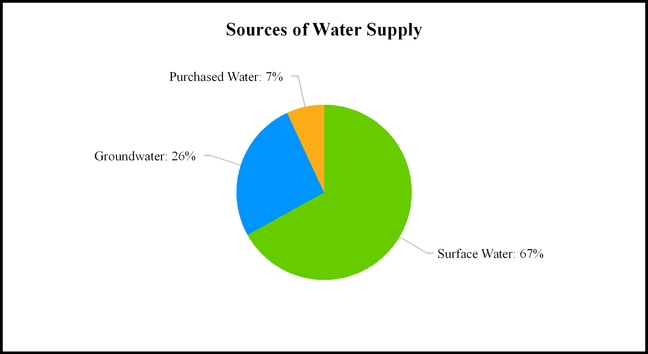
generally own the physical assets used to store, pump, treat and deliver water to our customers and collect, treat, transport and recycle wastewater. Typically, we do not own the water itself, which is held in public trust and is allocated to us through contracts, permits and allocation rights granted by federal and state agencies or through the ownership of water rights pursuant to local law. We are dependent on defined sources of water supply and obtain our water supply from surface water sources such as reservoirs, lakes, rivers and streams; from groundwater sources, such as wells and aquifers; and water purchased from third party water suppliers. The level of treatment we apply to the water varies significantly depending upon the quality of the water source and customer stipulations. Surface water sources typically generally require significant treatment, while groundwater sources require chemical treatment only.
8
The following chart depicts our sources of water supply as of
December 31, 2017
:
The percentages of water supply by source type for our top seven states for
2017
were as follows:
|
|
Surface Water
|
Ground Water
|
Purchased Water
|
||
|
New Jersey
|
72%
|
24%
|
4%
|
||
|
Pennsylvania
|
91%
|
7%
|
2%
|
||
|
Illinois
|
53%
|
36%
|
11%
|
||
|
Missouri
|
80%
|
19%
|
1%
|
||
|
Indiana
|
44%
|
56%
|
—
|
||
|
California
|
—
|
65%
|
35%
|
||
|
West Virginia
|
100%
|
—
|
—
|
||
Our ability to meet the existing and future water demands of our customers depends on an adequate water supply. Drought, governmental restrictions, overuse of sources of water, the protection of threatened species or habitats, contamination or other factors may limit the availability of ground and surface water. We employ a variety of measures in an effort to obtain adequate sources of water supply, both in the short-term and over the long-term. The geographic diversity of our service areas may mitigate some of the economic effects on the water supply associated with weather extremes we might encounter in any particular service territory. For example, in any given summer, some areas may experience drier than average weather, which may reduce the amount of source water available, while other areas we serve may experience wetter than average weather.
9
In our long-term planning, we evaluate quality, quantity, growth needs and alternate sources of water supply as well as transmission and distribution capacity. Water supply is seasonal in nature and weather conditions can have a pronounced effect on supply. In order to ensure that we have adequate water supply, we use long-term planning processes and maintain contingency plans to minimize the potential impact on service caused by climate variability and a wide range of weather fluctuations. In connection with supply planning for most surface or groundwater sources, we employ models to determine safe yields under different rainfall and drought conditions. Surface and ground water levels are routinely monitored so that supply capacity deficits may, to the extent possible, be predicted and mitigated through demand management and additional supply development. An example of our use of long-term planning to ensure that we have adequate water supply is our involvement in the Monterey Peninsula Water Supply Project (the “Water Supply Project”) in California. The Water Supply Project includes the construction of a desalination plant, owned by California-American Water Company (“Cal Am”), our wholly owned subsidiary, and the construction of wells that would supply water to the desalination plant. In addition, the Water Supply Project also includes Cal Am’s purchase of water from a groundwater replenishment project between the Monterey Regional Water Pollution Control Agency and the Monterey Peninsula Water Management District (the “MPWMD”). The Water Supply Project is intended, among other things, to fulfill obligations of Cal Am to eliminate unauthorized diversions from the Carmel River as required under orders of the California State Water Resources Control Board (the “SWRCB”).
Wastewater services involve the collection of wastewater from customers’ premises through sewer lines. The wastewater is then transported through a sewer network to a treatment facility, where it is treated to meet required regulatory standards for wastewater before being returned to the environment. The solid waste by-product of the treatment process is disposed of or recycled in accordance with applicable standards and regulations.
Seasonality
Customer demand for our water service is affected by weather and tends to vary with temperature, rainfall levels and the frequency of rainfall. Customer demand is generally greater during the warmer months, primarily due to increased water usage for irrigation systems and other outdoor water use. As such, we typically expect our operating revenues to be the highest in the third quarter of each year. Weather that is hotter and drier than average generally increases operating revenues whereas, weather that is cooler and/or wetter than average generally serves to suppress customer water demand and can reduce water operating revenues. Three of our jurisdictions, California, Illinois and New York, have adopted revenue stability mechanisms which permit us to collect state PUC-authorized revenue for a given period which is not tied to the volume of water sold during that period, thereby lessening the impact of weather variability. See “
Economic Regulation and Rate Making
” for additional information regarding revenue stability mechanisms.
Market-Based Businesses
Through our
Market-Based Businesses
, we provide a broad range of related and complementary water and wastewater services to military bases, municipalities, gas exploration and production companies, as well as commercial, industrial and residential customers. These businesses are not subject to economic regulation by state PUCs and the services provided do not require significant capital investment. Operating revenues for our
Market-Based Businesses
were
$422 million
for
2017
,
$451 million
for
2016
and
$434 million
for
2015
, accounting for
13%
,
14%
and
14%
, respectively, of the Company’s total operating revenues for the same periods. Included within our
Market-Based Businesses
’ results is operating revenues attributed to Canadian operations of
$5 million
for
2017
and
$6 million
for both
2016
and
2015
, respectively.
Our
Market-Based Businesses
are comprised of
four
operating segments:
|
•
|
Military Services Group, which enters into long-term contracts with the U.S. government to provide water and wastewater services on various military bases;
|
|
•
|
Homeowner Services Group, which provides warranty-type services to homeowners and smaller commercial customers to protect against the cost of repairing broken or leaking water pipes and clogged or blocked sewer pipes on their premises, and other services;
|
|
•
|
Contract Operations Group, which enters into contracts with municipal, commercial and industrial customers, primarily to operate and manage water and wastewater facilities and other related services; and
|
|
•
|
Keystone Clearwater Solutions, LLC (“Keystone”), which provides customized water service and management solutions for natural gas exploration and production companies and customers in the municipal water services market.
|
10
Military Services Group
Our Military Services Group has been granted contracts to operate on
13
military bases under 50-year contracts with the U.S. government as part of its Utility Privatization Program. See
Item 7—Management’s Discussion and Analysis of Financial Condition and Results of Operations
—Strategic Focus and 2017 Achievements—Growth for additional information. The scope of these contracts generally includes the O&M of the bases’ water and wastewater systems and a capital program focused on asset replacement and, in certain instances, systems expansion. The replacement of assets assumed when a contract is awarded to the Company is funded from the contract fee. At times, new assets are required to support the base’s mission and the construction of these assets are funded by the U.S. government as additional work under the contract. The current capital program does not use the Company’s equity or debt borrowings; however, we may make limited short-term working capital investments under these contracts and some working capital is used to fund work-in-process until paid by the U.S. government.
The contract price for
nine
of our contracts with the U.S. government is subject to redetermination two years after commencement of operations, and every three years thereafter. Price redetermination is a contract mechanism to periodically adjust the service fee in the next period to reflect changes in contract obligations and anticipated market conditions. The remaining
four
contracts with the U.S. government are subject to annual price adjustments under a mechanism similar to price redetermination, called “Economic Price Adjustment.” All of these contracts may be terminated, in whole or in part, prior to the end of the 50-year term for convenience of the U.S. government or as a result of default or non-performance by the subsidiary performing the contract. In either event, pursuant to termination provisions applicable to these contracts, we would be entitled to recover allowable costs that we may have incurred under the contract, plus the contract profit margin on incurred costs. Our backlog of revenue associated with our contracts with the U.S. government is approximately
$3.6 billion
, with an average remaining contract term of 42 years.
Homeowner Services Group
Our Homeowner Services Group, through our various protection programs, provides services to domestic homeowners and smaller commercial customers to protect against repair costs for interior and external water and sewer lines, interior electric lines, heating and cooling systems and water heaters, as well as power surge protection and other related services. Our LineSaver™ program involves partnering with utilities, municipalities and other organizations to offer our protection programs to customers serviced by or affiliated with those municipalities and organizations. Terms of these partnership agreements are typically three to five years in length, with optional renewals. As of
December 31, 2017
, our Homeowner Services Group had approximately
1.7 million
customer contracts in
43
states and the District of Columbia, and
10
LineSaver™ partnership agreements with municipalities and other organizations.
Contract Operations Group
Our Contract Operations Group enters into contracts to provide O&M services, including the delivery of design-build-operate projects and the provision of water and wastewater operations, maintenance and management services, to municipal and regional governmental entities through public-private partnerships, as well as industrial customers who possess a wide range of water quality and regulatory compliance needs. Historically, we have made minimal long-term capital investment under these contracts; instead we perform our services for a fee. Occasionally, we provide our customers with financing for capital projects as part of a long-term O&M partnership. As of
December 31, 2017
, our Contract Operations Group had
33
contracts across the United States and Canada, varying in size and scope, with an average remaining contract term of 3
years. In the course of pursuing our long-term strategy and growth initiatives for our Market-Based Businesses, we will concentrate on optimizing the portfolio of contracts in our Contract Operations Group, which will involve strategic decisions around the pursuit of renewals of our current contracts approaching expiration, as well as the sale of certain contracts that fall outside of our strategic focus.
Keystone
In July 2015, we acquired a
95%
interest in Water Solutions Holdings, LLC, including its wholly owned subsidiary, Keystone. Keystone is a water service and management solutions company that serves natural gas exploration and production customers in the Appalachian Basin, as well as customers in the municipal water services market. Keystone is primarily focused on customized water transfer, sourcing, recycling and storage services, along with pipeline construction and related O&M services. Keystone operates under master service agreements that are generally shorter term in nature. When the initial term of these agreements expire, they typically renew automatically on an annual basis and generally are cancelable by either party with 30 days prior notice. As of
December 31, 2017
, Keystone serves approximately
35
customers.
11
Competition
We face competition in our
Market-Based Businesses
from a number of service providers, including American States Water Company, Suez North America, and Veolia Environnement S.A. in our Military Services Group, and Pivotal Home Solutions (owned by Southern Company Gas) and HomeServe USA in our Homeowner Services Group. Our Contract Operations Group competes in a highly competitive market in order to secure new O&M contracts, as these contracts are awarded based on a combination of customer relationships, service levels, competitive pricing, references and technical expertise. We also face competition in maintaining existing O&M contracts to which we are a party, as the municipal and industrial fixed term contracts frequently come up for renegotiation and are subject to an open bidding process. Competitors of our Contract Operations Group include Suez North America, Veolia Environnement S.A., Inframark, LLC and Woodard & Curran. Keystone currently faces competition from water service providers that typically provide particular segments of the water management cycle, such as Select Energy Services, Inc., TETRA Technologies, Inc. and Fluid Delivery Solutions, LLC.
Environmental, Health and Safety, and Water Quality Regulation
Our water and wastewater operations, including the services provided by both our
Regulated Businesses
and
Market-Based Businesses
, are subject to extensive federal, state and local laws and regulations, and in the case of our Canadian operations, Canadian laws and regulations governing the protection of the environment, health and safety, the provision of water and wastewater services, particularly with respect to the quality of water we deliver to our customers, and the manner in which we collect, treat, discharge, recycle and dispose of wastewater. These regulations include the Safe Drinking Water Act, the Lead and Copper Rule (“LCR”), the Reduction of Lead in Drinking Water Act and the Clean Water Act. We are subject to various federal, state, local and Canadian laws and regulations governing the storage of hazardous materials, the management and disposal of hazardous and solid wastes, discharges to air and water, the cleanup of contaminated sites, dam safety and other matters relating to the protection of the environment and health and safety. State PUCs also set conditions and standards for the water and wastewater services we deliver.
Environmental, health and safety, and water quality regulations are complex and change frequently. For example, in 2017, the New Jersey Department of Environmental Protection announced that it would seek to adopt more stringent maximum contaminant levels for perfluorooctoanic acid, or PFOA, and perfluorononanoic acid, or PFNA. The overall trend has been that they have become increasingly stringent over time. As newer or stricter standards are introduced, our capital and operating costs could increase. We incur substantial costs associated with compliance with the environmental, health and safety, and water quality standards to which our operations are subject. In the past, our
Regulated Businesses
have generally been able to recover the costs associated with compliance; however, this recovery is affected by regulatory lag and the corresponding uncertainties surrounding rate recovery. We estimate that we will make capital expenditures of
$96 million
during
2018
and
$138 million
during
2019
for environmental control facilities, which we define for this purpose as any project (or portion thereof) that involves the preservation of air, water or land. We also maintain an environmental program that includes responsible business practices, compliance with environmental laws and regulations, and effective use of natural resources. We believe that our operations are materially in compliance with, and in many cases surpass, minimum standards required by applicable environmental laws and regulations.
Our operations also involve the use, storage and disposal of hazardous substances and wastes. For example, our water and wastewater treatment facilities store and use chlorine and other chemicals that generate wastes that require proper handling and disposal under applicable environmental requirements. We also could incur remedial costs in connection with any contamination relating to our operations or facilities or our off-site disposal of wastes. The Comprehensive Environmental Response, Compensation, and Liability Act of 1980 (“CERCLA”), authorizes the EPA, and comparable state laws authorize state environmental authorities, to issue orders and bring enforcement actions to compel responsible parties to investigate and take remedial actions at any site that is determined to present an actual or potential threat to human health or the environment because of an actual or threatened release of one or more hazardous substances. Parties that generated or transported hazardous substances to such sites, as well as the owners and operators of such sites, may be deemed liable, without regard to fault, under CERCLA or comparable state laws. Although we are not aware of any material cleanup or decontamination obligations, the discovery of contamination or the imposition of such obligations in the future could result in additional costs. Our facilities and operations are also subject to requirements under the U.S. Occupational Safety and Health Act and inspections thereunder. Certain of our subsidiaries are involved in pending legal proceedings relating to environmental matters. See
Item 3—Legal Proceedings
for additional information.
Safe Drinking Water Act
The Safe Drinking Water Act and related regulations establish national quality standards for drinking water. The EPA has issued rules governing the levels of numerous, naturally occurring and man-made chemical and microbial contaminants and radionuclides allowable in drinking water, and continues to propose new rules. These rules also prescribe testing requirements for detecting regulated contaminants, the treatment systems that may be used for removing those contaminants, and other requirements. To date, the EPA has set standards for approximately 90 contaminants and indicators for drinking water, and there is a process in place to make a regulatory determination on at least five additional compounds every five years.
12
To help formulate the basis for future regulations, the EPA has the authority to require monitoring for additional, unregulated contaminants under the Unregulated Contaminant Monitoring Rule (the “Rule”). Our laboratory and many of our treatment systems are preparing for the fourth round of testing under the Rule, which will begin in 2018. There are thousands of other chemical compounds that are not regulated, many of which are lacking a testing methodology, occurrence data, health effects information and/or treatment technology. The process of developing new drinking water standards is long and complex, but we actively participate with the EPA and other water industry groups by sharing research and water quality operational knowledge. See Item 1—Business—Research and Development—Emerging Containments for further discussion.
To effect the removal or inactivation of microbial organisms, the EPA has established various rules to improve the disinfection and filtration of drinking water and to reduce consumers’ exposure to disinfectants and by-products of the disinfection process. In 2006, the EPA issued the Long-Term 2 Enhanced Surface Water Treatment Rule and the Stage 2 Disinfectants and Disinfection Byproduct Rule and, later in 2006, finalized the Ground Water Rule, applicable to systems providing water from underground sources. In 2016, the revised Total Coliform Rule implemented a “find and fix” process where exceeding bacterial trigger levels requires an assessment to correct any sanitary defects. We are within the EPA’s time frame for compliance of these standards, which includes sample collection, data analysis, engineering planning and system implementation. Recent monitoring under the Long-Term 2 Rule has resulted in the need for more than 30 of our surface water systems to provide additional protection against cryptosporidium. In most cases, this will involve installing UV disinfection at an estimated cost ranging from $150 million to $250 million. Further, the EPA is actively considering regulations for a number of contaminants, including strontium, hexavalent chromium, fluoride, nitrosamines, perchlorate, some pharmaceuticals and certain volatile organic compounds. We do not anticipate that any such regulations, if enacted, will require implementation in 2018.
Across the Company, we conduct over one million water quality tests each year at our laboratory facilities and plant operations, including continuous on-line instrumentations such as monitoring turbidity levels, disinfectant residuals and adjustments to chemical treatment based on changes in incoming water. We participate in the Partnership for Safe Water, the EPA’s voluntary program to meet more stringent goals for reducing microbial contaminants. With
68
of our
72
surface water treatment plants receiving the EPA program’s “Director” award, which recognizes utilities that: (i) have completed a comprehensive self-assessment report; (ii) created an action plan for continuous improvement; and (iii) produced high quality drinking water, we account for approximately one-third of the plants receiving such awards nationwide. In addition,
66
of our surface water treatment plants have received the “Five-Year Phase III” award,
61
plants have received the “Ten-Year Phase III” award and
54
plants have received the “Fifteen-Year Phase III” award; these awards recognize plants that have met the Director award status for five, 10 and 15 years, respectively. Further,
nine
of our surface water plants have received the “Presidents” award, which recognizes treatment plants that achieve the Partnership’s rigorous individual filter effluent turbidity standards.
Although it is difficult to project the ultimate costs of complying with the above or other pending or future requirements, we expect current requirements under the Safe Drinking Water Act and other similar laws to be recoverable through the regulatory process and therefore compliance costs are not expected to have a material impact on our operations or financial condition. In addition, capital expenditures and operating costs to comply with environmental mandates have been traditionally recognized by the state PUCs as appropriate for inclusion in establishing rates. As a result, we expect to recover the operating and capital costs resulting from these pending or future requirements.
Lead and Copper Rule and Lead in Drinking Water Act
Across the country, there is a renewed focus on the potential risk of lead in drinking water. In 1991, the EPA published the LCR to control lead and copper in drinking water and, since that time, has issued minor revisions in 2000, 2004 and 2007, enhancing monitoring, reporting and public education requirements. In 2011, Congress enacted the Reduction of Lead in Drinking Water Act regarding the use and introduction into commerce of lead pipes, plumbing fittings for fixtures, solder and flux. While these advances have made an impact in reducing lead exposure in drinking water, legacy lead plumbing materials, primarily in building plumbing, still remain in many communities. The EPA is currently working to develop long-term revisions to the LCR, with a revised draft likely in 2018. It is currently estimated that approximately 5% of our service lines contain lead. We have reviewed our related practices and are working with stakeholders to develop feasible solutions to remove legacy lead from service lines in older neighborhoods. A fundamental step in this effort is the ongoing project to inventory lead service lines across our footprint. Our goal is to replace our lead service lines in most areas over an approximate 10 year time frame, at an estimated cost ranging from $600 million to $1.2 billion. In cases where we are replacing an American Water owned lead service line, our standard approach will be to replace the company-owned portion of the service line, and work with the customer to replace the customer-owned portion of the service line. Replacing the full service line is considered a best practice as advised by the Lead Service Line Replacement Collaborative, an association of leading water industry organizations. The prioritization of this work will depend on several factors, including our planned water main and service line renewal projects, adjacent projects by municipalities or other utilities, LCR compliance monitoring results and cooperation with our customers with respect to the customer-owned portion of the service line.
13
Clean Water Act
The Clean Water Act regulates discharges from drinking water and wastewater treatment facilities into lakes, rivers, streams and groundwater. In addition to requirements applicable to our wastewater collection systems, our operations require discharge permits under the National Pollutant Discharge Elimination System (“NPDES”) permit program established under the Clean Water Act, which must be renewed every five years. Pursuant to the NPDES permit program, the EPA and implementing states set maximum discharge limits for wastewater effluents and overflows from wastewater collection systems. Discharges that exceed the limits specified under NPDES permits can lead to the imposition of penalties, and persistent non-compliance could lead to significant penalties and compliance costs. In addition, the difficulty of obtaining and complying with NPDES permits, and renewing expiring permits, may impose time and cost burdens on our operations. From time to time, discharge violations occur at our facilities, some of which result in fines. We do not expect any such violations or fines to have a material impact on our results of operations or financial condition.
Environmental, Social Responsibility and Governance
Integrating environmental, social responsibility and governance (“ESG”) policies and practices into our daily operations emphasizes our belief that the only way to do business is to do it responsibly, by delivering value to our customers, building strong communities, leveraging innovation to develop our industry and supporting the expertise and dedication of our people. This focus is derived from our vision statement, “clean water for life”, and our core values: (i) safety; (ii) trust; (iii) environmental leadership; (iv) teamwork; and (v) high performance, the principles by which we work and live. Our vision and values drive our company strategy, which is centered on five central themes:
|
•
|
Customers—Our customers are at the center of everything we do, helping us to shape our strategic priorities. We challenge ourselves so that if our regulated utility customers had a choice of providers, we would want them to choose us.
|
|
•
|
Safety—The safety of our employees and our customers is the number one focus for American Water.
|
|
•
|
People—Maintaining an environment which is open, diverse and inclusive, and where our people feel valued, included and accountable is critical to our ability to serve our customers every day.
|
|
•
|
Technology and Operational Efficiency—Our technology and operational efficiency strategy helps us to continually find better and more efficient ways to do business and provide the best services at affordable costs for our customers.
|
|
•
|
Growth—We believe that when companies grow, they can invest more in creating stable jobs, training, benefits, infrastructure and our communities. Growth, in turn, benefits all stakeholders.
|
In 2017, we issued our fourth biennial Corporate Responsibility Report, covering our performance in 2015 to 2016. Our first report was issued in 2011, making us the first large water services company to measure its performance against the Global Reporting Index. In addition, our sustainability practices have supported our inclusion in the Dow Jones Sustainability North America Index in 2012, 2013 and 2015, and we have also maintained our position in the Euronext Vigeo
®
U.S. 50 index, which includes the 50 most advanced companies in the nation with respect to their environmental, social and governance performance, based on a review of hundreds of indicators.
Highlights of our commitment to our ESG policies and practices, many of which are detailed in our most recent Corporate Responsibility Report, are summarized below:
Environmental
|
•
|
Expect to spend between
$8.0 billion
and
$8.6 billion
on capital investments from 2018 to 2022, including:
|
|
•
|
$7.2 billion
for regulated capital expenditures to address aging infrastructure, reduce/eliminate leaks, improve cyber/physical security, and increase resiliency of critical assets to climate variability;
|
|
•
|
$600 million
to
$1.2 billion
to acquire financially distressed municipal water and wastewater systems which tend to have a strong need for capital investment; and
|
|
•
|
$200 million
for strategic capital investments with approximately
$164 million
focused on construction of our new corporate headquarters in Camden, New Jersey, as part of the revitalization effort in this community.
|
|
•
|
Lowered our greenhouse gas emissions by approximately 26% since our base year of 2007.
|
|
•
|
Reduced water use by 3.5 billion gallons year over year, through our conservation efforts and programs.
|
|
•
|
Recycled over 2 billion gallons of water annually and produced reuse water at 30 of our facilities.
|
Social Responsibility
|
•
|
On average, more than 60,000 hours of safety training given annually to our employees.
|
|
•
|
Achieved top quartile in the water industry for customer satisfaction.
|
14
|
•
|
Increased our annual spend with Tier 1 diverse suppliers to over $385 million.
|
|
•
|
More than 4,000 hours of Company-sponsored community service performed annually by our employees.
|
|
•
|
Company-sponsored workplace giving campaigns with the United Way and Water For People, as well annual contributions from the American Water Charitable Foundation, focused on supporting employees in their own charitable endeavors, providing support for disaster relief efforts, and providing funding for initiatives related to clean water, conservation, education and community sustainability.
|
|
•
|
Over 85% of our job requisitions had a diverse candidate pool, with more than 50% of transfers or promotions filled by minority, female, veteran or disabled individuals.
|
Governance
|
•
|
Our Board of Directors is led by an independent, non-executive chairman, and has an average director tenure, including our two new directors, of approximately 6 years.
|
|
•
|
Including our two new directors, we have achieved gender parity among the members of the Board of Directors.
|
|
•
|
Stock ownership guidelines and retention requirements that align equity ownership of executives and directors with the long-term interests of our stockholders.
|
Research and Development
Our Research and Development Program
We maintain an industry-leading Research and Development (“R&D”) program that is designed to enhance our services, help ensure compliance, and improve quality and operational effectiveness. Our R&D personnel are located in New Jersey and Illinois, the latter housing our quality control and testing laboratory, which supports our R&D activities through testing and analysis. Approximately one-third of our research budget is funded by competitively awarded outside research grants. Such grants reduce the cost of research and allow collaboration with leading national and international researchers. I
n
2017
, we spent
$3 million
on research in total, including
$1 million
funded by grants. Spending on research amounted to
$4 million
, including
$1 million
funded by grants, in each of
2016
and
2015
.
We continue to leverage the Company’s expertise and collaborate with the EPA to help establish effective environmental, health and safety, and water quality standards and regulation. This relationship includes the sharing of our research, such as our treatment and distribution system optimization research and our and national water quality monitoring data. Our engagement with the EPA provides us with early insight into emerging regulatory issues and initiatives, thereby allowing us to anticipate and to accommodate our future compliance requirements. We also frequently engage with the Centers for Disease Control and other state environmental agencies. We believe that continued R&D activities are critical for providing safe, reliable and affordable services, as well as maintaining our leadership position in the industry, which provides us with a competitive advantage as we seek additional business with new and existing customers.
Emerging Contaminants
Emerging contaminants include chemicals such as pharmaceuticals, personal care products, pesticides, herbicides and endocrine disrupting compounds, which have been detected in drinking water supplies, for which the risk to the public’s health is not fully understood and/or has not been quantified. While these contaminants have been present in our drinking water for as long as they have been in use, technological advances have only recently made it possible to detect many of them. The ability to detect contaminants, even at trace levels, has raised questions among regulators and government agencies, further affecting the public’s perception of drinking water quality.
The Chemicals Abstract Service Registry contains over 130 million registered chemicals, with a new substance being produced approximately every 3 seconds from chemical breakdown and reformation. We are continually investigating new substances and contaminants, employing a team of scientists, engineers and public health professionals to identify threats to our water supply, to act on emerging regulations and new health advisories, and to research the influx of advanced treatment technologies. We maintain state-of-the-art water quality testing equipment and implement new and emerging technologies to help predict and manage potential water supply contamination issues. Examples of our efforts include:
|
•
|
using our research findings to communicate information to our customers (via a web site) on the actions they can take to manage Legionella (the Centers for Disease Control statistics indicate that water-associated disease from Legionella is on the rise, with exposure typically associated with plumbing systems in large buildings);
|
|
•
|
aerial drone testing to detect harmful algal blooms and ultrasonic technology testing to help prevent taste and odor events and to eliminate cyanotoxins before they get to the water treatment plant;
|
|
•
|
the implementation of
water source assessment tools, including sensors and analytics,
to evaluate and track chemical storage and transport through watersheds and to detect source water contamination events; and
|
15
|
•
|
the implementation of activated carbon and biofiltration for the control of emerging contaminants.
|
Support Services
American Water Works Service Company, Inc. (the “Service Company”) is our wholly owned subsidiary that provides support and operational services to the Company’s operating subsidiaries. These services are predominantly provided to our
Regulated Businesses
under contracts that have been approved by PUCs, where necessary, and are also provided to (i) our three
Market-Based Businesses
organized under American Water Enterprises, Inc., our wholly owned subsidiary (“AWE”), and (ii) Keystone as requested or may be necessary. Services provided by the Service Company may include accounting and finance, administration, business development, communications, compliance, education and training, engineering, health and safety, human resources, information systems, internal audit, investor relations, legal and governance, operations, procurement, rates and regulatory support, security, risk management, treasury, water quality and R&D. The Service Company also operates two national customer service centers located in Alton, Illinois and Pensacola, Florida, which provide customer relations, field service and operational support to our
Regulated Businesses
. Services are provided by the Service Company at cost, enabling our operating subsidiaries to fulfill their responsibilities in a cost-effective manner, while providing them access to in-depth, functional expertise.
Our security team provides oversight and policy guidance on physical, cyber and information security, as well as business continuity, throughout our operations. It is responsible for designing, implementing, monitoring and supporting effective physical and technical security controls for our physical assets, business systems and operational technologies. Risk assessments are conducted periodically to evaluate the effectiveness of existing security controls and serve as the basis for additional safeguards, security controls and measures. Operational and technical security controls are deployed and integrated as safeguards against unauthorized access to the Company’s information systems. These controls: (i) are aimed at assuring the continuity of business processes that are dependent upon automation; (ii) seek to maintain the integrity of our data; (iii) support regulatory and legislative compliance requirements; and (iv) are aimed at maintaining safe and reliable service to our customers. We engage in partnerships with U.S. federal, state and local law enforcement agencies to coordinate and improve the security of our water delivery systems and to safeguard our water supply and operations.
Employee Matters
As of
December 31, 2017
, approximately
46%
of our workforce was represented by unions, which include
76
collective bargaining agreements with
19
different unions. Additionally, as of
December 31, 2017
we had one collective bargaining agreement beyond expiration, affecting approximately
180
employees, all of which are actively working under the terms of the existing agreement, and another collective bargaining agreement in the process of being implemented, affecting approximately
20
employees. During
2018
,
20
of our collective bargaining agreements, and our national benefits agreement with most of the labor unions representing employees in our
Regulated Businesses
, will be expiring in accordance with their terms.
Executive Officers
The following table summarizes the name, age, offices held and business experience for each of our executive officers, as of
February 20, 2018
:
|
Name
|
Age
|
Office and Experience
|
||
|
Susan N. Story
|
58
|
President and Chief Executive Officer.
Ms. Story has served as President and Chief Executive Officer of the Company since May 2014. Ms. Story served as Senior Vice President and Chief Financial Officer of the Company from April 2013 until May 2014. Prior to joining American Water, she served as President and Chief Executive Officer of Southern Company Services, a subsidiary of Southern Company, from January 2011 until March 2013 and President and Chief Executive Officer of Gulf Power Company, also a subsidiary of Southern Company, from 2003 until December 2010. Since 2008, Ms. Story has served as a member of the board of directors of Raymond James Financial, Inc., a diversified financial services company, and as lead director since 2016. Since January 2017, Ms. Story has also served on the board of directors of Dominion Energy, Inc., a producer and transporter of energy.
|
||
|
Brian Chin
|
44
|
Senior Vice President, Planning and Strategy Integration.
Mr. Chin joined the Company as its Senior Vice President, Planning and Strategy Integration on June 20, 2017. Prior to joining the Company, from May 2013 to April 2017, Mr. Chin served as the lead utility analyst for the North America research function at Bank of America Merrill Lynch. From 2001 to 2013, Mr. Chin worked in Electric Utilities Research at Citigroup. Within that period, Mr. Chin was the global head of Electric Utilities Research for Citigroup.
|
||
|
Deborah A. Degillio
|
46
|
President, AWE.
Ms. Degillio has been President of AWE since May 2016.
From January 2015 to May 2016, Ms. Degillio
served as the Company’s Vice President and Treasurer. Prior to that time, Ms. Degillio served as Vice President of Finance of AWE from November 2013 to February 2015, as a Vice President in the Company’s Finance team for its Eastern Division from June 2009 until October 2013, and as Director of Financial Planning and Analysis for American Water’s then Western states, from April 2007 until May 2009.
|
||
16
|
Name
|
Age
|
Office and Experience
|
||
|
Melanie M. Kennedy
|
44
|
Senior Vice President, Human Resources.
Since March 1, 2017, Ms. Kennedy has served as the Company’s Senior Vice President, Human Resources. From August 2014 until February 2017, Ms. Kennedy served as Vice President, Human Resources of the Company, and from August 2012 to August 2014, she served as Director, Human Resources in our Northeast Division. Ms. Kennedy initially joined the Company in 2007, and before that time, she practiced law for nine years.
|
||
|
Walter J. Lynch
|
55
|
Executive Vice President and Chief Operating Officer.
Mr. Lynch has over 20 years of experience in the water and wastewater industry. Mr. Lynch has served as the Company’s Executive Vice President and Chief Operating Officer since January 2016, as Chief Operating Officer of Regulated Operations from February 2010 to December 2015, and President of Regulated Operations from July 2008 to December 2015. Mr. Lynch joined us in 2001. Mr. Lynch is on the Board of Directors of the National Association of Water Companies and serves on its Executive Committee. In addition, Mr. Lynch also serves on the Water Research Foundation Board of Trustees.
|
||
|
Bradley A. Okoniewski
|
51
|
Vice President, Safety and Environmental Leadership
. Mr. Okoniewski joined the Company on May 1, 2017 as its Vice President, Safety and Environmental Leadership. Prior to that, from April 2016 to May 2017, Mr. Okoniewski served as the global environmental, occupational health and safety director for Campbell Soup Company, a publicly-traded consumer products company based in Camden, New Jersey. Prior to that, Mr. Okoniewski served as the global director, safety, health and environmental affairs for Carpenter Technology Company, a publicly-traded specialty metals company based in Philadelphia, Pennsylvania, from February 2013 to March 2016.
|
||
|
Michael A. Sgro
|
59
|
Executive Vice President, General Counsel and Secretary.
Mr. Sgro has over 20 years of experience in the water and wastewater industry. He has served as the Company’s Executive Vice President, General Counsel and Secretary since January 1, 2016 and its Senior Vice President, General Counsel and Secretary from February 2015 to January 2016. Prior to that, he served as the Company’s Interim General Counsel and Secretary from January 2015 until February 2015 and as Vice President, General Counsel and Secretary of American Water’s Northeast Division beginning in 2002.
|
||
|
Linda G. Sullivan
|
54
|
Executive Vice President and Chief Financial Officer.
Ms. Sullivan has served as the Company’s Executive Vice President and Chief Financial Officer since January 1, 2016 and the Company’s Senior Vice President and Chief Financial Officer from May 2014 to December 31, 2015. Prior to joining American Water, Ms. Sullivan served as the Senior Vice President and Chief Financial Officer of Southern California Edison Company, a subsidiary of Edison International, from July 2009 until May 2014, and Vice President and Controller of both Edison International and Southern California Edison Company, from July 2004 until July 2009. Ms. Sullivan is a Certified Public Accountant (inactive) and a Certified Management Accountant. On April 27, 2017, Ms. Sullivan was elected to the Board of Directors of NorthWestern Corp. and serves on its Audit Committee. In addition, Ms. Sullivan serves on the board of directors of University of Maryland University College Ventures and on its Audit & Finance Committee and is a member of the EPA’s Finance Advisory Board.
|
||
|
Radhakrishnan Swaminathan
|
56
|
Senior Vice President, Chief Technology and Information Officer.
Mr. Swaminathan has served as Senior Vice President, Chief Technology and Innovation Officer of the Company since November 1, 2017. Mr. Swaminathan joined the Company in March 2016 as our Chief Technology and Innovation Officer. Prior to that, from October 2012 through February 2016, he served as Vice President and Chief Technology Officer, Energy, Natural Resources and Utilities, of WIPRO Technologies. Prior to that, he served as the Director of Smart Grid Technologies at NextEra Energy, Inc. from January 2009 through September 2012.
|
||
|
Loyd “Aldie” Warnock
|
58
|
Senior Vice President of External Affairs and Business Development.
Mr. Warnock has served as the Company’s Senior Vice President of External Affairs and Business Development since August 1, 2017. From April 2014 to July 31, 2017, Mr. Warnock served as the Company’s Senior Vice President of External Affairs, Communications and Public Policy. Prior to joining the Company, he served as Senior Vice President of External Affairs at Midwest Independent System Operator, Inc., a non-profit, self-governing organization, from March 2011 to April 2014. Prior to that, he served as Vice President of External Affairs for Allegheny Energy, Inc. from December 2005 to February 2011 and Senior Vice President of Governmental and Regulatory Affairs at Mirant Corporation from July 2004 to November 2005. Mr. Warnock serves on the Board of Directors of the National Association of Water Companies and on the Executive Advisory Board of the Mississippi State University College of Business.
|
||
|
Melissa K. Wikle
|
52
|
Vice President and Controller.
Ms. Wikle joined the Company in July 2016 as its Vice President and Controller, and assumed the duties of the Company’s principal accounting officer in August 2016. Prior to joining the Company, Ms. Wikle served as Corporate Controller and Chief Accounting Officer of Columbus McKinnon Corporation, a publicly-traded worldwide designer, manufacturer and marketer of material handling products, systems and services, since April 2011. Ms. Wikle is a Certified Public Accountant.
|
||
|
Charles Witherspoon
|
50
|
Vice President and Treasurer.
Mr. Witherspoon has served as the Company’s Vice President and Treasurer since February 14, 2018 and has over 24 years of collective experience in corporate treasury, marketing, finance and audit roles. Mr. Witherspoon joined the Company in January 2016 as its Assistant Treasurer. Prior to joining the Company, Mr. Witherspoon served as Vice President of Finance and Corporate Treasurer of Church & Dwight Co., Inc., a publicly-traded packaged goods company, from December 2007 to January 2016. Before that, Mr. Witherspoon held finance and treasury roles for Johnson & Johnson and FMC Corporation. Mr. Witherspoon is a Certified Public Accountant and a Certified Treasury Professional.
|
||
Each executive officer is elected annually by the Board of Directors and serves until his or her respective successor has been elected and qualified or his or her earlier death, resignation or removal.
17
Available Information
We are subject to the reporting requirements of the Exchange Act. We file or furnish annual, quarterly and current reports, proxy statements and other information with the SEC. You may obtain a copy of our annual reports on Form 10-K, our quarterly reports on Form 10-Q or our current reports on Form 8-K, or any amendments to them, that are filed with or furnished to the SEC, free of charge, from the Investor Relations section of our website,
http://ir.amwater.com,
as soon as reasonably practicable after we file or furnish the information to the SEC. Information contained on our website shall not be deemed incorporated into, or to be a part of, this report, and any website references included herein are not intended to be made through active hyperlinks. We recognize our website as a key channel of distribution to reach public investors and as a means of disclosing material non-public information to comply with our disclosure obligations under SEC Regulation FD.
The American Water corporate governance guidelines and the charters for each of the standing committees of the Board of Directors, together with the American Water Code of Ethics and additional information regarding our corporate governance, are available on our Investor Relations website,
http://ir.amwater.com,
and will be made available, without charge, in print to any stockholder who requests such documents from our Investor Relations Department, American Water Works Company, Inc., 1025 Laurel Oak Road, Voorhees, NJ, 08043.
|
ITEM 1A.
|
RISK FACTORS
|
We operate in a market and regulatory environment that involves significant risks, many of which are beyond our control. In addition to the other information included or incorporated by reference in this Form 10-K, the following factors should be considered in evaluating our business and future prospects. Any of the following risks, either alone or taken together, could materially and adversely affect our business, financial position, results of operations, cash flows and liquidity.
Risks Related to Our Industry and Business Operations
Our utility operations are subject to extensive economic regulation by state PUCs and other regulatory agencies, which significantly affects our business, financial condition, results of operations and cash flows. Our utility operations also may be subject to fines, penalties and other sanctions for the inability to meet these regulatory requirements.
Our
Regulated Businesses
provide water and wastewater services to our customers through subsidiaries that are subject to economic regulation by state PUCs. Economic regulation affects the rates we charge our customers and has a significant impact on our business and results of operations. Generally, the state PUCs authorize us to charge rates that they determine are sufficient to recover our prudently incurred operating expenses, including, but not limited to, operating and maintenance costs, depreciation, financing costs and taxes, and provide us the opportunity to earn an appropriate rate of return on invested capital.
Our ability to successfully implement our business plan and strategy depends on the rates authorized by the various state PUCs. We periodically file rate increase applications with state PUCs. The ensuing administrative process may be lengthy and costly. Our rate increase requests may or may not be approved, or may be partially approved, and any approval may not occur in a timely manner. Moreover, a PUC may not approve a rate request to an extent that is sufficient to:
|
•
|
cover our expenses, including purchased water and costs of chemicals, fuel and other commodities used in our operations;
|
|
•
|
enable us to recover our investment; and
|
|
•
|
provide us with an opportunity to earn an appropriate rate of return on our investment.
|
Approval of the PUCs is also required in connection with other aspects of our utilities’ operations. Some state PUCs are empowered to impose financial penalties, fines and other sanctions for non-compliance with applicable rules and regulations. Our utilities are also required to have numerous permits, approvals and certificates from the PUCs that regulate their businesses and authorize acquisitions. Although we believe that each utility subsidiary has obtained or sought renewal of the material permits, approvals and certificates necessary for its existing operations, we are unable to predict the impact that future regulatory activities may have on our business.
In any of these cases, our business, financial condition, results of operations, cash flows and liquidity may be adversely affected. Even if rates are sufficient, we face the risk that we will not achieve the rates of return on our invested capital to the extent permitted by state PUCs. This could occur if certain conditions exist, including but not limited to, if water usage is less than the level anticipated in establishing rates, or if our investments or expenses prove to be higher than the level estimated in establishing rates.
18
Our operations and the quality of water we supply are subject to extensive and increasingly stringent environmental, water quality and health and safety laws and regulations, including with respect to emerging contaminants, compliance with which could impact our operating costs, and violations of which could subject us to substantial liabilities and costs, as well as damage to our reputation.
Our water and wastewater operations and the operations of our
Market-Based Businesses
are subject to extensive federal, state and local laws and regulations and, in the case of our Canadian operations, Canadian laws and regulations that govern the protection of the environment, health and safety, the quality of the water we deliver to our customers, water allocation rights, and the manner in which we collect, treat, discharge and dispose of wastewater. These requirements include CERCLA, the Clean Water Act and the Safe Drinking Water Act, and similar state and Canadian laws and regulations. For example, CERCLA authorizes the EPA to issue orders and bring enforcement actions to compel responsible parties to investigate and take remedial actions with respect to actual or threatened releases of hazardous substances, and can impose joint and several liability, without regard to fault, on responsible parties for the costs thereof. We are also required to obtain various environmental permits from regulatory agencies for our operations.
In addition, state PUCs also set conditions and standards for the water and wastewater services we deliver. If we deliver water or wastewater services to our customers that do not comply with regulatory standards, or otherwise violate environmental laws, regulations or permits, or other health and safety and water quality regulations, we could incur substantial fines, penalties or other sanctions or costs, as well as damage to our reputation. In the most serious cases, regulators could reduce requested rate increases or force us to discontinue operations and sell our operating assets to another utility or to a municipality. Given the nature of our business which, in part, involves supplying water for human consumption, any potential non-compliance with, or violation of, environmental, water quality and health and safety laws or regulations would likely pose a more significant risk to us than to a company not similarly involved in the water and wastewater industry.
We incur substantial operating and capital costs on an ongoing basis to comply with environmental, water quality and health and safety laws and regulations. These laws and regulations, and their enforcement, generally have become more stringent over time, and new or stricter requirements could increase our costs. Although we may seek to recover ongoing compliance costs in our Regulated Businesses through customer rates, there can be no guarantee that the various state PUCs or similar regulatory bodies that govern our
Regulated Businesses
would approve rate increases that would enable us to recover such costs or that such costs will not materially and adversely affect our financial condition, results of operations, cash flows and liquidity.
We may also incur liabilities if, under environmental laws and regulations, we are required to investigate and clean up environmental contamination at our properties, including potential spills of hazardous chemicals, such as chlorine, which we use to treat water, or at off-site locations where we have disposed of waste or caused an adverse environmental impact. The discovery of previously unknown conditions, or the imposition of cleanup obligations in the future, could result in significant costs and could adversely affect our financial condition, results of operations, cash flows and liquidity. Such remediation costs may not be covered by insurance and may make it difficult for us to secure insurance at acceptable rates in the future.
Attention is being given to emerging contaminants, including, without limitation, chemicals and other substances that currently do not have any regulatory standard in drinking water or have been recently created or discovered (including by means of scientific achievements in the analysis and detection of trace amounts of substances). Examples of sources of emerging contaminants include, but are not limited to, newly created chemical compounds (including, for example, perfluorinated compounds and manufactured nanomaterials); human and veterinary products; microbes, viruses, amoebae and other pathogens; and residual by-products of disinfection. We rely upon governmental agencies to set appropriate regulatory standards to protect the public from these and other contaminants. Our role is to meet or surpass those standards, when established. In some of our states, PUCs may disapprove of cost recovery, in whole or in part, for implementation of treatment infrastructure for an emerging contaminant in the absence of a regulatory standard. Furthermore, given the rapid pace at which emerging contaminants are being created and/or discovered, we may not be able to detect and/or mitigate all such substances in our drinking water system or supplies, which could have a material adverse impact on our financial condition, results of operations and reputation. In addition, we believe emerging contaminants may form the basis for additional or increased federal or state regulatory initiatives and requirements in the future, which could significantly increase the cost of our operations.
19
Limitations on availability of water supplies or restrictions on our use of water supplies as a result of government regulation or action may adversely affect our access to sources of water, our ability to supply water to customers or the demand for our water services.
Our ability to meet the existing and future demand of our customers depends on the availability of an adequate supply of water. As a general rule, sources of public water supply, including rivers, lakes, streams and groundwater aquifers, are held in the public trust and are not owned by private interests. As a result, we typically do not own the water that we use in our operations, and the availability of our water supply is established through allocation rights (determined by legislation or court decisions) and passing-flow requirements set by governmental entities. Passing-flow requirements set minimum volumes of water that must pass through specified water sources, such as rivers and streams, in order to maintain environmental habitats and meet water allocation rights of downstream users. Allocation rights are imposed to ensure sustainability of major water sources and passing-flow requirements are most often imposed on source waters from smaller rivers, lakes and streams. These requirements, which can change from time to time, may adversely impact our water supply. Supply issues, such as drought, overuse of sources of water, the protection of threatened species or habitats, contamination or other factors may limit the availability of ground and surface water.
For example, in our Monterey County, California operations, we are seeking to augment our sources of water supply, principally to comply with an October 20, 2009 cease and desist order (the “2009 Order”), as amended by an order in July 2016 (the “2016 Order”), of the SWRCB that requires Cal Am to significantly decrease its diversions from the Carmel River in accordance with a reduction schedule that terminates on December 31, 2021 (the “2021 Deadline”). We are also required to augment our Monterey County sources of water supply to comply with the requirements of the Endangered Species Act. We cannot predict whether Cal Am will be able to secure alternative sources of water, or if Cal Am will be exposed to liabilities if it is unable to meet the 2021 Deadline under the 2009 Order and the 2016 Order. If Cal Am or any of our other subsidiaries are unable to secure an alternative source of water, or if other adverse consequences result from the events described above, our business, financial condition, results of operations and cash flows could be adversely affected. See
Item 3—Legal Proceedings
—Alternative Water Supply in Lieu of Carmel River Diversions, which includes additional information regarding this matter.
The current regulatory rate setting process may result in a significant delay, also known as “regulatory lag,” from the time that we invest in infrastructure improvements, incur increased operating expenses or experience declining water usage, to the time at which we can seek to address these events in rate case applications; our inability to minimize regulatory lag could adversely affect our business.
There is typically a delay, known as “regulatory lag,” between the time one of our regulated subsidiaries makes a capital investment or incurs an operating expense increase and the time when those costs are reflected in rates. In addition, billings permitted by state PUCs typically are, to a considerable extent, based on the volume of water usage in addition to a minimum base rate. Thus, we may experience regulatory lag between the time our revenues are affected by declining usage and the time we are able to adjust the rate per gallon of usage to address declining usage. Our inability to reduce this regulatory lag could have an adverse effect on our financial condition, results of operations, cash flows and liquidity.
We endeavor to reduce regulatory lag by pursuing constructive regulatory policies. For example, ten of our state PUCs permit rates to be adjusted outside of the rate case application process through surcharges that address certain capital investments, such as replacement of aging infrastructure. These surcharges are adjusted periodically based on factors such as project completion or future budgeted expenditures, and specific surcharges are eliminated once the related capital investment is incorporated in new PUC approved rates. Furthermore, in setting rates, nine of our state PUCs allow us to use future test years, which extend beyond the date a rate request is filed to allow for current or projected revenues, expenses and investments to be reflected in rates on a more timely basis. Other examples of such programs include states that allow us to increase rates for certain cost increases that are beyond our control, such as purchased water costs, property or other taxes, or power, conservation, chemical or other expenditures. These surcharge mechanisms enable us to adjust rates in less time after costs have been incurred than would be the case under the rate case application process.
While these programs have reduced regulatory lag in several of our regulated states, we continue to seek expansion of programs to reduce regulatory lag in those jurisdictions that have not approved such programs. Furthermore, PUCs may fail to adopt new surcharge programs and existing programs may not continue in their current form, or at all. Although we intend to continue our efforts to expand state PUC approval of surcharges to address issues of regulatory lag, our efforts may not be successful, or even if successful they may not completely address our regulatory lag, in which case our business, financial condition, results of operations, cash flows and liquidity may be materially and adversely affected.
20
Changes in laws and regulations and changes in certain agreements can significantly affect our business, financial condition, results of operations, cash flows and liquidity.
New legislation, regulations, government policies or court decisions, including without limitation with respect to federal and state income and other tax laws, can materially affect our operations, results of operations and cash flows. The individuals who serve as regulators are elected or political appointees. Therefore, elections which result in a change of political administration or new appointments may also result in changes in the individuals who serve as regulators and the policies of the regulatory agencies that they serve. New laws or regulations, new interpretations of existing laws or regulations, changes in agency policy, including those made in response to shifts in public opinion, or conditions imposed during the regulatory hearing process could have the following consequences, among others:
|
•
|
making it more difficult for us to raise our rates and, as a consequence, to recover our costs or earn our expected rates of return;
|
|
•
|
changing the determination of the costs, or the amount of costs, that would be considered recoverable in rate cases;
|
|
•
|
restricting our ability to terminate our services to customers who owe us money for services previously provided or limiting our bill collection efforts;
|
|
•
|
requiring us to provide water or wastewater services at reduced rates to certain customers;
|
|
•
|
limiting or restricting our ability to acquire water or wastewater systems, purchase or dispose of assets or issue securities, or making it less cost-effective for us to do so;
|
|
•
|
negatively impacting the deductibility of expenses under federal or state tax laws, the amount of tax credits or tax abatement benefits that may be available, the amount of taxes owed, or the ability to utilize our net operating loss carryforwards;
|
|
•
|
changing regulations that affect the benefits we expected to receive when we began offering services in a particular area;
|
|
•
|
increasing the costs associated with complying with environmental, health, safety and water quality regulations to which our operations are subject;
|
|
•
|
changing or placing additional limitations on change in control requirements relating to any concentration of ownership of our common stock;
|
|
•
|
making it easier for governmental entities to convert our assets to public ownership via condemnation, eminent domain or other similar process, or for governmental agencies or private plaintiffs to assess liability against us for damages under these or similar processes;
|
|
•
|
placing limitations, prohibitions or other requirements with respect to the sharing of information and participation in transactions by or between a regulated subsidiary and us or our other affiliates, including Service Company and any of our other subsidiaries;
|
|
•
|
restricting or prohibiting our extraction of water from rivers, streams, reservoirs or aquifers; and
|
|
•
|
revoking or altering the terms of the certificates of public convenience and necessity (or similar authorizations) issued to us by state PUCs.
|
Any of the foregoing consequences could have an adverse effect on our business, financial condition, results of operations, cash flows and liquidity.
21
In addition, new Federal, state and local laws, changes in existing laws, rules or regulations, or administrative interpretations thereof, could impact us. On December 22, 2017, the TCJA was signed into law, which, among other things, enacted significant and complex changes to the Internal Revenue Code of 1986, including a reduction in the maximum U.S. federal corporate income tax rate from 35% to 21% as of January 1, 2018, and certain other provisions related specifically to the public utility industry, including continuation of interest expense deductibility, the exclusion from utilizing bonus depreciation and the normalization of deferred income taxes. The enactment of the TCJA required a re-measurement of our deferred income taxes that materially impacted our 2017 results of operations and financial position. We have assumed that the predominant majority of our deferred tax assets and liabilities at our utility subsidiaries will remain subject to a normalization method of accounting pursuant to the U.S. tax code or applicable PUC regulations and that we will be able to deduct for U.S. federal corporate income tax purposes substantially all of our interest expense, based upon our interpretation of U.S. tax law debt allocation methodologies , at the TCJA’s 21% corporate tax rate. The adoption or issuance of any Related Interpretations that impact these assumptions or with respect to provisions related specifically to the public utility industry or to corporate taxpayers in general may also impact our future financial performance, including our results of operations, cash flows and liquidity, which impacts will largely be determined through future regulatory proceedings. All of our 14 jurisdictions subject to economic regulation have opened formal proceedings related to the TCJA, and we have open rate cases in three of them. At this time, we cannot predict the impacts of any Related Interpretations, if and when issued, on us, or the regulatory treatment of the TCJA in each of our regulatory jurisdictions. Moreover, we are unable to determine or predict the potential impacts, if any, of any other new or amended laws, rules or regulations, or interpretations thereof, to the extent they may be ultimately enacted, adopted or issued, on us or our businesses, financial condition, results of operations, cash flows and liquidity.
Service disruptions caused by severe weather conditions, climate variability patterns or natural disasters may disrupt our operations or reduce the demand for our water services, which could adversely affect our financial condition, results of operations, cash flows and liquidity.
Service interruptions due to severe weather, climate variability patterns and other natural events are possible across all our businesses. These include, among other things, storms, freezing conditions, high wind conditions, hurricanes, tornadoes, earthquakes, landslides, wildfires, coastal and intercoastal floods or high water conditions, including those in or near designated flood plains, severe electrical storms and solar flares. Weather and other natural events such as these may affect the condition or operability of our facilities, limiting or preventing us from delivering water or wastewater services to our customers, or requiring us to make substantial capital expenditures to repair any damage. Tariffs in place or cost recovery proceedings with respect to our Regulated Businesses may not provide reimbursement to us, in whole or in part, for any of these impacts.
Government restrictions on water use may also result in decreased use of water services, even if our water supplies are sufficient to serve our customers, which may adversely affect our financial condition, results of operations and cash flows. Seasonal drought conditions that may impact our water services are possible across all of our service areas. Governmental restrictions imposed in response to a drought may apply to all systems within a region independent of the supply adequacy of any individual system. As examples, drought conditions had persisted in California over a five-year period, and had been declared in New Jersey in 2016. In 2017, these droughts were declared concluded, but other droughts that may occur from time to time may result in the imposition of voluntary or mandatory water use targets, rationing restrictions, water conservation regulations, and requirements to minimize water system leaks. While expenses incurred in implementing water conservation and rationing plans may generally be recoverable provided the relevant PUC determines they were reasonable and prudent, we cannot assure that any such expenses incurred will, in fact, be fully recovered. Moreover, reductions in water consumption, including those resulting from installation of equipment or changed consumer behavior, may persist even after drought restrictions are repealed and the drought has ended, which could adversely affect our business, financial condition, results of operations and cash flows.
Climate variability may cause increased volatility in weather and may impact water usage and related revenue or require additional expenditures, all of which may not be fully recoverable in rates or otherwise.
The issue of climate variability is receiving increasing attention worldwide. Some scientific experts are predicting a worsening of weather volatility in the future associated with climate variability. Many climate variability predictions, if true, present several potential challenges to water and wastewater utilities, such as:
|
•
|
increased frequency and duration of droughts;
|
|
•
|
increased precipitation and flooding;
|
|
•
|
challenges associated with changes in temperature or increases in ocean levels;
|
|
•
|
potential degradation of water quality;
|
|
•
|
decreases in available water supply and changes in water usage patterns;
|
|
•
|
increases in disruptions in service;
|
|
•
|
increased costs to repair damaged facilities; or
|
22
|
•
|
increased costs to reduce risks associated with the increasing frequency of natural events, including to improve the resiliency and reliability of our water production and delivery facilities and systems.
|
Because of the uncertainty of weather volatility related to climate variability, we cannot predict its potential impact on our business, financial condition, results of operations, cash flows and liquidity. Although some or all potential expenditures and costs with respect to our Regulated Businesses could be recovered through rates, infrastructure replacement surcharges or other regulatory mechanisms, there can be no assurance that state PUCs would authorize rate increases to enable us to recover such expenditures and costs, in whole or in part.
A loss of one or more large industrial customers could have a material adverse impact upon the results of operations of one or more of our Regulated Businesses.
Adverse economic conditions or other factors can cause our customers, particularly industrial customers, to curtail operations. A curtailment of operations by an industrial customer would typically result in reduced water usage by that customer. In more severe circumstances, the decline in usage could be permanent. Any decrease in demand resulting from difficult economic conditions affecting these industrial customers could adversely affect our financial condition and results of operations. Tariffs in place with respect to our Regulated Businesses may not reimburse us, in whole or in part, for any of these impacts.
Our
Regulated Businesses
require significant capital expenditures and may suffer if we fail to secure appropriate funding to make investments, or if we experience delays in completing major capital expenditure projects.
The water and wastewater utility business is capital intensive. We invest significant amounts of capital to add, replace and maintain property, plant and equipment, and to improve aging infrastructure. In
2017
, we invested
$1.4 billion
in net Company-funded capital improvements. The level of capital expenditures necessary to maintain the integrity of our systems will likely increase in the future. We expect to fund capital improvement projects using cash generated from operations, borrowings under our revolving credit facility and commercial paper programs and issuances of long-term debt. We may not be able to access our revolving credit facility or the commercial paper, long-term debt and equity capital markets, when necessary or desirable to fund capital improvements on favorable terms or at all. If we are not able to obtain sufficient financing, we could be unable to maintain our existing property, plant and equipment, fund our capital investment strategies, meet our growth targets and expand our rate base to enable us to earn satisfactory future returns on our investments. Even with adequate financial resources to make required capital expenditures, we face the additional risk that we will not complete our major capital projects on time, as a result of construction delays, permitting delays, labor shortages or other disruptions, environmental restrictions, or other obstacles. Each of these outcomes could adversely affect our financial condition, results of operations and cash flows.
Seasonality could adversely affect the volume of water sold and our revenues.
The volume of water we sell during the warmer months, typically in the summer, is generally greater than during other months, due primarily to increased water usage for irrigation systems, swimming pools, cooling systems and other applications. Throughout the year, and particularly during typically warmer months, the volume of water sold tends to vary with temperature, rainfall levels and rainfall frequency. In the event that temperatures during the typically warmer months are cooler than normal, or if there is more rainfall than normal, the amount of water we sell may decrease and adversely affect our revenues.
Three of our jurisdictions, California, Illinois and New York, have adopted revenue stability mechanisms, which permit us to collect state PUC-authorized revenue for a given period which is not tied to the volume of water sold during that period. Revenue stability mechanisms are designed to allow utilities to recover the fixed cost of operations while supporting water conservation goals. In those jurisdictions that have not adopted a revenue stability mechanism, operating results could continue to be affected by seasonality.
Regulatory and environmental risks associated with the collection, treatment and disposal of wastewater may impose significant costs.
The wastewater collection, treatment and disposal operations of our subsidiaries are subject to substantial regulation and involve environmental risks. If collection, treatment or disposal systems fail, overflow, or do not operate properly, untreated wastewater or other contaminants could spill onto nearby properties or into nearby streams and rivers, causing damage to persons or property, injury to aquatic life and economic damages. This risk is most acute during periods of substantial rainfall or flooding, which are the main causes of sewer overflow and system failure. Liabilities resulting from such damage could adversely and materially affect our business, financial condition, results of operations and cash flows.
23
Contamination of water supplies or our water service provided to our customers could result in service limitations and interruptions and exposure to substances not typically found in potable water supplies, and could subject us and our subsidiaries to reductions in usage and other responsive obligations, government enforcement actions, damage to our reputation and private litigation.
The water supplies that flow into our treatment plants or are delivered through our distribution system, or the water service that is provided to our customers, may be subject to contamination, including, among other items, contamination from naturally-occurring compounds, chemicals in groundwater systems, pollution resulting from man-made sources (such as perchlorate, methyl tertiary butyl ether, lead and other materials, chemical spills or other accidents that result in contaminants entering the water source), and possible terrorist attacks. In addition, new categories of these substances continue to emerge in the water treatment industry. If one of our water supplies or the water service provided to our customers is contaminated, depending on the nature of the contamination, we may have to take responsive actions that could include, among other things (1) continuing limited use of the water supply under a “Do Not Use” protective order that enables continuation of basic sanitation and essential fire protection, or (2) interrupting the use of that water supply. If service is disrupted, our financial condition, results of operations, cash flows, liquidity and reputation may be adversely affected. In addition, we may incur significant costs in order to treat the contaminated source through the expansion of our current treatment facilities or the development of new treatment methods. We may be unable to recover costs associated with treating or decontaminating water supplies through insurance, customer rates, tariffs or contract terms. Any recovery of these costs that we are able to obtain through regulatory proceedings or otherwise may not occur in a timely manner. Moreover, we could be subject to claims for damages arising from government enforcement actions or toxic tort or other lawsuits arising out of an interruption of service or human exposure to hazardous substances in our drinking water and water supplies.
In this regard, on January 9, 2014, a chemical storage tank owned by Freedom Industries, Inc. leaked two substances into the Elk River near the West Virginia-American Water Company (“WVAWC”) treatment plant intake in Charleston, West Virginia. On September 21, 2017, the U.S. District Court for the Southern District of West Virginia granted preliminary approval of a settlement class and proposed global class action settlement (the “Settlement”) of claims involving WVAWC and its affiliates arising out of the Freedom Industries chemical spill. Under the terms of the Settlement, WVAWC has agreed that it will not seek rate recovery from the Public Service Commission of West Virginia (the “PSC”) for the amounts paid by WVAWC, net of insurance recoveries, under the Settlement. See
Item 3—Legal Proceedings
—West Virginia Elk River Freedom Industries Chemical Spill, which includes additional information regarding this matter.
Since we engage in the business of providing water service to our customers, contamination of the water supply, or the water service provided to our customers, could result in substantial injury or damage to our customers, employees or others and we could be exposed to substantial claims and litigation. Such claims could relate to, among other things, personal injury, loss of life, business interruption, property damage, pollution, and environmental damage and may be brought by our customers or third parties. Litigation and regulatory proceedings are subject to inherent uncertainties and unfavorable rulings can and do occur, and we may not be protected from these claims or negative impacts therefrom in whole or in part by tariffs or other contract terms. Negative impacts to our reputation may occur even if we are not liable for any contamination or other environmental damage or the consequences arising out of human exposure to contamination or hazardous substances in the water or water supplies. In addition, insurance coverage may not cover all or a portion of these losses, and are subject to deductibles and other limitations. Pending or future claims against us could have a material adverse impact on our business, financial condition, results of operations and cash flows.
We may sustain losses that exceed or are excluded from our insurance coverage or for which we are self-insured.
We maintain insurance coverage as part of our overall legal and risk management strategy to minimize potential liabilities arising from our utility operations, as well as the operations of our
Market-Based Businesses
. Our insurance programs have varying coverage limits, exclusions and maximums, and insurance companies may seek to deny claims we might make. Generally, our insurance policies cover property damage, worker’s compensation, employer’s liability, general liability, terrorism risks and automobile liability. Each policy includes deductibles or self-insured retentions and policy limits for covered claims. As a result, we may sustain losses that exceed or that are excluded from our insurance coverage or for which we are self-insured.
Although in the past we have been generally able to cover our insurance needs, there can be no assurance that we can secure all necessary or appropriate insurance in the future, or that such insurance can be economically secured. For example, catastrophic events can result in decreased coverage limits, more limited coverage, increased premium costs or deductibles.
24
We are subject to adverse publicity and reputational risks, which make us vulnerable to negative customer perception and could lead to increased regulatory oversight or other sanctions.
Water and wastewater utilities, including our regulated subsidiaries and our
Market-Based Businesses
, have a large direct and indirect customer base and as a result are exposed to public criticism regarding, among other things, the reliability of their water, wastewater and related or ancillary services, the quality of water provided, and the amount, timeliness, accuracy and format of bills that are provided for such services. Adverse publicity and negative consumer sentiment may render legislatures and other governing bodies, state PUCs and other regulatory authorities, and government officials less likely to view us in a favorable light, and may cause us to be susceptible to less favorable legislative, regulatory and economic outcomes, as well as increased regulatory or other oversight and more stringent regulatory or economic requirements. Unfavorable regulatory and economic outcomes may include the enactment of more stringent laws and regulations governing our operations and less favorable economic terms in our agreements related to our
Market-Based Businesses
, as well as fines, penalties or other sanctions or requirements. The imposition of any of the foregoing could have a material negative impact on us and our financial condition, results of operations and cash flows.
The failure of, or the requirement to repair, upgrade or dismantle, any of our dams may adversely affect our financial condition, results of operations, cash flows and liquidity.
The properties of our
Regulated Businesses
segment include
80
dams, a failure of any of which could result in personal injury and downstream property damage for which we may be liable. The failure of a dam would also adversely affect our ability to supply water in sufficient quantities to our customers and could adversely affect our financial condition and results of operations. Any losses or liabilities incurred due to a failure of one of our dams might not be covered by insurance policies or be recoverable in rates, and such losses may make it difficult for us to secure insurance at acceptable rates in the future.
We also are required from time to time to decommission, repair or upgrade the dams that we own. The cost of such repairs or upgrades can be and has been material. The federal and state agencies that regulate our operations may adopt rules and regulations requiring us to dismantle our dams, which also could entail material costs. Although in most cases, the PUC has permitted recovery of expenses and capital investment related to dam rehabilitation, we might not be able to recover costs of repairs, upgrades or dismantling through rates in the future. The inability to recover these costs or delayed recovery of the costs as a result of regulatory lag can affect our financial condition, results of operations, cash flows and liquidity.
Any failure of our network of water and wastewater pipes and water reservoirs could result in losses and damages that may affect our financial condition and reputation.
Our operating subsidiaries distribute water and collect wastewater through an extensive network of pipes and storage systems located across the United States. A failure of major pipes or reservoirs could result in injuries and property damage for which we may be liable. The failure of major pipes and reservoirs may also result in the need to shut down some facilities or parts of our network in order to conduct repairs. Such failures and shutdowns may limit our ability to supply water in sufficient quantities to our customers and to meet the water and wastewater delivery requirements prescribed by government regulators, including state PUCs with jurisdiction over our operations, and adversely affect our financial condition, results of operations, cash flows, liquidity and reputation. Any business interruption or other losses might not be covered by insurance policies or be recoverable in rates, and such losses may make it difficult for us to secure insurance at acceptable rates in the future. Moreover, to the extent such business interruptions or other losses are not covered by insurance, they may not be recovered through rate adjustments.
An important part of our growth strategy is the acquisition of water and wastewater systems, which involves risks, including competition for acquisition opportunities from other regulated utilities, governmental entities and other buyers, that may hinder or limit our ability to grow our business.
An important element of our growth strategy is the acquisition of water and wastewater systems in order to broaden our current, and move into new, service areas. We may not be able to acquire other businesses if we cannot identify suitable acquisition opportunities or reach mutually agreeable terms with acquisition candidates. Further, competition for acquisition opportunities from other regulated utilities, governmental entities, and other buyers may hinder our ability to expand our business.
The negotiation of potential acquisitions as well as the integration of acquired businesses with our existing operations could require us to incur significant costs and cause diversion of our management’s time and resources. Future acquisitions by us could result in, among other things:
|
•
|
incurrence or assumption of debt, contingent liabilities and environmental liabilities of or with respect to an acquired business, including liabilities that were unknown at the time of acquisition;
|
|
•
|
failure to recover acquisition premiums;
|
|
•
|
unanticipated capital expenditures;
|
25
|
•
|
failure to maintain effective internal control over financial reporting;
|
|
•
|
recording goodwill and other intangible assets at values that ultimately may be subject to impairment charges;
|
|
•
|
fluctuations in quarterly results;
|
|
•
|
unanticipated acquisition-related expenses;
|
|
•
|
failure to realize anticipated benefits, such as cost savings and revenue enhancements; and
|
|
•
|
difficulties in assimilating personnel, benefits, services and systems.
|
Some or all of these items could have a material adverse effect on our business. The businesses we acquire in the future may not achieve anticipated sales and profitability, and any difficulties we encounter in the integration process could interfere with our operations, reduce our operating margins and adversely affect our internal control over financial reporting.
We compete with governmental entities, other regulated utilities, and strategic and financial buyers for acquisition opportunities. If consolidation becomes more prevalent in the water and wastewater industries and competition for acquisitions increases, the prices for suitable acquisition candidates may increase and limit our ability to expand through acquisitions.
Our
Regulated Businesses
are subject to condemnation and other proceedings through eminent domain or other similar authorized process, which could materially and adversely affect their results of operations and financial condition.
Municipalities and other government subdivisions have historically been involved in the provision of water and wastewater services in the United States, and organized efforts may arise from time to time in one or more of the service areas in which our
Regulated Businesses
operate to convert our assets to public ownership and operation through exercise of the governmental power of eminent domain, or another similar authorized process. Should a municipality or other government subdivision or a citizen group seek to acquire our assets through eminent domain or such other process, either directly or indirectly as a result of a citizen petition, we may resist the acquisition.
Furthermore, the law in certain jurisdictions in which our
Regulated Businesses
operate, including, for example, California, provide for eminent domain rights allowing private property owners to seek just compensation against a public utility if the public utility’s infrastructure has been determined to be a substantial cause of damage to that property. In these actions, the plaintiff would not have to prove that the public utility acted negligently. These actions have occurred in connection with events such as floods, mudslides and debris flow, broken water mains, landslides and wild and brush fires.
Contesting an exercise of condemnation, eminent domain or other similar process, or responding to a citizen petition, may result in costly legal proceedings and may divert the attention of management of affected
Regulated Businesses
from the operation of those businesses. Moreover, our efforts to resist the condemnation, eminent domain or other process may not be successful, which may require us to sell the operations at issue in a condemnation proceeding or to pay a private property owner compensation for the property damage suffered. If a municipality or other government subdivision succeeds in acquiring the assets of one or more of our
Regulated Businesses
through eminent domain or other process, there is a risk that we will not receive adequate compensation for the business, that we will not be able to keep the compensation, or that we will not be able to divest the business without incurring significant charges. Any of these outcomes may have a material adverse effect on our business, results of operations, financial condition, cash flows and liquidity.
We rely on technology systems to facilitate the management of our business and customer and supplier relationships, and a disruption of these systems could adversely affect our business.
Our technology systems, particularly our operational technology and IT systems, are an integral part of our business, and any disruption of these systems could significantly limit our ability to manage and operate our business efficiently, which, in turn, could cause our business and competitive position to suffer and adversely affect our results of operations. For example, we depend on these systems to bill customers, process orders, provide customer service, manage certain plant operations and construction projects, manage our financial records, track assets, remotely monitor certain of our plants and facilities and manage human resources, inventory and accounts receivable collections. These systems also enable us to purchase products from our suppliers and bill customers on a timely basis, maintain cost-effective operations and provide service to our customers.
Although we do not believe that these systems are at a materially greater risk of failure or cybersecurity incidents than other similar organizations, our operational technology and IT systems remain vulnerable to damage or interruption from:
|
•
|
power loss, computer systems failures, and internet, telecommunications or data network failures;
|
|
•
|
operator error or improper operation by, or the negligent or improper supervision of, employees and contractors;
|
26
|
•
|
physical and electronic loss of customer or employee data due to security breaches, cyber attacks, misappropriation and similar events;
|
|
•
|
computer viruses;
|
|
•
|
intentional security breaches, hacking, denial of services actions, misappropriation of data and similar events; and
|
|
•
|
severe weather and other events, including without limitation, hurricanes, tornadoes, fires, floods, earthquakes and other disasters.
|
These events may result in physical and electronic loss of customer, employee or financial data, security breaches, misappropriation and other adverse consequences. In addition, a lack of or inadequate levels of redundancy for certain of these systems, including billing systems, could exacerbate the impact of any of these events on us. We may not be successful in developing or acquiring technology that is competitive and responsive to the needs of our business, and we might lack sufficient resources to make the necessary upgrades or replacements of outdated existing technology to enable us to continue to operate at our current level of efficiency.
We may be subject to physical and/or cyber attacks.
As operators of critical infrastructure, we may face a heightened risk of physical and/or cyber attacks. Our water and wastewater systems may be vulnerable to disability or failures as a result of physical or cyber acts of war or terrorism, vandalism or other causes. Our operational technology and IT systems throughout our businesses may be vulnerable to unauthorized access due to hacking, viruses, acts of war or terrorism, and other causes. Unauthorized access to confidential information located or stored on these systems could negatively and materially impact our customers, employees, suppliers and other third parties. While we have instituted certain safeguards to protect our operational technology and IT systems, those safeguards may not always be effective due to the evolving nature of cyber attacks and cyber vulnerabilities. We cannot guarantee that such protections will be completely successful in the event of a cyber attack.
If, despite our security measures, a significant physical attack or cyber breach occurred, our operations could be disrupted, property damaged, and customer and other confidential information lost or stolen; experience substantial loss of revenues, response costs and other financial loss; suffer a loss of management time, attention and resources from our regular business operations; and be subject to increased regulation, litigation, and damage to our reputation, any of which could have a negative impact on our business, results of operations and cash flows. These types of events, either impacting our facilities or the industry in general, could also cause us to incur additional security and insurance related costs. Losses resulting from a physical or cyber attack against us or our operations or assets may not be covered by, or may exceed the coverage provided by, applicable insurance policies.
In addition, in the ordinary course of business, we collect and retain sensitive information, including personally identifiable information, about our customers and employees. In many cases, we outsource administration of certain functions to vendors that could be targets of cyber attacks. Any theft, loss and/or fraudulent use of customer, employee or proprietary data as a result of a cyber attack could subject us to significant litigation, liability and costs, as well as adversely impact our reputation with customers and regulators, among others.
Our inability to efficiently upgrade and improve our operational technology and IT systems, or implement new systems, could result in higher than expected costs or otherwise adversely impact our internal controls environment, operations and profitability.
Upgrades and improvements to computer systems and networks, or the implementation of new systems, may require substantial amounts of management’s time and financial resources to complete, and may also result in system or network defects or operational errors due to multiple factors, including employees’ ability to effectively use the new or upgraded system. We continue to implement technology to improve our business processes and customer interactions, and have installed new, and upgraded existing, technology systems. These efforts support our broader strategic initiatives and are intended to improve our operations and enhance our customer service capabilities. Any technical or other difficulties in upgrading and improving existing or implementing new technology systems may increase costs beyond those anticipated and have an adverse or disruptive effect on our operations and reporting processes, including our internal control over financial reporting. We may also experience difficulties integrating current systems with new or upgraded systems, which may impact our ability to serve our customers effectively or efficiently. Although we make efforts to minimize any adverse impact on our controls, business and operations, we cannot assure that all such impacts have been or will be mitigated, and any such impacts could harm our business (individually or collectively) and have a material adverse effect on our results of operations, financial condition and cash flows.
Our business has inherently dangerous workplaces. If we fail to maintain safe work sites, we may experience workforce injuries or loss of life, and be exposed to financial losses, including penalties and other liabilities.
Our safety record is critical to our reputation. We maintain health and safety standards to protect our employees, customers, contractors, vendors and the public. Although we intend to adhere to such health and safety standards and aim for zero injuries, it is extremely difficult to avoid accidents at all times.
27
Our business sites, including construction and maintenance sites, often put our employees, contractors and others in close proximity with large pieces of equipment, moving vehicles, pressurized water, underground trenches and vaults, chemicals and other regulated materials. On many sites we are responsible for safety and, accordingly, must implement safety procedures. If we fail to implement such procedures or if the procedures we implement are ineffective or are not followed by our employees or others, our employees, contractors and others may be injured or die. Unsafe work sites also have the potential to increase employee turnover, expose us to litigation and raise our operating costs. Any of the foregoing could result in financial losses, which could have a material adverse impact on our business, financial condition, results of operations and cash flows.
In addition, our operations can involve the handling and storage of hazardous chemicals, which, if improperly handled, stored or disposed of, could subject us to penalties or other liabilities. We are also subject to regulations dealing with occupational health and safety. Although we maintain functional employee groups whose primary purpose is to ensure we implement effective health, safety, and environmental work procedures throughout our organization, including construction sites and maintenance sites, the failure to comply with such regulations or procedures could subject us to liability.
Work stoppages and other labor relations matters could adversely affect our results of operations.
As of
December 31, 2017
, approximately
46%
of our workforce was represented by unions, and we had
76
collective bargaining agreements in place with
19
different unions representing our unionized employees. These collective bargaining agreements, including
35
which expired in
2017
, and
20
which will expire during
2018
, are subject to periodic renewal and renegotiation. Moreover, our national benefits agreement with most of the labor unions that represent employees in our Regulated Businesses expires on July 31, 2018 and will be renegotiated during 2018. We may not be able to successfully renew or renegotiate these labor contracts on terms that are fair to us. Any negotiations or dispute resolution processes undertaken in connection with our labor contracts could be delayed or affected by labor actions or work stoppages. Labor actions, work stoppages or the threat of work stoppages, and our failure to obtain favorable labor contract terms during renegotiations, may disrupt our operations and result in higher labor costs, which could adversely affect our financial condition, results of operations, cash flows and liquidity. While we have developed contingency plans to be implemented as necessary if a work stoppage or strike does occur, a strike or work stoppage may have a material adverse impact on our financial position, results of operations and cash flows.
Our continued success is dependent upon our ability to hire, retain, and utilize qualified personnel.
The success of our business is dependent upon our ability to hire, retain, and utilize qualified personnel, including engineers, licensed operators, water quality and other operating and craft personnel, and management professionals who have the required experience and expertise. From time to time, it may be difficult to attract and retain qualified individuals with the expertise and in the timeframe demanded for our business needs. In certain geographic areas, for example, we may not be able to satisfy the demand for our services because of our inability to successfully hire and retain qualified personnel.
In addition, as some of our key personnel approach retirement age, we need to have appropriate succession plans in place and to successfully implement such plans. If we cannot attract and retain qualified personnel or effectively implement appropriate succession plans, it could have a material adverse impact on our business, financial condition, results of operations and cash flows.
Financial and Market-Related Risks
Our indebtedness could affect our business adversely and limit our ability to plan for or respond to changes in our business, and we may be unable to generate sufficient cash flows to satisfy our liquidity needs.
As of
December 31, 2017
, our aggregate long-term and short-term debt balance (including preferred stock with mandatory redemption requirements) was
$7.7 billion
, and our working capital (defined as current assets less current liabilities) was in a deficit position. Our indebtedness could have important consequences, including:
|
•
|
limiting our ability to obtain additional financing to fund future working capital requirements or capital expenditures;
|
|
•
|
exposing us to interest rate risk with respect to the portion of our indebtedness that bears interest at variable rates;
|
|
•
|
limiting our ability to pay dividends on our common stock or make payments in connection with our other obligations;
|
|
•
|
impairing our access to the capital markets for debt and equity;
|
|
•
|
requiring that an increasing portion of our cash flows from operations be dedicated to the payment of the principal and interest on our debt, thereby reducing funds available for future operations, dividends on our common stock or capital expenditures;
|
|
•
|
limiting our ability to take advantage of significant business opportunities, such as acquisition opportunities, and to react to changes in market or industry conditions; and
|
|
•
|
placing us at a competitive disadvantage compared to those of our competitors that have less debt.
|
28
In order to meet our capital expenditure needs, we may be required to make additional borrowings under our revolving credit facility or issue new short-term and long-term debt securities. Moreover, additional borrowings may be required to refinance outstanding indebtedness. Debt maturities and sinking fund payments in
2018
,
2019
and
2020
will be
$322 million
,
$170 million
and
$51 million
, respectively. We can provide no assurance that we will be able to access the debt capital markets on favorable terms, if at all. Moreover, if new debt is added to our current debt levels, the related risks we now face could intensify, limiting our ability to refinance existing debt on favorable terms.
In an attempt to manage our exposure to interest rate risk associated with our issuance of variable and fixed-rate debt, we have entered into, and in the future may enter into, financial derivative instruments, including without limitation, interest rate swaps, forward starting swaps, swaptions and U.S. Treasury lock agreements. See
Item 7A—Quantitative and Qualitative Disclosures About Market Risk
. However, these efforts may not be effective to fully mitigate interest rate risk, and may expose us to other risks and uncertainties, including quarterly “mark to market” valuation risk associated with these instruments, that could negatively and materially affect our financial condition, results of operations and cash flows.
We will depend primarily on cash flows from operations to fund our expenses and to pay the principal and interest on our outstanding debt. Therefore, our ability to pay our expenses and satisfy our debt service obligations depends on our future performance, which will be affected by financial, business, economic, competitive, legislative (including tax initiatives and reforms, and other similar legislation or regulation), regulatory and other factors largely beyond our control. If we do not have sufficient cash flows to pay the principal and interest on our outstanding debt, we may be required to refinance all or part of our existing debt, reduce capital investments, sell assets, borrow additional funds or sell additional equity. In addition, if our business does not generate sufficient cash flows from operations, or if we are unable to incur indebtedness sufficient to enable us to fund our liquidity needs, we may be unable to plan for or respond to changes in our business, which could cause our financial condition, operating results and prospects to be affected adversely.
Our inability to access the capital or financial markets or other events could affect our ability to meet our liquidity needs at reasonable cost and our ability to meet long-term commitments, which could adversely affect our financial condition and results of operations.
In addition to cash from operations, we rely primarily on our revolving credit facility, commercial paper programs, and the capital markets to satisfy our liquidity needs. In this regard, our principal external sources of short-term liquidity are our
$1.6 billion
commercial paper program and our
$1.75 billion
revolving credit facility. Our revolving credit facility expires in accordance with its terms in June 2020. We regularly use our commercial paper program under this revolving credit facility as a principal source of short-term borrowing due to the generally more attractive rates we generally can obtain in the commercial paper market. As of
December 31, 2017
, American Water Capital Corp. (“AWCC”), our wholly owned financing subsidiary, had no outstanding borrowings under the revolving credit facility, and had
$905 million
of commercial paper outstanding and
$84 million
in outstanding letters of credit. There can be no assurance that AWCC will be able to continue to access its commercial paper program or its revolving credit facility, when, as and if desired, or that the amount of capital available thereunder will be sufficient to meet all of our liquidity needs at a reasonable, or any, cost.
Under the terms of our revolving credit facility, our consolidated debt cannot exceed 70% of our consolidated capitalization, as determined under the terms of the credit facility. If our equity were to decline or debt were to increase to a level that caused our debt to exceed this limit, lenders under the credit facility would be entitled to refuse any further extension of credit and to declare all of the outstanding debt under the credit facility immediately due and payable. To avoid such a default, a waiver or renegotiation of this covenant would be required, which would likely increase funding costs and could result in additional covenants that would restrict our operational and financing flexibility.
Our ability to comply with this and other covenants contained in the revolving credit facility and our other consolidated indebtedness is subject to various risks and uncertainties, including events beyond our control. For example, events that could cause a reduction in equity include, without limitation, a significant write-down of our goodwill. Even if we are able to comply with this or other covenants, the limitations on our operational and financial flexibility could harm our business by, among other things, limiting our ability to incur indebtedness or reduce equity in connection with financings or other corporate opportunities that we may believe would be in our best interests or the interests of our stockholders to complete.
29
Disruptions in the capital markets or changes in our credit ratings could also limit our ability to access capital on terms favorable to us or at all. While the lending banks that participate in our revolving credit facility have met all of their obligations, disruptions in the credit markets, changes in our credit ratings, or deterioration of the banking industry’s financial condition could discourage or prevent lenders from meeting their existing lending commitments, extending the terms of such commitments, or agreeing to new commitments. These or other occurrences may cause our lenders to not meet their existing commitments, and we may not be able to access the commercial paper or loan or debt markets in the future on terms acceptable to us or at all. Furthermore, our inability to maintain, renew or replace commitments under this facility could materially increase our cost of capital and adversely affect our financial condition, results of operations and liquidity. Longer term disruptions in the capital and credit markets as a result of uncertainty, including as a result of changes in U.S. tax and other laws, reduced financing alternatives, or failures of significant financial institutions could adversely affect our access to the liquidity needed for our business. Any significant disruption in the capital, debt or credit markets, or financial institution failures could require us to take measures to conserve cash until the market stabilizes or until alternative financing can be arranged. Such measures could include deferring capital expenditures, reducing or suspending dividend payments, and reducing other discretionary expenditures.
Any of the foregoing events that impede our access to the capital markets, or the failure of any of our lenders to meet their commitments that result from financial market disruptions, could expose us to increased interest expense, require us to institute cash conservation measures or otherwise adversely and materially affect our business, financial condition, results of operations, cash flows and liquidity.
American Water may be unable to meet its ongoing and future financial obligations and to pay dividends on its common stock if its subsidiaries are unable to pay upstream dividends or repay funds to American Water.
American Water is a holding company and, as such, American Water has no operations of its own. Substantially all of our consolidated assets are held by subsidiaries. American Water’s ability to meet its financial obligations and to pay dividends on its common stock is primarily dependent on the net income and cash flows of its subsidiaries and their ability to pay upstream dividends to American Water or repay indebtedness to American Water. Prior to paying dividends to American Water, American Water’s regulated subsidiaries must comply with applicable regulatory restrictions and financial obligations, including, for example, debt service and preferred and preference stock dividends, as well as applicable corporate, tax and other laws and regulations and agreements, and covenants and other agreements made or entered into by American Water and its subsidiaries. American Water’s subsidiaries are separate legal entities and have no obligation to pay dividends to American Water. A failure or inability of any of these subsidiaries to pay such dividends or repay intercompany obligations could have a material adverse impact on American Water’s liquidity and its ability to pay dividends on its common stock and meet its other obligations.
We may not be able to fully utilize our U.S. and state net operating loss carryforwards.
As of
December 31, 2017
, we had U.S. federal and state NOL carryforwards of approximately
$1.05 billion
and
$322 million
, respectively, and management believes it is more likely than not that these NOL carryforwards will be recovered in the future. With the enactment of the TCJA, the Company analyzed the impacts of the reduction in the U.S. federal corporate income tax rate from 35% to 21% on the Company’s deferred tax assets and liabilities, including its NOL carryforwards, and as a result, remeasured those NOL carryforwards as of the date of enactment of the TCJA based on this tax rate change.
Our federal NOL carryforwards will begin to expire in
2028
, and our state NOL carryforwards will begin to expire in 2018 through 2037. Our ability to utilize our NOL carryforwards is primarily dependent upon our ability to generate sufficient taxable income. We have, in the past, been unable to utilize certain of our state NOL carryforwards, and the establishment or increase of a valuation allowance in the future would reduce our deferred income tax assets and our net income.
Our actual results may differ from those estimated by management in making its assessment as to our ability to use the NOL carryforwards. Moreover, adoption of Related Interpretations with respect to the TCJA and other changes in income tax laws, the economy and the general business environment could affect the future utilization of our NOL carryforwards. If we are unable to fully utilize our NOL carryforwards to offset taxable income generated in the future, our financial position, results of operations and cash flows could be materially adversely affected.
We have recorded a significant amount of goodwill, and we may never realize the full value of our intangible assets, causing us to record impairments that may negatively affect our results of operations.
Our total assets include
$1.4 billion
of goodwill at
December 31, 2017
. The goodwill is primarily associated with the acquisition of American Water by an affiliate of our previous owner in 2003 and the acquisition of E’town Corporation by a predecessor to our previous owner in 2001, and, to a lesser extent, the acquisition of Keystone in 2015. Goodwill represents the excess of the purchase price the purchaser paid over the fair value of the net tangible and other intangible assets acquired. Goodwill is recorded at fair value on the date of an acquisition and is reviewed annually or more frequently if changes in circumstances indicate the carrying value may not be recoverable. As required by the applicable accounting rules, we have taken significant non-cash charges to operating results for goodwill impairments in the past.
30
We may be required to recognize an impairment of goodwill in the future due to market conditions or other factors related to our performance or the performance of an acquired business. These market conditions could include a decline over a period of time of our stock price, a decline over a period of time in valuation multiples of comparable water utilities, market price performance of our common stock that compares unfavorably to our peer companies, decreases in control premiums, or, with respect to Keystone, fluctuations in the level of exploration and production activities in the Marcellus and Utica shale regions served by Keystone, a prolonged depression of natural gas prices or other factors that negatively impact our current or future forecasts of operating results, cash flows or key assumptions. A decline in the results forecasted in our business plan due to events such as changes in rate case results, capital investment budgets or interest rates, could also result in an impairment charge. Recognition of impairments of goodwill would result in a charge to income in the period in which the impairment occurred, which may negatively affect our financial condition, results of operations and total capitalization. The effects of any such impairment could be material and could make it more difficult to maintain our credit ratings, secure financing on attractive terms, maintain compliance with debt covenants and meet the expectations of our regulators.
Market conditions may impact the value of benefit plan assets and liabilities, as well as assumptions related to the benefit plans, which may require us to provide significant additional funding.
The performance of the capital markets affects the values of the assets that are held in trust to satisfy significant future obligations under our pension and postretirement benefit plans. The value of these assets is subject to market fluctuations, which may cause investment returns to fall below our projected return rates. A decline in the market value of the pension and postretirement benefit plan assets can increase the funding requirements under our pension and postretirement benefit plans. Additionally, our pension and postretirement benefit plan liabilities are sensitive to changes in interest rates. If interest rates decrease, our liabilities would increase, potentially increasing benefit expense and funding requirements. Further, changes in demographics, such as increases in life expectancy assumptions and increasing trends in health care costs may also increase our funding requirements. Future increases in pension and other postretirement costs as a result of reduced plan assets may not be fully recoverable in rates, in which case our results of operations and financial position could be negatively affected.
In addition, market factors can affect assumptions we use in determining funding requirements with respect to our pension and postretirement plans. For example, a relatively modest change in our assumptions regarding discount rates can materially affect our calculation of funding requirements. To the extent that market data compels us to reduce the discount rate used in our assumptions, our benefit obligations could be materially increased, which could adversely affect our financial position, results of operations and cash flows.
New accounting standards or changes to existing accounting standards could materially impact how we report our results of operations, cash flow and financial condition.
Our Consolidated Financial Statements are prepared in accordance with GAAP. The SEC, the Financial Accounting Standards Board or other authoritative bodies or governmental entities may issue new pronouncements or new interpretations of existing accounting standards that may require us to change our accounting policies. These changes are beyond our control, can be difficult to predict and could materially impact how we report our results of operations, cash flow and financial condition. We could be required to apply a new or revised standard retroactively, which could adversely affect our results of operations, cash flow and financial condition.
Undetected errors in internal controls and information reporting could result in the disallowance of cost recovery and noncompliant disclosure.
Our internal controls, accounting policies and practices and internal information systems are designed to enable us to capture and process transactions and information in a timely and accurate manner in compliance with GAAP, taxation requirements, federal securities laws and regulations and other laws and regulations applicable to us. Such compliance permits us to, among other things, disclose and report financial and other information in connection with the recovery of our costs and with the reporting requirements under federal securities, tax and other laws and regulations.
We have implemented corporate governance, internal control and accounting policies and procedures in connection with the Sarbanes-Oxley Act of 2002 (the “Sarbanes-Oxley Act”) and relevant SEC rules, as well as other applicable regulations. Such internal controls and policies have been and continue to be closely monitored by our management and Board of Directors to ensure continued compliance with these laws, rules and regulations. Management is also responsible for establishing and maintaining internal control over financial reporting and is required to assess annually the effectiveness of these controls. While we believe these controls, policies, practices and systems are adequate to verify data integrity, unanticipated and unauthorized actions of employees or temporary lapses in internal controls due to shortfalls in oversight or resource constraints could lead to undetected errors that could result in the disallowance of cost recovery and noncompliant disclosure and reporting. The consequences of these events could have a negative impact on our results of operations and financial condition. The inability of management to certify as to the effectiveness of these controls due to the identification of one or more material weaknesses in these controls could also increase financing costs or could also adversely affect our or AWCC’s ability to access the capital markets.
31
Additional Risks Related to Our
Market-Based Businesses
We (excluding our regulated subsidiaries) provide performance guarantees with respect to certain obligations of our
Market-Based Businesses
, including financial guarantees or deposits, to our public-sector and public clients, and these clients may seek to enforce the guarantees if our
Market-Based Businesses
do not satisfy these obligations.
Under the terms of some of our agreements for the provision of services to water and wastewater facilities with municipalities, other governmental entities and other customers, American Water (excluding our regulated subsidiaries) provides guarantees of specified performance obligations of our
Market-Based Businesses
, including financial guarantees or deposits. In the event our
Market-Based Businesses
fail to perform these obligations, the entity holding the guarantees may seek to enforce the performance commitments against us or proceed against the deposit. In that event, our financial condition, results of operations, cash flows, and liquidity could be adversely affected.
At
December 31, 2017
, we had remaining performance commitments as measured by remaining contract revenue totaling approximately
$3.6 billion
, and this amount is likely to increase if our
Market-Based Businesses
expand. The presence of these commitments may adversely affect our financial condition and make it more difficult for us to secure financing on attractive terms.
AWE’s operations are subject to various risks associated with doing business with the U.S. government.
We enter into contracts with the U.S. government for the operation and maintenance of water and wastewater systems, which contracts may be terminated, in whole or in part, prior to the end of the 50-year term for convenience of the U.S. government or as a result of default or non-performance by the subsidiary performing the contract. In addition, the contract price for each of these military contracts is typically subject to redetermination two years after commencement of operations and every three years thereafter. Price redetermination is a contract mechanism to periodically adjust the service fee in the next period to reflect changes in contract obligations and anticipated market conditions. Any early contract termination or unfavorable price redetermination could adversely affect our financial condition, results of operations and cash flows.
Moreover, entering into contracts with the U.S. government subjects us to a number of operational and compliance risks, including dependence on the level of government spending and compliance with and changes in governmental procurement and security regulations. We are subject to potential government investigations of our business practices and compliance with government procurement and security regulations, which are complex, and compliance with these regulations can be expensive and burdensome. If we were charged with wrongdoing as a result of an investigation, we could be suspended or barred from bidding on or receiving awards of new contracts with the U.S. government, which could have a material adverse effect on our results of operations and cash flows.
AWE operates a number of water and wastewater systems under O&M contracts and faces the risk that the owners of those systems may fail to provide capital to properly maintain those systems, which may negatively affect AWE as the operator of the systems.
AWE operates a number of water and wastewater systems under O&M contracts. Pursuant to these contracts, AWE operates the system according to the standards set forth in the applicable contract, and it is generally the responsibility of the owner of the system to undertake capital improvements. In some cases, AWE may not be able to convince the owner to make needed improvements in order to maintain compliance with applicable regulations. Although violations and fines incurred by water and wastewater systems may be the responsibility of the owner of the system under these contracts, those non-compliance events may reflect poorly on AWE as the operator of the system and us, and damage our reputation, and in some cases, may result in liability to us to the same extent as if we were the owner.
AWE’s
Market-Based Businesses
are party to long-term contracts to operate and maintain water and wastewater systems under which we may incur costs in excess of payments received.
Some of AWE’s
Market-Based Businesses
enter into long-term contracts under which they agree to operate and maintain a municipality’s, federal government’s or other party’s water or wastewater treatment and delivery facilities, which includes specified major maintenance for some of those facilities, in exchange for an annual fee. These
Market-Based Businesses
are generally subject to the risk that costs associated with operating and maintaining the facilities, including production costs such as purchased water, electricity, fuel and chemicals used in water treatment, may exceed the fees received from the municipality or other contracting party. Losses under these contracts or guarantees may adversely affect our financial condition, results of operations, cash flows and liquidity.
32
Keystone’s operations may expose us to substantial costs and liabilities with respect to environmental laws and matters.
Keystone’s operations, and the operation generally of natural gas and oil exploration and production facilities by Keystone’s customers, are subject to stringent federal, state and local laws, rules, regulations and ordinances governing the release of materials into the environment or otherwise relating to environmental protection. These provisions may require the acquisition by Keystone of permits or licenses before providing its services to customers, prohibit the release of substances defined thereunder as hazardous in connection with these activities, and impose substantial liabilities for the violation thereof that may result from these operations. Failure to comply with these laws, rules, regulations and ordinances may result in substantial environmental remediation and other costs to Keystone, the assessment of administrative, civil and criminal penalties or the issuance of injunctions restricting or prohibiting certain activities. Under existing environmental laws and regulations, Keystone could be held strictly liable for the removal or remediation of previously released materials or property contamination regardless of whether the release resulted from its operations, or whether its operations were in compliance with all applicable laws at the time they were performed. While we have structured and maintained our ownership and control of Keystone’s operations in such a way that we believe should insulate the Company, its regulated subsidiaries and its other
Market-Based Businesses
from any liabilities associated with Keystone’s operations, including liabilities for environmental matters, there can be no assurance that such efforts will be sufficient to prevent the Company from incurring liability for the operations of Keystone.
Changes in environmental laws and regulations occur frequently, and any changes to these or other laws governing the natural gas and oil exploration industry that result in more stringent or costly water or wastewater handling, storage, transport, disposal or cleanup requirements could require Keystone to make significant expenditures to maintain compliance with such requirements, may harm Keystone’s business and results of operations by reducing the demand for Keystone’s water and related services, and may otherwise have a material adverse effect on Keystone’s competitive position, financial condition, results of operations and cash flows.
|
ITEM 1B.
|
UNRESOLVED STAFF COMMENTS
|
None
|
ITEM 2.
|
PROPERTIES
|
Our properties consist primarily of: (i) water and wastewater treatment plants; (ii) mains and pipes used for transmission, distribution and collection of water and wastewater; (iii) wells and other sources of water supply, such as reservoirs; (iv) water and wastewater pumping stations; (v) meters and fire hydrants; (vi) general structures, including buildings, dams and treated water storage facilities; (vii) land and easements; (viii) vehicles; (ix) software rights and; (x) other equipment and facilities, the majority of which are used directly in the operation of our systems. Substantially all of our properties are owned by our subsidiaries, with a large percentage subject to liens of our mortgage bonds. We lease our corporate offices, located in Voorhees, New Jersey, equipment and furniture from certain of our wholly owned subsidiaries. These properties are utilized by our directors, officers and staff in the conduct of the business.
The properties of our
Regulated Businesses
consist mainly of:
|
•
|
72
surface water treatment plants;
|
|
•
|
527
groundwater treatment plants;
|
|
•
|
8
combined (surface water and groundwater) treatment plants;
|
|
•
|
127
wastewater treatment plants;
|
|
•
|
50,382
miles of transmission, distribution and collection mains and pipes;
|
|
•
|
1,103
groundwater wells;
|
|
•
|
1,428
water and wastewater pumping stations;
|
|
•
|
1,313
treated water storage facilities; and
|
|
•
|
80
dams.
|
We have ongoing infrastructure renewal programs in all states in which our
Regulated Businesses
operate. These programs consist of both the rehabilitation of existing mains and equipment, and the replacement of mains and equipment that have been damaged or have reached, or are near, the end of their useful service lives. The properties of our
Market-Based Businesses
consist mainly of office furniture and IT equipment, and are primarily located in New Jersey. Approximately
52%
of all properties that we own are located in New Jersey and Pennsylvania.
We maintain property insurance against loss or damage to our properties by fire or other perils, subject to certain exceptions. For insured losses, we are self-insured to the extent that any losses are within the policy deductible or exceed the amount of insurance maintained.
33
We believe that our properties are generally maintained in good operating condition and in accordance with current standards of good water and wastewater industry practice.
|
ITEM 3.
|
LEGAL PROCEEDINGS
|
Alternative Water Supply in Lieu of Carmel River Diversions
Under the 2009 Order, Cal Am is required, among other things, to decrease significantly its yearly diversions of water from the Carmel River according to a set reduction schedule. The 2009 Order responded to claims that Cal Am had not sufficiently implemented actions to terminate its unpermitted diversions of water from the Carmel River as required by a 1995 SWRCB order. In July 2016, at the request of Cal Am and several Monterey County government agencies, the SWRCB issued the 2016 Order approving a five-year extension of the deadline to comply with the 2009 Order, to December 31, 2021. In November 2016, the Water Ratepayers Association of the Monterey Peninsula, a citizens’ advocacy group, filed an action in Sacramento County Superior Court against the SWRCB and its board members, and naming Cal Am as the real party in interest, seeking to reverse the extension of the 2009 Order, to rescind the designation by the California Public Utilities Commission (the “CPUC”) of Cal Am as the public utility water provider to the Monterey Peninsula, and to appoint a receiver to oversee Cal Am’s compliance with the 2009 Order, with ultimate transfer to a public entity. In May 2017, Cal Am and the SWRCB filed demurrers to the action, and on June 12, 2017, the court entered an order sustaining those demurrers and dismissing the action with prejudice.
Regional Desalination Project Litigation
The Regional Desalination Project (the “RDP”) involved the construction of a desalination facility in the City of Marina, north of Monterey. The RDP was intended to, among other things, eliminate unauthorized diversions from the Carmel River as required under the 2009 Order. In December 2010, the CPUC approved the RDP, which was to be implemented through a Water Purchase Agreement and ancillary agreements (collectively, the “Agreements”) among the Marina Coast Water District (“MCWD”), the Monterey County Water Resources Agency (“MCWRA”) and Cal Am. In 2011, due to a conflict of interest concerning a former member of MCWRA’s Board of Directors, MCWRA stated that the Agreements were void, and, as a result, Cal Am terminated the Agreements. In April 2015, the CPUC approved a settlement agreement among Cal Am, MCWRA and the County of Monterey to resolve these matters among the parties signing the agreement. In March 2016, the Supreme Court of California granted MCWD’s petition for review of the CPUC approval, and following the court’s disposition of a related issue in another case, MCWD’s petition for review of the CPUC-approved settlement agreement was remanded to the CPUC, and remains pending.
In October 2012, Cal Am filed a Complaint for Declaratory Relief against MCWRA and MCWD, which was ultimately transferred to the San Francisco County Superior Court, seeking a determination as to whether the Agreements are void as a result of the alleged conflict of interest. In June 2015, the court entered a final judgment agreeing with Cal Am’s position that four of the five Agreements are void, and one, the credit line agreement, is not void. In November 2016, the Supreme Court of California denied MCWD’s final appeal of this judgment, which allows further proceedings to determine the amount of damages that may be awarded in the proceeding.
In July 2015, Cal Am and MCWRA filed a Complaint in San Francisco County Superior Court against MCWD and RMC Water and Environment (“RMC”), a private engineering consulting firm, seeking to recover compensatory damages in excess of $10 million associated with the failure of the RDP, as well as punitive and treble damages, statutory penalties and attorneys’ fees. Shortly thereafter, complaints seeking similar damages were filed in the same court by MCWD and RMC against Cal Am and MCWRA in excess of $19 million in the aggregate. In December 2015, the court consolidated all of these complaints into a single action, and trial in this matter has been scheduled for June 18, 2018. On December 21, 2017, RMC filed a Motion for Summary Judgment and a hearing on such motion is scheduled for March 15, 2018. On December 6, 2017, MCWD filed a Motion for Judgment on the Pleadings and a hearing on such motion took place on February 2, 2018. On February 5, 2018, the court dismissed Cal Am’s and MCWRA’s tort law claims against MCWD, and allowed Cal Am leave to amend its breach of contract claims against MCWD. The court’s decision does not impact Cal Am’s and MCWRA’s tort claims against RMC. Cal Am and MCWRA were given until February 19, 2018 to amend their breach of contract claims. Cal Am and MCWRA are considering their responses to the order, including an appeal to the California Court of Appeal.
Monterey Peninsula Water Supply Project
The Water Supply Project is intended to reduce water diversions from the Carmel River and involves construction of a desalination plant, owned by Cal Am, and purchase of water by Cal Am from a groundwater replenishment project (the “GWR Project”) between the Monterey Regional Water Pollution Control Agency and the MPWMD. Cal Am’s ability to move forward on the Water Supply Project is subject to extensive administrative review by the CPUC and other government agencies, obtaining necessary permits, and intervention from other parties. On January 12, 2017, the CPUC issued a Draft Environmental Impact Report/Environmental Impact Statement. A final report is expected at the end of the first quarter of 2018.
34
On September 15, 2016, the CPUC unanimously approved a decision to authorize Cal Am to enter into a water purchase agreement for the GWR Project and to construct a pipeline and pump station facilities and recover up to $50 million in associated costs, subject to meeting certain criteria. If construction costs exceed $50 million, Cal Am would be allowed to seek additional cost recovery.
A preliminary step to building the Water Supply Project desalination plant is the construction and operation of a test slant well to confirm the suitability of the property on which intake wells will be located to draw water from under Monterey Bay. In November 2014, the California Coastal Commission (the “Coastal Commission”) approved coastal development permits for the test slant well, enabling Cal Am to construct and operate the test slant well. The permits would have expired on February 28, 2018, at which time Cal Am would have been required to decommission the test slant well, but because Cal Am could use the test slant well as one of the slant wells for the Water Supply Project, it sought an amendment of its coastal development permits to allow the test slant well to remain in place and be maintained on site until February 28, 2019. The Coastal Commission approved the permit amendment on December 13, 2017. The required lease obtained from the California State Lands Commission (the “State Lands Commission”), as amended, after a two-year extension granted on November 29, 2017, is to expire on December 16, 2019.
On July 13, 2017, the Coastal Commission adopted a consent agreement and cease and desist order requiring sand mining operations on the property on which intake wells will be located to cease by the end of 2020 and the property to be sold to either a non-profit or governmental entity. The consent agreement strictly limits future use of the property but preserves Cal Am’s existing property rights and allows uses consistent with existing easements and other rights of record.
The CPUC held hearings from October 25 through November 3, 2017 on Cal Am’s request for a certificate of public convenience and necessity for the Water Supply Project. This request remains pending.
In December 2014, the MCWD and the Ag Land Trust, an agricultural land conservancy, filed petitions against the Coastal Commission and Cal Am, which were ultimately transferred to the Santa Cruz County Superior Court, seeking to vacate the Coastal Commission’s approval of the coastal development permit and to permanently restrain Cal Am and the Coastal Commission from constructing the test slant well pending full compliance with the California Environmental Quality Act and the California Coastal Act. The court denied these petitions, and on January 11, 2017, the Supreme Court of California denied MCWD’s petition for review of this decision. MCWD filed a similar petition in January 2015 against the State Lands Commission and Cal Am, which remains pending.
In November 2015, MCWD filed a Petition for Writ of Mandate and Complaint for Declaratory and Injunctive Relief in Santa Cruz County Superior Court against the Coastal Commission and Cal Am challenging the amendment of the coastal development permits and seeking an injunction against further test well pumping. In September 2016, the court denied MCWD’s petition with respect to all claims, except claims related to those raised in the December 2014 petitions discussed above. On October 3, 2017, after conducting a trial for all matters raised in MCWD’s November 2015 challenge, other than claims that had been denied by the court in September 2016, the court denied MCWD’s claims with respect to these matters. On January 12, 2018, MCWD filed a notice of appeal of the court’s judgment.
Based on the foregoing, Cal Am estimates that the earliest date by which the Water Supply Project desalination plant could be completed is sometime in 2021. There can be no assurance that Cal Am’s application for the Water Supply Project will be approved or that the Water Supply Project will be completed on a timely basis, if ever. Furthermore, there can be no assurance that Cal Am will be able to comply with the diversion reduction requirements and other remaining requirements under the 2009 Order and the 2016 Order, or that any such compliance will not result in material additional costs or obligations to Cal Am or the Company.
California Public Utilities Commission Residential Rate Design Proceeding
In December 2016, the CPUC issued a final decision in a proceeding involving Cal Am adopting a new residential rate design for Cal Am’s Monterey District. The decision allowed for recovery by Cal Am of $32 million in under-collections in the water revenue adjustment mechanism/modified cost balancing account (“WRAM/MCBA”) over a five-year period, plus interest, and modified existing conservation and rationing plans. In its decision, the CPUC noted concern regarding Cal Am’s residential tariff administration, specifically regarding the lack of verification of customer-provided information about the number of residents per household. This information was used for generating billing determinants under the tiered rate system. As a result, the CPUC kept this proceeding open to address several issues, including whether Cal Am’s residential tariff administration violated a statute, rule or CPUC decision, and if so, whether a penalty should be imposed.
On February 24, 2017, Cal Am, the MPWMD, the CPUC’s Office of Ratepayer Advocates, and the Coalition of Peninsula Businesses filed for CPUC approval of a joint settlement agreement (the “Joint Settlement Agreement”), which among other things, proposed to resolve the CPUC’s residential tariff administration concerns by providing for a waiver by Cal Am of $0.5 million of cost recovery for residential customers through the WRAM/MCBA in lieu of a penalty. Approval of the Joint Settlement Agreement, which is required for it to take effect, remains pending before the CPUC.
35
On March 28, 2017, the administrative law judge assigned to the proceeding issued a ruling stating there was sufficient evidence to conclude, on a preliminary basis, that Cal Am’s administration of the residential tariff violated certain provisions of the California Public Utilities Code and a CPUC decision. The ruling ordered Cal Am to show cause why it should not be penalized for these administrative violations and directed the settling parties to address whether the cost recovery waiver in the Joint Settlement Agreement was reasonable compared to a potential penalty range described by the administrative law judge. During hearings held on April 13-14, 2017, the administrative law judge clarified that this potential penalty range is $3 million to $179 million (calculated as a continuing violation dating back to 2000 and applying penalties of up to $20,000 per day until January 1, 2012 and penalties of up to $50,000 per day thereafter, reflecting a 2012 change to the relevant statute). The administrative law judge also noted that a per diem penalty may not be appropriate, as Cal Am’s monthly billing practices did not allow Cal Am to update customer-provided information for billing purposes on a daily basis. Hearings before the administrative law judge in this matter were held in August, September and November 2017. Cal Am also submitted additional testimony on the issue of whether Cal Am should be penalized, and if so, the reasonable amount of any such penalty. This proceeding remains pending, and the CPUC has set a statutory deadline of September 30, 2018 for the completion of the proceeding.
West Virginia Elk River Freedom Industries Chemical Spill
Background
On January 9, 2014, a chemical storage tank owned by Freedom Industries, Inc. leaked two substances, 4-methylcyclohexane methanol (“MCHM”), and PPH/DiPPH, a mix of polyglycol ethers, into the Elk River near the WVAWC treatment plant intake in Charleston, West Virginia. After having been alerted to the leak of MCHM by the West Virginia Department of Environmental Protection, WVAWC took immediate steps to gather more information about MCHM, augment its treatment process as a precaution, and begin consultations with federal, state and local public health officials. As soon as possible after it was determined that the augmented treatment process would not fully remove the MCHM, a joint decision was reached in consultation with the West Virginia Bureau for Public Health to issue a “Do Not Use” order for all of its approximately 93,000 customer accounts in parts of nine West Virginia counties served by the Charleston treatment plant. By January 18, 2014, none of WVAWC’s customers were subject to the Do Not Use order.
Following the Freedom Industries chemical spill, numerous lawsuits were filed against WVAWC and certain other Company-affiliated entities (collectively, the “American Water Defendants”) with respect to this matter in the U.S. District Court for the Southern District of West Virginia or West Virginia Circuit Courts in Kanawha, Boone and Putnam counties, and to date, more than
70
cases remain pending. Four of the cases pending before the U.S. district court were consolidated for purposes of discovery, and an amended consolidated class action complaint for those cases (the “Federal action”) was filed in December 2014 by several plaintiffs. In January 2016, all of the then-filed state court cases were referred to West Virginia’s Mass Litigation Panel for further proceedings, which have been stayed until April 22, 2018 pending the approval by the court in the Federal action of a global agreement to settle all of such cases, as described below. The court in the Federal action has continued the start of the trial indefinitely pending ongoing settlement approval activities.
Proposed Global Class Action Settlement
In October 2016, the court in the Federal action approved the preliminary principles, terms and conditions of a binding global agreement in principle to settle claims among the American Water Defendants, and all class members, putative class members, claimants and potential claimants, arising out of the Freedom Industries chemical spill. On April 27, 2017, the parties filed with the court in the Federal action a proposed settlement agreement providing details of the terms of the settlement of these matters and requesting that the court in the Federal action grant preliminary approval of such settlement. On July 6, 2017, the court in the Federal action issued an opinion denying without prejudice the joint motion for preliminary approval of the Settlement. On August 25, 2017, the parties filed a proposed amended settlement agreement and related materials addressing the matters set forth in the July 6, 2017 order.
On September 21, 2017, the court in the Federal action issued an order granting preliminary approval of a settlement class and proposed class action settlement (the “Settlement”) with respect to claims against the American Water Defendants by all putative class members (collectively, the “Plaintiffs”) for all claims and potential claims arising out of the Freedom Industries chemical spill. The Settlement proposes a global resolution of all federal and state litigation and potential claims against the American Water Defendants and their insurers. Under the terms and conditions of the Settlement and the proposed amended settlement agreement, the American Water Defendants have not admitted, and will not admit, any fault or liability for any of the allegations made by the Plaintiffs in any of the actions to be resolved. Under federal class action rules, claimants had the right, until December 8, 2017, to elect to opt out of the final Settlement, in which case such claimant would not receive any benefit from or be bound by the terms of the Settlement. As of January 31, 2018, less than 100 of the 225,000 estimated putative Plaintiffs have submitted opt-out notices. The deadline to file a claim in the Settlement is February 21, 2018.
36
The proposed aggregate pre-tax amount of the Settlement with respect to the Company is $
126 million
. The aggregate portion of the Settlement to be contributed by WVAWC, net of insurance recoveries, is $
43 million
(approximately $
26 million
after-tax), taking into account the September 2017 settlement with one of the Company’s general liability insurance carriers discussed below. Another defendant to the Settlement is to contribute up to $
25 million
to the Settlement. Two of the Company’s general liability insurance carriers, which provide an aggregate of $
50 million
in insurance coverage to the Company under these policies, had been originally requested to participate in the Settlement at the time of the initial filing of the binding agreement in principle with the court in the Federal action, but did not agree to do so at that time. WVAWC filed a lawsuit against one of these carriers alleging that the carrier’s failure to agree to participate in the Settlement constituted a breach of contract. On September 19, 2017, the Company and the insurance carrier settled this lawsuit for $
22 million
, out of a maximum of $25 million in potential coverage under the terms of the relevant policy, in exchange for a full release by the Company and WVAWC of all claims against the insurance carrier related to the Freedom Industries chemical spill. WVAWC and the settling insurer have agreed to stay this litigation pending final approval of the Settlement. The Company and WVAWC continue to pursue vigorously their rights to insurance coverage for contributions by WVAWC to the Settlement in mandatory arbitration with the remaining non-participating carrier. This arbitration proceeding remains pending. Despite these efforts, the Company may not ultimately be successful in obtaining full or further reimbursement under this insurance policy for amounts that WVAWC may be required to contribute to the Settlement.
The proposed Settlement would establish a two-tier settlement fund for the payment of claims, comprised of (i) a simple claim fund, which is also referred to as the “guaranteed fund,” of $
76 million
, of which $
29 million
will be contributed by WVAWC, including insurance deductibles, and $
47 million
would be contributed by two of the Company’s general liability insurance carriers, and (ii) an individual review claim fund of up to $
50 million
, of which up to $
14 million
would be contributed by WVAWC and up to $
36 million
would be contributed by a number of the Company’s general liability insurance carriers. Separately, up to $
25 million
would be contributed to the guaranteed fund by another defendant to the Settlement. If any final approval order by the court in the Federal action with respect to the Settlement is appealed and such appeal would delay potential payment to claimants under the Settlement, WVAWC and the other defendant to the Settlement will contribute up to $
50 million
and $
25 million
, respectively, to the Settlement (not including, in the case of WVAWC, any contributions by the Company’s general liability insurance carriers which would not be made until such time as a final, non-appealable order is issued) into an escrow account during the pendency of such appeals. For certain claims, WVAWC and the other defendant to the Settlement may, in lieu of these escrowed contributions, make advance payments of such claims if agreed to by the parties. All administrative expenses of the Settlement and attorneys’ fees of class counsel related thereto would be paid from the funds designated to pay claims covered by the Settlement.
As a result of these events, in the third quarter of 2016, the Company recorded a charge to earnings, net of insurance receivables, of $
65 million
($
39 million
after-tax). Additionally, in the third quarter of 2017, the Company recorded a benefit of $
22 million
($
13 million
after-tax) as an additional insurance receivable reflecting the settlement with the insurance carrier described above. The Company intends to fund WVAWC’s contributions to the Settlement through existing sources of liquidity, although no contribution by WVAWC will be required unless and until the terms of the Settlement are finally approved by the court in the Federal action. Furthermore, under the terms of the Settlement, WVAWC has agreed that it will not seek rate recovery from the PSC for approximately $
4 million
in direct response costs expensed in 2014 by WVAWC relating to the Freedom Industries chemical spill as well as for amounts paid by WVAWC under the Settlement.
The Company’s insurance policies operate under a layered structure where coverage is generally provided in the upper layers after claims have exhausted lower layers of coverage. The $
36 million
to be contributed by a number of the Company’s general liability insurance carriers to the individual review claim fund, as noted above, is from higher layers of the insurance structure than the insurance carrier that was requested, but presently has not agreed, to participate in the Settlement. Any recovery by WVAWC or the Company from the remaining non-participating carrier would reimburse WVAWC for its contributions to the guaranteed fund.
Notice of the terms of the Settlement to members of the settlement class commenced on October 11, 2017. Following the notice period, on January 9, 2018, the court in the Federal action held a fairness hearing to consider final approval of the Settlement, which was continued on February 1, 2018 to address certain open matters. At this hearing, the court in the Federal action indicated that it intended to enter an order approving the Settlement, and the parties submitted a proposed order to the court on February 2, 2018.
There can be no assurance that the Settlement will not be amended further or that the court will provide its final approval as to any agreement negotiated between the parties reflecting the terms of the Settlement.
The American Water Defendants believe that WVAWC has responded appropriately to, and, other than through the Settlement, has no responsibility for, the Freedom Industries chemical spill, and that the American Water Defendants have valid, meritorious defenses to the lawsuits. Nevertheless, WVAWC and the Company are unable to predict the outcome of any lawsuit against the American Water Defendants brought or maintained by a claimant that has elected to opt out of the Settlement, and any such outcome or outcomes could have a material adverse effect on the Company’s financial condition, results of operations, cash flows, liquidity and reputation.
37
Other Related Proceedings
Additionally, investigations were initiated with respect to the matter by the U.S. Chemical Safety and Hazard Investigation Board (the “CSB”), the U.S. Attorney’s Office for the Southern District of West Virginia, the West Virginia Attorney General, and the PSC. As a result of the U.S. Attorney’s Office investigation, Freedom Industries and six former Freedom Industries employees (three of whom also were former owners of Freedom Industries), pled guilty to violations of the federal Clean Water Act. The PSC issued an order on June 15, 2017 concluding its investigation without requiring WVAWC to take any further action with respect to the matters covered by the general investigation.
The CSB is an independent investigatory agency with no regulatory mandate or ability to issue fines or citations; rather, the CSB can only issue recommendations for further action. In response to the Freedom Industries chemical spill, the CSB commenced an investigation shortly thereafter. In September 2016, the CSB issued and adopted its investigation report in which it recommended that the Company conduct additional source water protection activities. On April 4, 2017, the CSB indicated that the implementation by the Company of source water protection activities resolved the first two parts of the CSB’s recommendation. The CSB also noted that compliance by the Company with the third part of its recommendation is ongoing and that closure of this part is contingent upon completion of updated contingency planning for the Company’s water utilities outside of West Virginia. In light of public response to its original September 2016 investigation report, on May 11, 2017, the CSB issued a new version of this report. The primary substantive change addressed CSB’s factual evaluation of the duration and volume of contamination from the leaking tank, decreasing its estimate of the leak time but increasing the volume estimate by 10%. No substantive changes were made to the conclusions and recommendations in the original report.
On March 16, 2017, the Lincoln County (West Virginia) Commission (the “LCC”) passed a county ordinance entitled the “Lincoln County, WV Comprehensive Public Nuisance Investigation and Abatement Ordinance.” The ordinance establishes a mechanism that Lincoln County believes will allow it to pursue criminal or civil proceedings for the “public nuisance” it alleges was caused by the Freedom Industries chemical spill. On April 20, 2017, the LCC filed a complaint in Lincoln County state court against WVAWC and certain other defendants not affiliated with the Company, alleging that the Freedom Industries chemical spill caused a public nuisance in Lincoln County. The complaint seeks an injunction against WVAWC that would require the creation of various databases and public repositories of documents related to the Freedom Industries chemical spill, as well as further study and risk assessments regarding the alleged exposure of Lincoln County residents to the released chemicals. On June 12, 2017, the Mass Litigation Panel entered an order granting a motion to transfer this case to its jurisdiction and stayed the case consistent with the existing stay order. The LCC has elected to opt out of the Settlement. On January 26, 2018, the LCC filed a motion seeking to lift the stay imposed by the Mass Litigation Panel. This motion is pending. WVAWC believes that this lawsuit is without merit and intends to vigorously contest the claims and allegations raised in the complaint.
WVAWC and the Company are unable to predict the outcome of the ongoing government investigations or actions or any legislative initiatives that might affect WVAWC’s water utility operations.
Dunbar, West Virginia Water Main Break Class Action Litigation
On the evening of June 23, 2015, a 36-inch pre-stressed concrete transmission water main, installed in the early 1970s, failed. The water main is part of WVAWC’s West Relay pumping station located in the City of Dunbar. The failure of the main caused water outages and low pressure to up to approximately 25,000 WVAWC customers. In the early morning hours of June 25, 2015, crews completed a repair, but that same day, the repair developed a leak. On June 26, 2015, a second repair was completed and service was restored that day to approximately 80% of the impacted customers, and to the remaining approximately 20% by the next morning. The second repair showed signs of leaking but the water main was usable until June 29, 2015 to allow tanks to refill. The system was reconfigured to maintain service to all but approximately 3,000 customers while a final repair was completed safely on June 30, 2015. Water service was fully restored on July 1, 2015 to all customers affected by this event.
On June 2, 2017, a class action complaint was filed in West Virginia Circuit Court in Kanawha County against WVAWC on behalf of a purported class of residents and business owners who lost water service or pressure as a result of the Dunbar main break. The complaint alleges breach of contract by WVAWC for failure to supply water, violation of West Virginia law regarding the sufficiency of WVAWC’s facilities and negligence by WVAWC in the design, maintenance and operation of the water system. The plaintiffs seek unspecified alleged damages on behalf of the class for lost profits, annoyance and inconvenience, and loss of use, as well as punitive damages for willful, reckless and wanton behavior in not addressing the risk of pipe failure and a large outage.
The Company and WVAWC believe that WVAWC has valid, meritorious defenses to the claims raised in this class action complaint. On October 12, 2017, WVAWC filed with the court a motion seeking to dismiss all of the plaintiffs’ counts alleging statutory and common law tort claims. Furthermore, WVAWC asserts that the PSC, and not the court, has primary jurisdiction over allegations involving violations of the applicable tariff, the public utility code and related rules. This motion remains pending.
38
Contract Operations Group -- East Palo Alto Water System Voluntary Report
On April 10, 2017, AWE, the parent entity of the Company’s Contract Operations Group, voluntarily reported to the Division of Drinking Water of the SWRCB potential violations of the California Safe Drinking Water Act (the “CSDWA”) in connection with AWE’s operation of the City of East Palo Alto’s water distribution system. Upon the resignation of the system’s general manager in March 2017, AWE discovered that it may have operated the system without a properly certified operator for two years, the triennial LCR sampling was not completed, and the 2015 Consumer Confidence Report improperly reported data for lead and copper samples from the system’s upstream water provider. Promptly after discovering these issues, AWE engaged an outside law firm to conduct an internal investigation and has reported the results of that investigation to the SWRCB.
On June 15, 2017, the SWRCB issued to AWE a citation that required AWE to, among other things: comply with regulations related to water operator certifications, lead and copper tap sampling requirements and the publishing of a Consumer Confidence Report; provide public notification of the LCR violation; and prepare a corrective action plan to evaluate the causes leading to these incidents and measures to be taken to prevent recurrence of future incidents. The citation did not impose on AWE any monetary penalties, but the SWRCB reserved the right to take additional enforcement action.
By letter dated October 4, 2017, the SWRCB advised AWE that it is in compliance with all of the directives and relevant statutory and administrative provisions specified in the SWRCB’s June 15, 2017 citation. While AWE has completed all required compliance activities with respect to the citation, the SWRCB has previously reserved the right to take additional enforcement action. In February 2018, the SWRCB referred this matter to the San Mateo County, California District Attorney’s office for further investigation. AWE continues to cooperate with the SWRCB, the City of East Palo Alto and the San Mateo County District Attorney regarding this matter. Proven violations of the CSDWA may result in civil and criminal penalties.
General
Periodically, the Company is involved in other proceedings or litigation arising in the ordinary course of business. Other than those proceedings described in this
Item 3—Legal Proceedings
, the Company does not believe that the ultimate resolution of these matters will materially affect its financial position or results of operations. However, litigation and other proceedings are subject to many uncertainties, and the outcome of individual matters is not predictable with assurance. It is possible that some litigation and other proceedings could be decided unfavorably to the Company, and that any such unfavorable decisions could have a material adverse effect on its business, financial condition, results of operations and cash flows.
|
ITEM 4.
|
MINE SAFETY DISCLOSURES
|
Not applicable
39
Since April 23, 2008, our common stock has traded on the New York Stock Exchange (“NYSE”) under the symbol “AWK.” The following table summarizes the per share range of the high and low intraday sales prices of our common stock as reported on the NYSE and the per share cash dividends paid and declared:
|
|
Intraday Market Prices
|
Per Share Dividends Paid
|
Per Share Dividends Declared (a)
|
|||||||||||||
|
2017
|
High
|
Low
|
||||||||||||||
|
Fourth Quarter
|
$
|
92.37
|
|
$
|
80.89
|
|
$
|
0.415
|
|
$
|
0.83
|
|
||||
|
Third Quarter
|
83.14
|
|
77.36
|
|
0.415
|
|
0.415
|
|
||||||||
|
Second Quarter
|
82.89
|
|
74.63
|
|
0.415
|
|
0.415
|
|
||||||||
|
First Quarter
|
78.73
|
|
69.96
|
|
0.375
|
|
—
|
|
||||||||
|
|
Intraday Market Prices
|
Per Share Dividends Paid
|
Per Share Dividends Declared (a)
|
|||||||||||||
|
2016
|
High
|
Low
|
||||||||||||||
|
Fourth Quarter
|
$
|
76.12
|
|
$
|
69.41
|
|
$
|
0.375
|
|
$
|
0.75
|
|
||||
|
Third Quarter
|
85.24
|
|
72.12
|
|
0.375
|
|
0.375
|
|
||||||||
|
Second Quarter
|
84.54
|
|
68.09
|
|
0.375
|
|
0.375
|
|
||||||||
|
First Quarter
|
70.10
|
|
58.90
|
|
0.34
|
|
—
|
|
||||||||
|
(a)
|
Dividends declared during the three months ended December 31, 2017 and 2016, include quarterly dividends payable December 1 and March 1.
|
As of
February 15, 2018
, there were
178,551,923
shares of common stock outstanding held by approximately
2,644
record holders. Holders of our common stock are entitled to receive dividends when they are declared by our Board of Directors. When dividends on common stock are declared, they are typically paid in March, June, September and December. Future dividends are not guaranteed by the Company and will be dependent on future earnings, financial requirements, contractual provisions of debt agreements and other relevant factors. For more information regarding restrictions on the payment of dividends on our common stock, see
Item 7—Management’s Discussion and Analysis of Financial Condition and Results of Operations
—Liquidity and Capital Resources—Dividends.
In February 2015, our Board of Directors authorized an anti-dilutive common stock repurchase program to mitigate the dilutive effect of shares issued through our dividend reinvestment, employee stock purchase and executive compensation activities. The program allows us to purchase up to
10
million shares of our outstanding common stock over an unrestricted period of time in the open market or through privately negotiated transactions. The program is conducted in accordance with Rule 10b-18 of the Exchange Act, and to facilitate these repurchases, we enter into Rule 10b5-1 share repurchase plans with a third party broker, which allow us to repurchase shares at times when we may otherwise be prevented from doing so under insider trading laws or because of self-imposed trading blackout periods. Subject to applicable regulations, we may elect to amend or cancel the program or share repurchase parameters at our discretion to manage dilution.
From April 1, 2015, the date repurchases under the anti-dilutive stock repurchase program commenced, through
December 31, 2017
, the Company repurchased an aggregate of
3,950,000
shares of common stock under the program, including
700,000
shares repurchased during the first half of
2017
. There were no repurchases of common stock in the last half of
2017
.
40
|
ITEM 6.
|
SELECTED FINANCIAL DATA
|
|
|
For the Years Ended December 31,
|
||||||||||||||||||
|
(In millions, except per share data)
|
2017
|
2016
|
2015
|
2014
|
2013
|
||||||||||||||
|
Statement of Operations data:
|
|
|
|
|
|
||||||||||||||
|
Operating revenues
|
$
|
3,357
|
|
$
|
3,302
|
|
$
|
3,159
|
|
$
|
3,011
|
|
$
|
2,879
|
|
||||
|
Income from continuing operations
(a)
|
426
|
|
468
|
|
476
|
|
430
|
|
371
|
|
|||||||||
|
Income from continuing operations per basic common share
(a)
|
$
|
2.39
|
|
$
|
2.63
|
|
$
|
2.66
|
|
$
|
2.40
|
|
$
|
2.08
|
|
||||
|
Income from continuing operations per diluted common share
(a)
|
2.38
|
|
2.62
|
|
2.64
|
|
2.39
|
|
2.07
|
|
|||||||||
|
Balance Sheet data:
|
|
|
|
|
|
||||||||||||||
|
Total assets
(b) (c)
|
$
|
19,482
|
|
$
|
18,482
|
|
$
|
17,241
|
|
$
|
16,038
|
|
$
|
15,064
|
|
||||
|
Long-term debt and redeemable preferred stock at redemption value
(b)
|
6,498
|
|
5,759
|
|
5,874
|
|
5,442
|
|
5,225
|
|
|||||||||
|
Other data:
|
|
|
|
|
|
||||||||||||||
|
Cash dividends declared per common share
|
$
|
1.66
|
|
$
|
1.50
|
|
$
|
1.36
|
|
$
|
1.24
|
|
$
|
1.12
|
|
||||
|
Net cash provided by operating activities
(d) (e) (f)
|
1,449
|
|
1,289
|
|
1,195
|
|
1,122
|
|
956
|
|
|||||||||
|
Net cash used in investing activities
(f)
|
(1,672
|
)
|
(1,590
|
)
|
(1,459
|
)
|
(1,029
|
)
|
(1,068
|
)
|
|||||||||
|
Net cash provided by (used in) financing activities
(d) (e) (f)
|
207
|
|
328
|
|
290
|
|
(104
|
)
|
104
|
|
|||||||||
|
Capital expenditures included in net cash used in investing activities
|
(1,434
|
)
|
(1,311
|
)
|
(1,160
|
)
|
(956
|
)
|
(980
|
)
|
|||||||||
|
(a)
|
In November 2014, we disposed of our Class B Biosolids operating segment by selling our subsidiary, Terratec Environmental Ltd (“Terratec”) in Ontario, Canada. The results of Terratec are presented as discontinued operations and, as such, have been excluded from Income from continuing operations for the years ended December 31, 2014 and 2013.
|
|
(b)
|
The information for the years ended December 31, 2014 and 2013, has been revised to reflect the retrospective application of Accounting Standard Update 2015-15, Presentation of Debt Issuance Costs, which was adopted by the Company as of December 31, 2015.
|
|
(c)
|
The information for the years ended December 31, 2014 and 2013, has been revised to reflect the retrospective application of Accounting Standard Update 2015-17, Income Taxes, which was adopted by the Company as of December 31, 2015.
|
|
(d)
|
The information for the years ended December 31, 2016, 2015, 2014 and 2013, has been revised to reflect the retrospective application of Accounting Standard Update 2016-09, Improvements to Employee Share-Based Payment Accounting, which was adopted by the Company as of January 1, 2017.
|
|
(e)
|
The information for the year ended December 31, 2013, has been revised to reflect the retrospective application of Accounting Standard Update 2016-15, Classification of Certain Cash Receipts and Cash Payments, which was adopted by the Company as of December 31, 2017.
|
|
(f)
|
The information for the years ended December 31, 2016, 2015, 2014 and 2013, has been revised to reflect the retrospective application of Accounting Standard Update 2016-18, Statement of Cash Flows (Topic 230) - Restricted Cash, which was adopted by the Company as of December 31, 2017.
|
41
|
ITEM 7.
|
MANAGEMENT’S DISCUSSION AND ANALYSIS OF FINANCIAL CONDITION AND RESULTS OF OPERATIONS
|
The following discussion should be read together with the Consolidated Financial Statements and the notes thereto included elsewhere in this Form 10-K. This discussion contains forward-looking statements that are based on management’s current expectations, estimates and projections about our business, operations and financial performance. The cautionary statements made in this Form 10-K should be read as applying to all related forward-looking statements whenever they appear in this Form 10-K. Our actual results may differ materially from those currently anticipated and expressed in such forward-looking statements as a result of a number of factors, including those we discuss under “Forward-Looking Statements,”
Item 1A—Risk Factors
and elsewhere in this Form 10-K.
Overview
American Water is the largest and most geographically diverse, publicly-traded water and wastewater utility company in the United States, as measured by both operating revenues and population served. We employ approximately
6,900
professionals who provide drinking water, wastewater and other related services to an estimated
15 million
people in
46
states, the District of Columbia and Ontario, Canada. Our primary business involves the ownership of utilities that provide water and wastewater services to residential, commercial, industrial, public authority, fire service and sale for resale customers, collectively presented as our “
Regulated Businesses
.” Our utilities operate in
16
states and serve approximately
3.4 million
customers, based on the number of active service connections to our water and wastewater networks. Our
Regulated Businesses
are generally subject to economic regulation by certain state utility commissions or other entities engaged in utility regulation, collectively referred to as PUCs. We also operate market-based businesses within four operating segments, providing a broad range of related and complementary water and wastewater services to military bases, municipalities, oil and gas exploration and production companies, as well as commercial, industrial and residential customers. Individually, these
four
operating segments do not meet the criteria of a reportable segment in accordance with generally accepted accounting principles in the United States (“GAAP”), and are collectively presented as our
Market-Based Businesses
, which is consistent with how management assesses the results of these businesses.
2017
Financial Results
The following table provides highlights of our diluted earnings per share and our adjusted diluted earnings per share (a non-GAAP measure):
|
For the Years Ended December 31,
|
|||||||||||
|
2017
|
2016
|
2015
|
|||||||||
|
Diluted earnings per share (GAAP):
|
|||||||||||
|
Net income attributable to common stockholders
|
$
|
2.38
|
|
$
|
2.62
|
|
$
|
2.64
|
|
||
|
Non-GAAP adjustments:
|
|||||||||||
|
Impact of Freedom Industries settlement activities
|
(0.12
|
)
|
0.36
|
|
—
|
|
|||||
|
Income tax impact
|
0.05
|
|
(0.14
|
)
|
—
|
|
|||||
|
Net non-GAAP adjustment
|
(0.07
|
)
|
0.22
|
|
—
|
|
|||||
|
Early extinguishment of debt at the parent company
|
0.03
|
|
—
|
|
—
|
|
|||||
|
Income tax impact
|
(0.01
|
)
|
—
|
|
—
|
|
|||||
|
Net non-GAAP adjustment
|
0.02
|
|
—
|
|
—
|
|
|||||
|
Impact of re-measurement from the Tax Cuts and Jobs Act
|
0.70
|
|
—
|
|
—
|
|
|||||
|
Total net non-GAAP adjustments
|
0.65
|
|
0.22
|
|
—
|
|
|||||
|
Adjusted diluted earnings per share (non-GAAP)
|
$
|
3.03
|
|
$
|
2.84
|
|
$
|
2.64
|
|
||
42
For the year ended
December 31, 2017
, net income attributable to common stockholders was
$2.38
per diluted share, a decrease of
$0.24
per diluted share, or
9.2%
, as c
ompared to the prior year.
Included in the
2017
amount was: (i) an after-tax benefit of
$13 million
, or
$0.07
per diluted share, resulting from an insurance settlement with one of our general liability insurance carriers related to the Freedom Industries chemical spill; (ii) an after-tax charge of
$4 million
, or
$(0.02)
per diluted share, resulting from the early extinguishment of debt at the parent company; and (iii) a non-cash, after-tax re-measurement charge of
$125 million
, or
$0.70
per diluted share, resulting from the impact of the change in the federal tax rate on the Company’s deferred income taxes from the enactment of the TCJA on December 22, 2017. Included in the 2016 amounts was an after-tax charge of
$39 million
, or
$(0.22)
per diluted share, resulting from the binding global agreement in principle to settle claims associated with the Freedom Industries chemical spill. For additional information, see Item 3—Legal Proceedings—West Virginia Elk River Freedom Industries Chemical Spill.
Excluding these items, adjusted diluted earnings per share (a non-GAAP measure) was
$3.03
for the year ended
December 31, 2017
, an increase of
$0.19
per diluted share, or
6.7%
, as compared to the prior year. This increase was primarily due to continued growth in our
Regulated Businesses
, largely driven by infrastructure investment, acquisitions and organic growth, combined with growth in our
Market-Based Businesses
from our Homeowner Services Group and Keystone
. These increases were partially offset by lower water services demand in 2017
in our
Regulated Businesses
, attributable in part to overall warmer weather in 2016, as well as lower capital upgrades in our Military Services Group. For further discussion of our consolidated results of operations, as well as financial results for our
Regulated Businesses
segment and our
Market-Based Businesses
, see “Consolidated Results of Operations” and “Segment Results of Operations” for additional information.
Adjusted diluted earnings per share represents a non-GAAP financial measure and means diluted earnings per share, calculated in accordance with GAAP, excluding the impact of: (i) the third quarter of 2017 insurance settlement related to the Freedom Industries chemical spill; (ii) the early extinguishment of debt at the parent company in the third quarter of 2017; (iii) the non-cash, after-tax re-measurement charge in the fourth quarter of 2017 resulting from the impact of the change in the federal tax rate on the Company’s deferred income taxes from enactment of the TCJA; a
nd (iv)
the fourth quarter of 2016 binding global agreement in principle to settle claims related to the Freedom Industries chemical spill. We believe that this non-GAAP measure provides investors with useful information by excluding certain matters that may not be indicative of our ongoing operating results, and that providing this non-GAAP measure will allow investors to understand better our businesses’ operating performance and facilitate a meaningful year-to-year comparison of our results of operations. Although management uses this non-GAAP financial measure internally to evaluate our results of operations, we do not intend results excluding the adjustments to represent results as defined by GAAP, and the reader should not consider them as indicators of performance. This non-GAAP financial measure is derived from our consolidated financial information but is not presented in our financial statements prepared in accordance with GAAP, and thus it should be considered in addition to, and not as a substitute for, measures of financial performance prepared in accordance with GAAP. In addition, this non-GAAP financial measure as defined and used above may not be comparable to similarly titled non-GAAP measures used by other companies, and, accordingly, it may have significant limitations on its use.
Strategic Focus and
2017
Achievements
We believe our success in the future will be driven by engaged employees, smart investments and safe, efficient operations, leading to satisfied customers which in turn will lead to constructive regulatory outcomes and sustainable financial performance. Our strategy, which is driven by our vision and core values, will continue to be anchored on our five central themes:
|
•
|
Customer—Our customers are at the center of everything we do. We want to be the best, and if our customers have a choice as to who serves them, we want it to be us.
|
|
•
|
In
2017
, we:
|
|
•
|
achieved both a customer satisfaction rating and a service quality rating in the top quartile among our water industry peers;
|
|
•
|
expanded our customer experience initiative, designed to make it easier for customers to do business with us, and enhanced our quality of service through implementation and upgrades of technology tools; and
|
|
•
|
continued to make needed infrastructure investment while implementing operational efficiency improvements to keep customer rates affordable.
|
|
•
|
Looking forward, we will:
|
|
•
|
target the achievement of customer satisfaction and service quality targets in the top quartile of service industries, beyond the water and wastewater industry. We have a three year plan to enhance technology and innovation in our customer experience through: (i) leveraging secure artificial intelligence to better serve our customers; (ii) using on-line customer communities for immediate input and reactions before rolling out programs; and (iii) mapping our most frequent customer interactions and re-working our internal processes to how the customer wants services; and
|
43
|
•
|
aim for top quartile targets for drinking water quality and being an industry leader in system resiliency and environmental stewardship. We intend to continue to make needed infrastructure investments while implementing operational efficiency improvements to help keep customer rates affordable.
|
|
•
|
Safety—Safety is both a strategy and a value at American Water. We put safety first in everything that we do.
|
|
•
|
In
2017
, we:
|
|
•
|
finished the year with fewer employee injuries than the prior year and exceeded our targeted results for our Occupational Safety and Health Administration recordable incident rate and our Days Away Restricted or Transferred rate; and
|
|
•
|
strengthened our safety culture as measured by employee responses to safety-related questions in the Company’s culture survey, and scored 13 points above “High Performing Companies” in the category of safety, as measured by CEB, Inc. Our safety council, consisting of management and labor employees from across the Company, continued its mission of developing and implementing recommendations to reinforce the Company’s commitment to safety.
|
|
•
|
Looking forward, we will:
|
|
•
|
strive toward zero workplace injuries;
|
|
•
|
focus on requiring that the contractors that perform work for the Company are approved in accordance with the Contractor Safety Qualification Practice and are held to the same standards as our employees; and
|
|
•
|
continue our focus on “near miss reporting,” to promote continuous learning and corrective action regarding potential safety hazards.
|
|
•
|
People—We are building a diverse, fully-engaged, high performance workforce and culture and creating an environment where our people feel valued, included and accountable.
|
|
•
|
In
2017
, we continued to demonstrate our commitment to employees by expanding training and development across the Company, with the vast majority of our employees completing at least 20 hours of training during 2017. We also added new Respect and Diversity training to strengthen our values-based culture.
|
|
•
|
Looking forward, we will continue to:
|
|
•
|
improve the diversity of our overall employee population, reflective of our customers and communities;
|
|
•
|
implement a strategic workforce plan which will address the changing requirements of our business and our jobs, and how we will fill those critical positions throughout the Company to promote continuity and help us to meet future operational needs; and
|
|
•
|
dedicate ourselves to personal development through effective training and development plans.
|
|
•
|
Growth—We expect to continue to grow our businesses, with the significant majority of our growth to be achieved in our
Regulated Businesses
through: (i) continued investment in infrastructure to provide safe, clean, reliable and affordable water and wastewater services to our customers; and (ii) regulated acquisitions to expand our services to new customers. We also expect to continue to grow our
Market-Based Businesses
, which leverage our core water and wastewater competencies.
|
|
•
|
In
2017
, we invested
$1.7 billion
, a record level of annual investment since the Company went public in 2008, and $200 million more than
2016
, which had previously been a record year for investment. Our 2017 investment included:
|
|
•
|
$1.4 billion
, of which the majority was in our
Regulated Businesses
for infrastructure replacements and improvements; and
|
|
•
|
$210 million
to fund acquisitions in our Regulated Businesses, which added approximately
40,000
water and wastewater customers, including bulk customers, highlighted by the:
|
|
•
|
April 3, 2017
acquisition of Shorelands Water Company, Inc. (“Shorelands”) in a stock transaction for
$33 million
in the form of
438,211
shares of our common stock. Shorelands, which is now a part of our New Jersey subsidiary, provides water service to approximately
11,000
customers in Monmouth County, New Jersey; and the
|
44
|
•
|
December 18, 2017
acquisition of the McKeesport system for
$159 million
. This acquisition was the first acquisition executed under Pennsylvania’s Act 12 of 2016, which allows municipalities to sell water and wastewater systems for a price based upon the fair market value of the system. Under Act 12, the rate base for this acquisition was approved at
$158 million
. The McKeesport system, which is now part of our Pennsylvania subsidiary, represents approximately
22,000
customers; comprised of
11,000
customer connections, as well as service to an additional
11,000
customers under bulk contracts to
13
municipalities in Allegheny County, Pennsylvania.
|
|
•
|
On September 29, 2017, our Military Services Group was awarded a contract for ownership, operation and maintenance of the water and wastewater systems at Wright-Patterson Air Force Base, the largest single-site employer in the state of Ohio. The contract award includes estimated revenues of approximately $490 million over a 50-year period, subject to an annual economic price adjustment. In the fourth quarter of 2017, a bid protest was filed on this contract by an unsuccessful bidder. In January 2018, the bid protest was sustained because a required element of the solicitation was not properly considered. The protester’s bid proposal will be re-evaluated, and we believe that the contract previously awarded to our Military Services Group will be reinstated.
|
|
•
|
Looking forward, we expect to invest between
$8.0 billion
to
$8.6 billion
from 2018 to 2022, including a range of
$1.6 billion
to
$1.8 billion
in
2018
. Our expected future investment includes:
|
|
•
|
capital investment for infrastructure improvements in our
Regulated Businesses
of
$7.2 billion
over the next five years, including a range of
$1.4 billion
to
$1.5 billion
expected in
2018
;
|
|
•
|
growth from acquisitions in our
Regulated Businesses
to expand our water and wastewater customer base of between
$600 million
to
$1.2 billion
over the next five years, including a range of
$120 million
to
$240 million
expected in
2018
; and
|
|
•
|
strategic capital investments of approximately
$200 million
over the next five years, including approximately
$100 million
expected in
2018
. These investments include strategic growth opportunities in our
Market-Based Businesses
and the construction of our new corporate headquarters in Camden, New Jersey, which is expected to be completed during the second half of 2018 and is eligible for up to
$164 million
in tax credits from New Jersey’s Economic Development Authority.
|
The following chart depicts the estimated allocation of our expected capital investment for infrastructure improvements in our
Regulated Businesses
from
2018
to
2022
, by purpose:

45
|
•
|
Technology and Operational Efficiency—We continue to strive for industry-leading operational efficiency, driven by technology. Our technology investments are aimed at enhancing our customer experience and operational efficiency.
|
|
•
|
In
2017
:
|
|
•
|
our
Regulated Businesses
achieved an adjusted O&M efficiency ratio (a non-GAAP measure) of
33.8%
for the year ended
December 31, 2017
, compared to
34.9%
and
35.9%
for the years ended
December 31, 2016
and
2015
, respectively. The continued improvement in our adjusted O&M efficiency ratio in 2017 was attributable to both an increase in operating revenues and a decrease in O&M expenses (see the following table). The improvement in the
2016
adjusted O&M efficiency ratio over the
2015
ratio was primarily attributable to an increase in operating revenues;
|
|
•
|
we introduced new tools such as FSR Customer One View, which provides our employees with information such as neighborhood maps, customer usage data, billing and payment history, and real-time meter reads; and MapCall, which helps to manage location based assets such as hydrants, valves, meters, among others; along with implementing technology upgrades to our national customer services, focused on helping us improve customer service;
|
|
•
|
we continued our commitment to water quality and the environment by leveraging new technologies; we now have advanced water quality sensors at all of our major drinking water intake sites and we are automating our reporting and compliance systems; and
|
|
•
|
we implemented other technology tools that will enhance communication, collaboration and mobility to help our operations and support employees work more safely and efficiently, and enhance the customer experience.
|
|
•
|
Looking forward, we will focus on technology and efficiency to:
|
|
•
|
be the leader in optimizing technology deployment across the water and wastewater industry, with a keen focus on specific, innovative projects that will set us apart from other utilities, and to help us serve our customers with greater ease, make us safer and help us operate more efficiently; and
|
|
•
|
achieve our goal of an adjusted O&M efficiency ratio equal to or below
32.0%
by 2022.
|
Our adjusted O&M efficiency ratio is defined as our regulated operation and maintenance expenses divided by our regulated operating revenues, where both operation and maintenance expenses and operating revenues were adjusted to eliminate purchased water expense. Additionally, from operation and maintenance expenses, we have excluded the allocable portion of non-operation and maintenance support services costs, mainly depreciation and general taxes, that are reflected in our
Regulated Businesses
segment as operation and maintenance expenses, but for consolidated financial reporting purposes, are categorized within other line items in the accompanying Consolidated Statements of Operations. For the years ended
December 31, 2017
and
2016
, we have also excluded from operation and maintenance expenses the impact of certain Freedom Industries chemical spill settlement activities. We excluded all of the above items from the calculation as we believe such items are not reflective of management’s ability to increase efficiency of our regulated operations. Going forward, we expect changes to our adjusted O&M efficiency ratio related to the impact of the enactment of the TCJA and the adoption of new accounting standards in the future.
We evaluate our operating performance using this ratio because we believe it directly measures improvement in the efficiency of our regulated operations. This information is intended to enhance an investor’s overall understanding of our operating performance. Our adjusted O&M efficiency ratio is not a GAAP financial measure and may not be comparable to other companies’ operating measures, and should not be used in place of the GAAP information provided elsewhere in this Form 10-K.
With respect to our adjusted O&M efficiency ratio goal for 2022, we are unable to provide without unreasonable efforts a quantitative reconciliation of each component of this ratio to the most comparable financial measure calculated in accordance with GAAP. In calculating the components of the ratio, certain items that may ultimately be excluded would be reflective of events that cannot be reasonably predicted at this time. The unavailable information would include, among other things, the impact of items currently excluded from the calculation of the components, adjustments for weather conditions that exceed a certain threshold of variability and adjustments for events or circumstances that may not be reflective of ongoing operating results. The probable significance of these items is also presently unknown and cannot be reasonably estimated.
46
The following table provides the calculation of our adjusted O&M efficiency ratio and a reconciliation that compares operation and maintenance expenses and operating revenues, each as determined in accordance with GAAP, to those amounts utilized in the calculation of our adjusted O&M efficiency ratio:
|
For the Years Ended December 31,
|
|||||||||||
|
(Dollars in millions)
|
2017
|
2016
|
2015
|
||||||||
|
Total operation and maintenance expenses
|
$
|
1,378
|
|
$
|
1,504
|
|
$
|
1,404
|
|
||
|
Less:
|
|
|
|
||||||||
|
Operation and maintenance expenses—Market-Based Businesses
|
337
|
|
372
|
|
358
|
|
|||||
|
Operation and maintenance expenses—Other
|
(50
|
)
|
(44
|
)
|
(49
|
)
|
|||||
|
Total operation and maintenance expenses—Regulated Businesses
|
1,091
|
|
1,176
|
|
1,095
|
|
|||||
|
Less:
|
|
|
|
||||||||
|
Regulated purchased water expenses
|
128
|
|
122
|
|
117
|
|
|||||
|
Allocation of non-operation and maintenance expenses
|
29
|
|
30
|
|
35
|
|
|||||
|
Impact of Freedom Industries settlement activities
(a)
|
(22
|
)
|
65
|
|
—
|
|
|||||
|
Adjusted operation and maintenance expenses—Regulated Businesses
(i)
|
$
|
956
|
|
$
|
959
|
|
$
|
943
|
|
||
|
Total operating revenues
|
$
|
3,357
|
|
$
|
3,302
|
|
$
|
3,159
|
|
||
|
Less:
|
|
|
|
||||||||
|
Operating revenues—Market-Based Businesses
|
422
|
|
451
|
|
434
|
|
|||||
|
Operating revenues—Other
|
(23
|
)
|
(20
|
)
|
(18
|
)
|
|||||
|
Total operating revenues—Regulated Businesses
|
2,958
|
|
2,871
|
|
2,743
|
|
|||||
|
Less:
|
|
|
|
||||||||
|
Regulated purchased water revenues
(b)
|
128
|
|
122
|
|
117
|
|
|||||
|
Adjusted operating revenues—Regulated Businesses
(ii)
|
$
|
2,830
|
|
$
|
2,749
|
|
$
|
2,626
|
|
||
|
Adjusted O&M efficiency ratio—Regulated Businesses
(i) / (ii)
|
33.8
|
%
|
34.9
|
%
|
35.9
|
%
|
|||||
|
(a)
|
Includes the impact of the binding global agreement in principle to settle claims in 2016 and a settlement with one of our general liability insurance carriers in 2017.
|
|
(b)
|
The calculation assumes regulated purchased water revenues approximate regulated purchased water expenses.
|
47
Regulatory Matters
The following table provides general rate case authorizations effective from
2015
through
2017
, and depicts annualized incremental revenues assuming a constant water sales volume:
|
(In millions)
|
2017
|
2016
|
2015
|
||||||||
|
General rate case authorizations by state:
|
|
|
|
|
|
|
|||||
|
New York
(effective June 1, 2017)
|
$
|
4
|
|
$
|
—
|
|
$
|
—
|
|
||
|
Virginia
(a)
|
5
|
|
—
|
|
—
|
|
|||||
|
Iowa
(effective March 27, 2017)
|
4
|
|
—
|
|
—
|
|
|||||
|
California
(b)
|
5
|
|
2
|
|
5
|
|
|||||
|
Illinois
(effective January 1, 2017)
|
25
|
|
—
|
|
—
|
|
|||||
|
Kentucky
(effective August 28, 2016)
|
—
|
|
7
|
|
—
|
|
|||||
|
Missouri
(effective July 20, 2016 and July 22, 2016)
|
—
|
|
5
|
|
—
|
|
|||||
|
West Virginia
(effective February 25, 2016)
|
—
|
|
18
|
|
—
|
|
|||||
|
Indiana
(effective January 29, 2016 and January 29, 2015)
|
—
|
|
2
|
|
5
|
|
|||||
|
New Jersey
(effective September 21, 2015)
|
—
|
|
—
|
|
22
|
|
|||||
|
Other
|
—
|
|
—
|
|
1
|
|
|||||
|
Total general rate case authorizations
|
$
|
43
|
|
$
|
34
|
|
$
|
33
|
|
||
|
(a)
|
The effective date of the rate order was May 24, 2017, authorizing the implementation of interim rates as of April 1, 2016.
|
|
(b)
|
Step rates for 2017 effective January 13, 2017 through February 2, 2017. Step rates for 2016 and 2015 effective January 1, 2016 and January 1, 2015, respectively.
|
On
December 7, 2017
, a settlement in our Pennsylvania subsidiary’s general rate case filing was approved authorizing additional annualized revenues of
$62 million
, effective on
January 1, 2018
.
Pending General Rate Case and Cost of Capital Filings
On
September 15, 2017
, our New Jersey subsidiary filed a general rate case requesting
$129 million
in additional annualized water and wastewater revenues.
On
June 30, 2017
, our Missouri subsidiary filed a general rate case requesting
$84 million
in additional annualized water and wastewater revenues.
On
April 3, 2017
, our California subsidiary filed an application requesting a cost of capital of
8.49%
, compared to
8.41%
currently authorized. On February 6, 2018, a proposed decision was issued by the administrative law judge and we plan to work through the regulatory process with the CPUC over the next several months.
During the third quarter of 2016, our California subsidiary filed a general rate case requesting
$35 million
in additional annualized revenues and an increase of
$8 million
in the escalation year of 2019 and the attrition year of 2020. During the fourth quarter of 2016, our California subsidiary filed an update to its general rate case, adjusting its request for additional annualized revenues to
$32 million
and increasing its request to
$9 million
in the escalation year of 2019.
48
A number of states have authorized the use of regulatory mechanisms that permit rates to be adjusted outside of a general rate case for certain costs and investments, such as infrastructure surcharge mechanisms that permit recovery of capital investments to replace aging infrastructure.
The following table provides infrastructure surcharge authorizations effective from
2015
through
2017
, and depicts annualized incremental revenues assuming a constant water sales volume:
|
(In millions)
|
2017
|
2016
|
2015
|
||||||||
|
Infrastructure surcharge authorizations by state:
|
|
|
|
||||||||
|
Missouri
(effective December 15, 2017 and June 27, 2015)
|
$
|
6
|
|
$
|
—
|
|
$
|
2
|
|
||
|
New Jersey
(a)
|
14
|
|
19
|
|
9
|
|
|||||
|
Indiana
(effective March 22, 2017 and May 4, 2016)
|
8
|
|
3
|
|
—
|
|
|||||
|
Tennessee
(effective March 14, 2017, March 15, 2016 and June 29, 2015)
|
2
|
|
2
|
|
2
|
|
|||||
|
Pennsylvania
(b)
|
1
|
|
28
|
|
14
|
|
|||||
|
West Virginia (
effective January 1, 2017)
|
2
|
|
—
|
|
—
|
|
|||||
|
Illinois
(c)
|
—
|
|
7
|
|
6
|
|
|||||
|
New York
(effective December 1, 2015)
|
—
|
|
—
|
|
1
|
|
|||||
|
Total infrastructure surcharge authorizations
|
$
|
33
|
|
$
|
59
|
|
$
|
34
|
|
||
|
(a)
|
For 2017,
$10 million
effective June 1 and
$4 million
effective December 10. For 2016,
$9 million
effective June 1 and
$10 million
effective December 1. For 2015,
$9 million
effective January 1.
|
|
(b)
|
For 2017,
$1 million
effective January 1 (the infrastructure surcharge cap was reached after the first quarter of 2017). For 2016,
$11 million
,
$2 million
,
$6 million
and
$9 million
effective January 1, April 1, July 1 and October 1, respectively. For 2015,
$2 million
,
$4 million
and
$8 million
effective April 1, July 1 and October 1, respectively.
|
|
(c)
|
For 2016,
$1 million
effective January 1 and
$6 million
effective August 1. For 2015,
$5 million
effective January 1 and
$1 million
effective February 1.
|
On
December 28, 2017
, our West Virginia subsidiary received a decision on its infrastructure surcharge filing authorizing additional annualized revenues of
$3 million
, effective on January 1, 2018. Additionally, on
December 20, 2017
, our Illinois subsidiary filed for an infrastructure surcharge requesting
$3 million
in additional annualized revenues, which will become effective on January 1, 2018.
There is no assurance that all or any portion of these requests will be granted.
Pending Infrastructure Surcharge Filings
The following table details of our pending infrastructure surcharge filings:
|
(In millions)
|
Date Filed
|
Amount
|
|||
|
Pending infrastructure surcharge filings by state:
|
|||||
|
Indiana
|
January 18, 2018
|
$
|
7
|
|
|
|
Tennessee
|
November 7, 2017
|
2
|
|
||
|
Virginia
|
October 31, 2017
|
1
|
|
||
|
Total pending infrastructure surcharge filings
|
$
|
10
|
|
||
There is no assurance that all or any portion of these requests will be granted.
Other Regulatory Matters
On August 4, 2017, our Illinois subsidiary filed a petition with the Illinois Commerce Commission (“ICC”) to place into effect, revised depreciation rates applicable to our depreciable water and wastewater plant, resulting from a new depreciation study. The petition requested that these new rates would be effective January 1, 2017. On November 21, 2017, the ICC approved this petition, which resulted in lower depreciation expense of
$16 million
in 2017.
49
Tax Matters
Tax Cuts and Jobs Act
On
December 22, 2017
, the TCJA was signed into law, which, among other things, enacted significant and complex changes to the Internal Revenue Code of 1986, including a reduction in the maximum U.S. federal corporate income tax rate from
35%
to
21%
as of January 1, 2018, and certain other provisions related specifically to the public utility industry, including continuation of interest expense deductibility, the exclusion from utilizing bonus depreciation and the normalization of deferred income tax. The enactment of the TCJA required a re-measurement of our deferred income taxes that materially impacted our
2017
results of operations and financial position. The portion of this re-measurement related to our
Regulated Businesses
was substantially offset by a regulatory liability, as we believe it is probable that the deferred income tax excesses created by the TCJA will be refunded to customers in future rates. The remaining portion of this re-measurement of the net deferred income tax liability was recorded as a non-cash charge to earnings of
$125 million
during the fourth quarter of 2017.
Other Tax Matters
On April 11, 2017, the state of New York enacted legislation that increased the state income tax rate on our taxable income attributable to New York. This legislation eliminated the production of water as a qualified manufacturing activity in New York, which effectively increased the state income tax rate in New York. As a result of the legislative change, we were required to re-measure our cumulative deferred income tax balances using the higher state income tax rate in the second quarter of 2017. This change in legislation was the primary cause of an increase to our unitary deferred income tax liability of $11 million. The portion of this increase related to our New York subsidiary calculated on a stand-alone basis was $7 million, and was offset by a regulatory asset, as we believe it is probable of recovery in future rates. The remaining increase in the deferred income tax liability was calculated through state tax apportionment rates and recorded at the consolidated level, resulting in a non-cash, cumulative charge to earnings of $4 million during the second quarter of 2017.
On July 7, 2017, the State of Illinois enacted legislation that increased, effective July 1, 2017, the state income tax rate on our taxable income attributable to Illinois from 7.75% to 9.5%. As a result of the legislative change, we were required to re-measure our cumulative deferred income tax balances using the higher state income tax rate in the third quarter of 2017. This change in legislation was the primary cause of an increase to our unitary deferred income tax liability of $7 million. The portion of this increase related to our Illinois subsidiary calculated on a stand-alone basis was $4 million, and was offset by a regulatory asset, as we believe it is probable of recovery in future rates. The remaining increase in the deferred income tax liability was recorded at the consolidated level, resulting in a non-cash, cumulative charge to earnings of $3 million during the third quarter of 2017.
50
Consolidated Results of Operations
The following table presents our consolidated results of operations and the ensuing discussions provide explanations for the variances related to the major components:
|
|
For the Years Ended December 31,
|
Increase
(Decrease) |
Increase
(Decrease) |
||||||||||||||||||||||
|
2017
|
2016
|
2015
|
2017 vs. 2016
|
2016 vs. 2015
|
|||||||||||||||||||||
|
(Dollars in millions)
|
|
$
|
%
|
$
|
%
|
||||||||||||||||||||
|
Operating revenues
|
$
|
3,357
|
|
$
|
3,302
|
|
$
|
3,159
|
|
$
|
55
|
|
1.7
|
|
$
|
143
|
|
4.5
|
|
||||||
|
Operating expenses:
|
|
|
|
|
|
|
|
||||||||||||||||||
|
Operation and maintenance
|
1,378
|
|
1,504
|
|
1,404
|
|
(126
|
)
|
(8.4
|
)
|
100
|
|
7.1
|
|
|||||||||||
|
Depreciation and amortization
|
492
|
|
470
|
|
440
|
|
22
|
|
4.7
|
|
30
|
|
6.8
|
|
|||||||||||
|
General taxes
|
259
|
|
258
|
|
243
|
|
1
|
|
0.4
|
|
15
|
|
6.2
|
|
|||||||||||
|
Gain on asset dispositions and purchases
|
(16
|
)
|
(10
|
)
|
(3
|
)
|
(6
|
)
|
60.0
|
|
(7
|
)
|
233.3
|
|
|||||||||||
|
Total operating expenses, net
|
2,113
|
|
2,222
|
|
2,084
|
|
(109
|
)
|
(4.9
|
)
|
138
|
|
6.6
|
|
|||||||||||
|
Operating income
|
1,244
|
|
1,080
|
|
1,075
|
|
164
|
|
15.2
|
|
5
|
|
0.5
|
|
|||||||||||
|
Other income (expense):
|
|
|
|
|
|
|
|
||||||||||||||||||
|
Interest, net
|
(342
|
)
|
(325
|
)
|
(308
|
)
|
(17
|
)
|
5.2
|
|
(17
|
)
|
5.5
|
|
|||||||||||
|
Loss on early extinguishment of debt
|
(7
|
)
|
—
|
|
—
|
|
(7
|
)
|
100.0
|
|
—
|
|
—
|
|
|||||||||||
|
Other, net
|
17
|
|
15
|
|
15
|
|
2
|
|
13.3
|
|
—
|
|
—
|
|
|||||||||||
|
Total other income (expense)
|
(332
|
)
|
(310
|
)
|
(293
|
)
|
(22
|
)
|
7.1
|
|
(17
|
)
|
5.8
|
|
|||||||||||
|
Income before income taxes
|
912
|
|
770
|
|
782
|
|
142
|
|
18.4
|
|
(12
|
)
|
(1.5
|
)
|
|||||||||||
|
Provision for income taxes
|
486
|
|
302
|
|
306
|
|
184
|
|
60.9
|
|
(4
|
)
|
(1.3
|
)
|
|||||||||||
|
Net income attributable to common stockholders
|
$
|
426
|
|
$
|
468
|
|
$
|
476
|
|
$
|
(42
|
)
|
(9.0
|
)
|
$
|
(8
|
)
|
(1.7
|
)
|
||||||
Operating Revenues
In
2017
, operating revenues
increased
$55 million
, or
1.7%
, primarily due to a:
|
•
|
$87 million
increase
in our
Regulated Businesses
principally due to authorized rate increases to fund infrastructure investment growth, as well as acquisitions and organic growth, offset in part by lower water services demand in 2017, including a $15 million reduction due to warmer weather in 2016; partially offset by a
|
|
•
|
$29 million
decrease
in our
Market-Based Businesses
mainly due to lower capital upgrades in our Military Services Group, driven largely by reduced military base budgets, offset in part by incremental revenues in our Homeowner Services Group from contract growth and price increases, and in Keystone from an increase in operations as a result of market recovery in the natural gas industry.
|
In
2016
, operating revenues
increased
$143 million
, or
4.5%
, primarily due to a:
|
•
|
$128 million
increase
in our
Regulated Businesses
principally due to authorized rate increases to fund infrastructure investment growth, as well as acquisitions and organic growth; and a
|
|
•
|
$17 million
increase
in our
Market-Based Businesses
mainly due to our acquisition of Keystone in the third quarter of 2015 and incremental revenues from our Homeowner Services and Contract Operations Groups from contract growth, partially offset by lower capital upgrades in our Military Services Group.
|
Operation and Maintenance
In
2017
, operation and maintenance expense
decreased
$126 million
, or
8.4%
, primarily due to a:
|
•
|
$85 million
decrease
in our
Regulated Businesses
principally due to a $65 million net charge recorded in 2016, resulting from the binding global agreement in principle to settle claims associated with the Freedom Industries chemical spill in West Virginia, and a $22 million benefit recorded in 2017, resulting from a related insurance settlement with one of our general liability insurance carriers; and a
|
51
|
•
|
$35 million
decrease
in our
Market-Based Businesses
mainly due to lower capital upgrades in our Military Services Group, as discussed above, partially offset by higher employee-related costs from growth in Keystone and increased customer uncollectible expense in Homeowner Services from contract growth during 2017.
|
In
2016
, operation and maintenance expense
increased
$100 million
, or
7.1%
, primarily due to a:
|
•
|
$81 million
increase
in our
Regulated Businesses
principally due to a $65 million charge recorded in 2016, resulting from the binding global agreement in principle to settle claims associated with the Freedom Industries chemical spill in West Virginia, as well as higher employee-related costs and litigation expenses, partially offset by lower casualty insurance and customer uncollectible expense; and an
|
|
•
|
$14 million
increase
in our
Market-Based Businesses
which included $11 million from our acquisition of Keystone in the third quarter of 2015, as well as incremental costs associated with growth in our Homeowner Services and Contract Operations Group, partially offset by lower capital upgrades in our Military Services Group, as discussed above.
|
Depreciation and Amortization
In
2017
and
2016
, depreciation and amortization expense increased
$22 million
and
$30 million
, or
4.7%
and
6.8%
, respectively. The increase for both periods was primarily due to additional utility plant placed in service. Included in
2017
was the impact of revised depreciation rates from a depreciation study approved by the ICC in our Illinois subsidiary, resulting in lower depreciation expense of
$16 million
. Included in
2016
was incremental depreciation and amortization expense resulting from our acquisition of Keystone in the third quarter of 2015.
General Taxes
In
2017
and
2016
, general taxes
increased
$1 million
and
$15 million
, or
0.4%
and
6.2%
, respectively. The increase in
2016
was primarily due to incremental property and gross receipts taxes in our
Regulated Businesses
.
Gain on Asset Dispositions and Purchases
In
2017
and
2016
, gain on asset dispositions and purchases
increased
$6 million
and
$7 million
, or
60.0%
and
233.3%
, respectively. The increase in
2017
was primarily due to a $7 million gain recognized on a land sale in our Kentucky subsidiary. The increase in
2016
was largely attributable to a gains recognized on a land sale in our Pennsylvania subsidiary and an acquisition in our Missouri subsidiary.
Other Income (Expense)
In
2017
and
2016
, other expenses
increased
$22 million
and
$17 million
, or
7.1%
and
5.8%
, respectively. The increase in
2017
was primarily due to an increase in interest expense from the issuance of incremental long-term debt in 2017 and the fourth quarter of 2016, as well as a
$6 million
charge resulting from the early extinguishment of debt at the parent company. The increase in
2016
was largely attributable to an increase in interest expense from the issuance of incremental long-term debt, as well as an increase in short-term interest expense, mainly due to higher levels of short-term borrowings during 2016, coupled with an increase in the average short-term borrowing rates in 2016, as compared to the prior year.
Provision for Income Taxes
In
2017
, our provision for income taxes
increased
by
$184 million
, or
60.9%
, from the previous year. The increase is primarily due to higher pretax income and a non-cash, after-tax re-measurement charge of
$125 million
, resulting from the impact of the change in the federal tax rate on the Company’s deferred income taxes from the enactment of the TCJA, which included a reduction in the maximum U.S. federal corporate income tax rate from
35%
to
21%
. The
$125 million
charge includes
$6 million
allocated to our
Regulated Businesses
segment,
$5 million
to our
Market-Based Businesses
and
$114 million
to our Other segment. In
2016
, our provision for income taxes
decreased
$4 million
, or
1.3%
, from the previous year. This decrease was primarily due to the decrease in pre-tax income. The effective tax rates were
53.3%
,
39.2%
and
39.1%
for the years ended
December 31, 2017
,
2016
and
2015
, respectively.
As of
December 31, 2017
, we’ve recognized federal NOL carryforwards of
$1.05 billion
. The TCJA eliminated the bonus depreciation deduction for property acquired or constructed after September 27, 2017, and we currently expect to utilize the benefits of our federal NOL carryforwards over the next two years. See
Note 13—Income Taxes
in the Notes to Consolidated Financial Statements for additional information.
52
Segment Results of Operations
Our segments are determined based on how we assess performance and allocate resources. We evaluate the performance of our segments and allocate resources based on several factors, with the primary measure being net income attributable to common stockholders. The majority of our business is conducted through our
Regulated Businesses
reportable segment. We also operate several market-based businesses that provide a broad range of related and complementary water and wastewater services within
four
operating segments that individually do not meet the criteria of a reportable segment in accordance with GAAP. These
four
, non-reportable operating segments are collectively presented as our
Market-Based Businesses
, which is consistent with how management assesses the results of these businesses.
Regulated Businesses
Segment
The following table summarizes certain financial information for our
Regulated Businesses
:
|
|
For the Years Ended December 31,
|
Increase
(Decrease) |
Increase
(Decrease) |
||||||||||||||||||||||
|
2017
|
2016
|
2015
|
2017 vs. 2016
|
2016 vs. 2015
|
|||||||||||||||||||||
|
(Dollars in millions)
|
|
|
|
|
|
|
$
|
%
|
$
|
%
|
|||||||||||||||
|
Operating revenues
|
$
|
2,958
|
|
$
|
2,871
|
|
$
|
2,743
|
|
$
|
87
|
|
3.0
|
|
$
|
128
|
|
4.7
|
|
||||||
|
Operation and maintenance
|
1,091
|
|
1,176
|
|
1,095
|
|
(85
|
)
|
(7.2
|
)
|
81
|
|
7.4
|
|
|||||||||||
|
Operating expenses, net
|
1,781
|
|
1,852
|
|
1,732
|
|
(71
|
)
|
(3.8
|
)
|
120
|
|
6.9
|
|
|||||||||||
|
Net income attributable to common stockholders
|
559
|
|
472
|
|
473
|
|
87
|
|
18.4
|
|
(1
|
)
|
(0.2
|
)
|
|||||||||||
Operating Revenues
The following tables and the ensuing discussions provide explanations for the variances related to the three components of operating revenues––water services revenues, wastewater services revenues and other revenues:
|
For the Years Ended December 31,
|
Increase
(Decrease) |
Increase
(Decrease) |
|||||||||||||||||||||||
|
|
2017
|
2016
|
2015
|
2017 vs. 2016
|
2016 vs. 2015
|
||||||||||||||||||||
|
(Dollars in millions)
|
$
|
%
|
$
|
%
|
|||||||||||||||||||||
|
Billed water services revenues:
|
|
|
|
|
|
|
|
||||||||||||||||||
|
Residential
|
$
|
1,654
|
|
$
|
1,592
|
|
$
|
1,536
|
|
$
|
62
|
|
3.9
|
|
$
|
56
|
|
3.6
|
|
||||||
|
Commercial
|
603
|
|
580
|
|
559
|
|
23
|
|
4.0
|
|
21
|
|
3.8
|
|
|||||||||||
|
Industrial
|
137
|
|
134
|
|
130
|
|
3
|
|
2.2
|
|
4
|
|
3.1
|
|
|||||||||||
|
Public and other
|
351
|
|
338
|
|
331
|
|
13
|
|
3.8
|
|
7
|
|
2.1
|
|
|||||||||||
|
Other
|
31
|
|
53
|
|
39
|
|
(22
|
)
|
(41.5
|
)
|
14
|
|
35.9
|
|
|||||||||||
|
Total billed water services revenues
|
2,776
|
|
2,697
|
|
2,595
|
|
79
|
|
2.9
|
|
102
|
|
3.9
|
|
|||||||||||
|
Unbilled water services revenues
|
(11
|
)
|
13
|
|
(3
|
)
|
(24
|
)
|
(184.6
|
)
|
16
|
|
(533.3
|
)
|
|||||||||||
|
Total water services revenues
|
2,765
|
|
2,710
|
|
2,592
|
|
55
|
|
2.0
|
|
118
|
|
4.6
|
|
|||||||||||
|
Wastewater services revenues
|
142
|
|
112
|
|
97
|
|
30
|
|
26.8
|
|
15
|
|
15.5
|
|
|||||||||||
|
Other revenues
|
51
|
|
49
|
|
54
|
|
2
|
|
4.1
|
|
(5
|
)
|
(9.3
|
)
|
|||||||||||
|
Total operating revenues
|
$
|
2,958
|
|
$
|
2,871
|
|
$
|
2,743
|
|
$
|
87
|
|
3.0
|
|
$
|
128
|
|
4.7
|
|
||||||
53
|
|
For the Years Ended December 31,
|
Increase
(Decrease) |
Increase
(Decrease) |
|||||||||||||||||
|
|
2017
|
2016
|
2015
|
2017 vs. 2016
|
2016 vs. 2015
|
|||||||||||||||
|
(Gallons in millions)
|
Gallons
|
%
|
Gallons
|
%
|
||||||||||||||||
|
Billed water services volumes:
|
|
|
|
|
|
|
|
|||||||||||||
|
Residential
|
174,420
|
|
174,599
|
|
175,653
|
|
(179
|
)
|
(0.1
|
)
|
(1,054
|
)
|
(0.6
|
)
|
||||||
|
Commercial
|
82,147
|
|
82,489
|
|
81,772
|
|
(342
|
)
|
(0.4
|
)
|
717
|
|
0.9
|
|
||||||
|
Industrial
|
39,404
|
|
38,465
|
|
38,991
|
|
939
|
|
2.4
|
|
(526
|
)
|
(1.3
|
)
|
||||||
|
Public and other
|
51,341
|
|
50,678
|
|
51,324
|
|
663
|
|
1.3
|
|
(646
|
)
|
(1.3
|
)
|
||||||
|
Total billed water services volumes
|
347,312
|
|
346,231
|
|
347,740
|
|
1,081
|
|
0.3
|
|
(1,509
|
)
|
(0.4
|
)
|
||||||
|
Note:
|
The correlation between water revenues and billed water volumes shown in the preceding tables is impacted by the California drought. In 2015, and to a lesser extent in 2016, California experienced a severe drought. In April 2015, the Governor mandated water usage restrictions to reduce overall water usage by 25% in the state compared to 2013 levels. In April 2017, the mandated water usage restrictions were removed. In California, revenue is decoupled from sales volume through the WRAM/MCBA, aligning our water conservation goals with those of the state and our customers, and therefore usage reductions do not impact earnings.
|
In
2017
, operating revenues
increased
$87 million
, or
3.0%
, primarily due to a:
|
•
|
$81 million increase from authorized rate increases, including infrastructure surcharges, principally to fund investment growth in various states;
|
|
•
|
$43 million increase attributable to water and wastewater acquisitions, as well as organic growth in existing systems; and a
|
|
•
|
$9 million increase resulting from higher wastewater treatment volumes and an increase in private fire service connections; partially offset by a
|
|
•
|
$48 million decrease due to lower water services demand, including a $15 million reduction due to warmer weather in 2016.
|
In
2016
, operating revenues
increased
$128 million
, or
4.7%
, primarily due to a:
|
•
|
$92 million increase from authorized rate increases, including infrastructure surcharges, principally to fund investment growth in various states;
|
|
•
|
$19 million increase attributable to water and wastewater acquisitions, as well as organic growth in existing systems;
|
|
•
|
$4 million increase resulting from higher wastewater treatment volumes and an increase in private fire service connections; and
|
|
•
|
$13 million increase mainly due to revenues from balancing accounts, primarily in our California subsidiary, as well as surcharges and other adjustments.
|
Operation and Maintenance
The following tables and the ensuing discussions provide explanations for the variances related to the major components of operation and maintenance expense:
|
|
For the Years Ended December 31,
|
Increase
(Decrease) |
Increase
(Decrease) |
||||||||||||||||||||||
|
|
2017
|
2016
|
2015
|
2017 vs. 2016
|
2016 vs. 2015
|
||||||||||||||||||||
|
(Dollars in millions)
|
|
$
|
%
|
$
|
%
|
||||||||||||||||||||
|
Production costs
|
$
|
298
|
|
$
|
288
|
|
$
|
282
|
|
$
|
10
|
|
3.5
|
|
$
|
6
|
|
2.1
|
|
||||||
|
Employee-related costs
|
446
|
|
443
|
|
430
|
|
3
|
|
0.7
|
|
13
|
|
3.0
|
|
|||||||||||
|
Operating supplies and services
|
209
|
|
212
|
|
194
|
|
(3
|
)
|
(1.4
|
)
|
18
|
|
9.3
|
|
|||||||||||
|
Maintenance materials and supplies
|
70
|
|
73
|
|
70
|
|
(3
|
)
|
(4.1
|
)
|
3
|
|
4.3
|
|
|||||||||||
|
Customer billing and accounting
|
51
|
|
54
|
|
63
|
|
(3
|
)
|
(5.6
|
)
|
(9
|
)
|
(14.3
|
)
|
|||||||||||
|
Other
|
17
|
|
106
|
|
56
|
|
(89
|
)
|
(84.0
|
)
|
50
|
|
89.3
|
|
|||||||||||
|
Total
|
$
|
1,091
|
|
$
|
1,176
|
|
$
|
1,095
|
|
$
|
(85
|
)
|
(7.2
|
)
|
$
|
81
|
|
7.4
|
|
||||||
54
Production Costs
|
|
For the Years Ended December 31,
|
Increase
(Decrease) |
Increase
(Decrease) |
|||||||||||||||||||||
|
|
2017
|
2016
|
2015
|
2017 vs. 2016
|
2016 vs. 2015
|
|||||||||||||||||||
|
(Dollars in millions)
|
|
$
|
%
|
$
|
%
|
|||||||||||||||||||
|
Purchased water
|
$
|
128
|
|
$
|
122
|
|
$
|
117
|
|
$
|
6
|
|
4.9
|
$
|
5
|
|
4.3
|
|
||||||
|
Fuel and power
|
89
|
|
87
|
|
89
|
|
2
|
|
2.3
|
(2
|
)
|
(2.2
|
)
|
|||||||||||
|
Chemicals
|
47
|
|
47
|
|
48
|
|
—
|
|
—
|
(1
|
)
|
(2.1
|
)
|
|||||||||||
|
Waste disposal
|
34
|
|
32
|
|
28
|
|
2
|
|
6.3
|
4
|
|
14.3
|
|
|||||||||||
|
Total
|
$
|
298
|
|
$
|
288
|
|
$
|
282
|
|
$
|
10
|
|
3.5
|
$
|
6
|
|
2.1
|
|
||||||
In
2017
, production costs
increased
$10 million
, or
3.5%
, primarily due to a:
|
•
|
$6 million increase in purchased water principally due to usage increases in our California subsidiary, the result of the lifting in April 2017 of California water usage restrictions that had been mandated in 2015 due to the state’s extreme drought;
|
|
•
|
$2 million increase in fuel and power largely attributable to higher system delivery of water and supplier price increases in our Missouri and California subsidiaries; and
|
|
•
|
$2 million increase in waste disposal mainly due to higher sludge removal costs in our Illinois and Missouri subsidiaries.
|
In
2016
, production costs
increased
$6 million
, or
2.1%
, primarily due to a:
|
•
|
$5 million increase in purchased water principally due to price increases in our California subsidiary; and a
|
|
•
|
$4 million increase in waste disposal largely attributable to higher sludge removal costs in several of our subsidiaries; partially offset by a
|
|
•
|
$2 million decrease in fuel and power mainly due to a price decrease in our New Jersey subsidiary.
|
Employee-Related Costs
|
|
For the Years Ended December 31,
|
Increase
(Decrease) |
Increase
(Decrease) |
||||||||||||||||||||||
|
|
2017
|
2016
|
2015
|
2017 vs. 2016
|
2016 vs. 2015
|
||||||||||||||||||||
|
(Dollars in millions)
|
|
$
|
%
|
$
|
%
|
||||||||||||||||||||
|
Salaries and wages
|
$
|
334
|
|
$
|
336
|
|
$
|
321
|
|
$
|
(2
|
)
|
(0.6
|
)
|
$
|
15
|
|
4.7
|
|
||||||
|
Pensions
|
32
|
|
28
|
|
30
|
|
4
|
|
14.3
|
|
(2
|
)
|
(6.7
|
)
|
|||||||||||
|
Group insurance
|
54
|
|
58
|
|
60
|
|
(4
|
)
|
(6.9
|
)
|
(2
|
)
|
(3.3
|
)
|
|||||||||||
|
Other benefits
|
26
|
|
21
|
|
19
|
|
5
|
|
23.8
|
|
2
|
|
10.5
|
|
|||||||||||
|
Total
|
$
|
446
|
|
$
|
443
|
|
$
|
430
|
|
$
|
3
|
|
0.7
|
|
$
|
13
|
|
3.0
|
|
||||||
In
2017
, employee-related costs
increased
$3 million
, or
0.7%
, primarily due to a:
|
•
|
$4 million increase in pensions principally due to a lower discount rate in 2017, resulting in increased plan obligations; and a
|
|
•
|
$5 million increase in other benefits largely attributable to higher employer 401(k) savings plan contributions and an increase in training costs; partially offset by a
|
|
•
|
$4 million decrease in group insurance mainly due to lower medical claims experienced in 2017 and a decrease in other postretirement benefit plan costs resulting from plan amendments approved in 2016, offset in part by higher enrollment in 2017 and increases in group insurance rates.
|
In
2016
, employee-related costs
increased
$13 million
, or
3.0%
, primarily due to a:
|
•
|
$15 million increase in salaries and wages principally due to higher annual performance plan expense and an increase in compensation expense in support of the growth of the business, offset in part by an increase in capitalized labor attributable to higher capital investment; partially offset by a
|
55
|
•
|
$2 million decrease in group insurance largely attributable to a $10 million decrease in other postretirement benefit plan costs resulting from plan amendments approved in 2016, offset in part by $9 million of higher medical claims experienced in 2016.
|
Operating Supplies and Services
|
|
For the Years Ended December 31,
|
Increase
(Decrease) |
Increase
(Decrease) |
||||||||||||||||||||||
|
|
2017
|
2016
|
2015
|
2017 vs. 2016
|
2016 vs. 2015
|
||||||||||||||||||||
|
(Dollars in millions)
|
|
$
|
%
|
$
|
%
|
||||||||||||||||||||
|
Contracted services
|
$
|
84
|
|
$
|
84
|
|
$
|
81
|
|
$
|
—
|
|
—
|
|
$
|
3
|
|
3.7
|
|
||||||
|
Office supplies and services
|
49
|
|
45
|
|
44
|
|
4
|
|
8.9
|
|
1
|
|
2.3
|
|
|||||||||||
|
Transportation
|
14
|
|
13
|
|
16
|
|
1
|
|
7.7
|
|
(3
|
)
|
(18.8
|
)
|
|||||||||||
|
Rents
|
15
|
|
14
|
|
14
|
|
1
|
|
7.1
|
|
—
|
|
—
|
|
|||||||||||
|
Other
|
47
|
|
56
|
|
39
|
|
(9
|
)
|
(16.1
|
)
|
17
|
|
43.6
|
|
|||||||||||
|
Total
|
$
|
209
|
|
$
|
212
|
|
$
|
194
|
|
$
|
(3
|
)
|
(1.4
|
)
|
$
|
18
|
|
9.3
|
|
||||||
In
2017
, operating supplies and services
decreased
$3 million
, or
1.4%
, primarily due to a:
|
•
|
$9 million decrease in other principally due to charges recorded in 2016, including a $5 million write-off of timekeeping system costs that were previously capitalized and a $7 million judgment in litigation; partially offset by a
|
|
•
|
$4 million increase in office supplies and services largely attributable to higher employee relocation, telecommunication and office supplies expense.
|
In
2016
, operating supplies and services
increased
$18 million
, or
9.3%
, primarily due to a:
|
•
|
$17 million increase in other principally due to a $5 million write-off of timekeeping system costs that were previously capitalized and a $7 million judgment in litigation, both recorded in 2016, and a $3 million adjustment recorded in 2015 to recognize previously expensed business transformation costs as a regulatory asset in our California subsidiary, resulting from a rate case decision.
|
Maintenance Materials and Supplies
In
2017
, maintenance materials and supplies
decreased
$3 million
, or
4.1%
, primarily due to lower tank painting expense in our New Jersey subsidiary and the timing of maintenance activities.
In
2016
, maintenance materials and supplies
increased
$3 million
, or
4.3%
, primarily due to a:
|
•
|
$10 million increase in tank painting expense in several of our subsidiaries; partially offset by a
|
|
•
|
$5 million decrease in main breaks driven by milder winter weather in 2016.
|
Customer Billing and Accounting
In
2017
and
2016
, customer billing and accounting
decreased
$3 million
and
$9 million
, or
5.6%
and
14.3%
, respectively. The decrease in both years was primarily due to lower customer uncollectible expense attributable to focused collection efforts.
Other
In
2017
, other operation and maintenance
decreased
$89 million
, or
84.0%
, primarily due to a:
|
•
|
$65 million net charge recorded in 2016, resulting from the binding global agreement in principle to settle claims associated with the Freedom Industries chemical spill in West Virginia, and a $22 million benefit recorded in 2017, resulting from a related insurance settlement with one of our general liability insurance carriers; and
|
|
•
|
$5 million decrease in casualty insurance expense attributable to a lower claims experience.
|
In
2016
, other operation and maintenance expenses
increased
$50 million
, or
89.3%
, primarily due to a:
|
•
|
$65 million charge recorded in 2016, resulting from the binding global agreement in principle to settle claims associated with the Freedom Industries chemical spill in West Virginia; partially offset by a
|
56
|
•
|
$15 million decrease in casualty insurance expense attributable to a lower claims experience.
|
Operating Expenses, net.
In
2017
, operating expenses, net
decreased
$71 million
, or
3.8%
, primarily due to a:
|
•
|
$85 million
decrease in operation and maintenance expense as explained above; and a
|
|
•
|
$7 million gain recognized on a land sale in our Kentucky subsidiary; partially offset by a
|
|
•
|
$22 million
increase in depreciation and amortization expense attributable to additional utility plant placed in service; included in the
2017
expense amount was the impact of revised rates from a depreciation study approved by the ICC in our Illinois subsidiary, resulting in lower depreciation expense of
$16 million
.
|
In
2016
, operating expenses, net
increased
$120 million
, or
6.9%
, primarily due to a:
|
•
|
$81 million
increase in operation and maintenance expense as explained above;
|
|
•
|
$30 million
increase in depreciation and amortization expense attributable to additional utility plant placed in service and incremental depreciation and amortization expense resulting from our acquisition of Keystone in the third quarter of 2015; and
|
|
•
|
$14 million increase in general taxes principally due to incremental property and gross receipts taxes.
|
Market-Based Businesses
The following table summarizes certain financial information for our
Market-Based Businesses
and the ensuing discussions provide explanations for the variance related to operating revenues:
|
|
For the Years Ended December 31,
|
Increase
(Decrease) |
Increase
(Decrease) |
||||||||||||||||||||||
|
2017
|
2016
|
2015
|
2017 vs. 2016
|
2016 vs. 2015
|
|||||||||||||||||||||
|
(Dollars in millions)
|
|
|
|
|
|
|
$
|
%
|
$
|
%
|
|||||||||||||||
|
Operating revenues
|
$
|
422
|
|
$
|
451
|
|
$
|
434
|
|
$
|
(29
|
)
|
(6.4
|
)
|
$
|
17
|
|
3.9
|
|
||||||
|
Operation and maintenance
|
337
|
|
372
|
|
358
|
|
(35
|
)
|
(9.4
|
)
|
14
|
|
3.9
|
|
|||||||||||
|
Operating expenses, net
|
360
|
|
391
|
|
370
|
|
(31
|
)
|
(7.9
|
)
|
21
|
|
5.7
|
|
|||||||||||
|
Net income attributable to common stockholders
|
38
|
|
39
|
|
42
|
|
(1
|
)
|
(2.6
|
)
|
(3
|
)
|
(7.1
|
)
|
|||||||||||
Operating Revenues
In
2017
, operating revenues
decreased
$29 million
, or
6.4%
, primarily due to a:
|
•
|
$56 million decrease in our Military Services Group principally due to lower capital upgrades in 2017, largely driven by reduced military base budgets and the completion of a large project in mid-2016 at Fort Polk; and a
|
|
•
|
$6 million decrease in our Contract Operations Group largely attributable to the completion of several contracts in 2017; partially offset by a
|
|
•
|
$18 million increase in our Homeowner Services Group mainly due to contract growth, as well as expansion into new geographic areas and price increases for existing customers; and a
|
|
•
|
$16 million increase in Keystone primarily due to an increase in operations as a result of market recovery in the natural gas industry.
|
In
2016
, operating revenues
increased
$17 million
, or
3.9%
, primarily due to a:
|
•
|
$15 million increase from Keystone, which was acquired in the third quarter of 2015;
|
|
•
|
$11 million increase in our Homeowner Services Group mainly due to contract growth, as well as expansion into new geographic areas and price increases for existing customers; and a
|
|
•
|
$11 million increase in our Contract Operations Group largely attributable to contract growth, specifically from our contract in Camden, New Jersey; partially offset by a
|
|
•
|
$21 million decrease in our Military Services Group principally due to lower capital upgrades in 2016, offset in part by incremental revenues from the addition of the Vandenberg Air Force Base contract in 2016.
|
57
Operation and Maintenance
The following table and ensuing discussions provide explanations for the variances related to the major components of operation and maintenance expense:
|
|
For the Years Ended December 31,
|
Increase
(Decrease) |
Increase
(Decrease) |
||||||||||||||||||||||
|
|
2017
|
2016
|
2015
|
2017 vs. 2016
|
2016 vs. 2015
|
||||||||||||||||||||
|
(Dollars in millions)
|
|
|
|
$
|
%
|
$
|
%
|
||||||||||||||||||
|
Production costs
|
$
|
37
|
|
$
|
35
|
|
$
|
36
|
|
$
|
2
|
|
5.7
|
|
$
|
(1
|
)
|
(2.8
|
)
|
||||||
|
Employee-related costs
|
97
|
|
94
|
|
76
|
|
3
|
|
3.2
|
|
18
|
|
23.7
|
|
|||||||||||
|
Operating supplies and services
|
121
|
|
165
|
|
182
|
|
(44
|
)
|
(26.7
|
)
|
(17
|
)
|
(9.3
|
)
|
|||||||||||
|
Maintenance materials and supplies
|
67
|
|
68
|
|
57
|
|
(1
|
)
|
(1.5
|
)
|
11
|
|
19.3
|
|
|||||||||||
|
Other
|
15
|
|
10
|
|
7
|
|
5
|
|
50.0
|
|
3
|
|
42.9
|
|
|||||||||||
|
Total
|
$
|
337
|
|
$
|
372
|
|
$
|
358
|
|
$
|
(35
|
)
|
(9.4
|
)
|
$
|
14
|
|
3.9
|
|
||||||
In
2017
, operation and maintenance expense
decreased
$35 million
, or
9.4%
, primarily due to a:
|
•
|
$44 million decrease in operating supplies and services principally due to lower capital upgrades in our Military Services Group in 2017, as discussed above, as well as lower advertising and marketing expense in our Homeowners Services Group; partially offset by a
|
|
•
|
$3 million increase in employee-related costs largely attributable to higher headcount in Keystone due to an increase in operations as a result of market recovery in the natural gas industry, offset in part in our Contract Operations Group as several contracts were completed in 2017; and a
|
|
•
|
$5 million increase in other mainly due to an increase in customer uncollectible expense in our Homeowner Services Group as a result of contract growth in 2017.
|
In
2016
, operation and maintenance expense
increased
$14 million
, or
3.9%
, primarily due to a:
|
•
|
$11 million increase from Keystone, which was acquired in the third quarter of 2015, including $8 million in employee-related costs and $1 million each in production costs, operating supplies and services, and an;
|
|
•
|
$11 million increase in maintenance materials and supplies largely attributable to contract growth in our Homeowner Services and Contract Operations Groups, and higher claims, marketing expenses and costs associated with our investment in a new customer information system in our Homeowner Services Group; and a
|
|
•
|
$10 million increase in employee-related costs principally due to the addition of the Vandenberg Air Force Base contract in 2016, and increased headcount resulting from contract growth in our Homeowner Services and Contract Operations Groups; partially offset by a
|
|
•
|
$18 million decrease in operating supplies and services mainly due to lower capital upgrades in our Military Services Group, as discussed above.
|
Liquidity and Capital Resources
We regularly evaluate and monitor our cash requirements for capital investments, acquisitions, operations, commitments, debt maturities, interest and dividends. Our business is capital intensive, with a majority of this capital funded by cash flows from operations. When necessary, we also obtain funds from external sources, primarily in the debt markets and through short-term commercial paper borrowings. We also have access to equity capital markets, if needed. Our access to external financing on reasonable terms depends on our credit ratings and current business conditions, including that of the utility and water utility industries in general, as well as conditions in the debt or equity capital markets, and the national and international economic and geopolitical arenas. If these business, market, financial and other conditions deteriorate to the extent that we no longer are able to access the capital markets on reasonable terms, we have access to an unsecured revolving credit facility with aggregate bank commitments of
$1.75 billion
, with an expiration date of June 2020 (subject to extension by us for up to two one-year periods). We rely on this revolving credit facility and the capital markets to fulfill our short-term liquidity needs, to issue letters of credit and to support our
$1.6 billion
commercial paper program. Disruptions in the credit markets may discourage lenders from extending the terms of such commitments or agreeing to new commitments. Market disruptions may also limit our ability to issue debt and equity securities in the capital markets. See “Credit Facilities and Short-Term Debt” for further discussion.
58
In order to meet our short-term liquidity needs, we, through AWCC, our wholly owned financing subsidiary, issue commercial paper, which is supported by the revolving credit facility. As of
December 31, 2017
, AWCC had
no
outstanding borrowings and
$84 million
of outstanding letters of credit under its revolving credit facility, with
$1.75 billion
available to fulfill our short-term liquidity needs and to issue letters of credit, which supported
$905 million
in outstanding commercial paper. We believe that our ability to access the capital markets, our revolving credit facility and our cash flows from operations will generate sufficient cash to fund our short-term requirements. We have no plans to issue equity under normal operating conditions in the foreseeable future with the limited exception of privately or investor-owned acquisitions whose sellers require equity as necessary to complete the acquisition. We believe we have sufficient liquidity and the ability to manage our expenditures, should there be a disruption of the capital and credit markets. However, we can provide no assurances that the lenders will meet their existing commitments to AWCC under the revolving credit facility or that we will be able to access the commercial paper or loan markets in the future on terms acceptable to us or at all.
In addition, our regulated subsidiaries receive advances and contributions from customers, home builders and real estate developers to fund construction necessary to extend service to new areas. Advances for construction are refundable for limited periods, which vary according to state regulations, as new customers begin to receive service or other contractual obligations are fulfilled. Amounts which are no longer refundable are reclassified to contributions in aid of construction. Utility plant funded by advances and contributions is excluded from our
Regulated Businesses
rate base. Generally, we depreciate contributed property and amortize contributions in aid of construction at the composite rate of the related property. Some of our subsidiaries do not depreciate contributed property, based upon regulatory guidelines. The taxability of advances and contributions in aid of construction was changed with the enactment of the TCJA. Previously, the majority of advances and contributions that we collected were not taxable however, with the enactment of the TCJA, they will be taxable going forward. Regulatory treatment for advances and contributions under the TCJA has not yet been defined and we are working with our regulatory jurisdictions to determine impacts to the Company and our customers.
We use our capital resources, including cash, primarily to: (i) fund operating and capital requirements; (ii) pay interest and meet debt maturities; (iii) pay dividends; (iv) fund acquisitions; and (v) fund pension and postretirement benefit obligations. We invest a significant amount of cash on regulated capital projects where we expect to earn a long-term return on investment. Additionally, we operate in rate regulated environments in which the amount of new investment recovery may be limited, and where such recovery generally takes place over an extended period of time, and certain capital recovery is also subject to regulatory lag. See
Item 1—Business
—
Regulated Businesses
—
Economic Regulation and Rate Making
. We expect to fund future maturities of long-term debt through a combination of external debt and, to the extent available, cash flows from operations. Since we expect our capital investments over the next few years to be greater than our cash flows from operating activities, we have no plans to reduce debt significantly. If necessary, we may delay certain capital investments or other funding requirements, or pursue financing from other sources to preserve liquidity. In this event, we believe we can rely upon cash flows from operations to meet our obligations and fund our minimum required capital investments for an extended period of time.
With the enactment of the TCJA and the reduction of the U.S. federal corporate income tax rate from 35% to 21%, we anticipate a decrease in future revenue authorizations associated with our
Regulated Businesses
, initially leading to lower cash flows. We expect this cash flow impact to decline over time, as our
Regulated Businesses
’ rate base grows, the result of lower deferred income tax liabilities, which offset rate base. The lower deferred income tax liabilities are mainly due to: (i) a lower U.S. federal corporate income tax rate; (ii) the normalization (refunding to customers) of the re-measured deferred income tax liabilities over the remaining life of the associated assets; and (iii) the loss of future bonus depreciation deductions on capital projects that began after September 27, 2017.
Cash Flows Provided by Operating Activities
Cash flows provided by operating activities primarily result from the sale of water and wastewater services and, due to the seasonality of demand, are generally greater during the warmer months. Our future cash flows provided by operating activities will be affected by, among other things: economic utility regulation; inflation; compliance with environmental, health and safety standards; production costs; customer growth; declining customer usage of water; employee-related costs, including pension funding; weather and seasonality; taxes; and overall economic conditions.
We expect that the enactment of the TCJA to be accretive to our consolidated earnings over time through: (i) growth in rate base for the same level of expected capital expenditures due to the impact of the lower U.S. federal corporate income tax rate and the re-measurement of our deferred income tax assets and liabilities; (ii) increased earnings in our
Market-Based Businesses
due to the lower U.S. federal corporate income tax rate; all partially offset by (iii) the impact of increased debt due to lower cash flows from operations. We believe that we will likely begin paying federal income taxes towards the end of 2019, when we expect our federal NOL carryforwards balance will be fully benefited or used, and expect to be a full cash taxpayer by 2020, although this timing could be impacted by any significant changes in our future results of operations and the outcome of regulatory proceedings regarding the TCJA.
59
Cash flows provided by operating activities have been a reliable, steady source of funding, sufficient to meet operating requirements, make our dividend payments and fund a portion of our capital expenditure requirements. We expect to seek access to debt capital markets to meet the balance of our capital expenditure requirements as needed. We also have access to equity capital markets, if needed. Operating cash flows can be negatively affected by changes in our rate regulated environments or changes in our customers’ economic outlook and ability to pay for service in a timely manner. As such, our working capital needs are primarily limited to funding increases in customer accounts receivable and unbilled revenues, mainly associated with revenue increases in our
Regulated Businesses
. We can provide no assurance that our customers’ historical payment pattern will continue in the future. Sometimes our current liabilities exceed current assets because of our debt due within one year and the periodic use of short-term debt as a funding source, primarily to meet scheduled maturities of long-term debt, as well as cash needs which can fluctuate significantly due to the seasonality of the business, stage of our acquisitions and construction projects. We address cash timing differences through the aforementioned liquidity funding mechanisms.
The following table provides a summary of the major items affecting our cash flows provided by operating activities:
|
|
For the Years Ended December 31,
|
||||||||||
|
(In millions)
|
2017
|
2016
|
2015
|
||||||||
|
Net income
|
$
|
426
|
|
$
|
468
|
|
$
|
476
|
|
||
|
Add (less):
|
|
|
|
||||||||
|
Depreciation and amortization
|
492
|
|
470
|
|
440
|
|
|||||
|
Deferred income taxes and amortization of investment tax credits
|
462
|
|
295
|
|
312
|
|
|||||
|
Other non-cash activities
(a)
|
16
|
|
35
|
|
37
|
|
|||||
|
Impact of Freedom Industries settlement activities
|
(22
|
)
|
65
|
|
—
|
|
|||||
|
Changes in working capital
(b)
|
123
|
|
9
|
|
(13
|
)
|
|||||
|
Pension and postretirement benefit contributions
|
(48
|
)
|
(53
|
)
|
(57
|
)
|
|||||
|
Net cash flows provided by operating activities
|
$
|
1,449
|
|
$
|
1,289
|
|
$
|
1,195
|
|
||
|
(a)
|
Includes provision for losses on accounts receivable, gain on asset dispositions and purchases, pension and non-pension postretirement benefits and other non-cash, net. Details of each component can be found in the Consolidated Statements of Cash Flows.
|
|
(b)
|
Changes in working capital include changes to receivables and unbilled revenues, accounts payable and accrued liabilities, and other current assets and liabilities, net.
|
In
2017
, cash flows provided by operating activities
increased
$160 million
, primarily due to an increase in net income after non-cash adjustments, including the impact of the enactment of the TCJA, and an increase in cash flows from working capital. The main factors contributing to the net income increase are described in the “Consolidated Results of Operations” section and include higher operating revenues, partially offset by higher income taxes due to a
$125 million
re-measurement charge resulting from the impact of the change in the federal tax rate on the Company’s deferred income taxes from the enactment of the TCJA. The increase in non-cash activities was mainly attributable to the increase in deferred income taxes, as mentioned above, and an increase in depreciation and amortization due to additional utility plant placed in service. The change in working capital was principally due to: (i) the timing of accounts payable and accrued liabilities, including the accrual recorded during 2016 for the binding global agreement in principle to settle claims associated with the Freedom Industries chemical spill in West Virginia; (ii) a decrease in unbilled revenues as a result of our Military Services Group achieving significant capital project milestones during 2016; and (iii) a change in other current assets and liabilities, including the decrease in other current assets associated with the termination of our four forward starting swap agreements and timing of payments clearing our cash accounts.
In
2016
, cash flows provided by operations
increased
$94 million
, primarily due to an increase in net income after non-cash adjustments, including the impact of the binding global agreement in principle to settle claims associated with the Freedom Industries chemical spill in West Virginia, and an increase in cash flows from working capital. The main factors contributing to the net income increase are described in the “Consolidated Results of Operations” section and include higher operating revenues, partially offset by higher O&M expenses. The increase in non-cash activities was mainly attributable to an increase in depreciation and amortization due to additional utility plant placed in service. The change in working capital was principally due to: (i) a change in accounts receivable and unbilled revenues resulting from continuous improvement in our
Regulated Businesses
’ collection efforts, as well as a decrease in unbilled revenues in our Military Services Group attributable to lower capital upgrades in 2016 as compared to the same period in 2015; (ii) the timing of accounts payable and accrued liabilities; and (iii) a change in other current assets and liabilities.
The Company expects to make pension and postretirement contributions to the plan trusts up to
$45 million
in
2018
. In addition, we estimate that contributions will amount to
$47 million
,
$47 million
,
$51 million
and
$58 million
in
2019
,
2020
,
2021
and
2022
, respectively. Actual amounts contributed could change materially from these estimates as a result of changes in assumptions and actual investment returns, among other factors.
60
Cash Flows Used in Investing Activities
The following table provides a summary of the major items affection our cash flows used in investing activities:
|
|
For the Years Ended December 31,
|
||||||||||
|
(In millions)
|
2017
|
2016
|
2015
|
||||||||
|
Capital expenditures
|
$
|
(1,434
|
)
|
$
|
(1,311
|
)
|
$
|
(1,160
|
)
|
||
|
Acquisitions
|
(177
|
)
|
(204
|
)
|
(197
|
)
|
|||||
|
Other investing activities, net
(a)
|
(61
|
)
|
(75
|
)
|
(102
|
)
|
|||||
|
Net cash flows used in investing activities
|
$
|
(1,672
|
)
|
$
|
(1,590
|
)
|
$
|
(1,459
|
)
|
||
|
(a)
|
Includes removal costs from property, plant and equipment retirements and proceeds from sale of assets and securities.
|
In
2017
and
2016
, cash flows used in investing activities increased primarily due to an increase in our regulated capital expenditures, principally from incremental investments associated with the replacement and renewal of our transmission and distribution infrastructure in our
Regulated Businesses
.
Our infrastructure investment plan consists of both infrastructure renewal programs, where we replace infrastructure, as needed, and major capital investment projects, where we construct new water and wastewater treatment and delivery facilities to meet new customer growth and water quality regulations. Our projected capital expenditures and other investments are subject to periodic review and revision to reflect changes in economic conditions and other factors.
The following table provides a summary of our historical capital expenditures related to the upgrading of our infrastructure and systems:
|
|
For the Years Ended December 31,
|
||||||||||
|
(In millions)
|
2017
|
2016
|
2015
|
||||||||
|
Transmission and distribution
|
$
|
551
|
|
$
|
568
|
|
$
|
527
|
|
||
|
Treatment and pumping
|
171
|
|
151
|
|
136
|
|
|||||
|
Services, meter and fire hydrants
|
281
|
|
297
|
|
214
|
|
|||||
|
General structure and equipment
|
281
|
|
202
|
|
174
|
|
|||||
|
Sources of supply
|
54
|
|
59
|
|
53
|
|
|||||
|
Wastewater
|
96
|
|
34
|
|
56
|
|
|||||
|
Total capital expenditures
|
$
|
1,434
|
|
$
|
1,311
|
|
$
|
1,160
|
|
||
In
2017
, our capital expenditures
increased
$123 million
, or
9.4%
, primarily due to investment in our general structure and equipment and wastewater categories. In
2016
, our capital expenditures
increased
$151 million
, or
13.0%
, principally due to investment across the majority of our infrastructure categories.
We also grow our business through acquisitions of water and wastewater systems, as well as other water-related services. These acquisitions are complementary to our existing business and support continued geographical diversification and growth of our operations. Generally, acquisitions are funded initially with short-term debt, and later refinanced with the proceeds from long-term debt.
The following provides a summary of the acquisitions and dispositions affecting our cash flows from investing activities:
2017
:
|
•
|
The majority of cash paid for acquisitions pertained to the
$159 million
purchase of the McKeesport system, excluding a
$5 million
non-escrowed deposit made in
2016
.
|
|
•
|
Paid
$18 million
for
16
water and wastewater systems, excluding the McKeesport system and Shorelands (a stock transaction), representing approximately
7,000
customers.
|
|
•
|
Received
$15 million
for the sale of assets and securities.
|
2016
:
|
•
|
Paid
$199 million
for
15
water and wastewater systems, representing approximately
42,000
customers.
|
|
•
|
Made a non-escrowed deposit of
$5 million
related to the McKeesport system acquisition.
|
61
|
•
|
Received
$9 million
for the sale of assets and securities.
|
2015
:
|
•
|
Paid
$133 million
for the acquisition of our
95%
interest in Water Solutions Holdings, LLC, the parent company of Keystone.
|
|
•
|
Paid
$64 million
for
14
water and wastewater systems, representing approximately
24,000
customers.
|
|
•
|
Received
$5 million
for the sale of assets and securities.
|
As previously noted, we expect to invest between
$8.0 billion
to
$8.6 billion
from
2018
to
2022
, with
$7.2 billion
of this range for infrastructure improvements in our
Regulated Businesses
. In
2018
, we expect to invest between
$1.6 billion
to
$1.8 billion
, with a range of
$1.4 billion
to
$1.5 billion
for infrastructure improvements in our
Regulated Businesses
. Also in
2018
, we expect to invest between
$120 million
to
$240 million
for acquisitions in our
Regulated Businesses
, and approximately
$100 million
for strategic growth opportunities, including the construction of our new corporate headquarters in Camden, New Jersey, which is expected to be completed during the second half of 2018 and is eligible for tax credits from New Jersey’s Economic Development Authority.
Cash Flows from Financing Activities
Our financing activities, primarily focused on funding infrastructure construction expenditures, include the issuance of long-term and short-term debt, primarily through AWCC. In addition, new infrastructure may be funded with customer advances and contributions in aid of construction, net of refunds, which amounted to
$28 million
,
$16 million
and
$26 million
for the years ended
December 31, 2017
,
2016
and
2015
, respectively. Based on the needs of our
Regulated Businesses
and the Company, AWCC may borrow funds or issue its debt in the capital markets and then, through intercompany loans, provide those borrowings to the
Regulated Businesses
and the parent company. The
Regulated Businesses
and the parent company are obligated to pay their portion of the respective principal and interest to AWCC, in the amount necessary to enable AWCC to meet its debt service obligations. The parent company’s borrowings are not a source of capital for the
Regulated Businesses
, therefore, the parent company is not able to recover the interest charges on its debt through regulated water and wastewater rates. As of
December 31, 2017
, AWCC has made long-term fixed rate loans and commercial paper loans to our
Regulated Businesses
amounting to
$3.9 billion
and
$586 million
, respectively. Additionally, as of
December 31, 2017
, AWCC has made long-term fixed rate loans and commercial paper loans to the parent company amounting
$1.6 billion
and
$319 million
, respectively.
On
August 10, 2017
, AWCC completed a
$1.35 billion
debt offering which included the sale of
$600 million
aggregate principal amount of its
2.95%
Senior Notes due 2027, and
$750 million
aggregate principal amount of its
3.75%
Senior Notes due in 2047. At the closing of the offering, AWCC received, after deduction of underwriting discounts and debt issuance costs,
$1.33 billion
. On September 13, 2017, AWCC used proceeds from the offering to prepay
$138 million
of its outstanding
5.62%
Series C Senior Notes due December 21, 2018 (“Series C Senior Notes”) and
$181 million
of its outstanding
5.77%
Series D Senior Notes due December 21, 2021 (“Series D Senior Notes”). AWCC also used the proceeds of this offering to repay commercial paper obligations and for general corporate purposes, and subsequently, on October 15, 2017, to repay at maturity,
$524 million
of its
6.085%
Senior Notes.
As a result of AWCC’s prepayment of the Series C Senior Notes and the Series D Senior Notes, and payment of a make-whole premium amount to the holders thereof of
$34 million
, we recorded a
$6 million
charge resulting from the early extinguishment of debt at the parent company. Substantially all of the early debt extinguishment costs allocable to the
Regulated Businesses
were recorded as regulatory assets for we believe they are probable of recovery in future rates. Approximately
$1 million
of the early debt extinguishment costs allocable to the
Regulated Businesses
were amortized in 2017.
One of the principal market risks to which the Company is exposed is changes in interest rates. In order to manage the exposure, we follow risk management policies and procedures, including the use of derivative contracts such as swaps. We reduce exposure to interest rates by managing commercial paper and debt maturities. We do not enter into derivative contracts for speculative purposes and do not use leveraged instruments. The derivative contracts entered into are for periods consistent with the related underlying exposures. The Company is exposed to the risk that counterparties to derivative contracts will fail to meet their contractual obligations. We minimize the counterparty credit risk on these transactions by only dealing with leading, credit-worthy financial institutions, having long-term credit ratings of “A” or better.
On
August 7, 2017
, coinciding with AWCC’s
$1.35 billion
debt offering, we terminated
four
existing forward starting swap agreements with an aggregate notional amount of
$300 million
, realizing a gain of
$19 million
to be amortized through interest, net, over
30
years. On February 8, 2017, and December 11, 2017, we entered into forward starting swap agreements, each with notional amounts of
$100 million
, to reduce interest rate exposure on debt expected to be issued in 2018. These forward starting swap agreements terminate in November 2018, and have an average fixed rate of
2.59%
. We have designated these forward starting swap agreements as cash flow hedges, with their fair values recorded in accumulated other comprehensive gain or loss. Upon termination, the cumulative gain or loss recorded in accumulated other comprehensive gain or loss will be amortized through interest, net, over the term of the new debt.
62
In October 2017, we terminated our interest-rate swap to hedge
$100 million
of its
6.085%
Senior Notes maturing in the fourth quarter of 2017. The Company paid variable interest of six-month LIBOR plus
3.422%
, and had designated this interest rate swap as a fair value hedge, accounted for at fair value with gains or losses, as well as the offsetting gains or losses on the hedged item, recognized in interest, net. The net gain and loss recognized by the Company was de minimis for the periods ended
December 31, 2017
and
2016
.
In May 2015, the parent company and AWCC filed with the SEC, a universal shelf registration statement that enables us to meet our capital needs through the offer and sale to the public from time to time of an unlimited amount of various types of securities, including American Water common stock, preferred stock, and other equity and hybrid securities, and AWCC debt securities, all subject to market conditions and demand, general economic conditions, and as applicable, rating status. The shelf registration will expire in May 2018. During
2017
,
2016
and
2015
,
$1.35 billion
,
$550 million
and
$550 million
, respectively, of debt securities were issued pursuant to this registration statements.
The following table details the issuances of long-term debt in
2017
:
|
Company
|
Type
|
Rate
|
Maturity
|
Amount
(In millions) |
||||||
|
AWCC
|
Senior notes—fixed rate
|
2.95%-3.75%
|
2027-2047
|
$
|
1,350
|
|
||||
|
Other American Water subsidiaries
|
Private activity bonds and government funded debt—fixed rate
|
0.00%-1.44%
|
2020-2037
|
31
|
|
|||||
|
Other American Water subsidiaries
|
Mortgage bonds—fixed rate
|
3.92%
|
2020
|
$
|
3
|
|
||||
|
Other American Water subsidiaries
|
Term loan
|
4.62%-5.12%
|
2021
|
$
|
11
|
|
||||
|
Total issuances
|
|
|
|
$
|
1,395
|
|
||||
The following table details the long-term debt that was retired through sinking fund provisions, optional redemption or payment at maturity during
2017
:
|
Company
|
Type
|
Rate
|
Maturity
|
Amount
(In millions) |
||||||
|
AWCC
|
Senior notes—fixed rate
|
5.62%-6.09%
|
2017-2021
|
$
|
844
|
|
||||
|
AWCC
|
Private activity bonds and government funded debt—fixed rate
|
1.79%-2.90%
|
2021-2031
|
1
|
|
|||||
|
Other American Water subsidiaries
|
Private activity bonds and government funded debt—fixed rate
|
0.00%-5.38%
|
2017-2041
|
15
|
|
|||||
|
Other American Water subsidiaries
|
Mortgage bonds—fixed rate
|
7.08%
|
2017
|
33
|
|
|||||
|
Other American Water subsidiaries
|
Mandatorily redeemable preferred stock
|
8.49%-9.18%
|
2031-2036
|
2
|
|
|||||
|
Other American Water subsidiaries
|
Term loan
|
4.31%-5.31%
|
2021
|
1
|
|
|||||
|
Total retirements and redemptions
|
|
|
|
$
|
896
|
|
||||
The following table details the issuances of long-term debt in
2016
:
|
Company
|
Type
|
Rate
|
Maturity
|
Amount
(In millions) |
||||||
|
AWCC
(a)
|
Senior notes—fixed rate
|
3.00%-4.00%
|
2026-2046
|
$
|
550
|
|
||||
|
Other American Water subsidiaries
|
Private activity bonds and government funded debt—fixed rate
|
1.00%-1.36%
|
2026-2037
|
3
|
|
|||||
|
Total issuances
|
|
|
|
$
|
553
|
|
||||
|
(a)
|
On November 17, 2016, AWCC completed an offering of its senior fixed rate notes. Proceeds from this offering were used to lend funds to the Company and its
Regulated Businesses
, to repay commercial paper borrowings and for general corporate purposes.
|
63
The following table details the long-term debt that was retired through sinking fund provisions, optional redemption or payment at maturity during
2016
:
|
Company
|
Type
|
Rate
|
Maturity
|
Amount
(In millions) |
||||||
|
AWCC
|
Senior notes—fixed rate
|
5.52%
|
2016
|
$
|
37
|
|
||||
|
AWCC
|
Private activity bonds and government funded debt—fixed rate
|
1.79%-2.90%
|
2021-2031
|
1
|
|
|||||
|
Other American Water subsidiaries
|
Private activity bonds and government funded debt—fixed rate
|
0.00%-5.30%
|
2016-2041
|
104
|
|
|||||
|
Other American Water subsidiaries
|
Mandatorily redeemable preferred stock
|
8.49%-9.18%
|
2031-2036
|
2
|
|
|||||
|
Total retirements and redemptions
|
|
|
|
$
|
144
|
|
||||
The following table details the issuances of long-term debt in
2015
:
|
Company
|
Type
|
Rate
|
Maturity
|
Amount
(In millions) |
||||||
|
AWCC
(a)
|
Senior notes—fixed rate
|
3.40%-4.30%
|
2025-2045
|
$
|
550
|
|
||||
|
Other American Water subsidiaries
|
Private activity bonds and government funded debt—fixed rate
|
1.00%-1.56%
|
2032
|
15
|
|
|||||
|
Total issuances
|
|
|
|
$
|
565
|
|
||||
|
(a)
|
On August 13, 2015, AWCC completed an offering of its senior fixed rate notes. Proceeds from this offering were used to lend funds to the Company and its
Regulated Businesses
, to repay commercial paper borrowings and to finance redemptions of long-term debt.
|
The following table details the long-term debt that was retired through sinking fund provisions, optional redemption or payment at maturity during
2015
:
|
Company
|
Type
|
Rate
|
Maturity
|
Amount
(In millions) |
||||||
|
AWCC
|
Senior notes—fixed rate
|
6.00%
|
2015
|
30
|
|
|||||
|
AWCC
|
Private activity bonds and government funded debt—fixed rate
|
1.79%-5.25%
|
2015-2031
|
$
|
36
|
|
||||
|
Other American Water subsidiaries
(a)
|
Private activity bonds and government funded debt—fixed rate
|
0.00%-5.40%
|
2015-2041
|
61
|
|
|||||
|
Other American Water subsidiaries
|
Mandatorily redeemable preferred stock
|
8.49%-9.18%
|
2031-2036
|
4
|
|
|||||
|
Total retirements and redemptions
|
|
|
|
$
|
131
|
|
||||
|
(a)
|
Includes $2 million of non-cash redemptions resulting from the use of restricted funds.
|
From time to time and as market conditions warrant, we may engage in long-term debt retirements through tender offers, open market repurchases or other viable alternatives to strengthen our balance sheets.
In February 2015, our Board of Directors authorized an anti-dilutive, common stock repurchase program to mitigate the effect of shares issued through our dividend reinvestment, employee stock purchase and executive compensation activities. The program allows the Company to purchase up to
10 million
shares of its outstanding common stock, over an unrestricted period of time, in the open market or through privately negotiated transactions. The program is conducted in accordance with Rule 10b-18 of the Exchange Act, and to facilitate the repurchases, we have also entered into Rule 10b5-1 share repurchase plans with a third-party broker, which allows us to repurchase shares at times when we may otherwise be prevented from doing so under insider trading laws or because of self-imposed trading blackout periods. Subject to applicable regulations, we may elect to amend or cancel this repurchase program or the share repurchase parameters at our discretion. As of
December 31, 2017
, we have repurchased an aggregate of
3,950,000
shares of common stock under this program.
64
We have an unsecured revolving credit facility of
$1.75 billion
that expires in June 2020. In March 2016, and under the terms of the revolving credit agreement dated June 30, 2015, AWCC exercised its right to increase its borrowing capacity available under our revolving credit facility from the aggregate maximum of $1.25 billion, to
$1.75 billion
. All other terms, conditions and covenants with respect to the existing facility remained unchanged. On June 30, 2015, AWCC and its lenders extended the termination date of the revolving credit facility from October 2018, to June 2020. This amended and restated agreement also allowed AWCC to request to extend further the term of the credit facility for up to two one-year periods. An extension request must satisfy certain conditions and receive approval of the lenders, as set forth in the revolving credit agreement.
Interest rates on advances under the facility are based on a credit spread to the Eurodollar rate or base rate in accordance with AWCC’s then-applicable Moody Investors Service or Standard & Poor’s Ratings Services credit rating. At current ratings, that spread would be 0.90%. The facility is used principally to support AWCC’s commercial paper program and to provide up to
$150 million
in letters of credit. Indebtedness under the facility is considered “debt” for purposes of a support agreement between the Company and AWCC, which serves as a functional equivalent of a guarantee by the Company of AWCC’s payment obligations under the credit facility.
AWCC also has an outstanding commercial paper program that is backed by the revolving credit facility, the maximum aggregate outstanding amount of which was increased on March 22, 2016, from $1.0 billion to
$1.6 billion
.
Keystone has its own line of credit facility with a maximum availability of up to
$12 million
, the actual amount of which is determined pursuant to a collateral base calculation. Borrowings under this facility are payable upon demand with interest being paid monthly. Interest accrues each day at a rate per annum equal to 2.75% above the greater of the one month or one day LIBOR. The borrowing base under the facility allows for financing up to the greater of the note or 80% of eligible accounts receivable. Based on the collateral assets at December 31, 2017,
$7 million
was available to borrow. At
December 31, 2017
, there were
no
outstanding borrowings.
The following table summarizes information regarding the Company’s aggregate credit facility commitments, letter of credit sub-limits and available funds under those revolving credit facilities, as well as outstanding amounts of commercial paper and outstanding borrowings under the respective facilities as of
December 31, 2017
and
2016
:
|
(Dollars in millions)
|
Credit Facility
Commitment |
Available Credit
Facility Capacity |
Letter of Credit
Sublimit |
Available Letter of
Credit Capacity |
Commercial
Paper Limit |
Available Commercial
Paper Capacity |
|||||||||||||||||
|
December 31, 2017
|
$
|
1,762
|
|
$
|
1,673
|
|
$
|
150
|
|
$
|
66
|
|
$
|
1,600
|
|
$
|
695
|
|
|||||
|
December 31, 2016
|
1,766
|
|
1,668
|
|
150
|
|
62
|
|
1,600
|
|
751
|
|
|||||||||||
The weighted-average interest rate on AWCC short-term borrowings for the years ended
December 31, 2017
and
2016
was approximately
1.24%
and
0.78%
, respectively.
Capital Structure
The following table indicates the percentage of our capitalization represented by the components of our capital structure as of December 31:
|
|
2017
|
2016
|
2015
|
|||||
|
Total common stockholders' equity
|
41.0
|
%
|
42.1
|
%
|
43.5
|
%
|
||
|
Long-term debt and redeemable preferred stock at redemption value
|
49.6
|
%
|
46.4
|
%
|
50.6
|
%
|
||
|
Short-term debt and current portion of long-term debt
|
9.4
|
%
|
11.5
|
%
|
5.9
|
%
|
||
|
Total
|
100
|
%
|
100
|
%
|
100
|
%
|
||
The changes in the capital structure between periods were mainly attributable to an increase in the current portion of long-term debt.
Debt Covenants
Our debt agreements contain financial and non-financial covenants. To the extent that we are not in compliance with these covenants, an event of default may occur under one or more debt agreements and we or our subsidiaries may be restricted in our ability to pay dividends, issue new debt or access our revolving credit facility. Our long-term debt indentures contain a number of covenants that, among other things, prohibit or restrict the Company from issuing debt secured by the Company’s assets, subject to certain exceptions. Our failure to comply with any of these covenants could accelerate repayment obligations.
65
Covenants in certain long-term notes and the revolving credit facility require us to maintain a ratio of consolidated debt to consolidated capitalization (as defined in the relevant documents) of not more than 0.70 to 1.00. On
December 31, 2017
, our ratio was
0.59
to 1.00 and therefore we were in compliance with the covenants.
Security Ratings
Our access to the capital markets, including the commercial paper market, and respective financing costs in those markets, may be directly affected by our securities ratings. We primarily access the debt capital markets, including the commercial paper market, through AWCC. However, we have also issued debt through our regulated subsidiaries, primarily in the form of tax exempt securities or borrowings under state revolving funds, to lower our overall cost of debt.
The following table presents our long-term and short-term credit rating and rating outlook as of
February 20, 2018
:
|
Securities
|
Moody’s Investors Service
|
Standard & Poor’s Ratings Service
|
|
|
Rating Outlook
|
Negative
|
Stable
|
|
|
Senior unsecured debt
|
A3
|
A
|
|
|
Commercial paper
|
P-2
|
A-1
|
|
On January 19, 2018, Moody’s Investors Service changed the rating outlooks to negative, from stable, for 24 regulated utilities and utility holding companies, including the Company, all of which were primarily impacted by enactment of the TCJA. A security rating is not a recommendation to buy, sell or hold securities and may be subject to revision or withdrawal at any time by the assigning rating agency, and each rating should be evaluated independently of any other rating. Security ratings are highly dependent upon our ability to generate cash flows in an amount sufficient to service our debt and meet our investment plans. We can provide no assurances that our ability to generate cash flows is sufficient to maintain our existing ratings. None of our borrowings are subject to default or prepayment as a result of the downgrading of these security ratings, although such a downgrading could increase fees and interest charges under our credit facility.
As part of the normal course of business, we routinely enter into contracts for the purchase and sale of water, energy, chemicals and other services. These contracts either contain express provisions or otherwise permit us and our counterparties to demand adequate assurance of future performance when there are reasonable grounds for doing so. In accordance with the contracts and applicable contract law, if we are downgraded by a credit rating agency, especially if such downgrade is to a level below investment grade, it is possible that a counterparty would attempt to rely on such a downgrade as a basis for making a demand for adequate assurance of future performance, which could include a demand that we provide collateral to secure our obligations. We do not expect to post any collateral which will have a material adverse impact on the Company’s results of operations, financial position or cash flows.
Dividends
Our Board of Directors authorizes the payment of dividends. Our ability to pay dividends on our common stock is subject to having access to sufficient sources of liquidity, the net income and cash flows of our subsidiaries, the receipt of dividends and repayments of indebtedness from our subsidiaries, compliance with Delaware corporate and other laws, compliance with the contractual provisions of debt and other agreements, and other factors. The Company’s dividend rate on its common stock is determined by the Board of Directors on a quarterly basis and takes into consideration, among other factors, current and possible future developments that may affect the Company’s income and cash flows. Historically, dividends have been paid quarterly to holders of record less than 30 days prior to the distribution date. Since the dividends on our common stock are not cumulative, only declared dividends are paid.
During
2017
,
2016
and
2015
, we paid
$289 million
,
$261 million
and
$239 million
in cash dividends, respectively. The following table summarizes the per share cash dividends paid for the years ended
December 31, 2017
,
2016
and
2015
:
|
2017
|
2016
|
2015
|
|||||||||
|
December
|
$
|
0.415
|
|
$
|
0.375
|
|
$
|
0.34
|
|
||
|
September
|
$
|
0.415
|
|
$
|
0.375
|
|
$
|
0.34
|
|
||
|
June
|
$
|
0.415
|
|
$
|
0.375
|
|
$
|
0.34
|
|
||
|
March
|
$
|
0.375
|
|
$
|
0.34
|
|
$
|
0.31
|
|
||
On
December 8, 2017
, our Board of Directors declared a quarterly cash dividend payment of
$0.415
per share payable on
March 1, 2018
, to stockholders of record as of
February 7, 2018
.
66
Regulatory Restrictions
The issuance by the Company or AWCC of long-term debt or equity securities does not require authorization of any state PUC if no guarantee or pledge of the regulated subsidiaries is utilized. However, state PUC authorization is required to issue long-term debt at most of our regulated subsidiaries. Our regulated subsidiaries normally obtain the required approvals on a periodic basis to cover their anticipated financing needs for a period of time or in connection with a specific financing.
Under applicable law, our subsidiaries can pay dividends only from retained, undistributed or current earnings. A significant loss recorded at a subsidiary may limit the dividends that the subsidiary can distribute to us. Furthermore, the ability of our subsidiaries to pay upstream dividends or repay indebtedness to American Water is subject to compliance with applicable regulatory restrictions and financial obligations, including, for example, debt service and preferred and preference stock dividends, as well as applicable corporate, tax and other laws and regulations, and other agreements or covenants made or entered into by American Water and its subsidiaries.
Insurance Coverage
We carry various property, casualty and financial insurance policies with limits, deductibles and exclusions that we believe are consistent with industry standards. However, insurance coverage may not be adequate or available to cover unanticipated losses or claims. Additionally, annual policy renewals can be impacted by claims experience which in turn can impact coverage terms and conditions on a going forward basis. We are self-insured to the extent that losses are within the policy deductible or exceed the amount of insurance maintained. Such losses could have a material adverse effect on our short-term and long-term financial condition and our results of operations and cash flows.
Contractual Obligations and Commitments
We enter into contractual obligations with third parties in the ordinary course of business. Information related to our contractual obligations as of
December 31, 2017
is summarized in the table below:
|
Contractual obligation (In millions)
|
Total
|
1 year or Less
|
2-3 Years
|
4-5 years
|
More Than
5 years |
|||||||||||||||
|
Long-term debt obligations
(a)
|
$
|
6,814
|
|
$
|
320
|
|
$
|
218
|
|
$
|
420
|
|
$
|
5,856
|
|
|||||
|
Interest on long-term debt
(b)
|
5,047
|
|
324
|
|
600
|
|
571
|
|
3,552
|
|
||||||||||
|
Operating lease obligations
(c)
|
123
|
|
15
|
|
26
|
|
17
|
|
65
|
|
||||||||||
|
Purchase water obligations
(d)
|
979
|
|
59
|
|
130
|
|
129
|
|
661
|
|
||||||||||
|
Other purchase obligations
(e)
|
235
|
|
235
|
|
—
|
|
—
|
|
—
|
|
||||||||||
|
Postretirement benefit plans' obligations
(f)
|
3
|
|
—
|
|
3
|
|
—
|
|
—
|
|
||||||||||
|
Pension plan obligations
(f)
|
239
|
|
39
|
|
91
|
|
109
|
|
—
|
|
||||||||||
|
Preferred stocks with mandatory redemption requirements
|
10
|
|
2
|
|
3
|
|
2
|
|
3
|
|
||||||||||
|
Interest on preferred stock with mandatory redemption requirements
|
5
|
|
1
|
|
1
|
|
1
|
|
2
|
|
||||||||||
|
Other obligations
(g)
|
1,113
|
|
430
|
|
213
|
|
154
|
|
316
|
|
||||||||||
|
Total
|
$
|
14,568
|
|
$
|
1,425
|
|
$
|
1,285
|
|
$
|
1,403
|
|
$
|
10,455
|
|
|||||
Note: The above table reflects only financial obligations and commitments. Therefore, performance obligations associated with our
Market-Based Businesses
are not included in the above amounts. Also, uncertain tax positions of
$106 million
are not reflected in this table as we cannot predict when open tax years will close with completed examinations. See
Note 13—Income Taxes
in the Notes to the Consolidated Financial Statements.
|
(a)
|
Represents sinking fund obligations, debt maturities and capital lease obligations.
|
|
(b)
|
Represents expected interest payments on outstanding long-term debt. Amounts reported may differ from actual due to future financing of debt.
|
|
(c)
|
Represents future minimum payments under non-cancelable operating leases, primarily for the lease of motor vehicles, buildings, land and other equipment including water facilities and systems constructed by partners under the Public-Private Partnerships described below.
|
|
(d)
|
Represents future payments under water purchase agreements for minimum quantities of water.
|
|
(e)
|
Represents the open purchase orders as of
December 31, 2017
for goods and services purchased in the ordinary course of business.
|
|
(f)
|
Represents contributions expected to be made to pension and postretirement benefit plans for the years
2018
through
2022
.
|
|
(g)
|
Includes an estimate of advances for construction to be refunded, capital expenditures estimated to be required under legal and binding contractual obligations, contracts entered into for energy purchases, a liability associated with a conservation agreement and service agreements.
|
67
Public-Private Partnerships
WVAWC has entered into a series of agreements with various public entities, which we refer to as the Partners, to establish certain joint ventures, commonly referred to as “public-private partnerships.” Under the public-private partnerships, WVAWC constructed utility plant, financed by WVAWC, and the Partners constructed utility plant (connected to WVAWC’s property), financed by the Partners. WVAWC agreed to transfer and convey some of its real and personal property to the Partners in exchange for an equal principal amount of Industrial Development Bonds, commonly referred to as IDBs, issued by the Partners under a state Industrial Development Bond and Commercial Development Act. WVAWC leased back the total facilities, including portions funded by both WVAWC and the Partners, under leases for a period of 40 years.
The leases have payments that approximate the payments required by the terms of the IDBs. These payments are considered “PILOT payments” which represent payments that WVAWC otherwise would pay as property taxes on the properties. We have presented the transaction on a net basis in the Consolidated Financial Statements. The carrying value of the transferred facilities, which is presented in property, plant and equipment in the Consolidated Balance Sheets, was approximately
$150 million
as of
December 31, 2017
.
Performance Obligations
We have entered into agreements for the provision of services to water and wastewater facilities for the United States military, municipalities and other customers. These military services agreements expire between 2051 and 2068 and have remaining performance commitments as measured by estimated remaining contract revenues of
$3.6 billion
as of
December 31, 2017
. The operations and maintenance agreements with municipalities and other customers expire between 2018 and 2038 and have remaining performance commitments as measured by estimated remaining contract revenue of
$711 million
as of
December 31, 2017
. Some of the Company’s long-term contracts to operate and maintain a municipality’s, federal government’s or other party’s water or wastewater treatment and delivery facilities include responsibility for certain major maintenance for some of the facilities, in exchange for an annual fee.
Critical Accounting Policies and Estimates
The preparation of financial statements in conformity with GAAP requires that management apply accounting policies and make estimates, assumptions and judgments that could significantly affect a company’s financial condition, results of operations and cash flows. Management believes that the areas described below require significant judgment in the application of accounting policy or in making estimates and assumptions in matters that are inherently uncertain and that may change in subsequent periods. Accordingly, changes in the estimates, assumptions and judgments applied to these accounting policies could have a significant impact on our financial condition, results of operations and cash flows, as reflected in our Consolidated Financial Statements. Management has reviewed the critical accounting polices described below with our audit committee, including the estimates, assumptions and judgments used in their application. Additional discussion regarding these critical accounting policies and their application can be found in
Note 2—Significant Accounting Policies
in the Notes to the Consolidated Financial Statements for additional information.
Rate Regulation and Regulatory Accounting
Our regulated utilities are subject to economic regulation by PUCs and, as such, we follow the authoritative accounting principles required for rate regulated utilities, which requires us to reflect the effects of rate regulation in our Consolidated Financial Statements. Use of this authoritative guidance is applicable to utility operations that meet the following criteria: (i) third-party regulation of rates; (ii) cost-based rates; and (iii) a reasonable assumption that rates will be set to recover the estimated costs of providing service, plus a return on net investment, or rate base. As of
December 31, 2017
, we concluded that the operations of our utilities met the criteria.
Application of this authoritative guidance has a further effect on our financial statements as it pertains to allowable costs used in the ratemaking process. We make significant assumptions and estimates to quantify amounts recorded as regulatory assets and liabilities. Such judgments include, but are not limited to, assets and liabilities related to regulated acquisitions, pension and postretirement benefits, depreciation rates and taxes. Due to timing and other differences in the collection of revenues, these authoritative accounting principles allow a cost that would otherwise be charged as an expense by an non-regulated entity, to be deferred as a regulatory asset if it is probable that such cost is recoverable through future rates. Conversely, the principles require the creation of a regulatory liability for amounts collected in rates to recover costs expected to be incurred in the future, or amounts collected in excess of costs incurred and are refundable to customers. Regulators may also impose certain fines or penalties.
68
For each regulatory jurisdiction where we conduct business, we assess, at the end of each reporting period, whether the regulatory assets and liabilities continue to meet the criteria for probable, future recovery or settlement. This assessment includes consideration of factors such as changes in applicable regulatory environments; recent rate orders on recovery of a specific or similar incurred cost to other regulated entities in the same jurisdiction and the status of any pending or potential legislation that could impact the ability to recover costs through regulated rates. If subsequent events indicate that the regulatory assets or liabilities no longer meet the criteria for probable, future recovery or settlement, our Consolidated Statements of Operations and financial position could be materially affected. In addition, if we conclude in a future period that a separable portion of the business no longer meets the criteria, we are required to eliminate the financial statement effects of regulation for that part of the business, which would include the elimination of any or all regulatory assets and liabilities that had been recorded in the Consolidated Financial Statements. Failure to meet the criteria of this authoritative guidance could materially impact our Consolidated Financial Statements.
On
December 22, 2017
, the TCJA was signed into law, which, among other things, enacted significant and complex changes to the Internal Revenue Code of 1986, including a reduction in the maximum U.S. federal corporate income tax rate from
35%
to
21%
as of January 1, 2018. The TCJA created significant excess deferred income taxes that the Company and its regulatory jurisdictions believe should be refunded to customers. As such, we recorded these amounts as regulatory liabilities. The PUCs in our regulatory jurisdictions have opened formal proceedings related to the TCJA and we have begun working with our regulators on options to provide the income tax savings to our customers, and to address customer rate impacts and cash flow impacts for the Company. The outcome of these proceedings will likely take some time and could vary by regulatory jurisdiction.
As of
December 31, 2017
and
2016
, our regulatory asset balance was
$1.1 billion
and
$1.3 billion
, respectively, and our regulatory liability balance was
$1.7 billion
and
$403 million
, respectively. See
Note 6—Regulatory Assets and Liabilities
in the Notes to Consolidated Financial Statements for further information regarding our significant regulatory assets and liabilities.
Goodwill
As of
December 31, 2017
and
2016
, our goodwill balance was
$1.4 billion
and
$1.3 billion
, respectively. Under GAAP, goodwill must be allocated at the reporting unit level, which is defined as an operating segment or one level below, and evaluated for impairment minimally, once a year. We perform an annual review for impairment of goodwill as of
November 30
of each year, or more frequently if we determine that changes in circumstances or a triggering event that would more likely than not, reduce the fair value of a reporting unit below its carrying value, has occurred. Adverse industry or economic trends, lower projections of profitability, or a sustained decline in our market capitalization, among other things, may be indicators of potential goodwill impairment issues, requiring the testing of the carrying value for recoverability.
Entities evaluating goodwill for impairment have the option of first performing a qualitative assessment to determine whether a quantitative assessment is necessary. In performing a qualitative assessment, we assess and makes judgments, among other things, around macroeconomic conditions, industry and market conditions, overall financial performance, cost factors and entity specific events. These factors require significant judgment and estimates, and application of alternative assumptions could produce significantly different results. If it is determined, based upon qualitative factors, that the fair value of a reporting unit is more likely than not, greater than its carrying value, no further testing is required. If an entity bypasses the qualitative assessment, or performs the qualitative assessment but determines that the fair value of a reporting unit is more likely than not, less than its carrying value, a two-step, quantitative fair value assessment is performed.
The first step of a quantitative assessment compares the estimated fair value of the reporting unit to its respective net carrying value, including goodwill, on the measurement date. If the estimated fair value of the reporting unit is less than such reporting unit’s carrying value, then the second step of the quantitative assessment is performed to measure the amount of the impairment loss, if any, for such reporting unit.
The second step of a quantitative assessment requires an allocation of fair value to the individual assets and liabilities of the reporting unit, using purchase price allocation accounting guidance in order to determine the implied fair value of goodwill. If the implied fair value of goodwill is less than the carrying value for the reporting unit, an impairment loss is recorded as a reduction to goodwill and a charge to operating expense. Application of goodwill impairment testing requires significant management judgment, including the identification of reporting units and determining the fair value of the reporting unit. We estimate fair value using a combination of a discounted cash flow analysis and market multiples analysis. Significant assumptions used in these fair value analyses include, but are not limited to, forecasts of future operating results, discount and growth rates, capital expenditures, tax rates, working capital, weighted average cost of capital and projected terminal values.
Changes in estimates or the application of alternative assumptions could produce significantly different results.
69
At
November 30
,
2017
, we completed qualitative assessments for our Regulated Businesses, Military Services Group and Contract Operations Group reporting units, and determined that no qualitative factors were present that would indicate the estimated fair values of these reporting units were less than their respective carrying values. As such, we determined that the two-step, quantitative fair value assessment was not necessary for these reporting units as of
November 30
,
2017
.
At
November 30
,
2017
, we completed step one of the two-step, quantitative assessment for our Homeowner Services Group and Keystone reporting units, and concluded there were no impairments to their respective goodwill carry values. We used an income approach valuation technique which estimates discounted future cash flows from operations, which relies on a single scenario reflecting the best estimate of projected cash flows. The estimated fair value of the Homeowner Services Group reporting unit exceeded its carrying value by more than
156%
. The estimated fair value of the Keystone reporting unit exceeded its carrying value by approximately
11%
. If further decline in the fair value were to occur, the Keystone reporting unit would be at risk of failing step one of the two-step, quantitative assessment.
Additional discussion regarding our goodwill can be found in
Note 7—Goodwill and Other Intangible Assets
in the Notes to the Consolidated Financial Statements.
Impairment of Long-Lived Assets
Long-lived assets include land, buildings, equipment and long-term investments. Other than land and long-term investments, our long-lived assets are depreciated over their estimated useful lives and are reviewed for impairment whenever changes in circumstances indicate that their carrying value may not be recoverable. Such circumstances include, but are not limited to, a significant decrease in the market value of the long-lived asset, a change in the asset’s expected useful life or physical condition, a history of operating or cash flow losses associated with the use of the asset or a significant adverse change in the manner in which the asset is being used or is planned to be used. When such events or changes occur, we estimate the fair value of the long-lived asset from future cash flows expected to result from its use and, if applicable, the eventual disposition of the asset, and compare it to the carrying value of the asset. If the carrying value of the long-lived asset is greater than its fair value, an impairment loss is recognized equal to the amount by which carrying value exceeds fair value. Key variables that must be estimated include assumptions regarding sales volume, rates, operating costs, labor and other benefit costs, capital additions, assumed discount rates and other economic factors. These variables require significant management judgment and include inherent uncertainties, since they are forecasting future events. A variation in the assumptions used could lead to a different conclusion regarding the realizability of a long-lived asset and, thus, could have a significant effect on our Consolidated Financial Statements.
The long-lived assets of our regulated utilities are grouped on a separate entity basis for impairment testing, as they are integrated state-wide operations that do not have the option to curtail service and generally have uniform tariffs. A regulatory asset is charged to earnings if and when future recovery in rates of that asset is no longer probable. The fair values of our long-term investments are dependent on the financial performance and solvency of the entities in which we invest, as well as volatility inherent in the external markets, all of which are factors that we consider when assessing the potential impairment of these investments. If such long-term investments are considered impaired, an impairment loss is recognized equal to the amount by which the investment’s carrying value exceeds its fair value.
Revenue Recognition
Revenue for our regulated utilities is recognized as water and wastewater services are delivered to customers and includes amounts billed to customers on a cycle basis, and unbilled amounts which are based on estimated usage from the date of the meter reading associated with the latest customer bill, to the end of the accounting period. Increases or decreases in the volumes delivered to customers and rate mix due to changes in usage patterns in customer classes in the period could be significant to the calculation of unbilled revenue. In addition, changes in the timing of meter reading schedules and the number and type of customers scheduled for each meter reading date would also have an effect on the unbilled revenue calculation. Unbilled revenue for our regulated utilities as of
December 31, 2017
and
2016
was
$152 million
and
$161 million
, respectively.
Revenues of the
Market-Based Businesses
are recognized as services are rendered. For certain construction contracts, revenue is recognized over the contract term based on a calculated ratio that compares the costs incurred to date during the period to the total estimated costs for the entire contract. Losses on contracts are recognized during the period in which the loss first becomes probable and estimable. Revenues recognized during the period in excess of billings on construction contracts are recorded as unbilled revenue. Billings in excess of revenues recognized on construction contracts are recorded as other current liabilities on the balance sheet until the recognition criteria are met. Changes in contract performance and related estimated contract profitability may result in revisions to costs and revenues and are recognized in the period in which revisions are determined. Unbilled revenue for our
Market-Based Businesses
as of
December 31, 2017
and
2016
was
$60 million
and
$102 million
, respectively.
70
Accounting for Income Taxes
Significant management judgment is required in determining the provision for income taxes, primarily due to the uncertainty related to tax positions taken, as well as deferred tax assets and liabilities, valuation allowances and the utilization of net operating loss carryforwards.
In accordance with applicable authoritative guidance, we account for uncertain income tax positions using a benefit recognition model with a two-step approach, including a more-likely-than-not recognition threshold and a measurement approach based on the largest amount of tax benefit that is greater than 50% likely of being realized upon ultimate settlement. If it is not more-likely-than-not that the benefit of the tax position will be sustained on its technical merits, no benefit is recorded. Uncertain tax positions that relate only to timing of when an item is included on a tax return are considered to have met the recognition threshold. Management evaluates each position based solely on the technical merits and facts and circumstances of the position, assuming the position will be examined by a taxing authority having full knowledge of all relevant information. Significant judgment is required to determine whether the recognition threshold has been met and, if so, the appropriate amount of unrecognized tax benefit to be recorded in the Consolidated Financial Statements.
We evaluate the probability of realizing deferred tax assets quarterly by reviewing a forecast of future taxable income and our intent and ability to implement tax planning strategies, if necessary, to realize deferred tax assets. We also assess our ability to utilize tax attributes, including those in the form of carryforwards, for which the benefits have already been reflected in the financial statements. We record valuation allowances for deferred tax assets when we conclude it is more-likely-than-not such benefit will not be realized in future periods.
Under GAAP, specifically Accounting Standards Codification (“ASC”) Topic 740, Income Taxes the tax effects of changes in tax laws must be recognized in the period in which the law is enacted. ASC 740 also requires deferred tax assets and liabilities to be measured at the enacted tax rate expected to apply when temporary differences are to be realized or settled. Thus, at the date of enactment, the Company’s deferred taxes were re-measured based upon the new tax rate. For our regulated entities, the change in deferred taxes are recorded as either an offset to a regulatory asset or liability and may be subject to refund to customers. For our unregulated operations, the change in deferred taxes are recorded as a non-cash re-measurement adjustment to earnings.
The staff of the SEC has recognized the complexity of reflecting the impacts of changes in tax law, more specifically the TCJA, and on December 22, 2017, issued guidance in Staff Accounting Bulletin 118 (“SAB 118”) which clarifies accounting for income taxes under ASC 740 if information is not yet available or complete and provides for up to a one year period in which to complete the required analyses and accounting. SAB 118 describes three scenarios or buckets associated with a company’s status of accounting for the TCJA:(1) a company is complete with its accounting for certain effects of tax reform, (2) a company is able to determine a reasonable estimate for certain effects of tax reform and records that estimate as a provisional amount, or (3) a company is not able to determine a reasonable estimate and therefore continues to apply ASC 740, based on the provisions of the tax laws that were in effect immediately prior to the TCJA being enacted. The significant assumptions considered and evaluated by the Company relating to our accounting for the TCJA, include, but are not limited to, the:
|
•
|
recording of regulatory liabilities from the re-measurement of the Company’s deferred income taxes, and the uncertainty of regulatory treatment in our various jurisdictions in which the Company currently operates;
|
|
•
|
allocation of interest deductibility at the parent to our subsidiaries;
|
|
•
|
bonus depreciation deductions for assets constructed and placed in service during the period September 28, 2017 through December 31, 2017; and
|
|
•
|
normalization periods for our re-measured deferred taxes.
|
Actual income taxes could vary from estimated amounts due to the future impacts of various items, including changes in income tax laws, our forecasted financial condition and results of operations, failure to successfully implement tax planning strategies, recovery of taxes through the regulatory process for our
Regulated Businesses
, as well as results of audits and examinations of filed tax returns by taxing authorities. While we believe the resulting tax balances as of
December 31, 2017
and
2016
are appropriately accounted for in accordance with the applicable authoritative guidance, the ultimate outcome of tax matters could result in favorable or unfavorable adjustments to our Consolidated Financial Statements and such adjustments could be material. See
Note 13—Income Taxes
in the Notes to Consolidated Financial Statements for additional information regarding income taxes.
Accounting for Pension and Postretirement Benefits
We maintain noncontributory defined benefit pension plans covering eligible employees of our regulated utility and shared service operations. See
Note 14—Employee Benefits
in the Notes to Consolidated Financial Statements for further information regarding the description of and accounting for the defined benefit pension plans and postretirement benefit plans.
71
The Company’s pension and postretirement benefit costs are developed from actuarial valuations. Inherent in these valuations are key assumptions provided by the Company to its actuaries, including the discount rate and expected long-term rate of return on plan assets. Material changes in the Company’s pension and postretirement benefit costs may occur in the future due to changes in these assumptions as well as fluctuations in plan assets. The assumptions are selected to represent the average expected experience over time and may differ in any one year from actual experience due to changes in capital markets and the overall economy. These differences will impact the amount of pension and other postretirement benefit expense that the Company recognizes. The primary assumptions are:
|
•
|
Discount Rate—The discount rate is used in calculating the present value of benefits, which are based on projections of benefit payments to be made in the future. The objective in selecting the discount rate is to measure the single amount that, if invested at the measurement date in a portfolio of high-quality debt instruments, would provide the necessary future cash flows to pay the accumulated benefits when due;
|
|
•
|
Expected Return on Plan Assets (“EROA”)—Management projects the future return on plan assets considering prior performance, but primarily based upon the plans’ mix of assets and expectations for the long-term returns on those asset classes. These projected returns reduce the net benefit costs we record currently;
|
|
•
|
Rate of Compensation Increase—Management projects employees’ pay increases, which are used to project employees’ pension benefits at retirement;
|
|
•
|
Health Care Cost Trend Rate—Management projects the expected increases in the cost of health care; and
|
|
•
|
Mortality—Management retained the Society of Actuaries RP-2014 mortality table but adopted the new MP-2017 generational projection scale to project mortality improvements after 2006.
|
The discount rate assumption, which is determined for the pension and postretirement benefit plans independently, is subject to change each year, consistent with changes in applicable high-quality, long-term corporate bond indices. We use an approach that approximates the process of settlement of obligations tailored to the plans’ expected cash flows by matching the plans’ cash flows to the coupons and expected maturity values of individually selected bonds. The yield curve was developed for a portfolio containing the majority of United States-issued AA-graded non-callable (or callable with make-whole provisions) corporate bonds. For each plan, the discount rate was developed as the level equivalent rate that would yield the same present value as using spot rates aligned with the projected benefit payments. The discount rate for determining pension benefit obligations was
3.75%
,
4.28%
and
4.66%
at
December 31, 2017
,
2016
and
2015
, respectively. The discount rate for determining other post-retirement benefit obligations was
3.73%
,
4.26%
and
4.67%
at
December 31, 2017
,
2016
and
2015
, respectively.
In selecting an EROA, we considered tax implications, past performance and economic forecasts for the types of investments held by the plans. The long-term EROA assumption used in calculating pension cost was
6.49%
for
2017
,
7.02%
for
2016
, and
6.91%
for
2015
. The weighted average EROA assumption used in calculating other postretirement benefit costs was
5.09%
for
2017
,
5.37%
for
2016
and
4.92%
for
2015
.
The asset allocations for the Company’s U.S. pension plan by asset category were as follows:
|
|
Target
Allocation
|
Percentage of Plan Assets
as of December 31,
|
|||||||
|
Asset Category
|
2018
|
2017
|
2016
|
||||||
|
Equity securities
|
43
|
%
|
44
|
%
|
49
|
%
|
|||
|
Fixed income
|
50
|
%
|
49
|
%
|
42
|
%
|
|||
|
Real Estate
|
5
|
%
|
5
|
%
|
7
|
%
|
|||
|
Real estate investment trusts (“REITs”)
|
2
|
%
|
2
|
%
|
2
|
%
|
|||
|
Total
|
100
|
%
|
100
|
%
|
100
|
%
|
|||
During 2017, the Company reduced the risk of its investments in the pension plan by reducing its exposure to equities from 60% to 50%, and increasing its long duration fixed-income allocation from 40% to 50%. This new structure is designed to reduce the plan’s funded status volatility. It is also intended to reduce the pension plan’s exposure to interest rates since a higher proportion of long duration fixed-income securities that have a duration similar to that of the pension liabilities should reduce interest rate risk associated with the plan’s liabilities.
72
The Company’s other postretirement benefit plans are partially funded. The asset allocations for the Company’s other postretirement benefit plans by asset category were as follows:
|
|
Target
Allocation
|
Percentage of Plan Assets
as of December 31,
|
|||||||
|
Asset Category
|
2018
|
2017
|
2016
|
||||||
|
Equity securities
|
38
|
%
|
35
|
%
|
33
|
%
|
|||
|
Fixed income
|
62
|
%
|
65
|
%
|
67
|
%
|
|||
|
REITs
|
—
|
|
—
|
|
—
|
|
|||
|
Total
|
100
|
%
|
100
|
%
|
100
|
%
|
|||
The Company’s target asset allocation, is evaluated periodically through asset liability studies. The studies consider projected cash flows of maturity liabilities, projected asset class returns and risks, correlations, and the Company’s risk tolerance. In 2017, the Company conducted new asset-liability studies for the Post-Retirement Plans and approved new asset allocations for both plans. The Post-Retirement Medical Bargaining plan increased its equity allocation from 20% to 30% due to rising medical claims and medical inflation and the long duration portion of the portfolio was reduced from 80% to 70%. The Post-Retirement Non-Bargaining Medical Plan’s allocation was adjusted to reduce volatility and interest rate risk in a manner similar to that described above with respect to the pension plan, reducing the equity allocation from 70% to 60% and increasing the fixed-income allocation from 30% to 40%. The Post-Retirement Medical Non-Bargaining plan’s equity allocation was reduced due to the cap on benefits for some non-union participants and the resultant reduction in the plan’s liabilities. These changes will be implemented in 2018.
The investments of the pension and postretirement welfare plan trusts include debt and equity securities held either directly or through commingled funds. The trustee for the Company’s defined benefit pension and postretirement welfare plans uses an independent valuation firm to calculate the fair value of plan assets. Additionally, the Company independently verifies the assets values. Approximately
41%
of the assets are valued using the quoted market price for the assets in an active market at the measurement date, while
59%
of the assets are valued using other inputs.
In selecting a rate of compensation increase, we consider past experience in light of movements in inflation rates. Our rate of compensation increase was
3.02%
for
2017
,
3.07%
for
2016
and
3.10%
for
2015
.
In selecting health care cost trend rates, we consider past performance and forecasts of increases in health care costs. As of January 1, 2017, our health care cost trend rate assumption used to calculate the periodic cost was
7%
in
2017
gradually declining to
5%
in
2021
and thereafter. As of December 31, 2017, the Company is projecting that medical inflation will continue to persist for longer than expected and, it will ultimately trend down to 4.50%, but not until 2026.
Assumed health care cost trend rates have a significant effect on the amounts reported for the other postretirement benefit plans. The health care cost trend rate is based on historical rates and expected market conditions. A one-percentage-point change in assumed health care cost trend rates would have the following effects:
|
Change in Actuarial Assumption (Dollars in millions)
|
Impact on Other
Postretirement Benefit Obligation as of December 31, 2017 |
Impact on 2017
Total Service and Interest Cost Components |
||||||
|
Increase assumed health care cost trend by 1%
|
$
|
73
|
|
$
|
5
|
|
||
|
Decrease assumed health care cost trend by 1%
|
$
|
(60
|
)
|
$
|
(4
|
)
|
||
We will use a discount rate and EROA of
3.75%
and
5.95%
, respectively, for estimating our
2018
pension costs. Additionally, we will use a discount rate and expected blended return based on weighted assets of
3.73%
and
4.77%
, respectively, for estimating our
2018
other postretirement benefit costs. A decrease in the discount rate or the EROA would increase our pension expense. Our
2017
and
2016
pension and postretirement benefit costs were
$56 million
and
$54 million
, respectively. The Company expects to make pension and postretirement benefit contributions to the plan trusts up to
$45 million
in
2018
, and
$47 million
,
$47 million
,
$51 million
and
$58 million
in
2019
,
2020
,
2021
and
2022
, respectively. Actual amounts contributed could change significantly from these estimates. The assumptions are reviewed annually and at any interim re-measurement of the plan obligations. The impact of assumption changes is reflected in the recorded pension and postretirement benefit amounts as they occur, or over a period of time if allowed under applicable accounting standards. As these assumptions change from period to period, recorded pension and postretirement benefit amounts and funding requirements could also change.
73
Accounting for Contingencies
We record loss contingencies when management determines that the outcome of future events is probable of occurring and when the amount of the loss or a range of losses can be reasonably estimated. The determination of a loss contingency is based on management judgment and estimates about the likely outcome of the matter, which may include an analysis of different scenarios. Liabilities are recorded or adjusted when events or circumstances cause these judgments or estimates to change. In assessing whether a loss is reasonably possible, management considers many factors, which include, but are not limed to: the nature of the litigation, claim or assessment, review of applicable law, opinions or views of legal counsel and other advisors, and the experience gained from similar cases or situations. We provide disclosures for material contingencies when management deems there is a reasonable possibility that a loss or an additional loss may be incurred. We provide estimates of reasonably possible losses when such estimates may be reasonably determined, either as a single amount or within a reasonable range.
Actual amounts realized upon settlement of contingencies may be different than amounts recorded and disclosed and could have a significant impact on the liabilities, revenue and expenses recorded on the Consolidated Financial Statements. For a discussion of contingencies, see
Note 15—Commitments and Contingencies
in the Notes to Consolidated Financial Statements.
New Accounting Standards
See
Note 2—Significant Accounting Policies
in the Notes to Consolidated Financial Statements for a description of recent accounting standards.
|
ITEM 7A.
|
QUANTITATIVE AND QUALITATIVE DISCLOSURES ABOUT MARKET RISK
|
We are exposed to market risk associated with changes in commodity prices, equity prices and interest rates. We are exposed to risks from changes in interest rates as a result of our issuance of variable and fixed rate debt and commercial paper. We manage our interest rate exposure by limiting our variable rate exposure and by monitoring the effects of market changes in interest rates. We also have the ability to enter into financial derivative instruments, which could include instruments such as, but not limited to, interest rate swaps, forward starting swaps, swaptions and U.S. Treasury lock agreements to manage and mitigate interest rate risk exposure. As of
December 31, 2017
, a hypothetical increase of interest rates by
1%
associated with our short-term borrowings would result in an
$8 million
increase in short-term interest expense.
The Company has two forward starting swap agreements with an aggregate notional amount of $200 million to reduce interest rate exposure on debt expected to be issued in 2018. The forward starting swap agreements terminate in November 2018 and have an average fixed rate of
2.59%
. When entering into forward starting interest rate swaps, the Company is subject to market risk with respect to changes in the underlying benchmark interest rate that impacts the fair value of the forward starting interest rate swaps. We manage market risk by matching terms of the swaps with the critical terms of the expected debt issuance. The fair value of the forward starting swaps at December 31, 2017 was in a loss position of
$3 million
. A hypothetical
1%
adverse change in interest rates would result in a decrease in the fair value of our forward starting swaps of approximately
$32 million
at
December 31, 2017
.
Our risks associated with price increases for chemicals, electricity and other commodities are reduced through contractual arrangements and the expected ability to recover price increases through rates, in the next general rate case proceeding or other regulatory mechanism, as authorized by each regulatory jurisdiction. Non-performance by these commodity suppliers could have a material adverse impact on our results of operations, financial position and cash flows.
The market price of our common stock may experience fluctuations, which may be unrelated to our operating performance. In particular, our stock price may be affected by general market movements as well as developments specifically related to the water and wastewater industry. These could include, among other things, interest rate movements, quarterly variations or changes in financial estimates by securities analysts and governmental or regulatory actions. This volatility may make it difficult for us to access the capital markets in the future through additional offerings of our common stock, regardless of our financial performance, and such difficulty may preclude us from being able to take advantage of certain business opportunities or meet business obligations.
We are exposed to credit risk through our water, wastewater and other water-related services provided by our
Regulated Businesses
and
Market-Based Businesses
. Our
Regulated Businesses
serve residential, commercial, industrial and other customers while our
Market-Based Businesses
engage in business activities with developers, government entities and other customers. Our primary credit risk is exposure to customer default on contractual obligations and the associated loss that may be incurred due to the non-payment of customer accounts receivable balances. Our credit risk is managed through established credit and collection policies which are in compliance with applicable regulatory requirements and involve monitoring of customer exposure and the use of credit risk mitigation measures such as letters of credit or prepayment arrangements. Our credit portfolio is diversified with no significant customer or industry concentrations. In addition, our
Regulated Businesses
are generally able to recover all prudently incurred costs including uncollectible customer accounts receivable expenses and collection costs through rates.
74
The Company’s retirement trust assets are exposed to the market prices of debt and equity securities. Changes to the retirement trust asset values can impact the Company’s pension and other benefits expense, funded status and future minimum funding requirements. Changes in interest rates can impact retirement liabilities. We aim to reduce risk through asset diversification and by investing in long duration fixed-income securities that have a duration similar to that of our pension liabilities, seeking to hedge some of the interest rate sensitivity of our liabilities. That way, if interest rates fall and liabilities increase, we expect that the fixed-income assets in our retirement trust will also increase in value. We also expect our risk to be reduced through our ability to recover pension and other benefit costs through rates.
We are also exposed to a potential national economic recession or deterioration in local economic conditions in the markets in which we operate. The credit quality of our customer accounts receivable is dependent on the economy and the ability of our customers to manage through unfavorable economic cycles and other market changes. In addition, there can be no assurances that regulators will grant sufficient rate authorizations. Therefore, our ability to fully recover operating expense, recover our investment and provide an appropriate return on invested capital made in our
Regulated Businesses
may be adversely impacted.
75
|
ITEM 8.
|
FINANCIAL STATEMENTS AND SUPPLEMENTARY DATA
|
INDEX TO CONSOLIDATED FINANCIAL STATEMENTS
|
|
Page
|
|
Audited Consolidated Financial Statements
|
|
76
Report of Independent Registered Public Accounting Firm
To the Board of Directors and Stockholders of
American Water Works Company, Inc.
Opinions on the Financial Statements and Internal Control over Financial Reporting
We have audited the accompanying consolidated balance sheets of American Water Works Company, Inc. and its subsidiaries as of
December 31, 2017
and
2016
,
and the related consolidated statements of operations, of comprehensive income, of cash flows, and of changes in stockholders’ equity for each of the three years in the period ended
December 31, 2017
, including the related notes (collectively referred to as the “consolidated financial statements”).
We also have audited the Company's internal control over financial reporting as of
December 31, 2017
, based on criteria established in
Internal Control - Integrated Framework
(2013)
issued by the Committee of Sponsoring Organizations of the Treadway Commission (COSO).
In our opinion, the consolidated financial statements referred to above present fairly, in all material respects, the financial position of the Company as of
December 31, 2017
and
2016
,
and the results of their
operations and their cash flows for each of the three years in the period ended
December 31, 2017
in conformity with accounting principles generally accepted in the United States of America. Also in our opinion, the Company maintained, in all material respects, effective internal control over financial reporting as of
December 31, 2017
, based on criteria established in
Internal Control - Integrated Framework
(2013)
issued by the COSO.
Basis for Opinions
The Company's management is responsible for these consolidated financial statements, for maintaining effective internal control over financial reporting, and for its assessment of the effectiveness of internal control over financial reporting, included in Management's Report on Internal Control over Financial Reporting appearing under Item 9A.
Our responsibility is to express opinions on the Company’s consolidated financial statements and on the Company's internal control over financial reporting based on our audits. We are a public accounting firm registered with the Public Company Accounting Oversight Board (United States) ("PCAOB") and are required to be independent with respect to the Company in accordance with the U.S. federal securities laws and the applicable rules and regulations of the Securities and Exchange Commission and the PCAOB.
We conducted our audits in accordance with the standards of the PCAOB. Those standards require that we plan and perform the audits to obtain reasonable assurance about whether the consolidated financial statements are free of material misstatement, whether due to error or fraud, and whether effective internal control over financial reporting was maintained in all material respects.
Our audits of the consolidated financial statements included performing procedures to assess the risks of material misstatement of the consolidated
financial statements, whether due to error or fraud, and performing procedures that respond to those risks. Such procedures included examining, on a test basis, evidence regarding the amounts and disclosures in the consolidated financial statements. Our audits also included evaluating the accounting principles used and significant estimates made by management, as well as evaluating the overall presentation of the consolidated
financial statements. Our audit of internal control over financial reporting included obtaining an understanding of internal control over financial reporting, assessing the risk that a material weakness exists, and testing and evaluating the design and operating effectiveness of internal control based on the assessed risk. Our audits also included performing such other procedures as we considered necessary in the circumstances. We believe that our audits provide a reasonable basis for our opinions.
Definition and Limitations of Internal Control over Financial Reporting
A company’s internal control over financial reporting is a process designed to provide reasonable assurance regarding the reliability of financial reporting and the preparation of financial statements for external purposes in accordance with generally accepted accounting principles. A company’s internal control over financial reporting includes those policies and procedures that (i) pertain to the maintenance of records that, in reasonable detail, accurately and fairly reflect the transactions and dispositions of the assets of the company; (ii) provide reasonable assurance that transactions are recorded as necessary to permit preparation of financial statements in accordance with generally accepted accounting principles, and that receipts and expenditures of the company are being made only in accordance with authorizations of management and directors of the company; and (iii) provide reasonable assurance regarding prevention or timely detection of unauthorized acquisition, use, or disposition of the company’s assets that could have a material effect on the financial statements.
77
Because of its inherent limitations, internal control over financial reporting may not prevent or detect misstatements. Also, projections of any evaluation of effectiveness to future periods are subject to the risk that controls may become inadequate because of changes in conditions, or that the degree of compliance with the policies or procedures may deteriorate.
|
/s/ PricewaterhouseCoopers LLP
|
|
Philadelphia, Pennsylvania
|
|
February 20, 2018
|
We have served as the Company’s auditor since 1948.
78
American Water Works Company, Inc. and Subsidiary Companies
(In millions, except share and per share data)
|
December 31, 2017
|
December 31, 2016
|
||||||
|
ASSETS
|
|||||||
|
Property, plant and equipment
|
$
|
21,716
|
|
$
|
19,954
|
|
|
|
Accumulated depreciation
|
(5,470
|
)
|
(4,962
|
)
|
|||
|
Property, plant and equipment, net
|
16,246
|
|
14,992
|
|
|||
|
Current assets:
|
|
|
|||||
|
Cash and cash equivalents
|
55
|
|
75
|
|
|||
|
Restricted funds
|
27
|
|
20
|
|
|||
|
Accounts receivable, net
|
272
|
|
269
|
|
|||
|
Unbilled revenues
|
212
|
|
263
|
|
|||
|
Materials and supplies
|
41
|
|
39
|
|
|||
|
Other
|
113
|
|
118
|
|
|||
|
Total current assets
|
720
|
|
784
|
|
|||
|
Regulatory and other long-term assets:
|
|
|
|||||
|
Regulatory assets
|
1,061
|
|
1,289
|
|
|||
|
Goodwill
|
1,379
|
|
1,345
|
|
|||
|
Other
|
76
|
|
72
|
|
|||
|
Total regulatory and other long-term assets
|
2,516
|
|
2,706
|
|
|||
|
TOTAL ASSETS
|
$
|
19,482
|
|
$
|
18,482
|
|
|
The accompanying notes are an integral part of these Consolidated Financial Statements.
79
American Water Works Company, Inc. and Subsidiary Companies
Consolidated Balance Sheets
(In millions, except share and per share data)
|
December 31, 2017
|
December 31, 2016
|
||||||
|
CAPITALIZATION AND LIABILITIES
|
|||||||
|
Capitalization:
|
|
|
|||||
|
Common stock ($0.01 par value, 500,000,000 shares authorized, 182,508,564 and 181,798,555 shares issued, respectively)
|
$
|
2
|
|
$
|
2
|
|
|
|
Paid-in-capital
|
6,432
|
|
6,388
|
|
|||
|
Accumulated deficit
|
(723
|
)
|
(873
|
)
|
|||
|
Accumulated other comprehensive loss
|
(79
|
)
|
(86
|
)
|
|||
|
Treasury stock, at cost (4,064,010 and 3,701,867 shares, respectively)
|
(247
|
)
|
(213
|
)
|
|||
|
Total common stockholders' equity
|
5,385
|
|
5,218
|
|
|||
|
Long-term debt
|
6,490
|
|
5,749
|
|
|||
|
Redeemable preferred stock at redemption value
|
8
|
|
10
|
|
|||
|
Total long-term debt
|
6,498
|
|
5,759
|
|
|||
|
Total capitalization
|
11,883
|
|
10,977
|
|
|||
|
Current liabilities:
|
|
|
|||||
|
Short-term debt
|
905
|
|
849
|
|
|||
|
Current portion of long-term debt
|
322
|
|
574
|
|
|||
|
Accounts payable
|
195
|
|
154
|
|
|||
|
Accrued liabilities
|
630
|
|
609
|
|
|||
|
Taxes accrued
|
33
|
|
31
|
|
|||
|
Interest accrued
|
73
|
|
63
|
|
|||
|
Other
|
167
|
|
112
|
|
|||
|
Total current liabilities
|
2,325
|
|
2,392
|
|
|||
|
Regulatory and other long-term liabilities:
|
|
|
|||||
|
Advances for construction
|
271
|
|
300
|
|
|||
|
Deferred income taxes, net
|
1,551
|
|
2,596
|
|
|||
|
Deferred investment tax credits
|
22
|
|
23
|
|
|||
|
Regulatory liabilities
|
1,664
|
|
403
|
|
|||
|
Accrued pension expense
|
384
|
|
419
|
|
|||
|
Accrued postretirement benefit expense
|
40
|
|
87
|
|
|||
|
Other
|
66
|
|
67
|
|
|||
|
Total regulatory and other long-term liabilities
|
3,998
|
|
3,895
|
|
|||
|
Contributions in aid of construction
|
1,276
|
|
1,218
|
|
|||
|
Commitments and contingencies (See Note 15)
|
|
|
|
|
|||
|
TOTAL CAPITALIZATION AND LIABILITIES
|
$
|
19,482
|
|
$
|
18,482
|
|
|
The accompanying notes are an integral part of these consolidated financial statements.
80
American Water Works Company, Inc. and Subsidiary Companies
(In millions, except per share data)
|
|
For the Years Ended December 31,
|
||||||||||
|
|
2017
|
2016
|
2015
|
||||||||
|
Operating revenues
|
$
|
3,357
|
|
$
|
3,302
|
|
$
|
3,159
|
|
||
|
Operating expenses:
|
|
|
|
||||||||
|
Operation and maintenance
|
1,378
|
|
1,504
|
|
1,404
|
|
|||||
|
Depreciation and amortization
|
492
|
|
470
|
|
440
|
|
|||||
|
General taxes
|
259
|
|
258
|
|
243
|
|
|||||
|
Gain on asset dispositions and purchases
|
(16
|
)
|
(10
|
)
|
(3
|
)
|
|||||
|
Total operating expenses, net
|
2,113
|
|
2,222
|
|
2,084
|
|
|||||
|
Operating income
|
1,244
|
|
1,080
|
|
1,075
|
|
|||||
|
Other income (expense):
|
|
|
|
||||||||
|
Interest, net
|
(342
|
)
|
(325
|
)
|
(308
|
)
|
|||||
|
Loss on early extinguishment of debt
|
(7
|
)
|
—
|
|
—
|
|
|||||
|
Other, net
|
17
|
|
15
|
|
15
|
|
|||||
|
Total other income (expense)
|
(332
|
)
|
(310
|
)
|
(293
|
)
|
|||||
|
Income before income taxes
|
912
|
|
770
|
|
782
|
|
|||||
|
Provision for income taxes
|
486
|
|
302
|
|
306
|
|
|||||
|
Net income attributable to common stockholders
|
$
|
426
|
|
$
|
468
|
|
$
|
476
|
|
||
|
Basic earnings per share:
(a)
|
|
|
|
||||||||
|
Net income attributable to common stockholders
|
$
|
2.39
|
|
$
|
2.63
|
|
$
|
2.66
|
|
||
|
Diluted earnings per share:
(a)
|
|
|
|
||||||||
|
Net income attributable to common stockholders
|
$
|
2.38
|
|
$
|
2.62
|
|
$
|
2.64
|
|
||
|
Weighted-average common shares outstanding:
|
|
|
|
||||||||
|
Basic
|
178
|
|
178
|
|
179
|
|
|||||
|
Diluted
|
179
|
|
179
|
|
180
|
|
|||||
|
Dividends declared per common share
|
$
|
1.66
|
|
$
|
1.50
|
|
$
|
1.36
|
|
||
|
(a) Amounts may not calculate due to rounding.
|
|
|
|
||||||||
The accompanying notes are an integral part of these Consolidated Financial Statements.
81
American Water Works Company, Inc. and Subsidiary Companies
Consolidated Statements of Comprehensive Income
(In millions)
|
|
For the Years Ended December 31,
|
||||||||||
|
|
2017
|
2016
|
2015
|
||||||||
|
Net income attributable to common stockholders
|
$
|
426
|
|
$
|
468
|
|
$
|
476
|
|
||
|
Other comprehensive income (loss), net of tax:
|
|
|
|
||||||||
|
Change in employee benefit plan funded status, net of tax of $2, $(14) and $(6) in 2017, 2016 and 2015, respectively
|
7
|
|
(21
|
)
|
(10
|
)
|
|||||
|
Pension amortized to periodic benefit cost:
|
|
|
|
||||||||
|
Actuarial loss, net of tax of $5, $4 and $3 in 2017, 2016 and 2015, respectively
|
7
|
|
6
|
|
5
|
|
|||||
|
Foreign currency translation adjustment
|
(1
|
)
|
—
|
|
(1
|
)
|
|||||
|
Unrealized (loss) gain on cash flow hedges, net of tax of $(4), $10 and $0 in 2017, 2016 and 2015, respectively
|
(6
|
)
|
17
|
|
—
|
|
|||||
|
Net other comprehensive income (loss)
|
7
|
|
2
|
|
(6
|
)
|
|||||
|
Comprehensive income attributable to common stockholders
|
$
|
433
|
|
$
|
470
|
|
$
|
470
|
|
||
The accompanying notes are an integral part of these Consolidated Financial Statements.
82
American Water Works Company, Inc. and Subsidiary Companies
(In millions)
|
|
For the Years Ended December 31,
|
||||||||||
|
|
2017
|
2016
|
2015
|
||||||||
|
CASH FLOWS FROM OPERATING ACTIVITIES
|
|
|
|
||||||||
|
Net income
|
$
|
426
|
|
$
|
468
|
|
$
|
476
|
|
||
|
Adjustments to reconcile to net cash flows provided by operating activities:
|
|
|
|
||||||||
|
Depreciation and amortization
|
492
|
|
470
|
|
440
|
|
|||||
|
Deferred income taxes and amortization of investment tax credits
|
462
|
|
295
|
|
312
|
|
|||||
|
Provision for losses on accounts receivable
|
29
|
|
27
|
|
32
|
|
|||||
|
Gain on asset dispositions and purchases
|
(16
|
)
|
(10
|
)
|
(3
|
)
|
|||||
|
Pension and non-pension postretirement benefits
|
57
|
|
54
|
|
61
|
|
|||||
|
Other non-cash, net
|
(54
|
)
|
(36
|
)
|
(53
|
)
|
|||||
|
Changes in assets and liabilities:
|
|
|
|
||||||||
|
Receivables and unbilled revenues
|
21
|
|
(31
|
)
|
(84
|
)
|
|||||
|
Pension and non-pension postretirement benefit contributions
|
(48
|
)
|
(53
|
)
|
(57
|
)
|
|||||
|
Accounts payable and accrued liabilities
|
38
|
|
60
|
|
80
|
|
|||||
|
Other assets and liabilities, net
|
64
|
|
(20
|
)
|
(9
|
)
|
|||||
|
Impact of Freedom Industries settlement activities
|
(22
|
)
|
65
|
|
—
|
|
|||||
|
Net cash provided by operating activities
|
1,449
|
|
1,289
|
|
1,195
|
|
|||||
|
CASH FLOWS FROM INVESTING ACTIVITIES
|
|
|
|
||||||||
|
Capital expenditures
|
(1,434
|
)
|
(1,311
|
)
|
(1,160
|
)
|
|||||
|
Acquisitions, net of cash acquired
|
(177
|
)
|
(204
|
)
|
(197
|
)
|
|||||
|
Proceeds from sale of assets and securities
|
15
|
|
9
|
|
5
|
|
|||||
|
Removal costs from property, plant and equipment retirements, net
|
(76
|
)
|
(84
|
)
|
(107
|
)
|
|||||
|
Net cash used in investing activities
|
(1,672
|
)
|
(1,590
|
)
|
(1,459
|
)
|
|||||
|
CASH FLOWS FROM FINANCING ACTIVITIES
|
|
|
|
||||||||
|
Proceeds from long-term debt
|
1,395
|
|
553
|
|
565
|
|
|||||
|
Repayments of long-term debt
|
(896
|
)
|
(144
|
)
|
(132
|
)
|
|||||
|
Proceeds from short-term borrowings with maturities greater than three months
|
—
|
|
—
|
|
60
|
|
|||||
|
Repayments of short-term borrowings with maturities greater than three months
|
—
|
|
—
|
|
(60
|
)
|
|||||
|
Net short-term borrowings with maturities less than three months
|
55
|
|
221
|
|
180
|
|
|||||
|
Proceeds from issuances of employee stock plans and
direct stock purchase plan
|
26
|
|
26
|
|
39
|
|
|||||
|
Advances and contributions for construction, net of refunds of $22, $31 and $23 in 2017, 2016 and 2015, respectively
|
28
|
|
16
|
|
26
|
|
|||||
|
Debt issuance costs
|
(13
|
)
|
(5
|
)
|
(7
|
)
|
|||||
|
Make-whole premium on early debt redemption
|
(34
|
)
|
—
|
|
—
|
|
|||||
|
Dividends paid
|
(289
|
)
|
(261
|
)
|
(239
|
)
|
|||||
|
Anti-dilutive share repurchases
|
(54
|
)
|
(65
|
)
|
(126
|
)
|
|||||
|
Taxes paid related to employee stock plans
|
(11
|
)
|
(13
|
)
|
(16
|
)
|
|||||
|
Net cash provided by (used in) financing activities
|
207
|
|
328
|
|
290
|
|
|||||
|
Net (decrease) increase in cash and cash equivalents and restricted funds
|
(16
|
)
|
27
|
|
26
|
|
|||||
|
Cash and cash equivalents and restricted funds at beginning of period
|
99
|
|
72
|
|
46
|
|
|||||
|
Cash and cash equivalents and restricted funds at end of period
|
$
|
83
|
|
$
|
99
|
|
$
|
72
|
|
||
|
Cash paid during the year for:
|
|
|
|
||||||||
|
Interest, net of capitalized amount
|
$
|
338
|
|
$
|
327
|
|
$
|
309
|
|
||
|
Income taxes, net of refunds of $0, $0 and $1 in 2017, 2016 and 2015, respectively
|
$
|
30
|
|
$
|
16
|
|
$
|
12
|
|
||
|
Non-cash investing activity:
|
|
|
|
||||||||
|
Capital expenditures acquired on account but unpaid as of year end
|
$
|
204
|
|
$
|
171
|
|
$
|
224
|
|
||
|
Acquisition financed by treasury stock
|
$
|
33
|
|
$
|
—
|
|
$
|
—
|
|
||
The accompanying notes are an integral part of these Consolidated Financial Statements.
83
American Water Works Company, Inc. and Subsidiary Companies
Consolidated Statements of Changes in Stockholders’ Equity
(In millions)
|
Common Stock
|
|
|
Accumulated Other Comprehensive Loss
|
Treasury Stock
|
Total Stockholders' Equity
|
|||||||||||||||||||||||||
|
|
Shares
|
Par Value
|
Paid-in Capital
|
Accumulated Deficit
|
Shares
|
At Cost
|
||||||||||||||||||||||||
|
Balance as of December 31, 2014
|
179.5
|
|
$
|
2
|
|
$
|
6,302
|
|
$
|
(1,296
|
)
|
$
|
(82
|
)
|
(0.2
|
)
|
$
|
(11
|
)
|
$
|
4,915
|
|
||||||||
|
Cumulative effect of change in accounting principle
|
—
|
|
—
|
|
—
|
|
(8
|
)
|
—
|
|
—
|
|
—
|
|
(8
|
)
|
||||||||||||||
|
Net income attributable to common stockholders
|
—
|
|
—
|
|
—
|
|
476
|
|
—
|
|
—
|
|
—
|
|
476
|
|
||||||||||||||
|
Direct stock reinvestment and purchase plan
|
0.1
|
|
—
|
|
4
|
|
—
|
|
—
|
|
—
|
|
—
|
|
4
|
|
||||||||||||||
|
Employee stock purchase plan
|
0.1
|
|
—
|
|
5
|
|
—
|
|
—
|
|
—
|
|
—
|
|
5
|
|
||||||||||||||
|
Stock-based compensation activity
|
1.2
|
|
—
|
|
40
|
|
(1
|
)
|
—
|
|
(0.1
|
)
|
(6
|
)
|
33
|
|
||||||||||||||
|
Repurchases of common stock
|
—
|
|
—
|
|
—
|
|
—
|
|
—
|
|
(2.3
|
)
|
(126
|
)
|
(126
|
)
|
||||||||||||||
|
Net other comprehensive income (loss)
|
—
|
|
—
|
|
—
|
|
—
|
|
(6
|
)
|
—
|
|
—
|
|
(6
|
)
|
||||||||||||||
|
Dividends
|
—
|
|
—
|
|
—
|
|
(244
|
)
|
—
|
|
—
|
|
—
|
|
(244
|
)
|
||||||||||||||
|
Balance as of December 31, 2015
|
180.9
|
|
$
|
2
|
|
$
|
6,351
|
|
$
|
(1,073
|
)
|
$
|
(88
|
)
|
(2.6
|
)
|
$
|
(143
|
)
|
$
|
5,049
|
|
||||||||
|
Net income attributable to common stockholders
|
—
|
|
—
|
|
—
|
|
468
|
|
—
|
|
—
|
|
—
|
|
468
|
|
||||||||||||||
|
Direct stock reinvestment and purchase plan
|
0.1
|
|
—
|
|
5
|
|
—
|
|
—
|
|
—
|
|
—
|
|
5
|
|
||||||||||||||
|
Employee stock purchase plan
|
0.1
|
|
—
|
|
7
|
|
—
|
|
—
|
|
—
|
|
—
|
|
7
|
|
||||||||||||||
|
Stock-based compensation activity
|
0.7
|
|
—
|
|
25
|
|
(1
|
)
|
—
|
|
(0.1
|
)
|
(5
|
)
|
19
|
|
||||||||||||||
|
Repurchases of common stock
|
—
|
|
—
|
|
—
|
|
—
|
|
—
|
|
(1.0
|
)
|
(65
|
)
|
(65
|
)
|
||||||||||||||
|
Net other comprehensive income (loss)
|
—
|
|
—
|
|
—
|
|
—
|
|
2
|
|
—
|
|
—
|
|
2
|
|
||||||||||||||
|
Dividends
|
—
|
|
—
|
|
—
|
|
(267
|
)
|
—
|
|
—
|
|
—
|
|
(267
|
)
|
||||||||||||||
|
Balance as of December 31, 2016
|
181.8
|
|
$
|
2
|
|
$
|
6,388
|
|
$
|
(873
|
)
|
$
|
(86
|
)
|
(3.7
|
)
|
$
|
(213
|
)
|
$
|
5,218
|
|
||||||||
|
Cumulative effect of change in accounting principle
|
—
|
|
—
|
|
—
|
|
21
|
|
—
|
|
—
|
|
—
|
|
21
|
|
||||||||||||||
|
Net income attributable to common stockholders
|
—
|
|
—
|
|
—
|
|
426
|
|
—
|
|
—
|
|
—
|
|
426
|
|
||||||||||||||
|
Direct stock reinvestment and purchase plan
|
0.1
|
|
—
|
|
8
|
|
—
|
|
—
|
|
—
|
|
—
|
|
8
|
|
||||||||||||||
|
Employee stock purchase plan
|
0.1
|
|
—
|
|
7
|
|
—
|
|
—
|
|
—
|
|
—
|
|
7
|
|
||||||||||||||
|
Stock-based compensation activity
|
0.5
|
|
—
|
|
22
|
|
—
|
|
—
|
|
(0.1
|
)
|
(7
|
)
|
15
|
|
||||||||||||||
|
Acquisitions via treasury stock
|
—
|
|
—
|
|
7
|
|
—
|
|
—
|
|
0.4
|
|
27
|
|
34
|
|
||||||||||||||
|
Repurchases of common stock
|
—
|
|
—
|
|
—
|
|
—
|
|
—
|
|
(0.7
|
)
|
(54
|
)
|
(54
|
)
|
||||||||||||||
|
Net other comprehensive income (loss)
|
—
|
|
—
|
|
—
|
|
—
|
|
7
|
|
—
|
|
—
|
|
7
|
|
||||||||||||||
|
Dividends
|
—
|
|
—
|
|
—
|
|
(297
|
)
|
—
|
|
—
|
|
—
|
|
(297
|
)
|
||||||||||||||
|
Balance as of December 31, 2017
|
182.5
|
|
$
|
2
|
|
$
|
6,432
|
|
$
|
(723
|
)
|
$
|
(79
|
)
|
(4.1
|
)
|
$
|
(247
|
)
|
$
|
5,385
|
|
||||||||
The accompanying notes are an integral part of these Consolidated Financial Statements.
84
American Water Works Company, Inc. and Subsidiary Companies
Notes to Consolidated Financial Statements
(Unless otherwise noted, in millions, except per share data)
American Water Works Company, Inc. (the “Company” or “American Water”) is the holding company for regulated and market-based subsidiaries throughout the United States and Ontario, Canada. The Company’s primary business involves the ownership of utilities that provide water and wastewater services in
16
states in the United States, collectively referred to as the “
Regulated Businesses
.” The Company also operates market-based businesses within
four
, non-reportable operating segments, collectively referred to as the “
Market-Based Businesses
.” These businesses include the Military Services Group, which conducts operation and maintenance (“O&M”) of water and wastewater systems on military bases; the Homeowner Services Group, which primarily provides water and sewer line protection plans for homeowners; the Contract Operations Group, which conducts O&M of water and wastewater facilities for municipalities and industrial customers; and Keystone Clearwater Solutions, LLC (“Keystone”), which provides water services for natural gas exploration and production companies.
Principles of Consolidation
The accompanying Consolidated Financial Statements include the accounts of American Water and all of its subsidiaries in which a controlling interest is maintained after the elimination of intercompany balances and transactions. The Company uses the equity method to report its investments in joint ventures where it holds up to a
50%
voting interest and cannot exercise control over the operations and policies of the investments. Under the equity method, the Company records its interests as an investment and its percentage share of the investee’s earnings as income or losses.
In July 2015, the Company acquired a
95%
interest in Water Solutions Holdings, LLC, including its wholly-owned subsidiary, Keystone Clearwater Solutions, LLC (collectively referred to as “Keystone”). The outside stockholders’ interest, which is redeemable at the option of the minority owners, is recognized as redeemable noncontrolling interest. The redeemable noncontrolling interest amounted to
$7 million
as of
December 31, 2017
and
2016
, and is included in other long-term liabilities in the accompanying Consolidated Balance Sheets. The net income in
2017
and the net loss in
2016
, respectively, attributable to the noncontrolling interest was not significant. The Company has entered into an agreement whereby it has the option to acquire from the minority owners, and the minority owners have the option to sell to the Company, the remaining
five
percent interest at fair value, upon the occurrence of certain triggering events, or at the defined date of December 31, 2018.
Use of Estimates
The preparation of financial statements in conformity with accounting principles generally accepted in the United States (“GAAP”) requires management to make estimates, assumptions and judgments that affect the Company’s financial condition, results of operations and cash flows. Actual results could differ from these estimates, judgments and assumptions. The Company considers its critical accounting estimates to include: the application of regulatory accounting principles and the related determination and estimation of regulatory assets and liabilities; assumptions used in impairment testing of goodwill and other long-lived assets, including regulatory assets; revenue recognition and the estimates used in the calculation of unbilled revenue; accounting for income taxes and the recently enacted Tax Cuts and Jobs Act (the “TCJA”); benefit plan assumptions; and the judgments and estimates used in the determining loss contingencies. The Company’s critical accounting estimates that are particularly sensitive to change in the near term are amounts reported for regulatory assets and liabilities, goodwill, income taxes, benefit plan assumptions and contingency-related obligations.
Regulation
The Company’s regulated utilities are subject to economic regulation by certain state utility commissions or other entities engaged in utility regulation, collectively referred to as Public Utility Commissions (“PUCs” or “Regulators”). As such, the Company follows authoritative accounting principles required for rate regulated utilities, which requires the effects of rate regulation to be reflected in the Company’s Consolidated Financial Statements. PUCs generally authorize revenue at levels intended to recover the estimated costs of providing service, plus a return on net investments, or rate base. Regulators may also approve accounting treatments, long-term financing programs and cost of capital, capital expenditures, O&M expenses, taxes, transactions and affiliate relationships, reorganizations and mergers, and acquisitions, along with imposing certain penalties or granting certain incentives. Due to timing and other differences in the collection of a regulated utility’s revenue, an incurred cost that would otherwise be charged as an expense by a non-regulated entity, could be deferred as a regulatory asset if it is probable that such cost is recoverable through future rates. Conversely, the authoritative accounting principles require the creation of a regulatory liability for amounts collected in rates to recover costs expected to be incurred in the future, or amounts collected in excess of costs incurred and are refundable to customers. See
Note 6—Regulatory Assets and Liabilities
.
85
Property, Plant and Equipment
Property, plant and equipment consists primarily of utility plant. Additions to utility plant and replacement of retirement units of utility plant are capitalized and include costs such as materials, direct labor, payroll taxes and benefits, indirect items such as engineering and supervision, transportation and an allowance for funds used during construction (“AFUDC”). Costs for repair, maintenance and minor replacements are charged to O&M expense as incurred.
The cost of property, plant and equipment is depreciated using the straight-line average remaining life method. The Company’s regulated utilities record depreciation in conformity with amounts approved by PUCs, after regulatory review of the information the Company submits to support its estimates of the assets’ remaining useful lives.
When units of property, plant and equipment are replaced, retired or abandoned, the carrying value is credited against the asset and charged to accumulated depreciation. To the extent the Company recovers cost of removal or other retirement costs through rates after the retirement costs are incurred, a regulatory asset is recorded. In some cases, the Company recovers retirement costs through rates during the life of the associated asset and before the costs are incurred. These amounts result in a regulatory liability being reported based on the amounts previously recovered through customer rates, until the costs to retire those assets are incurred.
The costs incurred to acquire and internally develop computer software for internal use are capitalized as a unit of property. The carrying value of these costs amounted to
$346 million
and
$345 million
as of
December 31, 2017
and
2016
, respectively.
Nonutility property consists primarily of buildings and equipment utilized by the Company for internal operations. This property is stated at cost, net of accumulated depreciation, which calculated using the straight-line method over the useful lives of the assets.
Cash and Cash Equivalents, and Restricted Funds
Substantially all cash is invested in interest-bearing accounts. All highly liquid investments with a maturity of three months or less when purchased are considered to be cash equivalents.
Restricted funds consists primarily of proceeds from financings for the construction and capital improvement of facilities, and deposits for future services under O&M projects. Proceeds are held in escrow or interest-bearing accounts until the designated expenditures are incurred. Restricted funds are classified in the Consolidated Balance Sheets as either current or long-term based upon the intended use of the funds.
The following table provides a reconciliation of the cash and cash equivalents, and restricted funds as presented in the Consolidated Balance Sheets, to the sum of such amounts presented in the Consolidated Statements of Cash Flows for the years ended
December 31
:
|
|
2017
|
2016
|
|||||
|
Cash and cash equivalents
|
$
|
55
|
|
$
|
75
|
|
|
|
Restricted funds
|
27
|
|
20
|
|
|||
|
Restricted funds included in other long-term assets
|
1
|
|
4
|
|
|||
|
Cash and cash equivalents, and restricted funds as presented in the Consolidated Statements of Cash Flows
|
$
|
83
|
|
$
|
99
|
|
|
Accounts Receivable and Unbilled Revenues
Accounts receivable include regulated utility customer accounts receivable, which represent amounts billed to water and wastewater customers on a cycle basis. Credit is extended based on the guidelines of the applicable PUCs and collateral is generally not required. Also included are market-based trade accounts receivable and nonutility customer receivables of the regulated subsidiaries. Unbilled revenues are accrued when service has been provided but has not been billed to customers and when costs exceed billings on market-based construction contracts.
Allowance for Uncollectible Accounts
Allowances for uncollectible accounts are maintained for estimated probable losses resulting from the Company’s inability to collect receivables from customers. Accounts that are outstanding longer than the payment terms are considered past due. A number of factors are considered in determining the allowance for uncollectible accounts, including the length of time receivables are past due and previous loss history. The Company generally writes off accounts when they become uncollectible or are over a certain number of days outstanding. See
Note 5—Allowance for Uncollectible Accounts
.
86
Materials and Supplies
Materials and supplies are stated at the lower of cost or net realizable value. Cost is determined using the average cost method.
Goodwill
Goodwill represents the excess of the purchase price paid over the estimated fair value of the assets acquired and liabilities assumed in the acquisition of a business. Goodwill is not amortized, but is tested for impairment at least annually or on an interim basis if an event occurs or circumstances change that would more likely than not reduce the fair value of a reporting unit below its carrying value. Goodwill is primarily associated with the acquisition of the Company by RWE Aktiengesellschaft in 2003 and the acquisition of Keystone in 2015, and has been assigned to reporting units based on the fair values at the date of the acquisitions. The reporting units in the
Regulated Businesses
segment are aggregated into a single reporting unit. The
Market-Based Businesses
is comprised of
four
non-reportable reporting units. The Company’s annual impairment test is performed as of
November 30
of each year, in conjunction with the completion of the Company’s annual business plan. The Company assesses qualitative factors to determine whether it is necessary to perform the two-step quantitative goodwill impairment test. If based on qualitative factors, the fair value of the reporting unit is more likely than not greater than the carrying amount, no further testing is required. If the Company bypasses the qualitative assessment or performs the qualitative assessment, but determines that it is more likely than not that its fair value is less than its carrying amount, a quantitative two-step, fair value-based test is performed.
The first step compares the estimated fair value of the reporting unit to its respective net carrying value, including goodwill, on the measurement date. If the estimated fair value of any reporting unit is less than such reporting unit’s carrying value, then the second step is performed to measure the amount of the impairment loss (if any) for such reporting unit.
The second step requires an allocation of fair value to the individual assets and liabilities using purchase price allocation accounting guidance in order to determine the implied fair value of goodwill. If the implied fair value of goodwill is less than the carrying amount for the reporting unit, an impairment loss is recorded as a reduction to goodwill and a charge to operating expense. Application of the goodwill impairment test requires management judgment, including the identification of reporting units and determining the fair value of the reporting unit. Management estimates fair value using a combination of a discounted cash flow analysis and market multiples analysis. Significant assumptions used in these fair value analyses include discount and growth rates and projected terminal values.
The Company believes the assumptions and other considerations used to value goodwill to be appropriate. However, if experience differs from the assumptions and considerations used in its analysis, the resulting change could have a material adverse impact on the Consolidated Financial Statements. See
Note 7—Goodwill and Other Intangible Assets
.
Long-Lived Assets
Long-lived assets include land, buildings, equipment and long-term investments. Long-lived assets, other than investments and land, are depreciated over their estimated useful lives, and are reviewed for impairment whenever changes in circumstances indicate the carrying value of the asset may not be recoverable. Such circumstances would include items such as a significant decrease in the market value of a long-lived asset, a significant adverse change in the manner the asset is being used or planned to be used or in its physical condition, or a history of operating or cash flow losses associated with the use of the asset. In addition, changes in the expected useful life of these long-lived assets may also be an impairment indicator. When such events or changes occur, the Company estimates the fair value of the asset from future cash flows expected to result from the use and, if applicable, the eventual disposition of the asset and compares that to the carrying value of the asset. If the carrying value is greater than the fair value, an impairment loss is recorded.
The Company believes the assumptions and other considerations used to evaluate the carrying value of long-lived assets are appropriate. However, if actual experience differs from the assumptions and considerations used in its estimates, the resulting change could have a material adverse impact on the Consolidated Financial Statements.
The key variables to determine fair value include assumptions regarding sales volume, rates, operating costs, labor and other benefit costs, capital additions, assumed discount rates and other economic factors. These variables require significant management judgment and include inherent uncertainties, since they are forecasting future events. If such assets are considered impaired, an impairment loss is recognized equal to the amount by which the asset’s carrying value exceeds its fair value.
The long-lived assets of the regulated utility subsidiaries are tested on a separate entity basis for impairment testing as they are integrated state-wide operations that do not have the option to curtail service and generally have uniform tariffs. A regulatory asset is charged to earnings if and when future recovery in rates of that asset is no longer probable.
The Company holds other investments including investments in privately held companies and investments in joint ventures accounted for using the equity method. The Company’s investments in privately held companies and joint ventures are classified as other long-term assets in the accompanying Consolidated Balance Sheets.
87
The fair values of long-term investments are dependent on the financial performance and solvency of the entities in which the Company invests, as well as volatility inherent in the external markets. If such assets are considered impaired, an impairment loss is recognized equal to the amount by which the asset’s carrying value exceeds its fair value.
Advances for Construction and Contributions in Aid of Construction
Regulated utility subsidiaries may receive advances for construction and contributions in aid of construction from customers, home builders and real estate developers to fund construction necessary to extend service to new areas.
Advances are refundable for limited periods of time as new customers begin to receive service or other contractual obligations are fulfilled. Included in other current liabilities as of
December 31, 2017
and
2016
in the accompanying Consolidated Balance Sheets are estimated refunds of
$23 million
and
$21 million
, respectively. Those amounts represent expected refunds during the next 12-month period.
Advances that are no longer refundable are reclassified to contributions. Contributions are permanent collections of plant assets or cash for a particular construction project. For ratemaking purposes, the amount of such contributions generally serves as a rate base reduction since the contributions represent non-investor supplied funds.
Generally, the Company depreciates utility plant funded by contributions and amortizes its contributions balance as a reduction to depreciation expense, producing a result which is functionally equivalent to reducing the original cost of the utility plant for the contributions. In accordance with applicable regulatory guidelines, some of the Company’s utility subsidiaries do not amortize contributions, and any contribution received remains on the balance sheet indefinitely. Amortization of contributions in aid of construction was
$27 million
,
$27 million
and
$26 million
for the years ended
December 31, 2017
,
2016
and
2015
, respectively.
Recognition of Revenues
Revenues of the regulated utility subsidiaries are recognized as water and wastewater services are provided, and include amounts billed to customers on a cycle basis and unbilled amounts based on estimated usage from the date of the meter reading associated with the latest customer bill to the end of the accounting period. The Company also recognizes revenue when it is probable that future recovery of previously incurred costs or future refunds that are to be credited to customers will occur through the ratemaking process.
The Company has agreements with the U.S. government to operate and maintain water and wastewater systems at various military bases pursuant to
50
-year contracts (“military agreements”). These contracts also include construction components that are accounted for separately from the O&M components.
Nine
of the military agreements are subject to periodic price redetermination adjustments and modifications for changes in circumstance. The remaining
four
agreements are subject to annual price adjustments under a mechanism similar to price redeterminations. Additionally, the Company has agreements ranging in length from
one
to
25
years with municipalities and businesses in various industries to operate and maintain water and wastewater systems (“O&M agreements”). Revenues from operations and management services are recognized as services are provided. See
Note 15—Commitments and Contingencies
.
Revenues from construction projects are recognized over the contract term based on the costs incurred to date during the period compared to the total estimated costs over the entire contract. Losses on contracts are recognized during the period in which the loss first becomes probable and estimable. Revenues recognized during the period in excess of billings on construction contracts are recorded as unbilled revenue. Billings in excess of revenues recognized on construction contracts are recorded as other current liabilities until the recognition criteria are met. Changes in contract performance and related estimated contract profitability may result in revisions to costs and revenues and are recognized in the period in which revisions are determined.
Income Taxes
American Water and its subsidiaries participate in a consolidated federal income tax return for U.S. tax purposes. Members of the consolidated group are charged with the amount of federal income tax expense determined as if they filed separate returns.
Certain income and expense items are accounted for in different time periods for financial reporting than for income tax reporting purposes. The Company provides deferred income taxes on the difference between the tax basis of assets and liabilities and the amounts at which they are carried in the financial statements. These deferred income taxes are based on the enacted tax rates expected to be in effect when these temporary differences are projected to reverse. In addition, the regulated utility subsidiaries recognize regulatory assets and liabilities for the effect on revenues expected to be realized as the tax effects of temporary differences, previously flowed through to customers, reverse.
Investment tax credits have been deferred by the regulated utility subsidiaries and are being amortized to income over the average estimated service lives of the related assets.
88
The Company recognizes accrued interest and penalties related to tax positions as a component of income tax expense and accounts for sales tax collected from customers and remitted to taxing authorities on a net basis. See
Note 13—Income Taxes
.
Allowance for Funds Used During Construction
AFUDC is a non-cash credit to income with a corresponding charge to utility plant that represents the cost of borrowed funds or a return on equity funds devoted to plant under construction. The regulated utility subsidiaries record AFUDC to the extent permitted by the PUCs. The portion of AFUDC attributable to borrowed funds is shown as a reduction of interest, net in the accompanying Consolidated Statements of Operations. Any portion of AFUDC attributable to equity funds would be included in other income (expenses) in the accompanying Consolidated Statements of Operations. AFUDC is summarized in the following table for the years ended
December 31
:
|
|
2017
|
2016
|
2015
|
||||||||
|
Allowance for other funds used during construction
|
$
|
19
|
|
$
|
15
|
|
$
|
13
|
|
||
|
Allowance for borrowed funds used during construction
|
8
|
|
6
|
|
8
|
|
|||||
Environmental Costs
The Company’s water and wastewater operations and the operations of its
Market-Based Businesses
are subject to U.S. federal, state, local and foreign requirements relating to environmental protection, and as such, the Company periodically becomes subject to environmental claims in the normal course of business. Environmental expenditures that relate to current operations or provide a future benefit are expensed or capitalized as appropriate. Remediation costs that relate to an existing condition caused by past operations are accrued, on an undiscounted basis, when it is probable that these costs will be incurred and can be reasonably estimated. A conservation agreement entered into by a subsidiary of the Company with the National Oceanic and Atmospheric Administration in 2010 and amended in 2017 required the Company to, among other provisions, implement certain measures to protect the steelhead trout and its habitat in the Carmel River watershed in the State of California. The Company agreed to pay
$1 million
annually commencing in 2010 with the final payment being made in 2021. Remediation costs accrued amounted to
$6 million
and
less than $1 million
as of
December 31, 2017
and
2016
, respectively.
Derivative Financial Instruments
The Company uses derivative financial instruments for purposes of hedging exposures to fluctuations in interest rates. These derivative contracts are entered into for periods consistent with the related underlying exposures and do not constitute positions independent of those exposures. The Company does not enter into derivative contracts for speculative purposes and does not use leveraged instruments.
All derivatives are recognized on the balance sheet at fair value. On the date the derivative contract is entered into, the Company may designate the derivative as a hedge of the fair value of a recognized asset or liability (fair-value hedge) or a hedge of a forecasted transaction or of the variability of cash flows to be received or paid related to a recognized asset or liability (cash-flow hedge).
Changes in the fair value of a fair-value hedge, along with the gain or loss on the underlying hedged item, are recorded in current-period earnings. The gains and losses on the effective portion of cash-flow hedges are recorded in other comprehensive income, until earnings are affected by the variability of cash flows. Any ineffective portion of designated cash-flow hedges is recognized in current-period earnings.
Cash flows from derivative contracts are included in net cash provided by operating activities in the accompanying Consolidated Statements of Cash Flows.
89
New Accounting Standards
The following recently issued accounting standards have been adopted by the Company as of
December 31, 2017
:
|
Standard
|
Description
|
Date of
Adoption
|
Application
|
Effect on the Consolidated
Financial Statements
(or Other Significant Matters)
|
||||
|
Simplification of Employee Share-Based Payment Accounting
|
Simplified accounting and disclosure requirements for share-based payment awards. The updated guidance addresses simplification in areas such as: (i) the recognition of excess tax benefits and deficiencies; (ii) the classification of excess tax benefits and taxes paid on the Consolidated Statements of Cash Flows; (iii) election of an accounting policy for forfeitures; and (iv) the amount an employer can withhold to cover income taxes and still qualify for equity classification.
|
January 1, 2017
|
Modified retrospective for the recognition of excess tax benefits and deficiencies; full retrospective for the classification of excess tax benefits and taxes paid on the Consolidated Statements of Cash Flows
|
The cumulative effect of adoption increased retained earnings by $21 million, with an offsetting decrease to deferred income taxes, net. Adoption also increased cash flows from operating activities and decreased cash flows from financing activities by $17 million, $13 million and $16 million for the years ended December 31, 2017, 2016 and 2015, respectively, on the Consolidated Statements of Cash Flows.
|
||||
|
Classification of Certain Cash Receipts and Cash Payments on the Statement of Cash Flows
|
Provides guidance on the presentation and classification in the Consolidated Statements of Cash Flows for the following cash receipts and payments: (i) debt prepayment or debt extinguishment costs; (ii) settlement of zero-coupon debt instruments or other debt instruments with coupon interest rates that are insignificant in relation to the effective interest rate of the borrowing; (iii) contingent consideration payments made after a business combination; (iv) proceeds from the settlement of insurance claims; (v) proceeds from the settlement of corporate-owned life insurance policies, including bank-owned life insurance policies; (vi) distributions received from equity method investees; (vii) beneficial interests in securitization transactions and (viii) separately identifiable cash flows and application of the predominance principle.
|
December 31, 2017
|
Retrospective
|
Adoption resulted in the change in the presentation of a $34 million make-whole premium payment from operating activities to financing activities on the Consolidated Statements of Cash Flows for the year ended December 31, 2017, as compared to the third quarter 2017 Form 10-Q. See Note 10- Long-Term Debt in the Notes to Consolidated Financial Statements for further information regarding this make-whole premium payment.
|
||||
|
Presentation of Changes in Restricted Cash on the Statement of Cash Flows
|
Updates the accounting and disclosure guidance for the classification and presentation of changes in restricted cash on the Consolidated Statements of Cash Flows. The amended guidance requires that the statements of cash flows explain the change during the period in the total of cash, cash equivalents and amounts described as restricted cash or restricted cash equivalents. Restricted cash and restricted cash equivalents will now be included with cash and cash equivalents when reconciling the beginning-of-period and end-of-period total amounts shown on the statements of cash flows.
|
December 31, 2017
|
Retrospective
|
Adoption resulted in the inclusion of restricted funds and related changes in the total of cash and cash equivalents, and restricted funds on the Consolidated Statements of Cash Flows. Total restricted funds amounted to $28 million, $24 million and $27 million as of December 31, 2017, 2016, 2015, respectively. The adoption also resulted in an increase in net cash used in investing activities previously reported of $3 million for the year ended December 31, 2016, and a decrease of $6 million for the year ended December 31, 2015.
|
||||
The following recently issued accounting standards have not yet been adopted by the Company as of
December 31, 2017
:
|
Standard
|
Description
|
Date of
Adoption
|
Application
|
Estimated Effect on the Consolidated
Financial Statements
(or Other Significant Matters)
|
||||
|
Revenue from Contracts with Customers
|
Changes the criteria for recognizing revenue from a contract with a customer. Replaces existing guidance on revenue recognition, including most industry specific guidance. The objective is to provide a single, comprehensive revenue recognition model for all contracts with customers to improve comparability within industries, across industries and across capital markets. The underlying principle is that an entity will recognize revenue to depict the transfer of goods and services to customers at an amount the entity expects to be entitled to in exchange for those goods or services. The guidance also requires a number of disclosures regarding the nature, amount, timing and uncertainty of revenue and the related cash flows.
|
January 1, 2018
|
Full or modified retrospective
|
The adoption will not result in material impact to the Consolidated Financial Statements as there are no material changes to the timing or recognition of revenue. The Company plans to adopt using the modified retrospective method.
|
||||
|
Clarifying the Definition of a Business
|
Updated the accounting guidance to clarify the definition of a business with the objective of assisting entities with evaluating whether transactions should be accounted for as acquisitions, or disposals, of assets or businesses.
|
January 1, 2018
|
Prospective
|
The update could result in more acquisitions being accounted for as asset acquisitions. The effect on the Company’s Consolidated Financial Statements will be dependent on the acquisitions that close subsequent to adoption.
|
||||
90
|
Standard
|
Description
|
Date of
Adoption
|
Application
|
Estimated Effect on the Consolidated
Financial Statements
(or Other Significant Matters)
|
||||
|
Presentation of Net Periodic Pension Cost and Net Periodic Postretirement Benefit Cost
|
Updated authoritative guidance requires the service cost component of net periodic benefit cost to be presented in the same income statement line item(s) as other employee compensation costs arising from services rendered during the period. The remaining components of net periodic benefit cost are required to be presented separately from the service cost component in an income statement line item outside of operating income. Also, the guidance only allows for the service cost component to be eligible for capitalization. The updated guidance does not impact the accounting for net periodic benefit costs as regulatory assets or liabilities.
|
January 1, 2018
|
Retrospective for the presentation of net periodic benefit cost components in the income statement; prospective for the capitalization of net periodic benefit costs components in total assets.
|
The Company expects to reclassify net periodic benefit costs, other than the service cost component of approximately $9 million, $5 million and $5 million for the years ended December 31, 2017, 2016 and 2015, respectively, to Other, net in its Consolidated Statements of Operations. The Company expects to record the non-service cost component probable of recovery from (or payable to) customers as a regulatory asset (or regulatory liability) accordingly.
|
||||
|
Reclassification of Certain Tax Effects from Accumulated Other Comprehensive Income
|
Permits entities to reclassify tax effects stranded in accumulated other comprehensive income as a result of the Tax Cuts and Jobs Act to retained earnings.
|
January 1, 2019; early adoption permitted
|
In the period of adoption or retrospective.
|
The Company is evaluating the impact on the Consolidated Financial Statements, as well as the timing of adoption.
|
||||
|
Accounting for Leases
|
Updated the accounting and disclosure guidance for leasing arrangements. Under this guidance, a lessee will be required to recognize the following for all leases, excluding short-term leases, at the commencement date: (i) a lease liability, which is a lessee’s obligation to make lease payments arising from a lease, measured on a discounted basis; and (ii) a right-of-use asset, which is an asset that represents the lessee’s right to use, or control the use of, a specified asset for the lease term. Under the guidance, lessor accounting is largely unchanged.
|
January 1, 2019; early adoption permitted
|
Modified retrospective
|
The Company is evaluating the effect on its Consolidated Financial Statements.
|
||||
|
Accounting for Hedging Activities
|
Updated the accounting and disclosure guidance for hedging activities, which allows for more financial and nonfinancial hedging strategies to be eligible for hedge accounting. Under this guidance, a qualitative effectiveness assessment is permitted for certain hedges if an entity can reasonably support an expectation of high effectiveness throughout the term of the hedge, provided that an initial quantitative test establishes that the hedge relationship is highly effective. Also, for cash flow hedges determined to be highly effective, all changes in the fair value of the hedging instrument will be recorded in other comprehensive income with a subsequent reclassification to earnings when the hedged item impacts earnings.
|
January 1, 2019; early adoption permitted
|
Modified retrospective for adjustments related to the measurement of ineffectiveness for cash flow hedges; prospective for the updated presentation and disclosure requirements.
|
The Company does not expect the adoption to have a material impact on its Consolidated Financial Statements based on the hedges held as of the balance sheet date. The Company is evaluating the timing of adoption.
|
||||
|
Simplification of Goodwill Impairment Testing
|
Updated authoritative guidance which simplifies the subsequent measurement of goodwill by eliminating Step 2 from the goodwill impairment test. Under the amendments in the update, an entity should perform its annual or interim goodwill impairment test by comparing the fair value of a reporting unit with its carrying amount. An impairment charge should be recognized for the amount by which the carrying value exceeds the reporting unit’s fair value, however, the loss recognized should not exceed the total amount of goodwill allocated to that reporting unit. An entity still has the option to perform the qualitative assessment for a reporting unit to determine if the quantitative impairment test is necessary.
|
January 1, 2020; early adoption permitted
|
Prospective
|
The Company is evaluating the impact on its Consolidated Financial Statements, as well as the timing of adoption.
|
||||
|
Measurement of Credit Losses
|
Updated the accounting guidance on reporting credit losses for financial assets held at amortized cost basis and available-for-sale debt securities. Under this guidance, expected credit losses are required to be measured based on historical experience, current conditions and reasonable and supportable forecasts that affect the collectability of the reported amount of financial assets. Also, this guidance requires that credit losses on available-for-sale debt securities be presented as an allowance rather than as a direct write-down.
|
January 1, 2020; early adoption permitted
|
Modified retrospective
|
The Company is evaluating the impact on its Consolidated Financial Statements, as well as the timing of adoption.
|
||||
Reclassifications
Certain reclassifications have been made to prior periods in the accompanying Consolidated Financial Statements and notes to conform to the current presentation.
91
During
2017
, the Company closed on
18
acquisitions of various regulated water and wastewater systems for a total aggregate purchase price of
$210 million
. This included the acquisition of the wastewater system assets of the Municipal Authority of the City of McKeesport, Pennsylvania, on
December 18, 2017
. Assets acquired, principally utility plant, totaled
$207 million
. Liabilities assumed totaled
$23 million
, including
$9 million
of contributions in aid of construction and assumed debt of
$7 million
. The Company recorded additional goodwill of
$29 million
associated with
four
of its acquisitions, which is reported in its
Regulated Businesses
segment. Of this total goodwill, approximately
$1 million
is expected to be deductible for tax purposes. Additionally, the Company recognized a bargain purchase gain of
$3 million
associated with
three
of the acquisitions. The preliminary purchase price allocations related to these acquisitions will be finalized once the valuation of assets acquired has been completed, no later than one year after their acquisition date.
During
2016
, the Company closed on
15
acquisitions of various regulated water and wastewater systems for a total aggregate purchase price of
$199 million
. This included the acquisition of substantially all of the wastewater collection and treatment assets of the Sewer Authority of the City of Scranton, Pennsylvania (“Scranton”) in December 2016. Assets acquired, principally utility plant, totaled
$194 million
. Liabilities assumed totaled
$30 million
, including
$14 million
of contributions in aid of construction and assumed debt of
$6 million
. During
2016
, the Company recorded additional goodwill of
$43 million
associated with
five
of its acquisitions, which is reported in its
Regulated Businesses
segment. Of this total goodwill, approximately
$31 million
is expected to be deductible for tax purposes. Additionally, during
2017
the Company recorded a measurement period adjustment of
$5 million
, increasing the goodwill recognized from the Scranton acquisition.
During
2015
, the Company closed on
14
acquisitions of various regulated water and wastewater systems for a total aggregate purchase price of
$64 million
. Assets acquired, principally utility plant, totaled
$90 million
. Liabilities assumed totaled
$26 million
, including
$10 million
of contributions in aid of construction and assumed debt of
$1 million
. The Company recorded additional goodwill of
$3 million
associated with four of its acquisitions, which is reported in its
Regulated Businesses
segment and is expected to be fully deductible for tax purposes. The Company also recognized a bargain purchase gain of
$3 million
associated with five of its acquisitions, of which
$1 million
was deferred as a regulatory liability.
During
2015
, the Company also closed on the Keystone acquisition, which is included as part of the
Market-Based Businesses
, for a total purchase price of
$133 million
, net of cash received. The fair value of identifiable assets acquired and liabilities assumed was
$56 million
and
$7 million
, respectively, and principally included the acquisition of nonutility property of
$25 million
, accounts receivable and unbilled revenues of
$18 million
and intangible assets of
$12 million
. The purchase price allocation, which is based on the estimated fair value of net assets acquired, resulted in the Company recording redeemable noncontrolling interest of
$7 million
and additional goodwill of
$91 million
. This goodwill is expected to be fully deductible for tax purposes.
The pro forma impact of our acquisitions was not material to our Consolidated Statements of Operations for the years ended
December 31, 2017
and
2016
.
The following table summarizes the major classes of property, plant and equipment by category as of
December 31
:
|
2017
|
2016
|
Range of Remaining
Useful Lives |
Weighted Average
Useful Life |
||||||||
|
Utility plant:
|
|
|
|
|
|||||||
|
Land and other non-depreciable assets
|
$
|
151
|
|
$
|
147
|
|
|
|
|||
|
Sources of supply
|
798
|
|
734
|
|
2 to 127 Years
|
45 years
|
|||||
|
Treatment and pumping facilities
|
3,356
|
|
3,218
|
|
3 to 101 Years
|
37 years
|
|||||
|
Transmission and distribution facilities
|
9,583
|
|
9,043
|
|
9 to 156 Years
|
72 years
|
|||||
|
Services, meters and fire hydrants
|
3,754
|
|
3,504
|
|
5 to 90 Years
|
30 years
|
|||||
|
General structures and equipment
|
1,458
|
|
1,343
|
|
1 to 156 Years
|
16 years
|
|||||
|
Waste treatment, pumping and disposal
|
557
|
|
457
|
|
3 to 106 Years
|
37 years
|
|||||
|
Waste collection
|
904
|
|
637
|
|
5 to 97 Years
|
55 years
|
|||||
|
Construction work in progress
|
585
|
|
419
|
|
|
|
|||||
|
Total utility plant
|
21,146
|
|
19,502
|
|
|
|
|||||
|
Nonutility property
|
570
|
|
452
|
|
3 to 50 years
|
6 years
|
|||||
|
Total property, plant and equipment
|
$
|
21,716
|
|
$
|
19,954
|
|
|
|
|||
92
Property, plant and equipment depreciation expense amounted to
$460 million
,
$435 million
,
and
$405 million
for the years ended
December 31, 2017
,
2016
and
2015
, respectively and was included in depreciation and amortization expense in the accompanying Consolidated Statements of Operations. The provision for depreciation expressed as a percentage of the aggregate average depreciable asset balances was
3.07%
,
3.14%
and
3.13%
for years
December 31, 2017
,
2016
and
2015
, respectively.
The following table summarizes the changes in the Company’s allowances for uncollectible accounts for the years ended
December 31
:
|
|
2017
|
2016
|
2015
|
||||||||
|
Balance as of January 1
|
$
|
(40
|
)
|
$
|
(39
|
)
|
$
|
(35
|
)
|
||
|
Amounts charged to expense
|
(29
|
)
|
(27
|
)
|
(32
|
)
|
|||||
|
Amounts written off
|
30
|
|
29
|
|
31
|
|
|||||
|
Recoveries of amounts written off
|
(3
|
)
|
(3
|
)
|
(3
|
)
|
|||||
|
Balance as of December 31
|
$
|
(42
|
)
|
$
|
(40
|
)
|
$
|
(39
|
)
|
||
Regulatory Assets
Regulatory assets represent costs that are probable of recovery from customers in future rates. The majority of the regulatory assets earn a return. The following table summarizes the composition of regulatory assets as of
December 31
:
|
|
2017
|
2016
|
|||||
|
Deferred pension expense
|
$
|
285
|
|
$
|
310
|
|
|
|
Income taxes recoverable through rates
|
—
|
|
241
|
|
|||
|
Removal costs recoverable through rates
|
269
|
|
251
|
|
|||
|
San Clemente Dam project costs
|
89
|
|
91
|
|
|||
|
Regulatory balancing accounts
|
113
|
|
110
|
|
|||
|
Debt expense
|
67
|
|
66
|
|
|||
|
Make-whole premium on early extinguishment of debt
|
27
|
|
—
|
|
|||
|
Purchase premium recoverable through rates
|
57
|
|
58
|
|
|||
|
Deferred tank painting costs
|
42
|
|
39
|
|
|||
|
Other
|
112
|
|
123
|
|
|||
|
Total Regulatory Assets
|
$
|
1,061
|
|
$
|
1,289
|
|
|
The Company’s deferred pension expense includes a portion of the underfunded status that is probable of recovery through rates in future periods of
$270 million
and
$300 million
as of
December 31, 2017
and
2016
, respectively. The remaining portion is the pension expense in excess of the amount contributed to the pension plans which is deferred by certain subsidiaries and will be recovered in future service rates as contributions are made to the pension plan.
The Company has recorded a regulatory asset for the additional revenues expected to be realized when the tax effects of temporary differences previously flowed through to customers, reverse. These temporary differences are primarily related to the difference between book and tax depreciation on property placed in service before the adoption by the regulatory authorities of full normalization for rate making purposes. Full normalization requires no flow through of tax benefits to customers. The regulatory asset for income taxes recoverable through rates is net of the reduction expected in future revenues as deferred taxes previously provided, attributable to the difference between the state and federal income tax rates under prior law and the current statutory rates, reverse over the average remaining service lives of the related assets.
Removal costs recoverable through rates represent costs incurred for removal of property, plant and equipment or other retirement costs.
93
San Clemente Dam project costs represent costs incurred and deferred by the Company’s California subsidiary pursuant to its efforts to investigate alternatives to strengthen or remove the dam due to potential earthquake and flood safety concerns. In June 2012, the California Public Utilities Commission (“CPUC”) issued a decision authorizing implementation of a project to reroute the Carmel River and remove the San Clemente Dam. The project includes the Company’s California subsidiary, the California State Conservancy and the National Marine Fisheries Services. Under the order’s terms, the CPUC has authorized recovery for pre-construction costs, interim dam safety measures and environmental costs and construction costs. The authorized costs are to be recovered via a surcharge over a
twenty
-year period which began in October 2012. The unrecovered balance of project costs incurred, including cost of capital, net of surcharges totaled
$89 million
and
$91 million
as of
December 31, 2017
and
2016
, respectively. Surcharges collected were
$7 million
and
$4 million
for the years ended
December 31, 2017
and
2016
, respectively. In the current general rate case in California, there is a pending request to reset the twenty-year recovery period to begin on January 1, 2018 and to set the annual recovery amount.
Regulatory balancing accounts accumulate differences between revenues recognized and authorized revenue requirements until they are collected from customers or are refunded. Regulatory balancing accounts include low income programs and purchased power and water accounts.
Debt expense is amortized over the lives of the respective issues. Call premiums on the redemption of long-term debt, as well as unamortized debt expense, are deferred and amortized to the extent they will be recovered through future service rates.
As a result of American Water Capital Corp.’s prepayment of the
5.62%
Series C Senior Notes due December 21, 2018 (“Series C Senior Notes”) and
5.77%
Series D Senior Notes due December 21, 2021 (“Series D Senior Notes”) and payment of a make-whole premium amount to the holders thereof of
$34 million
, the Company recorded a
$6 million
charge resulting from the early extinguishment of debt at the parent company. Substantially all of the early debt extinguishment costs allocable to the Company’s utility subsidiaries were recorded as regulatory assets that the Company believes are probable of recovery in future rates. Approximately
$1 million
of the early debt extinguishment costs allocable to the Company’s utility subsidiaries was amortized in 2017.
Purchase premium recoverable through rates is primarily the recovery of the acquisition premiums related to an asset acquisition by the Company’s California Utility subsidiary during 2002, and acquisitions in 2007 by the Company’s New Jersey Utility subsidiary. As authorized for recovery by the California and New Jersey PUCs, these costs are being amortized to depreciation and amortization in the Consolidated Statements of Operations through November 2048.
Tank painting costs are generally deferred and amortized to operations and maintenance expense in the Consolidated Statements of Operations on a straight-line basis over periods ranging from
two
to
fifteen
years, as authorized by the regulatory authorities in their determination of rates charged for service.
Other regulatory assets include certain construction costs for treatment facilities, property tax stabilization, employee-related costs, deferred other postretirement benefit expense, business services project expenses, coastal water project costs, rate case expenditures and environmental remediation costs among others. These costs are deferred because the amounts are being recovered in rates or are probable of recovery through rates in future periods.
Regulatory Liabilities
Regulatory liabilities generally represent amounts that are probable of being credited or refunded to customers through the rate-making process. Also, if costs expected to be incurred in the future are currently being recovered through rates, the Company records those expected future costs as regulatory liabilities. The following table summarizes the composition of regulatory liabilities as of
December 31
:
|
|
2017
|
2016
|
|||||
|
Income taxes recovered through rates
|
$
|
1,242
|
|
$
|
—
|
|
|
|
Removal costs recovered through rates
|
315
|
|
316
|
|
|||
|
Pension and other postretirement benefit balancing accounts
|
48
|
|
55
|
|
|||
|
Other
|
59
|
|
32
|
|
|||
|
Total Regulatory Liabilities
|
$
|
1,664
|
|
$
|
403
|
|
|
94
Income taxes recovered through rates relate to deferred taxes that will likely be refunded to the Company’s customers. On
December 22, 2017
, the TCJA was signed into law, which, among other things, enacted significant and complex changes to the Internal Revenue Code of 1986, including a reduction in the maximum U.S. federal corporate income tax rate from
35%
to
21%
as of January 1, 2018. The TCJA created significant excess deferred income taxes that the Company and its regulatory jurisdictions believe should be refunded to customers. Since these are significant refundable amounts, the Company believes it is probable these amounts will be refunded to customers through future rates, and as such the amounts are recorded to a regulatory liability.
Removal costs recovered through rates are estimated costs to retire assets at the end of their expected useful life that are recovered through customer rates over the life of the associated assets. In December 2008, the Company’s utility subsidiary in New Jersey, at the direction of the New Jersey Board of Public Utilities, began to depreciate
$48 million
of the total balance into depreciation and amortization expense in the Consolidated Statements of Operations via straight line amortization through November 2048.
Pension and other postretirement benefit balancing accounts represent the difference between costs incurred and costs authorized by the PUCs that are expected to be refunded to customers.
Other regulatory liabilities include legal settlement proceeds, deferred gains and various regulatory balancing accounts.
Goodwill
The following table summarizes changes in the carrying amount of goodwill for the years ended
December 31, 2017
and
2016
:
|
|
Regulated Businesses
|
Market-Based Businesses
|
Consolidated
|
||||||||||||||||||||||||
|
|
Cost
|
Accumulated Impairment
|
Cost
|
Accumulated Impairment
|
Cost
|
Accumulated Impairment
|
Total Net
|
||||||||||||||||||||
|
Balance as of January 1, 2016
|
$
|
3,415
|
|
$
|
(2,332
|
)
|
$
|
327
|
|
$
|
(108
|
)
|
$
|
3,742
|
|
$
|
(2,440
|
)
|
$
|
1,302
|
|
||||||
|
Goodwill from acquisitions
|
43
|
|
—
|
|
—
|
|
—
|
|
43
|
|
—
|
|
43
|
|
|||||||||||||
|
Balance as of December 31, 2016
|
$
|
3,458
|
|
$
|
(2,332
|
)
|
$
|
327
|
|
$
|
(108
|
)
|
$
|
3,785
|
|
$
|
(2,440
|
)
|
$
|
1,345
|
|
||||||
|
Goodwill from acquisitions
|
29
|
|
—
|
|
—
|
|
—
|
|
29
|
|
—
|
|
29
|
|
|||||||||||||
|
Measurement period adjustments
|
5
|
|
—
|
|
—
|
|
—
|
|
5
|
|
—
|
|
5
|
|
|||||||||||||
|
Balance as of December 31, 2017
|
$
|
3,492
|
|
$
|
(2,332
|
)
|
$
|
327
|
|
$
|
(108
|
)
|
$
|
3,819
|
|
$
|
(2,440
|
)
|
$
|
1,379
|
|
||||||
In
2017
, the Company acquired aggregate goodwill of
$29 million
associated with
four
of its acquisitions in the
Regulated Businesses
segment. Additionally, during
2017
the Company recorded a measurement period adjustment of
$5 million
, increasing the goodwill recognized from the Scranton acquisition completed in December 2016.
In
2016
, the Company acquired aggregate goodwill of
$43 million
associated with
five
of its acquisitions in the
Regulated Businesses
segment.
The Company completed its annual impairment assessment of goodwill as of
November 30
,
2017
and
2016
. It elected to apply the qualitative assessment of factors for goodwill in our
Regulated Businesses
and in Military Services Group and Contract Operations Group reporting units within the
Market-Based Businesses
for both
November 30
,
2017
and
2016
. The Company also elected to apply the qualitative assessment of factors for annual impairment assessment of goodwill as of
November 30
,
2016
to its Homeowners Services Group. Based on the work performed, the Company determined that no qualitative factors were present that would indicate the estimated fair values of the above stated reporting units were less than the respective carrying values.
At
November 30
,
2017
, the Company completed step one of the two-step test for its Homeowner Services Group and Keystone reporting units. The Company also completed a step one test for the Keystone reporting unit at
November 30
,
2016
. Based on those valuations, the Company concluded that there were no impairments to its goodwill. The Company used an income approach valuation technique which estimates the discounted future cash flows of operations. The discounted cash flow analysis relies on a single scenario reflecting the best estimate of projected cash flows. Significant assumptions were used in estimating the fair values, including the discount rate, growth rate and terminal value. At
November 30
,
2017
, the estimated fair value of the Homeowner Services Group reporting unit exceeded its carrying value by more than
156%
, and the estimated fair value of the Keystone reporting unit exceeded its carrying value by approximately
11%
. If further decline in the fair value were to occur, the Keystone reporting unit would be at risk of failing step one of the goodwill impairment test.
95
There can be no assurances that the Company will not be required to recognize an impairment of goodwill in the future due to market conditions or other factors related to the performance of the Company’s reporting units. These market events could include a decline over a period of time of the Company’s stock price, a decline over a period of time in valuation multiples of comparable water utilities and reporting unit companies, the lack of an increase in the Company’s market price consistent with its peer companies, decreases in control premiums or continued downward pressure on commodity prices. A decline in the forecasted results in our business plan, such as changes in rate case results or capital investment budgets or changes in our interest rates, could also result in an impairment charge. In regards to the Keystone goodwill, adverse developments in market conditions, including prolonged depression of natural gas or oil prices or other factors that negatively impact our forecast operating results, cash flows or key assumptions in the future could result in an impairment charge of a portion or all of the goodwill balance.
Other Intangible Assets
Included in other long-term assets at
December 31, 2017
and
2016
, is a
$8 million
and
$10 million
, respectively, customer relationship intangible resulting from the Keystone acquisition. This intangible is being amortized on a straight-line basis over a period of
eight
years.
Common Stock
Under the dividend reinvestment and direct stock purchase plan (the “DRIP”), stockholders may reinvest cash dividends and purchase additional Company common stock, up to certain limits, through the plan administrator without commission fees. Shares purchased by participants through the DRIP may be newly-issued shares, treasury shares, or at the Company’s election, shares purchased by the plan administrator in the open market or in privately negotiated transactions. Purchases generally will be made and credited to DRIP accounts once each week. As of
December 31, 2017
, there were approximately
4.3 million
shares available for future issuance under the DRIP.
Anti-dilutive Stock Repurchase Program
In February 2015, the Company’s Board of Directors authorized an anti-dilutive stock repurchase program, which allowed the Company to purchase up to
10 million
shares of its outstanding common stock over an unrestricted period of time. The Company repurchased
0.7 million
shares and
1.0 million
shares of common stock in the open market at an aggregate cost of
$54 million
and
$65 million
under this program for the years ended
December 31, 2017
and
2016
, respectively. As of
December 31, 2017
, there were
6.1 million
shares of common stock available for purchase under the program.
Accumulated Other Comprehensive Loss
The following table presents changes in accumulated other comprehensive loss by component, net of tax, for the years ended
December 31, 2017
and
2016
:
|
|
Defined Benefit Plans
|
Foreign
Currency Translation |
Gain (Loss)
on Cash Flow Hedge |
Accumulated Other
Comprehensive Loss |
|||||||||||||||||||
|
|
Employee
Benefit Plan Funded Status |
Amortization
of Prior Service Cost |
Amortization
of Actuarial Loss |
||||||||||||||||||||
|
Beginning balance as of January 1, 2016
|
$
|
(126
|
)
|
$
|
1
|
|
$
|
36
|
|
$
|
2
|
|
$
|
(1
|
)
|
$
|
(88
|
)
|
|||||
|
Other comprehensive gain (loss) before reclassification
|
(21
|
)
|
—
|
|
—
|
|
—
|
|
17
|
|
(4
|
)
|
|||||||||||
|
Amounts reclassified from accumulated other comprehensive income
|
—
|
|
—
|
|
6
|
|
—
|
|
—
|
|
6
|
|
|||||||||||
|
Net other comprehensive income (loss)
|
(21
|
)
|
—
|
|
6
|
|
—
|
|
17
|
|
2
|
|
|||||||||||
|
Ending balance as of December 31, 2016
|
$
|
(147
|
)
|
$
|
1
|
|
$
|
42
|
|
$
|
2
|
|
$
|
16
|
|
$
|
(86
|
)
|
|||||
|
Other comprehensive gain (loss) before reclassification
|
7
|
|
—
|
|
—
|
|
(1
|
)
|
(6
|
)
|
—
|
|
|||||||||||
|
Amounts reclassified from accumulated other comprehensive income
|
—
|
|
—
|
|
7
|
|
—
|
|
—
|
|
7
|
|
|||||||||||
|
Net other comprehensive income (loss)
|
7
|
|
—
|
|
7
|
|
(1
|
)
|
(6
|
)
|
7
|
|
|||||||||||
|
Ending balance as of December 31, 2017
|
$
|
(140
|
)
|
$
|
1
|
|
$
|
49
|
|
$
|
1
|
|
$
|
10
|
|
$
|
(79
|
)
|
|||||
96
The Company does not reclassify the amortization of defined benefit pension cost components from accumulated other comprehensive loss directly to net income in its entirety, as a portion of these costs have been capitalized as a regulatory asset. These accumulated other comprehensive loss components are included in the computation of net periodic pension cost. See
Note 14—Employee Benefits
.
The amortization of the loss on cash flow hedge is reclassified to net income during the period incurred and is included in interest, net in the accompanying Consolidated Statements of Operations.
The Company has granted stock options and restricted stock unit (“RSU”) awards to non-employee directors, officers and other key employees of the Company pursuant to the terms of its 2007 Omnibus Equity Compensation Plan (the “2007 Plan”). The total aggregate number of shares of common stock that may be issued under the 2007 Plan is
15.5 million
. As of
December 31, 2017
,
7.7 million
shares were available for grant under the 2007 Plan.
On May 12, 2017, the Company’s stockholders approved the American Water Works Company, Inc. 2017 Omnibus Equity Compensation Plan (the “2017 Omnibus Plan”). A total of
7.2 million
shares of common stock may be issued under the 2017 Omnibus Plan. As of
December 31, 2017
,
7.2 million
shares were available for grant under the 2017 Omnibus Plan. The 2017 Omnibus Plan provides that grants of awards may be in any of the following forms: incentive stock options, nonqualified stock options, stock appreciation rights, stock units, stock awards, other stock-based awards and dividend equivalents, which may be granted only on stock units or other stock-based awards. Following the approval of the 2017 Omnibus Plan, no additional awards are to be granted under the 2007 Plan. However, shares will still be issued under the 2007 Plan pursuant to the terms of awards previously issued under that plan prior to May 12, 2017.
The cost of services received from employees in exchange for the issuance of stock options and restricted stock awards is measured based on the grant date fair value of the awards issued. The value of stock options and RSUs awards at the date of the grant is amortized through expense over the three-year service period. All awards granted in
2017
,
2016
and
2015
are classified as equity. The Company recognizes compensation expense for stock awards over the vesting period of the award. The Company stratified its grant populations and used historic employee turnover rates to estimate employee forfeitures. The estimated rate is compared to the actual forfeitures at the end of the reporting period and adjusted as necessary. The following table presents stock-based compensation expense recorded in operation and maintenance expense in the accompanying Consolidated Statements of Operations for the years ended
December 31
:
|
|
2017
|
2016
|
2015
|
||||||||
|
Stock options
|
$
|
1
|
|
$
|
2
|
|
$
|
2
|
|
||
|
RSUs
|
9
|
|
8
|
|
8
|
|
|||||
|
Nonqualified employee stock purchase plan
|
1
|
|
1
|
|
1
|
|
|||||
|
Stock-based compensation
|
11
|
|
11
|
|
11
|
|
|||||
|
Income tax benefit
|
(4
|
)
|
(4
|
)
|
(4
|
)
|
|||||
|
Stock-based compensation expense, net of tax
|
$
|
7
|
|
$
|
7
|
|
$
|
7
|
|
||
There were
no
significant stock-based compensation costs capitalized during the years ended
December 31, 2017
,
2016
and
2015
.
The Company receives a tax deduction based on the intrinsic value of the award at the exercise date for stock options and the distribution date for RSUs. For each award, throughout the requisite service period, the Company recognizes the tax benefits, which have been included in deferred income tax assets, related to compensation costs. The tax deductions in excess of the benefits recorded throughout the requisite service period are recorded to the Consolidated Statements of Operations and are presented in the financing section of the Consolidated Statements of Cash Flows.
Stock Options
There were
no
grants of stock options to employees in
2017
. In
2016
and
2015
, the Company granted non-qualified stock options to certain employees under the 2007 Plan. The stock options vest ratably over the
three
-year service period beginning on January 1 of the year of the grant and have no performance vesting conditions. Expense is recognized using the straight-line method and is amortized over the requisite service period.
97
The following table summarizes the weighted-average assumptions used in the Black-Scholes option-pricing model for grants and the resulting weighted-average grant date fair value per share of stock options granted for the years ended
December 31
:
|
|
2017
|
2016
|
2015
|
||||||||
|
Dividend yield
|
—
|
%
|
2.09
|
%
|
2.35
|
%
|
|||||
|
Expected volatility
|
—
|
%
|
15.89
|
%
|
17.64
|
%
|
|||||
|
Risk-free interest rate
|
—
|
%
|
1.15
|
%
|
1.48
|
%
|
|||||
|
Expected life (years)
|
0
|
|
4.0
|
|
4.4
|
|
|||||
|
Exercise price
|
$
|
—
|
|
$
|
65.25
|
|
$
|
52.75
|
|
||
|
Grant date fair value per share
|
$
|
—
|
|
$
|
6.61
|
|
$
|
6.21
|
|
||
The Company used the actual historical experience of exercises or expirations of the 2009 grant to determine the expected stock option life. The Company began granting stock options at the time of its initial public offering in April 2008. Expected volatility is based on a weighted average of historic volatilities of traded common stock of peer companies (regulated water companies) over the expected term of the stock options and historic volatilities of the Company’s common stock during the period it has been publicly traded. The dividend yield is based on the Company’s expected dividend payments and the stock price on the date of grant. The risk-free interest rate is the market yield on U.S. Treasury strips with maturities similar to the expected term of the stock options. The exercise price of the stock options is equal to the fair market value of the underlying stock on the date of option grant. Stock options vest over periods ranging from
one
to
three
years and have a maximum term of
seven
years from the effective date of the grant.
The table below summarizes stock option activity for the year ended
December 31, 2017
:
|
|
Shares
(In thousands) |
Weighted-
Average Exercise Price (Per share) |
Weighted-
Average Remaining Life (Years) |
Aggregate
Intrinsic Value |
||||||||
|
Options outstanding as of December 31, 2016
|
987
|
|
$
|
50.65
|
|
4.3
|
$
|
21
|
|
|||
|
Granted
|
—
|
|
—
|
|
|
|
||||||
|
Forfeited or expired
|
(14
|
)
|
62.10
|
|
|
|
||||||
|
Exercised
|
(262
|
)
|
42.29
|
|
|
|
||||||
|
Options outstanding as of December 31, 2017
|
711
|
|
$
|
53.51
|
|
3.67
|
$
|
29
|
|
|||
|
Exercisable as of December 31, 2017
|
452
|
|
$
|
48.83
|
|
3.15
|
$
|
21
|
|
|||
As of
December 31, 2017
,
$1 million
of total unrecognized compensation cost related to nonvested stock options is expected to be recognized over the remaining weighted-average period of
1.0
years. The total fair value of stock options vested was
$2 million
,
$1 million
and
$3 million
for the years ended
December 31, 2017
,
2016
and
2015
, respectively.
The following table summarizes additional information regarding stock options exercised during the years ended
December 31
:
|
|
2017
|
2016
|
2015
|
||||||||
|
Intrinsic value
|
$
|
10
|
|
$
|
18
|
|
$
|
22
|
|
||
|
Exercise proceeds
|
11
|
|
15
|
|
30
|
|
|||||
|
Income tax benefit realized
|
3
|
|
6
|
|
7
|
|
|||||
RSUs
During
2017
,
2016
and
2015
, the Company granted RSUs, both with and without performance conditions, to certain employees under the 2007 Plan. RSUs generally vest over periods ranging from
one
to
three
years.
During
2017
, the Company granted RSUs to non-employee directors under the 2017 Omnibus Plan, and during
2016
and
2015
, these awards were granted under the 2007 Plan. The RSUs vested on the date of grant; however, distribution of the shares will be made within 30 days of the earlier of: (i) 15 months after grant date, subject to any deferral election by the director; or (ii) the participant’s separation from service. Because these RSUs vested on the grant date, the total grant date fair value was recorded in operation and maintenance expense on the grant date.
98
The RSUs without performance conditions are valued at the market value of the closing price of the Company’s common stock on the date of the grant and vest ratably over the
three
-year service period beginning January 1 of the year of the grant. These RSUs are amortized through expense over the requisite service period using the straight-line method.
The table below summarizes activity of RSUs without performance conditions for the year ended
December 31, 2017
:
|
|
Shares
(In thousands) |
Weighted
Average Grant Date Fair Value (Per share) |
||||
|
Non-vested total as of December 31, 2016
|
74
|
|
$
|
56.43
|
|
|
|
Granted
|
61
|
|
73.43
|
|
||
|
Vested
|
(42
|
)
|
56.52
|
|
||
|
Forfeited
|
(4
|
)
|
69.09
|
|
||
|
Non-vested total as of December 31, 2017
|
89
|
|
$
|
67.48
|
|
|
RSUs
with performance conditions vest ratably over the three-year performance period beginning January 1 of the year of the grant (the “Performance Period”). Distribution of the performance shares is contingent upon the achievement of internal performance measures and, separately, certain market thresholds over the Performance Period.
RSUs granted with internal performance measures are valued at the market value of the closing price of the Company’s common stock on the date of grant. RSUs granted with market conditions are valued using a Monte Carlo model. Expected volatility is based on historical volatilities of traded common stock of the Company and comparative companies using daily stock prices over the past three years. The expected term is
three
years and the risk-free interest rate is based on the three-year U.S. Treasury rate in effect as of the measurement date. The following table presents the weighted-average assumptions used in the Monte Carlo simulation and the weighted-average grant date fair values of RSUs granted for the years ended
December 31
:
|
|
2017
|
2016
|
2015
|
||||||||
|
Expected volatility
|
17.40
|
%
|
15.90
|
%
|
14.93
|
%
|
|||||
|
Risk-free interest rate
|
1.53
|
%
|
0.91
|
%
|
1.07
|
%
|
|||||
|
Expected life (years)
|
3.0
|
|
3.0
|
|
3.0
|
|
|||||
|
Grant date fair value per share
|
$
|
72.81
|
|
$
|
77.16
|
|
$
|
62.10
|
|
||
The grant date fair value of restricted stock awards that vest ratably and have market and/or performance conditions are amortized through expense over the requisite service period using the graded-vesting method.
The table below summarizes activity of RSUs with performance conditions for the year ended
December 31, 2017
:
|
|
Shares
(In thousands) |
Weighted
Average Grant Date Fair Value (Per share) |
||||
|
Non-vested total as of December 31, 2016
|
309
|
|
$
|
55.94
|
|
|
|
Granted
|
186
|
|
63.10
|
|
||
|
Vested
|
(204
|
)
|
46.10
|
|
||
|
Forfeited
|
(10
|
)
|
70.50
|
|
||
|
Non-vested total as of December 31, 2017
|
281
|
|
$
|
67.33
|
|
|
As of
December 31, 2017
,
$6 million
of total unrecognized compensation cost related to the nonvested RSUs, with and without performance conditions, is expected to be recognized over the weighted-average remaining life of
1.5
years. The total fair value of RSUs, with and without performance conditions, vested was
$16 million
,
$14 million
and
$12 million
for the years ended
December 31, 2017
,
2016
and
2015
, respectively.
99
If dividends are paid with respect to shares of the Company’s common stock before the RSUs are distributed, the Company credits a liability for the value of the dividends that would have been paid if the RSUs were shares of Company common stock. When the RSUs are distributed, the Company pays the participant a lump sum cash payment equal to the value of the dividend equivalents accrued. The Company accrued dividend equivalents totaling
less than $1 million
,
$1 million
and
$1 million
to accumulated deficit in the accompanying Consolidated Statements of Changes in Stockholders’ Equity for the years ended
December 31, 2017
,
2016
and
2015
, respectively.
Employee Stock Purchase Plan
The Company maintains a nonqualified employee stock purchase plan (the “ESPP”) through which employee participants may use payroll deductions to acquire Company common stock at the lesser of
90%
of the fair market value of the common stock at either the beginning or the end of a three-month purchase period. On February 15, 2017, the Board adopted the American Water Works Company, Inc. and its Designated Subsidiaries 2017 Nonqualified Employee Stock Purchase Plan, which was approved by stockholders on May 12, 2017 and took effect on August 5, 2017. The prior plan was terminated as to new purchases of Company stock effective August 31, 2017. As of
December 31, 2017
, there were
2.0 million
shares of common stock reserved for issuance under the ESPP. The ESPP is considered compensatory. During the years ended
December 31, 2017
,
2016
and
2015
, the Company issued
93 thousand
,
93 thousand
and
98 thousand
shares, respectively, under the ESPP.
The Company obtains long-term debt primarily to fund capital expenditures of the
Regulated Businesses
and to refinance debt of the parent company. The following table summarizes the components of long-term debt as of
December 31
:
|
Rate
|
Weighted
Average Rate |
Maturity
|
2017
|
2016
|
||||||||||
|
Long-term debt of American Water Capital Corp.
(a)
|
|
|
|
|
|
|||||||||
|
Senior notes—fixed rate
|
2.95%-8.27%
|
4.47%
|
2018-2047
|
$
|
5,292
|
|
$
|
4,786
|
|
|||||
|
Private activity bonds and government funded debt—fixed rate
|
1.79%-6.25%
|
5.44%
|
2021-2040
|
193
|
|
194
|
|
|||||||
|
Long-term debt of other American Water subsidiaries
|
|
|
|
|
|
|||||||||
|
Private activity bonds and government funded debt—fixed rate
(b)
|
0.00%-6.20%
|
4.59%
|
2018-2041
|
712
|
|
695
|
|
|||||||
|
Mortgage bonds—fixed rate
|
3.92%-9.71%
|
7.41%
|
2019-2039
|
607
|
|
636
|
|
|||||||
|
Mandatorily redeemable preferred stock
|
8.47%-9.75%
|
8.60%
|
2019-2036
|
10
|
|
12
|
|
|||||||
|
Capital lease obligations
|
12.66%
|
12.66%
|
2026
|
1
|
|
1
|
|
|||||||
|
Term loan
|
4.81%-5.31%
|
5.15%
|
2021
|
9
|
|
—
|
|
|||||||
|
Long-term debt
|
|
|
|
6,824
|
|
6,324
|
|
|||||||
|
Unamortized debt premium, net
(c)
|
9
|
|
17
|
|
||||||||||
|
Unamortized debt issuance costs
|
|
|
|
(13
|
)
|
(9
|
)
|
|||||||
|
Interest rate swap fair value adjustment
|
|
|
|
—
|
|
1
|
|
|||||||
|
Less current portion of long-term debt
|
|
|
|
(322
|
)
|
(574
|
)
|
|||||||
|
Total long-term debt
|
|
|
|
$
|
6,498
|
|
$
|
5,759
|
|
|||||
|
(a)
|
This indebtedness is considered “debt” for purposes of a support agreement between American Water and American Water Capital Corp. (“AWCC”), the Company’s wholly owned finance subsidiary, which serves as a functional equivalent of a guarantee by American Water of AWCC’s payment obligations under such indebtedness.
|
|
(b)
|
Includes
$5 million
and
$6 million
of variable rate debt as of
December 31, 2017
and
2016
, respectively, with variable-to-fixed interest rate swaps ranging between
3.93%
and
4.72%
. This debt was assumed via an acquisition in 2013.
|
|
(c)
|
Primarily fair value adjustments previously recognized in acquisition purchase accounting.
|
All mortgage bonds, term loans and
$709 million
of the private activity bonds and government funded debt held by the Company’s subsidiaries were collateralized as of
December 31, 2017
.
Long-term debt indentures contain a number of covenants that, among other things, limit, subject to certain exceptions, the Company from issuing debt secured by the Company’s assets. Certain long term notes require the Company to maintain a ratio of consolidated total indebtedness to consolidated total capitalization of not more than
0.70
to
1.00
. The ratio as of
December 31, 2017
was
0.59
to
1.00
. In addition, the Company has
$922 million
of notes which include the right to redeem the notes at par value, in whole or in part, from time to time, subject to certain restrictions.
100
The following table presents future sinking fund payments and debt maturities:
|
Year
|
Amount
|
|||
|
2018
|
$
|
322
|
|
|
|
2019
|
170
|
|
||
|
2020
|
51
|
|
||
|
2021
|
299
|
|
||
|
2022
|
123
|
|
||
|
Thereafter
|
5,859
|
|
||
The following table details the issuances of long-term debt in
2017
:
|
Company
|
Type
|
Rate
|
Maturity
|
Amount
|
||||||
|
AWCC
|
Senior notes—fixed rate
|
2.95%-3.75%
|
2027-2047
|
$
|
1,350
|
|
||||
|
Other American Water subsidiaries
|
Private activity bonds and government funded debt—fixed rate
|
0.00%-1.44%
|
2020-2037
|
31
|
|
|||||
|
Other American Water subsidiaries
|
Mortgage bonds—fixed rate
|
3.92%
|
2020
|
3
|
|
|||||
|
Other American Water subsidiaries
|
Term loan
|
4.62%-5.12%
|
2021
|
11
|
|
|||||
|
Total issuances
|
|
|
|
$
|
1,395
|
|
||||
The Company also assumed debt of
$7 million
as a result of acquisitions during
2017
, of which
$1 million
was paid subsequent to an acquisition closing during 2017. The remaining
$6 million
of assumed debt has fixed interest rates of
0.00%
and
3.92%
, maturing in
2024
and
2020
, respectively. The Company incurred debt issuance costs of
$17 million
related to the above issuances.
The following table details the long-term debt that was retired through sinking fund provisions, optional redemption or payment at maturity during
2017
:
|
Company
|
Type
|
Rate
|
Maturity
|
Amount
|
||||||
|
AWCC
|
Senior notes—fixed rate
|
5.62%-6.09%
|
2017-2021
|
$
|
844
|
|
||||
|
AWCC
|
Private activity bonds and government funded debt—fixed rate
|
1.79%-2.90%
|
2021-2031
|
1
|
|
|||||
|
Other American Water subsidiaries
|
Private activity bonds and government funded debt—fixed rate
|
0.00%-5.38%
|
2017-2041
|
15
|
|
|||||
|
Other American Water subsidiaries
|
Mortgage bonds—fixed rate
|
7.08%
|
2017
|
33
|
|
|||||
|
Other American Water subsidiaries
|
Mandatorily redeemable preferred stock
|
8.49%-9.18%
|
2031-2036
|
2
|
|
|||||
|
Other American Water subsidiaries
|
Term loan
|
4.31%-5.31%
|
2021
|
1
|
|
|||||
|
Total retirements and redemptions
|
|
|
|
$
|
896
|
|
||||
On
August 10, 2017
, AWCC completed a
$1.35 billion
debt offering which included the sale of
$600 million
aggregate principal amount of its
2.95%
Senior Notes due 2027, and
$750 million
aggregate principal amount of its
3.75%
Senior Notes due in 2047. At the closing of the offering, AWCC received, after deduction of underwriting discounts and debt issuance costs,
$1.33 billion
. On September 13, 2017, AWCC used proceeds from the offering to prepay
$138 million
of its outstanding
5.62%
Series C Senior Notes due December 21, 2018 (“Series C Senior Notes”) and
$181 million
of it’s outstanding
5.77%
Series D Senior Notes due December 21, 2021 (“Series D Senior Notes”). AWCC also used the proceeds of this offering to repay commercial paper obligations and for general corporate purposes, and subsequently, on October 15, 2017, to repay at maturity,
$524 million
of its
6.085%
Senior Notes.
As a result of AWCC’s prepayment of the Series C Senior Notes and Series D Senior Notes, and payment of a make-whole premium amount to the holders thereof of
$34 million
, the Company recorded a
$6 million
charge resulting from the early extinguishment of debt at the parent company. Substantially all of the early debt extinguishment costs allocable to the
Regulated Businesses
were recorded as regulatory assets for the Company believes they are probable of recovery in future rates. Approximately
$1 million
of the early debt extinguishment costs allocable to the
Regulated Businesses
were amortized in 2017.
101
Interest net, includes interest income of approximately
$14 million
,
$14 million
and
$13 million
in
2017
,
2016
and
2015
, respectively.
One of the principal market risks to which the Company is exposed is changes in interest rates. In order to manage the exposure, the Company follows risk management policies and procedures, including the use of derivative contracts such as swaps. The Company reduces exposure to interest rates by managing commercial paper and debt maturities. The Company also does not enter into derivative contracts for speculative purposes and does not use leveraged instruments. The derivative contracts entered into are for periods consistent with the related underlying exposures. The Company is exposed to the risk that counterparties to derivative contracts will fail to meet their contractual obligations and minimizes this risk by dealing only with leading, credit-worthy financial institutions having long-term credit ratings of “A” or better.
On
August 7, 2017
, coinciding with AWCC’s
$1.35 billion
debt offering, the Company terminated
four
existing forward starting swap agreements with an aggregate notional amount of
$300 million
, realizing a gain of
$19 million
to be amortized through interest, net, over
30
years. On February 8, 2017, and December 11, 2017, the Company entered into forward starting swap agreements, each with a notional amount of
$100 million
, to reduce interest rate exposure on debt expected to be issued in 2018. These forward starting swap agreements terminate in November 2018, and have an average fixed rate of
2.59%
. The Company has designated these forward starting swap agreements as cash flow hedges, with their fair values recorded in accumulated other comprehensive gain or loss. Upon termination, the cumulative gain or loss recorded in accumulated other comprehensive gain or loss will be amortized through interest, net, over the term of the new debt.
In October 2017, the Company terminated its interest-rate swap to hedge
$100 million
of its
6.085%
Senior Notes maturing in the fourth quarter of 2017. The Company paid variable interest of six-month LIBOR plus
3.422%
, and had designated this interest rate swap as a fair value hedge, accounted for at fair value with gains or losses, as well as the offsetting gains or losses on the hedged item, recognized in interest, net. The net gain and loss recognized by the Company was de minimis for the periods ended
December 31, 2017
and
2016
.
The Company has employed interest rate swaps to fix the interest cost on a portion of its variable-rate debt with an aggregate notional amount of
$5 million
. The Company has designated these instruments as economic hedges, accounted for at fair value, with gains or losses recognized in interest, net. The gain recognized by the Company was de minimis for the years ended
2017
and
2016
.
The following table provides a summary of the gross fair value for the Company’s derivative asset and liabilities, as well as the location of the asset and liability balances in the Consolidated Balance Sheets as of December 31:
|
Derivative Instruments
|
Derivative Designation
|
Balance Sheet Classification
|
2017
|
2016
|
||||||||
|
Asset derivative:
|
|
|
|
|
||||||||
|
Forward starting swaps
|
Cash flow hedge
|
Other current assets
|
$
|
—
|
|
$
|
27
|
|
||||
|
Interest rate swap
|
Fair value hedge
|
Other current assets
|
—
|
|
1
|
|
||||||
|
Liability derivative:
|
|
|
|
|
||||||||
|
Interest rate swap
|
Fair value hedge
|
Current portion of long-term debt
|
—
|
|
1
|
|
||||||
|
Forward starting swaps
|
Cash flow hedge
|
Other current liabilities
|
3
|
|
—
|
|
||||||
Short-term debt consists of commercial paper and credit facility borrowings totaling
$905 million
and
$849 million
as of
December 31, 2017
and
2016
, respectively. As of
December 31, 2017
there were
no
borrowings outstanding with maturities greater than three months.
AWCC has a revolving credit facility with
$1.75 billion
in aggregate total commitments from a diversified group of financial institutions with a termination date of June 2020. On March 22, 2016, AWCC and its lenders agreed to increase total commitments under AWCC’s revolving credit facility to the
$1.75 billion
, from
$1.25 billion
. Other terms and conditions of the existing facility remained unchanged. The agreement also includes a
$150 million
sublimit for letters of credit and a
$100 million
sublimit for swing loans. On June 30, 2015, AWCC and its lenders extended the termination date of revolving credit facility from October 2018, to June 2020.
This amended and restated agreement also allowed AWCC to request to further extend the term of the credit facility for up to two one-year periods.
Issuance costs related to the increased lending commitments will be amortized over the remaining life of the credit facility and is included in interest, net in the accompanying Consolidated Statements of Operations. Interest on borrowings are based on a LIBOR-based rate, plus an applicable margin.
102
Also, the Company acquired a line of credit facility as part of the Keystone acquisition. This facility has a maximum availability of up to
$12 million
, dependent on a collateral base calculation. Based on the collateral assets at
December 31, 2017
,
$7 million
was available to borrow. At
December 31, 2017
, there were
no
outstanding borrowings on this line of credit facility. Borrowings under the facility are due upon demand with interest being paid monthly. Interest accrues each day at a rate per annum equal to
2.75%
above the greater of the
one month or one day LIBOR
.
The borrowing base under the facility allows for financing up to the greater of the note or 80% of eligible accounts receivable.
The following table summarizes the Company’s aggregate credit facility commitments, letter of credit sub-limit under our revolving credit facility and commercial paper limit, as well as the available capacity for each as of:
|
|
Credit Facility Commitment
|
Available Credit Facility Capacity
|
Letter of Credit Sublimit (a)
|
Available Letter of Credit Capacity
|
Commercial Paper Limit
|
Available Commercial Paper Capacity
|
||||||||||||||||||
|
December 31, 2017
|
$
|
1,762
|
|
$
|
1,673
|
|
$
|
150
|
|
$
|
66
|
|
$
|
1,600
|
|
$
|
695
|
|
||||||
|
December 31, 2016
|
1,766
|
|
1,668
|
|
150
|
|
62
|
|
1,600
|
|
751
|
|
||||||||||||
|
(a)
|
Letters of credit are non-debt instruments maintained to provide credit support for certain transactions as requested by third parties. The Company had
$84 million
and
$88 million
of outstanding letters of credit as of
December 31, 2017
and
2016
, respectively, all of which were issued under the revolving credit facility noted above.
|
The following table summarizes the short-term borrowing activity for AWCC for the years ended
December 31
:
|
|
2017
|
2016
|
|||||
|
Average borrowings
|
$
|
779
|
|
$
|
850
|
|
|
|
Maximum borrowings outstanding
|
1,135
|
|
1,016
|
|
|||
|
Weighted average interest rates, computed on daily basis
|
1.24
|
%
|
0.78
|
%
|
|||
|
Weighted average interest rates, as of December 31
|
1.61
|
%
|
0.98
|
%
|
|||
The credit facility requires the Company to maintain a ratio of consolidated debt to consolidated capitalization of not more than
0.70
to
1.00
. The ratio as of
December 31, 2017
was
0.59
to
1.00
.
None of the Company’s borrowings are subject to default or prepayment as a result of a downgrading of securities, although such a downgrading could increase fees and interest charges under the Company’s credit facility.
As part of the normal course of business, the Company routinely enters contracts for the purchase and sale of water, energy, fuels and other services. These contracts either contain express provisions or otherwise permit the Company and its counterparties to demand adequate assurance of future performance when there are reasonable grounds for doing so. In accordance with the contracts and applicable contract law, if the Company is downgraded by a credit rating agency, especially if such downgrade is to a level below investment grade, it is possible that a counterparty would attempt to rely on such a downgrade as a basis for making a demand for adequate assurance of future performance. Depending on the Company’s net position with the counterparty, the demand could be for the posting of collateral. In the absence of expressly agreed provisions that specify the collateral that must be provided, the obligation to supply the collateral requested will be a function of the facts and circumstances of the Company’s situation at the time of the demand. If the Company can reasonably claim that it is willing and financially able to perform its obligations, it may be possible that no collateral would need to be posted or that only an amount equal to two or three months of future payments should be sufficient. The Company does not expect to post any collateral which will have a material adverse impact on the Company’s results of operations, financial position or cash flows.
The following table summarizes the components of general tax expense for the years ended
December 31
:
|
|
2017
|
2016
|
2015
|
||||||||
|
Gross receipts and franchise
|
$
|
110
|
|
$
|
106
|
|
$
|
99
|
|
||
|
Property and capital stock
|
105
|
|
106
|
|
98
|
|
|||||
|
Payroll
|
31
|
|
32
|
|
31
|
|
|||||
|
Other general
|
13
|
|
14
|
|
15
|
|
|||||
|
Total general taxes
|
$
|
259
|
|
$
|
258
|
|
$
|
243
|
|
||
103
The following table summarizes the components of income tax expense for the years ended
December 31
:
|
|
2017
|
2016
|
2015
|
||||||||
|
Current income taxes
|
|
|
|
||||||||
|
State
|
$
|
25
|
|
$
|
20
|
|
$
|
10
|
|
||
|
Federal
|
(1
|
)
|
1
|
|
—
|
|
|||||
|
Total current income taxes
|
$
|
24
|
|
$
|
21
|
|
$
|
10
|
|
||
|
Deferred income taxes
|
|
|
|
||||||||
|
State
|
$
|
50
|
|
$
|
24
|
|
$
|
32
|
|
||
|
Federal
|
413
|
|
258
|
|
265
|
|
|||||
|
Amortization of deferred investment tax credits
|
(1
|
)
|
(1
|
)
|
(1
|
)
|
|||||
|
Total deferred income taxes
|
462
|
|
281
|
|
296
|
|
|||||
|
Provision for income taxes
|
$
|
486
|
|
$
|
302
|
|
$
|
306
|
|
||
The following is a reconciliation between the statutory federal income tax rate and the Company’s effective tax rate for the years ended
December 31
:
|
|
2017
|
2016
|
2015
|
|||||
|
Income tax at statutory rate
|
35.0
|
%
|
35.0
|
%
|
35.0
|
%
|
||
|
Increases (decreases) resulting from:
|
|
|
|
|||||
|
State taxes, net of federal taxes
|
5.4
|
%
|
3.8
|
%
|
3.6
|
%
|
||
|
Tax Cuts and Jobs Act
|
13.7
|
%
|
—
|
%
|
—
|
%
|
||
|
Other, net
|
(0.8
|
)%
|
0.4
|
%
|
0.5
|
%
|
||
|
Effective tax rate
|
53.3
|
%
|
39.2
|
%
|
39.1
|
%
|
||
On
December 22, 2017
, President Trump signed into law the TCJA. Substantially all of the provisions of the TCJA are effective for taxable years beginning after December 31, 2017. The TCJA includes significant changes to the Internal Revenue Code of 1986, as amended (the “Code”), including amendments which significantly change the taxation of individuals and business entities, and includes specific provisions related to regulated public utilities. The more significant changes that impact the Company included in the TCJA are reductions in the corporate federal income tax rate from
35%
to
21%
, and several technical provisions including, among others, limiting the utilization of net operating losses (“NOLs”) arising after December 31, 2017 to
80%
of taxable income with an indefinite carryforward. The specific provisions related to regulated public utilities in the TCJA generally allow for the continued deductibility of interest expense, the elimination of full expensing for tax purposes of certain property acquired after September 27, 2017 and continue certain rate normalization requirements for accelerated depreciation benefits. Non-regulated segments of the Company’s business will be able to take advantage of the full expensing provisions of the TCJA.
Changes in the Code from the TCJA had a material impact on our financial statements in 2017. Under GAAP, specifically Accounting Standards Codification (“ASC”) Topic 740, Income Taxes, the tax effects of changes in tax laws must be recognized in the period in which the law is enacted. ASC 740 also requires deferred income tax assets and liabilities to be measured at the enacted tax rate expected to apply when temporary differences are to be realized or settled. Thus, at the date of enactment, the Company’s deferred income taxes were re-measured based upon the new tax rate. For the Company’s regulated entities, substantially all of the change in deferred income taxes are recorded as either an offset to a regulatory asset or liability because changes are expected to be recovered by or refunded to customers. For the Company’s unregulated operations, the change in deferred income taxes is recorded as a non-cash re-measurement adjustment to earnings.
104
The staff of the U.S. Securities and Exchange Commission (the “SEC”) has recognized the complexity of reflecting the impacts of the TCJA, and on December 22, 2017 issued guidance in Staff Accounting Bulletin 118 (“SAB 118”) which clarifies accounting for income taxes under ASC 740 if information is not yet available or complete and provides for up to a one year period in which to complete the required analyses and accounting. SAB 118 describes three scenarios or buckets associated with a company’s status of accounting for income tax reform: (1) a company is complete with its accounting for certain effects of tax reform, (2) a company is able to determine a reasonable estimate for certain effects of tax reform and records that estimate as a provisional amount, or (3) a company is not able to determine a reasonable estimate and therefore continues to apply ASC 740, based on the provisions of the tax laws that were in effect immediately prior to the TCJA being enacted. The Company has made a reasonable estimate for the measurement and accounting of certain effects of the TCJA which have been reflected in the December 31, 2017 financial statements. The re-measurement of deferred income taxes at the new federal tax rate increased the 2017 deferred income tax provision by
$125 million
for the year ending December 31, 2017. Additionally, the accumulated deferred income tax liability decreased by
$1.39 billion
and regulatory liabilities increased by
$1.51 billion
, respectively, as of December 31, 2017.
As provided for under SAB 118, the Company has not recorded the impact for certain items under TCJA for which it has not yet been able to gather, prepare and analyze the necessary information in reasonable detail to complete the ASC 740 accounting. For these items, which include the impact of TCJA on state income taxes, the current and deferred income taxes were recognized and measured based on the provisions of the tax laws that were in effect immediately prior to the TCJA being enacted. The current and deferred state taxes are
$25 million
and
$50 million
as of December 31, 2017, respectively. The determination of the impact of the income tax effects of these items and the items reflected as provisional amounts will require additional analysis of historical records and further interpretation of the TCJA from yet to be issued U.S. Treasury regulations which will require more time, information and resources than currently available to the Company.
The following table provides the components of the net deferred tax liability as of
December 31
:
|
|
2017
|
2016
|
|||||
|
Deferred tax assets
|
|
|
|||||
|
Advances and contributions
|
$
|
395
|
|
$
|
540
|
|
|
|
Tax losses and credits
|
256
|
|
301
|
|
|||
|
Regulatory income tax assets
|
327
|
|
—
|
|
|||
|
Pension and other postretirement benefits
|
96
|
|
173
|
|
|||
|
Other
|
49
|
|
90
|
|
|||
|
Total deferred tax assets
|
1,123
|
|
1,104
|
|
|||
|
Valuation allowance
|
(13
|
)
|
(6
|
)
|
|||
|
Total deferred tax assets, net of allowance
|
$
|
1,110
|
|
$
|
1,098
|
|
|
|
Deferred tax liabilities
|
|
|
|
||||
|
Property, plant and equipment
|
$
|
2,489
|
|
$
|
3,339
|
|
|
|
Deferred pension and other postretirement benefits
|
69
|
|
126
|
|
|||
|
Other
|
103
|
|
229
|
|
|||
|
Total deferred tax liabilities
|
2,661
|
|
3,694
|
|
|||
|
Total deferred tax liabilities, net of deferred tax assets
|
$
|
(1,551
|
)
|
$
|
(2,596
|
)
|
|
As of
December 31, 2017
and
2016
, the Company recognized federal NOL carryforwards of
$1.05 billion
and
$1.23 billion
, respectively. The Company believes the federal NOL carryforwards are more likely than not to be recovered and require no valuation allowance. The Company’s federal NOL carryforwards will begin to expire in
2028
.
As of
December 31, 2017
and
2016
, the Company had state NOLs of
$322 million
and
$625 million
, respectively, a portion of which are offset by a valuation allowance because the Company does not believe these NOLs are more likely than not to be realized.
The state NOL carryforwards will begin to expire in 2018 through 2037
.
As of
December 31, 2017
and
2016
, the Company had an insignificant amount of Canadian NOL carryforwards and capital loss carryforwards for federal income tax purposes.
105
The Company files income tax returns in the United States federal jurisdiction and various state and foreign jurisdictions. With few exceptions, the Company is no longer subject to U.S. federal, state or local or non-U.S. income tax examinations by tax authorities for years on or before 2012. The Company has state income tax examinations in progress and does not expect material adjustments to result.
The following table summarizes the changes in the Company’s gross liability, excluding interest and penalties, for unrecognized tax benefits:
|
Balance as of January 1, 2016
|
$
|
233
|
|
|
Increases in current period tax positions
|
10
|
|
|
|
Decreases in prior period measurement of tax positions
|
(74
|
)
|
|
|
Balance as of December 31, 2016
|
$
|
169
|
|
|
Increases in current period tax positions
|
8
|
|
|
|
Decreases in prior period measurement of tax positions
|
(71
|
)
|
|
|
Balance as of December 31, 2017
|
$
|
106
|
|
The Company’s tax positions relate primarily to the deductions claimed for repair and maintenance costs on its utility plant. The gross liability was reduced primarily as a result of the Section 481(a) adjustment allocated for the current year when the Company filed the accounting method change with its 2015 tax return. The Company does not anticipate material changes to its unrecognized tax benefits within the next year. If the Company sustains all of its positions as of
December 31, 2017
, an unrecognized tax benefit of
$10 million
, excluding interest and penalties, would impact the Company’s effective tax rate. The Company had an insignificant amount of interest and penalties related to its tax positions as of
December 31, 2017
and
2016
.
The following table summarizes the changes in the Company’s valuation allowance:
|
Balance as of January 1, 2015
|
$
|
10
|
|
|
Decreases in current period tax positions
|
(2
|
)
|
|
|
Balance as of December 31, 2015
|
$
|
8
|
|
|
Decreases in current period tax positions
|
(2
|
)
|
|
|
Balance as of December 31, 2016
|
$
|
6
|
|
|
Increases in current period tax positions
|
7
|
|
|
|
Balance as of December 31, 2017
|
$
|
13
|
|
Pension and Other Postretirement Benefits
The Company maintains noncontributory defined benefit pension plans covering eligible employees of its regulated utility and shared services operations. Benefits under the plans are based on the employee’s years of service and compensation. The pension plans have been closed for all new employees. The pension plans were closed for most employees hired on or after January 1, 2006. Union employees hired on or after January 1, 2001, except for specific eligible groups specified in the Plan, had their accrued benefit frozen and will be able to receive this benefit as a lump sum upon termination or retirement. Union employees hired on or after January 1, 2001 and non-union employees hired on or after January 1, 2006 are provided with a
5.25%
of base pay defined contribution plan. The Company does not participate in a multi-employer plan. The Company also has unfunded noncontributory supplemental non-qualified pension plans that provide additional retirement benefits to certain employees.
The Company’s pension funding practice is to contribute at least the greater of the minimum amount required by the Employee Retirement Income Security Act of 1974 or the normal cost. Further, the Company will consider additional contributions if needed to avoid “at risk” status and benefit restrictions under the Pension Protection Act of 2006 (“PPA”). The Company may also consider increased contributions, based on other financial requirements and the plans’ funded position. Pension expense in excess of the amount contributed to the pension plans is deferred by certain regulated subsidiaries pending future recovery in rates charged for utility services as contributions are made to the plans. See
Note 6—Regulatory Assets and Liabilities
. Pension plan assets are invested in a number of actively managed, commingled funds, and limited partnerships including equities, fixed income securities, guaranteed annuity contracts with insurance companies, real estate funds and real estate investment trusts (“REITs”).
106
The Company maintains other postretirement benefit plans providing varying levels of medical and life insurance to eligible retirees. The retiree welfare plans are closed for union employees hired on or after January 1, 2006. The plans had previously closed for non-union employees hired on or after January 1, 2002. The Company’s policy is to fund other postretirement benefit costs up to the amount recoverable through rates. Assets of the plans are invested in a number of actively managed and commingled funds including equities and fixed income securities.
The investment policy guidelines of the pension plan require that the fixed income portfolio has an overall weighted-average credit rating of A or better by Standard & Poor’s. None of the Company’s securities are included in pension or other postretirement benefit plan assets. The investment policies’ objectives are focused on reducing the volatility of the plans’ funded status over a long term horizon.
The Company uses fair value for all classes of assets in the calculation of market-related value of plan assets. As of 2017, the fair values and asset allocations of the pension plan assets include the American Water Pension Plan, the New York Water Service Corporation Pension Plan, and the Shorelands Water Company, Inc. Pension Plan.
The fair values and asset allocations of pension plan assets as of
December 31, 2017
and
2016
, respectively, by asset category were as follows:
|
Quoted Prices in Active Markets for Identical Assets
(Level 1) |
Significant Observable Inputs
(Level 2) |
Significant Unobservable Inputs
(Level 3) |
Percentage
of Plan Assets as of |
|||||||||||||||||||
|
2018
|
||||||||||||||||||||||
|
Asset Category
|
Target
Allocation |
Total
|
December 31, 2017
|
|||||||||||||||||||
|
Cash
|
$
|
7
|
|
$
|
7
|
|
$
|
—
|
|
$
|
—
|
|
—
|
|
||||||||
|
Equity securities:
|
50
|
%
|
|
|
|
|
|
|||||||||||||||
|
U.S. large cap
|
344
|
|
344
|
|
—
|
|
—
|
|
21
|
%
|
||||||||||||
|
U.S. small cap
|
84
|
|
79
|
|
5
|
|
—
|
|
5
|
%
|
||||||||||||
|
International
|
295
|
|
2
|
|
149
|
|
144
|
|
18
|
%
|
||||||||||||
|
Real estate fund
|
86
|
|
—
|
|
—
|
|
86
|
|
5
|
%
|
||||||||||||
|
REITs
|
26
|
|
—
|
|
26
|
|
—
|
|
2
|
%
|
||||||||||||
|
Fixed income securities:
|
50
|
%
|
|
|
|
|
|
|
||||||||||||||
|
U.S. Treasury securities and government bonds
|
200
|
|
180
|
|
20
|
|
—
|
|
12
|
%
|
||||||||||||
|
Corporate bonds
|
519
|
|
—
|
|
519
|
|
—
|
|
31
|
%
|
||||||||||||
|
Mortgage-backed securities
|
1
|
|
—
|
|
1
|
|
—
|
|
—
|
|
||||||||||||
|
Municipal bonds
|
31
|
|
—
|
|
31
|
|
—
|
|
2
|
%
|
||||||||||||
|
Long duration bond fund
|
8
|
|
8
|
|
—
|
|
—
|
|
1
|
%
|
||||||||||||
|
Guarantee annuity contracts
|
48
|
|
—
|
|
—
|
|
48
|
|
3
|
%
|
||||||||||||
|
Total
|
100
|
%
|
$
|
1,649
|
|
$
|
620
|
|
$
|
751
|
|
$
|
278
|
|
100
|
%
|
||||||
107
|
Quoted Prices in Active Markets for Identical Assets
(Level 1) |
Significant Observable Inputs
(Level 2) |
Significant Unobservable Inputs
(Level 3) |
Percentage
of Plan Assets as of |
|||||||||||||||||||
|
2017
|
||||||||||||||||||||||
|
Asset Category
|
Target
Allocation |
Total
|
December 31, 2016
|
|||||||||||||||||||
|
Cash
|
$
|
10
|
|
$
|
10
|
|
$
|
—
|
|
$
|
—
|
|
—
|
|
||||||||
|
Equity Securities:
|
60
|
%
|
|
|
|
|
|
|||||||||||||||
|
U.S. large cap
|
316
|
|
316
|
|
—
|
|
—
|
|
22
|
%
|
||||||||||||
|
U.S. small cap
|
134
|
|
134
|
|
—
|
|
—
|
|
9
|
%
|
||||||||||||
|
International
|
259
|
|
—
|
|
259
|
|
—
|
|
18
|
%
|
||||||||||||
|
Real estate fund
|
101
|
|
—
|
|
—
|
|
101
|
|
7
|
%
|
||||||||||||
|
REITs
|
24
|
|
—
|
|
24
|
|
—
|
|
2
|
%
|
||||||||||||
|
Fixed income securities:
|
40
|
%
|
|
|
|
|
|
|
||||||||||||||
|
U.S. Treasury securities and government bonds
|
150
|
|
114
|
|
36
|
|
—
|
|
11
|
%
|
||||||||||||
|
Corporate bonds
|
391
|
|
—
|
|
391
|
|
—
|
|
27
|
%
|
||||||||||||
|
Mortgage-backed securities
|
3
|
|
—
|
|
3
|
|
—
|
|
—
|
|
||||||||||||
|
Long duration bond fund
|
7
|
|
7
|
|
—
|
|
—
|
|
1
|
%
|
||||||||||||
|
Guarantee annuity contracts
|
48
|
|
—
|
|
9
|
|
39
|
|
3
|
%
|
||||||||||||
|
Total
|
100
|
%
|
$
|
1,443
|
|
$
|
581
|
|
$
|
722
|
|
$
|
140
|
|
100
|
%
|
||||||
The following tables present a reconciliation of the beginning and ending balances of the fair value measurements using significant unobservable inputs (Level 3) for
2017
and
2016
, respectively:
|
|
Level 3
|
||
|
Balance as of January 1, 2017
|
$
|
140
|
|
|
Actual return on assets
|
2
|
|
|
|
Purchases, issuances and settlements, net
|
136
|
|
|
|
Balance as of December 31, 2017
|
$
|
278
|
|
|
|
Level 3
|
||
|
Balance as of January 1, 2016
|
$
|
136
|
|
|
Actual return on assets
|
8
|
|
|
|
Purchases, issuances and settlements, net
|
(4
|
)
|
|
|
Balance as of December 31, 2016
|
$
|
140
|
|
The Company’s postretirement benefit plans have different levels of funded status and the assets are held under various trusts. The investments and risk mitigation strategies for the plans are tailored specifically for each trust. In setting new strategic asset mixes, consideration is given to the likelihood that the selected asset allocation will effectively fund the projected plan liabilities and meet the risk tolerance criteria of the Company. The Company periodically updates the long-term, strategic asset allocations for these plans through asset liability studies and uses various analytics to determine the optimal asset allocation. Considerations include plan liability characteristics, liquidity needs, funding requirements, expected rates of return and the distribution of returns. Strategies to address the goal of ensuring sufficient assets to pay benefits include target allocations to a broad array of asset classes and, within asset classes, strategies are employed to provide adequate returns, diversification and liquidity.
In 2012, the Company implemented a de-risking strategy for the American Water Pension Plan after conducting an asset-liability study to reduce the volatility of the funded status of the plan. As part of the de-risking strategy, the Company revised the asset allocations to increase the matching characteristics of fixed-income assets relative to liabilities. The fixed income portion of the portfolio was designed to match the bond-like and long-dated nature of the postretirement liabilities. In 2017, the Company further increased its exposure to liability-driven investing and increased its fixed-income allocation to
50%
, up from 40%, in an effort to further decrease the funded status volatility of the plan and hedge the portfolio from movements in interest rates.
108
In 2012, the Company also implemented a de-risking strategy for the medical bargaining trust within the plan to minimize volatility. In 2017, the Company conducted a new asset-liability study that indicated medical trend inflation that outpaced the Consumer Price Index by more than 2% for the last 20 years. Given continuously rising medical costs, the Company decided to increase the equity exposure of the portfolio to
30%
, up from 20%, while reducing the fixed-income portion of the portfolio from
80%
to 70%. The Company also conducted an asset-liability study for the Post-Retirement Non-Bargaining Medical Plan. Its allocation was adjusted to make it more conservative, reducing the equity allocation from 70% to
60%
and increasing the fixed-income allocation from 30% to
40%
. The Post-Retirement Medical Non-Bargaining plan’s equity allocation was reduced due to the cap on benefits for some non-union participants and resultant reduction in the plan’s liabilities. These changes will take place in 2018.
The Company engages third party investment managers for all invested assets. Managers are not permitted to invest outside of the asset class (e.g. fixed income, equity, alternatives) or strategy for which they have been appointed. Investment management agreements and recurring performance and attribution analysis are used as tools to ensure investment managers invest solely within the investment strategy they have been provided. Futures and options may be used to adjust portfolio duration to align with a plan’s targeted investment policy.
In order to minimize asset volatility relative to the liabilities, a portion of plan assets is allocated to fixed income investments that are exposed to interest rate risk. Increases in interest rates generally will result in a decline in the value of fixed income assets while reducing the present value of the liabilities. Conversely, rate decreases will increase fixed income assets, partially offsetting the related increase in the liabilities. Within equities, risk is mitigated by constructing a portfolio that is broadly diversified by geography, market capitalization, manager mandate size, investment style and process.
Actual allocations to each asset class vary from target allocations due to periodic investment strategy updates, market value fluctuations, the length of time it takes to fully implement investment allocations, and the timing of benefit payments and contributions. The asset allocation is rebalanced on a quarterly basis, if necessary. Voluntary Employees’ Beneficiary Association (“VEBA”) Trust assets include the American Water Post-Retirement Medical Benefits Bargaining Plan, the New York Water Service Corporation Post-Retirement Medical Benefits Bargaining Plan, the American Water Post-Retirement Medical Benefits Non-Bargaining Plan, and the American Water Life Insurance Trust.
109
The fair values and asset allocations of postretirement benefit plan assets as of
December 31, 2017
and
2016
, respectively, by asset category, were as follows:
|
Quoted Prices in Active Markets for Identical Assets
(Level 1) |
Significant Observable Inputs
(Level 2) |
Significant Unobservable Inputs
(Level 3) |
Percentage
of Plan Assets as of |
|||||||||||||||||||
|
2018
|
||||||||||||||||||||||
|
Asset Category
|
Target Allocation
|
Total
|
December 31, 2017
|
|||||||||||||||||||
|
Bargain VEBA:
|
|
|
|
|
|
|
||||||||||||||||
|
Cash
|
$
|
18
|
|
$
|
18
|
|
$
|
—
|
|
$
|
—
|
|
—
|
|
||||||||
|
Equity securities:
|
30
|
%
|
|
|
|
|
|
|||||||||||||||
|
U.S. large cap
|
44
|
|
44
|
|
—
|
|
—
|
|
10
|
%
|
||||||||||||
|
International
|
51
|
|
51
|
|
—
|
|
—
|
|
12
|
%
|
||||||||||||
|
Fixed income securities:
|
70
|
%
|
|
|
|
|
||||||||||||||||
|
U.S. Treasury securities and government bonds
|
48
|
|
21
|
|
27
|
|
—
|
|
11
|
%
|
||||||||||||
|
Corporate bonds
|
233
|
|
—
|
|
233
|
|
—
|
|
55
|
%
|
||||||||||||
|
Municipal bonds
|
26
|
|
—
|
|
26
|
|
—
|
|
6
|
%
|
||||||||||||
|
Long duration bond fund
|
4
|
|
4
|
|
—
|
|
—
|
|
1
|
%
|
||||||||||||
|
Future and option contracts
(a)
|
2
|
|
2
|
|
—
|
|
—
|
|
5
|
%
|
||||||||||||
|
Total bargain VEBA
|
100
|
%
|
$
|
426
|
|
$
|
140
|
|
$
|
286
|
|
$
|
—
|
|
100
|
%
|
||||||
|
Non-bargain VEBA:
|
|
|
|
|
|
|
||||||||||||||||
|
Cash
|
$
|
1
|
|
$
|
1
|
|
$
|
—
|
|
$
|
—
|
|
—
|
|
||||||||
|
Equity securities:
|
60
|
%
|
|
|
|
|
|
|||||||||||||||
|
U.S. large cap
|
53
|
|
53
|
|
—
|
|
—
|
|
37
|
%
|
||||||||||||
|
U.S. small cap
|
5
|
|
5
|
|
—
|
|
—
|
|
4
|
%
|
||||||||||||
|
International
|
47
|
|
47
|
|
—
|
|
—
|
|
33
|
%
|
||||||||||||
|
Fixed income securities:
|
40
|
%
|
|
|
|
|
||||||||||||||||
|
Core fixed income bond fund
(a)
|
36
|
|
36
|
|
—
|
|
—
|
|
26
|
%
|
||||||||||||
|
Total non-bargain VEBA
|
100
|
%
|
$
|
142
|
|
$
|
142
|
|
$
|
—
|
|
$
|
—
|
|
100
|
%
|
||||||
|
Life VEBA:
|
|
|
|
|
|
|
||||||||||||||||
|
Cash
|
$
|
3
|
|
$
|
3
|
|
$
|
—
|
|
$
|
—
|
|
—
|
|
||||||||
|
Equity securities:
|
70
|
%
|
|
|
|
|
|
|||||||||||||||
|
U.S. large cap
|
3
|
|
3
|
|
—
|
|
—
|
|
38
|
%
|
||||||||||||
|
Fixed income securities:
|
30
|
%
|
|
|
|
|
||||||||||||||||
|
Core fixed income bond fund
(a)
|
2
|
|
2
|
|
—
|
|
—
|
|
62
|
%
|
||||||||||||
|
Total life VEBA
|
100
|
%
|
$
|
8
|
|
$
|
8
|
|
$
|
—
|
|
$
|
—
|
|
100
|
%
|
||||||
|
Total
|
100
|
%
|
$
|
576
|
|
$
|
290
|
|
$
|
286
|
|
$
|
—
|
|
100
|
%
|
||||||
|
(a)
|
Includes cash for margin requirements.
|
110
|
Quoted Prices in Active Markets for Identical Assets
(Level 1) |
Significant Observable Inputs
(Level 2) |
Significant Unobservable Inputs
(Level 3) |
Percentage
of Plan Assets as of |
|||||||||||||||||||
|
2017
|
||||||||||||||||||||||
|
Asset Category
|
Target Allocation
|
Total
|
December 31, 2016
|
|||||||||||||||||||
|
Bargain VEBA:
|
|
|
|
|
|
|
||||||||||||||||
|
Equity securities:
|
20
|
%
|
|
|
|
|
|
|||||||||||||||
|
U.S. large cap
|
$
|
35
|
|
$
|
35
|
|
$
|
—
|
|
$
|
—
|
|
9
|
%
|
||||||||
|
International
|
40
|
|
40
|
|
—
|
|
—
|
|
10
|
%
|
||||||||||||
|
Fixed income securities:
|
80
|
%
|
|
|
|
|
||||||||||||||||
|
U.S. Treasury securities and government bonds
|
84
|
|
84
|
|
—
|
|
—
|
|
22
|
%
|
||||||||||||
|
Corporate bonds
|
223
|
|
—
|
|
223
|
|
—
|
|
58
|
%
|
||||||||||||
|
Long duration bond fund
|
3
|
|
3
|
|
—
|
|
—
|
|
1
|
%
|
||||||||||||
|
Future and option contracts
(a)
|
1
|
|
1
|
|
—
|
|
—
|
|
—
|
|
||||||||||||
|
Total bargain VEBA
|
100
|
%
|
$
|
386
|
|
$
|
163
|
|
$
|
223
|
|
$
|
—
|
|
100
|
%
|
||||||
|
Non-bargain VEBA:
|
|
|
|
|
|
|
||||||||||||||||
|
Cash
|
$
|
2
|
|
$
|
2
|
|
$
|
—
|
|
$
|
—
|
|
—
|
|
||||||||
|
Equity securities:
|
70
|
%
|
|
|
|
|
|
|||||||||||||||
|
U.S. large cap
|
29
|
|
29
|
|
—
|
|
—
|
|
22
|
%
|
||||||||||||
|
U.S. small cap
|
30
|
|
30
|
|
—
|
|
—
|
|
22
|
%
|
||||||||||||
|
International
|
37
|
|
37
|
|
—
|
|
—
|
|
28
|
%
|
||||||||||||
|
Fixed income securities:
|
30
|
%
|
|
|
|
|
||||||||||||||||
|
Core fixed income bond fund
|
36
|
|
36
|
|
—
|
|
—
|
|
28
|
%
|
||||||||||||
|
Total non-bargain VEBA
|
100
|
%
|
$
|
134
|
|
$
|
134
|
|
$
|
—
|
|
$
|
—
|
|
100
|
%
|
||||||
|
Life VEBA:
|
|
|
|
|
|
|
||||||||||||||||
|
Equity securities:
|
70
|
%
|
|
|
|
|
|
|||||||||||||||
|
U.S. large cap
|
$
|
3
|
|
$
|
3
|
|
$
|
—
|
|
$
|
—
|
|
60
|
%
|
||||||||
|
Fixed income securities:
|
30
|
%
|
|
|
|
|
||||||||||||||||
|
Core fixed income bond fund
|
2
|
|
2
|
|
—
|
|
—
|
|
40
|
%
|
||||||||||||
|
Total life VEBA
|
100
|
%
|
$
|
5
|
|
$
|
5
|
|
$
|
—
|
|
$
|
—
|
|
100
|
%
|
||||||
|
Total
|
100
|
%
|
$
|
525
|
|
$
|
302
|
|
$
|
223
|
|
$
|
—
|
|
100
|
%
|
||||||
|
(a)
|
Includes cash for margin requirements.
|
Valuation Techniques Used to Determine Fair Value
Cash—Cash and investments with maturities of three months or less when purchased, including certain short-term fixed-income securities, are considered cash and are included in the recurring fair value measurements hierarchy as Level 1.
Equity securities—For equity securities, the trustees obtain prices from pricing services, whose prices are obtained from direct feeds from market exchanges, that the Company is able to independently corroborate. Equity securities are valued based on quoted prices in active markets and categorized as Level 1. Certain equities, such as international securities held in the pension plan are invested in commingled funds and/or limited partnerships. These funds are valued to reflect the plan fund’s interest in the fund based on the reported year-end net asset value. Since net asset value is not directly observable or not available on a nationally recognized securities exchange for the commingled funds, they are categorized as Level 2. For limited partnerships, the assets as a whole are categorized as level 3 due to the fact that the partnership provides the pricing and the pricing inputs are less readily observable. In addition, the limited partnership vehicle cannot be readily traded.
Fixed-income securities—The majority of U.S. Treasury securities and government bonds have been categorized as Level 1 because they trade in highly-liquid and transparent markets and their prices can be corroborated. The fair values of corporate bonds, mortgage backed securities, and certain government bonds are based on prices that reflect observable market information, such as actual trade information of similar securities. They are categorized as Level 2 because the valuations are calculated using models which utilize actively traded market data that the Company can corroborate.
111
Guaranteed annuity contracts are categorized as Level 3 because the investments are not publicly quoted. Since these market values are determined by the provider, they are not highly observable and have been categorized as Level 3. Exchange-traded future and option positions are reported in accordance with changes in variation margins that are settled daily. Exchange-traded options and futures, for which market quotations are readily available, are valued at the last reported sale price or official closing price on the primary market or exchange on which they are traded and are classified as Level 1.
Real estate fund—Real estate fund is categorized as Level 3 as the fund uses significant unobservable inputs for fair value measurement and the vehicle is in the form of a limited partnership.
REITs—REITs are invested in commingled funds. Commingled funds are valued to reflect the plan fund’s interest in the fund based on the reported year-end net asset value. Since the net asset value is not directly observable for the commingled funds, they are categorized as Level 2.
The following table provides a rollforward of the changes in the benefit obligation and plan assets for the most recent two years for all plans combined:
|
|
Pension Benefits
|
Other Benefits
|
|||||||||||||
|
|
2017
|
2016
|
2017
|
2016
|
|||||||||||
|
Change in benefit obligation:
|
|
|
|
|
|||||||||||
|
Benefit obligation as of January 1,
|
$
|
1,864
|
|
$
|
1,720
|
|
$
|
610
|
|
$
|
667
|
|
|||
|
Service cost
|
33
|
|
32
|
|
10
|
|
12
|
|
|||||||
|
Interest cost
|
80
|
|
80
|
|
26
|
|
28
|
|
|||||||
|
Plan participants' contributions
|
—
|
|
—
|
|
2
|
|
2
|
|
|||||||
|
Plan amendments
|
—
|
|
—
|
|
—
|
|
(156
|
)
|
|||||||
|
Actuarial (gain) loss
|
118
|
|
100
|
|
(9
|
)
|
82
|
|
|||||||
|
Acquisitions
|
9
|
|
—
|
|
—
|
|
—
|
|
|||||||
|
Settlements
|
—
|
|
(3
|
)
|
—
|
|
—
|
|
|||||||
|
Gross benefits paid
|
(70
|
)
|
(65
|
)
|
(26
|
)
|
(26
|
)
|
|||||||
|
Federal subsidy
|
—
|
|
—
|
|
1
|
|
1
|
|
|||||||
|
Benefit obligation as of December 31,
|
$
|
2,034
|
|
$
|
1,864
|
|
$
|
614
|
|
$
|
610
|
|
|||
|
Change in plan assets:
|
|
|
|
|
|||||||||||
|
Fair value of plan assets as of January 1,
|
$
|
1,443
|
|
$
|
1,376
|
|
$
|
525
|
|
$
|
500
|
|
|||
|
Actual return on plan assets
|
227
|
|
99
|
|
69
|
|
32
|
|
|||||||
|
Employer contributions
|
42
|
|
36
|
|
6
|
|
17
|
|
|||||||
|
Plan participants' contributions
|
—
|
|
—
|
|
2
|
|
2
|
|
|||||||
|
Settlements
|
—
|
|
(3
|
)
|
—
|
|
—
|
|
|||||||
|
Acquisitions
|
7
|
|
—
|
|
—
|
|
—
|
|
|||||||
|
Benefits paid
|
(70
|
)
|
(65
|
)
|
(26
|
)
|
(26
|
)
|
|||||||
|
Fair value of plan assets as of December 31,
|
$
|
1,649
|
|
$
|
1,443
|
|
$
|
576
|
|
$
|
525
|
|
|||
|
Funded value as of December 31,
|
$
|
(385
|
)
|
$
|
(421
|
)
|
$
|
(38
|
)
|
$
|
(85
|
)
|
|||
|
Amounts recognized in the balance sheet consist of:
|
|
|
|
|
|||||||||||
|
Noncurrent asset
|
$
|
—
|
|
$
|
—
|
|
$
|
2
|
|
$
|
2
|
|
|||
|
Current liability
|
(2
|
)
|
(2
|
)
|
—
|
|
—
|
|
|||||||
|
Noncurrent liability
|
(383
|
)
|
(419
|
)
|
(40
|
)
|
(87
|
)
|
|||||||
|
Net amount recognized
|
$
|
(385
|
)
|
$
|
(421
|
)
|
$
|
(38
|
)
|
$
|
(85
|
)
|
|||
On July 31, 2016, the other postretirement benefit plan was re-measured to reflect a plan amendment, which capped benefits for certain non-union plan participants. The re-measurement included an
$156 million
reduction in future benefits payable to plan participants, and resulted in an
$89 million
reduction to the net accrued postretirement benefit obligation. The plan amendment will be amortized over
10.2
years, the average future working lifetime to full eligibility age for all plan participants.
112
The following table provides the components of the Company’s accumulated other comprehensive income and regulatory assets that have not been recognized as components of periodic benefit costs as of
December 31
:
|
|
Pension Benefits
|
Other Benefits
|
|||||||||||||
|
|
2017
|
2016
|
2017
|
2016
|
|||||||||||
|
Net actuarial loss
|
$
|
416
|
|
$
|
466
|
|
$
|
108
|
|
$
|
170
|
|
|||
|
Prior service cost (credit)
|
2
|
|
2
|
|
(140
|
)
|
(158
|
)
|
|||||||
|
Net amount recognized
|
$
|
418
|
|
$
|
468
|
|
$
|
(32
|
)
|
$
|
12
|
|
|||
|
Regulatory assets (liabilities)
|
$
|
270
|
|
$
|
300
|
|
$
|
(32
|
)
|
$
|
12
|
|
|||
|
Accumulated other comprehensive income
|
148
|
|
168
|
|
—
|
|
—
|
|
|||||||
|
Total
|
$
|
418
|
|
$
|
468
|
|
$
|
(32
|
)
|
$
|
12
|
|
|||
As of
December 31, 2017
and
2016
, the projected benefit obligation, accumulated benefit obligation and fair value of plan assets for pension plans with a projected obligation in excess of plan assets were as follows:
|
Projected Benefit Obligation Exceeds the Fair Value of Plans' Assets
|
|||||||
|
|
2017
|
2016
|
|||||
|
Projected benefit obligation
|
$
|
2,034
|
|
$
|
1,864
|
|
|
|
Fair value of plan assets
|
1,649
|
|
1,443
|
|
|||
|
|
Accumulated Benefit Obligation Exceeds the Fair Value of Plans' Assets
|
||||||
|
|
2017
|
2016
|
|||||
|
Accumulated benefit obligation
|
$
|
1,888
|
|
$
|
1,722
|
|
|
|
Fair value of plan assets
|
1,649
|
|
1,443
|
|
|||
The accumulated postretirement benefit obligation exceeds plan assets for all of the Company’s other postretirement benefit plans, except for the New York Water Medical Benefits Bargaining Trust.
In August 2006, the PPA was signed into law in the U.S. The PPA replaces the funding requirements for defined benefit pension plans by requiring that defined benefit plans contribute to 100% of the current liability funding target over seven years. Defined benefit plans with a funding status of less than 80% of the current liability are defined as being “at risk” and additional funding requirements and benefit restrictions may apply. The PPA was effective for the 2008 plan year with short-term phase-in provisions for both the funding target and at-risk determination. The Company’s qualified defined benefit plan is currently funded above the at-risk threshold, and therefore the Company expects that the plans will not be subject to the “at risk” funding requirements of the PPA. The Company is proactively monitoring the plan’s funded status and projected contributions under the law to appropriately manage the potential impact on cash requirements.
Minimum funding requirements for the qualified defined benefit pension plan are determined by government regulations and not by accounting pronouncements. The Company plans to contribute amounts at least equal to the greater of the minimum required contributions or the normal cost in
2018
to the qualified pension plans. The Company plans to contribute to its
2018
other postretirement benefit cost for rate-making purposes.
Information about the expected cash flows for the pension and postretirement benefit plans is as follows:
|
Pension
Benefits |
Other
Benefits |
||||||
|
2018 expected employer contributions:
|
|
|
|||||
|
To plan trusts
|
$
|
39
|
|
$
|
—
|
|
|
|
To plan participants
|
2
|
|
—
|
|
|||
113
The following table reflects the net benefits expected to be paid from the plan assets or the Company’s assets:
|
|
Pension Benefits
|
Other Benefits
|
|||||||||
|
|
Expected Benefit
Payments |
Expected Benefit
Payments |
Expected Federal
Subsidy Payments |
||||||||
|
2018
|
$
|
77
|
|
$
|
29
|
|
$
|
2
|
|
||
|
2019
|
83
|
|
31
|
|
2
|
|
|||||
|
2020
|
89
|
|
32
|
|
2
|
|
|||||
|
2021
|
94
|
|
34
|
|
2
|
|
|||||
|
2022
|
99
|
|
35
|
|
2
|
|
|||||
|
2022-2026
|
577
|
|
192
|
|
12
|
|
|||||
Because the above amounts are net benefits, plan participants’ contributions have been excluded from the expected benefits.
Accounting for pensions and other postretirement benefits requires an extensive use of assumptions about the discount rate, expected return on plan assets, the rate of future compensation increases received by the Company’s employees, mortality, turnover and medical costs. Each assumption is reviewed annually. The assumptions are selected to represent the average expected experience over time and may differ in any one year from actual experience due to changes in capital markets and the overall economy. These differences will impact the amount of pension and other postretirement benefit expense that the Company recognizes.
The significant assumptions related to the Company’s pension and other postretirement benefit plans were as follows:
|
|
Pension Benefits
|
Other Benefits
|
|||||||||
|
|
2017
|
2016
|
2015
|
2017
|
2016
|
2015
|
|||||
|
Weighted-average assumptions used to determine December 31 benefit obligations:
|
|
|
|
|
|
|
|||||
|
Discount rate
|
3.75%
|
4.28%
|
4.66%
|
3.73%
|
4.26%
|
4.67%
|
|||||
|
Rate of compensation increase
|
3.02%
|
3.07%
|
3.10%
|
N/A
|
N/A
|
N/A
|
|||||
|
Medical trend
|
N/A
|
N/A
|
N/A
|
graded from
|
graded from
|
graded from
|
|||||
|
|
|
|
|
7.00% in 2018
|
7.00% in 2017
|
6.50% in 2016
|
|||||
|
|
|
|
|
to 4.50% in 2026+
|
to 5.00% in 2021+
|
to 5.00% in 2021+
|
|||||
|
Weighted-average assumptions used to determine net periodic cost:
|
|
|
|
|
|
|
|||||
|
Discount rate
|
4.28%
|
4.66%
|
4.24%
|
4.26%
|
3.66%
|
4.24%
|
|||||
|
Expected return on plan assets
|
6.49%
|
7.02%
|
6.91%
|
5.09%
|
5.37%
|
4.92%
|
|||||
|
Rate of compensation increase
|
3.07%
|
3.10%
|
3.12%
|
N/A
|
N/A
|
N/A
|
|||||
|
Medical trend
|
N/A
|
N/A
|
N/A
|
graded from
|
graded from
|
graded from
|
|||||
|
|
|
|
|
7.00% in 2017
|
6.50% in 2016
|
6.75% in 2015
|
|||||
|
|
|
|
|
to 5% in 2021+
|
to 5.00% in 2021+
|
to 5.00% in 2021+
|
|||||
Note: N/A - Assumption is not applicable.
The discount rate assumption was determined for the pension and postretirement benefit plans independently. At year-end 2011, the Company began using an approach that approximates the process of settlement of obligations tailored to the plans’ expected cash flows by matching the plans’ cash flows to the coupons and expected maturity values of individually selected bonds. The yield curve was developed for a universe containing the majority of U.S.-issued AA-graded corporate bonds, all of which were non-callable (or callable with make-whole provisions). Historically, for each plan, the discount rate was developed at the level equivalent rate that would produce the same present value as that using spot rates aligned with the projected benefit payments.
114
The expected long-term rate of return on plan assets is based on historical and projected rates of return, prior to administrative and investment management fees, for current and planned asset classes in the plans’ investment portfolios. Assumed projected rates of return for each of the plans’ projected asset classes were selected after analyzing historical experience and future expectations of the returns and volatility of the various asset classes. Based on the target asset allocation for each asset class, the overall expected rate of return for the portfolio was developed, adjusted for historical and expected experience of active portfolio management results compared to the benchmark returns and for the effect of expenses paid from plan assets. The Company’s pension expense increases as the expected return on assets decreases. The Company used an expected return on plan assets of
6.49%
to estimate its 2017 pension benefit costs, and an expected blended return based on weighted assets of
5.09%
to estimate its 2017 other postretirement benefit costs.
In the determination of year end 2014 projected benefit plan obligations, the Company adopted a new table based on the Society of Actuaries RP 2014 mortality table including a generational BB-2D projection scale. The adoption resulted in a significant increase to pension and other postretirement benefit plans’ projected benefit obligations. In 2015 a new MP 2015 Projection Scale was issued, but not adopted by the Company since all of the experience upon which the MP 2015 Projection Scale is based was considered by the Company in selecting its 2014 assumptions. For year-end 2017, the Company retained the Society of Actuaries RP-2014 mortality table as its base mortality table but adopted the new MP-2017 generational projection scale to project mortality improvements after 2006.
Assumed health care cost trend rates have a significant effect on the amounts reported for the other postretirement benefit plans. The health care cost trend rate is based on historical rates and expected market conditions. A one-percentage-point change in assumed health care cost trend rates would have the following effects:
|
One-Percentage-Point
Increase |
One-Percentage-Point
Decrease |
||||||
|
Effect on total of service and interest cost components
|
$
|
5
|
|
$
|
(4
|
)
|
|
|
Effect on other postretirement benefit obligation
|
73
|
|
(60
|
)
|
|||
The following table provides the components of net periodic benefit costs for the years ended
December 31
:
|
|
2017
|
2016
|
2015
|
||||||||
|
Components of net periodic pension benefit cost:
|
|
|
|
||||||||
|
Service cost
|
$
|
33
|
|
$
|
32
|
|
$
|
37
|
|
||
|
Interest cost
|
80
|
|
80
|
|
74
|
|
|||||
|
Expected return on plan assets
|
(93
|
)
|
(95
|
)
|
(97
|
)
|
|||||
|
Amortization of:
|
|
|
|
||||||||
|
Prior service cost (credit)
|
1
|
|
1
|
|
1
|
|
|||||
|
Actuarial (gain) loss
|
34
|
|
27
|
|
25
|
|
|||||
|
Net periodic pension benefit cost
|
$
|
55
|
|
$
|
45
|
|
$
|
40
|
|
||
|
Other changes in plan assets and benefit obligations recognized in other comprehensive income:
|
|
|
|
||||||||
|
Amortization of prior service credit (cost)
|
$
|
—
|
|
$
|
—
|
|
$
|
—
|
|
||
|
Current year actuarial (gain) loss
|
(7
|
)
|
21
|
|
10
|
|
|||||
|
Amortization of actuarial gain (loss)
|
(7
|
)
|
(6
|
)
|
(5
|
)
|
|||||
|
Total recognized in other comprehensive income
|
$
|
(14
|
)
|
$
|
15
|
|
$
|
5
|
|
||
|
Total recognized in net periodic benefit cost and comprehensive income
|
$
|
41
|
|
$
|
60
|
|
$
|
45
|
|
||
|
Components of net periodic other postretirement benefit cost:
|
|
|
|
||||||||
|
Service cost
|
$
|
10
|
|
$
|
12
|
|
$
|
14
|
|
||
|
Interest cost
|
26
|
|
28
|
|
30
|
|
|||||
|
Expected return on plan assets
|
(26
|
)
|
(27
|
)
|
(26
|
)
|
|||||
|
Amortization of:
|
|
|
|
||||||||
|
Prior service cost (credit)
|
(18
|
)
|
(9
|
)
|
(2
|
)
|
|||||
|
Actuarial (gain) loss
|
10
|
|
5
|
|
5
|
|
|||||
|
Net periodic other postretirement benefit cost
|
$
|
2
|
|
$
|
9
|
|
$
|
21
|
|
||
115
The Company’s policy is to recognize curtailments when the total expected future service of plan participants is reduced by greater than
10%
due to an event that results in terminations and/or retirements.
Cumulative gains and losses that are in excess of
10%
of the greater of either the projected benefit obligation or the fair value of plan assets are amortized over the expected average remaining future service of the current active membership for the plans.
The estimated amounts that will be amortized from accumulated other comprehensive income and regulatory assets into net periodic benefit cost in
2018
are as follows:
|
|
Pension Benefits
|
Other Benefits
|
|||||
|
Actuarial (gain) loss
|
$
|
27
|
|
$
|
4
|
|
|
|
Prior service cost (credit)
|
1
|
|
(18
|
)
|
|||
|
Total
|
$
|
28
|
|
$
|
(14
|
)
|
|
Savings Plans for Employees
The Company maintains 401(k) savings plans that allow employees to save for retirement on a tax-deferred basis. Employees can make contributions that are invested at their direction in one or more funds. The Company makes matching contributions based on a percentage of an employee’s contribution, subject to certain limitations. Due to the Company’s discontinuing new entrants into the defined benefit pension plan, on January 1, 2006 the Company began providing an additional
5.25%
of base pay defined contribution benefit for union employees hired on or after January 1, 2001 and non-union employees hired on or after January 1, 2006. Plan expenses totaled
$13 million
,
$9 million
and
$9 million
for
2017
,
2016
and
2015
, respectively. All of the Company’s contributions are invested in one or more funds at the direction of the employees.
Commitments have been made in connection with certain construction programs. The estimated capital expenditures required under legal and binding contractual obligations amounted to
$475 million
as of
December 31, 2017
.
The Company’s regulated subsidiaries maintain agreements with other water purveyors for the purchase of water to supplement their water supply. The future annual commitments related to minimum quantities of purchased water having non-cancelable terms are as follows:
|
Year
|
Amount
|
||
|
2018
|
$
|
59
|
|
|
2019
|
65
|
|
|
|
2020
|
65
|
|
|
|
2021
|
65
|
|
|
|
2022
|
64
|
|
|
|
Thereafter
|
661
|
|
|
The Company enters into agreements for the provision of services to water and wastewater facilities for the United States military, municipalities and other customers. The Company’s military agreements expire between
2051
and
2068
and have remaining performance commitments as measured by estimated remaining contract revenue of
$3.6 billion
as of
December 31, 2017
. The military agreements are subject to customary termination provisions held by the U.S. government prior to the agreed upon contract expiration. The Company’s O&M agreements with municipalities and other customers expire between
2018
and
2038
and have remaining performance commitments as measured by estimated remaining contract revenue of
$711 million
as of
December 31, 2017
. Some of the Company’s long-term contracts to operate and maintain a municipality’s, federal government’s or other party’s water or wastewater treatment and delivery facilities include responsibility for certain maintenance for some of those facilities, in exchange for an annual fee. Unless specifically required to perform certain maintenance activities, the maintenance costs are recognized when the maintenance is performed.
116
Contingencies
The Company is routinely involved in legal actions incident to the normal conduct of its business. As of
December 31, 2017
, the Company has accrued approximately
$135 million
of probable loss contingencies and has estimated that the maximum amount of losses associated with reasonably possible loss contingencies that can be reasonably estimated is
$27 million
. For certain matters, claims and actions, the Company is unable to estimate possible losses. The Company believes that damages or settlements, if any, recovered by plaintiffs in such matters, claims or actions, other than as described in this
Note 15—Commitments and Contingencies
, will not have a material adverse effect on the Company.
West Virginia Elk River Freedom Industries Chemical Spill
Background
On January 9, 2014, a chemical storage tank owned by Freedom Industries, Inc. leaked two substances, 4-methylcyclohexane methanol (“MCHM”), and PPH/DiPPH, a mix of polyglycol ethers, into the Elk River near the West Virginia-American Water Company (“WVAWC”) treatment plant intake in Charleston, West Virginia. After having been alerted to the leak of MCHM by the West Virginia Department of Environmental Protection, WVAWC took immediate steps to gather more information about MCHM, augment its treatment process as a precaution, and begin consultations with federal, state and local public health officials. As soon as possible after it was determined that the augmented treatment process would not fully remove the MCHM, a joint decision was reached in consultation with the West Virginia Bureau for Public Health to issue a “Do Not Use” order for all of its approximately
93,000
customer accounts in parts of nine West Virginia counties served by the Charleston treatment plant. By January 18, 2014, none of WVAWC’s customers were subject to the Do Not Use order.
Following the Freedom Industries chemical spill, numerous lawsuits were filed against WVAWC and certain other Company affiliated entities (collectively, the “American Water Defendants”) with respect to this matter in the U.S. District Court for the Southern District of West Virginia or West Virginia Circuit Courts in Kanawha, Boone and Putnam counties, and to date, more than
70
cases remain pending.
Four
of the cases pending before the U.S. district court were consolidated for purposes of discovery, and an amended consolidated class action complaint for those cases (the “Federal action”) was filed in December 2014 by several plaintiffs. In January 2016, all of the then-filed state court cases were referred to West Virginia’s Mass Litigation Panel for further proceedings, which have been stayed until April 22, 2018 pending the approval by the court in the Federal action of a global agreement to settle all of such cases, as described below. The court in the Federal action has continued the start of the trial indefinitely pending ongoing settlement approval activities.
Proposed Global Class Action Settlement
In October 2016, the court in the Federal action approved the preliminary principles, terms and conditions of a binding global agreement in principle to settle claims among the American Water Defendants, and all class members, putative class members, claimants and potential claimants, arising out of the Freedom Industries chemical spill. On April 27, 2017, the parties filed with the court in the Federal action a proposed settlement agreement providing details of the terms of the settlement of these matters and requesting that the court in the Federal action grant preliminary approval of such settlement. On July 6, 2017, the court in the Federal action issued an opinion denying without prejudice the joint motion for preliminary approval of the Settlement. On August 25, 2017, the parties filed a proposed amended settlement agreement and related materials addressing the matters set forth in the July 6, 2017 order.
On September 21, 2017, the court in the Federal action issued an order granting preliminary approval of a settlement class and proposed class action settlement (the “Settlement”) with respect to claims against the American Water Defendants by all putative class members (collectively, the “Plaintiffs”) for all claims and potential claims arising out of the Freedom Industries chemical spill. The Settlement proposes a global resolution of all federal and state litigation and potential claims against the American Water Defendants and their insurers. Under the terms and conditions of the Settlement and the proposed amended settlement agreement, the American Water Defendants have not admitted, and will not admit, any fault or liability for any of the allegations made by the Plaintiffs in any of the actions to be resolved. Under federal class action rules, claimants had the right, until December 8, 2017, to elect to opt out of the final Settlement, in which case such claimant would not receive any benefit from or be bound by the terms of the Settlement. As of January 31, 2018, less than
100
of the
225,000
estimated putative Plaintiffs have submitted opt-out notices. The deadline to file a claim in the Settlement is February 21, 2018.
117
The proposed aggregate pre-tax amount of the Settlement with respect to the Company is
$126 million
. The aggregate portion of the Settlement to be contributed by WVAWC, net of insurance recoveries, is
$43 million
(approximately
$26 million
after-tax), taking into account the September 2017 settlement with one of the Company’s general liability insurance carriers discussed below. Another defendant to the Settlement is to contribute up to
$25 million
to the Settlement. Two of the Company’s general liability insurance carriers, which provide an aggregate of
$50 million
in insurance coverage to the Company under these policies, had been originally requested to participate in the Settlement at the time of the initial filing of the binding agreement in principle with the court in the Federal action, but did not agree to do so at that time. WVAWC filed a lawsuit against one of these carriers alleging that the carrier’s failure to agree to participate in the Settlement constituted a breach of contract. On September 19, 2017, the Company and the insurance carrier settled this lawsuit for
$22 million
, out of a maximum of
$25 million
in potential coverage under the terms of the relevant policy, in exchange for a full release by the Company and WVAWC of all claims against the insurance carrier related to the Freedom Industries chemical spill. WVAWC and the settling insurer have agreed to stay this litigation pending final approval of the Settlement. The Company and WVAWC continue to pursue vigorously their rights to insurance coverage for contributions by WVAWC to the Settlement in mandatory arbitration with the remaining non-participating carrier. This arbitration proceeding remains pending.
The proposed Settlement would establish a two-tier settlement fund for the payment of claims, comprised of (i) a simple claim fund, which is also referred to as the “guaranteed fund,” of
$76 million
, of which
$29 million
will be contributed by WVAWC, including insurance deductibles, and
$47 million
would be contributed by two of the Company’s general liability insurance carriers, and (ii) an individual review claim fund of up to
$50 million
, of which up to
$14 million
would be contributed by WVAWC and up to
$36 million
would be contributed by a number of the Company’s general liability insurance carriers. Separately, up to
$25 million
would be contributed to the guaranteed fund by another defendant to the Settlement. If any final approval order by the court in the Federal action with respect to the Settlement is appealed and such appeal would delay potential payment to claimants under the Settlement, WVAWC and the other defendant to the Settlement will contribute up to
$50 million
and
$25 million
, respectively, to the Settlement (not including, in the case of WVAWC, any contributions by the Company’s general liability insurance carriers which would not be made until such time as a final, non-appealable order is issued) into an escrow account during the pendency of such appeals. For certain claims, WVAWC and the other defendant to the Settlement may, in lieu of these escrowed contributions, make advance payments of such claims if agreed to by the parties. All administrative expenses of the Settlement and attorneys’ fees of class counsel related thereto would be paid from the funds designated to pay claims covered by the Settlement.
As a result of these events, in the third quarter of 2016, the Company recorded a charge to earnings, net of insurance receivables, of
$65 million
(
$39 million
after-tax). Additionally, in the third quarter of 2017, the Company recorded a benefit of
$22 million
(
$13 million
after-tax) as an additional insurance receivable reflecting the settlement with the insurance carrier described above. The settlement amount of
$126 million
is reflected in Accrued Liabilities and the offsetting insurance receivables are reflected in Other Current Assets in the Consolidated Balance Sheet as of
December 31, 2017
. The Company intends to fund WVAWC’s contributions to the Settlement through existing sources of liquidity, although no contribution by WVAWC will be required unless and until the terms of the Settlement are finally approved by the court in the Federal action. Furthermore, under the terms of the Settlement, WVAWC has agreed that it will not seek rate recovery from the Public Service Commission of West Virginia (the “PSC”) for approximately
$4 million
in direct response costs expensed in 2014 by WVAWC relating to the Freedom Industries chemical spill as well as for amounts paid by WVAWC under the Settlement.
The Company’s insurance policies operate under a layered structure where coverage is generally provided in the upper layers after claims have exhausted lower layers of coverage. The
$36 million
to be contributed by a number of the Company’s general liability insurance carriers to the individual review claim fund, as noted above, is from higher layers of the insurance structure than the insurance carrier that was requested, but presently has not agreed, to participate in the Settlement. Any recovery by WVAWC or the Company from the remaining non-participating carrier would reimburse WVAWC for its contributions to the guaranteed fund.
Notice of the terms of the Settlement to members of the settlement class commenced on October 11, 2017. Following the notice period, on January 9, 2018, the court in the Federal action held a fairness hearing to consider final approval of the Settlement, which was continued on February 1, 2018 to address certain open matters. At this hearing, the court in the Federal action indicated that it intended to enter an order approving the Settlement, and the parties submitted a proposed order to the court on February 2, 2018.
Other Related Proceedings
Additionally, investigations with respect to the matter have been initiated by the U.S. Chemical Safety and Hazard Investigation Board (the “CSB”), the U.S. Attorney’s Office for the Southern District of West Virginia, the West Virginia Attorney General, and the PSC. As a result of the U.S. Attorney’s Office investigation, Freedom Industries and six former Freedom Industries employees (three of whom also were former owners of Freedom Industries), pled guilty to violations of the federal Clean Water Act. Moreover, the PSC issued an order on June 15, 2017 concluding its investigation without requiring WVAWC to take any further action with respect to the matters covered by the general investigation.
118
The CSB is an independent investigatory agency with no regulatory mandate or ability to issue fines or citations; rather, the CSB can only issue recommendations for further action. In response to the Freedom Industries chemical spill, the CSB commenced an investigation shortly thereafter. In September 2016, the CSB issued and adopted its investigation report in which it recommended that the Company conduct additional source water protection activities. On April 4, 2017, the CSB indicated that the implementation by the Company of source water protection activities resolved the first two parts of the CSB’s recommendation. The CSB also noted that compliance by the Company with the third part of its recommendation is ongoing and that closure of this part is contingent upon completion of updated contingency planning for the Company’s water utilities outside of West Virginia. In light of public response to its original September 2016 investigation report, on May 11, 2017, the CSB issued a new version of this report. The primary substantive change addressed CSB’s factual evaluation of the duration and volume of contamination from the leaking tank, decreasing its estimate of the leak time but increasing the volume estimate by 10%. No substantive changes were made to the conclusions and recommendations in the original report. The Company has submitted an updated report on contingency planning and is awaiting CSB’s further review.
On March 16, 2017, the Lincoln County (West Virginia) Commission (the “LCC”) passed a county ordinance entitled the “Lincoln County, WV Comprehensive Public Nuisance Investigation and Abatement Ordinance.” The ordinance establishes a mechanism that Lincoln County believes will allow it to pursue criminal or civil proceedings for the “public nuisance” it alleges was caused by the Freedom Industries chemical spill. On April 20, 2017, the LCC filed a complaint in Lincoln County state court against WVAWC and certain other defendants not affiliated with the Company, alleging that the Freedom Industries chemical spill caused a public nuisance in Lincoln County. The complaint seeks an injunction against WVAWC that would require the creation of various databases and public repositories of documents related to the Freedom Industries chemical spill, as well as further study and risk assessments regarding the alleged exposure of Lincoln County residents to the released chemicals. On June 12, 2017, the Mass Litigation Panel entered an order granting a motion to transfer this case to its jurisdiction and stayed the case consistent with the existing stay order. The LCC has elected to opt out of the Settlement. On January 26, 2018, the LCC filed a motion seeking to lift the stay imposed by the Mass Litigation Panel. This motion is pending. WVAWC believes that this lawsuit is without merit and intends to vigorously contest the claims and allegations raised in the complaint.
California Public Utilities Commission Residential Rate Design Proceeding
In December 2016, the CPUC issued a final decision in a proceeding involving California-American Water Company, a wholly owned subsidiary of the Company (“Cal Am”), adopting a new residential rate design for Cal Am’s Monterey District. The decision allowed for recovery by Cal Am of
$32 million
in under-collections in the water revenue adjustment mechanism/modified cost balancing account (“WRAM/MCBA”) over a
five
-year period, plus interest, and modified existing conservation and rationing plans. In its decision, the CPUC noted concern regarding Cal Am’s residential tariff administration, specifically regarding the lack of verification of customer-provided information about the number of residents per household. This information was used for generating billing determinants under the tiered rate system. As a result, the CPUC kept this proceeding open to address several issues, including whether Cal Am’s residential tariff administration violated a statute, rule or CPUC decision, and if so, whether a penalty should be imposed.
On February 24, 2017, Cal Am, the Monterey Peninsula Water Management District, the CPUC’s Office of Ratepayer Advocates, and the Coalition of Peninsula Businesses filed for CPUC approval of a joint settlement agreement (the “Joint Settlement Agreement”), which among other things, proposed to resolve the CPUC’s residential tariff administration concerns by providing for a waiver by Cal Am of
$0.5 million
of cost recovery for residential customers through the WRAM/MCBA in lieu of a penalty. Approval of the Joint Settlement Agreement, which is required for it to take effect, remains pending before the CPUC.
On March 28, 2017, the administrative law judge assigned to the proceeding issued a ruling stating there was sufficient evidence to conclude, on a preliminary basis, that Cal Am’s administration of the residential tariff violated certain provisions of the California Public Utilities Code and a CPUC decision. The ruling ordered Cal Am to show cause why it should not be penalized for these administrative violations and directed the settling parties to address whether the cost recovery waiver in the Joint Settlement Agreement was reasonable compared to a potential penalty range described by the administrative law judge. During hearings held on April 13-14, 2017, the administrative law judge clarified that this potential penalty range is
$3 million
to
$179 million
(calculated as a continuing violation dating back to 2000 and applying penalties of up to
$20,000
per day until January 1, 2012 and penalties of up to
$50,000
per day thereafter, reflecting a 2012 change to the relevant statute). The administrative law judge also noted that a per diem penalty may not be appropriate, as Cal Am’s monthly billing practices did not allow Cal Am to update customer-provided information for billing purposes on a daily basis. Hearings before the administrative law judge in this matter were held in August, September and November 2017. Cal Am also submitted additional testimony on the issue of whether Cal Am should be penalized, and if so, the reasonable amount of any such penalty. This proceeding remains pending, and the CPUC has set a statutory deadline of September 30, 2018 for the completion of the proceeding.
As of
December 31, 2017
, the portions of this loss contingency that are probable and/or reasonably possible have been determined to be immaterial to the Company and have been included in the aggregate maximum amounts described above in the paragraph under “Contingencies” in this Note 15.
119
Dunbar, West Virginia Water Main Break Class Action Litigation
On the evening of June 23, 2015, a 36-inch pre-stressed concrete transmission water main, installed in the early 1970s, failed. The water main is part of WVAWC’s West Relay pumping station located in the City of Dunbar. The failure of the main caused water outages and low pressure to up to approximately
25,000
WVAWC customers. In the early morning hours of June 25, 2015, crews completed a repair, but that same day, the repair developed a leak. On June 26, 2015, a second repair was completed and service was restored that day to approximately
80%
of the impacted customers, and to the remaining approximately
20%
by the next morning. The second repair showed signs of leaking but the water main was usable until June 29, 2015 to allow tanks to refill. The system was reconfigured to maintain service to all but approximately
3,000
customers while a final repair was completed safely on June 30, 2015. Water service was fully restored on July 1, 2015 to all customers affected by this event.
On June 2, 2017, a class action complaint was filed in West Virginia Circuit Court in Kanawha County against WVAWC on behalf of a purported class of residents and business owners who lost water service or pressure as a result of the Dunbar main break. The complaint alleges breach of contract by WVAWC for failure to supply water, violation of West Virginia law regarding the sufficiency of WVAWC’s facilities and negligence by WVAWC in the design, maintenance and operation of the water system. The plaintiffs seek unspecified alleged damages on behalf of the class for lost profits, annoyance and inconvenience, and loss of use, as well as punitive damages for willful, reckless and wanton behavior in not addressing the risk of pipe failure and a large outage.
On October 12, 2017, WVAWC filed with the court a motion seeking to dismiss all of the plaintiffs’ counts alleging statutory and common law tort claims. Furthermore, WVAWC asserts that the PSC, and not the court, has primary jurisdiction over allegations involving violations of the applicable tariff, the public utility code and related rules. This motion remains pending.
The Company and WVAWC believe that WVAWC has valid, meritorious defenses to the claims raised in this class action complaint. WVAWC is vigorously defending itself against these allegations. Given the current stage of this proceeding, the Company cannot reasonably estimate the amount of any reasonably possible losses or a range of such losses related to this proceeding.
The following is a reconciliation of the numerator and denominator for basic and diluted earnings per share (“EPS”) calculations for the years ended
December 31
:
|
|
2017
|
2016
|
2015
|
||||||||
|
Numerator:
|
|
|
|
||||||||
|
Net income attributable to common stockholders
|
$
|
426
|
|
$
|
468
|
|
$
|
476
|
|
||
|
Denominator:
|
|
|
|
|
|
|
|||||
|
Weighted average common shares outstanding—Basic
|
178
|
|
178
|
|
179
|
|
|||||
|
Effect of dilutive common stock equivalents
|
1
|
|
1
|
|
1
|
|
|||||
|
Weighted average common shares outstanding—Diluted
|
179
|
|
179
|
|
180
|
|
|||||
The effect of dilutive common stock equivalents is related to RSUs and performance stock units granted under the 2007 and 2017 Omnibus Equity Compensation Plans, as well as shares purchased under the ESPP. Less than
one million
share-based awards were excluded from the computation of diluted EPS for the years ended
December 31, 2017
,
2016
and
2015
because their effect would have been anti-dilutive under the treasury stock method.
The following methods and assumptions were used by the Company in estimating its fair value disclosures for financial instruments:
Current assets and current liabilities—The carrying amounts reported in the Consolidated Balance Sheets for current assets and current liabilities, including revolving credit debt, due to the short-term maturities and variable interest rates, approximate their fair values.
120
Preferred stock with mandatory redemption requirements and long-term debt—The fair values of preferred stock with mandatory redemption requirements and long-term debt are categorized within the fair value hierarchy based on the inputs that are used to value each instrument. The fair value of long-term debt classified as Level 1 is calculated using quoted prices in active markets. Level 2 instruments are valued using observable inputs and Level 3 instruments are valued using observable and unobservable inputs. The fair values of instruments classified as Level 2 and 3 are determined by a valuation model that is based on a conventional discounted cash flow methodology and utilizes assumptions of current market rates. As a majority of the Company’s debts do not trade in active markets, the Company calculated a base yield curve using a risk-free rate (a U.S. Treasury securities yield curve) plus a credit spread that is based on the following two factors: an average of the Company’s own publicly-traded debt securities and the current market rates for U.S. Utility A debt securities. The Company used these yield curve assumptions to derive a base yield for the Level 2 and Level 3 securities. Additionally, the Company adjusted the base yield for specific features of the debt securities including call features, coupon tax treatment and collateral for the Level 3 instruments.
The carrying amounts, including fair value adjustments previously recognized in acquisition purchase accounting and a fair value adjustment related to the Company’s interest rate swap fair value hedge (which is classified as Level 2 in the fair value hierarchy), and fair values of the financial instruments were as follows:
|
|
Carrying Amount
|
December 31, 2017
|
|||||||||||||||||
|
|
L
e
vel 1
|
Level 2
|
Level 3
|
Total
|
|||||||||||||||
|
Preferred stock with mandatory redemption requirements
|
$
|
10
|
|
$
|
—
|
|
$
|
—
|
|
$
|
14
|
|
$
|
14
|
|
||||
|
Long-term debt (excluding capital lease obligations)
|
6,809
|
|
4,846
|
|
976
|
|
1,821
|
|
7,643
|
|
|||||||||
|
|
Carrying Amount
|
December 31, 2016
|
|||||||||||||||||
|
|
L
e
vel 1
|
Level 2
|
Level 3
|
Total
|
|||||||||||||||
|
Preferred stock with mandatory redemption requirements
|
$
|
12
|
|
$
|
—
|
|
$
|
—
|
|
$
|
15
|
|
$
|
15
|
|
||||
|
Long-term debt (excluding capital lease obligations)
|
6,320
|
|
3,876
|
|
1,363
|
|
1,805
|
|
7,044
|
|
|||||||||
Fair Value Measurements
To increase consistency and comparability in fair value measurements, GAAP establishes a fair value hierarchy that prioritizes the inputs to valuation techniques used to measure fair value into three levels as follows:
|
•
|
Level 1—quoted prices (unadjusted) in active markets for identical assets or liabilities that the Company has the ability to access as of the reporting date. Financial assets and liabilities utilizing Level 1 inputs include active exchange-traded equity securities, exchange-based derivatives, mutual funds and money market funds.
|
|
•
|
Level 2—inputs other than quoted prices included within Level 1 that are directly observable for the asset or liability or indirectly observable through corroboration with observable market data. Financial assets and liabilities utilizing Level 2 inputs include fixed income securities, non-exchange-based derivatives, commingled investment funds not subject to purchase and sale restrictions and fair-value hedges.
|
|
•
|
Level 3—unobservable inputs, such as internally-developed pricing models for the asset or liability due to little or no market activity for the asset or liability. Financial assets and liabilities utilizing Level 3 inputs include infrequently-traded non-exchange-based derivatives and commingled investment funds subject to purchase and sale restrictions.
|
121
Recurring Fair Value Measurements
The following table presents assets and liabilities measured and recorded at fair value on a recurring basis and their level within the fair value hierarchy as of
December 31, 2017
and
2016
, respectively:
|
|
December 31, 2017
|
||||||||||||||
|
|
Level 1
|
Level 2
|
Level 3
|
Total
|
|||||||||||
|
Assets:
|
|
|
|
|
|||||||||||
|
Restricted funds
|
$
|
28
|
|
$
|
—
|
|
$
|
—
|
|
$
|
28
|
|
|||
|
Rabbi trust investments
|
15
|
|
—
|
|
—
|
|
15
|
|
|||||||
|
Deposits
|
4
|
|
—
|
|
—
|
|
4
|
|
|||||||
|
Other investments
|
3
|
|
—
|
|
—
|
|
3
|
|
|||||||
|
Total assets
|
50
|
|
—
|
|
—
|
|
50
|
|
|||||||
|
Liabilities:
|
|
|
|
|
|||||||||||
|
Deferred compensation obligation
|
17
|
|
—
|
|
—
|
|
17
|
|
|||||||
|
Mark-to-market derivative liability
|
—
|
|
3
|
|
—
|
|
3
|
|
|||||||
|
Total liabilities
|
17
|
|
3
|
|
—
|
|
20
|
|
|||||||
|
Total net assets (liabilities)
|
$
|
33
|
|
$
|
(3
|
)
|
$
|
—
|
|
$
|
30
|
|
|||
|
|
December 31, 2016
|
||||||||||||||
|
|
Level 1
|
Level 2
|
Level 3
|
Total
|
|||||||||||
|
Assets:
|
|
|
|
|
|||||||||||
|
Restricted funds
|
$
|
24
|
|
$
|
—
|
|
$
|
—
|
|
$
|
24
|
|
|||
|
Rabbi trust investments
|
12
|
|
—
|
|
—
|
|
12
|
|
|||||||
|
Deposits
|
3
|
|
—
|
|
—
|
|
3
|
|
|||||||
|
Mark-to-market derivative asset
|
—
|
|
28
|
|
—
|
|
28
|
|
|||||||
|
Other investments
|
1
|
|
—
|
|
—
|
|
1
|
|
|||||||
|
Total assets
|
40
|
|
28
|
|
—
|
|
68
|
|
|||||||
|
Liabilities:
|
|
|
|
|
|||||||||||
|
Deferred compensation obligation
|
13
|
|
—
|
|
—
|
|
13
|
|
|||||||
|
Mark-to-market derivative liability
|
—
|
|
—
|
|
—
|
|
—
|
|
|||||||
|
Total liabilities
|
13
|
|
—
|
|
—
|
|
13
|
|
|||||||
|
Total net assets (liabilities)
|
$
|
27
|
|
$
|
28
|
|
$
|
—
|
|
$
|
55
|
|
|||
Restricted funds—The Company’s restricted funds primarily represent proceeds received from financings for the construction and capital improvement of facilities and from customers for future services under operations and maintenance projects. Long-term restricted funds of
$1 million
and
$4 million
were included in other long-term assets as of
December 31, 2017
and
2016
, respectively.
Rabbi trust investments—The Company’s Rabbi trust investments consist of equity and index funds from which supplemental executive retirement plan benefits and deferred compensation obligations can be paid. The Company includes these assets in other long-term assets.
Deposits—Deposits include escrow funds and certain other deposits held in trust. The Company includes cash deposits in other current assets.
Deferred compensation obligations—The Company’s deferred compensation plans allow participants to defer certain cash compensation into notional investment accounts. The Company includes such plans in other long-term liabilities. The value of the Company’s deferred compensation obligations is based on the market value of the participants’ notional investment accounts. The notional investments are comprised primarily of mutual funds, which are based on observable market prices.
122
Mark-to-market derivative asset and liability—The Company utilizes fixed-to-floating interest-rate swaps, typically designated as fair-value hedges, to achieve a targeted level of variable-rate debt as a percentage of total debt. The Company also employs derivative financial instruments in the form of variable-to-fixed interest rate swaps and forward starting interest rate swaps, classified as economic hedges and cash flow hedges, respectively, in order to fix the interest cost on existing or forecasted debt. The Company uses a calculation of future cash inflows and estimated future outflows, which are discounted, to determine the current fair value. Additional inputs to the present value calculation include the contract terms, counterparty credit risk, interest rates and market volatility.
Other investments—Other investments primarily represent money market funds used for active employee benefits. The Company includes other investments in other current assets.
The Company has entered into operating leases involving certain facilities and equipment. Rental expenses under operating leases were
$29 million
,
$24 million
and
$21 million
for the years ended
December 31, 2017
,
2016
and
2015
, respectively. The operating leases for facilities will expire over the next
25
years and the operating leases for equipment will expire over the next
5
years. Certain operating leases have renewal options ranging from one to five years.
The minimum annual future rental commitment under operating leases that have initial or remaining non-cancelable lease terms over the next
5
years and thereafter are as follows:
|
Amount
|
|||
|
2018
|
$
|
15
|
|
|
2019
|
14
|
|
|
|
2020
|
12
|
|
|
|
2021
|
9
|
|
|
|
2022
|
8
|
|
|
|
Thereafter
|
65
|
|
|
The Company has a series of agreements with various public entities (the “Partners”) to establish certain joint ventures, commonly referred to as “public-private partnerships.” Under the public-private partnerships, the Company constructed utility plant, financed by the Company and the Partners constructed utility plant (connected to the Company’s property), financed by the Partners. The Company agreed to transfer and convey some of its real and personal property to the Partners in exchange for an equal principal amount of Industrial Development Bonds (“IDBs”), issued by the Partners under a state Industrial Development Bond and Commercial Development Act. The Company leased back the total facilities, including portions funded by both the Company and the Partners, under leases for a period of
40
years.
The leases related to the portion of the facilities funded by the Company have required payments from the Company to the Partners that approximate the payments required by the terms of the IDBs from the Partners to the Company (as the holder of the IDBs). As the ownership of the portion of the facilities constructed by the Company will revert back to the Company at the end of the lease, the Company has recorded these as capital leases. The lease obligation and the receivable for the principal amount of the IDBs are presented by the Company on a net basis. The carrying value of the facilities funded by the Company recognized as a capital lease asset was
$150 million
and
$152 million
as of
December 31, 2017
and
2016
, respectively, which is presented in property, plant and equipment in the accompanying Consolidated Balance Sheets. The future payments under the lease obligations are equal to and offset by the payments receivable under the IDBs.
As of
December 31, 2017
, the minimum annual future rental commitment under the operating leases for the portion of the facilities funded by the Partners that have initial or remaining non-cancelable lease terms in excess of
one
year included in the preceding minimum annual rental commitments are
$4 million
in
2018
through
2022
, and
$63 million
thereafter.
The Company’s operating segments are comprised of the revenue-generating components of its businesses for which separate financial information is internally produced and regularly used by management to make operating decisions and assess performance. The Company operates its businesses primarily through
one
reportable segment, the
Regulated Businesses
segment. The Company also operates businesses that provide a broad range of related and complementary water and wastewater services in non-regulated markets, which includes
four
operating segments that individually do not meet the criteria of a reportable segment. These
four
non-reportable operating segments are collectively presented as our “
Market-Based Businesses
.”
123
The Regulated Businesses segment is the largest component of the Company’s business and includes
20
subsidiaries that provide water and wastewater services to customers in
16
states.
The
Market-Based Businesses
’
four
non-reportable operating segments are Military Services Group, Contract Operations Group, Homeowner Services Group and Keystone Operations. Military Services Group performs
50
-
year contracts with the U.S. government for the operation and maintenance of the water and wastewater systems on certain military bases. Homeowner Services Group provides services to domestic homeowners and smaller commercial establishments to protect against the cost of repairing damaged or blocked pipes inside and outside their accommodations, as well as interior electric lines. Contract Operations Group performs contracts with municipalities, the food and beverage industry and other customers to operate and maintain water and wastewater facilities. Keystone Operations provides customized water sourcing, transfer services, pipeline construction and water storage solutions, for natural gas exploration and production companies.
The accounting policies of the segments are the same as those described in the summary of significant accounting policies. See
Note 2—Significant Accounting Policies
. The
Regulated Businesses
segment and
Market-Based Businesses
include intercompany costs that are allocated by American Water Works Service Company, Inc. and intercompany interest that is charged by American Water Capital Corp., which are eliminated to reconcile to the Consolidated Statements of Operations. Inter-segment revenues, include the sale of water from a regulated subsidiary to market-based subsidiaries, leased office space, furniture and equipment provided by the Company’s market-based subsidiaries to its regulated subsidiaries. “Other” includes corporate costs that are not allocated to the Company’s operating segments, eliminations of inter-segment transactions, fair value adjustments and associated income and deductions related to the acquisitions that have not been allocated to the operating segments for evaluation of performance and allocation of resource purposes. The adjustments related to the acquisitions are reported in Other as they are excluded from segment performance measures evaluated by management.
The following tables include the Company’s summarized segment information as of and for the years ended
December 31
:
|
|
2017
|
||||||||||||||
|
|
Regulated
Businesses |
Market-Based
Businesses |
Other
|
Consolidated
|
|||||||||||
|
Operating revenues
|
$
|
2,958
|
|
$
|
422
|
|
$
|
(23
|
)
|
$
|
3,357
|
|
|||
|
Depreciation and amortization
|
462
|
|
18
|
|
12
|
|
492
|
|
|||||||
|
Total operating expenses, net
|
1,781
|
|
360
|
|
(28
|
)
|
2,113
|
|
|||||||
|
Interest, net
|
(268
|
)
|
3
|
|
(77
|
)
|
(342
|
)
|
|||||||
|
Income before income taxes
|
925
|
|
66
|
|
(79
|
)
|
912
|
|
|||||||
|
Provision for income taxes
|
366
|
|
28
|
|
92
|
|
486
|
|
|||||||
|
Net income attributable to common stockholders
|
559
|
|
38
|
|
(171
|
)
|
426
|
|
|||||||
|
Total assets
|
17,602
|
|
599
|
|
1,281
|
|
19,482
|
|
|||||||
|
Capital expenditures
|
1,316
|
|
18
|
|
100
|
|
1,434
|
|
|||||||
|
|
2016
|
||||||||||||||
|
|
Regulated
Businesses |
Market-Based
Businesses |
Other
|
Consolidated
|
|||||||||||
|
Operating revenues
|
$
|
2,871
|
|
$
|
451
|
|
$
|
(20
|
)
|
$
|
3,302
|
|
|||
|
Depreciation and amortization
|
440
|
|
15
|
|
15
|
|
470
|
|
|||||||
|
Total operating expenses, net
|
1,852
|
|
391
|
|
(21
|
)
|
2,222
|
|
|||||||
|
Interest, net
|
(256
|
)
|
2
|
|
(71
|
)
|
(325
|
)
|
|||||||
|
Income before income taxes
|
775
|
|
65
|
|
(70
|
)
|
770
|
|
|||||||
|
Provision for income taxes
|
303
|
|
26
|
|
(27
|
)
|
302
|
|
|||||||
|
Net income attributable to common stockholders
|
472
|
|
39
|
|
(43
|
)
|
468
|
|
|||||||
|
Total assets
|
16,405
|
|
637
|
|
1,440
|
|
18,482
|
|
|||||||
|
Capital expenditures
|
1,274
|
|
18
|
|
19
|
|
1,311
|
|
|||||||
124
|
|
2015
|
||||||||||||||
|
|
Regulated
Businesses |
Market-Based
Businesses |
Other
|
Consolidated
|
|||||||||||
|
Operating revenues
|
$
|
2,743
|
|
$
|
434
|
|
$
|
(18
|
)
|
$
|
3,159
|
|
|||
|
Depreciation and amortization
|
411
|
|
8
|
|
21
|
|
440
|
|
|||||||
|
Total operating expenses, net
|
1,732
|
|
370
|
|
(18
|
)
|
2,084
|
|
|||||||
|
Interest, net
|
(248
|
)
|
2
|
|
(62
|
)
|
(308
|
)
|
|||||||
|
Income before income taxes
|
776
|
|
68
|
|
(62
|
)
|
782
|
|
|||||||
|
Provision for income taxes
|
303
|
|
26
|
|
(23
|
)
|
306
|
|
|||||||
|
Net income attributable to common stockholders
|
473
|
|
42
|
|
(39
|
)
|
476
|
|
|||||||
|
Total assets
|
15,258
|
|
496
|
|
1,487
|
|
17,241
|
|
|||||||
|
Capital expenditures
|
1,143
|
|
17
|
|
—
|
|
1,160
|
|
|||||||
The following table summarizes certain supplemental unaudited consolidated quarterly financial data for each of the four quarters in the years ended
December 31, 2017
and
2016
, respectively. The operating results for any quarter are not indicative of results that may be expected for a full year or any future periods.
|
2017
|
|||||||||||||||
|
First Quarter
|
Second Quarter
|
Third Quarter
|
Fourth Quarter
|
||||||||||||
|
Operating revenues
|
$
|
756
|
|
$
|
844
|
|
$
|
936
|
|
$
|
821
|
|
|||
|
Operating income
|
227
|
|
308
|
|
430
|
|
279
|
|
|||||||
|
Net income attributable to common stockholders
|
93
|
|
131
|
|
203
|
|
(1
|
)
|
|||||||
|
Basic earnings per share:
|
|
|
|
|
|||||||||||
|
Net income attributable to common stockholders
|
$
|
0.52
|
|
$
|
0.74
|
|
$
|
1.14
|
|
$
|
(0.01
|
)
|
|||
|
Diluted earnings per share:
|
|
|
|
|
|||||||||||
|
Net income attributable to common stockholders
|
0.52
|
|
0.73
|
|
1.13
|
|
—
|
|
|||||||
|
2016
|
|||||||||||||||
|
|
First Quarter
|
Second Quarter
|
Third Quarter
|
Fourth Quarter
|
|||||||||||
|
Operating revenues
|
$
|
743
|
|
$
|
827
|
|
$
|
930
|
|
$
|
802
|
|
|||
|
Operating income
|
214
|
|
299
|
|
319
|
|
248
|
|
|||||||
|
Net income attributable to common stockholders
|
82
|
|
137
|
|
148
|
|
101
|
|
|||||||
|
Basic earnings per share:
|
|
|
|
|
|||||||||||
|
Net income attributable to common stockholders
|
$
|
0.46
|
|
$
|
0.77
|
|
$
|
0.83
|
|
$
|
0.57
|
|
|||
|
Diluted earnings per share:
|
|
|
|
|
|||||||||||
|
Net income attributable to common stockholders
|
0.46
|
|
0.77
|
|
0.83
|
|
0.57
|
|
|||||||
125
|
ITEM 9.
|
CHANGES IN AND DISAGREEMENTS WITH ACCOUNTANTS ON ACCOUNTING AND FINANCIAL DISCLOSURE
|
None
|
ITEM 9A.
|
CONTROLS AND PROCEDURES
|
Disclosure Controls and Procedures
The Company, under the supervision and with the participation of its management, including the Chief Executive Officer and the Chief Financial Officer, conducted an evaluation of the effectiveness of the design and operation of the Company’s disclosure controls and procedures as such term is defined in Rule 13a-15(e) and Rule 15d-15(e) under the Exchange Act as of the end of the period covered by this report.
Based on that evaluation, our Chief Executive Officer and Chief Financial Officer have concluded that, as of
December 31, 2017
, our disclosure controls and procedures were effective at a reasonable level of assurance. Our disclosure controls and procedures are designed to provide reasonable assurance that the information required to be disclosed by us in the reports we file or submit under the Exchange Act is recorded, processed, summarized and reported within the time periods specified in the SEC’s rules and forms, and that such information is accumulated and communicated to management, including the Chief Executive Officer and the Chief Financial Officer, to allow timely decisions regarding required disclosure.
Management’s Report on Internal Control over Financial Reporting
Our management is responsible for establishing and maintaining adequate internal control over financial reporting, as such term is defined in Rule 13a-15(f) of the Exchange Act. Our internal control over financial reporting is a process designed by or under the supervision of our Chief Executive Officer and Chief Financial Officer to provide reasonable assurance regarding the reliability of financial reporting and the preparation of financial statements for external purposes in accordance with generally accepted accounting principles. Our internal control over financial reporting includes those policies and procedures that: (i) pertain to the maintenance of records that in reasonable detail accurately and fairly reflect our transactions and dispositions of our assets; (ii) provide reasonable assurance that transactions are recorded as necessary to permit preparation of the financial statements in accordance with generally accepted accounting principles, and that our receipts and expenditures are being made only in accordance with authorizations of our management and our directors; and (iii) provide reasonable assurance regarding prevention or timely detection of unauthorized acquisition, use or disposition of our assets that could have a material effect on the financial statements.
Because of its inherent limitations, internal control over financial reporting may not prevent or detect misstatements. Also, projections of any evaluation of effectiveness to future periods are subject to the risk that controls may become inadequate because of changes in conditions, or that the degree of compliance with the policies or procedures may deteriorate.
Our management, including our Chief Executive Officer and Chief Financial Officer, assessed the effectiveness of our internal control over financial reporting, as of
December 31, 2017
, using the criteria described in
Internal Control—Integrated Framework (2013)
issued by the Committee of Sponsoring Organizations of the Treadway Commission (COSO).
Based on our evaluation under the framework in
Internal Control—Integrated Framework (2013)
, our management concluded that our internal control over financial reporting was effective as of
December 31, 2017
.
The effectiveness of our internal control over financial reporting as of
December 31, 2017
has been audited by PricewaterhouseCoopers LLP, an independent registered public accounting firm, as stated in their report appearing in
Item 8—Financial Statements and Supplementary Data
of this
Annual Report on Form 10-K
.
Changes in Internal Control over Financial Reporting
There were no changes to our internal control over financial reporting during our last fiscal quarter that have materially affected, or are reasonably likely to materially affect, our internal control over financial reporting.
|
ITEM 9B.
|
OTHER INFORMATION
|
Changes to Long-Term Equity Award Retirement Provisions
On February 14, 2018, our Board of Directors and Executive Development and Compensation Committee approved changes to the retirement provisions of equity awards granted under the Company’s 2017 Omnibus Equity Compensation Plan (the “Omnibus Plan”) to persons serving as the Company’s Chief Executive Officer, Chief Financial Officer or Chief Operating Officer (each, a “Covered Executive”), so long as the Covered Executive has held one or more of those titles (or any other title that contains such title) for a period of at least three years of consecutive service.
126
These changes acknowledge that these three positions consistently make and/or should make decisions that are in both the short-term and long-term interests of the Company, and extend the vesting of equity awards beyond the Covered Executive’s retirement date to reflect the desired accountability. The changes apply to awards that are granted or may be granted to a Covered Executive under the Omnibus Plan commencing on February 14, 2018. These changes did not affect any equity award granted under the Omnibus Plan prior to February 14, 2018.
Except as contemplated by the amended retirement provisions, the Company will not permit the acceleration of vesting of any long-term equity award granted under the Omnibus Plan on account of retirement of a Covered Executive. With respect to a Covered Executive, the amended retirement provisions for a long-term equity award state that such award will continue to vest over the normal vesting schedule of the award after the Covered Executive has a separation from service based upon either normal retirement or early retirement. In the event of a normal retirement of a Covered Executive, defined as having attained age 60 and five years of service with the Company or any subsidiary, an award will vest in full over the normal vesting schedule of the award. In the event of an early retirement of a Covered Executive, defined as having attained age 55 and five years of service with the Company or any subsidiary, 75% of each award will vest over the normal vesting schedule of the award. Performance stock unit awards will continue to vest in accordance with their normal vesting schedule and shall be paid at the end of the three-year performance period based on actual performance. Any stock option granted after February 14, 2018 to a Covered Executive will remain exercisable for a period of two years after the retirement date.
127
|
ITEM 10.
|
DIRECTORS, EXECUTIVE OFFICERS AND CORPORATE GOVERNANCE
|
The information required by this item and not given below or in
Item 1—Business
—Executive Officers of this Form 10-K, is incorporated by reference from the Company’s Proxy Statement for the
2018
Annual Meeting of Stockholders, to be filed with the SEC within 120 days following the end of the fiscal year covered by this report, under the captions entitled “Board of Directors and Corporate Governance,” “Proposal 1—Election of Directors” and “Certain Beneficial Ownership Matters—Section 16(a) Beneficial Ownership Reporting Compliance.”
We have adopted a Code of Ethics, which applies to directors, officers and employees. The full text of the Code of Ethics is publicly available on our website at
https://amwater.com
. We intend to post on our website any amendments to our Code of Ethics and any waivers of such provisions granted to certain principal officers.
|
ITEM 11.
|
EXECUTIVE COMPENSATION
|
Information required by this item is incorporated by reference in the Company’s Proxy Statement for the
2018
Annual Meeting of Stockholders, under the captions entitled “Proposal 1—Election of Directors—Director Compensation Table,” “Compensation Discussion and Analysis,” “Executive Compensation,” “Compensation Committee Interlocks and Insider Participation” and “Compensation Committee Report.”
|
ITEM 12.
|
SECURITY OWNERSHIP OF CERTAIN BENEFICIAL OWNERS AND MANAGEMENT AND RELATED STOCKHOLDER MATTERS
|
Information required by this item setting forth the security ownership of certain beneficial owners and management is incorporated by reference in the Company’s Proxy Statement for the
2018
Annual Meeting of Stockholders, under the captions entitled “Certain Beneficial Ownership Matters—Security Ownership of Management,” “Certain Beneficial Ownership Matters—Security Ownership of Certain Beneficial Owners” and “Equity Compensation Plan Information.”
|
ITEM 13.
|
CERTAIN RELATIONSHIPS AND RELATED TRANSACTIONS, AND DIRECTOR INDEPENDENCE
|
Information required by this item is incorporated by reference in the Company’s Proxy Statement for the
2018
Annual Meeting of Stockholders, under the caption entitled “Board of Directors and Corporate Governance—Board Review of Related Person Transactions” and “Proposal 1—Election of Directors—Director Independence.”
|
ITEM 14.
|
PRINCIPAL ACCOUNTANT FEES AND SERVICES
|
Information required by this item is incorporated by reference in the Company’s Proxy Statement for the
2018
Annual Meeting of Stockholders, under the caption entitled “Fees Paid to Independent Registered Public Accounting Firm” and “Pre-Approval of Services Provided by Independent Registered Public Accounting Firm.”
128
|
ITEM 15.
|
EXHIBITS AND FINANCIAL STATEMENT SCHEDULES
|
|
(a)
|
The following documents have been filed as a part of this Form 10-K:
|
|
1.
|
The financial statements listed in the “Index to Consolidated Financial Statements” contained in
|
|
2.
|
Financial statement schedules have been omitted since they are either not required or are not applicable as the information is otherwise included in the financial statements or notes thereto.
|
|
3.
|
Exhibits. The list of documents contained in “Exhibit Index” to this Form 10-K is incorporated by reference in response to this Item 15(a). The warranties, representations and covenants contained in any of the agreements included or incorporated by reference herein or which appear as exhibits hereto should not be relied upon by buyers, sellers or holders of the Company’s or its subsidiaries’ securities and are not intended as warranties, representations or covenants to any individual or entity except as specifically set forth in such agreement.
|
The responses to Items 15(b) and (c) of Form 10-K are included above in response to Item 15(a).
|
ITEM 16.
|
FORM 10-K SUMMARY
|
None
129
EXHIBIT INDEX
|
Exhibit
Number
|
Exhibit Description
|
|
|
3.1
|
||
|
3.2
|
||
|
4.1
|
||
|
4.2
|
||
|
4.3
|
||
|
4.4
|
||
|
4.5
|
||
|
4.6
|
||
|
4.7
|
||
|
4.8
|
||
|
4.9
|
||
|
4.10
|
||
|
4.11
|
||
|
4.12
|
||
|
4.13
|
||
|
4.14
|
||
|
4.15
|
||
|
4.16
|
||
|
10.1
|
||
|
10.2
|
||
|
10.3*
|
||
|
10.4*
|
||
130
|
Exhibit
Number
|
Exhibit Description
|
|
|
10.5*
|
||
|
10.6*
|
||
|
10.7*
|
||
|
10.8.1*
|
||
|
10.8.2*
|
||
|
10.9*
|
||
|
10.10.1*
|
||
|
10.10.2*
|
||
|
10.10.3*
|
||
|
10.10.4*
|
||
|
10.10.5*
|
||
|
10.10.6*
|
||
|
10.10.7*
|
||
|
10.10.8*
|
||
|
10.10.9*
|
||
|
10.10.10*
|
||
|
10.10.11*
|
||
131
|
Exhibit
Number
|
Exhibit Description
|
|
|
10.10.12*
|
||
|
10.10.13*
|
||
|
10.10.14*
|
||
|
10.10.15*
|
||
|
10.10.16*
|
||
|
10.10.17*
|
||
|
10.10.18*
|
||
|
10.10.19*
|
||
|
10.10.20*
|
||
|
10.10.21*
|
||
|
10.10.22*
|
||
|
10.10.23*
|
||
|
10.10.24*
|
||
|
10.10.25*
|
||
|
10.10.26*
|
||
|
10.10.27*
|
||
|
10.10.28*
|
||
|
10.10.29*
|
||
|
10.10.30*
|
||
|
10.10.31*
|
||
|
10.10.32*
|
||
|
10.10.33*
|
||
|
10.10.34*
|
||
|
10.10.35*
|
||
|
10.10.36*
|
||
|
10.10.37*
|
||
|
10.10.38*
|
||
132
|
Exhibit
Number
|
Exhibit Description
|
|
|
10.11
|
||
|
10.12*
|
||
|
12.1
|
||
|
21.1
|
||
|
23.1
|
||
|
31.1
|
||
|
31.2
|
||
|
32.1
|
||
|
32.2
|
||
|
101
|
The following financial statements from American Water Works Company, Inc.’s Annual Report on Form 10-K for the period ended December 31, 2017, formatted in XBRL (eXtensible Business Reporting Language): (i) the Consolidated Balance Sheets; (ii) the Consolidated Statements of Operations; (iii) the Consolidated Statements of Comprehensive Income; (iv) the Consolidated Statements of Cash Flows; (v) the Consolidated Statements of Changes in Stockholders’ Equity; and (vi) the Notes to Consolidated Financial Statements (filed herewith).
|
|
|
*
|
Denotes a management contract or compensatory plan or arrangement.
|
Instruments defining the rights of holders of certain issues of long-term debt of the Company and certain of its consolidated subsidiaries have not been filed as exhibits to this report because the authorized principal amount of any one of such issues does not exceed 10% of the Company’s consolidated total assets. The Company agrees to furnish a copy of each such instrument to the SEC upon request.
133
SIGNATURES
Pursuant to the requirements of Section 13 or 15(d) of the Securities Exchange Act of 1934, the Registrant has duly caused this report to be signed on its behalf by the undersigned, thereunto duly authorized, on the
20th day of February, 2018
.
|
AMERICAN WATER WORKS COMPANY, INC.
|
|
|
B
Y
:
|
/s/ SUSAN N. STORY
|
|
|
Susan N. Story
|
|
|
President and Chief Executive Officer
|
Pursuant to the requirements of the Securities Exchange Act of 1934, this
Annual Report on Form 10-K
has been signed on the
20th day of February, 2018
, by the following persons in the capacities indicated.
|
/s/ SUSAN N. STORY
|
/s/ MARTHA CLARK GOSS
|
|
|
Susan N. Story
President and Chief Executive Officer
(Principal Executive Officer and Director)
|
Martha Clark Goss
(Director)
|
|
|
/s/ LINDA G. SULLIVAN
|
/s/ VERONICA M. HAGEN
|
|
|
Linda G. Sullivan
Executive Vice President and Chief Financial Officer
(Principal Financial Officer)
|
Veronica M. Hagen
(Director)
|
|
|
/s/ MELISSA K. WIKLE
|
/s/ JULIA L. JOHNSON
|
|
|
Melissa K. Wikle
Vice President and Controller
(Principal Accounting Officer)
|
Julia L. Johnson
(Director)
|
|
|
/s/ GEORGE MacKENZIE
|
/s/ KARL F. KURZ
|
|
|
George MacKenzie
(Director)
|
Karl F. Kurz
(Director)
|
|
|
|
||
134
TABLE OF CONTENTS
Part IItem 1. BusinessItem 7 Management S Discussion and Analysis Of Financial Condition and Results Of OperationsNote 19 Segment InformationItem 3 Legal ProceedingsItem 1A. Risk FactorsItem 7A Quantitative and Qualitative Disclosures About Market RiskItem 1B. Unresolved Staff CommentsItem 2. PropertiesItem 3. Legal ProceedingsItem 4. Mine Safety DisclosuresPart IIItem 5. Market For Registrant S Common Equity, Related Stockholder Matters and Issuer Purchases Of Equity SecuritiesItem 6. Selected Financial DataItem 7. Management S Discussion and Analysis Of Financial Condition and Results Of OperationsItem 1A Risk FactorsNote 13 Income TaxesItem 1 BusinessNote 2 Significant Accounting PoliciesNote 6 Regulatory Assets and LiabilitiesNote 7 Goodwill and Other Intangible AssetsNote 14 Employee BenefitsNote 15 Commitments and ContingenciesItem 7A. Quantitative and Qualitative Disclosures About Market RiskItem 8. Financial Statements and Supplementary DataNote 1: Organization and OperationNote 2: Significant Accounting PoliciesNote 5 Allowance For Uncollectible AccountsNote 3: AcquisitionsNote 4: Property, Plant and EquipmentNote 5: Allowance For Uncollectible AccountsNote 6: Regulatory Assets and LiabilitiesNote 7: Goodwill and Other Intangible AssetsNote 8: Stockholders EquityNote 9: Stock Based CompensationNote 10: Long-term DebtNote 11: Short-term DebtNote 12: General TaxesNote 13: Income TaxesNote 14: Employee BenefitsNote 15: Commitments and ContingenciesNote 16: Earnings Per Common ShareNote 17: Fair Values Of Financial InstrumentsNote 18: LeasesNote 19: Segment InformationNote 20: Unaudited Quarterly DataItem 9. Changes in and Disagreements with Accountants on Accounting and Financial DisclosureItem 9A. Controls and ProceduresItem 8 Financial Statements and Supplementary DataItem 9B. Other InformationPart IIIItem 10. Directors, Executive Officers and Corporate GovernanceItem 11. Executive CompensationItem 12. Security Ownership Of Certain Beneficial Owners and Management and Related Stockholder MattersItem 13. Certain Relationships and Related Transactions, and Director IndependenceItem 14. Principal Accountant Fees and ServicesPart IVItem 15. Exhibits and Financial Statement SchedulesItem 16. Form 10-k Summary