AMERICAN STATES WATER CO
10-Ks and 10-Qs
|
|
|
|
|
|
|
|
|
|
|
|
|
|
|
|
|
|
|
|
|
|
|
|
|
|
|
|
|
|
|
|
|
|
|
|
|
|
|
|
|
|
|
|
|
|
|
|
|
|
|
|
|
|
|
|
SECURITIES AND EXCHANGE COMMISSION
WASHINGTON, D.C. 20549
FORM 10-K
FOR ANNUAL AND TRANSITION REPORTS
PURSUANT TO SECTION 13 OR 15(d) OF THE
SECURITIES EXCHANGE ACT OF 1934
(Mark One)
x
Annual Report pursuant to Section 13 or 15(d) of the Securities Exchange Act of 1934 for the fiscal year ended December 31,
2018
or
¨
Transition report pursuant to Section 13 or 15(d) of the Securities Exchange Act of 1934 for the transition period from to
|
Commission
File Number
|
|
Registrant, State of Incorporation
Address, Zip Code and Telephone Number
|
|
IRS Employer
Identification No.
|
|
001-14431
|
|
American States Water Company
(Incorporated in California)
630 E. Foothill Boulevard, San Dimas, CA 91773-1212
(909) 394-3600
|
|
95-4676679
|
|
001-12008
|
|
Golden State Water Company
(Incorporated in California)
630 E. Foothill Boulevard, San Dimas, CA 91773-1212
(909) 394-3600
|
|
95-1243678
|
Securities registered pursuant to Section 12(b) of the Act:
|
Title of Each Class
|
|
Name of Each Exchange on Which Registered
|
|
American States Water Company Common Shares
|
|
New York Stock Exchange
|
Securities registered pursuant to Section 12(g) of the Act:
None
Indicate by check mark if the Registrant is a well-known seasoned issuer, as defined in Rule 405 of the Securities Act.
|
American States Water Company
|
|
Yes
x
No
¨
|
||
|
Golden State Water Company
|
|
Yes
¨
No
x
|
||
Indicate by check mark if the Registrant is not required to file reports pursuant to Section 13 or Section 15(d) of the Act.
|
American States Water Company
|
|
Yes
¨
No
x
|
||
|
Golden State Water Company
|
|
Yes
¨
No
x
|
||
Indicate by check mark whether Registrant (1) has filed all reports required to be filed by Section 13 or 15(d) of the Securities Exchange Act of 1934 during the preceding 12 months (or for such shorter period that Registrant was required to file such reports), and (2) has been subject to such filing requirements for the past 90 days.
|
American States Water Company
|
|
Yes
x
No
¨
|
||
|
Golden State Water Company
|
|
Yes
x
No
¨
|
||
Indicate by check mark whether Registrant has submitted electronically and posted on its corporate Web site, if any, every Interactive Data File required to be submitted and posted pursuant to Rule 405 of Regulation S-T (§ 232.405 of this chapter) during the preceding 12 months (or such shorter period that the Registrant was required to submit and post such files).
|
American States Water Company
|
|
Yes
x
No
¨
|
||
|
Golden State Water Company
|
|
Yes
x
No
¨
|
||
Indicate by check mark if disclosure of delinquent filers pursuant to Item 405 of Regulation S-K is not contained herein, and will not be contained, to the best of Registrant’s knowledge, in definitive proxy or information statements incorporated by reference in Part III of this Form 10-K or any amendment to this Form 10-K.
¨
Indicate by check mark whether the registrant is a large accelerated filer, an accelerated filer, a non-accelerated filer, or a smaller reporting company. See definition of “large accelerated filer”, “accelerated filer” and “smaller reporting company” in Rule 12b-2 of the Exchange Act. (Check one):
|
American States Water Company
|
||||||||
|
Large accelerated filer
x
|
|
Accelerated filer
¨
|
|
Non-accelerated filer
¨
|
|
Smaller reporting company
¨
|
Emerging growth company
¨
|
|
|
Golden State Water Company
|
||||||||
|
Large accelerated filer
¨
|
|
Accelerated filer
¨
|
|
Non-accelerated filer
x
|
|
Smaller reporting company
¨
|
Emerging growth company
¨
|
|
If an emerging growth company, indicate by check mark if the registrant has elected not to use the extended transition period for complying with any new or revised financial accounting standards provided pursuant to Section 13(a) of the Exchange Act.
¨
Indicate by check mark whether the Registrant is a shell company (as defined in Rule 12b-2 of the Exchange Act)
|
American States Water Company
|
|
Yes
¨
No
x
|
||
|
Golden State Water Company
|
|
Yes
¨
No
x
|
||
The aggregate market value of all voting Common Shares held by non-affiliates of American States Water Company was approximately
$2,099,687,000
and
$2,625,678,000
on June 30,
2018
and
February 22, 2019
, respectively. The closing price per Common Share of American States Water Company on
February 22, 2019
, as traded on the New York Stock Exchange, was
$71.40
. As of
February 22, 2019
, the number of Common Shares of American States Water Company outstanding was
36,774,205
. As of that same date, American States Water Company owned all 165 outstanding Common Shares of Golden State Water Company. The aggregate market value of all voting stock held by non-affiliates of Golden State Water Company was zero on June 30,
2018
and
February 22, 2019
.
Golden State Water Company meets the conditions set forth in General Instruction I(1)(a) and (b) of Form 10-K and is therefore filing this Form, in part, with the reduced disclosure format for Golden State Water Company.
Documents Incorporated by Reference:
Portions of the Proxy Statement of American States Water Company will be subsequently filed with the Securities and Exchange Commission as to Part III, Item Nos. 10, 11, 13 and 14 and portions of Item 12, in each case as specifically referenced herein.
2
PART I
Item 1. Business
This annual report on Form 10-K is a combined report being filed by two separate Registrants, American States Water Company (“AWR”) and Golden State Water Company (“GSWC”). References in this report to “Registrant” are to AWR and GSWC, collectively, unless otherwise specified. GSWC makes no representations as to the information contained in this report relating to AWR and its subsidiaries, other than GSWC.
AWR makes its periodic reports, Form 10-Q and Form 10-K, and current reports, Form 8-K, available free of charge through its website, www.aswater.com, as soon as material is electronically filed with or furnished to the Securities and Exchange Commission (“SEC”). Such reports are also available on the SEC’s website at www.sec.gov. AWR also makes available free of charge its code of business conduct and ethics, its corporate governance guidelines and the charters of its Nominating and Governance Committee, Compensation Committee and Audit and Finance Committee through its website or by calling (877) 463-6297. AWR and GSWC have filed the certification of officers required by Section 302 of the Sarbanes-Oxley Act as Exhibits 31.1 and 31.2 to its Form 10-K for the year ended
December 31, 2018
.
Overview
AWR is the parent company of GSWC and American States Utility Services, Inc. (“ASUS”) (and its wholly owned subsidiaries: Fort Bliss Water Services Company (“FBWS”), Terrapin Utility Services, Inc. (“TUS”), Old Dominion Utility Services, Inc. (“ODUS”), Palmetto State Utility Services, Inc. (“PSUS”), Old North Utility Services, Inc. (“ONUS”), Emerald Coast Utility Services, Inc. (“ECUS”) and
Fort Riley Utility Services, Inc. (
“
FRUS
”
)
). AWR was incorporated as a California corporation in 1998 as a holding company. AWR has three reportable segments: water, electric and contracted services. Within the segments, AWR has two principal business units, water and electric service utility operations, conducted through GSWC, and contracted services conducted through ASUS and its subsidiaries. FBWS, TUS, ODUS, PSUS, ONUS, ECUS and FRUS may be referred to herein collectively as the “Military Utility Privatization Subsidiaries.”
GSWC is a public utility engaged principally in the purchase, production, distribution and sale of water in 10 counties in the State of California. GSWC is regulated by the California Public Utilities Commission (“CPUC”). It was incorporated as a California corporation on December 31, 1929. GSWC also distributes electricity in several San Bernardino County mountain communities in California through its Bear Valley Electric Service (“BVES”) division.
GSWC served 259,919 water customers and 24,353 electric customers at
December 31, 2018
, or a total of 284,272 customers, compared with 258,949 water customers and 24,274 electric customers at
December 31, 2017
, or a total of 283,223 customers. GSWC’s operations exhibit seasonal trends. Although GSWC’s water utility operations have a diversified customer base, residential and commercial customers account for the majority of GSWC’s water sales and revenues. Revenues derived from commercial and residential water customers accounted for nearly 90% of total water revenues for the years ended
December 31, 2018
,
2017
and
2016
.
ASUS, itself or through the Military Utility Privatization Subsidiaries, has contracted with the U.S. government to provide water and/or wastewater services at various military installations. ASUS operates, maintains and performs construction activities (including renewal and replacement capital work) on water and/or wastewater systems at various U.S. military bases pursuant to 50-year firm, fixed-price contracts. Each of the contracts with the U.S. government is subject to termination, in whole or in part, prior to the end of its 50-year term for convenience of the U.S. government or as a result of default or nonperformance by the subsidiary performing the contract. The contract price for each of these contracts is subject to annual economic price adjustments. Contracts are also subject to modifications for changes in circumstances, changes in laws and regulations, and additions to the contract value for new construction of facilities at the military bases. AWR guarantees performance of ASUS’s military privatization contracts.
3
Pursuant to the terms of these contracts, the Military Utility Privatization Subsidiaries operate the following water and wastewater systems:
|
Subsidiary
|
Military Base
|
Type of System
|
Location
|
|||
|
FBWS
|
Fort Bliss
|
Water and Wastewater
|
Texas and New Mexico
|
|||
|
TUS
|
Joint Base Andrews
|
Water and Wastewater
|
Maryland
|
|||
|
ODUS
|
Fort Lee
|
Wastewater
|
Virginia
|
|||
|
ODUS
|
Joint-Base Langley Eustis and Joint Expeditionary Base Little Creek-Fort Story
|
Water and Wastewater
|
Virginia
|
|||
|
PSUS
|
Fort Jackson
|
Water and Wastewater
|
South Carolina
|
|||
|
ONUS
|
Fort Bragg, Pope Army Airfield and Camp Mackall
|
Water and Wastewater
|
North Carolina
|
|||
|
ECUS
|
Eglin Air Force Base
|
Water and Wastewater
|
Florida
|
|||
|
FRUS
|
Fort Riley
|
Water and Wastewater Collection and Treatment
|
Kansas
|
|||
Certain financial information for each of AWR’s business segments - water distribution, electric distribution, and contracted services - is set forth in Note 16 to the Notes to Consolidated Financial Statements of American States Water Company and its subsidiaries. While AWR’s water and electric utility segments are not dependent upon a single or only a few customers, the U.S. government is the primary customer for ASUS’s contracted services. ASUS, from time to time, performs work at military bases for other prime contractors of the U.S. government.
A large portion of the revenue from AWR’s segments is seasonal. The impact of this seasonality is discussed in more detail in Item 1A.
“Risk Factors.”
Environmental matters and compliance with such laws and regulations are discussed in detail in Item 7.
“Management’s Discussion and Analysis of Financial Condition and Results of Operation”
under the section titled “Environmental Matters.”
Competition
The businesses of GSWC are substantially free from direct and indirect competition with other public utilities, municipalities and other public agencies within their existing service territories. However, GSWC may be subject to eminent domain proceedings in which governmental agencies, under state law, may acquire GSWC’s water systems if doing so is necessary and in the public’s interest. GSWC competes with governmental agencies and other investor-owned utilities in connection with offering service to new real estate developments on the basis of financial terms, availability of water and ability to commence providing service on a timely basis. ASUS actively competes for business with other investor-owned utilities, other third-party providers of water and/or wastewater services and governmental entities primarily on the basis of quality of service and price.
AWR Workforce
AWR and its subsidiaries had a total of 817 employees as of January 31, 2019. GSWC had 549 employees as of January 31, 2019. Sixteen employees of BVES are covered by a collective bargaining agreement with the International Brotherhood of Electrical Workers, which expires in December 2020.
ASUS had 268 employees as of January 31, 2019. Fourteen of FBWS's employees are covered by a collective bargaining agreement with the International Union of Operating Engineers. This agreement expires in September 2022.
Forward-Looking Information
This Form 10-K and the documents incorporated herein contain forward-looking statements intended to qualify for the “safe harbor” from liability established by the Private Securities Litigation Reform Act of 1995. Forward-looking statements are based on current estimates, expectations and projections about future events and assumptions regarding these events, and
4
include statements regarding management’s goals, beliefs, plans or current expectations, considering the information currently available to management. Forward-looking statements are not statements of historical facts. For example, when we use words such as “anticipate,” “believe,” “plan,” “estimate,” “expect,” “intend,” “may” and other words that convey uncertainty of future events or outcomes, we are making forward-looking statements. We are not able to predict all the factors that may affect future results. We caution you that any forward-looking statements made by us are not guarantees of future performance and the actual results may differ materially from those in our forward-looking statements. Some of the factors that could cause future results to differ materially from those expressed or implied by our forward-looking statements or from historical results, include, but are not limited to:
|
•
|
the outcome of pending and future regulatory, legislative or other proceedings, investigations or audits, including decisions in GSWC's general rate cases and the results of independent audits of GSWC's construction contracting procurement practices or other independent audits of our costs;
|
|
•
|
changes in the policies and procedures of the California Public Utilities Commission ("CPUC");
|
|
•
|
timeliness of CPUC action on GSWC rates;
|
|
•
|
availability of GSWC's water supplies, which may be adversely affected by increases in the frequency and duration of droughts, changes in weather patterns, contamination, and court decisions or other governmental actions restricting the use of water from the Colorado River, the California State Water Project, and/or pumping of groundwater;
|
|
•
|
liabilities of GSWC associated with the inherent risks of damage to private property and injuries to employees and the public if our or their property should come into contact with electrical current or equipment;
|
|
•
|
the breakdown or failure of equipment at GSWC's electric division if those failures result in fires or unplanned electric outages, and whether GSWC will be subject to investigations, penalties, liabilities to customers or other third parties or other costs in connection with such events;
|
|
•
|
the potential of strict liability for damages caused by GSWC's property or equipment, even if GSWC was not negligent in the operation and maintenance of that property or equipment, under a doctrine known as inverse condemnation;
|
|
•
|
the impact of storms, high winds, earthquakes, floods, mudslides, drought, wildfires and similar natural disasters, contamination or acts of terrorism or vandalism, that affect water quality and/or supply, affect customer demand, that damage or disrupt facilities, operations or information technology systems owned by us, our customers or third parties on whom we rely or that damage the property of our customers or other third parties or cause bodily injury resulting in liabilities that we may be unable to recover from insurance, other third parties and/or the U.S. government or that the CPUC or the courts do not permit us to recover from ratepayers;
|
|
•
|
the impact on water utility operations during high fire threat conditions as a result of the Public Safety Power Shutdown (PSPS) program authorized by the CPUC and implemented by California regulated electric companies, including Southern California Edison and Pacific Gas and Electric, which serve GSWC facilities throughout the state;
|
|
•
|
increases in the cost of obtaining insurance or in uninsured losses that may not be recovered in rates, or under our contracts with the U.S. government, including increases due to difficulties in obtaining insurance for certain risks, such as wildfires and earthquakes in California;
|
|
•
|
increases in costs to reduce the risks associated with the increasing frequency of severe weather, including to improve the resiliency and reliability of our water production and delivery facilities and systems, and our electric transmission and distribution lines;
|
|
•
|
increases in service disruptions if severe weather and wildfires or threats of wildfire become more frequent as predicted by some scientists who study climate change;
|
|
•
|
our ability to efficiently manage GSWC capital expenditures and operating and maintenance expenses within CPUC authorized levels and timely recover our costs through rates;
|
5
|
•
|
the impact of opposition to GSWC rate increases on our ability to recover our costs through rates, including costs associated with construction and costs associated with damages to our property and that of others and injuries to persons arising out of more extreme weather events;
|
|
•
|
the impact of opposition by GSWC customers to conservation rate design, including more stringent water-use restrictions if drought in California persists due to climate change, as well as future restrictions on water use mandated in California, which may decrease adopted usage and increase customer rates;
|
|
•
|
the impact of condemnation actions on future GSWC revenues and other aspects of our business if we do not receive adequate compensation for the assets taken, or recovery of all charges associated with the condemnation of such assets, as well as the impact on future revenues if we are no longer entitled to any portion of the revenues generated from such assets;
|
|
•
|
our ability to forecast the costs of maintaining GSWC’s aging water and electric infrastructure;
|
|
•
|
our ability to recover increases in permitting costs and costs associated with negotiating and complying with the terms of our franchise agreements with cities and counties and other demands made upon us by the cities and counties in which GSWC operates;
|
|
•
|
changes in accounting valuations and estimates, including changes resulting from our assessment of anticipated recovery of GSWC's regulatory assets, settlement of liabilities and revenues subject to refund or regulatory disallowances and the timing of such recovery, and the amounts set aside for uncollectible accounts receivable, inventory obsolescence, pension and post-retirement liabilities, taxes and uninsured losses and claims, including general liability and workers' compensation claims;
|
|
•
|
changes in environmental laws, health and safety laws, and water and recycled water quality requirements, and increases in costs associated with complying with these laws and requirements, including costs associated with GSWC's upgrading and building new water treatment plants, GSWC's disposing of residuals from our water treatment plants, more stringent rules regarding pipeline repairs and installation, handling and storing hazardous chemicals, upgrading electrical equipment to make it more resistant to extreme weather events, removal of vegetation near power lines, compliance-monitoring activities and GSWC's securing alternative water supplies when necessary;
|
|
•
|
our ability to obtain adequate, reliable and cost-effective supplies of chemicals, electricity, fuel, water and other raw materials that are needed for our water and wastewater operations;
|
|
•
|
our ability to attract, retain, train, motivate, develop and transition key employees;
|
|
•
|
our ability to recover the costs associated with any contamination of GSWC’s groundwater supplies from parties responsible for the contamination or through the ratemaking process, and the time and expense incurred by us in obtaining recovery of such costs;
|
|
•
|
adequacy of GSWC's electric division's power supplies and the extent to which we can manage and respond to the volatility of electricity and natural gas prices;
|
|
•
|
GSWC's electric division's ability to comply with the CPUC’s renewable energy procurement requirements;
|
|
•
|
changes in GSWC's long-term customer demand due to changes in customer usage patterns as a result of conservation efforts, regulatory changes affecting demand such as mandatory restrictions on water use, new landscaping or irrigation requirements, recycling of water by customers or purchase of recycled water supplied by other parties, unanticipated population growth or decline, changes in climate conditions, general economic and financial market conditions and cost increases, which may impact our long-term operating revenues if we are unable to secure rate increases in an amount sufficient to offset reduced demand;
|
|
•
|
changes in accounting treatment for regulated utilities;
|
|
•
|
effects of changes in or interpretations of tax laws, rates or policies;
|
|
•
|
changes in estimates used in ASUS’s cost-to-cost method for revenue recognition of certain construction activities;
|
6
|
•
|
termination, in whole or in part, of one or more of ASUS's military utility privatization contracts to provide water and/or wastewater services at military bases for the convenience of the U.S. government or for default;
|
|
•
|
suspension or debarment of ASUS for a period of time from contracting with the government due to violations of laws or regulations in connection with military utility privatization activities;
|
|
•
|
delays by the U.S. government in making timely payments to ASUS for water and/or wastewater services or construction activities at military bases because of fiscal uncertainties over the funding of the U.S. government or otherwise;
|
|
•
|
delays in ASUS obtaining economic price or equitable adjustments to our prices on one or more of our contracts to provide water and/or wastewater services at military bases;
|
|
•
|
disallowance of costs on any of ASUS's contracts to provide water and/or wastewater services at military bases because of audits, cost reviews or investigations by contracting agencies;
|
|
•
|
inaccurate assumptions used by ASUS in preparing bids in our contracted services business;
|
|
•
|
failure of wastewater systems that ASUS operates on military bases resulting in untreated wastewater or contaminants spilling into nearby properties, streams or rivers, the likelihood of which could increase from climate-change-induced flooding and rainfall events;
|
|
•
|
failure to comply with the terms of our military privatization contracts;
|
|
•
|
failure of any of our subcontractors to perform services for ASUS in accordance with the terms of our military privatization contracts;
|
|
•
|
competition for new military privatization contracts;
|
|
•
|
issues with the implementation, maintenance or upgrading of our information technology systems;
|
|
•
|
general economic conditions which may impact our ability to recover infrastructure investments and operating costs from customers;
|
|
•
|
explosions, fires, accidents, mechanical breakdowns, the disruption of information technology and telecommunication systems, human error and similar events that may occur while operating and maintaining water and electric systems in California or operating and maintaining water and wastewater systems on military bases under varying geographic conditions;
|
|
•
|
potential costs, lost revenues, or other consequences resulting from misappropriation of assets or sensitive information, corruption of data, or operational disruption due to a cyber-attack or other cyber incident;
|
|
•
|
restrictive covenants in our debt instruments or changes to our credit ratings on current or future debt that may increase our financing costs or affect our ability to borrow or make payments on our debt; and
|
|
•
|
our ability to access capital markets and other sources of credit in a timely manner on acceptable terms.
|
Please consider our forward-looking statements in light of these risks as you read this Form 10-K. We qualify all of our forward-looking statements by these cautionary statements.
7
Item 1A. Risk Factors
You should carefully read the risks described below and other information in this Form 10-K in order to understand certain of the risks of our business.
Our business is heavily regulated and, as a result, decisions by regulatory agencies and changes in laws and regulations can significantly affect our business
GSWC's revenues depend substantially on the rates and fees it charges its customers and the ability to recover its costs on a timely basis, including the ability to recover the costs of purchased water, groundwater assessments, electricity, natural gas, chemicals, water treatment, security at water facilities and preventative maintenance and emergency repairs. Any delays by the CPUC in granting rate relief to cover increased operating and capital costs at our public utilities or delays in obtaining approval of our requests at ASUS for economic price or equitable adjustments for contracted services from the U.S. government may adversely affect our financial performance. We may file for interim rates in California in situations where there may be delays in granting final rate relief during a general rate case proceeding. If the CPUC approves lower rates, the CPUC will require us to refund to customers the difference between the interim rates and the rates approved by the CPUC. Similarly, if the CPUC approves rates that are higher than the interim rates, the CPUC may authorize us to recover the difference between the interim rates and the final rates.
Regulatory decisions affecting GSWC may also impact prospective revenues and earnings, affect the timing of the recognition of revenues and expenses, may overturn past decisions used in determining our revenues and expenses and could result in impairment charges and customer refunds. Management continually evaluates the anticipated recovery of regulatory assets, settlement of liabilities and revenues subject to refund and provides for allowances and reserves as deemed necessary. In the event that our assessment of the probability of recovery or settlement through the ratemaking process is incorrect, we will adjust the associated regulatory asset or liability to reflect the change in our assessment or any regulatory disallowances. A change in our evaluation of the probability of recovery of regulatory assets or a regulatory disallowance of all or a portion of our costs could have a material adverse effect on our financial results.
We are also, in some cases, required to estimate future expenses and, in others, we are required to incur the expense before recovering costs. As a result, our revenues and earnings may fluctuate depending on the accuracy of our estimates, the timing of our investments or expenses or other factors. If expenses increase significantly over a short period, we may experience delays in recovery of these expenses, the inability to recover carrying costs for these expenses and increased risks of regulatory disallowances or write-offs.
Regulatory agencies may also change their rules and policies, which may adversely affect our profitability and cash flows. Changes in policies of the U.S. government may also adversely affect one or more of our Military Utility Privatization Subsidiaries. In certain circumstances, the U.S. government may be unwilling or unable to appropriate funds to pay costs mandated by changes in rules and policies of federal or state regulatory agencies. The U.S. government may disagree with the increases that we request and may delay approval of requests for equitable adjustment or economic price adjustments, which could adversely affect our anticipated rates of return.
We may also be subject to fines or penalties if a regulatory agency, including the U.S. government, determines that we have failed to comply with laws, regulations or orders applicable to our businesses, unless we successfully appeal such an adverse determination. Regulatory agencies may also disallow recovery of certain costs if they determine they may no longer be recovered in rates, or if audit findings determine that we have failed to comply with our policies and procedures for procurement or other practices.
Our liquidity and earnings may be adversely affected by wildfires
It is possible that wildfires may occur more frequently, be of longer duration or impact larger areas as a result of drought-damaged plants and trees, lower humidity or higher winds that might be occurring as result of changed weather patterns. Our liquidity, earnings and operations may be materially adversely affected by wildfires in our electric service territory. We may be required to (i) incur greater costs to relocate lines or increase our trimming of trees and other plants near our electric facilities to avoid wildfires, and (ii) bear the costs of damages to property or injuries to the public if it is determined that our power lines or other electrical equipment was a cause of such damages or injuries.
Losses by insurance companies resulting from wildfires in California may cause insurance coverage for wildfire risks to become more expensive or unavailable under reasonable terms, and our insurance may be inadequate to recover all our losses incurred in a wildfire. We might not be allowed to recover in our rates any increased costs of wildfire insurance or the costs of any uninsured wildfire losses.
8
Electric utilities in California are authorized to shut down power for public safety reasons, such as during periods of extreme fire hazard, if the utility reasonably believes that there is an imminent and significant risk that strong winds may topple power lines or cause vegetation to come into contact with power lines leading to increased risk of fire. Shutdowns not only reduce electric revenues and decrease customer satisfaction in BVES’s service territory if BVES decides to shut down its power lines, but could also adversely affect GSWC’s water utility operations if the electric utilities that provide electric service to GSWC’s water operations shut down power lines that deliver electricity to GSWC’s water plant and equipment, thereby adversely affecting its ability to provide water service to its customers. Shutdowns may also lead to water-customer dissatisfaction, claims for refunds of service charges and claims for damages.
We may be held strictly liable for damages to property caused by our equipment even if we are not negligent
Utilities in California may be held strictly liable for damages caused by their property, such as mains, fire hydrants, power lines and other equipment, even though they were not negligent in the operation and maintenance of that property, under a doctrine known as inverse condemnation. GSWC's liquidity, earnings and operations may be adversely affected if we are unable to recover the costs of paying claims for damages caused by the non-negligent operation and maintenance of our property from customers or through insurance.
Our costs involved in maintaining water quality and complying with environmental regulation have increased and are expected to continue to increase
Our capital and operating costs at GSWC can increase substantially as a result of increases in environmental regulation arising from increases in the cost of upgrading and building new water treatment plants, disposing of residuals from our water treatment plants, compliance-monitoring activities and securing alternative supplies when necessary. GSWC may be able to recover these costs through the ratemaking process. We may also be able to recover these costs under settlement and contractual arrangements.
We may be subject to financial losses, penalties and other liabilities if we fail to maintain safe work sites, equipment or facilities
Our safety record is critical to our reputation. We maintain health and safety standards to protect our employees, customers, vendors and the public. Although we are vigilant in adhering to such health and safety standards, it is unlikely that we will be able to avoid accidents or other events resulting in damage to property or the public at all times.
Our business sites, including construction and maintenance sites, often put our employees and others in close proximity with large pieces of equipment, moving vehicles, pressurized water, chemicals and other regulated materials. On many sites we are responsible for safety and, accordingly, must implement safety procedures. If we fail to implement such procedures or if the procedures we implement are ineffective or are not followed by our employees or others, our employees and others may be injured or die. Unsafe work sites also have the potential to increase our operating costs. Any of the foregoing could result in financial losses, which could have a material adverse impact on our business, financial condition, and results of operations.
Our operations may involve the handling and storage of hazardous chemicals which, if improperly handled, stored or disposed of, could subject us to penalties or other liabilities. We are also subject to regulations dealing with occupational health and safety. Although we maintain functional employee groups whose primary purpose is to ensure that we implement effective health, safety, and environmental work procedures throughout our organization, including construction sites and maintenance sites, a failure to comply with such regulations could subject us to liability.
Electrical facilities also have an inherent risk of damage to persons or property should such persons or property come into contact with such facilities which could, depending upon the circumstances, subject us to penalties and damages.
We may sustain losses that exceed or are excluded from our insurance coverage or for which we are not insured
We are, from time to time, parties to legal or regulatory proceedings. These proceedings may pertain to regulatory investigations, employment matters or other disputes. Management periodically reviews its assessment of the probable outcome of these proceedings, the costs and expenses reasonably expected to be incurred, and the availability and extent of insurance coverage. On the basis of this review, management establishes reserves for such matters. We may, however, from time to time be required to pay fines, penalties or damages that exceed our insurance coverage and/or reserves if our estimate of the probable outcome of such proceedings proves to be inaccurate.
9
We maintain insurance coverage as part of our overall legal and risk management strategy to minimize our potential liabilities. However, our insurance policies contain exclusions and other limitations that may not cover our potential liabilities. Generally, our insurance policies cover property, workers' compensation, employer liability, general liability and automobile liability. Each policy includes deductibles or self-insured retentions and policy limits for covered claims. As a result, we may sustain losses that exceed or that are excluded from our insurance coverage or for which we are not insured.
We have experienced increased costs in obtaining insurance coverage for wildfires that could impact or potentially arise from BVES’s ordinary operations. Uninsured losses and increases in the cost of insurance may not be recoverable in customer rates. A loss which is not insured or not fully insured or cannot be recovered in customer rates could materially affect GSWC’s financial condition and results of operations.
Additional Risks Associated with our Public Utility Operations
Our operating costs may increase as a result of groundwater contamination
Our operations can be impacted by groundwater contamination in certain service territories. Historically, we have taken a number of steps to address contamination, including the removal of wells from service, decreasing the amount of groundwater pumped from wells in order to facilitate remediation of plumes of contaminated water, constructing water treatment facilities and securing alternative sources of supply from other areas not affected by the contamination. In emergency situations, we have supplied our customers with bottled water until the emergency situation has been resolved.
Our ability to recover these types of costs depends upon a variety of factors, including approval of rate increases, the willingness of potentially responsible parties to settle litigation and otherwise address the contamination and the extent and magnitude of the contamination. We may recover costs from certain third parties that may be responsible, or potentially responsible, for groundwater contamination. However, we often experience delays in obtaining recovery of these costs and incur additional costs associated with seeking recovery from responsible or potentially responsible parties which may adversely impact our liquidity. In some events we may be unable to recover all of these costs from third parties due to the inability to identify the potentially responsible parties, the lack of financial resources of responsible parties or the high litigation costs associated with obtaining recovery from responsible or potentially responsible parties.
We can give no assurance regarding the adequacy of any such recovery to offset the costs associated with contamination or the cost of recovery of any legal costs. To date, the CPUC has permitted us to establish memorandum accounts for potential recovery of these types of costs when they have arisen.
Management believes that rate recovery, proper insurance coverage and reserves are in place to appropriately manage these types of contamination issues. However, such issues, if ultimately resolved unfavorably to us, could, in the aggregate, have a material adverse effect on our results of operations and financial condition.
The adequacy of our water supplies depends upon weather and a variety of other uncontrollable factors
The adequacy of our water supplies varies from year to year depending upon a variety of factors, including:
|
•
|
rainfall, basin replenishment, flood control, snow pack levels in California and the West, reservoir levels and availability of reservoir storage;
|
|
•
|
availability of Colorado River water and imported water from the State Water Project;
|
|
•
|
the amount of usable water stored in reservoirs and groundwater basins;
|
|
•
|
the amount of water used by our customers and others;
|
|
•
|
water quality;
|
|
•
|
legal limitations on production, diversion, storage, conveyance and use; and
|
|
•
|
climate change.
|
More frequent and extended California drought conditions and changes in weather patterns and population growth in California cause increased stress on surface water supplies and groundwater basins. In addition, low or no allocations of water from the State Water Project and court-ordered pumping restrictions on water obtained from the Sacramento-San Joaquin Delta decrease or eliminate the amount of water that the Metropolitan Water District of Southern California ("MWD") and other state water contractors are able to import from northern California.
10
We have implemented tiered rates and other practices, as appropriate, in order to encourage water conservation. We have also implemented programs to assist customers in complying with water usage reductions. Over the long term, we are acting to secure additional supplies from desalination and increase use of reclaimed water, where appropriate and feasible. We cannot predict the extent to which these efforts to reduce stress on our water supplies will be successful or sustainable, or the extent to which these efforts will enable us to continue to satisfy all of the water needs of our customers.
Water shortages at GSWC may:
|
•
|
adversely affect our supply mix, for instance, by causing increased reliance upon more expensive water sources;
|
|
•
|
adversely affect our operating costs, for instance, by increasing the cost of producing water from more highly contaminated aquifers or requiring us to transport water over longer distances, truck water to water systems or adopt other emergency measures to enable us to continue to provide water service to our customers;
|
|
•
|
result in an increase in our capital expenditures over the long term, for example, by requiring future construction of pipelines to connect to alternative sources of supply, new wells to replace those that are no longer in service or are otherwise inadequate to meet the needs of our customers, and other facilities to conserve or reclaim water;
|
|
•
|
adversely affect the volume of water sold as a result of such factors as mandatory or voluntary conservation efforts by customers, changes in customer conservation patterns, recycling of water by customers and imposition of new regulations impacting such things as landscaping and irrigation patterns;
|
|
•
|
adversely affect aesthetic water quality if we are unable to flush our water systems as frequently due to water shortages or drought restrictions; and
|
|
•
|
result in customer dissatisfaction and harm to our reputation if water service is reduced, interrupted or otherwise adversely affected as a result of drought, water contamination or other causes.
|
Our liquidity may be adversely affected by changes in water supply costs
We obtain our water supplies for GSWC from a variety of sources, which vary among our water systems. Certain systems obtain all of their supply from water that is pumped from aquifers within our service areas; some systems purchase all of their supply from wholesale suppliers; some systems obtain their supply from treating surface water sources; and other systems obtain their supply from a combination of wells, surface water sources and/or wholesale suppliers. The cost of obtaining these supplies varies, and overall costs can be impacted as use within a system varies from time to time. As a result, our cost of providing, distributing and treating water for our customers’ use can vary significantly.
Furthermore, imported water wholesalers, such as MWD, may not always have an adequate supply of water to sell to us. Wholesale water suppliers may increase their prices for water delivered to us based on factors that affect their operating costs. Purchased water rate increases are beyond our control.
GSWC has implemented a modified supply cost balancing account ("MCBA") to track and recover costs from supply mix changes and rate changes by wholesale suppliers, as authorized by the CPUC. However, cash flows from operations can be significantly affected since much of the balance we recognize in the MCBA is collected from or refunded to customers primarily through surcharges or surcredits, respectively, generally over twelve- to twenty-four-month periods.
Our liquidity and earnings may be adversely affected by maintenance costs
Some of our infrastructure in California is aging. We have experienced leaks and mechanical problems in some of these older systems. In addition, well and pump maintenance expenses are affected by labor and material costs and more stringent environmental regulations. Our electrical systems have also required upgrades due to aging and new compliance requirements. These costs can increase substantially and unexpectedly.
We include estimated increases in maintenance costs for future years in each water and electric general rate case filed by GSWC for possible recovery.
Our liquidity and earnings may be adversely affected by our conservation efforts
Our water utility business is heavily dependent upon revenue generated from rates charged to our customers based on the volume of water used. The rates we charge for water are regulated by the CPUC and may not be adequately adjusted to reflect changes in demand. Declining usage also negatively impacts our long-term operating revenues if we are unable to secure rate increases or if growth in the customer base does not occur to the extent necessary to offset per-customer usage decline.
11
Conservation by all customer classes at GSWC is a top priority. However, customer conservation will result in lower volumes of water sold. We may experience a decline in per-customer water usage due to factors such as:
|
•
|
conservation efforts to reduce costs;
|
|
•
|
drought conditions resulting in additional water conservation;
|
|
•
|
the use of more efficient household fixtures and appliances by consumers to save water;
|
|
•
|
voluntary or mandatory changes in landscaping and irrigation patterns;
|
|
•
|
recycling of water by our customers; and
|
|
•
|
mandated water-use restrictions.
|
These types of changes may result in permanent decreases in demand even if our water supplies are sufficient to meet higher levels of demand after a drought ends. In addition, governmental restrictions on water usage during drought conditions may result in a decreased demand for water, even if our sources of supply are sufficient to serve our customers during such drought conditions.
We implemented a CPUC-approved water-revenue adjustment mechanism ("WRAM") at GSWC, which has the effect of reducing the adverse impact of our customers’ conservation efforts on revenues. However, cash flows from operations can be significantly affected since much of the balance we recognize in the WRAM account is collected from or refunded to customers generally over twelve-, eighteen- or twenty-four-month periods.
Our earnings may be affected by weather during different seasons
The demand for water and electricity varies by season. For instance, there can be a higher level of water consumption during the third quarter of each year when weather in California tends to be hot and dry. During unusually wet weather, our customers generally use less water. The CPUC-approved WRAM helps mitigate fluctuations in revenues due to changes in water consumption by our customers in California.
The demand for electricity in our electric customer service area is greatly affected by winter snow levels. An increase in winter snow levels reduces the use of snowmaking machines at ski resorts in the Big Bear area and, as a result, reduces our electric revenues. Likewise, unseasonably warm weather during a skiing season may result in temperatures too high for snowmaking conditions, which also reduces our electric revenues. GSWC has implemented a CPUC-approved base-revenue-requirement adjustment mechanism for our electric business which helps mitigate fluctuations in the revenues of our electric business due to changes in the amount of electricity used by GSWC’s electric customers.
Our liquidity may be adversely affected by increases in electricity and natural gas prices in California
We purchase most of the electric energy sold to customers in our electric customer service area from others under purchased power contracts. In addition to purchased power contracts, we purchase additional energy from the spot market to meet peak demand and following the expiration of purchased power contracts if there are delays in obtaining CPUC authorization of new purchase power contracts. We may sell surplus power to the spot market during times of reduced energy demand. As a result, our cash flows may be affected by increases in spot market prices of electricity purchased and decreases in spot market prices for electricity sold. However, GSWC has implemented supply-cost balancing accounts, as approved by the CPUC, to mitigate fluctuations in supply costs. We also operate a natural-gas-fueled 8.4 megawatt generator in our electric service area.
Unexpected generator downtime or a failure to perform by any of the counterparties to our electric and natural gas purchase contracts could further increase our exposure to fluctuating natural gas and electricity prices.
Changes in electricity prices also affect the unrealized gains and losses on our block forward purchased power contracts that qualify as derivative instruments since we adjust the asset or liability on these contracts to reflect the fair market value of the contracts at the end of each month. The CPUC has authorized us to establish a memorandum account to track the changes in the fair market value of our purchased power contracts. As a result, unrealized gains and losses on these types of purchased power contracts do not impact earnings.
We may not be able to procure sufficient renewable energy resources to comply with CPUC rules
We are required to procure a portion of our electricity for BVES from renewable energy resources to meet the CPUC’s renewable procurement requirements. We have an agreement with a third party to purchase renewable energy credits which we believe enables us to meet these requirements through 2023. In the event that the third party fails to perform in accordance with the terms of the agreement, we may not be able to obtain sufficient resources to meet the renewable procurement
12
requirements. We may be subject to fines and penalties by the CPUC if it determines that we are not in compliance with the renewable resource procurement rules.
Our assets are subject to condemnation
Municipalities and other governmental subdivisions may, in certain circumstances, seek to acquire certain of our assets through eminent domain proceedings. It is generally our practice to contest these proceedings, which may be costly and may temporarily divert the attention of management from the operation of our business. If a municipality or other governmental subdivision succeeds in acquiring our assets, there is a risk that we will not receive adequate compensation for the assets taken or be able to recover all charges associated with the condemnation of such assets. In addition, we would no longer be entitled to any portion of revenue generated from the use of such assets.
Our costs of obtaining and complying with the terms of franchise agreements are increasing
Cities and counties in which GSWC operates have granted GSWC franchises to construct, maintain and use pipes and appurtenances in public streets and rights of way. The costs of obtaining, renewing and complying with the terms of these franchise agreements have been increasing as cities and counties attempt to regulate GSWC’s operations within the boundaries of the city or unincorporated areas of the counties in which GSWC operates. Cities and counties have also been imposing new fees on GSWC’s operations, including pipeline abandonment fees and road-cut or other types of capital improvement fees. At the same time, there is increasing opposition from consumer groups to rate increases that may be necessary to compensate GSWC for the increased costs of regulation by local governments. These trends may adversely affect GSWC’s ability to recover in rates its costs of providing water service and to efficiently manage capital expenditures and operating and maintenance expenses within CPUC-authorized levels.
The generation, transmission and distribution of electricity are dangerous and involve inherent risks of damage to private property and injury to employees and the general public
Electricity is dangerous for employees and the general public should they come in contact with electrical current or equipment, including through downed power lines, sparking during high-wind events or equipment malfunctions. Injuries and property damage caused by such events may subject GSWC to significant liabilities that may not be covered or fully covered by insurance. Additionally, the CPUC has delegated to its staff the authority to issue citations, which carry a fine of $50,000 per-violation per day, to electric utilities subject to its jurisdiction for violations of safety rules found in statutes, regulations, and the General Orders of the CPUC, which could also materially affect GSWC's liquidity and results of operations.
Additional Risks Associated with our Contracted Services Operations
We derive revenues from contract operations primarily from the operation and maintenance of water and/or wastewater systems at military bases and the construction of water and wastewater infrastructure on these bases (including renewal and replacement of these systems). As a result, these operations are subject to risks that are different from those of our public utility operations.
Our 50-year contracts for servicing military bases create certain risks that are different from our public utility operations
We have entered into contracts to provide water and/or wastewater services at military bases pursuant to 50-year contracts, subject to termination, in whole or in part, for the convenience of the U.S. government. In addition, the U.S. government may stop work under the terms of one or more of the contracts, delay performance of our obligations under the contracts or modify the contracts at its convenience.
Our contract pricing is based on a number of assumptions, including assumptions about prices and availability of labor, equipment and materials. We may be unable to recover all costs if any of these assumptions are inaccurate or if all costs incurred in connection with performing the work were not considered. Our contracts are also subject to annual economic price adjustments or other changes permitted by the terms of the contracts. Prices are also subject to equitable adjustment based upon changes in circumstances, laws or regulations and service-requirement changes to the extent provided in each of the contracts.
We are required to record all costs under these types of contracts as they are incurred. As a result, we may record losses associated with unanticipated conditions, higher than anticipated infrastructure levels and emergency work at the time such expenses occur. We recognize additional revenue for such work as, and to the extent that, our economic price adjustments and/or requests for equitable adjustments are approved. Delays in obtaining approval of economic price adjustments and/or equitable adjustments can negatively impact our results of operations and cash flows.
13
Certain payments under these contracts are subject to appropriations by Congress. We may experience delays in receiving payment or delays in price adjustments due to canceled or delayed appropriations specific to our projects or reductions in government spending for the military generally or military-base operations specifically. Appropriations and the timing of payment may be influenced by, among other things, the state of the economy, competing political priorities, budget constraints, the timing and amount of tax receipts, government shutdowns and the overall level of government expenditures.
Management also reviews goodwill for impairment at least annually. ASUS has $1.1 million of goodwill which may be at risk for potential impairment if requested economic price adjustments and/or equitable adjustments are not granted.
Risks associated with wastewater systems are different from those of our water distribution operations
The wastewater-collection-system operations of our subsidiaries providing wastewater services on military bases are subject to substantial regulation and involve significant environmental risks. If collection, treatment or disposal systems fail, overflow or do not operate properly, untreated wastewater or other contaminants could spill onto nearby properties or into nearby streams and rivers, causing damage to persons or property, injury to aquatic life and economic damages. The cost of addressing such damages may not be recoverable. This risk is most acute during periods of substantial rainfall or flooding, which are common causes of sewer overflows and system failures. Liabilities resulting from such damage could adversely and materially affect our business, results of operations and financial condition. In the event that we are deemed liable for any damage caused by overflows, our losses may not be recoverable under our contracts with the U.S. government or covered by insurance policies. We may also find it difficult to secure insurance for this business in the future at acceptable rates.
We may have responsibility for water quality at the military bases we serve
While it is the responsibility of the U.S. government to provide the source of water supply to meet the Military Utility Privatization Subsidiaries’ water distribution system requirements under their contracts, the Military Utility Privatization Subsidiaries, as the water system permit holders for most of the bases they serve, are responsible for ensuring the continued compliance of the provided source of supply with all federal, state and local regulations. We believe, however, that the terms of the contracts between the Military Utility Privatization Subsidiaries and the U.S. government provide the opportunity for us to recover costs incurred in the treatment or remediation of any quality issue that arises from the source of water supply.
Our contracts for the construction of infrastructure improvements on military bases create risks that are different from those of our operations and maintenance activities
We have entered into contract modifications with the U.S. government and agreements with third parties for the construction of new water and/or wastewater infrastructure at the military bases on which we operate. Most of these contracts are firm fixed-price contracts. Under firm fixed-price contracts, we will benefit from cost savings, but are generally unable (except for changes in scope or circumstances approved by the U.S. government or third party) to recover any cost overruns to the approved contract price. Under most circumstances, the U.S. government or third party has approved increased-cost change orders due to changes in scope of work performed.
We generally recognize contract revenues from these types of contracts over time using input methods to measure progress towards satisfying a performance obligation. The measurement of performance over time is based on cost incurred relative to total estimated costs, or the physical completion of the construction projects. The earnings or losses recognized on individual contracts are based on periodic estimates of contract revenues, costs and profitability as these construction projects progress.
We establish prices for these types of firm fixed-price contracts and the overall 50-year contracts taken as a whole, based, in part, on cost estimates that are subject to a number of assumptions, including assumptions regarding future economic conditions. If these estimates prove inaccurate or circumstances change, cost overruns could have a material adverse effect on our contracted business operations and results of operations.
We may be adversely affected by disputes with the U.S. government regarding our performance of contracted services on military bases
We are periodically audited or reviewed by the Defense Contract Auditing Agency (“DCAA”) and/or the Defense Contract Management Agency ("DCMA") for compliance with federal acquisition regulations, cost-accounting standards and other laws, regulations and standards that are not applicable to the operations of GSWC. During the course of these audits/reviews, the DCAA or DCMA may question our incurred project costs or the manner in which we have accounted for such costs and recommend to our U.S. government administrative contracting officer that such costs be disallowed.
14
If there is a dispute with the U.S. government regarding performance under these contracts or the amounts owed to us, the U.S. government may delay, reject or withhold payment, delay price adjustments or assert its right to offset damages against amounts owed to us. If we are unable to collect amounts owed to us on a timely basis or the U.S. government asserts its offset rights, profits and cash flows could be adversely affected.
If we fail to comply with the terms of one or more of our U.S. government contracts, other agreements with the U.S. government or U.S. government statutes and regulations, we could also be suspended or barred from future U.S. government contracts for a period of time and be subject to possible damages, fines and penalties as well as damage to our reputation in the water and wastewater industry.
We depend, to some extent, upon subcontractors to assist us in the performance of contracted services on military bases
We rely, to some extent, on subcontractors to assist us in the operation and maintenance of the water and wastewater systems at military bases. The failure of any of these subcontractors to perform services for us in accordance with the terms of our contracts with the U.S. government could result in the termination of our contract to provide water and/or wastewater services at the affected base(s), and/or a loss of revenues, or increases in costs, to correct a subcontractor’s performance failures.
We are also required to make a good faith effort to achieve our small business subcontracting plan goals pursuant to U.S. government regulations. If we fail to use good faith efforts to meet these goals, the U.S. government may assess damages against us at the end of the contract. The U.S. government has the right to offset claimed damages against any amounts owed to us.
We also rely on third-party manufacturers, as well as third-party subcontractors, to complete our construction projects. To the extent that we cannot engage subcontractors or acquire equipment or materials, our ability to complete a project in a timely fashion or at a profit may be impaired. If the amount of costs we incur for these projects exceeds the amount we have estimated in our bids, we could experience reduced profits or losses in the performance of these contracts. In addition, if a subcontractor or manufacturer is unable to deliver its services, equipment or materials according to the negotiated terms for any reason, including the deterioration of its financial condition, we may be required to purchase the services, equipment or materials from another source at a higher price. This may reduce the profit to be realized or result in a loss on a project for which the services, equipment or materials were needed.
If subcontractors fail to perform services to be provided to us or fail to provide us with the proper equipment or materials, we may be penalized for their failure to perform; however, our contracts with subcontractors include certain protective provisions, which may include the assessment of liquidated damages. We also mitigate these risks by requiring our subcontractors, as appropriate, to obtain performance bonds and to compensate us for any penalties we may be required to pay as a result of their failure to perform.
Our earnings may be affected, to some extent, by weather during different seasons
Seasonal weather conditions, such as hurricanes, heavy rainfall or significant winter storms, occasionally cause temporary office closures and/or result in temporary halts to construction activity at military bases. To the extent that our construction activities are impeded by these events, we will experience a delay in recognizing revenues from these construction projects.
We continue to incur costs associated with the expansion of our contract activities
We continue to incur additional costs in connection with the expansion of our contract operations associated with the preparation of bids for new contract operations on prospective and existing military bases. Our ability to recover these costs and to earn a profit on our contract operations will depend upon the extent to which we are successful in obtaining new contracts and recovering these costs and other costs from new contract revenues.
We face competition for new military privatization contracts
An important part of our growth strategy is the expansion of our contracted services business through new contract awards to serve additional military bases for the U.S. government. ASUS competes with other regulated utilities, municipalities, and other entities for these contracts.
15
Other Risks
The accuracy of our judgments and estimates about financial and accounting matters will impact our operating results and financial condition
The quality and accuracy of estimates and judgments used have an impact on our operating results and financial condition. If our estimates are not accurate, we will be required to make an adjustment in a future period. We make certain estimates and judgments in preparing our financial statements regarding, among others:
•
timing of recovering WRAM and MCBA regulatory assets;
•
amounts to set aside for uncollectible accounts receivable, inventory obsolescence and uninsured losses;
|
•
|
our legal exposure and the appropriate accrual for claims, including general liability and workers' compensation claims;
|
•
future costs and assumptions for pensions and other post-retirement benefits;
•
regulatory recovery of deferred items; and
•
possible tax uncertainties.
Our business requires significant capital expenditures
The utility business is capital intensive. We spend significant sums of money for additions to, or replacement of, our property, plant and equipment at our water and electric utilities. We obtain funds for these capital projects from operations, contributions by developers and others, and refundable advances from developers (which are repaid over a period of time). We also periodically borrow money or issue equity for these purposes. In addition, we have a revolving credit facility that is partially used for these purposes. We cannot provide assurance that these sources will continue to be adequate or that the cost of funds will remain at levels permitting us to earn a reasonable rate of return.
Our Military Utility Privatization Subsidiaries providing water and wastewater services on military bases also expect to incur significant capital expenditures. To the extent that the U.S. government does not reimburse us for these expenditures as the work is performed or completed, the U.S. government will repay us over time.
We may be adversely impacted by economic conditions
Access to external financing on reasonable terms depends, in part, on conditions in the debt and equity markets. When business and market conditions deteriorate, we may no longer have access to the capital markets on reasonable terms. Our ability to obtain funds is dependent upon our ability to access the capital markets by issuing debt or equity to third parties or obtaining funds from our revolving credit facility. In the event of financial turmoil affecting the banking system and financial markets, consolidation of the financial services industry, significant financial service institution failures or our inability to renew or replace our existing revolving credit facility on favorable terms, it may become necessary for us to seek funds from other sources on less favorable terms.
Market conditions and demographic changes may adversely impact the value of our benefit plan assets and liabilities
Market factors can affect assumptions we use in determining funding requirements with respect to our pension and other post-retirement benefit plans. For example, a relatively modest change in our assumptions regarding discount rates can materially affect our calculation of funding requirements. To the extent that market data compels us to reduce the discount rate used in our assumptions, our benefit obligations could materially increase, which could adversely affect our financial position and cash flows. Further, changes in demographics, such as increases in life expectancy assumptions may also increase the funding requirements of our obligations related to the pension and other post-retirement benefit plans.
Market conditions also affect the values of the assets that are held in trusts to satisfy significant future obligations under our pension and other post-retirement benefit plans. These assets are subject to market fluctuations, which may cause investment returns to fall below our projected rates of return. A decline in the market value of our pension and other post-retirement benefit plan assets will increase the funding requirements under these plans if future returns on these assets are insufficient to offset the decline in value. Future increases in pension and other post-retirement costs as a result of the reduced value of plan assets may not be fully recoverable in rates, and our results of operations and financial position could be negatively affected. These risks are mitigated to some extent by the two-way pension balancing accounts authorized by the CPUC, which permits us to track differences between forecasted annual pension expense adopted in water and electric rates and actual pension expenses for future recovery or refund to customers.
16
Payment of our debt may be accelerated if we fail to comply with restrictive covenants in our debt agreements
Our failure to comply with restrictive covenants in our debt agreements could result in an event of default. If the default is not cured or waived, we may be required to repay or refinance the debt before it becomes due. Even if we are able to obtain waivers from our creditors, we may only be able to do so on unfavorable terms.
The price of our Common Shares may be volatile and may be affected by market conditions beyond our control
The trading price of our Common Shares may fluctuate in the future because of the volatility of the stock market and a variety of other factors, many of which are beyond our control. Factors that could cause fluctuations in the trading price of our Common Shares include: regulatory developments; general economic conditions and trends; price and volume fluctuations in the overall stock market; actual or anticipated changes or fluctuations in our results of operations; actual or anticipated changes in the expectations of investors or securities analysts; actual or anticipated developments in other utilities' businesses or the competitive landscape generally; litigation involving us or our industry; major catastrophic events, or sales of large blocks of our stock.
AWR is a holding company that depends on cash flow from its subsidiaries to meet its financial obligations and to pay dividends on its Common Shares
As a holding company, our subsidiaries conduct substantially all operations and our only significant assets are investments in our subsidiaries. This means that we are dependent on distributions of funds from our subsidiaries to meet our debt service obligations and to pay dividends on our Common Shares.
Our subsidiaries are separate and distinct legal entities and generally have no obligation to pay any amounts due on our credit facility. Our subsidiaries only pay dividends if and when declared by the respective subsidiary board. Moreover, GSWC is obligated to give first priority to its own capital requirements and to maintain a capital structure consistent with that determined to be reasonable by the CPUC in its most recent decision on capital structure in order that customers not be adversely affected by the holding company structure. Furthermore, our right to receive cash or other assets in the unlikely event of liquidation or reorganization of any of our subsidiaries is generally subject to the prior claims of creditors of that subsidiary. If we are unable to obtain funds from a subsidiary in a timely manner, we may be unable to meet our financial obligations, make additional investments or pay dividends.
Failure to attract, retain, train, motivate, develop and transition key employees could adversely affect our business
In order to be successful, we must attract, retain, train, motivate, and develop key employees, including those in managerial, operational, financial, regulatory, business-development and information-technology support positions. Our regulated business and contracted services operations are complex. Attracting and retaining high quality staff allows us to minimize the cost of providing quality service. In order to attract and retain key employees in a competitive marketplace, we must provide a competitive compensation package and be able to effectively recruit qualified candidates. The failure to successfully hire key employees or the loss of a material number of key employees could have a significant impact on the quality of our operations in the short term. Further, changes in our management team may be disruptive to our business, and any failure to successfully transition key new hires or promoted employees could adversely affect our business and results of operations.
We must successfully maintain and/or upgrade our information technology systems as we are increasingly dependent on the continuous and reliable operation of these systems
We rely on various information technology systems to manage our operations. Such systems require periodic modifications, upgrades and/or replacement, which subject us to inherent costs and risks including potential disruption of our internal control structure, substantial capital expenditures, additional administrative and operating expenses, retention of sufficiently skilled personnel to implement and operate the new systems, and other risks and costs of delays or difficulties in transitioning to new systems or of integrating new systems into our current systems. In addition, the difficulties with implementing new technology systems may cause disruptions in our business operations and have an adverse effect on our business and operations, if not anticipated and appropriately mitigated.
We rely on our computer, information and communications technology systems in connection with the operation of our business, especially with respect to customer service and billing, accounting and the monitoring and operation of our treatment, storage and pumping facilities. Our computer and communications systems and operations could be damaged or interrupted by weather, natural disasters, telecommunications failures or acts of war or terrorism or similar events or disruptions. Any of these or other events could cause system interruption, delays and loss of critical data, or delay or prevent operations and adversely affect our financial results.
17
Security risks, data protection breaches and cyber-attacks could disrupt our internal operations, and any such disruption could increase our expenses, damage our reputation and adversely affect our stock price
There have been an increasing number of cyber-attacks on companies around the world, which have caused operational failures or compromised sensitive corporate or customer data. These attacks have occurred over the internet, through malware, viruses or attachments to e-mails, or through persons inside the organization or with access to systems inside the organization. Although we do not believe that our systems are at a materially greater risk of cyber security attacks than other similar organizations, our information technology systems remain vulnerable to damage or interruption from:
|
•
|
computer viruses;
|
|
•
|
malware;
|
|
•
|
hacking; and
|
|
•
|
denial of service actions.
|
We have implemented security measures and will continue to devote significant resources to address any security vulnerabilities in an effort to prevent cyber-attacks. Despite our efforts, we cannot be assured that a cyber-attack will not cause water, wastewater or electric system problems, disrupt service to our customers, compromise important data or systems or result in unintended release of customer or employee information. Moreover, if a computer security breach affects our systems or results in the unauthorized release of sensitive data, our reputation could be materially damaged. We could also be exposed to a risk of loss or litigation and possible liability. In addition, pursuant to U.S. government regulations regarding cyber-security of government contractors, we might be subject to fines, penalties or other actions, including debarment, with respect to current contracts or with respect to future contract opportunities.
Our operations are geographically concentrated in California
Although we operate water and wastewater facilities in a number of states, our water and electric operations are concentrated in California, particularly Southern California. As a result, our financial results are largely subject to political, water supply, labor, utility cost and regulatory risks, economic conditions, natural disasters and other risks affecting California.
We operate in areas subject to natural disasters
We operate in areas that are prone to earthquakes, fires, mudslides, hurricanes, tornadoes, flooding or other natural disasters. While we maintain insurance policies to help reduce our financial exposure, a significant seismic event in Southern California, where GSWC's operations are concentrated, wildfires or other natural disasters in any of the areas that we serve could adversely impact our ability to deliver water and electricity or provide wastewater service and adversely affect our costs of operations. With respect to GSWC, the CPUC has historically allowed utilities to establish a catastrophic event memorandum account to potentially recover such costs. With respect to the Military Utility Privatization Subsidiaries, costs associated with response to natural disasters have been recoverable through requests for equitable adjustment.
Our operations may be the target of terrorist activities
Terrorists could seek to disrupt service to our customers by targeting our assets. We have invested in additional security for facilities throughout our regulated service areas to mitigate the risks of terrorist activities. We also may be prevented from providing water and/or wastewater services at the military bases we serve in times of military crisis affecting these bases.
The final determination of our income tax liability may be materially different from our income tax provision
Significant judgment is required in determining our provision for income taxes. Our calculation of the provision for income taxes is subject to our interpretation of applicable tax laws in the jurisdictions in which we file. In addition, our income tax returns are subject to periodic examination by the Internal Revenue Service and other taxing authorities.
On December 22, 2017, the Tax Cuts and Jobs Act (the "Tax Act") was signed into federal law. The provisions of this major tax reform were generally effective January 1, 2018. The most significant change impacting Registrant is the reduction of the corporate federal income tax rate from 35% to 21% effective January 1, 2018. Registrant remeasured its deferred tax balances to account for the effects of the Tax Act, which are reflected in its December 31, 2018 financial statements. Technical corrections or other forms of guidance addressing the Tax Act, as well as regulatory or governmental actions, could result in adjustments to Registrant's remeasurement and accounting for the effects of the Tax Act.
In December 2014, the Company also changed its tax method of accounting to permit the expensing of qualifying utility asset improvement costs that were previously being capitalized and depreciated for tax purposes. As a result of the
18
change, which included a cumulative adjustment for 2013 and prior years, the Company deducted a significant amount of asset costs that consisted primarily of water mains and connections. Our determination of costs that qualify as a capital asset versus an immediate tax deduction for utility asset improvements is subject to subsequent adjustment arising from review by taxing authorities, and may impact the deductions that have been taken on recently filed income tax returns. Although we believe our income tax estimates are appropriate, there is no assurance that the final determination of our current taxes payable will not be materially different, either higher or lower, from the amounts reflected in our financial statements. In the event we are assessed additional income taxes, our financial condition and cash flows could be adversely affected.
Item 1B. Unresolved Staff Comments
None.
19
Item 2. Properties
Water Properties
As of
December 31, 2018
, GSWC’s physical properties consisted of water transmission and distribution systems which included 2,789 miles of pipeline together with services, meters and fire hydrants and approximately 450 parcels of land, generally less than one acre each, on which are located wells, pumping plants, reservoirs and other water utility facilities, including four surface water treatment plants. GSWC also has franchises, easements and other rights of way for the purpose of accessing wells and tanks and constructing and using pipes and appurtenances for transmitting and distributing water. All of GSWC's properties are located in California.
As of
December 31, 2018
, GSWC owned 235 wells, of which 186 are active with an aggregate production capacity of approximately 189 million gallons per day. GSWC has 61 connections to the water distribution facilities of the MWD and other municipal water agencies. GSWC’s storage reservoirs and tanks have an aggregate capacity of approximately 113.8 million gallons. GSWC owns no dams. The following table provides information regarding the water utility plant of GSWC:
|
Pumps
|
Distribution Facilities
|
Reservoirs
|
||||||||||||||||||
|
Well
|
Booster
|
Mains*
|
Services
|
Hydrants
|
Tanks
|
Capacity*
|
||||||||||||||
|
235
|
|
387
|
|
2,789
|
|
259,986
|
|
26,235
|
|
142
|
|
113.8
|
|
(1)
|
||||||
* Reservoir capacity is measured in millions of gallons. Mains are in miles.
(1)
GSWC has additional capacity in its Bay Point system through an exclusive capacity right to use 4.4 million gallons per day from a treatment plant owned by the Contra Costa Water District. GSWC also has additional reservoir capacity through an exclusive right to use all of one eight-million-gallon reservoir, one-half of another eight-million-gallon reservoir, and one-half of a treatment plant’s capacity, all owned by the Three Valleys Municipal Water District, to serve the cities of Claremont and San Dimas.
Electric Properties
GSWC’s electric properties are located in the Big Bear area of San Bernardino County, California. As of
December 31, 2018
, GSWC owned and operated approximately 87.8 miles of overhead 34.5 kilovolt (kv) sub-transmission lines, 5.9 miles of underground 34.5 kv sub-transmission lines, 489.6 miles of 4.16 kv or 2.4 kv distribution lines, 103.2 miles of underground cable, 13 sub-stations and a natural gas-fueled 8.4 MW peaking generation facility. GSWC also has franchises, easements and other rights of way for the purpose of constructing and using poles, wires and other appurtenances for transmitting electricity.
Adjudicated and Other Water Rights
GSWC owns groundwater and surface water rights in California. Groundwater rights are further subject to classification as either adjudicated or unadjudicated rights. Adjudicated rights have been subjected to comprehensive litigation in the courts, are typically quantified and are actively managed for optimization and sustainability of the resource. Unadjudicated rights are subject to further regulation by the State Water Resources Control Board (“SWRCB”) and the California Department of Water Resources. Surface water rights are quantified and managed by the SWRCB, unless the surface water rights originated prior to 1914. As of
December 31, 2018
, GSWC had adjudicated groundwater rights and surface water rights of 73,431 and 11,335 acre-feet per year, respectively. GSWC also has a number of unadjudicated groundwater rights, which have not been quantified, but are typically measured by historical usage.
Office Buildings
GSWC owns its general headquarters facility in San Dimas, California. GSWC also owns and leases customer service offices and office space throughout California. ASUS leases office facilities in Georgia, Virginia and North Carolina. ECUS and FRUS rent temporary service center facilities in Florida and Kansas, respectively, pending the completion of facilities to be constructed at those locations. FBWS has a renewable, no-cost license for use of space in a U.S. government building at Fort Bliss pending construction of an owned service center. TUS, PSUS, ODUS and ONUS own service centers in Maryland, South Carolina, Virginia and North Carolina, respectively.
20
Mortgage and Other Liens
As of
December 31, 2018
, neither AWR, GSWC, ASUS, nor any of its subsidiaries, had any mortgage debt or liens securing indebtedness outstanding.
Under the terms of certain debt instruments, AWR and GSWC are prohibited from issuing any secured debt, without providing equal and ratable security to the holders of this existing debt.
Condemnation of Properties
The laws of the state of California provide for the acquisition of public utility property by governmental agencies through their power of eminent domain, also known as condemnation, where doing so constitutes a more necessary use. In addition, these laws provide that the owner of utility property (i) may contest whether the condemnation is actually necessary, and (ii) is entitled to receive the fair market value of its property if the property is ultimately taken.
Environmental Clean-Up and Remediation of Properties
GSWC has been involved in environmental remediation and clean-up at a plant site ("Chadron Plant") that contained an underground storage tank which was used to store gasoline for its vehicles. This tank was removed from the ground in July 1990 along with the dispenser and ancillary piping. Since then, GSWC has been involved in various remediation activities at this site.
GSWC has accrued an estimated liability which includes costs for two years of continued activities of cleanup and monitoring, and site-closure-related activities. The ultimate cost may vary as there are many unknowns in remediation of underground gasoline spills and this is an estimate based on currently available information. Management believes it is probable that the estimated additional costs will be approved for inclusion in rate base by the CPUC.
Item 3. Legal Proceedings
Registrant is subject to ordinary routine litigation incidental to its business, some of which may include claims for compensatory and punitive damages. Management believes that rate recovery, proper insurance coverage and reserves are in place to insure against, among other things, property, general liability, employment, and workers’ compensation claims incurred in the ordinary course of business. Insurance coverage may not cover certain claims involving punitive damages.
Item 4. Mine Safety Disclosure
Not applicable.
21
PART II
Item 5. Market for Registrant’s Common Equity, Related Stockholder Matters and Issuer Purchases of Equity Securities
Stock Performance Graph
The graph below compares the cumulative 5-year total return on American States Water Company's Common Shares relative to the cumulative total returns of the S&P 500 index and a peer group of eight publicly traded companies headquartered in the United States. The eight companies included in the Company's customized peer group are: American Water Works Company Inc., Aqua America Inc., Artesian Resources Corporation, California Water Service Group, Connecticut Water Service Inc., Middlesex Water Company, York Water Company and SJW Group.
An investment of $100 (with reinvestment of all dividends) is assumed to have been made in our Common Shares, and in the common stock in the index and in the peer group on December 31, 2013. Relative performance is tracked through
December 31, 2018
.
COMPARISON OF 5 YEAR CUMULATIVE TOTAL RETURN*
among American States Water Company, the S&P 500 Index,
and a Peer Group
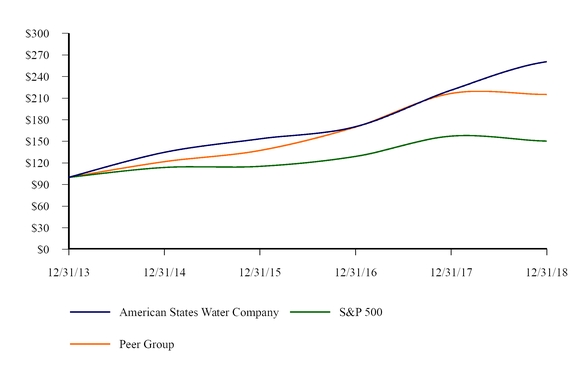
*$100 invested on December 31, 2013 in stock or index, including reinvestment of dividends.
Fiscal year ending December 31.
Copyright© 2019 Standard & Poor's, a division of S&P Global. All rights reserved
|
|
12/2013
|
12/2014
|
12/2015
|
12/2016
|
12/2017
|
12/2018
|
|||||||||||||||||
|
American States Water Company
|
$
|
100.00
|
|
$
|
134.70
|
|
$
|
153.44
|
|
$
|
170.32
|
|
$
|
221.02
|
|
$
|
260.61
|
|
|||||
|
S&P 500
|
$
|
100.00
|
|
$
|
113.69
|
|
$
|
115.26
|
|
$
|
129.05
|
|
$
|
157.22
|
|
$
|
150.33
|
|
|||||
|
Peer Group
|
$
|
100.00
|
|
$
|
121.74
|
|
$
|
137.31
|
|
$
|
169.86
|
|
$
|
216.46
|
|
$
|
215.01
|
|
|||||
The stock price performance included in this graph is not necessarily indicative of future stock price performance.
22
Market Information Relating to Common Shares
Common Shares of American States Water Company are traded on the New York Stock Exchange (“NYSE”) under the symbol “AWR”. The intra-day high and low NYSE prices on the Common Shares for each quarter during the past two years were:
|
|
Stock Prices
|
||||||
|
|
High
|
Low
|
|||||
|
2018
|
|
|
|||||
|
First Quarter
|
$
|
60.00
|
|
$
|
50.16
|
|
|
|
Second Quarter
|
$
|
58.82
|
|
$
|
51.30
|
|
|
|
Third Quarter
|
$
|
61.66
|
|
$
|
57.13
|
|
|
|
Fourth Quarter
|
$
|
69.61
|
|
$
|
58.48
|
|
|
|
2017
|
|
|
|
|
|||
|
First Quarter
|
$
|
45.92
|
|
$
|
41.14
|
|
|
|
Second Quarter
|
$
|
50.86
|
|
$
|
43.08
|
|
|
|
Third Quarter
|
$
|
51.78
|
|
$
|
46.62
|
|
|
|
Fourth Quarter
|
$
|
58.44
|
|
$
|
49.55
|
|
|
The closing price of the Common Shares of American States Water Company on the NYSE on
February 22, 2019
was
$71.40
.
Approximate Number of Holders of Common Shares
As of
February 22, 2019
, there were
2,204
holders of record of the
36,774,205
outstanding Common Shares of American States Water Company. AWR owns all of the outstanding Common Shares of GSWC and ASUS. ASUS owns all of the outstanding stock of the Military Utility Privatization Subsidiaries.
Frequency and Amount of Any Dividends Declared and Dividend Restrictions
For the last two years, AWR has paid dividends on its Common Shares on or about March 1, June 1, September 1 and December 1. The following table lists the amounts of dividends paid on Common Shares of American States Water Company:
|
|
2018
|
2017
|
|||||
|
First Quarter
|
$
|
0.255
|
|
$
|
0.242
|
|
|
|
Second Quarter
|
$
|
0.255
|
|
$
|
0.242
|
|
|
|
Third Quarter
|
$
|
0.275
|
|
$
|
0.255
|
|
|
|
Fourth Quarter
|
$
|
0.275
|
|
$
|
0.255
|
|
|
|
Total
|
$
|
1.060
|
|
$
|
0.994
|
|
|
AWR’s ability to pay dividends is subject to the requirement in its $150.0 million revolving credit facility to maintain compliance with all covenants described in footnote
(14)
to the table in the section entitled “
Contractual Obligations, Commitments and Off-Balance Sheet Arrangements
” included in Part II, Item 7, in Management’s Discussion and Analysis of Financial Condition and Results of Operation. GSWC’s maximum ability to pay dividends is restricted by certain Note Agreements to the sum of $21.0 million plus 100% of consolidated net income from certain dates plus the aggregate net cash proceeds received from capital stock offerings or other instruments convertible into capital stock from various dates. Under the most restrictive of the Note Agreements,
$427.4 million
was available from GSWC to pay dividends to AWR as of
December 31, 2018
. GSWC is also prohibited under the terms of senior notes from paying dividends if, after giving effect to the dividend, its total indebtedness to capitalization ratio (as defined) would be more than 0.6667-to-1. GSWC would have to issue additional debt of
$627.7 million
to invoke this covenant as of
December 31, 2018
.
23
Under California law, AWR, GSWC and ASUS are each permitted to distribute dividends to its shareholders and repurchase its shares so long as the Board of Directors determines, in good faith, that either: (i) the value of the corporation’s assets equals or exceeds the sum of its total liabilities immediately after the dividend, or (ii) its retained earnings equals or exceeds the amount of the distribution. Under the least restrictive of the California tests, approximately
$304.5 million
was available to pay dividends to AWR’s common shareholders and repurchase shares from AWR’s common shareholders at
December 31, 2018
. Approximately
$211.2 million
was available for GSWC to pay dividends to AWR at
December 31, 2018
and approximately
$67.3 million
was available for ASUS to pay dividends to AWR at
December 31, 2018
. However, ASUS's ability to pay dividends is further subject to the ability of each of its subsidiaries to pay dividends to it, which may, in turn, be restricted by the laws under the state in which the applicable subsidiary was formed.
AWR paid
$38.9 million
in dividends to shareholders for the year ended
December 31, 2018
, as compared to
$36.4 million
for the year ended
December 31, 2017
. GSWC paid dividends of
$68.9 million
and
$27.7 million
to AWR in
2018
and
2017
, respectively. ASUS paid dividends of
$10.1 million
and
$8.9 million
to AWR in
2018
and
2017
, respectively.
Other Information
The shareholders of AWR have approved the material features of all equity-compensation plans under which AWR directly issues equity securities. AWR did not directly issue any unregistered equity securities during
2018
.
The following table provides information about AWR repurchases of its Common Shares during the fourth quarter of
2018
:
|
Period
|
Total Number of Shares Purchased
|
Average Price Paid per Share
|
Total Number of
Shares Purchased as Part of Publicly Announced Plans or Programs (1) |
Maximum Number
of Shares That May Yet Be Purchased under the Plans or Programs (1)(3) |
|||||||||
|
October 1 - 31, 2018
|
43,380
|
|
$
|
59.96
|
|
—
|
|
—
|
|
||||
|
November 1 - 30, 2018
|
12,409
|
|
$
|
64.70
|
|
—
|
|
—
|
|
||||
|
December 1 - 31, 2018
|
19,059
|
|
$
|
65.55
|
|
—
|
|
—
|
|
||||
|
Total
|
74,848
|
|
(2)
|
$
|
62.17
|
|
—
|
|
|
|
|||
(1)
None of the Common Shares were repurchased pursuant to any publicly announced stock repurchase program.
(2)
Of this amount, 69,868 Common Shares were acquired on the open market for employees pursuant to the 401(k) Plan and the remainder of the Common Shares were acquired on the open market for participants in the Common Share Purchase and Dividend Reinvestment Plan.
(3)
Neither the 401(k) plan nor the Common Share Purchase and Dividend Reinvestment Plan contains a maximum number of common shares that may be purchased in the open market.
24
Item 6. Selected Financial Data
AMERICAN STATES WATER COMPANY (AWR):
|
(in thousands, except per share amounts)
|
2018
|
2017 (1)
|
2016
|
2015
|
2014
|
|||||||||||||||
|
Income Statement Information:
|
|
|
|
|
|
|
|
|
|
|
||||||||||
|
Total Operating Revenues
|
$
|
436,816
|
|
$
|
440,603
|
|
$
|
436,087
|
|
$
|
458,641
|
|
$
|
465,791
|
|
|||||
|
Total Operating Expenses
(2)
|
335,833
|
|
313,508
|
|
321,895
|
|
339,721
|
|
347,027
|
|
||||||||||
|
Operating Income
(2)
|
100,983
|
|
127,095
|
|
114,192
|
|
118,920
|
|
118,764
|
|
||||||||||
|
Interest Expense
|
23,433
|
|
22,582
|
|
21,992
|
|
21,088
|
|
21,617
|
|
||||||||||
|
Interest Income
|
3,578
|
|
1,790
|
|
757
|
|
458
|
|
927
|
|
||||||||||
|
Net Income
|
$
|
63,871
|
|
$
|
69,367
|
|
$
|
59,743
|
|
$
|
60,484
|
|
$
|
61,058
|
|
|||||
|
Basic Earnings per Common Share
|
$
|
1.73
|
|
$
|
1.88
|
|
$
|
1.63
|
|
$
|
1.61
|
|
$
|
1.57
|
|
|||||
|
Fully Diluted Earnings per Common Share
|
$
|
1.72
|
|
$
|
1.88
|
|
$
|
1.62
|
|
$
|
1.60
|
|
$
|
1.57
|
|
|||||
|
Average Shares Outstanding
|
36,733
|
|
36,638
|
|
36,552
|
|
37,389
|
|
38,658
|
|
||||||||||
|
Average number of Diluted Shares Outstanding
|
36,936
|
|
36,844
|
|
36,750
|
|
37,614
|
|
38,880
|
|
||||||||||
|
Dividends paid per Common Share
|
$
|
1.060
|
|
$
|
0.994
|
|
$
|
0.914
|
|
$
|
0.874
|
|
$
|
0.831
|
|
|||||
|
Balance Sheet Information:
|
|
|
|
|
|
|
|
|
|
|
||||||||||
|
Total Assets
(3) (4)
|
$
|
1,501,433
|
|
$
|
1,416,734
|
|
$
|
1,470,493
|
|
$
|
1,343,959
|
|
$
|
1,373,316
|
|
|||||
|
Common Shareholders’ Equity
|
558,223
|
|
529,945
|
|
494,297
|
|
465,945
|
|
506,801
|
|
||||||||||
|
Long-Term Debt
(4)
|
281,087
|
|
321,039
|
|
320,981
|
|
320,900
|
|
320,816
|
|
||||||||||
|
Total Capitalization
|
$
|
839,310
|
|
$
|
850,984
|
|
$
|
815,278
|
|
$
|
786,845
|
|
$
|
827,617
|
|
|||||
GOLDEN STATE WATER COMPANY (GSWC):
|
(in thousands)
|
2018
|
2017 (1)
|
2016
|
2015
|
2014
|
|||||||||||||||
|
Income Statement Information:
|
|
|
|
|
|
|||||||||||||||
|
Total Operating Revenues
|
$
|
329,608
|
|
$
|
340,301
|
|
$
|
338,702
|
|
$
|
364,550
|
|
$
|
361,059
|
|
|||||
|
Total Operating Expenses
(2)
|
249,046
|
|
234,430
|
|
243,515
|
|
263,887
|
|
261,698
|
|
||||||||||
|
Operating Income
(2)
|
80,562
|
|
105,871
|
|
95,187
|
|
100,663
|
|
99,361
|
|
||||||||||
|
Interest Expense
|
22,621
|
|
22,055
|
|
21,782
|
|
20,998
|
|
21,524
|
|
||||||||||
|
Interest Income
|
2,890
|
|
1,766
|
|
749
|
|
440
|
|
894
|
|
||||||||||
|
Net Income
|
$
|
48,012
|
|
$
|
53,757
|
|
$
|
46,969
|
|
$
|
47,591
|
|
$
|
47,857
|
|
|||||
|
Balance Sheet Information:
|
|
|
|
|
||||||||||||||||
|
Total Assets
(3) (4)
|
$
|
1,389,222
|
|
$
|
1,326,823
|
|
$
|
1,384,178
|
|
$
|
1,271,879
|
|
$
|
1,277,392
|
|
|||||
|
Common Shareholder’s Equity
|
503,575
|
|
474,374
|
|
446,770
|
|
423,730
|
|
435,190
|
|
||||||||||
|
Long-Term Debt
(4)
|
281,087
|
|
321,039
|
|
320,981
|
|
320,900
|
|
320,816
|
|
||||||||||
|
Total Capitalization
|
$
|
784,662
|
|
$
|
795,413
|
|
$
|
767,751
|
|
$
|
744,630
|
|
$
|
756,006
|
|
|||||
(1)
2017 results include an $8.3 million pretax gain, or $0.13 per share, from the sale of GSWC's Ojai water system.
(2)
Registrant adopted Accounting Standards Update ASU 2017-07,
Improving the Presentation of Net Periodic Pension Cost,
as of January 1, 2018 on a retrospective basis.
As a result,
service costs for defined benefit pension plans and other retirement benefits continue to be reflected as operating expenses, while all other components of net benefit cost for retirement plans (such as interest cost, expected return on assets, and the amortization of prior service costs and actuarial gains and losses) are presented outside of operating income. Total Operating Expenses and Operating Income have been restated for all periods presented above.
(3)
Registrant adopted Accounting Standards Update 2015-17,
Balance Sheet Classification of Deferred Taxes,
as of December 31, 2015 on a prospective basis, whereby all deferred tax assets and liabilities are classified as noncurrent on the Registrant's balance sheet. Prior periods were not retrospectively adjusted.
(4)
Registrant adopted Accounting Standard Update 2015-03,
Simplifying the Presentation of Debt Issuance Costs
as of December 31, 2016, whereby debt issuance costs and redemption premiums are presented as a direct reduction from the carrying value of the associated debt rather than as an asset. Total Assets and Long-Term Debt have been restated for all periods presented above.
25
Item 7. Management’s Discussion and Analysis of Financial Condition and Results of Operation
The following discussion and analysis provides information on AWR’s consolidated operations and assets, and, where necessary, includes specific references to AWR’s individual segments and/or its subsidiaries: GSWC and ASUS and its subsidiaries. Included in the following analysis is a discussion of water and electric gross margins. Water and electric gross margins are computed by subtracting total supply costs from total revenues. Registrant uses these gross margins as important measures in evaluating its operating results. Registrant believes these measures are useful internal benchmarks in evaluating the performance of GSWC.
The discussions and tables included in the following analysis also present Registrant’s operations in terms of earnings per share by business segment. Registrant believes that the disclosure of earnings per share by business segment provides investors with clarity surrounding the performance of its different services. Registrant reviews these measurements regularly and compares them to historical periods and to its operating budget. Furthermore, the discussion refers to a non-core business activity related to gains and losses on Registrant's investments held to fund a retirement benefit plan, which is excluded when communicating earnings results to help facilitate comparisons of the Company’s performance from period to period. However, all of these measures, which are not presented in accordance with Generally Accepted Accounting Principles (“GAAP”), may not be comparable to similarly titled measures used by other enterprises and should not be considered as an alternative to operating income or earnings per share, which are determined in accordance with GAAP. A reconciliation of water and electric gross margins to the most directly comparable GAAP measures is included in the table under the section titled “
Operating Expenses: Supply Costs.
” Reconciliations to AWR’s diluted earnings per share are included in the discussions under the sections titled “
Summary Results by Segment.
”
Overview
Factors affecting our financial performance are summarized under
Forward-Looking Information
.
Water and Electric Segments:
GSWC's revenues, operating income and cash flows are earned primarily through delivering potable water to homes and businesses in California and the delivery of electricity in the Big Bear area of San Bernardino County, California. Rates charged to GSWC customers are determined by the CPUC. These rates are intended to allow recovery of operating costs and a reasonable rate of return on capital. GSWC plans to continue to seek additional rate increases in future years from the CPUC to recover operating and supply costs and receive reasonable returns on invested capital. Capital expenditures in future years at GSWC are expected to remain at higher levels than depreciation expense. When necessary, GSWC obtains funds from external sources in the capital markets and through bank borrowings.
Pending General Rate Case Filings
:
Water Segment:
In July 2017, GSWC filed a general rate case application for its water regions and the general office. The general rate case will determine new water rates for the years 2019 through 2021. On August 15, 2018, GSWC and the CPUC’s Public Advocates Office, formerly the Office of Ratepayer Advocates, filed a joint motion to adopt a settlement agreement between GSWC and the Public Advocates Office in connection with the general rate case. If approved by the CPUC, the settlement would resolve all of the issues in the general rate case application and authorize GSWC to invest approximately $334.5 million in capital infrastructure over the three-year rate cycle. The $334.5 million of infrastructure investment, as settled, includes $20.4 million of capital projects to be filed for revenue recovery through advice letters when those projects are completed.
Excluding the advice-letter-project revenues, the water gross margin for 2019 in the settlement filing is expected to increase by approximately $6.0 million as compared to the 2018 adopted water gross margin. The 2019 water revenue requirement, as settled, has been reduced to reflect a decrease of approximately $7.0 million in depreciation expense, compared to the adopted 2018 depreciation expense, due to a reduction in the overall composite depreciation rates based on a revised study filed in the general rate case. The decrease in depreciation expense lowers the water gross margin, and is offset by a corresponding decrease in depreciation expense, resulting in no impact to net earnings. In addition, the 2019 water revenue requirement, as settled, includes a decrease of approximately $2.2 million for excess deferred tax refunds as a result of the Tax Act, which has a corresponding decrease in income tax expense and also results in no impact to net earnings. Had depreciation expense, as settled, remained the same as the 2018 adopted amount and there was no excess deferred tax refund that lowered the 2019 revenue requirement, the water gross margin for 2019 would have increased by approximately $15.2 million. The settlement also allows for potential additional water revenue increases in 2020 and 2021 of approximately $10.0 million and $12.0 million, respectively, subject to the results of an earnings test and changes to the forecasted inflationary index values.
GSWC and the Public Advocates Office informed the assigned Administrative Law Judge ("ALJ”) that hearings would not be needed in light of the settlement agreement. Subsequently, the ALJ issued a ruling requesting additional information on
26
a number of items in the general rate case. GSWC has provided the additional information requested by the ALJ and believes it has satisfied all of the questions raised. Both the ALJ’s request and GSWC’s response are public information. GSWC is awaiting a proposed decision by the ALJ, which is expected during the first quarter of 2019, with a final decision by the CPUC expected later in 2019. When approved, the new rates will be retroactive to January 1, 2019.
Electric Segment:
In May 2017, GSWC filed its electric general rate case application with the CPUC to determine new electric rates for the years 2018 through 2021. In November 2018, GSWC and the Public Advocates Office filed a joint motion to adopt a settlement agreement between the two parties resolving all issues in connection with the general rate case. Among other things, the settlement incorporates a previous stipulation in the case, which authorizes a new return on equity for GSWC's electric segment of 9.60%, as compared to its previously authorized return of 9.95%. The stipulation also included a capital structure and debt cost similar to those approved by the CPUC in March 2018 in connection with GSWC's water segment cost of capital proceeding, as discussed below. Because of the delay in finalizing the electric general rate case, billed electric revenues in 2018 were based on 2017 adopted rates, pending a final decision by the CPUC in this rate case application. Had the new rates in the settlement agreement been approved by the CPUC prior to December 31, 2018, the electric segment’s gross margin would have increased by approximately $2.0 million, or $0.04 per share, for the year ended December 31, 2018. A decision in this case is expected in 2019, and when approved by the CPUC, the new rates will be retroactive to January 1, 2018. Accordingly, Registrant will record the 2018 increase to earnings in the period in which a CPUC decision is received.
Cost of Capital Proceeding for GSWC's Water Segment:
In March 2018, the CPUC issued a final decision in the cost of capital proceeding for GSWC and three other investor-owned water utilities that serve California. Among other things, the final decision adopts for GSWC (i) a return on equity of 8.90%, (ii) a cost of debt of 6.6%, (iii) a capital structure with 57% equity and 43% debt, (iv) a return on rate base of 7.91%, and (v) the continuation of the water cost of capital adjustment mechanism. GSWC’s prior authorized return on equity and equity ratio for its water segment were 9.43% and 55%, respectively, with a return on rate base of 8.34%. The newly authorized return on rate base of 7.91% reflects a true-up of GSWC’s embedded debt cost from 6.99% to 6.60%. The reduced debt costs contributed approximately 18 basis points to the 43-basis-point drop in the authorized return on rate base. The lower return on rate base beginning in 2018 decreased GSWC’s 2018 adopted annual revenue requirement by approximately $3.6 million, or $0.07 per share.
Contracted Services Segment:
ASUS's revenues, operating income and cash flows are earned by providing water and/or wastewater services, including operation and maintenance services and construction of facilities at the water and/or wastewater systems at various military installations, pursuant to 50-year firm fixed-price contracts. The contract price for each of these 50-year contracts is subject to annual economic price adjustments. Additional revenues generated by contract operations are primarily dependent on new construction activities under contract modifications with the U.S. government or agreements with other third-party prime contractors.
Fort Riley:
On July 1, 2018, ASUS assumed the operation, maintenance and construction management of the water distribution and wastewater collection and treatment facilities at Fort Riley, a United States Army installation located in Kansas, after completing a transition period and a detailed inventory study. The contract was awarded by the U.S. government in September 2017 with a value of $681 million over a 50-year period. The 50-year contract is also subject to annual economic price adjustments.
Eglin Air Force Base (“Eglin AFB”):
On June 15, 2017, ASUS assumed operations of the water and wastewater systems at Eglin AFB in Florida after completing a transition period and a detailed joint inventory study. The value of the 50-year contract is approximately $702.4 million. The contract is subject to annual economic price adjustments.
With the addition of Fort Riley and Eglin AFB, ASUS serves 11 military bases in the United Sates, including four of the largest military installations: Fort Bragg, Fort Bliss, Eglin AFB and Fort Riley.
U.S. Government Shutdown:
From December 22, 2018 until January 25, 2019, the U.S. government shutdown impacted non-essential government employees due to the lack of an approved appropriations bill to fund the operations of the federal government for fiscal year 2019. However, the shutdown did not have an impact on ASUS due to the fact that funding for military operations (including military bases) is provided by the Department of Defense, which is fully funded for fiscal 2019 and was not part of the government shutdown.
27
Tax Cuts and Jobs Act:
On December 22, 2017, the Tax Act was signed into federal law. The provisions of this major tax reform were generally effective January 1, 2018. The most significant provisions of the Tax Act impacting GSWC are the reduction of the federal corporate income tax rate from 35% to 21% and the elimination of bonus depreciation for regulated utilities. As a result, for the year ended December 31, 2018, the water-revenue requirement was lower by approximately $12.5 million as compared to 2017 as a result of the Tax Act, which was largely offset by a decrease in income tax expense, resulting in no material impact to net earnings. The CPUC also ordered GSWC to update its pending electric general rate case filing to reflect the lower federal corporate income tax rate. For the year ended December 31, 2018, GSWC reduced electric revenues by approximately $1.2 million, which was also largely offset by a corresponding decrease in income tax expense, resulting in no material impact to net earnings. In 2017, the Tax Act did have a negative impact on net earnings at the water segment as a result of remeasuring deferred tax balances to reflect the lower federal tax rate; however, that was mostly offset by an increase in net earnings at AWR (parent) and, to a lesser extent, at the other two business segments.
In addition to lowering customer rates, GSWC expects the Tax Act to reduce property-related deferred tax liabilities. Property-related deferred tax liabilities reduce GSWC's rate base. As new plant is placed in service, the lower federal corporate tax rate will result in lower deferred tax liabilities. As a result of the lower federal tax rate and elimination of bonus depreciation by the Tax Act, GSWC expects that its rate base and earnings will increase for the same level of expected capital expenditures. This increase is expected to be partially offset by higher financing costs arising from a greater need to fund capital expenditures through the issuance of debt and/or equity due to lower cash flows from operating activities.
During the second and third quarter of 2018, the U.S. government issued contract modifications for the majority of ASUS's 50-year contracts addressing the impacts of the Tax Act. The modifications did not result in a material impact to ASUS's results for the year ended December 31, 2018.
Summary Results by Segment
The table below sets forth diluted earnings per share by business segment for AWR’s operations:
|
|
Diluted Earnings per Share
|
||||||||||
|
|
Year Ended
|
|
|||||||||
|
|
12/31/2018
|
12/31/2017
|
CHANGE
|
||||||||
|
Water, excluding one-time gain on sale of Ojai water system
|
$
|
1.19
|
|
$
|
1.22
|
|
$
|
(0.03
|
)
|
||
|
Electric
|
0.11
|
|
0.11
|
|
—
|
|
|||||
|
Contracted services
|
0.42
|
|
0.37
|
|
0.05
|
|
|||||
|
AWR (parent)
|
—
|
|
0.05
|
|
(0.05
|
)
|
|||||
|
Consolidated diluted earnings per share, adjusted
|
1.72
|
|
1.75
|
|
(0.03
|
)
|
|||||
|
Gain on sale of Ojai water system
|
—
|
|
0.13
|
|
(0.13
|
)
|
|||||
|
Totals from operations, as reported
|
$
|
1.72
|
|
$
|
1.88
|
|
$
|
(0.16
|
)
|
||
Water Segment:
Included in the results for the year ended
December 31, 2017
were (i) the recognition of a pretax gain of $8.3 million, or $0.13 per share, on the sale of GSWC's Ojai water system in June of 2017, with no similar gain in 2018, and (ii) the recovery in February 2017 of incremental costs approved by the CPUC related to California's drought state of emergency that were previously expensed, and which resulted in an increase to pretax earnings in 2017 of $1.5 million, or $0.02 per share (approximately $1.2 million was reflected as a reduction to other operation expenses and approximately $260,000 was reflected as additional revenue). Furthermore, affecting the results and comparability between the two periods were losses incurred during 2018, as a result of market conditions, on Registrant's investments held to fund a retirement benefit plan as compared to gains recorded in 2017. This non-core business item decreased the water segment’s earnings on a relative basis by approximately $0.05 per share.
Excluding the impact of the items discussed above, diluted earnings from the water segment for
2018
increased by $0.04 per share as compared to
2017
due to the following items:
|
•
|
An overall increase in the water gross margin of $0.03 per share, largely due to revenues generated from CPUC-approved third-year rate increases effective January 1, 2018, partially offset by the effect of the cessation of the Ojai operations in June of 2017 and the revenue impact from the lower authorized return on rate base in the cost of capital proceeding approved by the CPUC and effective in 2018. The lower return on rate base decreased GSWC’s 2018 adopted annual water revenue requirement by approximately $3.6 million, or $0.07 per share.
|
28
|
•
|
An increase in operating expenses (excluding supply costs) decreased earnings by approximately $0.04 per share due, in large part, to a reduction in legal costs of $1.8 million, or $0.03 per share, recorded in December 2017 for amounts received from the City of Claremont pursuant to a settlement agreement, with no similar item in the fourth quarter of 2018. Excluding this item, overall recurring operating expenses increased by approximately $0.01 per share due mostly to higher depreciation and property tax expenses, both of which are due to plant additions.
|
|
•
|
Excluding gains and losses from investments, there was an increase in interest and other income (net of interest expense), which increased earnings by approximately $0.01 per share due, in part, to interest income related to a federal tax refund recorded during the fourth quarter of 2018, partially offset by an increase in interest expense resulting from higher short-term borrowings to fund operations and a portion of GSWC's capital expenditures.
|
|
•
|
An overall decrease in the water segment's effective income tax rate ("ETR"), which positively impacted earnings by approximately $0.04 per share. The decrease in the ETR was due, in large part, to the unfavorable remeasurement adjustment recorded in December 2017 at the water segment related to certain non-rate-regulated deferred tax assets (primarily compensation- and benefit-related items) in connection with the Tax Act. The one-time remeasurement negatively impacted water net earnings in 2017 by approximately $0.03 per share. There was no similar adjustment in 2018. In addition, the water ETR was favorably impacted in 2018 by changes in flow-through adjustments recorded in accordance with regulatory requirements (primarily related to plant and compensation-related items).
|
The comparison between the two periods discussed above also excluded the reductions in water revenue in 2018 resulting from the Tax Act and billed surcharges, both of which had no material impact to earnings.
Electric Segment:
For each of the years ended
December 31, 2018
, and
2017
, diluted earnings from the electric segment were
$0.11
per share. Due to the delay in the electric general rate case, billed revenues in 2018 were based on 2017 adopted rates, pending a final CPUC decision on the electric general rate case. In November 2018, GSWC and the CPUC’s Public Advocates Office filed a joint motion to adopt a settlement agreement between the two parties resolving all issues in connection with the general rate case. A decision in this case is expected in 2019 and when approved by the CPUC, the new rates will be retroactive to January 1, 2018. Had the new rates in the settlement agreement been approved by the CPUC prior to December 31, 2018, the electric segment’s gross margin would have been higher by approximately $2.0 million, or $0.04 per share, for the year ended December 31, 2018.
Contracted Services Segment:
For the year ended
December 31, 2018
, diluted earnings from contracted services were
$0.42
per share, compared to
$0.37
per share for the same period in
2017
. Included in the results for 2017 were retroactive revenues resulting from the approval of the third price redetermination at Fort Bragg, which totaled approximately $1.0 million, or $0.02 per share, related to periods prior to 2017. Excluding this retroactive amount, diluted earnings per share from the contracted services segment increased $0.07 per share as compared to 2017, due largely to the commencement of operations at Eglin AFB and Fort Riley in June 2017 and July 2018, respectively. There was also an increase in management fee revenues at the other military bases resulting from the successful resolution of various price adjustments during 2017 and 2018. These increases were partially offset by lower construction activities at the military bases other than Eglin AFB and Fort Riley.
AWR (parent):
For the year ended
December 31, 2018
, diluted earnings from AWR (parent) decreased
$0.05
per share compared to
2017
. Included in the results for 2017 was the one-time benefit from the remeasurement of the AWR (parent) deferred tax balances as a result of the Tax Act. This one-time remeasurement was based on the Tax Act's lower federal corporate tax rate of 21%, which increased earnings at AWR (parent) by approximately $0.03 per share during 2017. There was no similar adjustment in 2018. In addition, there were higher state unitary taxes recorded at the parent level during 2018 as compared to the same period in 2017.
The following discussion and analysis for the years ended
December 31,
2018
,
2017
and
2016
provides information on AWR’s consolidated operations and assets and, where necessary, includes specific references to AWR’s individual segments and subsidiaries: GSWC and ASUS and its subsidiaries.
29
Consolidated Results of Operations — Years Ended
December 31,
2018
and
2017
(amounts in thousands, except per share amounts)
:
|
Year Ended
|
Year Ended
|
$
|
%
|
|||||||||||
|
12/31/2018
|
12/31/2017
|
CHANGE
|
CHANGE
|
|||||||||||
|
OPERATING REVENUES
|
|
|
|
|
|
|
|
|
||||||
|
Water
|
$
|
295,258
|
|
$
|
306,332
|
|
$
|
(11,074
|
)
|
-3.6
|
%
|
|||
|
Electric
|
34,350
|
|
33,969
|
|
381
|
|
1.1
|
%
|
||||||
|
Contracted services
|
107,208
|
|
100,302
|
|
6,906
|
|
6.9
|
%
|
||||||
|
Total operating revenues
|
436,816
|
|
440,603
|
|
(3,787
|
)
|
-0.9
|
%
|
||||||
|
OPERATING EXPENSES
|
|
|
|
|
|
|
|
|
||||||
|
Water purchased
|
68,904
|
|
68,302
|
|
602
|
|
0.9
|
%
|
||||||
|
Power purchased for pumping
|
8,971
|
|
8,518
|
|
453
|
|
5.3
|
%
|
||||||
|
Groundwater production assessment
|
19,440
|
|
18,638
|
|
802
|
|
4.3
|
%
|
||||||
|
Power purchased for resale
|
11,590
|
|
10,720
|
|
870
|
|
8.1
|
%
|
||||||
|
Supply cost balancing accounts
|
(15,649
|
)
|
(17,939
|
)
|
2,290
|
|
-12.8
|
%
|
||||||
|
Other operation
|
31,650
|
|
29,994
|
|
1,656
|
|
5.5
|
%
|
||||||
|
Administrative and general
|
82,595
|
|
81,643
|
|
952
|
|
1.2
|
%
|
||||||
|
Depreciation and amortization
|
40,425
|
|
39,031
|
|
1,394
|
|
3.6
|
%
|
||||||
|
Maintenance
|
15,682
|
|
15,176
|
|
506
|
|
3.3
|
%
|
||||||
|
Property and other taxes
|
18,404
|
|
17,905
|
|
499
|
|
2.8
|
%
|
||||||
|
ASUS construction
|
53,906
|
|
49,838
|
|
4,068
|
|
8.2
|
%
|
||||||
|
Gain on sale of assets
|
(85
|
)
|
(8,318
|
)
|
8,233
|
|
-99.0
|
%
|
||||||
|
Total operating expenses
|
335,833
|
|
313,508
|
|
22,325
|
|
7.1
|
%
|
||||||
|
OPERATING INCOME
|
100,983
|
|
127,095
|
|
(26,112
|
)
|
-20.5
|
%
|
||||||
|
OTHER INCOME AND EXPENSES
|
|
|
|
|
|
|
|
|
||||||
|
Interest expense
|
(23,433
|
)
|
(22,582
|
)
|
(851
|
)
|
3.8
|
%
|
||||||
|
Interest income
|
3,578
|
|
1,790
|
|
1,788
|
|
99.9
|
%
|
||||||
|
Other, net
|
760
|
|
2,038
|
|
(1,278
|
)
|
-62.7
|
%
|
||||||
|
|
(19,095
|
)
|
(18,754
|
)
|
(341
|
)
|
1.8
|
%
|
||||||
|
INCOME FROM OPERATIONS BEFORE INCOME TAX EXPENSE
|
81,888
|
|
108,341
|
|
(26,453
|
)
|
-24.4
|
%
|
||||||
|
Income tax expense
|
18,017
|
|
38,974
|
|
(20,957
|
)
|
-53.8
|
%
|
||||||
|
NET INCOME
|
$
|
63,871
|
|
$
|
69,367
|
|
$
|
(5,496
|
)
|
-7.9
|
%
|
|||
|
Basic earnings per Common Share
|
$
|
1.73
|
|
$
|
1.88
|
|
$
|
(0.15
|
)
|
-8.0
|
%
|
|||
|
Fully diluted earnings per Common Share
|
$
|
1.72
|
|
$
|
1.88
|
|
$
|
(0.16
|
)
|
-8.5
|
%
|
|||
In accordance with new accounting guidance, effective January 1, 2018, Registrant changed the financial statement presentation for the costs of its defined benefit pension plans and other retirement benefits. The components of net periodic benefits cost, other than the service cost component, have been included in the line item “Other, net” in Registrant's income statements. Amounts for 2017 have been reclassified on the income statements to conform to the current-period presentation.
30
Operating Revenues
General
Registrant relies upon approvals by the CPUC of rate increases to recover operating expenses and to provide for a return on invested and borrowed capital used to fund utility plant for GSWC. Registrant relies on economic price adjustments and equitable adjustments by the U.S. government in order to recover operating expenses and provide a profit margin for ASUS. If adequate rate relief or adjustments are not granted in a timely manner, current operating revenues and earnings can be negatively impacted. ASUS’s earnings are also impacted by the level of additional construction projects at the Military Utility Privatization Subsidiaries, which may or may not continue at current levels in future periods.
Water
For the year ended
December 31, 2018
, revenues from water operations decreased by
$11.1 million
to
$295.3 million
, compared to
$306.3 million
for the year ended
December 31, 2017
. This decrease was primarily due to: (i) downward adjustments to water revenue which were largely offset by lower income tax expense, thus no material impact to earnings, as a result of the Tax Act, (ii) a lower authorized rate of return approved by the CPUC in the March 2018 final decision on the water cost of capital application, and (iii) decreases related to the expiration of various surcharges that were in place to recover previously incurred costs. These decreases in surcharge revenues were offset by a corresponding decrease in operating expenses (primarily administrative and general), resulting in no impact to earnings. These decreases in water revenue were partially offset by CPUC-approved third-year rate increases effective January 1, 2018. There were also CPUC-approved rate increases to cover increases in supply costs experienced in most ratemaking areas, which were largely offset by a corresponding increase in supply costs, resulting in an immaterial impact to earnings.
Billed water consumption for the year ended
December 31, 2018
increased approximately 3% as compared to
2017
. In general, changes in consumption do not have a significant impact on recorded revenues due to the CPUC-approved WRAM accounts in place in the majority of GSWC's rate-making areas. GSWC records the difference between what it bills its water customers and that which is authorized by the CPUC in the WRAM accounts as regulatory assets or liabilities.
Electric
For the year ended
December 31, 2018
, revenues from electric operations were
$34.4 million
as compared to
$34.0 million
for the year ended
December 31, 2017
. This slight increase was primarily due to rate increases generated from advice letter projects approved by the CPUC in 2017 and 2018. Due to the delay in the electric general rate case, 2018 billed revenues have been based on 2017 adopted rates, pending a final CPUC decision which is expected later in 2019.
Billed electric usage for the year ended
December 31, 2018
increased slightly as compared to the same period in
2017
. Due to the CPUC-approved base revenue requirement adjustment mechanism ("BRRAM"), which adjusts base revenues to adopted levels authorized by the CPUC, changes in usage do not have a significant impact on earnings.
Contracted Services
Revenues from contracted services are composed of construction revenues (including renewal and replacements) and management fees for operating and maintaining the water and/or wastewater systems at various military bases. For the year ended
December 31, 2018
, revenues from contracted services were
$107.2 million
as compared to
$100.3 million
for
2017
. Included in revenues for 2017 was approximately $1.0 million in retroactive management fees related to periods prior to 2017. The increase in revenues was due to the commencement of operations at Eglin AFB in June 2017 and at Fort Riley in July 2018.
ASUS's subsidiaries continue to enter into U.S. government-awarded contract modifications and agreements with third-party prime contractors for new construction projects at the military bases served. During 2018, ASUS was awarded approximately $24 million in new construction projects, the majority of which are expected to be completed during 2019. Earnings and cash flows from modifications to the original 50-year contracts with the U.S. government and agreements with third-party prime contractors for additional construction projects may or may not continue in future periods.
31
Operating Expenses:
Supply Costs
Supply costs for the water segment consist of purchased water, purchased power for pumping, groundwater production assessments and changes in the water supply cost balancing accounts. Supply costs for the electric segment consist of purchased power for resale, the cost of natural gas used by BVES’s generating unit, the cost of renewable energy credits and changes in the electric supply cost balancing account
.
Water and electric gross margins are computed by subtracting total supply costs from total revenues. Registrant uses these gross margins and related percentages as an important measure in evaluating its operating results. Registrant believes these measures are useful internal benchmarks in evaluating the utility business performance within its water and electric segments. Registrant reviews these measurements regularly and compares them to historical periods and to its operating budget. However, these measures, which are not presented in accordance with GAAP, may not be comparable to similarly titled measures used by other enterprises and should not be considered as an alternative to operating income, which is determined in accordance with GAAP.
Total supply costs comprise the largest segment of total operating expenses. Supply costs accounted for
27.8%
and
28.1%
of total operating expenses for the years ended
December 31, 2018
and
2017
, respectively. The table below provides the amounts (in thousands) of increases (decreases) and percent changes in water and electric revenues, supply costs and gross margins during the years ended
December 31, 2018
and
2017
. As previously discussed, water and electric revenues for the year ended December 31, 2018 were $12.5 million and $1.2 million lower, respectively, as compared to 2017 due to the effects of the Tax Act, but had no significant impact to earnings due to a corresponding decrease in water and electric income tax expense. Furthermore, there was a decrease in surcharges of $3.7 million recorded in water revenues to recover previously incurred costs, which also did not impact water earnings. Surcharges to recover previously incurred costs are recorded to revenues when billed to customers and are offset by a corresponding amount in operating expenses (primarily administrative and general), resulting in no impact to earnings.
|
Year Ended
|
Year Ended
|
$
|
%
|
|||||||||||
|
12/31/2018
|
12/31/2017
|
CHANGE
|
CHANGE
|
|||||||||||
|
WATER OPERATING REVENUES
(1)
|
$
|
295,258
|
|
$
|
306,332
|
|
$
|
(11,074
|
)
|
-3.6
|
%
|
|||
|
WATER SUPPLY COSTS:
|
|
|
||||||||||||
|
Water purchased
(1)
|
68,904
|
|
68,302
|
|
602
|
|
0.9
|
%
|
||||||
|
Power purchased for pumping
(1)
|
8,971
|
|
8,518
|
|
453
|
|
5.3
|
%
|
||||||
|
Groundwater production assessment
(1)
|
19,440
|
|
18,638
|
|
802
|
|
4.3
|
%
|
||||||
|
Water supply cost balancing accounts
(1)
|
(17,116
|
)
|
(20,289
|
)
|
3,173
|
|
-15.6
|
%
|
||||||
|
TOTAL WATER SUPPLY COSTS
|
$
|
80,199
|
|
$
|
75,169
|
|
$
|
5,030
|
|
6.7
|
%
|
|||
|
WATER GROSS MARGIN
(2)
|
$
|
215,059
|
|
$
|
231,163
|
|
$
|
(16,104
|
)
|
-7.0
|
%
|
|||
|
|
|
|||||||||||||
|
ELECTRIC OPERATING REVENUES
(1)
|
$
|
34,350
|
|
$
|
33,969
|
|
$
|
381
|
|
1.1
|
%
|
|||
|
ELECTRIC SUPPLY COSTS:
|
|
|
||||||||||||
|
Power purchased for resale
(1)
|
11,590
|
|
10,720
|
|
870
|
|
8.1
|
%
|
||||||
|
Electric supply cost balancing accounts
(1)
|
1,467
|
|
2,350
|
|
(883
|
)
|
-37.6
|
%
|
||||||
|
TOTAL ELECTRIC SUPPLY COSTS
|
$
|
13,057
|
|
$
|
13,070
|
|
$
|
(13
|
)
|
-0.1
|
%
|
|||
|
ELECTRIC GROSS MARGIN
(2)
|
$
|
21,293
|
|
$
|
20,899
|
|
$
|
394
|
|
1.9
|
%
|
|||
(1)
As reported on AWR’s Consolidated Statements of Income, except for supply-cost-balancing accounts. The sums of water and electric supply-cost balancing accounts in the table above are shown on AWR’s Consolidated Statements of Income and totaled
$(15.6) million
and
$(17.9) million
for the years ended
December 31, 2018
and
2017
, respectively. Revenues include surcharges that have no net earnings impact because they increase both revenues and operating expenses by corresponding amounts.
(2)
Water and electric gross margins do not include depreciation and amortization, maintenance, administrative and general, property and other taxes, and other operation expenses.
Two of the principal factors affecting water supply costs are the amount of water produced and the source of the water. Generally, the variable cost of producing water from wells is less than the cost of water purchased from wholesale suppliers. Under the CPUC-approved Modified Cost Balancing Account ("MCBA"), GSWC tracks adopted and actual expense levels for
32
purchased water, power purchased for pumping and pump taxes. GSWC records the variances (which include the effects of changes in both rate and volume) between adopted and actual purchased water, purchased power and pump tax expenses. GSWC recovers from or refunds to customers the amount of such variances. GSWC tracks these variances individually for each water ratemaking area.
The overall actual percentages for purchased water for the years ended
December 31, 2018
and
2017
were 41% and 42%, respectively, as compared to the adopted percentages of 28% for both 2018 and 2017. The higher actual percentages of purchased water as compared to adopted percentages resulted primarily from several wells being out of service. Purchased water costs for the year ended
December 31, 2018
increased to
$68.9 million
as compared to
$68.3 million
for the same period in
2017
primarily due to an increase in customer usage, as well as an increase in wholesale water costs as compared to the year ended December 31,
2017
.
For the year ended
December 31, 2018
, the cost of power purchased for pumping increased to
$9.0 million
as compared to
$8.5 million
for the same period in
2017
primarily due to an increase in customer usage as well increases in electric rates.
Groundwater production assessments were
$19.4 million
in
2018
as compared to
$18.6 million
in
2017
due to an increase in pump tax rates during
2018
as compared to
2017
.
The under-collection in the water supply cost balancing account decreased
$3.2 million
during the year ended
December 31, 2018
as compared to the same period in
2017
due to the CPUC-approved rate increases to cover increases in supply costs experienced in most ratemaking areas. This increase to revenues was largely offset by a corresponding increase in supply costs, which reduces the under-collection in the water supply cost balancing account.
For the year ended
December 31, 2018
, the cost of power purchased for resale to BVES's customers was
$11.6 million
as compared to
$10.7 million
for the same period in
2017
. The average price per megawatt-hour ("MWh"), including fixed costs, increased to $79.90 per MWh in
2018
from $73.03 per MWh for the year ended December 31,
2017
.
Other Operation
The primary components of other operation expenses for GSWC include payroll, materials and supplies, chemicals and water-treatment costs, and outside service costs of operating the regulated water and electric systems, including the costs associated with transmission and distribution, pumping, water quality, meter reading, billing, and operations of district offices. Registrant’s contracted services operations incur many of the same types of expenses. For the years ended
December 31, 2018
and
2017
, other operation expenses by business segment consisted of the following amounts (in thousands):
|
Year
Ended |
Year
Ended |
$
|
%
|
|||||||||||
|
12/31/2018
|
12/31/2017
|
CHANGE
|
CHANGE
|
|||||||||||
|
Water Services
|
$
|
22,525
|
|
$
|
22,189
|
|
$
|
336
|
|
1.5
|
%
|
|||
|
Electric Services
|
2,809
|
|
2,688
|
|
121
|
|
4.5
|
%
|
||||||
|
Contracted Services
|
6,316
|
|
5,117
|
|
1,199
|
|
23.4
|
%
|
||||||
|
Total other operation
|
$
|
31,650
|
|
$
|
29,994
|
|
$
|
1,656
|
|
5.5
|
%
|
|||
In 2017, the CPUC approved the recovery of $1.2 million in incremental drought-related costs, which was recorded during the first quarter of 2017 as a regulatory asset with a corresponding decrease mostly to other operation-related expenses at the water segment. There was no similar reduction recorded in 2018. Excluding the impact of this recovery, as well as changes in billed surcharges which have no impact to earnings, other operation expenses at the water segment decreased overall by approximately $459,000 due, in large part, to lower conservation costs incurred compared to 2017.
For the year ended
December 31, 2018
, total other operation expenses at the electric segment increased mainly due to higher labor-related costs.
For the year ended
December 31, 2018
, total other operation expenses for the contracted services segment increased mainly due to the commencement of operations at Fort Riley on July 1, 2018, including transition costs.
33
Administrative and General
Administrative and general expenses include payroll related to administrative and general functions, the related employee benefits, insurance expenses, outside legal and consulting fees, regulatory utility commission expenses, expenses associated with being a public company and general corporate expenses charged to expense accounts. For the years ended
December 31, 2018
and
2017
, administrative and general expenses by business segment, including AWR (parent), consisted of the following amounts (in thousands):
|
Year
Ended |
Year
Ended |
$
|
%
|
|||||||||||
|
12/31/2018
|
12/31/2017
|
CHANGE
|
CHANGE
|
|||||||||||
|
Water Services
|
$
|
54,212
|
|
$
|
55,471
|
|
$
|
(1,259
|
)
|
-2.3
|
%
|
|||
|
Electric Services
|
7,944
|
|
6,937
|
|
1,007
|
|
14.5
|
%
|
||||||
|
Contracted Services
|
20,446
|
|
19,139
|
|
1,307
|
|
6.8
|
%
|
||||||
|
AWR (parent)
|
(7
|
)
|
96
|
|
(103
|
)
|
-107.3
|
%
|
||||||
|
Total administrative and general
|
$
|
82,595
|
|
$
|
81,643
|
|
$
|
952
|
|
1.2
|
%
|
|||
For the year ended
December 31, 2018
, there was a decrease of $2.9 million in surcharges billed to customers to recover previously incurred administrative and general
costs approved by the CPUC. This decrease was offset by a corresponding decrease in administrative and general expense to reflect the recovery of these costs, resulting in no impact to earnings. Excluding the decrease in billed surcharges, administrative and general expenses at the water segment increased by $1.7 million due primarily to the receipt of $1.8 million in December 2017 for reimbursement of litigation costs pursuant to a settlement agreement, which were reflected as a reduction to legal expenses in 2017. There was no similar reduction recorded in 2018. Overall, other administrative and general expenses remained relatively flat compared to 2017.
For the year ended
December 31, 2018
, administrative and general expenses for the electric segment increased by
$1.0 million
as compared to
2017
due to an increase in regulatory, legal and outside services costs.
For the year ended
December 31, 2018
, administrative and general expenses for contracted services increased by
$1.3 million
due primarily to the commencement of operations at Eglin AFB and at Fort Riley in 2017 and 2018, respectively, as well as an increase in labor-related costs.
Depreciation and Amortization
For the years ended
December 31, 2018
and
2017
, depreciation and amortization expense by segment consisted of the following amounts (in thousands):
|
Year
Ended |
Year
Ended |
$
|
%
|
|||||||||||
|
12/31/2018
|
12/31/2017
|
CHANGE
|
CHANGE
|
|||||||||||
|
Water Services
|
$
|
36,137
|
|
$
|
35,706
|
|
$
|
431
|
|
1.2
|
%
|
|||
|
Electric Services
|
2,258
|
|
2,146
|
|
112
|
|
5.2
|
%
|
||||||
|
Contracted Services
|
2,030
|
|
1,179
|
|
851
|
|
72.2
|
%
|
||||||
|
Total depreciation and amortization
|
$
|
40,425
|
|
$
|
39,031
|
|
$
|
1,394
|
|
3.6
|
%
|
|||
For the year ended
December 31, 2018
, depreciation and amortization expense increased due to fixed asset additions for all business segments during 2018. The increase in fixed assets for contracted services was due to the purchase of transportation and other equipment.
34
Maintenance
For the years ended
December 31, 2018
and
2017
, maintenance expense by segment consisted of the following amounts (in thousands):
|
Year
Ended |
Year
Ended |
$
|
%
|
|||||||||||
|
12/31/2018
|
12/31/2017
|
CHANGE
|
CHANGE
|
|||||||||||
|
Water Services
|
$
|
12,102
|
|
$
|
12,101
|
|
$
|
1
|
|
—
|
%
|
|||
|
Electric Services
|
1,002
|
|
869
|
|
133
|
|
15.3
|
%
|
||||||
|
Contracted Services
|
2,578
|
|
2,206
|
|
372
|
|
16.9
|
%
|
||||||
|
Total maintenance
|
$
|
15,682
|
|
$
|
15,176
|
|
$
|
506
|
|
3.3
|
%
|
|||
Maintenance expense for the electric segment increased due to higher fire prevention and tree-trimming maintenance work performed in 2018 as compared to 2017.
Maintenance expense for contracted services increased due primarily to the commencement of operations at Eglin AFB and Fort Riley in 2017 and 2018, respectively.
Property and Other Taxes
For the years ended
December 31, 2018
and
2017
, property and other taxes by segment, consisted of the following amounts (in thousands):
|
Year
Ended |
Year
Ended |
$
|
%
|
|||||||||||
|
12/31/2018
|
12/31/2017
|
CHANGE
|
CHANGE
|
|||||||||||
|
Water Services
|
$
|
15,750
|
|
$
|
15,336
|
|
$
|
414
|
|
2.7
|
%
|
|||
|
Electric Services
|
1,059
|
|
1,066
|
|
(7
|
)
|
-0.7
|
%
|
||||||
|
Contracted Services
|
1,595
|
|
1,503
|
|
92
|
|
6.1
|
%
|
||||||
|
Total property and other taxes
|
$
|
18,404
|
|
$
|
17,905
|
|
$
|
499
|
|
2.8
|
%
|
|||
Property and other taxes increased overall by
$499,000
during
2018
as compared to
2017
primarily due to capital additions and the associated higher assessed property values.
ASUS Construction
For the year ended
December 31, 2018
, construction expenses for contracted services were
$53.9 million
, increasing by
$4.1 million
compared to the same period in
2017
due to the commencement of operations at Eglin AFB and Fort Riley in 2017 and 2018, respectively.
Gain on Sale of Assets
In June 2017, GSWC completed the sale of its Ojai water system to Casitas Municipal Water District for $34.3 million, resulting in a pretax gain of $8.3 million on the sale of the assets.
Interest Expense
For the years ended
December 31, 2018
and
2017
, interest expense by segment, including AWR (parent), consisted of the following amounts (in thousands):
|
Year
Ended |
Year
Ended |
$
|
%
|
|||||||||||
|
12/31/2018
|
12/31/2017
|
CHANGE
|
CHANGE
|
|||||||||||
|
Water Services
|
$
|
21,212
|
|
$
|
20,670
|
|
$
|
542
|
|
2.6
|
%
|
|||
|
Electric Services
|
1,409
|
|
1,385
|
|
24
|
|
1.7
|
%
|
||||||
|
Contracted Services
|
362
|
|
269
|
|
93
|
|
34.6
|
%
|
||||||
|
AWR (parent)
|
450
|
|
258
|
|
192
|
|
74.4
|
%
|
||||||
|
Total interest expense
|
$
|
23,433
|
|
$
|
22,582
|
|
$
|
851
|
|
3.8
|
%
|
|||
Overall, interest expense for the year ended
December 31, 2018
increased by
$851,000
as compared to the same period in
2017
due largely to higher average borrowings as well as higher interest rates on the revolving credit facility as compared to
2017
. The borrowings were used to fund operations and a portion of capital expenditures. There was also an increase in interest expense related to an increase in regulatory liabilities as compared to the same period in 2017.
35
Interest Income
For the years ended
December 31, 2018
and
2017
, interest income by business segment, including AWR (parent), consisted of the following amounts (in thousands):
|
Year
Ended |
Year
Ended |
$
|
%
|
|||||||||||
|
12/31/2018
|
12/31/2017
|
CHANGE
|
CHANGE
|
|||||||||||
|
Water Services
|
$
|
2,809
|
|
$
|
1,761
|
|
$
|
1,048
|
|
59.5
|
%
|
|||
|
Electric Services
|
81
|
|
5
|
|
76
|
|
*
|
|
||||||
|
Contracted Services
|
689
|
|
14
|
|
675
|
|
*
|
|
||||||
|
AWR (parent)
|
(1
|
)
|
10
|
|
(11
|
)
|
*
|
|
||||||
|
Total interest income
|
$
|
3,578
|
|
$
|
1,790
|
|
$
|
1,788
|
|
99.9
|
%
|
|||
* not meaningful
Interest income increased by
$1.8 million
for the year ended
December 31, 2018
as compared to the same period in
2017
due primarily to interest income related to a federal tax refund recorded in 2018. The increase in interest income at the contracted services segment was due to Registrant's adoption of ASC Topic 606 (
Revenues from Contracts with Customers)
on January 1, 2018 using the modified retrospective approach. As a result of this adoption, certain funds received by the contracted services segment from the U.S. government during 2018 have been recorded as interest income. Prior to the adoption of ASC Topic 606, these funds were recorded as revenues.
Other, net
For the year ended
December 31, 2018
, other income decreased by
$1.3 million
primarily due to losses recorded on investments held for a retirement benefit plan resulting from unfavorable market conditions in 2018, as compared to gains recorded in 2017. This was partially offset by a decrease in the non-service cost components of net periodic benefit costs related to Registrant's defined benefit pension plans and other retirement benefits. However, as a result of GSWC's pension balancing account authorized by the CPUC, changes in net periodic benefit costs are mostly offset by corresponding changes in revenues, having no material impact to earnings.
Income Tax Expense
For the years ended
December 31, 2018
and
2017
, income tax expense by segment, including AWR (parent), consisted of the following amounts (in thousands):
|
Year
Ended |
Year
Ended |
$
|
%
|
|||||||||||
|
12/31/2018
|
12/31/2017
|
CHANGE
|
CHANGE
|
|||||||||||
|
Water Services
|
$
|
12,391
|
|
$
|
32,212
|
|
$
|
(19,821
|
)
|
-61.5
|
%
|
|||
|
Electric Services
|
1,212
|
|
1,847
|
|
(635
|
)
|
-34.4
|
%
|
||||||
|
Contracted Services
|
4,939
|
|
7,136
|
|
(2,197
|
)
|
-30.8
|
%
|
||||||
|
AWR (parent)
|
(525
|
)
|
(2,221
|
)
|
1,696
|
|
-76.4
|
%
|
||||||
|
Total income tax expense
|
$
|
18,017
|
|
$
|
38,974
|
|
$
|
(20,957
|
)
|
-53.8
|
%
|
|||
Consolidated income tax expense for the year ended December 31, 2018 decreased by
$21.0 million
primarily due to a lower effective income tax rate ("ETR") from the Tax Act. AWR's consolidated ETR was
22.0%
and
36.0%
for the years ended December 31, 2018 and 2017, respectively. The ETR for GSWC was
22.1%
for 2018 as compared to
38.8%
for 2017. For all segments, the lower income tax expense resulting from the Tax Act was due primarily to the reduction in the federal corporate income tax rate from 35% to 21%, which was largely offset by corresponding decreases in revenues, resulting in an immaterial impact to 2018 net earnings.
36
Consolidated Results of Operations — Years Ended December 31, 2017 and 2016 (amounts in thousands, except per share amounts)
:
|
Year Ended
|
Year Ended
|
$
|
%
|
|||||||||||
|
12/31/2017
|
12/31/2016
|
CHANGE
|
CHANGE
|
|||||||||||
|
OPERATING REVENUES
|
|
|
|
|
|
|
|
|
||||||
|
Water
|
$
|
306,332
|
|
$
|
302,931
|
|
$
|
3,401
|
|
1.1
|
%
|
|||
|
Electric
|
33,969
|
|
35,771
|
|
(1,802
|
)
|
-5.0
|
%
|
||||||
|
Contracted services
|
100,302
|
|
97,385
|
|
2,917
|
|
3.0
|
%
|
||||||
|
Total operating revenues
|
440,603
|
|
436,087
|
|
4,516
|
|
1.0
|
%
|
||||||
|
OPERATING EXPENSES
|
|
|
|
|
|
|
|
|
||||||
|
Water purchased
|
68,302
|
|
64,442
|
|
3,860
|
|
6.0
|
%
|
||||||
|
Power purchased for pumping
|
8,518
|
|
8,663
|
|
(145
|
)
|
-1.7
|
%
|
||||||
|
Groundwater production assessment
|
18,638
|
|
14,993
|
|
3,645
|
|
24.3
|
%
|
||||||
|
Power purchased for resale
|
10,720
|
|
10,387
|
|
333
|
|
3.2
|
%
|
||||||
|
Supply cost balancing accounts
|
(17,939
|
)
|
(12,206
|
)
|
(5,733
|
)
|
47.0
|
%
|
||||||
|
Other operation
|
29,994
|
|
28,257
|
|
1,737
|
|
6.1
|
%
|
||||||
|
Administrative and general
|
81,643
|
|
81,518
|
|
125
|
|
0.2
|
%
|
||||||
|
Depreciation and amortization
|
39,031
|
|
38,850
|
|
181
|
|
0.5
|
%
|
||||||
|
Maintenance
|
15,176
|
|
16,470
|
|
(1,294
|
)
|
-7.9
|
%
|
||||||
|
Property and other taxes
|
17,905
|
|
16,801
|
|
1,104
|
|
6.6
|
%
|
||||||
|
ASUS construction
|
49,838
|
|
53,720
|
|
(3,882
|
)
|
-7.2
|
%
|
||||||
|
Gain on sale of assets
|
(8,318
|
)
|
—
|
|
(8,318
|
)
|
*
|
|
||||||
|
Total operating expenses
|
313,508
|
|
321,895
|
|
(8,387
|
)
|
-2.6
|
%
|
||||||
|
OPERATING INCOME
|
127,095
|
|
114,192
|
|
12,903
|
|
11.3
|
%
|
||||||
|
OTHER INCOME AND EXPENSES
|
|
|
|
|
|
|
|
|
||||||
|
Interest expense
|
(22,582
|
)
|
(21,992
|
)
|
(590
|
)
|
2.7
|
%
|
||||||
|
Interest income
|
1,790
|
|
757
|
|
1,033
|
|
136.5
|
%
|
||||||
|
Other, net
|
2,038
|
|
1,521
|
|
517
|
|
34.0
|
%
|
||||||
|
|
(18,754
|
)
|
(19,714
|
)
|
960
|
|
-4.9
|
%
|
||||||
|
INCOME FROM OPERATIONS BEFORE INCOME TAX EXPENSE
|
108,341
|
|
94,478
|
|
13,863
|
|
14.7
|
%
|
||||||
|
Income tax expense
|
38,974
|
|
34,735
|
|
4,239
|
|
12.2
|
%
|
||||||
|
NET INCOME
|
$
|
69,367
|
|
$
|
59,743
|
|
$
|
9,624
|
|
16.1
|
%
|
|||
|
Basic earnings per Common Share
|
$
|
1.88
|
|
$
|
1.63
|
|
$
|
0.25
|
|
15.3
|
%
|
|||
|
Fully diluted earnings per Common Share
|
$
|
1.88
|
|
$
|
1.62
|
|
$
|
0.26
|
|
16.0
|
%
|
|||
* not applicable
In accordance with new accounting guidance, effective January 1, 2018, Registrant changed the financial statement presentation for the costs of its defined benefit pension plans and other retirement benefits. The components of net periodic benefits cost, other than the service cost component, have been included in the line item “Other, net” in Registrant's income statements. Previously reported amounts for 2017 and 2016 have been reclassified on the income statements to conform to the current-period presentation.
37
Summary Results by Segment
The table below sets forth diluted earnings per share by business segment for AWR’s operations:
|
|
Diluted Earnings per Share
|
||||||||||
|
|
Year Ended
|
|
|||||||||
|
|
12/31/2017
|
12/31/2016
|
CHANGE
|
||||||||
|
Water, excluding one-time gain on sale of Ojai water system
|
$
|
1.22
|
|
$
|
1.17
|
|
$
|
0.05
|
|
||
|
Electric
|
0.11
|
|
0.10
|
|
0.01
|
|
|||||
|
Contracted services
|
0.37
|
|
0.33
|
|
0.04
|
|
|||||
|
AWR (parent)
|
0.05
|
|
0.02
|
|
0.03
|
|
|||||
|
Consolidated diluted earnings per share, adjusted
|
1.75
|
|
1.62
|
|
0.13
|
|
|||||
|
Gain on sale of Ojai water system
|
0.13
|
|
—
|
|
0.13
|
|
|||||
|
Totals from operations, as reported
|
$
|
1.88
|
|
$
|
1.62
|
|
$
|
0.26
|
|
||
Water Segment:
For the year ended December 31, 2017, fully diluted earnings per share for the water segment increased by $0.18 per share to $1.35 per share, as compared to $1.17 per share for 2016 due, in large part, to the one-time $0.13 per share pretax gain on the sale of Ojai assets in June 2017. In addition, in February 2017, the CPUC approved recovery of incremental costs related to California's drought state of emergency, which were previously expensed. As a result of this approval, during the first quarter of 2017, GSWC recorded a regulatory asset and a corresponding increase to pretax earnings of $1.5 million, or $0.02 per share, of which $1.2 million was reflected as a reduction to other operation expenses and approximately $260,000 was reflected as additional revenue. Furthermore, affecting the results and comparability between the two periods were higher gains recorded in 2017 on Registrant's investments held to fund a retirement benefit plan as compared to 2016. This non-core business item increased the water segment’s earnings on a relative basis by approximately $0.02 per share.
Excluding the impact of the items discussed above and an increase in billed surcharges which have no impact to earnings, diluted earnings from the water segment for 2017 increased by $0.01 per share as compared to 2016 due to the following items, which impacted the comparability between the two periods:
|
•
|
A decrease in operating expenses (excluding supply costs) increased earnings by approximately $0.05 per share due, in large part, to a reduction in legal costs of $1.8 million, or $0.03 per share, recorded in December 2017 for amounts received from the City of Claremont pursuant to a settlement agreement. Excluding this item, overall operating expenses decreased by $0.02 per share due mostly to lower maintenance costs, and incurring only a partial year of Ojai-related operating expenses as a result of the sale. These decreases were partially offset by higher medical insurance costs, conservation costs, general rate-case-related expenses and property and other taxes, as well as an $800,000 reduction in operating expenses recorded in the fourth quarter of 2016 as a result of the CPUC's water general rate case decision, which granted recovery of previously incurred costs tracked in memorandum accounts.
|
|
•
|
Excluding gains and losses on investments, there was an increase in interest and other income (net of interest expense), which increased earnings by approximately $0.01 per share, due primarily to (i) higher interest income on GSWC's regulatory assets resulting mostly from an increase in the 90-day commercial paper rate, and (ii) amounts collected from developers on certain outstanding balances owed to GSWC.
|
The increase in diluted earnings from the water segment discussed above were partially offset by the following:
|
•
|
An overall decrease in the water gross margin of $2.3 million, or $0.03 per share, largely due to the cessation of Ojai operations in June 2017. This was partially offset by revenues generated from CPUC-approved second-year rate increases effective January 1, 2017.
|
|
•
|
An overall increase in the water segment's effective income tax rate ("ETR"), which negatively impacted water earnings by approximately $0.02 per share. The increase in the ETR was due, in large part, to the remeasurement of certain non-rate-regulated deferred tax assets (primarily compensation- and benefit-related items) in connection with the Tax Act, which negatively impacted water earnings by approximately $0.03 per share. This was partially offset by changes in flow-through and permanent items at the water segment.
|
38
Electric Segment:
For the year ended December 31, 2017, diluted earnings from the electric segment increased by $0.01 per share as compared to the same period in 2016. Operating expenses (other than supply costs) decreased by $1.2 million primarily due to additional costs incurred in 2016 in response to power outages caused by severe winter storms experienced in January 2016, lower regulatory costs, and lower costs associated with energy efficiency and solar power programs approved by the CPUC. There was also a decrease in the effective income tax rate for the electric segment as compared to the same period in 2016 resulting primarily from changes in flow-through items. These increases to earnings were partially offset by a lower electric gross margin, which was due mostly to a downward adjustment in the electric revenue requirement to reflect updated allocations from the general office as a result of the decision in the water general rate case.
Contracted Services Segment:
For the year ended December 31, 2017, diluted earnings from contracted services were $0.37 per share, compared to $0.33 per share for the same period in 2016. There was an increase in management fee revenues from the successful resolution of various price adjustments and asset transfers received during 2016 and 2017. This includes approximately $1.0 million, or $0.02 per share, of retroactive management fees recorded in 2017 which related to periods prior to 2017, as compared to $421,000, or $0.01 per share, of retroactive management fees recorded in 2016 which related to periods prior to 2016. There was also an increase in management fees and construction revenues generated from the operations at Eglin Air Force Base ("Eglin AFB"), which began in June 2017. These increases to earnings were partially offset by higher operating costs due to transition activities and joint inventory study at Eglin AFB, as well as increases in labor and outside services costs related to business development and compliance.
AWR (parent):
For the year ended December 31, 2017, diluted earnings from AWR (parent) increased $0.03 per share compared to 2016 due to the remeasurement of deferred tax balances recorded at the parent level. The one-time remeasurement was based on the Tax Act's lower federal corporate tax rate of 21% as compared to 35%, which increased earnings at AWR (parent) by approximately $0.03 per share during 2017.
The following discussion and analysis for the years ended December 31, 2017 and 2016 provides information on AWR’s consolidated operations and assets and, where necessary, includes specific references to AWR’s individual segments and subsidiaries: GSWC and ASUS and its subsidiaries.
Operating Revenues
Water
For the year ended December 31, 2017, revenues from water operations increased by $3.4 million to $306.3 million, compared to $302.9 million for the year ended December 31, 2016. The increase was primarily due to second-year rate increases effective January 1, 2017, and rate increases to specifically cover increases in supply costs experienced in certain rate-making areas. The rate changes related to supply costs are largely offset by a corresponding increase in supply costs, resulting in an insignificant change to the water gross margin. There were also new surcharges implemented during 2017 to recover previously incurred costs, which were offset by a corresponding increase in operating expenses (primarily administrative and general) totaling $3.6 million, resulting in no impact to earnings. These increases in revenues were partially offset by lower revenues due to the cessation of Ojai operations in June 2017.
Billed water consumption for the year ended December 31, 2017 increased approximately 4% as compared to 2016. In general, changes in consumption do not have a significant impact on recorded revenues due to the CPUC-approved WRAM accounts in place in the majority of GSWC's rate-making areas. GSWC records the difference between what it bills its water customers and that which is authorized by the CPUC in the WRAM accounts as regulatory assets or liabilities.
Electric
In 2016, the CPUC granted BVES's request to defer the filing of its next electric general rate case to 2017, setting new rates for the years 2018 through 2021. As a result, adopted base revenues for 2017 were based on 2016 adopted base revenues, adjusted for the change in the general office allocation approved by the CPUC in the water general rate case. For the year ended December 31, 2017, revenues from electric operations were $34.0 million as compared to $35.8 million for the year ended December 31, 2016. This decrease was primarily due to the reduction in the adopted revenue requirement for electric to reflect a decrease in the general office allocation. In May 2017, BVES filed its general rate case application with the CPUC. A final decision is expected in 2019.
39
Billed electric usage for the year ended December 31, 2017 decreased slightly as compared to the same period in 2016. Due to the CPUC-approved base revenue requirement adjustment mechanism ("BRRAM"), which adjusts base revenues to adopted levels authorized by the CPUC, changes in usage do not have a significant impact on earnings.
Contracted Services
Revenues from contracted services are composed of construction revenues (including renewal and replacements) and management fees for operating and maintaining the water and/or wastewater systems at various military bases. For the year ended December 31, 2017, revenues from contracted services were $100.3 million as compared to $97.4 million for 2016. There was an increase in ongoing operations and maintenance management fees due to the successful resolution of various price adjustments and asset transfers during 2016 and 2017, as well as the commencement of operations at Eglin AFB in June 2017. Included in management fees for 2017 was approximately $1.0 million in retroactive revenues related to periods prior to 2017, as compared to $421,000 of retroactive management fees recorded in 2016 which related to periods prior to 2016. These increases were partially offset by a decrease in construction activity in 2017 as compared to 2016.
During 2017, ASUS was awarded approximately $20.2 million in new construction projects, the majority of which were completed during 2018.
Operating Expenses:
Supply Costs
Total supply costs comprise the largest segment of total operating expenses. Supply costs accounted for 28.1% and 26.8% of total operating expenses for the years ended December 31, 2017 and 2016, respectively. The table below provides the amounts (in thousands) of increases (decreases) and percent changes in water and electric revenues, supply costs and gross margins during the years ended December 31, 2017 and 2016:
|
Year Ended
|
Year Ended
|
$
|
%
|
|||||||||||
|
12/31/2017
|
12/31/2016
|
CHANGE
|
CHANGE
|
|||||||||||
|
WATER OPERATING REVENUES
(1)
|
$
|
306,332
|
|
$
|
302,931
|
|
$
|
3,401
|
|
1.1
|
%
|
|||
|
WATER SUPPLY COSTS:
|
|
|
||||||||||||
|
Water purchased
(1)
|
68,302
|
|
64,442
|
|
3,860
|
|
6.0
|
%
|
||||||
|
Power purchased for pumping
(1)
|
8,518
|
|
8,663
|
|
(145
|
)
|
-1.7
|
%
|
||||||
|
Groundwater production assessment
(1)
|
18,638
|
|
14,993
|
|
3,645
|
|
24.3
|
%
|
||||||
|
Water supply cost balancing accounts
(1)
|
(20,289
|
)
|
(14,813
|
)
|
(5,476
|
)
|
37.0
|
%
|
||||||
|
TOTAL WATER SUPPLY COSTS
|
$
|
75,169
|
|
$
|
73,285
|
|
$
|
1,884
|
|
2.6
|
%
|
|||
|
WATER GROSS MARGIN
(2)
|
$
|
231,163
|
|
$
|
229,646
|
|
$
|
1,517
|
|
0.7
|
%
|
|||
|
ELECTRIC OPERATING REVENUES
(1)
|
$
|
33,969
|
|
$
|
35,771
|
|
$
|
(1,802
|
)
|
-5.0
|
%
|
|||
|
ELECTRIC SUPPLY COSTS:
|
||||||||||||||
|
Power purchased for resale
(1)
|
10,720
|
|
10,387
|
|
333
|
|
3.2
|
%
|
||||||
|
Electric supply cost balancing accounts
(1)
|
2,350
|
|
2,607
|
|
(257
|
)
|
-9.9
|
%
|
||||||
|
TOTAL ELECTRIC SUPPLY COSTS
|
$
|
13,070
|
|
$
|
12,994
|
|
$
|
76
|
|
0.6
|
%
|
|||
|
ELECTRIC GROSS MARGIN
(2)
|
$
|
20,899
|
|
$
|
22,777
|
|
$
|
(1,878
|
)
|
-8.2
|
%
|
|||
(1)
As reported on AWR’s Consolidated Statements of Income, except for supply-cost-balancing accounts. The sums of water and electric supply-cost balancing accounts in the table above are shown on AWR’s Consolidated Statements of Income and totaled $(17.9) million and $(12.2) million for the years ended December 31, 2017 and 2016, respectively. Revenues include surcharges, which increase both revenues and operating expenses by corresponding amounts, thus having no net earnings impact.
(2)
Water and electric gross margins do not include depreciation and amortization, maintenance, administrative and general, property and other taxes, and other operation expenses.
40
The overall actual percentages for purchased water for the years ended December 31, 2017 and 2016 were 42% and 40%, respectively, as compared to the adopted percentages of 28% and 29% for 2017 and 2016, respectively. The higher actual percentages of purchased water as compared to adopted percentages resulted primarily from several wells being out of service.
Purchased water costs for the year ended December 31, 2017 increased to $68.3 million as compared to $64.4 million for the same period in 2016 primarily due to an increase of purchased water in the supply mix as a result of several wells being out of service, as well as an increase in wholesale water costs as compared to the year ended December 31, 2016.
For the year ended December 31, 2017, the cost of power purchased for pumping decreased slightly to $8.5 million as compared to $8.7 million for the same period in 2016 primarily due to decreases in pumped water. Groundwater production assessments were $18.6 million in 2017 as compared to $15.0 million in 2016 due to an increase in pump tax rates and pump taxes paid for water storage rights during 2017 as compared to 2016.
The under-collection in the water supply cost balancing account increased $5.5 million during the year ended December 31, 2017 as compared to the same period in 2016 due to the higher purchased water costs as well as higher groundwater production assessments as compared to adopted water supply costs.
For the year ended December 31, 2017, the cost of power purchased for resale to BVES's customers was $10.7 million as compared to $10.4 million for the same period in 2016. The average price per megawatt-hour ("MWh"), including fixed costs, increased to $73.03 per MWh in 2017 from $69.54 per MWh for the year ended December 31, 2016.
Other Operation
For the years ended December 31, 2017 and 2016, other operation expenses by business segment consisted of the following amounts (in thousands):
|
Year
Ended |
Year
Ended |
$
|
%
|
|||||||||||
|
12/31/2017
|
12/31/2016
|
CHANGE
|
CHANGE
|
|||||||||||
|
Water Services
|
$
|
22,189
|
|
$
|
21,649
|
|
$
|
540
|
|
2.5
|
%
|
|||
|
Electric Services
|
2,688
|
|
3,122
|
|
(434
|
)
|
-13.9
|
%
|
||||||
|
Contracted Services
|
5,117
|
|
3,486
|
|
1,631
|
|
46.8
|
%
|
||||||
|
Total other operation
|
$
|
29,994
|
|
$
|
28,257
|
|
$
|
1,737
|
|
6.1
|
%
|
|||
During 2017, there was a $433,000 increase in surcharges billed to customers to recover previously incurred other operation expenses approved by the CPUC as part of the final decision on the water general rate case. These surcharges increased revenues and water gross margin with a corresponding increase in other operation expenses, resulting in no impact to earnings. Furthermore, in February 2017, the CPUC approved the recovery of incremental drought-related costs incurred in 2015 and 2016 during the drought state of emergency in California. As a result of the CPUC's approval, GSWC recorded a $1.2 million regulatory asset with a corresponding reduction in other operation expenses during the first quarter of 2017. Excluding the impact of surcharges and the recovery of drought-related costs, other operation expenses at the water segment increased by $1.3 million during the year ended December 31, 2017 as compared to the same period in 2016. The increase was due primarily to higher conservation costs, labor and bad debt expense.
The decrease in other operation expenses at the electric segment was due to outside services costs and labor costs incurred in response to power outages caused by severe winter storms experienced in January 2016. There were no similar events in 2017.
For the year ended December 31, 2017, total other operation expenses for the contracted services segment increased mainly due to transition costs incurred at Eglin AFB, including a joint inventory study conducted with the U.S. government for the water and wastewater system infrastructure. ASUS assumed operations at Eglin AFB in June 2017, which further increased other operation expenses in 2017 as compared to 2016. ASUS assumed the operations at Fort Riley in July 2018.
41
Administrative and General
For the years ended December 31, 2017 and 2016, administrative and general expenses by business segment, including AWR (parent), consisted of the following amounts (in thousands):
|
Year
Ended |
Year
Ended |
$
|
%
|
|||||||||||
|
12/31/2017
|
12/31/2016
|
CHANGE
|
CHANGE
|
|||||||||||
|
Water Services
|
$
|
55,471
|
|
$
|
56,745
|
|
$
|
(1,274
|
)
|
-2.2
|
%
|
|||
|
Electric Services
|
6,937
|
|
7,953
|
|
(1,016
|
)
|
-12.8
|
%
|
||||||
|
Contracted Services
|
19,139
|
|
16,801
|
|
2,338
|
|
13.9
|
%
|
||||||
|
AWR (parent)
|
96
|
|
19
|
|
77
|
|
405.3
|
%
|
||||||
|
Total administrative and general
|
$
|
81,643
|
|
$
|
81,518
|
|
$
|
125
|
|
0.2
|
%
|
|||
Surcharges were implemented in 2017 to recover previously incurred administrative and general
costs approved by the CPUC as part of the final decision on the water general rate case issued in March 2017. A $3.3 million increase in revenues and water gross margin from these surcharges was offset by a corresponding increase in administrative and general expense to reflect the recovery of these costs, resulting in no impact to earnings. Excluding the increase in billed surcharges, administrative and general expenses at the water segment decreased by $4.6 million due primarily to lower legal expenses related to condemnation matters as compared to 2016. In addition, the Claremont settlement payment received in December 2017 included reimbursement of approximately $1.8 million in litigation costs, which was reflected as a reduction to legal expenses in 2017. These decreases were partially offset by higher medical insurance costs and general-rate-case-related expenses, as well as an $800,000 reduction to administrative and general expenses recorded in 2016 to reflect the CPUC's approval for recovery of previously incurred costs that were being tracked in CPUC-authorized memorandum accounts.
For the year ended December 31, 2017, administrative and general expenses for the electric segment decreased by $1.0 million as compared to 2016 due to lower regulatory costs, as well as decreases in costs associated with the energy-efficiency and solar-initiative programs approved by the CPUC.
For the year ended December 31, 2017, administrative and general expenses for contracted services increased by $2.3 million due primarily to (i) an increase in labor-related costs, (ii) the start of operations at Eglin AFB in June 2017, which increased administrative and general expenses in 2017 as compared to 2016, and (iii) an increase in outside services costs related to new business development and compliance.
Depreciation and Amortization
For the years ended December 31, 2017 and 2016, depreciation and amortization expense by segment consisted of the following amounts (in thousands):
|
Year
Ended |
Year
Ended |
$
|
%
|
|||||||||||
|
12/31/2017
|
12/31/2016
|
CHANGE
|
CHANGE
|
|||||||||||
|
Water Services
|
$
|
35,706
|
|
$
|
35,777
|
|
$
|
(71
|
)
|
-0.2
|
%
|
|||
|
Electric Services
|
2,146
|
|
2,027
|
|
119
|
|
5.9
|
%
|
||||||
|
Contracted Services
|
1,179
|
|
1,046
|
|
133
|
|
12.7
|
%
|
||||||
|
Total depreciation and amortization
|
$
|
39,031
|
|
$
|
38,850
|
|
$
|
181
|
|
0.5
|
%
|
|||
For the year ended December 31, 2017, depreciation and amortization expense at the water segment decreased due primarily to retirements recorded during 2017 and 2016, as well as the sale of the Ojai utility assets in June 2017. These decreases were largely offset by additions to utility plant during 2017. The increases for the electric and contracted services segments were due primarily to additions to plant in 2017.
42
Maintenance
For the years ended December 31, 2017 and 2016, maintenance expense by segment consisted of the following amounts (in thousands):
|
Year
Ended |
Year
Ended |
$
|
%
|
|||||||||||
|
12/31/2017
|
12/31/2016
|
CHANGE
|
CHANGE
|
|||||||||||
|
Water Services
|
$
|
12,101
|
|
$
|
13,783
|
|
$
|
(1,682
|
)
|
-12.2
|
%
|
|||
|
Electric Services
|
869
|
|
736
|
|
133
|
|
18.1
|
%
|
||||||
|
Contracted Services
|
2,206
|
|
1,951
|
|
255
|
|
13.1
|
%
|
||||||
|
Total maintenance
|
$
|
15,176
|
|
$
|
16,470
|
|
$
|
(1,294
|
)
|
-7.9
|
%
|
|||
Maintenance expense for water services decreased by $1.7 million due to an overall lower level of planned and unplanned maintenance in 2017. Maintenance expense for contracted services increased due primarily to the commencement of operations at Eglin AFB in June 2017.
Property and Other Taxes
For the years ended December 31, 2017 and 2016, property and other taxes by segment, consisted of the following amounts (in thousands):
|
Year
Ended |
Year
Ended |
$
|
%
|
|||||||||||
|
12/31/2017
|
12/31/2016
|
CHANGE
|
CHANGE
|
|||||||||||
|
Water Services
|
$
|
15,336
|
|
$
|
14,362
|
|
$
|
974
|
|
6.8
|
%
|
|||
|
Electric Services
|
1,066
|
|
1,082
|
|
(16
|
)
|
-1.5
|
%
|
||||||
|
Contracted Services
|
1,503
|
|
1,357
|
|
146
|
|
10.8
|
%
|
||||||
|
Total property and other taxes
|
$
|
17,905
|
|
$
|
16,801
|
|
$
|
1,104
|
|
6.6
|
%
|
|||
Property and other taxes increased overall by $1.1 million during 2017 as compared to 2016 due primarily to capital additions at the water segment.
ASUS Construction
For the year ended December 31, 2017, construction expenses for contracted services were $49.8 million, decreasing by $3.9 million compared to the same period in 2016 due to an overall decrease in construction activity.
Gain on Sale of Assets
In June 2017, GSWC completed the sale of its Ojai water system to Casitas Municipal Water District for $34.3 million, resulting in a pretax gain of $8.3 million on the sale of the assets.
Interest Expense
For the years ended December 31, 2017 and 2016, interest expense by segment, including AWR (parent), consisted of the following amounts (in thousands):
|
Year
Ended |
Year
Ended |
$
|
%
|
|||||||||||
|
12/31/2017
|
12/31/2016
|
CHANGE
|
CHANGE
|
|||||||||||
|
Water Services
|
$
|
20,670
|
|
$
|
20,430
|
|
$
|
240
|
|
1.2
|
%
|
|||
|
Electric Services
|
1,385
|
|
1,352
|
|
33
|
|
2.4
|
%
|
||||||
|
Contracted Services
|
269
|
|
76
|
|
193
|
|
253.9
|
%
|
||||||
|
AWR (parent)
|
258
|
|
134
|
|
124
|
|
92.5
|
%
|
||||||
|
Total interest expense
|
$
|
22,582
|
|
$
|
21,992
|
|
$
|
590
|
|
2.7
|
%
|
|||
Overall, interest expense for the year ended December 31, 2017 increased by $590,000 as compared to the same period in 2016 due largely to higher average borrowings on the revolving credit facility as compared to 2016. The borrowings were used to fund operations and a portion of capital expenditures. The proceeds received in June 2017 from the completed sale of GSWC's Ojai system were used to repay a portion of these borrowings. Borrowings on the revolving credit facility are expected to continue in 2018 to fund operations and a portion of capital expenditures.
43
Interest Income
For the years ended December 31, 2017 and 2016, interest income by business segment, including AWR (parent), consisted of the following amounts (in thousands):
|
Year
Ended |
Year
Ended |
$
|
%
|
|||||||||||
|
12/31/2017
|
12/31/2016
|
CHANGE
|
CHANGE
|
|||||||||||
|
Water Services
|
$
|
1,761
|
|
$
|
734
|
|
$
|
1,027
|
|
139.9
|
%
|
|||
|
Electric Services
|
5
|
|
15
|
|
(10
|
)
|
-66.7
|
%
|
||||||
|
Contracted Services
|
14
|
|
8
|
|
6
|
|
75.0
|
%
|
||||||
|
AWR (parent)
|
10
|
|
—
|
|
10
|
|
—
|
%
|
||||||
|
Total interest income
|
$
|
1,790
|
|
$
|
757
|
|
$
|
1,033
|
|
136.5
|
%
|
|||
Interest income increased by $1.0 million for the year ended December 31, 2017 as compared to the same period in 2016 due primarily to (i) the collection of certain amounts from developers previously owed to GSWC, (ii) higher interest income on GSWC's regulatory assets resulting mostly from an increase in the 90-day commercial paper rate, and (iii) interest income related to a settlement payment received in December 2017.
Other, net
For the year ended December 31, 2017, other income increased by $517,000 primarily due to higher gains recorded on investments held for a retirement benefit plan resulting from more favorable market conditions as compared to 2016. This was partially offset by a decrease in the non-service cost components of net periodic benefit costs related to Registrant's defined benefit pension plans and other retirement benefits.
Income Tax Expense
For the years ended December 31, 2017 and 2016, income tax expense by segment, including AWR (parent), consisted of the following amounts (in thousands):
|
Year
Ended |
Year
Ended |
$
|
%
|
|||||||||||
|
12/31/2017
|
12/31/2016
|
CHANGE
|
CHANGE
|
|||||||||||
|
Water Services
|
$
|
32,212
|
|
$
|
25,894
|
|
$
|
6,318
|
|
24.4
|
%
|
|||
|
Electric Services
|
1,847
|
|
2,715
|
|
(868
|
)
|
-32.0
|
%
|
||||||
|
Contracted Services
|
7,136
|
|
6,672
|
|
464
|
|
7.0
|
%
|
||||||
|
AWR (parent)
|
(2,221
|
)
|
(546
|
)
|
(1,675
|
)
|
306.8
|
%
|
||||||
|
Total income tax expense
|
$
|
38,974
|
|
$
|
34,735
|
|
$
|
4,239
|
|
12.2
|
%
|
|||
Consolidated income tax expense for the year ended December 31, 2017 increased by $4.2 million due primarily to an increase in pretax income. AWR's effective income tax rate ("ETR") was 36.0% and 36.8% for the years ended December 31, 2017 and 2016, respectively. The ETR for GSWC was 38.8% for 2017 as compared to 37.9% for 2016 due, in part, to the remeasurement of non rate-regulated deferred tax assets as a result of the Tax Act, which reduced the federal corporate tax rate from 35% to 21%. The earnings impact of this increase in GSWC's ETR was largely offset by a reduction in deferred tax liabilities at AWR (parent), due also to the remeasurement of federal deferred tax liabilities associated with the California state unitary deferred tax balance.
44
Critical Accounting Policies and Estimates
Critical accounting policies and estimates are those that are important to the portrayal of AWR’s financial condition, results of operations and cash flows, and require the most difficult, subjective or complex judgments of AWR’s management. The need to make estimates about the effect of items that are uncertain is what makes these judgments difficult, subjective and/or complex. Management makes subjective judgments about the accounting and regulatory treatment of many items. The following are accounting policies that are critical to the financial statements of AWR. For more information regarding the significant accounting policies of Registrant, see Note 1 of “
Notes to Financial Statements
” included in Part II, Item 8, in Financial Statements and Supplementary Data.
Accounting for Rate Regulation
—
Because GSWC operates extensively in a regulated business, it is subject to the authoritative guidance for accounting for the effects of certain types of regulation. Application of this guidance requires accounting for certain transactions in accordance with regulations adopted by the regulatory commissions of the states in which rate-regulated operations are conducted. Utility companies defer costs and credits on the balance sheet as regulatory assets and liabilities when it is probable that those costs and credits will be recognized in the ratemaking process in a period different from the period in which they would have been reflected in income by an unregulated company. These deferred regulatory assets and liabilities are then reflected in the income statement in the period in which the same amounts are reflected in the rates charged for service.
Regulation and the effects of regulatory accounting have the most significant impact on the financial statements of GSWC. When GSWC files for adjustments to rates, the capital assets, operating costs and other matters are subject to review, and disallowances may occur. In the event that a portion of the GSWC’s operations is no longer subject to the accounting guidance for the effects of certain types of regulation, GSWC is required to write-off related regulatory assets that are not specifically recoverable and determine if other assets might be impaired. If the CPUC determines that a portion of GSWC’s assets are not recoverable in customer rates, GSWC is required to determine if it has suffered an asset impairment that would require a write-down in the asset valuation. Management continually evaluates the anticipated recovery, settlement or refund of regulatory assets, liabilities, and revenues subject to refund and provides for allowances and/or reserves that it believes to be necessary. In the event that GSWC’s assessment as to the probability of the inclusion in the ratemaking process is incorrect, the associated regulatory asset or liability will be adjusted to reflect the change in assessment or the impact of regulatory approval of rates. Reviews by the CPUC may also result in additional regulatory liabilities to refund previously collected revenues to customers if the CPUC were to disallow costs included in the ratemaking process.
Registrant also reviews its utility plant in-service for possible impairment in accordance with accounting guidance for regulated entities for abandonments and disallowances of plant costs.
Revenue Recognition
—
Effective January 1, 2018, Registrant adopted Accounting Standard Update 2014-09,
Revenue from Contracts with Customers (Topic 606)
("ASU 2014-09") issued by the Financial Accounting Standards Board. The adoption of this revenue guidance did not have a material impact on how Registrant recognizes revenue.
GSWC records water and electric utility operating revenues when the service is provided to customers. Operating revenues include unbilled revenues that are earned (i.e., the service has been provided) but not billed by the end of each accounting period. Unbilled revenues are calculated based on the number of days and total usage from each customer’s most recent billing record that was billed prior to the end of the accounting period, and is used to estimate unbilled consumption as of the year-end reporting period. Unbilled revenues are recorded for both monthly and bi-monthly customers.
The CPUC granted GSWC the authority to implement revenue decoupling mechanisms through the adoption of the WRAM and the BRRAM. With the adoption of these alternative revenue programs, GSWC adjusts revenues in the WRAM and BRRAM for the difference between what is billed to its regulated customers and that which is authorized by the CPUC. Alternative revenue programs such as the WRAM and BRRAM are outside the scope of ASU 2014-09.
As required by the accounting guidance for alternative revenue programs, GSWC is required to collect its WRAM and BRRAM balances within 24 months following the year in which they are recorded. The CPUC has set the recovery period for under-collected balances that are up to 15% of adopted annual revenues at 18 months or less. For net WRAM under-collected balances greater than 15%, the recovery period is 19 to 36 months. As a result of the accounting guidance and CPUC-adopted recovery periods, Registrant must estimate if any WRAM and BRRAM revenues will be collected beyond the 24-month period, which can affect the timing of when such revenues are recognized.
Revenues for ASUS's operations and maintenance contracts are recognized when services have been rendered to the U.S. government pursuant to 50-year contracts. Revenues from construction activities are recognized based on either the
45
percentage-of-completion or cost-plus methods of accounting. In accordance with GAAP, revenue recognition under these methods requires management to estimate the progress toward completion on a contract in terms of efforts, such as costs incurred. This approach is used because management considers it to be the best available measure of progress on these contracts. Changes in job performance, job conditions, change orders and estimated profitability, including those arising from any contract penalty provisions, and final contract settlements may result in revisions to costs and income, and are recognized in the period in which the revisions are determined. Unbilled receivables from the U.S. government represent amounts to be billed for construction work completed and/or for services rendered pursuant to the
50
-year contracts with the U.S government, which are not presently billable but which will be billed under the terms of the contracts.
Income Taxes
—
Registrant’s income tax calculations require estimates due principally to the regulated nature of the operations of GSWC, the multiple states in which Registrant operates, and potential future tax rate changes. Registrant uses the asset and liability method of accounting for income taxes under which deferred tax assets and liabilities are recognized for future tax consequences attributable to differences between the financial statement carrying amounts of existing assets and liabilities and their respective tax bases. Deferred tax assets and liabilities are measured using enacted tax rates expected to apply to taxable income in the years in which these temporary differences are expected to be recovered or settled. Changes in regulatory treatment, or significant changes in tax-related estimates, assumptions or law, could have a material impact on the financial position and results of operations of Registrant.
As a regulated utility, GSWC treats certain temporary differences as flow-through adjustments in computing its income tax expense consistent with the income tax approach approved by the CPUC for ratemaking purposes. Flow-through adjustments increase or decrease tax expense in one period, with an offsetting decrease or increase occurring in another period. Giving effect to these temporary differences as flow-through adjustments typically results in a greater variance between the effective tax rate and the statutory federal income tax rate in any given period than would otherwise exist if GSWC were not required to account for its income taxes as a regulated enterprise. As of
December 31, 2018
, Registrant’s total amount of unrecognized tax benefits was zero.
Pension Benefits
—
Registrant’s pension benefit obligations and related costs are calculated using actuarial concepts within the framework of accounting guidance for employers' accounting for pensions and post-retirement benefits other than pensions. Two critical assumptions, the discount rate and the expected return on plan assets, are important elements of expense and/or liability measurement. We evaluate these critical assumptions annually. Other assumptions include employee demographic factors such as retirement patterns, mortality, turnover and rate of compensation increase. The discount rate enables Registrant to state expected future cash payments for benefits as a present value on the measurement date. The guideline for setting this rate is a high-quality, long-term corporate bond rate. Registrant’s discount rates were determined by considering the average of pension yield curves constructed using a large population of high-quality corporate bonds. The resulting discount rates reflect the matching of plan liability cash flows to the yield curves. A lower discount rate increases the present value of benefit obligations and increases periodic pension expense. Conversely, a higher discount rate decreases the present value of benefit obligations and decreases periodic pension expense. To determine the expected long-term rate of return on the plan assets, Registrant considers the current and expected asset allocation, as well as historical and expected returns on each plan asset class. A lower expected rate of return on plan assets will increase pension expense. The long-term expected return on the pension plan's assets was
6.50%
in both
2018
and
2017
.
For the pension plan obligation, Registrant increased the discount rate to
4.43%
as of
December 31, 2018
from
3.76%
as of
December 31, 2017
to reflect market interest-rate conditions at
December 31, 2018
. A hypothetical 25-basis point decrease in the assumed discount rate would have increased total net periodic pension expense for
2018
by approximately $855,000, or 27.8%, and would have increased the projected benefit obligation (“PBO”) and accumulated benefit obligation (“ABO”) at
December 31, 2018
by a total of $7.0 million, or 3.6%. A 25-basis point further decrease in the long-term return on pension-plan-asset assumption would have increased
2018
pension cost by approximately $430,000, or 14.0%.
In addition, changes in the fair value of plan assets will impact future pension cost and the Plan’s funded status. Volatile market conditions can affect the value of AWR’s trust established to fund its future long-term pension benefits. Any reductions in the value of plan assets will result in increased future expense, an increase in the underfunded position and increased future contributions.
The CPUC has authorized GSWC to maintain two-way balancing accounts to track differences between the forecasted annual pension expenses adopted in rates and the actual annual expense to be recorded by GSWC in accordance with the accounting guidance for pension costs. As of
December 31, 2018
, GSWC has a
$3.0 million
over-collection in the two-way pension balancing accounts, consisting of a
$2.0 million
over-collection related to the general office and water regions, and a
$1.0 million
over-collection related to BVES.
46
Funding requirements for qualified defined benefit pension plans are determined by government regulations. In establishing the contribution amount, Registrant has considered the potential impact of funding-rule changes under the Pension Protection Act of 2006. Registrant contributes the minimum required contribution as determined by government regulations or the forecasted annual pension cost authorized by the CPUC and included in customer rates, whichever is higher. In accordance with this funding policy, for
2019
the pension contribution is expected to be approximately
$3.6 million
. Any differences between the forecasted annual pension costs in rates and the actual pension costs are included in the two-way pension balancing accounts.
Additionally, our pension plan liabilities are sensitive to changes in interest rates. As interest rates decrease, thereby reducing returns, our liabilities increase, potentially increasing benefit expense and funding requirements. In addition, market factors can affect assumptions we use in determining funding requirements with respect to our pension plan. For example, a relatively modest change in our assumptions regarding discount rates can materially affect our calculation of funding requirements. To the extent that market data compels us to reduce the discount rate used in our assumptions, our benefit obligations could materially increase.
Changes in demographics, including increased numbers of retirees or increases in life expectancy assumptions may also increase the funding requirements of our obligations related to the pension and other postretirement benefit plans. Mortality assumptions are a critical component of benefit obligation amounts and a key factor in determining the expected length of time for annuity payments. Assuming no changes in actuarial assumptions or plan amendments, the costs over the long term are expected to decrease due to the closure of Registrant’s defined benefit pension plan to new employees as of January 1, 2011. Employees hired or rehired after December 31, 2010 are eligible to participate in a defined contribution plan.
47
Liquidity and Capital Resources
AWR
Registrant’s regulated business is capital intensive and requires considerable capital resources. A portion of these capital resources is provided by internally generated cash flows from operations. AWR anticipates that interest expense will increase in future periods due to the need for additional external capital to fund its construction program, and as market interest rates increase. AWR believes that costs associated with capital used to fund construction at GSWC will continue to be recovered through water and electric rates charged to customers.
AWR funds its operating expenses and pays dividends on its outstanding Common Shares primarily through dividends from its wholly owned subsidiaries. The ability of GSWC to pay dividends to AWR is restricted by California law. Under these restrictions, approximately
$211.2 million
was available for GSWC to pay dividends to AWR on
December 31, 2018
. Approximately
$67.3 million
was available for ASUS to pay dividends to AWR as of
December 31, 2018
to the extent that the subsidiaries of ASUS are able to pay dividends in that amount to ASUS under applicable state laws.
When necessary, Registrant obtains funds from external sources in the capital markets and through bank borrowings. Access to external financing on reasonable terms depends on the credit ratings of AWR and GSWC and current business conditions, including that of the water utility industry in general, as well as conditions in the debt and equity capital markets. AWR has access to a syndicated credit facility, which expires in May 2023. AWR borrows under this facility and provides funds to its subsidiaries, GSWC and ASUS, in support of their operations. Any amounts owed to AWR by GSWC for borrowings under this facility are included in inter-company payables on GSWC’s balance sheet. The interest rate charged to GSWC and ASUS is sufficient to cover AWR’s interest cost under the credit facility.
In March of 2019, $40 million of GSWC's 6.70% senior notes will mature. GSWC intends to borrow under its intercompany borrowing arrangement with AWR to fund the repayment of this note. As of February 1, 2019 there were $99.5 million of outstanding borrowings under this facility and
$940,000
of letters of credit outstanding. As of February 1, 2019, AWR had $49.6 million available to borrow under the credit facility.
In July 2018, Standard and Poor’s Global Ratings (“S&P”) affirmed an A+ credit rating with a stable outlook on both AWR and GSWC. S&P’s debt ratings range from AAA (highest possible) to D (obligation is in default). In January 2019, Moody's Investors Service ("Moody's") affirmed its A2 rating with a positive outlook for GSWC. Securities ratings are not recommendations to buy, sell or hold a security and are subject to change or withdrawal at any time by the rating agencies. Registrant believes that AWR’s sound capital structure and A+ credit rating, combined with its financial discipline, will enable AWR to access the debt and equity markets. However, unpredictable financial market conditions in the future may limit its access or impact the timing of when to access the market, in which case, Registrant may choose to temporarily reduce its capital spending. If needed, GSWC may issue long-term debt in the future, depending on market conditions. It is anticipated that the proceeds from any such debt issuance would be used to pay down short-term borrowings and fund a portion of capital expenditures.
AWR’s ability to pay cash dividends on its Common Shares outstanding depends primarily upon cash flows from its subsidiaries. AWR intends to continue paying quarterly cash dividends in the future, on or about March 1, June 1, September 1 and December 1, subject to earnings and financial conditions, regulatory requirements and such other factors as the Board of Directors may deem relevant. Registrant has paid dividends on its Common Shares for over 80 consecutive years. On January 29, 2019, AWR's Board of Directors approved a first quarter dividend of $0.275 per share on AWR's Common Shares. Dividends on the Common Shares will be paid on March 1, 2019 to shareholders of record at the close of business on February 15, 2019.
Cash Flows from Operating Activities
:
Cash flows from operating activities have generally provided sufficient cash to fund operating requirements, including a portion of construction expenditures at GSWC, construction expenses at ASUS, and dividend payments. Registrant’s future cash flows from operating activities are expected to be affected by a number of factors, including utility regulation; changes in tax law and deferred taxes; maintenance expenses; inflation; compliance with environmental, health and safety standards; production costs; customer growth; per-customer usage of water and electricity; weather and seasonality; conservation efforts; compliance with local governmental requirements, including mandatory restrictions on water use; and required cash contributions to pension and post-retirement plans. Future cash flows from contracted services subsidiaries will depend on new business activities, existing operations, the construction of new and/or replacement infrastructure at military bases, timely economic price and equitable adjustment of prices, and timely collection of payments from the U.S. government and other prime contractors operating at the military bases.
48
The lower federal tax rate and the elimination of bonus depreciation brought about by the Tax Act are reducing Registrant's cash flows from operating activities, and are expected to result in higher financing costs arising from an increased need to raise debt and/or equity.
ASUS funds its operating expenses primarily through internal operating sources, which include U.S. government funding under 50-year contracts for operations and maintenance costs and construction activities, as well as investments by, or loans from, AWR. ASUS, in turn, provides funding to its subsidiaries. ASUS's subsidiaries may also from time to time provide funding to ASUS or its subsidiaries.
Cash flows from operating activities are primarily generated by net income, adjusted for non-cash expenses such as depreciation and amortization, and deferred income taxes. Cash generated by operations varies during the year. Net cash provided by operating activities was
$136.8 million
for the year ended
December 31, 2018
as compared to
$144.6 million
for the year ended
December 31, 2017
, and
$96.9 million
for the year ended
December 31, 2016
. The decrease in cash from operating activities during
2018
was due primarily to: (i) significant differences in the timing of income tax payments made and refunds received between the two periods, and (ii) a decrease resulting from the timing of billing of and cash receipts for construction work at military bases during the year ended
December 31, 2018
. The billings (and cash receipts) for construction work generally occur at completion of the work or in accordance with a billing schedule contractually agreed to with the U.S. government and/or other prime contractors. Thus, cash flow from construction-related activities may fluctuate from period to period with such fluctuations representing timing differences of when the work is being performed and when the cash is received for payment of the work. These decreases in cash from operating activities were partially offset by an overall increase in cash collected from customers related to GSWC’s regulatory accounts. The timing of cash receipts and disbursements related to other working capital items also affected the changes in net cash provided by operating activities.
The increase in operating cash flow during 2017 as compared to 2016 was due to various CPUC-approved surcharges implemented during 2017 to recover previously incurred costs as well as income tax refunds received in 2017. The increase in operating cash flow was also due to the timing of billing of and cash receipts for construction work at military bases during 2017. Changes in customer accounts receivable were due to higher balances outstanding resulting from CPUC-approved rate increases and surcharges. The timing of cash receipts and disbursements related to other working capital items also affected the change in net cash provided by operating activities.
Cash Flows from Investing Activities
:
Net cash used in investing activities was
$128.0 million
for the year ended
December 31, 2018
as compared to
$80.0 million
used in
2017
and
$131.2 million
used in
2016
. Cash used in investing activities during
2017
were partially offset by $34.3 million in cash proceeds generated from the sale of GSWC's Ojai water system in
2017
. Cash used for other investments consists primarily of cash invested in a trust for a retirement benefit plan.
The decrease in cash used in investing activities in
2017
as compared to 2016 was due to the $34.3 million in cash proceeds generated from the sale of GSWC's Ojai water system.
Registrant invests capital to provide essential services to its regulated customer base, and has an opportunity to earn a fair rate of return on investments in infrastructure. Registrant’s infrastructure investment plan consists of both infrastructure renewal programs, where infrastructure is replaced, as needed, and major capital investment projects, where new water treatment and delivery facilities are constructed. GSWC may also be required from time to time to relocate existing infrastructure in order to accommodate local infrastructure improvement projects. Projected capital expenditures and other investments are subject to periodic review and revision.
Cash Flows from Financing Activities
:
Registrant’s financing activities include primarily: (i) the sale proceeds from the issuance of Common Shares and stock option exercises and the repurchase of Common Shares; (ii) the issuance and repayment of long-term debt and notes payable to banks; and (iii) the payment of dividends on Common Shares. In order to finance new infrastructure, Registrant also receives customer advances (net of refunds) for, and contributions in aid of, construction. Short-term borrowings are used to fund capital expenditures until long-term financing is arranged.
Net cash used in financing activities was
$1.8 million
for the year ended
December 31, 2018
as compared to net cash used of
$64.7 million
and net cash provided of
$30.3 million
for the same periods in
2017
and
2016
, respectively. The decrease in net cash used in financing activities in 2018 from 2017 was due to the use of the Ojai sale proceeds, as well as cash
49
generated from operating activities during 2017 to repay a portion of short-term borrowings from Registrant's revolving credit facility.
Net cash used in financing activities in 2017 as compared to net cash provided by financing activities in 2016 was due to the use of the Ojai sale proceeds.
GSWC
GSWC funds its operating expenses, payments on its debt, dividends on its outstanding common shares and a portion of its construction expenditures through internal sources. Internal sources of cash flow are provided primarily by retention of a portion of earnings from operating activities. Internal cash generation is influenced by factors such as weather patterns, conservation efforts, environmental regulation, litigation, changes in tax law and deferred taxes, changes in supply costs and regulatory decisions affecting GSWC’s ability to recover these supply costs, timing of rate relief, increases in maintenance expenses and capital expenditures, surcharges authorized by the CPUC to enable GSWC to recover expenses previously incurred from customers, and CPUC requirements to refund amounts previously charged to customers.
GSWC may, at times, utilize external sources, including equity investments and short-term borrowings from AWR, and long-term debt to help fund a portion of its construction expenditures. On November 29, 2018, the Board of Directors approved the issuance of nineteen additional GSWC common shares to AWR for $47.5 million. GSWC used the proceeds from the issuance to pay down intercompany borrowings owed to AWR.
In addition, GSWC receives advances and contributions from customers, homebuilders and real estate developers to fund construction necessary to extend service to new areas. Advances for construction are generally refundable at a rate of 2.5% in equal annual installments over 40 years. Amounts that are no longer subject to refund are reclassified to contributions in aid of construction. Utility plant funded by advances and contributions is excluded from rate base. Generally, GSWC amortizes contributions in aid of construction at the same composite rate of depreciation for the related property.
As is often the case with public utilities, GSWC’s current liabilities may at times exceed its current assets. Management believes that internally generated funds, along with the proceeds from the issuance of long-term debt, borrowings from AWR, and common share issuances to AWR, will be adequate to provide sufficient capital to enable GSWC to maintain normal operations and to meet its capital and financing requirements pending recovery of costs in rates.
In March of 2019, $40 million of GSWC's 6.70% senior note will mature. GSWC intends to borrow under its intercompany borrowing arrangement with AWR to fund the repayment of this note.
Cash Flows from Operating Activities
:
Net cash provided by operating activities was
$120.4 million
for the year ended
December 31, 2018
as compared to
$129.6 million
and
$101.3 million
for the same periods in
2017
and
2016
, respectively. This decrease was primarily due to significant differences in the timing of income tax payments made and refunds received between the two periods, partially offset by an overall increase in cash collected from customers related to GSWC’s regulatory accounts. The timing of cash receipts and disbursements related to other working capital items also affected net cash provided by operating activities.
The increase in cash from operations in 2017 as compared to 2016 was due to various CPUC-approved surcharges implemented during 2017 to recover previously incurred costs, as well as income tax refunds received in 2017. Changes in customer accounts receivable were due to higher balances outstanding resulting from CPUC-approved rate increases and surcharges. The timing of cash receipts and disbursements related to other working capital items also affected net cash provided by operating activities.
Cash Flows from Investing Activities
:
Net cash used in investing activities was
$117.9 million
for the year ended
December 31, 2018
as compared to
$77.4 million
and
$129.3 million
for the same periods in
2017
and
2016
, respectively. Cash used for capital expenditures in
2017
was partially offset by cash proceeds received from the sale of GSWC's Ojai water system.
During the years ended
December 31, 2018
,
2017
and
2016
, cash paid for capital expenditures was
$116.4 million
,
$110.5 million
and
$127.9 million
, respectively. Capital expenditures incurred in 2018, 2017 and 2016 were consistent with GSWC’s capital investment program. GSWC expects 2019 company-funded capital expenditures to be between $115 and $125 million.
50
Cash Flows from Financing Activities
:
Net cash provided by financing activities was
$1.4 million
for
2018
as compared to net cash used of
$52.2 million
and net cash provided of
$25.7 million
for
2017
and
2016
, respectively. The increase in net cash provided by financing activities during
2018
was due to the issuance of additional Common Shares to AWR for
$47.5 million
in cash proceeds, as well as an increase in intercompany borrowings as compared to 2017. These increases were partially offset by an increase in dividends paid to AWR.
The change in net cash used in financing activities in 2017 of
$52.2 million
, as compared to net cash provided by financing activities of
$25.7 million
in 2016, was due to repayments made during 2017 on intercompany borrowings using the Ojai sale proceeds and cash generated from operating activities, as compared to net borrowings made from AWR in 2016.
Contractual Obligations, Commitments and Off-Balance-Sheet Arrangements
Registrant has various contractual obligations which are recorded as liabilities in the consolidated financial statements. Other items, such as certain purchase commitments and operating leases, are not recognized as liabilities in the consolidated financial statements, but are required to be disclosed. In addition to contractual maturities, Registrant has certain debt instruments that contain annual sinking funds or other principal payments. Registrant believes that it will be able to refinance debt instruments at their maturity through public issuance, or private placement, of debt or equity. Annual payments to service debt are generally made from cash flows from operations.
The following table reflects Registrant’s contractual obligations and commitments to make future payments pursuant to contracts as of
December 31, 2018
. All obligations and commitments are obligations and commitments of GSWC unless otherwise noted.
|
|
Payments/Commitments Due by Period (1)
|
|||||||||||||||||||
|
($ in thousands)
|
Total
|
Less than 1
Year
|
1-3 Years
|
4-5 Years
|
After 5 Years
|
|||||||||||||||
|
Notes/Debentures (2)
|
$
|
187,000
|
|
$
|
—
|
|
$
|
—
|
|
$
|
—
|
|
$
|
187,000
|
|
|||||
|
Private Placement Notes (3)
|
123,000
|
|
40,000
|
|
—
|
|
—
|
|
83,000
|
|
||||||||||
|
Tax-Exempt Obligations (4)
|
11,397
|
|
145
|
|
323
|
|
363
|
|
10,566
|
|
||||||||||
|
Other Debt Instruments (5)
|
3,581
|
|
175
|
|
387
|
|
431
|
|
2,588
|
|
||||||||||
|
Total AWR Long-Term Debt
|
$
|
324,978
|
|
$
|
40,320
|
|
710
|
|
$
|
794
|
|
$
|
283,154
|
|
||||||
|
Interest on Long-Term Debt (6)
|
$
|
254,380
|
|
$
|
19,413
|
|
$
|
37,776
|
|
$
|
37,708
|
|
$
|
159,483
|
|
|||||
|
Advances for Construction (7)
|
69,677
|
|
3,372
|
|
6,740
|
|
6,702
|
|
52,863
|
|
||||||||||
|
Renewable Energy Credit Agreement (8)
|
2,759
|
|
436
|
|
1,084
|
|
1,239
|
|
—
|
|
||||||||||
|
Purchased Power Contracts (9)
|
5,233
|
|
5,233
|
|
—
|
|
—
|
|
—
|
|
||||||||||
|
Capital Expenditures (10)
|
73,386
|
|
73,386
|
|
—
|
|
—
|
|
—
|
|
||||||||||
|
Water Purchase Agreements (11)
|
4,445
|
|
407
|
|
814
|
|
814
|
|
2,410
|
|
||||||||||
|
Operating Leases (12)
|
9,003
|
|
2,818
|
|
4,027
|
|
1,553
|
|
605
|
|
||||||||||
|
Employer Contributions (13)
|
10,042
|
|
3,573
|
|
6,469
|
|
—
|
|
—
|
|
||||||||||
|
SUB-TOTAL
|
$
|
428,925
|
|
$
|
108,638
|
|
$
|
56,910
|
|
$
|
48,016
|
|
$
|
215,361
|
|
|||||
|
Other Commitments (14)
|
101,668
|
|
||||||||||||||||||
|
TOTAL
|
$
|
855,571
|
|
|||||||||||||||||
(1) Excludes dividends and facility fees.
(2) The notes and debentures have been issued by GSWC under an Indenture dated September 1, 1993, as amended in December 2008. The notes and debentures do not contain any financial covenants that Registrant believes to be material or any cross-default provisions.
(3) GSWC issued private placement notes in 1991 in the amount of $28 million pursuant to the terms of note purchase agreements with substantially similar terms. These agreements contain restrictions on the payment of dividends, minimum interest coverage requirements, a maximum debt-to-capitalization ratio, and a negative pledge. Pursuant to the terms of these agreements, GSWC must maintain a minimum interest coverage ratio of two times interest expense. In addition, two senior notes in the amount of $40 million each were issued by GSWC in October 2005 and in March 2009 to CoBank, ACB. A
51
senior note in the amount of $15 million was issued to The Prudential Insurance Company of America in December 2014. Under the terms of these senior notes, GSWC may not incur any additional debt or pay any distributions to its shareholders if, after giving effect thereto, it would have a debt to capitalization ratio in excess of 0.6667-to-1 or a debt to earnings before interest, taxes, depreciation and amortization ratio of more than 8-to-1. GSWC is in compliance with these covenant provisions as of
December 31, 2018
. GSWC does not currently have any outstanding mortgages or other liens on indebtedness on its properties.
(4) Consists of obligations at GSWC related to (i) a loan agreement supporting
$7.7 million
in outstanding debt issued by the California Pollution Control Financing Authority, and (ii)
$3.7 million
of obligations with respect to GSWC's 500 acre-foot entitlement to water from the State Water Project (“SWP”). These obligations do not contain any financial covenants believed to be material to Registrant or any cross-default provisions. In regard to its SWP entitlement, GSWC has entered into agreements with various developers for a portion of its 500 acre-foot entitlement to water from the SWP.
(5) Consists of
$3.6 million
outstanding representing the debt portion of funds received under the American Recovery and Reinvestment Act for reimbursements of capital costs related to the installation of meters for conversion of non-metered service to metered service in GSWC's Arden-Cordova District.
(6) Consists of expected interest expense payments based on the assumption that GSWC’s long-term debt remains outstanding until maturity.
(7) Advances for construction represent annual contract refunds by GSWC to developers for the cost of water systems paid for by the developers. The advances are generally refundable in equal annual installments over 40-year periods.
(8) Consists of an agreement by GSWC to purchase renewable energy credits through 2023. These renewable energy credits are used by GSWC's electric division to meet California's renewables portfolio standard.
(9) Consists primarily of a fixed-cost purchased power contract effective January 1, 2015 between BVES and Shell Energy North America (US), L.P. and EDF Trading North America, LLC.
(10) Consists primarily of capital expenditures estimated to be required under signed contracts at GSWC as of December 31, 2018. In addition, on February 4, 2019 BVES entered into a purchase agreement with General Electric International, Inc. in which General Electric International, Inc. will construct and then sell to BVES a solar power generating facility for $11.8 million. This project is subject to CPUC approval.
(11) Water purchase agreements consist of (i) a remaining amount of
$2.2 million
under an agreement expiring in 2028 to use water rights from a third party, and (ii) an aggregate amount of
$2.2 million
of other water purchase commitments with other third parties, which expire through 2038.
(12) Reflects future minimum payments under noncancelable operating leases for both GSWC and ASUS.
(13) Consists of expected contributions to Registrant's defined benefit pension plan for the years 2019 through 2021. Contribution to the pension plan are expected to be the higher of the minimum required contribution under the Employee Retirement Income Security Act (“ERISA”) or the amounts that are recovered in customer rates and approved by the CPUC. These amounts are estimates and are subject to change based on, among other things, the limits established for federal tax deductibility (pension plan) and the significant impact that returns on plan assets and changes in discount rates have on such amounts.
(14)
Other commitments consist primarily of (i) a
$150 million
revolving credit facility, of which
$95.5 million
was outstanding as of
December 31, 2018
; (ii) a
$5.2 million
asset retirement obligation of GSWC that reflects the retirement of wells by GSWC, which by law need to be properly capped at the time of removal; (iii) an irrevocable letter of credit in the amount of $340,000 for the deductible in Registrant’s business automobile insurance policy; (iv) an irrevocable letter of credit issued on behalf of GSWC in the amount of $585,000 as security for the purchase of power by BVES under an energy scheduling agreement with Automated Power Exchange; and (v) a $15,000 irrevocable letter of credit issued on behalf of GSWC pursuant to a franchise agreement with the City of Rancho Cordova. All of the letters of credit are issued pursuant to the revolving credit facility. The revolving credit facility contains restrictions on prepayments, disposition of property, mergers, liens and negative pledges, indebtedness and guaranty obligations, transactions with affiliates, minimum interest coverage requirements, a maximum debt-to-capitalization ratio, and a minimum debt rating. Pursuant to the credit agreement, AWR must maintain a minimum interest coverage ratio of 3.25 times interest expense, a maximum total funded debt ratio of 0.65-to-1.00 and a minimum debt rating from Moody’s or S&P of Baa3 or BBB-, respectively. As of
December 31, 2018
, AWR was in compliance with these covenants with an interest coverage ratio of
6.23
times interest expense, a debt ratio of
0.43
-to-1.00 and debt ratings of A+ and A2.
52
Off-Balance-Sheet Arrangements
Registrant has various contractual obligations that are recorded as liabilities in the consolidated financial statements. Other items, such as certain purchase commitments and operating leases, are not recognized as liabilities in the consolidated financial statements, but are required to be disclosed. Except for those disclosed above in the table, Registrant does not have any other off-balance-sheet arrangements.
Effects of Inflation
The rates of GSWC are established to provide recovery of costs and a fair return on shareholders’ investment. Recovery of the effects of inflation through higher water rates is dependent upon receiving adequate and timely rate increases; however, authorized rates charged to customers are usually based on a forecast of expenses and capital costs for GSWC. Rates may lag increases in costs caused by unanticipated inflation. During periods of moderate to low inflation, as has been experienced for the last several years, the effects of inflation on operating results have not been significant. Furthermore, the CPUC approves projections for a future test year in general rate cases which reduces the impact of inflation to the extent that GSWC’s inflation forecasts are accurate.
For the Military Utility Privatization Subsidiaries, under the terms of the contracts with the U.S. government, the contract price is subject to an economic price adjustment on an annual basis. ASUS has experienced delays in some of its economic price adjustments. However, when adjustments are finalized, they are implemented retroactively to the effective date of the economic price adjustment.
Climate Change
Water
-
GSWC considers the potential impacts of climate change in its water supply portfolio planning and its overall infrastructure replacement plans. In addition, GSWC considers the impacts of greenhouse gas emissions and other environmental concerns in its operations and infrastructure investments.
Electric
-
California has established a cap-and-trade program applicable to greenhouse gas emissions. While BVES’s power-plant emissions are below the reporting threshold, as a “Covered Entity” BVES has an obligation to file a report in June of each year under the Greenhouse Gas Mandatory Reporting Regulation.
The State of California and the CPUC have also established renewable energy procurement targets. BVES has entered into a CPUC-approved ten-year contract for renewable energy credits. Because of this agreement, BVES believes it will comply through at least 2023 with California’s renewable energy statutes that address this issue. However, in addition to an anticipated increase in sales, one senate bill includes extending and increasing the renewable energy procurement requirements beyond 2020. As a result, BVES is examining its renewable supply quantities to ensure continued compliance.
BVES is also required to comply with the CPUC’s greenhouse gas emission performance standards. Under these standards, BVES must file an annual attestation with the CPUC stating that BVES is in compliance. Specifically, BVES must attest to having no new ownership investment in generation facilities exceeding the emission performance standards and no long-term commitments for generation exceeding the standards. In February 2019, BVES filed an attestation that BVES complied with the standards for 2018.
At this time, management cannot estimate the impact, if any, that these regulations may have on the cost of BVES’s power plant operations or the cost of BVES’s purchased power from third party providers.
53
BVES Power-Supply Arrangements
BVES began taking power effective January 1, 2015 at a fixed cost over three-and five-year terms depending on the amount of power and period during which the power is purchased under contracts approved by the CPUC in December 2014. The
three
-year contract expired on December 31, 2017. Registrant intends to enter into new purchased power contracts, subject to CPUC approval, once the five-year-term contract expires in November 2019. In addition to the purchased power contracts, BVES buys additional energy to meet peak demand as needed and sells surplus power when necessary. The average cost of power purchased, including fixed costs and the transactions in the spot market, was approximately $79.90 per MWh for the year ended
December 31, 2018
as compared to $73.03 per MWh for the same period of
2017
. BVES’s average energy costs are impacted by pricing fluctuations on the spot market. However, BVES has implemented an electric-supply-cost balancing account, as approved by the CPUC, to alleviate any impacts to earnings.
Construction Program
GSWC maintains an ongoing water distribution main replacement program throughout its customer service areas based on the age and type of distribution-system materials, priority of leaks detected, remaining productive life of the distribution system and an underlying replacement schedule. In addition, GSWC upgrades its electric and water supply facilities in accordance with industry standards, and local and CPUC requirements. As of
December 31, 2018
, GSWC has unconditional purchase obligations for capital projects of approximately
$73.4 million
. During the years ended
December 31, 2018
,
2017
and
2016
, GSWC had capital expenditures of $125.1 million, $115.3 million and $126.0 million, respectively. A portion of these capital expenditures was funded by developers through refundable advances, or contributions in aid of construction, which are not required to be repaid. During the years ended December 31, 2018, 2017 and 2016, capital expenditures funded by developers were $4.1 million, $3.5 million and $5.3 million, respectively. During
2019
, GSWC's company-funded capital expenditures are estimated to be approximately $115 - $125 million.
54
Contracted Services
Under the terms of the current and future utility privatization contracts with the U.S. government, each contract's price is subject to an economic price adjustment (“EPA”) on an annual basis. In the event that ASUS (i) is managing more assets at specific military bases than were included in the U.S. government’s request for proposal, (ii) is managing assets that are in substandard condition as compared to what was disclosed in the request for proposal, (iii) prudently incurs costs not contemplated under the terms of the utility privatization contract, and/or (iv) becomes subject to new regulatory requirements, such as more stringent water-quality standards, ASUS is permitted to file, and has filed, requests for equitable adjustment (“REA”). The timely filing for and receipt of EPAs and/or REAs continues to be critical in order for the Military Utility Privatization Subsidiaries to recover increasing costs of operating and maintaining, and renewing and replacing the water and/or wastewater systems at the military bases it serves.
Under the Budget Control Act of 2011 (the “2011 Act”), substantial automatic spending cuts, known as "sequestration," have impacted the expected levels of Department of Defense budgeting. The Military Utility Privatization Subsidiaries have not experienced any earnings impact to their existing operations and maintenance and renewal and replacement services, as utility privatization contracts are an "excepted service" within the 2011 Act. While the ongoing effects of sequestration have been mitigated through the passage of the Bipartisan Budget Act of 2018 for fiscal years 2018 and 2019, similar issues may arise as part of fiscal uncertainty and/or future debt-ceiling limits imposed by Congress. However, any future impact on ASUS and its operations through the Military Utility Privatization Subsidiaries will likely be limited to (a) the timing of funding to pay for services rendered, (b) delays in the processing of EPAs and/or REAs, (c) the timing of the issuance of contract modifications for new construction work not already funded by the U.S. government, and/or (d) delays in the solicitation for and/or awarding of new contracts under the Department of Defense utility privatization program. Furthermore, from December 22, 2018 until January 25, 2019, the U.S. government shutdown impacted non-essential government employees due to the lack of an approved appropriations bill to fund the operations of the federal government for fiscal year 2019. However, the shutdown did not have an impact on ASUS due to the fact that funding for military operations (including military bases) is provided by the Department of Defense, which is fully funded for fiscal 2019 and was not part of the government shutdown.
At times, the DCAA and/or the DCMA may, at the request of a contracting officer, perform audits/reviews of contractors for compliance with certain government guidance and regulations, such as the Federal Acquisition Regulations and Defense Federal Acquisition Regulation Supplements. Certain audit/review findings, such as system deficiencies for government-contract-business-system requirements, may result in delays in the timing of resolution of filings submitted to and/or the ability to file new proposals with the U.S. government.
Below is a summary of current and projected EPA filings for price adjustments to operations and maintenance fees and renewal and replacement fees for the Military Utility Privatization Subsidiaries.
|
Military Base
|
EPA period
|
Filing Date
|
|
Fort Bliss (FBWS)
|
October 2018 - September 2019
|
Third Quarter 2018
|
|
Andrews Air Force Base (TUS)
|
February 2019 - January 2020
|
Fourth Quarter 2018
|
|
Fort Lee (ODUS)
|
February 2019 - January 2020
|
Fourth Quarter 2018
|
|
Joint Base Langley Eustis and Joint Expeditionary Base Little Creek Fort Story (ODUS)
|
April 2019 - March 2020
|
First Quarter of 2019
|
|
Fort Jackson (PSUS)
|
February 2019 - January 2020
|
Fourth Quarter 2018
|
|
Fort Bragg (ONUS)
|
March 2019 - February 2020
|
Fourth Quarter 2018
|
|
Eglin Air Force Base (ECUS)
|
June 2019 - May 2020
|
Second Quarter 2019
|
|
Fort Riley (FRUS)
|
July 2019 - June 2020
|
Second Quarter 2019
|
ASUS assumed the operation of the water distribution and wastewater collection and treatment facilities at Fort Riley on July 1, 2018. The value of this contract is approximately $681.0 million over its 50-year term, subject to annual economic price adjustments.
55
Regulatory Matters
Certificates of Public Convenience and Necessity
GSWC holds Certificates of Public Convenience and Necessity (“CPCN”) granted by the CPUC in each of the ratemaking areas it serves. ASUS is regulated, if applicable, by the state in which it primarily conducts water and/or wastewater operations. FBWS holds a CPCN from the Public Utilities Commission of Texas. The Virginia State Corporation Commission exercises jurisdiction over ODUS as a public service company. The Maryland Public Service Commission approved the right of TUS to operate as a water and wastewater utility at Joint Base Andrews, Maryland, based on certain conditions. The South Carolina Public Service Commission exercises jurisdiction over PSUS as a public service company. ONUS is regulated by the North Carolina Public Service Commission. ECUS and FRUS are not subject to regulation by their respective states' utility commissions.
Rate Regulation
GSWC is subject to regulation by the CPUC, which has broad authority over service and facilities, rates, classification of accounts, valuation of properties, the purchase, disposition and mortgaging of properties necessary or useful in rendering public utility service, the issuance of securities, the granting of certificates of public convenience and necessity as to the extension of services and facilities and various other matters.
Rates that GSWC is authorized to charge are determined by the CPUC in general rate cases and are derived using rate base, cost of service and cost of capital, as projected for a future test year. Rates charged to customers vary according to customer class and rate jurisdiction and are generally set at levels allowing for recovery of prudently incurred costs, including a fair return on rate base. Rate base generally consists of the original cost of utility plant in service, plus certain other assets, such as working capital and inventory, less accumulated depreciation on utility plant in service, deferred income tax liabilities and certain other deductions.
GSWC is required to file a water general rate case application every three years according to a schedule established by the CPUC. General rate cases typically include an increase in the first test year with inflation-rate adjustments for expenses for the second and third years of the rate case cycle. For capital projects, there are two test years. Rates are based on a forecast of expenses and capital costs for each test year. Electric general rate cases are typically filed every four years.
Rates may also be increased by offsets for certain expense increases, including, but not limited to, supply-cost offset and balancing-account amortization, advice letter filings related to certain plant additions and other operating cost increases.
Neither the operations nor rates of AWR and ASUS are directly regulated by the CPUC. The CPUC does, however, regulate certain transactions between GSWC and ASUS and between GSWC and AWR.
Pending General Rate Case Filings
:
Water Segment:
In July 2017, GSWC filed a general rate case application for its water regions and the general office. The general rate case will determine new water rates for the years 2019 through 2021. On August 15, 2018, GSWC and the CPUC’s Public Advocates Office, formerly the Office of Ratepayer Advocates, filed a joint motion to adopt a settlement agreement between GSWC and the Public Advocates Office in connection with the general rate case. If approved by the CPUC, the settlement would resolve all of the issues in the general rate case application and authorize GSWC to invest approximately $334.5 million in capital infrastructure over the three-year rate cycle. The $334.5 million of infrastructure investment, as settled, includes $20.4 million of capital projects to be filed for revenue recovery through advice letters when those projects are completed.
Excluding the advice-letter-project revenues, the water gross margin for 2019 in the settlement filing is expected to increase by approximately $6.0 million as compared to the 2018 adopted water gross margin. The 2019 water revenue requirement, as settled, has been reduced to reflect a decrease of approximately $7.0 million in depreciation expense, compared to the adopted 2018 depreciation expense, due to a reduction in the overall composite depreciation rates based on a revised study filed in the general rate case. The decrease in depreciation expense lowers the water gross margin, and is offset by a corresponding decrease in depreciation expense, resulting in no impact to net earnings. In addition, the 2019 water revenue requirement, as settled, includes a decrease of approximately $2.2 million for excess deferred tax refunds as a result of the Tax Act, which has a corresponding decrease in income tax expense and also results in no impact to net earnings. Had depreciation expense, as settled, remained the same as the 2018 adopted amount and there was no excess deferred tax refund that lowered the 2019 revenue requirement, the water gross margin for 2019 would have increased by approximately $15.2 million. The settlement also allows for potential additional water revenue increases in 2020 and 2021 of approximately $10.0 million and $12.0 million, respectively, subject to the results of an earnings test and changes to the forecasted inflationary index values.
GSWC and the Public Advocates Office informed the assigned Administrative Law Judge ("ALJ”) that hearings would not be needed in light of the settlement agreement. Subsequently, the ALJ issued a ruling requesting additional information on
56
a number of items in the general rate case. GSWC has provided the additional information requested by the ALJ and believes it has satisfied all of the questions raised. Both the ALJ’s request and GSWC’s response are public information. GSWC is awaiting a proposed decision by the ALJ, which is expected during the first quarter of 2019, with a final decision by the CPUC expected later in 2019. When approved, the new rates will be retroactive to January 1, 2019.
Electric Segment:
In May 2017, GSWC filed its electric general rate case application with the CPUC to determine new electric rates for the years 2018 through 2021. In November 2018, GSWC and the Public Advocates Office filed a joint motion to adopt a settlement agreement between the two parties resolving all issues in connection with the general rate case. Among other things, the settlement incorporates a previous stipulation in the case, which authorizes a new return on equity for GSWC's electric segment of 9.60%, as compared to its previously authorized return of 9.95%. The stipulation also included a capital structure and debt cost similar to those approved by the CPUC in March 2018 in connection with GSWC's water segment cost of capital proceeding. Because of the delay in finalizing the electric general rate case, billed electric revenues in 2018 were based on 2017 adopted rates, pending a final decision by the CPUC in this rate case application. Had the new rates in the settlement agreement been approved by the CPUC prior to December 31, 2018, the electric segment’s gross margin would have increased by approximately $2.0 million, or $0.04 per share, for the year ended December 31, 2018. A decision in this case is expected in 2019 and when approved by the CPUC, the new rates will be retroactive to January 1, 2018. Accordingly, Registrant will record the 2018 increase to earnings in the period in which a CPUC decision is received.
Cost of Capital Proceeding for GSWC's Water Segment:
In March 2018, the CPUC issued a final decision in the cost of capital proceeding for GSWC and three other investor-owned water utilities that serve California. Among other things, the final decision adopts for GSWC (i) a return on equity of 8.90%, (ii) a cost of debt of 6.6%, (iii) a capital structure with 57% equity and 43% debt, (iv) a return on rate base of 7.91%, and (v) the continuation of the water cost of capital adjustment mechanism. GSWC’s prior authorized return on equity and equity ratio for its water segment were 9.43% and 55%, respectively, with a return on rate base of 8.34%. The newly authorized return on rate base of 7.91% reflects a true-up of GSWC’s embedded debt cost from 6.99% to 6.60%. The reduced debt costs contributed approximately 18 basis points to the 43-basis-point drop in the authorized return on rate base.
Tax Cuts and Jobs Act ("Tax Act"):
On December 22, 2017, the Tax Act was signed into federal law. The provisions of this major tax reform were generally effective January 1, 2018. The most significant provisions of the Tax Act impacting GSWC are the reduction of the federal corporate income tax rate from 35% to 21% and the elimination of bonus depreciation for regulated utilities. As a result, for the year ended December 31, 2018, the water-revenue requirement was reduced by approximately $12.5 million as compared to 2017 as a result of the Tax Act, which was largely offset by a decrease in income tax expense, resulting in no material impact to earnings. Pursuant to a CPUC directive, the 2018 impact of the Tax Act on the water adopted revenue requirement was tracked in a memorandum account effective January 1, 2018. On July 1, 2018, new lower water rates, which incorporate the new federal income tax rate, were implemented for all water ratemaking areas. As of
December 31, 2018
, GSWC had an over-collection of $7.1 million related to the water segment tracked and recorded as a regulatory liability.
The CPUC also ordered GSWC to update its pending electric general rate case filing, which will determine new electric rates for the years 2018 - 2021, to reflect the lower federal corporate income tax rate. For the year ended December 31, 2018, GSWC reduced electric revenues by approximately $1.2 million, which was also largely offset by a corresponding decrease in income tax expense, resulting in no material impact to earnings.
Other Regulatory Matters
Application to Transfer Electric Utility Operations to New Subsidiary
:
On December 14, 2018, GSWC filed an application with the CPUC to effectuate a reorganization plan that would transfer BVES from a division of GSWC to Bear Valley Electric Service, Inc. (“BVES Inc.”), a newly created separate legal entity and stand-alone subsidiary of AWR. Due to the differences in operations, regulations and risks, management believes a separate electric legal entity and stand-alone subsidiary of AWR is in the best interests of customers, employees, and the communities served. This reorganization plan is subject to CPUC approval and, if approved, is not expected to result in a substantive change to Registrant's operations and business segments. In February 2019, the City of Big Bear Lake filed a protest to the application, to which GSWC filed reply comments with the CPUC. The CPUC has not established a timeline for its review of the application.
For more information regarding significant regulatory matters, see Note 3 of “
Notes to Financial Statements
” included in Part II, Item 8, in Financial Statements and Supplementary Data.
57
Environmental Matters
AWR’s subsidiaries are subject to stringent environmental regulations, including the 1996 amendments to the Federal Safe Drinking Water Act. GSWC is required to comply with the safe drinking water standards established by the U.S. Environmental Protection Agency (“U.S. EPA”) and the Division of Drinking Water ("DDW"), under the State Water Resources Control Board ("SWRCB"). The U.S. EPA regulates contaminants that may have adverse health effects that are known or likely to occur at levels of public health concern, and the regulation of which will provide a meaningful opportunity for health risk reduction. The DDW, acting on behalf of the U.S. EPA, administers the U.S. EPA’s program in California. Similar state agencies administer these rules in the other states in which Registrant operates.
GSWC currently tests its water supplies and water systems according to, among other things, requirements listed in the Federal Safe Drinking Water Act (“SDWA”). GSWC works proactively with third parties and governmental agencies to address issues relating to known contamination threatening GSWC water sources. GSWC also incurs operating costs for testing to determine the levels, if any, of the constituents in its sources of supply and additional expense to treat contaminants in order to meet the federal and state maximum contaminant level standards and consumer demands. GSWC expects to incur additional capital costs as well as increased operating costs to maintain or improve the quality of water delivered to its customers in light of anticipated stress on water resources associated with watershed and aquifer pollution, as well as to meet future water quality standards and consumer expectations. The CPUC ratemaking process provides GSWC with the opportunity to recover prudently incurred capital and operating costs in future filings associated with achieving water quality standards. Management believes that such incurred and expected future costs should be authorized for recovery by the CPUC.
Matters Relating to Environmental Cleanup
GSWC has been involved in environmental remediation and cleanup at a plant site (“Chadron Plant”) that contained an underground storage tank that was used to store gasoline for its vehicles. This tank was removed from the ground in July 1990 along with the dispenser and ancillary piping. Since then, GSWC has been involved in various remediation activities at this site.
As of
December 31, 2018
, the total spent to cleanup and remediate GSWC’s plant facility was approximately
$5.9 million
, of which $1.5 million has been paid by the State of California Underground Storage Tank Fund. Amounts paid by GSWC have been included in rate base and approved by the CPUC for recovery. As of
December 31, 2018
, GSWC has a regulatory asset and an accrued liability for the estimated additional cost of $1.3 million to complete the cleanup at the site. The estimate includes costs for continued activities of groundwater cleanup and monitoring, future soil treatment, and site closure related activities. The ultimate cost may vary as there are many unknowns in remediation of underground gasoline spills and this is an estimate based on currently available information. Management also believes it is probable that the estimated additional costs will be approved for inclusion in rate base by the CPUC.
Lead Testing in Schools
In January 2017, California State Water Resources Control Board - Division of Drinking Water (DDW) issued a permit amendment that required all community water systems to test the schools in their service area for lead, if sampling is requested in writing by the institution’s officials. In addition, the Governor of California signed an assembly bill, which requires all community water systems that serve a school site of a local educational agency with a building constructed before January 1, 2010, to test for lead in the potable water system of the school site on or before July 1, 2019. GSWC has been working extensively with the schools in its service areas for the last several months. As a result of concerted outreach to the schools, GSWC has completed lead sampling at approximately 88 percent of the schools in its service area as of December 31, 2018, as compared to the State average of 35 percent. GSWC will continue to work with the remaining schools in its service area to meet the July 1, 2019 deadline. Management cannot predict if all schools will cooperate and complete the testing, and as a result cannot predict complete compliance with this regulation by the deadline.
Matters Relating to Military Privatization Contracts
Each of the Military Utility Privatization Subsidiaries is responsible for testing the water and wastewater systems on the military bases on which it operates in accordance with applicable law.
Each of the Military Utility Privatization Subsidiaries has the right to seek an equitable adjustment to its contract in the event that there are changes in environmental laws, a change in the quality of water used in providing water service or wastewater discharged by the U.S. government, or contamination of the air or soil not caused by the fault or negligence of the Military Utility Privatization Subsidiary. These changes can impact operations and maintenance and renewal and replacement costs under the contracts. The U.S. government is responsible for environmental contamination due to its fault or negligence and for environmental contamination that occurred prior to the execution of a contract.
58
Security Issues
GSWC has security systems and infrastructure in place intended to prevent unlawful intrusion, service disruption and cyber-attacks. GSWC utilizes a variety of physical security measures to protect its facilities. GSWC also considers advances in security and emergency preparedness technology and relevant industry developments in developing its capital-improvement plans. GSWC intends to seek approval of the CPUC to recover any additional costs that it incurs in enhancing the security, reliability and resiliency of its water and electric systems.
The Military Utility Privatization Subsidiaries operate facilities within the boundaries of military bases which provide limited access to the general public. To further enhance security, in prior years, certain upgrades were completed at various military bases through contract modifications funded by the U.S. government.
Registrant has evaluated its cyber-security systems and continues to address identified areas of improvement with respect to U.S. government regulations regarding cyber-security of government contractors. These improvements include the physical security at all of the office and employee facilities it operates. Registrant believes it is in compliance with these regulations.
Despite its efforts, Registrant cannot guarantee that intrusions, cyber-attacks or other attacks will not cause water or electric system problems, disrupt service to customers, compromise important data or systems, or result in unintended release of customer or employee information.
Drought Impact
In May 2018, the California Legislature passed two bills that provide a framework for long-term water-use efficiency standards and drought planning and resiliency. The initial steps in implementation of this legislation has been laid out in a summary document by the
California Department of Water Resources ("DWR") and State Water Resources Control Board ("
SWQCB"
). Over the next several years, State agencies, water suppliers and other entities will be working to meet the requirements and timelines of plan implementation. A notable milestone is the establishment of indoor water use standard of 55 gallons per capita per day (gpcd) until 2025 at which time the standard may be reduced to 52.5 gpcd or a new standard as recommend by DWR.
California's recent period of multi-year drought resulted in reduced recharge to the state's groundwater basins. GSWC utilizes groundwater from numerous groundwater basins throughout the state. Several of these basins, especially smaller basins, experienced lower groundwater levels because of the drought. Several of GSWC's service areas rely on groundwater as their only source of supply. Given the critical nature of the groundwater levels in California’s Central Coast area, GSWC implemented mandatory water restrictions in certain service areas, in accordance with CPUC procedures. In the event of water supply shortages beyond the locally available supply, GSWC would need to transport additional water from other areas, increasing the cost of water supply.
The 2017-2018 water year was a dry year, with rainfall in northern California being below normal levels. However, precipitation to date in 2019 has been at or above normal levels with statewide snowpack at above 100% of average.
As of February 19, 2019, the U.S. Drought Monitor estimated less than 2 percent of California in the rank of “Severe Drought” while approximately 4 percent continued in the rank of “Moderate Drought.” This is in comparison to February 20, 2018 when approximately 20 percent of the State was considered in a “Severe Drought” and 48 percent was considered in "Moderate Drought". If dry conditions return, the SWQCB or other regulatory agencies may impose emergency drought actions.
GSWC’s Water Supply
During
2018
, GSWC delivered approximately 63.3 million hundred cubic feet (“ccf”) of water to its customers, which is an average of about 398 acre-feet per day (an acre-foot is approximately 435.6 ccf or 326,000 gallons). Approximately 56% of GSWC's supply came from groundwater production wells situated throughout GSWC’s service areas. GSWC supplemented its groundwater production with wholesale purchases from Metropolitan Water District ("MWD") member agencies and regional water suppliers (roughly 41% of total demand) and with authorized diversions from rivers (roughly 3%) under contracts with the United States Bureau of Reclamation (“Bureau”) and the Sacramento Municipal Utility District (“SMUD”). GSWC also utilizes recycled water supplies to serve recycled water customers in several service areas. During
2017
, GSWC supplied 62.2 million ccf of water, approximately 55% of which was produced from groundwater sources and 45% was purchased from regional wholesalers and surface water diversions under contracts with the Bureau and SMUD. GSWC continually assesses its water rights and groundwater storage assets.
Groundwater
Over the years, population growth in GSWC’s service areas and increases in the amount of groundwater used have resulted in both cooperative and judicially enforced regimes for owning water rights and managing groundwater basins for
59
long-term sustainability. GSWC management actively participates in efforts to protect groundwater basins from over-use and from contamination and to protect its water rights. In some periods, these efforts require reductions in groundwater pumping and increased reliance on alternative water resources.
GSWC has a diverse water supply portfolio which includes approximately 73,400 acre-feet of adjudicated groundwater rights, surface water rights, and a number of unadjudicated water rights to help meet supply requirements. The productivity of GSWC’s groundwater resources varies from year to year depending upon a variety of factors, including the amount, duration, length and location of rainfall, the availability of imported replenishment water, the amount of water previously stored in groundwater basins, the amount and seasonality of water use by GSWC’s customers and others, evolving challenges to water quality, and a variety of legal limitations on use if a groundwater basin is, or may be, in an overdrafted condition.
On September 16, 2014, the Governor of California signed a package of three bills, which taken together are known as the “Sustainable Groundwater Management Act.” The purpose of the act is to provide local agencies with tools and authority to manage groundwater basins in a sustainable manner over the long term. Local “Groundwater Sustainability Agencies” are to be formed for each defined groundwater basin, and Groundwater Sustainability Plans must be completed for those basins by the year 2022 (by 2020 for those considered in critical overdraft). The act contains numerous provisions to protect existing water rights, and is not anticipated to infringe upon or otherwise alter existing surface water or groundwater rights under current law. GSWC intends to cooperate to the fullest extent allowed in the development of these Groundwater Sustainability Agencies and resulting Groundwater Sustainability Plans to protect its interests in proper management of these groundwater basins.
Metropolitan Water District /State Water Project
Water supplies available to the MWD through the State Water Project ("SWP") vary from year to year based on several factors. Historically, weather was the primary factor in determining annual deliveries. However, biological opinions issued in late 2007 have limited water diversions through the Sacramento/San Joaquin Delta (“Delta”) resulting in pumping restrictions on the SWP. Even with variable SWP deliveries, MWD has been able to provide sufficient quantities of water to satisfy the needs of its member agencies and their customers. Under its Integrated Resources Plan, MWD estimates that it can meet its member agencies’ demands over at least the next 20 years.
Every year, the California Department of Water Resources ("DWR") establishes the SWP allocation for water deliveries to the state water contractors. The SWP is a major source of water for the MWD. DWR generally establishes a percentage allocation of delivery requests based on a number of factors, including weather patterns, snow-pack levels, reservoir levels and biological diversion restrictions. In February 2019, DWR set an initial SWP delivery allocation at 35% of requests for the 2019 calendar year. This allocation will likely change depending on rain and snowfall received this winter.
Imported Water
GSWC also manages a portfolio of water supply arrangements with water wholesalers who may import water from outside the immediate service area. For example, GSWC has contracts with various governmental entities (principally MWD member agencies) and other parties to purchase water through a total of 61 connections for distribution to customers, in addition to numerous emergency connections. MWD is a public agency organized and managed to provide a supplemental, imported supply to its member public agencies. There are 26 such member agencies, consisting of 14 cities, 11 municipal water districts and one county water authority. GSWC has 45 connections to MWD’s water distribution facilities and those of member agencies. GSWC purchases MWD water through six separate member agencies aggregating 49,807 acre-feet annually. MWD’s principal source of water is the SWP and the Colorado River via the Colorado River Aqueduct.
GSWC has contracts to purchase water or water rights for an aggregate amount of
$4.4 million
as of
December 31, 2018
. Included in the
$4.4 million
is a remaining commitment of
$2.2 million
under an agreement with the City of Claremont (“the City”) to lease water rights that were ascribed to the City as part of the Six Basins adjudication. The initial term of the agreement expires in 2028. GSWC may exercise an option to renew this agreement for
10
additional years. The remaining
$2.2 million
is for commitments for purchased water with other third parties, which expire through 2038.
Military Utility Privatization Subsidiaries
The U.S. government is responsible for providing the source of supply for all water on each of the bases served by the Military Utility Privatization Subsidiaries at no cost to the Military Utility Privatization Subsidiaries. Once received from the U.S. government, ASUS is responsible for ensuring the continued compliance of the provided source of supply with all federal, state and local regulations.
New Accounting Pronouncements
Registrant is subject to newly issued requirements as well as changes in existing requirements issued by the Financial Accounting Standards Board. See
Note 1
of
Notes to Consolidated Financial Statements.
60
Item 7A. Quantitative and Qualitative Disclosures About Market Risk
Registrant is exposed to certain market risks, including fluctuations in interest rates, and commodity price risk primarily relating to changes in the market price of electricity. Market risk is the potential loss arising from adverse changes in prevailing market rates and prices.
Interest Rate Risk
A significant portion of Registrant’s capital structure is comprised of fixed-rate debt. Market risk related to our fixed-rate debt is deemed to be the potential increase in fair value resulting from a decrease in interest rates. At
December 31, 2018
, the fair value of Registrant’s long-term debt was
$387.9 million
. A hypothetical ten percent decrease in market interest rates would have resulted in a $14.4 million increase in the fair value of Registrant’s long-term debt.
At
December 31, 2018
, Registrant did not believe that its short-term debt was subject to interest-rate risk due to the fair market value being approximately equal to the carrying value.
Commodity/Derivative Risk
GSWC's electric division, BVES, is exposed to commodity price risk primarily relating to changes in the market price of electricity. To manage its exposure to energy price risk, BVES from time to time executes purchased power contracts that qualify as derivative instruments, requiring mark-to-market derivative accounting under the accounting guidance for derivatives. A derivative financial instrument or other contract derives its value from another investment or designated benchmark.
In December 2014, the CPUC approved an application, which allowed BVES to execute long-term purchased power contracts with energy providers, which became effective on January 1, 2015. BVES began taking power under these long-term contracts at a fixed cost over three- and five-year terms depending on the amount of power and period during which the power is purchased under the contracts.
The long-term contracts executed in December 2014 qualify for derivative accounting treatment. Among other things, the CPUC approval in December 2014 also authorized BVES to establish a regulatory memorandum account to offset the mark-to-market entries required by the accounting guidance. Accordingly, all unrealized gains and losses generated from these purchased power contracts are deferred on a monthly basis into a non-interest bearing regulatory memorandum account that tracks the changes in fair value of the derivative throughout the term of the contract. As a result, the unrealized gains and losses on these contracts do not impact GSWC’s earnings. The three-year term contract expired in 2017. The five-year term contract expires in November 2019. Registrant expects to enter into new purchased power contracts to replace the existing agreement once it expires. As of
December 31, 2018
, there was a
$311,000
unrealized loss in the memorandum account for the remaining purchased power contract as a result of a drop in energy prices since the execution of the contract.
Except as discussed above, Registrant has had no other derivative financial instruments, financial instruments with significant off-balance sheet risks or financial instruments with concentrations of credit risk.
61
Item 8. Financial Statements and Supplementary Data
|
American States Water Company
|
|
|
Golden State Water Company
|
|
62
Report of Independent Registered Public Accounting Firm
To the
Board of Directors and Shareholders of American States Water Company
Opinions on the Financial Statements and Internal Control over Financial Reporting
We have audited the accompanying consolidated
balance sheets and statements of capitalization of American States Water Company and its subsidiaries
(the “Company”) as of December 31, 2018
and 2017,
and the related consolidated statements of income, changes in common shareholders’ equity and cash flows
for each of the three years in the period ended December 31, 2018 including the related notes and the financial statement schedule listed in the index appearing under Item 15(a)(2)
(collectively referred to as the “consolidated financial statements”). We also have audited the Company's internal control over financial reporting as of December 31, 2018, based on criteria established in
Internal Control - Integrated Framework
(2013)
issued by the Committee of Sponsoring Organizations of the Treadway Commission (COSO).
In our opinion, the consolidated financial statements referred to above present fairly, in all material respects, the financial position of the Company as of December 31, 2018 and 2017,
and the results of its
operations and its
cash flows for each of the three years in the period ended December 31, 2018 in conformity with accounting principles generally accepted in the United States of America. Also in our opinion, the Company maintained, in all material respects, effective internal control over financial reporting as of December 31, 2018, based on criteria established in
Internal Control - Integrated Framework
(2013)
issued by the COSO.
Basis for Opinions
The Company's management is responsible for these consolidated financial statements, for maintaining effective internal control over financial reporting, and for its assessment of the effectiveness of internal control over financial reporting, included in Management's Report on Internal Control over Financial Reporting appearing under Item 9A. Our responsibility is to express opinions on the Company’s consolidated financial statements and on the Company's internal control over financial reporting based on our audits. We are a public accounting firm registered with the Public Company Accounting Oversight Board (United States) (PCAOB) and are required to be independent with respect to the Company in accordance with the U.S. federal securities laws and the applicable rules and regulations of the Securities and Exchange Commission and the PCAOB.
We conducted our audits in accordance with the standards of the PCAOB. Those standards require that we plan and perform the audits to obtain reasonable assurance about whether the
consolidated
financial statements are free of material misstatement, whether due to error or fraud, and whether effective internal control over financial reporting was maintained in all material respects.
Our audits of the consolidated financial statements included performing procedures to assess the risks of material misstatement of the consolidated financial statements, whether due to error or fraud, and performing procedures that respond to those risks. Such procedures included examining, on a test basis, evidence regarding the amounts and disclosures in the consolidated financial statements. Our audits also included evaluating the accounting principles used and significant estimates made by management, as well as evaluating the overall presentation of the consolidated financial statements. Our audit of internal control over financial reporting included obtaining an understanding of internal control over financial reporting, assessing the risk that a material weakness exists, and testing and evaluating the design and operating effectiveness of internal control based on the assessed risk. Our audits also included performing such other procedures as we considered necessary in the circumstances. We believe that our audits provide a reasonable basis for our opinions.
63
Definition and Limitations of Internal Control over Financial Reporting
A company’s internal control over financial reporting is a process designed to provide reasonable assurance regarding the reliability of financial reporting and the preparation of financial statements for external purposes in accordance with generally accepted accounting principles. A company’s internal control over financial reporting includes those policies and procedures that (i) pertain to the maintenance of records that, in reasonable detail, accurately and fairly reflect the transactions and dispositions of the assets of the company; (ii) provide reasonable assurance that transactions are recorded as necessary to permit preparation of financial statements in accordance with generally accepted accounting principles, and that receipts and expenditures of the company are being made only in accordance with authorizations of management and directors of the company; and (iii) provide reasonable assurance regarding prevention or timely detection of unauthorized acquisition, use, or disposition of the company’s assets that could have a material effect on the financial statements.
Because of its inherent limitations, internal control over financial reporting may not prevent or detect misstatements. Also, projections of any evaluation of effectiveness to future periods are subject to the risk that controls may become inadequate because of changes in conditions, or that the degree of compliance with the policies or procedures may deteriorate.
/s/PricewaterhouseCoopers LLP
Los Angeles, California
February 25, 2019
We have served as the Company’s auditor since 2002.
64
Report of Independent Registered Public Accounting Firm
To
the
Board of Directors and Shareholder of Golden State Water Company
Opinion on the Financial Statements
We have audited the accompanying balance sheets and statements of capitalization of Golden State Water Company as of December 31, 2018 and 2017, and the related statements of income, changes in common shareholder’s equity and cash flows for each of the three years in the period ended December 31, 2018, including the related notes (collectively referred to as the “financial statements”). In our opinion, the financial statements present fairly, in all material respects, the financial position of the Company
as of December 31, 2018
and 2017, and the results of its operations and its cash flows for each of the three years in the period ended December 31, 2018
in conformity with accounting principles generally accepted in the United States of America.
Basis for Opinion
These financial statements are the responsibility of the Company’s management. Our responsibility is to express an opinion on the Company’s financial statements based on our audits. We are a public accounting firm registered with the Public Company Accounting Oversight Board (United States) (PCAOB) and are required to be independent with respect to the Company in accordance with the U.S. federal securities laws and the applicable rules and regulations of the Securities and Exchange Commission and the PCAOB.
We conducted our audits of these financial statements in accordance with the standards of the PCAOB. Those standards require that we plan and perform the audit to obtain reasonable assurance about whether the financial statements are free of material misstatement, whether due to error or fraud. The Company is not required to have, nor were we engaged to perform, an audit of its internal control over financial reporting. As part of our audits we are required to obtain an understanding of internal control over financial reporting but not for the purpose of expressing an opinion on the effectiveness of the Company's internal control over financial reporting. Accordingly, we express no such opinion.
Our audits included performing procedures to assess the risks of material misstatement of the financial statements, whether due to error or fraud, and performing procedures that respond to those risks. Such procedures included examining, on a test basis, evidence regarding the amounts and disclosures in the financial statements. Our audits also included evaluating the accounting principles used and significant estimates made by management, as well as evaluating the overall presentation of the financial statements. We believe that our audits provide a reasonable basis for our opinion.
/s/PricewaterhouseCoopers LLP
Los Angeles, California
February 25, 2019
We have served as the Company's auditor since 2002.
65
|
|
December 31,
|
|||||||
|
(in thousands)
|
2018
|
2017
|
||||||
|
Assets
|
|
|
|
|
||||
|
Utility Plant
|
|
|
|
|
||||
|
Regulated utility plant, at cost:
|
|
|
|
|
||||
|
Water
|
$
|
1,649,535
|
|
$
|
1,559,209
|
|
||
|
Electric
|
106,064
|
|
99,726
|
|
||||
|
Total
|
1,755,599
|
|
1,658,935
|
|
||||
|
Non-regulated utility property, at cost
|
24,511
|
|
15,592
|
|
||||
|
Total utility plant, at cost
|
1,780,110
|
|
1,674,527
|
|
||||
|
Less — accumulated depreciation
|
(561,855
|
)
|
(533,370
|
)
|
||||
|
|
1,218,255
|
|
1,141,157
|
|
||||
|
Construction work in progress
|
78,055
|
|
63,835
|
|
||||
|
Net utility plant
|
1,296,310
|
|
1,204,992
|
|
||||
|
Other Property and Investments
|
|
|
|
|
||||
|
Goodwill
|
1,116
|
|
1,116
|
|
||||
|
Other property and investments
|
25,356
|
|
24,070
|
|
||||
|
Total other property and investments
|
26,472
|
|
25,186
|
|
||||
|
Current Assets
|
|
|
|
|
||||
|
Cash and cash equivalents
|
7,141
|
|
214
|
|
||||
|
Accounts receivable — customers, less allowance for doubtful accounts
|
23,395
|
|
26,127
|
|
||||
|
Unbilled revenue — receivable
|
23,588
|
|
26,411
|
|
||||
|
Receivable from U.S. government, less allowance for doubtful accounts
|
21,543
|
|
3,725
|
|
||||
|
Other accounts receivable, less allowance for doubtful accounts
|
3,103
|
|
8,251
|
|
||||
|
Income taxes receivable
|
2,164
|
|
4,737
|
|
||||
|
Materials and supplies
|
5,775
|
|
4,795
|
|
||||
|
Regulatory assets — current
|
16,527
|
|
34,220
|
|
||||
|
Prepayments and other current assets
|
6,063
|
|
5,596
|
|
||||
|
Contract assets (Note 2)
|
22,169
|
|
—
|
|
||||
|
Costs and estimated earnings in excess of billings on contracts (Note 2)
|
—
|
|
41,387
|
|
||||
|
Total current assets
|
131,468
|
|
155,463
|
|
||||
|
Other Assets
|
|
|
|
|
||||
|
Receivable from the U.S. government (Note 2)
|
39,583
|
|
—
|
|
||||
|
Contract assets (Note 2)
|
2,278
|
|
—
|
|
||||
|
Costs and estimated earnings in excess of billings on contracts (Note 2)
|
—
|
|
25,426
|
|
||||
|
Other
|
5,322
|
|
5,667
|
|
||||
|
Total other assets
|
47,183
|
|
31,093
|
|
||||
|
Total Assets
|
$
|
1,501,433
|
|
$
|
1,416,734
|
|
||
The accompanying notes are an integral part of these consolidated financial statements.
66
|
|
December 31,
|
|||||||
|
(in thousands)
|
2018
|
2017
|
||||||
|
Capitalization and Liabilities
|
|
|
|
|
||||
|
Capitalization
|
|
|
|
|
||||
|
Common shareholders’ equity
|
$
|
558,223
|
|
$
|
529,945
|
|
||
|
Long-term debt
|
281,087
|
|
321,039
|
|
||||
|
Total capitalization
|
839,310
|
|
850,984
|
|
||||
|
Current Liabilities
|
|
|
|
|
||||
|
Notes payable to banks
|
—
|
|
59,000
|
|
||||
|
Long-term debt — current
|
40,320
|
|
324
|
|
||||
|
Accounts payable
|
59,532
|
|
50,978
|
|
||||
|
Income taxes payable
|
360
|
|
225
|
|
||||
|
Accrued other taxes
|
10,094
|
|
7,344
|
|
||||
|
Accrued employee expenses
|
13,842
|
|
12,969
|
|
||||
|
Accrued interest
|
3,865
|
|
3,861
|
|
||||
|
Unrealized loss on purchased power contracts
|
311
|
|
2,941
|
|
||||
|
Contract liabilities (Note 2)
|
7,530
|
|
3,911
|
|
||||
|
Other
|
10,731
|
|
15,109
|
|
||||
|
Total current liabilities
|
146,585
|
|
156,662
|
|
||||
|
Other Credits
|
|
|
|
|
||||
|
Notes payable to banks
|
95,500
|
|
—
|
|
||||
|
Advances for construction
|
66,305
|
|
67,465
|
|
||||
|
Contributions in aid of construction — net
|
124,385
|
|
123,602
|
|
||||
|
Deferred income taxes
|
114,216
|
|
115,703
|
|
||||
|
Regulatory liabilities
|
44,867
|
|
32,178
|
|
||||
|
Unamortized investment tax credits
|
1,367
|
|
1,436
|
|
||||
|
Accrued pension and other post-retirement benefits
|
57,636
|
|
57,695
|
|
||||
|
Other
|
11,262
|
|
11,009
|
|
||||
|
Total other credits
|
515,538
|
|
409,088
|
|
||||
|
Commitments and Contingencies (Notes 14 and 15)
|
—
|
|
—
|
|
||||
|
Total Capitalization and Liabilities
|
$
|
1,501,433
|
|
$
|
1,416,734
|
|
||
The accompanying notes are an integral part of these consolidated financial statements.
67
|
|
December 31,
|
|||||||
|
(in thousands, except share data)
|
2018
|
2017
|
||||||
|
Common Shareholders’ Equity:
|
|
|
|
|
||||
|
Common Shares, no par value:
|
|
|
|
|
||||
|
Authorized: 60,000,000 shares
|
|
|
|
|
||||
|
Outstanding: 36,757,842 shares in 2018 and 36,680,794 shares in 2017
|
$
|
253,689
|
|
$
|
250,124
|
|
||
|
Reinvested earnings in the business
|
304,534
|
|
279,821
|
|
||||
|
|
558,223
|
|
529,945
|
|
||||
|
Long-Term Debt (All are of GSWC)
|
|
|
|
|
||||
|
Notes/Debentures:
|
|
|
|
|
||||
|
6.81% notes due 2028
|
15,000
|
|
15,000
|
|
||||
|
6.59% notes due 2029
|
40,000
|
|
40,000
|
|
||||
|
7.875% notes due 2030
|
20,000
|
|
20,000
|
|
||||
|
7.23% notes due 2031
|
50,000
|
|
50,000
|
|
||||
|
6.00% notes due 2041
|
62,000
|
|
62,000
|
|
||||
|
Private Placement Notes:
|
|
|
|
|
||||
|
3.45% notes due 2029
|
15,000
|
|
15,000
|
|
||||
|
9.56% notes due 2031
|
28,000
|
|
28,000
|
|
||||
|
5.87% notes due 2028
|
40,000
|
|
40,000
|
|
||||
|
6.70% notes due 2019
|
40,000
|
|
40,000
|
|
||||
|
Tax-Exempt Obligations:
|
|
|
|
|
||||
|
5.50% notes due 2026
|
7,730
|
|
7,730
|
|
||||
|
State Water Project due 2035
|
3,667
|
|
3,772
|
|
||||
|
Other Debt Instruments:
|
|
|
|
|
||||
|
Variable Rate Obligation due 2018
|
—
|
|
18
|
|
||||
|
American Recovery and Reinvestment Act Obligation due 2033
|
3,581
|
|
3,745
|
|
||||
|
|
324,978
|
|
325,265
|
|
||||
|
Less: Current maturities
|
(40,320
|
)
|
(324
|
)
|
||||
|
Debt issuance costs
|
(3,571
|
)
|
(3,902
|
)
|
||||
|
|
281,087
|
|
321,039
|
|
||||
|
Total Capitalization
|
$
|
839,310
|
|
$
|
850,984
|
|
||
The accompanying notes are an integral part of these consolidated financial statements.
68
|
|
For the years ended December 31,
|
|||||||||||
|
(in thousands, except per share amounts)
|
2018
|
2017
|
2016
|
|||||||||
|
Operating Revenues
|
|
|
|
|
|
|
||||||
|
Water
|
$
|
295,258
|
|
$
|
306,332
|
|
$
|
302,931
|
|
|||
|
Electric
|
34,350
|
|
33,969
|
|
35,771
|
|
||||||
|
Contracted services
|
107,208
|
|
100,302
|
|
97,385
|
|
||||||
|
Total operating revenues
|
436,816
|
|
440,603
|
|
436,087
|
|
||||||
|
Operating Expenses
|
|
|
|
|
|
|
||||||
|
Water purchased
|
68,904
|
|
68,302
|
|
64,442
|
|
||||||
|
Power purchased for pumping
|
8,971
|
|
8,518
|
|
8,663
|
|
||||||
|
Groundwater production assessment
|
19,440
|
|
18,638
|
|
14,993
|
|
||||||
|
Power purchased for resale
|
11,590
|
|
10,720
|
|
10,387
|
|
||||||
|
Supply cost balancing accounts
|
(15,649
|
)
|
(17,939
|
)
|
(12,206
|
)
|
||||||
|
Other operation
|
31,650
|
|
29,994
|
|
28,257
|
|
||||||
|
Administrative and general
|
82,595
|
|
81,643
|
|
81,518
|
|
||||||
|
Depreciation and amortization
|
40,425
|
|
39,031
|
|
38,850
|
|
||||||
|
Maintenance
|
15,682
|
|
15,176
|
|
16,470
|
|
||||||
|
Property and other taxes
|
18,404
|
|
17,905
|
|
16,801
|
|
||||||
|
ASUS construction
|
53,906
|
|
49,838
|
|
53,720
|
|
||||||
|
Gain on sale of assets
|
(85
|
)
|
(8,318
|
)
|
—
|
|
||||||
|
Total operating expenses
|
335,833
|
|
313,508
|
|
321,895
|
|
||||||
|
Operating Income
|
100,983
|
|
127,095
|
|
114,192
|
|
||||||
|
Other Income and Expenses
|
|
|
|
|
|
|
||||||
|
Interest expense
|
(23,433
|
)
|
(22,582
|
)
|
(21,992
|
)
|
||||||
|
Interest income
|
3,578
|
|
1,790
|
|
757
|
|
||||||
|
Other, net
|
760
|
|
2,038
|
|
1,521
|
|
||||||
|
Total other income and expenses
|
(19,095
|
)
|
(18,754
|
)
|
(19,714
|
)
|
||||||
|
Income before income tax expense
|
81,888
|
|
108,341
|
|
94,478
|
|
||||||
|
Income tax expense
|
18,017
|
|
38,974
|
|
34,735
|
|
||||||
|
Net Income
|
$
|
63,871
|
|
$
|
69,367
|
|
$
|
59,743
|
|
|||
|
Weighted Average Number of Shares Outstanding
|
36,733
|
|
36,638
|
|
36,552
|
|
||||||
|
Basic Earnings Per Common Share
|
$
|
1.73
|
|
$
|
1.88
|
|
$
|
1.63
|
|
|||
|
Weighted Average Number of Diluted Shares
|
36,936
|
|
36,844
|
|
36,750
|
|
||||||
|
Fully Diluted Earnings Per Share
|
$
|
1.72
|
|
$
|
1.88
|
|
$
|
1.62
|
|
|||
|
Dividends Paid Per Common Share
|
$
|
1.060
|
|
$
|
0.994
|
|
$
|
0.914
|
|
|||
The accompanying notes are an integral part of these consolidated financial statements.
69
AMERICAN STATES WATER COMPANY
CONSOLIDATED STATEMENTS OF CHANGES
IN COMMON SHAREHOLDERS’ EQUITY
|
|
Common Shares
|
Reinvested
|
|
||||||||||||
|
|
Number
|
|
Earnings
|
|
|||||||||||
|
|
of
|
|
in the
|
|
|||||||||||
|
(in thousands)
|
Shares
|
Amount
|
Business
|
Total
|
|||||||||||
|
Balances at December 31, 2015
|
36,502
|
|
$
|
245,022
|
|
$
|
220,923
|
|
$
|
465,945
|
|
||||
|
Add:
|
|
|
|
|
|
|
|
|
|||||||
|
Net income
|
|
|
|
|
59,743
|
|
59,743
|
|
|||||||
|
Exercise of stock options and other issuance of Common Shares
|
69
|
|
235
|
|
|
|
235
|
|
|||||||
|
Tax benefit from employee stock-based awards
|
|
|
581
|
|
|
|
581
|
|
|||||||
|
Compensation on stock-based awards
|
|
|
1,201
|
|
|
|
1,201
|
|
|||||||
|
Dividend equivalent rights on stock-based awards not paid in cash
|
|
|
193
|
|
|
|
193
|
|
|||||||
|
Deduct:
|
|
|
|
|
|
|
|
|
|||||||
|
Dividends on Common Shares
|
|
|
|
|
33,408
|
|
33,408
|
|
|||||||
|
Dividend equivalent rights on stock-based awards not paid in cash
|
|
|
|
|
193
|
|
193
|
|
|||||||
|
Balances at December 31, 2016
|
36,571
|
|
247,232
|
|
247,065
|
|
494,297
|
|
|||||||
|
Add:
|
|
|
|
|
|
|
|
|
|||||||
|
Net income
|
69,367
|
|
69,367
|
|
|||||||||||
|
Exercise of stock options and other issuance of Common Shares
|
110
|
|
909
|
|
909
|
|
|||||||||
|
Compensation on stock-based awards
|
1,789
|
|
1,789
|
|
|||||||||||
|
Dividend equivalent rights on stock-based awards not paid in cash
|
194
|
|
194
|
|
|||||||||||
|
Deduct:
|
|
||||||||||||||
|
Dividends on Common Shares
|
36,417
|
|
36,417
|
|
|||||||||||
|
Dividend equivalent rights on stock-based awards not paid in cash
|
194
|
|
194
|
|
|||||||||||
|
Balances at December 31, 2017
|
36,681
|
|
250,124
|
|
279,821
|
|
529,945
|
|
|||||||
|
Add:
|
|||||||||||||||
|
Net income
|
|
|
|
|
63,871
|
|
63,871
|
|
|||||||
|
Exercise of stock options and other issuance of Common Shares
|
77
|
|
546
|
|
|
|
546
|
|
|||||||
|
Compensation on stock-based awards
|
|
|
2,798
|
|
|
|
2,798
|
|
|||||||
|
Dividend equivalent rights on stock-based awards not paid in cash
|
|
|
221
|
|
|
|
221
|
|
|||||||
|
Deduct:
|
|
|
|
|
|
|
|
|
|||||||
|
Dividends on Common Shares
|
|
|
|
|
38,937
|
|
38,937
|
|
|||||||
|
Dividend equivalent rights on stock-based awards not paid in cash
|
|
|
|
|
221
|
|
221
|
|
|||||||
|
Balances at December 31, 2018
|
36,758
|
|
$
|
253,689
|
|
$
|
304,534
|
|
$
|
558,223
|
|
||||
The accompanying notes are an integral part of these consolidated financial statements.
70
|
|
For the years ended December 31,
|
|||||||||||
|
(in thousands)
|
2018
|
2017
|
2016
|
|||||||||
|
Cash Flows From Operating Activities:
|
|
|
|
|
|
|
||||||
|
Net income
|
$
|
63,871
|
|
$
|
69,367
|
|
$
|
59,743
|
|
|||
|
Adjustments to reconcile net income to net cash provided by operating activities:
|
|
|
|
|
|
|
||||||
|
Depreciation and amortization
|
40,663
|
|
39,273
|
|
39,109
|
|
||||||
|
Provision for doubtful accounts
|
841
|
|
989
|
|
619
|
|
||||||
|
Deferred income taxes and investment tax credits
|
(5,773
|
)
|
12,153
|
|
27,640
|
|
||||||
|
Stock-based compensation expense
|
3,851
|
|
2,885
|
|
2,538
|
|
||||||
|
Gain on sale of assets
|
(85
|
)
|
(8,318
|
)
|
—
|
|
||||||
|
Other — net
|
655
|
|
(1,525
|
)
|
(397
|
)
|
||||||
|
Changes in assets and liabilities:
|
|
|
|
|
|
|
||||||
|
Accounts receivable — customers
|
1,882
|
|
(7,671
|
)
|
(1,750
|
)
|
||||||
|
Unbilled revenue — receivable
|
2,823
|
|
(2,020
|
)
|
(4,901
|
)
|
||||||
|
Other accounts receivable
|
5,151
|
|
(1,671
|
)
|
(1,233
|
)
|
||||||
|
Receivables from the U.S. government
|
(20,976
|
)
|
4,742
|
|
(2,606
|
)
|
||||||
|
Materials and supplies
|
(980
|
)
|
(501
|
)
|
1,121
|
|
||||||
|
Prepayments and other assets
|
(519
|
)
|
(1,641
|
)
|
2,239
|
|
||||||
|
Contract assets
|
5,941
|
|
—
|
|
—
|
|
||||||
|
Costs and estimated earnings in excess of billings on contracts
|
—
|
|
(2,881
|
)
|
(10,433
|
)
|
||||||
|
Regulatory assets/liabilities
|
33,834
|
|
24,626
|
|
(5,610
|
)
|
||||||
|
Accounts payable
|
1,282
|
|
4,358
|
|
(3,442
|
)
|
||||||
|
Income taxes receivable/payable
|
2,708
|
|
13,206
|
|
(6,993
|
)
|
||||||
|
Contract liabilities / Billings in excess of costs and estimated earnings on contracts
|
3,619
|
|
1,648
|
|
(1,501
|
)
|
||||||
|
Accrued pension and other post-retirement benefits
|
(1,086
|
)
|
(878
|
)
|
(289
|
)
|
||||||
|
Other liabilities
|
(928
|
)
|
(1,589
|
)
|
3,095
|
|
||||||
|
Net cash provided
|
136,774
|
|
144,552
|
|
96,949
|
|
||||||
|
Cash Flows From Investing Activities:
|
|
|
|
|
|
|
||||||
|
Capital expenditures
|
(126,561
|
)
|
(113,126
|
)
|
(129,867
|
)
|
||||||
|
Proceeds from sale of assets
|
72
|
|
34,324
|
|
—
|
|
||||||
|
Other investments
|
(1,553
|
)
|
(1,229
|
)
|
(1,354
|
)
|
||||||
|
Net cash used
|
(128,042
|
)
|
(80,031
|
)
|
(131,221
|
)
|
||||||
|
Cash Flows From Financing Activities:
|
|
|
|
|
|
|
||||||
|
Proceeds from stock option exercises
|
546
|
|
909
|
|
235
|
|
||||||
|
Tax benefits from stock-based awards
|
—
|
|
—
|
|
581
|
|
||||||
|
Receipt of advances for and contributions in aid of construction
|
5,551
|
|
7,275
|
|
6,660
|
|
||||||
|
Refunds on advances for construction
|
(3,886
|
)
|
(3,889
|
)
|
(3,921
|
)
|
||||||
|
Retirement or repayments of long-term debt
|
(326
|
)
|
(329
|
)
|
(313
|
)
|
||||||
|
Net change in notes payable to banks
|
36,500
|
|
(31,000
|
)
|
62,000
|
|
||||||
|
Dividends paid
|
(38,937
|
)
|
(36,417
|
)
|
(33,408
|
)
|
||||||
|
Other
|
(1,253
|
)
|
(1,292
|
)
|
(1,490
|
)
|
||||||
|
Net cash (used) provided
|
(1,805
|
)
|
(64,743
|
)
|
30,344
|
|
||||||
|
Net change in cash and cash equivalents
|
6,927
|
|
(222
|
)
|
(3,928
|
)
|
||||||
|
Cash and cash equivalents, beginning of year
|
214
|
|
436
|
|
4,364
|
|
||||||
|
Cash and cash equivalents, end of year
|
$
|
7,141
|
|
$
|
214
|
|
$
|
436
|
|
|||
The accompanying notes are an integral part of these consolidated financial statements.
71
|
|
December 31,
|
|||||||
|
(in thousands)
|
2018
|
2017
|
||||||
|
Assets
|
|
|
|
|
||||
|
Utility Plant, at cost
|
|
|
|
|
||||
|
Water
|
$
|
1,649,535
|
|
$
|
1,559,209
|
|
||
|
Electric
|
106,064
|
|
99,726
|
|
||||
|
Total
|
1,755,599
|
|
1,658,935
|
|
||||
|
Less — accumulated depreciation
|
(551,244
|
)
|
(524,481
|
)
|
||||
|
|
1,204,355
|
|
1,134,454
|
|
||||
|
Construction work in progress
|
76,737
|
|
63,486
|
|
||||
|
Net utility plant
|
1,281,092
|
|
1,197,940
|
|
||||
|
Other Property and Investments
|
23,263
|
|
21,956
|
|
||||
|
|
23,263
|
|
21,956
|
|
||||
|
Current Assets
|
|
|
|
|
||||
|
Cash and cash equivalents
|
4,187
|
|
214
|
|
||||
|
Accounts receivable — customers, less allowance for doubtful accounts
|
23,395
|
|
26,127
|
|
||||
|
Unbilled revenue — receivable
|
17,892
|
|
18,852
|
|
||||
|
Other accounts receivable, less allowance for doubtful accounts
|
1,959
|
|
6,105
|
|
||||
|
Income taxes receivable from Parent
|
5,617
|
|
6,590
|
|
||||
|
Materials and supplies
|
4,797
|
|
4,046
|
|
||||
|
Regulatory assets — current
|
16,527
|
|
34,220
|
|
||||
|
Prepayments and other current assets
|
5,275
|
|
5,090
|
|
||||
|
Total current assets
|
79,649
|
|
101,244
|
|
||||
|
Other Assets
|
|
|
|
|
||||
|
Other
|
5,218
|
|
5,683
|
|
||||
|
Total other assets
|
5,218
|
|
5,683
|
|
||||
|
Total Assets
|
$
|
1,389,222
|
|
$
|
1,326,823
|
|
||
The accompanying notes are an integral part of these financial statements.
72
|
|
December 31,
|
|||||||
|
(in thousands)
|
2018
|
2017
|
||||||
|
Capitalization and Liabilities
|
|
|
|
|
||||
|
Capitalization
|
|
|
|
|
||||
|
Common shareholder’s equity
|
$
|
503,575
|
|
$
|
474,374
|
|
||
|
Long-term debt
|
281,087
|
|
321,039
|
|
||||
|
Total capitalization
|
784,662
|
|
795,413
|
|
||||
|
Current Liabilities
|
|
|
|
|
||||
|
Intercompany payable to Parent
|
—
|
|
34,836
|
|
||||
|
Long-term debt — current
|
40,320
|
|
324
|
|
||||
|
Accounts payable
|
47,865
|
|
42,497
|
|
||||
|
Accrued other taxes
|
9,911
|
|
7,108
|
|
||||
|
Accrued employee expenses
|
11,910
|
|
11,338
|
|
||||
|
Accrued interest
|
3,550
|
|
3,585
|
|
||||
|
Unrealized loss on purchased power contracts
|
311
|
|
2,941
|
|
||||
|
Other
|
9,432
|
|
14,705
|
|
||||
|
Total current liabilities
|
123,299
|
|
117,334
|
|
||||
|
Other Credits
|
|
|
|
|
||||
|
Intercompany payable to Parent
|
57,289
|
|
—
|
|
||||
|
Advances for construction
|
66,305
|
|
67,465
|
|
||||
|
Contributions in aid of construction — net
|
124,385
|
|
123,602
|
|
||||
|
Deferred income taxes
|
118,241
|
|
120,780
|
|
||||
|
Regulatory liabilities
|
44,867
|
|
32,178
|
|
||||
|
Unamortized investment tax credits
|
1,367
|
|
1,436
|
|
||||
|
Accrued pension and other post-retirement benefits
|
57,636
|
|
57,695
|
|
||||
|
Other
|
11,171
|
|
10,920
|
|
||||
|
Total other credits
|
481,261
|
|
414,076
|
|
||||
|
Commitments and Contingencies (Notes 14 and 15)
|
||||||||
|
Total Capitalization and Liabilities
|
$
|
1,389,222
|
|
$
|
1,326,823
|
|
||
The accompanying notes are an integral part of these financial statements.
73
|
|
December 31,
|
|||||||
|
(in thousands, except share data)
|
2018
|
2017
|
||||||
|
Common Shareholder’s Equity:
|
|
|
|
|
||||
|
Common Shares, no par value:
Authorized: 1,000 shares
Outstanding: 165 shares in 2018 and 146 shares in 2017
|
$
|
292,412
|
|
$
|
242,181
|
|
||
|
Reinvested earnings in the business
|
211,163
|
|
232,193
|
|
||||
|
|
503,575
|
|
474,374
|
|
||||
|
Long-Term Debt
|
|
|
|
|
||||
|
Notes/Debentures:
|
|
|
|
|
||||
|
6.81% notes due 2028
|
15,000
|
|
15,000
|
|
||||
|
6.59% notes due 2029
|
40,000
|
|
40,000
|
|
||||
|
7.875% notes due 2030
|
20,000
|
|
20,000
|
|
||||
|
7.23% notes due 2031
|
50,000
|
|
50,000
|
|
||||
|
6.00% notes due 2041
|
62,000
|
|
62,000
|
|
||||
|
Private Placement Notes:
|
|
|
|
|
||||
|
3.45% notes due 2029
|
15,000
|
|
15,000
|
|
||||
|
9.56% notes due 2031
|
28,000
|
|
28,000
|
|
||||
|
5.87% notes due 2028
|
40,000
|
|
40,000
|
|
||||
|
6.70% notes due 2019
|
40,000
|
|
40,000
|
|
||||
|
Tax-Exempt Obligations:
|
|
|
|
|
||||
|
5.50% notes due 2026
|
7,730
|
|
7,730
|
|
||||
|
State Water Project due 2035
|
3,667
|
|
3,772
|
|
||||
|
Other Debt Instruments:
|
|
|
|
|
||||
|
Variable rate obligation due 2018
|
—
|
|
18
|
|
||||
|
American Recovery and Reinvestment Act Obligation due 2033
|
3,581
|
|
3,745
|
|
||||
|
|
324,978
|
|
325,265
|
|
||||
|
Less: Current maturities
|
(40,320
|
)
|
(324
|
)
|
||||
|
Debt issuance costs
|
(3,571
|
)
|
(3,902
|
)
|
||||
|
|
281,087
|
|
321,039
|
|
||||
|
Total Capitalization
|
$
|
784,662
|
|
$
|
795,413
|
|
||
The accompanying notes are an integral part of these financial statements.
74
|
|
For the years ended December 31,
|
|||||||||||
|
(in thousands)
|
2018
|
2017
|
2016
|
|||||||||
|
Operating Revenues
|
|
|
|
|
|
|
||||||
|
Water
|
$
|
295,258
|
|
$
|
306,332
|
|
$
|
302,931
|
|
|||
|
Electric
|
34,350
|
|
33,969
|
|
35,771
|
|
||||||
|
Total operating revenues
|
329,608
|
|
340,301
|
|
338,702
|
|
||||||
|
Operating Expenses
|
|
|
|
|
|
|
||||||
|
Water purchased
|
68,904
|
|
68,302
|
|
64,442
|
|
||||||
|
Power purchased for pumping
|
8,971
|
|
8,518
|
|
8,663
|
|
||||||
|
Groundwater production assessment
|
19,440
|
|
18,638
|
|
14,993
|
|
||||||
|
Power purchased for resale
|
11,590
|
|
10,720
|
|
10,387
|
|
||||||
|
Supply cost balancing accounts
|
(15,649
|
)
|
(17,939
|
)
|
(12,206
|
)
|
||||||
|
Other operation
|
25,334
|
|
24,877
|
|
24,771
|
|
||||||
|
Administrative and general
|
62,156
|
|
62,408
|
|
64,698
|
|
||||||
|
Depreciation and amortization
|
38,395
|
|
37,852
|
|
37,804
|
|
||||||
|
Maintenance
|
13,104
|
|
12,970
|
|
14,519
|
|
||||||
|
Property and other taxes
|
16,809
|
|
16,402
|
|
15,444
|
|
||||||
|
Gain on sale of assets
|
(8
|
)
|
(8,318
|
)
|
—
|
|
||||||
|
Total operating expenses
|
249,046
|
|
234,430
|
|
243,515
|
|
||||||
|
Operating Income
|
80,562
|
|
105,871
|
|
95,187
|
|
||||||
|
Other Income and Expenses
|
|
|
|
|
|
|
||||||
|
Interest expense
|
(22,621
|
)
|
(22,055
|
)
|
(21,782
|
)
|
||||||
|
Interest income
|
2,890
|
|
1,766
|
|
749
|
|
||||||
|
Other, net
|
784
|
|
2,234
|
|
1,424
|
|
||||||
|
Total other income and expenses
|
(18,947
|
)
|
(18,055
|
)
|
(19,609
|
)
|
||||||
|
Income from operations before income tax expense
|
61,615
|
|
87,816
|
|
75,578
|
|
||||||
|
Income tax expense
|
13,603
|
|
34,059
|
|
28,609
|
|
||||||
|
Net Income
|
$
|
48,012
|
|
$
|
53,757
|
|
$
|
46,969
|
|
|||
The accompanying notes are an integral part of these financial statements.
75
|
|
Common Shares
|
Reinvested
|
|
||||||||||||
|
|
Number
|
|
Earnings
|
|
|||||||||||
|
|
of
|
|
in the
|
|
|||||||||||
|
(in thousands, except number of shares)
|
Shares
|
Amount
|
Business
|
Total
|
|||||||||||
|
Balances at December 31, 2015
|
146
|
|
$
|
238,795
|
|
$
|
184,935
|
|
$
|
423,730
|
|
||||
|
Add:
|
|
|
|
|
|
|
|
|
|||||||
|
Net income
|
|
|
|
|
46,969
|
|
46,969
|
|
|||||||
|
Tax benefit from employee stock-based awards
|
|
|
501
|
|
|
|
501
|
|
|||||||
|
Compensation on stock-based awards
|
|
|
1,020
|
|
|
|
1,020
|
|
|||||||
|
Dividend equivalent rights on stock-based awards not paid in cash
|
|
|
166
|
|
|
|
166
|
|
|||||||
|
Deduct:
|
|
|
|
|
|
|
|
|
|||||||
|
Dividends on Common Shares
|
|
|
|
|
25,450
|
|
25,450
|
|
|||||||
|
Dividend equivalent rights on stock-based awards not paid in cash
|
|
|
|
|
166
|
|
166
|
|
|||||||
|
Balances at December 31, 2016
|
146
|
|
240,482
|
|
206,288
|
|
446,770
|
|
|||||||
|
Add:
|
|
|
|
|
|
|
|
|
|||||||
|
Net income
|
|
|
|
|
53,757
|
|
53,757
|
|
|||||||
|
Compensation on stock-based awards
|
|
|
1,527
|
|
|
|
1,527
|
|
|||||||
|
Dividend equivalent rights on stock-based awards not paid in cash
|
|
|
172
|
|
|
|
172
|
|
|||||||
|
Deduct:
|
|
|
|
|
|
|
|
|
|||||||
|
Dividends on Common Shares
|
|
|
|
|
27,680
|
|
27,680
|
|
|||||||
|
Dividend equivalent rights on stock-based awards not paid in cash
|
|
|
|
|
172
|
|
172
|
|
|||||||
|
Balances at December 31, 2017
|
146
|
|
242,181
|
|
232,193
|
|
474,374
|
|
|||||||
|
Add:
|
|
|
|
|
|
|
|
|
|||||||
|
Net income
|
|
|
48,012
|
|
48,012
|
|
|||||||||
|
Issuance of Common Shares to Parent
|
19
|
|
47,500
|
|
47,500
|
|
|||||||||
|
Compensation on stock-based awards
|
|
|
2,539
|
|
2,539
|
|
|||||||||
|
Dividend equivalent rights on stock-based awards not paid in cash
|
|
|
192
|
|
192
|
|
|||||||||
|
Deduct:
|
|
|
|
|
|||||||||||
|
Dividends on Common Shares
|
|
|
68,850
|
|
68,850
|
|
|||||||||
|
Dividend equivalent rights on stock-based awards not paid in cash
|
|
|
192
|
|
192
|
|
|||||||||
|
Balances at December 31, 2018
|
165
|
|
$
|
292,412
|
|
$
|
211,163
|
|
$
|
503,575
|
|
||||
The accompanying notes are an integral part of these financial statements.
76
|
|
For the years ended December 31,
|
|||||||||||
|
(in thousands)
|
2018
|
2017
|
2016
|
|||||||||
|
Cash Flows From Operating Activities:
|
|
|
|
|
|
|
||||||
|
Net income
|
$
|
48,012
|
|
$
|
53,757
|
|
$
|
46,969
|
|
|||
|
Adjustments to reconcile net income to net cash provided by operating activities:
|
|
|
|
|
|
|
||||||
|
Depreciation and amortization
|
38,633
|
|
38,094
|
|
38,063
|
|
||||||
|
Provision for doubtful accounts
|
850
|
|
816
|
|
627
|
|
||||||
|
Deferred income taxes and investment tax credits
|
(6,817
|
)
|
13,970
|
|
28,099
|
|
||||||
|
Stock-based compensation expense
|
3,397
|
|
2,420
|
|
2,118
|
|
||||||
|
Gain on sale of assets
|
(8
|
)
|
(8,318
|
)
|
—
|
|
||||||
|
Other — net
|
585
|
|
(1,613
|
)
|
(352
|
)
|
||||||
|
Changes in assets and liabilities:
|
|
|
|
|
|
|
||||||
|
Accounts receivable — customers
|
1,882
|
|
(7,671
|
)
|
(1,750
|
)
|
||||||
|
Unbilled revenue — receivable
|
960
|
|
(1,152
|
)
|
481
|
|
||||||
|
Other accounts receivable
|
4,140
|
|
(544
|
)
|
(896
|
)
|
||||||
|
Materials and supplies
|
(751
|
)
|
(322
|
)
|
1,136
|
|
||||||
|
Prepayments and other assets
|
(154
|
)
|
(1,450
|
)
|
2,114
|
|
||||||
|
Regulatory assets/liabilities
|
33,834
|
|
24,626
|
|
(5,610
|
)
|
||||||
|
Accounts payable
|
(1,907
|
)
|
4,927
|
|
(1,514
|
)
|
||||||
|
Inter-company receivable/payable
|
(47
|
)
|
(390
|
)
|
280
|
|
||||||
|
Income taxes receivable/payable from/to Parent
|
973
|
|
15,266
|
|
(10,856
|
)
|
||||||
|
Accrued pension and other post-retirement benefits
|
(1,086
|
)
|
(878
|
)
|
(289
|
)
|
||||||
|
Other liabilities
|
(2,057
|
)
|
(1,930
|
)
|
2,666
|
|
||||||
|
Net cash provided
|
120,439
|
|
129,608
|
|
101,286
|
|
||||||
|
Cash Flows From Investing Activities:
|
|
|
|
|
|
|
||||||
|
Capital expenditures
|
(116,354
|
)
|
(110,487
|
)
|
(127,913
|
)
|
||||||
|
Proceeds from sale of assets
|
9
|
|
34,324
|
|
—
|
|
||||||
|
Other investments
|
(1,553
|
)
|
(1,229
|
)
|
(1,389
|
)
|
||||||
|
Net cash used
|
(117,898
|
)
|
(77,392
|
)
|
(129,302
|
)
|
||||||
|
Cash Flows From Financing Activities:
|
|
|
|
|
|
|
||||||
|
Proceeds from issuance of Common Shares to Parent
|
47,500
|
|
—
|
|
—
|
|
||||||
|
Tax benefits from stock-based awards
|
—
|
|
—
|
|
501
|
|
||||||
|
Receipt of advances for and contributions in aid of construction
|
5,551
|
|
7,275
|
|
6,660
|
|
||||||
|
Refunds on advances for construction
|
(3,886
|
)
|
(3,889
|
)
|
(3,921
|
)
|
||||||
|
Retirement or repayments of long-term debt
|
(326
|
)
|
(329
|
)
|
(313
|
)
|
||||||
|
Net change in inter-company borrowings
|
22,500
|
|
(26,500
|
)
|
49,500
|
|
||||||
|
Dividends paid
|
(68,850
|
)
|
(27,680
|
)
|
(25,450
|
)
|
||||||
|
Other
|
(1,057
|
)
|
(1,088
|
)
|
(1,253
|
)
|
||||||
|
Net cash provided (used)
|
1,432
|
|
(52,211
|
)
|
25,724
|
|
||||||
|
Net change in cash and cash equivalents
|
3,973
|
|
5
|
|
(2,292
|
)
|
||||||
|
Cash and cash equivalents, beginning of year
|
214
|
|
209
|
|
2,501
|
|
||||||
|
Cash and cash equivalents, end of year
|
$
|
4,187
|
|
$
|
214
|
|
$
|
209
|
|
|||
The accompanying notes are an integral part of these financial statements.
77
AMERICAN STATES WATER COMPANY AND SUBSIDIARIES
NOTES TO CONSOLIDATED FINANCIAL STATEMENTS
Note 1 — Summary of Significant Accounting Policies
Nature of Operations
: American States Water Company (“AWR”) is the parent company of Golden State Water Company (“GSWC”) and American States Utility Services, Inc. (“ASUS”) (and its wholly owned subsidiaries, Fort Bliss Water Services Company (“FBWS”), Terrapin Utility Services, Inc. (“TUS”), Old Dominion Utility Services, Inc. (“ODUS”), Palmetto State Utility Services, Inc. (“PSUS”), Old North Utility Services, Inc. (“ONUS”), Emerald Coast Utility Services, Inc. (“ECUS”), and Fort Riley Utility Services, Inc. ("FRUS")). AWR and its subsidiaries may be collectively referred to as “Registrant” or “the Company.” The subsidiaries of ASUS are collectively referred to as the “Military Utility Privatization Subsidiaries.”
GSWC is a public utility engaged principally in the purchase, production, distribution and sale of water in California serving approximately
260,000
customers. GSWC also distributes electricity in several San Bernardino County mountain communities in California serving approximately
24,000
customers through its Bear Valley Electric Service (“BVES”) division. Although Registrant has a diversified base of residential, industrial and other customers, revenues derived from commercial and residential water customers accounted for nearly
90%
of total water revenues in
2018
,
2017
and
2016
. The California Public Utilities Commission (“CPUC”) regulates GSWC’s water and electric businesses in matters including properties, rates, services, facilities, and transactions by GSWC with its affiliates. In December 2018, GSWC filed an application with the CPUC to effectuate a reorganization plan that would transfer BVES from a division of GSWC to Bear Valley Electric Service, Inc., a newly created separate legal entity and stand-alone subsidiary of AWR. This reorganization plan is subject to CPUC approval and, if approved, is not expected to result in a substantive change to Registrant's operations and business segments.
ASUS, through its Military Utility Privatization Subsidiaries, operates, maintains and performs construction activities (including renewal and replacement capital work) on water and/or wastewater systems at various U.S. military bases pursuant to
50
-year firm fixed-price contracts. These contracts are subject to annual economic price adjustments and modifications for changes in circumstances, changes in laws and regulations and additions to the contract value for new construction of facilities at the military bases. On July 1, 2018, ASUS assumed the operation, maintenance and construction management of the water distribution and wastewater collection and treatment facilities at Fort Riley, a United States Army installation located in Kansas, after completing a transition period. The
50
-year contract was awarded by the U.S. government in September 2017 and is subject to annual economic price adjustments.
There is no direct regulatory oversight by the CPUC over AWR or the operations, rates or services provided by ASUS or the Military Utility Privatization Subsidiaries.
Basis of Presentation
: The consolidated financial statements and notes thereto are presented in a combined report filed by
two
separate Registrants: AWR and GSWC. References in this report to “Registrant” are to AWR and GSWC, collectively, unless otherwise specified. Certain prior period amounts have been reclassified on the income statements to conform to the current-period presentation.
AWR owns all of the outstanding Common Shares of GSWC and ASUS. ASUS owns all of the outstanding Common shares of the Military Utility Privatization Subsidiaries. The consolidated financial statements of AWR include the accounts of AWR and its subsidiaries. These financial statements are prepared in conformity with accounting principles generally accepted in the United States of America. Intercompany transactions and balances have been eliminated in the AWR consolidated financial statements.
Related-Party Transactions
: GSWC and ASUS provide and/or receive various support services to and from their parent, AWR, and among themselves. GSWC also allocates certain corporate office administrative and general costs to its affiliate, ASUS, using allocation factors approved by the CPUC. During the years ended
December 31, 2018
,
2017
and
2016
, GSWC allocated to ASUS approximately
$4.2 million
,
$4.0 million
and
$3.9 million
, respectively, of corporate office administrative and general costs. In addition, AWR has a
$150.0 million
credit facility, which expires in May 2023. AWR borrows under this facility and provides funds to its subsidiaries, including GSWC, in support of their operations. The interest rate charged to GSWC and ASUS is sufficient to cover AWR’s interest cost under the credit facility. Amounts owed to GSWC by AWR, including for allocated expenses, are included in GSWC's intercompany receivables as of
December 31, 2018
and
2017
.
The CPUC requires GSWC to completely pay down all intercompany borrowings from AWR within a
24
-month period. In November 2018, the Board of Directors approved the issuance of
nineteen
additional GSWC Common Shares to AWR for
$47.5
million. On November 30, 2018, GSWC used the proceeds from this stock issuance to pay down its
78
intercompany borrowings owed to AWR. The next
24
-month period in which GSWC is required to completely pay down its intercompany borrowings will be at the end of November 2020. As a result, GSWC’s intercompany borrowings of
$57.3 million
as of
December 31, 2018
have been classified as a long-term liability on GSWC’s balance sheet.
GSWC Long-Term Debt:
In March of 2019,
$40
million of GSWC's
6.70%
senior note will mature. This note has been included in "Current Liabilities" in Registrant's balance sheets as of
December 31, 2018
. GSWC intends to borrow under its intercompany borrowing arrangement with AWR to fund the repayment of this note.
Utility Accounting
: Registrant’s accounting policies conform to accounting principles generally accepted in the United States of America ("U.S. GAAP"), including the accounting principles for rate-regulated enterprises, which reflect the ratemaking policies of the CPUC and the Federal Energy Regulatory Commission. GSWC has incurred various costs and received various credits reflected as regulatory assets and liabilities. Accounting for such costs and credits as regulatory assets and liabilities is in accordance with the guidance for accounting for the effects of certain types of regulation. This guidance sets forth the application of U.S. GAAP for those companies whose rates are established by or are subject to approval by an independent third-party regulator.
Under such accounting guidance, rate-regulated entities defer costs and credits on the balance sheet as regulatory assets and liabilities when it is probable that those costs and credits will be recognized in the ratemaking process in a period different from the period in which they would have been reflected in income by an unregulated company. These regulatory
assets and liabilities are then recognized in the income statement in the period in which the same amounts are reflected in the rates charged for service. The amounts included as regulatory assets and liabilities that will be collected or refunded over a period exceeding one year are classified as long-term assets and liabilities as of
December 31, 2018
and
2017
.
Property and Depreciation
: Registrant's property consists primarily of regulated utility plant at GSWC. GSWC capitalizes, as utility plant, the cost of construction and the cost of additions, betterments and replacements of retired units of property. Such cost includes labor, material and certain indirect charges. Water systems acquired are recorded at estimated original cost of utility plant when first devoted to utility service and the applicable depreciation is recorded to accumulated depreciation. The difference between the estimated original cost, less accumulated depreciation, and the purchase price, if recognized by the regulator, is recorded as an acquisition adjustment within utility plant.
Depreciation is computed on the straight-line, remaining-life basis, group method, in accordance with the applicable ratemaking process. GSWC's provision for depreciation expressed as a percentage of the aggregate depreciable asset balances was
2.7%
for
2018
,
2.6%
for
2017
, and
2.9%
for
2016
. Depreciation expense for GSWC, excluding amortization expense and depreciation on transportation equipment, totaled
$37.3 million
,
$36.5 million
and
$36.1 million
for the years ended
December 31, 2018
,
2017
and
2016
. Depreciation computed on GSWC’s transportation equipment is recorded in other operating expenses and totaled
$238,000
,
$242,000
and
$259,000
for the years ended
December 31, 2018
,
2017
and
2016
, respectively. Expenditures for maintenance and repairs are expensed as incurred. Replaced or retired property costs, including cost of removal, are charged to the accumulated provision for depreciation.
Estimated useful lives of GSWC’s utility plant, as authorized by the CPUC, are as follows:
|
Source of water supply
|
30 years to 50 years
|
|||
|
Pumping
|
25 years to 40 years
|
|||
|
Water treatment
|
20 years to 35 years
|
|||
|
Transmission and distribution
|
25 years to 55 years
|
|||
|
Generation
|
40 years
|
|||
|
Other plant
|
7 years to 40 years
|
|||
Non-regulated property consists primarily of equipment utilized by ASUS and its subsidiaries for its operations. This property is stated at cost, net of accumulated depreciation, which is calculated using the straight-line method over the useful lives of the assets.
Asset Retirement Obligations
: GSWC has a legal obligation for the retirement of its wells, which by law need to be properly capped at the time of removal. As such, GSWC incurs asset retirement obligations. GSWC records the fair value of a liability for these asset retirement obligations in the period in which they are incurred. When the liability is initially recorded, GSWC capitalizes the cost by increasing the carrying amount of the related long-lived asset. Over time, the liability is accreted to its present value each period, and the capitalized cost is depreciated over the useful life of the related asset. Upon settlement of the liability, GSWC either settles the obligation for its recorded amount or incurs a gain or loss upon settlement. Retirement costs have historically been recovered through rates subsequent to the retirement costs being incurred. Accordingly,
79
recoverability of GSWC’s asset retirement obligations are reflected as a regulatory asset. GSWC also reflects the loss or gain at settlement as a regulatory asset or liability on the balance sheet.
With regards to removal costs associated with certain other long-lived assets, such as water mains, distribution and transmission assets, asset retirement obligations have not been recognized as GSWC believes there is no legal obligation to do so. There are no CPUC rules or regulations that require GSWC to remove any of its other long-lived assets. In addition, GSWC’s water pipelines are not subject to regulation by any federal regulatory agency. GSWC has franchise agreements with various municipalities in order to use the public right of way for utility purposes (i.e., operate water distribution and transmission assets), and if certain events occur in the future, GSWC could be required to remove or relocate certain of its pipelines. However, it is not possible to estimate an asset retirement amount since the timing and the amount of assets that may be required to be removed, if any, is not known.
Amounts recorded for asset retirement obligations are subject to various assumptions and determinations, such as determining whether a legal obligation exists to remove assets, estimating the fair value of the costs of removal, when final removal will occur and the credit-adjusted risk-free interest rates to be utilized on discounting future liabilities. Changes that may arise over time with regard to these assumptions will change amounts recorded in the future. Revisions in estimates for timing or estimated cash flows are recognized as changes in the carrying amount of the liability and the related capitalized asset. The estimated fair value of the costs of removal was based on third-party costs.
Impairment of Long-Lived Assets
: Long-lived assets are reviewed for impairment whenever events or changes in circumstances indicate that the carrying amount of an asset may not be fully recoverable in accordance with accounting guidance for impairment or disposal of long-lived assets. Registrant would recognize an impairment loss on its regulated assets only if the carrying value amount of a long-lived asset is not recoverable from customer rates authorized by the CPUC. Impairment loss is measured as the excess of the carrying value over the amounts recovered in customer rates. For the years ended
December 31, 2018
,
2017
and
2016
,
no
impairment loss was incurred.
Goodwill
: At
December 31, 2018
and
2017
, AWR had approximately
$1.1 million
of goodwill. The
$1.1 million
goodwill arose from ASUS’s acquisition of a subcontractor’s business at some of the Military Utility Privatization Subsidiaries. In accordance with the accounting guidance for testing goodwill, AWR annually assesses qualitative factors to determine whether the existence of events or circumstances leads to a determination that it is more likely than not that the fair value of a reporting unit is less than its carrying amount. For
2018
, AWR’s assessment of qualitative factors did not indicate that an impairment had occurred for goodwill at ASUS.
Cash and Cash Equivalents
: Cash and cash equivalents include short-term cash investments with an original maturity of three months or less. At times, cash and cash equivalent balances may be in excess of federally insured limits. Cash and cash equivalents are held with financial institutions with high credit standings.
Accounts Receivable
: Accounts receivable is reported on the balance sheet net of any allowance for doubtful accounts. The allowance for doubtful accounts is Registrant’s best estimate of the amount of probable credit losses in Registrant’s existing accounts receivable from its water and electric customers, and is determined based on historical write-off experience and the aging of account balances. Registrant reviews the allowance for doubtful accounts quarterly. Account balances are written off against the allowance when it is probable the receivable will not be recovered. When utility customers request extended payment terms, credit is extended based on regulatory guidelines, and collateral is not required. Receivables from the U.S. government include amounts due under contracts with the U.S. government to operate and maintain, and/or provide construction services for the water and/or wastewater systems at military bases. Other accounts receivable consist primarily of amounts due from third parties (non-utility customers) for various reasons, including amounts due from contractors, amounts due under settlement agreements, amounts due from other third-party prime government contractors pursuant to agreements for construction of water and/or wastewater facilities for such third-party prime contractors. The allowance for these other accounts receivable is based on Registrant’s evaluation of the receivable portfolio under current conditions and a review of specific problems and such other factors that, in Registrant’s judgment, should be considered in estimating losses. Allowances for doubtful accounts are disclosed in Note 17.
Materials and Supplies
: Materials and supplies are stated at the lower of cost or net realizable value. Cost is computed using average cost. Major classes of materials include pipe, hydrants and valves.
Interest
: Interest incurred during the construction of capital assets has generally not been capitalized for financial reporting purposes as such policy is not followed in the ratemaking process. Interest expense is generally recovered through the regulatory process. However, the CPUC has authorized certain capital projects to be filed for revenue recovery with advice letters when those projects are completed. During the time that such projects are under development and construction, GSWC may accrue an allowance for funds used during construction (“AFUDC”) on the incurred expenditures to offset the cost of
80
financing project construction. For the year ended
December 31, 2018
,
$156,000
of AFUDC was recorded. For the year ended
December 31, 2017
,
no
AFUDC was recorded and for the year ended
December 31, 2016
,
$101,000
, of AFUDC was recorded related to capital projects based on a weighted cost of capital of
8.34%
for water and a cost of debt of
6.96%
for electric, as approved by the CPUC.
Debt Issuance Costs and Redemption Premiums
: Original debt issuance costs are deducted from the carrying value of the associated debt liability and amortized over the lives of the respective issues. Premiums paid on the early redemption of debt, which is reacquired through refunding, are deferred and amortized over the life of the debt issued to finance the refunding as Registrant normally receives recovery of these costs in rates.
Advances for Construction and Contributions in Aid of Construction
: Advances for construction represent amounts advanced by developers for the cost to construct water system facilities in order to extend water service to their properties. Advances are refundable in equal annual installments, generally over
40 years
. In certain instances, GSWC makes refunds on these advances over a specific period of time based on operating revenues related to the main or as new customers are connected to receive service from the main. Contributions in aid of construction are similar to advances but require no refunding. Generally, GSWC depreciates contributed property and amortizes contributions in aid of construction at the composite rate of the related property. Utility plant funded by advances and contributions is excluded from rate base.
Fair Value of Financial Instruments
: For cash and cash equivalents, accounts receivable, accounts payable and short-term debt, the carrying amount is assumed to approximate fair value due to the short-term nature of the amounts. The table below estimates the fair value of long-term debt issued by GSWC. Rates available to GSWC at
December 31, 2018
and
2017
for debt with similar terms and remaining maturities were used to estimate fair value for long-term debt. Changes in the assumptions will produce differing results.
|
|
2018
|
2017
|
||||||||||||||
|
(dollars in thousands)
|
Carrying Amount
|
Fair Value
|
Carrying Amount
|
Fair Value
|
||||||||||||
|
Long-term debt—GSWC
(1)
|
$
|
324,978
|
|
$
|
387,889
|
|
$
|
325,265
|
|
$
|
424,042
|
|
||||
(1)
Excludes debt issuance costs and redemption premiums.
The accounting guidance for fair value measurements applies to all financial assets and financial liabilities that are being measured and reported on a fair value basis. Under the accounting guidance, GSWC makes fair value measurements that are classified and disclosed in one of the following three categories:
Level 1
: Unadjusted quoted prices in active markets that are accessible at the measurement date for identical, unrestricted assets or liabilities;
Level 2
: Quoted prices in markets that are not active, or inputs which are observable, either directly or indirectly, for substantially the full term of the asset or liability; or
Level 3
: Prices or valuation techniques that require inputs that are both significant to the fair value measurement and unobservable (i.e., supported by little or no market activity).
Publicly issued notes, private placement notes and other long-term debt are measured using current U.S. corporate bond yields for similar debt instruments and are classified as Level 2. The following table sets forth by level, within the fair value hierarchy, GSWC’s long-term debt measured at fair value as of
December 31, 2018
:
|
(dollars in thousands)
|
Level 1
|
Level 2
|
Level 3
|
Total
|
||||||||||
|
Long-term debt—GSWC
|
—
|
|
$
|
387,889
|
|
—
|
|
$
|
387,889
|
|
||||
Stock-Based Awards
: AWR has issued stock-based awards to its employees under stock incentive plans. AWR has also issued stock-based awards to its Board of Directors under non-employee directors stock plans. Registrant applies the provisions in the accounting guidance for share-based payments in accounting for all of its stock-based awards. See Note 13 for further discussion.
Recently Issued Accounting Pronouncements
:
Accounting Pronouncements Adopted in 2018
In May 2014, the Financial Accounting Standards Board ("FASB") issued Accounting Standard Update ("ASU") 2014-09,
Revenue from Contracts with Customers (Topic 606)
. Under this guidance, an entity recognizes revenue when it transfers goods or services to customers in an amount that reflects what the entity expects in exchange for the goods or
81
services. Registrant adopted this guidance under the modified retrospective approach beginning January 1, 2018. The adoption of this guidance did not have a material impact on Registrant's measurement or timing of revenue recognition but required additional disclosures (see Note 2).
In March 2017, the FASB issued ASU 2017-07,
Compensation-Retirement Benefits (Topic 715): Improving the Presentation of Net Periodic Pension Cost and Net Periodic Postretirement Benefit Cost
, which changes the financial statement presentation for the costs of defined benefit pension plans and other retirement benefits. Prior to this guidance, the components of net benefit cost for retirement plans (such as service cost, interest cost, expected return on assets, and the amortization of prior service costs and actuarial gains and losses) were aggregated as operating costs for financial statement presentation purposes. Under the new guidance, the service cost component continues to be presented as operating costs, while all other components of net benefit cost are presented outside of operating income. The new guidance also limits any capitalization of net periodic benefits cost to the service cost component. Registrant adopted the new guidance beginning January 1, 2018, which did not have a material impact on its financial statements. Prior period amounts have been reclassified on the income statements to conform to the current-period presentation. Registrant used its prior year's disclosure of its pension and other employee benefit plans as an estimation for applying the retrospective presentation requirements of this guidance. The components of net periodic benefits cost, other than the service cost component, have been included in the line item “Other, net” in Registrant's income statements (see Note 12).
In November of 2016, the FASB issued ASU 2016-18,
Statement of Cash Flows (Topic 230) - Restricted Cash
. The guidance requires restricted cash to be combined with cash and cash equivalents when reconciling the beginning and end of period cash balances in the statement of cash flows. The adoption of this new guidance in 2018 did not have an impact on Registrant's cash flow statements. In August 2016, the FASB also issued ASU 2016-15,
Statement of Cash Flows (Topic 230) Classification of Certain Cash Receipts and Cash Payments
, which is intended to reduce diversity in practice in how certain transactions are classified in the statement of cash flows. The adoption of this new guidance in 2018 did not have an impact on Registrant's cash flow statements.
Accounting Pronouncements to be Adopted in Future Periods
In February 2016, the FASB issued a new lease accounting standard,
Leases
(ASC 842), which replaces the prior lease guidance, (ASC 840). Under the new standard, lessees will recognize a right-of-use asset and a lease liability for virtually all leases (other than leases that meet the definition of a short-term lease). For income statement purposes, leases will be classified as either operating or finance. Operating leases will result in straight-line expense while finance leases will result in a front-loaded expense pattern. Registrant will apply the new standard on January 1, 2019 and any periods presented prior to January 1, 2019 will not be adjusted to conform to the new lease standard. Registrant examined all current agreements accounted for under ASC 840, as well as other agreements which were not recorded as leases under ASC 840, and applied the lease criteria under ASC 842 to assess whether these agreements qualify as leases under the new standard. Registrant elected the practical expedient under ASU 2018-01
Land Easement Practical Expedient for Transition to Topic 842
. The discount rates used to value the lease liabilities were based on Registrant's incremental borrowing rates for a similar term as the underlying leases' terms. Based on its current lease portfolio and the analysis of the new standard performed to-date, Registrant estimates an increase in consolidated assets and liabilities of less than
$10
million, representing right-of-use assets and lease liabilities as a result of the adoption of ASC 842.
In August 2018, the FASB issued ASU 2018-15-Intangibles-Goodwill and Other-Internal-Use Software (Subtopic 350-40):
Customer’s Accounting for Implementation Costs Incurred in a Cloud Computing Arrangement That Is a Service Contract
. Under this standard, entities that enter into cloud computing service arrangements will apply existing internal-use software guidance to determine which implementation costs are eligible for capitalization. Under that guidance, implementation costs are capitalized or expensed depending on the nature of the costs and the project stage during which they are incurred. The new guidance is effective for fiscal years beginning after December 15, 2020. Early adoption is permitted. Registrant will adopt this guidance effective January 1, 2019 and does not expect the adoption to have a significant impact on its financial statements.
In August 2018, the FASB issued ASU 2018-14-
Compensation-Retirement Benefits-Defined Benefit Plans-General (Subtopic 715-20): Disclosure Framework-Changes to the Disclosure Requirements for Defined Benefit Plans
. This update removes disclosures to pension plans and other post-retirement benefit plans that no longer are considered cost beneficial, clarifies the specific disclosure requirements and adds disclosure requirements deemed relevant. The amendments in this ASU are effective for fiscal years ending after December 15, 2020 and will be applied on a retrospective basis to all periods presented.
82
Note 2 — Revenues
Most of Registrant's revenues are accounted for under the revenue recognition accounting standard,
"Revenue from Contracts with Customers - (Topic 606)."
The adoption of this accounting standard effective January 1, 2018 did not have a material impact on Registrant's measurement or timing of revenue recognition.
GSWC provides water and electric utility services to customers as specified by the CPUC. The transaction prices for water and electric revenues are based on tariff rates authorized by the CPUC, which include both quantity-based and flat-rate charges. Tariff revenues represent the adopted revenue requirement authorized by the CPUC intended to provide GSWC with an opportunity to recover its costs and earn a reasonable return on its net capital investment. The annual revenue requirements are comprised of operation and maintenance costs, administrative and general costs, depreciation and taxes in amounts authorized by the CPUC and a return on rate base consistent with the capital structure authorized by the CPUC.
Water and electric revenues are recognized over time as customers simultaneously receive and use the utility services provided. Water and electric revenues include amounts billed to customers on a cyclical basis, nearly all of which are based on meter readings for services provided. Customer bills also include surcharges for cost-recovery activities, which represent CPUC-authorized balancing and memorandum accounts that allow for the recovery of previously incurred operating costs. Revenues from these surcharges result in no impact to earnings as they are offset by corresponding increases in operating expenses to reflect the recovery of the associated costs. Customer payment terms are approximately
20
business days from the billing date. Unbilled revenues are amounts estimated to be billed for usage since the last meter-reading date to the end of the accounting period. Historical customer usage forms the basis for estimating unbilled revenue.
GSWC bills certain sales and use taxes levied by state or local governments to its customers. Included in these sales and use taxes are franchise fees, which GSWC pays to various municipalities and counties (based on their ordinances) in order to use public rights of way for utility purposes. GSWC bills these franchise fees to its customers based on a CPUC-authorized rate for each ratemaking area as applicable. These franchise fees, which are required to be paid regardless of GSWC’s ability to collect them from its customers, are accounted for on a gross basis. GSWC’s franchise fees billed to customers and recorded as operating revenue were approximately
$3.6 million
,
$3.6 million
and
$3.5 million
for the years ended
December 31,
2018
,
2017
and
2016
, respectively. When GSWC acts as an agent, and a tax is not required to be remitted if it is not collected from customers, the tax is accounted for on a net basis.
As authorized by the CPUC, GSWC records in revenues the difference between the adopted level of volumetric revenues as authorized by the CPUC for metered accounts (volumetric revenues) and the actual volumetric revenues recovered in customer rates. The difference is tracked under the Water Revenue Adjustment Mechanism (“WRAM”) regulatory accounts for its water segment, and the Base Revenue Requirement Adjustment Mechanism ("BRRAM") regulatory account for its electric segment. If this difference results in an under-collection of revenues, GSWC records the additional revenue only to the extent that they are expected to be collected within
24 months
following the year in which they are recorded in accordance with Accounting Standards Codification ("ASC") Topic 980,
Regulated Operations
.
For ASUS, performance obligations consist of (i) performing ongoing operation and maintenance of the water and/or wastewater systems and treatment plants for each military base served, and (ii) performing construction activities (including renewal and replacement capital work) on each military base served. The transaction price for each performance obligation is either delineated in, or initially derived from, the applicable
50
-year contract and/or any subsequent contract modifications. Depending on the state in which operations are conducted, the Military Utility Privatization Subsidiaries are also subject to certain state non-income tax assessments, which are accounted for on a gross basis and have been immaterial to date.
The ongoing performance of operation and maintenance of the water and/or wastewater systems and treatment plants is viewed as a single performance obligation for each
50
-year contract with the U.S. government. Registrant recognizes revenue for operations and maintenance fees monthly using the "right to invoice" practical expedient under ASC Topic 606. ASUS has a right to consideration from the U.S. government in an amount that corresponds directly to the value to the U.S. government of ASUS’s performance completed to-date. The contractual operations and maintenance fees are firm-fixed, and the level of effort or resources expended in the performance of the operations-and-maintenance-fees performance obligation is largely consistent over the
50
-year term. Therefore, Registrant has determined that the monthly amounts invoiced for operations and maintenance performance are a fair reflection of the value transferred to the U.S. government. Invoices to the U.S. government for operations and maintenance service, as well as construction activities, are due upon receipt.
ASUS's construction activities consist of various projects to be performed. Each of these projects' transaction prices is delineated either in the
50
-year contract or through a specific contract modification for each construction project, which includes the transaction price for that project. Each construction project is viewed as a separate, single performance obligation.
83
Therefore, it is generally unnecessary to allocate a construction transaction price to more than one construction performance obligation. Revenues for construction activities are recognized over time, with progress toward completion measured based on the input method using costs incurred relative to the total estimated costs (cost-to-cost method). Due to the nature of these construction projects, Registrant has determined the cost-to-cost input measurement to be the best method to measure progress towards satisfying its construction contract performance obligations, as compared to using an output measurement such as units produced. Changes in job performance, job site conditions, change orders and/or estimated profitability may result in revisions to costs and income for ASUS, and are recognized in the period in which any such revisions are determined. Pre-contract costs for ASUS, which consist of design and engineering labor costs, are deferred if recovery is probable, and are expensed as incurred if recovery is not probable. Deferred pre-contract costs have been immaterial to date.
Contracted services revenues recognized during the year ended
December 31,
2018 from performance obligations satisfied in previous periods were not material.
Although GSWC has a diversified base of residential, commercial, industrial and other customers, revenues derived from residential and commercial customers account for nearly
90%
of total water revenues, and
90%
of total electric revenues. For the year ended
December 31,
2018, disaggregated revenues from contracts with customers by segment are as follows:
|
(dollar in thousands)
|
For The Year Ended December 31, 2018
|
|||
|
Water:
|
||||
|
Tariff-based revenues
|
$
|
298,818
|
|
|
|
CPUC-approved surcharges (cost-recovery activities)
|
2,962
|
|
||
|
Other
|
1,813
|
|
||
|
Water revenues from contracts with customers
|
303,593
|
|
||
|
WRAM over-collection (alternative revenue program)
|
(8,335
|
)
|
||
|
Total water revenues
|
295,258
|
|
||
|
Electric:
|
||||
|
Tariff-based revenues
|
34,501
|
|
||
|
CPUC-approved surcharges (cost-recovery activities)
|
214
|
|
||
|
Electric revenues from contracts with customers
|
34,715
|
|
||
|
BRRAM over-collection (alternative revenue program)
|
(365
|
)
|
||
|
Total electric revenues
|
34,350
|
|
||
|
Contracted services:
|
||||
|
Water
|
62,273
|
|
||
|
Wastewater
|
44,935
|
|
||
|
Contracted services revenues from contracts with customers
|
107,208
|
|
||
|
Total revenues
|
$
|
436,816
|
|
|
The opening and closing balances of the receivable from the U.S. government, contract assets and contract liabilities from contracts with customers, which related entirely to ASUS, are as follows:
|
(dollar in thousands)
|
December 31, 2018
|
January 1, 2018
|
||||||
|
Receivable from the U.S. government
|
$
|
61,126
|
|
$
|
40,150
|
|
||
|
Contract assets
|
$
|
24,447
|
|
$
|
30,388
|
|
||
|
Contract liabilities
|
$
|
7,530
|
|
$
|
3,911
|
|
||
As a result of the adoption of ASC Topic 606, amounts previously reported under "Costs and estimated earnings in excess of billings on contracts" are now reflected as either "Receivable from U.S. government" or "Contract assets," depending on whether receipt of these amounts is conditional on something other than the passage of time. Amounts previously reported under "Billings in excess of costs and estimated earnings on contracts" are now reflected as "Contract liabilities."
84
Contract Assets - Contract assets are those of ASUS and consist of unbilled revenues recognized from work-in-progress construction projects where the right to payment is conditional on something other than the passage of time. The classification of this asset as current or noncurrent is based on the timing of when ASUS expects to bill these amounts.
Contract Liabilities - Contract liabilities are those of ASUS and consist of billings in excess of revenue recognized. The classification of this liability as current or noncurrent is based on the timing of when ASUS expects to recognize revenue.
Revenues for the year ended
December 31,
2018 that were included in contract liabilities at the beginning of the period were
$3.7 million
.
As of
December 31,
2018, Registrant's aggregate remaining performance obligations, all of which are for the contracted services segment, was
$3.2
billion. Registrant expects to recognize revenue on these remaining performance obligations over the remaining terms of each of the
50
-year contracts, which range from
36
to
50
years. Each of the contracts with the U.S. government is subject to termination, in whole or in part, prior to the end of its
50
-year term for the convenience of the U.S. government.
Note 3 — Regulatory Matters
In accordance with accounting principles for rate-regulated enterprises, Registrant records regulatory assets, which represent probable future recovery of costs from customers through the ratemaking process, and regulatory liabilities, which represent probable future refunds that are to be credited to customers through the ratemaking process. At
December 31, 2018
, Registrant had approximately
$56.3 million
of regulatory liabilities, net of regulatory assets, not accruing carrying costs. Of this amount, (i)
$81.5 million
of regulatory liabilities relates to the creation of an excess deferred income tax liability brought about by a lower federal income tax rate as a result of the Tax Cuts and Jobs Act (see Note 11) that is expected to be refunded to customers, (ii)
$15.3 million
relates to flow-through deferred income taxes including the gross-up portion on the deferred tax resulting from the excess deferred income tax regulatory liability (also see Note 11), and (iii)
$36.2 million
of regulatory assets relates to the underfunded position in Registrant's pension and other post-retirement obligations (not including the two-way pension balancing accounts). The remainder relates to other items that do not provide for or incur carrying costs.
Regulatory assets represent costs incurred by GSWC for which it has received or expects to receive rate recovery in the future. In determining the probability of costs being recognized in other periods, GSWC considers regulatory rules and decisions, past practices, and other facts or circumstances that would indicate if recovery is probable. If the CPUC determines that a portion of GSWC’s assets are not recoverable in customer rates, GSWC must determine if it has suffered an asset impairment that requires it to write down the asset's value. Regulatory assets are offset against regulatory liabilities within each rate-making area. Amounts expected to be collected or refunded in the next twelve months have been classified as current assets and current liabilities by rate-making area. Regulatory assets, less regulatory liabilities, included in the consolidated balance sheets are as follows:
|
|
December 31,
|
|||||||
|
(dollars in thousands)
|
2018
|
2017
|
||||||
|
GSWC
|
|
|
|
|
||||
|
Water Revenue Adjustment Mechanism and Modified Cost Balancing Account
|
$
|
17,763
|
|
$
|
29,556
|
|
||
|
Costs deferred for future recovery on Aerojet case
|
9,516
|
|
10,656
|
|
||||
|
Pensions and other post-retirement obligations (Note 12)
|
33,124
|
|
33,019
|
|
||||
|
Derivative unrealized loss (Note 5)
|
311
|
|
2,941
|
|
||||
|
Low income rate assistance balancing accounts
|
2,784
|
|
5,972
|
|
||||
|
General rate case memorandum accounts
|
5,054
|
|
10,522
|
|
||||
|
Other regulatory assets
|
15,656
|
|
16,393
|
|
||||
|
Excess deferred income taxes (Note 11)
|
(81,465
|
)
|
(83,231
|
)
|
||||
|
Flow-through taxes, net (Note 11)
|
(15,273
|
)
|
(17,716
|
)
|
||||
|
Tax Cuts and Jobs Act ("Tax Act") memorandum accounts
|
(8,293
|
)
|
—
|
|
||||
|
Various refunds to customers
|
(7,517
|
)
|
(6,070
|
)
|
||||
|
Total
|
$
|
(28,340
|
)
|
$
|
2,042
|
|
||
85
Alternative-Revenue Programs:
Under the WRAM, GSWC records the difference between the adopted level of volumetric revenues as authorized by the CPUC for metered accounts (adopted volumetric revenues) and the actual volumetric revenues recovered in customer rates. While the WRAM tracks volumetric-based revenues, the revenue requirements approved by the CPUC include service charges, flat rate charges, and other items that are not subject to the WRAM. The adopted volumetric revenues consider the seasonality of consumption of water based upon historical averages. The variance between adopted volumetric revenues and actual billed volumetric revenues for metered accounts is recorded as a component of revenue with an offsetting entry to an asset or liability balancing account (tracked individually for each rate making area). The variance amount may be positive or negative and represents amounts that will be billed or refunded to customers in the future. The WRAM only applies to customer classes with conservation rates in place. The majority of GSWC’s water customers have conservation rate structures.
Under the Modified Cost Balancing Account (“MCBA”), GSWC tracks adopted expense levels for purchased water, purchased power and pump taxes, as established by the CPUC. Variances (which include the effects of changes in both rate and volume) between adopted and actual purchased water, purchased power, and pump tax expenses are recorded as a component of the MCBA to be recovered from or refunded to GSWC’s customers at a later date. This is reflected with an offsetting entry to an asset or liability balancing account (tracked individually for each rate-making area). Unlike the WRAM, the MCBA applies to all customer classes.
The recovery or refund of the WRAM is netted against the MCBA over- or under-collection for the corresponding rate-making area and bears interest at the current
90
-day commercial-paper rate. During the year ended
December 31, 2018
,
$21.2 million
of pre-2018 WRAM/MCBA balances were recovered. During
2018
, GSWC recorded an additional
$9.4 million
net under-collection in the WRAM/MCBA. The majority of this balance represents an under-collection of supply costs incurred and recorded in the MCBA due to a higher volume of purchased water as compared to adopted. As of
December 31, 2018
, GSWC had an aggregated regulatory asset of
$17.8 million
, which is comprised of a
$3.8 million
over-collection in the WRAM accounts and a
$21.6 million
under-collection in the MCBA accounts. GSWC is expected to file with the CPUC for recovery of the
2018
WRAM/MCBA balances in March 2019.
As required by the accounting guidance for alternative revenue programs, GSWC is required to collect its WRAM balances within
24 months
following the year in which an under-collection is recorded. As of
December 31, 2018
, there were
no
WRAM under-collections that were estimated to be collected over more than 24 months.
Costs Deferred for Future Recovery
:
The CPUC authorized a memorandum account to allow for the recovery of costs incurred by GSWC related to contamination lawsuits brought against Aerojet-General Corporation ("Aerojet") and the state of California. In July 2005, the CPUC authorized GSWC to recover approximately
$21.3 million
of the Aerojet litigation memorandum account, through a rate surcharge, which will continue for no longer than
20
years. Beginning in October 2005, a surcharge went into effect to begin amortizing the memorandum account over a
20
-year period.
Aerojet also agreed to reimburse GSWC
$17.5 million
, plus interest accruing from January 1, 2004, for GSWC’s past legal and expert costs, which is included in the Aerojet litigation memorandum account. The reimbursement of the
$17.5 million
is contingent upon the issuance of land use approvals for development in a defined area within Aerojet property in Eastern Sacramento County and the receipt of certain fees in connection with such development. It is management’s intention to offset any proceeds from the housing development by Aerojet in this area against the balance in this litigation memorandum account. At this time, management believes the full balance of the Aerojet litigation memorandum account will be collected either from customers or Aerojet.
Pensions and Other Post-retirement Obligations
:
A regulatory asset has been recorded at
December 31, 2018
and
2017
for the costs that would otherwise be charged to “other comprehensive income” within shareholders’ equity for the underfunded status of Registrant’s pension and other post-retirement benefit plans because the cost of these plans has historically been recovered through rates. As discussed in Note 12, as of
December 31, 2018
, Registrant’s underfunded position for these plans that have been recorded as a regulatory asset totaled
$36.2 million
. Registrant expects this regulatory asset to be recovered through rates in future periods.
86
The CPUC has authorized GSWC to use two-way balancing accounts to track differences between the forecasted annual pension expenses adopted in both water and electric rates and the actual annual expense to be recorded by GSWC in accordance with the accounting guidance for pension costs. The two-way balancing accounts bear interest at the current
90
-day commercial paper rate. As of
December 31, 2018
, GSWC has a net
$3.0 million
over-collection in the two-way pension balancing accounts, consisting of a
$2.0 million
over-collection related to the general office and water regions, and a
$1.0 million
over-collection related to BVES.
Low Income Balancing Accounts
:
This regulatory asset reflects primarily the costs of implementing and administering the California Alternate Rates for Water program in GSWC’s water regions and the California Alternate Rate for Energy program in GSWC’s BVES division. These programs mandated by the CPUC currently provide a discount of a fixed dollar amount which is intended to represent a
15%
discount based on a typical customer bill for qualified low-income water customers and
20%
for qualified low-income electric customers. GSWC accrues interest on its low income balancing accounts at the prevailing rate for
90
-day commercial paper. As of
December 31, 2018
, there is an aggregate
$2.8 million
under-collection in the low income balancing accounts. Surcharges have been implemented to recover the costs included in these balancing accounts.
General Rate Case Memorandum Accounts
:
The balance in the general rate case memorandum accounts represents the revenue differences between interim rates and final rates authorized by the CPUC due to delays in receiving decisions on various general rate case applications. On December 15, 2016, the CPUC issued a decision on GSWC's water general rate case, which set rates for the years 2016 - 2018. The rates approved by the CPUC were retroactive to January 1, 2016. As a result, as of December 31, 2016, GSWC added
$9.5 million
to the general rate case memorandum accounts representing the rate difference between interim rates and final rates authorized by the CPUC, retroactive to January 1, 2016. As of
December 31, 2018
, there is a net aggregate
$5.1 million
under-collection in these accounts, primarily related to the revenue difference between interim rates and final rates authorized by the CPUC in the December 2016 decision. GSWC has implemented surcharges ranging from
12
-
36
months to collect the
$5.1 million
balance.
Tax Cuts and Jobs Act ("Tax Act") Memorandum Accounts:
On December 22, 2017, the Tax Act was signed into federal law. The provisions of this major tax reform were generally effective January 1, 2018. The most significant provisions of the Tax Act impacting GSWC are the reduction of the federal corporate income tax rate from 35% to 21% and the elimination of bonus depreciation for regulated utilities. Pursuant to a CPUC directive, the 2018 impact of the Tax Act on the water segment’s adopted revenue requirement was tracked in a memorandum account effective January 1, 2018. For the year ended
December 31, 2018
, over-collections of approximately
$7.1 million
related to the water segment were tracked and recorded as a regulatory liability. On July 1, 2018, new lower water rates, which incorporate the new federal income tax rate, were implemented for all water ratemaking areas. GSWC expects to refund the
$7.1 million
to water customers beginning in 2019. Furthermore, in March 2018, GSWC filed updated testimony revising the revenue requirements to reflect the impacts of the Tax Act in its pending water general rate case that will set new rates for the years 2019 - 2021.
The CPUC also ordered GSWC to update its pending electric general rate case filing, which will determine new electric rates for the years 2018 - 2021, to reflect the lower federal corporate income tax rate. As a result, for the year ended
December 31, 2018
, GSWC reduced electric revenues by approximately
$1.2 million
, and recorded a corresponding regulatory liability that will be satisfied as part of implementing overall new rates from the electric general rate case retroactive to January 1, 2018 once the CPUC issues a final decision.
Reductions in the water and electric revenue requirements resulting from the impacts of the Tax Act are largely offset by decreases in GSWC's income tax expense, resulting in no material impact to net earnings (see Note 11).
Other Regulatory Assets:
Other regulatory assets represent costs incurred by GSWC for which it has received or expects to receive rate recovery in the future. These regulatory assets are supported by regulatory rules and decisions, past practices, and other facts or circumstances that indicate recovery is probable.
87
Other Regulatory Matters:
Renewables Portfolio Standard:
BVES is subject to the renewables portfolio standard (“RPS”) law, which requires BVES to meet certain targets for purchases of energy from qualified renewable energy resources. In December 2012, GSWC entered into a ten-year agreement with a third party to purchase renewable energy credits (“RECs”) whereby GSWC agreed to purchase approximately
578,000
RECs over a
10
-year period, which would be used towards meeting California's RPS requirements. As of
December 31, 2018
, GSWC believes it has purchased sufficient RECs to be in compliance for all periods through
2018
. Accordingly,
no
provision for loss or potential penalties has been recorded in the financial statements as of
December 31, 2018
. GSWC intends to file its 2018 compliance report with the CPUC by the August 2019 deadline. The cost of these RECs has been included as part of the electric supply cost balancing account as of
December 31, 2018
.
In September 2018, the Governor of California signed a senate bill into law requiring, among other things, electric utilities to generate 40% of their electricity from renewable sources by 2024, 60% of their electricity from renewable energy sources by 2030 and 100% of their electricity from renewable energy sources and zero-carbon resources by 2045. The new requirement is in addition to the existing requirement for electric utilities to generate one third of their electricity from renewable sources by 2020. BVES is currently assessing various renewable energy opportunities to enable it to be in compliance with these requirements.
Cost of Capital Proceeding:
In March 2018, the CPUC issued a final decision in the cost of capital proceeding for GSWC and three other water utilities for the years 2018 - 2020. Among other things, the final decision adopted for GSWC's water segment a return on equity of
8.90%
, with a return on rate base of
7.91%
. The previously authorized return on equity for GSWC’s water segment was
9.43%
, with a return on rate base of
8.34%
. In April 2018, GSWC implemented new water rates to incorporate the cost of capital decision. For the year ended
December 31, 2018
, GSWC recorded a regulatory liability with a corresponding decrease in water revenues of approximately
$961,000
representing the revenue difference between the old and new cost of capital rates through April 2018.
Pending General Rate Case Filings:
Water Segment
:
In July 2017, GSWC filed a general rate case application for its water regions and the general office. The general rate case will determine new water rates for the years 2019 through 2021. On August 15, 2018, GSWC and the CPUC’s Public Advocates Office filed a joint motion to adopt a settlement agreement between GSWC and the Public Advocates Office in connection with this general rate case. If approved by the CPUC, the settlement would resolve all of the issues in the general rate case application.
GSWC and the Public Advocates Office informed the assigned Administrative Law Judge ("ALJ”) that hearings would not be needed in light of the settlement agreement. Subsequently, the ALJ issued a ruling requesting additional information on a number of items in the general rate case. GSWC has provided the additional information requested by the ALJ and believes it has satisfied all of the questions raised. Both the ALJ’s request and GSWC’s response are public information. GSWC is awaiting a proposed decision by the ALJ, which is expected during the first quarter of 2019, with a final decision by the CPUC expected later in 2019. When approved, the new rates will be retroactive to January 1, 2019.
Electric Segment
:
In May 2017, GSWC filed its electric general rate case application with the CPUC to determine new electric rates for the years 2018 through 2021. In November 2018, GSWC and the Public Advocates Office filed a joint motion to adopt a settlement agreement between the two parties resolving all issues in connection with the general rate case. Among other things, the settlement incorporates a previous stipulation in the case, which authorizes a new return on equity for GSWC's electric segment of
9.60%
, as compared to its previously authorized return of
9.95%
. The stipulation also included a capital structure and debt cost similar to those approved by the CPUC in March 2018 in connection with GSWC's water segment cost of capital proceeding. Because of the delay in finalizing the electric general rate case, year-to-date billed electric revenues in 2018 were based on 2017 adopted rates. A decision in this case is expected in 2019 and, when approved by the CPUC, the new rates will be retroactive to January 1, 2018.
88
Note 4 — Utility Plant and Intangible Assets
The following table shows Registrant’s utility plant (regulated utility plant and non-regulated utility property) by major asset class:
|
AWR
December 31, |
GSWC
December 31,
|
|||||||||||||||
|
(dollars in thousands)
|
2018
|
2017
|
2018
|
2017
|
||||||||||||
|
Water
|
||||||||||||||||
|
Land
|
$
|
14,890
|
|
$
|
14,895
|
|
$
|
14,890
|
|
$
|
14,895
|
|
||||
|
Intangible assets
|
29,412
|
|
29,396
|
|
29,413
|
|
29,378
|
|
||||||||
|
Source of water supply
|
91,349
|
|
88,168
|
|
91,349
|
|
88,168
|
|
||||||||
|
Pumping
|
182,673
|
|
178,252
|
|
182,673
|
|
178,252
|
|
||||||||
|
Water treatment
|
82,198
|
|
78,999
|
|
82,198
|
|
78,999
|
|
||||||||
|
Transmission and distribution
|
1,142,105
|
|
1,064,271
|
|
1,142,105
|
|
1,064,271
|
|
||||||||
|
Other
|
131,419
|
|
120,820
|
|
106,907
|
|
105,246
|
|
||||||||
|
1,674,046
|
|
1,574,801
|
|
1,649,535
|
|
1,559,209
|
|
|||||||||
|
Electric
|
||||||||||||||||
|
Transmission and distribution
|
82,257
|
|
76,188
|
|
82,257
|
|
76,188
|
|
||||||||
|
Generation
|
12,583
|
|
12,583
|
|
12,583
|
|
12,583
|
|
||||||||
|
Other
(1)
|
11,224
|
|
10,955
|
|
11,224
|
|
10,955
|
|
||||||||
|
106,064
|
|
99,726
|
|
106,064
|
|
99,726
|
|
|||||||||
|
Less — accumulated depreciation
|
(561,855
|
)
|
(533,370
|
)
|
(551,244
|
)
|
(524,481
|
)
|
||||||||
|
Construction work in progress
|
78,055
|
|
63,835
|
|
76,737
|
|
63,486
|
|
||||||||
|
Net utility plant
|
$
|
1,296,310
|
|
$
|
1,204,992
|
|
$
|
1,281,092
|
|
$
|
1,197,940
|
|
||||
(1)
Includes intangible assets of
$1.2 million
for the years ended
December 31, 2018
and
2017
for studies performed in association with the electricity segment of the Registrant’s operations.
As of
December 31, 2018
and
2017
, intangible assets consist of the following:
|
|
Weighted Average
Amortization
|
AWR
December 31,
|
GSWC
December 31,
|
|||||||||||||||
|
(dollars in thousands)
|
Period
|
2018
|
2017
|
2018
|
2017
|
|||||||||||||
|
Intangible assets
:
|
|
|
|
|
|
|
|
|
|
|||||||||
|
Conservation programs
|
3 years
|
$
|
9,486
|
|
$
|
9,486
|
|
$
|
9,486
|
|
$
|
9,486
|
|
|||||
|
Water and service rights
(2)
|
30 years
|
8,695
|
|
8,695
|
|
8,124
|
|
8,124
|
|
|||||||||
|
Water planning studies
|
14 years
|
12,641
|
|
13,011
|
|
12,641
|
|
13,011
|
|
|||||||||
|
Total intangible assets
|
|
30,822
|
|
31,192
|
|
30,251
|
|
30,621
|
|
|||||||||
|
Less — accumulated amortization
|
|
(24,399
|
)
|
(23,331
|
)
|
(24,268
|
)
|
(23,221
|
)
|
|||||||||
|
Intangible assets, net of amortization
|
|
$
|
6,423
|
|
$
|
7,861
|
|
$
|
5,983
|
|
$
|
7,400
|
|
|||||
|
Intangible assets not subject to amortization
(3)
|
|
$
|
422
|
|
$
|
422
|
|
$
|
404
|
|
$
|
404
|
|
|||||
(2)
Includes intangible assets of
$571,000
for contracted services included in "Other Property and Investments" on the consolidated balance sheets as of
December 31, 2018
and
2017
.
(3)
The intangible assets not subject to amortization primarily consist of organization and consent fees.
89
For the years ended
December 31, 2018
,
2017
and
2016
, amortization of intangible assets was
$1.1 million
,
$1.5 million
and
$1.9 million
, respectively, for both AWR and GSWC. Estimated future consolidated amortization expenses related to intangible assets for the succeeding five years are (in thousands):
|
|
Amortization
Expense
|
|||
|
2019
|
$
|
189
|
|
|
|
2020
|
90
|
|
||
|
2021
|
12
|
|
||
|
2022
|
12
|
|
||
|
2023
|
12
|
|
||
|
Total
|
$
|
315
|
|
|
Asset Retirement Obligations
:
The following is a reconciliation of the beginning and ending aggregate carrying amount of asset retirement obligations, which are included in “Other Credits” on the balance sheets as of
December 31, 2018
and
2017
:
|
(dollars in thousands)
|
GSWC
|
|||
|
Obligation at December 31, 2016
|
$
|
4,393
|
|
|
|
Additional liabilities incurred
|
562
|
|
||
|
Liabilities settled
|
(229
|
)
|
||
|
Accretion
|
237
|
|
||
|
Obligation at December 31, 2017
|
$
|
4,963
|
|
|
|
Additional liabilities incurred
|
256
|
|
||
|
Liabilities settled
|
(46
|
)
|
||
|
Accretion
|
55
|
|
||
|
Obligation at December 31, 2018
|
$
|
5,228
|
|
|
Note 5 — Derivative Instruments
GSWC's electric division, BVES, purchases power under long-term contracts at a fixed cost depending on the amount of power and the period during which the power is purchased under such contracts. In December 2014, the CPUC approved an application that allowed BVES to enter into long-term purchased power contracts with energy providers, which BVES executed in December 2014. BVES began taking power under these long-term contracts effective January 1, 2015 at a fixed cost over
three
and
five
-year terms depending on the amount of power and period during which the power is purchased under the contracts.
The long-term contracts executed in December 2014 are subject to the accounting guidance for derivatives and require mark-to-market derivative accounting. Among other things, the CPUC also authorized BVES to establish a regulatory asset and liability memorandum account to offset the mark-to-market entries required by the accounting guidance. Accordingly, all unrealized gains and losses generated from the purchased power contracts executed in December 2014 are deferred on a monthly basis into a non-interest bearing regulatory memorandum account that tracks the changes in fair value of the derivative throughout the term of the contract. As a result, these unrealized gains and losses do not impact GSWC’s earnings. The
three
-year contract expired on December 31, 2017. Registrant intends to enter into new purchased power contracts, subject to CPUC approval, once the five-year term contract expires in November 2019. As of
December 31, 2018
, there was a
$311,000
unrealized loss in the memorandum account, with a corresponding unrealized loss liability for the
five
-year purchased power contract as a result of the fixed prices being greater than the futures energy prices. The notional volume of derivatives remaining under this long-term contract as of
December 31, 2018
was approximately
96,000
megawatt hours.
As previously discussed in Note 1, the accounting guidance for fair value measurements establishes a framework for measuring fair value and requires fair value measurements to be classified and disclosed in one of three levels. Registrant’s valuation model utilizes various inputs that include quoted market prices for energy over the duration of the contract. The market prices used to determine the fair value for this derivative instrument were estimated based on independent sources such as broker quotes and publications that are not observable in or corroborated by the market. Registrant received
one
broker quote to determine the fair value of its derivative instrument. When such inputs have a significant impact on the measurement of fair value, the instrument is categorized as Level 3. Accordingly, the valuation of the derivative on Registrant’s purchased
90
power contract has been classified as Level 3 for all periods presented. The following table presents changes in the fair value of GSWC’s derivatives for the years ended
December 31, 2018
and
2017
:
|
(dollars in thousands)
|
2018
|
2017
|
||||||
|
Balance, at beginning of the period
|
$
|
(2,941
|
)
|
$
|
(4,901
|
)
|
||
|
Unrealized gain on purchased power contracts
|
2,630
|
|
1,960
|
|
||||
|
Balance, at end of the period
|
$
|
(311
|
)
|
$
|
(2,941
|
)
|
||
Note 6 — Military Privatization
Each of the Military Utility Privatization Subsidiaries have entered into a service contract(s) with the U.S. government to operate and maintain, as well as perform construction activities to renew and replace, the water and/or wastewater systems at a military base or bases. The amounts charged for these services are based upon the terms of the
50
-year contract between ASUS or the Military Utility Privatization Subsidiaries and the U.S. government. Under the terms of each of these agreements, the Military Utility Privatization Subsidiaries agree to operate and maintain the water and/or wastewater systems for: (i) a monthly net fixed-price for operation and maintenance, and (ii) an amount to cover renewal and replacement capital work. In addition, these contracts may also include firm, fixed-priced initial capital upgrade projects to upgrade the existing infrastructure. Contract modifications are also issued for other necessary capital upgrades to the existing infrastructure approved by the U.S. government.
Under the terms of each of these contracts, prices are subject to an economic price adjustment ("EPA") provision, on an annual basis. Prices may also be equitably adjusted for changes in law and other circumstances. During 2018, the U.S. government issued contract modifications for the majority of ASUS's
50
-year contracts addressing the impacts of the Tax Act. The modifications did not result in a material impact to ASUS's results for the year ended December 31, 2018. ASUS is permitted to file, and has filed, requests for equitable adjustment.
Each of the contracts may be subject to termination, in whole or in part, prior to the end of the
50
-year term for convenience of the U.S. government or as a result of default or nonperformance by the Military Utility Privatization Subsidiaries.
On July 1, 2018, ASUS assumed the operation, maintenance and construction management of the water distribution and wastewater collection and treatment facilities at Fort Riley, a United States Army installation located in Kansas. The
50
-year contract is subject to annual economic price adjustments. On June 15, 2017, ASUS assumed operations of the water and wastewater systems at Eglin AFB in Florida. This contract is also subject to annual economic price adjustments.
ASUS has experienced delays in receiving EPAs as provided for under its
50
-year contracts. Because of the delays, EPAs, when finally approved, are retroactive. During 2018, the U.S. government approved EPAs at seven of the bases served. In some cases, these EPAs included retroactive operation and maintenance management fees for prior periods. For the year ended
December 31, 2018
, retroactive operation and maintenance management fees related to periods prior to
2018
were immaterial. For the year ended
December 31, 2017
, ASUS recorded approximately
$1.0 million
in retroactive operation and maintenance management fees and pretax operating income related to periods prior to
2017
.
Note 7 — Earnings Per Share and Capital Stock
In accordance with the accounting guidance for participating securities and earnings per share (“EPS”), Registrant uses the “two-class” method of computing EPS. The “two-class” method is an earnings allocation formula that determines EPS for each class of common stock and participating security. AWR has participating securities related to restricted stock units that earn dividend equivalents on an equal basis with AWR’s Common Shares that have been issued under AWR’s 2000, 2008 and 2016 employee plans, and the 2003 and 2013 directors' plans. In applying the “two-class” method, undistributed earnings are allocated to both common shares and participating securities.
91
The following is a reconciliation of Registrant’s net income and weighted average Common Shares outstanding for calculating basic net income per share:
|
Basic:
|
For The Years Ended December 31,
|
|||||||||||
|
(in thousands, except per share amounts)
|
2018
|
2017
|
2016
|
|||||||||
|
Net income
|
$
|
63,871
|
|
$
|
69,367
|
|
$
|
59,743
|
|
|||
|
Less: (a) Distributed earnings to common shareholders
|
38,937
|
|
36,417
|
|
33,408
|
|
||||||
|
Distributed earnings to participating securities
|
204
|
|
197
|
|
187
|
|
||||||
|
Undistributed earnings
|
24,730
|
|
32,753
|
|
26,148
|
|
||||||
|
(b) Undistributed earnings allocated to common shareholders
|
24,601
|
|
32,577
|
|
26,003
|
|
||||||
|
Undistributed earnings allocated to participating securities
|
129
|
|
176
|
|
145
|
|
||||||
|
Total income available to common shareholders, basic (a)+(b)
|
$
|
63,538
|
|
$
|
68,994
|
|
$
|
59,411
|
|
|||
|
Weighted average Common Shares outstanding, basic
|
36,733
|
|
36,638
|
|
36,552
|
|
||||||
|
Basic earnings per Common Share
|
$
|
1.73
|
|
$
|
1.88
|
|
$
|
1.63
|
|
|||
Diluted EPS is based upon the weighted average number of Common Shares, including both outstanding shares and shares potentially issuable in connection with stock options and restricted stock units granted under AWR’s 2000, 2008 and 2016 employee plans, and the 2003 and 2013 directors' plans, and net income. At
December 31, 2018
, there were
35,560
stock options outstanding under the 2000 and 2008 employee stock option plans. As of January 28, 2018, all stock options remaining outstanding under the 2000 plan were canceled in accordance with the terms of the 2000 plan. At
December 31, 2018
, there were also
197,896
restricted stock units outstanding including performance shares awarded to officers of the Registrant.
The following is a reconciliation of Registrant’s net income and weighted average Common Shares outstanding for calculating diluted net income per share:
|
Diluted:
|
For The Years Ended December 31,
|
|||||||||||
|
(in thousands, except per share amounts)
|
2018
|
2017
|
2016
|
|||||||||
|
Common shareholders earnings, basic
|
$
|
63,538
|
|
$
|
68,994
|
|
$
|
59,411
|
|
|||
|
Undistributed earnings for dilutive stock options and restricted stock units
|
129
|
|
176
|
|
145
|
|
||||||
|
Total common shareholders earnings, diluted
|
$
|
63,667
|
|
$
|
69,170
|
|
$
|
59,556
|
|
|||
|
Weighted average Common Shares outstanding, basic
|
36,733
|
|
36,638
|
|
36,552
|
|
||||||
|
Stock-based compensation
(1)
|
203
|
|
206
|
|
198
|
|
||||||
|
Weighted average Common Shares outstanding, diluted
|
36,936
|
|
36,844
|
|
36,750
|
|
||||||
|
|
|
|
|
|
|
|||||||
|
Diluted earnings per Common Share
|
$
|
1.72
|
|
$
|
1.88
|
|
$
|
1.62
|
|
|||
(1)
In applying the treasury stock method of reflecting the dilutive effect of outstanding stock-based compensation in the calculation of diluted EPS,
35,560
stock options and
197,896
restricted stock units, including performance awards, at
December 31, 2018
were deemed to be outstanding in accordance with accounting guidance on earnings per share.
During the years ended
December 31, 2018
,
2017
and
2016
, AWR issued Common Shares totaling
44,906
,
56,498
and
56,900
, respectively, under AWR's employee stock incentive plans and the non-employee directors' plans. In addition, during the years ended
December 31, 2018
,
2017
and
2016
, AWR issued
32,142
,
52,936
and
12,546
Common Shares for approximately
$546,000
,
$909,000
and
$235,000
, respectively, as a result of the exercise of stock options. During
2018
,
2017
and
2016
,
no
cash proceeds received by AWR as a result of the exercise of stock options were distributed to any of AWR's subsidiaries. AWR has not issued any Common Shares during 2018, 2017 and 2016 under AWR's Common Share Purchase and Dividend Reinvestment Plan ("DRP") and the 401(k) Plan. Shares reserved for the 401(k) Plan are in relation to AWR’s matching contributions and investment by participants. As of
December 31, 2018
, there were
1,055,948
and
387,300
Common Shares authorized for issuance directly by AWR but unissued under the DRP and the 401(k) Plan, respectively.
GSWC’s outstanding Common Shares are owned entirely by its parent, AWR. To the extent GSWC does not reimburse AWR for stock-based compensation awarded under various stock compensation plans, such amounts increase the value of GSWC’s common shareholder’s equity.
92
Note 8 — Dividend Limitations
GSWC is subject to contractual restrictions on its ability to pay dividends. GSWC’s maximum ability to pay dividends is restricted by certain Note Agreements to the sum of
$21.0 million
plus
100%
of consolidated net income from various dates plus the aggregate net cash proceeds received from capital stock offerings or other instruments convertible into capital stock from various dates. Under the most restrictive of the Note Agreements,
$427.4 million
was available to pay dividends to AWR as of
December 31, 2018
. GSWC is also prohibited from paying dividends if, after giving effect to the dividend, its total indebtedness to capitalization ratio (as defined) would be more than
0.6667
-to-1. Dividends in the amount of
$68.9 million
,
$27.7 million
and
$25.5 million
were paid to AWR by GSWC during the years ended
December 31, 2018
,
2017
and
2016
, respectively.
The ability of AWR, ASUS and GSWC to pay dividends is also restricted by California law. Under California law, AWR, GSWC and ASUS are each permitted to distribute dividends to its shareholders so long as the Board of Directors determines, in good faith, that either: (i) the value of the corporation’s assets equals or exceeds the sum of its total liabilities immediately after the dividend, or (ii) its retained earnings equals or exceeds the amount of the distribution. Under the least restrictive of the California tests, approximately
$304.5 million
was available to pay dividends to AWR’s shareholders at
December 31, 2018
. Approximately
$211.2 million
was available for GSWC to pay dividends to AWR at
December 31, 2018
. Approximately
$67.3 million
was available for ASUS to pay dividends to AWR as of
December 31, 2018
to the extent that the subsidiaries of ASUS are able to pay dividends in that amount to ASUS under applicable state laws.
Note 9 — Bank Debt
AWR has access to a
$150.0 million
credit facility, which was renewed in May 2018. All amounts borrowed by AWR under the renewed facility are contractually due in May 2023 pursuant to the new terms and are generally priced off a spread to LIBOR. The aggregate effective amount that may be outstanding under letters of credit is
$25.0 million
. AWR has obtained letters of credit, primarily for GSWC, in the aggregate amount of
$940,000
, with fees of
0.65%
including: (i) letters of credit in an aggregate amount of
$340,000
as security for GSWC’s business automobile insurance policy; (ii) a letter of credit, in an amount of
$585,000
as security for the purchase of power; and (iii) a
$15,000
irrevocable letter of credit pursuant to a franchise agreement with the City of Rancho Cordova. Letters of credit outstanding reduce the amount that may be borrowed under the revolving credit facility. AWR is not required to maintain any compensating balances.
Loans may be obtained under this credit facility at the option of AWR and bear interest at rates based on credit ratings and
Euro rate
margins. In July 2018, Standard and Poor’s Global Ratings (“S&P”) affirmed an A+ credit rating with a stable outlook on both AWR and GSWC. S&P’s debt ratings range from AAA (highest possible) to D (obligation is in default). In January 2019, Moody's Investors Service ("Moody's") affirmed its A2 rating with a positive outlook for GSWC.
At
December 31, 2018
, there was
$95.5 million
outstanding under the credit facility. At times, AWR borrows under this facility and provides loans to its subsidiaries in support of their operations, on terms that are similar to that of the credit facility. AWR’s borrowing activities (excluding letters of credit) for the years ending
December 31, 2018
and
2017
were as follows:
|
|
December 31,
|
|||||||
|
(in thousands, except percent)
|
2018
|
2017
|
||||||
|
Balance Outstanding at December 31,
|
$
|
95,500
|
|
$
|
59,000
|
|
||
|
Interest Rate at December 31,
|
3.19
|
%
|
2.28
|
%
|
||||
|
Average Amount Outstanding
|
$
|
69,559
|
|
$
|
65,242
|
|
||
|
Weighted Average Annual Interest Rate
|
2.66
|
%
|
1.69
|
%
|
||||
|
Maximum Amount Outstanding
|
$
|
95,500
|
|
$
|
102,500
|
|
||
All of the letters of credit are issued pursuant to the revolving credit facility. The revolving credit facility contains restrictions on prepayments, disposition of property, mergers, liens and negative pledges, indebtedness and guaranty obligations, transactions with affiliates, minimum interest coverage requirements, a maximum debt to capitalization ratio and a minimum debt rating. Pursuant to the credit agreement, AWR must maintain a minimum interest coverage ratio of
3.25
times interest expense, a maximum total funded debt ratio of
0.65
to 1.00 and a minimum Moody’s Investor Service or S&P debt rating of Baa3 or BBB-, respectively. As of
December 31, 2018
,
2017
and
2016
, AWR was in compliance with these requirements. As of
December 31, 2018
, AWR had an interest coverage ratio of
6.23
times interest expense, a debt ratio of
0.43
to 1.00 and a debt rating of A+ by S&P.
93
Note 10 — Long-Term Debt
Registrant’s long-term debt consists primarily of notes and debentures of GSWC. Registrant summarizes its long-term debt in the Statements of Capitalization. GSWC does not currently have any outstanding mortgages or other encumbrances on its properties.
Each of the private placement notes issued by GSWC contain various restrictions. Private placement notes issued in the amount of
$28 million
due in 2031 contain restrictions on the payment of dividends, minimum interest coverage requirements, a maximum total indebtedness to capitalization ratio and a negative pledge. Pursuant to the terms of these notes, GSWC must maintain a minimum interest coverage ratio of
two
times interest expense. As of
December 31, 2018
, GSWC had an interest coverage ratio of over
four
times interest expense.
In December 2014, GSWC issued
$15.0
million in
3.45%
private placement senior notes due in 2029. In 2005 and 2009, GSWC issued two senior private placement notes to CoBank, ACB ("CoBank") due in 2028 and 2019, respectively. Pursuant to the terms of these three notes, GSWC must maintain a total indebtedness to capitalization ratio (as defined) of less than
0.6667
-to-1 and a total indebtedness to earnings before income taxes, depreciation and amortization ("EBITDA") of less than
8
-to-1. As of
December 31, 2018
, GSWC had a total indebtedness to capitalization ratio of
0.4298
-to-1 and a total indebtedness to EBITDA of
3.1
-to-1.
Certain long-term debt issues outstanding as of
December 31, 2018
can be redeemed, in whole or in part, at the option of GSWC subject to redemption schedules embedded in the agreements particular to each redeemable issue. The
9.56%
notes are subject to a make-whole premium based on
55
basis points above the applicable Treasury Yield if redeemed prior to 2021. After 2021, the maximum redemption premium is
3%
of par value. The
5.87%
and
6.7%
senior notes with Co-Bank are subject to a make-whole premium based on the difference between Co-Bank’s cost of funds on the date of purchase and Co-Bank’s cost of funds on the date of redemption plus
0.5%
. The
$15.0
million,
3.45%
senior notes due in 2029 have similar redemption premiums.
In October 2009, GSWC entered into an agreement with the California Department of Health (“CDPH”) whereby CDPH agreed to provide funds to GSWC of up to
$9.0 million
under the American Recovery and Reinvestment Act. Proceeds from the funds received were used to reimburse GSWC for capital costs incurred to install water meters to convert customers in GSWC’s Arden-Cordova district from non-metered service to metered service. GSWC received a total of
$8.6 million
in reimbursements from the CDPH, half of which was recorded as a contribution in aid of construction and the other half as long-term debt in accordance with the terms of the agreement. The loan portion bears interest at a rate of
2.5%
and is payable over
20 years
beginning in 2013. A surcharge to recover from customers the debt service cost on this loan was approved by the CPUC and implemented in 2013.
Annual maturities of all long-term debt at
December 31, 2018
are as follows (in thousands):
|
2019
|
$
|
40,320
|
|
|
2020
|
345
|
|
|
|
2021
|
365
|
|
|
|
2022
|
390
|
|
|
|
2023
|
404
|
|
|
|
Thereafter
|
283,154
|
|
|
|
Total
|
$
|
324,978
|
|
Note 11 — Taxes on Income
Registrant records deferred income taxes for temporary differences pursuant to the accounting guidance that addresses items recognized for income tax purposes in a different period from when these items are reported in the financial statements. These items include differences in net asset basis (primarily related to differences in depreciation lives and methods, and differences in capitalization methods) and the treatment of certain regulatory balancing accounts and construction contributions and advances. The accounting guidance for income taxes requires that rate-regulated enterprises record deferred income taxes and offsetting regulatory liabilities and assets for temporary differences where the rate regulator has prescribed flow-through treatment for ratemaking purposes (Note 3). Deferred investment tax credits (“ITC”) are amortized ratably to deferred tax expense over the remaining lives of the property that gave rise to these credits.
GSWC is included in both AWR’s consolidated federal income tax and its combined California state franchise tax returns. The impact of California’s unitary apportionment on the amount of AWR’s California income tax liability is a function of both the profitability of AWR’s non-California activities and the proportion of AWR’s California sales to its total sales. GSWC’s income tax expense is computed as if GSWC were autonomous and separately files its income tax returns, which is consistent with the method adopted by the CPUC in setting GSWC’s customer rates.
94
On December 22, 2017, the Tax Cuts and Jobs Act (the "Tax Act") was signed into federal law. The provisions of this major tax reform were generally effective on January 1, 2018. Among its significant provisions, the Tax Act (i) reduced the federal corporate income tax rate from
35%
to
21%
; (ii) eliminated bonus depreciation for regulated utilities, while allowing
100%
expensing for the cost of qualified property for non-regulated businesses; (iii) eliminated the provision that treated contributions in aid of construction provided to regulated water utilities as non-taxable; (iv) eliminated the domestic production activities deduction, and (v) limits the amount of net interest that can be deducted; however, this limitation is not applicable to regulated utilities and, therefore has not had, nor is it anticipated to have, a material impact to Registrant’s ability to deduct net interest.
Pursuant to ASC Topic 740,
"Income Taxes"
, the effects of changes in tax laws must be recognized within the period in which the tax law is enacted. This required AWR and GSWC to record an adjustment in its 2017 financial statements to reflect the impact of the reduction in the corporate income tax rate from
35%
to
21%
on its cumulative deferred income-tax balances and its tax-related regulatory assets/liabilities. The remeasurement of Registrant’s deferred income-tax balances and its tax-related regulatory assets/liabilities did not have a significant impact to Registrant's consolidated results of operations in 2017 since the majority of the remeasurement was related to GSWC’s rate-regulated activities and was offset by a corresponding increase to a regulatory liability (Note 3). Registrant has remeasured its deferred tax balances to account for the effects of the Tax Act, which are reflected in the December 31, 2018 financial statements. There were no material updates during the year ended December 31, 2018 to the remeasurement of Registrant's deferred income-tax balances and its tax-related regulatory assets/liabilities in accordance with Staff Accounting Bulletin 118.
The significant components of the deferred tax assets and liabilities as reflected in the balance sheets at
December 31, 2018
and
2017
are:
|
|
AWR
|
GSWC
|
||||||||||||||
|
|
December 31,
|
December 31,
|
||||||||||||||
|
(dollars in thousands)
|
2018
|
2017
|
2018
|
2017
|
||||||||||||
|
Deferred tax assets:
|
|
|
|
|
|
|
|
|
||||||||
|
Regulatory-liability-related
(1)
|
$
|
33,419
|
|
$
|
34,567
|
|
$
|
33,419
|
|
$
|
34,567
|
|
||||
|
Contributions and advances
|
5,281
|
|
4,679
|
|
5,666
|
|
5,022
|
|
||||||||
|
Other
|
2,988
|
|
1,934
|
|
3,310
|
|
1,625
|
|
||||||||
|
Total deferred tax assets
|
$
|
41,688
|
|
$
|
41,180
|
|
$
|
42,395
|
|
$
|
41,214
|
|
||||
|
Deferred tax liabilities:
|
|
|
|
|
|
|
|
|
||||||||
|
Fixed assets
|
$
|
(131,413
|
)
|
$
|
(130,115
|
)
|
$
|
(135,617
|
)
|
$
|
(134,437
|
)
|
||||
|
Regulatory-asset-related: depreciation and other
|
(18,146
|
)
|
(16,851
|
)
|
(18,146
|
)
|
(16,851
|
)
|
||||||||
|
Balancing and memorandum accounts (non-flow-through)
|
(6,325
|
)
|
(9,905
|
)
|
(6,873
|
)
|
(10,706
|
)
|
||||||||
|
Total deferred tax liabilities
|
(155,884
|
)
|
(156,871
|
)
|
(160,636
|
)
|
(161,994
|
)
|
||||||||
|
Accumulated deferred income taxes - net
|
$
|
(114,196
|
)
|
$
|
(115,691
|
)
|
$
|
(118,241
|
)
|
$
|
(120,780
|
)
|
||||
(1)
Primarily represents the gross-up portion of the deferred income tax (on the excess-deferred-tax regulatory liability) brought about by the Tax Act’s reduction in the federal income tax rate.
The current and deferred components of income tax expense are as follows:
|
|
AWR
|
|||||||||||
|
|
Year Ended December 31,
|
|||||||||||
|
(dollars in thousands)
|
2018
|
2017
|
2016
|
|||||||||
|
Current
|
|
|
|
|
|
|
||||||
|
Federal
|
$
|
17,252
|
|
$
|
20,978
|
|
$
|
2,297
|
|
|||
|
State
|
6,538
|
|
5,844
|
|
4,798
|
|
||||||
|
Total current tax expense
|
$
|
23,790
|
|
$
|
26,822
|
|
$
|
7,095
|
|
|||
|
Deferred
|
|
|
|
|
|
|
||||||
|
Federal
|
$
|
(4,334
|
)
|
$
|
11,543
|
|
$
|
26,715
|
|
|||
|
State
|
(1,439
|
)
|
609
|
|
925
|
|
||||||
|
Total deferred tax (benefit) expense
|
(5,773
|
)
|
12,152
|
|
27,640
|
|
||||||
|
Total income tax expense
|
$
|
18,017
|
|
$
|
38,974
|
|
$
|
34,735
|
|
|||
95
|
|
GSWC
|
|||||||||||
|
|
Year Ended December 31,
|
|||||||||||
|
(dollars in thousands)
|
2018
|
2017
|
2016
|
|||||||||
|
Current
|
|
|
|
|
|
|
||||||
|
Federal
|
$
|
14,488
|
|
$
|
15,044
|
|
$
|
(3,115
|
)
|
|||
|
State
|
5,932
|
|
5,045
|
|
3,625
|
|
||||||
|
Total current tax expense
|
$
|
20,420
|
|
$
|
20,089
|
|
$
|
510
|
|
|||
|
Deferred
|
|
|
|
|
|
|
||||||
|
Federal
|
$
|
(5,531
|
)
|
$
|
11,770
|
|
$
|
25,864
|
|
|||
|
State
|
(1,286
|
)
|
2,200
|
|
2,235
|
|
||||||
|
Total deferred tax (benefit) expense
|
(6,817
|
)
|
13,970
|
|
28,099
|
|
||||||
|
Total income tax expense
|
$
|
13,603
|
|
$
|
34,059
|
|
$
|
28,609
|
|
|||
The AWR and GSWC effective tax rates differ from the federal statutory tax rate primarily due to (i) state taxes, (ii) permanent differences including the excess tax benefits from share-based payments, which were reflected in the income statements and resulted in a reduction to income tax expense during the years ended
December 31, 2018
and
2017
, (iii) commencement of the amortization of the excess deferred income tax liability brought about by the lower federal corporate income tax rate, and (iv) differences between book and taxable income that are treated as flow-through adjustments in accordance with regulatory requirements (principally from plant, rate-case, and compensation expenses). As a regulated utility, GSWC treats certain temporary differences as flow-through in computing its income tax expense consistent with the income tax method used in its CPUC-jurisdiction ratemaking. Flow-through items either increase or decrease tax expense and thus impact the ETR. The reconciliations of the effective tax rates to the federal statutory rate are as follows:
|
|
AWR
|
|||||||||||
|
|
Year Ended December 31,
|
|||||||||||
|
(dollars in thousands)
|
2018
|
2017
|
2016
|
|||||||||
|
Federal taxes on pretax income at statutory rate (21% in 2018; 35% in 2017 and 2016)
|
$
|
17,196
|
|
$
|
37,919
|
|
$
|
33,067
|
|
|||
|
Increase (decrease) in taxes resulting from:
|
|
|
||||||||||
|
State income tax, net of federal benefit
|
3,693
|
|
4,382
|
|
3,029
|
|
||||||
|
Change in tax rate
|
(14
|
)
|
(82
|
)
|
—
|
|
||||||
|
Excess deferred tax amortization
|
(2,101
|
)
|
—
|
|
—
|
|
||||||
|
Flow-through on fixed assets
|
429
|
|
845
|
|
994
|
|
||||||
|
Flow-through on pension costs
|
373
|
|
412
|
|
(247
|
)
|
||||||
|
Flow-through on removal costs
|
(1,445
|
)
|
(1,980
|
)
|
(2,068
|
)
|
||||||
|
Domestic production activities deduction
|
(26
|
)
|
(1,421
|
)
|
(78
|
)
|
||||||
|
Investment tax credit
|
(69
|
)
|
(93
|
)
|
(83
|
)
|
||||||
|
Other – net
|
(19
|
)
|
(1,008
|
)
|
121
|
|
||||||
|
Total income tax expense from operations
|
$
|
18,017
|
|
$
|
38,974
|
|
$
|
34,735
|
|
|||
|
Pretax income from operations
|
$
|
81,888
|
|
$
|
108,341
|
|
$
|
94,478
|
|
|||
|
Effective income tax rate
|
22.0
|
%
|
36.0
|
%
|
36.8
|
%
|
||||||
96
|
|
GSWC
|
|||||||||||
|
Year Ended December 31,
|
||||||||||||
|
(dollars in thousands)
|
2018
|
2017
|
2016
|
|||||||||
|
Federal taxes on pretax income at statutory rate (21% in 2018; 35% in 2017 and 2016)
|
$
|
12,939
|
|
$
|
30,736
|
|
$
|
26,452
|
|
|||
|
Increase (decrease) in taxes resulting from:
|
|
|
||||||||||
|
State income tax, net of federal benefit
|
3,335
|
|
4,924
|
|
3,118
|
|
||||||
|
Change in tax rate
|
—
|
|
1,063
|
|
—
|
|
||||||
|
Excess deferred tax amortization
|
(2,101
|
)
|
—
|
|
—
|
|
||||||
|
Flow-through on fixed assets
|
429
|
|
845
|
|
994
|
|
||||||
|
Flow-through on pension costs
|
373
|
|
412
|
|
(247
|
)
|
||||||
|
Flow-through on removal costs
|
(1,445
|
)
|
(1,980
|
)
|
(2,068
|
)
|
||||||
|
Domestic production activities deduction
|
(25
|
)
|
(1,148
|
)
|
—
|
|
||||||
|
Investment tax credit
|
(69
|
)
|
(93
|
)
|
(82
|
)
|
||||||
|
Other – net
|
167
|
|
(700
|
)
|
442
|
|
||||||
|
Total income tax expense from operations
|
$
|
13,603
|
|
$
|
34,059
|
|
$
|
28,609
|
|
|||
|
Pretax income from operations
|
$
|
61,615
|
|
$
|
87,816
|
|
$
|
75,578
|
|
|||
|
Effective income tax rate
|
22.1
|
%
|
38.8
|
%
|
37.9
|
%
|
||||||
AWR and GSWC had
no
unrecognized tax benefits at December 31,
2018
,
2017
and
2016
.
Registrant’s policy is to classify interest on income tax over/underpayments in interest income/expense and penalties in “other operating expenses.” Registrant did not have any material interest receivables/payables from/to taxing authorities as of December 31,
2018
and
2017
, nor did it recognize any material interest income/expense or accrue any material tax-related penalties during the years ended December 31,
2018
,
2017
and
2016
.
Registrant files federal, California and various other state income tax returns. The Internal Revenue Service (“IRS”) completed its examination of AWR’s federal 2010 through 2012 refund claims in February 2016 and issued a refund to AWR of approximately
$2.1 million
. AWR’s 2015 - 2017 tax years remain subject to examination by the IRS. AWR filed refund claims with the California Franchise Tax Board ("FTB") for the 2002 through 2008 tax years in connection with the matters reflected on the federal refund claims along with other state tax items. In the first quarter of 2017, the FTB issued a refund to AWR for the 2002 - 2004 claims of approximately
$2.2 million
. The FTB continues to review the 2005 - 2008 refund claims. The 2009 - 2017 tax years remain subject to examination by the FTB.
97
Note 12 — Employee Benefit Plans
Pension and Post-Retirement Medical Plans
:
Registrant maintains a defined benefit pension plan (the “Pension Plan”) that provides eligible employees (those aged
21
and older, hired before January 1, 2011) monthly benefits upon retirement based on average salaries and length of service. The eligibility requirement to begin receiving these benefits is
5
years of vested service. The normal retirement benefit is equal to
2%
of the
5
highest consecutive years’ average earnings multiplied by the number of years of credited service, up to a maximum of
40
, reduced by a percentage of primary Social Security benefits. There is also an early retirement option. Annual contributions are made to the Pension Plan, which comply with the funding requirements of the Employee Retirement Income Security Act (“ERISA”). At
December 31, 2018
, Registrant had
945
participants in the Pension Plan.
Employees hired or rehired after December 31, 2010 are eligible to participate in a defined contribution plan. Registrant's existing 401(k) Investment Incentive Program was amended to include this defined contribution plan. Under this plan, Registrant provides a contribution ranging from
3%
to
5.25%
of eligible pay each pay period into investment vehicles offered by the plan’s trustee. Full vesting under this plan occurs upon
3
years of service. Employees hired before January 1, 2011 continue to participate in and accrue benefits under the terms of the Pension Plan.
Registrant also provides post-retirement medical benefits for all active employees hired before February of 1995 through a medical insurance plan. Eligible employees, who retire prior to age 65, and/or their spouses, are able to retain the benefits under the plan for active employees until reaching age 65. Eligible employees upon reaching age 65, and those eligible employees retiring at or after age 65, and/or their spouses, receive coverage through a Medicare supplement insurance policy paid for by Registrant subject to an annual cap limit. Registrant’s post-retirement medical plan does not provide prescription drug benefits to Medicare-eligible employees and is not affected by the Medicare Prescription Drug Improvement and Modernization Act of 2003.
In accordance with the accounting guidance for the effects of certain types of regulation, Registrant has established a regulatory asset for its underfunded position in its pension and post-retirement medical plans that is expected to be recovered through rates in future periods. The changes in actuarial gains and losses, prior service costs and transition assets or obligations pertaining to the regulatory asset are recognized as an adjustment to the regulatory asset account as these amounts are recognized as components of net periodic pension costs each year and in the rate-making process.
The following table sets forth the Pension Plan’s and post-retirement medical plan’s funded status and amounts recognized in Registrant’s balance sheets and the components of net pension cost and accrued liability at
December 31, 2018
and
2017
:
|
|
Pension Benefits
|
Post-Retirement Medical
Benefits
|
||||||||||||||
|
(dollars in thousands)
|
2018
|
2017
|
2018
|
2017
|
||||||||||||
|
Change in Projected Benefit Obligation:
|
|
|
|
|
|
|
|
|
||||||||
|
Projected benefit obligation at beginning of year
|
$
|
207,690
|
|
$
|
180,364
|
|
$
|
8,491
|
|
$
|
8,802
|
|
||||
|
Service cost
|
5,342
|
|
4,999
|
|
218
|
|
227
|
|
||||||||
|
Interest cost
|
7,646
|
|
7,904
|
|
292
|
|
324
|
|
||||||||
|
Plan amendment
|
3,626
|
|
—
|
|
—
|
|
—
|
|
||||||||
|
Actuarial (gain) loss
|
(21,717
|
)
|
20,397
|
|
(701
|
)
|
(355
|
)
|
||||||||
|
Benefits/expenses paid
|
(6,505
|
)
|
(5,974
|
)
|
(414
|
)
|
(507
|
)
|
||||||||
|
Projected benefit obligation at end of year
|
$
|
196,082
|
|
$
|
207,690
|
|
$
|
7,886
|
|
$
|
8,491
|
|
||||
|
Changes in Plan Assets:
|
|
|
|
|
|
|
|
|
||||||||
|
Fair value of plan assets at beginning of year
|
$
|
173,648
|
|
$
|
150,872
|
|
$
|
11,053
|
|
$
|
10,538
|
|
||||
|
Actual return on plan assets
|
(10,626
|
)
|
22,246
|
|
(629
|
)
|
1,022
|
|
||||||||
|
Employer contributions
|
6,012
|
|
6,504
|
|
—
|
|
—
|
|
||||||||
|
Benefits/expenses paid
|
(6,505
|
)
|
(5,974
|
)
|
(414
|
)
|
(507
|
)
|
||||||||
|
Fair value of plan assets at end of year
|
$
|
162,529
|
|
$
|
173,648
|
|
$
|
10,010
|
|
$
|
11,053
|
|
||||
|
Funded Status:
|
|
|
|
|
|
|
|
|
||||||||
|
Net amount recognized as accrued pension cost
|
$
|
(33,553
|
)
|
$
|
(34,042
|
)
|
$
|
2,124
|
|
$
|
2,562
|
|
||||
98
|
Pension Benefits
|
Post-Retirement
Medical Benefits
|
|||||||||||||||
|
(dollars in thousands)
|
2018
|
2017
|
2018
|
2017
|
||||||||||||
|
Amounts recognized on the balance sheets:
|
|
|
|
|
|
|
|
|
||||||||
|
Non-current assets
|
$
|
—
|
|
$
|
—
|
|
$
|
2,124
|
|
$
|
2,562
|
|
||||
|
Current liabilities
|
—
|
|
—
|
|
—
|
|
—
|
|
||||||||
|
Non-current liabilities
|
(33,553
|
)
|
(34,042
|
)
|
—
|
|
—
|
|
||||||||
|
Net amount recognized
|
$
|
(33,553
|
)
|
$
|
(34,042
|
)
|
$
|
2,124
|
|
$
|
2,562
|
|
||||
|
Amounts recognized in regulatory assets consist of:
|
|
|
|
|
|
|
|
|
||||||||
|
Prior service cost (credit)
|
$
|
3,626
|
|
$
|
—
|
|
$
|
—
|
|
$
|
—
|
|
||||
|
Net (gain) loss
|
31,587
|
|
32,761
|
|
(4,459
|
)
|
(5,650
|
)
|
||||||||
|
Regulatory assets (liabilities)
|
35,213
|
|
32,761
|
|
(4,459
|
)
|
(5,650
|
)
|
||||||||
|
Unfunded accrued pension cost
|
(1,660
|
)
|
1,281
|
|
2,335
|
|
3,088
|
|
||||||||
|
Net liability (asset) recognized
|
$
|
33,553
|
|
$
|
34,042
|
|
$
|
(2,124
|
)
|
$
|
(2,562
|
)
|
||||
|
Changes in plan assets and benefit obligations recognized in regulatory assets:
|
|
|
|
|
|
|
|
|
||||||||
|
Regulatory asset at beginning of year
|
$
|
32,761
|
|
$
|
25,828
|
|
$
|
(5,650
|
)
|
$
|
(5,515
|
)
|
||||
|
Net loss (gain)
|
81
|
|
7,856
|
|
421
|
|
(910
|
)
|
||||||||
|
New prior service cost
|
3,626
|
|
—
|
|
—
|
|
—
|
|
||||||||
|
Amortization of net gain (loss)
|
(1,255
|
)
|
(923
|
)
|
770
|
|
775
|
|
||||||||
|
Total change in regulatory asset
|
2,452
|
|
6,933
|
|
1,191
|
|
(135
|
)
|
||||||||
|
Regulatory asset (liability) at end of year
|
$
|
35,213
|
|
$
|
32,761
|
|
$
|
(4,459
|
)
|
$
|
(5,650
|
)
|
||||
|
Net periodic pension costs
|
$
|
3,070
|
|
$
|
4,121
|
|
$
|
(752
|
)
|
$
|
(690
|
)
|
||||
|
Change in regulatory asset
|
2,452
|
|
6,933
|
|
1,191
|
|
(135
|
)
|
||||||||
|
Total recognized in net periodic pension cost and regulatory asset (liability)
|
$
|
5,522
|
|
$
|
11,054
|
|
$
|
439
|
|
$
|
(825
|
)
|
||||
|
Estimated amounts that will be amortized from regulatory asset over the next fiscal year:
|
|
|
|
|
|
|
|
|
||||||||
|
Prior service (cost) credit
|
$
|
(434
|
)
|
$
|
—
|
|
$
|
—
|
|
$
|
—
|
|
||||
|
Net gain (loss)
|
$
|
(1,435
|
)
|
$
|
(1,378
|
)
|
$
|
598
|
|
$
|
727
|
|
||||
|
Additional year-end information for plans with an accumulated benefit obligation in excess of plan assets:
|
|
|
|
|
|
|
|
|
||||||||
|
Projected benefit obligation
|
$
|
196,082
|
|
$
|
207,690
|
|
$
|
7,886
|
|
$
|
8,491
|
|
||||
|
Accumulated benefit obligation
|
$
|
183,036
|
|
$
|
190,438
|
|
N/A
|
N/A
|
||||||||
|
Fair value of plan assets
|
$
|
162,529
|
|
$
|
173,648
|
|
$
|
10,010
|
|
$
|
11,053
|
|
||||
|
Weighted-average assumptions used to determine benefit obligations at December 31:
|
|
|
|
|
|
|
|
|
||||||||
|
Discount rate
|
4.43
|
%
|
3.76
|
%
|
4.20
|
%
|
3.52
|
%
|
||||||||
|
Rate of compensation increase
|
*
|
|
*
|
|
N/A
|
|
N/A
|
|
||||||||
* Age-graded ranging from
3.0%
to
8.0%
.
99
The components of net periodic pension and post-retirement benefits cost, before allocation to the overhead pool, for
2018
,
2017
and
2016
are as follows:
|
Pension Benefits
|
Post-Retirement
Medical Benefits
|
|||||||||||||||||||||||
|
(dollars in thousands, except percent)
|
2018
|
2017
|
2016
|
2018
|
2017
|
2016
|
||||||||||||||||||
|
Components of Net Periodic Benefits Cost:
|
|
|
|
|
|
|
|
|
|
|
|
|
||||||||||||
|
Service cost
|
$
|
5,342
|
|
$
|
4,999
|
|
$
|
5,094
|
|
$
|
218
|
|
$
|
227
|
|
$
|
247
|
|
||||||
|
Interest cost
|
7,646
|
|
7,904
|
|
7,910
|
|
292
|
|
324
|
|
371
|
|
||||||||||||
|
Expected return on plan assets
|
(11,172
|
)
|
(9,705
|
)
|
(9,838
|
)
|
(493
|
)
|
(466
|
)
|
(489
|
)
|
||||||||||||
|
Amortization of prior service cost (credit)
|
—
|
|
—
|
|
49
|
|
—
|
|
—
|
|
(34
|
)
|
||||||||||||
|
Amortization of actuarial (gain) loss
|
1,254
|
|
923
|
|
911
|
|
(769
|
)
|
(775
|
)
|
(701
|
)
|
||||||||||||
|
Net periodic pension cost under accounting standards
|
$
|
3,070
|
|
$
|
4,121
|
|
$
|
4,126
|
|
$
|
(752
|
)
|
$
|
(690
|
)
|
$
|
(606
|
)
|
||||||
|
Regulatory adjustment
|
—
|
|
465
|
|
859
|
|
—
|
|
—
|
|
—
|
|
||||||||||||
|
Total expense recognized, before surcharges and allocation to overhead pool
|
$
|
3,070
|
|
$
|
4,586
|
|
$
|
4,985
|
|
$
|
(752
|
)
|
$
|
(690
|
)
|
$
|
(606
|
)
|
||||||
|
Weighted-average assumptions used to determine net periodic cost:
|
|
|
|
|
|
|
|
|
|
|
|
|
||||||||||||
|
Discount rate
|
3.76
|
%
|
4.44
|
%
|
4.65
|
%
|
3.52
|
%
|
3.97
|
%
|
4.25
|
%
|
||||||||||||
|
Expected long-term return on plan assets
|
6.50
|
%
|
6.50
|
%
|
7.00
|
%
|
*
|
|
*
|
|
*
|
|
||||||||||||
|
Rate of compensation increase
|
**
|
|
**
|
|
**
|
|
N/A
|
|
N/A
|
|
N/A
|
|
||||||||||||
*
6.0%
for union plan and
4.2%
for non-union (net of income taxes) in
2018
and 2017 and
7.0%
for union plan and
4.20
% for non-union (net of income taxes) for
2016
.
** Age-graded ranging from
3.0%
to
8.0%
.
Regulatory Adjustment
:
The CPUC authorized GSWC to track differences between the forecasted annual pension expenses adopted in rates for its water and electric regions and the general office, and the actual annual expense to be recorded by GSWC in accordance with the accounting guidance for pension costs. During the years ended
December 31, 2018
,
2017
and
2016
, GSWC's actual expense was lower than the amounts included in water and electric customer rates (including surcharges) by
$1.7 million
,
$583,000
and
$859,000
, respectively. In 2017 and 2016, these annual over-collections were used to recover previously incurred under-collections. The cumulative amounts recorded in the two-way pension balancing accounts are included within the pensions and other post-retirement obligations regulatory assets discussed in Note 3. As of
December 31, 2018
, the two-way pension balancing accounts had a
$3.0 million
cumulative net over-collection included within regulatory assets.
Plan Funded Status
:
The Pension Plan was underfunded at
December 31, 2018
and
2017
. Registrant’s market related value of plan assets is equal to the fair value of plan assets. Past volatile market conditions have affected the value of GSWC’s trust established to fund its future long-term pension benefits. These benefit plan assets and related obligations are measured annually using a December 31 measurement date. Changes in the Pension Plan’s funded status will affect the assets and liabilities recorded on the balance sheet in accordance with accounting guidance on employers’ accounting for defined benefit pension and other post-retirement plans. Due to Registrant’s regulatory recovery treatment, the recognition of the underfunded status for the Pension Plan has been offset by a regulatory asset pursuant to guidance on the accounting for the effects of certain types of regulation.
Plan Assets
:
The assets of the pension and post-retirement medical plans are managed by a third party trustee. The investment policy allocation of the assets in the trust was approved by Registrant’s Administrative Committee (the “Committee”) for the pension and post-retirement medical funds, which has oversight responsibility for all retirement plans. The primary objectives underlying the investment of the pension and post-retirement plan assets are: (i) attempt to maintain a fully funded status with a cushion for unexpected developments, possible future increases in expense levels, and/or a reduction in the expected return on investments; (ii) seek to earn long-term returns that compare favorably to appropriate market indexes, peer group universes and the policy asset allocation index; (iii) seek to provide sufficient liquidity to pay current benefits and expenses; (iv) attempt to limit risk exposure through prudent diversification; and (v) seek to limit costs of administering and managing the plans.
100
The Committee recognizes that risk and volatility are present to some degree with all types of investments. High levels of risk may be avoided through diversification by asset class, style of each investment manager and sector and industry limits. Investment managers are retained to manage a pool of assets and allocate funds in order to achieve an appropriate, diversified and balanced asset mix. The Committee’s strategy balances the requirement to maximize returns using potentially higher-return generating assets, such as equity securities, with the need to control the risk of its benefit obligations with less volatile assets, such as fixed-income securities.
The Committee approves the target asset allocations. Registrant’s pension and post-retirement plan weighted-average asset allocations at
December 31, 2018
and
2017
, by asset category are as follows:
|
Pension Benefits
|
Post-Retirement
Medical Benefits
|
|||||||||||
|
Asset Category
|
2018
|
2017
|
2018
|
2017
|
||||||||
|
Actual Asset Allocations
:
|
|
|
|
|
|
|
|
|
||||
|
Equity securities
|
53
|
%
|
57
|
%
|
59
|
%
|
59
|
%
|
||||
|
Debt securities
|
43
|
%
|
39
|
%
|
39
|
%
|
37
|
%
|
||||
|
Real Estate Funds
|
4
|
%
|
4
|
%
|
—
|
%
|
—
|
%
|
||||
|
Cash equivalents
|
—
|
%
|
—
|
%
|
2
|
%
|
4
|
%
|
||||
|
Total
|
100
|
%
|
100
|
%
|
100
|
%
|
100
|
%
|
||||
Equity securities did not include AWR’s Common Shares as of
December 31, 2018
and
2017
.
|
Target Asset Allocations for 2018:
|
Pension Benefits
|
Post-retirement
Medical Benefits
|
||||
|
Equity securities
|
60
|
%
|
60
|
%
|
||
|
Debt securities
|
40
|
%
|
40
|
%
|
||
|
Total
|
100
|
%
|
100
|
%
|
||
The Pension Plan assets are in collective trust funds managed by a management firm appointed by the Committee. The fair value of these collective trust funds is measured using net asset value per share. In accordance with ASU 2015-07
Disclosures for Investments in Certain Entities that Calculate Net Asset Value per Share (or Its Equivalents)
, the fair value of the collective trust funds is not categorized in the fair value hierarchy as of
December 31, 2018
and
2017
.
101
The following tables set forth the fair value, measured by net asset value, of the pension investment assets as of
December 31, 2018
and
2017
:
|
Net Asset Value as of December 31, 2018
|
|||||||||||
|
(dollars in thousands)
|
Fair Value
|
Unfunded Commitments
|
Redemption Frequency
|
Redemption Notice Period
|
|||||||
|
Cash equivalents
|
$
|
590
|
|
—
|
|
N/A
|
N/A
|
||||
|
Fixed income fund
|
70,642
|
|
—
|
|
Daily
|
Daily
|
|||||
|
Equity securities
:
|
|||||||||||
|
U.S. small/mid cap funds
|
22,313
|
|
—
|
|
Daily
|
Daily
|
|||||
|
U.S. large cap funds
|
46,133
|
|
—
|
|
Daily
|
Daily
|
|||||
|
International funds
|
15,548
|
|
—
|
|
Daily
|
Daily
|
|||||
|
Total equity funds
|
83,994
|
|
—
|
|
|||||||
|
Real estate funds
|
7,303
|
|
—
|
|
Daily
|
Daily
|
|||||
|
Total
|
$
|
162,529
|
|
—
|
|
|
|
||||
|
Net Asset Value as of December 31, 2017
|
|||||||||||
|
(dollars in thousands)
|
Fair Value
|
Unfunded Commitments
|
Redemption Frequency
|
Redemption Notice Period
|
|||||||
|
Cash equivalents
|
$
|
489
|
|
—
|
|
N/A
|
N/A
|
||||
|
Fixed income fund
|
66,669
|
|
—
|
|
Daily
|
Daily
|
|||||
|
Equity securities
:
|
|||||||||||
|
U.S. small/mid cap funds
|
26,998
|
|
—
|
|
Daily
|
Daily
|
|||||
|
U.S. large cap funds
|
53,985
|
|
—
|
|
Daily
|
Daily
|
|||||
|
International funds
|
17,893
|
|
—
|
|
Daily
|
Daily
|
|||||
|
Total equity funds
|
98,876
|
|
|
|
|||||||
|
Real estate funds
|
7,614
|
|
—
|
|
Daily
|
Daily
|
|||||
|
Total
|
$
|
173,648
|
|
—
|
|
|
|
||||
The collective trust funds may be invested or redeemed daily, and generally do not have any significant restrictions to redeem the investments.
As previously discussed in Note 1, the accounting guidance for fair value measurements establishes a framework for measuring fair value and requires fair value measurements to be classified and disclosed in one of three levels. As required by the accounting guidance, assets and liabilities are classified in their entirety based on the lowest level of input that is significant to the fair value measurement. All equity investments in the post-retirement medical plan are Level 1 investments in mutual funds. The fixed income category includes corporate bonds and notes. The majority of fixed income investments range in maturities from less than
1
to
20
years. The fair values of these investments are based on quoted market prices in active markets.
102
The following tables set forth by level, within the fair value hierarchy, the post-retirement plan's investment assets measured at fair value as of
December 31, 2018
and
2017
:
|
Fair Value as of December 31, 2018
|
||||||||||||||
|
(dollars in thousands)
|
Level 1
|
Level 2
|
Level 3
|
Total
|
||||||||||
|
Fair Value of Post-Retirement Plan Assets:
|
|
|
|
|
|
|
|
|
||||||
|
Cash equivalents
|
$
|
263
|
|
—
|
|
—
|
|
$
|
263
|
|
||||
|
Fixed income
|
3,871
|
|
—
|
|
—
|
|
3,871
|
|
||||||
|
U.S. equity securities
|
5,876
|
|
—
|
|
—
|
|
5,876
|
|
||||||
|
Total investments measured at fair value
|
$
|
10,010
|
|
—
|
|
—
|
|
$
|
10,010
|
|
||||
|
|
Fair Value as of December 31, 2017
|
|||||||||||||
|
(dollars in thousands)
|
Level 1
|
Level 2
|
Level 3
|
Total
|
||||||||||
|
Fair Value of Post-Retirement Plan Assets:
|
|
|
|
|
|
|
|
|
||||||
|
Cash equivalents
|
$
|
189
|
|
—
|
|
—
|
|
$
|
189
|
|
||||
|
Fixed income
|
4,364
|
|
—
|
|
—
|
|
4,364
|
|
||||||
|
U.S. equity securities
|
6,507
|
|
—
|
|
—
|
|
6,507
|
|
||||||
|
Total investments measured at fair value
|
$
|
11,060
|
|
—
|
|
—
|
|
$
|
11,060
|
|
||||
Plan Contributions
:
During
2018
, Registrant contributed
$6.0 million
to its pension plan and did not make a contribution to the post-retirement medical plan. Registrant expects to contribute approximately
$3.6 million
to its pension plan in 2019. Registrant’s policy is to fund the plans annually at a level which is deductible for income tax purposes and is consistent with amounts recovered in customer rates.
Benefit Payments
:
Estimated future benefit payments at
December 31, 2018
for the next five years and thereafter are as follows (in thousands):
|
|
Pension Benefits
|
Post-Retirement
Medical Benefits
|
|||||
|
2019
|
$
|
7,343
|
|
$
|
585
|
|
|
|
2020
|
7,934
|
|
633
|
|
|||
|
2021
|
8,597
|
|
709
|
|
|||
|
2022
|
9,283
|
|
749
|
|
|||
|
2023
|
9,860
|
|
764
|
|
|||
|
Thereafter
|
57,832
|
|
3,172
|
|
|||
|
Total
|
$
|
100,849
|
|
$
|
6,612
|
|
|
Assumptions
:
Certain actuarial assumptions, such as the discount rate, long-term rate of return on plan assets, mortality, and the healthcare cost trend rate have a significant effect on the amounts reported for net periodic benefit cost as well as the related benefit obligation amounts.
Discount Rate —
The assumed discount rate for pension and post-retirement medical plans reflects the market rates for high-quality corporate bonds currently available. Registrant’s discount rates were determined by considering the average of pension yield curves constructed of a large population of high quality corporate bonds. The resulting discount rate reflects the matching of plan liability cash flows to the yield curves.
103
Expected Long-Term Rate of Return on Assets —
The long-term rate of return on plan assets represents an estimate of long-term returns on an investment portfolio consisting of a mixture of equities, fixed income and other investments. To develop the expected long-term rate of return on assets assumption for the pension plan, Registrant considered the historical returns and the future expectations for returns for each asset class, as well as the target asset allocation of the pension portfolio. Registrant’s policy is to fund the medical benefit trusts based on actuarially determined amounts as allowed in rates approved by the CPUC. Registrant has invested the funds in the post-retirement trusts that will achieve a desired return and minimize amounts necessary to recover through rates. The mix is expected to provide for a return on assets similar to the Pension Plan and to achieve Registrant’s targeted allocation. This resulted in the selection of the
6.0%
long-term rate of return on assets assumption for the union plan and
4.2%
(net of income taxes) for the non-union plan portion of the post-retirement plan.
Mortality —
Mortality assumptions are a critical component of benefit obligation amounts and a key factor in determining the expected length of time for annuity payments. In 2014, the Society of Actuaries ("SOA") released new mortality tables for pension plans. Beginning with 2014, the benefit obligation amounts assumed a longer life expectancy of participants as a result of the actuarial update to mortality tables. In 2016, the SOA published updated mortality tables reflecting three additional years of data and refined certain parameters used in developing the 2014 tables. Accordingly, the benefit obligation amounts as of
December 31, 2018
and
2017
have incorporated these updates to the mortality tables.
Healthcare Cost Trend Rate
—
The assumed health care cost trend rate for 2019 starts at
6.1%
grading down to
4.6%
in 2037 for those under age 65, and at
5.1%
grading down to
4.2%
in 2037 for those 65 and over. Assumed health care cost trend rates have a significant effect on the amounts reported for the health care plans. A one-percentage-point change in assumed health care cost trend rates would have the following effects on the post-retirement medical plan:
|
(dollars in thousands)
|
1-Percentage-Point
Increase
|
1-Percentage-Point
Decrease
|
||||||
|
Effect on total of service and interest cost components
|
$
|
41
|
|
$
|
(35
|
)
|
||
|
Effect on post-retirement benefit obligation
|
$
|
759
|
|
$
|
(659
|
)
|
||
Supplemental Executive Retirement Plan
:
Registrant has a supplemental executive retirement plan (“SERP”) that is intended to restore retirement benefits to certain key employees and officers of Registrant that are limited by Sections 415 and 401(a)(17) of the Internal Revenue Code of 1986, as amended. The Board of Directors approved the establishment of a Rabbi Trust created for the SERP. Assets in a Rabbi Trust can be subject to the claims of creditors; therefore, they are not considered as an asset for purposes of computing the SERP’s funded status. As of
December 31, 2018
, the balance in the Rabbi Trust totaled
$16.4 million
and is included in Registrant’s other property and investments.
All equity investments in the Rabbi Trust are Level 1 investments in mutual funds. The fixed income category includes corporate bonds and notes. The fair values of these investments are based on quoted market prices in active markets. The following tables set forth by level, within the fair value hierarchy, the Rabbi Trust investment assets measured at fair value as of
December 31, 2018
and
2017
:
|
|
Fair Value as of December 31, 2018
|
|||||||||||||
|
(dollars in thousands)
|
Level 1
|
Level 2
|
Level 3
|
Total
|
||||||||||
|
Fair Value of Assets held in Rabbi Trust:
|
|
|
|
|
|
|
|
|
||||||
|
Cash equivalents
|
$
|
166
|
|
—
|
|
—
|
|
$
|
166
|
|
||||
|
Fixed income securities
|
6,251
|
|
—
|
|
—
|
|
6,251
|
|
||||||
|
Equity securities
|
9,995
|
|
—
|
|
—
|
|
9,995
|
|
||||||
|
Total investments measured at fair value
|
$
|
16,412
|
|
—
|
|
—
|
|
$
|
16,412
|
|
||||
|
|
Fair Value as of December 31, 2017
|
|||||||||||||
|
(dollars in thousands)
|
Level 1
|
Level 2
|
Level 3
|
Total
|
||||||||||
|
Fair Value of Assets held in Rabbi Trust:
|
|
|
|
|
|
|
|
|
||||||
|
Cash equivalents
|
$
|
45
|
|
—
|
|
—
|
|
$
|
45
|
|
||||
|
Fixed income securities
|
6,072
|
|
—
|
|
—
|
|
6,072
|
|
||||||
|
Equity securities
|
9,110
|
|
—
|
|
—
|
|
9,110
|
|
||||||
|
Total investments measured at fair value
|
$
|
15,227
|
|
—
|
|
—
|
|
$
|
15,227
|
|
||||
104
The following provides a reconciliation of benefit obligations, funded status of the SERP, as well as a summary of significant estimates at
December 31, 2018
and
2017
:
|
(dollars in thousands)
|
2018
|
2017
|
||||||
|
Change in Benefit Obligation:
|
|
|
|
|
||||
|
Benefit obligation at beginning of year
|
$
|
24,062
|
|
$
|
20,783
|
|
||
|
Service cost
|
1,096
|
|
930
|
|
||||
|
Interest cost
|
888
|
|
893
|
|
||||
|
Actuarial (gain) loss
|
(1,104
|
)
|
1,872
|
|
||||
|
Benefits paid
|
(425
|
)
|
(416
|
)
|
||||
|
Benefit obligation at end of year
|
$
|
24,517
|
|
$
|
24,062
|
|
||
|
Changes in Plan Assets:
|
|
|
|
|
||||
|
Fair value of plan assets at beginning and end of year
|
—
|
|
—
|
|
||||
|
Funded Status:
|
|
|
|
|
||||
|
Net amount recognized as accrued cost
|
$
|
(24,517
|
)
|
$
|
(24,062
|
)
|
||
|
(in thousands)
|
2018
|
2017
|
||||||
|
Amounts recognized on the balance sheets:
|
|
|
|
|
||||
|
Current liabilities
|
$
|
(433
|
)
|
$
|
(409
|
)
|
||
|
Non-current liabilities
|
(24,084
|
)
|
(23,653
|
)
|
||||
|
Net amount recognized
|
$
|
(24,517
|
)
|
$
|
(24,062
|
)
|
||
|
Amounts recognized in regulatory assets consist of:
|
|
|
|
|
||||
|
Prior service cost
|
$
|
—
|
|
$
|
—
|
|
||
|
Net loss
|
5,403
|
|
7,556
|
|
||||
|
Regulatory assets
|
5,403
|
|
7,556
|
|
||||
|
Unfunded accrued cost
|
19,114
|
|
16,506
|
|
||||
|
Net liability recognized
|
$
|
24,517
|
|
$
|
24,062
|
|
||
|
Changes in plan assets and benefit obligations recognized in regulatory assets consist of:
|
|
|
|
|
||||
|
Regulatory asset at beginning of year
|
$
|
7,556
|
|
$
|
6,474
|
|
||
|
Net (gain) loss
|
(1,104
|
)
|
1,872
|
|
||||
|
Amortization of prior service credit
|
—
|
|
(12
|
)
|
||||
|
Amortization of net loss
|
(1,049
|
)
|
(778
|
)
|
||||
|
Total change in regulatory asset
|
(2,153
|
)
|
1,082
|
|
||||
|
Regulatory asset at end of year
|
$
|
5,403
|
|
$
|
7,556
|
|
||
|
Net periodic pension cost
|
$
|
3,033
|
|
$
|
2,612
|
|
||
|
Change in regulatory asset
|
(2,153
|
)
|
1,082
|
|
||||
|
Total recognized in net periodic pension and regulatory asset
|
$
|
880
|
|
$
|
3,694
|
|
||
|
Estimated amounts that will be amortized from regulatory asset over the next fiscal year:
|
|
|
|
|
||||
|
Initial net asset (obligation)
|
$
|
—
|
|
$
|
—
|
|
||
|
Prior service cost
|
—
|
|
—
|
|
||||
|
Net loss
|
(471
|
)
|
(1,049
|
)
|
||||
|
Additional year-end information for plans with an accumulated benefit obligation in excess of plan assets:
|
|
|
|
|
||||
|
Projected benefit obligation
|
$
|
24,517
|
|
$
|
24,062
|
|
||
|
Accumulated benefit obligation
|
21,229
|
|
20,742
|
|
||||
|
Fair value of plan assets
|
—
|
|
—
|
|
||||
|
Weighted-average assumptions used to determine benefit obligations:
|
|
|
|
|
||||
|
Discount rate
|
4.40
|
%
|
3.72
|
%
|
||||
|
Rate of compensation increase
|
4.00
|
%
|
4.00
|
%
|
||||
105
The components of SERP expense, before allocation to the overhead pool, for
2018
,
2017
and
2016
are as follows:
|
(dollars in thousands, except percent)
|
2018
|
2017
|
2016
|
|||||||||
|
Components of Net Periodic Benefits Cost:
|
|
|
|
|
|
|
||||||
|
Service cost
|
$
|
1,096
|
|
$
|
930
|
|
$
|
799
|
|
|||
|
Interest cost
|
888
|
|
893
|
|
743
|
|
||||||
|
Amortization of prior service cost
|
—
|
|
12
|
|
25
|
|
||||||
|
Amortization of net loss
|
1,049
|
|
777
|
|
292
|
|
||||||
|
Net periodic pension cost
|
$
|
3,033
|
|
$
|
2,612
|
|
$
|
1,859
|
|
|||
|
Weighted-average assumptions used to determine net periodic cost:
|
|
|
|
|
|
|
||||||
|
Discount rate
|
3.72
|
%
|
4.34
|
%
|
4.61
|
%
|
||||||
|
Rate of compensation increase
|
4.00
|
%
|
4.00
|
%
|
4.00
|
%
|
||||||
Benefit Payments
: Estimated future benefit payments for the SERP at
December 31, 2018
for the next ten years are as follows (in thousands):
|
2019
|
$
|
433
|
|
|
2020
|
1,339
|
|
|
|
2021
|
1,396
|
|
|
|
2022
|
1,387
|
|
|
|
2023
|
1,378
|
|
|
|
Thereafter
|
8,003
|
|
|
|
Total
|
$
|
13,936
|
|
401(k) Investment Incentive Program
:
Registrant has a 401(k) Investment Incentive Program under which employees may invest a percentage of their pay, up to a maximum investment prescribed by law, in an investment program managed by an outside investment manager. Registrant’s cash contributions to the 401(k) are based upon a percentage of individual employee contributions and for the years ended
December 31, 2018
,
2017
and
2016
were
$2.4 million
,
$2.3 million
and
$2.2 million
, respectively. The Investment Incentive Program also incorporates the defined contribution plan for employees hired on or after January 1, 2011. The cash contributions to the defined contribution plan for the years ended
December 31, 2018
,
2017
and
2016
were
$1.3 million
,
$1.1 million
and
$951,000
, respectively.
Note 13 — Stock-Based Compensation Plans
Summary Description of Stock Incentive Plans
As of December 31, 2018, AWR had
five
stock incentive plans: the 2000, 2008 and 2016 stock incentive plans for its employees, and the 2003 and 2013 non-employee directors plans for its Board of Directors, each more fully described below.
2000, 2008 and 2016 Employee Plans
—
AWR adopted these employee plans, following shareholder approval, to provide stock-based incentive awards in the form of stock options, restricted stock units and restricted stock to employees as a means of promoting the success of Registrant by attracting, retaining and more fully aligning the interests of employees with those of customers and shareholders. The 2008 and 2016 employee plans also provide for the grant of performance awards. No additional grants may be made under the 2000 or 2008 employee plans. No restricted stock grants are currently outstanding under any of the plans. As of January 28, 2018,
no
stock options were outstanding under the 2000 plan.
For stock options, Registrant’s Compensation Committee of the Board of Directors (“Compensation Committee”) determines, among other things, the date of grant, the form, term, option exercise price, vesting and exercise terms of each option. Stock options granted by AWR have been in the form of nonqualified stock options, expire
10
years from the date of grant, vest over a period of
3
years and are subject to earlier termination as provided in the form of option agreements approved by the Compensation Committee. The option price per share is determined by the Compensation Committee at the time of grant but may not be less than the fair market value of AWR's Common Shares on the date of grant.
For restricted stock unit awards, the Compensation Committee determines the specific terms, conditions and provisions relating to each restricted stock unit. Each employee who has been granted a time-vested restricted stock unit is entitled to dividend equivalent rights in the form of additional restricted stock units until vesting of the time-vested restricted
106
stock units. In general, time-vested restricted stock units vest over a period of
3
years. Restricted stock units may also vest upon retirement if the grantee is at least 55 and the sum of the grantee's age and years of service are equal to or greater than 75, or upon death or total disability. In addition, restricted stock units may vest following a change in control if the Company terminates the grantee other than for cause or the employee terminates employment for good reason. Each restricted stock unit is non-voting and entitles the holder of the restricted stock unit to receive
one
Common Share.
The Compensation Committee also has the authority to determine the number, amount or value of performance awards, the duration of the performance period or performance periods applicable to the award and the performance criteria applicable to each performance award for each performance period. Each outstanding performance award granted by the Compensation Committee has been in the form of restricted stock units that generally vest over a period of
three years
as provided in the performance award agreement. The amount of the performance award paid to an employee depends upon satisfaction of performance criteria following the end of a three-year performance period. Performance awards may also vest and be payable upon retirement if the grantee is at least 55 and the sum of the grantee's age and years of service are equal to or greater than 75, or upon death or total disability. In addition, performance awards may vest following a change in control if the Company terminates the grantee other than for cause or the employee terminates employment for good reason. The amount of the payment for performance awards granted in 2018 will be at target in the event of death or a termination of employment (other than for cause) by the Company or termination by the employee for good reason within
24
months after a change in control. In all other circumstances, adjustments will be made to the amount of the payment to take into account the shortened performance period
2003 and 2013 Directors Plans
—
The Board of Directors and shareholders of AWR have approved the 2003 and 2013 directors plans in order to provide the non-employee directors with supplemental stock-based compensation to encourage them to increase their stock ownership in AWR. No more grants may be made under the 2003 directors plan.
Non-employee directors are entitled to receive restricted stock units in an amount determined by the board of directors. This amount may not exceed two times the annual retainer paid to directors. Effective for grants of restricted stock units to non-employee directors after 2012, such units are convertible to AWR's Common Shares ninety days after the grant date.
All non-employee directors of AWR who were directors of AWR at the 2003 annual meeting have also received restricted stock units which will be distributed upon termination of the director's service as a director.
All stock options, restricted stock units and performance awards have been granted with dividend equivalent rights payable in the form of additional restricted stock units.
Recognition of Compensation Expense
Registrant recognizes compensation expense related to the fair value of stock-based compensation awards. Share-based compensation cost is measured at the grant date, based on the calculated fair value of the award, and is recognized as an expense over the employee’s requisite service period (generally the vesting period of the equity grant). Immediate vesting occurs if the employee is at least
55 years
old and the sum of the employee’s age and years of employment is equal to or greater than 75. Registrant assumes that pre-vesting forfeitures will be minimal, and recognizes pre-vesting forfeitures as they occur, which results in a reduction in compensation expense.
The following table presents share-based compensation expenses for the years ended
December 31, 2018
,
2017
and
2016
. These expenses resulting from restricted stock units, including performance awards, are included in administrative and general expenses in AWR's and GSWC’s statements of income:
|
|
AWR
|
GSWC
|
||||||||||||||||||||||
|
|
For The Years Ended
December 31,
|
For The Years Ended
December 31,
|
||||||||||||||||||||||
|
(in thousands)
|
2018
|
2017
|
2016
|
2018
|
2017
|
2016
|
||||||||||||||||||
|
Stock-based compensation related to:
|
|
|
|
|
|
|
|
|
|
|
|
|
||||||||||||
|
Restricted stock units
|
$
|
3,851
|
|
$
|
2,885
|
|
$
|
2,538
|
|
$
|
3,397
|
|
$
|
2,420
|
|
$
|
2,118
|
|
||||||
|
Total stock-based compensation expense
|
$
|
3,851
|
|
$
|
2,885
|
|
|
$
|
2,538
|
|
|
$
|
3,397
|
|
|
$
|
2,420
|
|
|
$
|
2,118
|
|
||
Equity-based compensation cost capitalized as part of GSWC's utility plant for the years ended
December 31, 2018
,
2017
and
2016
was
$199,000
,
$195,000
and
$155,000
, respectively, for both AWR and GSWC. For the years ended
December 31, 2018
,
2017
and
2016
, AWR recorded approximately
$1.6 million
,
$1.0 million
and
$581,000
, respectively, of tax benefits from stock-based awards. For the years ended
December 31, 2018
,
2017
and
2016
, GSWC recorded approximately
$1.6 million
,
$1.0 million
and
$501,000
, respectively, of tax benefits from stock-based awards.
107
Registrant amortizes stock-based compensation over the requisite (vesting) period for the entire award. Options issued pursuant to the 2008 employee plan vest and were exercisable in installments of
33%
the first two years and
34%
in the third year, starting one year from the date of the grant. Time-vesting restricted stock units vest and become nonforfeitable in installments of
33%
the first two years and
34%
in the third year, starting one year from the date of the grant. Outstanding performance awards vest and become nonforfeitable in installments of
33%
the first two years and
34%
in the third year and are distributed at the end of the performance period if the performance criteria set forth in the award agreement are satisfied.
Stock Options
—
There were
no
stock options granted during the years
2018
,
2017
or
2016
. A summary of stock option activity as of
December 31, 2018
and changes during the year ended
December 31, 2018
, are presented below:
|
|
Number of
Options
|
Weighted
Average
Exercise Price
|
Weighted Average
Remaining
Contractual Term
|
Aggregate
Intrinsic Value
|
||||||||
|
Options outstanding at January 1, 2018
|
69,202
|
|
$
|
16.87
|
|
|
|
|
||||
|
Exercised
|
(32,142
|
)
|
16.98
|
|
|
|
|
|||||
|
Forfeited or expired
|
(1,500
|
)
|
17.06
|
|
|
|
|
|||||
|
Options outstanding at December 31, 2018
|
35,560
|
|
$
|
16.76
|
|
0.99
|
$
|
1,788,028
|
|
|||
|
Options exercisable at December 31, 2018
|
35,560
|
|
$
|
16.76
|
|
0.99
|
$
|
1,788,028
|
|
|||
The aggregate intrinsic value in the table above represents the total pretax intrinsic value (i.e., the difference between the closing price of AWR's Common Shares on the last trading day of the
2018
calendar year and the exercise price, times the number of shares) that would have been received by the option holders had all option holders exercised their option on
December 31, 2018
. This amount changes if the fair market value of the Common Shares changes. The total intrinsic value of options exercised during the years ended
December 31, 2018
,
2017
and
2016
was approximately
$1,367,000
,
$1,718,000
and
$308,000
, respectively.
During the years ended
December 31, 2018
,
2017
and
2016
, Registrant received approximately
$546,000
,
$909,000
and
$235,000
, respectively, in cash proceeds from the exercise of its stock options.
Restricted Stock Units (Time-Vested)
—
A restricted stock unit (“RSU”) represents the right to receive a share of AWR’s Common Shares and are valued based on the fair market value of AWR's Common Shares on the date of grant. The fair value of RSUs were determined based on the closing trading price of Common Shares on the grant date. A summary of the status of Registrant’s outstanding RSUs, excluding performance awards, to employees and directors as of
December 31, 2018
, and changes during the year ended
December 31, 2018
, is presented below:
|
|
Number of
Restricted Share
Units
|
Weighted Average
Grant-Date Value
|
||||
|
Restricted share units at January 1, 2018
|
107,287
|
|
$
|
32.75
|
|
|
|
Granted
|
33,655
|
|
55.45
|
|
||
|
Vested
|
(37,509
|
)
|
47.29
|
|
||
|
Forfeited
|
(1,198
|
)
|
46.94
|
|
||
|
Restricted share units at December 31, 2018
|
102,235
|
|
$
|
34.73
|
|
|
As of
December 31, 2018
, there was approximately
$611,000
of total unrecognized compensation cost related to time-vested restricted stock units granted under AWR’s employee and director’s stock plans. That cost is expected to be recognized over a weighted average period of
1.52
years.
Restricted Stock Units (Performance Awards)
– During the years ended
December 31, 2018
,
2017
and
2016
, the Compensation Committee granted performance awards in the form of restricted stock units to officers of the Registrant. A performance award represents the right to receive a share of AWR's Common Shares if specified performance goals are met over the performance period specified in the grant (generally
three years
). Each grantee of any outstanding performance award may earn between
0%
and
200%
of the target amount depending on Registrant's performance against performance goals, which are determined by the Compensation Committee on the date of grant. As determined by the Compensation Committee, the performance awards granted during the years ended
December 31, 2018
,
2017
and
2016
included various performance-based conditions and one market-based condition related to total shareholder return ("TSR") that will be earned based on Registrant’s TSR compared to the TSR for a specific peer group of investor-owned water companies.
108
A summary of the status of Registrant’s outstanding performance awards to officers as of
December 31, 2018
, and changes during the year ended
December 31, 2018
, is presented below:
|
|
Number of
Performance awards |
Weighted Average
Grant-Date Value |
||||
|
Performance awards at January 1, 2018
|
97,879
|
|
$
|
41.49
|
|
|
|
Granted
|
25,195
|
|
55.88
|
|
||
|
Performance criteria adjustment
|
3,803
|
|
43.98
|
|
||
|
Vested
|
(31,216
|
)
|
41.55
|
|
||
|
Performance awards at December 31, 2018
|
95,661
|
|
$
|
45.36
|
|
|
A portion of the fair value of performance awards was estimated at the grant date based on the probability of satisfying the market-based condition using a Monte-Carlo simulation model, which assesses the probabilities of various outcomes of the market condition. The portion of the fair value of the performance awards associated with performance-based conditions was based on the fair market value of AWR's Common Shares at the grant date. The fair value of each outstanding performance award grant is amortized into compensation expense in installments of
33%
the first two years and
34%
in the third year of their respective vesting periods, which is generally over
3 years
unless earlier vested pursuant to the terms of the agreement. The accrual of compensation costs is based on the estimate of the final expected value of the award and is adjusted as required for the portion based on the performance-based condition. Unlike the awards with performance-based conditions, for the portion based on the market-based condition, compensation cost is recognized, and not reversed, even if the market condition is not achieved, as required by the accounting guidance for share-based awards. As of
December 31, 2018
,
$300,000
of unrecognized compensation costs related to performance awards is expected to be recognized over a weighted average period of
1.92
years.
Note 14 - Commitments
GSWC’s Water Supply
:
GSWC obtains its water supply from its operating wells and purchases from others, principally member agencies of the Metropolitan Water District of Southern California (“MWD”). MWD is a public agency and quasi-municipal corporation created in 1928 by a vote of the electorates of several Southern California cities. MWD’s primary purpose was and is to provide a supplemental supply of water for domestic and municipal uses and purposes at wholesale rates to its member public agencies. GSWC has connections to MWD’s water distribution facilities and those of other member water agencies. MWD’s principal sources of water are the State Water Project and the Colorado River.
GSWC has contracts to purchase water or water rights for an aggregate amount of
$4.4 million
as of
December 31, 2018
. Included in the
$4.4 million
is a commitment of
$2.2 million
to lease water rights from a third party under an agreement which expires in 2028. The remaining
$2.2 million
is for commitments for purchased water with other third parties, which expire through 2038.
GSWC’s estimated future minimum payments under these purchased water supply commitments at
December 31, 2018
are as follows (in thousands):
|
2019
|
$
|
407
|
|
|
2020
|
407
|
|
|
|
2021
|
407
|
|
|
|
2022
|
407
|
|
|
|
2023
|
407
|
|
|
|
Thereafter
|
2,410
|
|
|
|
Total
|
$
|
4,445
|
|
109
Bear Valley Electric Service
:
Generally, BVES purchases power at a fixed cost, under long-term purchased power contracts, depending on the amount of power and the period during which the power is purchased under such contracts. BVES began taking power pursuant to purchased power contracts approved by the CPUC effective January 1, 2015 at a fixed cost over three and five-year terms depending on the amount of power and period during which the power is purchased under the contracts. The three-year contract expired in 2017. As of
December 31, 2018
, GSWC's commitment under BVES's remaining contract totaled approximately
$5.2 million
.
Operating Leases
:
Registrant leases equipment and facilities primarily for its Regional and District offices and ASUS operations under non-cancelable operating leases with varying terms, provisions and expiration dates. Rent expense for leases that contain scheduled rent increases are recorded on a straight-line basis. During
2018
,
2017
and
2016
, Registrant’s consolidated rent expense was approximately
$2.5 million
,
$2.4 million
and
$2.3 million
, respectively. Registrant’s future minimum payments under long-term non-cancelable operating leases at
December 31, 2018
are as follows (in thousands):
|
2019
|
$
|
2,818
|
|
|
2020
|
2,530
|
|
|
|
2021
|
1,497
|
|
|
|
2022
|
1,007
|
|
|
|
2023
|
546
|
|
|
|
Thereafter
|
605
|
|
|
|
Total
|
$
|
9,003
|
|
There is no material difference between the consolidated operations of AWR and the operations of GSWC in regard to the future minimum payments under long-term non-cancelable operating leases.
Note 15 - Contingencies and Gain on Sale of Assets
Condemnation of Properties
:
The laws of the State of California provide for the acquisition of public utility property by governmental agencies through their power of eminent domain, also known as condemnation, where doing so is necessary and in the public interest. In addition, these laws provide that the owner of utility property (i) may contest whether the condemnation is necessary and in the public interest, and (ii) is entitled to receive the fair market value of its property if the property is ultimately taken.
Claremont System:
In December 2014, the City of Claremont, California (“the City”) filed an eminent-domain action against GSWC to condemn GSWC's Claremont water system. In December 2016, the judge presiding over the eminent domain lawsuit issued a decision rejecting the City's attempt to take over GSWC's Claremont water system, and further ordered that GSWC be entitled to recover
$7.6 million
(“Judgment Amount”) of its litigation expenses and related defense costs from Claremont. During the first quarter of 2017, Claremont appealed both decisions.
In October 2017, GSWC and the City entered into a settlement agreement whereby the City agreed to drop its appeals and in December 2017 paid
$2.0 million
to GSWC as partial satisfaction of the Judgment Amount, plus interest accrued through the end of 2017. GSWC recorded the
$2.0 million
as a reduction to legal fees of
$1.8 million
and an increase in interest income of
$200,000
in the fourth quarter of 2017. Furthermore, under the settlement agreement, quarterly interest-only payments calculated on the unpaid Judgment Amount of
$5.9 million
are to be made by Claremont to GSWC through the year 2029. If Claremont (i) makes all of the quarterly payments as required, and (ii) does not take formal action to condemn GSWC's Claremont water system before December 31, 2029, then on January 1, 2030, the unpaid Judgment Amount will be deemed satisfied by Claremont without further payment required to be made to GSWC. However, if Claremont were to take formal action any time prior to December 31, 2029
or miss any of the required payments specified in the settlement agreement, the unpaid Judgment Amount and any unpaid accrued interest would immediately become due and payable. GSWC is unable to predict the actions that Claremont will take prior to December 31, 2029 and, as a result, will record the quarterly payments only to the extent that they are collected from Claremont over this period. GSWC serves approximately
11,000
customers in Claremont.
110
Ojai Water System and Gain on Sale of Assets:
In June 2017, pursuant to a settlement agreement to resolve an eminent domain action, Casitas Municipal Water District acquired the operating assets of GSWC’s
2,900
-connection Ojai water system by eminent domain for
$34.3 million
in cash. As a result of this transaction, GSWC recorded a pretax gain of
$8.3 million
on the sale of the Ojai water system during the second quarter of 2017. The terms of the settlement agreement resolved the eminent domain action and dismissed all claims against GSWC brought by Casitas and another third party.
Environmental Clean-Up and Remediation
:
GSWC has been involved in environmental remediation and cleanup at a plant site (“Chadron Plant”) that contained an underground storage tank, which was used to store gasoline for its vehicles. This tank was removed from the ground in July 1990 along with the dispenser and ancillary piping. Since then, GSWC has been involved in various remediation activities at this site. Analysis indicates that offsite monitoring wells may also be necessary to document effectiveness of remediation.
As of
December 31, 2018
, the total spent to clean-up and remediate the Chadron Plant was approximately
$5.9 million
, of which
$1.5 million
has been paid by the State of California Underground Storage Tank Fund. Amounts paid by GSWC have been included in rate base and approved by the CPUC for recovery. As of
December 31, 2018
, GSWC has a regulatory asset and an accrued liability for the estimated remaining cost of
$1.3 million
to complete the cleanup at the site. The estimate includes costs for two years of continued activities of groundwater cleanup and monitoring, future soil treatment and site-closure-related activities. The ultimate cost may vary as there are many unknowns in remediation of underground gasoline spills and this is an estimate based on currently available information. Management also believes it is probable that the estimated additional costs will be approved in rate base by the CPUC.
Other Litigation
:
Registrant is also subject to other ordinary routine litigation incidental to its business, some of which may include claims for compensatory and punitive damages. Management believes that rate recovery, proper insurance coverage and reserves are in place to insure against, among other things, property, general liability, employment, and workers’ compensation claims incurred in the ordinary course of business. Insurance coverage may not cover certain claims involving punitive damages. However, Registrant does not believe the outcome from any pending suits or administrative proceedings will have a material effect on Registrant's consolidated results of operations, financial position or cash flows.
111
Note 16 - Business Segments
AWR has
3
reportable segments, water, electric and contracted services, whereas GSWC has
2
segments, water and electric. AWR has no material assets other than its investments in its subsidiaries on a stand-alone basis.
All activities of GSWC are geographically located within California. Activities of ASUS and the Military Utility Privatization Subsidiaries are conducted in California, Florida, Georgia, Kansas, Maryland, New Mexico, North Carolina, South Carolina, Texas and Virginia. Each of the Military Utility Privatization Subsidiaries is regulated, if applicable, by the state in which the subsidiary primarily conducts water and/or wastewater operations. Fees charged for operations and maintenance and renewal and replacement services are based upon the terms of the contracts with the U.S. government which have been filed, as appropriate, with the commissions in the states in which ASUS’s subsidiaries are incorporated.
The tables below set forth information relating to GSWC’s operating segments, ASUS and the Military Utility Privatization Subsidiaries and other matters. Total assets by segment are not presented below, as certain of Registrant’s assets are not tracked by segment. The utility plant balances are net of respective accumulated provisions for depreciation. Capital additions reflect capital expenditures paid in cash and exclude U.S. government-funded and third-party prime funded capital expenditures for ASUS and property installed by developers and conveyed to GSWC.
|
|
As Of And For The Year Ended December 31, 2018
|
|||||||||||||||||||
|
|
GSWC
|
ASUS
|
AWR
|
Consolidated
|
||||||||||||||||
|
(dollars in thousands)
|
Water
|
Electric
|
Contracts
|
Parent
|
AWR
|
|||||||||||||||
|
Operating revenues
|
$
|
295,258
|
|
$
|
34,350
|
|
$
|
107,208
|
|
$
|
—
|
|
$
|
436,816
|
|
|||||
|
Operating income
|
74,342
|
|
6,220
|
|
20,414
|
|
7
|
|
100,983
|
|
||||||||||
|
Interest expense, net
|
18,403
|
|
1,328
|
|
(327
|
)
|
451
|
|
19,855
|
|
||||||||||
|
Utility Plant
|
1,218,468
|
|
62,624
|
|
15,218
|
|
—
|
|
1,296,310
|
|
||||||||||
|
Depreciation and amortization expense
(1)
|
36,137
|
|
2,258
|
|
2,030
|
|
|
|
40,425
|
|
||||||||||
|
Income tax expense/(benefit)
|
12,391
|
|
1,212
|
|
4,939
|
|
(525
|
)
|
18,017
|
|
||||||||||
|
Capital additions
|
110,934
|
|
5,420
|
|
10,207
|
|
—
|
|
126,561
|
|
||||||||||
|
|
As Of And For The Year Ended December 31, 2017
|
|||||||||||||||||||
|
|
GSWC
|
ASUS
|
AWR
|
|
Consolidated
|
|||||||||||||||
|
(dollars in thousands)
|
Water
|
Electric
|
Contracts
|
Parent
|
|
AWR
|
||||||||||||||
|
Operating revenues
|
$
|
306,332
|
|
$
|
33,969
|
|
$
|
100,302
|
|
$
|
—
|
|
$
|
440,603
|
|
|||||
|
Operating income (loss)
(2)
|
98,678
|
|
7,193
|
|
21,320
|
|
(96
|
)
|
127,095
|
|
||||||||||
|
Interest expense, net
|
18,909
|
|
1,380
|
|
255
|
|
248
|
|
20,792
|
|
||||||||||
|
Utility Plant
|
1,137,995
|
|
59,945
|
|
7,052
|
|
—
|
|
1,204,992
|
|
||||||||||
|
Depreciation and amortization expense
(1)
|
35,706
|
|
2,146
|
|
1,179
|
|
—
|
|
39,031
|
|
||||||||||
|
Income tax expense/(benefit)
|
32,212
|
|
1,847
|
|
7,136
|
|
(2,221
|
)
|
38,974
|
|
||||||||||
|
Capital additions
|
104,546
|
|
5,941
|
|
2,639
|
|
—
|
|
113,126
|
|
||||||||||
|
|
As Of And For The Year Ended December 31, 2016
|
|||||||||||||||||||
|
|
GSWC
|
ASUS
|
AWR
|
|
Consolidated
|
|||||||||||||||
|
(dollars in thousands)
|
Water
|
Electric
|
Contracts
|
Parent
|
|
AWR
|
||||||||||||||
|
Operating revenues
|
$
|
302,931
|
|
$
|
35,771
|
|
$
|
97,385
|
|
$
|
—
|
|
$
|
436,087
|
|
|||||
|
Operating income (loss)
(2)
|
87,331
|
|
7,856
|
|
19,024
|
|
(19
|
)
|
114,192
|
|
||||||||||
|
Interest expense, net
|
19,696
|
|
1,337
|
|
68
|
|
134
|
|
21,235
|
|
||||||||||
|
Utility Plant
|
1,089,031
|
|
56,280
|
|
5,615
|
|
—
|
|
1,150,926
|
|
||||||||||
|
Depreciation and amortization expense
(1)
|
35,777
|
|
2,027
|
|
1,046
|
|
—
|
|
38,850
|
|
||||||||||
|
Income tax expense/(benefit)
|
25,894
|
|
2,715
|
|
6,672
|
|
(546
|
)
|
34,735
|
|
||||||||||
|
Capital additions
|
120,850
|
|
7,063
|
|
1,954
|
|
—
|
|
129,867
|
|
||||||||||
____________________________
(1)
Depreciation computed on GSWC’s transportation equipment is recorded in other operating expenses and totaled
$238,000
,
$242,000
and
$259,000
for the years ended
December 31, 2018
,
2017
and
2016
, respectively.
(2)
Adjusted to conform to current-year presentation pursuant to the adoption of ASU 2017-07, Compensation-Retirement Benefits (Topic 715): Improving the Presentation of Net Periodic Pension Cost and Net Periodic Postretirement Benefit Cost.
112
The following table reconciles total utility plant (a key figure for rate-making) to total consolidated assets (in thousands):
|
|
December 31,
|
|||||||
|
|
2018
|
2017
|
||||||
|
Total utility plant
|
$
|
1,296,310
|
|
$
|
1,204,992
|
|
||
|
Other assets
|
205,123
|
|
211,742
|
|
||||
|
Total consolidated assets
|
$
|
1,501,433
|
|
$
|
1,416,734
|
|
||
Note 17 — Allowance for Doubtful Accounts
The table below presents Registrant’s provision for doubtful accounts charged to expense and accounts written off, net of recoveries. Provisions included in
2018
,
2017
, and
2016
for AWR and GSWC are as follows:
|
|
AWR
|
|||||||||||
|
|
December 31,
|
|||||||||||
|
(dollars in thousands)
|
2018
|
2017
|
2016
|
|||||||||
|
Balance at beginning of year
|
$
|
1,041
|
|
$
|
764
|
|
$
|
944
|
|
|||
|
Provision charged to expense
|
841
|
|
989
|
|
619
|
|
||||||
|
Accounts written off, net of recoveries
|
(931
|
)
|
(712
|
)
|
(799
|
)
|
||||||
|
Balance at end of year
|
$
|
951
|
|
$
|
1,041
|
|
$
|
764
|
|
|||
|
Allowance for doubtful accounts related to accounts receivable-customer
|
$
|
892
|
|
$
|
806
|
|
$
|
702
|
|
|||
|
Allowance for doubtful accounts related to other accounts receivable
|
59
|
|
235
|
|
62
|
|
||||||
|
Total allowance for doubtful accounts
|
$
|
951
|
|
$
|
1,041
|
|
$
|
764
|
|
|||
|
|
GSWC
|
|||||||||||
|
|
December 31,
|
|||||||||||
|
(dollars in thousands)
|
2018
|
2017
|
2016
|
|||||||||
|
Balance at beginning of year
|
$
|
865
|
|
$
|
761
|
|
$
|
919
|
|
|||
|
Provision charged to expense
|
850
|
|
816
|
|
627
|
|
||||||
|
Accounts written off, net of recoveries
|
(764
|
)
|
(712
|
)
|
(785
|
)
|
||||||
|
Balance at end of year
|
$
|
951
|
|
$
|
865
|
|
$
|
761
|
|
|||
|
Allowance for doubtful accounts related to accounts receivable-customer
|
$
|
892
|
|
$
|
806
|
|
$
|
702
|
|
|||
|
Allowance for doubtful accounts related to other accounts receivable
|
59
|
|
59
|
|
59
|
|
||||||
|
Total allowance for doubtful accounts
|
$
|
951
|
|
$
|
865
|
|
$
|
761
|
|
|||
Note 18 — Supplemental Cash Flow Information
The following table sets forth non-cash financing and investing activities and other cash flow information (in thousands).
|
|
AWR
|
GSWC
|
|||||||||||||||||||||
|
|
December 31,
|
December 31,
|
|||||||||||||||||||||
|
|
2018
|
2017
|
2016
|
2018
|
2017
|
2016
|
|||||||||||||||||
|
Taxes and Interest Paid:
|
|
|
|
|
|
|
|
|
|
|
|
|
|||||||||||
|
Income taxes paid, net
|
$
|
21,084
|
|
$
|
13,615
|
|
$
|
10,916
|
|
$
|
19,448
|
|
$
|
4,822
|
|
$
|
8,437
|
|
|||||
|
Interest paid, net of capitalized interest
|
23,471
|
|
22,762
|
|
22,305
|
|
22,721
|
|
22,282
|
|
22,078
|
|
|||||||||||
|
Non-Cash Transactions:
|
|
|
|
|
|
|
|
|
|
|
|
|
|||||||||||
|
Accrued payables for investment in utility plant
|
$
|
27,403
|
|
$
|
20,131
|
|
$
|
17,236
|
|
$
|
27,403
|
|
$
|
20,128
|
|
$
|
17,207
|
|
|||||
|
Property installed by developers and conveyed
|
2,082
|
|
2,082
|
|
5,395
|
|
2,082
|
|
2,082
|
|
5,395
|
|
|||||||||||
113
Note 19 — Selected Quarterly Financial Data (Unaudited)
The quarterly financial information presented below is unaudited. Registrant's business is seasonal, and it is management’s opinion that comparisons of earnings for the quarterly periods do not reflect overall trends and changes in Registrant’s operations.
|
|
AWR
|
|||||||||||||||||||
|
|
For The Year Ended December 31, 2018
|
|||||||||||||||||||
|
(in thousands, except per share amounts)
|
First
Quarter |
Second
Quarter |
Third
Quarter
|
Fourth
Quarter |
Year
|
|||||||||||||||
|
Operating revenues
|
$
|
94,728
|
|
$
|
106,901
|
|
$
|
124,182
|
|
$
|
111,005
|
|
$
|
436,816
|
|
|||||
|
Operating income
|
18,691
|
|
25,568
|
|
33,975
|
|
22,749
|
|
100,983
|
|
||||||||||
|
Net income
|
10,782
|
|
16,348
|
|
22,952
|
|
13,789
|
|
63,871
|
|
||||||||||
|
Basic earnings per share *
|
0.29
|
|
0.44
|
|
0.62
|
|
0.37
|
|
1.73
|
|
||||||||||
|
Diluted earnings per share
|
0.29
|
|
0.44
|
|
0.62
|
|
0.37
|
|
1.72
|
|
||||||||||
|
|
GSWC
|
|||||||||||||||||||
|
|
For The Year Ended December 31, 2018
|
|||||||||||||||||||
|
(in thousands)
|
First
Quarter |
Second
Quarter |
Third
Quarter
|
Fourth
Quarter |
Year
|
|||||||||||||||
|
Operating revenues
|
$
|
74,244
|
|
$
|
84,574
|
|
$
|
95,564
|
|
$
|
75,226
|
|
$
|
329,608
|
|
|||||
|
Operating income
|
16,297
|
|
22,645
|
|
27,540
|
|
14,080
|
|
80,562
|
|
||||||||||
|
Net income
|
8,890
|
|
13,648
|
|
17,919
|
|
7,555
|
|
48,012
|
|
||||||||||
|
|
AWR
|
|||||||||||||||||||
|
|
For The Year Ended December 31, 2017
|
|||||||||||||||||||
|
(in thousands, except per share amounts)
|
First
Quarter
|
Second
Quarter (1) |
Third
Quarter
|
Fourth
Quarter (2) |
Year
|
|||||||||||||||
|
Operating revenues
|
$
|
98,810
|
|
$
|
113,195
|
|
$
|
124,418
|
|
$
|
104,180
|
|
$
|
440,603
|
|
|||||
|
Operating income
|
24,576
|
|
42,026
|
|
38,534
|
|
21,959
|
|
127,095
|
|
||||||||||
|
Net income
|
12,701
|
|
22,792
|
|
21,006
|
|
12,868
|
|
69,367
|
|
||||||||||
|
Basic earnings per share *
|
0.35
|
|
0.62
|
|
0.57
|
|
0.35
|
|
1.88
|
|
||||||||||
|
Diluted earnings per share
|
0.34
|
|
0.62
|
|
0.57
|
|
0.35
|
|
1.88
|
|
||||||||||
|
|
GSWC
|
|||||||||||||||||||
|
|
For The Year Ended December 31, 2017
|
|||||||||||||||||||
|
(in thousands)
|
First
Quarter |
Second
Quarter (1) |
Third
Quarter
|
Fourth
Quarter (2) |
Year
|
|||||||||||||||
|
Operating revenues
|
$
|
76,906
|
|
$
|
88,346
|
|
$
|
99,913
|
|
$
|
75,136
|
|
$
|
340,301
|
|
|||||
|
Operating income
|
21,876
|
|
35,229
|
|
32,986
|
|
15,780
|
|
105,871
|
|
||||||||||
|
Net income
|
10,749
|
|
18,363
|
|
17,336
|
|
7,309
|
|
53,757
|
|
||||||||||
* The sum of the quarterly basic earnings per share amounts do not agree to the yearly total due to rounding.
|
(1)
|
The second quarter of 2017 includes (i) an
$8.3 million
pretax gain related to the sale of GSWC's Ojai water system, and (ii) retroactive operating revenues at ASUS totaling
$1.0 million
related to periods prior to 2017 as a result of the U.S. government's approval of ASUS's economic price adjustment for one of its utility privatization contracts.
|
|
(2)
|
The fourth quarter of 2017 includes the remeasurement of deferred taxes as a result of the Tax Cuts and Jobs Act. In addition, a
$1.8 million
reduction to GSWC's operating expenses was recorded representing cash received for reimbursement of legal and other defense costs related to condemnation matters.
|
114
Item 9. Changes in and Disagreements with Accountants on Accounting and Financial Disclosure
None.
Item 9A. Controls and Procedures
(a)
Conclusion Regarding the Effectiveness of Disclosure Controls and Procedures
Under the supervision and with the participation of our management, including our principal executive officer and principal financial officer, we conducted an evaluation of our disclosure controls and procedures, as such term is defined under Rule 13a-15(e) or 15d-15(e) promulgated under the Securities Exchange Act of 1934, as amended (the “Exchange Act”). Based on this evaluation, our principal executive officer and our principal financial officer concluded that the disclosure controls and procedures of AWR and GSWC were effective as of the end of the period covered by this annual report.
(b)
Management’s Report on Internal Control over Financial Reporting
Our management is responsible for establishing and maintaining adequate internal control over financial reporting, as such term is defined in Exchange Act Rule 13a-15(f). Under the supervision and with the participation of our management, including our principal executive officer and principal financial officer, we conducted an evaluation of the effectiveness of our internal control over financial reporting based on the framework in
Internal Control - Integrated Framework
(2013) issued by the Committee of Sponsoring Organizations of the Treadway Commission. Based on our evaluation under the framework in
Internal Control - Integrated Framework
, our management concluded that the internal control over financial reporting of AWR and GSWC was effective as of
December 31, 2018
.
(c)
Attestation Report of the Independent Registered Public Accounting Firm
The effectiveness of our internal control over financial reporting of AWR as of
December 31, 2018
has been audited by PricewaterhouseCoopers LLP, an independent registered public accounting firm, as stated in their report which is included herein.
(d)
Changes in Internal Control over Financial Reporting
There have been no changes in our internal control over financial reporting (as such term is defined in Rules 13a-15(f) or 15d(f) under the Exchange Act) of AWR and GSWC that occurred during the fourth quarter of
2018
that have materially affected, or are reasonably likely to materially affect, our internal control over financial reporting.
Item 9B. Other Information
None.
115
PART III
Item 10. Directors, Executive Officers and Corporate Governance
Information responsive to Part III, Item 10 is included in the Proxy Statement, to be filed by AWR with the SEC pursuant to Regulation 14A, under the captions therein entitled: (i) “Proposal 1: Election of Directors”; (ii) “Executive Officers”; (iii) “Governance of the Company”; (iv) “Stock Ownership”; (v) “Nominating and Governance Committee”; (vi) “Audit and Finance Committee;” and (vii) “Obtaining Additional Information From Us” and is incorporated herein by reference pursuant to General Instruction G(3).
Item 11. Executive Compensation
Information responsive to Part III, Item 11 is included in the Proxy Statement, to be filed by AWR with the SEC pursuant to Regulation 14A, under the captions therein entitled: (i) “Proposal 1: Election of Directors”; (ii) “Executive Officers;” and (iii) “Compensation Committee” and is incorporated herein by reference pursuant to General Instruction G(3).
Item 12. Security Ownership of Certain Beneficial Owners and Management and Related Stockholder Matters
Information responsive to Part III, Item 12 is included in the Proxy Statement, to be filed by AWR with the SEC pursuant to Regulation 14A, under the caption entitled “Stock Ownership” and is incorporated herein by reference pursuant to General Instruction G(3).
Securities Authorized for Issuance under Equity Compensation Plans
AWR has made stock awards to its executive officers and managers under the 2000, 2008 and 2016 employee plans. It has also made stock awards to its non-employee directors under the 2003 and 2013 director plans. Information regarding the securities which have been issued and which are available for issuance under these plans is set forth in the table below as of
December 31, 2018
. This table does not include any AWR Common Shares that may be issued under our 401(k) plan.
|
Plan Category
|
Number of securities
to be issued upon exercise of
outstanding options,
warrants and rights
(1)
|
Weighted-average
exercise price of
outstanding options,
warrants and rights
(2)
|
Number of securities
remaining available for
future issuance under equity
compensation plans
(excluding securities
reflected in the first column)
(3)
|
|
Equity compensation plans approved by shareholders
|
235,903
|
$16.76
|
1,963,708
|
|
Equity compensation plans not approved by shareholders
|
—
|
—
|
—
|
|
Total
|
235,903
|
$16.76
|
1,963,708
|
____________________________
|
(1)
|
Amount shown in this column consists of 35,560 options outstanding under the 2000 employee plan and the 2008 employee plan, 7,812 time-vested restricted stock units outstanding under the 2008 employee plan (including dividend equivalents thereon with respect to declared dividends), and 36,954 time-vested restricted stock units outstanding under the 2016 employee plan (including dividend equivalents thereon with respect to declared dividends), 98,108 performance awards at the maximum level (including dividend equivalents thereon with respect to declared dividends) outstanding under the 2016 employee plan, and 57,469 restricted stock units (including dividend equivalents thereon with respect to declared dividends) outstanding under the 2003 directors plan.
|
|
(2)
|
Amount shown in this column is for options granted only.
|
|
(3)
|
Amount shown in this column consists of 194,876 shares available under the 2003 directors plan, 124,086 shares available under the 2013 directors plan, 503,836 shares available under the 2008 employee plan, and 1,140,910 shares available under the 2016 employee plan. The only shares that may be issued under the 2003 directors plan are pursuant to dividend equivalent rights on dividends not yet declared with respect to restricted stock units granted under the 2003 directors plan. The only shares that may be issued under the 2008 employee plan are pursuant to dividend equivalent rights on dividends not yet declared with respect to restricted stock units and performance awards granted under the 2008 employee plan. No additional stock awards may be granted under the 2000 employee plan, the 2003 directors plan or the 2008 employee plan.
|
116
Item 13. Certain Relationships and Related Transactions, and Director Independence
Information responsive to Part III, Item 13 is included in the Proxy Statement, to be filed by AWR with the SEC pursuant to Regulation 14A, under the caption therein entitled “Governance of the Company” and is incorporated herein by reference pursuant to General Instruction G(3).
Item 14. Principal Accounting Fees and Services
Information responsive to Part III, Item 14 is included in the Proxy Statement, to be filed by AWR with the SEC pursuant to Regulation 14A, under the caption therein entitled “Proposal 3: Ratification of Auditors” and is incorporated herein by reference pursuant to General Instruction G(3).
117
PART IV
Item 15. Exhibits, Financial Statement Schedules
(a)
The following documents are filed as a part of this Annual Report on Form 10-K:
1. Reference is made to the Financial Statements incorporated herein by reference to Part II, Item 8 hereof.
2. Schedule I — Condensed Financial Information of American States Water Company Parent at December 31,
2018
and
2017
and for the years ended
December 31,
2018
,
2017
and
2016
. See page
123
. Schedules II, III, IV, and V are omitted as they are not applicable.
3. Reference is made to Item 15(b) of this Annual Report on Form 10-K.
(b) Exhibits:
|
3.1
|
||
|
3.2
|
||
|
3.3
|
||
|
3.4
|
||
|
4.1
|
||
|
4.2
|
||
|
4.3
|
||
|
4.4
|
||
|
10.1
|
Second Sublease dated October 5, 1984 between Golden State Water Company and Three Valleys Municipal Water District incorporated herein by reference to Registrant's Registration Statement on Form S-2, Registration No. 33-5151
|
|
|
10.2
|
Note Agreement dated as of May 15, 1991 between Golden State Water Company and Transamerica Occidental Life Insurance Company incorporated herein by reference to Registrant's Form 10-Q with respect to the quarter ended June 30, 1991 (File No. 1-14431)
|
|
|
10.3
|
Schedule of omitted Note Agreements, dated May 15, 1991, between Golden State Water Company and Transamerica Annuity Life Insurance Company, and Golden State Water Company and First Colony Life Insurance Company incorporated herein by reference to Registrant's Form 10-Q with respect to the quarter ended June 30, 1991 (File No. 1-14431)
|
|
|
10.4
|
||
|
10.5
|
Agreement for Financing Capital Improvement dated as of June 2, 1992 between Golden State Water Company and Three Valleys Municipal Water District incorporated herein by reference to Registrant's Form 10-K with respect to the year ended December 31, 1992 (File No. 1-14431)
|
|
|
10.6
|
Water Supply Agreement dated as of June 1, 1994 between Golden State Water Company and Central Coast Water Authority incorporated herein by reference to Exhibit 10.15 of Registrant's Form 10-K with respect to the year ended December 31, 1994 (File No. 1-14431)
|
|
|
10.7
|
||
118
|
10.8
|
||
|
10.9
|
||
|
10.10
|
||
|
10.11
|
||
|
10.12
|
||
|
10.13
|
||
|
10.14
|
||
|
10.15
|
||
|
10.16
|
||
|
10.17
|
||
|
10.18
|
||
|
10.19
|
||
|
10.20
|
||
|
10.21
|
||
|
10.22
|
||
|
10.23
|
||
|
10.24
|
||
|
10.25
|
||
|
10.26
|
||
|
10.27
|
||
|
10.28
|
||
|
10.29
|
||
119
|
10.30
|
||
|
10.31
|
||
|
10.32
|
|
|
|
10.33
|
||
|
10.34
|
||
|
10.35
|
||
|
10.36
|
||
|
10.37
|
||
|
10.38
|
||
|
21
|
|
|
|
23.1
|
|
|
|
31.1
|
||
|
31.1.1
|
||
|
31.2
|
||
|
31.2.1
|
||
|
32.1
|
||
|
32.2
|
||
|
101.INS
|
XBRL Instance Document (3)
|
|
|
101.SCH
|
XBRL Taxonomy Extension Schema (3)
|
|
|
101.CAL
|
XBRL Taxonomy Extension Calculation Linkbase (3)
|
|
|
101.DEF
|
XBRL Taxonomy Extension Definition Linkbase (3)
|
|
|
101.LAB
|
XBRL Taxonomy Extension Label Linkbase (3)
|
|
|
101.PRE
|
XBRL Taxonomy Extension Presentation Linkbase (3)
|
|
(c) See Item 15(a)(2)
(1) Filed concurrently herewith
(2) Management contract or compensatory arrangement
(3) Furnished concurrently herewith
Item 16. Form 10-K Summary
None.
120
SIGNATURES
Pursuant to the requirements of Section 13 or 15(d) of the Securities Exchange Act of 1934, Registrants have duly caused this report to be signed on its behalf by the undersigned, thereunto duly authorized.
|
|
|
AMERICAN STATES WATER COMPANY (“AWR”):
|
|
|
By:
|
/s/ EVA G. TANG
|
|
Eva G. Tang
|
||
|
|
|
Senior Vice President-Finance, Chief Financial
|
|
|
|
Officer, Treasurer and Corporate Secretary
|
|
|
|
GOLDEN STATE WATER COMPANY (“GSWC”):
|
|
|
By:
|
/s/ EVA G. TANG
|
|
Eva G. Tang
|
||
|
|
|
Senior Vice President-Finance, Chief Financial
|
|
|
|
Officer and Secretary
|
|
|
Date:
|
February 25, 2019
|
121
Pursuant to the requirements of the Securities Exchange Act of 1934, this report has been signed below by the following persons on behalf of Registrants and in the capacities and on the dates indicated.
|
|
|
Date:
|
|
|
|
/s/ LLOYD E. ROSS
|
|
|
|
February 25, 2019
|
|
Lloyd E. Ross
|
|
|
|
|
|
Chairman of the Board and Director of AWR and GSWC
|
|
|
|
|
|
/s/ ANNE M. HOLLOWAY
|
February 25, 2019
|
|||
|
Anne M. Holloway
|
||||
|
Vice Chairman of the Board and Director of AWR and GSWC
|
||||
|
/s/ ROBERT J. SPROWLS
|
|
|
|
February 25, 2019
|
|
Robert J. Sprowls
|
|
|
|
|
|
Principal Executive Officer, President and Chief Executive Officer of AWR and GSWC and Director of AWR and GSWC
|
|
|
|
|
|
/s/ EVA G. TANG
|
|
|
|
February 25, 2019
|
|
Eva G. Tang
|
|
|
|
|
|
|
|
|
|
|
|
Principal Financial and Accounting Officer, Senior Vice President-Finance, Chief Financial Officer, Treasurer and Corporate Secretary of AWR; and Principal Financial and Accounting Officer, Senior Vice President-Finance, Chief Financial Officer and Secretary of GSWC
|
|
|
|
|
|
/s/ JAMES L. ANDERSON
|
|
|
|
February 25, 2019
|
|
James L. Anderson
|
|
|
|
|
|
Director of AWR and GSWC
|
|
|
|
|
|
/s/SARAH. J. ANDERSON
|
|
|
|
February 25, 2019
|
|
Sarah. J. Anderson
|
|
|
|
|
|
Director of AWR and GSWC
|
|
|
|
|
|
/s/ DIANA M. BONTÁ
|
|
|
|
February 25, 2019
|
|
Diana M. Bontá
|
|
|
|
|
|
Director of AWR and GSWC
|
|
|
|
|
|
/s/ JOHN R. FIELDER
|
|
|
|
February 25, 2019
|
|
John R. Fielder
|
|
|
|
|
|
Director of AWR and GSWC
|
|
|
|
|
|
/s/ JAMES F. MCNULTY
|
|
|
|
February 25, 2019
|
|
James F. McNulty
|
|
|
|
|
|
Director of AWR and GSWC
|
|
|
|
|
|
/s/ JANICE F. WILKINS
|
|
|
|
February 25, 2019
|
|
Janice F. Wilkins
|
|
|
|
|
|
Director of AWR and GSWC
|
|
|
|
|
122
AMERICAN STATES WATER COMPANY
SCHEDULE I - CONDENSED FINANCIAL INFORMATION OF PARENT
CONDENSED BALANCE SHEETS
|
|
December 31,
|
|||||||
|
(in thousands)
|
2018
|
2017
|
||||||
|
Assets
|
|
|
|
|
||||
|
Cash and equivalents
|
$
|
34
|
|
$
|
48
|
|
||
|
Intercompany note receivables
|
76,072
|
|
45,955
|
|
||||
|
Total current assets
|
76,106
|
|
46,003
|
|
||||
|
Investments in subsidiaries
|
574,330
|
|
539,332
|
|
||||
|
Deferred taxes and other assets
|
8,769
|
|
8,422
|
|
||||
|
Total assets
|
$
|
659,205
|
|
$
|
593,757
|
|
||
|
Liabilities and Capitalization
|
|
|
|
|
||||
|
Notes payable to bank
|
$
|
—
|
|
$
|
59,000
|
|
||
|
Income taxes payable
|
3,672
|
|
2,780
|
|
||||
|
Intercompany payable
|
—
|
|
73
|
|
||||
|
Deferred taxes and other liabilities
|
291
|
|
509
|
|
||||
|
Total current liabilities
|
3,963
|
|
62,362
|
|
||||
|
Notes payable to bank
|
95,500
|
|
—
|
|
||||
|
Income taxes payable and other liabilities
|
1,519
|
|
1,450
|
|
||||
|
Total other liabilities
|
97,019
|
|
1,450
|
|
||||
|
Common shareholders’ equity
|
558,223
|
|
529,945
|
|
||||
|
Total capitalization
|
558,223
|
|
529,945
|
|
||||
|
Total liabilities and capitalization
|
$
|
659,205
|
|
$
|
593,757
|
|
||
The accompanying condensed notes are an integral part of these condensed financial statements.
123
AMERICAN STATES WATER COMPANY
SCHEDULE I - CONDENSED FINANCIAL INFORMATION OF PARENT
CONDENSED STATEMENTS OF INCOME
|
|
For the Years Ended December 31,
|
|||||||||||
|
(In thousands, except per share amounts)
|
2018
|
2017
|
2016
|
|||||||||
|
Operating revenues and other income
|
$
|
—
|
|
$
|
—
|
|
$
|
71
|
|
|||
|
Operating expenses and other expenses
|
305
|
|
344
|
|
19
|
|
||||||
|
Income before equity in earnings of subsidiaries and income taxes
|
(305
|
)
|
(344
|
)
|
52
|
|
||||||
|
Equity in earnings of subsidiaries
|
63,651
|
|
67,490
|
|
59,145
|
|
||||||
|
Income before income taxes
|
63,346
|
|
67,146
|
|
59,197
|
|
||||||
|
Income tax benefit
|
(525
|
)
|
(2,221
|
)
|
(546
|
)
|
||||||
|
Net income
|
$
|
63,871
|
|
$
|
69,367
|
|
$
|
59,743
|
|
|||
|
Weighted Average Number of Common Shares Outstanding
|
36,733
|
|
36,638
|
|
36,552
|
|
||||||
|
Basic Earnings Per Common Share
|
$
|
1.73
|
|
$
|
1.88
|
|
$
|
1.63
|
|
|||
|
Weighted Average Number of Diluted Common Shares Outstanding
|
36,936
|
|
36,844
|
|
36,750
|
|
||||||
|
Fully Diluted Earnings per Common Share
|
$
|
1.72
|
|
$
|
1.88
|
|
$
|
1.62
|
|
|||
|
Dividends Paid Per Common Share
|
$
|
1.060
|
|
$
|
0.994
|
|
$
|
0.914
|
|
|||
The accompanying condensed notes are an integral part of these condensed financial statements.
124
AMERICAN STATES WATER COMPANY
SCHEDULE I - CONDENSED FINANCIAL INFORMATION OF PARENT
CONDENSED STATEMENTS OF CASH FLOWS
|
|
For the Years Ended December 31,
|
|||||||||||
|
(in thousands)
|
2018
|
2017
|
2016
|
|||||||||
|
Cash Flows From Operating Activities
|
$
|
79,877
|
|
$
|
36,024
|
|
$
|
34,878
|
|
|||
|
Cash Flows From Investing Activities:
|
|
|
|
|
|
|
||||||
|
Loans (made to)/repaid from, wholly-owned subsidiaries
|
(30,500
|
)
|
30,500
|
|
(64,500
|
)
|
||||||
|
Increase in investment of subsidiary
|
(47,500
|
)
|
—
|
|
—
|
|
||||||
|
Net cash provided (used) in investing activities
|
(78,000
|
)
|
30,500
|
|
(64,500
|
)
|
||||||
|
Cash Flows From Financing Activities:
|
|
|
|
|
|
|
||||||
|
Proceeds from stock option exercises
|
546
|
|
909
|
|
235
|
|
||||||
|
Net change in notes payable to banks
|
36,500
|
|
(31,000
|
)
|
62,000
|
|
||||||
|
Dividends paid
|
(38,937
|
)
|
(36,417
|
)
|
(33,408
|
)
|
||||||
|
Other
|
—
|
|
—
|
|
(9
|
)
|
||||||
|
Net cash provided (used) in financing activities
|
(1,891
|
)
|
(66,508
|
)
|
28,818
|
|
||||||
|
Change in cash and equivalents
|
(14
|
)
|
16
|
|
(804
|
)
|
||||||
|
Cash and equivalents at beginning of period
|
48
|
|
32
|
|
836
|
|
||||||
|
Cash and equivalents at the end of period
|
$
|
34
|
|
$
|
48
|
|
$
|
32
|
|
|||
The accompanying condensed notes are an integral part of these condensed financial statements.
125
AMERICAN STATES WATER COMPANY
NOTES TO CONDENSED FINANCIAL INFORMATION OF PARENT
Note 1 — Basis of Presentation
The accompanying condensed financial statements of AWR (parent) should be read in conjunction with the consolidated financial statements and notes thereto of American States Water Company and subsidiaries (“Registrant”) included in Part II, Item 8 of this Form 10-K. AWR’s (parent) significant accounting policies are consistent with those of Registrant and its wholly owned subsidiaries, Golden State Water Company (“GSWC”) and American States Utility Services, Inc. ("ASUS"), except that all subsidiaries are accounted for as equity method investments.
Related-Party Transactions:
As further discussed in
Note 2 — Notes Payable to Banks
, AWR (parent) has access to a
$150.0 million
revolving credit facility. AWR (parent) borrows under this facility and provides funds to its subsidiaries, in support of their operations. Any amounts owed to AWR (parent) for borrowings under this facility are reflected as inter-company receivables on the condensed balance sheets. The interest rate charged to the subsidiaries is sufficient to cover AWR (parent)’s interest cost under the credit facility.
AWR (parent) guarantees performance of ASUS's military privatization contracts and agrees to provide necessary resources, including financing, which are necessary to assure the complete and satisfactory performance of such contracts.
Note 2 — Note Payable to Banks
AWR (parent) has access to a
$150.0 million
credit facility, which expires in May 2023. The aggregate effective amount that may be outstanding under letters of credit is
$25.0 million
. AWR has obtained letters of credit, primarily for GSWC, in the aggregate amount of
$940,000
, with fees of
0.65%
including: (i) letters of credit in an aggregate amount of
$340,000
as security for GSWC’s business automobile insurance policy; (ii) a letter of credit in an amount of
$585,000
as security for the purchase of power; and (iii) a
$15,000
irrevocable letter of credit pursuant to a franchise agreement with the City of Rancho Cordova. Letters of credit outstanding reduce the amount that may be borrowed under the revolving credit facility. AWR was not required to maintain any compensating balances.
Loans can be obtained under this credit facility at the option of AWR and bear interest at rates based on credit ratings and
Euro rate
margins. In July 2018, Standard and Poor’s Global Ratings (“S&P”) affirmed an A+ credit rating with a stable outlook on both AWR and GSWC. S&P’s debt ratings range from AAA (highest possible) to D (obligation is in default). In January 2019, Moody's Investors Service ("Moody's") affirmed its A2 rating with a positive outlook for GSWC.
At
December 31, 2018
, there was
$95.5 million
outstanding under this facility. At times, AWR (parent) borrows under this facility and provides loans to its subsidiaries in support of its operations, under terms that are similar to that of the credit facility.
AWR’s (parent) borrowing activities (excluding letters of credit) for the years ended
December 31, 2018
and
2017
were as follows:
|
|
December 31,
|
|||||||
|
(in thousands, except percent)
|
2018
|
2017
|
||||||
|
Balance Outstanding at December 31,
|
$
|
95,500
|
|
$
|
59,000
|
|
||
|
Interest Rate at December 31,
|
3.19
|
%
|
2.28
|
%
|
||||
|
Average Amount Outstanding
|
$
|
69,559
|
|
$
|
65,242
|
|
||
|
Weighted Average Annual Interest Rate
|
2.66
|
%
|
1.69
|
%
|
||||
|
Maximum Amount Outstanding
|
$
|
95,500
|
|
$
|
102,500
|
|
||
All of the letters of credit are issued pursuant to the revolving credit facility. The revolving credit facility contains restrictions on prepayments, disposition of property, mergers, liens and negative pledges, indebtedness and guaranty obligations, transactions with affiliates, minimum interest coverage requirements, a maximum debt to capitalization ratio and a minimum debt rating. Pursuant to the credit agreement, AWR must maintain a minimum interest coverage ratio of
3.25
times interest expense, a maximum total funded debt ratio of
0.65
to
1.00
and a minimum debt rating from Moody’s or S&P of Baa3 or BBB-, respectively. As of
December 31, 2018
, AWR was in compliance with these covenants with an interest coverage ratio of
6.23
times interest expense, a debt ratio of
0.43
to 1.00 and a debt rating of A+ by S&P.
126
Note 3 — Income Taxes
AWR (parent) receives a tax benefit for expenses incurred at the parent-company level. AWR (parent) also recognizes the effect of AWR’s consolidated California unitary apportionment, which is beneficial or detrimental depending on a combination of the profitability of AWR’s consolidated non-California activities as well as the proportion of its consolidated California sales to total sales.
Note 4 — Dividend from Subsidiaries
Dividends in the amount of
$79.0 million
,
$36.5 million
and
$33.8 million
were paid to AWR (parent) by its wholly owned subsidiaries during the years ended December 31,
2018
,
2017
and
2016
, respectively.
127
TABLE OF CONTENTS
Part IItem 1. BusinessItem 1A. Risk FactorsItem 1B. Unresolved Staff CommentsItem 2. PropertiesItem 3. Legal ProceedingsItem 4. Mine Safety DisclosurePart IIItem 5. Market For Registrant S Common Equity, Related Stockholder Matters and Issuer Purchases Of Equity SecuritiesItem 6. Selected Financial DataItem 7. Management S Discussion and Analysis Of Financial Condition and Results Of OperationItem 7A. Quantitative and Qualitative Disclosures About Market RiskItem 8. Financial Statements and Supplementary DataNote 1 Summary Of Significant Accounting PoliciesNote 2 RevenuesNote 3 Regulatory MattersNote 4 Utility Plant and Intangible AssetsNote 5 Derivative InstrumentsNote 6 Military PrivatizationNote 7 Earnings Per Share and Capital StockNote 8 Dividend LimitationsNote 9 Bank DebtNote 10 Long-term DebtNote 11 Taxes on IncomeNote 12 Employee Benefit PlansNote 13 Stock-based Compensation PlansNote 14 - CommitmentsNote 15 - Contingencies and Gain on Sale Of AssetsNote 16 - Business SegmentsNote 17 Allowance For Doubtful AccountsNote 18 Supplemental Cash Flow InformationNote 19 Selected Quarterly Financial Data (unaudited)Item 9. Changes in and Disagreements with Accountants on Accounting and Financial DisclosureItem 9A. Controls and ProceduresItem 9B. Other InformationPart IIIItem 10. Directors, Executive Officers and Corporate GovernanceItem 11. Executive CompensationItem 12. Security Ownership Of Certain Beneficial Owners and Management and Related Stockholder MattersItem 13. Certain Relationships and Related Transactions, and Director IndependenceItem 14. Principal Accounting Fees and ServicesPart IVItem 15. Exhibits, Financial Statement SchedulesItem 16. Form 10-k SummaryNote 1 Basis Of PresentationNote 2 Notes Payable To BanksNote 2 Note Payable To BanksNote 3 Income TaxesNote 4 Dividend From Subsidiaries