AWARE INC /MA/
10-Ks and 10-Qs
|
|
|
|
|
|
|
|
|
|
|
|
|
|
|
|
|
|
|
|
|
|
|
|
|
|
|
|
|
|
|
|
|
|
|
|
|
|
|
|
|
|
|
|
|
|
|
|
|
|
|
|
|
|
|
|
|
|
|
|
|
|
|
|
|
|
|
|
UNITED STATES
SECURITIES AND EXCHANGE COMMISSION
Washington, D.C. 20549
FORM 10-K
Annual Report Pursuant to Section 13 or 15(d) of The
Securities Exchange Act of 1934
For the fiscal year ended December 31, 2010
Commission file number 000-21129
| AWARE, INC. | ||
| (Exact Name of Registrant as Specified in Its Charter) | ||
| Massachusetts | 04-2911026 | |||
|
(State or Other Jurisdiction of
Incorporation or Organization) |
(I.R.S. Employer Identification No.) |
| 40 Middlesex Turnpike, Bedford, Massachusetts 01730 | ||
|
(Address of Principal Executive Offices)
(Zip Code) |
| (781) 276-4000 | ||
| (Registrant’s Telephone Number, Including Area Code) | ||
Securities registered pursuant to Section 12(b) of the Act:
| Title of Each Class | Name of Each Exchange on Which Registered | |||
| Common Stock, par value $.01 per share | The Nasdaq Global Market | |||
Securities registered pursuant to Section 12(g) of the Act:
None
Indicate by check mark if the registrant is a well-known seasoned issuer, as defined in Rule 405 of the Securities Act. Yes
o
No
x
Indicate by check mark if the registrant is not required to file reports pursuant to Section 13 or Section 15(d) of the Exchange Act.
Yes
o
No
x
Indicate by check mark whether the registrant (1) has filed all reports required to be filed by Section 13 or 15(d) of the Securities Exchange Act of 1934 during the preceding 12 months (or for such shorter period that the registrant was required to file such reports), and (2) has been subject to such filing requirements for the past 90 days. Yes
x
No
o
Indicate by check mark whether the registrant has submitted electronically and posted on its corporate Web site, if any, every Interactive Data File required to be submitted and posted pursuant to Rule 405 of Regulation S-T (§ 232.405 of this chapter) during the preceding 12 months (or for such shorter period that the registrant was required to submit and post such files). YES
o
NO
o
Indicate by check mark if disclosure of delinquent filers pursuant to Item 405 of Regulation S-K is not contained herein, and will not be contained, to the best of registrant’s knowledge, in definitive proxy or information statements incorporated by reference in Part III of this Form 10-K or any amendment to this Form 10-K.
x
Indicate by check mark whether the registrant is a large accelerated filer, an accelerated filer, a non-accelerated filer, or a smaller reporting company. See the definitions of “large accelerated filer”, “accelerated filer”, and “smaller reporting company” in Rule 12b-2 of the Exchange Act. (Check one):
Large Accelerated Filer
o
Accelerated Filer
x
Non-Accelerated Filer
o
Smaller Reporting Company
o
Indicate by check mark whether the registrant is a shell company (as defined in Rule 12b-2 of the Exchange Act). Yes
o
No
x
As of June 30, 2010 the aggregate market value of the registrant’s common stock held by non-affiliates of the registrant, based on the closing sale price as reported on the Nasdaq Global Market, was approximately $41,410,529.
The number of shares outstanding of the registrant’s common stock as of February 4, 2011 was 20,183,754.
DOCUMENTS INCORPORATED BY REFERENCE
Portions of the registrant’s definitive Proxy Statement to be delivered to shareholders in connection with the registrant’s Annual Meeting of Shareholders to be held on May 25, 2011 are incorporated by reference into Part III of this Annual Report on Form 10-K.
AWARE, INC.
FORM 10-K
FOR THE YEAR ENDED DECEMBER 31, 2010
TABLE OF CONTENTS
|
PART I
|
||
|
Item 1.
|
Business
|
3
|
|
Item 1A.
|
Risk Factors
|
11
|
|
Item 1B.
|
Unresolved Staff Comments
|
18
|
|
Item 2.
|
Properties
|
19
|
|
Item 3.
|
Legal Proceedings
|
19
|
|
Item 4.
|
(Removed and Reserved)
|
19
|
|
PART II
|
||
|
Item 5.
|
Market for Registrant’s Common Equity, Related Stockholder Matters and Issuer Purchases of Equity Securities
|
20
|
|
Item 6.
|
Selected Financial Data
|
22
|
|
Item 7.
|
Management’s Discussion and Analysis of Financial Condition and Results of Operations
|
23
|
|
Item 7A.
|
Quantitative and Qualitative Disclosures About Market Risk
|
32
|
|
Item 8.
|
Financial Statements and Supplementary Data
|
33
|
|
Item 9.
|
Changes in and Disagreements with Accountants on Accounting and Financial Disclosure
|
53
|
|
Item 9A.
|
Controls and Procedures
|
53
|
|
Item 9B.
|
Other Information
|
53
|
|
PART III
|
||
|
Item 10.
|
Directors, Executive Officers and Corporate Governance
|
54
|
|
Item 11.
|
Executive Compensation
|
54
|
|
Item 12.
|
Security Ownership of Certain Beneficial Owners and Management and Related Stockholder Matters
|
54
|
|
Item 13.
|
Certain Relationships and Related Transactions, and Director Independence
|
54
|
|
Item 14.
|
Principal Accountant Fees and Services
|
54
|
|
PART IV
|
||
|
Item 15.
|
Exhibits and Financial Statement Schedule
|
55
|
|
Signatures
|
57
|
|
2
Company Overview
We have been a leading supplier of innovative signal processing and digital communications technology for imaging and telecommunications applications since the early 1990s. Presently, our business operations are focused along three product lines: i) biometrics and imaging; ii) Digital Subscriber Line (“DSL”) test and diagnostics; and iii) patent licensing. Prior to November 2009, we were also a supplier of DSL silicon intellectual property to the semiconductor industry.
Biometrics & Imaging.
Our biometrics software products leverage imaging and biometrics technologies developed by Aware over the past 20 years. We sell a broad range of software products that are used in biometric systems worldwide. Primary applications of biometrics systems include criminal justice, border management, secure credentialing, national defense, access control, and background checks.
Our products provide interoperable, standards-compliant, field-proven biometric functionality for: i) enrollment of fingerprints and facial images into biometrics systems; ii) biometric ID card personalization; and iii) reading and transmission of biometric transactions throughout identification networks. Our server-based Biometrics Services Platform (BioSP)™ is a modular, flexible software platform that enables developers, integrators and end-users to rapidly build and deploy centralized multimodal biometric data processing solutions in support of a service-oriented architecture. In addition, we offer professional services to assist customers with the design, development and implementation of biometrics systems. We also sell software products for medical and digital imaging applications based upon industry standards such as JPEG 2000 and JPIP.
We sell our biometrics and imaging products and services to OEM customers as well as directly to end-users, such as government agencies.
DSL Test & Diagnostics
. Our DSL test and diagnostics products leverage DSL technologies developed by Aware since the early 1990s. As phone companies expand their DSL offerings to include IPTV, video, and triple play services, they need better test and diagnostics solutions that improve the delivery of those services.
We sell DSL test and diagnostics hardware and software products that pre-qualify, monitor and troubleshoot DSL service. Our hardware products support all common DSL network architectures in single, easy-to-integrate modules. These products enable broad connectivity for DSL test and diagnostics applications by supporting interoperability across an extensive footprint of central office and customer premises equipment. We sell our modules to OEMs that incorporate them into their DSL equipment products, such as automated testheads and handheld testers.
Our DSL test and diagnostic software products include our line diagnostics platform (“LDP”) software and our Dr. DSL® software. LDP is an advanced test and diagnostics server-based software offering that provides a comprehensive, centralized system for analysis and diagnostics of a service provider’s DSL network. By utilizing equipment infrastructure already in place for DSL service delivery, LDP enables a cost-effective means for service providers to ensure quality levels and troubleshoot their networks. Our Dr. DSL® software products support pre-qualification, provisioning, rate estimation, troubleshooting and maintenance applications. We sell our software products to telephone companies, network equipment suppliers, and OEM suppliers.
Patent Licensing.
Over the past 20 years, we have actively patented the technologies we have developed. As of December 31, 2010, we had approximately 185 U.S. and foreign patents, and approximately 271 pending patent applications pertaining to communications and signal processing technologies, including DSL, test and diagnostics, biometrics and medical imaging, image compression, video compression, and seismic data compression. The objective of our patent licensing operations is to develop patents and to license or sell them to interested third parties. Over the past three years, we have continued to enhance and develop our patent portfolio; however patent licensing revenue has been limited other than a significant patent sale in 2008.
In September 2010, we announced plans to pursue a spin-off of our patent licensing operations. The spin-off would allow the spun-off entity to focus on patent licensing operations and for Aware to focus on being a supplier of biometrics and imaging software and DSL test and diagnostics products. As of the date of this report, our board is reviewing strategic options with respect to our patent licensing operations, including a potential spin-off.
3
DSL Silicon Intellectual Property.
From the mid 1990s until November 2009, we licensed DSL silicon intellectual property (“IP”) to enable semiconductor suppliers to manufacture and sell integrated circuits for the DSL industry. During the three years leading up to November 2009, our primary silicon licensing customers were Ikanos Communications, Inc. (“Ikanos”) and Infineon Technologies AG (“Infineon”). In November 2009 Infineon completed a spin-off of its semiconductor division into a new company called Lantiq Deutschland GmbH (“Lantiq”). Approximately one week later, we closed a transaction with Lantiq involving the sale and transfer of: i) our DSL and home networking silicon IP assets, ii) certain patents, and iii) 41 Aware employees. As a result of this sale, we no longer offer DSL or home networking silicon IP products and DSL silicon IP is not a material part of our business. However, we continue to provide a minor amount of engineering support services to Ikanos and we continue to receive royalties from Lantiq and Ikanos for the use of our DSL silicon IP in their DSL chipsets.
We have research and development activities underway to expand our product offerings and develop new technologies in biometrics and imaging as well as in communications test and diagnostics applications. We also play an active role at standards setting bodies so that we can anticipate and influence technology advances and changes in industry requirements.
We are headquartered in Bedford, Massachusetts. Our telephone number is (781) 276-4000, and our website is www.aware.com. Incorporated in Massachusetts in 1986, we employed 83 people as of December 31, 2010. Our stock is traded on the Nasdaq Global Market under the symbol AWRE.
Our website provides a link to a third-party website through which our annual, quarterly and current reports, and amendments to those reports, are available free of charge. We believe these reports are made available as soon as reasonably practicable after we electronically file them with, or furnish them to, the SEC. We do not maintain or provide any information directly to the third-party website, and we are not responsible for its accuracy. You may also access our various SEC filings and reports at the SEC’s website at www.sec.gov.
Industry Background
Biometrics Industry Background
. Biometric identification systems have traditionally used fingerprints as the primary means to identify individuals and they continue to be pervasive in a wide variety of government applications. These systems gather fingerprints at enrollment stations and access control locations, and utilize transaction processing hardware and software and matching systems for identification. The emergence of digital fingerprint acquisition devices, compression, and standardized biometric transaction/interchange formats in the 1990s has enabled biometrics systems to process and match fingerprints faster. These electronic systems are also capable of being upgraded to utilize biometrics other than or in addition to digital fingerprints, such as iris and facial images.
The capture and secure storage of biometric information over the past ten years has created a foundation for greater use of biometrics in government and commercial activities. The interest in using biometrics to improve security has continued to grow during this time. The emergence and adoption of industry standards for border control and secure credential applications has increased the reach and use of biometrics in security applications. Legislation is driving many government programs now underway that require the use of biometric information in e-passports, visas and personal identification cards. Personal identity verification (“PIV”) and other secure credentialing systems are being employed by government agencies to standardize federal employee and contractor IDs and utilize them to control access to government facilities and information systems. Other biometrics applications such as border management, and upgrades to state and local automated fingerprint identification systems (“AFIS”) used for fingerprint enrollments are also expected to present opportunities for vendors of biometrics products in the next several years. The use of biometric security systems by regulated segments of the financial, transportation and healthcare industries has also increased. As biometric security systems gain acceptance in new areas, and as infrastructure build-outs take hold, new opportunities are emerging for biometrics solutions suppliers. The biometrics security systems market is also expected to grow as the use of new biometrics, other than or in addition to fingerprints, gain favor.
Vendors of the hardware and/or software component of biometric enrollment stations include Lockheed Martin Corporation (“Lockheed”), Cross Match Technologies, Inc. (“Cross Match”), Unisys Corporation (“Unisys”), Science Applications International Corporation (“SAIC”), L-1 Identity Solutions, Inc. (“L-1”), Northrop Grumman Corporation (“Northrop”), Hewlett-Packard Electronic Data Systems (“EDS”) and NEC Corporation (“NEC”). Fingerprint matching and/or biometric transaction management systems are provided by companies such as Sagem Telecommunications (“Sagem”), NEC, 3M Cogent Inc. (“Cogent”), and numerous system integrators.
4
DSL Test & Diagnostics Industry Background
. DSL technology allows telephone companies to offer high-speed data services and Internet Protocol television (“IPTV”) over their existing telephone wires. There are hundreds of millions of DSL lines in service across North America, Europe, the Middle East, Africa, the Asia Pacific region and Latin America.
As the demand for faster residential broadband service continues to grow, telephone companies are upgrading their networks to increase the data rates that are delivered to their residential customers. With higher data rates, phone companies can offer improved service offerings such as television via IPTV, as well as video and triple play services. IPTV provides phone companies a means to deliver a superior and differentiated TV service by offering more channel selections, better quality and an improved user experience. Improved service offerings are expected to continue to drive increased demand for the fastest versions of DSL service over the next several years. Network upgrades for faster service require large financial expenditures and involve the deployment of fiber optic-based communications to points deeper in the access networks that are closer to residential customers than typical central office locations. The resulting fiber-to-the-node (“FTTN”) networks also require that new equipment platforms be installed at fiber-fed points. These equipment platforms deploy ADSL2+ or VDSL2 technology over existing telephone wires to provide increased data rates and reliability. ADSL2+, standardized by the ITU in 2003, achieves data rates up to 24 Mbps upstream on phone lines as long as 3,000 feet. VDSL2, standardized in 2006, is the fastest version of DSL providing data rates up to 100 Mbps.
As phone companies deploy higher data rates and video services, they also increasingly need improved solutions for testing, diagnosing and maintaining their DSL networks and services. The ADSL2+ and VDSL2 standards are the first DSL standards to incorporate test functionality for analyzing and diagnosing DSL networks, thus improving a phone company’s ability to test and diagnose their network.
DSL test and diagnostics solutions deployed by telephone companies include hardware and software products. These products are designed to allow telephone companies to gather information about their DSL networks. This information is used to assist with pre-qualifying, analyzing, and diagnosing problems encountered during service deployment or during operation. Hardware and software products include:
|
|
●
|
Centralized test equipment (also known as “testheads”) – Testheads are deployed in centralized locations of telephone companies, such as central offices and node-based equipment cabinets. This equipment allows telephone companies to provision or troubleshoot DSL service remotely from such centralized locations.
|
|
|
●
|
Handheld test devices – This equipment is used by technicians in the field to test and diagnose problems at customer premise locations.
|
|
|
●
|
Software-based test solutions – This software makes use of telephone companies’ DSL infrastructure that is already in place to provide DSL service. Over the past few years, DSL test software has become more widely adopted because of its cost effectiveness relative to hardware solutions.
|
Service providers are able to purchase DSL test and diagnostics hardware and software products from a number of companies including Alcatel-Lucent (“Alcatel”), Spirent Communications PLC (“Spirent”), Tollgrade Communications, Inc. (“Tollgrade”), JDS Uniphase Corporation (“JDSU”), Sunrise Communications, Inc. (“Sunrise”), Fluke Corporation (“Fluke”), Kurth Electronic GmbH (“Kurth”), Assia, Inc (“Assia”), and others.
Patent Licensing Industry Background
. Under U.S. law, an inventor or patent owner has the right to exclude others from making, selling or using their patented inventions.
Over the past decade, a number of companies have emerged to form a robust patent licensing industry. These companies grow their patent portfolios by: i) acquiring patents from third parties, ii) developing patents of their own, or iii) through a combination of both methods. Patent licensing companies then execute patent licensing arrangements with users of their patented technologies through willing licensing negotiations without the filing of patent infringement litigation, or through the negotiation of license and settlement arrangements in connection with the filing of patent infringement litigation.
Some well-known patent licensing companies include Intellectual Ventures Management LLC, Acacia Research Corporation, Digimarc Corporation, NTP, Inc., Wi-Lan, Inc., InterDigital, Inc., Rambus Inc, and MOSAID Technologies Inc.
5
Aware Biometrics and Imaging Products and Services
Aware has been involved with the development of wavelet-based image compression technology since the late 1980s. Aware provides standards-compliant biometrics software tools that enable integrators, solution providers, and government agencies to compress, analyze, optimize, format, and transport biometric images and data according to domestic and international standards.
Our biometrics and imaging products address:
|
●
|
Data formatting and interchange software components that support NIST, ISO, INCITS, ICAO, and FIPS 201 standards and enable interoperability.
|
|
●
|
Image compression software components for fingerprint and facial image compression such as WSQ and JPEG2000.
|
|
●
|
Biometric ID cards. Our PIVSuite™ family of software development kits (SDKs) supports registration, identity proofing, ID card personalization and issuance applications in compliance with FIPS 201. CaptureSuite™ is a family of SDKs for automatic capture and processing of fingerprints.
|
|
●
|
Image processing for biometric quality analysis, capture and transaction processing applications.
|
|
●
|
Software for building and deploying multimodal biometric data workflow solutions. Our Biometrics Services Platform (BioSP
TM
) is a service-oriented platform for biometrics data processing and integration applications. BioSP supports the collection of biometrics from a distributed network, and subsequent aggregation, analysis, processing and integration of this data into larger systems.
|
We sell our biometrics software products to integrators, OEMs and government agencies. We supply a broad range of fingerprint and facial biometric functionality, including enrollment, ID personalization and reading, and networking. Our solutions address border control and management, secure credentialing, national defense, access control, and fingerprint background check applications. We also sell medical imaging and digital imaging software solutions. We have a large number of OEM customers in the biometrics, medical and digital imaging markets.
We also offer professional services to customers who require assistance with the design and development of systems for biometrics applications.
Aware DSL Test and Diagnostics Products
We have developed test and diagnostics hardware and software products based upon our universal DMT (UDMT™) and Dr. DSL technology. These products are designed to improve the ability of service providers to pre-qualify, provision, monitor, and troubleshoot DSL networks by enabling them to collect relevant information and diagnose problems regarding their service offerings. The primary goal of these products is to reduce the costs associated with service set-up, troubleshooting and maintenance.
Aware’s UDMT modem modules can be software-configured to emulate both Digital Subscriber Line Access Multiplexers (“DSLAMs”) at central office end of the line and customer premise equipment (“CPE”) at the remote customer of the line across a broad range of DSL technologies, including ADSL, ADSL2+, legacy VDSL1/1.5 and VDSL2. A single UDMT module will support all common DSL network architectures so that test solutions can easily and cost-effectively interoperate with installed DSLAMs and CPE/gateways.
Our principal UDMT modem modules include our 450/455, 475, 550, 600, 606, and 656 model numbers. Each of these are easy-to-integrate, standard-compliant, modules for ADSL/2/2+ and VDSL networks. Each can be software configured to support DSLAM or CPE emulation.
We primarily sell our hardware products to OEMs who supply DSL automated test equipment and DSL handheld testers.
Our Dr. DSL Line Diagnostics Platform (“LDP”) is a server-based software platform that provides a comprehensive, centralized system for analysis and diagnostics of a service provider’s DSL lines. With LDP, we provide service providers with a software-based test solution that can use existing infrastructure to provide provisioning and maintenance services. This enables telephone companies to perform analysis and diagnostics of traditional POTS and traditional and advanced DSL services, including IPTV and triple play services.
6
Aware’s Dr. DSL software modules perform pre-qualification, fault detection, line diagnostics and line analysis functionality. Dr. DSL software is utilized by our UDMT modules.
We primarily sell our DSL test and diagnostic software products to telephone companies, network equipment suppliers, and OEM suppliers.
Aware Strategy
Aware is focused on developing innovative products that deliver a strong value proposition to our customers. We have vast experience in the biometrics and DSL industries, a broad technology foundation in signal processing, image processing and communications and long-standing relationships with industry-leading OEMs and end users.
Key elements of our strategy include:
Develop innovative products for our target markets.
Our technology forms the basis for our product developments in biometrics, imaging and communications applications. Our research and development activities focus primarily on product developments that commercialize our technology into software and hardware products for these applications.
Commercialize software components and server-based solutions for biometrics applications.
We have developed software products for fingerprint enrollment, border control and secure credential applications. Our Biometrics Services Platform (BioSP) is a server-based software product for enrollment of biometric data for personal identity verification and other applications. We sell products and services primarily to OEM suppliers and systems integrators giving us broad exposure to the global biometrics market. We also sell directly to government agencies and other end-users.
Commercialize hardware and software solutions for DSL test and diagnostics applications.
We have developed hardware modules and software solutions for pre-qualifying, provisioning, and troubleshooting DSL networks. These products leverage our DSL expertise, test functionality inherent in ADSL2+ and VDSL2 standard-compliant solutions and relationships with certain semiconductor suppliers. We sell to automated test equipment manufacturers, network equipment manufacturers and service providers. We sell primarily through OEMs which enables us to gain broad exposure to growth in spending by phone companies on DSL test and diagnostics solutions. We also sell directly to phone companies.
Develop intellectual property for signal processing and communications applications.
Over the past 20 years, we have developed a broad portfolio of intellectual property assets including trade secrets, copyrighted materials, and US and foreign patents. We have pioneered the development of core technologies for signal processing and communications applications that address various industries, including biometrics and DSL. We actively promote our technologies at certain standards bodies. We are also involved in licensing and selling our patents as a means to commercialize our technology.
Research and Development
Our research and development activities are focused primarily on improving core technologies in communications and imaging and product developments in DSL test, biometrics and medical imaging.
Our biometrics and imaging engineering activities are focused on improving software product functionality and broadening our exposure to biometrics, medical and digital imaging applications. During 2010, we further improved the functionality in our software components for PIV and fingerprint enrollment applications, as well as in our BioSP server-based software platform.
Our DSL test and diagnostics engineering activities involve improving the functionality of our DSL test and diagnostics hardware and software products to support phone company requirements for pre-qualifying, monitoring and troubleshooting advanced DSL services, including VDSL2 networks and IPTV deployments. During 2010, we focused on improvements to our LDP server-based software platform for DSL test and diagnostic applications and introduced new hardware modules.
7
As of December 31, 2010, we had an engineering staff of 51 employees, representing 61% of our total employee staff. During the years ended December 31, 2010, 2009, and 2008, research and development expenses charged to operations were $8.1 million, $11.9 million, and $13.2 million, respectively. In addition, because we provide engineering development services to our customers, a portion of our total engineering costs has been allocated to cost of contract revenue. We expect that we will continue to invest substantial funds in research and development activities.
Sales and Marketing
Our sales and marketing strategy varies by product line as follows:
Biometrics & Imaging
- We sell our biometrics and imaging software products and professional services either: i) through an OEM channel; or ii) directly to the federal government and/or its agencies.
DSL Test & Diagnostics
- We sell our DSL test and diagnostics hardware products primarily through an OEM channel. We sell our DSL test and diagnostics software products either: i) through an OEM channel; or ii) directly to telephone companies. In the future, we may also sell software products through partners, such as value added resellers.
Patent Licensing
- We sell patents or license patent rights directly to third parties. Decisions involving patent transactions are typically made at senior levels within a prospective customer’s organization, and therefore we rely on presentations by our senior management to make such sales or licenses.
As of December 31, 2010, there were 8 employees in our biometrics and digital imaging software sales and marketing organization, 5 employees in our DSL test and diagnostics sales and marketing organization, and no full-time employees in our patent licensing sales and marketing organization.
We had no biometrics and imaging customers that represented more than 10% of our total revenue in 2010 or 2009. In 2008, we derived approximately 10% of our total revenue from Technology Management Group, Inc. (“TMG”).
We had no DSL test and diagnostics customers that represented more than 10% of our total revenue in 2009 or 2008. In 2010, we derived approximately 11% of our total revenue from JDSU.
We had no patent licensing customers that represented more than 10% of our total revenue in 2010 and 2009. In 2008, we derived approximately 28% of our total revenue from Daphimo Co. B.V. LLC (“Daphimo”) for the sale of patents related to communications technology.
After the sale of our DSL silicon IP assets to Lantiq in 2009, Lantiq and Ikanos continued to sell integrated circuits based upon our licensed DSL technology. Neither customer represented more than 10% of our total revenue in 2010. Prior to the sale to Lantiq, we derived approximately 19% and 12% of our total revenue from Infineon in 2009 and 2008, respectively.
All revenue in 2010, 2009, and 2008 was derived from unaffiliated customers.
Competition
The markets for our biometrics and imaging software products and services are competitive and uncertain. We can give no assurance that the biometrics industry will grow. We can give no assurance that our products and services will succeed in the market. We can give no assurance that we will be able to compete effectively or that competitive pressures will not seriously harm our business.
The markets for our DSL test and diagnostics hardware and software products are competitive and uncertain. We can give no assurance that phone companies will purchase significant quantities of products to test and maintain their DSL networks, or that if they do they will use our products. Our success as a supplier of hardware and software products for DSL test and diagnostics depends in large part on the willingness and ability of OEM customers to design, build and sell automated test heads, hand-held testers, and DSLAMs that incorporate or work with our products. Our success also depends upon our ability to market and sell to service providers.
8
Our biometrics and imaging and DSL test and diagnostics competitors have significantly greater financial, technological, manufacturing, marketing and personnel resources than we do. We can give no assurance that our OEM customers will continue to purchase products from us or that we will be able to compete effectively or that competitive pressures will not seriously harm our business.
Patents and Intellectual Property
We rely on a combination of nondisclosure agreements and other contractual provisions, as well as patent, trademark, trade secret and copyright law to protect our proprietary rights. We have an active program to protect our proprietary technology through the filing of patents. As of December 31, 2010, we had approximately 185 U.S. and foreign patents, and approximately 271 pending patent applications pertaining to communications and signal processing technologies, including DSL, test and diagnostics, biometrics and medical imaging, image compression, video compression, and seismic data compression.
Although we have patented certain aspects of our technology, we rely primarily on trade secrets to protect our intellectual property. We attempt to protect our trade secrets and other proprietary information through agreements with our customers, suppliers, employees and consultants, and through security measures. Each of our employees is required to sign a non-disclosure and non-competition agreement. Although we intend to protect our rights vigorously, we cannot assure you that these measures will be successful. In addition, effective intellectual property protection may be unavailable or limited in certain foreign countries.
Third parties may assert exclusive patent, copyright and other intellectual property rights to technologies that are important to us. In the past, we have received claims from third parties suggesting that we may be obligated to license such intellectual property rights. If we were found to have infringed any third party’s patents, we could be subject to substantial damages or an injunction preventing us from conducting our business.
Manufacturing
We rely primarily on one third party contract manufacturer to assemble and test substantially all of our DSL hardware products. If this company were to terminate its arrangement with us or fail to provide the required capacity and quality on a timely basis, we would be unable to manufacture our products until replacement contract manufacturing services could be obtained. To qualify a new contract manufacturer, familiarize it with our products, quality standards and other requirements, and commence production is a costly and time-consuming process. We cannot assure you that we would be able to establish alternative manufacturing relationships on acceptable terms. Although we make reasonable efforts to ensure that our contract manufacturer performs to our standards, our reliance on a single source limits our control over quality assurance and delivery schedules. Defects in workmanship, unacceptable yields, and manufacturing disruptions and difficulties may impair our ability to manage inventory and cause delays in shipments and cancellation of orders that may adversely affect our relationships with current and prospective customers. As a result, our revenues and operating results may be harmed.
Our internal manufacturing capacity is limited to final test and assembly of certain products. Our current manufacturing systems have been adequate to manage current volumes of hardware products. However, our manufacturing systems have not been extensively tested by more complex hardware products or in volumes higher than that of our current volumes. If our manufacturing systems are inadequate or have other problems, our revenues and operating results may be harmed.
We rely on single source suppliers for components and materials used in our DSL hardware products. Our dependence on single source suppliers involves several risks, including limited control over pricing, availability, quality, and delivery schedules. Any delays in delivery of such components or shortages of such components could cause delays in the shipment of our products, which could significantly harm our business. Because of our reliance on these vendors, we may also be subject to increases in component costs. These increases could significantly harm our business. If any one or more of our single source suppliers cease to provide us with sufficient quantities of our components in a timely manner or on terms acceptable to us, we would have to seek alternative sources of supply. We could incur delays while we locate and engage alternative qualified suppliers and we might be unable to engage alternative suppliers on favorable terms. We could incur substantial hardware and software redesign costs if we are required to replace the components. Any such disruption or increased expenses could harm our commercialization efforts and adversely affect our ability to generate revenues.
9
Employees
At December 31, 2010, we employed 83 people, including 51 in engineering, 15 in sales and marketing, 3 in manufacturing and 14 in finance and administration. Of these employees, 79 were based in Massachusetts. None of our employees is represented by a labor union. We consider our employee relations to be good.
We believe that our future success will depend in large part on the service of our technical, sales, marketing and senior management personnel and upon our ability to retain highly qualified technical, sales and marketing and managerial personnel. We cannot assure you that we will be able to retain our key managers and employees or that we will be able to attract and retain additional highly qualified personnel in the future.
10
Some of the information in this Form 10-K contains forward-looking statements that involve substantial risks and uncertainties. You can identify these statements by forward-looking words such as “may,” “will,” “expect,” “anticipate,” “believe,” “estimate,” “continue” and similar words. You should read statements that contain these words carefully because they: (1) discuss our future expectations; (2) contain projections of our future operating results or financial condition; or (3) state other “forward-looking” information. However, we may not be able to predict future events accurately. The risk factors listed in this section, as well as any cautionary language in this Form 10-K, provide examples of risks, uncertainties and events that may cause our actual results to differ materially from the expectations we describe in our forward-looking statements. You should be aware that the occurrence of any of the events described in these risk factors and elsewhere in this Form 10-K could materially and adversely affect our business. We assume no obligation to update any forward-looking statements.
Further, there can be no assurance that Aware will engage in any strategic transaction concerning its patent licensing operations, the form that any such transaction might take, or the timing of any such transaction.
GENERAL BUSINESS RISKS
Our Quarterly Results are Unpredictable and May Fluctuate Significantly
Our quarterly revenue and operating results are difficult to predict and may fluctuate significantly from quarter-to-quarter due to the unpredictably of our revenue components.
It is difficult for us to make accurate forecasts of product revenue. Product revenue consists of sales of test and diagnostics hardware and software as well as biometrics and imaging software. Sales of hardware and software products fluctuate based upon demand by our customers and is difficult to predict. We generally ship customer orders as we receive them, and, therefore, we have no meaningful backlog of product orders. Since our product revenue includes sales of hardware products which typically have lower gross margins than our other sources of revenue, product gross margins and overall profitability are also difficult to predict.
Contract revenue is also unpredictable. Making accurate predictions regarding the timing of contract revenue from new and existing customers is difficult.
It is also difficult for us to make accurate forecasts of royalty revenues. Royalties are typically recognized in the quarter when we receive a report from a customer detailing sales and royalties due from the prior quarter, such as from the shipment of licensed integrated circuits. Royalties depend upon customer revenues which can be affected by factors beyond our ability to control or assess in advance. These factors include our customers’ ability to generate sales and fluctuating sales volumes and prices of products containing our technology.
Our business is subject to a variety of risks, which could materially adversely affect quarterly and annual operating results, including:
|
|
●
|
market acceptance of our hardware and software products;
|
|
|
●
|
fluctuations in the demand for our hardware and software products;
|
|
|
●
|
competitive pressures resulting in lower software or hardware product revenues;
|
|
|
●
|
the loss of a significant OEM customer relationship;
|
|
|
●
|
the loss by one of our OEM customers of one of its significant customers;
|
|
|
●
|
the termination of a significant professional services project by a customer;
|
|
|
●
|
announcements or introductions of new technologies or products by us or our competitors;
|
|
|
●
|
delays or problems in the introduction or performance of enhancements or of future generations of our technology;
|
|
|
●
|
failures or problems in our hardware or software products;
|
|
|
●
|
pricing pressure from our competitors in the markets in which we compete;
|
|
|
●
|
delays in the adoption of new industry standards or changes in market perception of the value of new or existing standards;
|
|
|
●
|
personnel changes, particularly those involving engineering, technical, sales and marketing personnel;
|
|
|
●
|
costs associated with protecting our intellectual property;
|
|
|
●
|
the potential that customers could fail to make payments under their agreements with us;
|
11
|
|
●
|
hardware manufacturing issues, including yield problems in our hardware platforms, and inventory buildup and obsolescence;
|
|
|
●
|
product gross margins may be affected by various factors including, but not limited to, product mix, product life cycle, and provisions for excess and obsolete inventory;
|
|
|
●
|
new laws, changes to existing laws, or regulatory developments; and
|
|
|
●
|
general economic trends and other factors.
|
As a result of these factors, we believe that period-to-period comparisons of our revenue levels and operating results are not necessarily meaningful. You should not rely on our quarterly revenue and operating results to predict our future performance.
We Have Experienced Net Losses
We had operating and net losses in 2001, 2002, 2003, 2004, and 2005, and operating losses in 2006, 2007, 2009, and 2010. We may experience losses in the future if:
|
|
●
|
the test and diagnostics or biometrics markets decline;
|
|
|
●
|
new and/or existing customers do not choose to use our software or hardware products; or
|
|
|
●
|
customers do not choose to license and/or buy our patents.
|
Our Business is Subject to Rapid Technological Change
The telecommunications and biometrics industries are characterized by rapid technological change and uncertainty. In these industries, new generations of products are introduced regularly and evolutionary improvements to existing products are required. Therefore, we face risks that others could introduce competing technologies that render our technologies and products less desirable or obsolete. Also, the announcement of new technologies could cause: i) our customers to delay purchasing our products; or ii) our customers’ customers to delay purchasing OEM products that incorporate our products. Either of these events could seriously harm our business.
We expect that our business will depend to a significant extent on our ability to introduce new generations of products as well as new technologies and products that keep pace with changes in these industries. We must continually devote significant engineering resources to achieving technical innovations and product developments. These developments are complex and require long development cycles. Moreover, we may have to make substantial investments in technological innovations and product developments before we can determine their commercial viability. We may lack sufficient financial resources to fund future development. Revenue from technological innovations, even if successfully developed, may not be sufficient to recoup the costs of development.
Our Intellectual Property is Subject to Limited Protection
Because we are a technology provider, our ability to protect our intellectual property and to operate without infringing the intellectual property rights of others is critical to our success. We regard our technology as proprietary. Our patent portfolio includes approximately 185 U.S. and foreign patents as well as approximately 271 pending patent applications. We also rely on a combination of trade secrets, copyright and trademark law and non-disclosure agreements to protect our unpatented intellectual property. Despite these precautions, it may be possible for a third party to copy or otherwise obtain and use our technology without authorization.
We typically work closely with our customers, who may also be potential competitors, and provide them with proprietary know-how. Although our agreements contain non-disclosure provisions and other terms protecting our proprietary know-how and technology rights, it is possible that, despite these precautions, some of our customers might obtain from us proprietary information that they could use to compete with us in the marketplace. Although we intend to defend our intellectual property as necessary, the steps we have taken may be inadequate to prevent misappropriation.
In the future, we may be involved in legal action to enforce our intellectual property rights relating to our patents, copyrights or trade secrets. Any such litigation could be costly and time-consuming for us, even if we were to prevail. Moreover, even if we are successful in protecting our proprietary information, our competitors may independently develop technologies substantially equivalent or superior to our technology. The misappropriation of our technology or the development of competitive technology could seriously harm our business.
12
Our technology, software or hardware may infringe the intellectual property rights of others. A large and increasing number of participants in the telecommunications and compression industries have applied for or obtained patents. Some of these patent holders have demonstrated a readiness to commence litigation based on allegations of patent and other intellectual property infringement. Third parties may assert patent, copyright and other intellectual property rights to technologies that are important to our business. In the past, we have received claims from other companies that our technology infringes their patent rights. Intellectual property rights can be uncertain and can involve complex legal and factual questions. We may infringe the proprietary rights of others, which could result in significant liability for us. If we were found to have infringed any third party’s patents, we could be subject to substantial damages or an injunction preventing us from conducting our business.
Our Business May Be Adversely Affected By Our Use of Open Source Software
The software industry is making increasing use of open source software in the development of products. We also integrate certain open source software components from third parties into our software. Open source licenses may require that the software code in those components or the software into which they are integrated be freely accessible under open source terms. While we take precautions to protect open source software, we cannot exclude the possibility that third-party claims may require us to make freely accessible under open source terms a product of ours or non-Aware software upon which we depend. If we were required to make our software freely available, our business could be seriously harmed.
Our Business May Be Affected by Government Regulations
Extensive regulation by federal, state, and foreign regulatory agencies could adversely affect us in ways that are difficult for us to predict. In addition, our business may also be adversely affected by: i) the imposition of tariffs, duties and other import restrictions on components we purchase from non-domestic suppliers; or ii) by the imposition of export restrictions on products we sell internationally. Changes in current or future laws or regulations, in the United States or elsewhere, could seriously harm our business.
Adverse Economic Conditions Could Harm Our Business
Unfavorable changes in economic conditions, including recessions, inflation, turmoil in financial markets, or other changes in economic conditions, could harm our business, results of operations, and financial conditions as a result of:
|
|
●
|
reduced demand for our products or our customers’ products that incorporate our technology;
|
|
|
●
|
increased risk of order cancellations or delays;
|
|
|
●
|
increased pressure on the prices for our products or our customers’ products that incorporate our technology;
|
|
|
●
|
greater difficulty in collecting accounts receivable; and
|
|
|
●
|
risks to our liquidity, including the possibility that we might not have access to our cash when needed.
|
We are unable to predict the timing, duration, and severity of any such adverse economic conditions in the U.S. and other countries, but the longer the duration, the greater the risks we face in operating our business.
We Must Make Judgments in the Process of Preparing Our Financial Statements
We prepare our financial statements in accordance with generally accepted accounting principles and certain critical accounting policies that are relevant to our business. The application of these principles and policies requires us to make significant judgments and estimates. In the event that judgments and estimates we make are incorrect, we may have to change them, which could materially affect our financial position and results of operations.
13
Moreover, accounting standards have been subject to rapid change and evolving interpretations by accounting standards setting organizations over the past few years. The implementation of new standards requires us to interpret and apply them appropriately. If our current interpretations or applications are later found to be incorrect, our financial position and results of operations could be materially affected.
If We are Unable to Maintain Effective Internal Controls Over Financial Reporting, Investors Could Lose Confidence In The Reliability of Our Financial Statements, Which Could Result In a Decline in the Price of Our Common Stock
As a public company, we are required to enhance and test our financial, internal and management control systems to meet obligations imposed by the Sarbanes-Oxley Act of 2002. Consistent with the Sarbanes-Oxley Act and the rules and regulations of the SEC, management’s assessment of our internal controls over financial reporting and the audit opinion of our independent registered accounting firm as to the effectiveness of our controls is required in connection with our filing of our Annual Report on Form 10-K. If we are unable to identify, implement and conclude that we have effective internal controls over financial reporting or if our independent auditors are unable to conclude that our internal controls over financial reporting are effective, investors could lose confidence in the reliability of our financial statements, which could result in a decrease in the value of our common stock. Our assessment of our internal controls over financial reporting may also uncover weaknesses or other issues with these controls that could also result in adverse investor reaction.
Our Stock Price May Be Extremely Volatile
Volatility in our stock price may negatively affect the price you may receive for your shares of common stock and increases the risk that we could be the subject of costly securities litigation. The market price of our common stock has fluctuated substantially and could continue to fluctuate based on a variety of factors, including:
|
|
●
|
quarterly fluctuations in our operating results;
|
|
|
●
|
changes in future financial guidance that we may provide to investors and public market analysts;
|
|
|
●
|
changes in our relationships with our customers;
|
|
|
●
|
announcements of technological innovations or new products by us, our customers or our competitors;
|
|
|
●
|
changes in DSL or biometrics market growth rates as well as investor perceptions regarding the investment opportunity that companies participating in the DSL or biometrics industry afford them;
|
|
|
●
|
changes in earnings estimates by public market analysts;
|
|
|
●
|
key personnel losses;
|
|
|
●
|
sales of our common stock;
|
|
|
●
|
our stock repurchase activities;
|
|
|
●
|
corporate actions we may initiate, such as spin-offs or other corporate reorganizations; and
|
|
|
●
|
developments or announcements with respect to industry standards, patents or proprietary rights.
|
In addition, the equity markets have experienced volatility that has particularly affected the market prices of equity securities of many high technology companies and that often has been unrelated or disproportionate to the operating performance of such companies. These broad market fluctuations may adversely affect the market price of our common stock.
14
BIOMETRICS & IMAGING PRODUCT LINE RISKS
Our Biometrics & Imaging Product Line Faces Intense Competition
The markets for our biometrics and imaging products and services are competitive and uncertain. Many of our biometric software competitors have significantly greater financial, technological, marketing and personnel resources than we do. We also face intense competition from internal development teams within potential customers. We must convince potential customers to purchase products and services from us rather than develop software or perform services internally. Furthermore, customers, who have already purchased from us, may choose to stop purchasing our software and develop their own software.
In addition, announcements or introductions of new technologies or products by our competitors may adversely affect our business.
Biometrics & Imaging Software Business Risks
Our biometrics and imaging software business is subject to a variety of additional risks, which could materially adversely affect our revenue and operating results, including:
|
|
●
|
market acceptance of our biometric and imaging technologies and products;
|
|
|
●
|
changes in contracting practices of government or law enforcement agencies;
|
|
|
●
|
the failure of the biometrics market to experience continued growth;
|
|
|
●
|
delays or problems in the introduction or performance of enhancements or of future generations of our technology;
|
|
|
●
|
failures or problems in our biometrics and imaging software products;
|
|
|
●
|
delays in the adoption of new industry biometric standards or changes in market perception of the value of new or existing standards;
|
|
|
●
|
growth of proprietary biometric systems which do not conform to industry standards;
|
|
|
●
|
competitive pressures resulting in lower software product revenues;
|
|
|
●
|
the availability of free open source software that competes with our software products;
|
|
|
●
|
personnel changes, particularly those involving engineering, technical and sales and marketing personnel;
|
|
|
●
|
costs associated with protecting our intellectual property;
|
|
|
●
|
litigation by third parties for alleged infringement of their proprietary rights;
|
|
|
●
|
the potential that customers could fail to make payments under their current contracts;
|
|
|
●
|
new laws, changes to existing laws, or regulatory developments; and
|
|
|
●
|
general economic trends and other factors.
|
Biometrics Professional Services Business Risks
Our biometrics professional services business is subject to additional risks, which could materially adversely affect our revenue and operating results, including:
|
|
●
|
our ability to structure and price technology contracts in a manner that is consistent with our business model;
|
|
|
●
|
our ability to structure ourselves to successfully bid on U.S. government contracts and meet the requirements of U.S. contracting rules and regulations;
|
|
|
●
|
our ability to deliver contract milestones: i) in a timely and cost efficient manner, and ii) in a form and condition acceptable to customers;
|
|
|
●
|
the risk that customers could terminate projects;
|
|
|
●
|
the risk that we rely substantially on third party contractors and consultants to deliver certain contract milestones; and
|
|
|
●
|
the potential that customers could fail to make payments under their contracts.
|
15
DSL TEST & DIAGNOSTICS PRODUCT LINE RISKS
Our DSL Test and Diagnostics Business Depends Upon a Limited Number of Customers, Therefore We Derive Revenue from a Small Number of Customers
There are a relatively limited number of OEM suppliers and service providers to which we can sell our DSL test and diagnostics products in a manner consistent with our business model. In 2010, we derived approximately 11% of our total revenue from JDSU, a test and diagnostics customer. No single test and diagnostics customer represented more than 10% of our total revenue in 2008 and 2009, although several customers contributed more than 5%, but less than 10% of our total revenue in those years.
If we fail to maintain relationships with our current customers or fail to establish a sufficient number of new customer relationships, our business could be seriously harmed. In addition, our current and prospective customers may use their superior size and bargaining power to demand terms that are unfavorable to us.
Our DSL Test and Diagnostics Business Faces Intense Competition
The markets for our DSL test and diagnostics hardware and software products are competitive and uncertain. Our success as a supplier of hardware and software products for DSL test and diagnostics depends in large part on:
|
|
●
|
the willingness and ability of OEM customers to design, build and sell automated test heads, hand-held testers, and DSLAMs that incorporate or work with our products;
|
|
|
●
|
our ability to market and sell to service providers; and
|
|
|
●
|
our ability to provide effective sales, marketing, and customer service to our customers.
|
Our OEM customers, their competitors and service providers have significantly greater financial, technological, manufacturing, marketing and personnel resources than we do. We can give no assurance that our customers will continue to purchase products from us or that we will be able to compete effectively or that competitive pressures will not seriously harm our business.
The Success of Our DSL Test and Diagnostics Business Requires Telephone Companies to Install DSL Services in Volume
The success of our DSL test and diagnostics business depends upon telephone companies installing DSL services in significant volumes. Moreover, our business depends on capital equipment spending by telephone companies. If telephone companies reduce their budgets for or decide not to install or utilize equipment dedicated to DSL service or test infrastructure, our test and diagnostics business could be harmed.
DSL services offered over telephone networks also compete with alternative broadband services that use other broadband network architectures, such as cable networks, fiber-to-the-home networks, and wireless networks. These alternative broadband networks may be more successful than DSL. If telephone companies cannot compete effectively with alternative broadband services our test and diagnostics business could be harmed.
The Success of Our DSL Test and Diagnostics Products Depends On Our Ability to Develop Commercially Viable Products in a Timely Fashion
Our success in developing and introducing, new and enhanced test and diagnostics products depends on the ability of our engineering organization to design and develop such products. Because of the complexity of our hardware and software products, it may take us a significant amount of time to develop new products. Moreover, such products must be commercially viable in terms of their features and pricing. If we cannot successfully introduce new commercially viable products on a timely basis, our DSL test and diagnostics business could be seriously harmed.
16
If Our Test and Diagnostics Hardware Products Have Quality Problems, Our Business Could Be Harmed
If our test and diagnostics hardware products have actual or perceived reliability, quality, functionality or other problems, we may suffer reduced orders, higher manufacturing costs, inability to recognize revenue, delays in collecting accounts receivable and higher service, support and warranty expenses or inventory write-offs, among other effects. We believe that the acceptance, volume production, timely delivery and customer satisfaction of our test and diagnostics hardware products is important to our future financial results. As a result, any inability to correct any technical, reliability, parts shortages or other difficulties or to manufacture and ship our test and diagnostics products on a timely basis meeting customer requirements could damage our relationships and reputation with current and prospective customers, which would harm our revenues and operating results. Any product problems that may require repair or replacement may adversely affect our customer and/or vendor relationships and have an impact on support costs, warranty reserves, or inventory reserves, among other effects.
If Our Test and Diagnostics Software Products Have Other Quality Problems, Our Business Could Be Harmed
If our test and diagnostics software products have actual or perceived reliability, quality, functionality or other problems, we may suffer reduced orders, inability to recognize revenue, delays in collecting accounts receivable, higher service costs, and higher support and related costs among other effects. We believe that the acceptance, timely delivery and customer satisfaction of our test and diagnostics software products is important to our future financial results. As a result, any inability to correct any technical, reliability, or other difficulties or to deliver our test and diagnostics software products on a timely basis meeting customer requirements could damage our relationships and reputation with current and prospective customers, which would harm our revenues and operating results.
We are Dependent On a Single Source Contract Manufacturer for the Manufacture of Our DSL Hardware Products, the Loss of Which Would Harm Our Business
We currently depend primarily on one contract manufacturer to manufacture our DSL hardware products. If this company were to terminate its arrangement with us or fail to provide the required capacity and quality on a timely basis, we would be unable to manufacture our products until replacement contract manufacturing services could be obtained. To qualify a new contract manufacturer, familiarize it with our products, quality standards and other requirements, and commence production is a costly and time-consuming process. We cannot assure you that we would be able to establish alternative manufacturing relationships on acceptable terms. Although we make reasonable efforts to ensure that our contract manufacturer performs to our standards, our reliance on a single source limits our control over quality assurance and delivery schedules. Defects in workmanship, inadequate yields, and manufacturing disruptions and difficulties may impair our ability to manage inventory and cause delays in shipments and cancellation of orders that may adversely affect our relationships with current and prospective customers. As a result, our test and diagnostics business could be harmed.
Our Manufacturing Systems May Not Be Adequate For Our DSL Test and Diagnostics Hardware Product Offerings
Our manufacturing systems have been adequate to manage current product configurations and production volumes. However, our manufacturing systems have not been tested by more complex hardware products or by production volumes higher than current levels. If our manufacturing systems are inadequate or have other problems, our test and diagnostics business could be harmed.
We are Dependent on Single Source Suppliers for Components in Our DSL Hardware Products
We rely on single source suppliers for components and materials used in our DSL hardware products. Our dependence on single source suppliers involves several risks, including limited control over pricing, availability, quality, and delivery schedules. Any delays in delivery of such components or shortages of such components could cause delays in the shipment of our products, which could significantly harm our business. Because of our reliance on these vendors, we may also be subject to increases in component costs. These increases could significantly harm our business.
If any one or more of our single source suppliers cease to provide us with sufficient quantities of our components in a timely manner or on terms acceptable to us, we would have to seek alternative sources of supply. We could incur delays while we locate and engage alternative qualified suppliers and we might be unable to engage alternative suppliers on favorable terms. We could incur substantial hardware and software redesign costs if we are required to replace the components. Any such disruption or increased expenses could harm our business.
17
PATENT LICENSING PRODUCT LINE RISKS
Our Ability to Obtain, Sell, License, or Enforce Patents Could be Affected by New Laws, Regulations or Rules
We intend to continue to pursue the license, sale or enforcement of patents in our patent portfolio. Our patent portfolio includes approximately 185 U.S. and foreign patents as well as approximately 271 pending patent applications. We also have an active program to protect our proprietary technology through the filing of additional patents. New laws, regulations or rules implemented either by Congress, the United States Patent and Trademark Office, foreign patent offices, or the courts that impact the patent application process, the patent enforcement process or the rights of patent holders could significantly increase our expenses related to patent prosecution or decrease revenues associated with our patents. While we are not aware that any such changes are likely to occur in the foreseeable future, we cannot assure you that such changes will not occur.
DSL SILICON IP LICENSING PRODUCT LINE RISKS
We Sold Substantially All of the Assets of Our DSL Silicon IP Licensing Product Line, And This Product Line Will No Longer Contribute Meaningful Contract Revenue
In November 2009, we sold substantially all of the assets associated with our DSL and home networking licensing product line to Lantiq for $6.75 million. Lantiq is a fabless semiconductor company that was spun out of Infineon. Prior to the spinout, Infineon was our largest DSL licensing customer. The sale included: i) our DSL and home networking technology products; ii) certain patents and patent applications related to these technologies; and iii) a group of 41 engineers and the equipment used by those engineers.
As a result of the sale, we will not be licensing DSL silicon IP to semiconductor customers for the foreseeable future, nor will we be deriving DSL contract revenue from either Infineon or Lantiq. In 2009 and 2008, we derived approximately 19% and 12% of our total revenue from Infineon, including contract revenue and royalties. In 2010, we derived approximately 7% of our total revenue from Lantiq for royalties only.
We Continue to Receive Royalty Revenues After the Sale to Lantiq; However Future Royalty Revenue May Decline Because of Factors That Are Beyond Our Control
Under the terms of our agreements with Lantiq, we continue to receive royalties for DSL chipsets Lantiq sells. We also expect to continue to derive royalties and a minimal amount of contract revenue from Ikanos as our agreement with Ikanos remains in effect after the sale to Lantiq. Future royalties we may receive from Lantiq and Ikanos are influenced by factors that are beyond our control, including:
|
|
●
|
The competitiveness of DSL chipsets offered by Lantiq and Ikanos and the willingness of their customers to purchase DSL chipsets from them;
|
|
|
●
|
The promotional and marketing efforts of Lantiq and Ikanos; and
|
|
|
●
|
DSL market risks in general, including: i) industry wide chipset demand; and ii) competitive pressures and cyclical demand for DSL chipsets, which may result in reduced average selling prices and channel inventory build-up.
|
Any or all of these factors may cause our royalty revenue to decline in the future.
Not applicable.
18
We believe that our existing facilities are adequate for our current needs and that additional space sufficient to meet our needs for the foreseeable future will be available on reasonable terms. We currently occupy approximately:
|
1.
|
72,000 square feet of office space in Bedford, Massachusetts, which serves as our headquarters. This site is used for our research and development, sales and marketing, and administrative activities. We own this facility.
|
|
2.
|
578 square feet of office space in Orinda, California. This facility is currently leased for a 3-year term, which expires on September 30, 2013.
|
From time to time we are involved in litigation incidental to the conduct of our business. We are not party to any lawsuit or proceeding that, in our opinion, is likely to seriously harm our business.
19
Our common stock is the only class of stock we have outstanding, and it trades on the Nasdaq Global Market under the symbol AWRE. The following table sets forth the high and the low sales prices of our common stock as reported on the Nasdaq Global Market for the periods indicated from January 1, 2009 to December 31, 2010.
|
First
|
Second
|
Third
|
Fourth
|
|||||||||||||
|
Quarter
|
Quarter
|
Quarter
|
Quarter
|
|||||||||||||
|
2010
|
||||||||||||||||
|
High
|
$ | 2.95 | $ | 2.72 | $ | 2.70 | $ | 3.00 | ||||||||
|
Low
|
2.31 | 2.08 | 2.04 | 2.57 | ||||||||||||
|
2009
|
||||||||||||||||
|
High
|
$ | 2.35 | $ | 2.99 | $ | 3.02 | $ | 2.90 | ||||||||
|
Low
|
1.60 | 1.83 | 2.25 | 1.94 | ||||||||||||
As of February 4, 2011, we had approximately 125 shareholders of record. This number does not include shareholders from whom shares were held in a “nominee” or “street” name. We have never paid cash dividends on our common stock and we anticipate that we will continue to reinvest any earnings to finance future operations.
We did not sell any equity securities that were not registered under the Securities Act of 1933 during the three months ended December 31, 2010.
20
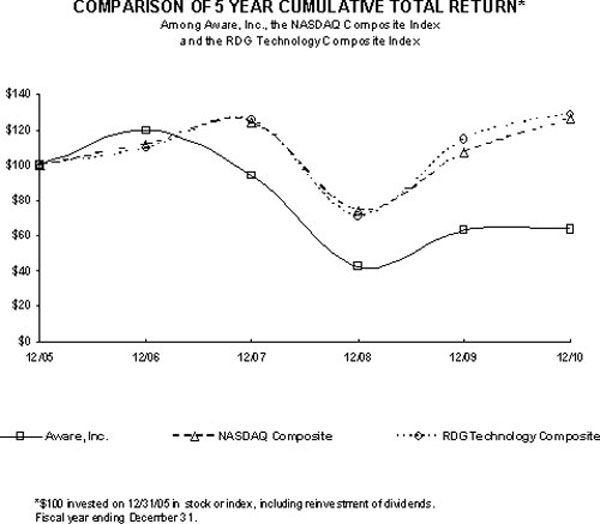
Performance Graph
The following performance graph compares the performance of Aware’s cumulative stockholder return with that of a broad market index, the Nasdaq Composite Index, and a published industry index, the RDG Technology Composite Index. The cumulative stockholder returns for shares of Aware’s common stock and for the market and industry indices are calculated assuming $100 was invested on December 31, 2005. Aware paid no cash dividends during the periods shown. The performance of the market and industry indices is shown on a total return, or dividends reinvested, basis.
|
Value of Investment ($)
|
||||||||||||||||||||||||
|
12/31/05
|
12/31/06
|
12/31/07
|
12/31/08
|
12/31/09
|
12/31/10
|
|||||||||||||||||||
|
Aware, Inc.
|
$ | 100.00 | $ | 119.78 | $ | 94.38 | $ | 42.02 | $ | 62.92 | $ | 63.82 | ||||||||||||
|
Nasdaq Composite Index
|
100.00 | 111.74 | 124.67 | 73.77 | 107.12 | 125.93 | ||||||||||||||||||
|
RDG Technology Composite
|
100.00 | 109.07 | 125.31 | 71.12 | 114.36 | 129.26 | ||||||||||||||||||
21
In the table below, we provide you with our selected consolidated financial data. We have prepared this information using our audited consolidated financial statements for the years ended December 31, 2010, 2009, 2008, 2007, and 2006. When you read this selected financial data, it is important that you read it along with Management’s Discussion and Analysis of Financial Condition and Results of Operations, our historical consolidated financial statements, and the related notes to the financial statements, which can be found in Item 8.
|
Year ended December 31,
|
2010
|
2009
|
2008
|
2007
|
2006
|
|||||||||||||||
|
(in thousands, except per share data)
|
||||||||||||||||||||
|
Statements of Operations Data
|
||||||||||||||||||||
|
Revenue
|
$ | 23,560 | $ | 22,042 | $ | 30,517 | $ | 26,437 | $ | 24,056 | ||||||||||
|
Income (loss) from operations
|
(333 | ) | (5,482 | ) | 629 | (1,830 | ) | (399 | ) | |||||||||||
|
Gain on sale of assets
|
- | 6,230 | - | - | - | |||||||||||||||
|
Net income
|
180 | 982 | 1,776 | 160 | 1,034 | |||||||||||||||
|
Net income per share – basic
|
$ | 0.01 | $ | 0.05 | $ | 0.08 | $ | 0.01 | $ | 0.04 | ||||||||||
|
Net income per share – diluted
|
$ | 0.01 | $ | 0.05 | $ | 0.07 | $ | 0.01 | $ | 0.04 | ||||||||||
|
Balance Sheet Data
|
||||||||||||||||||||
|
Cash and short-term investments
|
$ | 39,949 | $ | 39,669 | $ | 45,516 | $ | 38,055 | $ | 37,834 | ||||||||||
|
Working capital
|
43,818 | 42,209 | 47,288 | 45,031 | 41,372 | |||||||||||||||
|
Total assets
|
53,400 | 51,454 | 57,546 | 56,383 | 54,586 | |||||||||||||||
|
Total liabilities
|
3,517 | 3,094 | 3,023 | 3,147 | 3,216 | |||||||||||||||
|
Total stockholders’ equity
|
49,883 | 48,360 | 54,523 | 53,236 | 51,370 | |||||||||||||||
22
RESULTS OF OPERATIONS
The following table sets forth, for the years indicated, certain line items from our consolidated statements of operations stated as a percentage of total revenue:
|
Year ended December 31,
|
||||||||||||
|
Revenue:
|
2010
|
2009
|
2008
|
|||||||||
|
Product sales
|
80 | % | 70 | % | 46 | % | ||||||
|
Contract revenue
|
9 | 21 | 48 | |||||||||
|
Royalties
|
11 | 9 | 6 | |||||||||
|
Total revenue
|
100 | 100 | 100 | |||||||||
|
Costs and expenses:
|
||||||||||||
|
Cost of product sales
|
19 | 13 | 8 | |||||||||
|
Cost of contract revenue
|
3 | 13 | 14 | |||||||||
|
Research and development
|
34 | 54 | 43 | |||||||||
|
Selling and marketing
|
18 | 22 | 16 | |||||||||
|
General and administrative
|
27 | 23 | 17 | |||||||||
|
Total costs and expenses
|
101 | 125 | 98 | |||||||||
|
Income (loss) from operations
|
(1 | ) | (25 | ) | 2 | |||||||
|
Gain on sale of assets
|
- | 28 | - | |||||||||
|
Other income
|
2 | - | - | |||||||||
|
Interest income
|
- | 1 | 4 | |||||||||
|
Income before provision for income taxes
|
1 | 4 | 6 | |||||||||
|
Provision for income taxes
|
- | - | - | |||||||||
|
Net income
|
1 | % | 4 | % | 6 | % | ||||||
Summary of Operations
.
We have been a supplier of signal processing and digital communications technology for imaging and telecommunications applications since the early 1990s. Presently, our business operations are focused along three product lines: i) biometrics and imaging; ii) DSL test and diagnostics; and iii) patent licensing. Prior to November 2009, we were also a supplier of DSL silicon intellectual property to the semiconductor industry.
Biometrics & Imaging.
Our biometrics products consist of software and services used in biometric systems, and our imaging products consist of software used primarily in medical imaging applications. Biometrics systems are used in applications such as criminal justice, border control, national defense, secure credentialing, access control and background checks. We typically sell our biometrics software and services to: i) OEMs that incorporate our products into their biometrics hardware and software systems; and ii) government agencies that are deploying biometrics systems. Our imaging software is primarily sold to OEMs that incorporate our software into their medical imaging products.
DSL Test & Diagnostics
. Our test and diagnostics products consist of DSL hardware and software products that are used by telephone companies to improve the quality of their DSL service offerings. Our test and diagnostics hardware products are typically sold to OEMs that incorporate our modules into their automated testhead and handheld test equipment. Our OEM customers sell their equipment to telephone companies. We sell our test and diagnostics software products through OEMs and directly to telephone companies.
Patent Licensing
. The objective of our patent licensing operations is to develop patents and to license or sell them to third parties interested in acquiring such patent rights. In September 2010, we announced plans to pursue a spin-off of our patent licensing operations. The spin-off would allow the spun-off entity to focus on patent licensing operations and for Aware to focus on being a supplier of biometrics and imaging software and DSL test and diagnostics products. As of the date of this report, our board is reviewing strategic options with respect to our patent licensing operations, including a potential spin-off.
23
DSL Silicon Intellectual Property
. In November 2009, we completed a transaction in which we sold substantially all of the assets associated with our DSL silicon intellectual property product line to Lantiq Deutschland GmbH (“Lantiq”) for $6.75 million. Lantiq is a fabless semiconductor company that was spun out of Infineon Technologies AG (“Infineon”), our largest DSL silicon customer at that time. The sale included: i) our DSL and home networking technology assets; ii) certain patents and patent applications related to those technology assets; iii) a group of 41 engineers; and iv) lab and computer equipment used by the transferred engineers. Other significant terms of the sale were: i) Lantiq’s royalty obligations to Aware continued after the sale; ii) we agreed not to offer DSL or home networking silicon IP products for the foreseeable future; iii) we subleased certain office and lab space to Lantiq at our main facilities in Bedford, Massachusetts; and iv) Aware and Lantiq continued to cooperate with one another with respect to embedded wire line diagnostics technology and products.
As a result of the Lantiq sale, silicon IP development and licensing is no longer a material part of our business. However, we continue to provide a minor amount of engineering support services to Ikanos and we continue to receive royalties from Lantiq and Ikanos for the use of our DSL silicon IP in their DSL chipsets.
Summary of Financial Results
.
For the year ended December 31, 2010, we had net income of $180,000, or $0.01 per share, in accordance with generally accepted accounting principles (“GAAP”). GAAP net income in 2010 compares to GAAP net income of $982,000, or $0.05 per share, for the year ended December 31, 2009. Annual results for 2010 and 2009 compare to net income of $1.8 million, or $0.07 per share, for the year ended December 31, 2008.
There was a significant improvement in operating earnings in 2010 compared to 2009, although GAAP net income declined. Net income for the year ended December 31, 2009 included a $6.2 million gain on the sale of assets, which was the primary reason for our profitability in 2009. However, on an operating basis, we lost $5.5 million in 2009, which compares to an operating loss of $333,000 in 2010. The $5.1 million improvement was primarily attributable to: i) the cessation of operating losses from our DSL Silicon IP product line as a result of the sale to Lantiq in 2009, and ii) improved profitability in our DSL test & diagnostic product line. These factors were partially offset by increased legal spending for patents and the proposed spin-off of our patent licensing operations.
Non-GAAP Information
. The Company also uses non-GAAP information internally to evaluate its operating performance and believes these non-GAAP measures are useful to investors as they provide additional insight into the underlying operating results. Our non-GAAP net income (loss) excludes the effect of stock-based compensation expense.
Non-GAAP net income for the year ended December 31, 2010, excluding the effect of $1.5 million of stock-based compensation, was $1.7 million, or $0.08 per diluted share. Non-GAAP net income in 2010 compares to: i) non-GAAP net income for the year ended December 31, 2009, excluding the effect of $1.7 million of stock-based compensation, of $2.7 million, or $0.13 per diluted share; and ii) non-GAAP net income for the year ended December 31, 2008, excluding the effect of $1.5 million of stock-based compensation, of $3.3 million, or $0.14 per diluted share.
A reconciliation of GAAP to non-GAAP results is set forth in the table below (in thousands, except for per share amounts):
|
Years ended December 31,
|
|||||||||||||
|
2010
|
2009
|
2008
|
|||||||||||
|
GAAP net income
|
$ | 180 | $ | 982 | $ | 1,776 | |||||||
|
Stock-based compensation
|
1,495 | 1,737 | 1,505 | ||||||||||
|
Non-GAAP net income
|
$ | 1,675 | $ | 2,719 | $ | 3,281 | |||||||
24
|
Years ended December 31,
|
|||||||||||||
|
2010
|
2009
|
2008
|
|||||||||||
|
GAAP net income per share
|
$ | 0.01 | $ | 0.05 | $ | 0.07 | |||||||
|
Stock-based compensation per share
|
0.07 | 0.08 | 0.07 | ||||||||||
|
Non-GAAP net income per share
|
$ | 0.08 | $ | 0.13 | $ | 0.14 | |||||||
Product Sales
Product sales consist primarily of revenue from the sale of hardware and software products. Hardware products consist primarily of DSL test and diagnostics modules. Software products consist of software products, including maintenance contracts, for biometrics, medical imaging, and DSL test and diagnostics applications.
Product sales increased 23% from $15.4 million in 2009 to $18.9 million in 2010. As a percentage of total revenue, product sales increased from 70% in 2009 to 80% in 2010. The dollar increase in product sales was primarily due to a $3.7 million increase in revenue from the sale of test and diagnostic hardware and software, which was partially offset by a $0.2 million decrease in revenue from the sale of biometrics software. The $3.7 million increase in revenue from the sale of test and diagnostic products was mainly attributable to: 1) a $1.2 million increase in software revenue as a result of the sale of our LDP software to two European telephone companies; and 2) a $2.5 million increase in hardware revenue, which was driven by: i) sales to an OEM customer selling handheld test devices into large telephone companies, and ii) the introduction of new products. The $0.2 million decrease in revenue from the sale of biometrics software was primarily due to fewer larger-sized sales to individual customers in 2010 as compared to the prior year.
Product sales increased 10% from $14.0 million in 2008 to $15.4 million in 2009. As a percentage of total revenue, product sales increased from 46% in 2008 to 70% in 2009. The dollar increase in product sales was primarily due to a $1.7 million increase in revenue from the sale of test and diagnostic hardware and software, which was partially offset by a $0.3 million decrease in revenue from the sale of biometrics software. The $1.7 million increase in revenue from the sale of test and diagnostic products was mainly attributable to: 1) a $1.3 million increase in software revenue from two large customers, and 2) a $0.4 million increase in hardware revenue. The $0.3 million decrease in revenue from the sale of biometrics software was primarily due to challenging economic conditions in the first half of 2009.
The Lantiq transaction has not affected product sales in 2010 nor do we expect that it will in the future.
Contract Revenue
Contract revenue primarily consists of: i) engineering service fees from professional services contracts related to our biometrics and DSL test and diagnostics product lines; ii) engineering service fees from DSL silicon contracts for engineering support; and iii) patent fees from the license or sale of patents.
Contract revenue decreased 57% from $4.6 million in 2009 to $2.0 million in 2010. As a percentage of total revenue, contract revenue decreased from 21% in 2009 to 9% in 2010. The contract revenue dollar decrease was primarily due to a $2.9 million reduction of contract revenue from DSL silicon contracts as a result of the sale of our DSL silicon IP product line to Lantiq in November 2009. The decrease in contract revenue from DSL silicon contracts was partially offset by a $0.3 million increase in contract revenue from patent licensing activities.
Contract revenue decreased 69% from $14.7 million in 2008 to $4.6 million in 2009. As a percentage of total revenue, contract revenue decreased from 48% in 2008 to 21% in 2009. The dollar decrease was primarily due to an $8.5 million sale of patents that occurred in 2008. There were no patent sales in 2009. Also in 2009, contract revenue decreased by $1.7 million for revenue from biometrics professional services contracts as a result of the completion of a significant project.
25
We expect that any contract revenue from DSL silicon contracts will be minimal in future periods as a result of the sale of our DSL silicon IP product line to Lantiq. Moreover, we will not be pursuing new silicon IP licensing customers for DSL or home networking applications in the foreseeable future. Potential sources of future contract revenue include revenue from i) biometrics professional services contracts; ii) DSL test and diagnostic professional services contracts; and iii) patent fees from the license or sale of patents. We have publicly announced that our board is reviewing strategic options with respect to our patent licensing operations, including a potential spin-off, which could minimize future patent fees.
Royalties
Royalties consist of royalty payments we receive under DSL silicon contracts. We receive royalties from DSL silicon customers for the right to incorporate our silicon IP in their DSL chipsets.
Royalties increased 29% from $2.1 million in 2009 to $2.7 million in 2010. As a percentage of total revenue, royalties increased from 9% in 2009 to 11% in 2010. The dollar increase in royalties was due to a $0.6 million increase in DSL royalties from Lantiq and Ikanos.
Royalties increased 12% from $1.8 million in 2008 to $2.1 million in 2009. As a percentage of total revenue, royalties increased from 6% in 2008 to 9% in 2009. The dollar increase in royalties was due to a $0.3 million increase in DSL royalties from Infineon and Ikanos.
Our royalty revenue currently comes predominantly from ADSL chipset sales by Ikanos and ADSL and VDSL chipset sales by Lantiq (formerly Infineon). The Lantiq transaction did not alter the royalty obligations of Ikanos or Lantiq, which we expect to continue per the existing agreements with those parties. We remain uncertain as to whether these licensees will be able to maintain their market shares and chipset prices in the face of intense competition, and whether our relationships with them will contribute meaningful royalties to us in the future. Also, as a result of the Lantiq transaction, we will not be pursuing new silicon intellectual property licensing customers for DSL or home networking applications in the foreseeable future.
Cost of Product Sales
Since the cost of software product sales is minimal, cost of product sales consists primarily of the cost of hardware product sales.
Cost of product sales increased 51% from $2.9 million in 2009 to $4.4 million in 2010. As a percentage of product sales, cost of product sales increased from 19% in 2009 to 23% in 2010, which resulted in gross margins on product sales decreasing from to 81% to 77%. The dollar increase in cost of product sales in 2010 was primarily attributable to a $2.5 million increase in hardware product sales. The decrease in gross margins on product sales was primarily due to a lower proportion of software sales in the product sales mix.
Cost of product sales increased 12% from $2.6 million in 2008 to $2.9 million in 2009. As a percentage of product sales, cost of product sales increased from 18% in 2008 to 19% in 2009, which resulted in gross margins on product sales decreasing from to 82% to 81%. The dollar increase in cost of product sales in 2009 was primarily attributable to a $0.4 million increase in hardware product sales. The decrease in gross margins on product sales was primarily due to a slightly lower proportion of software sales in the product sales mix.
Cost of Contract Revenue
Cost of contract revenue consists of: i) an allocation of internal engineering costs to customer contracts that is based on hours worked on each contract by Aware engineers; and ii) direct costs for third party contractors and consultants who were temporarily engaged to work on specific customer contracts.
Cost of contract revenue decreased 75% from $2.9 million in 2009 to $0.7 million in 2010. As a percentage of contract revenue, cost of contract revenue decreased from 63% in 2009 to 36% in 2010, which resulted in gross margins on contract revenue increasing from 37% to 64%. The $2.2 million decrease in cost of contract revenue was almost entirely due to the loss of contract revenue from DSL silicon contracts as a result of the Lantiq sale. The increase in gross margins on contract revenue was due to a shift in contract revenue from DSL silicon contracts to more profitable non-DSL silicon contracts.
26
Cost of contract revenue decreased 31% from $4.2 million in 2008 to $2.9 million in 2009. As a percentage of contract revenue, cost of contract revenue increased from 29% in 2008 to 63% in 2009, which resulted in gross margins on contract revenue decreasing from 71% to 37%. The $1.3 million decrease in cost of contract revenue was primarily due to lower contract revenue from biometrics professional services contracts. The significant decrease in gross margins on contract revenue was due to: 1) no contract revenue from patent sales in 2009 as compared to $8.5 million of such revenue in 2008 (patent sales have had no associated cost of contract revenue); and 2) a decrease in contract revenue from biometrics professional services contracts.
Research and Development Expense
Research and development expense consists of costs for engineering personnel, including salaries, stock-based compensation, fringe benefits, consultants, contractors, supplies, equipment, depreciation, travel, and facilities. Engineering costs are incurred to develop technology, products and patents related to our various product lines. As described in the cost of contract revenue section, engineering costs incurred to provide engineering services for customer contracts are allocated to cost of contract revenue, and are not included in research and development expense.
Research and development expense decreased 32% from $11.9 million in 2009 to $8.1 million in 2010. As a percentage of total revenue, research and development expense decreased from 54% in 2009 to 34% in 2010. The $3.8 million decrease in research and development expense was primarily due to a $4.4 million reduction of engineering expenses as a result of the sale of our DSL silicon IP product line to Lantiq, which was partially offset by slightly higher spending in our biometrics and test and diagnostics engineering organizations.
Research and development expense decreased 9% from $13.2 million in 2008 to $11.9 million in 2009. As a percentage of total revenue, research and development expense increased from 43% in 2008 to 54% in 2009. The dollar decrease in research and development expense was primarily due to: 1) lower engineering spending associated with our licensing product line in the last 1 ½ months of the year as a result of the transfer of 41 engineers to Lantiq in mid-November 2009, and 2) lower engineering spending on our licensing product line in the first 10 ½ months of 2009 as compared with the same 10 ½ month period in 2008.
During the past year, our research and development activities have been focused primarily on developing biometrics and imaging software, and developing test and diagnostics hardware and software products.
Selling and Marketing Expense
Selling and marketing expense consists of costs for sales and marketing personnel, including salaries, sales commissions, stock-based compensation, fringe benefit, travel, advertising and promotion, and facilities expenses.
Selling and marketing expense decreased 9% from $4.7 million in 2008 to $4.3 million in 2010. As a percentage of total revenue, selling and marketing expense decreased from 21% in 2009 to 18% in 2010. The dollar decrease in selling and marketing expense is primarily due to lower headcount in our sales and marketing organization as well as lower stock-based compensation expenses. Lower spending attributable to these factors was partially offset by higher spending on tradeshows.
Selling and marketing expense was $4.7 million in 2008 and 2009. As a percentage of total revenue, selling and marketing expense increased from 16% in 2008 to 21% in 2009. Level sales and marketing expenses in 2009 were the result of higher spending in our biometrics sales organization, which was offset by lower spending in our licensing sales organization.
Since the Lantiq transaction did not involve any of our sales and marketing personnel, the transaction had a minimal impact on 2010 expenses and we expect that it will have a minimal impact on future selling and marketing expense.
General and Administrative Expense
General and administrative expense consists of costs for administrative personnel and activities, including administrative salaries, management bonuses, director compensation, stock-based compensation, fringe benefits, legal fees, audit fees, public company expenses, bad debt, insurance, and facilities.
27
General and administrative expense increased 26% from $5.1 million in 2009 to $6.4 million in 2010. As a percentage of total revenue, general and administrative expense increased from 23% in 2009 to 27% in 2010. The dollar increase in general and administrative expense was mainly attributable to higher spending on: i) legal fees related to patents of $0.8 million; ii) legal fees related to the proposed spin-off of our patent licensing operations of $0.5 million, and iii) stock-based compensation of $0.2 million.
General and administrative expense decreased 2% from $5.2 million in 2008 to $5.1 million in 2009. As a percentage of total revenue, general and administrative expense increased from 17% in 2008 to 23% in 2009. The dollar decrease in general and administrative expense was mainly attributable to lower spending on legal fees for litigation and patent filings, which was partially offset by higher stock-based compensation expenses.
Since the Lantiq transaction did not involve any of our administrative personnel, the transaction had a minimal impact on 2010 expenses and we expect that it will have a minimal impact on future general and administrative expense.
Gain on Sale of Assets
In 2009, we sold substantially all of the assets associated with our home networking and DSL technology to Lantiq for $6.75 million. We recorded a gain on the sale of assets of $6.2 million in the year ended December 31, 2009. The gain reflects $6.75 million of proceeds from Lantiq less the following items: i) the net book value of assets transferred to Lantiq; ii) the write-off of certain prepaid assets that had no economic value after the sale; and iii) transaction costs.
Other Income
We recorded $425,000 of other income in the year ended December 31, 2010. This amount represents proceeds from a legal settlement with a former customer.
Interest Income
Interest income decreased 62%, or $148,000, from $238,000 in 2009 to $90,000 in 2010. The dollar decrease in interest income was primarily due to a continued decline in money market interest rates during 2010.
Interest income decreased 80%, or $0.9 million, from $1.2 million in 2008 to $0.2 million in 2009. The dollar decrease in interest income was primarily due to a significant fall in money market interest rates during 2009.
Income Taxes
We are subject to income taxes in the United States and we use estimates in determining our provisions for income taxes. We account for income taxes using the asset and liability method for accounting and reporting income taxes. Deferred tax assets and liabilities are recognized based on temporary differences between the financial reporting and income tax bases of assets and liabilities using statutory rates.
We made no provision for income taxes in the years ended 2010, 2009 and 2008, except for $2,000, $4,000, and $16,000 of state excise taxes paid in each year, respectively.
As of December 31, 2010, we had U.S. federal net operating loss carryforwards for income tax purposes of $51.0 million that expire beginning in 2012 and state net operating loss carryforwards of $11.3 million that expire beginning in 2011. We also had U.S. federal tax credits of $13.5 million that expire beginning in 2011 and state research and development credits of $7.3 million that expire beginning in 2011. The Internal Revenue Code contains provisions that limit the net operating loss and tax credit carryforwards available to be used in any given year in the event of certain circumstances, including significant changes in ownership interests, as defined.
28
Due to the uncertainty surrounding the realization of our deferred tax assets, based principally on our significant historical operating losses, we have provided a full valuation allowance against our various tax attributes. We will assess the level of valuation allowance required in future periods. Should more positive than negative evidence regarding the realizability of tax attributes exist at a future point in time, the valuation allowance may be reduced or eliminated altogether. Reduction of the valuation
allowance, in whole or in part, would result in a non-cash reduction in income tax expense during the period of reduction.
LIQUIDITY AND CAPITAL RESOURCES
Since our inception in March 1986 until December 2007, we financed our activities primarily through the sale of stock. In 2010, 2009 and 2008, we purchased more of our stock than we issued. In the year ended December 31, 2010, we spent $161,000 to purchase stock from employees in connection with an employee option exchange program. In the years ended December 31, 2009 and 2008, we spent $9.0 million and $2.4 million, respectively, to repurchase our stock under a Dutch auction tender offer and a share repurchase program. Cash used to repurchase stock in the years ended December 31, 2010, 2009, and 2008 was partially offset by net proceeds we received from the issuance of stock under employee stock plans of $9,000, $7,000, and $0.4 million, respectively.
In the years ended December 31, 2010 and 2008, our operating activities provided net cash of $0.7 million and $9.4 million, respectively. In the year ended December 31, 2009, our operating activities used net cash of $3.4 million.
Cash provided by operations of $0.7 million in 2010 was primarily the result of net income of $0.2 million, which was increased for non-cash items related to depreciation and amortization of $0.5 million, and stock-based compensation expense of $1.5 million. Cash provided by operations in 2010 was reduced by a $1.5 million increase in working capital items.
Cash used in operations of $3.4 million in 2009 was primarily the result of net income of $1.0 million, which was: i) decreased by a $6.2 million gain on the sale of assets; and ii) increased for non-cash items related to depreciation and amortization of $0.8 million, and stock-based compensation expense of $1.7 million. Cash used in operations in 2009 was also increased by a $0.7 million increase of working capital items.
Cash provided by operations of $9.4 million in 2008 was primarily the result of net income of $1.8 million, which was increased for non-cash items related to depreciation and amortization of $0.9 million, and stock-based compensation expense of $1.5 million. Cash provided by operations in 2008 was also increased by a $5.2 million reduction of working capital items.
In the years ended December 31, 2010, 2009, and 2008, we made capital expenditures of $0.1 million, $0.2 million, and $0.4 million, respectively. Capital expenditures in all three years primarily consisted of spending on computer hardware and software and laboratory equipment used principally in engineering activities. We have no material commitments for capital expenditures.
In the year ended December 31, 2009, we received net proceeds from the sale of our DSL silicon intellectual property product line of $6.7 million.
At December 31, 2010, we had cash and cash equivalents of $39.9 million. While we can not assure you that we will not require additional financing, or that such financing will be available to us, we believe that our cash and cash equivalents will be sufficient to fund our operations for at least the next twelve months.
To date, inflation has not had a material impact on our financial results. There can be no assurance, however, that inflation will not adversely affect our financial results in the future.
OFF-BALANCE SHEET ARRANGEMENTS
We do not have any arrangements with unconsolidated entities, such as entities often referred to as structured finance, special purpose entities or variable interest entities which are often established for the purpose of facilitating off-balance sheet arrangements or other contractually narrow or limited purposes. Accordingly, we are not exposed to any financing, liquidity, market or credit risk that could arise if we had such relationships.
29
CONTRACTUAL OBLIGATIONS
We have various contractual obligations impacting our liquidity. The following represents our contractual obligations as of December 31, 2010 (in thousands):
|
Payments Due By Period
|
||||||||||||||||||||||
|
Contractual Obligations
|
|
Total
|
Less than
1 year
|
1-3 years
|
3-5 years
|
More than
5 years
|
||||||||||||||||
|
Operating leases
|
$ | 49 | $ | 18 | $ | 31 | $ | - | $ | - | ||||||||||||
|
Purchase orders
|
699 | 699 | - | - | - | |||||||||||||||||
|
Total
|
$ | 748 | $ | 717 | $ | 31 | $ | - | $ | - | ||||||||||||
CRITICAL ACCOUNTING POLICIES
We consider certain accounting policies related to revenue recognition, stock-based compensation, income taxes, inventories, and the allowance for doubtful accounts to be critical policies.
Revenue recognition
. We derive revenue from three sources (i) product revenue, which includes revenue from the sale of hardware and software products for the DSL test and diagnostics market and software products for the biometrics and imaging markets, (ii) contract revenue, which primarily includes engineering service fees from DSL silicon IP contracts, biometrics professional services contracts, and DSL test and diagnostics professional services contracts. Contract revenue also includes fees from patent sales and licenses, and (iii) royalties.
We recognize revenue when there is persuasive evidence of an arrangement, the sales price is fixed or determinable, collection of the related receivable is reasonably assured, and delivery has occurred or services have been rendered. As described below, we make significant judgments during the process of determining revenue for any particular accounting period.
In determining revenue recognition, we assess whether fees associated with revenue transactions are fixed or determinable based on the terms of the contract and based on payment terms. If the fee is not fixed or determinable, we defer the fee and recognize revenue as amounts become due and payable. We assess whether collection is reasonably assured based on a number of factors, including past transaction history with the customer and the credit-worthiness of the customer. If we determine that collection of a fee is not reasonably assured, we defer the fee and recognize revenue at the time collection becomes reasonably assured.
We must also make judgments with respect to the recognition of multiple element revenue arrangements in the following situations:
|
o
|
When software licenses and maintenance contracts are sold together, we generally recognize software license revenue upon delivery, provided we have vendor specific objective evidence (“VSOE”) for the fair value of the maintenance contract fee, and we generally recognize the fair value of maintenance contract revenue ratably over the related contract period. If we do not have VSOE for the fair value of the maintenance contract fee, we recognize software license and maintenance contract revenue ratably over the related contract period.
|
|
o
|
When engineering services and software licenses are sold together, the total fee is generally recognized by applying contract accounting. We have adopted the percentage-of-completion method of contract accounting, and we use an output method (i.e., contract milestones) to determine our completion percentage.
|
|
o
|
When we sell services, software and maintenance together, revenue is recognized as follows: i) maintenance revenue is separated from the other two elements and is recognized ratably over the related contract period; provided we have VSOE for the fair value of the maintenance element; and ii) the total fee from the software license and engineering service elements is recognized by applying the contract accounting method described in the previous paragraph. If we do not have VSOE for the fair value of the maintenance element, we recognize revenue for the entire arrangement ratably over a period that begins at the start of the engineering services project and ends when all elements of the arrangement have been delivered.
|
30
Our revenue recognition policies are described more fully in Note 2, Summary of Significant Accounting Policies, in the Notes to our Consolidated Financial Statements.
Stock-Based Compensation.
We grant stock options and stock to our employees and directors. We measure stock-based compensation cost at the grant date based on the fair value of the award and recognize it as expense over the applicable vesting period of the award using the straight-line basis.
We use the Black-Scholes valuation model to estimate the fair value of stock option awards. This valuation model takes into account the exercise price of the award, as well as a variety of significant assumptions. The assumptions used to estimate the fair value of stock options include the expected term, the expected volatility of our stock over the expected term, the risk-free interest rate over the expected term, and our expected annual dividend yield.
For stock awards, we determine the fair value of the award by using the fair market value of our stock on the date of grant; provided the number of shares in the grant is fixed on the grant date.
Income taxes
. As part of the process of preparing our consolidated financial statements we are required to estimate our actual current tax expense. We must also estimate temporary and permanent differences that result from differing treatment of certain items for tax and accounting purposes. These differences result in deferred tax assets and liabilities, which are included in our consolidated balance sheet. We must then assess the likelihood that our deferred tax assets will be recovered from future taxable income and to the extent we believe recovery is not likely, we must establish a valuation allowance. To the extent we establish a valuation allowance or increase this allowance in a period for deferred tax assets, which have been recognized, we must include an expense with the tax provision in the statement of operations.
Significant management judgment is required in determining our provision for income taxes, our deferred tax assets, and any valuation allowance recorded against our net deferred tax assets. Our deferred tax assets primarily relate to net operating losses and research and development tax credits that we are carrying forward into future tax periods. As of December 31, 2010, we had a total of $41.8 million of deferred tax assets for which we had recorded a full valuation allowance.
We adopted the guidance related to uncertain tax positions on January 1, 2007. The implementation of this guidance did not materially affect our financial position or results of operations. At the date of adoption of January 1, 2007 and also at December 31, 2008, 2009, and 2010 we had no unrecognized tax benefits. We recognize interest and penalties related to uncertain tax positions in income tax expense.
Inventories.
Inventories, which include materials and our contract manufacturer’s labor and overhead, are stated at the lower of cost (first-in, first-out basis) or net realizable value. On a quarterly basis, we use consistent methodologies to evaluate all inventories for net realizable value. We record provisions for both excess and obsolete inventory when such write-downs or write-offs are identified through the quarterly review process. The inventory valuation is based upon assumptions about future demand, product mix and possible alternative uses.
Allowance for doubtful accounts.
We make judgments as to our ability to collect outstanding receivables and provide allowances for receivables when collection becomes doubtful. Provisions are made based upon a specific review of all significant outstanding
invoices
. If the judgments we make to determine the allowance for doubtful accounts do not reflect the future ability to collect outstanding receivables, additional provisions for doubtful accounts may be required.
RECENT ACCOUNTING PRONOUNCEMENTS
We describe below recent pronouncements that have had or may have a significant effect on our financial statements. We do not discuss recent pronouncements that are not anticipated to have an impact on or are unrelated to our financial condition, results of operations, or disclosures.
In January 2010, the Financial Accounting Standards Board (“FASB”) issued Accounting Standards Update (“ASU”) 2010-06, “Improving Disclosures about Fair Value Measurements”. ASU 2010-06 requires additional disclosures about fair value measurements including transfers in and out of Levels 1 and 2 and a higher level of disaggregation for the different types of financial instruments. For the reconciliation of Level 3 fair value measurements, information about purchases, sales, issuances and settlements are presented separately. This standard is effective for interim and annual reporting periods beginning after December 15, 2009 with the exception of revised Level 3 disclosure requirements which are effective for interim and annual reporting periods beginning after December 15, 2010. Comparative disclosures are not required in the year of adoption. We adopted the provisions of the standard on January 1, 2010, which did not have a material impact on our financial statements.
31
Our exposure to market risk relates primarily to our investment portfolio, and the effect that changes in interest rates would have on that portfolio. Our investment portfolio has included:
|
|
●
|
Cash and cash equivalents, which consist of financial instruments with original maturities of three months or less;
|
|
|
●
|
Short-term investments, which consist of financial instruments with remaining maturities of twelve months or less, and auction rate securities that typically have interest reset dates of twenty-eight days; and
|
|
|
●
|
Investments, which consist of financial instruments that mature in three years or less.
|
All of our investments meet the high quality standards specified in our investment policy. This policy dictates the maturity period and limits the amount of credit exposure to any one issue, issuer, and type of instrument.
As of December 31, 2010, our cash and cash equivalents of $39.9 million were invested in money market accounts. Due to the nature and short duration of these financial instruments, we do not expect that an increase in interest rates would result in any material loss to our investment portfolio. As of December 31, 2010, we had no investments that matured in more than twelve months. We do not use derivative financial instruments for speculative or trading purposes.
32
Report of Independent Registered Public Accounting Firm
To Board of Directors and Stockholders of Aware, Inc.:
In our opinion, the consolidated financial statements listed in the index
appearing under Item 15 (a) (1) present fairly, in all material respects, the financial position of Aware, Inc. and its subsidiary at December 31, 2010 and December 31, 2009 and the results of their operations and their cash flows for each of the three years in the period ended December 31, 2010 in conformity with accounting principles generally accepted in the United States of America. In addition, in our opinion, the financial statement schedule listed in the index appearing under Item 15 (a) (2) presents fairly, in all material respects, the information set forth therein when read in conjunction with the related consolidated financial statements. Also in our opinion, the Company maintained, in all material respects, effective internal control over financial reporting as of December 31, 2010, based on criteria established in Internal Control - Integrated Framework issued by the Committee of Sponsoring Organizations of the Treadway Commission (COSO). The Company
’
s management is responsible for these financial statements and financial statement schedule, for maintaining effective internal control over financial reporting and for its assessment of the effectiveness of internal control over financial reporting, included in Management’s Report on Internal Control Over Financial Reporting appearing under Item 9A. Our responsibility is to express opinions on these financial statements, on the financial statement schedule, and on the Company’s internal control over financial reporting based on our integrated audits. We conducted our audits in accordance with the standards of the Public Company Accounting Oversight Board (United States). Those standards require that we plan and perform the audits to obtain reasonable assurance about whether the financial statements are free of material misstatement and whether effective internal control over financial reporting was maintained in all material respects. Our audits of the financial statements included examining, on a test basis, evidence supporting the amounts and disclosures in the financial statements, assessing the accounting principles used and significant estimates made by management, and evaluating the overall financial statement presentation. Our audit of internal control over financial reporting included obtaining an understanding of internal control over financial reporting, assessing the risk that a material weakness exists, and testing and evaluating the design and operating effectiveness of internal control based on the assessed risk. Our audits also included performing such other procedures as we considered necessary in the circumstances. We believe that our audits provide a reasonable basis for our opinions.
A company’s internal control over financial reporting is a process designed to provide reasonable assurance regarding the reliability of financial reporting and the preparation of financial statements for external purposes in accordance with generally accepted accounting principles. A company’s internal control over financial reporting includes those policies and procedures that (i) pertain to the maintenance of records that, in reasonable detail, accurately and fairly reflect the transactions and dispositions of the assets of the company; (ii) provide reasonable assurance that transactions are recorded as necessary to permit preparation of financial statements in accordance with generally accepted accounting principles, and that receipts and expenditures of the company are being made only in accordance with authorizations of management and directors of the company; and (iii) provide reasonable assurance regarding prevention or timely detection of unauthorized acquisition, use, or disposition of the company’s assets that could have a material effect on the financial statements.
Because of its inherent limitations, internal control over financial reporting may not prevent or detect misstatements. Also, projections of any evaluation of effectiveness to future periods are subject to the risk that controls may become inadequate because of changes in conditions, or that the degree of compliance with the policies or procedures may deteriorate.
/s/ PricewaterhouseCoopers LLP
PricewaterhouseCoopers LLP
Boston, Massachusetts
February
11
, 2011
33
AWARE, INC.
CONSOLIDATED BALANCE SHEETS
(in thousands, except share data)
|
December 31,
|
||||||||
|
2010
|
2009
|
|||||||
|
ASSETS
|
||||||||
|
Current assets:
|
||||||||
|
Cash and cash equivalents
|
$ | 39,949 | $ | 39,669 | ||||
|
Accounts receivable (less allowance for doubtful accounts of $30 in 2010 and 2009)
|
4,968 | 3,565 | ||||||
|
Inventories
|
1,863 | 1,113 | ||||||
|
Prepaid expenses and other current assets
|
235 | 363 | ||||||
|
Total current assets
|
47,015 | 44,710 | ||||||
|
Property and equipment, net
|
6,360 | 6,744 | ||||||
|
Other assets, net
|
25 | - | ||||||
|
Total assets
|
$ | 53,400 | $ | 51,454 | ||||
|
LIABILITIES AND STOCKHOLDERS’ EQUITY
|
||||||||
|
Current liabilities:
|
||||||||
|
Accounts payable
|
$ | 565 | $ | 327 | ||||
|
Accrued expenses
|
118 | 127 | ||||||
|
Accrued compensation
|
1,143 | 1,202 | ||||||
|
Accrued professional
|
427 | 282 | ||||||
|
Deferred revenue
|
944 | 563 | ||||||
|
Total current liabilities
|
3,197 | 2,501 | ||||||
|
Long-term deferred revenue
|
320 | 593 | ||||||
|
Commitments and contingent liabilities (Note 8)
|
||||||||
|
Stockholders’ equity:
|
||||||||
|
Preferred stock, $1.00 par value; 1,000,000 shares authorized,
none outstanding
|
- | - | ||||||
|
Common stock, $.01 par value; shares authorized,
70,000,000 in 2010 and 2009; issued
and outstanding, 20,041,863 in 2010 and 19,809,315 in 2009
|
200 | 198 | ||||||
|
Additional paid-in capital
|
77,373 | 76,032 | ||||||
|
Accumulated deficit
|
(27,690 | ) | (27,870 | ) | ||||
|
Total stockholders’ equity
|
49,883 | 48,360 | ||||||
|
Total liabilities and stockholders’ equity
|
$ | 53,400 | $ | 51,454 | ||||
The accompanying notes are an integral part of the consolidated financial statements.
34
AWARE, INC.
CONSOLIDATED STATEMENTS OF OPERATIONS
(in thousands, except per share data)
|
Years ended December 31,
|
||||||||||||
|
2010
|
2009
|
2008
|
||||||||||
|
Revenue:
|
||||||||||||
|
Product sales
|
$ | 18,914 | $ | 15,376 | $ | 14,022 | ||||||
|
Contract revenue
|
1,992 | 4,611 | 14,658 | |||||||||
|
Royalties
|
2,654 | 2,055 | 1,837 | |||||||||
|
Total revenue
|
23,560 | 22,042 | 30,517 | |||||||||
|
Costs and expenses:
|
||||||||||||
|
Cost of product sales
|
4,362 | 2,887 | 2,589 | |||||||||
|
Cost of contract revenue
|
714 | 2,896 | 4,180 | |||||||||
|
Research and development
|
8,096 | 11,920 | 13,171 | |||||||||
|
Selling and marketing
|
4,283 | 4,707 | 4,739 | |||||||||
|
General and administrative
|
6,438 | 5,114 | 5,209 | |||||||||
|
Total costs and expenses
|
23,893 | 27,524 | 29,888 | |||||||||
|
Income (loss) from operations
|
(333 | ) | (5,482 | ) | 629 | |||||||
|
Gain on sale of assets
|
- | 6,230 | - | |||||||||
|
Other income
|
425 | - | - | |||||||||
|
Interest income
|
90 | 238 | 1,163 | |||||||||
|
Income before provision for income taxes
|
182 | 986 | 1,792 | |||||||||
|
Provision for income taxes
|
2 | 4 | 16 | |||||||||
|
Net income
|
$ | 180 | $ | 982 | $ | 1,776 | ||||||
|
Net income per share – basic
|
$ | 0.01 | $ | 0.05 | $ | 0.08 | ||||||
|
Net income per share – diluted
|
$ | 0.01 | $ | 0.05 | $ | 0.07 | ||||||
|
Weighted average shares – basic
|
19,971 | 20,869 | 23,638 | |||||||||
|
Weighted average shares – diluted
|
20,182 | 20,874 | 23,697 | |||||||||
The accompanying notes are an integral part of the consolidated financial statements.
35
AWARE, INC.
CONSOLIDATED STATEMENTS OF CASH FLOWS
(in thousands)
|
Years ended December 31,
|
||||||||||||
|
2010
|
2009
|
2008
|
||||||||||
|
Cash flows from operating activities:
|
||||||||||||
|
Net income
|
$ | 180 | $ | 982 | $ | 1,776 | ||||||
|
Adjustments to reconcile net income to net cash
provided by (used in) operating activities:
|
||||||||||||
|
Depreciation and amortization
|
536 | 823 | 921 | |||||||||
|
Provision for doubtful accounts
|
- | - | (25 | ) | ||||||||
|
Stock-based compensation
|
1,495 | 1,737 | 1,505 | |||||||||
|
Gain on sale of assets
|
- | (6,230 | ) | - | ||||||||
|
Increase (decrease) from changes in assets and liabilities:
|
||||||||||||
|
Accounts receivable
|
(1,403 | ) | (1,353 | ) | 5,475 | |||||||
|
Inventories
|
(750 | ) | 542 | (232 | ) | |||||||
|
Prepaid expenses and other current assets
|
128 | 131 | 110 | |||||||||
|
Accounts payable
|
239 | (139 | ) | (473 | ) | |||||||
|
Accrued expenses
|
177 | (377 | ) | 423 | ||||||||
|
Deferred revenue
|
108 | 487 | (74 | ) | ||||||||
|
Net cash provided by (used in) operating activities
|
710 | (3,397 | ) | 9,406 | ||||||||
|
Cash flows from investing activities:
|
||||||||||||
|
Purchases of property and equipment
|
(118 | ) | (168 | ) | (445 | ) | ||||||
|
Proceeds from sale of assets, net
|
(100 | ) | 6,661 | - | ||||||||
|
Purchase of other assets
|
(60 | ) | - | - | ||||||||
|
Sales of investments
|
- | - | 38,743 | |||||||||
|
Purchases of investments
|
- | - | (2,000 | ) | ||||||||
|
Net cash provided by (used in) investing activities
|
(278 | ) | 6,493 | 36,298 | ||||||||
|
Cash flows from financing activities:
|
||||||||||||
|
Proceeds from issuance of common stock
|
9 | 7 | 363 | |||||||||
|
Shares surrendered by employees to pay taxes related to
unrestricted stock
|
(161 | ) | - | - | ||||||||
|
Repurchase of common stock
|
- | (8,950 | ) | (2,357 | ) | |||||||
|
Net cash used in financing activities
|
(152 | ) | (8,943 | ) | (1,994 | ) | ||||||
|
Increase (decrease) in cash and cash equivalents
|
280 | (5,847 | ) | 43,710 | ||||||||
|
Cash and cash equivalents, beginning of year
|
39,669 | 45,516 | 1,806 | |||||||||
|
Cash and cash equivalents, end of year
|
$ | 39,949 | $ | 39,669 | $ | 45,516 | ||||||
The accompanying notes are an integral part of the consolidated financial statements.
36
AWARE, INC.
CONSOLIDATED STATEMENTS OF STOCKHOLDERS’ EQUITY
(in thousands)
|
Additional
|
Total
|
|||||||||||||||||||
|
Common Stock
|
Paid-In
|
Accumulated
|
Stockholders’
|
|||||||||||||||||
|
Shares
|
Amount
|
Capital
|
Deficit
|
Equity
|
||||||||||||||||
|
Balance at December 31, 2007
|
23,855 | $ | 239 | $ | 83,626 | $ | (30,629 | ) | $ | 53,236 | ||||||||||
|
Exercise of common stock options
|
136 | 1 | 358 | 359 | ||||||||||||||||
|
Repurchase of common stock
|
(712 | ) | (7 | ) | (2,350 | ) | (2,357 | ) | ||||||||||||
|
Issuance of common stock under
employee stock purchase plan
|
2 | - | 4 | 4 | ||||||||||||||||
|
Stock-based compensation expense
|
- | - | 1,505 | 1,505 | ||||||||||||||||
|
Net income
|
1,776 | 1,776 | ||||||||||||||||||
|
Balance at December 31, 2008
|
23,281 | 233 | 83,143 | (28,853 | ) | 54,523 | ||||||||||||||
|
Exercise of common stock options
|
- | - | - | - | ||||||||||||||||
|
Repurchase of common stock
|
(3,500 | ) | (35 | ) | (8,915 | ) | (8,950 | ) | ||||||||||||
|
Issuance of unrestricted stock
|
25 | - | 60 | 60 | ||||||||||||||||
|
Issuance of common stock under
employee stock purchase plan
|
3 | - | 7 | 7 | ||||||||||||||||
|
Stock-based compensation expense
|
- | - | 1,737 | 1,737 | ||||||||||||||||
|
Net income
|
982 | 982 | ||||||||||||||||||
|
Balance at December 31, 2009
|
19,809 | 198 | 76,032 | (27,870 | ) | 48,360 | ||||||||||||||
|
Exercise of common stock options
|
1 | - | 1 | 1 | ||||||||||||||||
|
Issuance of unrestricted stock under a stock
option exchange program
|
178 | 2 | - | 2 | ||||||||||||||||
|
Shares surrendered by employees to
pay taxes related to unrestricted stock
|
(60 | ) | (1 | ) | (162 | ) | (163 | ) | ||||||||||||
|
Issuance of unrestricted stock
|
111 | 1 | - | 1 | ||||||||||||||||
|
Issuance of common stock under
employee stock purchase plan
|
3 | - | 7 | 7 | ||||||||||||||||
|
Stock-based compensation expense
|
- | - | 1,495 | 1,495 | ||||||||||||||||
|
Net income
|
180 | 180 | ||||||||||||||||||
|
Balance at December 31, 2010
|
20,042 | $ | 200 | $ | 77,373 | $ | (27,690 | ) | $ | 49,883 | ||||||||||
The accompanying notes are an integral part of the consolidated financial statements.
37
AWARE, INC.
NOTES TO CONSOLIDATED FINANCIAL STATEMENTS
|
1.
|
NATURE OF BUSINESS
|
We are a leading supplier of products for the biometrics and Digital Subscriber Line (“DSL”) test industries. We sell software products for biometrics and imaging applications and hardware and software products for DSL test and diagnostics applications. We sell our software products for biometrics, medical and digital imaging applications and professional services for biometrics primarily through an OEM sales channel. We sell our DSL test hardware and software products primarily through an OEM sales channel and directly to telephone companies. We also sell and/or license patents related to communications, signal processing, and compression technologies.
|
2.
|
SUMMARY OF SIGNIFICANT ACCOUNTING POLICIES
|
Basis of Presentation
- The consolidated financial statements include the accounts of Aware, Inc. and its subsidiary. All significant intercompany transactions have been eliminated.
Fair Value Measurements
- The FASB issued authoritative guidance for fair value measurements, which defines fair value, establishes a framework for measuring fair value, and expands disclosures for assets and liabilities measured at fair value in financial statements. We adopted these provisions on January 1, 2008.
The fair value guidance establishes a three-tier fair value hierarchy, which prioritizes the inputs used in measuring fair value. These tiers include: Level 1, defined as observable inputs such as quoted prices in active markets; Level 2, defined as inputs other than quoted prices in active markets that are either directly or indirectly observable; and Level 3, defined as unobservable inputs in which little or no market data exists, therefore requiring an entity to develop its own assumptions.
For recognition purposes, on a recurring basis we are required to measure available for sale investments at fair value. We had no available for sale investments as of December 31, 2010 or December 31, 2009.
Our cash and cash equivalents, including money market securities, are also classified within Level 1 of the fair value hierarchy because they are valued using quoted market prices.
Cash and Cash Equivalents
– Cash and cash equivalents consist primarily of demand deposits and money market funds, which are stated at cost, which approximates fair value.
Allowance for Doubtful Accounts
– Accounts are charged to the allowance for doubtful accounts as they are deemed uncollectible based on a periodic review of the accounts.
Inventories
– Inventories are stated at the lower of cost or net realizable value. Cost is determined by the first-in, first-out (“FIFO”) method. We evaluate all inventories for net realizable value on a quarterly basis, and record provisions for excess and obsolete inventory when required.
Property and Equipment
– Property and equipment are stated at cost. Depreciation and amortization of property and equipment is provided using the straight-line method over the estimated useful lives of the assets. Upon retirement or sale, the costs of the assets disposed of and the related accumulated depreciation are removed from the accounts and any resulting gain or loss is included in the determination of income or loss. Expenditures for repairs and maintenance are charged to expense as incurred.
38
AWARE, INC.
NOTES TO CONSOLIDATED FINANCIAL STATEMENTS
The estimated useful lives of assets used by us are:
|
Building and improvements
|
30 years
|
|
|
Building improvements
|
5 to 20 years
|
|
|
Furniture and fixtures
|
5 years
|
|
|
Computer, office & manufacturing equipment
|
3 years
|
|
|
Purchased software
|
3 years
|
Impairment of Long-Lived Assets
– We review long-lived assets for impairment whenever events or changes in business circumstances indicate that the carrying amount of the assets may not be fully recoverable or that the useful lives of these assets are no longer appropriate. Each impairment test is based on a comparison of the undiscounted cash flows to the recorded value of the asset. If an impairment is indicated, the asset is written down to its estimated fair value. The cash flow estimates used to identify the potential impairment reflect our best estimates using appropriate assumptions and projections at that time. We believe that no significant impairment of our long-lived assets has occurred as of December 31, 2010 and 2009.
Revenue Recognition
– We recognize revenue when there is persuasive evidence of an arrangement, the sales price is fixed or determinable, collection of the related receivable is reasonably assured, and delivery has occurred or services have been rendered.
Persuasive evidence of an arrangement:
We use contracts signed by both the customer and us or written purchase orders issued by the customer as evidence of an arrangement.
Product delivery:
We deem delivery to have occurred: (i) upon shipment when products are shipped FOB shipping point, or (ii) upon delivery at a customer’s location when products are shipped FOB destination. If customer acceptance provisions apply, revenue is not recognized until delivery has occurred and we have received such acceptance. If we are required to provide installation services, which is rare under our OEM business model, revenue is not recognized until installation is complete.
Fixed or determinable fee:
We consider fees to be fixed or determinable if the fee is not subject to refund or adjustment and the payment terms are within normal established practices. If the fee is not fixed or determinable, we recognize the revenue as amounts become due and payable.
Collection is deemed probable:
We conduct a credit review for all significant transactions at the time of the arrangement to determine the credit-worthiness of the customer. Collection is deemed probable if we expect that the customer will pay amounts under the arrangement as payments become due.
We categorize revenue as product sales, contract revenue, or royalties depending on the nature of the revenue. In addition to the general revenue recognition policies described above, specific revenue recognition policies apply to each category of revenue.
Product sales
Product sales consist of revenue from the sale of hardware and software products. Specific revenue recognition policies for product sales are:
Hardware product sales
. Hardware product sales consist of revenue from the sale of DSL test and diagnostic hardware products. Hardware products are typically sold independently of other revenue elements, such as software, services and maintenance. Accordingly, the terms of hardware sales generally do not contain provisions that obligate us to provide additional products or services after shipment. Additionally, we do not grant return rights other than normal warranty rights of return. We recognize hardware revenue upon delivery.
Software product sales.
Software product sales consist of revenue from the sale of biometrics and digital imaging software products as well as DSL test and diagnostics software. Software product sales from these product lines include: i) software licenses and ii) maintenance contracts that entitle customers to technical support and product updates during the contract period. We do not grant return rights other than normal warranty rights of return.
39
AWARE, INC.
NOTES TO CONSOLIDATED FINANCIAL STATEMENTS
When software licenses or maintenance contracts are sold separately, we recognize software license revenue upon delivery and maintenance contract revenue ratably over the related contract period. When software licenses and maintenance contracts are sold together, we generally recognize software license revenue upon delivery, provided we have vendor specific objective evidence (“VSOE”) for the fair value of the maintenance contract fee, and we generally recognize the fair value of maintenance contract revenue ratably over the related contract period. If we do not have VSOE for the fair value of the maintenance contract fee, we recognize software license and maintenance contract revenue ratably over the related contract period.
We recognize maintenance contract revenue upon delivery of software licenses when: i) customers purchase maintenance with their initial purchase of software licenses; ii) the maintenance contract period is for a period of one year or less, iii) the estimated cost of providing maintenance services during the contract period is insignificant, and iv) unspecified upgrades offered during PCS arrangements historically have been and are expected to continue to be minimal and infrequent.
Contract revenue
Contract revenue primarily consists of: i) engineering service fees from biometrics and DSL test and diagnostics customers for professional services; ii) engineering service fees from DSL silicon customers for engineering support; and iii) patent fees from the license or sale of patents. Our specific revenue recognition policies for each source of contract revenue are as follows:
Engineering services fees from professional services contracts.
Engineering services from professional services contracts are either sold separately or as part of a multiple element transaction. When sold separately, we recognize contract revenue from these agreements as engineering services are performed or as contract milestones are achieved. When engineering services are sold with other revenue elements, such as software licenses and/or maintenance contracts, our revenue recognition policy is as follows.
|
|
●
|
Services and software.
When engineering services and software licenses are sold together, the total fee is generally recognized by applying contract accounting. We have adopted the percentage-of-completion method of contract accounting, and we use an output method (i.e., contract milestones) to determine our completion percentage. The software license portion of the arrangement is classified as product sales and the engineering services portion is classified as contract revenue.
|
|
|
●
|
Services, software and maintenance.
When we sell services, software and maintenance together, revenue is recognized as follows: i) maintenance revenue is separated from the other two elements and is recognized ratably over the related contract period; provided we have VSOE for the fair value of the maintenance element; and ii) the total fee from the software license and engineering service elements is recognized by applying the contract accounting method described in the previous paragraph. If we do not have VSOE for the fair value of the maintenance element, we recognize revenue for the entire arrangement ratably over a period that begins at the start of the engineering services project and ends when all elements of the arrangement have been delivered.
|
DSL silicon engineering services fees.
In recent years, DSL silicon engineering services have been primarily sold separately. We recognize contract revenue from these agreements as engineering services are performed or as contract milestones are achieved.
Patent fees.
We recognize revenue from patent fees upon delivery of patents, provided there are no significant post delivery obligations.
Royalties
Royalty revenue consists of royalties we receive under DSL silicon IP contracts with customers that have incorporated our intellectual property into their products. Since we cannot reasonably estimate royalty revenue, such revenue is generally recognized in the quarter in which a final report is received from a customer. Royalty reports are typically received in the quarter immediately following the quarter in which sales of royalty-bearing products occur. The terms of our agreements generally require customers to give notification to us and to pay royalties within 45 to 60 days of the end of each quarter.
40
AWARE, INC.
NOTES TO CONSOLIDATED FINANCIAL STATEMENTS
Income Taxes
– We compute deferred income taxes based on the differences between the financial statement and tax basis of assets and liabilities using enacted rates in effect in the years in which the differences are expected to reverse. We establish a valuation allowance to offset temporary deductible differences, net operating loss carryforwards and tax credits when it is more likely than not that the deferred tax assets will not be realized.
Capitalization of Software Costs
– We capitalize certain internally developed software development costs after technological feasibility of the product has been established. No software costs were capitalized for the years ended December 31, 2010, 2009 and 2008, because such costs incurred subsequent to the establishment of technological feasibility, but prior to commercial availability, were immaterial.
Research and Development Costs
– Costs incurred in the research and development of our products are expensed as incurred.
Concentration of Credit Risk
– At December 31, 2010 and 2009, we had cash and investments, in excess of federally insured deposit limits of approximately $39.7 and $39.6 million, respectively.
Concentration of credit risk with respect to net accounts receivable consists of $1.4 million, $0.4 million, $0.4 million, and $0.3 million with four customers, respectively, at December 31, 2010, and $0.9 million, $0.7 million, $0.3 million, and $0.2 million with four customers, respectively, at December 31, 2009
Stock-Based Compensation
– We grant stock options and stock to our employees and directors. We measure stock-based compensation cost at the grant date based on the fair value of the award and recognize it as expense over the applicable vesting period of the award using the straight-line basis.
We use the Black-Scholes valuation model to estimate the fair value of stock option awards. This valuation model takes into account the exercise price of the award, as well as a variety of significant assumptions. The assumptions used to estimate the fair value of stock options include the expected term, the expected volatility of our stock over the expected term, the risk-free interest rate over the expected term, and our expected annual dividend yield.
For stock awards, we determine the fair value of the award by using the fair market value of our stock on the date of grant; provided the number of shares in the grant is fixed on the grant date.
Computation of Earnings per Share
– Basic earnings per share is computed by dividing income available to common shareholders by the weighted average number of common shares outstanding. Diluted earnings per share is computed by dividing income available to common shareholders by the weighted average number of common shares outstanding plus additional common shares that would have been outstanding if dilutive potential common shares had been issued. For the purposes of this calculation, stock options are considered common stock equivalents in periods in which they have a dilutive effect. Stock options that are antidilutive are excluded from the calculation.
Use of Estimates
–
The preparation of our financial statements in conformity with generally accepted accounting principles requires us to make estimates and assumptions that affect the reported amounts of assets and liabilities and disclosure of contingent assets and liabilities at the date of the financial statements and the reported amount of revenues and expenses during the reporting period. Significant estimates include revenue recognition, reserves for doubtful accounts, reserves for excess and obsolete inventory, useful lives of fixed assets, valuation allowance for deferred income tax assets, and accrued liabilities. Actual results could differ from those estimates.
Fair Value of Financial Instruments
– The carrying amounts of cash and cash equivalents, accounts receivable, accounts payable and accrued expenses approximate fair value because of their short-term nature.
41
AWARE, INC.
NOTES TO CONSOLIDATED FINANCIAL STATEMENTS
Comprehensive Income -
Comprehensive income is defined as the change in equity of a business enterprise during a period from transactions and other events and circumstances from non-owner sources, including foreign currency translation adjustments and unrealized gains and losses on marketable securities. For the years ended December 31, 2010, 2009, and 2008, comprehensive income was not materially different from net income.
Advertising Costs –
Advertising costs are expensed as incurred and were not material for 2010, 2009, and 2008.
Recent Accounting Pronouncements
– We describe below recent pronouncements that have had or may have a significant effect on our financial statements. We do not discuss recent pronouncements that are not anticipated to have an impact on or are unrelated to our financial condition, results of operations, or disclosures.
In January 2010, the Financial Accounting Standards Board (“FASB”) issued Accounting Standards Update (“ASU”) 2010-06, “Improving Disclosures about Fair Value Measurements”. ASU 2010-06 requires additional disclosures about fair value measurements including transfers in and out of Levels 1 and 2 and a higher level of disaggregation for the different types of financial instruments. For the reconciliation of Level 3 fair value measurements, information about purchases, sales, issuances and settlements are presented separately. This standard is effective for interim and annual reporting periods beginning after December 15, 2009 with the exception of revised Level 3 disclosure requirements which are effective for interim and annual reporting periods beginning after December 15, 2010. Comparative disclosures are not required in the year of adoption. We adopted the provisions of the standard on January 1, 2010, which did not have a material impact on our financial statements.
Reclassifications -
Certain prior period amounts have been reclassified to be consistent with the current period presentation.
Segments
–
We organize ourselves as one segment reporting to the chief operating decision-maker. We have sales outside of the United States, which are described in Note 9. All long-lived assets are maintained in the United States.
|
3.
|
ASSETS SOLD
|
On November 13, 2009, we completed a transaction in which we sold substantially all of the assets associated with our licensing product line to Lantiq Broadband Holdco, Inc. and Lantiq Deutschland GmbH (“Lantiq”) for $6.75 million. The sale included: i) our DSL and home networking technology assets; ii) certain patents and patent applications related to those technology assets; iii) a group of 41 engineers; and iv) lab and computer equipment used by the transferred engineers.
In 2009, we recorded a gain on the sale of assets of $6.2 million. The gain reflects $6.75 million of proceeds less the following items: i) the net book value of assets transferred to Lantiq; ii) the write-off of certain prepaid assets that had no economic value after the sale; and iii) transaction costs. Included in the assets transferred to Lantiq were property and equipment, principally lab and computer equipment, which had a cost of $1.9 million and a net book value of $124,000.
42
AWARE, INC.
NOTES TO CONSOLIDATED FINANCIAL STATEMENTS
4.
INVENTORIES
Inventories consisted of the following at December 31 (in thousands):
|
2010
|
2009
|
||||||||
|
Raw materials
|
$ | 966 | $ | 796 | |||||
|
Finished goods
|
897 | 317 | |||||||
|
Total
|
$ | 1,863 | $ | 1,113 | |||||
5. PROPERTY AND EQUIPMENT
Property and equipment consisted of the following at December 31 (in thousands):
|
2010
|
2009
|
|||||||
|
Land
|
$ | 1,080 | $ | 1,080 | ||||
|
Building and improvements
|
8,869 | 8,869 | ||||||
|
Computer equipment
|
1,190 | 1,272 | ||||||
|
Purchased software
|
193 | 257 | ||||||
|
Furniture and fixtures
|
811 | 820 | ||||||
|
Office equipment
|
207 | 209 | ||||||
|
Manufacturing equipment
|
76 | 76 | ||||||
|
Total
|
12,426 | 12,583 | ||||||
|
Less accumulated depreciation and amortization
|
(6,066 | ) | (5,839 | ) | ||||
|
Property and equipment, net
|
$ | 6,360 | $ | 6,744 | ||||
Depreciation expense amounted to $0.5 million, $0.8 million, and $0.9 million in each of the years ended December 31, 2010, 2009, and 2008, respectively. In 2010 and 2009, we identified $275,000 and $58,000, respectively, of fully depreciated assets no longer in use, and retired the assets and related accumulated depreciation. In 2009, we also sold assets with a cost of $1.9 million and a net book value of $124,000 in connection with the Lantiq asset sale.
6.
INCOME TAXES
Deferred tax assets are attributable to the following at December 31 (in thousands):
|
2010
|
2009
|
|||||||
|
Federal net operating loss carryforwards
|
$ | 16,977 | $ | 15,872 | ||||
|
Research and development and other tax credit carryforwards
|
18,719 | 18,116 | ||||||
|
State net operating loss carryforwards
|
535 | 599 | ||||||
|
Capitalized research and development costs
|
3,018 | 4,719 | ||||||
|
Other
|
2,510 | 3,464 | ||||||
|
Total
|
41,759 | 42,770 | ||||||
|
Less valuation allowance
|
(41,759 | ) | (42,770 | ) | ||||
|
Deferred tax assets, net
|
$ | - | $ | - | ||||
43
AWARE, INC.
NOTES TO CONSOLIDATED FINANCIAL STATEMENTS
A reconciliation of the U.S. federal statutory rate to the effective tax rate is as follows:
|
Year ended December 31,
|
||||||||||||
|
2010
|
2009
|
2008
|
||||||||||
|
Federal statutory rate
|
34 | % | 34 | % | 34 | % | ||||||
|
State rate, net of federal benefit
|
8 | 9 | 4 | |||||||||
|
Tax credits
|
(128 | ) | (88 | ) | (52 | ) | ||||||
|
Change in valuation allowance
|
(558 | ) | 30 | 8 | ||||||||
|
State tax rate change
|
157 | 0 | 0 | |||||||||
|
Non-qualified option cancellations and forfeitures
|
394 | 0 | 0 | |||||||||
|
Nondeductible compensation expense
|
0 | 6 | 3 | |||||||||
|
Prior year adjustment
|
5 | 0 | 0 | |||||||||
|
Expiring NOLs and tax credits
|
84 | 8 | 4 | |||||||||
|
Other
|
5 | 2 | 0 | |||||||||
|
Effective tax rate
|
1 | % | 1 | % | 1 | % | ||||||
At December 31, 2010, we had federal net operating loss (
“
NOL
”
) and research and development credit carryforwards of approximately $51.0 million and $13.5 million respectively, expiring in 2011 through various dates up through 2030. In 2010, approximately $731,000 of NOLs and $15,000 of research and development credits expired unused. Based on an analysis that we performed under Internal Revenue Code Section 382 on our NOLs generated for the period 1997 through 2010, we have not experienced a change in ownership as defined by Section 382, and, therefore, the NOLs are not currently under any Section 382 limitation.
For state purposes, we had state NOLs and research and development credit carryforwards of approximately $11.3 million and $7.3 million respectively, expiring in 2011 through various dates up to 2025. In 2010, approximately $2.5 million of state NOLs expired unused and $31,000 research and development credits expired unused.
Subsequent ownership changes, as defined in Section 382, could limit the amount of net operating loss carryforwards and research and development credits that can be utilized annually to offset future taxable income.
We recorded a full valuation allowance against our deferred tax assets because we determined that it was more likely than not that such deferred tax assets may not be realized. Our decision to reserve deferred tax assets was primarily due to a history of net operating losses incurred in recent years, and the uncertainty of the timing of future taxable income. If we generate sustained future taxable income against which these tax attributes may be applied, some portion or all of the valuation allowance would be reversed.
We did not record a provision for federal income taxes in 2010, 2009, and 2008 due to tax net operating losses and the uncertainty of the timing of profitability in future periods. However, in 2010, 2009 and 2008 we paid immaterial amounts of state excise taxes.
Gross deferred tax assets include cumulative deductions for stock options in excess of book expense of $63.1 million. None of the benefit related to these options has been reflected in equity because we determined that it was more likely than not that such deferred tax assets may not be realized. Therefore, the portion of the deferred tax asset valuation allowance related to the tax benefit of these options must be recorded to equity, when the tax benefit is realized. The estimated federal amount of this benefit is $23.1 million, and the estimated state amount is $2.0 for a total amount of $25.1 million.
We adopted the FASB’s guidance related to uncertain tax provisions on January 1, 2007. As a result of the implementation of this guidance, we recognized no material adjustment in the liability for unrecognized income tax benefits. At the adoption date of January 1, 2007 and also at December 31, 2009 and December 31, 2010, we had no unrecognized tax benefits.
44
AWARE, INC.
NOTES TO CONSOLIDATED FINANCIAL STATEMENTS
Our policy is to recognize interest and penalties related to uncertain tax positions in income tax expense. As of December 31, 2010, we had no accrued interest or penalties related to uncertain tax positions.
7. EQUITY AND STOCK COMPENSATION PLANS
At December 31, 2010, we have three stock-based compensation plans, which are described below:
Fixed Stock Option Plans
– We have two fixed option plans. Under our 1996 Stock Option Plan (“1996 Plan”), we were authorized to grant incentive stock options and nonqualified stock options to our employees and directors for up to 6,100,000 shares of common stock. There were no shares available for grant under the 1996 Plan as of December 31, 2010. Under our 2001 Nonqualified Stock Plan (“2001 Plan”), we are authorized to grant nonqualified stock options, stock appreciation rights and stock awards to our employees and directors for up to 8,000,000 shares of common stock. As of December 31, 2010, there were 3,561,956 shares available for grant under the 2001 Plan.
Under both plans, options are granted at exercise prices as determined by the Board of Directors and have terms ranging from four to a maximum of ten years. Our options generally vest over three to five years, although we have granted options that are 50% or fully vested on the date of grant.
The following table presents stock-based employee compensation expenses included in our consolidated statements of operations (in thousands):
|
2010
|
2009
|
2008
|
|||||||||||
|
Cost of product sales
|
$ | 10 | $ | 10 | $ | 11 | |||||||
|
Cost of contract revenue
|
19 | 114 | 135 | ||||||||||
|
Research and development
|
337 | 521 | 611 | ||||||||||
|
Selling and marketing
|
98 | 293 | 186 | ||||||||||
|
General and administrative
|
1,031 | 799 | 562 | ||||||||||
|
Stock-based compensation expense
|
$ | 1,495 | $ | 1,737 | $ | 1,505 | |||||||
Stock-based compensation expenses in the preceding table include expenses associated with grants of: i) stock options; ii) stock appreciation rights (SARs); and iii) unrestricted shares of our common stock. The method used to determine stock-based compensation expense for each type of equity grant is described in the following paragraphs.
Stock Option and SAR Grants.
For the years ended December 31, 2010, 2009, and 2008, we granted stock options for 0, 3,400, and 1,093,200 shares, respectively. For the year ended December 31, 2009, we also granted SARs to directors and officers representing 110,000 shares. We estimate the fair value of stock options and SARs using the Black-Scholes valuation model. We believe this valuation model is appropriate for SARs, as well as stock options, as SARs share most of the characteristics of stock options.
The Black-Scholes valuation model takes into account the exercise price of the award, as well as a variety of significant assumptions. The assumptions used to estimate the fair value of stock options and SARs include the expected term, the expected volatility of our stock over the expected term, the risk-free interest rate over the expected term, and our expected annual dividend yield. We believe that the valuation technique and the approach utilized to develop the underlying assumptions are appropriate in calculating the fair values of stock options and SARs granted in the years ended December 31, 2010, 2009 and 2008. Estimates of fair value are not intended to predict actual future events or the value ultimately realized by persons who receive equity awards.
45
AWARE, INC.
NOTES TO CONSOLIDATED FINANCIAL STATEMENTS
Specific assumptions used to determine the fair value of options granted during the years ended December 31, 2010, 2009 and 2008, using the Black-Scholes valuation model were:
|
Year Ended
December 31, 2010
|
Year Ended
December 31, 2009
|
Year Ended
December 31, 2008
|
|||||||||||
|
Expected term (1)
|
n/a |
6.58-6.73 years
|
6.70-7.16 years
|
||||||||||
|
Expected volatility factor (2)
|
n/a | 60-62 | % | 51-54 | % | ||||||||
|
Risk-free interest rate (3)
|
n/a | 1.76-2.47 | % | 2.17-3.16 | % | ||||||||
|
Expected annual dividend yield
|
n/a | — | — | ||||||||||
|
|
(1)
|
The expected term for each grant for the years ended December 31, 2009 and 2008 were determined based on the historical average term of grants issued over the past seven years.
|
|
|
|
|
|
(2)
|
The expected volatility for each grant is estimated based on an average of historical volatility over a period of time which we believe to be representative of our future volatility.
|
|
|
(3)
|
The risk-free interest rate for each grant is based on the U.S. Treasury yield curve in effect at the time of grant for a period equal to the expected term of the stock option.
|
We do not estimate our forfeiture rates as the actual forfeiture rate is known at the end of each reporting period due to the timing of our stock option vesting.
In the years ended December 31, 2010 and 2009, there were two stock option events that affected options outstanding and stock-based compensation expense:
In January 2010, we completed an employee option exchange program. Under the terms of the program, eligible rank and file employees had the right to exchange eligible vested and unvested stock options outstanding for shares of common stock. Exchange ratios for each eligible stock option were determined using the fair values of stock options and Aware’s common stock immediately prior to the initiation of the program. Employees exchanged 820,481 stock options for 178,314 shares of common stock. Employees were also allowed to surrender a portion of their common stock in return for the Company paying withholding taxes related to their stock grants. As a result of this provision, employees surrendered 60,659 shares of common stock and we paid approximately $161,000 of withholding taxes on their behalf. After the tax related share surrender, 117,655 net shares of common stock were issued to participating employees. The option exchange program had an insignificant impact on stock-based compensation expense for the year ended December 31, 2010.
In September 2009, the compensation committee of the board of directors approved an amendment to certain director and officer stock options that extended the period of time option holders have to exercise upon termination from the Company. This stock option modification resulted in a total non-cash stock-based compensation charge of approximately $282,000 of which $20,000 and $251,000, respectively was charged to expense in the years ended December 31, 2010 and 2009. The remaining $11,000 of unamortized expense will be amortized to expense in 2011.
Unrestricted Stock Grants
. Our 2001 Plan permits us to grant unrestricted shares of stock to our directors, officers and employees. For the years ended December 31, 2010, 2009, and 2008, we awarded 575,443, 25,000, and 0 shares, respectively to eligible plan participants. Stock-based compensation expense for stock grants is determined based on the fair market value of our stock on the date of grant; provided the number of shares in the grant is fixed on the grant date.
The 2010 stock grant of 575,443 shares includes 102,040 shares granted to directors and 473,403 shares granted to officers and employees. Shares granted to directors and one employee representing a total of 111,163 shares were issued to those individuals in 2010, which resulted in a stock-based compensation charge of $281,000 for the year ended December 31, 2010. All other shares granted to officers and employees representing a total of 464,280 shares were not issued in 2010. Such grants will be issued to grantees in four equal increments on December 31, 2010, June 30, 2011, December 31, 2011, and June 30, 2012; provided that grantees remain employed on each of those dates. The total stock-based compensation charge associated with the officer and employee grant is expected to be approximately $1.2 million and will be amortized to expense over the related two-year issuance period. We charged $293,000 of stock-based compensation expense related to the officer and employee grant in the year ended December 31, 2010. At December 31, 2010, unrecognized compensation expense related to this grant was approximately $878,000, which is expected to be recognized over a weighted-average period of 0.9 years.
46
AWARE, INC.
NOTES TO CONSOLIDATED FINANCIAL STATEMENTS
In 2009, we issued 25,000 shares of unrestricted stock to an employee representing $60,000 of stock-based compensation expense. This expense was charged against gain on sale of assets in connection with the Lantiq transaction.
A summary of stock option and SAR transactions for our two fixed stock option plans for the years ended December 31, 2010, 2009, and 2008 are presented below:
|
2010
|
2009
|
2008
|
||||||||||||||||||||||
|
Shares
|
Weighted
Average
Exercise
Price
|
Shares
|
Weighted
Average
Exercise
Price
|
Shares
|
Weighted
Average
Exercise
Price
|
|||||||||||||||||||
|
Outstanding at beginning of year
|
6,019,972 | $ | 4.42 | 7,538,993 | $ | 4.68 | 6,974,705 | $ | 4.84 | |||||||||||||||
|
Granted
|
- | - | 113,400 | 2.51 | 1,093,200 | 3.57 | ||||||||||||||||||
|
Exercised
|
(625 | ) | 1.68 | (187 | ) | 1.68 | (136,158 | ) | 2.64 | |||||||||||||||
|
Forfeited or cancelled
|
(936,456 | ) | 5.09 | (1,632,234 | ) | 5.48 | (392,754 | ) | 5.13 | |||||||||||||||
|
Outstanding at end of year
|
5,082,891 | $ | 4.30 | 6,019,972 | $ | 4.42 | 7,538,993 | $ | 4.68 | |||||||||||||||
|
Exercisable at year end
|
4,750,409 | $ | 4.34 | 5,269,969 | $ | 4.51 | 6,059,397 | $ | 4.80 | |||||||||||||||
All options and SARs granted during the years ended December 31, 2009 and 2008 had exercise prices equal to the fair market value of our common stock on the date of grant, and the weighted average grant date fair values of options granted were $1.51 and $1.97, respectively.
At December 31, 2010, the weighted average remaining contractual term for total options and total options exercisable was approximately 4 years for each.
At December 31, 2010, the aggregate intrinsic value of options outstanding and options exercisable was zero for both as each group of options was out-of-the money by approximately $7.4 million and $7.1 million, respectively. The intrinsic value of a stock option is the amount by which the market value of the underlying stock exceeds the exercise price of the option. The aggregate intrinsic value of options exercised during the year ended December 31, 2010 was approximately $744.
The following table summarizes the stock options and SARs outstanding at December 31, 2010:
|
Options Outstanding
|
Options Exercisable
|
||||||||||||||||
|
Exercise Price
Range
|
Number
|
Weighted
Average
Exercise
Price
|
Weighted Average
Remaining
Contractual
Term (in years)
|
Number
|
Weighted
Average
Exercise
Price
|
||||||||||||
|
$0 to $2
|
5,750
|
$ |
1.83
|
4.96
|
4,483
|
$ |
1.84
|
||||||||||
|
$2 to $3
|
725,368
|
2.84
|
4.06
|
711,554
|
2.85
|
||||||||||||
|
$3 to $4
|
2,278,961
|
3.41
|
4.55
|
2,011,585
|
3.38
|
||||||||||||
|
$4 to $5
|
264,850
|
4.63
|
6.93
|
215,044
|
4.63
|
||||||||||||
|
$5 to $6
|
260,962
|
5.08
|
3.86
|
260,743
|
5.08
|
||||||||||||
|
$6 to $7
|
1,509,000
|
6.08
|
4.01
|
1,509,000
|
6.08
|
||||||||||||
|
$7 to $10
|
38,000
|
7.75
|
0.46
|
38,000
|
7.75
|
||||||||||||
|
5,082,891
|
$ |
4.30
|
4.38
|
4,750,409
|
$ |
4.34
|
|||||||||||
47
AWARE, INC.
NOTES TO CONSOLIDATED FINANCIAL STATEMENTS
At December 31, 2010, unrecognized compensation expense related to non-vested stock options and SARs was approximately $688,000, which is expected to be recognized over a weighted average period of 0.8 years.
We issue common stock from previously authorized but unissued shares to satisfy option exercises and purchases under our Employee Stock Purchase Plan.
Employee Stock Purchase Plan
-
In June 1996, we adopted an Employee Stock Purchase Plan (the “ESPP Plan”) under which eligible employees could purchase common stock at a price equal to 85% of the lower of the fair market value of the common stock at the beginning or end of each six-month offering period. On November 29, 2005 we amended the ESPP Plan to provide that eligible employees may purchase common stock at a price equal to 95% of the fair market value of the common stock as of the end of each six-month offering period. There is no stock-based compensation expense related to our Employee Stock Purchase Plan because it is not considered a compensatory plan. The plan does not have a look-back feature, and has a minimal discount of 5% of the fair market value of the common stock as of the end of each six-month offering period. Participation in the ESPP Plan is limited to 6% of an employee’s compensation, may be terminated at any time by the employee and automatically ends on termination of employment. A total of 350,000 shares of common stock have been reserved for issuance. As of December 31, 2010 there were 126,379 shares available for future issuance under the ESPP Plan. We issued 3,105, 3,176, and 2,362 common shares under the ESPP Plan in 2010, 2009, and 2008, respectively.
Stockholder Rights Plan
-
In October 2001, our board of directors adopted a stockholder rights plan and declared a dividend distribution of one share purchase right (a “Right”) for each outstanding share of our common stock to stockholders of record at the close of business on October 15, 2001. Each share of common stock issued after that date also will carry with it one Right, subject to certain exceptions. Each Right, when it becomes exercisable, will entitle the record holder to purchase from us one ten-thousandth of a share of series A preferred stock at an exercise price of $40.00 subject to adjustment.
The Rights become exercisable upon the earliest of the following dates: (i) the date on which we first publicly announce that a person or group has become an acquiring person, or (ii) the date, if any, that our board of directors may designate following the commencement of, or first public disclosure of an intent to commence, a tender or exchange offer which could result in the potential buyer becoming a beneficial owner of 15% or more of our outstanding common stock. Under these circumstances, holders of Rights will be entitled to purchase, for the exercise price, the preferred stock equivalent of common stock having a market value of two times the exercise price. The Rights expire on October 2, 2011, and may be redeemed by us for $.001 per Right.
On September 6, 2007, our Board of Directors determined that it would be advisable to amend the Rights Agreement to exempt John B. Stafford, Jr., John S. Stafford, III, and James M. Stafford and their respective affiliates from the definition of “Acquiring Person” in the Rights Agreement. Accordingly, on September 6, 2007, we executed Amendment No.1 to the Rights Agreement with Computershare Trust Company, N.A. as successor rights agent to implement this amendment.
On June 1, 2010, our Board of Directors determined that it would be advisable to amend the Rights Agreement to exempt also, Susan Yang Stafford, the wife of John S. Stafford, Jr., and her affiliates and associates, from the definition of “Acquiring Person” in the Rights Agreement. Accordingly, on June 1, 2010, we executed Amendment No. 2 to the Rights Agreement with Computershare Trust Company, N.A. to implement this amendment.
Share Repurchase Program
-
In August 2007, we announced a stock repurchase program to purchase up to $5.0 million of our common stock, subject to market conditions and other factors. In October 2008, we announced that the program had been amended to increase the total amount of common stock that may be repurchased from $5.0 million to $10.0 million and to extend the period of time that shares may be repurchased from December 31, 2008 to December 31, 2009. When the program ended on December 31, 2009, we had repurchased 721,131 shares of common stock at a total cost of $2.4 million.
48
AWARE, INC.
NOTES TO CONSOLIDATED FINANCIAL STATEMENTS
In March 2009, we announced a modified Dutch auction self-tender offer to purchase up to 3,500,000 shares, or approximately 15%, of our outstanding common stock (including the associated preferred share purchase rights), at a price in the range of $2.20 to $2.60 per share, for a maximum aggregate purchase price of approximately $9.1 million. The terms of the tender offer also provided the right for us to purchase up to an additional 2% of our shares if the offer was oversubscribed. When the tender offer closed in April 2009, we repurchased 3,500,252 shares at $2.50 per share for a total cost of $9.0 million, including expenses.
|
8.
|
COMMITMENTS AND CONTINGENT LIABILITIES
|
Lease Commitments
– We own our principal office and research facility in Bedford, Massachusetts, which we have occupied since November 1997. We conduct a portion of our activities in a leased facility in California under a non-cancelable operating lease that expires in 2013. The following is a schedule of future minimum rental payments (in thousands):
|
Year ended December 31,
|
|||||
|
2011
|
$ | 18 | |||
|
2012
|
18 | ||||
|
2013
|
13 | ||||
|
Total minimum lease payments
|
$ | 49 | |||
Rental expense was approximately $16,000, $13,000, and $21,000 in 2010, 2009 and 2008, respectively.
Litigation
- There are no material pending legal proceedings to which we are a party or to which any of our properties are subject which, either individually or in the aggregate, are expected to have a material adverse effect on our business, financial position or results of operations.
Guarantees and Indemnification Obligations
–
We enter into agreements in the ordinary course of business that require us: i) to perform under the terms of the contracts, ii) to protect the confidentiality of our customers’ intellectual property, and iii) to indemnify customers, including indemnification against third party claims alleging infringement of intellectual property rights. We also have agreements with each of our directors and executive officers to indemnify such directors or executive officers, to the extent legally permissible, against all liabilities reasonably incurred in connection with any action in which such individual may be involved by reason of such individual being or having been a director or officer of the Company.
Given the nature of the above obligations and agreements, we are unable to make a reasonable estimate of the maximum potential amount that we could be required to pay. Historically, we have not made any significant payments on the above guarantees and indemnifications and no amount has been accrued in the accompanying consolidated financial statements with respect to these guarantees and indemnifications.
9.
BUSINESS SEGMENTS AND MAJOR CUSTOMERS
We manage the business as one segment and conduct our operations in the United States. We sell our products and technology to domestic and international customers. Revenues were generated from the following geographic regions (in thousands):
|
Year ended December 31,
|
|||||||||||||
|
2010
|
2009
|
2008
|
|||||||||||
|
United States
|
$ | 12,289 | $ | 12,235 | $ | 24,070 | |||||||
|
Germany
|
2,770 | 5,375 | 4,881 | ||||||||||
|
Rest of world
|
8,501 | 4,432 | 1,566 | ||||||||||
| $ | 23,560 | $ | 22,042 | $ | 30,517 | ||||||||
49
AWARE, INC.
NOTES TO CONSOLIDATED FINANCIAL STATEMENTS
The portion of total revenue that was derived from major customers was as follows:
|
Year ended December 31,
|
|||||||||||||
|
2010
|
2009
|
2008
|
|||||||||||
|
Customer A
|
11 | % | 4 | % | 2 | % | |||||||
|
Customer B
|
- | % | 19 | % | 12 | % | |||||||
|
Customer C
|
- | % | 4 | % | 10 | % | |||||||
|
Customer D
|
- | % | - | % | 28 | % | |||||||
|
10.
|
EMPLOYEE BENEFIT PLAN
|
In 1994, we established a qualified 401(k) Retirement Plan (the “Plan”) under which employees are allowed to contribute certain percentages of their pay, up to the maximum allowed under Section 401(k) of the Internal Revenue Code. Our contributions to the Plan are at the discretion of the Board of Directors. Our contributions were approximately $239,000, $363,000, and $326,000 in 2010, 2009 and 2008, respectively.
|
11.
|
NET INCOME PER SHARE
|
Net income per share is calculated as follows (in thousands, except per share data):
|
Year ended December 31,
|
||||||||||||
|
2010
|
2009
|
2008
|
||||||||||
|
Net income
|
$ | 180 | $ | 982 | $ | 1,776 | ||||||
|
Weighted average common shares outstanding
|
19,971 | 20,869 | 23,638 | |||||||||
|
Additional dilutive common stock equivalents
|
211 | 5 | 59 | |||||||||
|
Diluted shares outstanding
|
20,182 | 20,874 | 23,697 | |||||||||
|
Net income per share – basic
|
$ | 0.01 | $ | 0.05 | $ | 0.08 | ||||||
|
Net income per share – diluted
|
$ | 0.01 | $ | 0.05 | $ | 0.07 | ||||||
For the years ended December 31, 2010, 2009 and 2008, options to purchase 4,936,391, 5,970,722, and 6,739,957 shares of common stock at weighted average exercise prices of $4.36, $4.44, and $4.89 per share, respectively, were outstanding, but were not included
in the computation of diluted EPS because the options’ exercise prices were greater than the average market price of the common shares and thus would be anti-dilutive.
12.
QUARTERLY RESULTS OF OPERATIONS – UNAUDITED
The following table presents unaudited quarterly operating results for each of our quarters in the two-year period ended December 31, 2010 (in thousands, except per share data):
|
2010 Quarters Ended
|
||||||||||||||||
|
March 31
|
June 30
|
September 30
|
December 31
|
|||||||||||||
|
Revenue
|
$ | 5,616 | $ | 4,971 | $ | 6,151 | $ | 6,822 | ||||||||
|
Gross profit
|
4,508 | 4,057 | 4,709 | 5,210 | ||||||||||||
|
Income (loss) from operations
|
5 | (494 | ) | (52 | ) | 208 | ||||||||||
|
Other income
|
- | 325 | 100 | - | ||||||||||||
|
Net income (loss)
|
22 | (148 | ) | 76 | 230 | |||||||||||
|
Net income (loss) per share – basic
|
$ | 0.00 | $ | (0.01 | ) | $ | 0.00 | $ | 0.01 | |||||||
|
Net income (loss) per share – diluted
|
$ | 0.00 | $ | (0.01 | ) | $ | 0.00 | $ | 0.01 | |||||||
50
AWARE, INC.
NOTES TO CONSOLIDATED FINANCIAL STATEMENTS
|
2009 Quarters Ended
|
||||||||||||||||
|
March 31
|
June 30
|
September 30
|
December 31
|
|||||||||||||
|
Revenue
|
$ | 4,573 | $ | 5,764 | $ | 6,220 | $ | 5,486 | ||||||||
|
Gross profit
|
3,152 | 3,812 | 4,646 | 4,649 | ||||||||||||
|
Loss from operations
|
(2,253 | ) | (1,646 | ) | (1,163 | ) | (419 | ) | ||||||||
|
Gain on sale of assets
|
- | - | - | 6,230 | ||||||||||||
|
Net income (loss)
|
(2,131 | ) | (1,586 | ) | (1,133 | ) | 5,834 | |||||||||
|
Net income (loss) per share – basic
|
$ | (0.09 | ) | $ | (0.08 | ) | $ | (0.06 | ) | $ | 0.29 | |||||
|
Net income (loss) per share – diluted
|
$ | (0.09 | ) | $ | (0.08 | ) | $ | (0.06 | ) | $ | 0.29 | |||||
Quarterly amounts may not sum to annual amounts due to rounding and dilution.
13.
SPIN-OFF PLANS
In September 2010, we announced plans to pursue a spin-off of our patent licensing operations. The spin-off would allow the spun-off entity to focus on patent licensing operations. After the spin-off, Aware will continue as a supplier of test and diagnostics products and biometrics and imaging software.
In January 2011, we announced that our board was continuing to review strategic options with respect to our patent licensing operations, including a potential spin-off, but that no final decision had been made.
51
FINANCIAL STATEMENT SCHEDULE
Schedule II - Valuation and Qualifying Accounts – Years ended December 31, 2010, 2009, and 2008
(in thousands)
|
Col. A
|
Col. B
|
Col. C(1)
|
Col. C(2)
|
Col. D
|
Col. E
|
|||||||||||||||
|
Additions
|
||||||||||||||||||||
|
Balance at
|
Charged to
|
Charged
|
Deductions
|
Balance
|
||||||||||||||||
|
Beginning
|
Costs and
|
to Other
|
Charged to
|
at End
|
||||||||||||||||
|
of Period
|
Expenses
|
Accounts
|
Reserves
|
of Period
|
||||||||||||||||
|
Allowance for doubtful accounts receivable:
|
||||||||||||||||||||
|
2010
|
$ | 30 | $ | - | $ | - | $ | - | $ | 30 | ||||||||||
|
2009
|
$ | 30 | $ | - | $ | - | $ | - | $ | 30 | ||||||||||
|
2008
|
$ | 55 | $ | (25 | ) | $ | - | $ | - | $ | 30 | |||||||||
|
Inventory reserves:
|
||||||||||||||||||||
|
2010
|
$ | 1,137 | $ | 305 | $ | - | $ | 453 | $ | 989 | ||||||||||
|
2009
|
$ | 738 | $ | 399 | $ | - | $ | - | $ | 1,137 | ||||||||||
|
2008
|
$ | 409 | $ | 316 | $ | 13 | $ | - | $ | 738 | ||||||||||
|
Warranty reserves:
|
||||||||||||||||||||
|
2010
|
$ | 0 | $ | - | $ | - | $ | - | $ | 0 | ||||||||||
|
2009
|
$ | 118 | $ | - | $ | - | $ | 118 | $ | 0 | ||||||||||
|
2008
|
$ | 0 | $ | 118 | $ | - | $ | - | $ | 118 | ||||||||||
|
Deferred tax asset valuation allowance:
|
||||||||||||||||||||
|
2010
|
$ | 42,770 | $ | - | $ | (1,011 | ) | $ | - | $ | 41,759 | |||||||||
|
2009
|
$ | 42,481 | $ | - | $ | 289 | $ | - | $ | 42,770 | ||||||||||
|
2008
|
$ | 42,825 | $ | - | $ | (344 | ) | $ | - | $ | 42,481 | |||||||||
52
Not applicable.
Conclusion Regarding the Effectiveness of Disclosure Controls and Procedures
Under the supervision and with the participation of our management, including our chief executive officer and chief financial officer, we conducted an evaluation of our disclosure controls and procedures, as such term is defined under Rule 13a-15(e) promulgated under the Securities Exchange Act of 1934, as amended (the Exchange Act). Based on this evaluation, our chief executive officer and chief financial officer concluded that our disclosure controls and procedures were effective as of the end of the period covered by this annual report.
Evaluation of Changes in Internal Control Over Financial Reporting
Under the supervision and with the participation of our management, including our chief executive officer and chief financial officer, we concluded that there were no changes in our internal control over financial reporting that occurred during the quarterly period ended December 31, 2010 that have materially affected, or are reasonably likely to materially affect, our internal control over financial reporting.
Management’s Report on Internal Control Over Financial Reporting
Our management is responsible for establishing and maintaining adequate internal control over financial reporting, as such term is defined in Exchange Act Rule 13a-15(f). Under the supervision and with the participation of our management, including our principal executive officer and principal financial officer, we conducted an evaluation of the effectiveness of our internal control over financial reporting based on the framework in
Internal Control - Integrated Framework
issued by the Committee of Sponsoring Organizations of the Treadway Commission. Based on our evaluation under the framework in
Internal Control — Integrated Framework
, our management concluded that our internal control over financial reporting was effective as of December 31, 2010.
The effectiveness of our internal control over financial reporting as of December 31, 2010 has been audited by PricewaterhouseCoopers LLP, an independent registered public accounting firm, as stated in their report which is included herein.
None.
53
The information required by Item 10 of Form 10-K is incorporated by reference from the information contained in the sections captioned
“Directors and Executive Officers”, “Corporate Governance
” and
“Section 16(a
)
Beneficial Ownership Reporting Compliance”
in the Proxy Statement that will be delivered to our shareholders in connection with our May 25, 2011 Annual Meeting of Shareholders.
The information required by Item 11 of Form 10-K is incorporated by reference from the information contained in the section captioned
“Executive Compensation”
in the Proxy Statement that will be delivered to our shareholders in connection with our May 25, 2011 Annual Meeting of Shareholders.
The information required by Item 12 of Form 10-K is incorporated by reference from the information contained in the section captioned
“Security Ownership of Certain Beneficial Owners and Management and Related Stockholder Matters”
in the Proxy Statement that will be delivered to our shareholders in connection with our May 25, 2011 Annual Meeting of Shareholders.
The information, if any, required by Item 13 of Form 10-K is incorporated by reference from the information contained in the sections captioned
“Corporate Governance”
and
“Certain Relationships and Related Transactions”
in the Proxy Statement that will be delivered to our shareholders in connection with our May 25, 2011 Annual Meeting of Shareholders.
The information required by Item 14 of Form 10-K is incorporated by reference from the information contained in the section captioned
“Independent Accountants”
in the Proxy Statement that will be delivered to our shareholders in connection with our May 25, 2011 Annual Meeting of Shareholders.
54
The following documents are filed as part of this report:
(a)
Financial Statements and Exhibits
:
|
Page
|
|
|
(1) Report of Independent Registered Public Accounting Firm
|
33
|
|
Consolidated Balance Sheets as of December 31, 2010 and 2009
|
34
|
|
Consolidated Statements of Operations for each of the three
years in the period ended December 31, 2010
|
35
|
|
Consolidated Statements of Cash Flows for each of the
three years in the period ended December 31, 2010
|
36
|
|
Consolidated Statements of Stockholders’ Equity for each of
the three years in the period ended December 31, 2010
|
37
|
|
Notes to Consolidated Financial Statements
|
38
|
|
(2) Schedule II - Valuation and Qualifying Accounts
|
52
|
(3) Exhibits:
The exhibits listed below are filed with or incorporated by reference in this report.
|
Exhibit No.
|
Description of Exhibit
|
||
|
3.1
|
Amended and Restated Articles of Organization, as amended (filed as Exhibit 3.1 to the Company’s Form 10-K for the year ended December 31, 2008 and incorporated herein by reference).
|
||
|
3.2
|
Amended and Restated By-Laws (filed as Exhibit 3.1 to the Company’s Form 8-K filed with the Securities and Exchange Commission on December 10, 2007 and incorporated herein by reference).
|
||
|
4.1
|
Rights Agreement dated as of October 2, 2001 between Aware, Inc. and Equiserve Trust Company, N.A., as Rights Agent (filed as Exhibit 4(a) to the Company’s Form 8-K filed with the Securities and Exchange Commission on October 3, 2001 and incorporated herein by reference).
|
||
|
4.2
|
Terms of Series A Participating Cumulative Preferred Stock of Aware, Inc. (attached as Exhibit A to the Rights Agreement filed as Exhibit 4.1 hereto).
|
||
|
4.3
|
Form of Right Certificate (attached as Exhibit B to the Rights Agreement filed as Exhibit 4.1 hereto).
|
||
|
4.4
|
Amendment No. 1 to Rights Agreement dated September 6, 2007 between Aware, Inc. and Computershare Trust Company, N.A., as Rights Agent (filed as Exhibit 4.1 to the Company’s Form 8-K filed with the Securities and Exchange Commission on September 7, 2007 and incorporated herein by reference).
|
||
|
4.5
|
Amendment No. 2 to Rights Agreement dated June 1, 2010 between Aware, Inc. and Computershare Trust Company, N.A., as Rights Agent (filed as Exhibit 4.1 to the Company’s Form 8-K filed with the Securities and Exchange Commission on June 3, 2010 and incorporated herein by reference).
|
||
|
10.1*
|
1996 Stock Option Plan, as amended and restated (filed as Annex A to the Company’s Definitive Proxy Statement filed with the Securities and Exchange Commission on April 11, 2000 and incorporated herein by reference).
|
||
|
10.2*
|
1996 Employee Stock Purchase Plan, as amended and restated (filed as Exhibit 99.1 to the Company’s Current Report on Form 8-K filed with the Securities and Exchange Commission on November 29, 2005 and incorporated herein by reference).
|
||
|
10.3*
|
Form of Director and Officer Indemnification Agreement (filed as Exhibit 10.4 to the Company’s Form 10-K for the year ended December 31, 2002 and incorporated herein by reference).
|
||
|
10.4*
|
2001 Nonqualified Stock Plan (filed as Exhibit 99(d)(4) to the Company’s Schedule TO filed with the Securities and Exchange Commission on March 3, 2003 and incorporated herein by reference).
|
55
| 10.5* | Form of Nonqualified Stock Option Agreement under the 2001 Nonqualified Stock Plan for options granted to executive officers and directors prior to May 21, 2008 (filed as Exhibit 10.6 to Company’s Form 10-K for the year ended December 31, 2006 and incorporated herein by reference). | ||
|
10.6*
|
Form of Nonqualified Stock Option Agreement under the 2001 Nonqualified Stock Plan for options granted to executive officers and directors from and after May 21, 2008 (filed as Exhibit 10.8 to Company’s Form 8-K on May 22, 2008 and incorporated herein by reference)
|
||
|
10.7*
|
Form of Unrestricted Stock Award for outside directors of Aware under the 2001 Nonqualified Stock Plan (filed as Exhibit 10.1 to Company
’
s Form 8-K filed with the Securities and Exchange Commission on July 28, 2010 and incorporated herein by reference).
|
||
|
10.8*
|
Form of Unrestricted Stock Award for officers of Aware under the 2001 Nonqualified Stock Plan (filed as Exhibit 10.2 to Company
’
s Form 8-K filed with the Securities and Exchange Commission on July 28, 2010 and incorporated herein by reference).
|
||
|
10.9
|
Asset Purchase Agreement by and between Aware, Inc. and Lantiq Broadband Holdco, Inc. and Lantiq Deutschland GmbH dated October 14, 2009 (filed as Exhibit 10.8 to Company’s Form 10-K for the year ended December 31, 2009 and incorporated herein by reference).
|
||
|
21.1
|
Subsidiaries of Registrant.
|
||
|
23.1
|
Consent of Independent Registered Public Accounting Firm.
|
||
|
31.1
|
Certification of Chief Executive Officer pursuant to Section 302 of the Sarbanes-Oxley Act of 2002.
|
||
|
31.2
|
Certification of Chief Financial Officer pursuant to Section 302 of the Sarbanes-Oxley Act of 2002.
|
||
|
32.1
|
Certification of Chief Executive Officer and Chief Financial Officer pursuant to Section 906 of the Sarbanes-Oxley Act of 2002.
|
*
Management contract or compensatory plan.
56
SIGNATURES
Pursuant to the requirements of Section 13 or 15(d) of the Securities Exchange Act of 1934, the Registrant has duly caused this report to be signed on its behalf by the undersigned, thereunto duly authorized.
| AWARE, INC. | |||
|
|
By:
|
/s/ Edmund C. Reiter | |
| Edmund C. Reiter, President and Chief Executive Officer | |||
| Date: February 11, 2011 | |||
Pursuant to the requirements of the Securities Exchange Act of 1934, this report has been signed below by the following persons on behalf of the registrant and in the capacities indicated on the 11
th
day of February 2011.
|
Signature
|
Title
|
|
|
/s/ Michael A. Tzannes
|
Executive Chairman, Director
|
|
|
Michael A. Tzannes
|
||
|
/s/ Edmund C. Reiter
|
President and Chief Executive Officer, Director
|
|
|
Edmund C. Reiter
|
(Principal Executive Officer)
|
|
|
/s/ Richard P. Moberg
|
Chief Financial Officer
|
|
|
Richard P. Moberg
|
(Principal Financial and Accounting Officer)
|
|
|
/s/ John K. Kerr
|
Director
|
|
|
John K. Kerr
|
||
|
/s/ G. David Forney, Jr.
|
Director
|
|
|
G. David Forney, Jr.
|
||
|
/s/ Adrian F. Kruse
|
Director
|
|
|
Adrian F. Kruse
|
||
|
/s/ Mark G. McGrath
|
Director
|
|
|
Mark G. McGrath
|
57
TABLE OF CONTENTS
Part IItem 1. BusinessItem 1A. Risk FactorsItem 1B. Unresolved Staff CommentsItem 2. PropertiesItem 3. Legal ProceedingsItem 4. (removed and Reserved)Part IIItem 5. Market For Registrant S Common Equity, Related Stockholder Matters and Issuer Purchases Of Equity SecuritiesItem 6. Selected Financial DataItem 7. Management S Discussion and Analysis Of Financial Condition and Results Of OperationsItem 7A. Quantitative and Qualitative Disclosures About Market RiskItem 8. Financial Statements and Supplementary DataItem 9. Changes in and Disagreements with Accountants on Accounting and Financial DisclosureItem 9A. Controls and ProceduresItem 9B. Other InformationPart IIIItem 10. Directors, Executive Officers and Corporate GovernanceItem 11. Executive CompensationItem 12. Security Ownership Of Certain Beneficial Owners and Management and Related Stockholder MattersItem 13. Certain Relationships and Related Transactions, and Director IndependenceItem 14. Principal Accountant Fees and ServicesPart IVItem 15. Exhibits and Financial Statement Schedule