AWARE INC /MA/
10-Ks and 10-Qs
|
|
|
|
|
|
|
|
|
|
|
|
|
|
|
|
|
|
|
|
|
|
|
|
|
|
|
|
|
|
|
|
|
|
|
|
|
|
|
|
|
|
|
|
|
|
|
|
|
|
|
|
|
|
|
|
|
|
|
|
|
|
|
|
|
|
|
|
UNITED STATES
SECURITIES AND EXCHANGE COMMISSION
Washington, D.C. 20549
FORM 10-K
Annual Report Pursuant to Section 13 or 15(d) of The
Securities Exchange Act of 1934
For the fiscal year ended December 31, 2011
Commission file number 000-21129
| AWARE, INC. | ||
| (Exact Name of Registrant as Specified in Its Charter) | ||
| Massachusetts | 04-2911026 | |||||
|
(State or Other Jurisdiction of
Incorporation or Organization)
|
(I.R.S. Employer Identification No.) | |||||
| 40 Middlesex Turnpike, Bedford, Massachusetts 01730 | ||
|
(Address of Principal Executive Offices)
(Zip Code)
|
||
| (781) 276-4000 | ||
|
(Registrant’s Telephone Number, Including Area Code)
|
||
Securities registered pursuant to Section 12(b) of the Act:
| Title of Each Class | Name of Each Exchange on Which Registered | |||||
| Common Stock, par value $.01 per share | The Nasdaq Global Market | |||||
| Securities registered pursuant to Section 12(g) of the Act: None | ||||||
Indicate by check mark if the registrant is a well-known seasoned issuer, as defined in Rule 405 of the Securities Act. Yes
o
No
x
Indicate by check mark if the registrant is not required to file reports pursuant to Section 13 or Section 15(d) of the Exchange Act.
Yes
o
No
x
Indicate by check mark whether the registrant (1) has filed all reports required to be filed by Section 13 or 15(d) of the Securities Exchange Act of 1934 during the preceding 12 months (or for such shorter period that the registrant was required to file such reports), and (2) has been subject to such filing requirements for the past 90 days. Yes
x
No
o
Indicate by check mark whether the registrant has submitted electronically and posted on its corporate Web site, if any, every Interactive Data File required to be submitted and posted pursuant to Rule 405 of Regulation S-T (§ 232.405 of this chapter) during the preceding 12 months (or for such shorter period that the registrant was required to submit and post such files). Yes
x
No
o
Indicate by check mark if disclosure of delinquent filers pursuant to Item 405 of Regulation S-K is not contained herein, and will not be contained, to the best of registrant’s knowledge, in definitive proxy or information statements incorporated by reference in Part III of this Form 10-K or any amendment to this Form 10-K.
o
Indicate by check mark whether the registrant is a large accelerated filer, an accelerated filer, a non-accelerated filer, or a smaller reporting company. See the definitions of “large accelerated filer”, “accelerated filer”, and “smaller reporting company” in Rule 12b-2 of the Exchange Act. (Check one):
Large Accelerated Filer
o
Accelerated Filer
x
Non-Accelerated Filer
o
Smaller Reporting Company
o
Indicate by check mark whether the registrant is a shell company (as defined in Rule 12b-2 of the Exchange Act). Yes
o
No
x
As of June 30, 2011 the aggregate market value of the registrant’s common stock held by non-affiliates of the registrant, based on the closing sale price as reported on the Nasdaq Global Market, was approximately $31,607,415.
The number of shares outstanding of the registrant’s common stock as of February 10, 2012 was 20,700,312.
DOCUMENTS INCORPORATED BY REFERENCE
Portions of the registrant’s definitive Proxy Statement to be delivered to shareholders in connection with the registrant’s Annual Meeting of Shareholders to be held on May 23, 2012 are incorporated by reference into Part III of this Annual Report on Form 10-K.
AWARE, INC.
FORM 10-K
FOR THE YEAR ENDED DECEMBER 31, 2011
TABLE OF CONTENTS
|
PART I
|
|||
|
Item 1.
|
Business
|
3
|
|
|
Item 1A.
|
Risk Factors
|
13
|
|
|
Item 1B.
|
Unresolved Staff Comments
|
20
|
|
|
Item 2.
|
Properties
|
21
|
|
|
Item 3.
|
Legal Proceedings
|
21
|
|
|
Item 4.
|
Mine Safety Disclosures
|
21
|
|
|
PART II
|
|||
|
Item 5.
|
Market for Registrant’s Common Equity, Related Stockholder Matters and Issuer Purchases of Equity Securities
|
22
|
|
|
Item 6.
|
Selected Financial Data
|
24
|
|
|
Item 7.
|
Management’s Discussion and Analysis of Financial Condition and Results of Operations
|
25
|
|
|
Item 7A.
|
Quantitative and Qualitative Disclosures About Market Risk
|
35
|
|
|
Item 8.
|
Financial Statements and Supplementary Data
|
36
|
|
|
Item 9.
|
Changes in and Disagreements with Accountants on Accounting and Financial Disclosure
|
57
|
|
|
Item 9A.
|
Controls and Procedures
|
57
|
|
|
Item 9B.
|
Other Information
|
57
|
|
|
PART III
|
|||
|
Item 10.
|
Directors, Executive Officers and Corporate Governance
|
58
|
|
|
Item 11.
|
Executive Compensation
|
58
|
|
|
Item 12.
|
Security Ownership of Certain Beneficial Owners and Management and Related Stockholder Matters
|
58
|
|
|
Item 13.
|
Certain Relationships and Related Transactions, and Director Independence
|
58
|
|
|
Item 14.
|
Principal Accountant Fees and Services
|
58
|
|
|
|
|||
|
PART IV
|
|||
|
Item 15.
|
Exhibits and Financial Statement Schedule
|
59
|
|
|
Signatures
|
61
|
||
2
Company Overview
We have been a leading supplier of innovative signal processing and digital communications technology for imaging and telecommunications applications since the early 1990s. Presently, our business operations are focused along three product lines: i) biometrics and imaging; ii) Digital Subscriber Line (“DSL”) service assurance; and iii) patent management. Prior to November 2009, we were also a supplier of DSL silicon intellectual property to the semiconductor industry.
Biometrics & Imaging.
Our biometrics software products leverage imaging and biometrics technologies developed by Aware over the past 20 years. We sell a broad range of software products that are used in biometric systems worldwide for fingerprint, facial, and iris modalities. Primary applications of biometrics systems include law enforcement, border control, secure credentialing, national defense, access control, and background checks.
Our products provide interoperable, standards-compliant, field-proven biometric functionality and are used to capture, verify, format, compress and decompress biometric images as well as aggregate, analyze, process and transport those images around biometric systems. We also offer software engineering services to customers who require assistance with the design and development of biometric solutions. Specific services may involve customization of our software, installation services, or complete system development depending on customer needs and requirements. We also sell software products for medical and digital imaging applications based upon industry standards such as JPEG 2000 and JPIP.
We sell our biometrics software products and services to a large number of customers. We reach these customers through three principal channels of distribution: i) a systems integrator channel; ii) an OEM channel; and iii) directly to end-users, such as governments, their agencies, and corporate customers.
DSL Service Assurance
. Our DSL service assurance products, which we previously called DSL test and diagnostics, leverage DSL technologies developed by Aware since the early 1990s. Our DSL expertise has been acquired as a result of: i) our involvement in the design of DSL chipsets for more than a decade; and ii) our participation in the development of DSL standards at the International Telecommunications Union. Telephone companies use DSL service assurance solutions to deliver high quality video and triple play services. Aware’s DSL service assurance solutions benefit from our Dr. DSL® Expert Technology, which leverages Aware’s deep DSL knowledge.
Our DSL service assurance products comprise software and hardware offerings. Our principal software solution is our Line Diagnostics Platform (“LDP”) product. LDP is an advanced DSL diagnostics and performance optimization solution that lets broadband service providers manage their DSL networks more effectively. Service providers use Aware’s centralized LDP software to reduce DSL operational costs, extend service reach and improve the quality of their premium triple-play services. Aware’s LDP solution puts essential DSL test and management tools into a single, multi-vendor compatible platform for use by customer care and network operations teams as well as field technicians. We sell LDP directly to telephone companies.
We also sell embedded DSL test modules that are designed for integration into DSL equipment that is used by service providers to pre-qualify, monitor and troubleshoot DSL service. We sell our modules to suppliers of such DSL equipment. Our modules are: i) compliant to ITU-T standards; ii) interoperable with all industry-leading chipsets; and iii) meet all applicable Broadband Forum performance requirements. On January 18, 2012, our Board of Directors approved the shutdown of Aware’s DSL service assurance hardware product line. This decision was made to position Aware better strategically and to reduce costs. We will continue to build and ship DSL service assurance hardware products to fulfill customer orders that were received as of the date of the shutdown notice. We expect to conclude hardware shipments on or about June 30, 2012. We plan to continue to offer our DSL service assurance software products.
3
Patent Management.
Over the past 20 years, we have actively patented the technologies we have developed. As of December 31, 2011, we had approximately 235 U.S. and foreign patents, and approximately 219 pending patent applications pertaining to communications and signal processing technologies, including DSL, DSL service assurance, wireless, biometrics and medical imaging, image compression, video compression, and seismic data compression. The objective of our patent management operations, which we previously called patent licensing operations, is to develop patents and to license or sell them to interested third parties. While we have continued to enhance and develop our patent portfolio over the past three years, patent licensing revenue during the last three years was limited to an insignificant amount of revenue in the year ended December 31, 2010.
As we have previously disclosed, our board is reviewing strategic options with respect to our patent management operations, including a potential spin-off, sale or licensing of patents.
DSL Silicon Intellectual Property.
From the mid 1990s until November 2009, we licensed DSL silicon intellectual property (“IP”) to enable semiconductor suppliers to manufacture and sell integrated circuits for the DSL industry. In November 2009, we completed a transaction with Lantiq Deutschland GmbH (“Lantiq”) involving the sale and transfer of: i) our DSL and home networking silicon IP assets, ii) certain patents, and iii) 41 Aware employees. After this sale, we no longer offered DSL or home networking silicon IP products; however, we continued to receive DSL chipset royalties from Lantiq and Ikanos Communications, Inc. (“Ikanos’). We also continued to provide a minor amount of engineering support services to Ikanos.
We have research and development activities underway to expand our product offerings and develop new technologies in biometrics and imaging as well as DSL service assurance applications.
We are headquartered in Bedford, Massachusetts. Our telephone number is (781) 276-4000, and our website is www.aware.com. Incorporated in Massachusetts in 1986, we employed 77 people as of December 31, 2011. Our stock is traded on the Nasdaq Global Market under the symbol AWRE.
Our website provides a link to a third-party website through which our annual, quarterly and current reports, and amendments to those reports, are available free of charge. We believe these reports are made available as soon as reasonably practicable after we electronically file them with, or furnish them to, the SEC. We do not maintain or provide any information directly to the third-party website, and we are not responsible for its accuracy. You may also access our various SEC filings and reports at the SEC’s website at www.sec.gov.
Industry Background
Biometrics Industry Background
. Biometric identification systems are used as a means to identify individuals for a variety of government and commercial security applications, such as law enforcement, national defense, border control, secure credentialing, access control and background checks. In the past, ink-based fingerprint cards were used to capture and analyze fingerprint images. The emergence of digital fingerprint acquisition devices, compression, and standardized biometric transaction/interchange formats in the 1990s enabled biometrics systems to identify individuals much faster and more accurately. Ink-based fingerprint cards are still used today, but are now being digitally scanned into biometric systems. Biometric matching systems are also capable of utilizing additional biometric modalities, such as iris and facial images, either in place of or in conjunction with fingerprints.
Biometrics applications generally operate on client/server-based computer networks. Enrollment workstations with peripheral capture devices are used to “enroll” individuals into biometrics systems. Either fixed enrollment workstations or mobile devices are used to capture, process, and format biometric images and then transport them in digital form to centralized matching systems for identification. Examples of capture peripherals include scanners for fingerprint images, cameras for iris and facial images, and handheld devices for mobile capture of fingerprint, iris, and facial images.
The substantial increase in computer processing power-for-price along with the development of technologies that facilitate ease of capture of high-quality biometric information have created a foundation for growing use of biometrics in both government and commercial security applications. The emergence and adoption of international biometrics standards has encouraged more participants in the market, enabling more modular and flexible solutions as opposed to “monolithic” solutions sourced from a single, large company.
The most established application for biometrics is law enforcement, where federal, state and local law enforcement agencies perform fingerprint enrollment and submission to automated fingerprint identification systems (“AFIS”). Law enforcement is expected to continue to present opportunities for vendors of biometrics products in the next several years.
4
Over the past decade, legislation has been introduced in a number of countries which mandates increased security. This legislation has driven many government programs that require the use of biometric information in applications such as e-passports, visas and personal identification cards. For example, personal identity verification (“PIV”) and other secure credentialing systems are being employed by U.S. government agencies to standardize federal employee and contractor IDs. Such systems are used to control access to government facilities and information systems.
There is also an increase in use of biometrics for border management applications, such as performing background checks on visa applicants and checking biometric watch lists as part of the customs process at international airports. The use of biometrics for background checks in regulated segments of the financial, transportation and healthcare industries has also increased. As biometric security systems gain acceptance in new areas, and as infrastructure build-outs take hold, new opportunities are emerging for biometrics solution suppliers. The biometrics market is also expected to grow as the performance of emerging biometric modalities improves.
Biometrics industry participants may be segmented into three broad categories: i) companies that provide biometric hardware and/or software solutions; ii) system integrators that bring together biometric hardware and software solutions from a variety of vendors to deliver customized biometrics systems for government and commercial customers; and iii) companies that provide biometric hardware and software solutions and are also systems integrators.
Examples of industry participants that function primarily as providers of biometrics hardware and/or software solutions include: i) Aware, Inc.; ii) Cross Match Technologies, Inc.; iii) Green Bit S.p.A.; iv) Suprema, Inc.; v) Cognitec Systems GmbH; vi) Iris ID Systems, Inc.; and vii) Iritech, Inc.
Examples of industry participants that function primarily as systems integrators include: i) Northrop Grumman Corporation; ii) Lockheed Martin Corporation; iii) Science Applications International Corporation; iv) Hewlett-Packard Enterprise Services; v) International Business Machines; vi) Fujitsu Limited; vii) Computer Science Corporation; vii) BAE Systems; viii) Accenture LTD; ix) Daon, Inc.; and x) Unisys Corporation.
Examples of industry participants that function as biometrics hardware and software solutions providers and systems integrators include: i) Safran Morpho, a division of the Safran Group Company, which now includes L1 Identity Solutions; ii) 3M Cogent Inc.; and iii) NEC Corporation.
The end users of biometrics systems are typically local, state and federal governments and their agencies. To a lesser extent, end user customers also include commercial customers who use biometric systems primarily for access control and background checks.
DSL Service Assurance Industry Background
. DSL technology allows telecommunications service providers to offer broadband services over their installed copper access networks. Today there are more than 300 million DSL subscribers worldwide. With the recent deployment of new higher rate DSL technologies, such as ADSL2+ and VDSL2, service providers can increase average revenue per user by deploying new services based on these technologies. One of the more popular of these services is triple-play voice, data and Internet Protocol television (“IPTV”).
These new services tend to be more demanding on service providers, because they require higher quality network performance and stability. A DSL subscriber line capable of supporting basic internet applications may be unable to support triple-play services because of line impairments or other disturbers that can result in sporadic service problems, degraded picture quality and dissatisfied customers. As a result, service providers are looking for enhanced DSL service assurance tools for proactive maintenance and responsive troubleshooting of their networks. DSL service assurance tools may be categorized into hardware and software solutions.
5
Hardware solutions
. There are two principal types of DSL service assurance equipment.
|
1.
|
Broadband Test Probes (also known as “testheads”) – Testheads are deployed by service providers in centralized locations, such as central offices or node-based equipment cabinets. This equipment allows them to provision or troubleshoot DSL service remotely from these central locations, which reduces the cost of sending technicians into the field.
|
|
2.
|
DSL Test Sets – Test sets are handheld devices that are used by technicians in the field to test and diagnose problems at customer premise locations.
|
DSL service assurance testhead and test set products are available from a number of suppliers, including Alcatel-Lucent (“Alcatel”); Spirent Communications PLC; Tollgrade Communications, Inc.; JDS Uniphase Corporation (“JDSU”); Sunrise Communications, Inc.; Fluke Corporation; NCI Technologies, Inc.; Exfo Inc.; and Kurth Electronic GmbH.
Software solutions.
DSL service assurance software is software that resides in a service provider’s central network. This software makes use of service providers’ installed access network elements, such as Digital Subscriber Line Access Multiplexers (“DSLAMs”) and customer premises equipment. Its purpose is to deliver DSL diagnostics and performance information that is used by customer care, technical support and network planning organizations to manage their DSL networks.
DSL service assurance software products are available from four principal suppliers, including Aware, Inc.; Alcatel; Ericsson LM Telephone Company; and Assia, Inc.
Patent Management Industry Background
. Under U.S. law, an inventor or patent owner has the right to exclude others from making, selling or using their patented inventions.
Over the past decade, a number of companies have emerged to form a robust patent licensing industry. These companies grow their patent portfolios by: i) acquiring patents from third parties, ii) developing patents of their own, or iii) through a combination of both methods. Patent licensing companies then execute patent licensing arrangements with users of their patented technologies through willing licensing negotiations without the filing of patent infringement litigation, or through the negotiation of license and settlement arrangements in connection with the filing of patent infringement litigation.
Some well-known patent licensing companies include Intellectual Ventures Management LLC, Acacia Research Corporation, Digimarc Corporation, NTP, Inc., Wi-Lan, Inc., InterDigital, Inc., Rambus Inc, and MOSAID Technologies Inc.
Aware Biometrics and Imaging Products and Services
Biometrics Software Products and Services
We supply a broad range of biometrics software products for fingerprint, facial, and iris modalities. Our products capture, verify, format, compress and decompress biometric images as well as aggregate, analyze, process and transport those images around biometric systems. Our software products are used in applications for border control, law enforcement, national defense, secure credentialing, access control, and background checks. We sell software maintenance contracts along with our software products. Software maintenance allows customers to receive: i) technical support; and ii) software updates if and when they are available.
We also offer software engineering services to customers who require assistance with the design and development of biometric solutions. Specific services may involve customization of our software, installation services, or complete system development depending on customer needs and requirements.
We have four categories of biometrics software products that range from discrete software blocks that customers use to develop their own solutions to more complete applications that customers can use to reduce or eliminate their development times. Once customers sell systems that make use of these software products, they pay us software license fees based on the number of systems they sell.
6
The four categories of our biometrics software products are described below:
|
i)
|
Software Development Kits. S
oftware development kits or (“SDKs”) consist of multiple software libraries, sample applications that show customers how to use the libraries, and documentation. Customers use our SDKs to design their own applications using our libraries. We consider these products to be commercial off-the-shelf (“COTS”) products because they are ready-made products not customized by us for any particular customer. Our SDK products and the functions they perform are:
|
|
●
|
Products for hardware abstraction, autocapture, and quality assurance:
|
|
a)
|
FastCapture with LiveScan API;
|
|
b)
|
PreFace with Camera API;
|
|
c)
|
IrisCheck with IrisCam API;
|
|
d)
|
SequenceCheck; and
|
|
e)
|
Quality Check.
|
|
●
|
Products for biometric data formatting, validation and reading
according to ANSI/NIST, ISO/IEC, INCITS, ICAO, FIPS 201, and other U.S. and international standards:
|
|
a)
|
NISTPack;
|
|
b)
|
ICAOPack;
|
|
c)
|
PIVPack; and
|
|
d)
|
M1Pack.
|
|
●
|
Products for compression and decompression of fingerprint and facial images:
|
|
a)
|
Aware WSQ; and
|
|
b)
|
Aware JPEG2000.
|
|
●
|
Products for biometric authentication:
|
|
a)
|
AwareXM; and
|
|
b)
|
BioLog.
|
|
●
|
Products for scanning and printing of fingerprint cards:
|
|
a)
|
AccuScan; and
|
|
b)
|
AccuPrint.
|
|
●
|
Products for mobile devices:
|
|
a)
|
NISTPack Mobile
|
|
b)
|
ICAOPack Mobile
|
|
c)
|
PIVPack Mobile; and
|
|
d)
|
AwareXM Mobile.
|
|
●
|
Bundles of products for specific applications:
|
|
a)
|
CaptureSuite
-
for capture of either live scan or card scan fingerprint images;
|
|
b)
|
PIVSuite – for registration, identity proofing, and ID card personalization, issuance, and reading; and
|
|
c)
|
ICAOSuite - for biometric and biographic enrollment, e-passport personalization and reading, and fingerprint verification.
|
|
ii)
|
Software components
. Our software component products each include a user interface and one or more software libraries that perform a discrete set of functions. Software components allow customers to develop biometric applications more quickly than using our SDKs. Our set of products in this category is called BioComponents. BioComponents comprises modular, independent, self-contained software components that can operate either independently or in concert with each other performing a specific biometric task. Each biometric capture component has its own configurable user interface, and performs all tasks and workflows required for capture, hardware abstraction, and quality assurance.
|
|
iii)
|
Biometric applications
. Our products in this category combine a user interface with multiple Aware software libraries into more complete biometrics applications. Our application products and the functions they perform are:
|
|
●
|
Universal Registration Client (“URC”).
URC is a configurable Windows-based application that performs a variety of biometric data capture, analysis, matching, formatting, and hardware abstraction functions.
|
|
●
|
URC Mobile
. URC Mobile is a software application for performing biometric enrollment, identification, and screening on mobile biometric devices, such as those used by military personnel in the field.
|
|
●
|
FormScannerSE and FormScannerMB
. These are two independent applications for scanning and processing of inked fingerprint cards.
|
|
●
|
Forensic Workbench
. Forensic Workbench is a software application for the categorization, processing, and standards-compliant formatting of biometric images and demographic data.
|
7
|
●
|
WebEnroll
. WebEnroll provides a reference application with applets for browser-based enrollment of biographic data, fingerprints, and facial images.
|
|
iv)
|
Server-based solutions
. Our product in this category is called Biometrics Services Platform or BioSP
TM
. This product is used to build and deploy server-based biometric data processing and workflow solutions. BioSP supports the collection of biometric images from a distributed network, and the subsequent aggregation, analysis, processing and integration of this data into larger systems.
|
Imaging Software Products
We also sell products used in applications involving medical and advanced imaging.
Medical Imaging Products
. Aware provides modular, off-the-shelf, software products that enable healthcare IT systems with advanced, high-performance processing, distribution, and display of medical images and data. Our products are designed to be used by system integrators and solution providers to enhance their offerings with advanced medical imaging features and capabilities. Our medical imaging products include:
|
●
|
AccuRad ImageShare Server is a software application that provides fast, efficient, and versatile viewing of medical images.
|
|
●
|
AccuRad REM Server collects radiation exposure estimation data, and then stores and analyzes the data as it becomes available to calculate exposure information near real-time.
|
|
●
|
AccuRad SDKs provide optimized, standards-compliant implementations of JPEG 2000 image compression standards.
|
Advanced Imaging Products
. Aware also provides the following imaging products:
|
●
|
ArchivePack is used by libraries to store and distribute large digital imagery, such as are found in historical archives. Aware technology enables images to be compressed for efficient storage and viewed remotely and efficiently over networks.
|
|
●
|
SeisPact is used by the oil exploration industry for the efficient storage and satellite transmission of seismic data from ships.
|
|
●
|
Aware’s JPEG 2000 image compression software may be used for a wide variety of applications where compression and decompression of still imagery is required.
|
Aware DSL Service Assurance Products
Aware’s DSL service assurance solutions are used by telecommunication service providers and test equipment suppliers to improve the rate, reach and quality of DSL services. Aware’s diagnostics and management software has been deployed on DSL subscriber lines around the world and our DSL embedded test hardware products have been widely deployed by industry-leading DSL test equipment vendors.
Aware’s DSL service assurance solutions benefit from our Dr. DSL® Expert Technology which leverages Aware’s deep DSL knowledge. Our DSL expertise has been acquired as a result of: i) our involvement in the design of DSL chipsets for more than a decade; and ii) our participation in the development of DSL standards at the International Telecommunications Union.
Our DSL service assurance software and hardware products are described below.
DSL Diagnostics and Management Software.
Our Line Diagnostics Platform (“LDP”) software product is an advanced DSL diagnostics and performance optimization solution that lets broadband service providers manage their DSL networks more effectively. Service providers use Aware’s centralized LDP software to reduce DSL operational costs, extend service reach and improve the quality of their premium triple-play services. Aware’s LDP solution puts essential DSL test and management tools into a single, multi-vendor compatible platform for use by customer care and network operations teams as well as field technicians.
8
DSL Test Hardware.
Our embedded DSL test modules are designed for integration into DSL testhead and test set equipment by suppliers of DSL service assurance hardware products. Our customers’ equipment is used for verification and troubleshooting of DSL access and home networking services. Our modules are: i) compliant to ITU-T standards; ii) interoperable with all industry-leading chipsets; and iii) meet all applicable Broadband Forum performance requirements. Our modules are used for triple play troubleshooting and include performance validation of Ethernet and HPNA-over-Coax home networks.
On January 18, 2012, our Board of Directors approved the shutdown of Aware’s DSL service assurance hardware product line. This decision was made to position Aware better strategically and to reduce costs. We will continue to build and ship DSL service assurance hardware products to fulfill customer orders that were received as of the date of the shutdown notice. We expect to conclude hardware shipments on or about June 30, 2012.
Aware’s Strategy
Aware’s principal strategy is to sell software products and services that deliver a strong value proposition to our customers. We have decades of experience in the biometrics, imaging and DSL industries; a broad technology foundation in signal processing image processing and communications; and long-standing relationships with channel partners and end users.
Key elements of our strategy include:
Product development strategy
. Our product strategy is to develop high quality, full-featured software products that leverage our technological strengths in signal processing, image processing and communications. We identify applications where we can exploit these technologies to develop innovative products that meet the needs of our customers. To date, this strategy has resulted in three principal product lines: i) biometrics, ii) imaging, and iii) DSL service assurance.
Biometric product line
. Our biometrics product line includes products that are used to biometrically identify individuals for applications such as law enforcement, border control, national defense, secure credentialing, access control, and background checks.
Imaging product line.
Our imaging product line includes products that are used to compress, decompress, distribute and display images for applications such as medical imaging and digital archiving.
DSL service assurance product line
. Our DSL service assurance product line includes software products that are used by service providers to pre-qualify, provision, and troubleshoot their DSL networks.
Product sales strategy
. Our product sales strategy is to employ an approach that relies on a combination of channel partners and direct sales. The sales approach used in any given sales situation depends on the circumstances of the opportunity and customer wishes.
Biometric product line
. Our biometrics products are primarily sold through an OEM channel to hardware and software solutions suppliers and through a systems integrator channel. These two channels have given us broad exposure to the global biometrics market. When the sales situation calls for a direct approach, we also sell our biometrics products directly to end-users, such as government agencies, branches of the military, and corporate customers.
Imaging product line
. Our imaging products are primarily sold to OEM suppliers who bundle our software products into their hardware products.
DSL service assurance product line
. To date, our DSL service assurance software products have been primarily sold directly to DSL services providers and OEM suppliers. In the future, we may extend our global reach by selling our DSL software products through systems integrators in regions outside of the United States.
Services strategy
. Our services strategy is to offer engineering services to customers whenever we can help them derive the greatest value from their investment in our software products. Services projects may take several forms including: i) development projects in which we use our expertise to build complete applications for customers based on our software products; ii) customization services in which we customize our software products to meet customer specifications and requirements; or iii) installation services. One of our key strategic objectives is to continue to grow the services portion of our business, particularly in our biometrics product line.
9
Patent portfolio strategy.
Over the past 20 years, we have developed a broad portfolio of intellectual property assets including US and foreign patents. We are reviewing our strategic options with respect to certain intellectual property assets, including a potential spin-off, sale, or licensing of patents. Our strategic aim is to monetize our investment in patent assets for the benefit of our stockholders.
Research and Development
Our research and development activities are focused primarily on improving our core technologies and products for our biometrics, medical imaging, and DSL service assurance product lines. As of December 31, 2011, we had an engineering staff of 46 employees, representing 60% of our total employee staff.
Our biometrics and imaging engineering activities are focused on improving software product functionality and broadening our exposure to biometrics, medical and imaging applications. During 2011, we further improved the functionality of our SDKs, components, and applications, as well as in our BioSP server-based software platform. We also introduced new biometrics software products, including BioComponents, URC Mobile, IrisCheck and FormScanner. We also introduced new medical imaging products, including AccuRad ImageShare Server WebView Module and AccuRad REM Server.
Our DSL service assurance engineering activities involve improving the functionality of our hardware and software products to support service provider requirements for service qualification, line diagnostics, network monitoring and performance optimization of advanced DSL services. During 2011, we focused on improvements to our LDP software platform for DSL test and diagnostic applications and our embedded DSL test modules.
During the years ended December 31, 2011, 2010, and 2009, research and development expenses charged to operations were $7.2 million, $8.1 million, and $11.9 million, respectively. In addition, because we provide engineering development services to our customers, a portion of our total engineering costs has been allocated to cost of services. We expect that we will continue to invest substantial funds in research and development activities.
Sales and Marketing
As of December 31, 2011, there were a total of 14 employees in our sales and marketing organization. Of this total, 7 were focused on selling biometrics and imaging software products and services; 5 were focused on selling DSL service assurance products; 1 was focused on patent management sales and licensing; and 1 was engaged in corporate marketing activities.
All of our revenue in 2011, 2010, and 2009 was derived from unaffiliated customers.
Our sales and marketing strategy varies by product line as follows:
Biometrics
– We sell our biometrics software products and services to a large number of customers. We reach these customers through three principal channels of distribution:
|
i)
|
Systems integrator channel – we sell to systems integrators that incorporate our products into biometrics systems that are delivered primarily to government end users.
|
|
ii)
|
OEM channel – we sell to hardware and software solution providers that incorporate our products into their hardware and software products. Their products are generally sold to systems integrators or government end users.
|
|
iii)
|
Direct channel – we also sell directly to governments and their agencies, as well as commercial customers.
|
No single biometrics customer represented more than 10% of our total revenue in 2011, 2010 or 2009.
10
Medical & Advanced Imaging
– We sell our medical and advanced imaging products primarily through an OEM channel to hardware and software solution providers and through a systems integrator channel. No single medical & imaging customer represented more than 10% of our total revenue in 2011, 2010 or 2009.
DSL Service Assurance
- We sell our DSL service assurance hardware products primarily through an OEM channel. We sell our DSL service assurance software products either: i) through an OEM channel to hardware and/or software solution providers; or ii) directly to telephone companies. In the future, we may also sell software products through partners, such as value added resellers.
No single DSL service assurance customer represented more than 10% of our total revenue in 2011 or 2009. In 2010, we derived approximately 11% of our total revenue from JDSU.
Patent Management
- We sell patents or license patent rights directly to third parties. Decisions involving patent transactions are typically made at senior levels within a prospective customer’s organization, and therefore we rely on presentations by our senior management to make such sales or licenses. There were no patent management customers that represented more than 10% of our total revenue in 2011, 2010 and 2009.
DSL Silicon Intellectual Property -
After the sale of our DSL silicon IP assets to Lantiq in 2009, Lantiq and Ikanos continued to sell integrated circuits based upon our licensed DSL technology. Neither customer represented more than 10% of our total revenue in 2011 or 2010. Prior to the sale to Lantiq, we derived approximately 19% of our total revenue in 2009 from Infineon, the entity from which Lantiq was spun-out.
Competition
The markets for our biometrics and imaging software products and services are competitive and uncertain. We compete against: i) other companies that provide biometric software solutions; and ii) fully diversified companies that provide biometric software solutions and also act as systems integrators. We can give no assurance that: i) our products and services will succeed in the market; ii) that we will be able to compete effectively; or iii) that competitive pressures will not seriously harm our business.
The markets for our DSL service assurance software products are competitive and uncertain. We compete against several competitors that have dedicated more resources to this market than we have. Our success depends upon our ability to market and sell our LDP software product to service providers and systems integrators in sufficient volumes to support our business. We can give no assurance that: i) LDP will succeed in the market; ii) that we will be able to compete effectively; or iii) that competitive pressures will not seriously harm our business.
The markets for our DSL service assurance hardware products are also highly competitive. Intense competition and low margins in this market were key reasons behind our decision to exit it in 2012.
Many of our biometrics, imaging and DSL service assurance competitors have significantly greater financial, technological, marketing and personnel resources than we do. We can give no assurance that our customers will continue to purchase products from us or that we will be able to compete effectively in obtaining new customers to grow our business.
Patents and Intellectual Property
We rely on a combination of nondisclosure agreements and other contractual provisions, as well as patent, trademark, trade secret and copyright law to protect our proprietary rights. We have an active program to protect our proprietary technology through the filing of patents. As of December 31, 2011, we had approximately 235 U.S. and foreign patents, and approximately 219 pending patent applications pertaining to communications and signal processing technologies, including DSL, DSL service assurance, wireless, biometrics imaging, medical imaging, image compression, video compression, and seismic data compression.
Although we have patented certain aspects of our technology, we rely primarily on trade secrets to protect our intellectual property. We attempt to protect our trade secrets and other proprietary information through agreements with our customers, suppliers, employees and consultants, and through security measures. Each of our employees is required to sign a non-disclosure and non-competition agreement. Although we intend to protect our rights vigorously, we cannot assure you that these measures will be successful. In addition, effective intellectual property protection may be unavailable or limited in certain foreign countries.
11
Third parties may assert exclusive patent, copyright and other intellectual property rights to technologies that are important to us. In the past, we have received claims from third parties suggesting that we may be obligated to license such intellectual property rights. If we were found to have infringed any third party’s patents, we could be subject to substantial damages or an injunction preventing us from conducting our business.
Manufacturing
We have outsourced the manufacture of our DSL service assurance hardware products to a single contract manufacturer located in Canada. Our internal manufacturing group, which consists of 4 employees, has been responsible for final testing and assembly those products as well as shipping to customers. As a result of our January 2012 decision to terminate the production and sale of our DSL service assurance hardware products, we intend to wind down our relationship with our contract manufacturer and phase out our internal manufacturing group on or about June 30, 2012.
Employees
At December 31, 2011, we employed 77 people, including 46 in engineering, 14 in sales and marketing, 4 in manufacturing and 13 in finance and administration. Of these employees, 74 were based in Massachusetts. None of our employees is represented by a labor union. We consider our employee relations to be good.
We believe that our future success will depend in large part on the service of our technical, sales, marketing and senior management personnel and upon our ability to retain highly qualified technical, sales and marketing and managerial personnel. We cannot assure you that we will be able to retain our key managers and employees or that we will be able to attract and retain additional highly qualified personnel in the future.
12
Some of the information in this Form 10-K contains forward-looking statements that involve substantial risks and uncertainties. You can identify these statements by forward-looking words such as “may,” “will,” “expect,” “anticipate,” “believe,” “estimate,” “continue” and similar words. You should read statements that contain these words carefully because they: (1) discuss our future expectations; (2) contain projections of our future operating results or financial condition; or (3) state other “forward-looking” information. However, we may not be able to predict future events accurately. The risk factors listed in this section, as well as any cautionary language in this Form 10-K, provide examples of risks, uncertainties and events that may cause our actual results to differ materially from the expectations we describe in our forward-looking statements. You should be aware that the occurrence of any of the events described in these risk factors and elsewhere in this Form 10-K could materially and adversely affect our business. We assume no obligation to update any forward-looking statements.
GENERAL BUSINESS RISKS
Our Quarterly Results are Unpredictable and May Fluctuate Significantly
Our quarterly revenue and operating results are difficult to predict and may fluctuate significantly from quarter-to-quarter due to the unpredictably of our revenue components.
Product revenue.
It is difficult for us to make accurate forecasts of product revenue, because sales of products fluctuate based upon demand by our customers, which is difficult to predict. We generally ship customer orders as we receive them, and, therefore, we have no meaningful backlog of product orders.
Services revenue
. It is difficult for us to predict when we will receive services contracts from new and existing customers and when we will deliver the related services under those contracts.
Royalty revenue
. It is also difficult for us to make accurate forecasts of DSL chipset royalty revenue. Royalties are typically recognized in the quarter when we receive a report from a customer detailing sales and royalties due from the prior quarter. Royalties depend upon customer revenues which can be affected by factors beyond our ability to control or assess in advance. These factors include our customers’ ability to generate sales and fluctuating sales volumes and prices of products containing our technology.
Our business is subject to a variety of risks, which could materially adversely affect quarterly and annual operating results, including:
|
●
|
market acceptance of our products;
|
|
●
|
fluctuations in the demand for our products;
|
|
●
|
competitive pressures resulting in lower product revenues;
|
|
●
|
the loss of a significant OEM or system integrator customer relationship;
|
|
●
|
the loss by one of our OEM customers or one of its significant customers;
|
|
●
|
the termination of a significant services project by a customer;
|
|
●
|
announcements or introductions of new technologies or products by us or our competitors;
|
|
●
|
delays or problems in the introduction or performance of enhancements or of future generations of our technology;
|
|
●
|
failures or problems in our hardware or software products;
|
|
●
|
pricing pressure from our competitors in the markets in which we compete;
|
|
●
|
delays in the adoption of new industry standards or changes in market perception of the value of new or existing standards;
|
|
●
|
personnel changes, particularly those involving engineering, technical, sales and marketing personnel;
|
|
●
|
costs associated with protecting our intellectual property;
|
|
●
|
the potential that customers could fail to make payments under their agreements with us;
|
|
●
|
new laws, changes to existing laws, or regulatory developments; and
|
|
●
|
general economic trends and other factors.
|
13
As a result of these factors, we believe that period-to-period comparisons of our revenue levels and operating results are not necessarily meaningful. You should not rely on our quarterly revenue and operating results to predict our future performance.
We Have Experienced Net Losses
We had operating and net losses in 2001, 2002, 2003, 2004, and 2005, and operating losses in 2006, 2007, 2009, and 2010. We may experience losses in the future if the markets in which we participate decline, if our customers do not purchase our products in sufficient volumes, or if our royalty revenue declines.
We Continue to Receive DSL Chipset Royalty Revenue; However Future Royalty Revenue May Decline Because of Factors That Are Beyond Our Control
We sold substantially all of the assets associated with our DSL chipset licensing product line to Lantiq in 2009. Under the terms of our agreements with Lantiq, we continue to receive royalties for DSL chipsets Lantiq sells. We also continue to derive royalties from Ikanos as our Ikanos agreement remained in effect after the sale to Lantiq. Future royalties we may receive from Lantiq and Ikanos are influenced by factors that are beyond our control, including:
|
●
|
The competitiveness of DSL chipsets offered by Lantiq and Ikanos and the willingness of their customers to purchase DSL chipsets from them;
|
|
●
|
The promotional and marketing efforts of Lantiq and Ikanos; and
|
|
●
|
DSL market risks in general, including: i) industry wide chipset demand; and ii) competitive pressures and cyclical demand for DSL chipsets, which may result in reduced average selling prices and channel inventory build-up.
|
Any or all of these factors may cause our royalty revenue to decline in the future.
Our Business is Subject to Rapid Technological Change
The biometrics, imaging, and DSL service assurance industries are characterized by rapid technological change and uncertainty. In these industries, new generations of products are introduced regularly and evolutionary improvements to existing products are required. Therefore, we face risks that others could introduce competing technologies and products that render our technologies and products less desirable or obsolete. Also, the announcement of new technologies and products could cause: i) our customers to delay purchasing our products; or ii) our customers’ customers to delay purchasing OEM products that incorporate our products. Either of these events could seriously harm our business.
We expect that our business will depend to a significant extent on our ability to introduce new generations of products as well as new technologies and products that keep pace with changes in these industries. We must continually devote significant engineering resources to achieving technical innovations and product developments. These developments are complex and require long development cycles. Moreover, we may have to make substantial investments in technological innovations and product developments before we can determine their commercial viability. We may lack sufficient financial resources to fund future development. Revenue from technological innovations, even if successfully developed, may not be sufficient to recoup the costs of development.
Our Intellectual Property is Subject to Limited Protection
Because we are a technology provider, our ability to protect our intellectual property and to operate without infringing the intellectual property rights of others is critical to our success. We regard our technology as proprietary. Our patent portfolio includes approximately 235 U.S. and foreign patents as well as approximately 219 pending patent applications. We also rely on a combination of trade secrets, copyright and trademark law and non-disclosure agreements to protect our unpatented intellectual property. Despite these precautions, it may be possible for a third party to copy or otherwise obtain and use our technology without authorization.
14
We typically work closely with our customers, who may also be potential competitors, and provide them with proprietary know-how. Although our agreements contain non-disclosure provisions and other terms protecting our proprietary know-how and technology rights, it is possible that, despite these precautions, some of our customers might obtain from us proprietary information that they could use to compete with us in the marketplace. Although we intend to defend our intellectual property as necessary, the steps we have taken may be inadequate to prevent misappropriation.
In the future, we may be involved in legal action to enforce our intellectual property rights relating to our patents, copyrights or trade secrets. Any such litigation could be costly and time-consuming for us, even if we were to prevail. Moreover, even if we are successful in protecting our proprietary information, our competitors may independently develop technologies substantially equivalent or superior to our technology. The misappropriation of our technology or the development of competitive technology could seriously harm our business.
Our technology, software or hardware may infringe the intellectual property rights of others. A large and increasing number of participants in the technology industry, including companies known as non-practicing entities or NPEs, have applied for or obtained patents. Some of these patent holders have demonstrated a readiness to commence litigation based on allegations of patent and other intellectual property infringement. Third parties may assert patent, copyright and other intellectual property rights to technologies that are important to our business. In the past, we have received claims from other companies that our technology infringes their patent rights. Intellectual property rights can be uncertain and can involve complex legal and factual questions. We may infringe the proprietary rights of others, which could result in significant liability for us. If we were found to have infringed any third party’s patents, we could be subject to substantial damages or an injunction preventing us from conducting our business.
Our Business May Be Adversely Affected By Our Use of Open Source Software
The software industry is making increasing use of open source software in the development of products. We also integrate certain open source software components from third parties into our software. Open source licenses may require that the software code in those components or the software into which they are integrated be freely accessible under open source terms. While we take precautions to protect open source software, we cannot exclude the possibility that third-party claims may require us to make freely accessible under open source terms a product of ours or non-Aware software upon which we depend. If we were required to make our software freely available, our business could be seriously harmed.
Our Business May Be Affected by Government Regulations
Extensive regulation by federal, state, and foreign regulatory agencies could adversely affect us in ways that are difficult for us to predict. In addition, our business may also be adversely affected by: i) the imposition of tariffs, duties and other import restrictions on components we purchase from non-domestic suppliers; or ii) by the imposition of export restrictions on products we sell internationally. Changes in current or future laws or regulations, in the United States or elsewhere, could seriously harm our business.
Adverse Economic Conditions Could Harm Our Business
Unfavorable changes in economic conditions, including recessions, inflation, turmoil in financial markets, or other changes in economic conditions, could harm our business, results of operations, and financial conditions as a result of:
|
●
|
reduced demand for our products or our customers’ products that incorporate our technology;
|
|
●
|
increased risk of order cancellations or delays;
|
|
●
|
increased pressure on the prices for our products or our customers’ products that incorporate our technology;
|
|
●
|
greater difficulty in collecting accounts receivable; and
|
|
●
|
risks to our liquidity, including the possibility that we might not have access to our cash when needed.
|
15
We are unable to predict the timing, duration, and severity of any such adverse economic conditions in the U.S. and other countries, but the longer the duration, the greater the risks we face in operating our business.
We Must Make Judgments in the Process of Preparing Our Financial Statements
We prepare our financial statements in accordance with generally accepted accounting principles and certain critical accounting policies that are relevant to our business. The application of these principles and policies requires us to make significant judgments and estimates. In the event that judgments and estimates we make are incorrect, we may have to change them, which could materially affect our financial position and results of operations.
Moreover, accounting standards have been subject to rapid change and evolving interpretations by accounting standards setting organizations over the past few years. The implementation of new standards requires us to interpret and apply them appropriately. If our current interpretations or applications are later found to be incorrect, our financial position and results of operations could be materially affected.
If We are Unable to Maintain Effective Internal Controls Over Financial Reporting, Investors Could Lose Confidence In The Reliability of Our Financial Statements, Which Could Result In a Decline in the Price of Our Common Stock
As a public company, we are required to enhance and test our financial, internal and management control systems to meet obligations imposed by the Sarbanes-Oxley Act of 2002. Consistent with the Sarbanes-Oxley Act and the rules and regulations of the SEC, management’s assessment of our internal controls over financial reporting and the audit opinion of our independent registered accounting firm as to the effectiveness of our controls is required in connection with our filing of our Annual Report on Form 10-K. If we are unable to identify, implement and conclude that we have effective internal controls over financial reporting or if our independent auditors are unable to conclude that our internal controls over financial reporting are effective, investors could lose confidence in the reliability of our financial statements, which could result in a decrease in the value of our common stock. Our assessment of our internal controls over financial reporting may also uncover weaknesses or other issues with these controls that could also result in adverse investor reaction.
Our Stock Price May Be Extremely Volatile
Volatility in our stock price may negatively affect the price you may receive for your shares of common stock and increases the risk that we could be the subject of costly securities litigation. The market price of our common stock has fluctuated substantially and could continue to fluctuate based on a variety of factors, including:
|
●
|
quarterly fluctuations in our operating results;
|
|
●
|
changes in future financial guidance that we may provide to investors and public market analysts;
|
|
●
|
changes in our relationships with our customers;
|
|
●
|
announcements of technological innovations or new products by us, our customers or our competitors;
|
|
●
|
changes in the growth rates of the markets in which we participate as well as investor perceptions regarding the investment opportunity that companies participating in the those markets afford them;
|
|
●
|
changes in earnings estimates by public market analysts;
|
|
●
|
key personnel losses;
|
|
●
|
sales of our common stock;
|
|
●
|
our stock repurchase activities;
|
|
●
|
corporate actions we may initiate, such as spin-offs or other corporate reorganizations; and
|
|
●
|
developments or announcements with respect to industry standards, patents or proprietary rights.
|
In addition, the equity markets have experienced volatility that has particularly affected the market prices of equity securities of many high technology companies and that often has been unrelated or disproportionate to the operating performance of such companies. These broad market fluctuations may adversely affect the market price of our common stock.
16
BIOMETRICS & IMAGING PRODUCT LINE RISKS
Our Biometrics & Imaging Product Line Faces Intense Competition
The markets for our biometrics and imaging products and services are competitive and uncertain. Many of our biometric software competitors have significantly greater financial, technological, marketing and personnel resources than we do. We also face intense competition from internal development teams within potential customers and from low cost competitors in developing and other foreign countries. We must convince potential customers to purchase products and services from us rather than develop software or perform services internally. Furthermore, customers, who have already purchased from us, may choose to stop purchasing our software and develop their own software.
In addition, announcements or introductions of new technologies or products by our competitors may adversely affect our business.
Biometrics & Imaging Software Business Risks
Our biometrics and imaging software business is subject to a variety of additional risks, which could materially adversely affect our revenue and operating results, including:
|
●
|
market acceptance of our biometric and imaging technologies and products;
|
|
●
|
changes in contracting practices of government or law enforcement agencies;
|
|
●
|
the failure of the biometrics and imaging markets to continue to grow;
|
|
●
|
delays or problems in the introduction or performance of enhancements or of future generations of our technology;
|
|
●
|
reduced government funding of biometrics programs by the United States and foreign governments;
|
|
●
|
low cost products from competitors in developing and other foreign countries;
|
|
●
|
failures or problems in our biometrics and imaging software products;
|
|
●
|
delays in the adoption of new industry biometric standards or changes in market perception of the value of new or existing standards;
|
|
●
|
growth of proprietary biometric systems which do not conform to industry standards;
|
|
●
|
competitive pressures resulting in lower software product revenues;
|
|
●
|
the availability of free open source software that competes with our software products;
|
|
●
|
personnel changes, particularly those involving engineering, technical and sales and marketing personnel;
|
|
●
|
the ability to identify and hire qualified engineering, technical and sales and marketing personnel;
|
|
●
|
costs associated with protecting our intellectual property;
|
|
●
|
litigation by third parties for alleged infringement of their proprietary rights;
|
|
●
|
the potential that customers could fail to make payments under their current contracts;
|
|
●
|
new laws, changes to existing laws, or regulatory developments; and
|
|
●
|
general economic trends and other factors.
|
Biometrics Services Business Risks
Our biometrics services business is subject to additional risks, which could materially adversely affect our revenue and operating results, including:
|
●
|
our ability to structure and price engineering services contracts in a manner that is consistent with our business model;
|
|
●
|
our ability to structure ourselves to successfully bid on U.S. government contracts and meet the requirements of U.S. contracting rules and regulations;
|
|
●
|
our ability to deliver contract milestones: i) in a timely and cost efficient manner, and ii) in a form and condition acceptable to customers;
|
|
●
|
the risk that customers could terminate projects; and
|
|
●
|
the potential that customers could fail to make payments under their service contracts.
|
17
DSL SERVICE ASSURANCE PRODUCT LINE RISKS
Preface to DSL Service Assurance Product Line Risks.
Our DSL service assurance product line consists of hardware and software products, which have different risk characteristics. The risk factors associated with hardware and software products are delineated separately below.
DSL SERVICE ASSURANCE HARDWARE PRODUCT RISKS
Our Decision To Terminate The Production and Sale of DSL Service Assurance Hardware Products Exposes Us to Certain Exit Costs, Obligations and Risks
On January 18, 2012, our Board of Directors approved the shutdown of Aware’s DSL service assurance hardware product line. We will continue to build and ship DSL service assurance hardware products to fulfill customer orders that were received as of the date of the shutdown notice. We expect to conclude hardware shipments on or about June 30, 2012.
While we have developed an exit plan to conduct an orderly exit from this product line, we may be exposed to certain risks, some of which may be difficult to predict. These potential risks may include, but are not limited to, the following:
|
●
|
The risk that we may be unable to fulfill last time purchase rights under customer contracts;
|
|
●
|
The risk that we may have to provide post termination warranty and customer support;
|
|
●
|
The risk associated with employee terminations, including severance costs;
|
|
●
|
The risk that a portion of our inventory may be excess or obsolete; and
|
|
●
|
The risk that hardware customers may not pay their invoices to us.
|
Should any of the risks described above come to fruition, our results of operations and financial position may be adversely affected.
DSL SERVICE ASSURANCE SOFTWARE PRODUCT RISKS
Our Success as a Supplier of DSL Service Assurance Software Products Depends on Our Ability to Sell Our Line Diagnostics Product to DSL Service Providers
Our two principal DSL service assurance software products are: i) our Line Diagnostics Platform (“LDP”) product; and ii) our Dr. DSL product. We believe that our success as a supplier of DSL service assurance software depends on our ability to sell our LDP software product to DSL service providers. If we fail to sell LDP in sufficient volumes by obtaining new DSL service providers or maintaining current customer relationships, our business could be seriously harmed.
Our DSL Service Assurance Software Products, and LDP in Particular, Face Intense Competition
The DSL service assurance market into which we sell our DSL service assurance software products is competitive. In particular, we face intense competition from several competitors who compete against our LDP product. These competitors have more mature product offerings, larger market shares, and larger sales organizations than we do. Our ability to effectively compete against these competitors and others who may enter the market depends in large part on our ability:
|
●
|
to develop our LDP product so that it can compete against product offerings from Alcatel, Assia, and others;
|
|
●
|
to market and sell LDP to DSL service providers;
|
|
●
|
to scale LDP so that it operates effectively in DSL service provider networks; and
|
|
●
|
to provide effective customer service and support.
|
18
We can give no assurance that we will be able to compete effectively in this market or that competitive pressures will not seriously harm our business.
There Are a Limited Number of Customers to Which We Can Sell Our DSL Service Assurance Software Products, Therefore Our Success Depends on a Small Number of Customers
There are a relatively limited number of DSL service providers to which we can sell our LDP software product in a manner consistent with our business model. Such customers are limited to telephone company service providers who: i) maintain DSL networks and ii) wish to use software solutions instead of hardware solutions to maintain those networks. Once a service provider decides to adopt a DSL service assurance software product from a supplier, they generally deploy that one solution instead of multiple solutions from multiple vendors thereby reducing the possibility of future sales to that customer. In addition, our current and prospective service provider customers may use their superior size and bargaining power to demand terms that are unfavorable to us.
There are also a limited number of OEM suppliers to which we can sell our Dr. DSL software. If we fail to maintain relationships with our current OEM customers or fail to establish relationships with new customers, our business could be seriously harmed. In addition, our current and prospective OEM customers may use their superior size and bargaining power to demand terms that are unfavorable to us.
The Success of Our DSL Service Assurance Software Products, and LDP in Particular, Depends On Our Ability to Develop Commercially Viable Products in a Timely Fashion
Our success in developing and introducing new and enhanced DSL service assurance products depends on the ability of our engineering organization to design and develop such products. Because of the complexity of our software products, it may take us a significant amount of time to develop new products. Moreover, such products must be commercially viable in terms of their features and pricing. If we cannot successfully introduce new commercially viable products on a timely basis, our business could be seriously harmed.
If Our DSL Service Assurance Software Products Have Other Quality Problems, Our Business Could Be Harmed
If our DSL service assurance software products have actual or perceived reliability, quality, functionality or other problems, we may suffer reduced orders, inability to recognize revenue, delays in collecting accounts receivable, higher service costs, and higher support and related costs among other effects. We believe that the acceptance, timely delivery and customer satisfaction of our DSL service assurance software products is important to our future financial results. As a result, any inability to correct any technical, reliability, or other difficulties or to deliver our products on a timely basis meeting customer requirements could damage our relationships and reputation with current and prospective customers, which would harm our revenues and operating results.
19
PATENT MANAGEMENT PRODUCT LINE RISKS
Our Ability to Obtain, Sell, License, or Enforce Patents Could be Affected by New Laws, Regulations or Rules
We intend to pursue the license or sale of patents in our patent portfolio. Our patent portfolio includes approximately 235 U.S. and foreign patents as well as approximately 219 pending patent applications. We also have an active program to protect our proprietary technology through the filing of additional patents. New laws, regulations or rules implemented either by Congress, the United States Patent and Trademark Office, foreign patent offices, or the courts that impact the patent application process, the patent enforcement process or the rights of patent holders could significantly increase our expenses related to patent prosecution or decrease revenues associated with our patents.
There Can Be No Assurance That We Will Be Able To Successfully Monetize Our Patent Assets
In September 2010, we announced a possible transaction involving our patent management operations. There can be no assurance as to the timing of a possible transaction with respect to our patent management operations, whether it will ultimately be structured as a spin-off, sale, or license or whether such a transaction will be completed.
Not applicable.
20
We believe that our existing facilities are adequate for our current needs and that additional space sufficient to meet our needs for the foreseeable future will be available on reasonable terms. We currently occupy approximately:
|
1.
|
72,000 square feet of office space in Bedford, Massachusetts, which serves as our headquarters. This site is used for our research and development, sales and marketing, and administrative activities. We own this facility.
|
|
2.
|
578 square feet of office space in Orinda, California. This facility is currently leased for a 3-year term, which expires on September 30, 2013.
|
From time to time we are involved in litigation incidental to the conduct of our business. We are not party to any lawsuit or proceeding that, in our opinion, is likely to seriously harm our business.
Not applicable.
21
Our common stock is the only class of stock we have outstanding, and it trades on the Nasdaq Global Market under the symbol AWRE. The following table sets forth the high and the low sales prices of our common stock as reported on the Nasdaq Global Market for the periods indicated from January 1, 2010 to December 31, 2011.
|
First
|
Second
|
Third
|
Fourth
|
|||||||||||||
|
Quarter
|
Quarter
|
Quarter
|
Quarter
|
|||||||||||||
|
2011
|
||||||||||||||||
|
High
|
$ | 4.25 | $ | 3.65 | $ | 3.59 | $ | 3.20 | ||||||||
|
Low
|
2.80 | 2.84 | 2.61 | 2.36 | ||||||||||||
|
2010
|
||||||||||||||||
|
High
|
$ | 2.95 | $ | 2.72 | $ | 2.70 | $ | 3.00 | ||||||||
|
Low
|
2.31 | 2.08 | 2.04 | 2.57 | ||||||||||||
As of February 10, 2012, we had approximately 126 shareholders of record. This number does not include shareholders from whom shares were held in a “nominee” or “street” name. We have never paid cash dividends on our common stock and we anticipate that we will continue to reinvest any earnings to finance future operations.
We did not sell any equity securities that were not registered under the Securities Act of 1933 during the three months ended December 31, 2011.
22
Performance Graph
The following performance graph compares the performance of Aware’s cumulative stockholder return with that of a broad market index, the Nasdaq Composite Index, and a published industry index, the RDG Technology Composite Index. The cumulative stockholder returns for shares of Aware’s common stock and for the market and industry indices are calculated assuming $100 was invested on December 31, 2006. Aware paid no cash dividends during the periods shown. The performance of the market and industry indices is shown on a total return, or dividends reinvested, basis.
COMPARISON OF 5 YEAR CUMULATIVE TOTAL RETURN*
Among Aware, Inc., the NASDAQ Composite Index, and the RDG Technology Composite Index
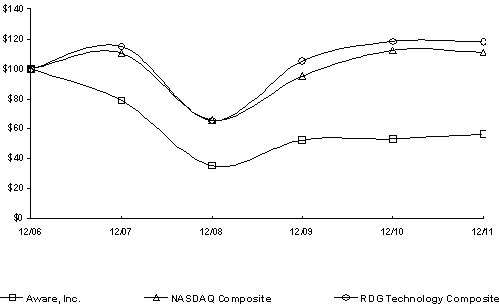
|
|
|
*$100 invested on 12/31/06 in stock or index, including reinvestment of dividends.
Fiscal year ending December 31.
|
|
Value of Investment ($)
|
||||||||||||||||||||||||
|
12/31/06
|
12/31/07
|
12/31/08
|
12/31/09
|
12/31/10
|
12/31/11
|
|||||||||||||||||||
|
Aware, Inc.
|
$ | 100.00 | $ | 78.80 | $ | 35.08 | $ | 52.53 | $ | 53.28 | $ | 56.29 | ||||||||||||
|
Nasdaq Composite Index
|
100.00 | 110.26 | 65.65 | 95.19 | 112.10 | 110.81 | ||||||||||||||||||
|
RDG Technology Composite
|
100.00 | 115.01 | 65.30 | 105.06 | 118.52 | 118.29 | ||||||||||||||||||
23
In the table below, we provide you with our selected consolidated financial data. We have prepared this information using our audited consolidated financial statements for the years ended December 31, 2011, 2010, 2009, 2008, and 2007. When you read this selected financial data, it is important that you read it along with Management’s Discussion and Analysis of Financial Condition and Results of Operations, our historical consolidated financial statements, and the related notes to the financial statements, which can be found in Item 8.
|
Year ended December 31,
|
2011
|
2010
|
2009
|
2008
|
2007
|
|||||||||||||||
|
(in thousands, except per share data)
|
||||||||||||||||||||
|
Statements of Operations Data
|
||||||||||||||||||||
|
Revenue
|
$ | 24,586 | $ | 23,560 | $ | 22,042 | $ | 30,517 | $ | 26,437 | ||||||||||
|
Income (loss) from operations
|
2,486 | (333 | ) | (5,482 | ) | 629 | (1,830 | ) | ||||||||||||
|
Gain on sale of assets
|
- | - | 6,230 | - | - | |||||||||||||||
|
Net income
|
2,567 | 180 | 982 | 1,776 | 160 | |||||||||||||||
|
Net income per share – basic
|
$ | 0.12 | $ | 0.01 | $ | 0.05 | $ | 0.08 | $ | 0.01 | ||||||||||
|
Net income per share – diluted
|
$ | 0.12 | $ | 0.01 | $ | 0.05 | $ | 0.07 | $ | 0.01 | ||||||||||
|
Balance Sheet Data
|
||||||||||||||||||||
|
Cash and short-term investments
|
$ | 46,577 | $ | 39,949 | $ | 39,669 | $ | 45,516 | $ | 38,055 | ||||||||||
|
Working capital
|
48,069 | 43,818 | 42,209 | 47,288 | 45,031 | |||||||||||||||
|
Total assets
|
57,851 | 53,400 | 51,454 | 57,546 | 56,383 | |||||||||||||||
|
Total liabilities
|
3,276 | 3,517 | 3,094 | 3,023 | 3,147 | |||||||||||||||
|
Total stockholders’ equity
|
54,575 | 49,883 | 48,360 | 54,523 | 53,236 | |||||||||||||||
24
RESULTS OF OPERATIONS
The following table sets forth, for the years indicated, certain line items from our consolidated statements of operations stated as a percentage of total revenue:
|
Year ended December 31,
|
||||||||||||
|
Revenue:
|
2011
|
2010
|
2009
|
|||||||||
|
Product sales
|
74 | % | 80 | % | 70 | % | ||||||
|
Services
|
17 | 9 | 21 | |||||||||
|
Royalties
|
9 | 11 | 9 | |||||||||
|
Total revenue
|
100 | 100 | 100 | |||||||||
|
Costs and expenses:
|
||||||||||||
|
Cost of product sales
|
15 | 19 | 13 | |||||||||
|
Cost of services
|
7 | 3 | 13 | |||||||||
|
Research and development
|
30 | 34 | 54 | |||||||||
|
Selling and marketing
|
18 | 18 | 22 | |||||||||
|
General and administrative
|
20 | 27 | 23 | |||||||||
|
Total costs and expenses
|
90 | 101 | 125 | |||||||||
|
Income (loss) from operations
|
10 | (1 | ) | (25 | ) | |||||||
|
Gain on sale of assets
|
- | - | 28 | |||||||||
|
Other income
|
- | 2 | - | |||||||||
|
Interest income
|
- | - | 1 | |||||||||
|
Income before provision for income taxes
|
10 | 1 | 4 | |||||||||
|
Provision for income taxes
|
- | - | - | |||||||||
|
Net income
|
10 | % | 1 | % | 4 | % | ||||||
Summary of Operations
.
We have been a supplier of signal processing and digital communications technology for imaging and telecommunications applications since the early 1990s. Presently, our business operations are focused along three product lines: i) biometrics and imaging; ii) DSL service assurance; and iii) patent management. Prior to November 2009, we were also a supplier of DSL silicon intellectual property to the semiconductor industry.
Biometrics & Imaging.
Our biometrics products consist of software and services used in biometric systems, and our imaging products consist of software used primarily in medical imaging applications. Biometrics systems are used in applications such as law enforcement, border control, national defense, secure credentialing, access control and background checks. We typically sell our biometrics software and services to: i) systems integrators that incorporate our software products into biometrics systems that they are developing on behalf of their customers; ii) OEMs that incorporate our products into their biometrics hardware and software solutions; and iii) directly to government agencies that are deploying biometrics systems. Our imaging software is primarily sold to OEMs and systems integrators that incorporate our software into their medical and imaging products.
DSL Service Assurance.
Our DSL service assurance products, which we previously called DSL test and diagnostics, consist of DSL software and hardware products that are used by telephone companies to improve the quality of their DSL service offerings. We sell our DSL service assurance software products through OEMs and directly to telephone companies. Our DSL service assurance hardware products are typically sold to OEMs that incorporate our modules into their automated testhead and handheld test equipment. Our OEM customers sell their equipment to telephone companies.
25
On January 18, 2012, our Board of Directors approved the shutdown of Aware’s DSL service assurance hardware product line. This decision was made to position Aware better strategically and to reduce costs. This decision had no impact on our results of operations for the three years ended December 31, 2011, 2010, or 2009.
In the year ended December 31, 2011, revenue and expenses directly attributable to the DSL service assurance hardware product line were $5.1 million and $5.7 million, respectively. Direct expenses include cost of goods sold, engineering and sales expenses. In 2012, we will continue to build and ship DSL service assurance hardware products to fulfill customer orders that were received as of the date of the shutdown notice. Therefore, DSL hardware revenue and expenses will continue in 2012 until we complete the shutdown, which we anticipate will be on or about June 30, 2012. We estimate that exiting this product line will produce an insignificant gain during the first half of 2012. The estimated gain consists of revenue from final hardware shipments less the following costs: i) cost of goods sold, ii) engineering and sales expenses to support final product shipments, and iii) one-time costs related to the shutdown of approximately $282,000, the majority of which are severance and employee-related costs.
Patent Management
. The objective of our patent management operations, which we previously called patent licensing operations, is to develop patents and to license or sell them to third parties interested in acquiring such patent rights. There were no patent related fees in revenue in the years ended December 31, 2011 and 2009. There were $330,000 of such fees in services revenue for the year ended December 31, 2010. As of the date of this report, our board is reviewing strategic options with respect to our patent management operations, including a potential spin-off, sale, or licensing of patents.
DSL Silicon Intellectual Property.
In November 2009, we completed a transaction with Lantiq Deutschland GmbH (“Lantiq”) involving the sale and transfer of: i) our DSL and home networking technology assets, ii) certain patents and patent applications related to those technology assets, and iii) 41 Aware employees. After this sale, we no longer offered DSL or home networking silicon IP products; however, we continued to receive DSL chipset royalties from Lantiq and Ikanos Communications, Inc. (“Ikanos’) and provide a minor amount of engineering support services to Ikanos.
Our results of operations for the years ended December 31, 2011, 2010, and 2009 include the following elements of DSL Silicon Intellectual Property revenue: i) royalty revenue from Lantiq and Ikanos in 2011, 2010, and 2009; ii) engineering services to Ikanos in 2011, 2010, and 2009; and iii) engineering services to Lantiq in 2009.
Summary of Financial Results
.
For the year ended December 31, 2011, we had net income of $2.6 million, or $0.12 per share. For the year ended December 31, 2010, we had net income of net income of $180,000, or $0.01 per share. For the year ended December 31, 2009, we had net income of $982,000, or $0.05 per share.
2011 compared to 2010
. There was a significant improvement in operating income and net income in 2011 compared to 2010. Operating income increased from a loss of $333,000 in 2010 to income of $2.5 million in 2011; and net income increased from $180,000 in 2010 to $2.6 million in 2011. Higher earnings in 2011 were primarily a result of the following factors: i) growth of our services business; ii) a greater proportion of software revenue versus hardware revenue in product sales during 2011; iii) lower legal fees related to patents and patent monetization activities; and iv) lower director and officer compensation expenses.
2010 compared to 2009
. There was also a significant improvement in operating income in 2010 compared to 2009, although net income declined. Net income for the year ended December 31, 2009 included a $6.2 million gain on the sale of assets, which was the primary reason for our profitability in 2009. However, operating losses were reduced from a loss of $5.5 million in 2009 to a loss of $333,000 in 2010. The $5.1 million improvement was primarily attributable to: i) the cessation of operating losses from our DSL Silicon IP product line as a result of the sale to Lantiq in 2009, and ii) improved profitability in our DSL service assurance product line. These factors were partially offset by increased legal fees related to patents and patent monetization activities.
Product Sales
Product sales consist primarily of revenue from the sale of hardware and software products. Hardware products consist primarily of DSL service assurance modules. Software products consist of software products, including maintenance contracts, for biometrics, medical imaging, and DSL service assurance applications.
26
Product sales decreased 4% from $18.9 million in 2010 to $18.1 million in 2011. As a percentage of total revenue, product sales decreased from 80% in 2010 to 74% in 2011. The dollar decrease in product sales was primarily due to a $1.4 million decrease in revenue from the sale of DSL service assurance hardware, and a $0.8 million decrease in revenue from the sale of DSL service assurance software. The decrease in DSL service assurance hardware and software revenue was partially offset by a $1.4 million increase in revenue from the sale of biometrics software.
The $1.4 million decrease in DSL hardware revenue was mainly attributable to the lack of availability of our next generation hardware products. The $0.8 million decrease in DSL software revenue was primarily due to lower sales of our LDP software. The $1.4 million increase in revenue from the sale of biometrics software was primarily due to a number of larger-sized license transactions with OEMs, systems integrators and end users in 2011.
Product sales increased 23% from $15.4 million in 2009 to $18.9 million in 2010. As a percentage of total revenue, product sales increased from 70% in 2009 to 80% in 2010. The dollar increase in product sales was primarily due to a $3.7 million increase in revenue from the sale of DSL service assurance hardware and software, which was partially offset by a $0.2 million decrease in revenue from the sale of biometrics software.
The $3.7 million increase in revenue from the sale of DSL service assurance products was mainly attributable to: 1) a $1.2 million increase in software revenue as a result of the sale of our LDP software to two European telephone companies; and 2) a $2.5 million increase in hardware revenue, which was driven by: i) sales to an OEM customer selling handheld test devices into large telephone companies, and ii) the introduction of new products. The $0.2 million decrease in revenue from the sale of biometrics software was primarily due to fewer larger-sized sales to individual customers in 2010 as compared to the prior year.
On January 18, 2012, our Board of Directors approved the shutdown of our DSL service assurance hardware product line. Revenue attributable to this product line was $5.1 million, $6.4 million, and $3.9 million in the three years ended December 31, 2011, 2010 and 2009, respectively. We will continue to build and ship DSL service assurance hardware products to fulfill customer orders that were received as of the date of the shutdown notice. We expect to conclude hardware shipments on or about June 30, 2012.
Services
Services, which we previously called “Contract Revenue,” primarily consist of engineering service fees related to: i) our biometrics product line; and ii) our DSL service assurance product line. Services revenue in 2009 also included a significant amount of engineering fees related to DSL silicon IP contracts, which was reduced dramatically in 2010 and 2011 as result of the sale to Lantiq in November 2009.
Services increased 116% from $2.0 million in 2010 to $4.3 million in 2011. As a percentage of total revenue, services increased from 9% in 2010 to 17% in 2011. The services dollar increase was primarily due to a $2.6 million revenue increase from the sale of biometrics engineering services. One of our strategic objectives over the last few years has been to increase revenue from biometrics engineering projects. Services revenue in 2011 reflects progress towards that goal, however we are unable to predict whether services revenue will trend upward or downward in future periods as we continue to develop this business. The increase in service revenue from biometrics engineering services was partially offset by a $0.3 million decrease in service revenue from patent licensing activities.
Services decreased 57% from $4.6 million in 2009 to $2.0 million in 2010. As a percentage of total revenue, services decreased from 21% in 2009 to 9% in 2010. The services dollar decrease was primarily due to a $2.9 million reduction of service revenue from DSL silicon IP contracts as a result of the sale of our DSL silicon IP product line to Lantiq in November 2009. The decrease in service revenue from DSL silicon contracts was partially offset by a $0.3 million increase in service revenue from patent licensing activities.
27
Royalties
Substantially all of our royalties are derived from royalty payments we receive under DSL silicon IP contracts with Ikanos and Lantiq. Each customer pays us royalties for the right to incorporate our silicon IP in their DSL chipsets. The sale of our DSL silicon IP assets in November 2009 did not alter the royalty obligations of Ikanos or Lantiq. We are uncertain as to whether these licensees will be able to maintain their market shares and chipset prices in the face of intense competition, and whether our relationships with them will contribute meaningful royalties to us in the future. Accordingly, we are unable to predict whether royalties reported by our licensees will trend upward or downward in future periods.
Royalties decreased 19% from $2.7 million in 2010 to $2.1 million in 2011. As a percentage of total revenue, royalties decreased from 11% in 2010 to 9% in 2011. The dollar decrease in royalties was due to a $0.6 million decrease in DSL royalties from Lantiq and Ikanos.
Royalties increased 29% from $2.1 million in 2009 to $2.7 million in 2010. As a percentage of total revenue, royalties increased from 9% in 2009 to 11% in 2010. The dollar increase in royalties was due to a $0.6 million increase in DSL royalties from Lantiq and Ikanos.
Cost of Product Sales
Since the cost of software product sales is minimal, cost of product sales consists primarily of the cost of hardware product sales.
Cost of product sales decreased 17% from $4.4 million in 2010 to $3.6 million in 2011. As a percentage of product sales, cost of product sales decreased from 23% in 2010 to 20% in 2011, which resulted in gross margins on product sales increasing from to 77% to 80%. The dollar decrease in cost of product sales in 2011 was primarily attributable to a $1.4 million decrease in hardware product sales. The increase in gross margins on product sales was primarily due to a higher proportion of software sales in the product sales mix that have relatively higher margins.
Cost of product sales increased 51% from $2.9 million in 2009 to $4.4 million in 2010. As a percentage of product sales, cost of product sales increased from 19% in 2009 to 23% in 2010, which resulted in gross margins on product sales decreasing from to 81% to 77%. The dollar increase in cost of product sales in 2010 was primarily attributable to a $2.5 million increase in hardware product sales. The decrease in gross margins on product sales was primarily due to a lower proportion of software sales in the product sales mix.
Cost of Services
Cost of services, which we previously called “Cost of Contract Revenue,” consists of engineering costs to complete customer engineering projects. Such costs primarily include: i) engineering salaries, stock-based compensation, fringe benefits, and facilities; and ii) engineering consultants and contractors.
Cost of services increased 149% from $0.7 million in 2010 to $1.8 million in 2011. As a percentage of services revenue, cost of services increased from 36% in 2010 to 41% in 2011, which resulted in gross margins on service revenue decreasing from 64% to 59%. The $1.1 million increase in cost of services was primarily due to a $2.3 million increase in service revenue. The decrease in gross margins on service revenue was due to a greater proportion of services provided to government customers that have slightly lower margins than commercial customers in 2011 as compared to 2010.
Cost of services decreased 75% from $2.9 million in 2009 to $0.7 million in 2010. As a percentage of services revenue, cost of services decreased from 63% in 2009 to 36% in 2010, which resulted in gross margins on service revenue increasing from 37% to 64%. The $2.2 million decrease in cost of services was almost entirely due to the loss of services revenue from DSL silicon contracts as a result of the Lantiq sale. The increase in gross margins on service revenue was due to a shift in service revenue from DSL silicon contracts to more profitable non-DSL silicon contracts.
28
Research and Development Expense
Research and development expense consists of costs for: i) engineering personnel, including salaries, stock-based compensation, fringe benefits, and facilities; ii) engineering consultants and contractors, and iii) other engineering expenses such as supplies, equipment depreciation, dues and memberships and travel. Engineering costs incurred to develop technology, products and patents related to our various product lines are classified as research and development expense. As described in the cost of services section, engineering costs incurred to provide engineering services for customer projects are classified as cost of services, and are not included in research and development expense.
Research and development expense decreased 11% from $8.1 million in 2010 to $7.2 million in 2011. As a percentage of total revenue, research and development expense decreased from 34% in 2010 to 30% in 2011. The $0.9 million decrease in research and development expense was primarily due to how we deployed our engineering resources in 2011 and 2010. In 2011, our total engineering costs were $9.0 million, of which we classified $7.2 million to research and development cost and $1.8 million to cost of services based on the time spent on each activity. In 2010, our total engineering costs were $8.8 million, of which we classified $8.1 million to research and development cost and $0.7 million to cost of services. The reduction of research and development expense in 2011 was primarily due to a greater deployment of engineering resources on customer services projects in the current year as compared to the previous year.
Research and development expense decreased 32% from $11.9 million in 2009 to $8.1 million in 2010. As a percentage of total revenue, research and development expense decreased from 54% in 2009 to 34% in 2010. The $3.8 million decrease in research and development expense was primarily due to a $4.4 million reduction of engineering expenses as a result of the sale of our DSL silicon IP product line to Lantiq, which was partially offset by slightly higher spending in our biometrics and DSL service assurance engineering organizations.
Our research and development activities are focused primarily on developing biometrics and imaging software; and DSL service assurance software.
Selling and Marketing Expense
Selling and marketing expense primarily consists of costs for: i) sales and marketing personnel, including salaries, sales commissions, stock-based compensation, fringe benefits, travel, and facilities; and ii) advertising and promotion expenses.
Selling and marketing expense increased 4% from $4.3 million in 2010 to $4.4 million in 2011. As a percentage of total revenue, selling and marketing expense was 18% in 2010 and 2011. The $0.1 million increase in selling and marketing expense reflected: 1) a stable sales and marketing organization; and 2) consistent levels of promotional activities.
Selling and marketing expense decreased 9% from $4.7 million in 2009 to $4.3 million in 2010. As a percentage of total revenue, selling and marketing expense decreased from 21% in 2009 to 18% in 2010. The dollar decrease in selling and marketing expense was primarily due to lower headcount in our sales and marketing organization as well as lower stock-based compensation expenses. Lower spending attributable to these factors was partially offset by higher spending on tradeshows.
General and Administrative Expense
General and administrative expense consists primarily of costs for: i) officers, directors and administrative personnel, including salaries, bonuses, director compensation, stock-based compensation, fringe benefits, and facilities; ii) professional fees, including legal and audit fees; iii) public company expenses; and iv) other administrative expenses, such as insurance costs and bad debt provisions.
General and administrative expense decreased 22% from $6.4 million in 2010 to $5.0 million in 2011. As a percentage of total revenue, general and administrative expense decreased from 27% in 2010 to 20% in 2011. The dollar decrease in general and administrative expense was mainly attributable to: i) lower legal fees related to patents and patent monetization activities of $1.0 million; ii) lower compensation expenses for directors and officers of $0.8 million; and iii) various other administrative spending decreases of $0.2 million. These spending decreases were partially offset by $0.6 million of severance costs paid in 2011 to our former CEO upon his departure from the company.
29
General and administrative expense increased 26% from $5.1 million in 2009 to $6.4 million in 2010. As a percentage of total revenue, general and administrative expense increased from 23% in 2009 to 27% in 2010. The dollar increase in general and administrative expense was mainly attributable to higher spending on: i) legal fees related to patents and patent monetization activities of $1.3 million; and ii) stock-based compensation of $0.2 million.
Gain on Sale of Assets
In 2009, we sold substantially all of the assets associated with our home networking and DSL technology to Lantiq for $6.75 million. We recorded a gain on the sale of assets of $6.2 million in the year ended December 31, 2009. The gain reflects $6.75 million of proceeds from Lantiq less the following items: i) the net book value of assets transferred to Lantiq; ii) the write-off of certain prepaid assets that had no economic value after the sale; and iii) transaction costs.
Other Income
We recorded $425,000 of other income in the year ended December 31, 2010. This amount represents proceeds from a legal settlement with a former customer.
Interest Income
Interest income decreased 8%, or $7,000, from $90,000 in 2010 to $83,000 in 2011. The dollar decrease in interest income was primarily due to a continued decline in money market interest rates during 2011.
Interest income decreased 62%, or $148,000, from $238,000 in 2009 to $90,000 in 2010. The dollar decrease in interest income was primarily due to a continued decline in money market interest rates during 2010.
Income Taxes
We are subject to income taxes in the United States and we use estimates in determining our provisions for income taxes. We account for income taxes using the asset and liability method for accounting and reporting income taxes. Deferred tax assets and liabilities are recognized based on temporary differences between the financial reporting and income tax bases of assets and liabilities using statutory rates.
We made no provision for income taxes in the years ended 2011, 2010 and 2009, except for $2,000, $2,000, and $4,000 of state excise taxes paid in each year, respectively.
As of December 31, 2011, we had U.S. federal net operating loss carryforwards for income tax purposes of $51.4 million that expire beginning in 2012 and state net operating loss carryforwards of $9.3 million that expire beginning in 2012. We also had U.S. federal tax credits of $13.6 million that expire beginning in 2012 and state research and development credits of $7.4 million that expire beginning in 2012. The Internal Revenue Code contains provisions that limit the net operating loss and tax credit carryforwards available to be used in any given year in the event of certain circumstances, including significant changes in ownership interests, as defined.
Based on all the available evidence, we continue to believe that it is more likely than not that our deferred tax assets are not currently realizable. In reaching this determination, we evaluated our three-year cumulative results as well as the impact that current economic conditions may have on our future results. As a result, we continue to provide a valuation allowance on our deferred tax assets.
We will continue to assess the level of valuation allowance required in future periods. Should more positive than negative evidence regarding the realizability of tax assets exist at a future point in time, the valuation allowance may be reduced or eliminated altogether.
30
LIQUIDITY AND CAPITAL RESOURCES
In recent years, we have financed the company with our cash balances, cash generated from operations, and cash received from the sale of our DSL silicon intellectual property product line. Equity financing has not been a meaningful source of financing for us in recent years. Cash flows from operating, investing and financing activities are described below.
Cash flow from operating activities
In the years ended December 31, 2011 and 2010, our operating activities provided net cash of $6.8 million and $0.7 million, respectively. In the year ended December 31, 2009, our operating activities used net cash of $3.4 million. A discussion of cash flow from operations for each of the last three years follows:
Year ended December 31, 2011
. Cash provided by operations of $6.8 million in 2011 was primarily the result of net income of $2.6 million, which was increased for non-cash items related to depreciation and amortization of $0.5 million and stock-based compensation expense of $1.3 million. Cash provided by operations was also driven higher by a $2.7 million reduction in accounts receivable and inventory, which was partially offset by a $0.3 million reduction of liabilities.
Year ended December 31, 2010.
Cash provided by operations of $0.7 million in 2010 was primarily the result of net income of $0.2 million, which was increased for non-cash items related to depreciation and amortization of $0.5 million, and stock-based compensation expense of $1.5 million. Cash provided by operations from these sources was reduced by a $2.0 million net increase in accounts receivable, inventory, and prepaid expenses, which was partially offset by a $0.5 million increase in liabilities.
Year ended December 31, 2009.
Cash used in operations of $3.4 million in 2009 was primarily the result of net income of $1.0 million, which was: i) decreased by a $6.2 million gain on the sale of assets; and ii) increased for non-cash items related to depreciation and amortization of $0.8 million, and stock-based compensation expense of $1.7 million. Cash used in operations from these sources was further increased by a $0.7 million net increase in accounts receivable, inventory, and prepaid expenses.
Cash flow from investing activities
In the years ended December 31, 2011 and 2010, our investing activities used net cash of $1.1 million and $0.3 million, respectively. In the year ended December 31, 2009, our investing activities provided net cash of $6.5 million. A discussion of cash flow from investing activities for each of the last three years follows:
Year ended December 31, 2011.
Cash used by investing activities of $1.1 million in 2011 was primarily the result of $0.3 million of capital expenditures and $0.7 million used to purchase investments.
Year ended December 31, 2010.
Cash used by investing activities of $0.3 million in 2010 was primarily the result of $0.1 million of capital expenditures, $0.1 million used to purchase other assets, and $0.1 million of expenses related to the sale of our DSL silicon intellectual property product line.
Year ended December 31, 2009.
Cash provided by investing activities of $6.5 million in 2009 was primarily the result of $6.7 million of proceeds from the sale of our DSL silicon intellectual property product line. Sales proceeds from this sale were partially offset by $0.2 million of capital expenditures.
We have no material commitments for capital expenditures.
Cash flow from financing activities
In the year ended December 31, 2011, our financing activities provided net cash of $0.9 million. In the years ended December 31, 2010 and 2009, our financing investing activities used net cash of $0.2 million and $8.9 million, respectively. A discussion of cash flow from financing activities for each of the last three years follows:
Year ended December 31, 2011.
Cash provided by financing activities of $0.9 million in 2011 was primarily the result of $1.8 million of proceeds from the exercise of stock options. Proceeds from stock option exercises were partially offset by $0.7 million used to repurchase our stock from a shareholder in a privately negotiated transaction, and $0.2 million used to repurchase stock from employees in connection with stock issuances under a 2010 stock grant program.
31
Year ended December 31, 2010.
Cash used by financial activities of $0.2 million in 2010 was primarily the result of $0.2 million used to purchase stock from employees in connection with an employee option exchange program.
Year ended December 31, 2009.
Cash used by financing activities of $8.9 million in 2009 was primarily the result of $8.9 million used to repurchase our stock in a Dutch auction tender offer.
At December 31, 2011, we had cash and cash equivalents of $46.6 million and investments of $0.7 million. While we can not assure you that we will not require additional financing, or that such financing will be available to us, we believe that our cash and cash equivalents and investments will be sufficient to fund our operations for at least the next twelve months.
To date, inflation has not had a material impact on our financial results. There can be no assurance, however, that inflation will not adversely affect our financial results in the future.
OFF-BALANCE SHEET ARRANGEMENTS
We have a patent arrangement with an unconsolidated entity that we classify as a variable interest entity. We have no equity interest and are not contractually obligated to fund this entity; therefore our maximum exposure to loss as a result of our involvement with this entity is zero. Other than this patent entity, we do not have any other arrangements with unconsolidated entities, such as structured finance or special purpose entities, which are often established for the purpose of facilitating off-balance sheet arrangements or other contractually narrow or limited purposes. Accordingly, we are not exposed to any financing, liquidity, market or credit risk.
32
CONTRACTUAL OBLIGATIONS
We have various contractual obligations impacting our liquidity. The following represents our contractual obligations as of December 31, 2011 (in thousands):
|
Payments Due By Period
|
|||||||||||||||||||||
|
Contractual Obligations
|
Total
|
Less than
1 year
|
1-3 years
|
3-5 years
|
More than
5 years
|
||||||||||||||||
|
Operating leases
|
$ | 31 | $ | 18 | $ | 13 | $ | - | $ | - | |||||||||||
|
Purchase orders
|
175 | 175 | - | - | - | ||||||||||||||||
|
Total
|
$ | 206 | $ | 193 | $ | 13 | $ | - | $ | - | |||||||||||
CRITICAL ACCOUNTING POLICIES
We consider certain accounting policies related to revenue recognition, stock-based compensation, income taxes, inventories, and the allowance for doubtful accounts to be critical policies.
Revenue recognition
. We derive revenue from three sources (i) product revenue, which includes revenue from the sale of biometrics, imaging and DSL service assurance software products and from the sale of DSL service assurance hardware products; (ii) services, which primarily includes engineering service fees; and (iii) royalties.
We recognize revenue when there is persuasive evidence of an arrangement, the sales price is fixed or determinable, collection of the related receivable is reasonably assured, and delivery has occurred or services have been rendered. As described below, we make significant judgments during the process of determining revenue for any particular accounting period.
In determining revenue recognition, we assess whether fees associated with revenue transactions are fixed or determinable based on the terms of the contract and based on payment terms. If the fee is not fixed or determinable, we defer the fee and recognize revenue as amounts become due and payable. We assess whether collection is reasonably assured based on a number of factors, including past transaction history with the customer and the credit-worthiness of the customer. If we determine that collection of a fee is not reasonably assured, we defer the fee and recognize revenue at the time collection becomes reasonably assured.
We must also make judgments with respect to the recognition of multiple element revenue arrangements in the following situations:
|
o
|
When software licenses and maintenance contracts are sold together, we generally recognize software license revenue upon delivery, provided we have vendor specific objective evidence (“VSOE”) for the fair value of the maintenance contract fee, and we generally recognize the fair value of maintenance contract revenue ratably over the related contract period. If we do not have VSOE for the fair value of the maintenance contract fee, we recognize software license and maintenance contract revenue ratably over the related contract period.
|
|
o
|
When engineering services and software licenses are sold together, the total fee is generally recognized by applying contract accounting. We have adopted the percentage-of-completion method of contract accounting, and we use an output method (i.e., contract milestones) to determine our completion percentage.
|
|
o
|
When we sell services, software and maintenance together, revenue is recognized as follows: i) maintenance revenue is separated from the other two elements and is recognized ratably over the related contract period; provided we have VSOE for the fair value of the maintenance element; and ii) the total fee from the software license and engineering service elements is recognized by applying the contract accounting method described in the previous paragraph. If we do not have VSOE for the fair value of the maintenance element, we recognize revenue for the entire arrangement ratably over a period that begins at the start of the engineering services project and ends when all elements of the arrangement have been delivered.
|
33
Our revenue recognition policies are described more fully in Note 2, Summary of Significant Accounting Policies, in the Notes to our Consolidated Financial Statements.
Stock-Based Compensation.
We grant stock options and stock to our employees and directors. We measure stock-based compensation cost at the grant date based on the fair value of the award and recognize it as expense over the applicable vesting period of the award using the straight-line basis.
We use the Black-Scholes valuation model to estimate the fair value of stock option awards. This valuation model takes into account the exercise price of the award, as well as a variety of significant assumptions. The assumptions used to estimate the fair value of stock options include the expected term, the expected volatility of our stock over the expected term, the risk-free interest rate over the expected term, and our expected annual dividend yield.
For stock awards, we determine the fair value of the award by using the fair market value of our stock on the date of grant; provided the number of shares in the grant is fixed on the grant date.
Income taxes
. As part of the process of preparing our consolidated financial statements we are required to estimate our actual current tax expense. We must also estimate temporary and permanent differences that result from differing treatment of certain items for tax and accounting purposes. These differences result in deferred tax assets and liabilities, which are included in our consolidated balance sheet. We must then assess the likelihood that our deferred tax assets will be recovered from future taxable income and to the extent we believe recovery is not likely, we must establish a valuation allowance. To the extent we establish a valuation allowance or increase this allowance in a period for deferred tax assets, which have been recognized, we must include an expense with the tax provision in the statement of operations.
Significant management judgment is required in determining our provision for income taxes, our deferred tax assets, and any valuation allowance recorded against our net deferred tax assets. Our deferred tax assets primarily relate to net operating losses and research and development tax credits that we are carrying forward into future tax periods. As of December 31, 2011, we had a total of $40.5 million of deferred tax assets for which we had recorded a full valuation allowance.
Based on all the available evidence, we continue to believe that it is more likely than not that our deferred tax assets are not currently realizable. In reaching this determination, we evaluated our three-year cumulative results as well as the impact that current economic conditions may have on our future results. As a result, we continue to provide a valuation allowance on our deferred tax assets.
We will continue to assess the level of valuation allowance required in future periods. Should more positive than negative evidence regarding the realizability of tax assets exist at a future point in time, the valuation allowance may be reduced or eliminated altogether.
Inventories.
Inventories, which include materials and our contract manufacturer’s labor and overhead, are stated at the lower of cost (first-in, first-out basis) or net realizable value. On a quarterly basis, we use consistent methodologies to evaluate all inventories for net realizable value. We record provisions for both excess and obsolete inventory when such write-downs or write-offs are identified through the quarterly review process. The inventory valuation is based upon assumptions about future demand, product mix and possible alternative uses.
Allowance for doubtful accounts.
We make judgments as to our ability to collect outstanding receivables and provide allowances for receivables when collection becomes doubtful. Provisions are made based upon a specific review of all significant outstanding invoices. If the judgments we make to determine the allowance for doubtful accounts do not reflect the future ability to collect outstanding receivables, additional provisions for doubtful accounts may be required.
34
RECENT ACCOUNTING PRONOUNCEMENTS
We describe below recent pronouncements that have had or may have a significant effect on our financial statements. We do not discuss recent pronouncements that are not anticipated to have an impact on or are unrelated to our financial condition, results of operations, or disclosures.
In May 2011, the Financial Accounting Standards Board issued guidance that changed the requirement for presenting “Comprehensive Income” in the consolidated financial statements. The update requires an entity to present the components of other comprehensive income either in a single continuous statement of comprehensive income or in two separate but consecutive statements. The currently available option to disclose the components of other comprehensive income within the statement of stockholders’ equity will no longer be available. The update is effective for fiscal years, and interim periods within those years, beginning after December 15, 2011 and should be applied retrospectively. The adoption of the standard will have no impact on our financial position or results of operations, but will result in a change in the presentation of our basic consolidated financial statements.
Our exposure to market risk relates primarily to our investment portfolio, and the effect that changes in interest rates would have on that portfolio. Our investment portfolio at December 31, 2011 consisted of two elements:
|
1.
|
Cash and cash equivalents.
As of December 31, 2011, our cash and cash equivalents of $46.6 million were primarily invested in money market funds. The money market funds were invested in high quality, short term financial instruments. Due to the nature, short duration, and professional management of these funds, we do not expect that a general increase in interest rates would result in any material loss.
|
|
2.
|
Investments.
As of December 31, 2011, our investments of $0.7 million were invested in high yield bonds with two separate corporate debt issuers. Both of these bonds mature in 2015. While we are exposed to default risk, the high current yield of these bonds largely mitigates interest rate risk. Therefore, due to the high current yield and approximate four-year life of these instruments, we do not believe that a general increase in interest rates would result in any material loss.
|
We do not use derivative financial instruments for speculative or trading purposes.
35
Report of Independent Registered Public Accounting Firm
To Board of Directors and Stockholders of Aware, Inc.:
In our opinion, the consolidated financial statements listed in the index
appearing under Item 15 (a) (1) present fairly, in all material respects, the financial position of Aware, Inc. and its subsidiary at December 31, 2011 and December 31, 2010 and the results of their operations and their cash flows for each of the three years in the period ended December 31, 2011 in conformity with accounting principles generally accepted in the United States of America. In addition, in our opinion, the financial statement schedule listed in the index appearing under Item 15 (a) (2) presents fairly, in all material respects, the information set forth therein when read in conjunction with the related consolidated financial statements. Also in our opinion, the Company maintained, in all material respects, effective internal control over financial reporting as of December 31, 2011, based on criteria established in Internal Control - Integrated Framework issued by the Committee of Sponsoring Organizations of the Treadway Commission (COSO). The Company’s management is responsible for these financial statements and financial statement schedule, for maintaining effective internal control over financial reporting and for its assessment of the effectiveness of internal control over financial reporting, included in Management’s Report on Internal Control Over Financial Reporting appearing under Item 9A. Our responsibility is to express opinions on these financial statements, on the financial statement schedule, and on the Company’s internal control over financial reporting based on our integrated audits. We conducted our audits in accordance with the standards of the Public Company Accounting Oversight Board (United States). Those standards require that we plan and perform the audits to obtain reasonable assurance about whether the financial statements are free of material misstatement and whether effective internal control over financial reporting was maintained in all material respects. Our audits of the financial statements included examining, on a test basis, evidence supporting the amounts and disclosures in the financial statements, assessing the accounting principles used and significant estimates made by management, and evaluating the overall financial statement presentation. Our audit of internal control over financial reporting included obtaining an understanding of internal control over financial reporting, assessing the risk that a material weakness exists, and testing and evaluating the design and operating effectiveness of internal control based on the assessed risk. Our audits also included performing such other procedures as we considered necessary in the circumstances. We believe that our audits provide a reasonable basis for our opinions.
A company’s internal control over financial reporting is a process designed to provide reasonable assurance regarding the reliability of financial reporting and the preparation of financial statements for external purposes in accordance with generally accepted accounting principles. A company’s internal control over financial reporting includes those policies and procedures that (i) pertain to the maintenance of records that, in reasonable detail, accurately and fairly reflect the transactions and dispositions of the assets of the company; (ii) provide reasonable assurance that transactions are recorded as necessary to permit preparation of financial statements in accordance with generally accepted accounting principles, and that receipts and expenditures of the company are being made only in accordance with authorizations of management and directors of the company; and (iii) provide reasonable assurance regarding prevention or timely detection of unauthorized acquisition, use, or disposition of the company’s assets that could have a material effect on the financial statements.
Because of its inherent limitations, internal control over financial reporting may not prevent or detect misstatements. Also, projections of any evaluation of effectiveness to future periods are subject to the risk that controls may become inadequate because of changes in conditions, or that the degree of compliance with the policies or procedures may deteriorate.
/s/ PricewaterhouseCoopers LLP
PricewaterhouseCoopers LLP
Boston, Massachusetts
February 21, 2012
36
AWARE, INC.
CONSOLIDATED BALANCE SHEETS
(in thousands, except share data)
|
December 31,
|
||||||||
|
2011
|
2010
|
|||||||
|
ASSETS
|
||||||||
|
Current assets:
|
||||||||
|
Cash and cash equivalents
|
$ | 46,577 | $ | 39,949 | ||||
|
Accounts receivable (less allowance for doubtful
|
||||||||
|
accounts of $30 in 2011 and 2010)
|
3,546 | 4,968 | ||||||
|
Inventories
|
547 | 1,863 | ||||||
|
Prepaid expenses and other current assets
|
213 | 235 | ||||||
|
Total current assets
|
50,883 | 47,015 | ||||||
|
Property and equipment, net
|
6,232 | 6,360 | ||||||
|
Investments
|
727 | - | ||||||
|
Other assets, net
|
9 | 25 | ||||||
|
Total assets
|
$ | 57,851 | $ | 53,400 | ||||
|
LIABILITIES AND STOCKHOLDERS’ EQUITY
|
||||||||
|
Current liabilities:
|
||||||||
|
Accounts payable
|
$ | 399 | $ | 565 | ||||
|
Accrued expenses
|
121 | 118 | ||||||
|
Accrued compensation
|
868 | 1,143 | ||||||
|
Accrued professional fees
|
109 | 427 | ||||||
|
Deferred revenue
|
1,317 | 944 | ||||||
|
Total current liabilities
|
2,814 | 3,197 | ||||||
|
Long-term deferred revenue
|
462 | 320 | ||||||
|
Commitments and contingent liabilities (Note 8)
|
||||||||
|
Stockholders’ equity:
|
||||||||
|
Preferred stock, $1.00 par value; 1,000,000 shares authorized,
none outstanding
|
- | - | ||||||
|
Common stock, $.01 par value; shares authorized,
70,000,000 in 2011 and 2010; issued
and outstanding 20,622,889 in 2011 and 20,041,863 in 2010
|
206 | 200 | ||||||
|
Additional paid-in capital
|
79,512 | 77,373 | ||||||
|
Accumulated other comprehensive loss
|
(20 | ) | - | |||||
|
Accumulated deficit
|
(25,123 | ) | (27,690 | ) | ||||
|
Total stockholders’ equity
|
54,575 | 49,883 | ||||||
|
Total liabilities and stockholders’ equity
|
$ | 57,851 | $ | 53,400 | ||||
|
The accompanying notes are an integral part of the consolidated financial statements.
|
37
AWARE, INC.
CONSOLIDATED STATEMENTS OF OPERATIONS
(in thousands, except per share data)
|
Years ended December 31,
|
||||||||||||
|
2011
|
2010
|
2009
|
||||||||||
|
Revenue:
|
||||||||||||
|
Product sales
|
$ | 18,129 | $ | 18,914 | $ | 15,376 | ||||||
|
Services
|
4,311 | 1,992 | 4,611 | |||||||||
|
Royalties
|
2,146 | 2,654 | 2,055 | |||||||||
|
Total revenue
|
24,586 | 23,560 | 22,042 | |||||||||
|
Costs and expenses:
|
||||||||||||
|
Cost of product sales
|
3,637 | 4,362 | 2,887 | |||||||||
|
Cost of services
|
1,777 | 714 | 2,896 | |||||||||
|
Research and development
|
7,240 | 8,096 | 11,920 | |||||||||
|
Selling and marketing
|
4,441 | 4,283 | 4,707 | |||||||||
|
General and administrative
|
5,005 | 6,438 | 5,114 | |||||||||
|
Total costs and expenses
|
22,100 | 23,893 | 27,524 | |||||||||
|
Income (loss) from operations
|
2,486 | (333 | ) | (5,482 | ) | |||||||
|
Gain on sale of assets
|
- | - | 6,230 | |||||||||
|
Other income
|
- | 425 | - | |||||||||
|
Interest income
|
83 | 90 | 238 | |||||||||
|
Income before provision for income taxes
|
2,569 | 182 | 986 | |||||||||
|
Provision for income taxes
|
2 | 2 | 4 | |||||||||
|
Net income
|
$ | 2,567 | $ | 180 | $ | 982 | ||||||
|
Net income per share – basic
|
$ | 0.12 | $ | 0.01 | $ | 0.05 | ||||||
|
Net income per share – diluted
|
$ | 0.12 | $ | 0.01 | $ | 0.05 | ||||||
|
Weighted average shares – basic
|
20,534 | 19,971 | 20,869 | |||||||||
|
Weighted average shares – diluted
|
20,735 | 20,182 | 20,874 | |||||||||
The accompanying notes are an integral part of the consolidated financial statements.
38
AWARE, INC.
CONSOLIDATED STATEMENTS OF CASH FLOWS
(in thousands)
|
Years ended December 31,
|
||||||||||||
|
2011
|
2010
|
2009
|
||||||||||
|
Cash flows from operating activities:
|
||||||||||||
|
Net income
|
$ | 2,567 | $ | 180 | $ | 982 | ||||||
|
Adjustments to reconcile net income to net cash
provided by (used in) operating activities:
|
||||||||||||
|
Depreciation and amortization
|
475 | 536 | 823 | |||||||||
|
Stock-based compensation
|
1,277 | 1,495 | 1,737 | |||||||||
|
Gain on sale of assets
|
- | - | (6,230 | ) | ||||||||
|
Amortization of discount on investments
|
(9 | ) | - | - | ||||||||
|
Increase (decrease) from changes in assets and liabilities:
|
||||||||||||
|
Accounts receivable
|
1,422 | (1,403 | ) | (1,353 | ) | |||||||
|
Inventories
|
1,316 | (750 | ) | 542 | ||||||||
|
Prepaid expenses and other current assets
|
22 | 128 | 131 | |||||||||
|
Accounts payable
|
(166 | ) | 239 | (139 | ) | |||||||
|
Accrued expenses
|
(590 | ) | 177 | (377 | ) | |||||||
|
Deferred revenue
|
515 | 108 | 487 | |||||||||
|
Net cash provided by (used in) operating activities
|
6,829 | 710 | (3,397 | ) | ||||||||
|
Cash flows from investing activities:
|
||||||||||||
|
Purchases of property and equipment
|
(331 | ) | (118 | ) | (168 | ) | ||||||
|
Purchases of investments
|
(737 | ) | - | - | ||||||||
|
Proceeds from sale of assets, net
|
- | (100 | ) | 6,661 | ||||||||
|
Purchase of other assets
|
- | (60 | ) | - | ||||||||
|
Net cash provided by (used in) investing activities
|
(1,068 | ) | (278 | ) | 6,493 | |||||||
|
Cash flows from financing activities:
|
||||||||||||
|
Proceeds from issuance of common stock
|
1,826 | 9 | 7 | |||||||||
|
Shares surrendered by employees to pay taxes related to
unrestricted stock
|
(224 | ) | (161 | ) | - | |||||||
|
Repurchase of common stock
|
(735 | ) | - | (8,950 | ) | |||||||
|
Net cash provided by (used in) financing activities
|
867 | (152 | ) | (8,943 | ) | |||||||
|
Increase (decrease) in cash and cash equivalents
|
6,628 | 280 | (5,847 | ) | ||||||||
|
Cash and cash equivalents, beginning of year
|
39,949 | 39,669 | 45,516 | |||||||||
|
Cash and cash equivalents, end of year
|
$ | 46,577 | $ | 39,949 | $ | 39,669 | ||||||
The accompanying notes are an integral part of the consolidated financial statements.
39
AWARE, INC.
CONSOLIDATED STATEMENTS OF STOCKHOLDERS’ EQUITY
(in thousands)
|
Additional
|
Accumulated
Other
|
Total
|
||||||||||||||||||||||
|
Common Stock
|
Paid-In
|
Comprehensive
|
Accumulated
|
Stockholders’
|
||||||||||||||||||||
|
Shares
|
Amount
|
Capital
|
Loss
|
Deficit
|
Equity
|
|||||||||||||||||||
|
Balance at December 31, 2008
|
23,281 | $ | 233 | $ | 83,143 | $ | - | ($ | 28,853 | ) | $ | 54,523 | ||||||||||||
|
Exercise of common stock options
|
- | - | - | - | ||||||||||||||||||||
|
Repurchase of common stock
|
(3,500 | ) | (35 | ) | (8,915 | ) | (8,950 | ) | ||||||||||||||||
|
Issuance of unrestricted stock
|
25 | - | 60 | 60 | ||||||||||||||||||||
|
Issuance of common stock under
employee stock purchase plan
|
3 | - | 7 | 7 | ||||||||||||||||||||
|
Stock-based compensation expense
|
- | - | 1,737 | 1,737 | ||||||||||||||||||||
|
Net income
|
982 | 982 | ||||||||||||||||||||||
|
Balance at December 31, 2009
|
19,809 | 198 | 76,032 | - | (27,870 | ) | 48,360 | |||||||||||||||||
|
Exercise of common stock options
|
1 | - | 1 | 1 | ||||||||||||||||||||
|
Issuance of unrestricted stock under a stock
option exchange program
|
178 | 2 | - | 2 | ||||||||||||||||||||
|
Shares surrendered by employees to
pay taxes related to unrestricted stock
|
(60 | ) | (1 | ) | (162 | ) | (163 | ) | ||||||||||||||||
|
Issuance of unrestricted stock
|
111 | 1 | - | 1 | ||||||||||||||||||||
|
Issuance of common stock under
employee stock purchase plan
|
3 | - | 7 | 7 | ||||||||||||||||||||
|
Stock-based compensation expense
|
- | - | 1,495 | 1,495 | ||||||||||||||||||||
|
Net income
|
180 | 180 | ||||||||||||||||||||||
|
Balance at December 31, 2010
|
20,042 | 200 | 77,373 | - | (27,690 | ) | 49,883 | |||||||||||||||||
|
Exercise of common stock options
|
596 | 6 | 1,804 | 1,810 | ||||||||||||||||||||
|
Issuance of unrestricted stock
|
300 | 3 | (3 | ) | - | |||||||||||||||||||
|
Shares surrendered by employees to
pay taxes related to unrestricted stock
|
(70 | ) | (1 | ) | (223 | ) | (224 | ) | ||||||||||||||||
|
Repurchase of common stock
|
(250 | ) | (2 | ) | (733 | ) | (735 | ) | ||||||||||||||||
|
Issuance of common stock under
employee stock purchase plan
|
5 | - | 17 | 17 | ||||||||||||||||||||
|
Stock-based compensation expense
|
- | - | 1,277 | 1,277 | ||||||||||||||||||||
|
Accumulated other comprehensive loss
|
(20 | ) | (20 | ) | ||||||||||||||||||||
|
Net income
|
2,567 | 2,567 | ||||||||||||||||||||||
|
Balance at December 31, 2011
|
20,623 | $ | 206 | $ | 79,512 | ($ | 20 | ) | ($ | 25,123 | ) | $ | 54,575 | |||||||||||
The accompanying notes are an integral part of the consolidated financial statements.
40
AWARE, INC.
NOTES TO CONSOLIDATED FINANCIAL STATEMENTS
|
1.
|
NATURE OF BUSINESS
|
We are a leading supplier of products for the biometrics and Digital Subscriber Line (“DSL”) service assurance industries. We sell software products for biometrics and imaging applications and hardware and software products for DSL service assurance applications. We sell our software products for biometrics, medical and digital imaging applications and professional services for biometrics through a systems integrator, OEM, and direct sales channel. We sell our DSL service assurance hardware products primarily through an OEM sales channel. We sell our DSL service assurance software products directly to DSL service providers and through an OEM sales channel. We also sell and/or license patents related to communications, signal processing, and compression technologies.
|
2.
|
SUMMARY OF SIGNIFICANT ACCOUNTING POLICIES
|
Basis of Presentation
- The consolidated financial statements include the accounts of Aware, Inc. and its subsidiary. All significant intercompany transactions have been eliminated.
Fair Value Measurements
- The FASB issued authoritative guidance for fair value measurements, which defines fair value, establishes a framework for measuring fair value, and expands disclosures for assets and liabilities measured at fair value in financial statements. The fair value guidance establishes a three-tier fair value hierarchy, which prioritizes the inputs used in measuring fair value. These tiers include: Level 1, defined as observable inputs such as quoted prices in active markets; Level 2, defined as inputs other than quoted prices in active markets that are either directly or indirectly observable; and Level 3, defined as unobservable inputs in which little or no market data exists, therefore requiring an entity to develop its own assumptions.
Our cash and cash equivalents, which primarily include money market funds, are classified within Level 1 of the fair value hierarchy because they are valued using quoted market prices.
Our investments, which consist of high yield corporate debt securities, are also classified within Level 1 of the fair value hierarchy because they are valued using quoted market prices. We categorize our investments as available-for-sale securities, and carry them at fair value in our financial statements. We had $0.7 million of available-for-sale investments as of December 31, 2011, and no available-for-sale investments as of December 31, 2010.
Cash and Cash Equivalents
– Cash and cash equivalents, which consist primarily of money market funds and an immaterial amount of demand deposits, are stated at cost, which approximates fair value.
Investments
- At December 31, 2011 and 2010, we categorized all investment securities as available-for-sale, since we may liquidate these investments currently. In calculating realized gains and losses, cost is determined using specific identification. Unrealized gains and losses on available-for-sale securities are excluded from earnings and reported in a separate component of stockholders’ equity called Accumulated Comprehensive Income.
There were no realized gains and losses on investments in the years ended December 31, 2011, 2010, and 2009. There were $20,000 of unrealized losses on investments in the year ended December 31, 2011, and there were no unrealized gains on investments in the years ended December 31, 2010 and 2009.
Investments, stated at fair value, consist of the following at December 31, 2011 and 2010 (in thousands):
|
2011
|
2010
|
|||||||
|
Corporate debt securities
|
$ | 727 | $ | - | ||||
|
Total
|
$ | 727 | $ | - | ||||
The amortized cost of our corporate debt securities was $747,000 at December 31, 2011. All corporate debt securities comprising investments mature in 2015.
41
AWARE, INC.
NOTES TO CONSOLIDATED FINANCIAL STATEMENTS
Allowance for Doubtful Accounts
– Accounts are charged to the allowance for doubtful accounts as they are deemed uncollectible based on a periodic review of the accounts.
Inventories
– Inventories are stated at the lower of cost or net realizable value. Cost is determined by the first-in, first-out (“FIFO”) method. We evaluate all inventories for net realizable value on a quarterly basis, and record provisions for excess and obsolete inventory when required.
Property and Equipment
– Property and equipment are stated at cost. Depreciation and amortization of property and equipment is provided using the straight-line method over the estimated useful lives of the assets. Upon retirement or sale, the costs of the assets disposed of and the related accumulated depreciation are removed from the accounts and any resulting gain or loss is included in the determination of income or loss. Expenditures for repairs and maintenance are charged to expense as incurred.
The estimated useful lives of assets used by us are:
|
Building and improvements
|
30 years
|
|
Building improvements
|
5 to 20 years
|
|
Furniture and fixtures
|
5 years
|
|
Computer, office & manufacturing equipment
|
3 years
|
|
Purchased software
|
3 years
|
Impairment of Long-Lived Assets
– We review long-lived assets for impairment whenever events or changes in business circumstances indicate that the carrying amount of the assets may not be fully recoverable or that the useful lives of these assets are no longer appropriate. Each impairment test is based on a comparison of the undiscounted cash flows to the recorded value of the asset. If an impairment is indicated, the asset is written down to its estimated fair value. The cash flow estimates used to identify the potential impairment reflect our best estimates using appropriate assumptions and projections at that time. We believe that no significant impairment of our long-lived assets has occurred as of December 31, 2011 and 2010.
Revenue Recognition
– We recognize revenue when there is persuasive evidence of an arrangement, the sales price is fixed or determinable, collection of the related receivable is reasonably assured, and delivery has occurred or services have been rendered.
Persuasive evidence of an arrangement:
We use contracts signed by both the customer and us or written purchase orders issued by the customer as evidence of an arrangement.
Product delivery:
We deem delivery to have occurred: (i) upon shipment when products are shipped FOB shipping point, or (ii) upon delivery at a customer’s location when products are shipped FOB destination. If customer acceptance provisions apply, revenue is not recognized until delivery has occurred and we have received such acceptance. If we are required to provide installation services, revenue is not recognized until installation is complete.
Fixed or determinable fee:
We consider fees to be fixed or determinable if the fee is not subject to refund or adjustment and the payment terms are within normal established practices. If the fee is not fixed or determinable, we recognize the revenue as amounts become due and payable.
Collection is deemed probable:
We conduct a credit review for all significant transactions at the time of the arrangement to determine the credit-worthiness of the customer. Collection is deemed probable if we expect that the customer will pay amounts under the arrangement as payments become due.
We categorize revenue as product sales, services, or royalties depending on the nature of the revenue. In addition to the general revenue recognition policies described above, specific revenue recognition policies apply to each category of revenue.
42
AWARE, INC.
NOTES TO CONSOLIDATED FINANCIAL STATEMENTS
Product sales
Product sales consist of revenue from the sale of hardware and software products. Specific revenue recognition policies for product sales are:
Hardware product sales
. Hardware product sales consist of revenue from the sale of DSL service assurance hardware products. Hardware products are typically sold independently of other revenue elements, such as software, services and maintenance. Accordingly, the terms of hardware sales generally do not contain provisions that obligate us to provide additional products or services after shipment. Additionally, we do not grant return rights other than normal warranty rights of return. We recognize hardware revenue upon delivery.
Software product sales.
Software product sales consist of revenue from the sale of biometrics and imaging software products as well as DSL service assurance software. Software product sales from these product lines include: i) software licenses and ii) maintenance contracts that entitle customers to technical support and product updates during the contract period. We do not grant return rights other than normal warranty rights of return.
When software licenses or maintenance contracts are sold separately, we recognize software license revenue upon delivery and maintenance contract revenue ratably over the related contract period. When software licenses and maintenance contracts are sold together, we generally recognize software license revenue upon delivery, provided we have vendor specific objective evidence (“VSOE”) for the fair value of the maintenance contract fee, and we generally recognize the fair value of maintenance contract revenue ratably over the related contract period. If we do not have VSOE for the fair value of the maintenance contract fee, we recognize software license and maintenance contract revenue ratably over the related contract period.
We recognize maintenance contract revenue upon delivery of software licenses when: i) customers purchase maintenance with their initial purchase of software licenses; ii) the maintenance contract period is for a period of one year or less, iii) the estimated cost of providing maintenance services during the contract period is insignificant, and iv) unspecified upgrades offered during PCS arrangements historically have been and are expected to continue to be minimal and infrequent.
Services
Service revenue primarily consists of fees from biometrics and DSL service assurance customers for engineering services. Engineering services are either sold separately or as part of a multiple element transaction. Our revenue recognition policy service revenue under each situation is:
When engineering services are sold separately, we recognize service revenue from these agreements as engineering services are performed or as contract milestones are achieved.
When engineering services are sold with other revenue elements, such as software licenses and/or maintenance contracts, our revenue recognition policy is as follows.
|
●
|
Services and software.
When engineering services and software licenses are sold together, the total fee is generally recognized by applying contract accounting. We have adopted the percentage-of-completion method of contract accounting, and we use an output method (i.e., contract milestones) to determine our completion percentage. The software license portion of the arrangement is classified as product sales and the engineering services portion is classified as services revenue.
|
|
●
|
Services, software and maintenance.
When we sell services, software and maintenance together, revenue is recognized as follows: i) maintenance revenue is separated from the other two elements and is recognized ratably over the related contract period; provided we have VSOE for the fair value of the maintenance element; and ii) the total fee from the software license and engineering service elements is recognized by applying the contract accounting method described in the previous paragraph. If we do not have VSOE for the fair value of the maintenance element, we recognize revenue for the entire arrangement ratably over a period that begins at the start of the engineering services project and ends when all elements of the arrangement have been delivered.
|
43
AWARE, INC.
NOTES TO CONSOLIDATED FINANCIAL STATEMENTS
Royalties
Royalty revenue consists of royalties we receive under DSL silicon IP contracts with customers that have incorporated our intellectual property into their products. Since we cannot reasonably estimate royalty revenue, such revenue is generally recognized in the quarter in which a final report is received from a customer. Royalty reports are typically received in the quarter immediately following the quarter in which sales of royalty-bearing products occur. The terms of our agreements generally require customers to give notification to us and to pay royalties within 45 to 60 days of the end of each quarter.
Income Taxes
– We compute deferred income taxes based on the differences between the financial statement and tax basis of assets and liabilities using enacted rates in effect in the years in which the differences are expected to reverse. We establish a valuation allowance to offset temporary deductible differences, net operating loss carryforwards and tax credits when it is more likely than not that the deferred tax assets will not be realized.
Capitalization of Software Costs
– We capitalize certain internally developed software development costs after technological feasibility of the product has been established. No software costs were capitalized for the years ended December 31, 2011, 2010 and 2009, because such costs incurred subsequent to the establishment of technological feasibility, but prior to commercial availability, were immaterial.
Research and Development Costs
– Costs incurred in the research and development of our products are expensed as incurred.
Concentration of Credit Risk
– At December 31, 2011 and 2010, we had cash and cash equivalents, in excess of federally insured deposit limits of approximately $46.3 and $39.7 million, respectively.
Concentration of credit risk with respect to net accounts receivable consists of $0.4 million, $0.4 million, $0.4 million, $0.2 million, $0.2 million and $0.2 million with six customers, respectively, at December 31, 2011, and $1.4 million, $0.4 million, $0.4 million, and $0.3 million with four customers, respectively, at December 31, 2010.
Concentration of credit risk with respect to our investment portfolio consists of $475,000 and $252,000 with two issuers of corporate debt securities, respectively, at December 31, 2011. We had no investments at December 31, 2010.
Stock-Based Compensation
– We grant stock options and stock to our employees and directors. We measure stock-based compensation cost at the grant date based on the fair value of the award and recognize it as expense over the applicable vesting period of the award using the straight-line basis.
We use the Black-Scholes valuation model to estimate the fair value of stock option awards. This valuation model takes into account the exercise price of the award, as well as a variety of significant assumptions. The assumptions used to estimate the fair value of stock options include the expected term, the expected volatility of our stock over the expected term, the risk-free interest rate over the expected term, and our expected annual dividend yield.
For stock awards, we determine the fair value of the award by using the fair market value of our stock on the date of grant; provided the number of shares in the grant is fixed on the grant date.
Computation of Earnings per Share
– Basic earnings per share is computed by dividing income available to common shareholders by the weighted average number of common shares outstanding. Diluted earnings per share is computed by dividing income available to common shareholders by the weighted average number of common shares outstanding plus additional common shares that would have been outstanding if dilutive potential common shares had been issued. For the purposes of this calculation, stock options are considered common stock equivalents in periods in which they have a dilutive effect. Stock options that are antidilutive are excluded from the calculation.
44
AWARE, INC.
NOTES TO CONSOLIDATED FINANCIAL STATEMENTS
Use of Estimates
–
The preparation of our financial statements in conformity with generally accepted accounting principles requires us to make estimates and assumptions that affect the reported amounts of assets and liabilities and disclosure of contingent assets and liabilities at the date of the financial statements and the reported amount of revenues and expenses during the reporting period. Significant estimates include revenue recognition, reserves for doubtful accounts, reserves for excess and obsolete inventory, useful lives of fixed assets, valuation allowance for deferred income tax assets, and accrued liabilities. Actual results could differ from those estimates.
Fair Value of Financial Instruments
– The carrying amounts of cash and cash equivalents, accounts receivable, accounts payable and accrued expenses approximate fair value because of their short-term nature. The carrying amount of investments is based on the fair value of the individual securities in our investment portfolio.
Comprehensive Income -
Comprehensive income is defined as the change in equity of a business enterprise during a period from transactions and other events and circumstances from non-owner sources, including foreign currency translation adjustments and unrealized gains and losses on marketable securities. For the years ended December 31, 2011, 2010, and 2009, comprehensive income, net of tax, was as follows:
|
Year ended December 31,
|
||||||||||||
|
2011
|
2010
|
2009
|
||||||||||
|
Net income
|
$ | 2,567 | $ | 180 | $ | 982 | ||||||
|
Other comprehensive income (loss):
|
||||||||||||
|
Unrealized losses on available for sale securities
|
(20 | ) | - | - | ||||||||
|
Comprehensive income
|
$ | 2,547 | $ | 180 | $ | 982 | ||||||
Advertising Costs –
Advertising costs are expensed as incurred and were not material for 2011, 2010, and 2009.
Recent Accounting Pronouncements
– We describe below recent pronouncements that have had or may have a significant effect on our financial statements. We do not discuss recent pronouncements that are not anticipated to have an impact on or are unrelated to our financial condition, results of operations, or disclosures.
In May 2011, the Financial Accounting Standards Board issued guidance that changed the requirement for presenting “Comprehensive Income” in the consolidated financial statements. The update requires an entity to present the components of other comprehensive income either in a single continuous statement of comprehensive income or in two separate but consecutive statements. The currently available option to disclose the components of other comprehensive income within the statement of stockholders’ equity will no longer be available. The update is effective for fiscal years, and interim periods within those years, beginning after December 15, 2011 and should be applied retrospectively. The adoption of the standard will have no impact on our financial position or results of operations, but will result in a change in the presentation of our basic consolidated financial statements.
Segments
–
We organize ourselves as two segments reporting to the chief operating decision-makers. We have sales outside of the United States, which are described in Note 9. All long-lived assets are maintained in the United States.
45
AWARE, INC.
NOTES TO CONSOLIDATED FINANCIAL STATEMENTS
|
3.
|
ASSETS SOLD
|
On November 13, 2009, we completed a transaction in which we sold substantially all of the assets associated with our licensing product line to Lantiq Broadband Holdco, Inc. and Lantiq Deutschland GmbH (“Lantiq”) for $6.75 million. The sale included: i) our DSL and home networking technology assets; ii) certain patents and patent applications related to those technology assets; iii) a group of 41 engineers; and iv) lab and computer equipment used by the transferred engineers.
In 2009, we recorded a gain on the sale of assets of $6.2 million. The gain reflects $6.75 million of proceeds less the following items: i) the net book value of assets transferred to Lantiq; ii) the write-off of certain prepaid assets that had no economic value after the sale; and iii) transaction costs. Included in the assets transferred to Lantiq were property and equipment, principally lab and computer equipment, which had a cost of $1.9 million and a net book value of $124,000.
|
4.
|
INVENTORIES
|
Inventories consisted of the following at December 31 (in thousands):
|
2011
|
2010
|
|||||||
|
Raw materials
|
$ | 339 | $ | 966 | ||||
|
Finished goods
|
208 | 897 | ||||||
|
Total
|
$ | 547 | $ | 1,863 | ||||
|
5.
|
PROPERTY AND EQUIPMENT
|
Property and equipment consisted of the following at December 31 (in thousands):
|
2011
|
2010
|
|||||||
|
Land
|
$ | 1,080 | $ | 1,080 | ||||
|
Building and improvements
|
9,050 | 8,869 | ||||||
|
Computer equipment
|
1,282 | 1,190 | ||||||
|
Purchased software
|
197 | 193 | ||||||
|
Furniture and fixtures
|
810 | 811 | ||||||
|
Office equipment
|
182 | 207 | ||||||
|
Manufacturing equipment
|
78 | 76 | ||||||
|
Total
|
12,679 | 12,426 | ||||||
|
Less accumulated depreciation and amortization
|
(6,447 | ) | (6,066 | ) | ||||
|
Property and equipment, net
|
$ | 6,232 | $ | 6,360 | ||||
Depreciation expense amounted to $0.5 million, $0.5 million, and $0.8 million in each of the years ended December 31, 2011, 2010, and 2009, respectively. In 2011 and 2010, we identified $78,000 and $275,000, of fully depreciated assets no longer in use, and retired the assets and related accumulated depreciation.
46
AWARE, INC.
NOTES TO CONSOLIDATED FINANCIAL STATEMENTS
|
6.
|
INCOME TAXES
|
Deferred tax assets are attributable to the following at December 31 (in thousands):
|
2011
|
2010
|
|||||||
|
Federal net operating loss carryforwards
|
$ | 17,041 | $ | 16,977 | ||||
|
Research and development and other tax credit carryforwards
|
18,807 | 18,719 | ||||||
|
State net operating loss carryforwards
|
465 | 535 | ||||||
|
Capitalized research and development costs
|
1,651 | 3,018 | ||||||
|
Other
|
2,512 | 2,510 | ||||||
|
Total
|
40,476 | 41,759 | ||||||
|
Less valuation allowance
|
(40,476 | ) | (41,759 | ) | ||||
|
Deferred tax assets, net
|
$ | - | $ | - | ||||
A reconciliation of the U.S. federal statutory rate to the effective tax rate is as follows:
|
Year ended December 31,
|
||||||||||||
|
2011
|
2010
|
2009
|
||||||||||
|
Federal statutory rate
|
34 | % | 34 | % | 34 | % | ||||||
|
State rate, net of federal benefit
|
6 | 8 | 9 | |||||||||
|
Tax credits
|
(9 | ) | (128 | ) | (88 | ) | ||||||
|
Change in valuation allowance
|
(50 | ) | (558 | ) | 30 | |||||||
|
State tax rate change
|
0 | 157 | 0 | |||||||||
|
Non-qualified option cancellations and forfeitures
|
11 | 394 | 0 | |||||||||
|
Nondeductible compensation expense
|
(1 | ) | 0 | 6 | ||||||||
|
Prior year adjustment
|
(2 | ) | 5 | 0 | ||||||||
|
Expiring NOLs and tax credits
|
10 | 84 | 8 | |||||||||
|
Other
|
1 | 5 | 2 | |||||||||
|
Effective tax rate
|
0 | % | 1 | % | 1 | % | ||||||
At December 31, 2011, we had federal net operating loss (“NOL”) and research and development credit carryforwards of approximately $51.4 million and $13.6 million respectively, expiring in 2012 through various dates up through 2031. In 2011, no NOLs and approximately $114,000 of research and development credits expired unused.
For state purposes, we had state NOLs and research and development credit carryforwards of approximately $9.3 million and $7.4 million respectively, expiring in 2012 through various dates up to 2026. In 2011, approximately $2.2 million of state NOLs expired unused and $79,000 research and development credits expired unused.
Ownership changes, as defined in Section 382, could limit the amount of net operating loss carryforwards and research and development credits that can be utilized annually to offset future taxable income.
We recorded a full valuation allowance against our deferred tax assets because based on all the available evidence, we continue to believe that it is more likely than not that our deferred tax assets are not currently realizable. In reaching this determination, we evaluated our three-year cumulative results as well as the impact that current economic conditions may have on our future results.
We will continue to assess the level of valuation allowance required in future periods. Should more positive than negative evidence regarding the realizability of tax assets exist at a future point in time, the valuation allowance may be reduced or eliminated altogether.
47
AWARE, INC.
NOTES TO CONSOLIDATED FINANCIAL STATEMENTS
We did not record a provision for federal income taxes in 2011, 2010, and 2009 due to tax net operating losses and the uncertainty of the timing of profitability in future periods. However, in 2011, 2010 and 2009 we paid immaterial amounts of state excise taxes.
Gross deferred tax assets include cumulative deductions for stock options in excess of book expense of $62.6 million. None of the benefit related to these options has been reflected in equity because we determined that it was more likely than not that such deferred tax assets may not be realized. Therefore, the portion of the deferred tax asset valuation allowance related to the tax benefit of these options must be recorded to equity, when the tax benefit is realized. The estimated federal amount of this benefit is $22.9 million, and the estimated state amount is $0.6 million for a total amount of $23.5 million.
Our policy is to recognize interest and penalties related to uncertain tax positions in income tax expense. As of December 31, 2011, we had no accrued interest or penalties related to uncertain tax positions.
|
7.
|
EQUITY AND STOCK COMPENSATION PLANS
|
At December 31, 2011, we have three stock-based compensation plans, which are described below:
Fixed Stock Option Plans
– We have two fixed option plans. Under our 1996 Stock Option Plan (“1996 Plan”), we were authorized to grant incentive stock options and nonqualified stock options to our employees and directors for up to 6,100,000 shares of common stock. There were no shares available for grant under the 1996 Plan as of December 31, 2011. Under our 2001 Nonqualified Stock Plan (“2001 Plan”), we are authorized to grant nonqualified stock options, stock appreciation rights and stock awards to our employees and directors for up to 8,000,000 shares of common stock. As of December 31, 2011, there were 4,671,784 shares available for grant under the 2001 Plan.
Under both plans, options are granted at exercise prices as determined by the Board of Directors and have terms ranging from four to a maximum of ten years. Our options generally vest over three to five years, although we have granted options that are 50% or fully vested on the date of grant.
The following table presents stock-based employee compensation expenses included in our consolidated statements of operations (in thousands):
|
2011
|
2010
|
2009
|
||||||||||
|
Cost of product sales
|
$ | 7 | $ | 10 | $ | 10 | ||||||
|
Cost of services
|
33 | 19 | 114 | |||||||||
|
Research and development
|
234 | 337 | 521 | |||||||||
|
Selling and marketing
|
144 | 98 | 293 | |||||||||
|
General and administrative
|
859 | 1,031 | 799 | |||||||||
|
Stock-based compensation expense
|
$ | 1,277 | $ | 1,495 | $ | 1,737 | ||||||
Stock-based compensation expenses in the preceding table include expenses associated with grants of: i) stock options; ii) stock appreciation rights (SARs); and iii) unrestricted shares of our common stock. The method used to determine stock-based compensation expense for each type of equity grant is described in the following paragraphs.
Stock Option and SAR Grants.
For the years ended December 31, 2011, 2010, and 2009, we granted stock options for 0, 0, and 3,400 shares, respectively. For the year ended December 31, 2009, we granted SARs to directors and officers representing 110,000 shares. We estimate the fair value of stock options and SARs using the Black-Scholes valuation model. We believe this valuation model is appropriate for SARs, as well as stock options, as SARs share most of the characteristics of stock options.
48
AWARE, INC.
NOTES TO CONSOLIDATED FINANCIAL STATEMENTS
The Black-Scholes valuation model takes into account the exercise price of the award, as well as a variety of significant assumptions. The assumptions used to estimate the fair value of stock options and SARs include the expected term, the expected volatility of our stock over the expected term, the risk-free interest rate over the expected term, and our expected annual dividend yield. We believe that the valuation technique and the approach utilized to develop the underlying assumptions are appropriate in calculating the fair values of stock options and SARs granted in the year ended December 31, 2009. Estimates of fair value are not intended to predict actual future events or the value ultimately realized by persons who receive equity awards.
Specific assumptions used to determine the fair value of options granted during the years ended December 31, 2011, 2010 and 2009, using the Black-Scholes valuation model were:
|
Year Ended
December 31, 2011
|
Year Ended
December 31, 2010
|
Year Ended
December 31, 2009
|
||||||||||
|
Expected term (1)
|
n/a | n/a |
6.58-6.73 years
|
|||||||||
|
Expected volatility factor (2)
|
n/a | n/a | 60-62 | % | ||||||||
|
Risk-free interest rate (3)
|
n/a | n/a | 1.76-2.47 | % | ||||||||
|
Expected annual dividend yield
|
n/a | n/a | — | |||||||||
(1) The expected term for each grant for the year ended December 31, 2009 was determined based on the historical average term of grants issued over the previous seven years.
(2) The expected volatility for each grant is estimated based on an average of historical volatility over a period of time which we believe to be representative of our future volatility.
(3) The risk-free interest rate for each grant is based on the U.S. Treasury yield curve in effect at the time of grant for a period equal to the expected term of the stock option.
We do not estimate our forfeiture rates as the actual forfeiture rate is known at the end of each reporting period due to the timing of our stock option vesting.
In the years ended December 31, 2010 and 2009, there were two stock option events that affected options outstanding and stock-based compensation expense:
Year ended December 31, 2010.
In January 2010, we completed an employee option exchange program. Under the terms of the program, eligible rank and file employees had the right to exchange eligible vested and unvested stock options outstanding for shares of common stock. Exchange ratios for each eligible stock option were determined using the fair values of stock options and Aware’s common stock immediately prior to the initiation of the program. Employees exchanged 820,481 stock options for 178,314 shares of common stock. Employees were also allowed to surrender a portion of their common stock in return for the Company paying withholding taxes related to their stock grants. As a result of this provision, employees surrendered 60,659 shares of common stock and we paid approximately $161,000 of withholding taxes on their behalf. After the tax related share surrender, 117,655 net shares of common stock were issued to participating employees. The option exchange program had an insignificant impact on stock-based compensation expense for the year ended December 31, 2010.
Year ended December 31, 2009.
In September 2009, the compensation committee of the board of directors approved an amendment to certain director and officer stock options that extended the period of time option holders have to exercise upon termination from the Company. This stock option modification resulted in a total non-cash stock-based compensation charge of approximately $282,000 of which $11,000, $20,000 and $251,000, respectively was charged to expense in the years ended December 31, 2011, 2010 and 2009.
49
AWARE, INC.
NOTES TO CONSOLIDATED FINANCIAL STATEMENTS
Unrestricted Stock Grants
. Our 2001 Plan permits us to grant shares of unrestricted stock to our directors, officers and employees. For the years ended December 31, 2011, 2010, and 2009, we awarded 105,000, 575,443, and 25,000 shares, respectively to eligible plan participants. Stock-based compensation expense for stock grants is determined based on the fair market value of our stock on the date of grant; provided the number of shares in the grant is fixed on the grant date. Unrestricted stock grant activity for the years ended December 31, 2011, 2010 and 2009 is described below:
Year ended December 31, 2011
. Our former President and CEO resigned in April 2011. As part of his separation arrangement he was granted 105,000 shares of common stock, which resulted in a stock-based compensation charge of $362,000. His grant contained a provision that allowed him to surrender a portion of his stock in return for the Company paying his related withholding taxes. He exercised that provision, and we issued 71,662 shares of common stock to him and paid $115,000 of withholding taxes on his behalf.
Year ended December 31, 2010
. In July 2010, our compensation committee granted 575,443 shares of unrestricted stock, which included 102,040 shares to directors and 473,403 shares to officers and employees. Shares granted to directors and one employee representing a total of 111,163 shares were issued to those individuals in 2010, which resulted in a stock-based compensation charge of $281,000 in the year ended December 31, 2010.
All other shares granted to officers and employees representing a total of 464,280 shares were not issued in 2010. Such grants are being issued to grantees in four equal increments on December 31, 2010, June 30, 2011, December 31, 2011, and June 30, 2012; provided that grantees remain employed on each of those dates. The total stock-based compensation charge associated with this grant is being amortized over the related two-year service period. For the years ended December 31, 2011 and 2010, $443,000 and $293,000 of stock-based compensation expense was charged to expense, respectively. At December 31, 2011, unrecognized compensation expense was approximately $195,000, which is expected to be recognized over a weighted average period of 0.38 years.
In connection with this stock grant, we issued 115,682 shares on January 4, 2011 to officers and employees who were employed as of December 31, 2010 and 79,304 shares on July 1, 2011 to officers and employees who were employed as of June 30, 2011. Grantees were allowed to surrender a portion of their stock in return for the Company paying their related withholding taxes. As a result of this provision, grantees surrendered 13,721 and 23,277 shares of common stock and the Company paid approximately $39,000 and $70,000 of withholding taxes on their behalf on January 4, 2011 and July 1, 2011, respectively. After the share surrender, 101,961 and 56,027 net shares of common stock were issued on January 4, 2011 and July 1, 2011, respectively.
Year ended December 31, 2009.
In 2009, we issued 25,000 shares of unrestricted stock to an employee representing $60,000 of stock-based compensation expense. This expense was charged against gain on sale of assets in connection with the Lantiq transaction.
A summary of stock option and SAR transactions for our two fixed stock option plans for the years ended December 31, 2011, 2010, and 2009 are presented below:
|
2011
|
2010
|
2009
|
||||||||||||||||||||||
|
Shares
|
Weighted
Average
Exercise
Price
|
Shares
|
Weighted
Average
Exercise
Price
|
Shares
|
Weighted
Average
Exercise
Price
|
|||||||||||||||||||
|
Outstanding at beginning of year
|
5,082,891 | $ | 4.30 | 6,019,972 | $ | 4.42 | 7,538,993 | $ | 4.68 | |||||||||||||||
|
Granted
|
- | - | - | - | 113,400 | 2.51 | ||||||||||||||||||
|
Exercised
|
(632,685 | ) | 3.02 | (625 | ) | 1.68 | (187 | ) | 1.68 | |||||||||||||||
|
Forfeited or cancelled
|
(1,614,254 | ) | 4.59 | (936,456 | ) | 5.09 | (1,632,234 | ) | 5.48 | |||||||||||||||
|
Outstanding at end of year
|
2,835,952 | $ | 4.42 | 5,082,891 | $ | 4.30 | 6,019,972 | $ | 4.42 | |||||||||||||||
|
Exercisable at year end
|
2,772,109 | $ | 4.44 | 4,750,409 | $ | 4.34 | 5,269,969 | $ | 4.51 | |||||||||||||||
All options and SARs granted during the year ended December 31, 2009 had exercise prices equal to the fair market value of our common stock on the date of grant, and the weighted average grant date fair values of options granted were $1.51.
50
AWARE, INC.
NOTES TO CONSOLIDATED FINANCIAL STATEMENTS
At December 31, 2011, the weighted average remaining contractual term for total options outstanding and total options exercisable was approximately 4 years for each.
At December 31, 2011, the aggregate intrinsic value of options outstanding and options exercisable was zero as each group of options was out-of-the money by approximately $4.0 million. The intrinsic value of a stock option is the amount by which the market value of the underlying stock exceeds the exercise price of the option. The aggregate intrinsic value of options exercised during the year ended December 31, 2011 was approximately $163,000.
The following table summarizes the stock options and SARs outstanding at December 31, 2011:
|
Options Outstanding
|
Options Exercisable
|
|||||||||||||||||||
|
Exercise Price
Range
|
Number
|
Weighted
Average
Exercise
Price
|
Weighted Average
Remaining
Contractual
Term (in years)
|
Number
|
Weighted
Average
Exercise
Price
|
|||||||||||||||
|
$0 to $2
|
5,750 | $ | 1.83 | 3.97 | 5,171 | $ | 1.83 | |||||||||||||
|
$2 to $3
|
311,288 | 2.87 | 3.51 | 310,981 | 2.87 | |||||||||||||||
|
$3 to $4
|
1,220,164 | 3.50 | 4.35 | 1,157,207 | 3.49 | |||||||||||||||
|
$4 to $5
|
235,350 | 4.63 | 5.94 | 235,350 | 4.63 | |||||||||||||||
|
$5 to $6
|
196,900 | 5.09 | 2.57 | 196,900 | 5.09 | |||||||||||||||
|
$6 to $7
|
866,500 | 6.08 | 3.02 | 866,500 | 6.08 | |||||||||||||||
| 2,835,952 | $ | 4.42 | 3.86 | 2,772,109 | $ | 4.44 | ||||||||||||||
At December 31, 2011, unrecognized compensation expense related to non-vested stock options was approximately $127,000, which is expected to be recognized over a weighted average period of 0.6 years.
We issue common stock from previously authorized but unissued shares to satisfy option exercises and purchases under our Employee Stock Purchase Plan.
Employee Stock Purchase Plan
- In June 1996, we adopted an Employee Stock Purchase Plan (the “ESPP Plan”) under which eligible employees could purchase common stock at a price equal to 85% of the lower of the fair market value of the common stock at the beginning or end of each six-month offering period. On November 29, 2005 we amended the ESPP Plan to provide that eligible employees may purchase common stock at a price equal to 95% of the fair market value of the common stock as of the end of each six-month offering period. There is no stock-based compensation expense related to our Employee Stock Purchase Plan because it is not considered a compensatory plan. The plan does not have a look-back feature, and has a minimal discount of 5% of the fair market value of the common stock as of the end of each six-month offering period. Participation in the ESPP Plan is limited to 6% of an employee’s compensation, may be terminated at any time by the employee and automatically ends on termination of employment. A total of 350,000 shares of common stock have been reserved for issuance. As of December 31, 2011 there were 120,816 shares available for future issuance under the ESPP Plan. We issued 5,563, 3,105, and 3,176 common shares under the ESPP Plan in 2011, 2010, and 2009, respectively.
Stockholder Rights Plan
– In October 2001, our board of directors adopted a stockholder rights plan and declared a dividend distribution of one share purchase right (a “Right”) for each outstanding share of our common stock to stockholders of record at the close of business on October 15, 2001. Each share of common stock issued after that date also carried with it one Right, subject to certain exceptions. Each Right, when it became exercisable, entitled the record holder to purchase from us one ten-thousandth of a share of series A preferred stock at an exercise price of $40.00 subject to adjustment. This plan expired on October 2, 2011.
51
AWARE, INC.
NOTES TO CONSOLIDATED FINANCIAL STATEMENTS
Share Repurchases -
In March 2009, we announced a modified Dutch auction self-tender offer to purchase up to 3,500,000 shares, or approximately 15%, of our outstanding common stock (including the associated preferred share purchase rights), at a price in the range of $2.20 to $2.60 per share, for a maximum aggregate purchase price of approximately $9.1 million. The terms of the tender offer also provided the right for us to purchase up to an additional 2% of our shares if the offer was oversubscribed. When the tender offer closed in April 2009, we repurchased 3,500,252 shares at $2.50 per share for a total cost of $9.0 million, including expenses.
During July 2011, we purchased 250,000 shares of our common stock at a price of $2.90 per share from a shareholder in a privately negotiated transaction. In addition, we paid a broker commission of 4 cents per share in connection with the transaction.
|
8.
|
COMMITMENTS AND CONTINGENT LIABILITIES
|
Lease Commitments
– We own our principal office and research facility in Bedford, Massachusetts, which we have occupied since November 1997. We conduct a portion of our activities in a leased facility in California under a non-cancelable operating lease that expires in 2013. The following is a schedule of future minimum rental payments (in thousands):
|
Year ended December 31,
|
||||
|
2012
|
$ | 18 | ||
|
2013
|
13 | |||
|
Total minimum lease payments
|
$ | 31 | ||
Rental expense was approximately $17,000, $16,000, and $13,000 in 2011, 2010 and 2009, respectively.
Litigation
- There are no material pending legal proceedings to which we are a party or to which any of our properties are subject which, either individually or in the aggregate, are expected to have a material adverse effect on our business, financial position or results of operations.
Guarantees and Indemnification Obligations
–
We enter into agreements in the ordinary course of business that require us: i) to perform under the terms of the contracts, ii) to protect the confidentiality of our customers’ intellectual property, and iii) to indemnify customers, including indemnification against third party claims alleging infringement of intellectual property rights. We also have agreements with each of our directors and executive officers to indemnify such directors or executive officers, to the extent legally permissible, against all liabilities reasonably incurred in connection with any action in which such individual may be involved by reason of such individual being or having been a director or officer of the Company.
Given the nature of the above obligations and agreements, we are unable to make a reasonable estimate of the maximum potential amount that we could be required to pay. Historically, we have not made any significant payments on the above guarantees and indemnifications and no amount has been accrued in the accompanying consolidated financial statements with respect to these guarantees and indemnifications.
52
AWARE, INC.
NOTES TO CONSOLIDATED FINANCIAL STATEMENTS
9. BUSINESS SEGMENTS AND MAJOR CUSTOMERS
|
Commencing in the fourth quarter of fiscal 2011, the company began reporting the results of operations for the following reportable segments (in thousands):
|
||||||||||||||||
|
Biometrics
|
DSL
|
|||||||||||||||
|
&
|
Service
|
Total
|
||||||||||||||
|
Imaging
|
Assurance
|
Corporate
|
Company
|
|||||||||||||
|
Year Ended December 31, 2011
|
||||||||||||||||
|
Revenue
|
$ | 14,052 | $ | 8,387 | $ | 2,147 | $ | 24,586 | ||||||||
|
Income (loss) from operations
|
6,262 | (1,988 | ) | (1,788 | ) | 2,486 | ||||||||||
|
Interest income
|
83 | 83 | ||||||||||||||
|
Income before provision for income taxes
|
2,569 | |||||||||||||||
|
Provisions for income taxes
|
(2 | ) | (2 | ) | ||||||||||||
|
Net income
|
$ | 2,567 | ||||||||||||||
|
Year Ended December 31, 2010
|
||||||||||||||||
|
Revenue
|
$ | 10,000 | $ | 10,585 | $ | 2,975 | $ | 23,560 | ||||||||
|
Income (loss) from operations
|
2,911 | (1,017 | ) | (2,227 | ) | (333 | ) | |||||||||
|
Other income
|
425 | 425 | ||||||||||||||
|
Interest income
|
90 | 90 | ||||||||||||||
|
Income before provision for income taxes
|
182 | |||||||||||||||
|
Provisions for income taxes
|
(2 | ) | (2 | ) | ||||||||||||
|
Net income
|
$ | 180 | ||||||||||||||
|
Year Ended December 31, 2009
|
||||||||||||||||
|
Revenue
|
$ | 10,568 | $ | 6,186 | $ | 5,288 | $ | 22,042 | ||||||||
|
Income (loss) from operations
|
3,274 | (3,000 | ) | (5,756 | ) | (5,482 | ) | |||||||||
|
Gain on sale of assets
|
6,230 | 6,230 | ||||||||||||||
|
Interest income
|
238 | 238 | ||||||||||||||
|
Income before provision for income taxes
|
986 | |||||||||||||||
|
Provisions for income taxes
|
(4 | ) | (4 | ) | ||||||||||||
|
Net income
|
$ | 982 | ||||||||||||||
| We conduct our operations in the United States and sell our products and services to domestic and international customers. Revenues were generated from the following geographic regions (in thousands): | ||||||||||||||||
|
Year ended December 31,
|
||||||||||||
|
2011
|
2010
|
2009
|
||||||||||
|
United States
|
$ | 14,687 | $ | 12,289 | $ | 12,235 | ||||||
|
Germany
|
1,686 | 2,770 | 5,375 | |||||||||
|
Rest of world
|
8,213 | 8,501 | 4,432 | |||||||||
| $ | 24,586 | $ | 23,560 | $ | 22,042 | |||||||
|
The portion of total revenue that was derived from major customers was as follows:
|
||||||||||||
|
Year ended December 31,
|
||||||||||||
|
2011
|
2010
|
2009
|
||||||||||
|
Customer A
|
- | % | 11 | % | 4 | % | ||||||
|
Customer B
|
- | % | - | % | 19 | % | ||||||
53
AWARE, INC.
NOTES TO CONSOLIDATED FINANCIAL STATEMENTS
|
10.
|
EMPLOYEE BENEFIT PLAN
|
In 1994, we established a qualified 401(k) Retirement Plan (the “Plan”) under which employees are allowed to contribute certain percentages of their pay, up to the maximum allowed under Section 401(k) of the Internal Revenue Code. Our contributions to the Plan are at the discretion of the Board of Directors. Our contributions were approximately $239,000, $239,000, and $363,000 in 2011, 2010 and 2009, respectively.
|
11.
|
NET INCOME PER SHARE
|
Net income per share is calculated as follows (in thousands, except per share data):
|
Year ended December 31,
|
||||||||||||
|
2011
|
2010
|
2009
|
||||||||||
|
Net income
|
$ | 2,567 | $ | 180 | $ | 982 | ||||||
|
Weighted-average common shares outstanding
|
20,534 | 19,971 | 20,869 | |||||||||
|
Additional dilutive common stock equivalents
|
201 | 211 | 5 | |||||||||
|
Diluted shares outstanding
|
20,735 | 20,182 | 20,874 | |||||||||
|
Net income per share – basic
|
$ | 0.12 | $ | 0.01 | $ | 0.05 | ||||||
|
Net income per share – diluted
|
$ | 0.12 | $ | 0.01 | $ | 0.05 | ||||||
For the years ended December 31, 2011, 2010 and 2009, options to purchase 2,518,914, 4,936,391, and 5,970,722 shares of common stock at weighted average exercise prices of $4.62, $4.36, and $4.44 per share, respectively, were outstanding, but were not included
in the computation of diluted EPS because the options’ exercise prices were greater than the average market price of the common shares and thus would be anti-dilutive.
|
12.
|
QUARTERLY RESULTS OF OPERATIONS – UNAUDITED
|
The following table presents unaudited quarterly operating results for each of our quarters in the two-year period ended December 31, 2011 (in thousands, except per share data):
|
2011 Quarters Ended
|
||||||||||||||||
|
March 31
|
June 30
|
September 30
|
December 31
|
|||||||||||||
|
Revenue
|
$ | 6,358 | $ | 5,913 | $ | 6,422 | $ | 5,892 | ||||||||
|
Gross profit
|
4,781 | 4,376 | 5,231 | 4,784 | ||||||||||||
|
Income (loss) from operations
|
572 | (283 | ) | 1,272 | 924 | |||||||||||
|
Net income (loss)
|
590 | (267 | ) | 1,284 | 959 | |||||||||||
|
Net income (loss) per share – basic
|
$ | 0.03 | ($ | 0.01 | ) | $ | 0.06 | $ | 0.05 | |||||||
|
Net income (loss) per share – diluted
|
$ | 0.03 | ($ | 0.01 | ) | $ | 0.06 | $ | 0.05 | |||||||
54
AWARE, INC.
NOTES TO CONSOLIDATED FINANCIAL STATEMENTS
|
2010 Quarters Ended
|
||||||||||||||||
|
March 31
|
June 30
|
September 30
|
December 31
|
|||||||||||||
|
Revenue
|
$ | 5,616 | $ | 4,971 | $ | 6,151 | $ | 6,822 | ||||||||
|
Gross profit
|
4,508 | 4,057 | 4,709 | 5,210 | ||||||||||||
|
Income (loss) from operations
|
5 | (494 | ) | (52 | ) | 208 | ||||||||||
|
Other income
|
- | 325 | 100 | - | ||||||||||||
|
Net income (loss)
|
22 | (148 | ) | 76 | 230 | |||||||||||
|
Net income (loss) per share – basic
|
$ | 0.00 | ($ | 0.01 | ) | $ | 0.00 | $ | 0.01 | |||||||
|
Net income (loss) per share – diluted
|
$ | 0.00 | ($ | 0.01 | ) | $ | 0.00 | $ | 0.01 | |||||||
Quarterly amounts may not sum to annual amounts due to rounding and dilution.
|
13.
|
VARIABLE INTEREST ENTITY
|
We have a patent arrangement with a third party that we classify as a variable interest entity. We have no equity interest and are not contractually obligated to fund this entity; therefore our maximum exposure to loss as a result of our involvement with this entity is zero. We may receive royalties in the future if certain conditions are met.
We are not the primary beneficiary of this entity because of shared power. Therefore, we do not consolidate this entity’s financial results into our financial statements. The significant factors used to determine shared power were the contractual provisions within the arrangement that do not provide us with the power to direct the activities that most significantly impact the economic performance of the entity. The carrying amount of the assets and liabilities of this entity in our balance sheet is zero. This arrangement had no impact on our results of operations, financial position or cash flows in the years ended December 31, 2011, 2010 and 2009.
|
14.
|
PATENT MANAGEMENT OPERATIONS
|
As of the date of this report, our board is reviewing strategic options with respect to our patent management operations, including a potential spin-off, sale or licensing of patents.
|
15.
|
SUBSEQUENT EVENT
|
On January 18, 2012, our Board of Directors approved the shutdown of our DSL service assurance hardware product line. This decision was made to position Aware better strategically and to reduce costs. We will continue to build and ship DSL service assurance hardware products to fulfill customer orders that were received as of the date of the shutdown notice. We expect to conclude hardware shipments on or about June 30, 2012. We estimate our total costs related to the shutdown will be approximately $282,000, the majority of which will be severance and employee-related costs.
55
FINANCIAL STATEMENT SCHEDULE
Schedule II - Valuation and Qualifying Accounts – Years ended December 31, 2011, 2010, and 2009
(in thousands)
|
Col. A
|
Col. B
|
Col. C(1)
|
Col. C(2)
|
Col. D
|
Col. E
|
|||||||||||||||
|
Additions
|
||||||||||||||||||||
|
Balance at
|
Charged to
|
Charged
|
Deductions
|
Balance
|
||||||||||||||||
|
Beginning
|
Costs and
|
to Other
|
Charged to
|
at End
|
||||||||||||||||
|
of Period
|
Expenses
|
Accounts
|
Reserves
|
of Period
|
||||||||||||||||
|
Allowance for doubtful accounts receivable:
|
||||||||||||||||||||
|
2011
|
$ | 30 | $ | - | $ | - | $ | - | $ | 30 | ||||||||||
|
2010
|
$ | 30 | $ | - | $ | - | $ | - | $ | 30 | ||||||||||
|
2009
|
$ | 30 | $ | - | $ | - | $ | - | $ | 30 | ||||||||||
|
Inventory reserves:
|
||||||||||||||||||||
|
2011
|
$ | 989 | $ | 450 | $ | - | $ | 36 | $ | 1,403 | ||||||||||
|
2010
|
$ | 1,137 | $ | 305 | $ | - | $ | 453 | $ | 989 | ||||||||||
|
2009
|
$ | 738 | $ | 399 | $ | - | $ | - | $ | 1,137 | ||||||||||
|
Warranty reserves:
|
||||||||||||||||||||
|
2011
|
$ | 0 | $ | - | $ | - | $ | - | $ | 0 | ||||||||||
|
2010
|
$ | 0 | $ | - | $ | - | $ | - | $ | 0 | ||||||||||
|
2009
|
$ | 118 | $ | - | $ | - | $ | 118 | $ | 0 | ||||||||||
|
Deferred tax asset valuation allowance:
|
||||||||||||||||||||
|
2011
|
$ | 41,759 | $ | - | ($ | 1,283 | ) | $ | - | $ | 40,476 | |||||||||
|
2010
|
$ | 42,770 | $ | - | ($ | 1,011 | ) | $ | - | $ | 41,759 | |||||||||
|
2009
|
$ | 42,481 | $ | - | $ | 289 | $ | - | $ | 42,770 | ||||||||||
56
Not applicable.
Conclusion Regarding the Effectiveness of Disclosure Controls and Procedures
Under the supervision and with the participation of our management, including our co-chief executive officers and chief financial officer, we conducted an evaluation of our disclosure controls and procedures, as such term is defined under Rule 13a-15(e) promulgated under the Securities Exchange Act of 1934, as amended (the Exchange Act). Based on this evaluation, our co-chief executive officers and chief financial officer concluded that our disclosure controls and procedures were effective as of the end of the period covered by this annual report.
Evaluation of Changes in Internal Control Over Financial Reporting
Under the supervision and with the participation of our management, including our co-chief executive officers and chief financial officer, we concluded that there were no changes in our internal control over financial reporting that occurred during the quarterly period ended December 31, 2011 that have materially affected, or are reasonably likely to materially affect, our internal control over financial reporting.
Management’s Report on Internal Control Over Financial Reporting
Our management is responsible for establishing and maintaining adequate internal control over financial reporting, as such term is defined in Exchange Act Rule 13a-15(f). Under the supervision and with the participation of our management, including our principal co-executive officers and principal financial officer, we conducted an evaluation of the effectiveness of our internal control over financial reporting based on the framework in
Internal Control - Integrated Framework
issued by the Committee of Sponsoring Organizations of the Treadway Commission. Based on our evaluation under the framework in
Internal Control — Integrated Framework
, our management concluded that our internal control over financial reporting was effective as of December 31, 2011.
The effectiveness of our internal control over financial reporting as of December 31, 2011 has been audited by PricewaterhouseCoopers LLP, an independent registered public accounting firm, as stated in their report which is included herein.
None.
57
The information required by Item 10 of Form 10-K is incorporated by reference from the information contained in the sections captioned
“Directors and Executive Officers”, “Corporate Governance
” and
“Section 16(a
)
Beneficial Ownership Reporting Compliance”
in the Proxy Statement that will be delivered to our shareholders in connection with our May 23, 2012 Annual Meeting of Shareholders.
The information required by Item 11 of Form 10-K is incorporated by reference from the information contained in the section captioned
“Executive Compensation”
in the Proxy Statement that will be delivered to our shareholders in connection with our May 23, 2012 Annual Meeting of Shareholders.
The information required by Item 12 of Form 10-K is incorporated by reference from the information contained in the section captioned
“Security Ownership of Certain Beneficial Owners and Management and Related Stockholder Matters”
in the Proxy Statement that will be delivered to our shareholders in connection with our May 23, 2012 Annual Meeting of Shareholders.
The information, if any, required by Item 13 of Form 10-K is incorporated by reference from the information contained in the sections captioned
“Corporate Governance”
and
“Certain Relationships and Related Transactions”
in the Proxy Statement that will be delivered to our shareholders in connection with our May 23, 2012 Annual Meeting of Shareholders.
The information required by Item 14 of Form 10-K is incorporated by reference from the information contained in the section captioned
“Independent Accountants”
in the Proxy Statement that will be delivered to our shareholders in connection with our May 23, 2012 Annual Meeting of Shareholders.
58
The following documents are filed as part of this report:
(a)
Financial Statements and Exhibits
:
|
Page
|
|
|
(1) Report of Independent Registered Public Accounting Firm
|
36
|
|
Consolidated Balance Sheets as of December 31, 2011 and 2010
|
37
|
|
Consolidated Statements of Operations for each of the three
years in the period ended December 31, 2011
|
38
|
|
Consolidated Statements of Cash Flows for each of the
three years in the period ended December 31, 2011
|
39
|
|
Consolidated Statements of Stockholders’ Equity for each of
the three years in the period ended December 31, 2011
|
40
|
|
Notes to Consolidated Financial Statements
|
41
|
|
(2) Schedule II - Valuation and Qualifying Accounts
|
56
|
(3) Exhibits:
The exhibits listed below are filed with or incorporated by reference in this report.
|
Exhibit No.
|
Description of Exhibit
|
|||
|
3.1
|
Amended and Restated Articles of Organization, as amended (filed as Exhibit 3.1 to the Company’s Form 10-K for the year ended December 31, 2008 and incorporated herein by reference).
|
|||
|
3.2
|
Amended and Restated By-Laws (filed as Exhibit 3.1 to the Company’s Form 8-K filed with the Securities and Exchange Commission on December 10, 2007 and incorporated herein by reference).
|
|||
|
10.1*
|
1996 Stock Option Plan, as amended and restated (filed as Annex A to the Company’s Definitive Proxy Statement filed with the Securities and Exchange Commission on April 11, 2000 and incorporated herein by reference).
|
|||
|
10.2*
|
1996 Employee Stock Purchase Plan, as amended and restated (filed as Exhibit 99.1 to the Company’s Current Report on Form 8-K filed with the Securities and Exchange Commission on November 29, 2005 and incorporated herein by reference).
|
|||
|
10.3*
|
Form of Indemnification Agreement for Directors and Officers of Aware, Inc. (filed as Exhibit 10.1 to the Company’s Form 8-K filed with the Securities and Exchange Commission on February 22, 2011 and incorporated herein by reference).
|
|||
|
10.4*
|
2001 Nonqualified Stock Plan (filed as Exhibit 99(d)(4) to the Company’s Schedule TO filed with the Securities and Exchange Commission on March 3, 2003 and incorporated herein by reference).
|
|||
| 10.5* | Form of Nonqualified Stock Option Agreement under the 2001 Nonqualified Stock Plan for options granted to executive officers and directors prior to May 21, 2008 (filed as Exhibit 10.6 to Company’s Form 10-K for the year ended December 31, 2006 and incorporated herein by reference). | |||
|
10.6*
|
Form of Nonqualified Stock Option Agreement under the 2001 Nonqualified Stock Plan for options granted to executive officers and directors from and after May 21, 2008 (filed as Exhibit 10.8 to Company’s Form 8-K on May 22, 2008 and incorporated herein by reference)
|
|||
|
10.7*
|
Form of Unrestricted Stock Award for outside directors of Aware under the 2001 Nonqualified Stock Plan (filed as Exhibit 10.1 to Company’s Form 8-K filed with the Securities and Exchange Commission on July 28, 2010 and incorporated herein by reference).
|
|||
|
10.8*
|
Form of Unrestricted Stock Award for officers of Aware under the 2001 Nonqualified Stock Plan (filed as Exhibit 10.2 to Company’s Form 8-K filed with the Securities and Exchange Commission on July 28, 2010 and incorporated herein by reference).
|
|||
59
|
10.9
|
Asset Purchase Agreement by and between Aware, Inc. and Lantiq Broadband Holdco, Inc. and Lantiq Deutschland GmbH dated October 14, 2009 (filed as Exhibit 10.8 to Company’s Form 10-K for the year ended December 31, 2009 and incorporated herein by reference).
|
|||
|
10.10*
|
Separation Agreement dated April 1, 2011 between Aware, Inc. and Edmund C. Reiter (filed as Exhibit 10.1 to the Company’s Form 8-K filed with the Securities and Exchange Commission on April 1, 2011 and incorporated herein by reference).
|
|||
|
10.11*
|
Consulting Agreement dated April 1, 2011 between Aware, Inc. and Edmund C. Reiter (filed as Exhibit 10.2 to the Company’s Form 8-K filed with the Securities and Exchange Commission on April 1, 2011 and incorporated herein by reference).
|
|||
|
21.1
|
Subsidiaries of Registrant.
|
|||
|
23.1
|
Consent of Independent Registered Public Accounting Firm.
|
|||
|
31.1
|
Certification of co-Chief Executive Officer pursuant to Section 302 of the Sarbanes-Oxley Act of 2002.
|
|||
|
31.2
|
Certification of co-Chief Executive Officer and Chief Financial Officer pursuant to Section 302 of the Sarbanes-Oxley Act of 2002.
|
|||
|
32.1
|
Certification of Chief Executive Officer and Chief Financial Officer pursuant to Section 906 of the Sarbanes-Oxley Act of 2002.
|
|||
*
Management contract or compensatory plan.
60
SIGNATURES
Pursuant to the requirements of Section 13 or 15(d) of the Securities Exchange Act of 1934, the Registrant has duly caused this report to be signed on its behalf by the undersigned, thereunto duly authorized.
| AWARE, INC. | |||
|
|
By:
|
/s/ Kevin T. Russell | |
|
Kevin T. Russell
co-Chief Executive Officer & co-President
General Counsel
|
|||
|
|
By:
|
/s/ Richard P. Moberg | |
|
Richard P. Moberg
co-Chief Executive Officer & co-President
Chief Financial Officer (Principal Financial and
Accounting Officer)
|
|||
|
Date: February 21, 2012
|
|||
Pursuant to the requirements of the Securities Exchange Act of 1934, this report has been signed below by the following persons on behalf of the registrant and in the capacities indicated on the 21
st
day of February 2012.
| Signature | Title | |||||
|
/s/ Kevin T. Russell
|
co-Chief Executive Officer, co-President,
|
|||||
|
Kevin T. Russell
|
General Counsel & Director
|
|||||
|
(co-Principal Executive Officer)
|
||||||
|
/s/ Richard P. Moberg
|
co-Chief Executive Officer, co-President,
|
|||||
|
Richard P. Moberg
|
Chief Financial Officer & Director
|
|||||
|
(co-Principal Executive Officer)
|
||||||
|
(Principal Financial and Accounting Officer)
|
||||||
|
/s/ John S. Stafford, Jr.
|
Chairman of the Board & Director
|
|||||
|
John S. Stafford, Jr.
|
||||||
|
/s/ John S. Stafford, III
|
Director
|
|||||
|
John S. Stafford, III
|
||||||
|
/s/ Adrian F. Kruse
|
Director
|
|||||
|
Adrian F. Kruse
|
||||||
|
/s/ Mark G. McGrath
|
Director
|
|||||
|
Mark G. McGrath
|
||||||
61
TABLE OF CONTENTS
Part IItem 1. BusinessItem 1A. Risk FactorsItem 1B. Unresolved Staff CommentsItem 2. PropertiesItem 3. Legal ProceedingsItem 4. Mine Safety DisclosuresPart IIItem 5. Market For Registrant S Common Equity, Related Stockholder Matters and Issuer Purchases Of Equity SecuritiesItem 6. Selected Financial DataItem 7. Management S Discussion and Analysis Of Financial Condition and Results Of OperationsItem 7A. Quantitative and Qualitative Disclosures About Market RiskItem 8. Financial Statements and Supplementary DataItem 9. Changes in and Disagreements with Accountants on Accounting and Financial DisclosureItem 9A. Controls and ProceduresItem 9B. Other InformationPart IIIItem 10. Directors, Executive Officers and Corporate GovernanceItem 11. Executive CompensationItem 12. Security Ownership Of Certain Beneficial Owners and Management and Related Stockholder MattersItem 13. Certain Relationships and Related Transactions, and Director IndependenceItem 14. Principal Accountant Fees and ServicesPart IVItem 15. Exhibits and Financial Statement Schedule