AWARE INC /MA/
10-Ks and 10-Qs
|
|
|
|
|
|
|
|
|
|
|
|
|
|
|
|
|
|
|
|
|
|
|
|
|
|
|
|
|
|
|
|
|
|
|
|
|
|
|
|
|
|
|
|
|
|
|
|
|
|
|
|
|
|
|
|
|
|
|
|
|
|
|
|
|
|
|
|
UNITED STATES
SECURITIES AND EXCHANGE COMMISSION
Washington, D.C. 20549
FORM 10-K
Annual Report Pursuant to Section 13 or 15(d) of The
Securities Exchange Act of 1934
For the fiscal year ended December 31, 2014
Commission file number 000-21129
| AWARE, INC. | ||||||||
| (Exact Name of Registrant as Specified in Its Charter) | ||||||||
| Massachusetts | 04-2911026 | |||||||
| (State or Other Jurisdiction of | (I.R.S. Employer Identification No.) | |||||||
| Incorporation or Organization) | ||||||||
| 40 Middlesex Turnpike, Bedford, Massachusetts 01730 | ||||
|
(Address of Principal Executive Offices)
|
||||
| (Zip Code) | ||||
| (781) 276-4000 | ||||
| (Registrant’s Telephone Number, Including Area Code) | ||||
| Securities registered pursuant to Section 12(b) of the Act: | ||||
| Title of Each Class | Name of Each Exchange on Which Registered | ||||
| Common Stock, par value $.01 per share | The Nasdaq Global Market | ||||
Securities registered pursuant to Section 12(g) of the Act:
None
Indicate
by check mark if the registrant is a well-known seasoned issuer, as defined in Rule 405 of the Securities Act. Yes
☐ No
☒
Indicate by check mark if the registrant is not required to file reports pursuant to Section 13 or Section 15(d) of the Exchange Act.
Ye
s
☐ No ☒
Indicate
by c
heck mark whether the registrant (1) has filed all reports required
to be filed by Section 13 or 15(d) of the Securities Exchange Act of 1934 during the preceding 12 months (or for such shorter
period that the registrant was required to file such reports), and (2) has been subject to such filing requirements for the past
90 days. Yes ☒ No
☐
Indicate
by check mark whether the registrant has submitted electronically and posted on its corporate Web site, if any, every Interactive
Data File required to be submitted and posted pursuant to Rule 405 of Regulation S-T (§ 232.405 of this chapter) during the
preceding 12 months (or for such shorter period that the registrant was required to submit and post such files). Yes
☒ No
☐
Indicate
by check mark if disclosure of delinquent filers pursuant to Item 405 of Regulation S-K is not contained herein, and will not
be contained, to the best of registrant’s knowledge, in definitive proxy or information statements incorporated by reference
in Part III of this Form 10-K or any amendment to this Form 10-K. ☒
Indicate by check mark whether the registrant is a large accelerated filer, an accelerated filer, a non-accelerated filer, or a smaller reporting company. See the definitions of “large accelerated filer”, “accelerated filer”, and “smaller reporting company” in Rule 12b-2 of the Exchange Act. (Check one):
| Large Accelerated Filer ☐ | Accelerated Filer ☒ | Non-Accelerated Filer ☐ | Smaller Reporting Company ☐ |
Indicate by check mark whether the registrant is a shell company (as defined in
Rul
e 12b-2 of the Exchange Act). Yes ☐ No
☒
As of June 30, 2014 the aggregate market value of the registrant’s common stock held by non-affiliates of the registrant, based on the closing sale price as reported on the Nasdaq Global Market, was approximately $95,635,924.
The number of shares outstanding of the registrant’s common stock as of February 5, 2015 was 22,865,565.
DOCUMENTS INCORPORATED BY REFERENCE
Portions of the registrant’s definitive Proxy Statement to be delivered to shareholders in connection with the registrant’s Annual Meeting of Shareholders to be held on May 20, 2015 are incorporated by reference into Part III of this Annual Report on Form 10-K.
AWARE, INC.
FORM 10-K
FOR THE YEAR ENDED DECEMBER 31, 2014
TABLE OF CONTENTS
| PART I | ||||
|
Item 1.
|
Business
|
3
|
||
|
Item 1A.
|
Risk Factors
|
14
|
||
|
Item 1B.
|
Unresolved Staff Comments
|
20
|
||
|
Item 2.
|
Properties
|
20
|
||
|
Item 3.
|
Legal Proceedings
|
20
|
||
|
Item 4.
|
Mine Safety Disclosures
|
20
|
||
|
PART II
|
||||
|
Item 5.
|
Market for Registrant’s Common Equity, Related Stockholder Matters and Issuer Purchases of Equity Securities
|
21
|
||
|
Item 6.
|
Selected Financial Data
|
23
|
||
|
Item 7.
|
Management’s Discussion and Analysis of Financial Condition and Results
of Operations
|
24
|
||
|
Item 7A.
|
Quantitative and Qualitative Disclosures About Market Risk
|
37
|
||
|
Item 8.
|
Financial Statements and Supplementary Data
|
38
|
||
|
Item 9.
|
Changes in and Disagreements with Accountants on Accounting and Financial
Disclosure
|
62
|
||
|
Item 9A.
|
Controls and Procedures
|
62
|
||
|
Item 9B.
|
Other Information
|
62
|
||
|
PART III
|
||||
|
Item 10.
|
Directors, Executive Officers and Corporate Governance
|
63
|
||
|
Item 11.
|
Executive Compensation
|
63
|
||
|
Item 12.
|
Security Ownership of Certain Beneficial Owners and Management and Related Stockholder Matters
|
63
|
||
|
Item 13.
|
Certain Relationships and Related Transactions, and Director Independence
|
63
|
||
|
Item 14.
|
Principal Accountant Fees and Services
|
63
|
||
|
PART IV
|
||||
|
Item 15.
|
Exhibits and Financial Statement Schedule
|
64
|
||
|
Signatures
|
66
|
|||
| 2 |
FORWARD LOOKING STATEMENTS
Matters discussed in this Annual Report on Form 10-K relating to future events or our future performance, including any discussion, express or implied, of our anticipated growth, operating results, future earnings per share, market opportunity, plans and objectives, are “forward-looking statements” within the meaning of Section 27A of the Securities Act of 1933, as amended, and Section 21E of the Securities Exchange Act of 1934, as amended. These statements are often identified by the words “may,” “will,” “expect,” “believe,” “anticipate,” “intend,” “could,” “estimate,” or “continue,” and similar expressions or variations. Such forward-looking statements are subject to risks, uncertainties and other factors that could cause actual results and the timing of certain events to differ materially from future results expressed or implied by such forward-looking statements. Factors that could cause or contribute to such differences include, but are not limited to, those discussed in the section titled “Risk Factors,” set forth in Item 1A of this Annual Report on Form 10-K and elsewhere in this Report. The forward-looking statements in this Annual Report on Form 10-K represent our views as of the date of this Annual Report on Form 10-K. We anticipate that subsequent events and developments will cause our views to change. However, while we may elect to update these forward-looking statements at some point in the future, we have no current intention of doing so except to the extent required by applicable law. You should, therefore, not rely on these forward-looking statements as representing our views as of any date subsequent to the date of this Annual Report on Form 10-K.
Company Overview
Aware, Inc. (“Aware”, “we”, “us”, “our”, or the “Company”) is a leading provider of software and services to the biometrics industry. We have been engaged in this business since 1993. Our software products are used in government and commercial biometrics systems to identify or authenticate people. Principal government applications of biometrics systems include border control, law enforcement, national defense, secure credentialing, access control, and background checks. Principal commercial applications include: i) user authentication for login to mobile devices, computers, networks, and software programs; ii) user authentication for financial transactions and purchases (online and in-person); iii) physical access control to buildings, and iv) screening and background checks of prospective employees and customers.
Our products provide interoperable, standards-compliant, field-proven biometric functionality and are used to capture, verify, format, compress and decompress biometric images as well as aggregate, analyze, process, match and transport those images within biometric systems. We sell a broad range of software products for fingerprint, facial, and iris modalities. We also offer a variety of software engineering services, including: i) project planning and management; ii) system design; iii) software design, development, customization, configuration, and testing; and iv) software integration and installation. We sell our biometrics software products and services globally through systems integrators and OEMs, and directly to end user customers.
Aware was incorporated in Massachusetts in 1986. We are headquartered at 40 Middlesex Turnpike in Bedford, Massachusetts, and our telephone number at this address is (781) 276-4000. Our website address is
www.aware.com
. The information on our website is not part of this Form 10-K, unless expressly noted. Our stock is traded on the Nasdaq Global Market under the symbol AWRE.
Industry Background
Biometrics is the measurement of unique, individual physiological characteristics, such as fingerprints, faces, irises, and voices that can be used to determine or verify an individual’s identity. The biometrics industry offers technology that digitally captures and encodes biometric characteristics and then compares those characteristics against previously encoded biometric data to determine or verify an individual’s identity. Biometrics addresses the limitations inherent in traditional identification and authentication processes, such as paper credentials, passwords, PIN codes and magnetic access cards.
| 3 |
The biometrics industry provides identification solutions for a broad range of government and commercial applications. Principal government biometrics applications include border control, law enforcement, national defense, secure credentialing, access control and background checks. Principal commercial applications include: i) user authentication for login to mobile devices, computers, networks, and software programs; ii) user authentication for financial transactions and purchases (online and in-person); iii) physical access control to buildings; and iv) screening and background checks of prospective employees and customers.
We believe that government and commercial entities will continue to adopt and expand the use of biometric-enabled solutions to address the limitations and vulnerabilities of traditional identification processes. We believe the following factors, among others, will contribute to the growth of biometrics solutions: i) government-mandated implementation of identification for employees, citizens, and foreign nationals to enhance national security; ii) military implementations for the identification of terrorists and other hostile persons; iii) increasing threats to personal security encountered in areas such as transportation; iv) government and commercial efforts to detect and reduce fraud and cybercrime; and v) the emergence and adoption of international biometrics standards.
The biometrics industry may be segmented into government and commercial sub-markets. While these markets are similar in many respects and share similar characteristics, other aspects of the markets are different. Important factors that differentiate the government market from the commercial market include: i) principal applications; ii) solutions; and iii) suppliers. We believe that this market-based distinction is important to an understanding of Aware’s business as the vast majority of our revenue is currently derived from government customers.
Government market
Governments were early adopters of biometrics technology and currently represent the largest consumer of the technology. There are sub-sectors within government, such as state, local and national, that use biometric technology. For example, at the local law enforcement level, biometric technology permits more efficient criminal booking and processing and also allows officers in the field to identify potential suspects more reliably and efficiently. Within military organizations, two key applications of biometrics involve: i) the verification and identification of military personnel and contractors; and ii) the collection and processing of biometrics from non-military personnel for the purpose of identifying potential hostile persons. State and local governments also benefit through applications such as background checks, the provision of drivers’ licenses and identification cards and benefits issuance.
At the national level, governments throughout the world have taken steps to improve security in response to heightened concerns over public safety from the threat of terrorism. National governments have mandated increased spending on security measures, implemented new regulations and placed greater emphasis on technology to address growing security concerns. Agencies responsible for immigration and border management use biometrics to help establish the identity of visitors. For example, the U.S. Office of Biometric Identity Management currently requires foreign visitors entering the United States to have their ten fingers scanned and a digital photograph taken to determine if they are present in a watch list. The European Union now mandates that e-passports include fingerprint data in addition to a digital photograph. The biometrics industry continues to benefit from these measures because biometric technology provides a reliable means of establishing and verifying identities.
Government biometrics systems typically operate on client/server-based computer networks. Enrollment workstations with peripheral capture devices are used to “enroll” individuals into biometrics systems. Either fixed enrollment workstations or mobile devices are used to capture, process, and format biometric images. Those images are then transported in digital form to centralized matching systems for identification. Examples of capture peripherals include scanners for fingerprint images, cameras for iris and facial images, and handheld devices for mobile capture of fingerprint, iris, and facial images. Other hardware components used in biometrics systems include computer servers to process and transport biometrics images and mainframe computers and servers to store and match those images. In addition, military applications may employ handheld devices that are capable of capturing images and matching those images against image databases that reside on the devices.
Due to the nature of government applications, particularly those involving security, government biometric systems must be capable of accurately and rapidly matching biometric images against large databases of stored images. The ability to accurately and rapidly match images against databases of millions of images is critical because incorrect or delayed results could have severe adverse consequences. These requirements are an important distinguishing characteristic of the government market as compared to the commercial market.
| 4 |
There are a number of vendors that serve the government biometrics market. We believe these vendors may be segmented into three types of suppliers:
|
i)
|
Technology suppliers
– Within this category, there are suppliers that provide software and hardware technologies that enable biometrics systems.
|
|
Biometrics software products provide functionality that: i) captures and formats images; ii) processes and transports images, and iii) matches images. Companies that sell products in this category include: i) Aware; ii) Cognitec Systems GmbH (“Cognitec”); iii) Neurotechnology; iv) Iritech, Inc. (“Iritech”); v) Innovatrics s.r.o. (“Innovatrics”); vi) WCC Group B.V. (“WCC”); vii) Daon, Inc. (“Daon”); viii) M2Sys Technology (“M2Sys”); and ix) Agnitio S.L. (“Agnitio”).
|
|
Hardware companies that provide equipment used in biometrics systems include:
|
|
|
●
|
Biometrics-specific hardware vendors, such as: i) Cross Match Technologies, Inc. (“Cross Match”); ii) Iris ID Systems, Inc.; iii) Integrated Biometrics, LLC (“Integrated Biometrics”); and iv) Lumidigm, Inc. which was acquired by HID Global Corporation in 2014 (“HID/Lumidigm”); and
|
|
|
●
|
General purpose computer hardware companies, such as Hewlett-Packard Development Company, L.P. and Dell, Inc.
|
|
ii)
|
System integrators
– This category of suppliers includes companies that provide system integration services. System integrators purchase hardware and software from biometrics technology vendors, such as those listed immediately above. They then incorporate those components into customized biometrics systems that they build for their end-user customers. System integrators include large multinationals with a broad range of expertise and the capacity to execute very large projects, as well as smaller system integrators that have more focused expertise on a particular market sector, technology, or geography.
|
|
Examples of systems integrators include: i) Northrop Grumman Corporation; ii) Lockheed Martin Corporation; iii) Science Applications International Corporation; iv) Hewlett-Packard Enterprise Services; v) International Business Machines; vi) Fujitsu Limited; vii) Computer Science Corporation; vii) Accenture plc; vii) Raytheon Company; ix) Unisys Corporation; x) Unicom Government, Inc; and xi) Telos Corporation.
|
|
iii)
|
Fully integrated solutions vendors
– This category of suppliers includes companies that are fully integrated providers of biometric systems. Such companies combine their in-house hardware and software technologies with their systems integration services to deliver customized biometrics systems to their end-user customers. While these vendors may purchase some components from third parties, we believe such component purchases represent a minor portion of the total systems they deliver.
|
|
We believe there are three primary fully integrated solutions vendors. They are: i) MorphoTrak and MorphoTrust, divisions of the Safran Group Company (“Safran Morpho”); ii) 3M Cogent Inc. (“3M/Cogent”); and iii) NEC Corporation (“NEC”). We believe that these companies supply a large percentage of the government market.
|
Commercial market
Although the recent appearance of biometric readers on popular consumer products, such as smartphones, has increased interest in biometrics as a means of authenticating and/or identifying individuals, commercial markets for biometrics technology are in the process of developing and evolving. Biometrics-based solutions compete with more traditional security methods including keys, cards, personal identification numbers and security personnel. Acceptance of biometrics as an alternative to such traditional methods depends upon a number of factors including: i) the performance and reliability of biometric solutions; ii) costs involved in adopting and integrating biometric solutions; iii) public concerns regarding privacy; and iv) potential privacy legislation.
Principal biometrics applications in commercial markets involve the authentication and/or identification of individuals. Examples of such applications include:
|
|
●
|
User authentication for login and access to mobile devices, computers, networks, and software programs.
|
|
|
●
|
User authentication for financial transactions in the financial services industry.
|
|
|
●
|
User authentication for in-person or online purchases in the retail industry.
|
|
|
●
|
Authentication for physical access to secured buildings and perimeters.
|
| 5 |
|
|
●
|
Authentication of employees to access private patient information in the healthcare industry.
|
|
|
●
|
Authentication of test takers in the educational testing industry.
|
|
|
●
|
Identification of prospective customers in the financial services industry.
|
|
|
●
|
Identification of candidates for pre-employment screening and background checks.
|
|
|
●
|
Identification of patients in hospital and surgical settings.
|
|
|
●
|
Identification of undesirable customers in the gaming industry.
|
The types of users that may need to be authenticated or identified in commercial applications include customers, employees, suppliers, visitors, patients, or other parties wishing to gain access to information, systems, bank accounts, credit card accounts, events, devices, buildings, or organizations.
We believe that the commercial biometrics market may be further delineated into mobile and enterprise segments although that distinction is not always clear as the two segments may overlap. Notwithstanding that limitation, this distinction serves a useful purpose in describing commercial biometrics markets as of the end of 2014.
Mobile segment - The mobile segment is dominated by biometrics-enabled smartphones. Many smartphones now contain fingerprint sensors and software that can: i) enroll and encode a fingerprint image, ii) store the image in a secure area on the phone, and iii) collect a live fingerprint and match it to the stored fingerprint image. Once a biometric match is achieved, the subsequent software functions are analogous to password authentication. This type of biometric authentication is sometimes referred to as a “1-to-1” match. Such 1-to-1 matches require less algorithmic accuracy, speed, sensor fidelity, and computer processing power than “1-to-many” matches that are used in government or enterprise applications that employ large databases of stored images.
Mobile biometrics authentication applications are largely controlled by smartphone manufacturers as this functionality is executed by smartphone operating systems and hardware, as opposed to third-party applications running on the phone. Applications running on smartphones are currently granted access to biometric authentication results, but may not necessarily have access to raw biometric samples, hardware, relevant security functions, or other smartphone capabilities. User authentication using facial or voice biometric modalities may be implemented in applications running on the phone, because these applications can make use of the camera and microphone on the device. User authentication and payment features enabled by smartphones continue to evolve, and we expect to see further changes in smartphone functionality.
Enterprise segment - Enterprise biometric systems typically provide for more robust performance than can be achieved on smartphones. Enterprise systems have greater power, functionality, flexibility, and control than mobile systems. Similar to government biometrics systems, enterprise solutions typically operate in a client/server environment that: i) captures biometrics images on a client PC; ii) stores those images in a large database on a server, and then, when queried; iii) matches live samples against stored images. As with passwords, there are a variety of mechanisms that may be used to secure the privacy of biometrics stored on servers. Mobile systems may be used in conjunction with enterprise systems, and we believe that evolving smartphone biometric functionality will likely have an impact on enterprise-centric biometrics systems in the future.
Another model for enterprise biometric authentication employs smart cards for storage of reference biometric images. In this model, a user must possess a smart card that contains a stored biometric image in order to achieve authentication.
There are standardization efforts being conducted by various industry consortia that may contribute to the adoption of biometrics for user authentication, with each tending to focus on a particular aspect of user authentication. These include FIDO Alliance (password enhancement), Natural Security Alliance (credit card enhancement), and NSTIC, or Natural Strategy for Trusted Identities in Cyberspace (access to online services). International standards bodies such as the Internationals Standards Organization (ISO) will likely also play a role in developing standards for biometric user authentication. Today, these standards are in various stages of completion, and adoption can be generally considered as nascent.
Classifying commercial biometrics hardware and software suppliers into well-defined mobile/enterprise categories is an imperfect exercise as: i) commercial markets are evolving; ii) some suppliers are involved in mobile and enterprise segments; and iii) some suppliers sell multiple types of products, including hardware, software, or hardware products containing software. Subject to this limitation, the following paragraphs provide examples of commercial biometrics vendors.
| 6 |
Hardware suppliers include three principal types of vendors:
|
●
|
Hardware companies involved in the mobile segment of the commercial market
. These companies include: i) Apple, Inc. through its acquisition of AuthenTec, Inc.; ii) Synaptics, Inc., which is a supplier to Samsung
Electronics Co., Ltd; iii) Qualcomm Technologies, Inc. through its acquisition of UltraScan Corporation; and iv) Sonavation, Inc.
|
|
●
|
Hardware companies involved in the enterprise segment of the commercial market
. These companies include: i) DigitalPersona, Inc., which was acquired by Francisco Partners Management LLC and merged with Cross Match in 2014; ii) Integrated Biometrics; iii) HID/Lumidigm; iv) Fingerprint Cards AB; v) Suprema, Inc.; vi) Credence ID, LLC; vii) SecuGen Corporation; viii) Next Biometrics AS; and ix) Eyelock, Inc. (“Eyelock”).
|
|
●
|
Hardware companies focused on the access control segment of the enterprise commercial market
. These companies include: i) Honeywell International, Inc.; ii) HID/Lumidigm; iii) Tyco International Ltd.; iv) Lenel Systems International Inc.; v) Stanley Security Limited; vi) IrisGuard, Inc.; and vii) Aurora Biometrics, Inc.
|
Commercial biometrics software suppliers include: i) Aware; ii) M2Sys; iii) Iritech; iv) Precise Biometrics AB; v) Facebanx, a subsidiary of OhHi, Ltd; vi) Agnitio; vii) VoiceTrust GmbH.; viii) Eyelock; ix) BIO-key International, Inc.; x) VoiceVault Inc.; xi) EyeVerify, Inc.; xii) NexID Biometrics LLC; and xiii) Imprivata, Inc.
In addition to supplying fully integrated solutions to government biometrics markets, Safran Morpho and 3M/Cogent also supply fully integrated biometrics solutions to commercial enterprise markets.
Products and Services
Software products
We sell a broad range of biometrics software products for fingerprint, facial, and iris modalities. Our software products enable important functions in biometrics systems, including:
|
|
1.
|
Enrollment, analysis, and processing of biometrics images and data.
|
|
|
2.
|
Integration of peripheral biometric capture devices.
|
|
|
3.
|
Centralized transaction workflow and processing.
|
|
|
4.
|
Matching of biometric images to verify identity or searching biometric databases; and
|
|
|
5.
|
Analysis and processing of text-based identity data.
|
Our biometrics software products range from discrete software blocks that customers can use to develop their own solutions to more complete applications that customers can use to reduce or eliminate their development times. We classify our biometrics software products into four product groups, including, i) Software Development Kits; ii) BioComponents
TM
; iii) Biometric Applications; and iv) Biometric Services Platform (“BioSP
TM
”). Each of these product groups is described below.
|
1)
|
Software Development Kits
.
Our software development kits or (“SDKs”) consist of: i) multiple software libraries; ii) sample applications that show customers how to use the libraries; and iii) documentation. Customers use our SDKs to design and develop biometrics applications. Our SDK products may be categorized into three groups: i) Enrollment; ii) Search and Matching; and iii) Identity Data Management and Analytics. These products are described below.
|
|
SDK Group 1: Enrollment SDKs
. Our suite of enrollment SDKs performs a variety of functions that are critical to biometric enrollment, including image capture, image quality assurance, image formatting, and image compression. Our enrollment SDK products include:
|
|
|
●
|
Hardware abstraction, autocapture, and quality assurance products
, including: i) FastCapture with LiveScan API; ii) PreFace
TM
with Camera API; iii) IrisCheck
TM
with IrisCam API; iv) SequenceCheck
TM
; and v) Quality Check
TM
.
|
|
|
●
|
Biometric data formatting, validation and reading products
, including: i) NISTPack; ii) ICAOPack; and iii) PIVPack
TM
.
|
|
|
●
|
Fingerprint, facial, and iris image compression and decompression products,
including: i) Aware WSQ1000; and ii) Aware JPEG2000.
|
| 7 |
|
|
●
|
Biometric authentication products
, including AwareXM
TM
.
|
|
|
●
|
Fingerprint card scanning and printing products
, including: i) AccuScan
TM
; and ii) AccuPrint
TM
.
|
|
|
●
|
Mobile products for smartphones and tablets
, including: i) NISTPack Mobile; ii) WSQ1000 Mobile; iii) ICAOPack Mobile; iv) PIVPack
TM
Mobile; and v) AwareXM
TM
Mobile.
|
|
|
●
|
Application specific bundles
, including CaptureSuite
TM
which is used for the development of applications for the capture of live scan or card scan fingerprint images.
|
SDK Group 2: Search and Matching SDKs
. In 2014, we introduced our Nexa™ line of biometric search and matching products for fingerprint, facial and iris images, including our Nexa|Fingerprint™, Nexa|Face™, and Nexa|Iris™ products. These products contain algorithms that convert images into biometric templates. A biometric template is a mathematical representation of a biometric image. Templates can then be compared to image templates stored in image databases to find matches.
Each Nexa SDK can be deployed on a workstation or a server, either as a standalone biometric search/match API, or in combination with our other SDKs, applications, and BioSP product. Our SequenceCheck, PreFace, and IrisCheck SDKs may be used in concert with Nexa libraries to perform optional quality assurance and preprocessing for enhanced fingerprint, face, and iris search and match functionality.
SDK Group 3: Identity Data Management and Analytics SDK
. In 2014, we also introduced our INQUIRE™ (INformation QUality and Identity Resolution Engine) SDK product. INQUIRE contains algorithms for text-based filtering, searching, matching, and linking functions to discover useful information in identity data. Product capabilities include: i) integrating and resolving identity-centric data across multiple data stores; ii) assessing data quality and detecting anomalies; iii) performing link analysis and relationship discovery; and iv) performing text-based pre- and post-filtering of biometric searches.
|
2)
|
BioComponents.
Our BioComponents products allow customers to develop biometric enrollment applications more quickly than if they purchased our SDKs. Each product in the group includes a user interface and one or more software libraries that perform a discrete set of functions, such as automated image capture, quality assurance, and capture hardware integration. BioComponents comprise modular, independent, self-contained software components that can operate either independently or in concert with one another. Specific BioComponents products and the functions they perform are:
|
|
|
●
|
BiographicComponent enables highly configurable data entry of biographic and textual information.
|
|
|
●
|
FingerprintComponent is used to capture, verify image quality, and compress fingerprint images.
|
|
|
●
|
FaceComponent is used to capture, verify image quality, and manipulate facial images.
|
|
|
●
|
IrisComponent is used to capture, segment, and verify image quality of iris images.
|
|
|
●
|
TravelDocComponent is used to authenticate travel documents, such as passports and driver’s licenses.
|
|
|
●
|
ScanningComponent is used to scan forms such as inked fingerprint cards.
|
|
|
●
|
PrintingComponent is used for printing FBI-quality fingerprint images on cards and forms.
|
|
|
●
|
SignatureComponent is used to collect handwritten signature images from an electronic signature pad.
|
|
|
●
|
PackagingComponent allows access to the data sets from the other components.
|
|
3)
|
Biometric applications.
Our products in this category combine user interfaces with multiple Aware software libraries and/or BioComponents to create more complete applications that operate on client workstations or mobile devices. Our application products and the functions they perform are:
|
|
|
●
|
Universal Registration Client (“URC
TM
”).
URC is a configurable Windows-based application that performs a variety of biometric data capture, analysis, matching, formatting, and hardware abstraction functions.
|
|
|
●
|
URC Mobile
. URC Mobile is a software application for performing biometric enrollment, identification, and screening on mobile biometric devices, such as those used by military personnel in the field.
|
|
|
●
|
FormScannerSE and FormScannerMB
. These are two independent applications for scanning and processing of inked fingerprint cards.
|
| 8 |
|
|
●
|
FormScannerSWFT
. This product is a version of FormScannerSE that is preconfigured for use in compliance with the “Secure Web Fingerprint Transmission” program of the U.S. Department of Defense.
|
|
|
●
|
Forensic Workbench
. Forensic Workbench is a software application for the categorization, processing, and standards-compliant formatting of biometric images and demographic data.
|
|
|
●
|
Sequence Workbench
. Sequence Workbench is a software application for the detection and assisted repair of fingerprint records containing sequence errors.
|
|
|
●
|
WebEnroll
. WebEnroll provides a reference application that uses BioComponents for browser-based enrollment of biographic data, fingerprints, facial images, and iris images.
|
|
4)
|
Biometric Services Platform (BioSP
). Our Biometric Services Platform, or BioSP product, is a service-oriented application used to enable biometric data processing and management. BioSP is suited for applications that require the collection of biometrics throughout a distributed network. BioSP is designed to be modular, programmable, scalable, and secure. It is used to manage transaction workflow, including messaging, submissions, responses, and logging.
|
Key BioSP features and functionality include:
|
|
●
|
automated biometric image and data analysis, processing, formatting, quality assurance, and reporting.
|
|
|
●
|
web services in support of a scalable, secure, service-oriented architecture.
|
|
|
●
|
integration of biometric functions with other enterprise systems such as identity management, access management, card management, and AFIS/ABIS.
|
|
|
●
|
1-to-1 and 1-to-many biometric matching for verification, identification, and duplicate checking.
|
|
|
●
|
centralized system administration and user management.
|
|
|
●
|
advanced reporting capabilities for fast troubleshooting of biometric capture problems.
|
|
|
●
|
centralized configuration, distribution, and management of enrollment client software.
|
|
|
●
|
support for fingerprint, facial, iris, and palm modalities.
|
In addition to our biometrics software products, we also sell products used in applications involving medical and advanced imaging. Our principal imaging product is Aware JPEG 2000. Our JPEG 2000 image compression software may be used for a variety of applications where compression and decompression of still imagery is required. Sales of imaging software products represented 7% of total revenue in 2014.
Software maintenance
We also sell software maintenance contracts to many of our customers who purchase software licenses. These contracts typically have a one year term during which customers have the right to receive technical support and software updates, if and when they become available. Customers tend to renew maintenance contracts during the period of time that our software is being used in their biometrics systems.
Services
We offer a variety of software engineering services, including: i) project planning and management; ii) system design; iii) software design, development, customization, configuration, and testing; and iv) software integration and installation. Services are typically, but not always, sold in conjunction with software licenses.
Service engagement deliverables may include: i) custom-designed software products; ii) custom-configured versions of existing software products; iii) one or more subsystems comprised of software products that are integrated within a larger system; or iv) complete software solutions. In some cases, the software resulting from service engagements may form the basis for new or improved Aware software products.
Our customers for services include: i) government agencies; ii) large multinational systems integrators; iii) smaller systems integrators with a particular market, technology or geographic focus; and iv) commercial providers of products, solutions, and services. We provide services directly to end-users or indirectly to end-users through systems integrators. When we provide services to systems integrators, they are often engaged with the end-user as a prime contractor and are responsible for delivery of a complete solution, in which case we typically serve as a subcontractor assigned a subset of the total scope of work.
The scope of our services projects varies. A small project might involve configuration and testing of a single software product, taking a small team one month or less. A large project might involve delivery of a more complex solution comprised of multiple products and subsystems, requiring a larger team to conduct project management, system design, software customization and integration, and taking up to one year or more. Some projects are followed by subsequent projects that serve to change or extend the features and functionality of the initial system.
| 9 |
Hardware products
We developed a biometrics software system for a U.S. government customer under a Small Business Innovation Research (“SBIR”) contract that began in 2008 and ended in early 2013. When the software development project ended in early 2013, we entered into a separate contract to supply hardware products incorporating the developed software. Hardware products sold to this customer integrate the developed software with: i) hardware purchased from third parties; ii) software purchased from third parties; and iii) some of our biometrics software products. While other customers could theoretically purchase the hardware products developed for this customer, we believe that it is unlikely that they will do so, because of the highly customized nature of the products.
Sales and Marketing
As of December 31, 2014, we had a total of 11 employees in our sales and marketing organization. In addition to our employee sales staff, we also engage third party sales agents to represent our products in various foreign countries.
We sell our products and services through three principal channels of distribution:
|
|
i)
|
Systems integrator channel – we sell to systems integrators that incorporate our software products into biometrics systems that are delivered primarily to government end users.
|
|
|
ii)
|
OEM channel – we sell to hardware and software solution providers that incorporate our software products into their products.
|
|
|
iii)
|
Direct channel – we also sell directly to government, and, to a lesser degree, to commercial customers.
|
All of our revenue in 2014, 2013, and 2012 was derived from unaffiliated customers. Revenue from the U.S. Navy represented 24%, 21%, and 5% of total revenue during 2014, 2013, and 2012, respectively. Revenue from the U.S. Marine Corps represented 10%, 3%, and 0% of total revenue during 2014, 2013, and 2012, respectively. No other customer represented 10% or more of total revenue in any of those years.
Competition
The markets for our products and services are competitive and uncertain. We compete against: i) other companies that provide biometric software solutions; and ii) fully diversified companies that provide biometric software solutions and also act as systems integrators. We can give no assurance that: i) our products and services will succeed in the market; ii) that we will be able to compete effectively; or iii) that competitive pressures will not seriously harm our business.
Many of our competitors are larger than us and have significantly greater financial, technological, marketing and personnel resources than we do. At the other end of the competitive spectrum, we have seen increasing competition from smaller biometrics companies in foreign countries. These smaller foreign competitors have demonstrated a willingness to sell their biometrics software products at low prices.
We can give no assurance that our customers will continue to purchase products from us or that we will be able to compete effectively in obtaining new customers to maintain or grow our business.
Aware’s Strategy
Our strategy is to capitalize on our strong brand and reputation to sell biometrics software products and services into government and commercial markets. We intend to offer a broad portfolio of high quality products that are coupled with expert technical support and services. We expect to continue to employ a three-pronged distribution strategy using systems integrators, OEMs, and direct sales.
Our strategy for growing our biometrics business may include one or more of the following elements:
|
|
i)
|
Product strategy
– Our product strategy is to offer more complete biometrics solutions. We believe this strategy will allow us to us to sell more software and services into biometrics projects. We recognized the need to make this transition several years ago and began developing products to enable this strategy.
|
| 10 |
Our strategy to offer complete solutions involves:
|
|
●
|
Product line expansion - Our aim is to expand our product portfolio by adding new products and increasing the functionality of existing products using our internal engineering teams. This means we may add resources to our engineering staff. To the extent we are unable to develop critical new technologies internally, we may purchase or license such technologies from third parties. Alternatively, we may also acquire biometrics companies provided we believe the acquisition cost is reasonable relative to the estimated future revenue and profits the acquired company may produce.
|
|
|
●
|
Engineering services – We believe that services are an important element of our strategy to sell complete solutions. We intend to have adequate engineering resources on hand to ensure that we can staff projects with the technical expertise we need to win new projects.
|
|
|
ii)
|
Market strategy –
Our market strategy is to continue to focus on our legacy government biometrics market and expand into new commercial biometrics markets. Historically our revenue has been primarily derived from the government biometrics market and we intend to continue our focus there.
|
We believe the evolution of commercial markets over the past year may present opportunities to us. While it is unlikely that we will pursue opportunities in the mobile segment of the market, we are beginning see opportunities in the enterprise segment. The requirements of the enterprise segment appear to be well suited to our technology, products, and expertise.
|
|
iii)
|
Sales strategy
– While the United States remains a large market, we believe there are attractive growth opportunities in international markets. We intend to continue our focus on international markets and pursue opportunities there through additions to our sales staff, as well as through the use of third party sales agents.
|
As we attempt to grow our biometrics business, we may make investments in growth initiatives, such as those described above, that may cause our profitability to decline in the near term.
Our strategy does not include growing biometrics hardware revenue. Hardware revenue in 2014 and 2013 represents an accommodation to an important customer. It is unlikely that we will have meaningful sales of hardware in future periods as this customer appears to have completed the bulk of its purchasing.
Backlog
We had $5.0 million of backlog on December 31, 2014. Backlog included: i) $3.2 million of software license and service revenue that was scheduled for delivery in the first nine months of 2015; and ii) $1.8 million of software maintenance revenue that will be recognized from deferred revenue during 2015. There was no hardware revenue or royalties included in backlog at December 31, 2014.
Research and Development
Our research and development activities are focused on enhancing our existing products and developing new products. Our engineering organization is based in Bedford, Massachusetts. As of December 31, 2014, we had an engineering staff of 48 employees, representing 69% of our total employee staff.
During the years ended December 31, 2014, 2013, and 2012, research and development expenses totaled $5.5 million, $4.1 million, and $3.5 million, respectively. We expect that we will continue to invest substantial funds in research and development activities.
| 11 |
Patents and Intellectual Property
We rely on a combination of nondisclosure agreements and other contractual provisions, as well as patent, trademark, trade secret and copyright law to protect our proprietary rights. We have an active program to protect our proprietary technology through the filing of patents. As of December 31, 2014, we had approximately 40 U.S. and foreign patents and approximately 49 pending patent applications. Our patents and patent applications pertain primarily to biometrics and imaging compression.
Although we have patented certain aspects of our technology, we rely primarily on trade secrets to protect our intellectual property. We attempt to protect our trade secrets and other proprietary information through agreements with our customers, suppliers, employees and consultants, and through security measures. Each of our employees is required to sign a non-disclosure and non-competition agreement. Although we intend to protect our rights vigorously, we cannot assure you that these measures will be successful. In addition, effective intellectual property protection may be unavailable or limited in certain foreign countries.
Third parties may assert exclusive patent, copyright and other intellectual property rights to technologies that are important to us. From time to time, we receive claims from third parties suggesting that we may be obligated to license such intellectual property rights. If we were found to have infringed any third party’s patents, we could be subject to substantial damages or an injunction preventing us from conducting our business.
Manufacturing & Systems Integration
We do not design or manufacture hardware products, however we provide systems integration services for one U.S. government customer. Our systems integration activities include: i) procuring hardware and software components from third party suppliers; ii) installing Aware and third party software on the purchased hardware; and iii) testing products for quality assurance prior to shipment.
We rely on single source suppliers for certain critical hardware and software components. Our dependence on single source suppliers involves several risks, including limited control over availability, quality, and delivery schedules. Any delays in delivery or shortages of such components could cause delays in the shipment of our products, which could harm our business.
Employees
At December 31, 2014, we employed 70 people, including 48 in engineering, 11 in sales and marketing, and 11 in finance and administration. Of these employees, 67 were based in Massachusetts. None of our employees are represented by a labor union. We consider our employee relations to be good.
We believe that our future success will depend in large part on the service of our technical, sales, marketing and senior management personnel and upon our ability to retain highly qualified technical, sales and marketing and managerial personnel. We cannot assure you that we will be able to retain our key managers and employees or that we will be able to attract and retain additional highly qualified personnel in the future.
DSL Discontinued Operations
From the early 1990s until 2013, we were engaged in the Digital Subscriber Line (“DSL”) industry. We sold the assets of our DSL semiconductor intellectual property business in 2009, and shut down our DSL service assurance hardware and software businesses in 2012 and 2013, respectively. Results from the shutdown of our DSL service assurance businesses were reported in discontinued operations in the years ended December 31, 2013 and 2012.
Notwithstanding the sale of DSL semiconductor intellectual property assets in 2009, we continue to receive royalty payments from two customers. DSL royalties are reported in continuing operations in accordance with ASC 205-20, Reporting Discontinued Operations, because we have continuing cash flows from this business. DSL royalties have been declining in recent years and represented approximately 3% of total revenue in 2014. We expect royalties will continue to decline in future periods.
| 12 |
Segment Information; Financial Information About Geographic Areas
We organize ourselves into a single segment that reports to the chief operating decision makers. Summaries of revenue by geographic regions and revenue by product group are set forth in Note 10 to our consolidated financial statements included elsewhere in this Annual Report.
Available Information
Our Annual Report on Form 10-K, Quarterly Reports on Form 10-Q, Current Reports on Form 8-K, proxy statements, and amendments to reports filed pursuant to Sections 13(a) and 15(d) of the Securities Exchange Act of 1934, as amended, are made available free of charge on or through our website at www.aware.com as soon as reasonably practicable after such reports are filed with, or furnished to, the Securities and Exchange Commission (the SEC). The SEC also maintains a website, www.sec.gov, that contains reports and other information regarding issuers that file electronically with the SEC. Such reports, proxy statements, and other information may also be obtained by visiting the Public Reference Room of the SEC at 100 F Street, N.E., Washington, DC, 20549 or by calling the SEC at 1-800-SEC-0330.
Copies of our (i) Corporate Governance Principles, (ii) charters for the Audit Committee, Compensation Committee, and Nominating Committee, and (iii) Code of Ethics are available in the Investor Relations section of our website at
www.aware.com
.
| 13 |
Our operating results may fluctuate significantly from period-to-period and are difficult to predict.
Individual orders can represent a meaningful percentage of our revenues and net income in any single quarter and the timing of the receipt of those orders is difficult to predict. The failure to close an order or the deferral or cancellation of an order can result in revenue and net income shortfalls for that quarter. We base our current and future expense levels on our internal operating plans and sales forecasts, and our operating costs are to a large extent fixed. As a result, we may not be able to sufficiently reduce our costs in any quarter to adequately compensate for an unexpected near-term shortfall in revenues, and even a small shortfall could disproportionately and adversely affect financial results for that quarter.
Our financial results may be negatively affected by a number of factors, including the following:
|
●
|
the lack or reduction of government funding and the political, budgetary and purchasing constraints of government customers who purchase products and services directly or indirectly from us;
|
|
●
|
the terms of customer contracts that affect the timing of revenue recognition;
|
|
●
|
the size and timing of our receipt of customer orders;
|
|
●
|
significant fluctuations in demand for our products and services;
|
|
●
|
the loss of a key customer or one of its key customers;
|
|
●
|
new competitors, or the introduction of enhanced solutions from new or existing competitors;
|
|
●
|
competitive pressures on selling prices;
|
|
●
|
cancellations, delays or contract amendments by government customers;
|
|
●
|
higher than expected costs, asset write-offs, and other one-time financial charges; and
|
|
●
|
general economic trends and other factors
|
As a result of these factors, we believe that period-to-period comparisons of our revenue levels and operating results are not necessarily meaningful. You should not rely on our quarterly revenue and operating results to predict our future performance.
We derive a significant portion of our revenue directly or indirectly from government customers, and our business may be adversely affected by changes in the contracting or fiscal policies of those governmental entities.
We derive a significant portion of our revenue directly or indirectly from federal, international, state and local governments. We believe that the success and growth of our business will continue to depend on government customers purchasing our products and services either directly through us or indirectly through our channel partners. Changes in government contracting policies or government budgetary constraints may adversely affect our financial performance. Among the factors that could adversely affect our business are:
|
●
|
changes in fiscal policies or decreases in available government funding,
|
|
●
|
changes in government funding priorities;
|
|
●
|
changes in government programs or applicable requirements;
|
|
●
|
the adoption of new laws or regulations or changes to existing laws or regulations;
|
|
●
|
changes in political or social attitudes with respect to security and defense issues;
|
|
●
|
changes in audit policies and procedures of government entities;
|
|
●
|
potential delays or changes in the government appropriations process; and
|
|
●
|
delays in the payment of our invoices by government payment offices.
|
These and other factors could cause government customers or our channel partners to reduce purchases of products and services from us which would have a material adverse effect on our business, financial condition and operating results.
| 14 |
A significant commercial market for biometrics technology may not develop, and, even if it does, there can be no assurance our biometrics technology will be successful.
A component of our strategy to grow revenue includes expansion into commercial markets. To date, biometrics technology has received only limited acceptance in such markets. Although the recent appearance of biometric readers on popular consumer products, such as smartphones, has increased interest in biometrics as a means of authenticating and/or identifying individuals, commercial markets for biometrics technology are in the process of developing and evolving. Biometrics-based solutions compete with more traditional security methods including keys, cards, personal identification numbers and security personnel. Acceptance of biometrics as an alternative to such traditional methods depends upon a number of factors including: i) the performance and reliability of biometric solutions; ii) costs involved in adopting and integrating biometric solutions; iii) public concerns regarding privacy; and iv) potential privacy legislation.
For these reasons, we are uncertain whether there will be significant demand for biometrics technology from commercial markets. Moreover, even if there is significant demand, there can be no assurance that our biometrics products will achieve market acceptance.
We derive a significant portion of our revenue from third party channel partners.
Our future results depend upon the continued successful distribution of our products through a channel of systems integrators and OEM partners. Systems integrators, including value added resellers, use our software products as a component of the biometrics systems they deliver to their customers. OEMs embed our software products in their technology devices or software products. These channel partners typically sell their products and services to government customers.
Our failure to effectively manage our relationships with these third parties could impair the success of our sales, marketing and support activities. Moreover, the activities of these third parties are not within our direct control. The occurrence of any of the following events could have a material adverse effect on our business, financial condition and operating results:
|
●
|
a reduction in sales efforts by our partners;
|
|
●
|
the failure of our partners to win government awards in which our products are used;
|
|
●
|
a reduction in technical capabilities or financial viability of our partners;
|
|
●
|
a misalignment of interest between us and them;
|
|
●
|
the termination of our relationship with a major systems integrator or OEM; or
|
|
●
|
any adverse effect on a partner’s business related to competition, pricing and other factors.
|
If the biometrics market does not experience significant growth or if our products do not achieve broad acceptance both domestically and internationally, we may not be able to grow our business.
Our revenues are derived primarily from sales of biometrics products and services. We cannot accurately predict the future growth rate or the size of the biometrics market. The expansion of the biometrics market and the market for our biometrics products and services depend on a number of factors, such as:
|
●
|
the cost, performance and reliability of our products and services and the products and services offered by our competitors;
|
|
●
|
the continued growth in demand for biometrics solutions within the government and law enforcement markets as well as the development and growth of demand for biometric solutions in markets outside of government and law enforcement;
|
|
●
|
customers’ perceptions regarding the benefits of biometrics solutions;
|
|
●
|
public perceptions regarding the intrusiveness of these solutions and the manner in which organizations use the biometric information collected;
|
|
●
|
public perceptions regarding the confidentiality of private information;
|
|
●
|
proposed or enacted legislation related to privacy of information;
|
|
●
|
customers’ satisfaction with biometrics solutions; and
|
|
●
|
marketing efforts and publicity regarding biometrics solutions.
|
| 15 |
Even if biometrics solutions gain wide market acceptance, our solutions may not adequately address market requirements and may not continue to gain market acceptance. If biometrics solutions generally or our solutions specifically do not gain wide market acceptance, we may not be able to achieve our anticipated level of growth and our revenues and results of operations would be adversely affected.
Hardware revenue is likely to decline in future periods.
In the years ended December 31, 2014 and 2013, we had hardware revenue of $4.9 million and $3.2 million respectively. Gross profit on hardware revenue was $1.4 million and $0.8 million in 2014 and 2013, respectively.
Hardware revenue consisted of sales of biometrics equipment to a single U.S. government customer. While we are unable to predict future hardware sales with any degree of certainty, future orders from this customer may be minimal as we believe that the bulk of its purchases may have already occurred. We have no hardware orders in backlog as of December 31, 2014. If we are unable to replace the lost gross profit on hardware revenue with sales of other products and services in future periods, our operating results will be adversely affected.
We face intense competition from other biometrics solutions providers.
A significant number of established companies have developed or are developing and marketing software and hardware for biometrics products and applications that currently compete with or will compete directly with our offerings. We believe that additional competitors will enter the biometrics market and become significant long-term competitors, and that, as a result, competition will increase. Companies competing with us may introduce solutions that are competitively priced, have increased performance or functionality or incorporate technological advances we have not yet developed or implemented. Our current principal competitors include:
|
●
|
Diversified technology providers that offer integrated biometrics solutions to governments, law enforcement agencies and other organizations. This group of competitors includes companies such as Safran Morpho, 3M/Cogent, and NEC.
|
|
●
|
Component providers that offer biometrics software and hardware components for fingerprint, facial, and iris biometric identification. This group of competitors includes companies such as Cognitec; Neurotechnology; Iritech; Innovatrics; WCC; Daon; and M2Sys.
|
We expect competition to intensify in the near term in the biometrics market. Many current and potential competitors have substantially greater financial, marketing, and research resources than we have. Moreover, low cost foreign competitors from third world and other countries have demonstrated a willingness to sell their products at significantly reduced prices. To compete effectively in this environment, we must continually develop and market new and enhanced solutions and technologies at competitive prices and must have the resources available to invest in significant research and development activities. Our failure to compete successfully could cause our revenues and market share to decline.
The biometrics industry is characterized by rapid technological change and evolving industry standards, which could render our existing products obsolete.
Our future success will depend upon our ability to develop and introduce a variety of new capabilities and enhancements to our existing products in order to address the changing and sophisticated needs of the marketplace. Frequently, technical development programs in the biometrics industry require assessments to be made of the future direction of technology, which is inherently difficult to predict. Delays in introducing new products and enhancements, the failure to choose correctly among technical alternatives or the failure to offer innovative products or enhancements at competitive prices may cause customers to forego purchases of our products and purchase our competitors’ products. We may not have adequate resources available to us or may not adequately keep pace with appropriate requirements in order to effectively compete in the marketplace.
| 16 |
Our software products may have errors, defects or bugs, which could result in delayed or lost revenue, expensive correction, liability to our customers, and claims against us.
Complex software products such as ours may contain errors, defects or bugs. Defects in the products that we develop and sell to our customers could require expensive corrections and result in delayed or lost revenue, adverse customer reaction and negative publicity about us or our products and services. Customers who are not satisfied with any of our products may also bring claims against us for damages, which, even if unsuccessful, would likely be time-consuming to defend, and could result in costly litigation and payment of damages. Such claims could harm our reputation, financial results and competitive position.
Our business may be adversely affected by our use of open source software.
The software industry is making increasing use of open source software in the development of products. We also license and integrate certain open source software components from third parties into our software. Open source software license agreements may require that the software code in these components or the software into which they are integrated be freely accessible under open source terms. Many features we may wish to add to our products in the future may be available as open source software and our development team may wish to make use of this software to reduce development costs and speed up the development process. While we carefully monitor the use of all open source software and try to ensure that no open source software is used in such a way as to require us to disclose the source code to the related product, such use could inadvertently occur. If we were required to make our software freely available, our business could be seriously harmed.
Our intellectual property is subject to limited protection.
Because we are a technology provider, our ability to protect our intellectual property and to operate without infringing the intellectual property rights of others is critical to our success. We regard our technology as proprietary. We rely on a combination of patent, trade secret, copyright, and trademark law as well as confidentiality agreements to protect our proprietary technology, and cannot assure you that we will be able to enforce the patents we own against third parties. Despite our efforts, these measures can only provide limited protection. Unauthorized third parties may try to copy or reverse engineer portions of our products or otherwise obtain and use our intellectual property. If we fail to protect our intellectual property rights adequately, our competitors may gain access to our technology, and our business would thus be harmed.
In the future, we may be involved in legal action to enforce our intellectual property rights relating to our patents, copyrights or trade secrets. Any such litigation could be costly and time-consuming for us, even if we were to prevail. Moreover, even if we are successful in protecting our proprietary information, our competitors may independently develop technologies substantially equivalent or superior to our technology. Accordingly, despite our efforts, we may be unable to prevent third parties from infringing upon or misappropriating our intellectual property or otherwise gaining access to our technology. The misappropriation of our technology or the development of competitive technology could seriously harm our business.
We may be sued by third parties for alleged infringement of their proprietary rights
.
Our technology and products may infringe the intellectual property rights of others. A large and increasing number of participants in the technology industry, including companies known as non-practicing entities, have applied for or obtained patents. Some of these patent holders have demonstrated a readiness to commence litigation based on allegations of patent infringement. Third parties have asserted against us in the past and may assert against us in the future patent, copyright and other intellectual property rights to technologies that are important to our business.
Intellectual property rights can be uncertain and involve complex legal and factual questions. Moreover, intellectual property claims, with or without merit, can be time-consuming and expensive to litigate or settle, and could divert management attention away from the execution of our business plan. If we were found to have infringed the proprietary rights of others, we could be subject to substantial damages or an injunction preventing us from conducting our business.
| 17 |
If we are unable to attract and retain key personnel, our business could be harmed.
If any of our key employees were to leave, we could face substantial difficulty in hiring qualified successors and could experience a loss in productivity while any successor obtains the necessary training and experience. Our employment relationships are at-will and we have had key employees leave in the past. We cannot assure you that one or more key employees will not leave in the future. We intend to continue to hire additional highly qualified personnel, including software engineers and sales personnel, but may not be able to attract, assimilate or retain qualified personnel in the future. Any failure to attract, integrate, motivate and retain these employees could harm our business.
We rely on single sources of supply for certain components used in our hardware products.
We commenced sales of biometrics hardware products to a U.S. government customer in 2013. Hardware products sold to this customer integrate hardware and software purchased from third parties. We rely on single source suppliers for certain critical hardware and software components. Our dependence on single source suppliers involves several risks, including limited control over availability, quality, and delivery schedules. Any delays in delivery or shortages of such components could cause delays in the shipment of our products, which could harm our business.
Our business may be affected by government regulations.
Extensive regulation by federal, state, and foreign regulatory agencies could adversely affect us in ways that are difficult for us to predict. In addition, our business may also be adversely affected by: i) the imposition of tariffs, duties and other import restrictions on goods and services we purchase from non-domestic suppliers; or ii) by the imposition of export restrictions on products we sell internationally. Changes in current or future laws or regulations, in the United States or elsewhere, could seriously harm our business.
Adverse economic conditions could harm our business.
Unfavorable changes in economic conditions, including recessions, inflation, turmoil in financial markets, or other changes in economic conditions, could harm our business, results of operations, and financial conditions as a result of:
|
●
|
reduced demand for our products;
|
|
●
|
increased risk of order cancellations or delays;
|
|
●
|
increased pressure on the prices for our products;
|
|
●
|
greater difficulty in collecting accounts receivable; and
|
|
●
|
risks to our liquidity, including the possibility that we might not have access to our cash when needed.
|
We are unable to predict the timing, duration, and severity of any such adverse economic conditions in the U.S. and other countries, but the longer the duration, the greater the risks we face in operating our business.
We may make acquisitions of companies.
We may make acquisitions of companies that offer complementary products, services and technologies. Any acquisitions we may complete involve a number of risks, including the risks of assimilating the operations and personnel of acquired companies, realizing the value of the acquired assets relative to the price paid, distraction of management from our ongoing businesses and potential product disruptions associated with the sale of the acquired company’s products. These factors could have a material adverse effect on our business, financial condition, operating results and cash flows. The consideration we pay for any future acquisitions could include our stock. As a result, future acquisitions could cause dilution to existing shareholders and to earnings per share.
| 18 |
We may have additional tax liabilities.
We are subject to income taxes in the United States. Significant judgments are required in determining our provisions for income taxes. In the course of preparing our tax provisions and returns, we must make calculations where the ultimate tax determination may be uncertain. Our tax returns are subject to examination by the Internal Revenue Service (“IRS”) and state tax authorities. The IRS is currently examining our tax return for the year ended December 31, 2012. There can be no assurance as to the outcome of these examinations. If the ultimate determination of taxes owed is for an amount in excess of amounts previously accrued, our operating results, cash flows, and financial condition could be adversely affected.
The market price of our common stock has been and may continue to be subject to wide fluctuations, and this may make it difficult for shareholders to resell the common stock when they want or at prices they find attractive.
The market price of our common stock, like that of other technology companies, is volatile and is subject to wide fluctuations in response to a variety of factors, including:
|
●
|
quarterly variations in operating results;
|
|
●
|
announcements of technological innovations or new products by us or our competitors,
|
|
●
|
changes in customer relationships, such as the loss of a key customer;
|
|
●
|
recruitment or departure of key personnel;
|
|
●
|
corporate actions we may initiate, such as acquisitions, stock sales or repurchases, dividend declarations, or corporate reorganizations; and
|
|
●
|
other events or factors.
|
Our stock price may also be affected by broader market trends unrelated to our performance. As a result, purchasers of our common stock may be unable at any given time to sell their shares at or above the price they paid for them. Moreover, companies that have experienced volatility in the market price of their stock often are subject to securities class action litigation. If we were the subject of such litigation, it could result in substantial costs and divert management’s attention and resources.
If we are unable to maintain effective internal controls over financial reporting, investors could lose confidence in the reliability of our financial statements, which could result in a decline in the price of our common stock.
As a public company, we are required to enhance and test our financial, internal and management control systems to meet obligations imposed by the Sarbanes-Oxley Act of 2002. Consistent with the Sarbanes-Oxley Act and the rules and regulations of the SEC, management’s assessment of our internal controls over financial reporting and the audit opinion of our independent registered accounting firm as to the effectiveness of our controls is required in connection with our filing of our Annual Report on Form 10-K. If we are unable to identify, implement and conclude that we have effective internal controls over financial reporting or if our independent auditors are unable to conclude that our internal controls over financial reporting are effective, investors could lose confidence in the reliability of our financial statements, which could result in a decrease in the value of our common stock. Our assessment of our internal controls over financial reporting may also uncover weaknesses or other issues with these controls that could also result in adverse investor reaction.
We must make judgments in the process of preparing our financial statements.
We prepare our financial statements in accordance with generally accepted accounting principles and certain critical accounting policies that are relevant to our business. The application of these principles and policies requires us to make significant judgments and estimates. In the event that our judgments and estimates differ from actual results, we may have to change them, which could materially affect our financial position and results of operations.
Moreover, accounting standards have been subject to rapid change and evolving interpretations by accounting standards setting organizations over the past few years. The implementation of new accounting standards requires us to interpret and apply them appropriately. If our current interpretations or applications are later found to be incorrect, we may have to restate our financial statements and the price of our stock could decline.
| 19 |
Not applicable.
We believe that our existing facilities are adequate for our current needs and that additional space sufficient to meet our needs for the foreseeable future will be available on reasonable terms. We currently occupy approximately 72,000 square feet of office space in Bedford, Massachusetts, which serves as our headquarters. This site is used for our research and development, sales and marketing, and administrative activities. We own this facility.
From time to time we are involved in litigation incidental to the conduct of our business. We are not party to any lawsuit or proceeding that, in our opinion, is likely to seriously harm our business.
Not applicable.
| 20 |
Our common stock is the only class of stock we have outstanding, and it trades on the Nasdaq Global Market under the symbol AWRE. The following table sets forth the high and the low sales prices of our common stock as reported on the Nasdaq Global Market for the periods indicated from January 1, 2013 to December 31, 2014.
|
First
|
Second
|
Third
|
Fourth
|
|||||||||||||
|
Quarter
|
Quarter
|
Quarter
|
Quarter
|
|||||||||||||
|
2014
|
||||||||||||||||
|
High
|
$ | 6.70 | $ | 6.70 | $ | 6.79 | $ | 5.02 | ||||||||
|
Low
|
5.27 | 5.02 | 3.50 | 3.46 | ||||||||||||
|
2013
|
||||||||||||||||
|
High
|
$ | 6.25 | $ | 5.65 | $ | 5.64 | $ | 6.14 | ||||||||
|
Low
|
4.58 | 4.50 | 4.80 | 5.06 | ||||||||||||
As of February 5, 2015, we had approximately 106 shareholders of record. This number does not include shareholders from whom shares were held in a “nominee” or “street” name. In 2014, we paid a special cash dividend of $1.75 per share on July 24, 2014. We paid no dividends in 2013. In 2012, we paid a special cash dividend of $1.15 per share on May 25, 2012 and another special cash dividend of $1.80 per share on December 17, 2012. We anticipate that we will continue to reinvest any earnings to finance future operations although we may also pay additional special cash dividends if our board of directors deems it appropriate.
We did not sell any equity securities that were not registered under the Securities Act of 1933 during the three months ended December 31, 2014.
| 21 |
Stock Performance Graph
The following stock performance graph compares the performance of Aware’s cumulative stockholder return with that of a broad market index, the Nasdaq Composite Index, and a published industry index, the RDG Technology Composite Index. The cumulative stockholder returns for shares of Aware’s common stock and for the market and industry indices are calculated assuming $100 was invested on December 31, 2009. Aware paid special cash dividends of $0.00, $0.00, $2.95, $0.00, and $1.75 per share in 2010, 2011, 2012, 2013, and 2014, respectively. The performance of the market and industry indices is shown on a total return, or dividend reinvested, basis.
COMPARISON OF 5 YEAR CUMULATIVE TOTAL RETURN*
Among Aware, Inc., the NASDAQ Composite Index, and the RDG Technology Composite Index
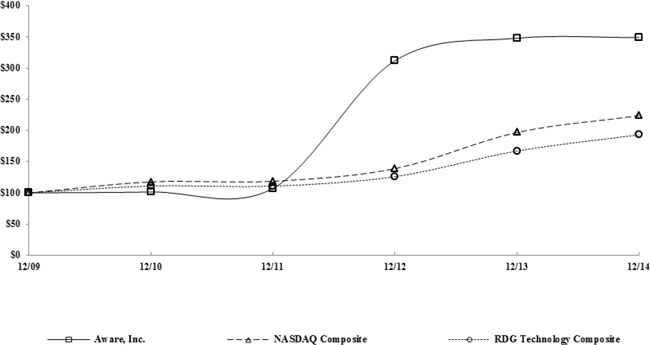
|
*$100 invested on 12/31/09 in stock or index, including reinvestment of dividends.
Fiscal year ending December 31.
|
|
Value of Investment ($)
|
||||||||||||||||||||||||
|
12/31/09
|
12/31/10
|
12/31/11
|
12/31/12
|
12/31/13
|
12/31/14
|
|||||||||||||||||||
|
Aware, Inc.
|
$ | 100.00 | $ | 101.43 | $ | 107.14 | $ | 312.06 | $ | 347.94 | $ | 349.02 | ||||||||||||
|
Nasdaq Composite Index
|
100.00 | 117.61 | 118.70 | 139.00 | 196.83 | 223.74 | ||||||||||||||||||
|
RDG Technology Composite Index
|
100.00 | 111.01 | 110.85 | 126.07 | 167.16 | 193.22 | ||||||||||||||||||
| 22 |
The following selected consolidated financial and operating data set forth below with respect to our consolidated financial statements for the fiscal years ended December 31, 2014, 2013 and 2012 are derived from the consolidated financial statements included elsewhere in this Form 10-K. The data for fiscal years ended December 31, 2011 and 2010 are derived from previously filed consolidated financial statements. The data set forth below should be read in conjunction with “Management’s Discussion and Analysis of Financial Condition and Results of Operations,” our historical consolidated financial statements, and the related notes to the consolidated financial statements, which can be found in Item 7 and Item 8.
|
Year ended December 31,
|
2014
|
2013
|
2012
|
2011
|
2010
|
|||||||||||||||
|
(in thousands, except per share data)
|
||||||||||||||||||||
|
Statements of Comprehensive Income Data
|
||||||||||||||||||||
|
Revenue
|
$ | 23,720 | $ | 19,357 | $ | 17,304 | $ | 16,199 | $ | 12,975 | ||||||||||
|
Patent related income
|
2,127 | 780 | 87,515 | - | - | |||||||||||||||
|
Operating income (loss)
|
7,089 | 5,318 | 92,558 | 3,500 | (360 | ) | ||||||||||||||
|
Income from continuing operations
|
4,583 | 3,752 | 72,383 | 3,581 | 154 | |||||||||||||||
|
Income (loss) from discontinued operations, net of income taxes
|
- | (1,156 | ) | (76 | ) | (1,014 | ) | 26 | ||||||||||||
|
Net income
|
4,583 | 2,596 | 72,307 | 2,567 | 180 | |||||||||||||||
|
Net income per share – basic
|
$ | 0.20 | $ | 0.12 | $ | 3.32 | $ | 0.12 | $ | 0.01 | ||||||||||
|
Net income per share – diluted
|
$ | 0.20 | $ | 0.11 | $ | 3.28 | $ | 0.12 | $ | 0.01 | ||||||||||
|
Balance Sheet Data
|
||||||||||||||||||||
|
Cash and cash equivalents
|
$ | 43,985 | $ | 72,660 | $ | 71,074 | $ | 46,577 | $ | 39,949 | ||||||||||
|
Working capital
|
44,745 | 75,760 | 73,358 | 48,069 | 43,818 | |||||||||||||||
|
Total assets
|
55,893 | 89,329 | 85,854 | 57,851 | 53,400 | |||||||||||||||
|
Total liabilities
|
3,504 | 4,179 | 3,958 | 3,276 | 3,517 | |||||||||||||||
|
Total stockholders’ equity
|
52,389 | 85,150 | 81,896 | 54,575 | 49,883 | |||||||||||||||
| 23 |
RESULTS OF OPERATIONS
The following table sets forth, for the years indicated, certain line items from our consolidated statements of income and comprehensive income stated as a percentage of total revenue:
|
Year ended December 31,
|
||||||||||||
|
Revenue:
|
2014
|
2013
|
2012
|
|||||||||
|
Software licenses
|
36 | % | 43 | % | 55 | % | ||||||
|
Software maintenance
|
18 | 20 | 18 | |||||||||
|
Services
|
22 | 16 | 15 | |||||||||
|
Hardware
|
21 | 16 | - | |||||||||
|
Royalties
|
3 | 5 | 12 | |||||||||
|
Total revenue
|
100 | 100 | 100 | |||||||||
|
Costs and expenses:
|
||||||||||||
|
Cost of hardware
|
15 | 12 | - | |||||||||
|
Cost of services
|
10 | 8 | 9 | |||||||||
|
Research and development
|
23 | 21 | 20 | |||||||||
|
Selling and marketing
|
16 | 18 | 20 | |||||||||
|
General and administrative
|
15 | 18 | 22 | |||||||||
|
Total costs and expenses
|
79 | 77 | 71 | |||||||||
|
Patent related income
|
9 | 4 | 506 | |||||||||
|
Operating income
|
30 | 27 | 535 | |||||||||
|
Other income (expense)
|
- | - | - | |||||||||
|
Interest income
|
- | 2 | 1 | |||||||||
|
Income from continuing operations before income taxes
|
30 | 29 | 536 | |||||||||
|
Provision for income taxes
|
11 | 10 | 118 | |||||||||
|
Income from continuing operations
|
19 | 19 | 418 | |||||||||
|
Loss from discontinued operations, net of income taxes
|
- | (6 | ) | - | ||||||||
|
Net income
|
19 | % | 13 | % | 418 | % | ||||||
Summary of Operations
Continuing Operations.
We are primarily engaged in the development and sale of biometrics products and services. Our software products are used in government and commercial biometrics systems to identify or authenticate people. Principal government applications of biometrics systems include border control, law enforcement, national defense, secure credentialing, access control, and background checks. Principal commercial applications include: i) user authentication for login and access to mobile devices, computers, networks, and software programs; ii) user authentication for financial transactions and purchases (online and in-person); iii) physical access control to buildings, and iv) screening and background checks of prospective employees and customers. We sell our software and services globally through systems integrators and OEMs, and directly to end user customers. We also derive a minor portion of our revenue from the sale of imaging software to OEMs that incorporate that software into medical imaging products.
Discontinued Operations.
We shut down our DSL service assurance hardware product line in 2012 and our DSL service assurance software product line in 2013. Both of these product lines were previously components of our DSL Service Assurance Segment. The results of the DSL Service Assurance Segment have been reported as discontinued operations as we no longer have any significant continuing involvement with, or cash flows from, this segment.
| 24 |
Summary of Financial Results
Income from continuing operations for the year ended December 31, 2014 was $4.6 million, or $0.20 per diluted share, which compares to income from continuing operations of $3.8 million, or $0.16 per diluted share, for the year ended December 31, 2013. Higher income from continuing operations in 2014 was primarily due to an increase in patent related income.
Income from continuing operations for the year ended December 31, 2013 was $3.8 million, or $0.16 per diluted share, which compares to income from continuing operations of $72.4 million, or $3.28 per diluted share, for the year ended December 31, 2012. Lower income from continuing operations in 2013 was primarily due to a decrease in patent related income.
Software Licenses
Software licenses consist of revenue from the sale of biometrics and imaging software products. Sales of software products depend on our ability to win proposals to supply software for biometrics systems projects either directly to end user customers or indirectly through channel partners.
Software license revenue increased 4% from $8.2 million in 2013 to $8.5 million in 2014. As a percentage of total revenue, software license revenue decreased from 43% in 2013 to 36% in 2014. The dollar increase in software license revenue was primarily due to a $0.4 million increase in sales of imaging software. Sales of biometrics software licenses were essentially unchanged from 2013, which reflects approximately the same number of project wins in both years.
Software license revenue decreased 13% from $9.5 million in 2012 to $8.2 million in 2013. As a percentage of total revenue, software license revenue decreased from 55% in 2012 to 43% in 2013. The dollar decrease in software license revenue was primarily due to lower sales to systems integrator and OEM customers. Software license sales to direct government customers were approximately the same in both years. We believe that lower software demand from channel partners in 2013 was primarily attributable to two factors: i) our partners won fewer new systems projects proposals involving our software in 2013; and ii) some larger projects that commenced in 2011 and 2012 wound down during 2013.
Software Maintenance
Software maintenance consists of revenue from the sale of software maintenance contracts. Software maintenance contracts entitle customers to receive software support and software updates, if and when they become available, during the term of the contract.
Software maintenance revenue increased 13% from $3.9 million in 2013 to $4.4 million in 2014. As a percentage of total revenue, software maintenance revenue decreased from 20% in 2013 to 18% in 2014.
Software maintenance revenue increased 27% from $3.0 million in 2012 to $3.9 million in 2013. As a percentage of total revenue, software maintenance revenue increased from 18% in 2012 to 20% in 2013.
The dollar increase in software maintenance revenue in 2014 and 2013 was primarily due to a growing base of customers who use our software and who also purchase maintenance contracts on that software. A majority of our customers purchase software maintenance contracts when they initially purchase software licenses. Since our software is used in active biometrics systems, many of our customers continue to renew their maintenance contracts in subsequent years while systems remain operational.
Services
Services consist of fees we charge to perform software development, integration, installation, and customization services. Similar to software license revenue, services revenue depends on our ability to win biometrics systems projects either directly with government customers or in conjunction with channel partners. Services revenue will fluctuate when we commence new projects and/or when we complete projects that were started in previous periods.
| 25 |
Services increased 64% from $3.1 million in 2013 to $5.2 million in 2014. As a percentage of total revenue, services increased from 16% in 2013 to 22% in 2014. The dollar increase in services revenue was due to: i) a $1.6 million increase from direct government customers; and ii) a $0.4 million increase from channel partners and direct commercial customers. The increase in direct government services was primarily due to a significant project with a U.S. government customer that commenced in the third quarter of 2013 and continued throughout 2014. This project is currently scheduled to end in March 2015, which means that services revenue may decline in 2015 unless we can replace the loss of revenue from this customer with services revenue from other customers. The $0.4 million increase in services revenue from channel partners and direct commercial customers was attributable to an increase in projects with a number of customers in 2014 as opposed to large projects with a small number of customers.
Services increased 22% from $2.6 million in 2012 to $3.1 million in 2013. As a percentage of total revenue, services increased from 15% in 2012 to 16% in 2013. The dollar increase in services revenue was primarily due to a significant project with a new U.S. government customer that commenced in 2013. As of December 31, 2013, we had $2.2 million of services revenue in backlog with this customer, which we expect to deliver in 2014. Services revenue derived from all other government customers and channel partners in 2012 and 2013 was approximately the same in both years.
Hardware
Hardware revenue consists of sales of biometrics equipment to a single U.S. government customer for whom we developed biometrics software. Hardware products sold to this customer integrate hardware purchased from third parties with software from other third parties as well as software from Aware. We evaluated the classification of gross versus net revenue recognition and determined gross recognition was appropriate.
Hardware revenue increased 55% from $3.2 in 2013 to $4.9 million in 2014. As a percentage of total revenue, hardware revenue increased from 16% in 2013 to 21% in 2014. The dollar increase in hardware revenue was due to
an increase in units ordered by our U.S. government hardware customer during 2014.
We are unable to predict future hardware revenue with any degree of certainty because: i) our contract with the government provides pricing, but does not obligate it to purchase any products until it provides us with purchase orders; and ii) forecasting our customer’s demand is difficult. Moreover, future orders from this customer may be minimal as we believe that the bulk of its purchases may have already occurred. We have no order backlog for hardware products as of December 31, 2014.
Hardware revenue increased from $0 in 2012 to $3.2 million in 2013. As a percentage of total revenue, hardware revenue increased from 0% in 2012 to 16% in 2013. The dollar increase in hardware revenue was due to the commencement of shipments in 2013.
Royalties
Royalties consist primarily of royalty payments we receive under DSL silicon contracts with two customers that incorporate our silicon intellectual property (“IP”) in their DSL chipsets. We sold the assets of our DSL IP business in 2009, but we continue to receive royalty payments from these customers. Royalties are reported in continuing operations in accordance with ASC 205-20, Reporting Discontinued Operations, because we have continuing ongoing cash flows from this business.
Royalties decreased 21% from $0.9 million in 2013 to $0.7 million in 2014. As a percentage of total revenue, royalties decreased from 5% in 2013 to 3% in 2014. The dollar decrease in royalties was primarily due to lower DSL royalties from both of our licensees.
Royalties decreased 58% from $2.2 million in 2012 to $0.9 million in 2013. As a percentage of total revenue, royalties decreased from 12% in 2012 to 5% in 2013. The dollar decrease in royalties was primarily due to lower DSL royalties from both of our licensees. One of our licensees achieved chipset sales that exceeded certain sales thresholds in our contractual arrangement in late 2012. The achievement of those sales thresholds triggered reductions in the royalty rate it is required to pay on certain products and eliminated them altogether on other products. Our other licensee also reported lower royalties to us in 2013.
| 26 |
We believe it is likely that royalties will continue to decline in future quarters.
Cost of Hardware
Cost of hardware consists primarily of the cost of third party equipment and software included in hardware shipments.
Cost of hardware increased by 47% from $2.4 million in 2013 to $3.5 million in 2014. Cost of hardware as a percentage of hardware revenue decreased from 74% in 2013 to 71% in 2014, which means that product gross margins increased from 26% in 2013 to 29% in 2014. The dollar increase in cost of hardware was due to higher unit shipments of hardware products in the current year periods compared to the prior year period.
Cost of hardware increased from $0 in 2012 to $2.4 million in 2013. Cost of hardware as a percentage of hardware revenue were 74% in 2013, which means that gross margins on hardware revenue were 26%. The dollar increase in cost of hardware was due to the commencement of hardware shipments in 2013.
Cost of Services
Cost of services consists of engineering costs to perform customer services projects. Such costs primarily include: i) engineering salaries, stock-based compensation, fringe benefits, and facilities; and ii) engineering consultants and contractors.
Cost of services increased 57% from $1.5 million in 2013 to $2.4 million in 2014. Cost of services as a percentage of services decreased from 48% in 2013 to 46% in 2014, which means that gross margins on services increased from 52% to 54%. The dollar increase in cost of services was attributable to an increase in services revenue.
Cost of services was unchanged at $1.5 million in 2012 and 2013. As a percentage of services revenue, cost of services decreased from 60% in 2012 to 48% in 2013, which means that gross margins on services increased from 40% to 52%.
Gross services margins of 54%, 52%, and 40% in 2014, 2013 and 2012, respectively, were a function of: i) the nature of the projects; ii) the level of engineering difficulty and labor hours required to complete project tasks; and iii) how much we were able to charge. Gross margins in these years reflect the profitability mix of customer projects. We expect that gross margins on services will continue to fluctuate in future periods based on the nature, complexity, and pricing of future projects.
Research and Development Expense
Research and development expense consists of costs for: i) engineering personnel, including salaries, stock-based compensation, fringe benefits, and facilities; ii) engineering consultants and contractors, and iii) other engineering expenses such as supplies, equipment depreciation, dues and memberships and travel. Engineering costs incurred to develop our technology and products are classified as research and development expense. As described in the cost of services section, engineering costs incurred to provide engineering services for customer projects are classified as cost of services, and are not included in research and development expense.
The classification of total engineering costs to research and development expense and cost of services was (in thousands):
|
Years ended December 31,
|
||||||||||||
|
2014
|
2013
|
2012
|
||||||||||
|
Research and development expense
|
$ | 5,505 | $ | 4,085 | $ | 3,489 | ||||||
|
Cost of services
|
2,359 | 1,503 | 1,542 | |||||||||
|
Total engineering costs
|
$ | 7,864 | $ | 5,588 | $ | 5,031 | ||||||
| 27 |
Research and development expense increased 35% from $4.1 million in 2013 to $5.5 million in 2014. As a percentage of total revenue, research and development expense increased from 21% in 2013 to 23% in 2014
As the table above indicates, total engineering costs increased from $5.6 million in 2013 to $7.9 million in 2014. The spending increase was primarily due to the hiring of engineering employees and contractors. In the last 18 months, engineering headcount, excluding contractors, grew from 30 employees as of June 30, 2013 to 48 employees as of December 31, 2014. The expansion of our engineering organization was designed to provide the resources we required to: i) pursue new product development initiatives; and ii) staff customer engineering services projects.
Research and development expense increased 17% from $3.5 million in 2012 to $4.1 million in 2013. As a percentage of total revenue, research and development expense increased from 20% in 2012 to 21% in 2013.
As the table above indicates, total engineering costs increased from $5.0 million in 2012 to $5.6 million in 2013. The dollar increase in research and development expense in 2013 was primarily due to headcount growth in our engineering organization, which was partially offset by lower expenses related to a former employee who was involved with the effort to monetize patents who left the company in 2012.
As we described in the strategy section in Part 1 of this Form 10-K, we intend to introduce new products that will allow us to offer more complete biometrics solutions. We believe this strategy will allow us to sell more software into biometrics systems projects in order to grow our revenue. Our preference is to develop such products internally, however to the extent we are unable to do that, we may purchase or license technologies from third parties. The engineering spending increases in 2013 and 2014 are a reflection of that strategy. We anticipate that we will continue to focus our future research and development activities on enhancing existing products and developing new products.
Selling and Marketing Expense
Selling and marketing expense primarily consists of costs for: i) sales and marketing personnel, including salaries, sales commissions, stock-based compensation, fringe benefits, travel, and facilities; and ii) advertising and promotion expenses.
Sales and marketing expense increased 12% from $3.3 million in 2013 to $3.7 million in 2014. As a percentage of total revenue, sales and marketing expense decreased from 18% in 2013 to 16% in 2014. The dollar increase in selling and marketing expense was primarily due to higher sales commissions on higher revenue in 2014, and the addition of one sales and marketing employee in early 2014.
Selling and marketing expense was essentially unchanged at approximately $3.3 million in 2012 and 2013. As a percentage of total revenue, selling and marketing expense decreased from 20% in 2012 to 18% in 2013. Unchanged selling and marketing expense reflects two sets of offsetting factors. Expenses increased due to growth in our sales organization, but those increases were mostly offset by lower expenses related to a former employee who was involved with the effort to monetize patents who left the company in 2012. Expense growth in the sales organization was driven by new sales employees, foreign sales agents, and higher sales commissions.
General and Administrative Expense
General and administrative expense consists primarily of costs for: i) officers, directors and administrative personnel, including salaries, bonuses, director compensation, stock-based compensation, fringe benefits, and facilities; ii) professional fees, including legal and audit fees; iii) public company expenses; and iv) other administrative expenses, such as insurance costs and bad debt provisions.
General and administrative expense increased 4% from $3.5 million in 2013 to $3.7 million in 2014. As a percentage of total revenue, general and administrative expense decreased from 18% in 2013 to 15% in 2014. The increase in general and administrative expense in 2014 was primarily due to an increase in stock-based compensation which was partially offset by lower patent filing expenses.
| 28 |
General and administrative expense decreased 9% from $3.9 million in 2012 to $3.5 million in 2013. As a percentage of total revenue, general and administrative expense decreased from 22% in 2012 to 18% in 2013. The dollar decrease in general and administrative expense was primarily due to two sets of offsetting factors. Expenses decreased due to lower: i) patent prosecution legal fees; ii) audit fees; and iii) general corporate legal fees. Such expense reductions were partially offset by stock-based compensation costs associated with a stock grant to directors and officers in April 2013.
Patent Related Income
Patent related income in the years ended December 31, 2014, 2013 and 2012 was derived from either gains on the sale of patent assets or income from a patent arrangement, or both. Income from these sources was included in income from continuing operations pursuant to ASC 360-10, Impairment or Disposal of Long-Lived Assets, and Rule 5-03 of Regulation S-X.
The composition of patent related income in 2014, 2013, and 2012 was as follows:
Year ended December 31, 2014.
We had a $2.1 million gain on the sale of patent assets and no income from our patent arrangement in 2014. The gain on the sale of patent assets is described below:
We sold a portion of our patent portfolio pertaining to DSL diagnostic technology to an unrelated third party for $2.6 million. The proceeds from the sale were reduced by $0.5 million of transaction costs, which consisted primarily of fees from the law firm that assisted us in the sale. We recorded a gain of $2.1 million on the sale.
The DSL diagnostic technology in the patents we sold in 2014 was related to our DSL Service Assurance business that we shut down in 2012 and 2013 and reported in discontinued operations in those periods. We do not consider our patent related activities to be a component of the operating business from which the underlying technology was derived, but rather as a component of corporate general and administrative expenses. Accordingly the gain on the sale of these patents was reported in income from continuing operations.
Year ended December 31, 2013.
We had $0.8 million of income from a patent arrangement and no gains on the sale of patent assets in 2013. Income from the patent arrangement is described below:
We entered into an arrangement with an unaffiliated third party in 2010 under which we assigned certain patents in return for royalties on proceeds from patent monetization efforts by the third party. Such third party has engaged in various patent monetization activities, including enforcement, litigation and licensing. The party reported and we recorded $0.8 million of income from this arrangement in the year ended December 31, 2013.
We continue to have a contractual relationship with this third party. However, we are unable to predict how much more income we might receive from this arrangement, if any, because:
|
|
●
|
The claims in one of the patents we assigned were rejected by the United States Patent Office (“USPTO”) in May 2013. The USPTO’s Patent Trial & Appeal Board (“PTAB”) affirmed the USPTO decision in June 2014. The PTAB decision was appealed to the Federal Circuit. In December 2014, the Federal Circuit remanded the appeal back to the PTAB for further consideration.
|
|
|
●
|
Notwithstanding the outcome at the PTAB, we do not know whether any patent monetization efforts by the third party will be successful.
|
Year ended December 31, 2012.
We had total patent related income of $87.5 million in 2012, which consisted of $86.4 million of gains on the sale of patent assets and $1.1 million of income from our patent arrangement. Patent related income in 2012 is described below:
Gains on the sale of patent assets
. Total gains on the sale of patent assets in 2012 were $86.4 million, which consisted of gains from two separate sales. Gains from both sales were recorded in income from continuing operations as none of these patents were related to any discontinued operations, including our discontinued DSL Service Assurance business. The two sales are described below:
|
|
●
|
We sold a portion of our patent portfolio pertaining to wireless technology to an unaffiliated third party for $75.0 million. The proceeds from the sale were reduced by $3.8 million of transaction costs, which consisted primarily of fees from the law firm that assisted us in the sale. We recorded a gain of $71.2 million on the sale.
|
| 29 |
|
|
●
|
We sold a portion of our patent portfolio pertaining to DSL semiconductor intellectual property technology for $16.0 million. The proceeds from the sale were reduced by $0.8 million of transaction costs, which also consisted primarily of fees from the law firm that assisted us in the sale. We recorded a gain of $15.2 million on the sale.
|
Income from patent arrangement.
The third party to whom we assigned patents reported and we recorded $1.1 million of income from this arrangement in the year ended December 31, 2012.
Other Income/(Expense)
We recorded other expense of $59,000 in the year ended December 31, 2014, and other income of $23,000 and $85,000 in the years ended December 31, 2013 and 2012, respectively. Other income or expense in all three years consisted of realized gains or losses on sales or calls of high yield bond investments.
Interest Income
Interest income decreased 31%, or $103,000, from $328,000 in 2013 to $225,000 in 2014. The dollar decrease was primarily due to i) lower levels of high yield bond investments held in 2014 as compared to 2013; and ii) lower cash balances as a result of a $39.9 million dividend payment in July 2014.
Interest income increased 44%, or $101,000, from $227,000 in 2012 to $328,000 in 2013. The dollar increase was primarily due to interest income from high yield bonds as we held more bonds in 2013 than 2012.
Income Taxes
We are subject to income taxes in the United States and we use estimates in determining our provisions for income taxes. We account for income taxes using the asset and liability method for accounting and reporting income taxes. Deferred tax assets and liabilities are recognized based on temporary differences between the financial reporting and income tax bases of assets and liabilities using statutory rates.
A discussion of income taxes for the years ended December 31, 2014, 2013, and 2012 follows:
Year ended December 31, 2014
. Total income tax expense for the year ended December 31, 2014 was $2.7 million, all of which was recorded in continuing operations. Income tax expense for 2014 was based on the U.S. statutory rate of 34%, increased by state income taxes, and reduced by Federal research tax credits and permanent adjustments.
As of December 31, 2014, we had a total of $1.0 million of deferred tax assets for which we had recorded no valuation allowance. We will continue to assess the level of valuation allowance in future periods. Should evidence regarding the realizability of tax assets change at a future point in time, the valuation allowance will be adjusted accordingly.
In addition to deferred tax assets carried on our balance sheet, we also had net federal and state research and development credit carryforwards available at December 31, 2014 of $4.0 million and $0.3 million. These credits were not recorded as tax assets as they relate to excess stock compensation deductions that may not be recorded as tax assets under generally accepted accounting principles until the amounts have been utilized to reduce our tax liability. To the extent that these assets can be used to reduce taxes, the benefit must be recorded as a reduction to additional paid-in capital. In 2014, we recorded a tax benefit of $1.2 million to equity related to the use of these tax credits to reduce our tax liability.
In 2014, the Internal Revenue Service commenced an examination of our tax return for the year ended December 31, 2012.
| 30 |
Year ended December 31, 2013.
Total income tax expense for the year ended December 31, 2013 was $1.2 million, including $1.9 million that was recorded in continuing operations less a tax benefit of $0.7 million that was recorded in discontinued operations. Income tax expense for 2013 was based on the U.S. statutory rate of 34%, increased by state income taxes, and reduced by Federal research tax credits and permanent adjustments. Tax expense in 2013 also reflects two items related to 2012, including: i) a tax benefit of $95,000 related to the 2012 research tax credit. This credit was extended retroactively back to January 1, 2012, by the American Taxpayer Relief Act of 2012, which was enacted on January 2, 2013; and ii) a tax benefit of $148,000 related to a reduction in the estimate of the 2012 tax expense recorded in our 2012 financial statements.
In 2013, we recorded a tax benefit of $128,000 that reduced our tax liability. This benefit was recorded in equity as it was related to federal and state research tax credits that represented excess stock compensation deductions.
Year ended December 31, 2012.
Total income tax expense for the year ended December 31, 2012 was $20.4 million, including $20.5 million that was recorded in continuing operations less a tax benefit of $51,000 that was recorded in discontinued operations. The Company’s actual tax liability for 2012 was $7.8 million as taxes that were currently payable were reduced by a $14.4 million equity adjustment. This equity adjustment is described more fully below.
In 2012, we used a significant portion of our available deferred tax assets to reduce income taxes on pre-tax income. A substantial portion of the deferred tax assets we utilized comprised cumulative deductions for stock options in excess of book expense. Under income tax accounting rules, the portion of tax benefits attributable to such deductions must be recorded as an adjustment to equity versus a reduction of income tax expense. In the year ended December 31, 2012, the tax benefits from such stock-based awards were $14.4 million, which we recorded as an equity adjustment to additional paid-in capital.
Income tax expense in 2012 was also reduced by a $1.8 million reversal of the valuation allowance on our remaining deferred tax assets at December 31, 2012. We reversed the valuation allowance because based on all the available evidence, we believed that it is more likely than not that our deferred tax assets will be realizable. In reaching this determination, we evaluated: i) our most recent years operating results; ii) our future financial plans; and iii) the nature of the components comprising deferred tax assets at December 31, 2012.
Loss from discontinued operation, net of income taxes.
Loss from discontinued operations, net of income taxes reflects results from our discontinued DSL Service Assurance Segment. This segment includes results from our DSL hardware and software product lines that we shut down in 2012 and 2013, respectively. Loss from such discontinued operations was (in thousands):
|
Years ended December 31,
|
||||||||||||
|
2014
|
2013
|
2012
|
||||||||||
|
Revenue
|
$ | - | $ | 3,216 | $ | 5,431 | ||||||
|
Expenses
|
- | 5,120 | 5,558 | |||||||||
|
Loss before income taxes
|
- | (1,904 | ) | (127 | ) | |||||||
|
Income tax benefit
|
- | (748 | ) | (51 | ) | |||||||
|
Loss from discontinued operations
|
$ | - | ($ | 1,156 | ) | ($ | 76 | ) | ||||
| 31 |
LIQUIDITY AND CAPITAL RESOURCES
In recent years, we have financed the company with our cash balances, cash generated from operations, and cash received from the sale of patent assets. Equity financing has not been a meaningful source of financing for us in recent years. Cash flows from operating, investing and financing activities are described below.
Cash flow from operating activities
In the years ended December 31, 2014 and 2013, our operating activities provided net cash of $6.3 million and $2.8 million, respectively. In the year ended December 31, 2012, our operating activities used net cash of $15.3 million. A discussion of cash flow from operating activities for each of the last three years follows:
Year ended December 31, 2014.
Cash provided by operating activities of $6.3 million in 2014 was primarily the result of net income of $4.6 million, which was increased for non-cash items related to depreciation and amortization of $0.5 million and stock-based compensation expense of $0.9 million. Cash provided by operating activities also included $2.4 million of cash that came from a reduction of working capital items. Cash provided by these sources was partially offset by a $2.1 million gain on the sale of patent assets that was included in $4.6 million of net income, but was included in cash flow from investing activities in the statements of cash flow.
Year ended December 31, 2013.
Cash provided by operations of $2.8 million in 2013 was primarily the result of net income of $2.6 million, which was increased for non-cash items related to depreciation and amortization of $0.5 million and stock-based compensation expense of $0.7 million. Cash provided from these sources was partially offset by $1.0 million of net cash used to fund working capital items.
Year ended December 31, 2012.
Cash used by operating activities of $15.3 million in 2012 was primarily the result of: i) cash provided by on-going operations of $6.7 million; less ii) income tax items on patent sales of $22.0 million. A discussion of each of these factors follows:
|
|
●
|
Cash provided by on-going operations of $6.7 million was the result of: i) operating income before patent related income of $5.0 million; ii) interest income and other income of $0.3 million; iii) adjustments for non-cash items related to depreciation and stock-based compensation of $0.5 million and $0.3 million, respectively; and iv) changes in working capital components that increased cash by $0.6 million.
|
|
|
●
|
Cash provided by on-going operations of $6.7 million was reduced by $22.0 million of income tax items that were incurred as a result of our patent sales in 2012. The $22.0 million of income tax items comprises: i) $7.6 million of tax payments; and ii) $14.4 million of tax expense that is reduced by a tax benefit from excess stock-based compensation that must be presented as cash flows from financing activities under generally accepted accounting principles as opposed to an item that benefits cash flows from operating activities.
|
Cash flow from investing activities
In the year ended December 31, 2014 and 2012, our investing activities provided net cash of $3.4 million and $85.1 million, respectively. In the year ended December 31, 2013, our investing activities used net cash of $1.4 million. A discussion of cash flow from investing activities for each of the last three years follows:
Year ended December 31, 2014.
Cash provided by investing activities of $3.4 million in 2014 was primarily the result of $2.1 million of net proceeds from the sale of patent assets and $1.4 million of proceeds from the sale of investments. Cash provided from these sources was partially offset by $0.1 million of capital expenditures.
Year ended December 31, 2013.
Cash used by investing activities of $1.4 million in 2013 was primarily the result of $0.2 million of capital expenditures, $0.9 million of net investment purchases, and $0.3 million used to purchase other assets.
Year ended December 31, 2012.
Cash provided by investing activities of $85.1 million in 2012 was primarily due to $86.4 million of net proceeds from the sale of patent assets. Cash provided from the sale of patent assets was reduced by: i) $0.1 million of capital expenditures; and ii) $1.2 million of net investment purchases.
We have no material commitments for capital expenditures.
| 32 |
Cash flow from financing activities
In the years ended December 31, 2014 and 2012, our financing activities used net cash of $38.4 million and $45.3 million, respectively. In the year ended December 31, 2013, our financing activities provided net cash of $122,000. A discussion of cash flow from financing activities for each of the last three years follows:
Year ended December 31, 2014.
Cash used by financing activities of $38.4 million in 2014 was primarily the result of a $39.9 million dividend payment and $0.2 million used to repurchase stock from employees in connection with stock issuances under a stock grant program. Cash used by these two items was partially offset by: i) a $1.2 million tax benefit related to excess stock-based compensation; and ii) $0.5 million of proceeds from the exercise of stock options.
Year ended December 31, 2013.
Cash provided by financing activities of $122,000 in 2013 was primarily the result of $65,000 of proceeds from the issuance of stock under employee stock programs and $128,000 of excess tax benefits from stock-based compensation. Cash provided by these two factors was partially offset by $71,000 used to repurchase stock from employees in connection with stock issuances under a 2013 stock grant.
Year ended December 31, 2012.
Cash used by financing activities of $45.3 million in 2012 was primarily the result of $66.0 million of dividend payments and $0.2 million used to repurchase stock from employees in connection with stock issuances under a stock grant program. Cash usage by these two factors was partially offset by: i) $6.5 million of proceeds from the exercise of stock options; and ii) a $14.4 million tax benefit related to excess stock-based compensation.
At December 31, 2014, we had cash and cash equivalents of $44.0 million and investments of $1.4 million. While we cannot assure you that we will not require additional financing, or that such financing will be available to us, we believe that our cash and cash equivalents and investments will be sufficient to fund our operations for at least the next twelve months.
To date, inflation has not had a material impact on our financial results. There can be no assurance, however, that inflation will not adversely affect our financial results in the future.
| 33 |
OFF-BALANCE SHEET ARRANGEMENTS
We do not currently have any arrangements with unconsolidated entities, such as entities often referred to as structured finance, special purpose entities, or variable interest entities which are often established for the purpose of facilitating off-balance sheet arrangements or other contractually narrow or limited purposes. Accordingly, we are not exposed to any financing, liquidity, market or credit risk if we had such relationships.
In 2011 and 2012, we disclosed that we had a patent arrangement with an unaffiliated third party that we classified as a variable interest entity (“VIE”). Under this arrangement we assigned certain patents to the third party, the third party engages in monetization activities and shares royalties with us. The third party is engaged in the business of the monetization of intellectual property.
We continue to have a contractual relationship with this third party.
We also disclosed in those years that: i) we had no equity interest in the entity; ii) we were not contractually obligated to fund the entity, therefore our maximum exposure to loss as a result of our involvement with the entity was zero; iii) we may receive royalties in the future if certain conditions are met; iv) we were not the primary beneficiary of the entity; v) we had not consolidated the entity’s results into our financial statements, therefore we carried the assets and liabilities of this entity in our balance sheet at zero; and vi) prior to September 30, 2012, this arrangement had no impact on our results of operations, financial position or cash flows in any previous periods.
We determined that the third party entity was a VIE in 2011 and 2012, because we made a judgment that the arrangement met two conditions under ASC 810, Consolidation, that caused VIE classification, namely: i) our right to receive royalties entitled us to receive a portion of the entity’s expected residual returns; and ii) a provision in the agreement denied the equity holders of the third party entity the power to direct the activities that most significantly impacted the entity’s economic performance.
We also determined at that time that we were not the primary beneficiary because: i) we had no equity interest in the third party entity; and ii) a provision in the agreement resulted in “shared power” that did not give either party the power to direct the activities that most significantly impacted the economic performance of the entity. Accordingly, we were not required to consolidate the third party entity under ASC 810, because we were not the primary beneficiary.
Due to strategic legal reasons, we found it necessary to amend the agreement in August 2012 to eliminate the provision that had previously denied the equity holders of the third party entity the power to direct the activities that most significantly impacted the entity’s economic performance. Upon amendment, the equity holders of the entity had such power, and we determined that the arrangement was no longer a VIE under ASC 810.
| 34 |
CONTRACTUAL OBLIGATIONS
We have various contractual obligations impacting our liquidity. The following represents our contractual obligations as of December 31, 2014 (in thousands):
|
Payments Due By Period
|
||||||||||||||||||||
|
Contractual Obligations
|
Total
|
Less than
1 year
|
1-3 years
|
3-5 years
|
More than
5 years
|
|||||||||||||||
|
Purchase orders
|
$ | 52 | $ | 52 | $ | - | $ | - | $ | - | ||||||||||
|
Total
|
$ | 52 | $ | 52 | $ | - | $ | - | $ | - | ||||||||||
CRITICAL ACCOUNTING POLICIES
We consider certain accounting policies related to revenue recognition, stock-based compensation, income taxes, and the allowance for doubtful accounts to be critical policies.
Revenue recognition
. We derive revenue from five sources: (i) software licenses; (ii) software maintenance; (iii) software services; iv) hardware; and (v) royalties.
We recognize revenue when there is persuasive evidence of an arrangement, the sales price is fixed or determinable, collection of the related receivable is reasonably assured, and delivery has occurred or services have been rendered. As described below, we make significant judgments during the process of determining revenue for any particular accounting period.
In determining revenue recognition, we assess whether fees associated with revenue transactions are fixed or determinable based on the terms of the contract and based on payment terms. If the fee is not fixed or determinable, we defer the fee and recognize revenue as amounts become due and payable. We assess whether collection is reasonably assured based on a number of factors, including past transaction history with the customer and the credit-worthiness of the customer. If we determine that collection of a fee is not reasonably assured, we defer the fee and recognize revenue at the time collection becomes reasonably assured.
We must also make judgments with respect to the recognition of revenue for multiple element revenue arrangements. We recognize revenue for multiple element arrangements as follows:
Software and software related multiple element arrangements
:
We sell software licenses, software maintenance and software services in various combinations of multiple element arrangements. We apply the provisions of ASC 985-605, Software Revenue Recognition, to these arrangements because all the elements are software or software related. The various combinations of multiple element arrangements and our revenue recognition for each are described below:
|
o
|
When software licenses and maintenance contracts are sold together, we recognize software license revenue upon delivery, provided we have vendor specific objective evidence (“VSOE”) for the fair value of the maintenance contract fee, and we recognize the fair value of maintenance contract revenue ratably over the related contract period.
|
|
o
|
When software engineering services and software licenses are sold together, the total fee is generally recognized by applying contract accounting. We have adopted the percentage-of-completion method of contract accounting, and we primarily use an input method (i.e., labor hours) to determine our completion percentage.
|
|
o
|
When we sell software licenses, software maintenance, and software services together, revenue is recognized as follows: i) maintenance revenue is separated from the other two elements and is recognized ratably over the related contract period; provided we have VSOE for the fair value of the maintenance element; and ii) the total fee from the software license and engineering service elements is recognized by applying the contract accounting method described in the previous paragraph.
|
| 35 |
Hardware and software multiple element arrangements
:
|
o
|
We also have a multiple element arrangement with one customer that involves the delivery of hardware, software maintenance, and software services. We determined that these elements qualified as separate units of accounting under ASC 605, Revenue Recognition, because they have value to the customer on a standalone basis. Accordingly, we recognize hardware revenue upon delivery and acceptance by the customer, maintenance revenue ratably over the related contract period, and service revenue as services are delivered.
|
Our revenue recognition policies are described more fully in Note 2, Summary of Significant Accounting Policies, in the Notes to our Consolidated Financial Statements.
Stock-Based Compensation.
We grant stock and stock options to our employees and directors, although stock option grants in recent years have been minimal. We measure stock-based compensation cost at the grant date based on the fair value of the award and recognize it as expense over the applicable vesting period of the award using the straight-line basis.
For stock awards, we determine the fair value of the award by using the fair market value of our stock on the date of grant; provided the number of shares in the grant is fixed on the grant date.
For stock options, we use the Black-Scholes valuation model to estimate the fair value of the award. This valuation model takes into account the exercise price of the award, as well as a variety of significant assumptions. The assumptions used to estimate the fair value of stock options include the expected term, the expected volatility of our stock over the expected term, the risk-free interest rate over the expected term, and our expected annual dividend yield.
Income taxes
. As part of the process of preparing our consolidated financial statements we are required to estimate our actual current tax expense. We must also estimate temporary and permanent differences that result from differing treatment of certain items for tax and accounting purposes. These differences result in deferred tax assets and liabilities, which are included in our consolidated balance sheet. We must then assess the likelihood that our deferred tax assets will be recovered from future taxable income and to the extent we believe recovery is not likely, we must establish a valuation allowance. To the extent we establish a valuation allowance or increase this allowance in a period for deferred tax assets, which have been recognized, we must include an expense with the tax provision in the statement of operations. Conversely, to the extent we decrease our valuation allowance in a period for deferred tax assets, which have been previously reserved, we must include a tax benefit with the tax provision in the statement of operations.
Significant management judgment is required in determining our provision for income taxes, our deferred tax assets, and any valuation allowance recorded against our net deferred tax assets. Our deferred tax assets primarily relate to temporary differences that result from differing treatment of certain items for tax and accounting purposes. As of December 31, 2014, we had a total of $1.0 million of deferred tax assets for which we had recorded no valuation allowance.
We will continue to assess the level of valuation allowance required in future periods. Should evidence regarding the realizability of tax assets change at a future point in time, the valuation allowance will be adjusted accordingly.
Allowance for doubtful accounts.
We make judgments as to our ability to collect outstanding receivables and provide allowances for receivables when collection becomes doubtful. Provisions are made based upon a specific review of all significant outstanding invoices. If the judgments we make to determine the allowance for doubtful accounts do not reflect the future ability to collect outstanding receivables, additional provisions for doubtful accounts may be required.
| 36 |
RECENT ACCOUNTING PRONOUNCEMENTS
In May 2014, the FASB issued ASU 2014-09, Revenue from Contracts with Customers (Topic 606). The ASU is the result of a joint project by the FASB and the International Accounting Standards Board (“IASB”) to clarify the principles for recognizing revenue and to develop a common revenue standard for GAAP and International Financial Reporting Standards (“IFRS”) that would: remove inconsistencies and weaknesses, provide a more robust framework for addressing revenue issues, improve comparability of revenue recognition practices across entities, jurisdictions, industries, and capital markets, improve disclosure requirements and resulting financial statements, and simplify the presentation of financial statements. The core principle of the new guidance is that an entity should recognize revenue to depict the transfer of promised goods or services to customers in an amount that reflects the consideration to which the entity expects to be entitled in exchange for those goods or services. The ASU is effective for annual reporting periods beginning after December 15, 2016. Early adoption is not permitted. We are currently evaluating the effect that the updated standard will have on our consolidated financial statements and related disclosures.
With the exception of the new revenue standard discussed above, there have been no other recently issued accounting pronouncements that are of significance or potential significance to us that we have not adopted as of December 31, 2014.
Our exposure to market risk relates primarily to our investment portfolio, and the effect that changes in interest rates would have on that portfolio. Our investment portfolio at December 31, 2014 consisted of two elements:
|
1.
|
Cash and cash equivalents.
As of December 31, 2014, our cash and cash equivalents of $44.0 million were primarily invested in money market funds. The money market funds were invested in high quality, short term financial instruments. Due to the nature, short duration, and professional management of these funds, we do not expect that a general increase in interest rates would result in any material loss.
|
|
2.
|
Investments.
As of December 31, 2014, our investments of $1.4 million were invested in high yield bonds with three corporate debt issuers, which mature in 2017 and 2018. While we are exposed to default risk, the high current yield of these bonds largely mitigates interest rate risk. Therefore, due to the high current yield and the two to five year life of these instruments, we do not believe that a general increase in interest rates would result in any material loss.
|
We do not use derivative financial instruments for speculative or trading purposes.
| 37 |
Report of Independent Registered Public Accounting Firm
Board of Directors and Stockholders of Aware, Inc.:
We have audited the accompanying consolidated balance sheets of Aware, Inc. (“the Company”) as of December 31, 2014 and 2013, and the related consolidated statements of income and comprehensive income, stockholders’ equity (deficit) and cash flows for each of the three years in the period ended December 31, 2014 and the financial statement schedule of Aware, Inc. listed in Item 15(a). We also have audited Aware, Inc.’s internal control over financial reporting as of December 31, 2014, based on criteria established in Internal Control — Integrated Framework issued by the Committee of Sponsoring Organizations of the Treadway Commission in 2013. Aware, Inc.’s management is responsible for these financial statements, for maintaining effective internal control over financial reporting, and for its assessment of the effectiveness of internal control over financial reporting included in the accompanying Management’s Report on Internal Control over Financial Reporting. Our responsibility is to express an opinion on these financial statements and an opinion on the Company’s internal control over financial reporting based on our audits.
We conducted our audits in accordance with the standards of the Public Company Accounting Oversight Board (United States). Those standards require that we plan and perform the audits to obtain reasonable assurance about whether the financial statements are free of material misstatement and whether effective internal control over financial reporting was maintained in all material respects. Our audits of the financial statements included examining, on a test basis, evidence supporting the amounts and disclosures in the financial statements, assessing the accounting principles used and significant estimates made by management, and evaluating the overall financial statement presentation. Our audit of internal control over financial reporting included obtaining an understanding of internal control over financial reporting, assessing the risk that a material weakness exists, and testing and evaluating the design and operating effectiveness of internal control based on the assessed risk. Our audits also included performing such other procedures as we considered necessary in the circumstances. We believe that our audits provide a reasonable basis for our opinions.
A company’s internal control over financial reporting is a process designed to provide reasonable assurance regarding the reliability of financial reporting and the preparation of financial statements for external purposes in accordance with generally accepted accounting principles. A company’s internal control over financial reporting includes those policies and procedures that (a) pertain to the maintenance of records that, in reasonable detail, accurately and fairly reflect the transactions and dispositions of the assets of the company; (b) provide reasonable assurance that transactions are recorded as necessary to permit preparation of financial statements in accordance with generally accepted accounting principles, and that receipts and expenditures of the company are being made only in accordance with authorizations of management and directors of the company; and (c) provide reasonable assurance regarding prevention or timely detection of unauthorized acquisition, use, or disposition of the company’s assets that could have a material effect on the financial statements.
Because of its inherent limitations, internal control over financial reporting may not prevent or detect misstatements. Also, projections of any evaluation of effectiveness to future periods are subject to the risk that controls may become inadequate because of changes in conditions, or that the degree of compliance with the policies or procedures may deteriorate.
In our opinion, the consolidated financial statements referred to above present fairly, in all material respects, the financial position of Aware, Inc. as of December 31, 2014 and 2013, and the consolidated results of its operations and its cash flows for each of the years in the three-year period ended December 31, 2014, in conformity with accounting principles generally accepted in the United States of America, and in our opinion, the related financial statement schedule, when considered in relation to the basic consolidated financial statements taken as a whole, present fairly in all material respects the information set forth therein. Also in our opinion, Aware, Inc. maintained, in all material respects, effective internal control over financial reporting as of December 31, 2014, based on criteria established in Internal Control — Integrated Framework issued by the Committee of Sponsoring Organizations of the Treadway Commission in 2013.
/s/ McGladrey LLP
Boston, Massachusetts
February 13, 2015
| 38 |
AWARE, INC.
CONSOLIDATED BALANCE SHEETS
(in thousands, except share data)
|
December 31,
|
||||||||
|
2014
|
2013
|
|||||||
|
ASSETS
|
||||||||
|
Current assets:
|
||||||||
|
Cash and cash equivalents
|
$ | 43,985 | $ | 72,660 | ||||
|
Accounts receivable (less allowance for doubtful accounts of $20 at December 31, 2014 and 2013)
|
3,619 | 4,582 | ||||||
|
Inventories
|
2 | 1,601 | ||||||
|
Deferred tax assets
|
168 | 383 | ||||||
|
Prepaid expenses and other current assets
|
401 | 695 | ||||||
|
Total current assets
|
48,175 | 79,921 | ||||||
|
Property and equipment, net
|
5,289 | 5,582 | ||||||
|
Investments
|
1,428 | 2,754 | ||||||
|
Long term deferred tax assets
|
804 | 762 | ||||||
|
Other assets
|
197 | 310 | ||||||
|
Total assets
|
$ | 55,893 | $ | 89,329 | ||||
|
LIABILITIES AND STOCKHOLDERS’ EQUITY
|
||||||||
|
Current liabilities:
|
||||||||
|
Accounts payable
|
$ | 258 | $ | 1,516 | ||||
|
Accrued expenses
|
108 | 108 | ||||||
|
Accrued compensation
|
585 | 571 | ||||||
|
Accrued professional fees
|
127 | 118 | ||||||
|
Deferred revenue
|
2,352 | 1,848 | ||||||
|
Total current liabilities
|
3,430 | 4,161 | ||||||
|
Long-term deferred revenue
|
74 | 18 | ||||||
|
Commitments and contingent liabilities (Note 9)
|
||||||||
|
Stockholders’ equity:
|
||||||||
|
Preferred stock, $1.00 par value; 1,000,000 shares authorized,
none outstanding
|
- | - | ||||||
|
Common stock, $.01 par value; shares authorized,
70,000,000 in 2014 and 2013; issued
and outstanding 22,808,761 in 2014 and 22,574,251 in 2013
|
228 | 226 | ||||||
|
Additional paid-in capital
|
103,756 | 101,293 | ||||||
|
Accumulated other comprehensive loss
|
(29 | ) | (125 | ) | ||||
|
Accumulated deficit
|
(51,566 | ) | (16,244 | ) | ||||
|
Total stockholders’ equity
|
52,389 | 85,150 | ||||||
|
Total liabilities and stockholders’ equity
|
$ | 55,893 | $ | 89,329 | ||||
The accompanying notes are an integral part of the consolidated financial statements.
| 39 |
AWARE, INC.
CONSOLIDATED STATEMENTS OF INCOME AND COMPREHENSIVE INCOME
(in thousands, except per share data)
|
Years ended December 31,
|
||||||||||||
|
2014
|
2013
|
2012
|
||||||||||
|
Revenue:
|
||||||||||||
|
Software licenses
|
$ | 8,537 | $ | 8,241 | $ | 9,525 | ||||||
|
Software maintenance
|
4,351 | 3,866 | 3,038 | |||||||||
|
Services
|
5,173 | 3,148 | 2,571 | |||||||||
|
Hardware
|
4,933 | 3,182 | - | |||||||||
|
Royalties
|
726 | 920 | 2,170 | |||||||||
|
Total revenue
|
23,720 | 19,357 | 17,304 | |||||||||
|
Costs and expenses:
|
||||||||||||
|
Cost of hardware
|
3,485 | 2,365 | - | |||||||||
|
Cost of services
|
2,359 | 1,503 | 1,542 | |||||||||
|
Research and development
|
5,505 | 4,085 | 3,489 | |||||||||
|
Selling and marketing
|
3,741 | 3,344 | 3,370 | |||||||||
|
General and administrative
|
3,668 | 3,522 | 3,860 | |||||||||
|
Total costs and expenses
|
18,758 | 14,819 | 12,261 | |||||||||
|
Patent related income
|
2,127 | 780 | 87,515 | |||||||||
|
Operating income
|
7,089 | 5,318 | 92,558 | |||||||||
|
Other income (expense)
|
(59 | ) | 23 | 85 | ||||||||
|
Interest income
|
225 | 328 | 227 | |||||||||
|
Income from continuing operations before income taxes
|
7,255 | 5,669 | 92,870 | |||||||||
|
Provision for income taxes
|
2,672 | 1,917 | 20,487 | |||||||||
|
Income from continuing operations
|
4,583 | 3,752 | 72,383 | |||||||||
|
Loss from discontinued operations, net of income taxes
|
- | (1,156 | ) | (76 | ) | |||||||
|
Net income
|
$ | 4,583 | $ | 2,596 | $ | 72,307 | ||||||
|
Basic net income per share:
|
||||||||||||
|
Basic net income per share from continuing operations
|
$ | 0.20 | $ | 0.17 | $ | 3.32 | ||||||
|
Basic net loss per share from discontinued operations
|
- | (0.05 | ) | (0.00 | ) | |||||||
|
Basic net income per share
|
$ | 0.20 | $ | 0.12 | $ | 3.32 | ||||||
|
Diluted net income per share:
|
||||||||||||
|
Diluted net income per share from continuing operations
|
$ | 0.20 | $ | 0.16 | $ | 3.28 | ||||||
|
Diluted net loss per share from discontinued operations
|
- | (0.05 | ) | (0.00 | ) | |||||||
|
Diluted net income per share
|
$ | 0.20 | $ | 0.11 | $ | 3.28 | ||||||
|
Weighted-average shares - basic
|
22,703 | 22,543 | 21,814 | |||||||||
|
Weighted-average shares - diluted
|
22,787 | 22,641 | 22,071 | |||||||||
|
Comprehensive income:
|
||||||||||||
|
Net income
|
$ | 4,583 | $ | 2,596 | $ | 72,307 | ||||||
|
Other comprehensive income (net of tax):
|
||||||||||||
|
Unrealized gain/(loss) on available for sale securities
|
96 | (75 | ) | (30 | ) | |||||||
|
Comprehensive income
|
$ | 4,679 | $ | 2,521 | $ | 72,277 | ||||||
The accompanying notes are an integral part of the consolidated financial statements.
| 40 |
AWARE, INC.
CONSOLIDATED STATEMENTS OF CASH FLOWS
(in thousands)
|
Years ended December 31,
|
||||||||||||
|
2014
|
2013
|
2012
|
||||||||||
|
Cash flows from operating activities:
|
||||||||||||
|
Net income
|
$ | 4,583 | $ | 2,596 | $ | 72,307 | ||||||
|
Adjustments to reconcile net income to net cash
provided by (used in) operating activities:
|
||||||||||||
|
Depreciation and amortization
|
541 | 458 | 453 | |||||||||
|
Stock-based compensation
|
915 | 662 | 321 | |||||||||
|
Gain on sale of patent assets
|
(2,127 | ) | - | (86,394 | ) | |||||||
|
Amortization of premium (discount) on investments
|
(3 | ) | 15 | (18 | ) | |||||||
|
(Gain)/loss on sale of investments
|
59 | (23 | ) | (85 | ) | |||||||
|
Deferred tax benefit (expense) on other comprehensive
income
|
(66 | ) | 81 | - | ||||||||
|
Loss on disposal of property and equipment
|
- | 28 | - | |||||||||
|
Provision for doubtful accounts
|
- | - | 4 | |||||||||
|
Increase (decrease) from changes in assets and liabilities:
|
||||||||||||
|
Accounts receivable
|
963 | (1,125 | ) | 85 | ||||||||
|
Receivable from patent arrangement
|
- | 1,121 | (1,121 | ) | ||||||||
|
Inventories
|
1,599 | (1,601 | ) | 547 | ||||||||
|
Prepaid expenses and other current assets
|
294 | (167 | ) | (315 | ) | |||||||
|
Deferred tax assets
|
173 | 563 | (1,760 | ) | ||||||||
|
Accounts payable
|
(1,258 | ) | 1,188 | (71 | ) | |||||||
|
Accrued expenses, compensation and professional
|
23 | (310 | ) | 9 | ||||||||
|
Deferred revenue
|
560 | (657 | ) | 744 | ||||||||
|
Net cash provided by (used in) operating activities
|
6,256 | 2,829 | (15,294 | ) | ||||||||
|
Cash flows from investing activities:
|
||||||||||||
|
Purchases of property and equipment
|
(135 | ) | (160 | ) | (116 | ) | ||||||
|
Proceeds from sale of property and equipment
|
- | 24 | - | |||||||||
|
Purchases of investments
|
- | (2,008 | ) | (2,065 | ) | |||||||
|
Sales of investments
|
1,432 | 1,117 | 855 | |||||||||
|
Proceeds from sale of patent assets, net
|
2,127 | - | 86,394 | |||||||||
|
Purchase of other assets
|
- | (338 | ) | - | ||||||||
|
Net cash provided by (used in) investing activities
|
3,424 | (1,365 | ) | 85,068 | ||||||||
|
Cash flows from financing activities:
|
||||||||||||
|
Proceeds from issuance of common stock
|
508 | 65 | 6,526 | |||||||||
|
Payment of dividends
|
(39,905 | ) | - | (66,024 | ) | |||||||
|
Excess tax benefits from stock-based compensation
|
1,247 | 128 | 14,395 | |||||||||
|
Payments made for taxes of employees who surrendered
shares related to unrestricted stock
|
(205 | ) | (71 | ) | (174 | ) | ||||||
|
Repurchase of common stock
|
- | - | - | |||||||||
|
Net cash provided by (used in) financing activities
|
(38,355 | ) | 122 | (45,277 | ) | |||||||
|
Increase/(decrease) in cash and cash equivalents
|
(28,675 | ) | 1,586 | 24,497 | ||||||||
|
Cash and cash equivalents, beginning of year
|
72,660 | 71,074 | 46,577 | |||||||||
|
Cash and cash equivalents, end of year
|
$ | 43,985 | $ | 72,660 | $ | 71,074 | ||||||
|
Supplemental disclosure:
|
||||||||||||
|
Cash paid for income taxes
|
$ | 1,018 | $ | 542 | $ | 7,954 | ||||||
The accompanying notes are an integral part of the consolidated financial statements.
| 41 |
AWARE, INC.
CONSOLIDATED STATEMENTS OF STOCKHOLDERS’ EQUITY
(in thousands)
|
Additional
|
Accumulated
Other
|
Total
|
||||||||||||||||||||||
|
Common Stock
|
Paid-In
|
Comprehensive
|
(Accumulated
|
Stockholders’
|
||||||||||||||||||||
|
Shares
|
Amount
|
Capital
|
Loss
|
Deficit)
|
Equity
|
|||||||||||||||||||
|
Balance at December 31, 2011
|
20,623 | $ | 206 | $ | 79,512 | ($ | 20 | ) | ($ | 25,123 | ) | $ | 54,575 | |||||||||||
|
Exercise of common stock options
|
1,764 | 18 | 6,481 | 6,499 | ||||||||||||||||||||
|
Issuance of unrestricted stock
|
151 | 1 | (1 | ) | - | |||||||||||||||||||
|
Shares surrendered by employees to
pay taxes related to unrestricted stock
|
(33 | ) | - | (174 | ) | (174 | ) | |||||||||||||||||
|
Issuance of common stock under
employee stock purchase plan
|
5 | - | 27 | 27 | ||||||||||||||||||||
|
Stock-based compensation expense
|
321 | 321 | ||||||||||||||||||||||
|
Tax benefits from stock-based awards
|
14,395 | 14,395 | ||||||||||||||||||||||
|
Dividend payment
|
(66,024 | ) | (66,024 | ) | ||||||||||||||||||||
|
Accumulated other comprehensive loss:
|
||||||||||||||||||||||||
|
Unrealized loss on securities
|
(30 | ) | (30 | ) | ||||||||||||||||||||
|
Net income
|
72,307 | 72,307 | ||||||||||||||||||||||
|
Balance at December 31, 2012
|
22,510 | 225 | 100,561 | (50 | ) | (18,840 | ) | 81,896 | ||||||||||||||||
|
Exercise of common stock options
|
6 | - | 26 | 26 | ||||||||||||||||||||
|
Issuance of unrestricted stock
|
65 | 1 | (1 | ) | - | |||||||||||||||||||
|
Shares surrendered by employees to
pay taxes related to unrestricted stock
|
(14 | ) | - | (71 | ) | (71 | ) | |||||||||||||||||
|
Issuance of common stock under
employee stock purchase plan
|
7 | - | 40 | 40 | ||||||||||||||||||||
|
Stock-based compensation expense
|
662 | 662 | ||||||||||||||||||||||
|
Tax benefits from stock-based awards
|
128 | 128 | ||||||||||||||||||||||
|
Deferred tax asset write-off
|
(52 | ) | (52 | ) | ||||||||||||||||||||
|
Accumulated other comprehensive loss:
|
||||||||||||||||||||||||
|
Unrealized loss on securities
|
(156 | ) | (156 | ) | ||||||||||||||||||||
|
Deferred tax benefit on unrealized loss
|
81 | 81 | ||||||||||||||||||||||
|
Net income
|
2,596 | 2,596 | ||||||||||||||||||||||
|
Balance at December 31, 2013
|
22,574 | 226 | 101,293 | (125 | ) | (16,244 | ) | 85,150 | ||||||||||||||||
|
Exercise of common stock options
|
118 | 1 | 468 | 469 | ||||||||||||||||||||
|
Issuance of unrestricted stock
|
141 | 1 | (1 | ) | - | |||||||||||||||||||
|
Shares surrendered by employees to
pay taxes related to unrestricted stock
|
(32 | ) | - | (205 | ) | (205 | ) | |||||||||||||||||
|
Issuance of common stock under
employee stock purchase plan
|
8 | - | 39 | 39 | ||||||||||||||||||||
|
Stock-based compensation expense
|
915 | 915 | ||||||||||||||||||||||
|
Tax benefits from stock-based awards
|
1,247 | 1,247 | ||||||||||||||||||||||
|
Dividend payment
|
(39,905 | ) | (39,905 | ) | ||||||||||||||||||||
|
Accumulated other comprehensive loss:
|
||||||||||||||||||||||||
|
Unrealized gain on securities
|
162 | 162 | ||||||||||||||||||||||
|
Deferred tax expense on unrealized gain
|
(66 | ) | (66 | ) | ||||||||||||||||||||
|
Net income
|
4,583 | 4,583 | ||||||||||||||||||||||
|
Balance at December 31, 2014
|
22,809 | $ | 228 | $ | 103,756 | ($ | 29 | ) | ($ | 51,566 | ) | $ | 52,389 | |||||||||||
The accompanying notes are an integral part of the consolidated financial statements.
| 42 |
AWARE, INC.
NOTES TO CONSOLIDATED FINANCIAL STATEMENTS
|
1.
|
NATURE OF BUSINESS
|
We are a leading provider of software and services to the biometrics industry. Our software products are used in government and commercial biometrics systems, which are capable of determining or verifying an individual’s identity. We also offer engineering services related to software customization, integration, and installation, as well as complete systems development. We sell our biometrics software products and services globally through systems integrators, OEMs, and directly to end user customers
2. SUMMARY OF SIGNIFICANT ACCOUNTING POLICIES
Basis of Presentation
- The consolidated financial statements include the accounts of Aware, Inc. and its subsidiary (“the Company”). All significant intercompany transactions have been eliminated.
Use of Estimates
–
The preparation of our financial statements in conformity with accounting principles generally accepted in the United States of America requires us to make estimates and assumptions that affect the reported amounts of assets and liabilities and disclosure of contingent assets and liabilities at the date of the financial statements and the reported amount of revenues and expenses during the reporting period. The most significant estimates included in the financial statements pertain to revenue recognition, reserves for doubtful accounts, useful lives of fixed assets, valuation allowance for deferred income tax assets, and accrued liabilities. Actual results could differ from those estimates.
Fair Value Measurements
- The Financial Accounting Standards Board (“FASB”) Codification defines fair value, and establishes a fair value hierarchy that prioritizes the inputs to valuation techniques used to measure fair value. The hierarchy gives the highest priority to the unadjusted quoted prices in active markets for identical assets or liabilities (level 1 measurements) and the lowest priority to unobservable inputs (level 3 measurements). The three levels of the fair value hierarchy under the FASB Codification are: i) Level 1 – valuations that are based on quoted prices (unadjusted) in active markets for identical assets or liabilities that the reporting entity has the ability to access at the measurement date; ii) Level 2 – valuations that are based on quoted prices in markets that are not active or for which all significant inputs are observable, either directly or indirectly; and iii) Level 3 – valuations that require inputs that are both significant to the fair value measurement and unobservable.
Cash and cash equivalents, which primarily include money market mutual funds, were $44.0 million and $72.7 million as of December 31, 2014 and December 31, 2013, respectively. We classified our cash equivalents of $34.3 million and $68.6 million as of December 31, 2014 and 2013, respectively, within Level 1 of the fair value hierarchy because they are valued using quoted market prices.
Our investments, which consist of high yield corporate debt securities, are also classified within Level 1 of the fair value hierarchy because they are valued using quoted market prices. Debt securities with maturities greater than one year are classified as long term assets. We categorize our investments as available-for-sale securities, and carry them at fair value in our financial statements. We had $1.4 million and $2.8 million of available-for-sale investments as of December 31, 2014 and December 31, 2013, respectively.
As of December 31, 2014, our assets that are measured at fair value on a recurring basis and whose carrying values approximate their respective fair values include the following (in thousands):
|
Fair Value Measurement at December 31, 2014 Using:
|
||||||||||||
|
Quoted Prices in
Active Markets for
Identical Assets
|
Significant Other
Observable Inputs |
Significant Unobservable
Inputs |
||||||||||
|
(Level 1)
|
(Level 2)
|
(Level 3)
|
||||||||||
|
Corporate debt securities
|
$ | 1,428 | $ | - | $ | - | ||||||
|
Money market funds (included in cash and cash equivalents)
|
34,339 | |||||||||||
|
Total
|
$ | 35,767 | $ | - | $ | - | ||||||
| 43 |
AWARE, INC.
NOTES TO CONSOLIDATED FINANCIAL STATEMENTS
As of December 31, 2013, our assets that are measured at fair value on a recurring basis and whose carrying values approximate their respective fair values include the following (in thousands):
|
Fair Value Measurement at December 31, 2013 Using:
|
||||||||||||
|
Quoted Prices in
Active Markets for
Identical Assets
|
Significant Other
Observable Inputs |
Significant Unobservable
Inputs |
||||||||||
|
(Level 1)
|
(Level 2)
|
(Level 3)
|
||||||||||
|
Corporate debt securities
|
$ | 2,754 | $ | - | $ | - | ||||||
|
Money market funds (included in cash and cash equivalents)
|
68,556 | |||||||||||
|
Total
|
$ | 71,310 | $ | - | $ | - | ||||||
Cash and Cash Equivalents
– Cash and cash equivalents, which consist primarily of money market funds and demand deposits, are stated at fair value. All highly liquid investments purchased with an original maturity of three months or less are considered cash equivalents. Our cash balances exceed the Federal Deposit Insurance Corporation limits. The Company does not believe it is exposed to significant credit risk related to cash and cash equivalents.
Investments
- At December 31, 2014 and 2013, we categorized all investment securities as available-for-sale, since we may liquidate these investments currently. In calculating realized gains and losses, cost is determined using specific identification. Unrealized gains and losses on available-for-sale securities are excluded from earnings and reported in a separate component of stockholders’ equity called Accumulated Comprehensive Income.
Realized losses on investments were $59,000 in the year ended December 31, 2014. Realized gains on investments were $23,000 and $85,000 in the years ended December 31, 2013 and 2012, respectively.
Unrealized gains on investments were $162,000 in the year ended December 31, 2014. Unrealized losses on investments were $156,000, and $30,000 in the years ended December 31, 2013, and 2012.
The amortized cost of our corporate debt securities was $1.5 million at December 31, 2014. Corporate debt securities comprising investments mature in 2017 and 2018.
Allowance for Doubtful Accounts
– Accounts are charged to the allowance for doubtful accounts as they are deemed uncollectible based on a periodic review of the accounts.
Inventories
– Inventories are stated at the lower of cost or net realizable value. Cost is determined by the first-in, first-out (“FIFO”) method. We evaluate all inventories for net realizable value on a quarterly basis, and record provisions for excess and obsolete inventory when required. There was no reserve for excess and obsolete inventory as of December 31, 2014.
Property and Equipment
– Property and equipment is stated at cost. Depreciation and amortization of property and equipment is provided using the straight-line method over the estimated useful lives of the assets. Upon retirement or sale, the costs of the assets disposed of and the related accumulated depreciation are removed from the accounts and any resulting gain or loss on disposal is included in the determination of income or loss. Expenditures for repairs and maintenance are charged to expense as incurred.
The estimated useful lives of assets used by us are:
|
Building
|
30 years
|
|
Building improvements
|
5 to 20 years
|
|
Furniture and fixtures
|
5 years
|
|
Computer, office & manufacturing equipment
|
3 years
|
|
Purchased software
|
3 years
|
| 44 |
AWARE, INC.
NOTES TO CONSOLIDATED FINANCIAL STATEMENTS
Impairment of Long-Lived Assets
– We review long-lived assets for impairment whenever events or changes in business circumstances indicate that the carrying amount of the assets may not be fully recoverable or that the useful lives of these assets are no longer appropriate. Each impairment test is based on a comparison of the undiscounted cash flows estimated to be generated by those assets over their estimated economic life to the related carrying value of those assets to determine if the assets are impaired. If an impairment is indicated, the asset is written down to its estimated fair value. The cash flow estimates used to identify the potential impairment reflect our best estimates using appropriate assumptions and projections at that time. We believe that no significant impairment of our long-lived assets has occurred as of December 31, 2014 and 2013.
Revenue Recognition
– We recognize revenue when there is persuasive evidence of an arrangement, the sales price is fixed or determinable, collection of the related receivable is reasonably assured, and delivery has occurred or services have been rendered.
Persuasive evidence of an arrangement:
We use contracts signed by both the customer and us or written purchase orders issued by the customer as evidence of an arrangement.
Product delivery:
We deem delivery to have occurred: (i) upon shipment when products are shipped FOB shipping point, or (ii) upon delivery at a customer’s location when products are shipped FOB destination, or (iii) when software is delivered electronically. If customer acceptance provisions apply, revenue is not recognized until delivery has occurred and we have received such acceptance. If we are required to provide installation services, revenue is not recognized until installation is complete.
Fixed or determinable fee:
We consider fees to be fixed or determinable if the fee is not subject to refund or adjustment and the payment terms are within normal established practices. If the fee is not fixed or determinable, we recognize the revenue as amounts become due and payable.
Collection is deemed probable:
We conduct a credit review for significant transactions at the time of the arrangement to determine the credit-worthiness of the customer. Collection is deemed probable if we expect that the customer will pay amounts under the arrangement as payments become due.
We categorize revenue as software licenses, software maintenance, services, hardware, or royalties. In addition to the general revenue recognition policies described above, specific revenue recognition policies apply to each category of revenue.
Software licenses
Software licenses consist of revenue from the sale of software licenses for biometrics and imaging applications. Our software licenses typically provide customers with the right to use our software in perpetuity. We recognize revenue from software licenses upon delivery when licenses are sold in single element arrangements, because we have no post-delivery obligations, including contractual or implied Post Contract Support (“PCS”).
Software maintenance
Software maintenance consists of revenue from the sale of software maintenance contracts for biometrics and imaging software. Software maintenance contracts entitle customers to receive software support and software updates, if and when they become available, during the term of the maintenance contract. We recognize software maintenance revenue ratably over the related contract period.
Services
Service revenue consists of fees from biometrics customers for software engineering services we provide to them. We recognize services revenue as services are delivered when services are sold in single element arrangements.
Hardware
Hardware revenue consists of sales of biometrics equipment to a single U.S. government customer. We recognize hardware revenue upon delivery and acceptance of the equipment by the customer.
| 45 |
AWARE, INC.
NOTES TO CONSOLIDATED FINANCIAL STATEMENTS
Royalties
Royalties consist primarily of royalty payments we receive under DSL silicon contracts with two customers that incorporate our silicon intellectual property (“IP”) in their DSL chipsets. We sold the assets of our DSL IP business in 2009, but we continue to receive royalty payments from these customers. Royalties are reported in continuing operations in accordance with ASC 205, Reporting Discontinued Operations, because we have continuing ongoing cash flows from this business.
Since we cannot reasonably estimate royalty revenue, such revenue is recognized in the quarter in which a final report is received from a customer. Royalty reports are typically received in the quarter immediately following the quarter in which sales of royalty-bearing products occur.
Multiple element arrangements with software and software related elements
In addition to selling software licenses, software maintenance and software services in single element arrangements, we also sell these three products as part of multiple element arrangements. We apply the provisions of ASC 985-605, Software Revenue Recognition, to these arrangements because all the elements are software or software related. The various combinations of multiple element arrangements and our revenue recognition for each are described as follows:
|
|
●
|
Software licenses and software maintenance
. When software licenses and software maintenance contracts are sold together, we recognize software license revenue upon delivery, provided we have vendor specific objective evidence (“VSOE”) for the fair value of the maintenance contract fee, and we recognize the fair value of maintenance contract revenue ratably over the related contract period. Under ASC 985-605, the residual method is the appropriate manner in which to allocate arrangement consideration to the license when VSOE exists for all undelivered elements (e.g., PCS), but not for the delivered element (e.g., the license).
|
|
|
●
|
Software licenses and services.
When software licenses and software engineering services are sold together, the total fee is generally recognized by applying contract accounting. We have adopted the percentage-of-completion method of contract accounting, and we generally use an input method (i.e., labor hours) to determine our completion percentage. The software license portion of the arrangement is classified as software license revenue and the engineering services portion is classified as services revenue in our consolidated statements of income and comprehensive income.
|
|
|
●
|
Software licenses, software maintenance and services.
When we sell software licenses, software maintenance and software services together, revenue is recognized as follows: i) software maintenance revenue is separated from the other two elements and is recognized ratably over the related software maintenance contract period; provided we have VSOE for the fair value of the maintenance element; and ii) the total fee from the software license and engineering service elements is recognized by applying the contract accounting method described in the previous paragraph.
|
Multiple element arrangement with hardware and software elements
We also have a multiple element arrangement with one customer that involves the delivery of hardware, software maintenance, and software services. We determined that these elements qualified as separate units of accounting under ASC 605, Revenue Recognition, because they have value to the customer on a standalone basis. We recognize revenue from this arrangement as follows: i) hardware revenue is recognized upon delivery and acceptance of the equipment by the customer; ii) maintenance revenue is recognized ratably over the related contract period; and iii) service revenue is recognized as services are delivered.
Income Taxes
– We compute deferred income taxes based on the differences between the financial statement and tax basis of assets and liabilities using enacted rates in effect in the years in which the differences are expected to reverse. We establish a valuation allowance to offset temporary deductible differences, net operating loss carryforwards and tax credits when it is more likely than not that the deferred tax assets will not be realized.
| 46 |
AWARE, INC.
NOTES TO CONSOLIDATED FINANCIAL STATEMENTS
We recognize the tax benefit from an uncertain tax position only if it is more-likely-than-not that the tax position will be sustained upon examination by the taxing authorities, based on the technical merits of the tax position. The evaluation of an uncertain tax position is based on factors that include, but are not limited to, changes in the tax law, the measurement of tax positions taken or expected to be taken in tax returns, the effective settlement of matters subject to audit, and changes in facts or circumstances related to a tax position. Any changes to these estimates, based on the actual results obtained and/or a change in assumptions, could impact our tax provision in future periods. Interest and penalty charges, if any, related to unrecognized tax benefits would be classified as a provision for income tax in the statement of income.
Capitalization of Software Costs
– We capitalize certain internally developed software development costs after technological feasibility of the product has been established. No software costs were capitalized for the years ended December 31, 2014, 2013 and 2012, because such costs incurred subsequent to the establishment of technological feasibility, but prior to commercial availability, were immaterial.
Research and Development Costs
– Costs incurred in the research and development of our products are expensed as incurred.
Concentration of Credit Risk
– At December 31, 2014 and 2013, we had cash and cash equivalents, in excess of federally insured deposit limits of approximately $43.7 million and $72.4 million, respectively.
Concentration of credit risk with respect to net accounts receivable consisted of amounts owed by the following customers that comprised more than 10% of net accounts receivable at December 31:
|
2014
|
2013
|
||||||||
|
Customer A
|
18 | % | 60 | % | |||||
|
Customer B
|
15 | % | - | % | |||||
|
Customer C
|
11 | % | - | % | |||||
Concentration of credit risk with respect to our investment portfolio consisted of $0.5 million, $0.5 million, and $0.4 million with three issuers of corporate debt securities, respectively, at December 31, 2014, and $0.8 million, $0.5 million, $0.5 million, $0.5 million, and $0.4 million with five issuers of corporate debt securities, respectively, at December 31, 2013.
Stock-Based Compensation
– We grant stock and stock options to our employees and directors. We measure stock-based compensation cost at the grant date based on the fair value of the award and recognize stock-based compensation expense on a straight-line basis over the requisite service period of the award.
For stock awards, we determine the fair value of the award by using the fair market value of our stock on the date of grant; provided the number of shares in the grant is fixed on the grant date.
For stock options, we use the Black-Scholes option valuation model to estimate the fair value of the award. This valuation model takes into account the exercise price of the award, as well as a variety of significant assumptions. The assumptions used to estimate the fair value of stock options include the expected term, the expected volatility of our stock over the expected term, the risk-free interest rate over the expected term, and our expected annual dividend yield.
Computation of Earnings per Share
– Basic earnings per share is computed by dividing income available to common shareholders by the weighted average number of common shares outstanding. Diluted earnings per share is computed by dividing income available to common shareholders by the weighted average number of common shares outstanding plus additional common shares that would have been outstanding if dilutive potential common shares had been issued. For the purposes of this calculation, stock options are considered common stock equivalents in periods in which they have a dilutive effect. Stock options that are antidilutive are excluded from the calculation.
Fair Value of Financial Instruments
– The carrying amounts of cash and cash equivalents, accounts receivable, accounts payable and accrued expenses approximate fair value because of their short-term nature. The carrying amount of investments is based on the fair value of the individual securities in our investment portfolio.
| 47 |
AWARE, INC.
NOTES TO CONSOLIDATED FINANCIAL STATEMENTS
Advertising Costs –
Advertising costs are expensed as incurred and were not material for 2014, 2013, and 2012.
Recent Accounting Pronouncements
– In May 2014, the FASB issued ASU 2014-09, Revenue from Contracts with Customers (Topic 606). The ASU is the result of a joint project by the FASB and the International Accounting Standards Board (“IASB”) to clarify the principles for recognizing revenue and to develop a common revenue standard for GAAP and International Financial Reporting Standards (“IFRS”) that would: remove inconsistencies and weaknesses, provide a more robust framework for addressing revenue issues, improve comparability of revenue recognition practices across entities, jurisdictions, industries, and capital markets, improve disclosure requirements and resulting financial statements, and simplify the presentation of financial statements. The core principle of the new guidance is that an entity should recognize revenue to depict the transfer of promised goods or services to customers in an amount that reflects the consideration to which the entity expects to be entitled in exchange for those goods or services. The ASU is effective for annual reporting periods beginning after December 15, 2016. Early adoption is not permitted. We are currently evaluating the effect that the updated standard will have on our consolidated financial statements and related disclosures.
With the exception of the new revenue standard discussed above, there have been no other recently issued accounting pronouncements that are of significance or potential significance to us that we have not adopted as of December 31, 2014.
Reclassifications -
Certain prior period amounts have been reclassified to be consistent with the current period presentation.
Segments
–
We organize ourselves into a single segment reporting to the chief operating decision makers. We have sales outside of the United States, which are described in Note 10. All long-lived assets are maintained in the United States.
|
3.
|
PATENT RELATED INCOME
|
Patent related income in the years ended December 31, 2014, 2013 and 2012 was derived from either gains on the sale of patent assets or income from a patent arrangement, or both. Income from these sources was included in income from continuing operations pursuant to ASC 360-10, Impairment or Disposal of Long-Lived Assets, and Rule 5-03 of Regulation S-X.
The composition of patent related income in 2014, 2013, and 2012 was as follows:
Year ended December 31, 2014.
We had a $2.1 million gain on the sale of patent assets and no income from our patent arrangement in 2014. The gain on the sale of patent assets is described below:
We sold a portion of our patent portfolio pertaining to DSL diagnostic technology to an unrelated third party for $2.6 million. The proceeds from the sale were reduced by $0.5 million of transaction costs, which consisted primarily of fees from the law firm that assisted us in the sale. We recorded a gain of $2.1 million on the sale.
The DSL diagnostic technology in the patents we sold in 2014 was related to our DSL Service Assurance business that we shut down in 2012 and 2013 and reported in discontinued operations in those periods. We do not consider our patent related activities to be a component of the operating business from which the underlying technology was derived, but rather as a component of corporate general and administrative expenses. Accordingly the gain on the sale of these patents was reported in income from continuing operations.
| 48 |
AWARE, INC.
NOTES TO CONSOLIDATED FINANCIAL STATEMENTS
Year ended December 31, 2013.
We had $0.8 million of income from a patent arrangement and no gains on the sale of patent assets in 2013. Income from the patent arrangement is described below:
We entered into an arrangement with an unaffiliated third party in 2010 under which we assigned certain patents in return for royalties on proceeds from patent monetization efforts by the third party. Such third party has engaged in various patent monetization activities, including enforcement, litigation and licensing. The party reported and we recorded $0.8 million of income from this arrangement in the year ended December 31, 2013.
We continue to have a contractual relationship with this third party. However, we are unable to predict how much more income we might receive from this arrangement, if any, because:
|
|
●
|
The claims in one of the patents we assigned were rejected by the United States Patent Office (“USPTO”) in May 2013. The USPTO’s Patent Trial & Appeal Board (“PTAB”) affirmed the USPTO decision in June 2014. The PTAB decision was appealed to the Federal Circuit. In December 2014, the Federal Circuit remanded the appeal back to the PTAB for further consideration.
|
|
|
●
|
Notwithstanding the outcome at the PTAB, we do not know whether any patent monetization efforts by the third party will be successful.
|
Year ended December
31, 2012.
We had total patent related income of $87.5 million in 2012, which consisted of $86.4 million of gains on the sale of patent assets and $1.1 million of income from our patent arrangement. Patent related income in 2012 is described below:
Gains on the sale of patent assets
. Total gains on the sale of patent assets in 2012 were $86.4 million, which consisted of gains from two separate sales. Gains from both sales were recorded in income from continuing operations as none of these patents were related to any discontinued operations, including our discontinued DSL Service Assurance business. The two sales are described below:
|
|
●
|
We sold a portion of our patent portfolio pertaining to wireless technology to an unaffiliated third party for $75.0 million. The proceeds from the sale were reduced by $3.8 million of transaction costs, which consisted primarily of fees from the law firm that assisted us in the sale. We recorded a gain of $71.2 million on the sale.
|
|
|
●
|
We sold a portion of our patent portfolio pertaining to DSL semiconductor intellectual property technology for $16.0 million. The proceeds from the sale were reduced by $0.8 million of transaction costs, which also consisted primarily of fees from the law firm that assisted us in the sale. We recorded a gain of $15.2 million on the sale.
|
Income from patent arrangement.
The third party to whom we assigned
patents reported and we recorded $1.1 million of income from this arrangement in the year ended December 31, 2012.
|
4.
|
DISCONTINUED OPERATIONS
|
Our board of directors approved the shutdown of our DSL service assurance hardware and software product lines in 2012 and 2013, respectively. Both product lines were previously components of our DSL Service Assurance Segment. Results from the DSL Service Assurance Segment have been reported as discontinued operations because we no longer have any significant continuing involvement with, or cash flows from, this segment.
Loss from the discontinued DSL Service Assurance Segment was (in thousands):
|
Years ended December 31,
|
||||||||||||
|
2014
|
2013
|
2012
|
||||||||||
|
Revenue
|
$ | - | $ | 3,216 | $ | 5,431 | ||||||
|
Expenses
|
- | 5,120 | 5,558 | |||||||||
|
Loss before income taxes
|
- | (1,904 | ) | (127 | ) | |||||||
|
Income tax benefit
|
- | (748 | ) | (51 | ) | |||||||
|
Loss from discontinued operations
|
$ | - | ($ | 1,156 | ) | ($ | 76 | ) | ||||
| 49 |
AWARE, INC.
NOTES TO CONSOLIDATED FINANCIAL STATEMENTS
The consolidated statements of income and comprehensive income for the year ended December 31, 2012 was reclassified to reflect the effect of discontinued operations as set forth above.
We incurred one-time costs related to the shutdown of the DSL service assurance hardware and software product lines. Shutdown costs for each product line were:
DSL service assurance hardware product line
. In 2012, we incurred one-time shutdown costs related to the hardware product line of approximately $0.3 million, the majority of which were severance and employee-related costs. All such costs were incurred, paid, and included in loss from discontinued operations for the year ended December 31, 2012.
DSL service assurance software product line.
In 2013, we incurred one-time shutdown costs related to the software product line of approximately $2.9 million. Such costs comprise: i) $3.7 million of payments to customers to terminate contracts, which were offset by $1.2 million of deferred revenue obligations that were relieved as a result of such contract terminations; ii) $0.3 million of severance and employee-related costs; and iii) $48,000 of asset write-offs. All such costs were incurred and included in loss from discontinued operations for the year ended December 31, 2013. All DSL service assurance software product line exit costs were paid in 2013, with the exception of $0.1 million of severance costs, which were paid in early January 2014.
There were no assets or liabilities remaining on the balance sheet as of December 31, 2014 related to the DSL Service Assurance Segment.
|
5.
|
INVENTORIES
|
Inventories consisted of the following at December 31 (in thousands):
|
2014
|
2013
|
|||||||
|
Raw materials
|
$ | 2 | $ | 1,584 | ||||
|
Finished goods
|
- | 17 | ||||||
|
Total
|
$ | 2 | $ | 1,601 | ||||
|
6.
|
PROPERTY AND EQUIPMENT
|
Property and equipment consisted of the following at December 31 (in thousands):
|
2014
|
2013
|
|||||||
|
Land
|
$ | 1,056 | $ | 1,056 | ||||
|
Building and improvements
|
9,060 | 9,060 | ||||||
|
Computer equipment
|
614 | 557 | ||||||
|
Purchased software
|
78 | 88 | ||||||
|
Furniture and fixtures
|
778 | 778 | ||||||
|
Office equipment
|
191 | 191 | ||||||
|
Total
|
11,777 | 11,730 | ||||||
|
Less accumulated depreciation and amortization
|
(6,488 | ) | (6,148 | ) | ||||
|
Property and equipment, net
|
$ | 5,289 | $ | 5,582 | ||||
Depreciation expense was $0.4 million, $0.5 million, and $0.4 million for the years ended December 31, 2014, 2013, and 2012, respectively. In 2014, 2013 and 2012, we identified $0.1 million, $0.3 million, and $1.0 million of assets no longer in use and retired the assets and related accumulated depreciation.
| 50 |
AWARE, INC.
NOTES TO CONSOLIDATED FINANCIAL STATEMENTS
7.
INCOME TAXES
We made provisions for income taxes related to continuing operations in the years ended December 31, 2014, 2013 and 2012 of $2.7 million, $1.9 million and $20.5 million, respectively. The components of the provision for income taxes are as follows (in thousands):
|
Year ended December 31,
|
||||||||||||
|
2014
|
2013
|
2012
|
||||||||||
|
Current:
|
||||||||||||
|
Federal
|
$ | 1,976 | $ | 1,000 | $ | 20,654 | ||||||
|
State
|
589 | 273 | 1,594 | |||||||||
| 2,565 | 1,273 | 22,248 | ||||||||||
|
Deferred:
|
||||||||||||
|
Federal
|
93 | 471 | (1,354 | ) | ||||||||
|
State
|
14 | 173 | (407 | ) | ||||||||
| 107 | 644 | (1,761 | ) | |||||||||
|
Total provision for income taxes
|
$ | 2,672 | $ | 1,917 | $ | 20,487 | ||||||
A reconciliation of the U.S. federal statutory rate to the effective tax rate is as follows:
|
Year ended December 31,
|
||||||||||||
|
2014
|
2013
|
2012
|
||||||||||
|
Federal statutory rate
|
34 | % | 34 | % | 35 | % | ||||||
|
State rate, net of federal benefit
|
5 | 5 | 5 | |||||||||
|
Tax credits
|
(1 | ) | (2 | ) | - | |||||||
|
Permanent adjustments
|
(1 | ) | (1 | ) | - | |||||||
|
Change in valuation allowance
|
- | - | (18 | ) | ||||||||
|
Prior year adjustment
|
- | (2 | ) | - | ||||||||
|
Effective tax rate
|
37 | % | 34 | % | 22 | % | ||||||
Total income tax expense for the year ended December 31, 2014 was $2.7 million, all of which was included in continuing operations. Income tax expense for 2014 was based on the U.S. statutory rate of 34%, increased by state income taxes, and reduced by Federal research tax credits and permanent adjustments.
Total income tax expense for the year ended December 31, 2013 was $1.2 million, including $1.9 million of tax expense that was recorded in continuing operations less a tax benefit of $0.7 million that was recorded in discontinued operations. Income tax expense for 2013 was based on the U.S. statutory rate of 34%, increased by state income taxes, and reduced by Federal research tax credits and permanent adjustments. Tax expense in 2013 also reflects two items related to 2012, including: i) a tax benefit of $0.1 million related to the 2012 research tax credit. This credit was extended retroactively back to January 1, 2012, by the American Taxpayer Relief Act of 2012, which was enacted on January 2, 2013; and ii) a tax benefit of $0.1 million related to a reduction in the estimate of the 2012 tax expense recorded in our 2012 financial statements.
Total income tax expense for the year ended December 31, 2012 was $20.4 million, including $20.5 million of tax expense that was recorded in continuing operations less a tax benefit of $51,000 that was recorded in discontinued operations. Our actual tax liability for 2012 was $7.8 million as taxes that were currently payable were reduced by a $14.4 million equity adjustment. This equity adjustment is described more fully below.
In 2012, we used a significant portion of our available deferred tax assets to reduce income taxes on pre-tax income. A substantial portion of the deferred tax assets we utilized comprised cumulative deductions for stock options in excess of book expense. Under income tax accounting rules, the portion of tax benefits attributable to such deductions must be recorded as an adjustment to equity versus a reduction of income tax expense. In the year ended December 31, 2012, the tax benefits from such stock-based awards were $14.4 million, which we recorded as an equity adjustment to additional paid-in capital.
| 51 |
AWARE, INC.
NOTES TO CONSOLIDATED FINANCIAL STATEMENTS
Income tax expense in 2012 was also reduced by a $1.8 million reversal of the valuation allowance on our remaining deferred tax assets at December 31, 2012. We reversed the valuation allowance because based on all the available evidence, we believed that it is more likely than not that our deferred tax assets will be realizable. In reaching this determination, we evaluated: i) our most recent years operating results; ii) our future financial plans; and iii) the nature of the components comprising deferred tax assets at December 31, 2012.
As of December 31, 2014 and 2013, we had deferred tax assets for which we had recorded no valuation allowance. The principal components of deferred tax assets were as follows at December 31 (in thousands):
|
2014
|
2013
|
|||||||
|
Depreciation
|
$ | 374 | $ | 418 | ||||
|
Stock compensation
|
303 | 199 | ||||||
|
Capitalized research and development costs
|
96 | 364 | ||||||
|
Other
|
199 | 164 | ||||||
|
Total
|
972 | 1,145 | ||||||
|
Less valuation allowance
|
(- | ) | (- | ) | ||||
|
Deferred tax assets, net
|
$ | 972 | $ | 1,145 | ||||
We will continue to assess the level of valuation allowance required in future periods. Should evidence regarding the realizability of tax assets change at a future point in time, the valuation allowance will be adjusted accordingly.
As a result of significant taxable income in 2012 and the utilization of research and development credits thereon, we conducted a review to determine whether any of our prior year research and development tax credits represented an uncertain tax position. Based on that review, we determined that $1.9 million of federal credits and $1.0 million of state credits could not be supported and therefore, those credits were written off. In addition to the write-off, we also determined that $1.9 million of federal credits and $1.0 million of state credits represented an uncertain tax position for which we established a valuation allowance. A rollforward of the uncertain tax position related to our research and development tax credits is as follows (in thousands):
|
Uncertain tax positions at December 31, 2011
|
$ | - | ||
|
Increase due to positions taken in prior periods
|
2,945 | |||
|
Uncertain tax positions at December 31, 2012
|
$ | 2,945 | ||
|
Increase due to positions taken in prior periods
|
- | |||
|
Uncertain tax positions at December 31, 2013
|
$ | 2,945 | ||
|
Increase due to positions taken in prior periods
|
- | |||
|
Uncertain tax positions at December 31, 2014
|
$ | 2,945 |
Uncertain tax positions of $2.6 million will impact our tax rate if realized. The difference between this amount and the total uncertain tax positions in the table above is the federal tax effect on state tax credits.
In addition to deferred tax assets carried on our balance sheet, we also had net federal and state research and development credit carryforwards available at December 31, 2014 of $4.0 million and $0.3 million. These credits were not recorded as tax assets as they relate to excess stock compensation deductions that may not be recorded as tax assets under generally accepted accounting principles until the amounts have been utilized to reduce our tax liability. To the extent that these assets are used to reduce future taxes, the benefit will be recorded as a reduction to additional paid-in capital. In 2014 and 2013, we recorded tax benefits of $1.2 million and $0.1 million to equity related to the use of these tax credits to reduce our tax liability.
Our policy is to recognize interest and penalties related to uncertain tax positions in income tax expense. As of December 31, 2014, we had no accrued interest or penalties related to uncertain tax positions.
The tax years from 1999 through 2014 are subject to examination by the IRS and state tax authorities. In the third quarter of 2014, the Internal Revenue Service commenced an examination of our tax return for the year ended December 31, 2012.
| 52 |
AWARE, INC.
NOTES TO CONSOLIDATED FINANCIAL STATEMENTS
8. EQUITY AND STOCK COMPENSATION PLANS
Fixed Stock Option Plans
– We have two fixed option plans. Under our 1996 Stock Option Plan (“1996 Plan”), we were authorized to grant incentive stock options and nonqualified stock options to our employees and directors for up to 6,100,000 shares of common stock. There were no shares available for grant under the 1996 Plan as of December 31, 2014. Under our 2001 Nonqualified Stock Plan (“2001 Plan”), we are authorized to grant nonqualified stock options, stock appreciation rights and stock awards to our employees and directors for up to 8,000,000 shares of common stock. As of December 31, 2014, there were 5,062,381 shares available for grant under the 2001 Plan.
Under both plans, options are granted at exercise prices as determined by the Board of Directors and have terms ranging from four to a maximum of ten years. Our options generally vest over three to five years.
The following table presents stock-based employee compensation expenses included in our consolidated statements of income and comprehensive income (in thousands):
|
Years ended December 31,
|
||||||||||||
|
2014
|
2013
|
2012
|
||||||||||
|
Cost of services
|
$ | 44 | $ | 34 | $ | 16 | ||||||
|
Research and development
|
106 | 81 | 51 | |||||||||
|
Selling and marketing
|
17 | 14 | 126 | |||||||||
|
General and administrative
|
748 | 533 | 83 | |||||||||
|
Loss from discontinued operations
|
- | - | 45 | |||||||||
|
Stock-based compensation expense
|
$ | 915 | $ | 662 | $ | 321 | ||||||
Stock-based compensation expenses in the preceding table include expenses associated with grants of: i) stock options; and iii) unrestricted shares of our common stock. The method used to determine stock-based compensation expense for each type of equity grant is described in the following paragraphs.
Stock Option Grants.
For the years ended December 31, 2014, 2013, and 2012, we granted stock options for 0, 0, and 50,000 shares, respectively. We estimate the fair value of stock options using the Black-Scholes valuation model.
The Black-Scholes valuation model takes into account the exercise price of the award, as well as a variety of significant assumptions. The assumptions used to estimate the fair value of stock options include the expected term, the expected volatility of our stock over the expected term, the risk-free interest rate over the expected term, and our expected annual dividend yield. We believe that the valuation technique and the approach utilized to develop the underlying assumptions are
appropriate in calculating the fair values of stock options granted in the year ended December 31, 2012. Estimates of fair value are not intended to predict actual future events or the value ultimately realized by persons who receive equity awards.
We did not grant any stock options in 2014 and 2013. Specific assumptions used to determine the fair value of options granted during the year ended December 31, 2012, using the Black-Scholes valuation model were:
|
Year Ended
December 31, 2012
|
||||
|
Expected term (1)
|
5 years
|
|||
|
Expected volatility factor (2)
|
58-63 | % | ||
|
Risk-free interest rate (3)
|
0.92 | % | ||
|
Expected annual dividend yield
|
n/a | |||
(1) The expected term for each grant was determined based on the contractual term of the option.
(2) The expected volatility for each grant is estimated based on an average of historical volatility over a period of time which we believe to be representative of our future volatility.
| 53 |
AWARE, INC.
NOTES TO CONSOLIDATED FINANCIAL STATEMENTS
(3) The risk-free interest rate for each grant is based on the U.S. Treasury yield curve in effect at the time of grant for a period equal to the expected term of the stock option.
We do not estimate our forfeiture rates as the actual forfeiture rate is known at the end of each reporting period due to the timing of our stock option vesting.
Unrestricted Stock Grants
. Our 2001 Plan permits us to grant shares of unrestricted stock to our directors, officers and employees. Stock-based compensation expense for stock grants is determined based on the fair market value of our stock on the date of grant; provided the number of shares in the grant is fixed on the grant date.
We granted 152,000, 130,000, and 0 shares of unrestricted stock during the years ended December 31, 2014, 2013, and 2012, respectively. The accounting treatment of those awards is described below:
Year ended December 31, 2014.
In March 2014, we granted 152,000 shares of unrestricted stock to directors, officers and employees. The shares were issued in two equal installments shortly after June 30, 2014 and December 31, 2014. We expensed $876,000 of stock-based compensation expense related to this grant in the year ended December 31, 2014. There was no unamortized stock-based compensation charge associated with this stock grant as of December 31, 2014.
We issued shares of common stock related to the March 2014 grant as follows: i) 58,769 net shares of common stock were issued in early July 2014 after employees surrendered 17,231 shares for which we paid $113,000 of withholding taxes on their behalf; and ii) 56,804 shares of common stock were issued in early January 2015 after employees surrendered 19,196 shares for which we paid $87,000 of withholding taxes on their behalf.
Year ended December 31, 2013.
In April 2013, we granted 130,000 shares of unrestricted stock to directors, officers and employees. The shares were issued in two equal installments shortly after June 30, 2013 and December 31, 2013. We expensed $623,000 of stock-based compensation expense related to this grant in the year ended December 31, 2013. There was no unamortized stock-based compensation charge associated with this stock grant as of December 31, 2013.
We issued shares of common stock related to the April 2013 grant as follows: i) 51,374 net shares of common stock were issued in early July 2013 after employees surrendered 13,626 shares for which we paid $71,000 of withholding taxes on their behalf; and ii) 49,936 net shares of common stock were issued in early January 2014 after employees surrendered 15,064 shares for which we paid $92,000 of withholding taxes on their behalf.
Year ended December 31, 2012.
No shares of unrestricted stock were granted in 2012, however we granted shares of unrestricted common stock in 2010 that affected results for the year ended December 31, 2012. Activity in 2012 related to the 2010 stock grant was: i) 2012 stock-based compensation expense included $189,000 related to the 2010 grant; and ii) we issued 118,113 net shares of common stock after employees surrendered 33,441 shares for which we paid $174,000 of withholding taxes on their behalf.
| 54 |
AWARE, INC.
NOTES TO CONSOLIDATED FINANCIAL STATEMENTS
A summary of stock option transactions for our two fixed stock option plans for the years ended December 31, 2014, 2013, and 2012 are presented below:
|
2014
|
2013
|
2012
|
||||||||||||||||||||||
|
Shares
|
Weighted
Average
Exercise
Price
|
Shares
|
Weighted
Average
Exercise
Price
|
Shares
|
Weighted
Average
Exercise
Price
|
|||||||||||||||||||
|
Outstanding at beginning of year
|
1,004,989 | $ | 5.68 | 1,063,025 | $ | 5.63 | 2,835,952 | $ | 4.42 | |||||||||||||||
|
Granted
|
- | - | - | - | 50,000 | 4.60 | ||||||||||||||||||
|
Exercised
|
(117,783 | ) | 3.98 | (6,163 | ) | 4.27 | (1,779,616 | ) | 3.71 | |||||||||||||||
|
Forfeited or cancelled
|
(781,004 | ) | 6.07 | (51,873 | ) | 4.83 | (43,311 | ) | 4.33 | |||||||||||||||
|
Outstanding at end of year
|
106,202 | $ | 4.71 | 1,004,989 | $ | 5.68 | 1,063,025 | $ | 5.63 | |||||||||||||||
|
Exercisable at year end
|
104,117 | $ | 4.69 | 986,237 | $ | 5.70 | 1,027,525 | $ | 5.66 | |||||||||||||||
The number of option shares vested and expected to vest at December 31, 2014 was 106,202 and those options had a weighted average exercise price of $4.71.
No stock options were granted in the years ended December 31, 2014 and 2013. All options granted during the year ended December 31, 2012 had exercise prices equal to the fair market value of our common stock on the date of grant, and the weighted average grant date fair values of options granted were $2.38.
At December 31, 2014, the weighted average remaining contractual term for total options outstanding and total options exercisable was approximately 2.5 years for each.
At December 31, 2014, the aggregate intrinsic value of options outstanding and options exercisable was zero for each. The intrinsic value of a stock option is the amount by which the market value of the underlying stock exceeds the exercise price of the option. The aggregate intrinsic value of options exercised during the year ended December 31, 2014 was approximately $301,000.
The following table summarizes the stock options outstanding at December 31, 2014:
|
Options Outstanding
|
Options Exercisable
|
|||||||||||||||||||
|
Exercise Price
Range
|
Number
|
Weighted
Average
Exercise
Price
|
Weighted Average
Remaining
Contractual
Term (in years)
|
Number
|
Weighted
Average
Exercise
Price
|
|||||||||||||||
|
$2 to $3
|
18,000 | $ | 2.52 | 4.39 | 18,000 | $ | 2.52 | |||||||||||||
|
$3 to $4
|
14,168 | 3.57 | 2.82 | 14,168 | 3.57 | |||||||||||||||
|
$4 to $5
|
33,200 | 4.64 | 2.93 | 33,200 | 4.64 | |||||||||||||||
|
$6 to $7
|
40,834 | 6.14 | 1.27 | 38,749 | 6.14 | |||||||||||||||
| 106,202 | $ | 4.71 | 2.52 | 104,117 | $ | 4.69 | ||||||||||||||
At December 31, 2014, unrecognized compensation expense related to non-vested stock options was approximately $7,000, which is expected to be recognized over a weighted average period of 0.25 years.
We issue common stock from previously authorized but unissued shares to satisfy option exercises and purchases under our Employee Stock Purchase Plan.
| 55 |
AWARE, INC.
NOTES TO CONSOLIDATED FINANCIAL STATEMENTS
Employee Stock Purchase Plan
- In June 1996, we adopted an Employee Stock Purchase Plan (the “ESPP Plan”) under which eligible employees could purchase common stock at a price equal to 85% of the lower of the fair market value of the common stock at the beginning or end of each six-month offering period. On November 29, 2005 we amended the ESPP Plan to provide that eligible employees may purchase common stock at a price equal to 95% of the fair market value of the common stock as of the end of each six-month offering period. There is no stock-based compensation expense related to our Employee Stock Purchase Plan because it is not considered a compensatory plan. The plan does not have a look-back feature, and has a minimal discount of 5% of the fair market value of the common stock as of the end of each six-month offering period. Participation in the ESPP Plan is limited to 6% of an employee’s compensation, may be terminated at any time by the employee and automatically ends on termination of employment. A total of 350,000 shares of common stock have been reserved for issuance. As of December 31, 2014 there were 100,937 shares available for future issuance under the ESPP Plan. We issued 8,022, 7,196, and 4,661 common shares under the ESPP Plan in 2014, 2013, and 2012, respectively.
Dividends –
We paid dividends in the years ended December 31, 2014 and 2012 as follows:
Year ended December 31, 2014
. On June 26, 2014, our board of directors declared a special cash dividend of $1.75 per share. The dividend was paid on July 24, 2014 to shareholders of record as of July 10, 2014. The total dividend payment was $39.9 million.
Year ended December 31, 2012
. In April 2012, our board of directors declared a special cash dividend of $1.15 per share. The dividend was paid on May 25, 2012 to shareholders of record as of May 11, 2012. The total amount of the dividend paid was $25.5 million. In November 2012, our board of directors declared a second special cash dividend of $1.80 per share. The dividend was paid on December 17, 2012 to shareholders of record as of December 3, 2012. The total amount of the dividend paid was $40.5 million.
|
9.
|
COMMITMENTS AND CONTINGENT LIABILITIES
|
Lease Commitments
– We own our principal office and research facility in Bedford, Massachusetts, which we have occupied since November 1997. We also conducted a portion of our activities in a leased facility in California in 2012 that we terminated in that year. Rental expense for the California facility was $0, $0, and $25,000 in 2014, 2013 and 2012, respectively.
Litigation
- There are no material pending legal proceedings to which we are a party or to which any of our properties are subject which, either individually or in the aggregate, are expected to have a material adverse effect on our business, financial position or results of operations.
Guarantees and Indemnification Obligations
–
We enter into agreements in the ordinary course of business that require us: i) to perform under the terms of the contracts, ii) to protect the confidentiality of our customers’ intellectual property, and iii) to indemnify customers, including indemnification against third party claims alleging infringement of intellectual property rights. We also have agreements with each of our directors and executive officers to indemnify such directors or executive officers, to the extent legally permissible, against all liabilities reasonably incurred in connection with any action in which such individual may be involved by reason of such individual being or having been a director or officer of the Company.
Given the nature of the above obligations and agreements, we are unable to make a reasonable estimate of the maximum potential amount that we could be required to pay. Historically, we have not made any significant payments on the above guarantees and indemnifications and no amount has been accrued in the accompanying consolidated financial statements with respect to these guarantees and indemnifications.
| 56 |
AWARE, INC.
NOTES TO CONSOLIDATED FINANCIAL STATEMENTS
10.
BUSINESS SEGMENTS AND MAJOR CUSTOMERS
We organize ourselves into a single segment that reports to the chief operating decision makers.
We conduct our operations in the United States and sell our products and services to domestic and international customers. Revenues were generated from the following geographic regions (in thousands):
|
Year ended December 31,
|
||||||||||||
|
2014
|
2013
|
2012
|
||||||||||
|
United States
|
$ | 18,168 | $ | 13,909 | $ | 12,158 | ||||||
|
Rest of world
|
5,552 | 5,448 | 5,146 | |||||||||
| $ | 23,720 | $ | 19,357 | $ | 17,304 | |||||||
There were no single foreign countries from which we derived 10% or more of total revenue in the years ended December 31, 2014, 2013, and 2012.
Revenue by product group was (in thousands):
|
Year ended December 31,
|
||||||||||||
|
2014
|
2013
|
2012
|
||||||||||
|
Biometrics
|
$ | 21,436 | $ | 17,085 | $ | 13,493 | ||||||
|
Imaging
|
1,558 | 1,352 | 1,641 | |||||||||
|
DSL royalties
|
726 | 920 | 2,170 | |||||||||
| $ | 23,720 | $ | 19,357 | $ | 17,304 | |||||||
The portion of total revenue that was derived from major customers was as follows:
|
Year ended December 31,
|
||||||||||||
|
2014
|
2013
|
2012
|
||||||||||
|
Customer A
|
24 | % | 21 | % | 5 | % | ||||||
|
Customer B
|
10 | % | 3 | % | - | % | ||||||
|
11.
|
EMPLOYEE BENEFIT PLAN
|
In 1994, we established a qualified 401(k) Retirement Plan (the “Plan”) under which employees are allowed to contribute certain percentages of their pay, up to the maximum allowed under Section 401(k) of the Internal Revenue Code. Our contributions to the Plan are at the discretion of the Board of Directors. Our contributions were approximately $198,000, $189,000, and $233,000 in 2014, 2013 and 2012, respectively.
| 57 |
AWARE, INC.
NOTES TO CONSOLIDATED FINANCIAL STATEMENTS
|
12.
|
NET INCOME PER SHARE
|
Net income per share is calculated as follows (in thousands, except per share data):
|
Year ended December 31,
|
||||||||||||
|
2014
|
2013
|
2012
|
||||||||||
|
Net income:
|
||||||||||||
|
Income from continuing operations
|
$ | 4,583 | $ | 3,752 | $ | 72,383 | ||||||
|
Loss from discontinued operations
|
- | (1,156 | ) | (76 | ) | |||||||
|
Net income
|
$ | 4,583 | $ | 2,596 | $ | 72,307 | ||||||
|
Shares outstanding
:
|
||||||||||||
|
Weighted-average common shares outstanding
|
22,703 | 22,543 | 21,814 | |||||||||
|
Additional dilutive common stock equivalents
|
84 | 98 | 257 | |||||||||
|
Diluted shares outstanding
|
22,787 | 22,641 | 22,071 | |||||||||
|
Basic net income per share
:
|
||||||||||||
|
Basic net income per share from continuing operations
|
$ | 0.20 | $ | 0.17 | $ | 3.32 | ||||||
|
Basic net loss per share from discontinued operations
|
- | (0.05 | ) | (0.00 | ) | |||||||
|
Basic net income per share
|
$ | 0.20 | $ | 0.12 | $ | 3.32 | ||||||
|
Diluted net income per share
:
|
||||||||||||
|
Diluted net income per share from continuing operations
|
$ | 0.20 | $ | 0.16 | $ | 3.28 | ||||||
|
Diluted net loss per share from discontinued operations
|
- | (0.05 | ) | (0.00 | ) | |||||||
|
Diluted net income per share
|
$ | 0.20 | $ | 0.11 | $ | 3.28 | ||||||
For the years ended December 31, 2014, 2013 and 2012, options to purchase 40,834, 823,338, and 821,838 shares of common stock at weighted average exercise prices of $6.14, $6.07, and $6.07 per share, respectively, were outstanding, but were not included
in the computation of diluted EPS because the options’ exercise prices were greater than the average market price of the common shares and thus would be anti-dilutive.
13.
ACCUMULATED OTHER COMPREHENSIVE LOSS
The components of accumulated other comprehensive loss and activity were as follows (in thousands):
|
December 31,
|
Increase/
|
Reclassification
|
December 31,
|
||||||||||||||
|
2013
|
Decrease
|
Adjustments
|
2014
|
||||||||||||||
|
Unrealized losses on available for sale securities
|
($ | 206 | ) | $ | 60 | $ | 59 | ($ | 87 | ) | |||||||
|
Unrealized gains on available for sale securities
|
- | 43 | - | 43 | |||||||||||||
|
Net unrealized gains (losses) on available for sale securities
|
(206 | ) | 103 | 59 |
(a)
|
(44 | ) | ||||||||||
|
Income tax benefit (expense) on other comprehensive loss
|
81 | (46 | ) | (20 | ) | 15 | |||||||||||
|
Total accumulated other comprehensive loss, net of taxes
|
($ | 125 | ) | $ | 57 | $ | 39 | ($ | 29 | ) | |||||||
|
(a)
|
– Classified in other expense.
|
| 58 |
AWARE, INC.
NOTES TO CONSOLIDATED FINANCIAL STATEMENTS
14.
QUARTERLY RESULTS OF OPERATIONS – UNAUDITED
The following table is a summary of certain items in the consolidated statements of income and comprehensive income for each of our quarters in the two-year period ended December 31, 2014 (in thousands, except per share data).
|
2014 Quarters Ended
|
||||||||||||||||
|
March 31
|
June 30
|
September 30
|
December 31
|
|||||||||||||
|
Revenue
|
$ | 6,617 | $ | 6,767 | $ | 6,027 | $ | 4,309 | ||||||||
|
Operating income
|
1,311 | 1,382 | 4,155 | 243 | ||||||||||||
|
Income from continuing operations
|
880 | 865 | 2,599 | 239 | ||||||||||||
|
Income from discontinued operations
|
- | - | - | - | ||||||||||||
|
Net income
|
880 | 865 | 2,599 | 239 | ||||||||||||
|
Net income per share – basic
|
$ | 0.04 | $ | 0.04 | $ | 0.11 | $ | 0.01 | ||||||||
|
Net income per share – diluted
|
$ | 0.04 | $ | 0.04 | $ | 0.11 | $ | 0.01 | ||||||||
|
2013 Quarters Ended
|
||||||||||||||||
|
March 31
|
June 30
|
September 30
|
December 31
|
|||||||||||||
|
Revenue
|
$ | 4,979 | $ | 4,427 | $ | 4,314 | $ | 5,637 | ||||||||
|
Operating income
|
2,982 | 543 | 1,039 | 754 | ||||||||||||
|
Income from continuing operations
|
1,972 | 465 | 790 | 525 | ||||||||||||
|
Income (loss) from discontinued
operations
|
(115 | ) | (158 | ) | (1,943 | ) | 1,060 | |||||||||
|
Net income (loss)
|
1,857 | 307 | (1,153 | ) | 1,585 | |||||||||||
|
Net income (loss) per share – basic
|
$ | 0.08 | $ | 0.01 | $ | (0.05 | ) | $ | 0.07 | |||||||
|
Net income (loss) per share – diluted
|
$ | 0.08 | $ | 0.01 | $ | (0.05 | ) | $ | 0.07 | |||||||
Quarterly amounts may not sum to annual amounts due to rounding and dilution.
15. OFF-BALANCE SHEET ARRANGEMENTS
We do not currently have any arrangements with unconsolidated entities, such as entities often referred to as structured finance, special purpose entities, or variable interest entities which are often established for the purpose of facilitating off-balance sheet arrangements or other contractually narrow or limited purposes. Accordingly, we are not exposed to any financing, liquidity, market or credit risk if we had such relationships.
In 2011 and 2012, we disclosed that we had a patent arrangement with an unaffiliated third party that we classified as a variable interest entity (“VIE”). Under this arrangement we assigned certain patents to the third party, and the third party engages in monetization activities and shares royalties with us. The third party is engaged in the business of the monetization of intellectual property.
We continue to have a contractual relationship with this third party.
We also disclosed in 2011 and 2012 that: i) we had no equity interest in the entity; ii) we were not contractually obligated to fund the entity, therefore our maximum exposure to loss as a result of our involvement with the entity was zero; iii) we may receive royalties in the future if certain conditions are met; iv) we were not the primary beneficiary of the entity; v) we had not consolidated the entity’s results into our financial statements, therefore we carried the assets and liabilities of this entity in our balance sheet at zero; and vi) prior to September 30, 2012, this arrangement had no impact on our results of operations, financial position or cash flows in any previous periods.
| 59 |
AWARE, INC.
NOTES TO CONSOLIDATED FINANCIAL STATEMENTS
We determined that the third party entity was a VIE in 2011 and 2012, because we made a judgment that the arrangement met two conditions under ASC 810 that caused VIE classification, namely: i) our right to receive royalties entitled us to receive a portion of the entity’s expected residual returns; and ii) a provision in the agreement denied the equity holders of the third party entity the power to direct the activities that most significantly impacted the entity’s economic performance.
We also determined at that time that we were not the primary beneficiary because: i) we had no equity interest in the third party entity; and ii) a provision in the agreement resulted in “shared power” that did not give either party the power to direct the activities that most significantly impacted the economic performance of the entity. Accordingly, we were not required to consolidate the third party entity under ASC 810, because we were not the primary beneficiary.
Due to strategic legal reasons, we found it necessary to amend the agreement in August 2012 to eliminate the provision that had previously denied the equity holders of the third party entity the power to direct the activities that most significantly impacted the entity’s economic performance. Upon amendment, the equity holders of the entity had such power, and we determined that the arrangement was no longer a VIE under ASC 810.
| 60 |
FINANCIAL STATEMENT SCHEDULE
Schedule II - Valuation and Qualifying Accounts – Years ended December 31, 2014, 2013, and 2012
(in thousands)
|
Col. A
|
Col. B
|
Col. C(1)
|
Col. C(2)
|
Col. D
|
Col. E
|
|||||||||||||||
|
Additions
|
||||||||||||||||||||
|
Balance at
|
Charged to
|
Charged
|
Deductions
|
Balance
|
||||||||||||||||
|
Beginning
|
Costs and
|
to Other
|
Charged to
|
at End
|
||||||||||||||||
|
of Period
|
Expenses
|
Accounts
|
Reserves
|
of Period
|
||||||||||||||||
|
Allowance for doubtful accounts receivable:
|
||||||||||||||||||||
|
2014
|
$ | 20 | $ | - | $ | - | $ | - | $ | 20 | ||||||||||
|
2013
|
$ | 20 | $ | - | $ | - | $ | - | $ | 20 | ||||||||||
|
2012
|
$ | 30 | $ | - | $ | - | $ | 10 | $ | 20 | ||||||||||
|
Inventory reserves:
|
||||||||||||||||||||
|
2014
|
$ | - | $ | - | $ | - | $ | - | $ | - | ||||||||||
|
2013
|
$ | - | $ | - | $ | - | $ | - | $ | - | ||||||||||
|
2012
|
$ | 1,403 | $ | 126 | $ | - | $ | 1,529 | $ | - | ||||||||||
|
Warranty reserves:
|
||||||||||||||||||||
|
2014
|
$ | - | $ | - | $ | - | $ | - | $ | - | ||||||||||
|
2013
|
$ | 10 | $ | - | $ | - | $ | 10 | $ | - | ||||||||||
|
2012
|
$ | - | $ | 12 | $ | - | $ | 2 | $ | 10 | ||||||||||
|
Deferred tax asset valuation allowance:
|
||||||||||||||||||||
|
2014
|
$ | - | $ | - | $ | - | $ | - | $ | - | ||||||||||
|
2013
|
$ | - | $ | - | $ | - | $ | - | $ | - | ||||||||||
|
2012
|
$ | 40,476 | $ | - | $ | - | $ | 40,476 | $ | - | ||||||||||
| 61 |
None.
Conclusion Regarding the Effectiveness of Disclosure Controls and Procedures
Under the supervision and with the participation of our management, including our co-chief executive officers and chief financial officer, we conducted an evaluation of our disclosure controls and procedures, as such term is defined under Rule 13a-15(e) promulgated under the Securities Exchange Act of 1934, as amended (the Exchange Act). Based on this evaluation, our co-chief executive officers and chief financial officer concluded that our disclosure controls and procedures were effective as of the end of the period covered by this annual report.
Evaluation of Changes in Internal Control Over Financial Reporting
Under the supervision and with the participation of our management, including our co-chief executive officers and chief financial officer, we concluded that there were no changes in our internal control over financial reporting that occurred during the quarterly period ended December 31, 2014 that have materially affected, or are reasonably likely to materially affect, our internal control over financial reporting.
Management’s Report on Internal Control Over Financial Reporting
Our management is responsible for establishing and maintaining adequate internal control over financial reporting as defined in Rules 13(a)-15(f) under the Exchange Act. Under the supervision and with the participation of our management, including our principal co-executive officers and principal financial officer, we conducted an evaluation of the effectiveness of our internal control over financial reporting based on the framework in
Internal Control - Integrated Framework
issued by the Committee of Sponsoring Organizations of the Treadway Commission in 2013. Based on our evaluation under the framework in
Internal Control — Integrated Framework
, our management concluded that our internal control over financial reporting was effective as of December 31, 2014.
The effectiveness of our internal control over financial reporting as of December 31, 2014 has been audited by McGladrey LLP, an independent registered public accounting firm, as stated in their audit report which is included herein.
None.
| 62 |
The information required by Item 10 of Form 10-K is incorporated by reference from the information contained in the sections captioned
“Directors and Executive Officers”, “Corporate Governance
” and
“Section 16(a
)
Beneficial Ownership Reporting Compliance”
in the Proxy Statement that will be delivered to our shareholders in connection with our May 20, 2015 Annual Meeting of Shareholders.
The information required by Item 11 of Form 10-K is incorporated by reference from the information contained in the section captioned
“Executive Compensation”
in the Proxy Statement that will be delivered to our shareholders in connection with our May 20, 2015 Annual Meeting of Shareholders.
The information required by Item 12 of Form 10-K is incorporated by reference from the information contained in the section captioned
“Security Ownership of Certain Beneficial Owners and Management and Related Stockholder Matters”
in the Proxy Statement that will be delivered to our shareholders in connection with our May 20, 2015 Annual Meeting of Shareholders.
The information, if any, required by Item 13 of Form 10-K is incorporated by reference from the information contained in the sections captioned
“Corporate Governance”
and
“Certain Relationships and Related Transactions”
in the Proxy Statement that will be delivered to our shareholders in connection with our May 20, 2015 Annual Meeting of Shareholders.
The information required by Item 14 of Form 10-K is incorporated by reference from the information contained in the section captioned
“Independent Accountants”
in the Proxy Statement that will be delivered to our shareholders in connection with our May 20, 2015 Annual Meeting of Shareholders.
| 63 |
The following documents are filed as part of this report:
(a)
Financial Statements and Exhibits
:
|
Page
|
|||
|
(1) Consolidated Balance Sheets as of December 31, 2014 and 2013
|
39 | ||
|
Consolidated Statements of Income and Comprehensive Income for each of the three
years in the period ended December 31, 2014
|
40 | ||
|
Consolidated Statements of Cash Flows for each of the
three years in the period ended December 31, 2014
|
41 | ||
|
Consolidated Statements of Stockholders’ Equity for each of
the three years in the period ended December 31, 2014
|
42 | ||
|
Notes to Consolidated Financial Statements
|
43 | ||
|
(2) Schedule II - Valuation and Qualifying Accounts
|
61 | ||
| (3) Exhibits: |
The exhibits listed below are filed with or incorporated by reference in this report.
|
Exhibit No.
|
Description of Exhibit
|
||
|
3.1
|
Amended and Restated Articles of Organization, as amended (filed as Exhibit 3.1 to the Company’s Form 10-K for the year ended December 31, 2008 and incorporated herein by reference).
|
||
|
3.2
|
Amended and Restated By-Laws (filed as Exhibit 3.1 to the Company’s Form 8-K filed with the Securities and Exchange Commission on December 10, 2007 and incorporated herein by reference).
|
||
|
10.1*
|
1996 Stock Option Plan, as amended and restated (filed as Annex A to the Company’s Definitive Proxy Statement filed with the Securities and Exchange Commission on April 11, 2000 and incorporated herein by reference).
|
||
|
10.2*
|
1996 Employee Stock Purchase Plan, as amended and restated (filed as Exhibit 99.1 to the Company’s Current Report on Form 8-K filed with the Securities and Exchange Commission on November 29, 2005 and incorporated herein by reference).
|
||
|
10.3*
|
Form of Indemnification Agreement for Directors and Officers of Aware, Inc. (filed as Exhibit 10.1 to the Company’s Form 8-K filed with the Securities and Exchange Commission on February 22, 2011 and incorporated herein by reference).
|
||
|
10.4*
|
2001 Nonqualified Stock Plan (filed as Exhibit 99(d)(4) to the Company’s Schedule TO filed with the Securities and Exchange Commission on March 3, 2003 and incorporated herein by reference).
|
||
| 10.5* | Form of Nonqualified Stock Option Agreement under the 2001 Nonqualified Stock Plan for options granted to executive officers and directors prior to May 21, 2008 (filed as Exhibit 10.6 to Company’s Form 10-K for the year ended December 31, 2006 and incorporated herein by reference). | ||
|
10.6*
|
Form of Nonqualified Stock Option Agreement under the 2001 Nonqualified Stock Plan for options granted to executive officers and directors from and after May 21, 2008 (filed as Exhibit 10.8 to Company’s Form 8-K on May 22, 2008 and incorporated herein by reference)
|
||
|
10.7*
|
Form of Unrestricted Stock Award for outside directors of Aware under the 2001 Nonqualified Stock Plan (filed as Exhibit 10.1 to Company’s Form 8-K filed with the Securities and Exchange Commission on July 28, 2010 and incorporated herein by reference).
|
||
|
10.8*
|
Form of Unrestricted Stock Award for officers of Aware under the 2001 Nonqualified Stock Plan (filed as Exhibit 10.2 to Company’s Form 8-K filed with the Securities and Exchange Commission on July 28, 2010 and incorporated herein by reference).
|
||
|
10.9
|
Asset Purchase Agreement by and between Aware, Inc. and Lantiq Broadband Holdco, Inc. and Lantiq Deutschland GmbH dated October 14, 2009 (filed as Exhibit 10.8 to Company’s Form 10-K for the year ended December 31, 2009 and incorporated herein by reference).
|
||
| 64 |
|
10.12*
|
Form of Unrestricted Stock Award for executive officers and directors of Aware, Inc. under the 2001 Nonqualified Plan (filed as Exhibit 10.1 to the Company’s Form 8-K filed with the Securities and Exchange Commission on April 4, 2013 and incorporated herein by reference).
|
|
|
21.1
|
Subsidiaries of Registrant.
|
|
|
23.1
|
Consent of Independent Registered Public Accounting Firm.
|
|
|
31.1
|
Certification of co-Chief Executive Officer pursuant to Section 302 of the Sarbanes-Oxley Act of 2002.
|
|
|
31.2
|
Certification of co-Chief Executive Officer and Chief Financial Officer pursuant to Section 302 of the Sarbanes-Oxley Act of 2002.
|
|
|
32.1
|
Certification of Chief Executive Officer and Chief Financial Officer pursuant to Section 906 of the Sarbanes-Oxley Act of 2002.
|
|
|
101**
|
The following financial statements from Aware, Inc.’s Annual Report on Form 10-K for the year ended December 31, 2014, formatted in XBRL (eXtensible Business Reporting Language), as follows: (i) Consolidated Balance Sheets as of December 31, 2014 and December 31, 2013; (ii) Consolidated Statements of Income and Comprehensive Income for the Years Ended December 31, 2014, December 31, 2013 and December 31, 2012; (iii) Consolidated Statements of Cash Flows for the Years Ended December 31, 2014, December 31, 2013 and December 31, 2012; (iv) Consolidated Statements of Stockholders’ Equity for the Years Ended December 31, 2014, December 31, 2013 and December 31, 2012; and (v) Notes to Consolidated Financial Statements.
|
†Portions of this exhibit are omitted and were filed separately with the Securities and Exchange Commission pursuant to the Company’s application requesting confidential treatment under Rule 24b-2 of the Securities Exchange Act of 1934, as amended.
*
Management contract or compensatory plan.
**Pursuant to Rule 406T of Regulation S-T, the Interactive Data Files in Exhibit 101 hereto shall not be deemed filed for purposes of Sections 11 or 12 of the Securities Act of 1933, as amended, or Section 18 of the Securities Exchange Act of 1934, as amended, or otherwise subject to liability under those sections.
| 65 |
SIGNATURES
Pursuant to the requirements of Section 13 or 15(d) of the Securities Exchange Act of 1934, the Registrant has duly caused this report to be signed on its behalf by the undersigned, thereunto duly authorized.
| AWARE, INC. | ||
|
|
By:
|
/s/ Kevin T. Russell |
| Kevin T. Russell | ||
| co-Chief Executive Officer & co-President | ||
| General Counsel | ||
|
|
By:
|
/s/ Richard P. Moberg |
| Richard P. Moberg | ||
| co-Chief Executive Officer & co-President | ||
| Chief Financial Officer (Principal Financial and Accounting Officer) | ||
| Date: February 13, 2015 | ||
Pursuant to the requirements of the Securities Exchange Act of 1934, this report has been signed below by the following persons on behalf of the registrant and in the capacities indicated on the 13th day of February 2015.
|
Signature
|
Title
|
|
||||
|
/s/ Kevin T. Russell
|
co-Chief Executive Officer, co-President,
|
|||||
|
Kevin T. Russell
|
General Counsel & Director
|
|||||
|
(co-Principal Executive Officer)
|
||||||
|
/s/ Richard P. Moberg
|
co-Chief Executive Officer, co-President,
|
|||||
|
Richard P. Moberg
|
Chief Financial Officer & Director
|
|||||
|
(co-Principal Executive Officer)
|
||||||
|
(Principal Financial and Accounting Officer)
|
||||||
|
/s/ John S. Stafford, Jr.
|
Chairman of the Board & Director
|
|||||
|
John S. Stafford, Jr.
|
||||||
|
/s/ John S. Stafford, III
|
Director
|
|||||
|
John S. Stafford, III
|
||||||
|
/s/ Adrian F. Kruse
|
Director
|
|||||
|
Adrian F. Kruse
|
||||||
|
/s/ Brian D. Connolly
|
Director
|
|||||
|
Brian D. Connolly
|
||||||
|
/s/ Brent P. Johnstone
|
Director
|
|||||
|
Brent P. Johnstone
|
||||||
| 66 |
TABLE OF CONTENTS
Part IItem 1. BusinessItem 1A. Risk FactorsItem 1B. Unresolved Staff CommentsItem 2. PropertiesItem 3. Legal ProceedingsItem 4. Mine Safety DisclosuresPart IIItem 5. Market For Registrant S Common Equity, Related Stockholder Matters and Issuer Purchases Of Equity SecuritiesItem 6. Selected Financial DataItem 7. Management S Discussion and Analysis Of Financial Condition and Results Of OperationsItem 7A. Quantitative and Qualitative Disclosures About Market RiskItem 8. Financial Statements and Supplementary DataItem 9. Changes in and Disagreements with Accountants on Accounting and Financial DisclosureItem 9A. Controls and ProceduresItem 9B. Other InformationPart IIIItem 10. Directors, Executive Officers and Corporate GovernanceItem 11. Executive CompensationItem 12. Security Ownership Of Certain Beneficial Owners and Management and Related Stockholder MattersItem 13. Certain Relationships and Related Transactions, and Director IndependenceItem 14. Principal Accountant Fees and ServicesPart IVItem 15. Exhibits and Financial Statement Schedule