AXON ENTERPRISE, INC.
10-Ks and 10-Qs
|
|
|
|
|
|
|
|
|
|
|
|
|
|
|
|
|
|
|
|
|
|
|
|
|
|
|
|
|
|
|
|
|
|
|
|
|
|
|
|
|
|
|
|
|
|
|
|
|
|
|
|
|
|
|
|
UNITED STATES
SECURITIES AND EXCHANGE COMMISSION
Washington, D.C. 20549
|
Form 10-K
|
(Mark One)
|
x
|
ANNUAL REPORT PURSUANT TO SECTION 13 OR 15(d) OF THE SECURITIES EXCHANGE ACT OF 1934
|
For the fiscal year ended December 31,
2016
or
|
¨
|
TRANSITION REPORT PURSUANT TO SECTION 13 OR 15(d) OF THE SECURITIES EXCHANGE ACT OF 1934
|
Commission File Number: 001-16391
|
TASER International, Inc.
(Exact name of registrant as specified in its charter)
|
|
Delaware
|
|
86-0741227
|
|
(State or other jurisdiction of
incorporation or organization)
|
|
(I.R.S. Employer
Identification No.)
|
|
17800 North 85
th
Street
Scottsdale, Arizona
|
|
85255
|
|
(Address of principal executive offices)
|
|
(Zip Code)
|
Registrant’s telephone number, including area code:
(480) 991-0797
Securities registered pursuant to Section 12(b) of the Act:
|
Title of each class
|
|
Name of exchange on which registered
|
|
Common Stock, $0.00001 par value per share
|
|
The Nasdaq Global Select Market
|
Securities registered pursuant to Section 12(g) of the Act:
None
(Title of Class)
Indicate by check mark if the registrant is a well-known seasoned issuer, as defined in Rule 405 of the Securities Act. Yes
¨
No
ý
Indicate by check mark if the registrant is not required to file reports pursuant to Section 13 or Section 15(d) of the Act. Yes
¨
No
ý
Indicate by check mark whether the registrant (1) has filed all reports required to be filed by Section 13 or 15(d) of the Securities Exchange Act of 1934 during the preceding 12 months (or for such shorter period that the registrant was required to file such reports), and (2) has been subject to such filing requirements for the past 90 days. Yes
ý
No
¨
Indicate by check mark whether the registrant has submitted electronically and posted on its corporate Website, if any, every Interactive Data File required to be submitted and posted pursuant to Rule 405 of Regulation S-T (§232.405 of this chapter) during the preceding 12 months (or for such shorter period that the registrant was required to submit and post such files). Yes
ý
No
¨
Indicate by check mark if disclosure of delinquent filers pursuant to Item 405 of Regulation S-K (§229.405 of this chapter) is not contained herein, and will not be contained, to the best of registrant’s knowledge, in definitive proxy or information statements incorporated by reference in Part III of this Form 10-K or any amendment to this Form 10-K.
¨
Indicate by check mark whether the registrant is a large accelerated filer, an accelerated filer, a non-accelerated filer, or a smaller reporting company. See the definitions of “large accelerated filer,” “accelerated filer” and “smaller reporting company” in Rule 12b-2 of the Exchange Act.
|
Large accelerated filer
|
|
ý
|
|
Accelerated filer
|
|
¨
|
|
Non-accelerated filer
|
|
¨
(Do not check if a smaller reporting company)
|
|
Smaller reporting company
|
|
¨
|
Indicate by check mark whether the registrant is a shell company (as defined in Rule 12b-2 of the Act). Yes
¨
No
ý
The aggregate market value of the common stock held by non-affiliates of the registrant, based on the last sales price of the issuer’s common stock on June 30,
2016
, which was the last business day of the registrant’s most recently completed second fiscal quarter, as reported by NASDAQ, was approximately
$1,273,000,000
. Solely for purposes of this disclosure, shares of common stock held by executive officers and directors of the registrant as of such date have been excluded because such persons may be deemed to be affiliates. This determination of executive officers and directors as affiliates is not necessarily a conclusive determination for any other purposes.
The number of shares of the registrant’s common stock outstanding as of
February 15, 2017
was
52,334,648
DOCUMENTS INCORPORATED BY REFERENCE
Parts of the registrant’s definitive proxy statement for its
2017
annual meeting of stockholders to be prepared and filed with the Securities and Exchange Commission not later than 120 days after December 31,
2016
are incorporated by reference into Part III of this Form 10-K.
TASER INTERNATIONAL, INC.
INDEX TO ANNUAL REPORT ON FORM 10-K
FOR THE YEAR ENDED DECEMBER 31,
2016
|
Page
|
||
2
Statements contained in this report that are not historical are “forward-looking statements” within the meaning of Section 27A of the Securities Act of 1933, as amended (the “Securities Act”), and Section 21E of the Securities Exchange Act of 1934, as amended (the “Exchange Act”), including statements regarding our expectations, beliefs, intentions and strategies regarding the future. We intend that such forward-looking statements be subject to the safe-harbor provided by the Private Securities Litigation Reform Act of 1995. Such forward-looking statements relate to, among other things:
|
•
|
our intentions about future development efforts and activities, including our intentions to invest in research and development as well as the development of new product and service lines and enhanced features for our existing product and service lines;
|
|
•
|
our need and the willingness of customers to upgrade and replace existing conducted electrical weapons (“CEW”) units;
|
|
•
|
that we may have more sales denominated in foreign currencies in
2017
;
|
|
•
|
our intention to increase our investment in the development of sales in the international, military and law enforcement market;
|
|
•
|
our plans to expand our sales force;
|
|
•
|
that cloud and mobile technologies are fundamentally changing the police environment;
|
|
•
|
our plan to invest in web activities and law enforcement trade shows in
2017
;
|
|
•
|
our intention to not pay dividends;
|
|
•
|
that increases in marketing and sales activities will lead to an increase in sales;
|
|
•
|
our belief that the video evidence capture and management market will grow significantly in the near future and the reasons thereto;
|
|
•
|
our intentions to continue to pursue the personal security market;
|
|
•
|
our intention to grow direct sales;
|
|
•
|
the sufficiency of our facilities and our strategy to expand manufacturing capacity if needed;
|
|
•
|
that we may lease facilities from parties that specialize in handling and manufacturing of firearm materials;
|
|
•
|
that we expect to continue to depend on sales of our X2 and X26P CEW devices;
|
|
•
|
our strategy and plans, and the expected benefits relating thereto, to expand our international sales;
|
|
•
|
that we expect further increases in our trial Axon programs and that these programs will lead to additional sales;
|
|
•
|
our intention to apply for and prosecute our patents;
|
|
•
|
that selling, general and administrative expense will increase in
2017
;
|
|
•
|
that research and development expenses will increase in
2017
;
|
|
•
|
the timing of the resolution of uncertain tax positions;
|
|
•
|
our intention to hold investments to maturity;
|
|
•
|
the effect of interest rate changes on our annual interest income;
|
|
•
|
that we may engage in currency hedging activities;
|
|
•
|
our intentions concerning, and the effectiveness of, our ongoing marketing efforts through web activities, trial programs, tech summits and law enforcement trade shows;
|
|
•
|
the benefits of our CEW products compared to other lethal and less-lethal alternatives;
|
|
•
|
the benefits of our Axon products compared to our competitors';
|
|
•
|
our belief that customers will honor multi-year contracts despite the existence of appropriations (or similar) clauses;
|
|
•
|
our belief that customers will renew their Evidence.com service subscriptions at the end of the contractual term;
|
|
•
|
our insulation from competition and our competitive advantage in the weapons business;
|
|
•
|
estimates regarding the size of our target markets and our competitive position in existing markets;
|
|
•
|
the availability of alternative materials and components suppliers;
|
|
•
|
the benefits of the continued automation of our production process;
|
|
•
|
the sufficiency and availability of our liquid assets and capital resources;
|
|
•
|
our financing and growth strategies, including: our decision not to pay dividends, potential joint ventures, mergers and acquisitions, stock repurchases and hedging activities;
|
|
•
|
the safety of our products;
|
3
|
•
|
our litigation strategy; including the outcome of legal proceedings in which we are currently involved;
|
|
•
|
our ability to maintain secure and consistent customer data access and storage, including the use of third-party data storage providers, and the impact of a loss of customer data, a breach of security or an extended outage;
|
|
•
|
our ability to attract and retain the qualified professional services necessary to implement and maintain our business, both through employment and through other partnership arrangements;
|
|
•
|
the effect of current and future tax strategies;
|
|
•
|
the impact of recently adopted and future accounting standards;
|
|
•
|
that the complaint filed by Digital Ally is frivolous; and
|
|
•
|
the ultimate resolution of financial statement items requiring critical accounting estimates.
|
These statements are qualified by important factors that could cause our actual results to differ materially from those reflected by the forward-looking statements. Such factors include, but are not limited to, those factors detailed in Part I Item 1A of this Annual Report on Form 10-K entitled “Risk Factors.” The risks included in the foregoing list are not exhaustive. Other sections of this report may include additional factors that could adversely affect our business and financial performance. New risk factors emerge from time to time, and it is not possible for management to predict all such factors, nor can it assess the impact of all such risk factors or the extent to which any factor, or combination of factors, may cause actual results to differ materially from those contained in any forward-looking statements. We undertake no obligation to update or revise any forward-looking statements to reflect changed assumptions, the occurrence of unanticipated events or changes to expectations over time.
TASER International, Inc. owns the following trademarks: ADVANCED TASER, Axon, TASER, XREP, the bolt on West Hemisphere logo, the bolt on ball logo, the bolt on circle logo, and the bolt within circle logo, all registered in the United States. All other trademarks and service marks including Bolt, CheckLok, C2, X2, X3, M18, M26, Protect Life, Protect Truth, Pulse, Strikelight, X26, X26C, X26P, X12, XREP, Axon Flex, Axon Body, Axon Body 2, Axon Flex 2, Axon Interview, Axon Fleet, Axon Mobile, Axon Signal, Evidence.com, Shockwave, TASER CAM and designs belong to TASER International, Inc., except as expressly indicated as belonging to another.
4
Item 1.
Business
Company Background and Business Strategy
TASER International, Inc.’s (the “Company” or “TASER” or “we” or “our”) core mission is to protect life through innovative technologies that make communities safer. We are the market leader in the development, manufacture and sale of conducted electrical weapons (“CEWs”) designed for use by law enforcement, corrections, military forces, private security personnel and by private individuals for personal defense. We are also the market leader in connected wearable on-officer cameras which utilize our cloud-based digital evidence management solution which is part of our Axon network that connects devices, apps and people to serve law enforcement. Our core goal is to have every officer in the world carry a TASER, deploy an Axon camera and be connected to the Axon network. Our key strategies going into Fiscal 2017 are as follows:
|
•
|
Devices
: Launch innovative new products, scale Axon Fleet, scale existing Axon cameras and devices
|
|
•
|
Apps
: Drive incremental usage, expand the product platform and deliver quality at scale
|
|
•
|
People
: Drive network adoption, achieve full deployment, grow global markets and maximize service plans and product bundles.
|
Technological innovation is the foundation of our long-term growth. By investing in research and development, we will continue to develop novel, high-value solutions across our product platforms. In 2016, we continued to refine our Axon platform by developing next generation applications and devices. In December 2016, the Company launched a new artificial intelligence ("AI") group called "Axon AI." The Company acquired certain proprietary technology, and hired a team of researchers and engineers to accelerate the introduction of new AI-powered capabilities for public safety. The technology acquired is aimed at improving the accuracy, efficiency and speed of processing images and video to enable customers to gain more insight from video, photos and audio. In January 2017, the Company completed another acquisition bringing the Axon AI team of researchers and engineers to nearly 20. This transaction included the acquisition of a computer-vision and deep learning systems to make the visual contents in video searchable in real time. This acquisition will give customers the ability to quickly isolate and analyze the most important aspects of footage from large amounts of video data.
Company Organization
Our products are sold directly to law enforcement agencies and through a network of distribution channels we developed for selling and marketing our products and services. The Company manages its business primarily on a geographic basis. Domestic law enforcement agencies are served through the Company's headquarters in Scottsdale, Arizona, and its Axon business unit located in Seattle, Washington, with various sales representatives strategically located throughout the United States. TASER International, B.V. (the "BV"), a wholly owned subsidiary of the Company, located in Amsterdam, Netherlands, serves as a permanent international headquarters. During 2016, the BV formed Axon Public Safety Australia Pty LTD to better facilitate growth and serve existing customers in the Australian region. The Company also has subsidiaries located in the United Kingdom ("UK"), Germany and Canada.
In May 2015, the Company acquired all of the outstanding common stock of MediaSolv Solutions Corporation ("MediaSolv"). MediaSolv provided solutions for interview room video, closed-circuit television and on-premise digital evidence management. The acquisition also allowed the Company to leverage MediaSolv's existing network and customer relationships. In July 2015, the Company acquired, through one of its wholly owned subsidiaries, all of the outstanding common stock of Tactical Safety Responses Limited ("TSR"), the Company's licensed distributor in the United Kingdom ("UK"). The acquisition has allowed the Company to expand operations in the UK and grow its in-country sales and support team.
The Company’s operations are comprised of two reportable segments: the sale of CEWs, accessories and other related products and services (the “TASER Weapons” segment); and the Axon business, focused on devices, wearables, applications, cloud and mobile products (the "Axon" segment). Within the Axon segment, the Company includes only revenues and costs attributable to that segment which include: costs of sales for both products and services, direct labor, selling expense for the sales team, product management and marketing expenses, trade shows and related expenses, finance and accounting expenses, and research and development for products included, or to be included, within the Axon segment. All other costs are included in the TASER Weapons segment. Further information about our reportable segments and sales by geographic region is included in Notes 1(p) and 16 of the consolidated financial statements in Part II, Item 8 of this Annual Report on Form 10-K.
5
Products
TASER Weapons Products
We make CEWs that use our proprietary Neuro Muscular Incapacitation (“NMI”) effects for two main types of market segments: (i) the law enforcement, military, corrections and private security markets; and (ii) the consumer market. Our products use a replaceable cartridge containing compressed nitrogen to deploy and propel two small probes that are attached to the CEW by insulated conductive wires with lengths ranging from 15 to 35 feet. Our CEWs transmit electrical pulses along the wires and into the body affecting the sensory and motor functions of the peripheral nervous system. The basic design is to provide incapacitating effects that last in cycles of five seconds for our law enforcement, military, corrections and private security products and up to thirty seconds for our consumer market models. This effect can be extended, if necessary, by the operator.
The benefits of using CEWs in the field have been significant. By some studies, TASER CEWs have prevented death or serious injury more than 178,000 times from the first deployment in 2000 to the end of
2016
. In addition to protecting life, the use of these devices instead of other force options has significantly reduced injuries for suspects and officers with substantial liability and workers’ compensation savings to government agencies around the world.
The following products are core to the Company's TASER Weapons product line:
TASER X26P
- The X26P is currently our smallest and most compact Smart Weapon for law enforcement and military use, and is ergonomically designed with ease of performance in mind. TASER Smart Weapons are built on an all-digital platform, and have the ability to regulate charge output, perform health checks, update firmware over the Internet and provide analytics displaying how and when someone uses a device. Through the Company's Evidence.com platform important records, such as event logs and pulse logs, can be viewed and analyzed. Event logs save every user action for record-keeping, including safety activation, and trigger event duration with times, dates, and battery life. Pulse logs display a pulse-by-pulse record of weapon output.
TASER X2
- The X2, designed for law enforcement and the military but available to general consumers, provides users with the same Smart Weapon features as the X26P. Additionally, the X2 incorporates law enforcement agencies' most requested features such as a backup shot, dual lasers to ensure accuracy, and a warning arc to ensure accuracy and effectiveness. The warning arc, a visible electric charge, increases voluntary surrenders and helps stop conflicts from escalating. It issues an audible and visual warning directly over the front of live cartridges.
TASER C2
- The C2 is one of the Company's consumer CEW models. The C2 features the same NMI effects as those available to law enforcement in a discreet appearance and compact and light form factor. The TASER C2 provides incapacitating effects that lasts in cycles of 30 seconds which is intended to allow adequate time for the user to escape the threat.
TASER Pulse
- During January 2016, the Company introduced its newest consumer product, the TASER Pulse CEW, which is a sub-compact model with a newly designed form factor with additional features as compared to the TASER C2, all at a comparable price point. The TASER Pulse became available for sale in the first quarter of 2016.
Replacement Cartridges
-
We manufacture multiple cartridge types for varying ranges and purposes. Types of cartridges include, among others, standard cartridges, smart cartridges and training cartridges. Smart cartridges communicate with the fire control system within the TASER X2 indicating the type of cartridge loaded in each bay and its deployment status. Standard cartridges are designed for use within the X26P CEW systems and are also used in our legacy X26E and M26 products. The Company also offers standard replacement cartridges for the C2 and Pulse consumer models. Our cartridges are available in unique variations for warm and cold climates, training scenarios, and tactical situations.
Axon Connected Solutions
Axon creates connected technologies for truth in public safety. As a segment of TASER, we're building on a history of innovation in policing. Axon is more than a collection of individual technologies; it is a cohesive ecosystem. Every product works together, built by the same team of engineers and supported by the same technicians. Every product from our Smart Weapons to our body-worn cameras to our digital evidence management system integrates seamlessly with one another, and often complements the systems and processes a customer already uses. Below are the products and features that are core to the Axon platform.
6
Hardware Products:
Axon Body 2
- Axon Body 2 builds upon the original platform bringing officers new features such as high-definition ("HD") video, wireless fidelity ("Wi-Fi") offload capabilities, longer battery life, and additional security enhancements. Both the original Axon Body and Axon Body 2 eliminate the need for the camera to be mounted above the shoulder of the individual and rather hooks into the shirt of the officer at mid-chest level. These cameras also eliminate all wires from the wearer’s body.
Axon Flex
- The Axon Flex camera system records video and audio of critical incidents from the visual perspective of the officer. Axon Flex provides complete flexibility in how an officer chooses to wear the device, including an option to deploy as an attachment to Oakley Flak Jacket
™
eyewear.
Axon Flex 2
- The Axon Flex 2 builds upon the original Axon Flex camera system and was designed with a more rugged industrial design, new mounts and advanced capabilities like unlimited HD video, a 120-degree field of view, extended battery life, improved buffering and wireless activation.
TASER CAM HD
- The TASER CAM is a recording device, which integrates with Evidence.com, that captures both video and audio of potential and actual TASER use incidents as an accessory to a TASER CEW. The device can capture video and audio before, during and after a TASER CEW deployment, which provides law enforcement with a greater level of accountability to support their use of TASER weapons against a resistant subject.
Axon Fleet
- Axon Fleet is a breakthrough in-car video system with advanced capabilities and a price that is significantly less than traditional systems. Axon Fleet includes automatic activation, HD video and a flexible design. It is also upgrades continuously behind the scenes with new software features, and is part of a powerful platform that connects mobile, cloud, and wearable technologies.
Axon Interview
- Axon Interview is a video and audio recording system designed for the critical context of the interview room. The system records crucial interviews with redundant, high-quality video and audio technology, ensuring that every moment is captured. The system is available with a 24/7 buffering option that allows agencies to capture key dialogue even after it occurs.
Axon Dock
- With the Axon Dock, the camera charging station is also the automatic data downloader. At the end of a shift, the Axon Dock syncs video from the user's Axon Flex or Axon Body camera during routine charging. Videos are uploaded directly to Evidence.com, eliminating manual filing processes.
Axon Signal
- Axon Signal is a technology that enables Axon Body 2, Axon Flex, Axon Flex 2 and Axon Fleet cameras to start recording automatically upon certain triggering events such as the opening of a patrol car door, activation of a patrol car lightbar or when a TASER X26P or X2 Smart Weapon is unholstered.
Axon Software and Mobile Technologies:
Evidence.com
-
As the sources of digital evidence expand, storage alone is not enough to keep track of the body-worn camera videos, photos, audio recordings and other data that is overwhelming agency servers and systems. Evidence.com is a robust end-to-end solution that not only allows agencies to store all that data, but also enables new workflows for managing and sharing that data. Officers and command staff can upload content from Axon and TASER devices or other systems easily, manage it simply with search and retrieval features, and then collaborate effortlessly with prosecutors by using powerful sharing features. When storage needs or users increase, the cloud-based system allows agencies to scale instantly and cost-effectively. Evidence.com offers several license options, ranging in price, that tailors to the needs of agencies of all sizes. We currently offer our Basic, Standard and Pro licenses that contain incremental feature sets with Pro license containing all of the advanced features currently available. The Company also offers its Ultimate license that includes the Pro license features with Axon camera upgrades and extended warranty services. The Company's Unlimited plan contains the offerings under the Ultimate tier, and includes unlimited HD storage of Axon digital evidence uploads. Finally, the Company offers its Officer Safety Plan tier that provides the highest value by bundling a TASER Smart Weapon with all of the features offered in the Unlimited Plan. All product and service revenues described above, with the exception of the TASER Smart Weapon, are included in the Company's calculation of Axon segment bookings.
Evidence.com
for Prosecutors
-
The same end-to-end evidence management solutions of Evidence.com now allow prosecutors to manage evidence of any type, from any agency, all in one place. Ramp-up time is immediate, and scaling to meet future needs is effortless. Files can be shared during discovery, complete chain of custody is maintained, and all evidence is encrypted. Plus, for prosecuting attorneys working with agencies already using Evidence.com, standard prosecutor licenses are provided at no cost.
Evidence Sync
- Evidence Sync is a desktop-based application that enables evidence in any format, from any source to be uploaded to Evidence.com. TASER Smart Weapon logs, Axon camera videos, dash cam and interview room footage, still photos and more can be uploaded, stored, and managed in one location, accessible anytime, anywhere. Sources new and old—from TASER devices
7
or other brands—are equally supported. Network servers, SD cards, CDs, and computer folders can be synced with ease, and frequently used folders or drives can be set up to automatically sync on schedule.
Axon Capture
- Axon Capture is a mobile application built specifically to allow officers to capture digital evidence right from the field. The app eliminates the need to carry three separate devices for photo, video, and audio recording. Instead, it builds upon the capabilities of an officer's mobile phone with the security and organization needed to protect truth. Officers can add tags, titles or GPS coordinates to any recordings before uploading the data to Evidence.com.
Axon View
- Axon View is a mobile application that wirelessly connects with an Axon camera to provide instant playback of unfolding events from the field, in the field, and the app's live display ensures the camera is positioned correctly.
Axon Five
- Axon Five is the most complete software application available to help customers enhance and analyze images and videos. An unmatched feature set lets a customer uncover details that assists officers in solving crimes. Since time is valuable, Axon Five also automates time-consuming tasks like removing duplicated or mismatched frames, making officers more productive at work.
Axon Convert -
Is a local software solution that gives customers the power to convert unplayable file formats with ease. It ingests and converts files in minutes with only a few clicks, making manual conversion a thing of the past. Since we know maintaining an evidence trail is important, Axon Convert not only produces a playable file, but also preserves the original file and creates a report detailing the exact conversion/translation changes.
Axon Detect
- Axon Detect is a photo analysis program for tamper detection. It goes beyond image-matching to offer a robust suite of authentication tools to certify evidence in-house. This reduces the need for external consultants, shortens turnaround time, and allows for use of evidence captured by the public.
Markets and Distribution
Law Enforcement
Our primary target market for both our weapon and video products is federal, state and local law enforcement agencies in the U.S. and throughout the world. In the law enforcement market, more than
17,800
law enforcement agencies in nearly
150
countries have made initial purchases of our TASER brand devices for testing or deployment. We estimate that in the U.S., approximately two-thirds of all law enforcement patrol officers carry a TASER CEW and internationally, approximately one out of every fifty eligible law enforcement officers carries a TASER CEW. Our goal is to have our CEWs be standard issue equipment for all domestic and international law agencies.
Other Markets
We also target military forces, private security, correctional facilities and consumer personal protection markets to provide technologies that offer a less lethal force of protection.
U.S. Distribution
The Company sells directly to law enforcement agencies in the U.S. as well as through a distribution network. Distributors are selected based upon their reputation within their respective industries, contacts and distribution network. Our regional sales managers work closely with the distributors in their territory to inform and educate the law enforcement communities. We continue to monitor our law enforcement distributors closely to help ensure that our service standards are achieved. Where appropriate, we intend to grow our direct sales over time. Distributors often allow us to penetrate regions at lower fixed costs; however, direct sales allow us greater control over the customer relationship.
Sales in the private citizen market are primarily made through our distributors and our website. We have implemented a variety of marketing initiatives to support sales of our consumer products, with a focus on web, public relations and consumer trade shows. We have consulted with professional digital media and public relations professionals to assist us in media and press events, and editorial placements along with attending numerous trade shows specifically to target the consumer market.
International Distribution
We market and distribute our CEW products to foreign markets through our international subsidiaries as well as through a network of distributors. For geographical and cultural reasons, our distributors usually have a territory defined by their country’s
8
borders. These distributors market both our law enforcement, military, and corrections products, and our consumer products where allowed by law. Our distributors work with local law enforcement, military and corrections agencies in the same manner as our domestic market distributors. For example, they may perform demonstrations, attend industry trade shows, maintain country specific websites, engage in print advertising and arrange training classes.
In order to more effectively engage customers internationally, we have also implemented direct sales teams strategically located throughout each major geographic region of the world. Having dedicated sales personnel stationed full time in these regions will allow us to better serve existing customers as well as execute our sales and marketing strategies more efficiently in order to continue to grow our customer base in new markets.
Manufacturing
We perform light manufacturing, final assembly, and final test operations at our headquarters in Scottsdale, Arizona, and own substantially all of the equipment required to develop, prototype, manufacture and assemble our finished products. This includes critical injection molds, schematics, automation equipment, test equipment and prototypes utilized by our supply chain for the conversion of raw materials into sub-assemblies. We have implemented lean/six sigma methodologies to optimize most direct and indirect resources within the organization, which has helped boost capacity for existing products, as well as provide flexibility to accommodate production of new TASER and Axon product introductions. We are currently operating one to two production shifts depending on inventory levels and demand. However, other capacity options, including the use of additional shifts, will be considered should we experience higher demand resulting from large orders of legacy or new product releases. We continue to maintain our ISO 9001 certification.
The Company currently purchases finished circuit boards and injection-molded plastic components from suppliers located in the U.S., Mexico and Taiwan. Although the Company currently obtains many of these components from single source suppliers, the Company owns the injection molded component tooling used in their production. As a result, management believes it could obtain alternative suppliers in most cases without incurring significant production delays. The Company also purchases small, machined parts from a vendor in Taiwan, custom cartridge assemblies from a proprietary vendor in the U.S., and electronic components from a variety of foreign and domestic distributors. Management believes that there are readily available alternative suppliers in most cases who can consistently meet the Company's needs for these components. The Company acquires most of its components on a purchase order basis and does not have long-term contracts with suppliers. Therefore, many components used by the Company, could at times be subject to industry-wide shortage, and significant pricing fluctuations that could materially adversely affect the Company’s financial condition and operating results.
Business Seasonality and Product Introductions
The Company has historically experienced higher net sales in its second and fourth quarters compared to other quarters in its fiscal year due to municipal budget cycles. Additionally, new product introductions can significantly impact net sales, product costs and operating expenses. However, historical seasonal patterns, municipal budgets or historical patterns of product introductions should not be considered reliable indicators of the Company’s future net sales or financial performance.
Backlog
Our backlog for products and services includes all orders that have been received and are believed to be firm. As of December 31,
2016
and
2015
our backlog was
$384.2 million
and
$183.9 million
, respectively. Included in our backlog as of December 31,
2016
and
2015
was deferred revenue of
$85.2 million
and
$51.0 million
, respectively. Of the deferred revenue balances recorded at December 31,
2016
and
2015
, current deferred revenue was
$45.1 million
and
$20.9 million
, respectively.
Competition
Law Enforcement, Corrections and Private Security Markets
Law enforcement customers partner with TASER for the long-term. The primary competitive factors in the law enforcement and corrections market include a weapon’s accuracy, effectiveness, safety, cost, ease of use and an exceptional customer experience. We are aware of competitors providing competing CEW products, primarily in international markets.
We also believe our CEWs compete indirectly with a variety of other less-lethal alternatives. These alternatives include, but are not limited to, pepper spray, batons and impact weapons sold by companies such as Defense Technology. We believe our TASER brand devices’ advanced technology, versatility, portability, effectiveness, built-in accountability systems, and low injury rate enable us to compete effectively against these other less-lethal alternatives.
9
Private Citizen Market
CEWs have gained limited acceptance in the private citizen market. These devices primarily compete with guns, but also with other less lethal weapons such as pepper spray. The primary competitive factors in the private citizen market include a weapon’s cost, effectiveness, safety and ease of use.
Video Evidence Market
The video evidence capture and management market segment is a highly fragmented and competitive market. Continued evolution in the industry and technology shifts are creating opportunities for both established and new competitors. Key competitive factors include: product performance; product features; product quality and warranty; total cost of ownership; data security; data and information work flows; company reputation and financial strength; and relationship with customers.
Our digital evidence management system, Evidence.com, is a cloud-based platform. Cloud computing fundamentally changes the way local, state and federal government agencies will develop and deploy software applications. Applications used by these agencies have historically required the agency to deploy their own infrastructure of servers, storage, network devices and operating systems. With a cloud-based system, the entire storage infrastructure is managed by third-parties who specialize in infrastructure management. Agencies use Internet web browsers to access the application. Our cloud-based Evidence.com service enables agencies to store, manage and analyze digital evidence. We believe our end-to-end solution of Axon and Evidence.com is a compelling value proposition for law enforcement agencies to implement.
Regulatory Matters
U.S. Regulation
The majority of TASER weapons, as well as the cartridges used by these devices, are subject to regulations; however, most are not considered to be a “firearm” by the U.S. Bureau of Alcohol, Tobacco, Firearms and Explosives. The TASER XREP, a non-core shotgun CEW product, does use a propellant system which falls under the definition of a “firearm” and is, therefore, subject to federal firearms-related regulations. Many states have regulations restricting the sale and use of stun guns, hand-held shock devices and electronic weapons. We believe existing stun gun laws and regulations apply to our devices.
In many cases, the law enforcement and corrections market is subject to different regulations than the private citizen market. Where different regulations exist, we assume the regulations affecting the private citizen market also apply to the private security markets, except as the applicable regulations otherwise specifically provide.
As of December 31,
2016
, the possession of stun guns by the general public, including TASER CEWs, is prohibited in five states: Hawaii, Massachusetts, New Jersey, New York, and Rhode Island, as well as in the District of Columbia. Some cities and municipalities also prohibit private citizen possession or use of our CEW products.
We are also subject to environmental laws and regulations, including restrictions on the presence of certain substances in electronic products. Reference is made to Section 1A, Risk Factors under the heading “Environmental laws and regulations subject us to a number of risks and could result in significant liabilities and costs.”
Evidence.com is subject to government regulation of the Internet in many areas, including telecommunications, data protection, user privacy and online content.
U.S. Export Regulation
CEWs are considered a crime control product by the U.S. government. Accordingly, the export of our devices is regulated under export administration regulations. As a result, we must obtain export licenses from the Department of Commerce for all shipments to foreign countries other than Canada. Most of our requests for export licenses have been granted, and the need to obtain these licenses has not caused a material delay in our shipments. Export regulations also prohibit the further shipment of our products from foreign markets in which we hold a valid export license to foreign markets in which we do not hold an export license for our products.
The Department of Commerce restricts the export of technology used in our CEWs. These regulations apply to both the technology incorporated in our CEW systems and to the processes used to produce them. The technology export regulations do not apply to production that takes place within the U.S. but is applicable to some sub-assemblies and controlled items manufactured outside the U.S.
10
Foreign Regulation
Foreign regulations, which may affect our devices, and sale thereof, are numerous and often unclear. We prefer to work with a distributor who is familiar with the applicable import regulations in each of our foreign markets. Experience with foreign distributors in the past indicates that restrictions may prohibit certain sales of our products in a number of countries. The vast majority of countries permit TASER devices to be sold and used by law enforcement. We maintain strong communication channels with our distributors to ensure we are aware of those countries where TASER CEW devices are prohibited or restricted.
Contracts
Our business is affected by numerous laws and regulations, including those related to the award, administration and performance of contracts. Governmental agencies generally have the ability to terminate our contracts, in whole or in part, for reasons including, but not limited to, non-appropriation of funds. We monitor our policies and procedures with respect to our contracts on a regular basis to enhance consistent application under similar terms and conditions, as well as compliance with all applicable laws and regulations.
Intellectual Property
We protect our intellectual property with U.S. and foreign patents and trademarks. Our patents and pending patent applications relate to technology used by us in connection with our products. We also rely on international treaties, organizations and foreign laws to protect our intellectual property. As of December 31,
2016
, we hold
122
U.S. patents,
54
U.S. registered trademarks,
100
foreign patents, and
257
foreign registered trademarks, and also have numerous patents and trademarks pending. We continuously assess whether and where to seek formal protection for particular innovations and technologies based on such factors as the commercial significance of our operations and our competitors’ operations in particular countries and regions, our strategic technology or product directions in different countries, and the degree to which intellectual property laws exist and are meaningfully enforced in different jurisdictions. TASER has the exclusive rights to many Internet domain names primarily including ‘TASER.com’, ‘Axon.com’, ‘Axon.net’, ‘Evidence.com' and 'Axon.io.’
Confidentiality agreements are used with employees, consultants and key suppliers to help ensure the confidentiality of our trade secrets.
Research and Development
Our research and development initiatives focus on next generation technology. Internally funded research has been primarily focused on improvements to existing TASER products and digital evidence management systems and other cloud-based apps, or the development of new applications for TASER technology that we believe generally will have broad market appeal. Our investment in internally funded research and development totaled
$30.6 million
,
$23.6 million
and
$14.9 million
in
2016
,
2015
, and
2014
, respectively.
Within the Axon segment, the Company's team of application developers conduct research and development initiatives for cloud applications, wearable and mobile technologies in law enforcement, focused specifically on new revenue opportunities that align with our Axon product solutions.
Within the TASER Weapons segment, current research and development initiatives include bio-medical research and electrical, mechanical and software engineering. We expect that future CEW development projects will focus on extending the range, reducing the size, improving the functionality and developing new delivery options for our products.
Our return on investment is intended to be realized over the long-term, although new systems and technologies often can have a more immediate impact on our business.
Employees
As of December 31,
2016
, we had
699
full-time employees and
202
temporary employees. The breakdown of our full-time employees by department is as follows:
175
direct manufacturing employees and
524
administrative and manufacturing support employees. Of the
524
administrative and manufacturing support employees,
213
were involved in sales, marketing, communications and training. Of the
202
temporary employees, more than
92%
worked in direct manufacturing roles. Our employees are not covered by any collective bargaining agreement, and we have never experienced a work stoppage. We believe that our relations with our employees are good.
11
Available Information
We were incorporated in Arizona in September 1993 as ICER Corporation. We changed our name to AIR TASER, Inc. in December 1993 and to TASER International, Incorporated in April 1998. In January 2001, we reincorporated in Delaware as TASER International, Inc.
Our Annual Report on Form 10-K, quarterly reports on Form 10-Q, current reports on Form 8-K and amendments to those reports filed or furnished pursuant to Section 13(a) or 15(d) of the Securities Exchange Act of 1934 are available free of charge on our website at
http://www.TASER.com
as soon as reasonably practicable after we electronically file such material with, or furnish such material to, the SEC. The SEC maintains a website that contains reports, proxy and information statements and other information regarding issuers that file electronically with the SEC at
http://www.sec.gov
.
12
Item 1A.
Risk Factors
Because of the following factors, as well as other variables affecting our operating results, our past financial performance may not be a reliable indicator of our future performance and historical trends should not be used to anticipate our results or trends in future periods.
We are materially dependent on acceptance of our products by law enforcement markets, both domestic and international. If law enforcement agencies do not continue to purchase and use our products, our revenues will be adversely affected.
At any point, due to external factors and opinions not related to product performance, law enforcement agencies may elect to no longer purchase our CEWs or video products
We substantially depend on sales of our TASER X26P and X2 CEWs, and if these products do not continue to be widely accepted, our growth prospects will be diminished.
In the years ended December 31,
2016
,
2015
and
2014
, we derived our revenues predominantly from sales of TASER CEW brand devices and related cartridges, and expect to depend on sales of these products for the foreseeable future. We are seeing a large number of customers upgrade their devices to the X2 or the new X26P device, which we introduced in 2011 and 2013, respectively. This is a trend we expect to continue. A decrease in the selling prices of, or demand for these products, or their failure to maintain broad market acceptance, would significantly harm our growth prospects, operating results and financial condition.
The success of our Evidence.com software as a service (“SaaS”) delivery model is materially dependent on acceptance of this business model by our law enforcement customers. Delayed or lengthy time to adoption by law enforcement agencies will negatively impact our sales and profitability.
A substantial number of law enforcement agencies may be slow to adopt our Evidence.com digital data evidence management and storage solution, requiring extended periods of trial and evaluation. The hosted service delivery business model is not presently widely adopted by our law enforcement customer base. As such, the sales cycle has additional complexity with the need to educate our customers and address issues regarding agency bandwidth requirements, data retention policies, data security and chain of evidence custody. Delays in successfully securing widespread adoption of Evidence.com services could adversely affect our revenues, profitability and financial condition.
If we are unable to design, introduce and sell new products or new product features successfully, our business and financial results could be adversely affected.
Our future success will depend on our ability to develop new products or new product features that achieve market acceptance in a timely and cost-effective manner. The development of new products and new product features is complex, time consuming and expensive, and we may experience delays in completing the development and introduction of new products. We cannot provide any assurance that products that we may develop in the future will achieve market acceptance. If we fail to develop new products or new product features on a timely basis that achieve market acceptance, our business, financial results and competitive position could be adversely affected.
Delays in product development schedules may adversely affect our revenues and cash flows.
The development of CEWs, cameras and software products such as Evidence.com is a complex and time-consuming process. New products and enhancements to existing products can require long development and testing periods. Our increasing focus on our SaaS platform also presents new and complex development issues. Significant delays in new product or service releases or significant problems in creating new products or services could adversely affect our revenue.
We face risks associated with rapid technological change and new competing products.
The technology associated with law enforcement devices is receiving significant attention and is rapidly evolving. While we have some patent protection in certain key areas of our CEW, Axon and SaaS technology, it is possible that new technology may result in competing products that operate outside our patents and could present significant competition for our products which could adversely affect our revenue.
Defects in our products could reduce demand for our products and result in a loss of sales, delay in market acceptance and damage to our reputation.
Complex components and assemblies used in our products may contain undetected defects that are subsequently discovered at any point in the life of the product. Defects in our products may result in a loss of sales, delay in market acceptance and damage to our reputation and increased warranty costs, which could have a material adverse effect on profitability and financial condition.
13
If our security measures are breached and unauthorized access is obtained to customers’ data or our data, our network, data centers and service may be perceived as not being secure, customers may curtail or stop using our service and we may incur significant legal and financial exposure and liabilities.
Our service involves the storage and transmission of customers’ proprietary information, and security breaches could expose us to a risk of loss of this information, litigation and possible liability. We devote significant resources to engineer secure products and ensure security vulnerabilities are mitigated. Despite these efforts, security measures may be breached as a result of third-party action, employee error, and malfeasance or otherwise. Breaches could occur during transfer of data to data centers or at any time, and result in unauthorized access to our data or our customers’ data. Third-parties may attempt to fraudulently induce employees or customers into disclosing sensitive information such as user names, passwords or other information in order to gain access to our data or our customers’ data. Additionally, hackers may develop and deploy viruses, worms, and other malicious software programs that attack or gain access to our networks and data centers. Because the techniques used to obtain unauthorized access, or to sabotage systems, change frequently and generally are not recognized until launched against a target, we may be unable to anticipate these techniques or to implement adequate preventative measures. Any security breach could result in a loss of confidence in the security of our service, damage our reputation, lead to legal liability and negatively impact our future sales.
Interruptions or delays in service from our third-party cloud storage providers for our Evidence.com service, or the loss or corruption of digitally stored evidence, would impair the delivery of our service and harm our business
.
We currently serve our Evidence.com customers from third-party cloud storage providers based in the U.S. and other countries. Interruptions in our service, or loss or corruption of digital evidence, may reduce our revenue, cause us to issue credits or pay penalties, cause customers to terminate their subscriptions and adversely affect our renewal rates and our ability to attract new customers. Our business will also be harmed if our customers and potential customers believe our service is unreliable.
Most of our end-user customers are subject to budgetary and political constraints that may delay or prevent sales.
Most of our end-user customers are government agencies. These agencies often do not set their own budgets and therefore, have limited control over the amount of money they can spend. In addition, these agencies experience political pressure that may dictate the manner in which they spend money. As a result, even if an agency wants to acquire our products, it may be unable to purchase them due to budgetary or political constraints, particularly in challenging economic environments. There can be no assurance that the economic and budgeting issues will not worsen and adversely impact sales of our products. Some government agency orders may also be canceled or substantially delayed due to budgetary, political or other scheduling delays which frequently occur in connection with the acquisition of products by such agencies and such cancellations may accelerate or be more severe than we have experienced historically.
We expend significant resources in anticipation of a sale due to our lengthy sales cycle and may receive no revenue in return.
Generally, law enforcement and corrections agencies consider a wide range of issues before committing to purchase our products, including product benefits, training costs, the cost to use our products in addition to, or in place of, other products, budget constraints and product reliability, safety and efficacy. The length of our sales cycle may range from a few weeks to as long as several years. Adverse publicity surrounding our products or the safety of such products has in the past, and could in the future, lengthen our sales cycle with customers. In the past, we believe that the Company’s sales were adversely impacted by negative publicity surrounding our products or the use of our products. We may incur substantial selling costs and expend significant effort in connection with the evaluation of our products by potential customers before they place an order. If these potential customers do not purchase our products, we will have expended significant resources and received no revenue in return.
Due to municipal government funding rules, certain of our contracts are subject to appropriation (or similar) cancellation clauses, which could allow our customers to cancel contracts in the future.
Although TASER has entered into contracts for the delivery of products and services in the future and anticipates the contracts will be completed, if agencies do not appropriate money in future year budgets, or if other cancellation clauses are invoked, revenue associated with these bookings will not ultimately be recognized, and will result in a reduction to bookings.
Changes in civil forfeiture laws may affect our customers’ ability to purchase our products
Some of our customers use funds seized through civil forfeiture proceedings to fund the purchase of our products. Changes in state legislatures could impact our customers’ ability to seize funds or use seized funds to fund purchases. Changes in civil forfeiture statutes or regulations are outside of our control and could limit the amount of funds available to our customers which could adversely affect the sale of our products.
14
SaaS revenue for Evidence.com is recognized over the terms of the contracts, which may be several years, and, as such, trends in new business may not be immediately reflected in our operating results.
Our SaaS product revenue is generally recognized ratably over the terms of the contracts, which generally range from one to five years. As a result, most of the SaaS revenue we report each quarter is the result of agreements entered into during previous quarters. Consequently, current positive or negative trends in this portion of our business may not be fully reflected in our revenue results for several periods.
We utilize multiple third-party cloud-based storage providers to host the Axon Evidence.com platform.
Utilizing and administering multiple cloud-based storage providers may result in duplication of efforts and resources, increased cost structure, and organization complexities. These complexities and additional costs could adversely affect our business, financial condition or operating results.
We may face personal injury, wrongful death and other liability claims that harm our reputation and adversely affect our sales and financial condition.
Our CEW products are often used in aggressive confrontations that may result in serious, permanent bodily injury or death to those involved. Our CEW products may be associated with these injuries. A person, or the family members of a person, injured in a confrontation or otherwise in connection with the use of our products, may bring legal action against us to recover damages on the basis of theories including wrongful death, personal injury, negligent design, defective product or inadequate warning. We are currently subject to a number of such lawsuits and we have recently been subject to significant adverse judgments and settlements. We may also be subject to lawsuits involving allegations of misuse of our products. If successful, wrongful death, personal injury, misuse and other claims could have a material adverse effect on our operating results and financial condition and could result in negative publicity about our products. Although we carry product liability insurance, we do incur significant legal expenses within our self-insured retention in defending these lawsuits and significant litigation could also result in a diversion of management’s attention and resources, negative publicity and a potential award of monetary damages in excess of our insurance coverage. The outcome of any litigation is inherently uncertain and there can be no assurance that our existing or any future litigation will not have a material adverse effect on our revenues, our financial condition or financial results.
Other litigation may subject us to significant litigation costs and judgments and divert management attention from our business.
We have been or could in the future be involved in numerous other litigation matters relating to our products, contracts and business relationships, including litigation against persons who we believe have infringed on our intellectual property, infringement litigation filed against the Company, litigation against a competitor and litigation filed by a former distributor against the Company. Such matters have resulted, and are expected to continue to result in, substantial costs to us, judgments, settlements and some diversion of our management’s attention, which could adversely affect our business, financial condition or operating results. There is also a risk of adverse judgments, as the outcome of litigation is inherently uncertain.
If we are unable to protect our intellectual property, we may lose our competitive advantage or incur substantial litigation costs to protect our rights. We may be subject to intellectual property infringement claims, which could cause us to incur litigation costs and divert management attention from our business.
Our future success depends upon our proprietary technology. Our protective measures, including patents, trademarks, copyrights, trade secret protection, and Internet identity registrations, may prove inadequate to protect our proprietary rights and market advantage. The right to stop others from misusing our trademarks and service marks in commerce depends, to some extent, on our ability to show evidence of enforcement of our rights against such misuse in commerce. Our efforts to stop improper use, if insufficient, may lead to loss of trademark and service mark rights, brand loyalty and notoriety among our customers and prospective customers. The scope of any patent to which we have or may obtain rights to may not prevent others from developing and selling competing products. The validity and breadth of claims covered in technology patents involve complex legal and factual questions, and the resolution of such claims may be highly uncertain, lengthy and expensive. In addition, our patents may be held invalid upon challenge, or others may claim rights in or ownership of our patents. Moreover, we are subject to litigation with parties that claim, among other matters, that we infringed their patents or other intellectual property rights. The defense and prosecution of patent and other intellectual property claims are both costly and time consuming and could result in a material adverse effect on our business and financial position.
Also, any intellectual property infringement claims against us, with or without merit, could be costly and time-consuming to defend and divert our management’s attention from our business. If our products were found to infringe a third-party’s proprietary rights, we could be forced to enter into costly royalty or licensing agreements in order to be able to sell our products or discontinue use of the protected technology. Such royalty and licensing agreements may not be available on terms acceptable to us or at all.
15
There is no guarantee that our use of conventional technology searching and brand clearance searching will identify all potential rights holders. Rights holders may demand payment for past infringements and/or force us to accept costly license terms or discontinue use of protected technology and/or works of authorship that may include, for example, photos, videos, and software. Our current research and development focus on developing software-based products increases this risk.
In foreign countries we can enforce patent rights only in the jurisdictions in which our patent applications have been granted.
Our U.S. patents protect us from imported infringing products coming into the U.S. from abroad. We have made applications for patents in a few foreign countries; however, these may be inadequate to protect markets for our products in other foreign countries. Each foreign patent is examined and granted according to the law of the country where it was filed independent of whether a U.S. patent on similar technology was granted. A patent in a foreign country may be subject to cancellation if the claimed invention has not been sold in that country. Meeting the requirements of working invention differs by country and ranges from sales in the country to manufacturing in the country. U.S. export law, or the laws of some foreign countries, may prohibit us from satisfying the requirements for working the invention, creating a risk that some of our foreign patents may become unenforceable.
Government regulations applied to our CEW products may affect our markets for and sales of these products.
We rely on the opinions of the U.S. Bureau of Alcohol, Tobacco, Firearms and Explosives, including the determination that a device that has projectiles propelled by the release of compressed gas in place of the expanding gases from ignited gunpowder, are not classified as firearms. Changes in statutes, regulations, and interpretation outside of our control may result in our products being classified or reclassified as firearms. Our private citizen market could be substantially reduced if consumers are required to obtain a registration to own a firearm prior to purchasing our products.
Federal regulation of sales in the U.S.
: With the exception of the TASER XREP, our CEWs are not firearms regulated by the U.S. Bureau of Alcohol, Tobacco, Firearms and Explosives, but our consumer products are regulated by the U.S. Consumer Product Safety Commission. Although there are currently no Federal laws restricting sales of our core CEW products in the U.S., future Federal regulation could adversely affect sales of our products.
Federal regulation of international sales
: Our CEW devices are considered a “crime control” product by the U.S. Department of Commerce (“DOC”) for export directly from the U.S. Consequently, we must obtain an export license from the DOC for the export of our CEW devices from the U.S. other than to Canada. In addition, certain of our camera and software products require classifications from the DOC before they may be shipped internationally. Our inability to obtain DOC export licenses or classifications on a timely basis for sales of our products to our international customers could significantly and adversely affect our international sales.
State and local regulation:
Our CEW devices are controlled, restricted or their use prohibited by a number of state and local governments. Our CEW devices are banned from private citizen purchase or use by statute in five states: Hawaii, Massachusetts, New Jersey, New York, and Rhode Island, as well as in the District of Columbia. Some cities and municipalities also prohibit private citizen possession or use of our CEW products. Other jurisdictions may ban or restrict the sale of our CEW products and our product sales may be significantly affected by additional state, county and city governmental regulation.
Foreign regulation
: Certain foreign jurisdictions prohibit, restrict, or require a permit for the importation, sale, possession or use of CEWs, including in some countries by law enforcement agencies, limiting our international sales opportunities.
We face unique regulatory and political challenges presented by international markets.
Our international business, including any expansion in new international markets, may be adversely affected by local laws and customs and U.S. laws applicable to foreign operations, including the Foreign Corrupt Practices Act.
Risks inherent in international operations also include, among others:
|
•
|
Foreign countries could change laws and regulations, change tax structures, or impose currency restrictions and other restraints;
|
|
•
|
Risks associated with the Foreign Corrupt Practices Act and local anti-bribery law compliance;
|
|
•
|
Political changes and economic crises may lead to changes in the business environment in which we operate;
|
|
•
|
Local distributors of our products may not comply with existing laws and regulations;
|
|
•
|
Some countries impose burdensome tariffs and quotas; and
|
|
•
|
Economic sanctions may be imposed by the U.S. on some countries, which could disrupt the markets for products we sell, even if we do not sell in the target country.
|
16
An attempt by the President's administration to withdraw from or materially modify the North American Free Trade Agreement ("NAFTA") and certain other international trade agreements could adversely affect our business, financial condition and results of operations.
A portion of our business activities are conducted in foreign countries. The President's administration has made comments suggesting that it was not supportive of certain existing international trade agreements, including NAFTA. At this time, it remains unclear what the administration would or would not do with respect to these international trade agreements. If action is taken to withdraw from, or materially modify NAFTA or certain other international trade agreements, our business, financial condition and results of operations could be adversely affected.
United Kingdom Vote to Exit the European Union
On June 23, 2016, the United Kingdom (“U.K.”) held a referendum in which voters approved an exit from the European Union (“E.U.”), commonly referred to as “Brexit”. As a result of the referendum, it is expected that the British government will begin negotiating the terms of the U.K.’s future relationship with the E.U. Although it is unknown what those terms will be, it is possible that there will be greater restrictions and potential increased costs, as well as increased regulatory complexities. These changes may adversely affect our operations and financial results.
Environmental laws and regulations subject us to a number of risks and could result in significant liabilities and costs.
We are subject to various state, federal and international laws and regulations governing the environment, including restricting the presence of certain substances in our products and making producers for those products financially responsible for the collection, treatment, recycling and disposal. Environmental legislation within the European Union (“EU”) may increase our cost of doing business internationally and impact our revenues from EU countries as we comply with and implement these requirements.
The EU has published Directives on the restriction of certain hazardous substances in electronic and electrical equipment (the “RoHS Directive”) and on electronic and electrical waste management (the “WEEE Directive”). The RoHS Directive restricts the use of a number of substances, including lead. The WEEE Directive directs members of the EU to enact laws, regulations, and administrative provisions to ensure that producers of electric and electronic equipment are financially responsible for the collection, recycling, treatment and environmentally responsible disposal of certain products sold into the EU. In addition, similar environmental legislation has been or may be enacted in other jurisdictions, including the U.S. (under federal and state laws) and other countries, the cumulative impact of which could be significant.
We continue to monitor the impact of specific registration and compliance activities required by the RoHS and WEEE Directives. We endeavor to comply with applicable environmental laws, yet compliance with such laws could increase our operations and product costs, increase the complexities of product design, procurement, and manufacturing, limit our ability to manage excess and obsolete non-compliant inventory, limit our sales activities, and impact our future financial results. Any violation of these laws can subject us to significant liability, including fines, penalties, and prohibiting sales of our products into one or more states or countries, and result in a material adverse effect on our financial condition.
Regulations related to voice, data and communications services may impact our ability to sell our products.
The radio spectrum is required to provide wireless voice, data and video communications services. The allocation of spectrum is regulated in the U.S. and other countries and limited spectrum space is allocated to wireless services and specifically to public safety users. In the U.S., the Federal Communications Commission (“FCC”) regulates spectrum use by non-federal entities and federal entities. Similarly, countries around the world have one or more regulatory bodies that define and implement the rules for use of radio spectrum and electromagnetic interference, pursuant to their respective national laws. We manufacture and market products in spectrum bands already made available by regulatory bodies. Consequently, our results could be positively or negatively affected by the rules and regulations adopted from time to time by the FCC or regulatory agencies in other countries. Regulatory changes in current spectrum bands may also provide opportunities or may require modifications to some of our products so they can continue to be manufactured and marketed. If current products do not comply with the regulations set forth by these governing bodies, we may be unable to sell our products or could incur penalties, which could have an adverse impact on our financial condition, results of operations and cash flows.
Regulations related to conflict minerals may force us to incur additional expenses, may make our supply chain more complex and may result in damage to our reputation with customers.
The U.S. Securities and Exchange Commission ("SEC") has enacted disclosure requirements for companies that use certain minerals and metals, known as “conflict minerals,” in their products, whether or not these products are manufactured by third-parties. These requirements require companies to perform due diligence, disclose and report whether or not such minerals originate from the Democratic Republic of Congo and adjoining countries. We have incurred and will likely continue to incur costs to comply with the disclosure requirements, including costs related to determining the source of any of the relevant minerals and
17
metals used in our products. In addition, these new requirements could adversely affect the sourcing, availability and pricing of minerals used in our products. Because our supply chain is complex, we may not be able to sufficiently verify the origins for these minerals and metals used in our products through the due diligence procedures that we implement, which may harm our reputation. In such an event, we may also face difficulties in satisfying customers who require that all of the components of our products are certified as conflict-free.
Our dependence on third-party suppliers for key components of our devices could delay shipment of our products and reduce our sales.
We depend on certain domestic and foreign suppliers for the delivery of components used in the assembly of our products. Our reliance on third-party suppliers creates risks related to our potential inability to obtain an adequate supply of components or sub-assemblies and reduced control over pricing and timing of delivery of components and sub-assemblies. Specifically, we depend on suppliers of sub-assemblies, machined parts, injection molded plastic parts, printed circuit boards, custom wire fabrications and other miscellaneous customer parts for our products. We do not have long-term agreements with any of our suppliers and there is no guarantee that supply will not be interrupted. Due to changes imposed for imports of foreign products into the U.S., as well as potential port closures and delays created by terrorist attacks or threats, public health issues, national disasters or work stoppages, we are exposed to risk of delays caused by freight carriers or customs clearance issues for our imported parts. Any interruption of supply for any material components of our products could significantly delay the shipment of our products and have a material adverse effect on our revenues, profitability and financial condition.
Component shortages could result in our inability to produce at a volume to adequately meet customer demand, which could result in a loss of sales, delay in deliveries and injury to our reputation.
Single or sole-source components used in the manufacture of our products may become unavailable or discontinued. Delays caused by industry allocations or obsolescence may take weeks or months to resolve. In some cases, parts obsolescence may require a product re-design to ensure quality replacement components. These delays could cause significant delays in manufacturing and loss of sales, leading to adverse effects significantly impacting our financial condition or results of operations and injure our reputation.
We may experience a decline in gross margins due to rising raw material and transportation costs associated with a future increase in petroleum prices.
A significant number of our raw materials are comprised of petroleum-based products, or incur some form of landed cost associated with transporting the raw materials or components to our facility. A significant rise in oil prices could adversely impact our ability to sustain current gross margins by increasing component pricing and transportation costs.
We may experience a decline in gross margins due to a shift in product sales from CEWs to Axon devices which may continue to carry a lower gross margin.
We continue to invest in the growth of the Axon segment, and this expected growth may result in a higher percentage of total revenues being comprised of Axon products and services. Gross margin as a percentage of net sales for the Axon segment is currently lower than that of the TASER Weapons segment, and may continue to be lower in the future.
To the extent demand for our products increases, our future success will be dependent upon our ability to manage our growth and to increase manufacturing production capacity, which may be accomplished by the implementation of customized manufacturing automation equipment.
To the extent demand for our products increases significantly in future periods, one of our key challenges will be to increase our production capacity to meet sales demand while maintaining product quality. Our primary strategies to accomplish this include introducing additional shifts, increasing the physical size of our assembly facilities, the hiring of additional production staff, and the implementation of additional customized automation equipment. The investments we make in this equipment may not yield the anticipated labor and material efficiencies. Our inability to meet any future increase in sales demand or effectively manage our expansion could have a material adverse effect on our revenues, financial results and financial condition.
Our future success is dependent on our ability to expand sales through distributors and direct sales and our inability to recruit new distributors or increase direct sales would negatively affect our sales.
Our distribution strategy is to pursue sales through multiple channels with an emphasis on independent distributors and direct sales. Our inability to establish relationships with and retain law enforcement equipment distributors, who we believe can successfully sell our products, would adversely affect our sales. In addition, our arrangements with our distributors are generally short-term. We are also focusing on direct sales to larger agencies through our regional sales managers and our inability to grow sales to these agencies in this manner could adversely affect our sales. If we do not competitively price our products, meet the
18
requirements of our distributors or end-users, provide adequate marketing support, or comply with the terms of our distribution arrangements, our distributors may fail to aggressively market our products or may terminate their relationships with us. These developments would likely have a material adverse effect on our sales. Our reliance on the sales of our products by others also makes it more difficult to predict our revenues, cash flow and operating results.
The increased focus on direct sales compared to sales through distribution is dependent on our ability to sell into the states or foreign jurisdictions that have established distributor relationships.
In certain states and foreign jurisdictions we have decided to pursue sales directly with law enforcement customers, rather than working through established distribution channels. Our customers may have strong working relationships with distributors and we may face resistance to this change. If we do not overcome this resistance and effectively build a direct relationship with our customers, sales may be adversely affected.
Acquisitions and joint ventures may have an adverse effect on our business.
We may consider additional acquisitions or joint ventures as part of our long-term business strategy. These transactions involve significant challenges and risks including that the transaction does not advance our business strategy, that we don’t realize a satisfactory return on our investment, or that we experience difficulty in the integration or coordination of new employees, business systems, and technology, or there is a diversion of management’s attention from our other businesses. These events could harm our operating results, financial condition or cash flows.
If our goodwill or finite-lived intangible assets become impaired, we may be required to record a significant charge to earnings.
We review our finite-lived intangible assets for impairment when events or changes in circumstances indicate the carrying value may not be recoverable, such as a decline in stock price and market capitalization. We test goodwill for impairment at least annually. If such goodwill or finite-lived intangible assets are deemed to be impaired, an impairment loss equal to the amount by which the carrying amount exceeds the fair value of the assets would be recognized. We may be required to record a significant charge in our financial statements during the period in which any impairment of our goodwill or finite-lived intangible assets is determined, which would negatively affect our results of operations.
Catastrophic events may disrupt our business.
A disruption or failure of our systems or operations in the event of a major earthquake, weather event, fire, explosion, failure to contain hazardous materials, industrial accident, cyber-attack, terrorist attack, or other catastrophic event could cause delays in completing sales, providing services, or performing other mission-critical functions. A catastrophic event that results in the destruction or disruption of any of our critical business or information technology systems could harm our ability to conduct normal business operations and our operating results as well as expose us to claims, litigation and governmental investigations and fines.
The Company’s financial performance is subject to risks associated with changes in the value of the U.S. dollar versus local currencies.
For current and potential foreign customers whose contracts are denominated in U.S. dollars, the relative change in currency values creates fluctuations in our product pricing. These changes in foreign end-user costs may result in lost orders and reduce the competitiveness of our products in certain foreign markets.
For non-U.S. dollar denominated sales, weakening of foreign currencies relative to the U.S. dollar generally leads us to raise international pricing, potentially reducing demand for our products. Should we decide not to raise local prices to fully offset the dollar’s strengthening, or at all, the U.S. dollar value of our foreign currency denominated sales and earnings would be adversely affected. We do not currently engage in hedging activities. Fluctuations in foreign currency could result in a change in the U.S. dollar value of our foreign denominated assets and liabilities including accounts receivable. Therefore, the U.S. dollar equivalent collected on a given sale could be less than the amount invoiced causing the sale to be less profitable than contemplated.
We also import selected components which are used in the manufacturing of some of our products. Although our purchase orders are generally in U.S. dollars, weakness in the U.S. dollar could lead to price increases for the components.
19
Unanticipated changes in our effective tax rate and additional tax liabilities may impact our operating results
We are subject to income taxes in the United States and various jurisdictions outside of the United States. Our effective tax rate could fluctuate due to changes in the mix of earnings and losses in countries with differing statutory tax rates. Our tax expense could also be impacted by changes in non-deductible expenses, changes in excess tax benefits related to exercises and vesting of stock-based expense, changes in the valuation of deferred tax assets and liabilities and our ability to utilize them and the applicability of withholding taxes.
We are subject to tax examinations in multiple jurisdictions. While we regularly evaluate new information that may change our judgment resulting in recognition, derecognition or change in measurement of a tax position taken, there can be no assurance that the final determination of any examinations will not have an adverse effect on our operating results and financial position.
Our tax provision could also be impacted by changes in federal, state or international tax laws including fundamental tax law changes applicable to corporate multinationals currently being considered by many countries including the United States as well as several European countries.
Additionally, we may be subject to additional tax liabilities due to changes in non-income taxes resulting from changes in federal, state or international tax laws, changes in taxing jurisdictions’ administrative interpretations, decisions, policies, and positions, results of tax examinations, settlements or judicial decisions, changes in accounting principles, changes to the business operations, including acquisitions, as well as the evaluation of new information that results in a change to a tax position taken in a prior period.
We maintain most of our cash balances, some of which are not insured, at five depository institutions.
We maintain the majority of its cash and cash equivalents accounts at
five
depository institutions. As of December 31,
2016
, the aggregate balances in such accounts were
$33.2 million
. The Company’s balances with these institutions regularly exceed Federal Deposit Insurance Corporation (“FDIC”) insured limits for domestic deposits and various deposit insurance programs covering our deposits in the Netherlands, the United Kingdom, Australia and Germany.
We could suffer losses with respect to the uninsured balances if the depositary institutions failed and the institution’s assets were insufficient to cover its deposits and/or the governments did not take actions to support deposits in excess of existing insurance limits. Any such losses could have a material adverse effect on our liquidity, financial condition and results of operations.
We depend on our ability to attract and retain our key management, sales and technical personnel.
Our success depends upon the continued service of our key management personnel. Our success also depends on our ability to continue to attract, retain and motivate qualified technical personnel. Although we have employment agreements with certain of our officers, the employment of such persons is “at-will” and either we or the employee can terminate the employment relationship at any time, subject to the applicable terms of the employment agreements. The competition for our key employees is intense. The loss of the service of one or more of our key personnel could harm our business.
Risks Related to Ownership of Our Common Stock
The trading price of our common stock has been, and is likely to continue to be, volatile. In addition to the factors discussed in this Annual Report on Form 10-K, the trading price of our common stock may fluctuate significantly in response to numerous factors, many of which are beyond our control, including:
|
•
|
actual or anticipated fluctuations in our revenue and other operating results;
|
|
•
|
the financial projections we may provide to the public, any changes in these projections or our failure to meet these projections;
|
|
•
|
actions of securities analysts who initiate or maintain coverage of us, changes in financial estimates by any securities analysts who follow our company, or our failure to meet these estimates or the expectations of investors;
|
|
•
|
investor sentiment with respect to our competitors, our business partners, and our industry in general;
|
|
•
|
announcements by us or our competitors of significant products or features, technical innovations, acquisitions, strategic partnerships, joint ventures, or capital commitments;
|
|
•
|
announcements by us or estimates by third-parties of actual or anticipated changes in the size of our user base, addressable market or the effectiveness of our products;
|
|
•
|
changes in operation performance and stock market valuations of technology companies in our industries, including our developers and competitors;
|
|
•
|
price and volume fluctuations in the overall stock market, including as a result of trends in the economy as a whole;
|
|
•
|
media coverage of our business and financial performance;
|
|
•
|
lawsuits threatened or filed against us;
|
20
|
•
|
developments in anticipated or new legislation and pending lawsuits or regulator actions, including interim or final rulings by tax, judicial or regulatory bodies; and
|
|
•
|
other events or factors, including those resulting from war or incidents of terrorism, or responses to these events.
|
Our revenues and operating results may fluctuate unexpectedly from quarter-to-quarter, which may cause our stock price to decline.
Our revenues and operating results have varied significantly in the past and may vary significantly in the future due to various factors, including, but not limited to:
|
•
|
budgetary cycles of municipal, state and federal law enforcement and corrections agencies;
|
|
•
|
market acceptance of our products and services;
|
|
•
|
the timing of large domestic and international orders;
|
|
•
|
the outcome of any existing or future litigation;
|
|
•
|
adverse publicity surrounding our products, the safety of our products, or the use of our products;
|
|
•
|
changes in our sales mix;
|
|
•
|
new product introduction costs;
|
|
•
|
increased raw material expenses;
|
|
•
|
changes in our operating expenses; and
|
|
•
|
regulatory changes that may affect the marketability of our products.
|
As a result of these and other factors, we believe that period-to-period comparisons of our operating results may not be meaningful in the short term, and our performance in a particular period may not be indicative of our performance in any future period.
Item 1B.
Unresolved Staff Comments
None.
Item 2.
Properties
Our corporate headquarters and manufacturing facilities are based in a 100,000 square foot facility in Scottsdale, Arizona, which we own. We also lease premises in Scottsdale, Arizona; Seattle, Washington; Topsfield, Massachusetts; Amsterdam, Netherlands; Daventry, England; London, England; Frankfurt, Germany; Brisbane, Australia and Sydney, Australia. We believe our existing facilities are well maintained and in good operating condition. We also believe we have adequate manufacturing capacity for our existing product lines. To the extent that we introduce new products in the future, we will likely need to acquire additional facilities to locate the associated production lines. However, we believe we can acquire or lease such facilities on reasonable terms. The Company continues to make investments in capital equipment as needed to meet anticipated demand for its products.
Item 3.
Legal Proceedings
See discussion of litigation in Note 9(c) to the consolidated financial statements included in Part II, Item 8 of this Annual Report on Form 10-K, which discussion is incorporated by reference herein.
Item 4.
Mine Safety Disclosures
None.
21
Item 5.
Market for Registrant’s Common Equity, Related Stockholder Matters and Issuer Purchases of Equity Securities
Market Information
Our common stock is quoted under the symbol “TASR” on The NASDAQ Global Select Market. The following tables set forth the high and low sales prices per share for our common stock as reported by NASDAQ for each quarter of the last two fiscal years.
|
High
|
Low
|
||||||
|
Year Ended December 31, 2016:
|
|||||||
|
First quarter
|
$
|
20.69
|
|
$
|
13.56
|
|
|
|
Second quarter
|
24.94
|
|
17.18
|
|
|||
|
Third quarter
|
30.15
|
|
24.46
|
|
|||
|
Fourth quarter
|
28.49
|
|
21.50
|
|
|||
|
High
|
Low
|
||||||
|
Year Ended December 31, 2015:
|
|||||||
|
First quarter
|
$
|
28.30
|
|
$
|
21.39
|
|
|
|
Second quarter
|
35.95
|
|
23.41
|
|
|||
|
Third quarter
|
34.91
|
|
18.05
|
|
|||
|
Fourth quarter
|
26.48
|
|
16.14
|
|
|||
Holders
As of
December 31, 2016
, there were
274
holders of record of our common stock.
Dividends
To date, the Company has not declared or paid cash dividends on its common stock. The Company does not intend to pay cash dividends in the foreseeable future, and its revolving line of credit prohibits the payment of cash dividends.
Issuer Purchases of Equity Securities
In February 2016, the Company's Board of Directors authorized a stock repurchase program to acquire up to
$50.0 million
of the Company’s outstanding common stock subject to stock market conditions and corporate considerations. The stock repurchase program does not have a stated expiration date. During the year ended December 31, 2016, the Company purchased, under a Rule 10b5-1 plan, approximately
1.8 million
common shares for a total cost of approximately
$33.7 million
, or a weighted average cost of
$18.90
per share. As of December 31, 2016,
$16.2 million
remains available under the plan for future purchases. The Company suspended its 10b-5 plan during the third quarter of 2016, and any future purchases will be discretionary.
22
Stock Performance Graph
The following stock performance graph compares the performance of our common stock to the NASDAQ Composite Index and the Russell 3000 Index. The graph covers the period from December 31, 2011 to December 31, 2016. The graph assumes that the value of the investment in our stock and in each index was $100 at December 31, 2011, and that all dividends were reinvested. We do not pay dividends on our common stock.
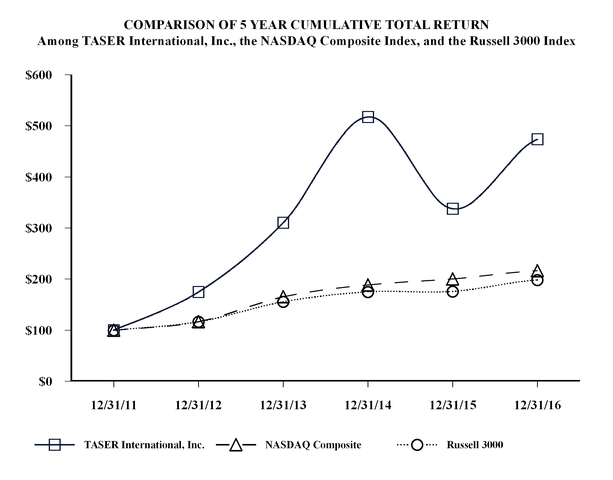
|
2011
|
2012
|
2013
|
2014
|
2015
|
2016
|
||||||||||||||||||
|
TASER International, Inc.
|
$
|
100.00
|
|
$
|
174.61
|
|
$
|
310.16
|
|
$
|
517.19
|
|
$
|
337.70
|
|
$
|
473.44
|
|
|||||
|
NASDAQ Composite
|
100.00
|
|
116.41
|
|
165.47
|
|
188.69
|
|
200.32
|
|
216.54
|
|
|||||||||||
|
Russell 3000
|
100.00
|
|
116.42
|
|
155.47
|
|
175.00
|
|
175.84
|
|
198.23
|
|
|||||||||||
23
Item 6.
Selected Financial Data
The following selected financial data should be read in conjunction with our consolidated financial statements and the notes thereto, and with Item 7, “Management’s Discussion and Analysis of Financial Condition and Results of Operations.” The statement of operations data for the years ended December 31,
2016
,
2015
and
2014
, and the balance sheet data as of December 31,
2016
and
2015
, have been derived from, and should be read in conjunction with, our audited consolidated financial statements and the notes thereto included herein. The statement of operations data for the years ended December 31,
2013
and
2012
, and the balance sheet data as of December 31,
2014
,
2013
and
2012
, is derived from our historical audited consolidated financial statements and the notes thereto which are not included in this Annual Report on Form 10-K. Dollars are in thousands, except per share amounts.
|
|
For the Year Ended December 31,
|
||||||||||||||||||
|
|
2016
|
2015
|
2014
|
2013
|
2012
|
||||||||||||||
|
Statements of Operations Data:
|
|||||||||||||||||||
|
Net sales
|
$
|
268,245
|
|
$
|
197,892
|
|
$
|
164,525
|
|
$
|
137,831
|
|
$
|
114,753
|
|
||||
|
Cost of products sold and services delivered
|
97,709
|
|
69,245
|
|
62,977
|
|
51,988
|
|
47,038
|
|
|||||||||
|
Gross margin
|
170,536
|
|
128,647
|
|
101,548
|
|
85,843
|
|
67,715
|
|
|||||||||
|
Sales, general and administrative expenses
|
108,076
|
|
69,698
|
|
54,158
|
|
46,557
|
|
39,247
|
|
|||||||||
|
Research and development expenses
|
30,609
|
|
23,614
|
|
14,885
|
|
9,888
|
|
8,139
|
|
|||||||||
|
Litigation judgments (recoveries)
|
—
|
|
—
|
|
—
|
|
1,450
|
|
(2,200
|
)
|
|||||||||
|
Income from operations
|
31,851
|
|
35,335
|
|
32,505
|
|
27,948
|
|
22,529
|
|
|||||||||
|
Interest and other income (expense), net
|
(354
|
)
|
26
|
|
(194
|
)
|
86
|
|
83
|
|
|||||||||
|
Income before provision for income taxes
|
31,497
|
|
35,361
|
|
32,311
|
|
28,034
|
|
22,612
|
|
|||||||||
|
Provision for income taxes
|
14,200
|
|
15,428
|
|
12,393
|
|
9,790
|
|
7,874
|
|
|||||||||
|
Net income
|
$
|
17,297
|
|
$
|
19,933
|
|
$
|
19,918
|
|
$
|
18,244
|
|
$
|
14,738
|
|
||||
|
Net income per common and common equivalent shares:
|
|||||||||||||||||||
|
Basic
|
$
|
0.33
|
|
$
|
0.37
|
|
$
|
0.38
|
|
$
|
0.35
|
|
$
|
0.27
|
|
||||
|
Diluted
|
$
|
0.32
|
|
$
|
0.36
|
|
$
|
0.37
|
|
$
|
0.34
|
|
$
|
0.27
|
|
||||
|
Weighted average number of common and common equivalent shares outstanding:
|
|||||||||||||||||||
|
Basic
|
52,667
|
|
53,548
|
|
52,948
|
|
51,880
|
|
53,827
|
|
|||||||||
|
Diluted
|
53,536
|
|
54,638
|
|
54,500
|
|
54,152
|
|
54,723
|
|
|||||||||
|
|
As of December 31,
|
||||||||||||||||||
|
|
2016
|
2015
|
2014
|
2013
|
2012
|
||||||||||||||
|
Balance Sheet Data:
|
|||||||||||||||||||
|
Working capital
|
$
|
99,192
|
|
$
|
123,269
|
|
$
|
102,669
|
|
$
|
67,237
|
|
$
|
51,548
|
|
||||
|
Total assets
|
278,163
|
|
229,881
|
|
185,368
|
|
148,382
|
|
116,236
|
|
|||||||||
|
Total current liabilities
|
78,039
|
|
38,140
|
|
31,973
|
|
23,129
|
|
18,109
|
|
|||||||||
|
Total long-term debt and capital leases, net of current portion
|
118
|
|
81
|
|
29
|
|
67
|
|
103
|
|
|||||||||
|
Total stockholders’ equity
|
150,888
|
|
157,004
|
|
129,106
|
|
108,347
|
|
87,285
|
|
|||||||||
24
Item 7.
Management’s Discussion and Analysis of Financial Condition and Results of Operations
Management’s Discussion and Analysis of Financial Condition and Results of Operations (“MD&A”) is designed to provide a reader of our consolidated financial statements with a narrative from the perspective of our management on our financial condition, results of operations, liquidity and certain other factors that may affect our future results. Our MD&A should be read in conjunction with the other sections of this Annual Report on Form 10-K, including Part I, Item 1A: “Risk Factors”; Part II, Item 6: “Selected Financial Data”; and Part II, Item 8: “Financial Statements and Supplementary Data.” The various sections of this MD&A contain a number of forward-looking statements, all of which are based on our current expectations and could be affected by the uncertainties and risk factors described throughout this filing. The tables in the MD&A sections below are derived from exact numbers and may have immaterial rounding differences.
Executive Overview and Key Strategic Initiatives
Our core mission is to protect life through innovative technologies that make communities safer. We are the market leader in the development, manufacture and sale of conducted electrical weapons (“CEWs”) designed for use by law enforcement, corrections, military forces, private security personnel and by private individuals for personal defense. We are also the market leader in connected wearable on-officer cameras which utilize our cloud-based digital evidence management solution which is part of our Axon network that connects devices, apps and people to serve law enforcement. Our core goal is to have every officer in the world carry a TASER, deploy an Axon camera and be connected to the Axon network.
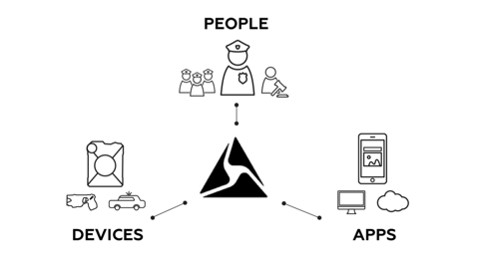
Our key strategies going into Fiscal 2017 are as follows:
|
•
|
Devices
: Launch innovative new products, scale Axon Fleet, scale existing Axon cameras and devices
|
|
•
|
Apps
: Drive incremental usage, expand the product platform and deliver quality at scale
|
|
•
|
People
: Drive network adoption, achieve full deployment, grow global markets and maximize service plans and product bundles.
|
Execution of Our Strategy
Devices -
Our TASER CEWs are one of the few weapons which can truly incapacitate a person without requiring death or serious injury. Over the past few decades, the TASER CEW has become one of the most frequently used weapons in the North American Law Enforcement Market, with injuries and deaths dropping dramatically as a result. Our Axon hardware products currently consist of our on-officer cameras that capture critical digital evidence aimed at protecting truth, a host of related accessory devices and an in-car camera variant which is in field testing preparing for 2017 launch. We believe our CEWs and Axon cameras should be standard issue equipment for all patrol officers domestically and internationally. We have created and are continuing to create service plans and product bundles to ensure agencies have the latest devices and technology at predictable annual costs.
Apps -
The Axon Evidence.com platform is a central place for all agencies' digital evidence. It is an end-to-end solution for not only storing data, but also for efficiently managing and sharing that data. We are continuously seeking to develop new features such as secure sharing, audit trails, integration of other data sources, transcription and redaction services, among others. These feature sets are designed to provide the customers we serve with valuable tools to police more efficiently and effectively while enabling greater transparency with the communities in which they serve.
Our constant drive to develop innovative apps is evidenced by two recent strategic acquisitions. In December 2016, the Company launched a new artificial intelligence ("AI") group called "Axon AI." The Company acquired certain proprietary technology and
25
hired a team of researchers and engineers to accelerate the introduction of new AI-powered capabilities for public safety. The technology acquired is aimed at improving the accuracy, efficiency and speed of processing images and video to enable customers to gain more insight from video, photos and audio. In January 2017, the Company completed another transaction which included the acquisition of a computer-vision and deep learning system to make the visual contents in video searchable in real time. This acquisition will give customers the ability to quickly isolate and analyze the most important aspects of footage from large amounts of video data.
People -
With our TASER weapons and Axon platform, we have created relationships with over 20,000 public safety agencies around the world. Some of our customers report that police officers are spending over 60% of their time on paperwork related tasks, rather than on value-add public safety work. The real opportunity is to leverage this connected platform to enable a broad suite of mobile, wearable, and data management capabilities to bring modern information technology capabilities to every law enforcement officer. Our technologies will not only allow our customers to spend more time on public safety work, but will allow for a capture to courtroom workflow of information. The ability to share files with prosecutors during discovery while maintaining a complete chain of custody and ensuring all evidence remains encrypted will provide a cohesive ecosystem that will deliver increased value to all stakeholders in the public safety and judicial communities.
Results of Operations
The following table presents data from our statements of operations as well as the percentage relationship to total net sales of items included in our statements of operations (dollars in thousands):
|
|
Year Ended December 31,
|
|||||||||||||||||||
|
|
2016
|
2015
|
2014
|
|||||||||||||||||
|
Net sales
|
$
|
268,245
|
|
100.0
|
%
|
$
|
197,892
|
|
100.0
|
%
|
$
|
164,525
|
|
100.0
|
%
|
|||||
|
Cost of products sold and services delivered
|
97,709
|
|
36.4
|
|
69,245
|
|
35.0
|
|
62,977
|
|
38.3
|
|
||||||||
|
Gross margin
|
170,536
|
|
63.6
|
|
128,647
|
|
65.0
|
|
101,548
|
|
61.7
|
|
||||||||
|
Operating expenses:
|
||||||||||||||||||||
|
Sales, general and administrative
|
108,076
|
|
40.3
|
|
69,698
|
|
35.2
|
|
54,158
|
|
32.9
|
|
||||||||
|
Research and development
|
30,609
|
|
11.4
|
|
23,614
|
|
11.9
|
|
14,885
|
|
9.0
|
|
||||||||
|
Total operating expenses
|
138,685
|
|
51.7
|
|
93,312
|
|
47.2
|
|
69,043
|
|
42.0
|
|
||||||||
|
Income from operations
|
31,851
|
|
11.9
|
|
35,335
|
|
17.9
|
|
32,505
|
|
19.8
|
|
||||||||
|
Interest and other income (expense), net
|
(354
|
)
|
(0.1
|
)
|
26
|
|
—
|
|
(194
|
)
|
(0.1
|
)
|
||||||||
|
Income before provision for income taxes
|
31,497
|
|
11.7
|
|
35,361
|
|
17.9
|
|
32,311
|
|
19.6
|
|
||||||||
|
Provision for income taxes
|
14,200
|
|
5.3
|
|
15,428
|
|
7.8
|
|
12,393
|
|
7.5
|
|
||||||||
|
Net income
|
$
|
17,297
|
|
6.4
|
%
|
$
|
19,933
|
|
10.1
|
%
|
$
|
19,918
|
|
12.1
|
%
|
|||||
Net sales to the U.S. and other countries are summarized as follows (dollars in thousands):
|
|
Year Ended December 31,
|
|||||||||||||||||||
|
|
2016
|
2015
|
2014
|
|||||||||||||||||
|
United States
|
$
|
218,757
|
|
81.6
|
%
|
$
|
161,803
|
|
81.8
|
%
|
$
|
132,205
|
|
80.4
|
%
|
|||||
|
Other Countries
|
49,488
|
|
18.4
|
|
36,089
|
|
18.2
|
|
32,320
|
|
19.6
|
|
||||||||
|
Total
|
$
|
268,245
|
|
100.0
|
%
|
$
|
197,892
|
|
100.0
|
%
|
$
|
164,525
|
|
100.0
|
%
|
|||||
The Company’s operations are comprised of two reportable segments: the sale of CEWs, accessories and other related products and services (the “TASER Weapons” segment); and the Axon business, focused on devices, wearables, applications, cloud and mobile products (the "Axon" segment). Within the Axon segment, the Company includes only revenues and costs attributable to that segment which include: costs of sales for both products and services, direct labor, selling expense for the sales team, product management and marketing expenses, trade shows and related expenses, finance and accounting expenses, and research and development for products included, or to be included, within the Axon segment. All other costs are included in the TASER Weapons segment. The chief operating decision maker does not review assets by segment as part of the financial information provided; therefore, no asset information is provided in the following tables.
26
Net Sales - For the Years Ended December 31,
2016
and
2015
Net sales by product line were as follows for the years ended December 31,
2016
and
2015
(dollars in thousands):
|
|
Year Ended December 31,
|
Dollar
Change
|
Percent
Change
|
|||||||||||||||||
|
|
2016
|
2015
|
||||||||||||||||||
|
TASER Weapons segment:
|
||||||||||||||||||||
|
TASER X26P
|
$
|
72,490
|
|
27.0
|
%
|
$
|
55,969
|
|
28.3
|
%
|
$
|
16,521
|
|
29.5
|
%
|
|||||
|
TASER X2
|
52,665
|
|
19.6
|
|
42,746
|
|
21.6
|
|
9,919
|
|
23.2
|
|
||||||||
|
TASER X26
|
6,372
|
|
2.4
|
|
7,337
|
|
3.7
|
|
(965
|
)
|
(13.2
|
)
|
||||||||
|
TASER Pulse and Bolt
|
3,580
|
|
1.3
|
|
2,146
|
|
1.1
|
|
1,434
|
|
66.8
|
|
||||||||
|
Single cartridges
|
52,305
|
|
19.5
|
|
41,674
|
|
21.1
|
|
10,631
|
|
25.5
|
|
||||||||
|
Extended warranties including TAP
|
9,880
|
|
3.7
|
|
7,402
|
|
3.7
|
|
2,478
|
|
33.5
|
|
||||||||
|
Other
|
5,352
|
|
2.0
|
|
5,101
|
|
2.6
|
|
251
|
|
4.9
|
|
||||||||
|
TASER Weapons segment
|
202,644
|
|
75.5
|
|
162,375
|
|
82.1
|
|
40,269
|
|
24.8
|
|
||||||||
|
Axon segment:
|
|
|
|
|
|
|
|
|
|
|||||||||||
|
Axon Body
|
12,911
|
|
4.8
|
|
4,029
|
|
2.0
|
|
8,882
|
|
220.5
|
|
||||||||
|
Axon Flex
|
5,323
|
|
2.0
|
|
6,880
|
|
3.5
|
|
(1,557
|
)
|
(22.6
|
)
|
||||||||
|
Axon Dock
|
7,422
|
|
2.8
|
|
4,022
|
|
2.0
|
|
3,400
|
|
84.5
|
|
||||||||
|
Evidence.com
|
29,260
|
|
10.9
|
|
11,765
|
|
5.9
|
|
17,495
|
|
148.7
|
|
||||||||
|
TASER Cam
|
4,888
|
|
1.8
|
|
5,746
|
|
2.9
|
|
(858
|
)
|
(14.9
|
)
|
||||||||
|
Extended warranties including TAP
|
3,710
|
|
1.4
|
|
1,794
|
|
0.9
|
|
1,916
|
|
106.8
|
|
||||||||
|
Other
|
2,087
|
|
0.8
|
|
1,281
|
|
0.6
|
|
806
|
|
62.9
|
|
||||||||
|
Axon segment
|
65,601
|
|
24.5
|
|
35,517
|
|
17.9
|
|
30,084
|
|
84.7
|
|
||||||||
|
Total net sales
|
$
|
268,245
|
|
100.0
|
%
|
$
|
197,892
|
|
100.0
|
%
|
$
|
70,353
|
|
35.6
|
|
|||||
Net unit sales by product line were as follows:
|
|
Year Ended December 31,
|
||||||||||
|
2016
|
2015
|
Unit
Change
|
Percent
Change
|
||||||||
|
TASER X26P
|
79,218
|
|
62,383
|
|
16,835
|
|
27.0
|
%
|
|||
|
TASER X2
|
47,700
|
|
38,050
|
|
9,650
|
|
25.4
|
|
|||
|
TASER X26
|
2,655
|
|
4,928
|
|
(2,273
|
)
|
(46.1
|
)
|
|||
|
TASER Pulse and Bolt
|
9,549
|
|
8,121
|
|
1,428
|
|
17.6
|
|
|||
|
Cartridges
|
1,979,051
|
|
1,694,450
|
|
284,601
|
|
16.8
|
|
|||
|
Axon Body
|
66,154
|
|
17,522
|
|
48,632
|
|
277.5
|
|
|||
|
Axon Flex
|
14,173
|
|
18,823
|
|
(4,650
|
)
|
(24.7
|
)
|
|||
|
Axon Dock
|
16,983
|
|
6,979
|
|
10,004
|
|
143.3
|
|
|||
|
TASER Cam
|
9,566
|
|
11,634
|
|
(2,068
|
)
|
(17.8
|
)
|
|||
Net sales were
$268.2 million
and
$197.9 million
for the years ended December 31,
2016
and
2015
, respectively, an increase of
$70.4 million
or
35.6%
. Net sales for the TASER Weapons segment were
$202.6 million
and
$162.4 million
for the years ended December 31,
2016
and
2015
, respectively, an increase of
$40.3 million
or
24.8%
. Net sales for the Axon segment were
$65.6 million
and
$35.5 million
for the years ended December 31,
2016
and
2015
, respectively, an increase of
$30.1 million
or
84.7%
. International sales were
$49.5 million
in
2016
compared to
$36.1 million
in
2015
, an increase of
37.1%
.
The increase in net sales for
2016
compared to
2015
in the TASER Weapons segment was primarily driven by the Company's ability to increase the frequency of upgrades through trade-in programs along with increased demand for the Company's installment payment plans, the Officer Safety Plan ("OSP") and TASER 60. These programs allow customers to pay for hardware and services
27
over an extended contractual life, which is typically five years. In the Axon segment, the increase in net sales was driven by the continued adoption of the Axon on-officer cameras and Evidence.com application in the law enforcement markets.
To gain more immediate feedback regarding activity for Axon products and Evidence.com services, we also review bookings for these products. We consider bookings to be a statistical measure defined as the sales contract value (not invoiced sales), net of cancellations, placed in the relevant fiscal period, regardless of when the products or services ultimately will be provided. Some bookings will be invoiced in subsequent years. Due to municipal government funding rules, certain of the future year amounts included in bookings are subject to budget appropriation or other contract cancellation clauses. Although TASER has entered into contracts for the delivery of products and services in the future and anticipates the contracts will be completed, if agencies do not appropriate money in future year budgets or enact a cancellation clause, revenue associated with these bookings will not ultimately be recognized, resulting in a future reduction to bookings. Bookings related to Evidence.com and Axon products and services, net of cancellations, increased to
$254.1 million
during
2016
, compared to
$135.1 million
in
2015
, an increase of
88.0%
.
The chart below illustrates the Company's quarterly Axon bookings for each of the previous six fiscal quarters (in thousands):
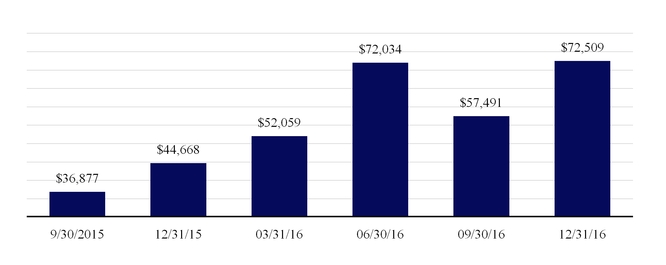
28
Net Sales - Three Months Ended December 31, 2016 Compared to September 30, 2016
Net sales by product line were as follows for the three months ended December 31,
2016
and September 30, 2016 (dollars in thousands):
|
Three Months Ended
December 31, 2016
|
Three Months Ended
September 30, 2016
|
Dollar
Change |
Percent
Change |
|||||||||||||||||
|
TASER Weapons segment:
|
||||||||||||||||||||
|
TASER X26P
|
$
|
20,233
|
|
24.7
|
%
|
$
|
18,943
|
|
26.4
|
%
|
$
|
1,290
|
|
6.8
|
%
|
|||||
|
TASER X2
|
15,529
|
|
18.9
|
|
13,514
|
|
18.8
|
|
2,015
|
|
14.9
|
|
||||||||
|
TASER X26
|
2,042
|
|
2.5
|
|
1,549
|
|
2.2
|
|
493
|
|
31.8
|
|
||||||||
|
TASER Pulse and Bolt
|
944
|
|
1.2
|
|
1,039
|
|
1.4
|
|
(95
|
)
|
(9.1
|
)
|
||||||||
|
Single cartridges
|
15,292
|
|
18.6
|
|
13,898
|
|
19.3
|
|
1,394
|
|
10.0
|
|
||||||||
|
Extended warranties including TAP
|
2,778
|
|
3.4
|
|
2,645
|
|
3.7
|
|
133
|
|
5.0
|
|
||||||||
|
Other
|
1,519
|
|
1.9
|
|
1,350
|
|
1.9
|
|
169
|
|
12.5
|
|
||||||||
|
TASER Weapons segment
|
58,337
|
|
71.1
|
|
52,938
|
|
73.6
|
|
5,399
|
|
10.2
|
|
||||||||
|
Axon segment:
|
||||||||||||||||||||
|
Axon Body
|
5,694
|
|
6.9
|
|
3,540
|
|
4.9
|
|
2,154
|
|
60.8
|
|
||||||||
|
Axon Flex
|
564
|
|
0.7
|
|
2,316
|
|
3.2
|
|
(1,752
|
)
|
(75.6
|
)
|
||||||||
|
Axon Dock
|
2,499
|
|
3.0
|
|
2,438
|
|
3.4
|
|
61
|
|
2.5
|
|
||||||||
|
Evidence.com
|
11,239
|
|
13.7
|
|
8,544
|
|
11.9
|
|
2,695
|
|
31.5
|
|
||||||||
|
TASER Cam
|
1,577
|
|
1.9
|
|
696
|
|
1.0
|
|
881
|
|
126.6
|
|
||||||||
|
Extended warranties including TAP
|
1,276
|
|
1.6
|
|
1,015
|
|
1.4
|
|
261
|
|
25.7
|
|
||||||||
|
Other
|
891
|
|
1.1
|
|
395
|
|
0.5
|
|
496
|
|
125.6
|
|
||||||||
|
Axon segment
|
23,740
|
|
28.9
|
|
18,944
|
|
26.4
|
|
4,796
|
|
25.3
|
|
||||||||
|
Total net sales
|
$
|
82,077
|
|
100.0
|
%
|
$
|
71,882
|
|
100.0
|
%
|
$
|
10,195
|
|
14.2
|
|
|||||
Net unit sales by product line were as follows:
|
Three Months Ended
|
|||||||||||
|
12/31/2016
|
9/30/2016
|
Unit
Change |
Percent
Change |
||||||||
|
TASER X26P
|
20,833
|
|
23,259
|
|
(2,426
|
)
|
(10.4
|
)%
|
|||
|
TASER X2
|
13,003
|
|
12,481
|
|
522
|
|
4.2
|
|
|||
|
TASER X26
|
769
|
|
365
|
|
404
|
|
110.7
|
|
|||
|
TASER Pulse and Bolt
|
3,027
|
|
1,936
|
|
1,091
|
|
56.4
|
|
|||
|
Cartridges
|
554,395
|
|
544,671
|
|
9,724
|
|
1.8
|
|
|||
|
Axon Body
|
25,177
|
|
25,093
|
|
84
|
|
0.3
|
|
|||
|
Axon Flex
|
3,147
|
|
4,961
|
|
(1,814
|
)
|
(36.6
|
)
|
|||
|
Axon Dock
|
5,747
|
|
6,432
|
|
(685
|
)
|
(10.6
|
)
|
|||
|
TASER Cam
|
3,106
|
|
1,323
|
|
1,783
|
|
134.8
|
|
|||
Net sales were
$82.1 million
and
$71.9 million
for the three months ended December 31, 2016 and September 30, 2016, respectively, an increase of
$10.2 million
or
14.2%
. Net sales for the TASER Weapons segment were
$58.3 million
and
$52.9 million
for the three months ended December 31, 2016 and September 30, 2016, respectively, an increase of
$5.4 million
or
10.2%
. Net sales for the Axon segment were
$23.7 million
and
$18.9 million
for the three months ended December 31, 2016 and September 30, 2016, respectively, an increase of
$4.8 million
or
25.3%
. International sales were
$18.6 million
in for the three months ended December 31,
2016
compared to $11.3 million for the three months ended September 30, 2016, an increase of $7.2 million or 63.9%.
29
The increase in net sales in the TASER Weapons segment on a quarterly sequential basis was primarily driven by the Company's ability to increase the frequency of upgrades through trade-in programs along the increased demand in the Company's installment payment plans, OSP and TASER 60. Additionally, revenues in the fourth quarter are historically the highest of the fiscal year due to the expiration of budget appropriations which also contributed to the sequential increase.
During the fourth quarter of 2016, the Company publicly announced the introduction of its next generation point of view camera, Flex 2. This introduction led to an increase in bookings for the quarter ended December 31, 2016 as compared to September 30, 2016, as many agencies placed orders for the new model, but this adversely impacted recognized revenues, as many agencies opted to order Flex 2 instead of the original Flex units. The Company continued to receive increased orders for its Axon Body 2 cameras due to continued adoption by both domestic and international agencies. The Company also continued to experience sequential revenue increases due to increased users on its Axon platform.
Net Sales - For the Years Ended December 31,
2015
and
2014
Net sales by product line were as follows for the years ended December 31,
2015
and
2014
(dollars in thousands):
|
|
Year Ended December 31,
|
Dollar
Change
|
Percent
Change
|
|||||||||||||||||
|
|
2015
|
2014
|
||||||||||||||||||
|
TASER Weapons segment:
|
||||||||||||||||||||
|
TASER X26P
|
$
|
55,969
|
|
28.3
|
%
|
$
|
43,512
|
|
26.4
|
%
|
$
|
12,457
|
|
28.6
|
%
|
|||||
|
TASER X2
|
42,746
|
|
21.6
|
|
28,774
|
|
17.5
|
|
13,972
|
|
48.6
|
|
||||||||
|
TASER X26
|
7,337
|
|
3.7
|
|
18,712
|
|
11.4
|
|
(11,375
|
)
|
(60.8
|
)
|
||||||||
|
TASER Pulse and Bolt
|
2,146
|
|
1.1
|
|
2,084
|
|
1.3
|
|
62
|
|
3.0
|
|
||||||||
|
Single cartridges
|
41,674
|
|
21.1
|
|
38,539
|
|
23.4
|
|
3,135
|
|
8.1
|
|
||||||||
|
Extended warranties including TAP
|
7,402
|
|
3.7
|
|
6,024
|
|
3.7
|
|
1,378
|
|
22.9
|
|
||||||||
|
Other
|
5,101
|
|
2.6
|
|
7,968
|
|
4.8
|
|
(2,867
|
)
|
(36.0
|
)
|
||||||||
|
TASER Weapons segment
|
162,375
|
|
82.1
|
|
145,613
|
|
88.5
|
|
16,762
|
|
11.5
|
|
||||||||
|
Axon segment:
|
||||||||||||||||||||
|
Axon Body
|
4,029
|
|
2.0
|
|
3,404
|
|
2.1
|
|
625
|
|
18.4
|
|
||||||||
|
Axon Flex
|
6,880
|
|
3.5
|
|
3,981
|
|
2.4
|
|
2,899
|
|
72.8
|
|
||||||||
|
Axon Dock
|
4,022
|
|
2.0
|
|
1,719
|
|
1.0
|
|
2,303
|
|
134.0
|
|
||||||||
|
Evidence.com
|
11,765
|
|
5.9
|
|
4,039
|
|
2.5
|
|
7,726
|
|
191.3
|
|
||||||||
|
TASER Cam
|
5,746
|
|
2.9
|
|
4,674
|
|
2.8
|
|
1,072
|
|
22.9
|
|
||||||||
|
Extended warranties including TAP
|
1,794
|
|
0.9
|
|
—
|
|
—
|
|
1,794
|
|
*
|
|
||||||||
|
Other
|
1,281
|
|
0.6
|
|
1,095
|
|
0.7
|
|
186
|
|
17.0
|
|
||||||||
|
Axon segment
|
35,517
|
|
17.9
|
|
18,912
|
|
11.5
|
|
16,605
|
|
87.8
|
|
||||||||
|
Total net sales
|
$
|
197,892
|
|
100.0
|
%
|
$
|
164,525
|
|
100.0
|
%
|
$
|
33,367
|
|
20.3
|
|
|||||
30
Net unit sales by product line were as follows:
|
|
Year Ended December 31,
|
||||||||||
|
2015
|
2014
|
Unit
Change
|
Percent
Change
|
||||||||
|
TASER X26P
|
62,383
|
|
51,283
|
|
11,100
|
|
21.6
|
%
|
|||
|
TASER X2
|
38,050
|
|
26,901
|
|
11,149
|
|
41.4
|
|
|||
|
TASER X26
|
4,928
|
|
17,770
|
|
(12,842
|
)
|
(72.3
|
)
|
|||
|
TASER Pulse and Bolt
|
8,121
|
|
7,249
|
|
872
|
|
12.0
|
|
|||
|
Cartridges
|
1,694,450
|
|
1,618,117
|
|
76,333
|
|
4.7
|
|
|||
|
Axon Flex
|
18,823
|
|
10,034
|
|
8,789
|
|
87.6
|
|
|||
|
Axon Body
|
17,522
|
|
13,219
|
|
4,303
|
|
32.6
|
|
|||
|
Axon Dock
|
6,979
|
|
4,219
|
|
2,760
|
|
65.4
|
|
|||
|
TASER Cam
|
11,634
|
|
9,303
|
|
2,331
|
|
25.1
|
|
|||
Net sales were $197.9 million and $164.5 million for the years ended December 31, 2015 and 2014, respectively, an increase of $33.4 million or 20.3%. Net sales for the TASER Weapons segment were $162.4 million and $145.6 million for the years ended December 31, 2015 and 2014, respectively, an increase of $16.8 million or 11.5%. Net sales for the Axon segment were $35.5 million and $18.9 million for the years ended December 31, 2015 and 2014, respectively, an increase of $16.6 million or 87.8%.
The increase in net sales for 2015 compared to 2014 in the TASER Weapons segment was primarily driven by increased adoption of the TASER X26P and X2 Smart Weapons, as customers upgrade their legacy CEWs to the new models. The Company has also introduced upgrade programs to incentivize agencies to replace older CEWs with the Company's new Smart Weapons. In the Axon segment, the increase in net sales was driven by the continued adoption of the Axon on-officer cameras and Evidence.com application in the law enforcement markets. International sales were $36.1 million in 2015 compared to $32.3 million in 2014, an increase of 11.7%.
Cost of Products Sold and Services Delivered
(dollars in thousands)
|
|
Year Ended December 31,
|
Year Ended December 31,
|
|||||||||||||||||||||||||||
|
|
|
Dollar
Change
|
Percent
Change
|
|
Dollar
Change |
Percent
Change |
|||||||||||||||||||||||
|
|
2016
|
2015
|
2015
|
2014
|
|||||||||||||||||||||||||
|
TASER Weapons segment:
|
|||||||||||||||||||||||||||||
|
Cost of products sold
|
$
|
61,930
|
|
$
|
48,821
|
|
$
|
13,109
|
|
26.9
|
%
|
$
|
48,821
|
|
$
|
47,680
|
|
$
|
1,141
|
|
2.4
|
%
|
|||||||
|
Cost as % of sales
|
30.6
|
|
30.1
|
|
30.1
|
|
32.7
|
|
|||||||||||||||||||||
|
Axon segment:
|
|||||||||||||||||||||||||||||
|
Cost of products sold
|
29,606
|
|
16,201
|
|
13,405
|
|
82.7
|
|
16,201
|
|
13,233
|
|
2,968
|
|
22.4
|
|
|||||||||||||
|
Cost of services delivered
|
6,173
|
|
4,223
|
|
1,950
|
|
46.2
|
|
4,223
|
|
2,064
|
|
2,159
|
|
104.6
|
|
|||||||||||||
|
Total cost of products sold and services delivered
|
35,779
|
|
20,424
|
|
15,355
|
|
75.2
|
|
20,424
|
|
15,297
|
|
5,127
|
|
33.5
|
|
|||||||||||||
|
Cost as % of sales
|
54.5
|
|
57.5
|
|
57.5
|
|
80.9
|
|
|||||||||||||||||||||
|
Total cost of products sold and services delivered
|
$
|
97,709
|
|
$
|
69,245
|
|
$
|
28,464
|
|
41.1
|
|
$
|
69,245
|
|
$
|
62,977
|
|
$
|
6,268
|
|
10.0
|
|
|||||||
|
Cost as % of sales
|
36.4
|
|
35.0
|
|
35.0
|
|
38.3
|
|
|||||||||||||||||||||
Cost of products sold and services delivered was
$97.7 million
and
$69.2 million
for the years ended December 31,
2016
and
2015
, respectively, an increase of
$28.5 million
or
41.1%
. As a percentage of net sales, cost of products sold and services delivered increased to
36.4%
in
2016
compared to
35.0%
in
2015
. Within the TASER Weapons segment, cost of products sold increased
$13.1 million
, or
26.9%
, to
$61.9 million
in
2016
, compared to
$48.8 million
in
2015
, and remained relatively consistent as a percent of sales at
30.6%
from
30.1%
. The overall increase in cost of products sold was attributable to higher unit sales.
Within the Axon segment, cost of products sold and services delivered was
$35.8 million
, an increase of
$15.4 million
, or
75.2%
from
2015
. As a percentage of net sales, cost of products sold and services delivered decreased to
54.5%
in
2016
from
57.5%
in
2015
. The increase in cost of products sold and services delivered was driven by continued growth, increased data storage
31
costs as more agencies utilize Evidence.com, as well as increased costs for our professional services team. The decrease as a percentage of sales was primarily driven by improvements in Evidence.com service margins.
Cost of products sold and services delivered was $69.2 million and $63.0 million for the years ended December 31, 2015 and 2014, respectively, an increase of $6.3 million, or 10.0%. As a percentage of net sales, cost of products sold and services delivered decreased to 35.0% in 2015 compared to 38.3% in 2014. Within the TASER Weapons segment, cost of products sold increased $1.1 million, or 2.4%, to $48.8 million in 2015, compared to $47.7 million in 2014, and decreased as a percent of sales to 30.1% from 32.7%. The overall increase in cost of products sold was attributable to higher unit sales, and the decrease of cost as a percentage of sales was primarily attributable to higher average selling prices and increased leverage of fixed operating costs.
Within the Axon segment, cost of products sold and services delivered were $20.4 million, an increase of $5.1 million, or 33.5% from 2014. As a percentage of net sales, cost of products sold and services delivered decreased to 57.5% in 2015 from 80.9% in 2014. The increase in cost of products sold and services delivered was driven by growing sales in this segment, increased data storage costs as more agencies utilize Evidence.com, as well as increased costs for our professional services team. The decrease in cost of products sold and services delivered as a percentage of sales was driven by higher sales and by improvements to our Evidence.com margins.
Gross Margin
(dollars in thousands)
|
|
Year Ended December 31,
|
Year Ended December 31,
|
|||||||||||||||||||||||||||
|
|
|
Dollar
Change
|
Percent
Change
|
|
Dollar
Change
|
Percent
Change
|
|||||||||||||||||||||||
|
|
2016
|
2015
|
2015
|
2014
|
|||||||||||||||||||||||||
|
TASER Weapons segment
|
$
|
140,714
|
|
$
|
113,554
|
|
$
|
27,160
|
|
23.9
|
%
|
$
|
113,554
|
|
$
|
97,933
|
|
$
|
15,621
|
|
16.0
|
%
|
|||||||
|
Axon segment
|
29,822
|
|
15,093
|
|
14,729
|
|
97.6
|
|
15,093
|
|
3,615
|
|
11,478
|
|
317.5
|
|
|||||||||||||
|
Total gross margin
|
$
|
170,536
|
|
$
|
128,647
|
|
$
|
41,889
|
|
32.6
|
|
$
|
128,647
|
|
$
|
101,548
|
|
$
|
27,099
|
|
26.7
|
|
|||||||
|
Gross margin as % of sales
|
63.6
|
|
65.0
|
|
65.0
|
|
61.7
|
|
|||||||||||||||||||||
Gross margin increased
$41.9 million
to
$170.5 million
for
2016
compared to
$128.6 million
for
2015
. As a percentage of net sales, gross margin decreased to
63.6%
for
2016
from
65.0%
for
2015
. The decrease in gross margin as a percentage of sales was due primarily to a change in product mix, as lower margin Axon sales became a greater percentage of the consolidated total. As a percentage of net sales, gross margin for the TASER Weapons segment was relatively consistent at
69.4%
and
69.9%
for
2016
and
2015
, respectively, while the same measure for these years for the Axon segment were
45.5%
and
42.5%
, respectively. The improvement in Axon segment gross margin is primarily attributable to higher service margins due to increased users on the Evidence.com platform.
Gross margin increased $27.1 million to $128.6 million for 2015 compared to $101.5 million for 2014. As a percentage of net sales, gross margin increased to 65.0% for 2015 compared to 61.7% for 2014. The increase is attributable to stronger margins in both the TASER Weapons and Axon segments. As a percentage of net sales, gross margin for the TASER Weapons segment was 69.9% and 67.3% for 2015 and 2014, respectively, while the same measure for these years for the Axon segment were 42.5% and 19.1%, respectively. The Company experienced improvements in margins for the TASER Weapons and Axon segments individually, due to higher average selling prices and continued leverage of fixed operating costs.
32
Sales, General and Administrative Expenses
Sales, general and administrative (“SG&A”) expenses were comprised of the following for
2016
and
2015
(dollars in thousands):
|
|
Year Ended December 31,
|
Dollar
Change
|
Percent
Change
|
|||||||||||
|
|
2016
|
2015
|
||||||||||||
|
Salaries, benefits and bonus
|
$
|
43,058
|
|
$
|
25,032
|
|
$
|
18,026
|
|
72.0
|
%
|
|||
|
Stock-based compensation
|
5,707
|
|
4,299
|
|
1,408
|
|
32.8
|
|
||||||
|
Professional, consulting and lobbying
|
19,321
|
|
13,165
|
|
6,156
|
|
46.8
|
|
||||||
|
Sales and marketing
|
15,132
|
|
10,776
|
|
4,356
|
|
40.4
|
|
||||||
|
Travel and meals
|
8,970
|
|
5,649
|
|
3,321
|
|
58.8
|
|
||||||
|
Other
|
15,888
|
|
10,777
|
|
5,111
|
|
47.4
|
|
||||||
|
Total sales, general and administrative expenses
|
$
|
108,076
|
|
$
|
69,698
|
|
$
|
38,378
|
|
55.1
|
|
|||
|
Sales, general, and administrative as a percentage of net sales
|
40.3
|
%
|
35.2
|
%
|
||||||||||
Sales, general and administrative expenses were
$108.1 million
and
$69.7 million
for the years ended December 31,
2016
and
2015
, respectively, an increase of
$38.4 million
, or
55.1%
. As a percentage of total net sales, SG&A expenses increased to
40.3%
for
2016
compared to
35.2%
for
2015
.
SG&A by type and by segment were as follows for the years ended December 31,
2016
and
2015
(dollars in thousands):
|
|
Year Ended December 31,
|
Dollar Change
|
Percent Change
|
|||||||||||||||||
|
|
2016
|
2015
|
||||||||||||||||||
|
TASER Weapons segment:
|
||||||||||||||||||||
|
Salaries, benefits and bonus
|
$
|
24,534
|
|
22.7
|
%
|
$
|
16,767
|
|
24.1
|
%
|
$
|
7,767
|
|
46.3
|
%
|
|||||
|
Stock-based compensation
|
3,339
|
|
3.1
|
|
3,187
|
|
4.6
|
|
152
|
|
4.8
|
|
||||||||
|
Professional, consulting and lobbying
|
10,128
|
|
9.4
|
|
10,258
|
|
14.7
|
|
(130
|
)
|
(1.3
|
)
|
||||||||
|
Sales and marketing
|
8,305
|
|
7.7
|
|
5,411
|
|
7.8
|
|
2,894
|
|
53.5
|
|
||||||||
|
Travel and meals
|
4,277
|
|
4.0
|
|
3,089
|
|
4.4
|
|
1,188
|
|
38.5
|
|
||||||||
|
Other
|
13,034
|
|
12.1
|
|
8,928
|
|
12.8
|
|
4,106
|
|
46.0
|
|
||||||||
|
TASER Weapons segment
|
63,617
|
|
58.9
|
|
47,640
|
|
68.4
|
|
15,977
|
|
33.5
|
|
||||||||
|
Axon segment:
|
||||||||||||||||||||
|
Salaries, benefits and bonus
|
18,524
|
|
17.1
|
|
8,265
|
|
11.9
|
|
10,259
|
|
124.1
|
|
||||||||
|
Stock-based compensation
|
2,368
|
|
2.2
|
|
1,112
|
|
1.6
|
|
1,256
|
|
112.9
|
|
||||||||
|
Professional, consulting and lobbying
|
9,193
|
|
8.5
|
|
2,907
|
|
4.2
|
|
6,286
|
|
216.2
|
|
||||||||
|
Sales and marketing
|
6,827
|
|
6.3
|
|
5,365
|
|
7.7
|
|
1,462
|
|
27.3
|
|
||||||||
|
Travel and meals
|
4,693
|
|
4.3
|
|
2,560
|
|
3.7
|
|
2,133
|
|
83.3
|
|
||||||||
|
Other
|
2,854
|
|
2.6
|
|
1,849
|
|
2.7
|
|
1,005
|
|
54.4
|
|
||||||||
|
Axon segment
|
44,459
|
|
41.1
|
|
22,058
|
|
31.6
|
|
22,401
|
|
101.6
|
|
||||||||
|
Total sales, general and administrative expenses
|
$
|
108,076
|
|
100.0
|
%
|
$
|
69,698
|
|
100.0
|
%
|
$
|
38,378
|
|
55.1
|
|
|||||
Within the TASER Weapons segment, SG&A increased
$16.0 million
, or
33.5%
, to
$63.6 million
from
$47.6 million
in
2015
. Salaries, benefits, bonus and stock-based compensation in the TASER Weapons increased approximately $7.9 million in
2016
compared to
2015
. This increase was primarily attributable to the Company's efforts to build the corporate infrastructure to facilitate future growth in departments such as supply chain, legal, finance and information technology. The increase in travel and meals was primarily attributable to the growth in the direct sales teams both domestically and internationally. The increase in sales and marketing of $2.9 million was primarily attributable to higher commissions of $3.2 million partially offset by a decrease in marketing related costs partially due to lower spending at the 2016 International Association of Chiefs of Police conference as compared to 2015. The increase in other expenses was made up primarily of $1.2 million in higher computer related costs, $0.3 million of higher rent expense, and $2.0 million of litigation costs incurred, including resolution expenses, that were not incurred during the same period in 2015.
33
Within the Axon segment, SG&A increased
$22.4 million
, or
101.6%
, to
$44.5 million
in
2016
in comparison to the prior year. Salaries, benefits, bonus and stock-based compensation in the Axon segment increased $11.5 million as the Company continued to hire additional engineering, product management personnel, sales and marketing personnel and general support staff to further expand upon existing product offerings as well as the development of new apps and cloud technologies. The increase in travel and meals was primarily attributable to the growth in the direct sales teams both domestically and internationally. Of the increase in professional, consulting and lobbying, $4.1 million represented primarily increased lobbying fees aimed at securing long-term body-worn camera and service contracts, $0.8 million of increased legal costs primarily attributable to the ongoing Digital Ally lawsuit, and $0.6 million related to increased patent and trademark costs. The increase in sales and marketing of $1.5 million was primarily attributable to higher commissions of $2.4 million partially offset by a decrease of $0.9 million in marketing related costs partially due to lower spending at the 2016 International Association of Chiefs of Police conference as compared to 2015.
The Company expects to see increases in SG&A in 2017 compared to
2016
as it plans to make additional investments in customer-facing positions both domestically and internationally along with increased investments in sales and marketing.
Of the increase in SG&A above, there was increased expense associated with customer-facing positions, including: salaries, benefits, bonus and stock-based compensation, as well as sales commissions, which are included in the sales and marketing line item in the table above. Positions were added throughout the year, with the following customer-facing headcount as of the end of each year:
|
|
As of December 31,
|
|||||||
|
|
2016
|
2015
|
2014
|
|||||
|
TASER Weapons sales representatives
|
26
|
|
18
|
|
12
|
|
||
|
Axon sales representatives
|
44
|
|
27
|
|
16
|
|
||
|
International sales representatives
(i)
|
11
|
|
13
|
|
5
|
|
||
|
Sales support staff
|
31
|
|
20
|
|
8
|
|
||
|
Telesales
|
42
|
|
27
|
|
17
|
|
||
|
Other customer-facing roles
|
59
|
|
33
|
|
20
|
|
||
|
Total customer-facing roles
|
213
|
|
138
|
|
78
|
|
||
(i)
In certain international markets where the Company does not have a legal entity, it generally engages sales managers as consultants. These expenses are reflected in the consulting and lobbying caption within selling, general and administrative expenses.
Sales, general and administrative expenses were comprised of the following for
2015
and
2014
(dollars in thousands):
|
|
Year Ended December 31,
|
Dollar
Change
|
Percent
Change
|
|||||||||||
|
|
2015
|
2014
|
||||||||||||
|
Salaries, benefits and bonus
|
$
|
25,032
|
|
$
|
18,179
|
|
$
|
6,853
|
|
37.7
|
%
|
|||
|
Stock-based compensation
|
4,299
|
|
3,558
|
|
741
|
|
20.8
|
|
||||||
|
Professional, consulting and lobbying
|
13,165
|
|
8,561
|
|
4,604
|
|
53.8
|
|
||||||
|
Sales and marketing
|
10,776
|
|
8,124
|
|
2,652
|
|
32.6
|
|
||||||
|
Travel and meals
|
5,649
|
|
4,778
|
|
871
|
|
18.2
|
|
||||||
|
Other
|
10,777
|
|
10,958
|
|
(181
|
)
|
(1.7
|
)
|
||||||
|
Total sales, general and administrative expenses
|
$
|
69,698
|
|
$
|
54,158
|
|
$
|
15,540
|
|
28.7
|
|
|||
|
Sales, general, and administrative as a percentage of net sales
|
35.2
|
%
|
32.9
|
%
|
||||||||||
Sales, general and administrative expenses were
$69.7 million
and
$54.2 million
for the years ended December 31,
2015
and
2014
, respectively, an increase of
$15.5 million
, or
28.7%
. As a percentage of total net sales, SG&A expenses increased to
35.2%
for
2015
compared to
32.9%
for
2014
.
34
SG&A by type and by segment were as follows for the years ended December 31,
2015
and
2014
(dollars in thousands):
|
|
Year Ended December 31,
|
Dollar Change
|
Percent Change
|
|||||||||||||||||
|
|
2015
|
2014
|
||||||||||||||||||
|
TASER Weapons segment:
|
||||||||||||||||||||
|
Salaries, benefits and bonus
|
$
|
16,767
|
|
24.1
|
%
|
$
|
14,522
|
|
26.8
|
%
|
$
|
2,245
|
|
15.5
|
%
|
|||||
|
Stock-based compensation
|
3,187
|
|
4.6
|
|
2,598
|
|
4.8
|
|
589
|
|
22.7
|
|
||||||||
|
Professional, consulting and lobbying
|
10,258
|
|
14.7
|
|
7,381
|
|
13.6
|
|
2,877
|
|
39.0
|
|
||||||||
|
Sales and marketing
|
5,411
|
|
7.8
|
|
4,902
|
|
9.1
|
|
509
|
|
10.4
|
|
||||||||
|
Travel and meals
|
3,089
|
|
4.4
|
|
3,014
|
|
5.6
|
|
75
|
|
2.5
|
|
||||||||
|
Other
|
8,928
|
|
12.8
|
|
10,572
|
|
19.5
|
|
(1,644
|
)
|
(15.6
|
)
|
||||||||
|
TASER Weapons segment
|
47,640
|
|
68.4
|
|
42,989
|
|
79.4
|
|
4,651
|
|
10.8
|
|
||||||||
|
Axon segment:
|
||||||||||||||||||||
|
Salaries, benefits and bonus
|
8,265
|
|
11.9
|
|
3,657
|
|
6.8
|
|
4,608
|
|
126.0
|
|
||||||||
|
Stock-based compensation
|
1,112
|
|
1.6
|
|
960
|
|
1.8
|
|
152
|
|
15.8
|
|
||||||||
|
Professional, consulting and lobbying
|
2,907
|
|
4.2
|
|
1,180
|
|
2.2
|
|
1,727
|
|
146.4
|
|
||||||||
|
Sales and marketing
|
5,365
|
|
7.7
|
|
3,222
|
|
5.9
|
|
2,143
|
|
66.5
|
|
||||||||
|
Travel and meals
|
2,560
|
|
3.7
|
|
1,764
|
|
3.3
|
|
796
|
|
45.1
|
|
||||||||
|
Other
|
1,849
|
|
2.7
|
|
386
|
|
0.7
|
|
1,463
|
|
379.0
|
|
||||||||
|
Axon segment
|
22,058
|
|
31.6
|
|
11,169
|
|
20.6
|
|
10,889
|
|
97.5
|
|
||||||||
|
Total sales, general and administrative expenses
|
$
|
69,698
|
|
100.0
|
%
|
$
|
54,158
|
|
100.0
|
%
|
$
|
15,540
|
|
28.7
|
|
|||||
Within the TASER Weapons segment, SG&A increased $4.7 million, or 10.8%, to $47.6 million from $43.0 million in 2014. Salaries, benefits, bonus and stock-based compensation in the TASER Weapons increased approximately $2.8 million in 2015 compared to 2014. This increase was primarily attributable to the Company's efforts to build out international and direct sales teams internally as well as increased headcount in certain administrative departments to support the overall growth of the entity. On a consolidated basis, legal, professional and accounting expenses were up $0.9 million in 2015 compared to 2014, and most of this increase was allocated to the TASER Weapons segment. Audit and tax compliance costs were up approximately $0.7 million due primarily to increased complexity in the business structure as well as overall growth of the Company. Also included in the increase in legal fees was $0.2 million of costs to secure new patents and trademarks. The increase in sales and marketing was primarily attributable to increased efforts at the 2015 International Association of Chiefs of Police ("IACP") conference as compared to 2014. The Company incurred higher consulting and lobbying expense during 2015 as compared to 2014 increasing $1.8 million to $4.2 million in 2015. The Company also engaged additional international sales consultants during 2015 to drive increased sales in targeted foreign markets. Offsetting these increases was a decrease to other expenses. The decrease in other expense was primarily the result of a litigation settlement in 2014 of $3.3 million as compared to settlements of $0.2 million in 2015.
Within the Axon segment, SG&A increased $10.9 million, or 97.5%, to $22.1 million in 2015 in comparison to the prior year. Salaries, benefits, bonus and stock-based compensation in the Axon segment increased $4.8 million as the Company continued to hire additional engineering, product management personnel, sales and marketing personnel and general support staff to further expand upon existing product offerings as well as the development of new mobile and cloud technologies. Sales and marketing expenses in the Axon segment also increased approximately $2.1 million in comparison to 2014 due primarily to increased commissions on higher sales and increased marketing efforts for Axon technologies. The increase in consulting and lobbying was due to the Axon branding campaign that took place in the third quarter of 2015 as well as increased lobbying and public relations efforts ahead of the IACP conference held in October 2015 as compared to 2014. The increase in the balance of other expenses of $1.5 million during the 2015 as compared 2014 was related to building expenses, including depreciation and amortization, and supplies. Of this amount $0.7 million related to depreciation and amortization of assets acquired in two business combinations affected during 2015.
35
Research and Development Expenses
Research and development ("R&D") expenses were comprised of the following for
2016
and
2015
(dollars in thousands):
|
|
Year Ended December 31,
|
Dollar
Change
|
Percent
Change
|
|||||||||||
|
|
2016
|
2015
|
||||||||||||
|
Salaries, benefits and bonus
|
$
|
17,205
|
|
$
|
13,013
|
|
$
|
4,192
|
|
32.2
|
%
|
|||
|
Stock-based compensation
|
3,320
|
|
2,576
|
|
744
|
|
28.9
|
|
||||||
|
Professional and consulting
|
3,212
|
|
3,835
|
|
(623
|
)
|
(16.2
|
)
|
||||||
|
Sales and marketing
|
919
|
|
63
|
|
856
|
|
1,358.7
|
|
||||||
|
Travel and meals
|
969
|
|
1,034
|
|
(65
|
)
|
(6.3
|
)
|
||||||
|
Other
|
4,984
|
|
3,093
|
|
1,891
|
|
61.1
|
|
||||||
|
Total research and development expenses
|
$
|
30,609
|
|
$
|
23,614
|
|
$
|
6,995
|
|
29.6
|
|
|||
|
Research and development as a percentage of net sales
|
11.4
|
%
|
11.9
|
%
|
||||||||||
Research and development expenses were
$30.6 million
and
$23.6 million
for the years ended December 31,
2016
and
2015
, respectively, an increase of
$7.0 million
, or
29.6%
. As a percentage of net sales, R&D decreased slightly to
11.4%
in
2016
in compared to
11.9%
in
2015
.
R&D by type and by segment were as follows for the years ended December 31,
2016
and
2015
(dollars in thousands):
|
|
Year Ended December 31,
|
Dollar Change
|
Percent Change
|
|||||||||||||||||
|
|
2016
|
2015
|
||||||||||||||||||
|
TASER Weapons segment:
|
||||||||||||||||||||
|
Salaries, benefits and bonus
|
$
|
2,301
|
|
7.5
|
%
|
$
|
1,596
|
|
6.8
|
%
|
$
|
705
|
|
44.2
|
%
|
|||||
|
Stock-based compensation
|
639
|
|
2.1
|
|
394
|
|
1.7
|
|
245
|
|
62.2
|
|
||||||||
|
Professional and consulting
|
1,167
|
|
3.8
|
|
1,196
|
|
5.1
|
|
(29
|
)
|
(2.4
|
)
|
||||||||
|
Sales and marketing
|
6
|
|
—
|
|
18
|
|
0.1
|
|
(12
|
)
|
(66.7
|
)
|
||||||||
|
Travel and meals
|
345
|
|
1.1
|
|
261
|
|
1.1
|
|
84
|
|
32.2
|
|
||||||||
|
Other
|
1,429
|
|
4.7
|
|
1,005
|
|
4.3
|
|
424
|
|
42.2
|
|
||||||||
|
TASER Weapons segment
|
5,887
|
|
19.2
|
|
4,470
|
|
18.9
|
|
1,417
|
|
31.7
|
|
||||||||
|
Axon segment:
|
||||||||||||||||||||
|
Salaries, benefits and bonus
|
14,904
|
|
48.7
|
|
11,417
|
|
48.3
|
|
3,487
|
|
30.5
|
|
||||||||
|
Stock-based compensation
|
2,681
|
|
8.8
|
|
2,182
|
|
9.2
|
|
499
|
|
22.9
|
|
||||||||
|
Professional and consulting
|
2,045
|
|
6.7
|
|
2,639
|
|
11.2
|
|
(594
|
)
|
(22.5
|
)
|
||||||||
|
Sales and marketing
|
913
|
|
3.0
|
|
45
|
|
0.2
|
|
868
|
|
1,928.9
|
|
||||||||
|
Travel and meals
|
624
|
|
2.0
|
|
773
|
|
3.3
|
|
(149
|
)
|
(19.3
|
)
|
||||||||
|
Other
|
3,555
|
|
11.6
|
|
2,088
|
|
8.8
|
|
1,467
|
|
70.3
|
|
||||||||
|
Axon segment
|
24,722
|
|
80.8
|
|
19,144
|
|
81.1
|
|
5,578
|
|
29.1
|
|
||||||||
|
Total research and development expenses
|
$
|
30,609
|
|
100.0
|
%
|
$
|
23,614
|
|
100.0
|
%
|
$
|
6,995
|
|
29.6
|
|
|||||
Within the TASER Weapons segment, R&D expenses increased
$1.4 million
, or
31.7%
, to
$5.9 million
in
2016
. Salaries, benefits, bonus and stock-based compensation in the TASER Weapons increased approximately
$1.0 million
in
2016
compared to
2015
. The increase for
2016
compared to
2015
is primarily driven by additional headcount as the Company continued to invest in the development of new CEW related technologies.
Within the Axon segment, R&D expenses increased
$5.6 million
, or
29.1%
, to
$24.7 million
in
2016
from the prior year. The Company's Axon segment was responsible for approximately
81%
of the overall expenses in R&D. Of the
$5.6 million
increase in R&D for the Axon segment,
$4.0 million
related to salaries and benefits, inclusive of bonus and stock-based compensation. The increase in sales and marketing of
$0.9 million
related to contractual earn-outs for legacy MediaSolv employees, who work in R&D, that are recorded as commissions expense, as they are tied to executed sales contracts. The Company remained focused on growing the Axon segment as it added headcount and external resources to develop new products and services to further advance its scalable cloud-connected device platform. These increases were partially offset by decreases in professional and consulting of
$0.6 million
related primarily to the Company being more selective in the utilization of consultants versus hiring additional internal
36
resources. The biggest portion of the increase in other R&D expenses related to tooling and supplies that made up $0.8 million of the overall increase. The remaining increase was attributable to the overall growth in of the Axon R&D department.
Research and development expenses were comprised of the following for
2015
and
2014
(dollars in thousands):
|
|
Year Ended December 31,
|
Dollar
Change
|
Percent
Change
|
|||||||||||
|
|
2015
|
2014
|
||||||||||||
|
Salaries, benefits and bonus
|
$
|
13,013
|
|
$
|
8,077
|
|
$
|
4,936
|
|
61.1
|
%
|
|||
|
Stock-based compensation
|
2,576
|
|
1,820
|
|
756
|
|
41.5
|
|
||||||
|
Professional and consulting
|
3,835
|
|
1,998
|
|
1,837
|
|
91.9
|
|
||||||
|
Sales and marketing
|
63
|
|
45
|
|
18
|
|
40.0
|
|
||||||
|
Travel and meals
|
1,034
|
|
694
|
|
340
|
|
49.0
|
|
||||||
|
Other
|
3,093
|
|
2,251
|
|
842
|
|
37.4
|
|
||||||
|
Total research and development expenses
|
$
|
23,614
|
|
$
|
14,885
|
|
$
|
8,729
|
|
58.6
|
|
|||
|
Research and development as a percentage of net sales
|
11.9
|
%
|
9.0
|
%
|
||||||||||
Research and development expenses were
$23.6 million
and
$14.9 million
for the years ended December 31,
2015
and
2014
, respectively, an increase of
$8.7 million
, or
58.6%
. As a percentage of net sales, R&D increased to
11.9%
in
2015
in comparison to
9.0%
in
2014
.
R&D by type and by segment were as follows for the years ended December 31,
2015
and
2014
(dollars in thousands):
|
|
Year Ended December 31,
|
Dollar Change
|
Percent Change
|
|||||||||||||||||
|
|
2015
|
2014
|
||||||||||||||||||
|
TASER Weapons segment:
|
||||||||||||||||||||
|
Salaries, benefits and bonus
|
$
|
1,596
|
|
6.8
|
%
|
$
|
1,689
|
|
11.3
|
%
|
$
|
(93
|
)
|
(5.5
|
)%
|
|||||
|
Stock-based compensation
|
394
|
|
1.7
|
|
280
|
|
1.9
|
|
114
|
|
40.7
|
|
||||||||
|
Professional and consulting
|
1,196
|
|
5.1
|
|
730
|
|
4.9
|
|
466
|
|
63.8
|
|
||||||||
|
Sales and marketing
|
18
|
|
0.1
|
|
27
|
|
0.2
|
|
(9
|
)
|
(33.3
|
)
|
||||||||
|
Travel and meals
|
261
|
|
1.1
|
|
223
|
|
1.5
|
|
38
|
|
17.0
|
|
||||||||
|
Other
|
1,005
|
|
4.3
|
|
923
|
|
6.2
|
|
82
|
|
8.9
|
|
||||||||
|
TASER Weapons segment
|
4,470
|
|
18.9
|
|
3,872
|
|
26.0
|
|
598
|
|
15.4
|
|
||||||||
|
Axon segment:
|
||||||||||||||||||||
|
Salaries, benefits and bonus
|
11,417
|
|
48.3
|
|
6,388
|
|
42.9
|
|
5,029
|
|
78.7
|
|
||||||||
|
Stock-based compensation
|
2,182
|
|
9.2
|
|
1,540
|
|
10.3
|
|
642
|
|
41.7
|
|
||||||||
|
Professional and consulting
|
2,639
|
|
11.2
|
|
1,268
|
|
8.5
|
|
1,371
|
|
108.1
|
|
||||||||
|
Sales and marketing
|
45
|
|
0.2
|
|
18
|
|
0.1
|
|
27
|
|
150.0
|
|
||||||||
|
Travel and meals
|
773
|
|
3.3
|
|
471
|
|
3.2
|
|
302
|
|
64.1
|
|
||||||||
|
Other
|
2,088
|
|
8.8
|
|
1,328
|
|
8.9
|
|
760
|
|
57.2
|
|
||||||||
|
Axon segment
|
19,144
|
|
81.1
|
|
11,013
|
|
74.0
|
|
8,131
|
|
73.8
|
|
||||||||
|
Total research and development expenses
|
$
|
23,614
|
|
100.0
|
%
|
$
|
14,885
|
|
100.0
|
%
|
$
|
8,729
|
|
58.6
|
|
|||||
Within the TASER Weapons segment, R&D expenses increased $0.6 million, or 15.4%, to $4.5 million in 2015, which was primarily driven by internal efforts and consulting expenses related to development of future CEW products.
Within the Axon segment, R&D expenses increased $8.1 million, or 73.8%, to $19.1 million in 2015 from the prior year. The increase for 2015 compared to 2014 was primarily driven by additional headcount and higher consulting fees as the Company continued its efforts to launch new product lines and SaaS offerings to strengthen its competitive advantage in these emerging technologies.
37
Interest and Other Income (Expense), Net
Interest and other income (expense), net was
$(0.4) million
for the year ended December 31,
2016
compared to income of
$26,000
and $0.2 million for the years ended December 31,
2015
and
2014
, respectively. Other income and expense amounts for
2016
,
2015
and
2014
consisted primarily of investment interest income and foreign currency transaction adjustments. For the year ended December 31, 2016, interest income of $0.7 million was more than offset by losses on foreign currency of $1.1 million.
Provision for Income Taxes
The provision for income taxes was $14.2 million for the year ended
December 31, 2016
. The effective income tax rate for 2016 was 45.1%. The effect of state income taxes of $0.9 million and the tax effects of intercompany transactions of $0.6 million were offset by a benefit of $1.9 million for research and development credits in the current year. The difference between statutory and foreign tax rates of $1.5 million was largely driven by losses incurred in a foreign entity for which no tax benefit will be realized. In addition, a valuation allowance in the amount of $1.8 million was recorded as of December 31, 2016 related to certain research and development tax credits that may not be utilized prior to expiration and losses in certain foreign jurisdictions in which there is a cumulative loss.
The provision for income taxes was $15.4 million for the year ended December 31, 2015. The effective income tax rate for 2015 was 43.7%. The effect of state income tax of $1.1 million was largely offset by a benefit of $1.0 million of research and development credits in the current year. The difference between statutory and foreign tax rates of $2.4 million was largely driven by losses incurred in a newly formed foreign entity for which no tax benefit will be realized, partially reduced by a tax benefit for newly formed foreign entities for which the statutory tax rate is lower than the U.S. statutory tax rate. In addition, valuation allowance in the amount of $1.2 million was recorded.
The provision for income taxes was $12.4 million for the year ended December 31, 2014. The effective income tax rate for 2014 was 38.4%. The effect of state income tax of $1.4 million was largely offset by a benefit of $0.6 million from incentive stock option deductions as well as $0.5 million of research and development credits in the current year. When an employee exercises ISOs and sells the related stock prior to the end of the mandatory holding period, the associated expense becomes a reduction to the Company’s taxable income.
Net Income
Our net income decreased by
$2.6 million
to
$17.3 million
for the year ended December 31,
2016
compared to
$19.9 million
in
2015
. Net income per basic share was
$0.33
and
$0.32
per diluted share, respectively, for
2016
compared to
$0.37
and
$0.36
per basic and diluted share, respectively, for
2015
.
Our net income was
$19.9 million
for each of the years ended December 31,
2015
and
2014
. Net income per basic and diluted share was
$0.37
and
$0.36
for
2015
, respectively, compared to
$0.38
and
$0.37
per basic and diluted share for
2014
, respectively.
Liquidity and Capital Resources
Summary
As of December 31,
2016
, we had
$40.7 million
of cash and cash equivalents, a decrease of
$18.9 million
from the end of
2015
.
Cash Flows
The following table summarizes our cash flows from operating, investing and financing activities (in thousands):
|
|
Year Ended December 31,
|
||||||||||
|
|
2016
|
2015
|
2014
|
||||||||
|
Operating activities
|
$
|
17,925
|
|
$
|
46,445
|
|
$
|
35,432
|
|
||
|
Investing activities
|
(3,045
|
)
|
(36,009
|
)
|
(24,581
|
)
|
|||||
|
Financing activities
|
(34,661
|
)
|
603
|
|
(4,840
|
)
|
|||||
|
Effect of exchange rate changes on cash and cash equivalents
|
906
|
|
120
|
|
85
|
|
|||||
|
Net increase (decrease) in cash and cash equivalents
|
$
|
(18,875
|
)
|
$
|
11,159
|
|
$
|
6,096
|
|
||
38
Operating activities
Net cash provided by operating activities in
2016
of
$17.9 million
consisted of
$17.3 million
in net income, the net add-back of non-cash income statement items totaling
$8.9 million
and a negative
$8.2 million
net change in operating assets and liabilities. Included in the non-cash items are
$3.7 million
in depreciation and amortization expense,
$9.4 million
in stock-based compensation expense, and
$1.3 million
of bond premium amortization. These additions were partially offset by an
$1.4 million
reduction related to excess tax benefit from stock-based compensation and
$5.2 million
related to deferred income taxes. The most significant increase to the portion of cash from operating activities related to the changes in operating assets and liabilities was a
$34.3 million
increase in deferred revenue. Of the increase,
$8.1 million
resulted from additional extended warranty sales,
$15.6 million
resulted from increased hardware deferred revenue from TASER Assurance Program ("TAP") and OSP sales, and
$10.5 million
related to prepayments for Axon services. The Company also had increases in cash provided from operating activities of
$17.6 million
for increases in accounts payable and accrued liabilities related primarily to increased inventory purchases. These increases were offset by increased prepaid expenses and other current assets of
$29.1 million
, inventory of
$18.7 million
and accounts and notes receivable of
$13.3 million
during 2016. The increases in accounts and notes receivable were due to increased sales during 2016, and increases in inventory resulted from higher anticipated sales for 2017. Long-term accounts receivable increased by
$16.4 million
during 2016 for sales made under OSP and TASER 60. The increase in prepaid expenses and other asset accounts during 2016 was driven primarily increased prepaid commissions of $1.8 million attributable to higher sales, increased balances under corporate-owed life insurance policies of $1.1 million, $3.3 million of restricted cash related primarily to a customer contract requiring certain contractual payments to be deposited in escrow until approved for release, and $1.7 million of long-term contingent consideration deposited in escrow in connection with a business combination that was completed in December 2016.
Net cash provided by operating activities in 2015 of $46.4 million consisted of $19.9 million in net income, the net add-back of non-cash income statement items totaling $6.3 million, and a positive $20.2 million net change in operating assets and liabilities. Included in the non-cash items was $3.3 million in depreciation and amortization expense, $7.3 million in stock-based compensation expense, and $1.7 million of bond premium amortization. Those additions were partially offset by a $6.9 million reduction related to excess tax benefit from stock-based compensation that was treated as a financing activity for cash flow purposes. The most significant increase to the portion of cash from operating activities related to the changes in operating assets and liabilities was a $15.3 million increase to deferred revenue. Of the increase in deferred revenue, $4.0 million resulted from additional extended warranty sales, $7.3 million resulted from increased hardware deferred revenue from the Company's TAP and OSP sales programs, and $4.0 million related to prepayments for Axon SaaS and related services. The Company also had increases in cash provided from operating activities of $4.2 million and $3.1 million for decreases in accounts and notes receivable and inventory, respectively. In addition, the $5.9 million increase to cash from operating activities related to increases in accounts payable, accrued and other liabilities that was primarily caused by current income tax expense, which would have resulted in an increase to income tax payable, if it had not been reduced by the excess tax benefit from stock-based compensation discussed above. Those increases were partially offset by increased prepaid expenses and other current assets of $8.6 million during 2015. The increase in other asset accounts during 2015 was driven by primarily by increased prepaid commissions of $2.5 million, increased long-term accounts receivable of $1.2 million for sales made under OSP, increased balances under corporate-owed life insurance policies of $1.1 million, and a deposit made with a foreign component manufacturer of $2.6 million related to future services.
Net cash provided by operating activities in 2014 of $35.4 million consisted of $19.9 million in net income, the net add-back of non-cash income statement items totaling $9.6 million and a positive $5.9 million net change in operating assets and liabilities. Included in the non-cash items was $4.3 million in depreciation and amortization expense and $5.6 million in stock-based compensation expense. Those additions were partially offset by an $8.0 million reduction related to excess tax benefit from stock-based compensation that was treated as a financing activity for cash flow purposes. The most significant increase to the portion of cash from operating activities related to the changes in operating assets and liabilities is a $15.5 million increase to deferred revenue. Of the increase in deferred revenue, $6.1 million resulted from additional extended warranty sales, $3.9 million resulted from increased hardware deferred revenue from TAP sales, and $5.3 million related to prepayments for Axon SaaS services. In addition, the $9.5 million increase to cash from operating activities related to increases in accounts payable, accrued and other liabilities that was primarily caused by current income tax expense, which would have resulted in an increase to income tax payable, if it had not been reduced by the excess tax benefit from stock-based compensation discussed above. Those increases to operating cash flow were partially offset by an increase in accounts and notes receivable of $8.4 million due to higher sales in the fourth quarter of 2014 compared to the same quarter in 2013, and an increase in inventory of $9.4 million.
Investing activities
Primarily as a result of investing cash generated from operating activities, we used
$3.0 million
in investing activities in
2016
. Calls and maturities on our investments, net of purchases, were
$8.9 million
. During 2016, we invested
$3.5 million
for the
39
acquisition of developed technology and hiring of personnel to form the Axon Artificial Intelligence group. The Company also invested
$8.4 million
in the purchase of property and equipment and intangibles, net of proceeds related to disposals.
Primarily as a result of investing cash generated from operating activities, the Company used $36.0 million for investing activities in 2015. Purchases of investments, net of calls and maturities, were $18.4 million. During 2015, net cash of $11.2 million was used for the acquisitions of MediaSolv Solutions Corporation and Tactical Safety Responses LTD. The Company also invested $6.5 million in the purchase of property and equipment and intangibles.
During the year ended December 31, 2014, the Company used $24.6 million for investing activities. Purchases of investments, net of calls and maturities, were $21.9 million. The Company also invested $2.7 million in the purchase of property and equipment and intangibles.
Financing activities
Net cash used by financing activities was
$34.7 million
for the year ended December 31,
2016
. During
2016
, the Company repurchased
$33.7 million
of its common stock, which was purchased for a weighted average cost of $18.90 per share, inclusive of applicable administrative costs. Additionally, the Company paid payroll taxes of
$1.8 million
on behalf of employees who net-settled stock awards during the period. These decreases were partially offset by
$0.5 million
of proceeds from the exercise of stock options, and
$1.4 million
of excess tax benefit from stock-based compensation. The purchase of common stock was made under a stock repurchase program authorized by TASER’s Board of Directors.
Net cash used by financing activities was $0.6 million for the year ended December 31, 2015. During 2015, the Company repurchases $7.6 million of the Company’s common stock, which was purchased for a weighted average cost of $25.86 per share. The Company also paid payroll taxes of $1.4 million on behalf of employees who net-settled stock awards during the year. These decreases were partially offset by $2.7 million of proceeds from the exercise of stock options, and $6.9 million of excess tax benefit from stock proceeds. The purchase of common stock was made under a stock repurchase program authorized by TASER’s Board of Directors.
Net cash used by financing activities was $4.8 million for the year ended December 31, 2014. The repurchase of $22.4 million of the Company’s common stock, which was purchased for a weighted average cost of $12.99 per share, was partially offset by $11.0 million of proceeds from the exercise of stock options, and $8.0 million of excess tax benefit from stock proceeds. The purchase of common stock was made under a stock repurchase program authorized by TASER’s Board of Directors.
Liquidity and Capital Resources
Our most significant source of liquidity continues to be funds generated by operating activities and available cash and cash equivalents. In addition, our
$10.0 million
revolving credit facility is available for additional working capital needs or investment opportunities. Under the terms of the line of credit, available borrowings are reduced by outstanding letters of credit. The line is secured by substantially all of the assets of the Company, and bears interest at varying rates, currently
LIBOR plus 1.5% or Prime less 0.75%
. As of December 31,
2016
, we had letters of credit outstanding of
$2.7 million
, leaving the net amount available for borrowing of
$7.3 million
. The facility matures on
July 31, 2017
. There can be no assurance that we will continue to generate cash flows at or above current levels or that we will be able to maintain our ability to borrow under our revolving credit facility. At December 31,
2016
and
2015
, there were no borrowings under the line.
Our agreement with the bank requires us to comply with certain financial and other covenants including maintenance of a minimum leverage ratio and fixed charge coverage ratio. The leverage ratio (ratio of total liabilities to tangible net worth) can be no greater than
1
:1, and the fixed charge coverage ratio can be no less than
1.25
:1, based upon a trailing
twelve
-month period. At December 31,
2016
, the Company’s tangible net worth ratio was
1.02
:1 and its fixed charge coverage ratio was
2.30
:1. The Company's violation of the leverage ratio requirement was waived as of December 31, 2016.
Based on our strong balance sheet and the fact that we had just
$0.2 million
in total long-term debt and capital lease obligations at December 31,
2016
, we believe financing will be available, both through our existing credit line and possible additional financing. However, there is no assurance that such funding will be available on terms acceptable to us, or at all.
We believe funds generated from our expected results of operations, as well as available cash and investments, will be sufficient to finance our operations and strategic initiatives for
2017
and the foreseeable future. From time to time, our board of directors considers repurchases of our common stock. Further repurchases of our common stock will take place on the open market, will be financed with available cash and are subject to authorization as well as market and business conditions.
40
Contractual Obligations
The following table outlines our future contractual financial obligations by period in which payment is expected, as of December 31,
2016
(dollars in thousands):
|
Total
|
Less than
1 Year
|
1 - 3 Years
|
3 - 5 Years
|
More than
5 Years
|
||||||||||||||||
|
Non-cancelable operating leases
|
$
|
5,117
|
|
$
|
1,440
|
|
$
|
1,924
|
|
$
|
1,249
|
|
$
|
504
|
|
|||||
|
Capital leases including interest
|
141
|
|
36
|
|
72
|
|
33
|
|
—
|
|
||||||||||
|
Open purchase orders
|
46,035
|
|
46,035
|
|
—
|
|
—
|
|
—
|
|
||||||||||
|
Total contractual obligations
|
$
|
51,293
|
|
$
|
47,511
|
|
$
|
1,996
|
|
$
|
1,282
|
|
$
|
504
|
|
|||||
Open purchase orders in the above table primarily represent cancelable purchase orders with key vendors, which are included in this table due to the Company’s strategic relationships with these vendors.
We are subject to U.S. Federal income tax as well as income taxes imposed by several states and foreign jurisdictions. As of December 31, 2016, we had $4.1 million of gross unrecognized tax benefits related to uncertain tax positions. The settlement period for our long-term income tax liabilities cannot be determined; however, the liabilities are not expected to significantly increase or decrease within the next 12 months.
Off-Balance Sheet Arrangements
The discussion of off-balance sheet arrangements in Note 9 to the consolidated financial statements included in Part II, Item 8 of this Annual Report on Form 10-K is incorporated by reference herein.
Critical Accounting Estimates
We have identified the following accounting estimates as critical to our business operations and the understanding of our results of operations. The preparation of this Annual Report on Form 10-K requires us to make estimates and assumptions that affect the reported amount of assets and liabilities, disclosure of contingent assets and liabilities at the date of our consolidated financial statements, and the reported amounts of revenue and expenses during the reporting period. While we don’t believe that a change in these estimates is reasonably likely, there can be no assurance that our actual results will not differ from these estimates. The effect of these estimates on our business operations is discussed below.
Product Warranties
The Company warranties its CEWs and Axon devices from manufacturing defects on a limited basis for a period of one year after purchase and, thereafter, will replace any defective unit for a fee. Estimated costs for our standard warranty are charged to cost of products sold and services delivered when revenue is recorded for the related product. We estimate future warranty costs based on historical data related to returns and warranty costs on a quarterly basis and apply this rate to current product anticipated returns from our customers. We have also historically increased our reserve amount if we become aware of a component failure that could result in larger than anticipated returns from our customers. The accrued warranty liability is reviewed quarterly to evaluate whether it sufficiently reflects the remaining warranty obligations based on the anticipated expenditures over the balance of the warranty obligation period, and adjustments are made when actual warranty claim experience differs from estimates. As of December 31,
2016
and
2015
, our reserve for warranty returns was approximately
$0.8 million
and
$0.3 million
, respectively. Warranty expense (recoveries) in the years ended December 31,
2016
,
2015
and
2014
was
$0.6 million
,
$(0.1) million
and
$0.4 million
, respectively. The increase in warranty reserve and related expense as of and for the year ended ended December 31,
2016
was primarily driven by additional warranty reserves related to the introduction of the Axon Body 2 on-officer camera, its related Axon Dock and related parts and accessories. The Company provided a supplemental reserve of approximately $0.6 million for uncertainties surrounding potential return rates due to these products first being sold in 2016 without well-established return rates, which is standard for new products the Company introduces. The Company has been closely monitoring actual returns, and will adjust its estimates in subsequent periods, accordingly. Additionally, as the Company continues investing in the development of new technologies it will continue to assess the adequacy of its reserves related to inherent uncertainties with new product offerings.
Revenue related to separately-priced extended warranties is recorded as deferred revenue at its contractual amount and subsequently recognized in net sales on a straight-line basis over the delivery period. Costs related to extended warranties are charged to cost of products sold and services delivered when incurred.
41
Inventory
Inventories are stated at the lower of cost or market, with cost determined using the weighted average cost of raw materials, which approximates the first-in, first-out (“FIFO”) method, and an allocation of manufacturing labor and overhead costs. The allocation of manufacturing labor and overhead costs includes management’s judgments of what constitutes normal capacity of our production facilities and a determination of what costs are considered to be abnormal fixed production costs, which are expensed as current period charges. Provisions are made to reduce potentially excess, obsolete or slow-moving inventories to their net realizable value. These provisions are based on our best estimates after considering historical demand, projected future demand, inventory purchase commitments, industry and market trends and conditions and other factors. During the year ended December 31,
2016
, the Company recorded provisions for obsolete inventory of approximately
$1.2 million
compared to $0.5 million during
2015
. The increase in provisions made during
2016
was primarily attributable to Axon Body 1 and Axon Flex 1 on-officer cameras due to the introduction of the second generation of these products during
2016
.
Revenue Recognition, Deferred Revenue and Accounts and Notes Receivable
We derive our revenue from two primary sources: (1) the sale of physical products, including our CEWs, Axon cameras, corresponding hardware extended warranties, and related accessories such as Axon Docks, cartridges and batteries, and (2) subscription to our Evidence.com digital evidence management SaaS (including data storage fees and other ancillary services), which includes varying levels of support. To a lesser extent, we also recognize training and other revenue. Revenue is recognized when persuasive evidence of an arrangement exists, delivery has occurred or services have been rendered, title has transferred, the price is fixed and collectability is reasonably assured. Contractual arrangements may contain explicit customer acceptance provisions, and under such arrangements, the Company defers recognition of revenue until formal customer acceptance is received. Extended warranty revenue, SaaS revenue and related data storage revenue are recognized ratably over the term of the contract.
Revenue arrangements with multiple deliverables are divided into separate units and revenue is allocated using the relative selling price method based upon vendor-specific objective evidence of selling price or third-party evidence of the selling prices if vendor-specific objective evidence of selling prices does not exist. If neither vendor-specific objective evidence nor third-party evidence exists, management uses its best estimate of selling price. The majority of the Company’s allocations of arrangement consideration under multiple element arrangements are performed using vendor-specific objective evidence by utilizing prices charged to customers for deliverables when sold separately. The Company’s multiple element arrangements may include future CEWs and/or Axon devices to be delivered at defined points within a multi-year contract, and in those arrangements, the Company allocates total arrangement consideration over the life of the multi-year contract to future deliverables using management’s best estimate of selling price. The Company has not utilized third-party evidence of selling price.
For the the years ended December 31,
2016
,
2015
and
2014
, the composition of revenue recognized from arrangements containing multiple elements and those not containing multiple elements was as follows:
|
For the Year Ended December 31, 2016
|
||||||||||||||||||||
|
TASER Weapons
|
Axon
|
Total
|
||||||||||||||||||
|
Arrangements with multiple elements
|
$
|
34,558
|
|
17.1
|
%
|
$
|
56,270
|
|
85.8
|
%
|
$
|
90,828
|
|
33.9
|
%
|
|||||
|
Arrangements without multiple elements
|
168,086
|
|
82.9
|
|
9,331
|
|
14.2
|
|
177,417
|
|
66.1
|
|
||||||||
|
Total
|
$
|
202,644
|
|
100.0
|
%
|
$
|
65,601
|
|
100.0
|
%
|
$
|
268,245
|
|
100.0
|
%
|
|||||
|
For the Year Ended December 31, 2015
|
||||||||||||||||||||
|
TASER Weapons
|
Axon
|
Total
|
||||||||||||||||||
|
Arrangements with multiple elements
|
$
|
11,141
|
|
6.9
|
%
|
$
|
26,489
|
|
74.6
|
%
|
$
|
37,630
|
|
19.0
|
%
|
|||||
|
Arrangements without multiple elements
|
151,234
|
|
93.1
|
|
9,028
|
|
25.4
|
|
160,262
|
|
81.0
|
|
||||||||
|
Total
|
$
|
162,375
|
|
100.0
|
%
|
$
|
35,517
|
|
100.0
|
%
|
$
|
197,892
|
|
100.0
|
%
|
|||||
|
For the Year Ended December 31, 2014
|
||||||||||||||||||||
|
TASER Weapons
|
Axon
|
Total
|
||||||||||||||||||
|
Arrangements with multiple elements
|
$
|
5,972
|
|
4.1
|
%
|
$
|
12,149
|
|
64.2
|
%
|
$
|
18,121
|
|
11.0
|
%
|
|||||
|
Arrangements without multiple elements
|
139,641
|
|
95.9
|
|
6,763
|
|
35.8
|
|
146,404
|
|
89.0
|
|
||||||||
|
Total
|
$
|
145,613
|
|
100.0
|
%
|
$
|
18,912
|
|
100.0
|
%
|
$
|
164,525
|
|
100.0
|
%
|
|||||
42
Evidence.com, Axon cameras and related accessories are sometimes sold separately, but in most instances are sold together. In these instances, customers typically purchase and pay for the equipment and one year of Evidence.com in advance. Additional years of service are generally billed annually over a specified service term, which has typically ranged from one to five years. Axon equipment represents a deliverable that is provided to the customer at the time of sale, while Evidence.com services are provided over the specified term of the contract. Generally, the Company recognizes revenue for the Axon equipment at the time of the sale consistent with the discussion of multiple deliverable arrangements above. Revenue for Evidence.com is deferred at the time of the sale and recognized over the service period. At times the Company subsidizes the cost of Axon devices provided to customers to secure long-term Evidence.com service contracts. In such circumstances, revenue related to the Axon devices recognized at the time of delivery is limited to the amount collected from the customer that is not contingent upon the delivery of future Evidence.com services. The Company recognizes the remaining allocated revenue related to subsidized Axon devices over the remaining period it provides the contracted Evidence.com services.
Deferred revenue consists of payments received in advance related to products and services for which the criteria for revenue recognition have not yet been met. Deferred revenue that will be recognized during the succeeding twelve month period is recorded as current deferred revenue and the remaining portion is recorded as long-term. Deferred revenue does not include future revenue from multi-year contracts for which no invoice has yet been created. We generally bill customers in annual installments.
Sales are typically made on credit and we generally do not require collateral. We perform ongoing credit evaluations of our customers’ financial condition and maintain an allowance for estimated potential losses. Uncollectible accounts are written off when deemed uncollectible, and accounts and notes receivable are presented net of an allowance for doubtful accounts. This allowance represents our best estimate and is based on our judgment after considering a number of factors including third-party credit reports, actual payment history, customer-specific financial information and broader market and economic trends and conditions. In the event that actual uncollectible amounts differ from our estimates, additional expense could be necessary.
Valuation of Goodwill, Intangibles and Long-lived Assets
The recoverability of the goodwill is evaluated and tested for impairment at least annually during the fourth quarter or more often, if and when circumstances indicate that goodwill may not be recoverable. Finite-lived intangible assets and other long-lived assets are amortized over their useful lives. We evaluate whether events and circumstances have occurred that indicate the remaining estimated useful life of long-lived assets and intangible assets may warrant revision or that the remaining balance of these assets, including intangible assets with indefinite lives, may not be recoverable.
Circumstances that might indicate long-lived assets might not be recoverable could include, but are not limited to, a change in the product mix, a change in the way products are created, produced or delivered, or a significant change in the way our products are branded and marketed. When performing a review for recoverability, we estimate the future undiscounted cash flows expected to result from the use of the assets and their eventual disposition. The amount of the impairment loss, if impairment exists, is calculated based on the excess of the carrying amounts of the assets over their estimated fair value computed using discounted cash flows.
Income Taxes
We recognize federal, state and foreign current tax liabilities or assets based on our estimate of taxes payable or refundable in the current fiscal year by tax jurisdiction. We also recognize federal, state and foreign deferred tax assets or liabilities, as appropriate, for our estimate of future tax effects attributable to temporary differences and carry forwards.
We recognize the tax benefit from an uncertain tax position only if it is more likely than not that the tax position will be sustained based on the technical merits of the position. The tax benefits recognized in the consolidated financial statements from such positions are measured based on the largest benefit that has a greater than fifty percent likelihood of being realized upon ultimate resolution. Management must also assess whether uncertain tax positions as filed could result in the recognition of a liability for possible interest and penalties if any. We have completed research and development tax credit studies which identified approximately $11.4 million in tax credits for federal, Arizona and California income tax purposes related to the 2003 through 2016 tax years, net of the federal benefit on the Arizona and California research and development tax credits. Management determined that it was more likely than not that the full benefit of the research and development tax credit would not be sustained on examination and accordingly, has established a liability for unrecognized tax benefits of $3.9 million as of December 31, 2016. In addition, we established a $0.1 million liability related to uncertain tax positions for certain state income tax liabilities, for a total unrecognized tax benefit at December 31, 2016 of $4.0 million. Management does not expect the amount of the unrecognized tax benefit liability to change significantly within the next 12 months. Should the unrecognized tax benefit of $4.0 million be recognized, the Company’s effective tax rate would be favorably impacted. Our estimates are based on the information available to us at the time we prepare the income tax provisions. Our income tax returns are subject to audit by federal, state, and local
43
governments, generally years after the returns are filed. These returns could be subject to material adjustments or differing interpretations of the tax laws.
Our calculation of current and deferred tax assets and liabilities is based on certain estimates and judgments and involves dealing with uncertainties in the application of complex tax laws. Our estimates of current and deferred tax assets and liabilities may change based, in part, on added certainty or finality to an anticipated outcome, changes in accounting or tax laws in the U.S. and overseas, or changes in other facts or circumstances. In addition, we recognize liabilities for potential U.S. tax contingencies based on our estimate of whether, and the extent to which, additional taxes may be due. If we determine that payment of these amounts is unnecessary, or if the recorded tax liability is greater than our current assessment, we may be required to recognize an income tax benefit, or additional income tax expense, respectively, in our consolidated financial statements.
In preparing our consolidated financial statements, management assesses the likelihood that our deferred tax assets will be realized from future taxable income. In evaluating our ability to recover our deferred income tax assets, management considers all available positive and negative evidence, including operating results, ongoing tax planning and forecasts of future taxable income on a jurisdiction by jurisdiction basis. A valuation allowance is established if we determine that it is more likely than not that some portion or all of the net deferred tax assets will not be realized.
Although management believes that its tax estimates are reasonable, the ultimate tax determination involves significant judgments that could become subject to audit by tax authorities in the ordinary course of business. As of December 31, 2016, the Company would need to generate approximately $44.3 million of pre-tax book income in order to realize the net deferred tax assets for which a benefit has been recorded. This estimate considers the reversal of approximately $10.6 million of gross deferred tax liabilities, $4.0 million tax-effected. We also have state net operating losses ("NOLs") of $1.8 million, which produce deferred tax assets of $68,000, which expire at various dates between 2029 and 2034. We anticipate the Company’s future income to continue to trend upward from our 2016 results, with sufficient pre-tax book income to realize a large portion of our deferred tax assets. However, based on specific income projections in years in which certain tax assets are set to expire, and cumulative losses in certain foreign tax jurisdictions, a reserve of approximately $3.5 million has been recorded as a valuation allowance against deferred tax assets as of December 31, 2016.
Stock-Based Compensation
We have historically granted stock-based compensation to key employees and non-employee directors as a means of attracting and retaining highly qualified personnel. We have historically utilized restricted stock units and stock options; however, no stock options were issued during
2016
,
2015
or
2014
. The fair value of restricted stock units is estimated as the closing price of our common stock on the date of grant. We estimate the fair value of granted stock options by using the Black-Scholes-Merton option pricing model, which requires the input of highly subjective assumptions. These assumptions include estimating the length of time employees will retain their stock options before exercising them (expected term), the estimated volatility of our common stock price over the expected term and the number of options that will ultimately not vest (forfeitures). The expense for both restricted stock units and stock options is recorded over the life of the grant, net of forfeitures.
We have granted a total of approximately
1.7 million
performance-based awards (options and restricted stock units) of which approximately
0.4 million
are outstanding as of December 31,
2016
, the vesting of which is contingent upon the achievement of certain performance criteria including the successful development and market acceptance of future product introductions as well as our future sales targets and operating performance. These awards will vest and compensation expense will be recognized based on management’s best estimate of the probability of the performance criteria being satisfied using the most currently available projections of future product adoption and operating performance, adjusted at each balance sheet date. Changes in the subjective and probability-based assumptions can materially affect the estimate of fair value of stock-based compensation and consequently, the related amount recognized in our statements of operations.
Contingencies and Accrued Litigation Expense
We are subject to the possibility of various loss contingencies including product-related litigation, arising in the ordinary course of business. We consider the likelihood of loss or impairment of an asset or the incurrence of a liability, as well as our ability to reasonably estimate the amount of loss in determining loss contingencies. An estimated loss contingency is accrued when it is probable that an asset has been impaired or a liability has been incurred and the amount of loss can be reasonably estimated. We regularly evaluate current information available to us to determine whether such accruals should be adjusted and whether new accruals are required.
44
Item 7A.
Quantitative and Qualitative Disclosures About Market Risk
Interest Rate Risk
We typically invest in a limited number of financial instruments, consisting principally of investments in money market accounts, certificates of deposit, corporate and municipal bonds with a typical long-term debt rating of “A” or better by any nationally recognized statistical rating organization, denominated in U.S. dollars. All of our cash equivalents and investments are treated as “held-to-maturity.” Investments in fixed-rate interest-earning instruments carry a degree of interest rate risk as their market value may be adversely impacted due to a rise in interest rates. As a result, we may suffer losses in principal if we sell securities that have declined in market value due to changes in interest rates. However, because we classify our debt securities as “held-to-maturity” based on our intent and ability to hold these instruments to maturity, no gains or losses are recognized due to changes in interest rates. These securities are reported at amortized cost. Based on investment positions as of December 31,
2016
, a hypothetical 100 basis point increase across all maturities would result in a
$0.2 million
incremental decline in the fair market value of the portfolio. Such losses would only be realized if the Company sold the investments prior to maturity.
Additionally, we have access to a line of credit borrowing facility which bears interest at varying rates, currently at
LIBOR plus 1.5% or Prime less 0.75%
. Under the terms of the line of credit, available borrowings are reduced by outstanding letters of credit, which totaled
$2.7 million
at December 31,
2016
. At December 31,
2016
, there was
no
amount outstanding under the line of credit, and the available borrowing under the line of credit was
$7.3 million
. We have not borrowed any funds under the line of credit since its inception; however; should we need to do so in the future, such borrowings could be subject to adverse or favorable changes in the underlying interest rate.
Exchange Rate Risk
Our results of operations and cash flows are subject to fluctuations due to changes in foreign currency exchange rates, particularly changes in the Euro and the British Pound, in each case compared to the U.S. Dollar, related to transactions by TASER International B.V., TASER Europe SE, Axon Public Safety UK LTD, Axon Public Safety Australia Pty Ltd, and Axon Public Safety Canada, Inc. To date, we have not engaged in any currency hedging activities, although we may do so in the future. Fluctuations in currency exchange rates could harm our business in the future.
The majority of our sales to international customers are transacted in U.S. dollars and therefore, are not subject to exchange rate fluctuations on these transactions. However, the cost of our products to our customers increases when the U.S. dollar strengthens against their local currency and the Company may have more sales and expenses denominated in foreign currencies in future years which would increase its foreign exchange rate risk.
45
Item 8.
Financial Statements and Supplementary Data
|
Index to Consolidated Financial Statements
|
Page
|
|
|
|
||
|
|
||
|
|
||
|
|
||
|
|
||
|
|
||
46
TASER INTERNATIONAL, INC.
(in thousands, except share data)
|
|
December 31,
|
||||||
|
|
2016
|
2015
|
|||||
|
ASSETS
|
|||||||
|
Current assets:
|
|||||||
|
Cash and cash equivalents
|
$
|
40,651
|
|
$
|
59,526
|
|
|
|
Short-term investments
|
48,415
|
|
50,254
|
|
|||
|
Accounts and notes receivable, net of allowance of $443 and $322 as of December 31, 2016 and 2015, respectively
|
39,466
|
|
27,701
|
|
|||
|
Inventory
|
34,841
|
|
15,763
|
|
|||
|
Prepaid expenses and other current assets
|
13,858
|
|
8,165
|
|
|||
|
Total current assets
|
177,231
|
|
161,409
|
|
|||
|
Property and equipment, net
|
24,004
|
|
21,848
|
|
|||
|
Deferred income tax assets, net
|
19,515
|
|
13,719
|
|
|||
|
Intangible assets, net
|
15,218
|
|
7,588
|
|
|||
|
Goodwill
|
10,442
|
|
9,596
|
|
|||
|
Long-term investments
|
234
|
|
8,525
|
|
|||
|
Long-term accounts and notes receivable, net of current portion
|
17,602
|
|
1,227
|
|
|||
|
Other assets
|
13,917
|
|
5,969
|
|
|||
|
Total assets
|
$
|
278,163
|
|
$
|
229,881
|
|
|
|
LIABILITIES AND STOCKHOLDERS’ EQUITY
|
|||||||
|
Current liabilities:
|
|||||||
|
Accounts payable
|
$
|
10,736
|
|
$
|
7,333
|
|
|
|
Accrued liabilities
|
18,248
|
|
8,643
|
|
|||
|
Current portion of deferred revenue
|
45,137
|
|
20,851
|
|
|||
|
Customer deposits
|
2,148
|
|
1,226
|
|
|||
|
Current portion of business acquisition contingent consideration
|
1,690
|
|
—
|
|
|||
|
Other current liabilities
|
80
|
|
87
|
|
|||
|
Total current liabilities
|
78,039
|
|
38,140
|
|
|||
|
Deferred revenue, net of current portion
|
40,054
|
|
30,190
|
|
|||
|
Liability for unrecognized tax benefits
|
1,896
|
|
1,315
|
|
|||
|
Long-term deferred compensation
|
3,362
|
|
2,199
|
|
|||
|
Business acquisition contingent consideration, net of current portion
|
1,635
|
|
952
|
|
|||
|
Other long-term liabilities
|
2,289
|
|
81
|
|
|||
|
Total liabilities
|
127,275
|
|
72,877
|
|
|||
|
Commitments and contingencies (Note 9)
|
|
|
|||||
|
Stockholders’ equity:
|
|||||||
|
Preferred stock, $0.00001 par value; 25,000,000 shares authorized; no shares issued and outstanding as of December 31, 2016 and 2015
|
—
|
|
—
|
|
|||
|
Common stock, $0.00001 par value; 200,000,000 shares authorized; 52,325,251 and 53,692,192 shares issued and outstanding as of December 31, 2016 and 2015, respectively
|
1
|
|
1
|
|
|||
|
Additional paid-in capital
|
187,656
|
|
178,143
|
|
|||
|
Treasury stock at cost, 20,220,227 and 18,432,158 shares as of December 31, 2016 and 2015, respectively
|
(155,947
|
)
|
(122,201
|
)
|
|||
|
Retained earnings
|
118,275
|
|
100,978
|
|
|||
|
Accumulated other comprehensive income
|
903
|
|
83
|
|
|||
|
Total stockholders’ equity
|
150,888
|
|
157,004
|
|
|||
|
Total liabilities and stockholders’ equity
|
$
|
278,163
|
|
$
|
229,881
|
|
|
The accompanying notes are an integral part of these consolidated financial statements.
47
TASER INTERNATIONAL, INC.
(in thousands, except per share data)
|
|
For the Years Ended December 31,
|
||||||||||
|
|
2016
|
2015
|
2014
|
||||||||
|
Net sales
|
$
|
268,245
|
|
$
|
197,892
|
|
$
|
164,525
|
|
||
|
Cost of products sold and services delivered
|
97,709
|
|
69,245
|
|
62,977
|
|
|||||
|
Gross margin
|
170,536
|
|
128,647
|
|
101,548
|
|
|||||
|
Operating expenses:
|
|||||||||||
|
Sales, general and administrative
|
108,076
|
|
69,698
|
|
54,158
|
|
|||||
|
Research and development
|
30,609
|
|
23,614
|
|
14,885
|
|
|||||
|
Total operating expenses
|
138,685
|
|
93,312
|
|
69,043
|
|
|||||
|
Income from operations
|
31,851
|
|
35,335
|
|
32,505
|
|
|||||
|
Interest and other income (expense), net
|
(354
|
)
|
26
|
|
(194
|
)
|
|||||
|
Income before provision for income taxes
|
31,497
|
|
35,361
|
|
32,311
|
|
|||||
|
Provision for income taxes
|
14,200
|
|
15,428
|
|
12,393
|
|
|||||
|
Net income
|
$
|
17,297
|
|
$
|
19,933
|
|
$
|
19,918
|
|
||
|
Net income per common and common equivalent shares:
|
|||||||||||
|
Basic
|
$
|
0.33
|
|
$
|
0.37
|
|
$
|
0.38
|
|
||
|
Diluted
|
$
|
0.32
|
|
$
|
0.36
|
|
$
|
0.37
|
|
||
|
Weighted average number of common and common equivalent shares outstanding:
|
|||||||||||
|
Basic
|
52,667
|
|
53,548
|
|
52,948
|
|
|||||
|
Diluted
|
53,536
|
|
54,638
|
|
54,500
|
|
|||||
|
CONSOLIDATED STATEMENTS OF COMPREHENSIVE INCOME
|
|||||||||||
|
Net income
|
$
|
17,297
|
|
$
|
19,933
|
|
$
|
19,918
|
|
||
|
Foreign currency translation adjustments
|
820
|
|
19
|
|
66
|
|
|||||
|
Comprehensive income
|
$
|
18,117
|
|
$
|
19,952
|
|
$
|
19,984
|
|
||
The accompanying notes are an integral part of these consolidated financial statements.
48
TASER INTERNATIONAL, INC.
CONSOLIDATED STATEMENTS OF STOCKHOLDERS’ EQUITY
(in thousands, except share data)
|
|
Common Stock
|
Additional
Paid-in Capital |
Treasury Stock
|
Accumulated
Other Comprehensive Income (Loss) |
Retained
Earnings |
Total
Stockholders’ Equity |
|||||||||||||||||||||||
|
|
Shares
|
Amount
|
Shares
|
Amount
|
|||||||||||||||||||||||||
|
Balance, December 31, 2013
|
52,725,247
|
|
$
|
1
|
|
$
|
139,424
|
|
16,412,755
|
|
$
|
(92,203
|
)
|
$
|
(2
|
)
|
$
|
61,127
|
|
$
|
108,347
|
|
|||||||
|
Stock options exercised and RSUs vested, net of withholdings
|
2,002,823
|
|
—
|
|
9,653
|
|
—
|
|
—
|
|
—
|
|
—
|
|
9,653
|
|
|||||||||||||
|
Stock-based compensation
|
—
|
|
—
|
|
5,579
|
|
—
|
|
—
|
|
—
|
|
—
|
|
5,579
|
|
|||||||||||||
|
Excess tax benefit from stock-based compensation
|
—
|
|
—
|
|
7,985
|
|
—
|
|
—
|
|
—
|
|
—
|
|
7,985
|
|
|||||||||||||
|
Purchase of treasury stock
|
(1,727,203
|
)
|
—
|
|
—
|
|
1,727,203
|
|
(22,442
|
)
|
—
|
|
—
|
|
(22,442
|
)
|
|||||||||||||
|
Net income
|
—
|
|
—
|
|
—
|
|
—
|
|
—
|
|
—
|
|
19,918
|
|
19,918
|
|
|||||||||||||
|
Foreign currency translation adjustments
|
—
|
|
—
|
|
—
|
|
—
|
|
—
|
|
66
|
|
—
|
|
66
|
|
|||||||||||||
|
Balance, December 31, 2014
|
53,000,867
|
|
1
|
|
162,641
|
|
18,139,958
|
|
(114,645
|
)
|
64
|
|
81,045
|
|
129,106
|
|
|||||||||||||
|
Stock options exercised and RSUs vested, net of withholdings
|
983,525
|
|
—
|
|
1,303
|
|
—
|
|
—
|
|
—
|
|
—
|
|
1,303
|
|
|||||||||||||
|
Stock-based compensation
|
—
|
|
—
|
|
7,263
|
|
—
|
|
—
|
|
—
|
|
—
|
|
7,263
|
|
|||||||||||||
|
Excess tax benefit from stock-based compensation
|
—
|
|
—
|
|
6,936
|
|
—
|
|
—
|
|
—
|
|
—
|
|
6,936
|
|
|||||||||||||
|
Purchase of treasury stock
|
(292,200
|
)
|
—
|
|
—
|
|
292,200
|
|
(7,556
|
)
|
—
|
|
—
|
|
(7,556
|
)
|
|||||||||||||
|
Net income
|
—
|
|
—
|
|
—
|
|
—
|
|
—
|
|
—
|
|
19,933
|
|
19,933
|
|
|||||||||||||
|
Foreign currency translation adjustments
|
—
|
|
—
|
|
—
|
|
—
|
|
—
|
|
19
|
|
—
|
|
19
|
|
|||||||||||||
|
Balance, December 31, 2015
|
53,692,192
|
|
1
|
|
178,143
|
|
18,432,158
|
|
(122,201
|
)
|
83
|
|
100,978
|
|
157,004
|
|
|||||||||||||
|
Stock options exercised and RSUs vested, net of withholdings
|
421,128
|
|
—
|
|
(1,294
|
)
|
—
|
|
—
|
|
—
|
|
—
|
|
(1,294
|
)
|
|||||||||||||
|
Stock-based compensation
|
—
|
|
—
|
|
9,369
|
|
—
|
|
—
|
|
—
|
|
—
|
|
9,369
|
|
|||||||||||||
|
Excess tax benefit from stock-based compensation
|
—
|
|
—
|
|
1,438
|
|
—
|
|
—
|
|
—
|
|
—
|
|
1,438
|
|
|||||||||||||
|
Purchase of treasury stock
|
(1,788,069
|
)
|
—
|
|
—
|
|
1,788,069
|
|
(33,746
|
)
|
—
|
|
—
|
|
(33,746
|
)
|
|||||||||||||
|
Net income
|
—
|
|
—
|
|
—
|
|
—
|
|
—
|
|
—
|
|
17,297
|
|
17,297
|
|
|||||||||||||
|
Foreign currency translation adjustments
|
—
|
|
—
|
|
—
|
|
—
|
|
—
|
|
820
|
|
—
|
|
820
|
|
|||||||||||||
|
Balance, December 31, 2016
|
52,325,251
|
|
$
|
1
|
|
$
|
187,656
|
|
20,220,227
|
|
$
|
(155,947
|
)
|
$
|
903
|
|
$
|
118,275
|
|
$
|
150,888
|
|
|||||||
The accompanying notes are an integral part of these consolidated financial statements.
49
TASER INTERNATIONAL, INC.
(in thousands)
|
|
For the Years Ended December 31,
|
||||||||||
|
|
2016
|
2015
|
2014
|
||||||||
|
Cash flows from operating activities:
|
|||||||||||
|
Net income
|
$
|
17,297
|
|
$
|
19,933
|
|
$
|
19,918
|
|
||
|
Adjustments to reconcile net income to net cash provided by operating activities:
|
|||||||||||
|
Depreciation and amortization
|
3,658
|
|
3,291
|
|
4,317
|
|
|||||
|
Purchase accounting adjustments to goodwill
|
520
|
|
—
|
|
—
|
|
|||||
|
Loss (gain) on disposals of property and equipment, net
|
42
|
|
(19
|
)
|
17
|
|
|||||
|
Loss on disposal of intangible assets
|
21
|
|
225
|
|
215
|
|
|||||
|
Bond premium amortization
|
1,265
|
|
1,650
|
|
957
|
|
|||||
|
Stock-based compensation
|
9,369
|
|
7,263
|
|
5,579
|
|
|||||
|
Deferred income taxes
|
(5,167
|
)
|
994
|
|
3,598
|
|
|||||
|
Unrecognized tax benefits
|
582
|
|
(156
|
)
|
202
|
|
|||||
|
Tax benefit from stock-based compensation
|
(1,438
|
)
|
(6,936
|
)
|
(7,985
|
)
|
|||||
|
Change in assets and liabilities:
|
|||||||||||
|
Accounts and notes receivable
|
(13,297
|
)
|
4,244
|
|
(8,247
|
)
|
|||||
|
Inventory
|
(18,668
|
)
|
3,140
|
|
(7,214
|
)
|
|||||
|
Prepaid expenses and other assets
|
(29,069
|
)
|
(8,579
|
)
|
(1,080
|
)
|
|||||
|
Accounts payable, accrued and other liabilities
|
17,584
|
|
5,868
|
|
9,852
|
|
|||||
|
Deferred revenue
|
34,304
|
|
15,289
|
|
15,469
|
|
|||||
|
Customer deposits
|
922
|
|
238
|
|
(166
|
)
|
|||||
|
Net cash provided by operating activities
|
17,925
|
|
46,445
|
|
35,432
|
|
|||||
|
Cash flows from investing activities:
|
|||||||||||
|
Purchases of investments
|
(56,086
|
)
|
(62,464
|
)
|
(32,900
|
)
|
|||||
|
Proceeds from call / maturity of investments
|
64,951
|
|
44,105
|
|
10,997
|
|
|||||
|
Purchases of property and equipment
|
(4,957
|
)
|
(6,003
|
)
|
(2,505
|
)
|
|||||
|
Proceeds from disposal of property and equipment
|
42
|
|
40
|
|
10
|
|
|||||
|
Purchases of intangible assets
|
(3,495
|
)
|
(501
|
)
|
(183
|
)
|
|||||
|
Business acquisitions, net of cash acquired
|
(3,500
|
)
|
(11,186
|
)
|
—
|
|
|||||
|
Net cash used in investing activities
|
(3,045
|
)
|
(36,009
|
)
|
(24,581
|
)
|
|||||
|
Cash flows from financing activities:
|
|||||||||||
|
Repurchase of common stock
|
(33,746
|
)
|
(7,556
|
)
|
(22,442
|
)
|
|||||
|
Proceeds from options exercised
|
478
|
|
2,673
|
|
11,000
|
|
|||||
|
Payroll tax payments for net-settled stock awards
|
(1,772
|
)
|
(1,370
|
)
|
(1,347
|
)
|
|||||
|
Payments on capital lease obligation
|
(32
|
)
|
(80
|
)
|
(36
|
)
|
|||||
|
Payments on notes payable
|
(75
|
)
|
—
|
|
—
|
|
|||||
|
Payment of contingent consideration for business acquisition
|
(952
|
)
|
—
|
|
—
|
|
|||||
|
Excess tax benefit from stock-based compensation
|
1,438
|
|
6,936
|
|
7,985
|
|
|||||
|
Net cash (used in) provided by financing activities
|
(34,661
|
)
|
603
|
|
(4,840
|
)
|
|||||
|
Effect of exchange rate changes on cash and cash equivalents
|
906
|
|
120
|
|
85
|
|
|||||
|
Net increase (decrease) in cash and cash equivalents
|
(18,875
|
)
|
11,159
|
|
6,096
|
|
|||||
|
Cash and cash equivalents, beginning of year
|
59,526
|
|
48,367
|
|
42,271
|
|
|||||
|
Cash and cash equivalents, end of year
|
$
|
40,651
|
|
$
|
59,526
|
|
$
|
48,367
|
|
||
The accompanying notes are an integral part of these consolidated financial statements.
50
1
. Organization and Summary of Significant Accounting Policies
TASER International, Inc. (“TASER” or the “Company”) is a developer and manufacturer of advanced conducted electrical weapons (“CEWs”) designed for use by law enforcement, military, corrections, and private security personnel, and by private individuals for personal defense. In addition, the Company has developed full technology solutions for the capture, storage and management of video/audio evidence as well as other tactical capabilities for use in law enforcement. The Company sells its products worldwide through its direct sales force, distribution partners, online store and third-party resellers. The Company was incorporated in Arizona in September 1993, and reincorporated in Delaware in January 2001. The Company’s corporate headquarters and manufacturing facilities are located in Scottsdale, Arizona. The Company’s software development unit facility is located in Seattle, Washington. TASER International BV, a wholly owned subsidiary of the Company, serves as the Company's international headquarters, and is located in Amsterdam, Netherlands.
The accompanying consolidated financial statements include the accounts of the Company, and its wholly owned subsidiaries, including TASER International Europe SE (“TASER Europe”), TASER International B.V., Axon Public Safety Canada, and MediaSolv Solutions Corporation ("MediaSolv"). All material intercompany accounts, transactions, and profits have been eliminated.
a. Basis of Presentation and Use of Estimates
The accompanying consolidated financial statements have been prepared in conformity with accounting principles generally accepted in the United States of America (“U.S. GAAP”). The preparation of these consolidated financial statements requires management to make estimates and assumptions that affect the reported amounts of assets and liabilities and disclosure of contingent assets and liabilities at the date of the consolidated financial statements and the reported amounts of revenues and expenses during the reporting period. Significant estimates and assumptions in these consolidated financial statements include:
|
•
|
product warranty reserves,
|
|
•
|
inventory valuation,
|
|
•
|
revenue recognition allocated in multiple-deliverable contracts or arrangements,
|
|
•
|
valuation of goodwill, intangibles and long-lived assets,
|
|
•
|
recognition, measurement and valuation of current and deferred income taxes,
|
|
•
|
recognition and measurement of contingencies and accrued litigation expense. and
|
|
•
|
fair value of stock awards issued, the estimated vesting period for performance-based stock awards and forfeiture rates,
|
Actual results could differ materially from those estimates.
b. Cash, Cash Equivalents and Investments
Cash, cash equivalents and investments include cash, money market funds, certificates of deposit, state and municipal obligations and corporate bonds. The Company places its cash and cash equivalents with high quality financial institutions. Although the Company deposits its cash with multiple financial institutions, its deposits, at times, may exceed federally insured limits.
Cash and cash equivalents include funds on hand and highly liquid investments purchased with initial maturity of three months or less. Short-term investments include securities with an expected maturity date within one year of the balance sheet date that do not meet the definition of a cash equivalent, and long-term investments are securities with an expected maturity date greater than one year. Based on management’s intent and ability, the Company’s investments are classified as held to maturity investments and are recorded at amortized cost. Held-to-maturity investments are reviewed quarterly for impairment to determine if other-than-temporary declines in the carrying value have occurred for any individual investment. Other-than-temporary declines in the value of held-to-maturity investments are recorded as expense in the period the determination is made.
c. Inventory
Inventories are stated at the lower of cost or market. Cost is determined using the weighted average cost of raw materials which approximates the first-in, first-out (“FIFO”) method and includes allocations of manufacturing labor and overhead. Provisions are made to reduce potentially excess, obsolete or slow-moving inventories to their net realizable value. These provisions are based on management’s best estimate after considering historical demand, projected future demand, inventory purchase commitments, industry and market trends and conditions and other factors. Management evaluates inventory costs for abnormal costs due to excess production capacity and treats such costs as period costs.
51
TASER INTERNATIONAL, INC.
NOTES TO CONSOLIDATED FINANCIAL STATEMENTS – (Continued)
d. Property and Equipment
Property and equipment are stated at cost, net of accumulated depreciation and amortization. Additions and improvements are capitalized, while ordinary maintenance and repair expenditures are charged to expense as incurred. Depreciation is calculated using the straight-line method over the estimated useful lives of the assets.
e. Software Development Costs
The Company expenses software development costs, including costs to develop software products or the software component of products to be marketed to external users, before technological feasibility of such products is reached. The Company has determined that technological feasibility is reached shortly before the release of those products and as a result, the development costs incurred after the establishment of technological feasibility and before the release of those products are not material.
Software development costs also include costs to develop software programs to be used solely to meet the Company's internal needs and cloud-based applications used to deliver its services. The Company capitalizes development costs related to these software applications once the preliminary project stage is complete and it is probable that the project will be completed and the software will be used to perform the intended function. Additionally, the Company capitalizes qualifying costs incurred for upgrades and enhancements to existing software that result in additional functionality. Costs related to preliminary project planning activities, post-implementation activities, maintenance and minor modifications are expensed as incurred. Internal-use software is amortized on a straight line basis over its estimated useful life.
Management evaluates the useful lives of these assets on an annual basis and tests for impairment whenever events or changes in circumstances occur that could impact the recoverability of these assets.
f. Valuation of Goodwill, Intangibles and Long-lived Assets
The Company does not amortize goodwill and intangible assets with indefinite useful lives, rather such assets are required to be tested for impairment at least annually during the fourth quarter or sooner whenever events or changes in circumstances indicate that the assets may be impaired. Finite-lived intangible assets and other long-lived assets are amortized over their useful lives. Management evaluates whether events and circumstances have occurred that indicate the remaining estimated useful life of long-lived assets and intangible assets may warrant revision or that the remaining balance of these assets, including intangible assets with indefinite lives, may not be recoverable.
Circumstances that might indicate long-lived assets might not be recoverable could include, but are not limited to, a change in the product mix, a change in the way products are created, produced or delivered, or a significant change in the way the Company's products are branded and marketed. When performing a review for recoverability, management estimates the future undiscounted cash flows expected to result from the use of the assets and their eventual disposition. The amount of the impairment loss, if impairment exists, is calculated based on the excess of the carrying amounts of the assets over their estimated fair value computed using discounted cash flows.
No
impairment losses were recorded during the years ended December 31,
2016
,
2015
and
2014
.
g. Customer Deposits
The Company requires deposits in advance of shipment for certain customer sales orders. Customer deposits are recorded as a current liability in the accompanying consolidated balance sheets.
h. Revenue Recognition, Deferred Revenue and Accounts and Notes Receivable
The Company derives revenue from
two
primary sources: (1) the sale of physical products, including CEWs, Axon cameras, corresponding extended warranties, and related accessories such as Axon Docks, cartridges and batteries, among others, and (2) subscription to the Company's Evidence.com software as a service ("SaaS") (including data storage fees and other ancillary services), which includes varying levels of support. To a lesser extent, the Company also recognizes training and other professional services revenue. Revenue is recognized when persuasive evidence of an arrangement exists, delivery has occurred or services have been rendered, title has transferred, the price is fixed and collectability is reasonably assured. Contractual arrangements may contain explicit customer acceptance provisions, and under such arrangements, the Company defers recognition of revenue until formal customer acceptance is received. Extended warranty revenue, SaaS revenue and related data storage revenue are recognized ratably over the term of the contract beginning on the commencement date of each contract.
52
TASER INTERNATIONAL, INC.
NOTES TO CONSOLIDATED FINANCIAL STATEMENTS – (Continued)
Revenue arrangements with multiple deliverables are divided into separate units and revenue is allocated using the relative selling price method based upon vendor-specific objective evidence of selling price or third-party evidence of the selling prices if vendor-specific objective evidence of selling prices does not exist. If neither vendor-specific objective evidence nor third-party evidence exists, management uses its best estimate of selling price. The majority of the Company’s allocations of arrangement consideration under multiple element arrangements are performed using vendor-specific objective evidence by utilizing prices charged to customers for deliverables when sold separately. The Company’s multiple element arrangements may include future CEWs and/or Axon devices to be delivered at defined points within a multi-year contract, and in those arrangements, the Company allocates total arrangement consideration over the life of the multi-year contract to future deliverables using management’s best estimate of selling price. The Company has not utilized third-party evidence of selling price.
The Company offers the right to purchase extended warranties that include additional services and coverage beyond the standard limited warranty for certain products. Revenue for extended warranty purchases is deferred at the time of sale and recognized over the warranty period commencing on the date of sale. Extended warranties range from
one
to
five
years.
Evidence.com and Axon cameras and related accessories have stand-alone value to the customer and are sometimes sold separately, but in most instances are sold together. In these instances, customers typically purchase and pay for the equipment and
one
year of Evidence.com in advance. Additional years of service are generally billed annually over a specified service term, which has typically ranged from
one
to
five
years. Generally, the Company recognizes revenue for the Axon equipment at the time of the sale consistent with the discussion of multiple deliverable arrangements above. Revenue for Evidence.com is deferred at the time of the sale and recognized over the service period. At times the Company subsidizes the cost of Axon devices provided to customers to secure long-term Evidence.com service contracts. In such circumstances, revenue related to the Axon devices recognized at the time of delivery is limited to the amount collected from the customer that is not contingent upon the delivery of future Evidence.com services. The Company recognizes the remaining allocated revenue related to subsidized Axon devices over the remaining period it provides the contracted Evidence.com services.
In 2012, the Company introduced a program, the TASER Assurance Program (“TAP”) whereby a customer purchasing a product and joining the program will have the right to trade-in the original product for a new product of the same or like model in the future. Upon joining TAP, customers also receive an extended warranty for the initial products purchased and spare inventory. Under this program the customer generally pays additional annual installments over the contract period, generally
three
to
five
years. The Company records consideration received related to the future product purchase as deferred revenue until all revenue recognition criteria are met, which is generally when the new product is delivered. Consideration related to future product purchases is determined at the inception of the arrangement using management’s best estimate of selling price. Management’s estimate is principally based on the current selling price for such products, with due evaluation of the impact of any expected product and pricing changes, which have historically had an immaterial influence on management’s best estimate of selling price.
In 2015, The Company introduced the Officer Safety Plan (“OSP”), whereby a customer typically enters into a
five
year Evidence.com subscription that includes all of its standard advanced features along with unlimited storage. The OSP also includes a service plan that includes upgrades of (i) the Axon devices every
2.5 years
and (ii) a TASER CEW at any point within the contract period. Upon entering into the OSP, customers also receive extended warranties on the Axon and CEW devices over the
five
-year contract periods as well as spare inventory units. Under this program the customer generally makes an initial purchase of Axon cameras and related accessories, and CEWs at inception and pays the first of its annual installments for services and future hardware deliverables over the contract period. The Company records consideration received related to the future purchase as deferred revenue until all revenue recognition criteria are met, which is generally when the products or services are delivered.
In 2016, the Company introduced the TASER 60 Plan ("TASER 60") whereby a customer typically enters into a
five
year CEW installment purchase arrangement. The TASER 60 plan also includes extended warranties on the CEW devices upon delivery covering the contract periods as well as on-site spares, holsters and cartridges. Generally, the Company recognizes revenue for the amount allocated to the CEW at the time of sale for the amount of the customer receivable, net of imputed interest, and the amount allocated to the extended warranty is recognized over
five
years.
Sales tax collected on sales is netted against government remittances and thus, recorded on a net basis. Training revenue is recorded as the service is provided.
Deferred revenue consists of payments received in advance related to products and services for which the criteria for revenue recognition have not yet been met. Deferred revenue that will be recognized during the succeeding twelve month period is recorded as current deferred revenue and the remaining portion is recorded as long-term. Deferred revenue does not include future revenue
53
TASER INTERNATIONAL, INC.
NOTES TO CONSOLIDATED FINANCIAL STATEMENTS – (Continued)
from multi-year contracts for which no invoice has yet been created. Generally, customers are billed in annual installments. See Note 7 for further disclosures about of the Company’s deferred revenue.
Sales are typically made on credit and the Company generally does not require collateral. Management performs ongoing credit evaluations of its customers’ financial condition and maintains an allowance for estimated potential losses. Uncollectible accounts are charged to expense when deemed uncollectible, and accounts and notes receivable are presented net of an allowance for doubtful accounts. This allowance represents management’s best estimate and is based on their judgment after considering a number of factors, including third-party credit reports, actual payment history, cash discounts, customer-specific financial information and broader market and economic trends and conditions.
i. Cost of Products Sold and Services Provided
Cost of products sold represents manufacturing costs, consisting of materials, labor and overhead related to finished goods and components. Shipping costs incurred related to product delivery are also included in cost of products sold. Cost of services delivered includes third-party cloud services, and software maintenance and support costs, including personnel costs, associated with supporting Evidence.com.
j. Advertising Costs
The Company expenses advertising costs in the period in which they are incurred. The Company incurred advertising costs of
$0.4 million
,
$0.6 million
and
$0.3 million
in the years ended December 31,
2016
,
2015
and
2014
, respectively. Advertising costs are included in sales, general and administrative expenses in the accompanying statements of operations.
k. Standard Warranties
The Company warranties its CEWs, Axon cameras and certain related accessories from manufacturing defects on a limited basis for a period of
one
year after purchase and, thereafter, will replace any defective unit for a fee. Estimated costs for the standard warranty are charged to cost of products sold and services delivered when revenue is recorded for the related product. Future warranty costs are estimated based on historical data related to returns and warranty costs on a quarterly basis and this rate is applied to current product sales. Historically, reserve amounts have been increased if management becomes aware of a component failure that could result in larger than anticipated returns from customers. The accrued warranty liability expense is reviewed quarterly to verify that it sufficiently reflects the remaining warranty obligations based on the anticipated expenditures over the balance of the warranty obligation period, and adjustments are made when actual warranty claim experience differs from estimates. Costs related to extended warranties are charged to cost of products sold and services delivered when incurred. The reserve for warranty returns is included in accrued liabilities on the accompanying consolidated balance sheets.
Changes in the Company’s estimated product warranty liabilities were as follows (in thousands):
|
2016
|
2015
|
2014
|
|||||||||
|
Balance, January 1
|
$
|
314
|
|
$
|
675
|
|
$
|
955
|
|
||
|
Utilization of accrual
|
(155
|
)
|
(299
|
)
|
(676
|
)
|
|||||
|
Warranty expense (recoveries)
|
621
|
|
(62
|
)
|
396
|
|
|||||
|
Balance, December 31
|
$
|
780
|
|
$
|
314
|
|
$
|
675
|
|
||
l. Research and Development Expenses
The Company expenses as incurred research and development costs that do not meet the qualifications to be capitalized. The Company incurred research and development expense of
$30.6 million
,
$23.6 million
and
$14.9 million
, in
2016
,
2015
and
2014
, respectively.
m. Income Taxes
Income taxes are accounted for under the asset and liability method. Deferred tax assets and liabilities are recognized for the future tax consequences attributable to differences between the financial statement amounts of assets and liabilities and their respective tax bases and operating loss and tax credit carry forwards. Deferred tax assets and liabilities are measured using enacted
54
TASER INTERNATIONAL, INC.
NOTES TO CONSOLIDATED FINANCIAL STATEMENTS – (Continued)
tax rates expected to apply to taxable income in future years in which those temporary differences are expected to be recovered or settled. The effect on deferred tax assets and liabilities of a change in tax rate is recognized in income in the period that includes the enactment date. Deferred tax assets are reduced through the establishment of a valuation allowance if, based upon available evidence, it is determined that it is more likely than not that the deferred tax assets will not be realized.
The Company recognizes the tax benefit from an uncertain tax position only if it is more likely than not that the tax position will be sustained on examination by the taxing authorities, based on the technical merits of the position. The tax benefits recognized in the consolidated financial statements from such a position are measured based on the largest benefit that has a greater than
50%
likelihood of being realized upon ultimate resolution. Management also assesses whether uncertain tax positions, as filed, could result in the recognition of a liability for possible interest and penalties. The Company’s policy is to include interest and penalties related to unrecognized tax benefits as a component of income tax expense. Refer to Note 10 for additional information regarding the change in unrecognized tax benefits.
n. Concentration of Credit Risk and Major Customers / Suppliers
Financial instruments that potentially subject the Company to concentrations of credit risk consist of accounts and notes receivable and cash. Sales are typically made on credit and the Company generally does not require collateral. Management performs ongoing credit evaluations of its customers’ financial condition and maintains an allowance for estimated losses. Uncollectible accounts are written off when deemed uncollectible, and accounts receivable are presented net of an allowance for doubtful accounts, which totaled
$0.4 million
and
$0.3 million
as of December 31,
2016
and
2015
, respectively. Historically, the Company has experienced a low level of write-offs related to doubtful accounts.
The Company maintains the majority of its cash and cash equivalents accounts at
five
depository institutions. As of December 31,
2016
, the aggregate balances in such accounts were
$33.2 million
. The Company’s balances with these institutions regularly exceed Federal Deposit Insurance Corporation (“FDIC”) insured limits for domestic deposits and various deposit insurance programs covering our deposits in the Netherlands, the United Kingdom, Germany and Australia. To manage the related credit exposure, management continually monitors the creditworthiness of the financial institutions where the Company has deposits.
The Company sells some of its products through a network of unaffiliated distributors. The Company also reserves the right to sell directly to the end user to secure the customer’s account.
No
customer represented more than 10% of total net sales for the years ended December 31,
2016
,
2015
or
2014
.
At December 31,
2016
and
2015
, the Company had a trade receivable from
one
unaffiliated customer comprising
14.5%
and
12.5%
, respectively, of the aggregate accounts receivable balance.
The Company currently purchases finished circuit boards and injection-molded plastic components from suppliers located in the U.S., Mexico and Taiwan. Although the Company currently obtains many of these components from single source suppliers, the Company owns the injection molded component tooling used in their production. As a result, management believes it could obtain alternative suppliers in most cases without incurring significant production delays. The Company also purchases small, machined parts from a vendor in Taiwan, custom cartridge assemblies from a proprietary vendor in the U.S., and electronic components from a variety of foreign and domestic distributors. Management believes that there are readily available alternative suppliers in most cases who can consistently meet the Company's needs for these components. The Company acquires most of its components on a purchase order basis and does not have any significant long-term contracts with suppliers.
o. Fair Value of Financial Instruments
The Company uses the fair value framework that prioritizes the inputs to valuation techniques for measuring financial assets and liabilities measured on a recurring basis and for non-financial assets and liabilities when these items are re-measured. Fair value is considered to be the exchange price in an orderly transaction between market participants, to sell an asset or transfer a liability at the measurement date. The hierarchy below lists three levels of fair value based on the extent to which inputs used in measuring fair value are observable in the market. The Company categorizes each of its fair value measurements in one of these three levels based on the lowest level input that is significant to the fair value measurement in its entirety. These levels are:
|
•
|
Level 1 – Valuation techniques in which all significant inputs are unadjusted quoted prices from active markets for assets or liabilities that are identical to the assets or liabilities being measured.
|
55
TASER INTERNATIONAL, INC.
NOTES TO CONSOLIDATED FINANCIAL STATEMENTS – (Continued)
|
•
|
Level 2 – Valuation techniques in which significant inputs include quoted prices from active markets for assets or liabilities that are similar to the assets or liabilities being measured and/or quoted prices for assets or liabilities that are identical or similar to the assets or liabilities being measured from markets that are not active. Also, model-derived valuations in which all significant inputs and significant value drivers are observable in active markets are Level 2 valuation techniques.
|
|
•
|
Level 3 – Valuation techniques in which one or more significant inputs or significant value drivers are unobservable. Unobservable inputs are valuation technique inputs that reflect the Company's own assumptions about inputs that market participants would use in pricing an asset or liability.
|
The Company has cash equivalents and investments, which at December 31,
2016
and
2015
, were comprised of money market funds, state and municipal obligations, corporate bonds, and certificates of deposits. See additional disclosure regarding the fair value of the Company’s cash equivalents and investments in Note 2. Included in the balance of other assets as of December 31,
2016
and
2015
was
$3.2 million
and
$2.2 million
, respectively, related to corporate-owned life insurance policies which are used to fund the Company’s deferred compensation plan. The Company determines the fair value of its insurance contracts by obtaining the cash surrender value of the contracts from the issuer, a Level 2 valuation technique.
The Company’s financial instruments also include accounts and notes receivable, accounts payable and accrued liabilities. Due to the short-term nature of these instruments, their fair values approximate their carrying values on the balance sheet.
p. Segment and Geographic Information
The Company is comprised of
two
reportable segments: the sale of CEWs, accessories and other products and services (the “TASER Weapons” segment); and the Axon business, focused on devices, wearables, applications, cloud and mobile products (the "Axon" segment). Reportable segments are determined based on discrete financial information reviewed by the Company’s Chief Executive Officer who is the chief operating decision maker for the Company. The Company organizes and reviews operations based on products and services, and currently there are no operating segments that are aggregated. The Company performs an annual analysis of its reportable segments. Additional information related to the Company’s business segments is summarized in Note 16.
For the three years ended December 31,
2016
,
2015
and
2014
, net sales by geographic area were as follows (in thousands):
|
|
Year Ended December 31,
|
|||||||||||||||||||
|
|
2016
|
2015
|
2014
|
|||||||||||||||||
|
United States
|
$
|
218,757
|
|
81.6
|
%
|
$
|
161,803
|
|
81.8
|
%
|
$
|
132,205
|
|
80.4
|
%
|
|||||
|
Other Countries
|
49,488
|
|
18.4
|
|
36,089
|
|
18.2
|
|
32,320
|
|
19.6
|
|
||||||||
|
Total
|
$
|
268,245
|
|
100.0
|
%
|
$
|
197,892
|
|
100.0
|
%
|
$
|
164,525
|
|
100.0
|
%
|
|||||
Sales to customers outside of the U.S. are typically denominated in U.S. dollars and are attributed to each country based on the shipping address of the distributor or customer. For the three years ended December 31,
2016
,
2015
and
2014
,
no
individual country outside the U.S. represented more than
10%
of net sales. Substantially all of the Company’s assets are located in the U.S.
q. Stock-Based Compensation
The Company calculates the fair value of stock options using the Black-Scholes-Merton option pricing valuation model, which incorporates various assumptions including volatility, expected life and risk-free interest rates.
No
options were awarded during the years ended December 31,
2016
,
2015
or
2014
. The fair value of restricted stock units is estimated as the closing price of the Company's common stock on the date of grant.
The estimated fair value of stock-based compensation awards is amortized to expense on a straight-line basis over the requisite service periods. As stock-based compensation expense recognized is based on awards ultimately expected to vest, it is reduced for estimated forfeitures. Forfeitures are estimated at the time of grant and revised, if necessary, in subsequent periods if actual forfeitures differ from those estimates. The Company’s forfeiture rate was calculated based on its historical experience of awards which ultimately vested. See Note 12 for further disclosure about the Company’s stock-based compensation.
56
TASER INTERNATIONAL, INC.
NOTES TO CONSOLIDATED FINANCIAL STATEMENTS – (Continued)
r. Income per Common Share
Basic income per common share is computed by dividing net income by the weighted average number of common shares outstanding during the periods presented. Diluted income per share reflects the potential dilution that would occur if outstanding stock options were exercised utilizing the treasury stock method. The calculation of the weighted average number of shares outstanding and earnings per share are as follows (in thousands except per share data):
|
|
For the Year Ended December 31,
|
||||||||||
|
|
2016
|
2015
|
2014
|
||||||||
|
Numerator for basic and diluted earnings per share:
|
|||||||||||
|
Net income
|
$
|
17,297
|
|
$
|
19,933
|
|
$
|
19,918
|
|
||
|
Denominator:
|
|||||||||||
|
Weighted average shares outstanding—basic
|
52,667
|
|
53,548
|
|
52,948
|
|
|||||
|
Dilutive effect of stock-based awards
|
869
|
|
1,090
|
|
1,552
|
|
|||||
|
Diluted weighted average shares outstanding
|
53,536
|
|
54,638
|
|
54,500
|
|
|||||
|
Anti-dilutive stock-based awards excluded
|
443
|
|
198
|
|
177
|
|
|||||
|
Net income per common share:
|
|||||||||||
|
Basic
|
$
|
0.33
|
|
$
|
0.37
|
|
$
|
0.38
|
|
||
|
Diluted
|
$
|
0.32
|
|
$
|
0.36
|
|
$
|
0.37
|
|
||
s. Recently Issued Accounting Guidance
In May 2014, the Financial Accounting Standards Board (“FASB”) issued Accounting Standards Update (“ASU”) 2014-09, Revenue from Contracts with Customers (Topic 606). ASU 2014-09 requires entities to recognize revenue through the application of a five-step model, which includes identification of the contract, identification of the performance obligations, determination of the transaction price, allocation of the transaction price to the performance obligations and recognition of revenue as the entity satisfies the performance obligations. Subsequently, the FASB issued the following accounting standard updates related to Topic 606, Revenue Contracts with Customers:
|
•
|
ASU No. 2016-08, Revenue from Contracts with Customers (Topic 606): Principal versus Agent Considerations (Reporting Revenue Gross versus Net) in March 2016. ASU 2016-08 does not change the core principle of revenue recognition in Topic 606 but clarifies the implementation guidance on principal versus agent considerations.
|
|
•
|
ASU No. 2016-10, Revenue from Contracts with Customers (Topic 606): Identifying Performance Obligations and Licensing in April 2016. ASU 2016-10 does not change the core principle of revenue recognition in Topic 606 but clarifies the implementation guidance on identifying performance obligations and the licensing
|
|
•
|
ASUs No. 2016-12 and 2016-20, Revenue from Contracts with Customers (Topic 606): Narrow-Scope Improvements and Practical Expedients. These ASUs do not change the core principle of revenue recognition in Topic 606 but clarifies the implementation guidance on a few narrow areas and adds some practical expedients to the guidance.
|
The amendments are effective for annual reporting periods beginning after December 15, 2017, including interim periods within that reporting period. During Fiscal 2016, the Company established an internal implementation team and engaged a third-party advisory firm to assist in the implementation of the new standard. The Company is currently finalizing its assessment relative to the adoption of this guidance, and currently does not expect it will have significant impact on its consolidated financial statements. The Company is also evaluating whether to adopt the guidance using the full or modified retrospective basis, and will likely make that determination during the first half of Fiscal 2017.
In July 2015, the FASB issued ASU 2015-11, Inventory (Topic 330). The amendments require that an entity should measure inventory at the lower of cost and net realizable value. Net realizable value is the estimated prices in the ordinary course of business, less reasonably predictable costs of completion, disposal, and transportation. The Company adopted this guidance effective January 1, 2017 and does not expect this ASU to have a material impact on its consolidated financial statements.
In February 2016, the FASB issued ASU 2016-02, Leases (Topic 842) in order to increase transparency and comparability among organizations by recognizing lease assets and lease liabilities on the balance sheet for those leases classified as operating
57
TASER INTERNATIONAL, INC.
NOTES TO CONSOLIDATED FINANCIAL STATEMENTS – (Continued)
leases under previous GAAP. ASU 2016-02 requires that a lessee should recognize a liability to make lease payments (the lease liability) and a right-of-use asset representing its right to use the underlying asset for the lease term on the balance sheet. ASU 2016-02 is effective for the fiscal year beginning after December 15, 2018 (including interim periods within that year) using a modified retrospective approach and early adoption is permitted. The Company is currently in the process of evaluating the impact of adoption of ASU 2016-02 on its consolidated financial statements.
In March 2016, the FASB issued ASU 2016-09, Improvements to Employee Share-Based Payment Accounting, which amends Accounting Standards Codification (Topic 718), Compensation – Stock Compensation. ASU 2016-09 simplifies several aspects of the accounting for share-based payment transactions, including the income tax consequences, classification of awards as either equity or liabilities, and classification on the statement of cash flows. The Company adopted this guidance effective January 1, 2017. Under this standard, all excess tax benefits and tax deficiencies related to stock compensation will be recognized as income tax expense or benefit in the consolidated statement of operations. The Company will recognize excess tax benefits regardless of whether the benefit reduces taxes payable in the current period, subject to normal valuation allowance considerations. The standard will be applied using a modified retrospective transition method by means of a cumulative-effect adjustment to equity as of the beginning of Fiscal 2017. The Company does not expect the provisions of this ASU to have a material impact on its consolidated financial statements.
In June 2016, the FASB issued ASU 2016-13, Financial Instruments - Credit Losses, which amends ASC 326. The new guidance differs from existing GAAP wherein previous objectives generally delayed recognition of credit losses until the loss was probable. ASU 2016-13 eliminates the probable initial recognition threshold and, instead, reflect an entity’s current estimate of all expected credit losses. The use of forecasted information is intended to incorporate more timely information in the estimate of expected credit loss. ASU 2016-13 is effective for the fiscal year beginning after December 15, 2019, and interim periods within that fiscal year, and early adoption is permitted. The Company is currently in the process of evaluating the impact of adoption of ASU 2016-13 on its consolidated financial statements.
In August 2016, the FASB issued ASU 2016-15, Statement of Cash Flows (Topic 230): Classification of Certain Cash Receipts and Cash Payments. ASU 2016-15 eliminates the diversity in practice related to the classification of certain cash receipts and payments. ASU 2016-15 designates the appropriate cash flow classification, including requirements to allocate certain components of these cash receipts and payments among operating, investing and financing activities. ASU 2016-15 is effective for the fiscal year beginning after December 15, 2017, and interim periods within that fiscal year, and early adoption is permitted. The retrospective transition method, requiring adjustment to all comparative periods presented, is required unless it is impracticable for some of the amendments, in which case those amendments would be prospectively as of the earliest date practicable. The Company does not expect the adoption of this ASU to have a material impact on its consolidated financial statements.
In October 2016, the FASB issued ASU 2016-16, Income Taxes (Topic 740) - Intra-Entity Transfers of Assets Other Than Inventory. ASU 2016-16 requires an entity to recognize income tax consequences of an intra-entity transfer of an asset other than inventory when the transfer occurs. This removes the exception to postpone recognition until the asset has been sold to an outside party. ASU 2016-16 is effective for fiscal year beginning after December 15, 2017 using a modified retrospective approach, and early adoption is permitted. The Company is currently in the process of evaluating the impact of adoption of ASU 2016-16 on its consolidated financial statements.
In November 2016, the FASB issued ASU 2016-18, Statement of Cash Flows - Restricted Cash (Topic 230), which amends the existing guidance relating to the disclosure of restricted cash and restricted cash equivalents on the statement of cash flows. ASU 2016-18 is effective for the fiscal year beginning after December 15, 2017, and interim periods within that fiscal year, and early adoption is permitted. The Company is currently in the process of evaluating the impact of adoption of ASU 2016-18 on its Consolidated Statements of Cash Flows.
In January 2017, the FASB issued ASU 2017-01, Business Combinations (Topic 805) to provide a more robust framework to use in determining when a set of assets and activities is a business. ASU 2017-01 is effective for the fiscal year beginning after December 15, 2017, and interim periods within that year and early adoption is permitted. The Company does not expect the adoption of this ASU to have a material impact on its consolidated financial statements.
58
TASER INTERNATIONAL, INC.
NOTES TO CONSOLIDATED FINANCIAL STATEMENTS – (Continued)
t. Foreign Currency Translation
The Company’s foreign subsidiaries use their local currency as their functional currency. Assets and liabilities are translated at exchange rates in effect at the balance sheet date. Income and expense accounts are translated at the average monthly exchange rates during the year. Resulting translation adjustments are recorded as a component of accumulated other comprehensive income on the consolidated balance sheets.
u. Reclassification of Prior Year Presentation
Certain prior year amounts have been reclassified for consistency with the current year presentation. These reclassifications had no effect on the reported results of operations.
2
. Cash, Cash Equivalents and Investments
The following tables summarize the Company's cash, cash equivalents, and held-to-maturity investments at December 31 (in thousands):
|
As of December 31, 2016
|
|||||||||||||||||||||||||||
|
Amortized Cost
|
Gross Unrealized Gains
|
Gross Unrealized Losses
|
Fair Value
|
Cash and Cash Equivalents
|
Short-Term Investments
|
Long-Term Investments
|
|||||||||||||||||||||
|
Cash
|
$
|
32,802
|
|
$
|
—
|
|
$
|
—
|
|
$
|
32,802
|
|
$
|
32,802
|
|
$
|
—
|
|
$
|
—
|
|
||||||
|
Level 1:
|
|||||||||||||||||||||||||||
|
Money market funds
|
7,849
|
|
—
|
|
—
|
|
7,849
|
|
7,849
|
|
—
|
|
—
|
|
|||||||||||||
|
Corporate bonds
|
33,379
|
|
—
|
|
(57
|
)
|
33,322
|
|
—
|
|
33,379
|
|
—
|
|
|||||||||||||
|
Subtotal
|
41,228
|
|
—
|
|
(57
|
)
|
41,171
|
|
7,849
|
|
33,379
|
|
—
|
|
|||||||||||||
|
Level 2:
|
|||||||||||||||||||||||||||
|
State and municipal obligations
|
14,477
|
|
—
|
|
(10
|
)
|
14,467
|
|
—
|
|
14,243
|
|
234
|
|
|||||||||||||
|
Certificates of deposit
|
793
|
|
—
|
|
—
|
|
793
|
|
—
|
|
793
|
|
—
|
|
|||||||||||||
|
Subtotal
|
15,270
|
|
—
|
|
(10
|
)
|
15,260
|
|
—
|
|
15,036
|
|
234
|
|
|||||||||||||
|
Total
|
$
|
89,300
|
|
$
|
—
|
|
$
|
(67
|
)
|
$
|
89,233
|
|
$
|
40,651
|
|
$
|
48,415
|
|
$
|
234
|
|
||||||
|
As of December 31, 2015
|
|||||||||||||||||||||||||||
|
Amortized Cost
|
Gross Unrealized Gains
|
Gross Unrealized Losses
|
Fair Value
|
Cash and Cash Equivalents
|
Short-Term Investments
|
Long-Term Investments
|
|||||||||||||||||||||
|
Cash
|
$
|
57,137
|
|
$
|
—
|
|
$
|
—
|
|
$
|
57,137
|
|
$
|
57,137
|
|
$
|
—
|
|
$
|
—
|
|
||||||
|
Level 1:
|
|||||||||||||||||||||||||||
|
Money market funds
|
2,389
|
|
—
|
|
—
|
|
2,389
|
|
2,389
|
|
—
|
|
—
|
|
|||||||||||||
|
Corporate bonds
|
36,406
|
|
—
|
|
(70
|
)
|
36,336
|
|
—
|
|
35,677
|
|
729
|
|
|||||||||||||
|
Subtotal
|
38,795
|
|
—
|
|
(70
|
)
|
38,725
|
|
2,389
|
|
35,677
|
|
729
|
|
|||||||||||||
|
Level 2:
|
|||||||||||||||||||||||||||
|
State and municipal obligations
|
19,002
|
|
11
|
|
(9
|
)
|
19,004
|
|
—
|
|
12,000
|
|
7,002
|
|
|||||||||||||
|
Certificates of deposit
|
3,371
|
|
—
|
|
—
|
|
3,371
|
|
—
|
|
2,577
|
|
794
|
|
|||||||||||||
|
Subtotal
|
22,373
|
|
11
|
|
(9
|
)
|
22,375
|
|
—
|
|
14,577
|
|
7,796
|
|
|||||||||||||
|
Total
|
$
|
118,305
|
|
$
|
11
|
|
$
|
(79
|
)
|
$
|
118,237
|
|
$
|
59,526
|
|
$
|
50,254
|
|
$
|
8,525
|
|
||||||
The Company believes the unrealized losses on the Company’s investments are due to interest rate fluctuations. As these investments are either short-term in nature, are expected to be redeemed at par value and/or because the Company has the ability
59
TASER INTERNATIONAL, INC.
NOTES TO CONSOLIDATED FINANCIAL STATEMENTS – (Continued)
and intent to hold these investments to maturity, the Company does not consider these investments to be other than temporarily impaired at December 31,
2016
. None of Company’s investments have been in an unrealized loss position for more than one year.
The following table summarizes the amortized cost and fair value of the short-term and long-term investments held by the Company at December 31,
2016
by contractual maturity (in thousands):
|
Amortized Cost
|
Fair Value
|
||||||
|
Due in less than one year
|
$
|
48,415
|
|
$
|
48,349
|
|
|
|
Due after one year, through two years
|
234
|
|
233
|
|
|||
|
Due after two years
|
—
|
|
—
|
|
|||
|
Total short-term and long-term investments
|
$
|
48,649
|
|
$
|
48,582
|
|
|
3. Inventory
Inventories consisted of the following at December 31 (in thousands):
|
2016
|
2015
|
||||||
|
Raw materials
|
$
|
18,002
|
|
$
|
8,853
|
|
|
|
Finished goods
|
16,839
|
|
6,910
|
|
|||
|
Total inventory
|
$
|
34,841
|
|
$
|
15,763
|
|
|
4. Property and Equipment
Property and equipment consisted of the following at December 31 (in thousands):
|
Estimated
Useful Life
|
2016
|
2015
|
|||||||
|
Land
|
N/A
|
$
|
2,900
|
|
$
|
2,900
|
|
||
|
Building and leasehold improvements
|
3-39 years
|
15,295
|
|
15,246
|
|
||||
|
Production equipment
|
3-7 years
|
19,849
|
|
18,689
|
|
||||
|
Computer equipment
|
3-5 years
|
7,985
|
|
8,048
|
|
||||
|
Furniture and office equipment
|
5-7 years
|
4,990
|
|
4,116
|
|
||||
|
Vehicles
|
5 years
|
675
|
|
713
|
|
||||
|
Website development costs
|
3 years
|
601
|
|
601
|
|
||||
|
Capitalized software development costs
|
3 years
|
3,695
|
|
3,670
|
|
||||
|
Construction-in-process
|
N/A
|
5,813
|
|
3,885
|
|
||||
|
Total cost
|
61,803
|
|
57,868
|
|
|||||
|
Less: Accumulated depreciation
|
(37,799
|
)
|
(36,020
|
)
|
|||||
|
Property and equipment, net
|
$
|
24,004
|
|
$
|
21,848
|
|
|||
Depreciation and amortization expense relative to property and equipment, including equipment under capital lease, was
$2.5 million
,
$2.3 million
and
$4.0 million
for the years ended December 31,
2016
,
2015
and
2014
, respectively, of which
$0.7 million
,
$0.7 million
and
$2.8 million
was included in cost of products sold and services delivered for the respective years.
60
TASER INTERNATIONAL, INC.
NOTES TO CONSOLIDATED FINANCIAL STATEMENTS – (Continued)
5. Goodwill and Intangible Assets
The changes in the carrying amount of goodwill for the year ended December 31,
2016
were as follows (in thousands):
|
Balance, January 1, 2015
|
$
|
9,596
|
|
|
Goodwill acquired
|
1,615
|
|
|
|
Purchase accounting adjustments
|
(520
|
)
|
|
|
Foreign currency translation adjustments
|
(249
|
)
|
|
|
Balance, December 31, 2016
|
$
|
10,442
|
|
Intangible assets (other than goodwill) consisted of the following (in thousands):
|
|
|
December 31, 2016
|
December 31, 2015
|
||||||||||||||||||||||
|
Useful
Life
|
Gross
Carrying
Amount
|
Accumulated
Amortization
|
Net
Carrying
Amount
|
Gross
Carrying
Amount
|
Accumulated
Amortization
|
Net
Carrying
Amount
|
|||||||||||||||||||
|
Amortized:
|
|||||||||||||||||||||||||
|
Domain names
|
5-10 years
|
$
|
3,161
|
|
$
|
(125
|
)
|
$
|
3,036
|
|
$
|
125
|
|
$
|
(120
|
)
|
$
|
5
|
|
||||||
|
Issued patents
|
4-15 years
|
1,942
|
|
(780
|
)
|
1,162
|
|
1,866
|
|
(659
|
)
|
1,207
|
|
||||||||||||
|
Issued trademarks
|
3-11 years
|
655
|
|
(320
|
)
|
335
|
|
603
|
|
(255
|
)
|
348
|
|
||||||||||||
|
Customer relationships
|
4-8 years
|
914
|
|
(240
|
)
|
674
|
|
1,035
|
|
(93
|
)
|
942
|
|
||||||||||||
|
Non-compete agreements
|
3-4 years
|
465
|
|
(236
|
)
|
229
|
|
464
|
|
(164
|
)
|
300
|
|
||||||||||||
|
Developed technology
|
5-7 years
|
8,661
|
|
(824
|
)
|
7,837
|
|
3,470
|
|
(326
|
)
|
3,144
|
|
||||||||||||
|
Total amortized
|
15,798
|
|
(2,525
|
)
|
13,273
|
|
7,563
|
|
(1,617
|
)
|
5,946
|
|
|||||||||||||
|
Not amortized:
|
|||||||||||||||||||||||||
|
TASER trademark
|
900
|
|
900
|
|
900
|
|
900
|
|
|||||||||||||||||
|
Patents and trademarks pending
|
1,045
|
|
1,045
|
|
742
|
|
742
|
|
|||||||||||||||||
|
Total not amortized
|
1,945
|
|
1,945
|
|
1,642
|
|
1,642
|
|
|||||||||||||||||
|
Total intangible assets
|
$
|
17,743
|
|
$
|
(2,525
|
)
|
$
|
15,218
|
|
$
|
9,205
|
|
$
|
(1,617
|
)
|
$
|
7,588
|
|
|||||||
Amortization expense related to intangible assets was
$0.9 million
,
$0.8 million
and
$0.2 million
for the years ended December 31,
2016
,
2015
and
2014
, respectively. Estimated amortization for intangible assets with definitive lives for the next five years, and thereafter, is as follows for the years ended December 31 (in thousands):
|
2017
|
$
|
2,281
|
|
|
2018
|
2,268
|
|
|
|
2019
|
2,145
|
|
|
|
2020
|
2,084
|
|
|
|
2021
|
2,076
|
|
|
|
Thereafter
|
2,419
|
|
|
|
Total
|
$
|
13,273
|
|
61
TASER INTERNATIONAL, INC.
NOTES TO CONSOLIDATED FINANCIAL STATEMENTS – (Continued)
6. Other Long-Term Assets
Other long-term assets consisted of the following at December 31 (in thousands):
|
2016
|
2015
|
||||||
|
Cash surrender value of corporate-owned life insurance policies (Note 1)
|
$
|
3,240
|
|
$
|
2,180
|
|
|
|
Prepaid commissions
(i)
|
5,302
|
|
3,543
|
|
|||
|
Restricted cash
(ii)
|
3,317
|
|
—
|
|
|||
|
Prepaid expenses, deposits and other
(iii)
|
2,058
|
|
246
|
|
|||
|
$
|
13,917
|
|
$
|
5,969
|
|
||
(i)
Prepaid commissions represent customer acquisition costs to secure long-term contracts. The Company capitalizes incremental and direct costs related to a specific contract and recognizes expense over the term of the contract.
(ii)
As of December 31, 2016, restricted cash primarily consisted of
$2.7 million
of sales proceeds related to a long-term contract with a specific customer. These proceeds are held in escrow until certain billing milestones are achieved, and then specified amounts are transferred to the Company's operating accounts. Restricted also contained
$0.6 million
related to a performance guarantee related to an international customer sales contract.
(iii)
Included in long-term assets as of December 31, 2016 was
$1.8 million
of funds deposited in escrow related to contingent consideration in connection with a business combination (see Note 15). The funds will be held in escrow and released to selling shareholders if certain conditions are subsequently met. If the conditions are not met, the funds will be released back to the Company.
7. Deferred Revenue
Deferred revenue consisted of the following at December 31 (in thousands):
|
December 31, 2016
|
December 31, 2015
|
||||||||||||||||||||||
|
Current
|
Long-Term
|
Total
|
Current
|
Long-Term
|
Total
|
||||||||||||||||||
|
Warranty:
|
|||||||||||||||||||||||
|
TASER Weapons
|
$
|
9,783
|
|
$
|
17,319
|
|
$
|
27,102
|
|
$
|
7,278
|
|
$
|
13,982
|
|
$
|
21,260
|
|
|||||
|
Axon
|
3,979
|
|
2,926
|
|
6,905
|
|
2,332
|
|
2,344
|
|
4,676
|
|
|||||||||||
|
13,762
|
|
20,245
|
|
34,007
|
|
9,610
|
|
16,326
|
|
25,936
|
|
||||||||||||
|
Hardware:
|
|||||||||||||||||||||||
|
TASER Weapons
|
1,702
|
|
4,390
|
|
6,092
|
|
952
|
|
2,459
|
|
3,411
|
|
|||||||||||
|
Axon
|
9,850
|
|
11,205
|
|
21,055
|
|
786
|
|
7,382
|
|
8,168
|
|
|||||||||||
|
11,552
|
|
15,595
|
|
27,147
|
|
1,738
|
|
9,841
|
|
11,579
|
|
||||||||||||
|
Axon Services
|
19,626
|
|
4,214
|
|
23,840
|
|
9,303
|
|
4,023
|
|
13,326
|
|
|||||||||||
|
Other
|
197
|
|
—
|
|
197
|
|
200
|
|
—
|
|
200
|
|
|||||||||||
|
Total
|
$
|
45,137
|
|
$
|
40,054
|
|
$
|
85,191
|
|
$
|
20,851
|
|
$
|
30,190
|
|
$
|
51,041
|
|
|||||
|
December 31, 2016
|
December 31, 2015
|
||||||||||||||||||||||
|
Current
|
Long-Term
|
Total
|
Current
|
Long-Term
|
Total
|
||||||||||||||||||
|
TASER Weapons and other
|
$
|
11,682
|
|
$
|
21,709
|
|
$
|
33,391
|
|
$
|
8,430
|
|
$
|
16,441
|
|
$
|
24,871
|
|
|||||
|
Axon
|
33,455
|
|
18,345
|
|
51,800
|
|
12,421
|
|
13,749
|
|
26,170
|
|
|||||||||||
|
Total
|
$
|
45,137
|
|
$
|
40,054
|
|
$
|
85,191
|
|
$
|
20,851
|
|
$
|
30,190
|
|
$
|
51,041
|
|
|||||
62
TASER INTERNATIONAL, INC.
NOTES TO CONSOLIDATED FINANCIAL STATEMENTS – (Continued)
8. Accrued Liabilities
Accrued liabilities consisted of the following at December 31 (in thousands):
|
2016
|
2015
|
||||||
|
Accrued salaries, benefits and bonus
|
$
|
6,474
|
|
$
|
3,637
|
|
|
|
Accrued professional, consulting and lobbying
|
3,673
|
|
1,098
|
|
|||
|
Accrued warranty expense
|
780
|
|
314
|
|
|||
|
Accrued income and other taxes
|
4,581
|
|
1,215
|
|
|||
|
Other accrued expenses
|
2,740
|
|
2,379
|
|
|||
|
Accrued liabilities
|
$
|
18,248
|
|
$
|
8,643
|
|
|
9. Commitments and Contingencies
a. Operating and capital lease obligations
The Company has entered into operating leases for various office space, storage facilities and equipment. As of December 31,
2016
, the Company's leases are for terms ranging from less than
one
year to
six
years. The Company's leases generally contain multi-year renewal options and escalation clauses. Rent expense under all operating leases, including both cancelable and non-cancelable leases, was
$1.8 million
,
$1.0 million
and
$0.9 million
for the years ended December 31,
2016
,
2015
, and
2014
, respectively.
Future minimum lease payments under non-cancelable leases at December 31,
2016
, are as follows (in thousands):
|
Operating
|
Capital
|
||||||
|
2017
|
$
|
1,440
|
|
$
|
36
|
|
|
|
2018
|
1,278
|
|
36
|
|
|||
|
2019
|
646
|
|
36
|
|
|||
|
2020
|
653
|
|
33
|
|
|||
|
2021
|
596
|
|
—
|
|
|||
|
Thereafter
|
504
|
|
—
|
|
|||
|
Total minimum lease payments
|
$
|
5,117
|
|
141
|
|
||
|
Less: Amount representing interest
|
(11
|
)
|
|||||
|
Capital lease obligation
|
$
|
130
|
|
||||
b. Purchase commitments
The Company routinely enters into cancelable purchase orders with many of its key vendors. Based on the strategic relationships with many of these vendors, the Company’s ability to cancel these purchase orders and maintain a favorable relationship would be limited. As of December 31,
2016
, the Company has approximately
$46.0 million
of open purchase orders.
c. Litigation
Product Litigation
The Company is currently named as a defendant in
eight
lawsuits in which the plaintiffs allege either wrongful death or personal injury in situations in which a TASER CEW was used (or present) by law enforcement officers in connection with arrests or during training exercises. While the facts vary from case to case, the product liability claims are typically based on an alleged product defect resulting in injury or death, usually involving a failure to warn, and the plaintiffs are seeking monetary damages. The information throughout this note is current through the date of these financial statements.
As a general rule, it is the Company’s policy not to settle suspect injury or death cases. Exceptions are sometimes made where the settlement is strategically beneficial to the Company. Also, on occasion, the Company’s insurance carrier has settled such lawsuits over the Company’s objection where the risk is over the Company’s liability insurance deductibles. Due to the
63
TASER INTERNATIONAL, INC.
NOTES TO CONSOLIDATED FINANCIAL STATEMENTS – (Continued)
confidentiality of the Company's litigation strategy and the confidentiality agreements that are executed in the event of a settlement, the Company does not identify or comment on which specific lawsuits have been settled or the amount of any settlement.
In 2009, the Company implemented new risk management strategies, including revisions to product warnings and training to better protect both the Company and its customers from litigation based on ‘failure to warn’ theories – which comprise the vast majority of the cases against the Company. These risk management strategies have been highly effective in reducing the rate and exposure from litigation post-2009. From the third quarter of 2011 through the date of these financial statements, product liability cases have been reduced from
55
active to
eight
active cases.
Management believes that pre-2009 cases have a different risk profile than cases which have occurred since the risk management procedures were introduced in 2009. Therefore, the Company necessarily treats certain pre-2009 cases as exceptions to the Company’s general no settlement policy in order to reduce caseload, legal costs and liability exposure. The Company intends to continue its successful practice of aggressively defending and generally not settling litigation except in very limited and unusual circumstances as described above.
With respect to each of the pending lawsuits, the following table lists the name of plaintiff, the date the Company was served with process, the jurisdiction in which the case is pending, the type of claim and the status of the matter.
|
Plaintiff
|
|
Month
Served
|
|
Jurisdiction
|
|
Claim Type
|
|
Status
|
|
Derbyshire
|
|
Nov-09
|
|
Ontario, Canada Superior Court of Justice
|
|
Officer Injury
|
|
Discovery Phase
|
|
Shymko
|
|
Dec-10
|
|
The Queen's Bench, Winnipeg Centre, Manitoba
|
|
Wrongful Death
|
|
Pleading Phase
|
|
Ramsey
|
|
Jan-12
|
|
12th Judicial Circuit Court, Broward County, FL
|
|
Wrongful Death
|
|
Discovery Phase
|
|
Firman
|
|
Apr-12
|
|
Ontario, Canada Superior Court of Justice
|
|
Wrongful Death
|
|
Dismissal Pending
|
|
Schrock
|
|
Sep-14
|
|
San Bernardino County Superior Court, CA
|
|
Wrongful Death
|
|
Motion of Summary Judgment Granted on all claims except negligent design and manufacture, subject to repleading by Plaintiff. Plaintiff filed an amended complaint for negligent design claims as well as a Petition for Writ of Mandate or Prohibition Petition from the Court; which writ was summarily denied. Trial scheduled for August 14, 2017
|
|
Bennett
|
Sep-15
|
11th Judicial Circuit Court, Miami-Dade County, FL
|
Wrongful Death
|
Discovery Phase
|
||||
|
Suarez
|
Sep-16
|
US District Court, Southern District of Florida
|
Wrongful Death
|
Pleading Phase
|
||||
|
Masters
|
Nov-16
|
US District Court, Western District of Missouri
|
Suspect Injury
|
Pleading Phase
|
||||
There are no product litigation matters in which the Company is involved that are currently on appeal.
There were
4
cases that were dismissed or judgment entered during the fourth quarter of 2016 and through the date of these financial statements. Cases that were dismissed or judgment entered in prior fiscal quarters are not included.
|
Plaintiff
|
|
Month
Served
|
|
Jurisdiction
|
|
Claim Type
|
|
Status
|
|
Doan
|
|
Apr-10
|
|
The Queen's Bench Alberta, Red Deer Judicial Dist.
|
|
Wrongful Death
|
|
Dismissed
|
|
Hernandez/Llach
|
Sep-15
|
11th Judicial Circuit Court, Miami-Dade County, FL
|
Wrongful Death
|
Dismissed
|
||||
|
Williams
|
Aug-16
|
US District Court for the Northern District of Georgia
|
Wrongful Death
|
Dismissed
|
||||
|
Ramos
|
Dec-16
|
US District Court for the Northern District of Illinois
|
Conspiracy and negligent spoliation
|
Dismissed
|
||||
64
TASER INTERNATIONAL, INC.
NOTES TO CONSOLIDATED FINANCIAL STATEMENTS – (Continued)
The claims, and in some instances the defense, of each of these lawsuits have been submitted to the Company’s insurance carriers that maintained insurance coverage during the applicable periods. The Company continues to maintain product liability insurance coverage with varying limits and deductibles. The following table provides information regarding the Company’s product liability insurance. Remaining insurance coverage is based on information received from the Company’s insurance provider (in millions).
|
Policy Year
|
Policy
Start
Date
|
Policy
End
Date
|
Insurance
Coverage
|
Deductible
Amount
|
Defense
Costs
Covered
|
Remaining
Insurance
Coverage
|
Active Cases and Cases on
Appeal
|
|||||||||||||
|
2009
|
12/15/2008
|
12/15/2009
|
$
|
10.0
|
|
$
|
1.0
|
|
N
|
$
|
10.0
|
|
Derbyshire
|
|||||||
|
2010
|
12/15/2009
|
12/15/2010
|
10.0
|
|
1.0
|
|
N
|
10.0
|
|
Shymko
|
||||||||||
|
2011
|
12/15/2010
|
12/15/2011
|
10.0
|
|
1.0
|
|
N
|
10.0
|
|
n/a
|
||||||||||
|
Jan-Jun 2012
|
12/15/2011
|
6/25/2012
|
7.0
|
|
1.0
|
|
N
|
7.0
|
|
Ramsey, Firman
|
||||||||||
|
Jul-Dec 2012
|
6/25/2012
|
12/15/2012
|
12.0
|
|
1.0
|
|
N
|
12.0
|
|
n/a
|
||||||||||
|
2013
|
12/15/2012
|
12/15/2013
|
12.0
|
|
1.0
|
|
N
|
12.0
|
|
n/a
|
||||||||||
|
2014
|
12/15/2013
|
12/15/2014
|
11.0
|
|
4.0
|
|
N
|
11.0
|
|
Schrock
|
||||||||||
|
2015
|
12/15/2014
|
12/15/2015
|
10.0
|
|
5.0
|
|
N
|
10.0
|
|
Bennett
|
||||||||||
|
2016
|
12/15/2015
|
12/15/2016
|
10.0
|
|
5.0
|
|
N
|
10.0
|
|
Suarez, Masters
|
||||||||||
Other Litigation
In November 2015, the Company filed a complaint against Phazzer Electronics Inc. and Sang Min International Co. Ltd. for patent infringement, trademark infringement and false advertising. Defendant Phazzer has filed a motion to dismiss. Phazzer has filed an ex parte review with the USPTO to invalidate the Company’s patent on its data log as well as a cancellation of the Company’s trademark on its cartridge, which cancellation proceeding has been stayed. This litigation is in the motion/discovery phase with a trial date on September 5, 2017.
In February 2016, the Company was served with a first amended complaint filed by Digital Ally in the Federal District Court for the District of Kansas alleging patent infringement, commercial bribery, contracts, combinations and conspiracies in restraint of trade and unfair or anti-competitive acts and practices. In March 2016, the Company was served with a second amended complaint with similar allegations. The second amended complaint seeks a judgment of infringement, monetary damages, a permanent injunction, punitive damages and attorneys’ fees and costs. The Company believes the second amended complaint is frivolous and the Company will vigorously defend this litigation. The Company’s motion to dismiss the claims involving commercial bribery, contracts, combinations and conspiracies in restraint of trade and unfair or anti-competitive acts and practices, was granted. The Company has filed four inter parte reviews with the USPTO to invalidate Digital Ally’s patents and also has filed a motion to stay the litigation pending resolution of the inter parte reviews. This litigation is in the discovery phase.
In April 2016, the Company was served with a notice of arbitration claim filed by Antoine di Zazzo, the Company’s former distributor in France, for commissions allegedly owed Mr. di Zazzo. The arbitration claim was filed with the International Court of Arbitration of the International Chamber of Commerce in Paris, France, and the amount that is claimed in controversy is approximately
$0.6 million
. The Company’s records reflect that all commissions that were due Mr. di Zazzo under his contract were paid or offered to him and the Company will vigorously defend this arbitration claim.
General
From time to time, the Company is notified that it may be a party to a lawsuit or that a claim is being made against it. It is the Company’s policy to not disclose the specifics of any claim or threatened lawsuit until the summons and complaint are actually served on the Company. After carefully assessing the claim, and assuming the Company determines that it is not at fault or it disagrees with the damages or relief demanded, the Company vigorously defends any lawsuit filed against the Company. In certain legal matters, the Company records a liability when losses are deemed probable and reasonably estimable. In evaluating matters for accrual and disclosure purposes, the Company takes into consideration factors such as its historical experience with matters of a similar nature, the specific facts and circumstances asserted, the likelihood of prevailing, and the severity of any potential loss. The Company reevaluates and updates its accruals as matters progress over time.
Based on the Company's assessment of outstanding litigation and claims as of December 31,
2016
, the Company has determined that it is not reasonably possible that these lawsuits will individually, or in the aggregate, materially affect its results of operations, financial condition or cash flows. However, the outcome of any litigation is inherently uncertain and there can be
65
TASER INTERNATIONAL, INC.
NOTES TO CONSOLIDATED FINANCIAL STATEMENTS – (Continued)
no assurance that any expense, liability or damages that may ultimately result from the resolution of these matters will be covered by insurance or will not be in excess of amounts recognized or provided by insurance coverage and will not have a material adverse effect on the Company's operating results, financial condition or cash flows.
d. Employment Agreements
The Company has employment agreements with certain key executives. The Company may terminate the agreements with or without cause. Should the Company terminate the agreements without cause, or upon a change of control of the Company or death or disability of the employee, the employee, or family of the employee, are entitled to additional compensation. Under these circumstances, these officers and employees would receive cash compensation amounts remaining under their contracts upon termination, which range from approximately
$0.7 million
to
$1.3 million
as of December 31,
2016
, depending on the nature of the termination event. In November 2016, the Company announced a transition plan with an executive officer. In connection with the severance agreement, the Company accrued approximately
$0.6 million
as of December 31, 2016, and will incur approximately $0.9 million in additional severance during the first quarter of 2017.
e. Off-Balance Sheet Arrangements
Under certain circumstances, the Company uses letters of credit and surety bonds to guarantee its performance under various contracts, principally in connection with the installation and integration of its Axon cameras and related technologies. Certain of the Company's letters of credit contracts and surety bonds have stated expiration dates with others being released as the contractual performance terms are completed. The Company expects to fulfill all contractual performance obligations related to outstanding guarantees. At December 31,
2016
, the Company had an outstanding letter of credit of approximately
$2.7 million
which is expected to expire in May 2017. Additionally, the Company had approximately
$5.7 million
of outstanding surety bonds at December 31,
2016
, with
$0.4 million
expiring in 2018,
$2.4 million
expiring in 2020, and the remaining
$2.9 million
expiring in 2021.
10. Income Taxes
Income before income taxes included the following components for the years ended December 31 (in thousands):
|
2016
|
2015
|
2014
|
|||||||||
|
United States
|
$
|
38,414
|
|
$
|
42,761
|
|
$
|
32,751
|
|
||
|
Foreign
|
(6,917
|
)
|
(7,400
|
)
|
(440
|
)
|
|||||
|
Total
|
$
|
31,497
|
|
$
|
35,361
|
|
$
|
32,311
|
|
||
66
TASER INTERNATIONAL, INC.
NOTES TO CONSOLIDATED FINANCIAL STATEMENTS – (Continued)
Significant components of the Company’s deferred income tax assets and liabilities are as follows at December 31 (in thousands):
|
2016
|
2015
|
||||||
|
Deferred income tax assets:
|
|||||||
|
Net operating loss carryforward
|
$
|
2,405
|
|
$
|
649
|
|
|
|
Deferred revenue
|
11,537
|
|
6,762
|
|
|||
|
Deferred compensation
|
1,695
|
|
1,252
|
|
|||
|
Inventory reserve
|
1,126
|
|
956
|
|
|||
|
Non-qualified and non-employee stock option expense
|
4,410
|
|
3,393
|
|
|||
|
Capitalized research and development
|
1,991
|
|
3,348
|
|
|||
|
Research and development tax credit carryforward
|
2,722
|
|
2,386
|
|
|||
|
Reserves, accruals, and other
|
1,239
|
|
1,067
|
|
|||
|
Total deferred income tax assets
|
27,125
|
|
19,813
|
|
|||
|
Deferred income tax liabilities:
|
|||||||
|
Depreciation
|
(2,364
|
)
|
(2,228
|
)
|
|||
|
Amortization
|
(1,473
|
)
|
(1,979
|
)
|
|||
|
Other
|
(294
|
)
|
(187
|
)
|
|||
|
Total deferred income tax liabilities
|
(4,131
|
)
|
(4,394
|
)
|
|||
|
Net deferred income tax assets before valuation allowance
|
22,994
|
|
15,419
|
|
|||
|
Valuation allowance
|
(3,479
|
)
|
(1,700
|
)
|
|||
|
Net deferred income tax assets
|
$
|
19,515
|
|
$
|
13,719
|
|
|
For the years ended December 31,
2016
,
2015
and
2014
the provision for income taxes includes
$1.4 million
,
$6.9 million
and
$8.0 million
, respectively, of tax expense resulting from stock-based compensation tax benefits that have been recorded as increases to additional paid-in capital on the consolidated statement of changes in stockholders’ equity.
The Company has
$1.8 million
of state net operating losses ("NOLs") which expire at
various dates between 2029 and 2034
. The Company also has Federal NOLs of
$0.9 million
which expire
between 2032 and 2034
, and are subject to limitation under IRC Section 382. The Company has
$43,000
of federal research and development ("R&D") credits which expire in 2022 and 2023, and are also subject to limitation under IRC Section 382. The Company has
$6.4 million
of Arizona R&D credits carrying forward, which expire at
various dates between 2018 and 2032
, In Australia, the UK, Canada, and Germany, the Company has
$1.5 million
,
$5.5 million
,
$0.7 million
, and
$1.1 million
of NOLs, respectively, which expire at various dates or may be carried forward indefinitely.
In preparing the Company’s consolidated financial statements, management has assessed the likelihood that deferred income tax assets will be realized from future taxable income. In evaluating the ability to recover its deferred income tax assets, management considers all available evidence, positive and negative; including the Company’s operating results, ongoing tax planning and forecasts of future taxable income on a jurisdiction by jurisdiction basis. A valuation allowance is established if it is determined that it is more likely than not that some portion or all of the net deferred income tax assets will not be realized. Management exercises significant judgment in determining the Company’s provisions for income taxes, its deferred income tax assets and liabilities and its future taxable income for purposes of assessing its ability to utilize any future tax benefit from its deferred income tax assets.
Although management believes that its tax estimates are reasonable, the ultimate tax determination involves significant judgments that could become subject to audit by tax authorities in the ordinary course of business. As of each reporting date, management considers new evidence, both positive and negative, that could impact management’s view with regards to future realization of deferred tax assets. As of
December 31, 2016
, the Company continues to demonstrate three-year cumulative pre-tax income in the U.S. federal and Arizona tax jurisdictions; however, the Arizona R&D Tax Credits start to expire in 2018 with a significant tranche with a gross value of
$1.2 million
expiring in 2019. Under the Company’s new structure, it appears that long term investments which impact short term profits will likely result in some of the R&D credits expiring before they are utilized.
67
TASER INTERNATIONAL, INC.
NOTES TO CONSOLIDATED FINANCIAL STATEMENTS – (Continued)
Therefore, management has concluded that it is more likely than not that a portion of the Company’s U.S. deferred tax assets will not be realized.
As of
December 31, 2016
, the Company has cumulative losses in Australia, the UK, Canada, and Germany, which limits the ability to consider other subjective evidence, such as projections for future growth. On the basis of this evaluation, a full valuation allowance has been recorded for these jurisdictions. The amount of the deferred tax asset considered realizable, however, could be adjusted if objective negative evidence in the form of cumulative losses is no longer present and additional weight is given to subjective evidence such as projections for growth.
Significant components of the provision for income taxes are as follows for the years ended December 31 (in thousands)
|
2016
|
2015
|
2014
|
|||||||||
|
Current:
|
|||||||||||
|
Federal
|
$
|
16,346
|
|
$
|
13,594
|
|
$
|
7,793
|
|
||
|
State
|
1,534
|
|
996
|
|
800
|
|
|||||
|
Foreign
|
1,050
|
|
—
|
|
—
|
|
|||||
|
Total current
|
18,930
|
|
14,590
|
|
8,593
|
|
|||||
|
Deferred:
|
|||||||||||
|
Federal
|
(4,145
|
)
|
288
|
|
2,656
|
|
|||||
|
State
|
(977
|
)
|
984
|
|
942
|
|
|||||
|
Foreign
|
(45
|
)
|
(278
|
)
|
—
|
|
|||||
|
Total deferred
|
(5,167
|
)
|
994
|
|
3,598
|
|
|||||
|
Tax provision recorded as an increase (decrease) in liability for unrecorded tax benefits
|
437
|
|
(156
|
)
|
202
|
|
|||||
|
Provision for income taxes
|
$
|
14,200
|
|
$
|
15,428
|
|
$
|
12,393
|
|
||
A reconciliation of the Company’s effective income tax rate to the federal statutory rate follows for the years ended December 31 (in thousands):
|
2016
|
2015
|
2014
|
|||||||||
|
Federal income tax at the statutory rate
|
$
|
11,024
|
|
$
|
12,347
|
|
$
|
11,236
|
|
||
|
State income taxes, net of federal benefit
|
889
|
|
1,061
|
|
1,433
|
|
|||||
|
Difference between statutory and foreign tax rates
(i)
|
1,521
|
|
2,442
|
|
—
|
|
|||||
|
Permanent differences
(ii)
|
(457
|
)
|
(205
|
)
|
98
|
|
|||||
|
Research and development
|
(1,928
|
)
|
(1,050
|
)
|
(452
|
)
|
|||||
|
Return to provision adjustment
|
327
|
|
(67
|
)
|
28
|
|
|||||
|
Change in liability for unrecognized tax benefits
|
700
|
|
(156
|
)
|
202
|
|
|||||
|
Incentive stock option benefit
|
(77
|
)
|
(144
|
)
|
(616
|
)
|
|||||
|
Change in valuation allowance
|
1,779
|
|
1,200
|
|
500
|
|
|||||
|
Tax effects of intercompany transactions
|
630
|
|
—
|
|
—
|
|
|||||
|
Other
|
(208
|
)
|
—
|
|
(36
|
)
|
|||||
|
Provision for income taxes
|
$
|
14,200
|
|
$
|
15,428
|
|
$
|
12,393
|
|
||
|
Effective tax rate
|
45.1
|
%
|
43.6
|
%
|
38.4
|
%
|
|||||
|
(i)
|
The difference between statutory and foreign tax rates of
$1.5 million
was largely driven by losses incurred in a foreign entity for which no tax benefit will be realized, partially reduced by a tax benefit for foreign entities for which the statutory tax rate is lower than the U.S. statutory tax rate.
|
|
(ii)
|
Permanent differences include certain expenses that are not deductible for tax purposes including lobbying fees as well as favorable items including the domestic production activities deduction.
|
68
TASER INTERNATIONAL, INC.
NOTES TO CONSOLIDATED FINANCIAL STATEMENTS – (Continued)
The Company has completed research and development tax credit studies which identified approximately
$14.1 million
in tax credits for federal, Arizona and California income tax purposes related to the 2003 through 2016 tax years. Management has made the determination that it is more likely than not that the full benefit of the R&D tax credit will not be sustained on examination and recorded a liability for unrecognized tax benefits of
$3.9 million
as of
December 31, 2016
. In addition, management accrued approximately
$0.2 million
for estimated uncertain tax positions related to certain state income tax liabilities. Should the unrecognized tax benefit of
$4.1 million
be recognized, the Company’s effective tax rate would be favorably impacted.
The Company recognizes interest and penalties related to unrecognized tax benefits within the income tax expense line in the accompanying Consolidated Statement of Operations. As of December 31,
2016
and
2015
, respectively, the Company had accrued interest of
$98,000
and
$55,000
.
The following table presents a roll forward of the Company's liability for unrecognized tax benefits, exclusive of accrued interest, as of December 31 (in thousands):
|
2016
|
2015
|
2014
|
|||||||||
|
Balance, beginning of period
|
$
|
3,396
|
|
$
|
3,325
|
|
$
|
3,110
|
|
||
|
Decrease in previous year tax positions
|
—
|
|
(389
|
)
|
—
|
|
|||||
|
Increase in current year tax positions
|
448
|
|
270
|
|
121
|
|
|||||
|
Decrease due to lapse of statute of limitations
|
—
|
|
(14
|
)
|
—
|
|
|||||
|
Increase related to adjustment of previous estimates of activity
|
206
|
|
204
|
|
94
|
|
|||||
|
Balance, end of period
|
$
|
4,050
|
|
$
|
3,396
|
|
$
|
3,325
|
|
||
Federal income tax returns for 2004 through 2016 remain open to examination by the U.S. Internal Revenue Service (the “IRS”), while state and local income tax returns for 2004 through 2016 also remain open to examination by state taxing authorities. The 2004 through 2011 income tax returns are only open to the extent that net operating loss or other tax attributes carrying forward from those years were utilized in 2012 through 2016. The foreign tax returns for 2013 through 2016 also remain open to examination. The Company has not been notified by any major federal, foreign, or state tax jurisdictions that it will be subject to examination.
The Company considers the earnings of certain non-U.S. subsidiaries to be indefinitely reinvested outside of the United States on the basis of estimates that future domestic cash generation will be sufficient to meet future domestic cash needs and the Company's specific plans for reinvestment of those subsidiary earnings. It is not practicable to estimate the amount of the deferred tax liability, if any, related to investments in those foreign subsidiaries. If the Company decides to repatriate the foreign earnings, it would need to adjust its income tax provision in the period it determined that the earnings will no longer be indefinitely invested outside the United States.
11. Line of Credit
The Company has a
$10.0 million
revolving line of credit with a domestic bank. At December 31,
2016
and
2015
, there were
no
borrowings under the line. Under the terms of the line of credit, available borrowings are reduced by outstanding letters of credit. As of December 31,
2016
, the Company had letters of credit outstanding of approximately
$2.7 million
under the facility and available borrowing of
$7.3 million
. The line is secured by substantially all of the assets of the Company, and bears interest at varying rates (currently
LIBOR plus 1.5% or Prime less 0.75%
). The line of credit matures on
July 31, 2017
, and requires monthly payments of interest only. The Company’s agreement with the bank requires it to comply with certain financial and other covenants including maintenance of a minimum leverage ratio and fixed charge coverage ratio. The leverage ratio (ratio of total liabilities to tangible net worth) can be no greater than
1
:1, and the fixed charge coverage ratio can be no less than
1.25
:1, based upon a trailing
twelve
-month period. At December 31,
2016
, the Company’s tangible net worth ratio was
1.02
:1 and its fixed charge coverage ratio was
2.30
:1. The Company's violation of the leverage ratio requirement was waived as of December 31, 2016.
12. Stockholders’ Equity
a. Common Stock and Preferred Stock
The Company has authorized the issuance of
two
classes of stock designated as “common stock” and “preferred stock,” each having a par value of
$0.00001
per share. The Company is authorized to issue
200 million
shares of common stock and
25 million
shares of preferred stock.
69
TASER INTERNATIONAL, INC.
NOTES TO CONSOLIDATED FINANCIAL STATEMENTS – (Continued)
b. Stock Repurchase
In February 2016, the Company announced that TASER's Board of Directors authorized a stock repurchase program to acquire up to
$50.0 million
of the Company’s outstanding common stock subject to stock market conditions and corporate considerations. During the year ended December 31, 2016, the Company purchased, under a Rule 10b5-1 plan, approximately
1.8 million
common shares for a total cost of approximately
$33.7 million
, or a weighted average cost of
$18.90
per share. As of December 31, 2016,
$16.2 million
remains available under the plan for future purchases. The Company suspended its 10b-5 plan, and any future purchases will be discretionary.
In May 2014, the Company announced that TASER's Board of Directors authorized a stock repurchase program to acquire up to
$30.0 million
of the Company’s outstanding common stock subject to stock market conditions and corporate considerations. Under this program, which was completed in the third quarter of 2015, the Company purchased approximately
2.0 million
common shares for a total cost of approximately
$30.0 million
, or a weighted average cost, including commissions of
$14.85
per share. As of December 31, 2015,
no
amounts remained available under the plan for future purchases.
c. Stock-based Compensation Plans
The Company has historically utilized stock-based compensation, consisting of restricted stock units (“RSUs”) and stock options, for key employees and non-employee directors as a means of attracting and retaining quality personnel. Service-based grants generally have a vesting period of
3
to
5
years and a contractual maturity of
ten years
. Performance-based grants generally have vesting periods ranging from
1
to
5
years and a contractual maturity of
ten years
.
On February 26, 2016, the Company’s Board of Directors approved the 2016 Stock Incentive Plan (the “2016 Plan") which was subsequently approved by stockholders at the Annual Meeting of Stockholders on May 26, 2016. Under the 2016 Plan, the Company reserved for future grants: (i)
2.0 million
shares of common stock, plus (ii) the number of shares of common stock that were authorized but unissued under the Company’s 2013 Stock Incentive Plan (the “2013 Plan”) as of the effective date of the 2016 Plan, and (iii) the number of shares of stock that have been granted under the 2013 Plan or the 2009 Stock Incentive Plan that either terminate, expire or lapse for any reason after the effective date of the 2016 Plan. As of December 31,
2016
, approximately
2.7 million
shares remain available for future grants. Shares issued upon exercise of stock awards from these plans have historically been issued from the Company’s authorized unissued shares.
d. Performance-based stock awards
The Company has issued performance-based stock options and performance-based RSUs, the vesting of which is generally contingent upon the achievement of certain performance criteria related to the operating performance of the Company as well as successful and timely development and market acceptance of future product introductions. In addition, certain of the performance RSUs have additional service requirements subsequent to the achievement of the performance criteria. Compensation expense is recognized over the implicit service period (the longer of the period the performance condition is expected to be achieved or the required service period) based on management’s estimate of the probability of the performance criteria being satisfied, adjusted at each balance sheet date.
70
TASER INTERNATIONAL, INC.
NOTES TO CONSOLIDATED FINANCIAL STATEMENTS – (Continued)
e. Restricted Stock Units
The following table summarizes RSU activity for the years ended December 31 (number of units and aggregate intrinsic value in thousands):
|
|
2016
|
2015
|
2014
|
||||||||||||||||||
|
Number
of
Units
|
Weighted
Average
Grant-Date
Fair Value
|
Number
of
Units
|
Weighted
Average
Grant-Date
Fair Value
|
Number
of
Units
|
Weighted
Average
Grant-Date
Fair Value
|
||||||||||||||||
|
Units outstanding, beginning of year
|
1,139
|
|
$
|
19.30
|
|
1,226
|
|
$
|
13.23
|
|
1,279
|
|
$
|
9.67
|
|
||||||
|
Granted
|
718
|
|
19.75
|
|
516
|
|
26.18
|
|
554
|
|
16.98
|
|
|||||||||
|
Released
|
(414
|
)
|
15.91
|
|
(488
|
)
|
11.82
|
|
(433
|
)
|
7.61
|
|
|||||||||
|
Forfeited
|
(113
|
)
|
21.65
|
|
(115
|
)
|
16.72
|
|
(174
|
)
|
13.08
|
|
|||||||||
|
Units outstanding, end of year
|
1,330
|
|
20.40
|
|
1,139
|
|
19.30
|
|
1,226
|
|
13.23
|
|
|||||||||
|
Aggregate intrinsic value at year end (in thousands)
|
$
|
32,239
|
|
|
|
||||||||||||||||
Aggregate intrinsic value represents the Company’s closing stock price on the last trading day of the period, which was
$24.24
per share at December 30,
2016
, multiplied by the number of restricted stock units. The fair value as of the respective vesting dates of RSUs that vested during the year ended December 31,
2016
was
$8.4 million
. Certain RSUs that vested in
2016
were net-share settled such that the Company withheld shares with value equivalent to the employees’ minimum statutory obligation for the applicable income and other employment taxes, and remitted the cash to the appropriate taxing authorities. Total shares withheld during
2016
were
88,289
and had a value of approximately
$1.8 million
on their respective vesting dates as determined by the Company’s closing stock price. Payments for the employees’ tax obligations are reflected as a financing activity within the statement of cash flows. These net-share settlements had the effect of share repurchases by the Company as they reduced the amount of shares that would have otherwise been issued as a result of the vesting.
In
2016
,
2015
and
2014
, the Company granted approximately
79,000
,
49,000
and
140,000
performance-based RSUs, respectively (included in the table above). Certain of the performance-based RSUs outstanding as of December 31,
2016
can vest with a range of shares earned being between
0%
and
200%
of the targeted shares granted, depending on the final achievement of pre-determined performance criteria achieved as of the measurement date. As of December 31,
2016
, the performance criteria had been met for
0.1 million
of the
0.2 million
performance-based RSUs outstanding. The Company recognized
$2.1 million
,
$1.5 million
and
$1.0 million
of compensation expense related to performance-based RSUs during the years ended December
2016
,
2015
and
2014
, respectively.
f. Stock Option Activity
The following table summarizes stock option activity for the years ended December 31 (number of options in thousands):
|
|
2016
|
2015
|
2014
|
|||||||||||||||||
|
Number
of
Options
|
Weighted
Average
Exercise
Price
|
Number
of
Options
|
Weighted
Average
Exercise
Price
|
Number
of
Options
|
Weighted
Average
Exercise
Price
|
|||||||||||||||
|
Options outstanding, beginning of year
|
1,103
|
|
$
|
5.37
|
|
1,641
|
|
$
|
5.26
|
|
3,366
|
|
$
|
6.15
|
|
|||||
|
Granted
|
—
|
|
—
|
|
—
|
|
—
|
|
—
|
|
—
|
|
||||||||
|
Exercised
|
(95
|
)
|
5.02
|
|
(525
|
)
|
4.95
|
|
(1,644
|
)
|
6.69
|
|
||||||||
|
Expired / terminated
|
—
|
|
—
|
|
(13
|
)
|
7.27
|
|
(81
|
)
|
16.59
|
|
||||||||
|
Options outstanding, end of year
|
1,008
|
|
5.40
|
|
1,103
|
|
5.37
|
|
1,641
|
|
5.26
|
|
||||||||
|
Options exercisable, end of year
|
977
|
|
5.42
|
|
1,072
|
|
5.39
|
|
1,606
|
|
5.27
|
|
||||||||
|
Options expected to vest, end of year
|
25
|
|
4.75
|
|
|
|
|
|
||||||||||||
No
stock options were granted in
2016
,
2015
or
2014
. Total intrinsic value of options exercised was
$2.0 million
,
$13.6 million
and
$20.2 million
for the years ended December 31,
2016
,
2015
and
2014
, respectively. The intrinsic value for options
71
TASER INTERNATIONAL, INC.
NOTES TO CONSOLIDATED FINANCIAL STATEMENTS – (Continued)
exercised was calculated as the difference between the exercise price of the underlying stock option awards and the market price of the Company’s common stock on the date of exercise.
The following table summarizes information about stock options outstanding and exercisable as of December 31,
2016
(number of options in thousands):
|
|
Options Outstanding
|
Options Exercisable
|
|||||||||||||||
|
Range of
Exercise Price
|
Number of
Options
Outstanding
|
Weighted
Average
Exercise
Price
|
Weighted
Average
Remaining
Contractual
Life (Years)
|
Number of
Options
Exercisable
|
Weighted
Average
Price
|
Weighted
Average
Remaining
Contractual
Life (Years)
|
|||||||||||
|
$4.00 - $5.00
|
722
|
|
$
|
4.65
|
|
2.66
|
691
|
|
$
|
4.64
|
|
2.69
|
|||||
|
$5.01 - $7.00
|
112
|
|
5.57
|
|
1.70
|
112
|
|
5.57
|
|
1.70
|
|||||||
|
$7.01 - $10.00
|
106
|
|
7.25
|
|
1.19
|
106
|
|
7.25
|
|
1.19
|
|||||||
|
$10.01 - $16.23
|
68
|
|
10.30
|
|
0.40
|
68
|
|
10.30
|
|
0.40
|
|||||||
|
$4.00 - $16.23
|
1,008
|
|
5.40
|
|
2.25
|
977
|
|
5.42
|
|
2.25
|
|||||||
The aggregate intrinsic value of options outstanding and options exercisable at December 31,
2016
was
$19.0 million
and
$18.4 million
, respectively. Aggregate intrinsic value represents the difference between the exercise price of the underlying stock option awards and the closing market price of the Company’s common stock of
$24.24
on December 30,
2016
.
At December 31,
2016
, the Company had
30,600
unvested options outstanding with a weighted average exercise price of
$4.75
per share, weighted average grant-date fair value of
$2.58
per share and weighted average remaining contractual life of
2.0 years
. The aggregate intrinsic value of unvested options at December 31,
2016
was
$0.6 million
.
The Company granted approximately
1.0 million
performance-based stock options (included in the table above) from 2008 through 2011. As of December 31,
2016
, approximately
0.2 million
performance-based stock options are outstanding, of which approximately
30,600
are unvested and
25,000
are expected to vest. The aggregate grant-date fair value of the
0.2 million
performance-based stock options vested and expected to vest as of December 31,
2016
was approximately
$0.6 million
. The Company recognized
no
stock-based compensation expense related to performance-based stock options during the year ended December 31, 2016,
$0.1 million
during the year ended December 31, 2015, and
no
expense during the year ended December 31, 2014.
g. Stock-based Compensation Expense
The Company accounts for stock-based compensation using the fair-value method. Reported stock-based compensation was classified as follows for the years ended December 31 (in thousands):
|
2016
|
2015
|
2014
|
|||||||||
|
Cost of products sold and services delivered
|
$
|
342
|
|
$
|
402
|
|
$
|
204
|
|
||
|
Sales, general and administrative expenses
|
5,707
|
|
4,285
|
|
3,555
|
|
|||||
|
Research and development expenses
|
3,320
|
|
2,576
|
|
1,820
|
|
|||||
|
Total stock-based compensation
|
$
|
9,369
|
|
$
|
7,263
|
|
$
|
5,579
|
|
||
There was
no
stock-based compensation expense recognized in the consolidate statements of operations for the year ended December 31,
2016
. Total stock-based compensation expense for the years ended December 31,
2015
and
2014
includes
$54,000
and
$28,000
, respectively, related to ISOs for which no tax benefit is recognized. The Company recorded a tax benefit in
2016
,
2015
, and
2014
of
$0.2 million
,
$0.2 million
, and
$0.7 million
, respectively, to offset taxes payable related to the non-qualified disposition of ISOs exercised and sold. For the years ended December 31,
2016
,
2015
and
2014
the provision for income taxes included
$1.4 million
,
$6.9 million
and
$8.0 million
, respectively, of tax expense resulting from the fact that stock-based compensation tax benefits have been recorded as increases to additional paid-in capital on the consolidated statements of changes in stockholders' equity. The total future tax benefits related to non-qualified and restricted stock units was
$4.4 million
and
$3.4 million
as of December 31,
2016
and
2015
, respectively.
As of December 31,
2016
, there was
$20.2 million
in unrecognized compensation costs related to RSUs under the Company's stock plans. The Company expects to recognize the cost related to the RSUs over a weighted average period of
2.71 years
.
72
TASER INTERNATIONAL, INC.
NOTES TO CONSOLIDATED FINANCIAL STATEMENTS – (Continued)
13. Related Party Transactions
The Company engages Dr. Mark Kroll, a member of the Board of Directors, to provide consulting services. The expenses related to these services were approximately
$0.2 million
for each of the years ended December 31,
2016
,
2015
and
2014
. At December 31,
2016
and
2015
, the Company had accrued liabilities of approximately
$12,000
and
$31,000
, respectively, related to these services.
The Company subscribes to a mobile collaboration software suite co-founded and managed by Bret Taylor, a member of the Company's Board of Directors. The cost to license this software is approximately
$0.1 million
per year, and as of December 31,
2016
and
2015
the Company had
$50,500
and
$36,000
, respectively, of prepaid costs related to the license subscription.
14
. Employee Benefit Plans
The Company has a defined contribution profit sharing
401
(k) plan for eligible employees, which is qualified under Sections
401
(a) and
401
(k) of the Internal Revenue Code of 1986, as amended. Employees are entitled to make tax-deferred contributions of up to the maximum allowed by law of their eligible compensation. Contributions to the plans are made by both the employee and the Company. Company contributions are based on the level of employee contributions and are immediately vested. The Company’s matching contributions to the plan for the years ended December 31,
2016
,
2015
and
2014
, were approximately
$1.6 million
,
$1.2 million
and
$0.9 million
, respectively.
The Company also has a non-qualified deferred compensation plan for certain executives, key employees and non-employee directors through which participants may elect to postpone the receipt and taxation of a portion of their compensation, including stock-based compensation, received from the Company. The non-qualified deferred compensation plan allows eligible participants to defer up to
80%
of their base salary and up to
100%
of other types of compensation. The plan also allows for (i) matching and discretionary employer contributions and (ii) the deferral of vested RSU awards. Employee deferrals are deemed
100%
vested upon contribution. Distributions from the plan are made upon retirement, death, separation of service, specified date or upon the occurrence of an unforeseeable emergency. Distributions can be paid in a variety of forms from lump sum to installments over a period of years. Participants in the plan are entitled to select from a wide variety of investments available under the plan and are allocated gains or losses based upon the performance of the investments selected by the participant. All gains or losses are allocated fully to plan participants and the Company does not guarantee a rate of return on deferred balances. Assets related to this plan consist of corporate-owned life insurance contracts and are included in other assets in the consolidated balance sheets. Participants have no rights or claims with respect to any plan assets and any such assets are subject to the claims of the Company’s general creditors. Subsequent to December 31,
2016
, the Company made contributions to the non-qualified deferred compensation plan related to the year ended December 31,
2016
of approximately
$32,000
. Future matching or profit sharing contributions to the plans are at the Company’s sole discretion.
15. Business Acquisitions
MediaSolv Solutions Corporation
On May 5, 2015, the Company acquired all of the outstanding capital stock of MediaSolv Solutions Corporation, a Delaware corporation, for a total purchase price of
$8.8 million
, net of
$0.1 million
of cash acquired. MediaSolv primarily provides solutions for interview room video, closed-circuit television ("CCTV") and on-premise digital evidence management. These products connect with the Company's Axon on-officer cameras and, in some cases, its Evidence.com cloud platform. The Company believes the acquisition will continue to allow the Company to leverage MediaSolv’s existing network and relationships to further strengthen its position in the market.
The purchase price consisted primarily of cash, net of cash acquired and working capital adjustments,
$7.8 million
and contingent consideration of
$1.0 million
representing potential earn-outs to former stockholders based on predetermined future financial metrics. The Company also agreed to additional earn-out provisions and compensation adjustments totaling approximately
$4.0 million
based, in part, on predefined future financial metrics. The additional earn-outs were not included as part of the purchase price and will be expensed as compensation in the period earned.
73
TASER INTERNATIONAL, INC.
NOTES TO CONSOLIDATED FINANCIAL STATEMENTS – (Continued)
During the first quarter of 2016, the
$1.0 million
of earn-outs to former stockholders were earned in full and were paid during the second quarter of 2016. During the years ended December 31, 2016 and 2015, the Company recorded an additional
$1.5 million
and
$0.2 million
, respectively, of earn-outs that were recorded as commission expense, and as of December 31, 2016,
$0.2 million
of earn-outs were recorded as accrued liabilities within the accompanying consolidated financial statements.
The major classes of assets and liabilities to which the Company allocated the purchase price was as follows (in thousands):
|
Accounts receivable and other current assets
|
$
|
590
|
|
|
Inventory
|
35
|
|
|
|
Property and equipment
|
53
|
|
|
|
Intangible assets
|
4,145
|
|
|
|
Goodwill
|
5,496
|
|
|
|
Accounts payable and accrued liabilities
|
(697
|
)
|
|
|
Deferred revenue
|
(111
|
)
|
|
|
Deferred income tax liabilities, net
|
(688
|
)
|
|
|
Total purchase price
|
$
|
8,823
|
|
The Company has assigned the goodwill to the Axon segment. Other identifiable definite lived intangible assets were assigned a total weighted average amortization period of
6.5
years. MediaSolv has been included in the Company's consolidated results of operations subsequent to the acquisition date. Pro forma results of operations for MediaSolv have not been presented because they are not material to the consolidated results of operations. In connection with the acquisition, the Company incurred and expensed costs of approximately
$0.2 million
, which included legal, accounting and other third-party expenses related to the transaction.
Tactical Safety Responses Limited
On July 16, 2015, TASER International B.V., a wholly owned subsidiary of the Company, acquired all of the outstanding capital stock of Tactical Safety Responses Limited ("TSR"), a United Kingdom ("UK") corporation. TSR is the Company's licensed distributor of TASER CEWs and Axon cameras and related accessories in the UK. The acquisition is intended to help expand the Company's growth across the UK by growing its in-country sales and support team. The total purchase price was
$3.3 million
consisting of
$4.0 million
cash at close, net of
$0.7 million
of cash acquired. The Company also agreed to additional amounts in the form of earn-outs, subject to the achievement of predefined performance metrics. The earn-outs were not included as part of the purchase price and will be expensed as compensation in the period earned. During the year ended December 31, 2016,
$0.1 million
was recorded as commissions expense under these earn-out provisions.
No
such expense was recorded during 2015.
The major classes of assets and liabilities to which the Company allocated the purchase price was as follows (in thousands):
|
Accounts receivable
|
$
|
726
|
|
|
Inventory
|
497
|
|
|
|
Property and equipment
|
583
|
|
|
|
Other Assets
|
20
|
|
|
|
Intangible assets
|
881
|
|
|
|
Goodwill
|
1,441
|
|
|
|
Accounts payable and accrued liabilities
|
(207
|
)
|
|
|
Notes payable
|
(169
|
)
|
|
|
Income tax liabilities
|
(438
|
)
|
|
|
Total purchase price
|
$
|
3,334
|
|
The Company has assigned the goodwill equally between the TASER Weapons and Axon segments. Other identifiable definite lived intangible assets were assigned a total weighted average amortization period of
7.0
years. TSR has been included in the Company's consolidated results of operations subsequent to the acquisition date. Pro forma results of operations for TSR have not been presented because they are not material to the consolidated results of operations. In connection with the acquisition, the Company incurred and expensed costs of approximately
$0.1 million
, which included legal, accounting and other third-party expenses related to the transaction.
74
TASER INTERNATIONAL, INC.
NOTES TO CONSOLIDATED FINANCIAL STATEMENTS – (Continued)
Axon Artificial Intelligence
On December 30, 2016, the Company acquired certain intellectual property from Fossil Group, Inc. and Fossil Vietnam, Limited Liability Company. This transaction, which was accounted for as a business combination under ASC 805, was part of the Company's efforts to expand on the Axon platform by transforming workflows using computer vision and natural language with machine learning techniques in order to analyze data and multimedia captured throughout the course of policing. Additionally, as part of the acquisition, a team of seven researchers and software engineers joined the Company, and will part of the newly established Axon Artificial Intelligence team. The purchase price, totaling approximately
$6.8 million
, consisted of
$3.5 million
cash at close, and up to an additional
$3.3 million
of consideration contingent upon the satisfaction of certain conditions.
The Company's purchase price allocation is preliminary and subject to revision as more detailed analyses are completed and additional information about fair value of assets become available.
The major classes of assets and liabilities to which the Company has allocated the purchase price, on a preliminary basis, were as follows (in thousands):
|
Developed technology
|
$
|
5,210
|
|
|
Goodwill
|
1,615
|
|
|
|
Total purchase price
|
$
|
6,825
|
|
The Company assigned the goodwill to the Axon segment. The acquired developed technology was assigned an amortization period of
5.0
years. Costs related to the acquisition were expensed as incurred and were considered insignificant.
16
. Segment Data
The Company’s operations are comprised of
two
reportable segments: the sale of CEWs, accessories and other products and services (the “TASER Weapons” segment); and the Axon business, focused on devices, wearables, applications, cloud and mobile products (the "Axon" segment). Within the Axon segment, the Company includes only revenues and costs attributable to that segment which include: costs of sales for both products and services, direct labor, selling expense for the sales team, product management and marketing expenses, trade shows and related expenses, finance and accounting expenses, and research and development for products included, or to be included, within the Axon segment. All other costs are included in the TASER Weapons segment. The chief operating decision maker does not review assets by segment as part of the financial information provided; therefore, only limited asset information is provided in the following tables.
Information relative to the Company’s reportable segments was as follows (in thousands):
|
|
For the year ended December 31, 2016
|
||||||||||
|
|
TASER
Weapons
|
Axon
|
Total
|
||||||||
|
Product sales
|
$
|
202,644
|
|
$
|
35,929
|
|
$
|
238,573
|
|
||
|
Service revenue
|
—
|
|
29,672
|
|
29,672
|
|
|||||
|
Net sales
|
202,644
|
|
65,601
|
|
268,245
|
|
|||||
|
Cost of products sold
|
61,930
|
|
29,606
|
|
91,536
|
|
|||||
|
Cost of services delivered
|
—
|
|
6,173
|
|
6,173
|
|
|||||
|
Gross margin
|
140,714
|
|
29,822
|
|
170,536
|
|
|||||
|
Sales, general and administrative
|
63,617
|
|
44,459
|
|
108,076
|
|
|||||
|
Research and development
|
5,887
|
|
24,722
|
|
30,609
|
|
|||||
|
Income (loss) from operations
|
$
|
71,210
|
|
$
|
(39,359
|
)
|
$
|
31,851
|
|
||
|
Purchase of property and equipment
|
$
|
4,129
|
|
$
|
828
|
|
$
|
4,957
|
|
||
|
Purchase of intangible assets
|
262
|
|
3,233
|
|
3,495
|
|
|||||
|
Purchase of intangible assets in connection with business acquisitions
|
—
|
|
6,825
|
|
6,825
|
|
|||||
|
Depreciation and amortization
|
2,207
|
|
1,451
|
|
3,658
|
|
|||||
75
TASER INTERNATIONAL, INC.
NOTES TO CONSOLIDATED FINANCIAL STATEMENTS – (Continued)
|
|
For the year ended December 31, 2015
|
||||||||||
|
|
TASER
Weapons |
Axon
|
Total
|
||||||||
|
Product sales
|
$
|
162,375
|
|
$
|
22,855
|
|
$
|
185,230
|
|
||
|
Service revenue
|
—
|
|
12,662
|
|
12,662
|
|
|||||
|
Net sales
|
162,375
|
|
35,517
|
|
197,892
|
|
|||||
|
Cost of products sold
|
48,821
|
|
16,201
|
|
65,022
|
|
|||||
|
Cost of services delivered
|
—
|
|
4,223
|
|
4,223
|
|
|||||
|
Gross margin
|
113,554
|
|
15,093
|
|
128,647
|
|
|||||
|
Sales, general and administrative
|
47,640
|
|
22,058
|
|
69,698
|
|
|||||
|
Research and development
|
4,470
|
|
19,144
|
|
23,614
|
|
|||||
|
Income (loss) from operations
|
$
|
61,444
|
|
$
|
(26,109
|
)
|
$
|
35,335
|
|
||
|
Purchase of property and equipment
|
$
|
4,159
|
|
$
|
1,844
|
|
$
|
6,003
|
|
||
|
Purchase of intangible assets
|
277
|
|
224
|
|
501
|
|
|||||
|
Purchase of property and equipment and intangible assets in connection with business acquisitions
|
1,453
|
|
11,146
|
|
12,599
|
|
|||||
|
Depreciation and amortization
|
2,311
|
|
980
|
|
3,291
|
|
|||||
|
|
For the year ended December 31, 2014
|
||||||||||
|
|
TASER
Weapons |
Axon
|
Total
|
||||||||
|
Product sales
|
$
|
145,613
|
|
$
|
14,700
|
|
$
|
160,313
|
|
||
|
Service revenue
|
—
|
|
4,212
|
|
4,212
|
|
|||||
|
Net sales
|
145,613
|
|
18,912
|
|
164,525
|
|
|||||
|
Cost of products sold
|
47,680
|
|
13,233
|
|
60,913
|
|
|||||
|
Cost of services delivered
|
—
|
|
2,064
|
|
2,064
|
|
|||||
|
Gross margin
|
97,933
|
|
3,615
|
|
101,548
|
|
|||||
|
Sales, general and administrative
|
42,989
|
|
11,169
|
|
54,158
|
|
|||||
|
Research and development
|
3,872
|
|
11,013
|
|
14,885
|
|
|||||
|
Income (loss) from operations
|
$
|
51,072
|
|
$
|
(18,567
|
)
|
$
|
32,505
|
|
||
|
Purchase of property and equipment
|
$
|
2,233
|
|
$
|
272
|
|
$
|
2,505
|
|
||
|
Purchase of intangible assets
|
180
|
|
3
|
|
183
|
|
|||||
|
Depreciation and amortization
|
3,936
|
|
381
|
|
4,317
|
|
|||||
76
TASER INTERNATIONAL, INC.
NOTES TO CONSOLIDATED FINANCIAL STATEMENTS – (Continued)
17
. Selected Quarterly Financial Data (unaudited)
Selected quarterly financial data for years ended December 31,
2016
and
2015
follows (in thousands, except per share data):
|
|
Quarter Ended
|
||||||||||||||
|
March 31,
|
June 30,
|
September 30,
|
December 31,
|
||||||||||||
|
2016
|
2016
|
2016
|
2016
|
||||||||||||
|
Net sales
|
$
|
55,530
|
|
$
|
58,756
|
|
$
|
71,882
|
|
$
|
82,077
|
|
|||
|
Gross margin
|
36,902
|
|
37,299
|
|
46,565
|
|
49,770
|
|
|||||||
|
Net income
|
3,463
|
|
3,650
|
|
3,843
|
|
6,341
|
|
|||||||
|
Earnings per share
(1)
:
|
|||||||||||||||
|
Basic
|
$
|
0.06
|
|
$
|
0.07
|
|
$
|
0.07
|
|
$
|
0.12
|
|
|||
|
Diluted
|
$
|
0.06
|
|
$
|
0.07
|
|
$
|
0.07
|
|
$
|
0.12
|
|
|||
|
|
Quarter Ended
|
||||||||||||||
|
|
March 31,
|
June 30,
|
September 30,
|
December 31,
|
|||||||||||
|
2015
|
2015
|
2015
|
2015
|
||||||||||||
|
Net sales
|
$
|
44,762
|
|
$
|
46,713
|
|
$
|
50,376
|
|
$
|
56,041
|
|
|||
|
Gross margin
|
29,868
|
|
30,723
|
|
31,068
|
|
36,988
|
|
|||||||
|
Net income
|
7,205
|
|
6,103
|
|
1,521
|
|
5,104
|
|
|||||||
|
Earnings per share
(1)
:
|
|||||||||||||||
|
Basic
|
$
|
0.14
|
|
$
|
0.11
|
|
$
|
0.03
|
|
$
|
0.10
|
|
|||
|
Diluted
|
$
|
0.13
|
|
$
|
0.11
|
|
$
|
0.03
|
|
$
|
0.09
|
|
|||
(1)
Basic and diluted earnings per share are computed independently for each of the quarters presented. Therefore, the sum of quarterly basic and diluted per share information may not equal annual basic and diluted earnings per share.
18. Supplemental Disclosure to Cash Flows
Supplemental non-cash and other cash flow information were as follows for the years ended December 31 (in thousands):
|
2016
|
2015
|
2014
|
|||||||||
|
Cash paid for income taxes, net of refunds
|
$
|
14,048
|
|
$
|
6,759
|
|
$
|
386
|
|
||
|
Non-cash transactions:
|
|||||||||||
|
Contingent consideration related to business combinations
|
$
|
3,325
|
|
$
|
952
|
|
$
|
—
|
|
||
|
Property and equipment purchases in accounts payable
|
82
|
|
315
|
|
270
|
|
|||||
|
Purchase of assets under capital lease obligations
|
134
|
|
—
|
|
—
|
|
|||||
19. Subsequent Events
On February 9, 2017, the Company acquired all of the outstanding capital stock of Dextro, Inc. ("Dextro"). Dextro's products aim to make videos discoverable and searchable using machine learning further consisting of developed algorithms that can analyze the audiovisual contents of video footage in real time in order to provide meaningful data to end users. These capabilities are intended to expand the Axon platform and the newly developed Axon Artificial Intelligence team.
The purchase price consisted of
$7.1 million
cash, including
$1.1 million
in the form of earn-outs, subject to the achievement of predefined performance metrics. The acquisition will be accounted for in the first quarter of Fiscal 2017 using the acquisition method in accordance with ASC 805, Business Combinations. Accordingly, the identifiable assets acquired and liabilities assumed will be measured at their acquisition-date fair value. Operating results will be included in the Company’s consolidated financial statements from the effective date of the acquisition.
77
REPORT OF INDEPENDENT REGISTERED PUBLIC ACCOUNTING FIRM
Board of Directors and Stockholders
TASER International, Inc.
We have audited the accompanying consolidated balance sheets of TASER International, Inc. (a Delaware corporation) and subsidiaries (the “Company”) as of December 31, 2016 and 2015, and the related consolidated statements of operations and comprehensive income, changes in stockholders’ equity, and cash flows for each of the three years in the period ended December 31, 2016. Our audits of the basic consolidated financial statements included the financial statement schedule listed in the index appearing under Item 15(a)(2). These financial statements and financial statement schedule are the responsibility of the Company’s management. Our responsibility is to express an opinion on these financial statements and financial statement schedule based on our audits.
We conducted our audits in accordance with the standards of the Public Company Accounting Oversight Board (United States). Those standards require that we plan and perform the audit to obtain reasonable assurance about whether the financial statements are free of material misstatement. An audit includes examining, on a test basis, evidence supporting the amounts and disclosures in the financial statements. An audit also includes assessing the accounting principles used and significant estimates made by management, as well as evaluating the overall financial statement presentation. We believe that our audits provide a reasonable basis for our opinion.
In our opinion, the consolidated financial statements referred to above present fairly, in all material respects, the financial position of TASER International, Inc. and subsidiaries as of December 31, 2016 and 2015, and the results of their operations and their cash flows for each of the three years in the period ended December 31, 2016 in conformity with accounting principles generally accepted in the United States of America. Also in our opinion, the related financial statement schedule, when considered in relation to the basic consolidated financial statements taken as a whole, presents fairly, in all material respects, the information set forth therein.
We also have audited, in accordance with the standards of the Public Company Accounting Oversight Board (United States), the Company’s internal control over financial reporting as of December 31, 2016, based on criteria established in the 2013 Internal Control-Integrated Framework issued by the Committee of Sponsoring Organizations of the Treadway Commission (COSO), and our report dated
March 6, 2017
expressed an adverse opinion.
/s/ GRANT THORNTON LLP
Phoenix, Arizona
March 6, 2017
78
Item 9.
Changes in and Disagreements With Accountants on Accounting and Financial Disclosure
None.
Item 9A.
Controls and Procedures
Attached as exhibits to this Form 10-K are certifications of the Company’s Chief Executive Officer (CEO) and Principal Financial and Accounting Officer, which are required in accordance with Rule 13a-14 of the Securities Exchange Act of 1934, as amended (the “Exchange Act”). This “Controls and Procedures” section includes information concerning the controls and controls evaluation referred to in the certifications. This section should be read in conjunction with the certifications and the Grant Thornton LLP attestation report for a more complete understanding of the topics presented.
Evaluation of Disclosure Controls and Procedures
Our Chief Executive Officer and Principal Financial and Accounting Officer are responsible for the evaluation of the effectiveness of our disclosure controls and procedures (as defined in Rules 13a-15(e) or 15d-15(e) under the Exchange Act) as of the end of the period covered by this Annual Report on Form 10-K. Our disclosure controls and procedures are designed to ensure that information we are required to disclose in reports that we file or submit under the Exchange Act is (i) recorded, processed, summarized and reported within the time periods specified in the Securities and Exchange Commission’s rules and forms and (ii) accumulated and communicated to our management, including our Chief Executive Officer and our Principal Financial and Accounting Officer as appropriate to allow timely decisions regarding required disclosure. Based on that evaluation, our Chief Executive Officer and Principal Financial and Accounting Officer have concluded that because of certain material weaknesses in our internal control over financial reporting that have not yet been remediated, as further described below, our disclosure controls and procedures were not effective as of December 31, 2016 at a level that provides reasonable assurance as of the last day of the period covered by this report.
Management Report On Internal Control over Financial Reporting
Management is responsible for establishing and maintaining adequate internal control over financial reporting (as defined in Rule 13a-15(f) or 15d-15(f) under the Exchange Act). Management has assessed the effectiveness of our internal control over financial reporting as of December 31, 2016 based on criteria established in Internal Control-Integrated Framework (2013) issued by the Committee of Sponsoring Organizations of the Treadway Commission. As a result of this assessment, management concluded that, as of December 31, 2016, our internal control over financial reporting was not effective in providing reasonable assurance regarding the reliability of financial reporting and the preparation of financial statements for external purposes in accordance with generally accepted accounting principles.
During the year ended December 31, 2016, we identified material weaknesses in our internal control over financial reporting. A material weakness is defined as a deficiency, or a combination of deficiencies, in internal control over financial reporting, such that there is a reasonable possibility that a material misstatement of our financial statements will not be prevented or detected on a timely basis.
Specifically, during the year ended December 31, 2016, we identified material weaknesses in our internal controls over revenue recognition, cost of goods sold and services delivered and the reporting of deferred revenue. Further, we identified material weaknesses in our account reconciliations and monitoring processes. These material weaknesses in internal control over financial reporting resulted from a breakdown in the operation of identified preventative and detective controls which led to the Company not initially recording some transactions correctly.
These material weaknesses arose during a period where the timing of the Company’s financial close and reporting process had been adversely impacted by the continued growth in both the volume and complexity of our business transactions. To remediate the material weaknesses described above, we are working to design and implement new controls and procedures to properly ensure transactions are identified and recorded timely and accurately.
Specifically:
|
•
|
we have added and will continue to add staff to support the growing operations of the Company. During the year ended December 31, 2016, we have added additional resources to our revenue accounting and general accounting teams to ensure that we have the knowledge and resources to properly execute revenue recognition in accordance with GAAP.
|
79
|
•
|
we have implemented and are continuing to implement additional internal reporting procedures, including those designed to add depth to our detailed review processes of revenue transactions and related accounting for deferred revenue and cost of goods sold and services delivered;
|
|
•
|
we have implemented and are continuing to implement additional system controls that would help prevent data entry errors of transactional information within the Company’s general ledger system, as well as adding and refining existing system reports that would help isolate outliers within the Company’s transactional data for further review;
|
|
•
|
we have improved and are continuing to improve communication and coordination among our finance and accounting departments and we have expanded cross-functional involvement and input into period-end accruals; and
|
|
•
|
we are in the process of documenting, assessing and testing our internal control over financial reporting as part of our efforts to comply with Section 404 of the Sarbanes-Oxley Act.
|
The material weaknesses will not be considered remediated until the applicable remedial controls operate for a sufficient period of time and management has concluded, through testing, that these controls are operating effectively. We expect that the remediation of these deficiencies will be completed prior to the end of fiscal year 2017.
Grant Thornton LLP has independently assessed the effectiveness of our internal control over financial reporting and its report is included below.
Changes in Internal Control over Financial Reporting
Except as noted above, there was no change in our internal control over financial reporting during the fiscal quarter ended December 31,
2016
, that has materially affected, or is reasonably likely to materially affect, our internal control over financial reporting.
80
REPORT OF INDEPENDENT REGISTERED PUBLIC ACCOUNTING FIRM
Board of Directors and Stockholders
TASER International, Inc.
We have audited the internal control over financial reporting of TASER International, Inc. (a Delaware corporation) and subsidiaries (the “Company”) as of December 31, 2016, based on criteria established in the 2013 Internal Control-Integrated Framework issued by the Committee of Sponsoring Organizations of the Treadway Commission (COSO). The Company’s management is responsible for maintaining effective internal control over financial reporting and for its assessment of the effectiveness of internal control over financial reporting, included in the accompanying Management Report on Internal Control Over Financial Reporting (“Management’s Report”). Our responsibility is to express an opinion on the Company’s internal control over financial reporting based on our audit.
We conducted our audit in accordance with the standards of the Public Company Accounting Oversight Board (United States). Those standards require that we plan and perform the audit to obtain reasonable assurance about whether effective internal control over financial reporting was maintained in all material respects. Our audit included obtaining an understanding of internal control over financial reporting, assessing the risk that a material weakness exists, testing and evaluating the design and operating effectiveness of internal control based on the assessed risk, and performing such other procedures as we considered necessary in the circumstances. We believe that our audit provides a reasonable basis for our opinion.
A company’s internal control over financial reporting is a process designed to provide reasonable assurance regarding the reliability of financial reporting and the preparation of financial statements for external purposes in accordance with generally accepted accounting principles. A company’s internal control over financial reporting includes those policies and procedures that (1) pertain to the maintenance of records that, in reasonable detail, accurately and fairly reflect the transactions and dispositions of the assets of the company; (2) provide reasonable assurance that transactions are recorded as necessary to permit preparation of financial statements in accordance with generally accepted accounting principles, and that receipts and expenditures of the company are being made only in accordance with authorizations of management and directors of the company; and (3) provide reasonable assurance regarding prevention or timely detection of unauthorized acquisition, use, or disposition of the company’s assets that could have a material effect on the financial statements.
Because of its inherent limitations, internal control over financial reporting may not prevent or detect misstatements. Also, projections of any evaluation of effectiveness to future periods are subject to the risk that controls may become inadequate because of changes in conditions, or that the degree of compliance with the policies or procedures may deteriorate.
A material weakness is a deficiency, or combination of control deficiencies, in internal control over financial reporting, such that there is a reasonable possibility that a material misstatement of the company’s annual or interim financial statements will not be prevented or detected on a timely basis. The following material weaknesses have been identified and included in management’s assessment. Management identified a material weakness in its account reconciliation and monitoring processes related to the identification and recording of liabilities. Additionally, management identified material weaknesses related to revenue recognition, cost of goods sold and services delivered and the reporting of deferred revenue.
In our opinion, because of the effect of the material weaknesses described above on the achievement of the objectives of the control criteria, the Company has not maintained effective internal control over financial reporting as of December 31, 2016, based on criteria established in the 2013 Internal Control-Integrated Framework issued by COSO.
We also have audited, in accordance with the standards of the Public Company Accounting Oversight Board (United States), the consolidated financial statements of the Company as of and for the year ended December 31, 2016. The material weaknesses identified above were considered in determining the nature, timing, and extent of audit tests applied in our audit of the 2016 consolidated financial statements, and this report does not affect our report dated
March 6, 2017
, which expressed an unqualified on those financial statements.
We do not express an opinion or any other form of assurance on management’s statement referring to the timing of the Company’s financial close and reporting process being adversely impacted by the Company’s continued growth in both the volume and complexity of transactions, and “Remediation” included in Management’s Report.
/s/ GRANT THORNTON LLP
Phoenix, Arizona
March 6, 2017
81
Item 9B.
Other Information
None.
Item 10.
Directors, Executive Officers and Corporate Governance
The information required to be disclosed by this item is incorporated herein by reference to our definitive proxy statement for the
2017
Annual Meeting of Stockholders (the “
2017
Proxy Statement”) which proxy statement we expect to file with the Securities and Exchange Commission within 120 days after the end of our fiscal year ended December 31,
2016
.
Item 11.
Executive Compensation
The information required to be disclosed by this item is incorporated herein by reference to our
2017
Proxy Statement.
Item 12.
Security Ownership of Certain Beneficial Owners and Management and Related Stockholder Matters
Equity Compensation Plan Information
A description of our equity compensation plans approved by our stockholders is included in Note 12(c) to the Consolidated Financial Statements included in Part II, Item 8 of this Annual Report on Form 10-K. The following table provides details of our equity compensation plans at
December 31, 2016
:
|
Plan Category
|
Number of Securities to
be Issued upon Exercise
of Outstanding Options,
Warrants and Rights
(a)
|
Weighted-Average
Exercise Price of
Outstanding Options,
Warrants and Rights
(b) (1)
|
Number of Securities
Remaining Available Under Equity
Compensation Plans for
Future Issuance
(Excluding Securities Reflected
in Column (a))
(c)
|
||||||
|
Equity compensation plans approved by security holders
|
2,337,416
|
|
$
|
5.40
|
|
2,696,536
|
|
||
|
Equity compensation plans not approved by security holders
|
—
|
|
—
|
|
|||||
|
Total
|
2,337,416
|
|
$
|
—
|
|
2,696,536
|
|
||
|
(1)
|
The weighted average exercise price is calculated based solely on the exercise prices of the outstanding options and does not reflect the shares that will be issued upon the vesting of outstanding awards of restricted stock units which have no exercise price.
|
All other information required to be disclosed by this item is incorporated herein by reference to our
2017
Proxy Statement.
Item 13.
Certain Relationships and Related Transactions, and Director Independence
The information required to be disclosed by this item is incorporated herein by reference to our
2017
Proxy Statement.
Item 14.
Principal Accounting Fees and Services
The information required to be disclosed by this item is incorporated herein by reference to our
2017
Proxy Statement.
82
Item 15.
Exhibits, Financial Statement Schedules
(a) The following documents are filed as part of this report:
|
1.
|
Consolidated financial statements: All consolidated financial statements as set forth under Part II, Item 8 of this report.
|
|
2.
|
Supplementary Financial Statement Schedules: Schedule II — Valuation and Qualifying Accounts
|
Other schedules have not been included because they are not applicable or because the information is included elsewhere in this report.
(Dollars in thousands)
SCHEDULE II – VALUATION AND QUALIFYING ACCOUNTS
|
Description
|
Balance at
Beginning
of Period
|
Charged to
Costs and
Expenses
|
Charged to
Other
Accounts
|
Deductions
|
Balance at
End of
Period
|
||||||||||||||
|
Allowance for doubtful accounts:
|
|||||||||||||||||||
|
Year ended December 31, 2016
|
$
|
322
|
|
$
|
205
|
|
$
|
—
|
|
$
|
(84
|
)
|
$
|
443
|
|
||||
|
Year ended December 31, 2015
|
251
|
|
86
|
|
—
|
|
(15
|
)
|
322
|
|
|||||||||
|
Year ended December 31, 2014
|
200
|
|
142
|
|
—
|
|
(91
|
)
|
251
|
|
|||||||||
|
Warranty reserve:
|
|||||||||||||||||||
|
Year ended December 31, 2016
|
$
|
314
|
|
$
|
621
|
|
$
|
—
|
|
$
|
(155
|
)
|
$
|
780
|
|
||||
|
Year ended December 31, 2015
|
675
|
|
(62
|
)
|
—
|
|
(299
|
)
|
314
|
|
|||||||||
|
Year ended December 31, 2014
|
955
|
|
396
|
|
—
|
|
(676
|
)
|
675
|
|
|||||||||
3. Exhibits:
|
Exhibit
Number
|
|
Description
|
|
3.1
|
|
Certificate of Incorporation, as amended (incorporated by reference to Exhibit 3.1 to Registration Statement on Form SB-2, effective May 11, 2001 (Registration No. 333-55658))
|
|
3.2
|
|
Bylaws, as amended, effective January 17, 2016 (incorporated by reference to Exhibit 3.2 to Annual Report filed on Form 10-K, filed March 7, 2016)
|
|
3.3
|
|
Certificate of Amendment to Certificate of Incorporation dated September 1, 2004 (incorporated by reference to Exhibit 3.3 to Annual Report on Form 10-KSB, filed March 31, 2005)
|
|
3.4
|
Amended and Restated Certificate of Incorporation (incorporated by reference to Annex A to 2016 Proxy Statement, filed April 15, 2016.
|
|
|
4.1
|
|
Form of Common Stock Certificate (incorporated by reference to Exhibit 4.2 to Registration Statement on Form SB-2, effective May 11, 2001 (Registration No. 333-55658))
|
|
10.1*
|
|
Executive Employment Agreement with Patrick W. Smith, dated July 1, 1998 (incorporated by reference to Exhibit 10.1 to Registration Statement on Form SB-2, effective May 11, 2001 (Registration No. 333-55658))
|
|
10.2*
|
|
Form of Indemnification Agreement between the Company and its directors (incorporated by reference to Exhibit 10.4 to Registration Statement on Form SB-2, effective May 11, 2001 (Registration No. 333-55658))
|
|
10.3*
|
|
Form of Indemnification Agreement between the Company and its officers (incorporated by reference to Exhibit 10.15 to Registration Statement on Form SB-2, effective May 11, 2001 (Registration No. 333-55658))
|
|
10.4*
|
|
2001 Stock Option Plan (incorporated by reference to Exhibit 10.7 to Registration Statement on Form SB-2, effective May 11, 2001 (Registration No. 333-55658))
|
|
10.5*
|
|
Executive Employment Agreement with Douglas E. Klint, dated December 15, 2002 (incorporated by reference to Exhibit 10.14 to Annual Report on Form 10-KSB, filed March 14, 2003)
|
|
10.6*
|
|
Executive Employment Agreement with Daniel Behrendt, dated April 28, 2004 (incorporated by reference to Exhibit 10.14 to Annual Report on Form 10-KSB, filed March 31, 2005)
|
|
10.7*
|
|
2004 Stock Option Plan (incorporated by reference to Exhibit 10.15 to the Annual Report on Form 10-KSB, filed March 31, 2005)
|
83
|
Exhibit
Number
|
|
Description
|
|
10.8*
|
|
2004 Outside Director Stock Option Plan, as amended (incorporated by reference to Exhibit 10.16 to the Annual Report on Form 10-KSB, filed March 31, 2005)
|
|
10.9*
|
|
2009 Stock Incentive Plan. (incorporated by reference to Appendix A to 2009 Proxy Statement, filed April 15, 2009)
|
|
10.10*
|
|
Executive Employment Agreement with Jeff Kukowski, dated August 9, 2010 (incorporated by reference to Exhibit 10.18 to the Annual Report on Form 10-K, filed March 8, 2013)
|
|
10.11*
|
|
2013 Stock Incentive Plan (incorporated by reference to Appendix of 2013 Proxy Statement, filed on April 3, 2013)
|
|
10.12*
|
|
TASER International, Inc. Deferred Compensation Plan (incorporated by reference to Exhibit 10.1 to Form 8-K, filed on July 12, 2013)
|
|
10.13
|
Amended and Restated Credit Agreement dated August 18, 2014 between the Company and JP Morgan Chase Bank, NA (incorporated by reference to Exhibit 10.13 to Form 10-K, filed on March 11, 2015)
|
|
|
10.14
|
Note Modification Agreement dated as of July 29, 2015, between the Company and JP Morgan Chase Bank, N.A. (incorporated by reference to Exhibit 10.1 to Form 10-Q, filed on November 6, 2015)
|
|
|
10.15*
|
2016 Stock Incentive Plan (incorporated by reference to Annex B of 2016 Proxy Statement, filed on April 15, 2016)
|
|
|
21.1**
|
|
List of Subsidiaries
|
|
23.1**
|
|
Consent of Grant Thornton, LLP, independent registered public accounting firm
|
|
24.1**
|
|
Powers of attorney (see signature page)
|
|
31.1**
|
|
Principal Executive Officer Certification pursuant to Rule 13a-14(a) or Rule 15d-14(a)
|
|
31.2**
|
|
Principal Financial Officer Certification pursuant to Rule 13a-14(a) or Rule 15d-14(a)
|
|
32.1***
|
|
Principal Executive Officer and Principal Financial Officer Certification pursuant to 18 U.S.C. Section 1350 as adopted pursuant to Section 906 of the Sarbanes-Oxley Act of 2002
|
|
101.INS**
|
|
XBRL Instance Document
|
|
101.SCH**
|
|
XBRL Taxonomy Extension Schema Document
|
|
101.CAL**
|
|
XBRL Taxonomy Calculation Linkbase Document
|
|
101.LAB**
|
|
XBRL Taxonomy Label Linkbase Document
|
|
101.PRE**
|
|
XBRL Taxonomy Presentation Linkbase Document
|
* Management contract or compensatory plan or arrangement
** Filed herewith
*** Furnished herewith
Item 16.
Form 10-K Summary
Not applicable.
84
SIGNATURES
Pursuant to the requirements of Section 13 or 15(d) of the Securities Exchange Act of 1934, the registrant has duly caused this report to be signed on its behalf by the undersigned, thereunto duly authorized.
|
TASER INTERNATIONAL, INC.
|
|
|||
|
Date:
|
March 6, 2017
|
|
||
|
By:
|
|
/s/ PATRICK W. SMITH
|
||
|
|
Chief Executive Officer, Director
|
|||
|
(Principal Executive Officer)
|
||||
|
Date:
|
March 6, 2017
|
By:
|
|
/s/ MARIE C. MASENGA
|
|
|
Corporate Controller
|
|||
|
|
(Principal Financial and Accounting Officer)
|
|||
85
POWER OF ATTORNEY
KNOW ALL PERSONS BY THESE PRESENTS
, that each person whose signature appears below constitutes and appoints Patrick W. Smith his or her true and lawful attorney-in-fact and agent, with full power of substitution and resubstitution, for him or her and in his or her name, place and stead, in any and all capacities, to sign any and all amendments to this Annual Report on Form 10-K, and to file the same, including all exhibits thereto and other documents in connection therewith, with the Securities and Exchange Commission, granting unto said attorney-in-fact and agent full power and authority to do and perform each and every act and thing requisite and necessary to be done in and about the premises, as fully and to all intents and purposes as he or she might or could do in person hereby ratifying and confirming all that said attorney-in-fact and agent, or his substitute or substitutes, may lawfully do or cause to be done by virtue hereof.
Pursuant to the requirements of the Securities Exchange Act of 1934, this report has been signed by the following persons on behalf of the registrant and in the capacities and on the dates indicated.
|
Signature
|
|
Title
|
|
Date
|
|
/s/ MICHAEL GARNREITER
|
|
Director
|
|
March 6, 2017
|
|
Michael Garnreiter
|
|
|
||
|
/s/ HADI PARTOVI
|
|
Director
|
|
March 6, 2017
|
|
Hadi Partovi
|
|
|
||
|
/s/ JUDY MARTZ
|
|
Director
|
|
March 6, 2017
|
|
Judy Martz
|
|
|
||
|
/s/ MARK W. KROLL
|
|
Director
|
|
March 6, 2017
|
|
Mark W. Kroll
|
|
|
||
|
/s/ RICHARD H. CARMONA
|
|
Director
|
|
March 6, 2017
|
|
Richard H. Carmona
|
|
|
||
|
/s/ BRET S. TAYLOR
|
|
Director
|
|
March 6, 2017
|
|
Bret S. Taylor
|
|
|
||
|
/s/ MATTHEW R. MCBRADY
|
Director
|
|
March 6, 2017
|
|
|
Matthew R. McBrady
|
|
|
||
86
TABLE OF CONTENTS
Part IItem 1. BusinessItem 1A. Risk FactorsItem 1B. Unresolved Staff CommentsItem 2. PropertiesItem 3. Legal ProceedingsItem 4. Mine Safety DisclosuresPart IIItem 5. Market For Registrant S Common Equity, Related Stockholder Matters and Issuer Purchases Of Equity SecuritiesItem 6. Selected Financial DataItem 7. Management S Discussion and Analysis Of Financial Condition and Results Of OperationsItem 7A. Quantitative and Qualitative Disclosures About Market RiskItem 8. Financial Statements and Supplementary DataItem 9. Changes in and Disagreements with Accountants on Accounting and Financial DisclosureItem 9A. Controls and ProceduresItem 9B. Other InformationPart IIIItem 10. Directors, Executive Officers and Corporate GovernanceItem 11. Executive CompensationItem 12. Security Ownership Of Certain Beneficial Owners and Management and Related Stockholder MattersItem 13. Certain Relationships and Related Transactions, and Director IndependenceItem 14. Principal Accounting Fees and ServicesPart IVItem 15. Exhibits, Financial Statement SchedulesItem 16. Form 10-k Summary