AMREP CORP.
10-Ks and 10-Qs
|
|
|
|
|
|
|
|
|
|
|
|
|
|
|
|
|
|
|
|
|
|
|
|
|
|
|
|
|
|
|
|
|
|
|
|
|
|
|
|
|
|
|
|
|
|
|
|
|
|
|
|
|
|
|
|
|
|
|
UNITED STATES
SECURITIES AND EXCHANGE COMMISSION
WASHINGTON, D.C. 20549
____________________
FORM 10-K
ANNUAL REPORT PURSUANT TO SECTIONS 13 OR 15(d)
OF THE SECURITIES EXCHANGE ACT OF 1934
| (Mark One) |
| [x ] | Annual Report pursuant to Section 13 or 15(d) of the Securities Exchange Act of 1934 | |
| For the fiscal year ended April 30, 2010 |
OR
| [ ] | Transition Report pursuant to Section 13 or 15(d) of the Securities Exchange Act of 1934 | |
| For the transition period from to |
Commission File Number
1-4702
|
AMREP CORPORATION
|
|
(Exact name of Registrant as specified in its charter)
|
|
Oklahoma
|
59-0936128
|
|
(State or other jurisdiction of
|
(IRS Employer
|
|
incorporation or organization)
|
Identification No.)
|
|
300 Alexander Park, Suite 204, Princeton, New Jersey
|
08540
|
|
(Address of principal executive offices)
|
(Zip Code)
|
Registrant's telephone number, including area code:
(609) 716-8200
Securities registered pursuant to Section 12(b) of the Act:
Title of Each Class
Name of Each Exchange on Which Registered
Common Stock $.10 par value New York Stock Exchange
Securities registered pursuant to Section 12(g) of the Act: None
Indicate by check mark whether the Registrant is a well-known seasoned issuer, as defined in Rule 405 of the Securities Act.
|
Yes
|
No
|
X
|
Indicate by check mark if the Registrant is not required to file reports pursuant to Section 13 or 15(d) of the Act.
|
Yes
|
No
|
X
|
Indicate by check mark whether the Registrant (1) has filed all reports required to be filed by Section 13 or 15(d) of the Act during the preceding 12 months (or for such shorter period that the Registrant was required to file such reports), and (2) has been subject to such filing requirements for the past 90 days.
|
Yes
|
X |
No
|
|
Indicate by check mark whether the Registrant has submitted electronically and posted on its corporate Web site, if any, every Interactive Data File required to be submitted and posted pursuant to Rule 405 of Regulation S-T (§229.405 of this chapter) during the preceding 12 months (or for such shorter period that the Registrant was required to submit and post such files).
|
Yes
|
No
|
|
Indicate by check mark if disclosure of delinquent filers pursuant to Item 405 of Regulation S-K (§229.405 of this chapter) is not contained herein, and will not be contained, to the best of the Registrant's knowledge, in definitive proxy or information statements incorporated by reference in Part III of this Form 10-K or any amendment to this Form 10-K.
[
X
]
Indicate by check mark whether the Registrant is a large accelerated filer, an accelerated filer, a non-accelerated filer or a smaller reporting company. See definitions of “large accelerated filer”, “accelerated filer” and “smaller reporting company” in Rule 12b-2 of the Act.
|
Large accelerated filer
|
Accelerated filer
|
|||
|
Non-accelerated filer
|
X
|
Smaller reporting company
|
(Do not check if a smaller reporting company)
Indicate by check mark whether the Registrant is a shell company (as defined in Rule 12b-2 of the Act).
|
Yes
|
No
|
X
|
As of October 31, 2009, which was the last business day of the Registrant’s most recently completed second fiscal quarter, the aggregate market value of the Common Stock held by non-affiliates of the Registrant was $21,088,273. Such aggregate market value was computed by reference to the closing sale price of the Registrant’s Common Stock as quoted on the New York Stock Exchange on such date. For purposes of making this calculation only, the Registrant has defined affiliates as including all directors and executive officers and certain persons related to them. In making such calculation, the Registrant is not making a determination of the affiliate or non-affiliate status of any holders of shares of Common Stock.
As of July 16, 2010, there were 5,996,212 shares of the Registrant’s Common Stock outstanding.
DOCUMENTS INCORPORATED BY REFERENCE
As stated in Part III of this annual report on Form 10-K, portions of the Registrant’s definitive proxy statement to be filed within 120 days after the end of the fiscal year covered by this annual report on Form 10-K are incorporated herein by reference.
2
GENERAL
The Company* was organized in 1961 and, through its subsidiaries, is primarily engaged in four business segments: the Real Estate business operated by AMREP Southwest Inc. and its subsidiaries (collectively, “AMREP Southwest”), and the Subscription Fulfillment Services, Newsstand Distribution Services and Product Services and Other businesses operated by Kable Media Services, Inc. and its subsidiaries (collectively, “Kable” or “Media Services”). As of July 1, 2010, the Company employed approximately 1,300 persons. Data concerning industry segments is set forth in Note 20 of the notes to the consolidated financial statements. The Company’s foreign sales and activities are not significant. All references in this Item 1 to 2010, 2009 and 2008 mean the Company’s fiscal years ended April 30, 2010, 2009 and 2008, unless otherwise qualified.
REAL ESTATE OPERATIONS
The Company conducts its Real Estate business through AMREP Southwest, with these activities occurring primarily in the City of Rio Rancho and certain adjoining areas of Sandoval County, New Mexico. References below to Rio Rancho include the City and such adjoining areas.
Properties – Rio Rancho
Rio Rancho consists of 91,049 contiguous acres in Sandoval County near Albuquerque, of which approximately 73,810 acres have been platted into approximately 114,680 residential and commercial lots, 16,470 acres are dedicated to community facilities, roads and drainage and the remainder is unplatted land. At April 30, 2010, approximately 90,500 of these residential and commercial lots had been sold by AMREP Southwest net of lots repurchased and those returned to AMREP Southwest by deeds in lieu of foreclosure. AMREP Southwest currently owns approximately 17,340 acres in Rio Rancho, of which approximately 4,460 acres are in contiguous blocks, which are being developed or are suitable for development, and approximately 2,010 acres are in areas with a high concentration of ownership, where AMREP Southwest owns more than 50% of the lots in the area. These high concentration areas are suitable for special assessment districts or city redevelopment areas that may allow for future development under the auspices of local government. The balance of the acreage owned is in scattered lots, where AMREP Southwest owns less than 50% of the lots in the area, that may require the purchase of a sufficient number of adjoining lots to create tracts suitable for development or that AMREP Southwest may offer for sale individually or in small groups.
Activities conducted or arranged by AMREP Southwest to facilitate development include the obtaining of necessary governmental approvals (“entitlements”), installation of utilities and necessary storm drains, and building or improving of roads. At Rio Rancho, AMREP Southwest is developing both residential lots and sites for commercial and industrial use as the demand warrants, and also is securing entitlements for large development tracts for sale to homebuilders. The engineering work at Rio Rancho is performed by both AMREP Southwest employees and outside firms, but development work is performed by outside contractors. AMREP Southwest personnel market land at Rio Rancho, both directly and through brokers. AMREP Southwest competes with other owners of land in the Rio Rancho and Albuquerque area that offer for sale developed residential lots and sites for commercial and industrial use.
The City of Rio Rancho is the third largest city in New Mexico with a population of approximately 80,000 whose median age is 35 years. It was named as the 51st best place to live by CNNMoney.com in 2010 for those cities in the United States with greater than 50,000 residents. The city’s population grew by approximately 56% from the calendar year 2000 through 2009. In December 2009, its unemployment rate was 7.5%. The city has significant construction projects recently completed, ongoing or announced, including: (i) a new central business district with a 6,500 seat events center and a new city hall, (ii) a new second high school, (iii) the opening of the University of New Mexico West campus, (iv) the construction of a new Hewlett-Packard technical and customer support center and (v) the planned construction of two new hospitals, among others. Announced new projects and business relocations are anticipated to directly generate approximately 6,300 jobs in the Rio Rancho area over the next five years.
___________________
*As used herein, “Company” includes the Registrant and its subsidiaries unless the context requires or indicates otherwise.
3
Currently, major non-government employers include Intel Corporation, U.S. Cotton and customer care call centers of Bank of America, JCPenney, Victoria’s Secret and Sprint PCS.
In Rio Rancho, AMREP Southwest sells both developed and undeveloped lots to national, regional and local homebuilders, commercial and industrial property developers and others. In the last three fiscal years, land sales in Rio Rancho have been as follows:
|
Acres Sold
|
Revenues
|
Revenues
Per Acre (a)
|
||||||||||
|
2010:
|
||||||||||||
|
Developed
|
|
|||||||||||
|
Residential
|
6 | $ | 1,891,000 | $ | 293,000 | |||||||
|
Commercial
|
2 | 894,000 | 523,000 | |||||||||
|
Total Developed
|
8 | 2,785,000 | 341,000 | |||||||||
|
Undeveloped
|
48 | 2,400,000 | 50,000 | |||||||||
|
Total
|
56 | $ | 5,185,000 | $ | 92,000 | |||||||
|
2009:
|
||||||||||||
|
Developed
|
||||||||||||
|
Residential
|
13 | $ | 3,109,000 | $ | 244,000 | |||||||
|
Commercial
|
1 | 126,000 | 126,000 | |||||||||
|
Total Developed
|
14 | 3,235,000 | 236,100 | |||||||||
|
Undeveloped
|
134 | 5,679,000 | 42,400 | |||||||||
|
Total
|
148 | $ | 8,914,000 | $ | 60,200 | |||||||
|
2008:
|
||||||||||||
|
Developed
|
||||||||||||
|
Residential
|
30 | $ | 9,542,000 | $ | 318,100 | |||||||
|
Commercial
|
39 | 8,651,000 | 221,800 | |||||||||
|
Total Developed
|
69 | 18,193,000 | 263,700 | |||||||||
|
Undeveloped
|
337 | 9,709,000 | 28,800 | |||||||||
|
Total
|
406 | $ | 27,902,000 | $ | 68,700 | |||||||
| (a) | Revenues per acre may not calculate precisely due to rounding of acres sold amounts. |
A substantial number of lots without homes were sold to consumers prior to 1977, and most of these remain in areas where utilities have not yet been installed. Under certain of the pre-1977 lot sale contracts, if utilities have not reached a lot when the purchaser is ready to build a home, AMREP Southwest is obligated to exchange a lot in an area then serviced by water, telephone and electric utilities for the lot of the purchaser, without cost to the purchaser. AMREP Southwest has not incurred significant costs related to such exchanges.
Other Properties
AMREP Southwest also owns two tracts of land in Colorado, consisting of one property of approximately 160 acres planned for approximately 400 homes that AMREP Southwest intends to offer for sale upon obtaining all necessary entitlements, and one property of approximately 10 acres zoned for commercial use, which is being offered for sale.
SUBSCRIPTION FULFILLMENT SERVICES, NEWSSTAND DISTRIBUTION SERVICES AND PRODUCT SERVICES AND OTHER OPERATIONS
The Company (i) through its Palm Coast Data and Kable Subscription Fulfillment Services subsidiaries (collectively, “Palm Coast Data”), conducts its Subscription Fulfillment Services business in which it performs subscription fulfillment and related services for publishers and other customers, (ii) through its Kable Newsstand Distribution Services subsidiary distributes periodicals nationally and in Canada and, to a small degree, in other foreign countries, and (iii) through its Kable Product Services, Specialty Packaging Services and Staffing Resources subsidiaries, distributes premium products, provides packaging services and provides temporary staffing services.
4
Subscription Fulfillment Services
The Subscription Fulfillment Services business performs fulfillment and fulfillment-related activities, principally magazine subscription fulfillment services and list services, and it accounted for 80% of Media Service’s revenues in 2010.
In the magazine subscription fulfillment services operation, Palm Coast Data processes new orders, receives and accounts for payments, prepares and transmits to each publisher’s printer the labels or tapes containing the names and addresses of subscribers for mailing each issue, handles subscriber telephone inquiries and correspondence, prepares renewal and statement notifications for mailing, maintains subscriber lists and databases, generates marketing and statistical reports, processes Internet orders and prints forms and promotional materials. These services are performed for many clients, but some clients may only utilize certain of them. Although by far the largest number of magazine titles for which subscription fulfillment services are performed are consumer publications, Palm Coast Data also performs services for a number of membership organizations, trade (business) publications and government agencies that utilize the broad capabilities of Kable’s extensive database systems.
The Palm Coast Data lettershop and graphics departments prepare and mail statements and renewal forms for its publisher clients to use in their subscriber mailings. List services clients are also primarily publishers for whom Palm Coast Data maintains client customer lists, selects names for clients who rent their lists, merges rented lists with a client’s lists to eliminate duplication for the client’s promotional mailings, and sorts and sequences mailing labels to provide optimum postal discounts. Palm Coast Data also provides membership services to both publisher and non-publisher clients including donation processing and membership fulfillment for membership organizations, in addition to more standard magazine fulfillment services that are also used by membership clients.
Palm Coast Data performs subscription fulfillment services for approximately 580 different magazine titles for approximately 170 clients and maintains databases of over 55 million active subscribers for its client publishers. In a typical month, Palm Coast Data produces approximately 59 million mailing labels for its client publishers and also processes over 21 million pieces of outgoing mail for these clients.
There are a number of companies that perform subscription fulfillment services for publishers and with which Palm Coast Data competes, including one that is larger than Palm Coast Data. Since publishers often utilize only a single fulfillment company for a particular publication, there is intense competition to obtain subscription fulfillment contracts with publishers. Competition for non-publisher clients is also intense. Palm Coast Data has a sales staff whose primary task is to solicit subscription fulfillment business.
Newsstand Distribution Services
In its Newsstand Distribution Services business, Kable distributes magazines for approximately 200 publishers. Among the titles are many special interest magazines, including various hobbyist, celebrity, puzzle, automotive, comics, romance and sports magazines. In a typical month, Kable distributes approximately 49 million copies of various titles to wholesalers. Kable coordinates the movement of the publications from its publisher clients to approximately 100 independent wholesalers. The wholesalers in turn sell the publications to retail chains and independent retail outlets. All parties generally have full return rights for unsold copies. The Newsstand Distribution Services business accounted for 11% of Kable’s revenues in 2010.
While Kable may not handle all publications of an individual publisher client, it usually is the exclusive distributor into the consumer marketplace for the publications it distributes. Kable has a distribution sales and marketing force that works with wholesalers and retailers to promote magazine sales and assist in determining the appropriate number of copies of an individual magazine to be delivered to each wholesaler and ultimately each retailer serviced by that wholesaler. Kable generally does not physically handle any product. Kable generates and delivers to each publisher’s printer shipping instructions with the addresses of the wholesalers and the number of copies of product to be shipped to each. All magazines have a defined “off sale” date following which the retailers return unsold copies to the wholesalers, who destroy them after accounting for returned merchandise in a manner satisfactory to and auditable by Kable.
Kable generally makes substantial cash advances to publishers against future sales that publishers may use to help pay for printing, paper and production costs prior to the product going on sale. Kable is usually not paid by wholesalers for product until some time after the product has gone on sale, and is therefore exposed to credit risks with both publishers and wholesalers. Kable’s ability to limit its credit risk is dependent in part on its skill in
5
estimating the number of copies of an issue that should be distributed and which will be sold, and on limiting its advances to the publisher accordingly.
Kable competes primarily with three other national distributors. Each of these competitors is owned by or affiliated with a magazine publishing company. Such companies publish a substantial portion of all magazines sold in the United States, and the competition for the distribution rights to the remaining publications is intense. In addition, there has been a major consolidation and reduction in the number of wholesalers to whom Kable distributes magazines arising from changes within the magazine distribution industry in recent years. During 2010, business with three of these wholesalers accounted for approximately 72% of the gross billings of the Newsstand Distribution Services business, which is common for the industry. Of Kable’s Newsstand Distribution Services aggregate accounts receivable at April 30, 2010, approximately 45% were due from these three wholesalers.
Product Services and Other
For some time, as an adjunct to the Subscription Fulfillment Services business, Kable has offered product fulfillment services through its Product Services business to its publisher clients, which services are generally fee-based when filling orders. Many publishers offer premiums (a free gift) to subscribers for subscribing to their magazines and also offer to sell (paid orders) copies of current or older issues of their magazines as well as other items that may be offered for sale in their magazines or on their websites. Additionally, almost all publishers want the ability to send replacement copies to subscribers who for whatever reason do not receive their original subscription copy. Kable’s Product Services business offers full customer service, web-based ordering, and the processing of external orders to its customers. Some of these services are subcontracted from affiliates within the Company. These services are portable to non-publishing clients as well.
In November 2008, Kable purchased certain assets of a company engaged in the specialty packaging business and now, as part of its Product Services business, Kable provides customized packaging solutions, which may include receiving, warehousing, packaging and shipping services to a variety of businesses that require various degrees of packaging and order fulfillment from bulk inventory of their products. These services are typically fee-based. The Product Services business, including the specialty packaging business, operates from a 191,000 square foot facility owned by the Company in Fairfield, Ohio.
In November 2008, Kable also purchased certain assets of a temporary staffing company in Fairfield, Ohio and established a staffing company (“Kable Staffing”). Kable Staffing operates as a separate business which provides temporary employees to local companies, including its affiliate Kable Product Services. Many of its clients experience fluctuations in their businesses and therefore choose to use temporary employees from an agency rather than trying to manage the labor themselves. In this business, Kable Staffing hires and pays the employees it provides to its clients, and charges its clients a rate that includes its margin for providing this service.
Both Product Services and Kable Staffing operate in a very competitive environment. Together, they accounted for 9% of Media Service’s revenues in 2010.
Available Information
The Company maintains an Internet website at
www.amrepcorp.com
. The Company’s Annual Report on Form 10-K, quarterly reports on Form 10-Q, current reports on Form 8-K and amendments to reports filed or furnished pursuant to Sections 13(a) and 15(d) of the Securities Exchange Act of 1934, as amended, are available free of charge through the Company’s website as soon as reasonably practicable after such material is electronically filed with, or furnished to, the Securities and Exchange Commission. The information found on the Company’s website is not part of this or any other report that the Company files with, or furnishes to, the Securities and Exchange Commission.
6
The risks described below are among those that could materially and adversely affect the Company’s business, financial condition or results of operations. These risks could cause actual results to differ materially from historical experience and from the Company’s plans, projections or other forward-looking statements included in “Item 7. Management’s Discussion and Analysis of Financial Condition and Operations” below and elsewhere in this Report on Form 10-K. These risks are not the only risks the Company faces, and other risks include those not presently known as well as those that are currently considered to be less significant.
General Economic Risks
The effects of the global economic crisis may continue to impact the Company’s business, operating results or financial condition.
The global economic crisis has caused a general tightening of the credit markets, lower levels of liquidity, increases in the rates of default and bankruptcy, and extreme volatility in credit, equity and fixed income markets. These macroeconomic developments have negatively affected, and could continue to negatively affect, the Company’s business, operating results or financial condition in a number of ways. For example, potential real estate developers may be unable to obtain financing which could cause them to delay, decrease or cancel purchases of land from the Company, and revenues from subscriptions and advertising sources may further deteriorate such that magazine publishers cease publishing certain titles and thus no longer need the Company’s services.
The deterioration of the credit and capital markets may adversely impact the Company’s ability to obtain financing on acceptable terms, which may hinder or prevent the Company from meeting its future operational and capital needs.
Global financial markets have experienced extreme volatility and disruption during the past 18 months, and the debt and equity capital markets were exceedingly distressed and difficult to access during much of this period. These issues have made, and will likely continue to make, it more difficult to obtain financing than has historically been the case. If future funding is not available when needed or to the extent required, or if it is available only on unfavorable terms, this might adversely affect the Company’s ability to meet its operating needs or its future capital expenditures.
Risks Related to the Company’s Real Estate Operations
The Company’s real estate assets are concentrated in one market, Rio Rancho, New Mexico, meaning the Company’s results of operations and future growth may be limited or affected by economic changes in that market.
Substantially all of the Company’s real estate assets are located in Rio Rancho, which is adjacent to Albuquerque, New Mexico. As a result of this geographic concentration, the Company could be affected by changes in economic conditions in this region from time to time, including regional economic contraction due to, among other things, the failure or downturn of key industries and employers. The Company’s results of operations, future growth or both may be adversely affected if the demand for residential or commercial real estate declines in the Rio Rancho area as a result of changes in economic conditions. For example, real estate land sales have declined from $95.8 million in 2007 to $5.2 million in 2010, as builders have slowed the pace of building on developed lots previously purchased from the Company in Rio Rancho and delayed or cancelled the purchase of additional developed lots.
7
A downturn in the business of Rio Rancho’s largest employer may adversely affect the Company’s real estate development business there.
Intel Corporation (“Intel”) is the largest employer in Rio Rancho and operates a large semiconductor manufacturing facility there. Although Intel has made substantial investments in the Rio Rancho plant in recent years, it has reduced its employment there from approximately 4,700 at April 30, 2008 to approximately 3,000 at April 30, 2010 as it has adjusted to current business conditions. If Intel’s presence in Rio Rancho were to continue to diminish for any reason, such as in response to a downturn in its semiconductor manufacturing business, the Rio Rancho real estate market and consequently the Company’s land development business located there may continue to be adversely affected.
As Rio Rancho’s population continues to grow, the Company’s land development activities in that market may be subject to greater limitations than they have been historically.
When the Company acquired its core real estate inventory in Rio Rancho over 40 years ago, the area was not developed and had a low population. As of April 30, 2010, Rio Rancho was the third largest city in New Mexico and had a population of approximately 80,000. As Rio Rancho’s population continues to grow, the Company may be unable to engage in development activities comparable to those the Company has engaged in historically. Local community or political groups may oppose the Company’s development plans or require modification of those plans, which could cause delays or increase the cost of the Company’s development projects. In addition, zoning density limitations, “slow growth” provisions or other land use regulations implemented by state, city or local governments could further restrict the Company’s development activities or those of its homebuilder customers, or could adversely affect financial returns from a given project, which could adversely affect the Company’s results of operations.
T
he Company’s remaining Rio Rancho real estate is not all in contiguous blocks, which may adversely affect the Company’s ability to sell lots at levels comparable with the levels it experienced prior to the 2008 sales downturn.
Of the approximately 17,340 acres in Rio Rancho that the Company owned at April 30, 2010, approximately 4,460 acres were in contiguous blocks that are being developed or are suitable for development, and approximately 2,010 acres were in areas with a high concentration of ownership, where the Company owns more than 50% of the lots in the area, suitable for special assessment districts or city redevelopment areas that may allow for future development under the auspices of local government. The balance is in scattered lots, where the Company owns less than 50% of the lots in the area, which may require the purchase of a sufficient number of adjoining lots to create tracts suitable for development or that the Company may offer for sale individually or in small groups. As the Company’s land sales continue and the number of the Company’s contiguous and highly concentrated lots diminishes, the Company’s ability to continue to be in a position to sell lots and generate land sale revenues at satisfactory levels may be adversely affected, which would have an adverse effect on the Company’s results of operations.
The Company’s real estate assets are diminishing over time, meaning long-term growth in the real estate business will require the acquisition of additional real estate assets, possibly by expanding into new markets.
Substantially all of the Company’s real estate revenues are derived from sales of the Company’s core inventory in Rio Rancho. This property was acquired more than 40 years ago, and each time the Company develops and sells real estate to customers in Rio Rancho, the Company’s real estate assets diminish. As of April 30, 2010, the Company owned approximately 17,340 acres in Rio Rancho out of an original purchase of approximately 91,000 acres. The continuity and future growth of the Company’s real estate business will require that the Company acquire new properties in or near Rio Rancho or expand to other markets to provide sufficient assets to support a meaningful real estate development business. While the Company holds two properties in Colorado, it has not for many years made any significant attempt to identify a development opportunity similar to the one the Company has undertaken in Rio Rancho, and there can be no assurance that the Company will identify such an opportunity in another market. If the Company does not acquire new real estate assets, its real estate holdings will continue to diminish, which will adversely affect the Company’s ability to continue its real estate operations at a significant level.
The Company may not be able to acquire properties or develop them successfully.
If the Company is able to identify real estate development opportunities outside of Rio Rancho, the success of the Company’s real estate segment will still depend in large part upon its ability to acquire additional properties on satisfactory terms and to develop them successfully. If the Company is unable to do so, its results of operations
8
could be adversely affected.
The acquisition, ownership and development of real estate is subject to many risks that may adversely affect the Company’s results of operations, including the risks that:
|
•
|
the Company may not be able to acquire a desired property because of competition from other real estate investors who may have greater capital or better access to cash than the Company has;
|
||
|
•
|
the Company may not be able to obtain or renew financing on acceptable terms, or at all;
|
||
|
•
|
an adverse change in market conditions during the interval between acquisition and sale of a property may result in a lower than originally anticipated profit;
|
||
|
•
|
the Company may underestimate the cost of development required to bring an acquired property up to standards established for the market position intended for that property;
|
||
|
•
|
acquired properties may be located in new markets where the Company may face risks associated with a lack of market knowledge or understanding of the local economy, a lack of business relationships in the area or unfamiliarity with local governmental and permitting procedures; and
|
||
|
•
|
the Company may be unable to quickly and efficiently integrate new acquisitions, particularly acquisitions of portfolios of properties, into its existing operations.
|
||
The Company’s real estate development activities have been primarily limited to a single market, and it may face substantially more experienced competition in acquiring and developing real estate in new markets.
Since the Company’s real estate acquisition and development activities have been primarily limited to the Rio Rancho market, the Company does not have extensive experience in acquiring real estate in other markets or engaging in development activities in multiple markets simultaneously. Should the Company seek to acquire additional real estate in new markets, competition from other potential purchasers of real estate could adversely affect the Company’s operations. Many of these entities may have substantially greater experience than the Company has in identifying, acquiring and developing real estate opportunities in other markets and in managing real estate developments in multiple markets. These entities may also have greater financial resources than the Company has and may be able to pay more than the Company can or accept more risk than the Company is willing to accept to acquire real estate. These entities also may be less sensitive to risks with respect to the costs or the geographic concentration of their investments. This competition may prevent the Company from acquiring the real estate assets the Company seeks, or increase the cost of properties that the Company does acquire. Competition may also reduce the number of suitable investment opportunities available to the Company or may increase the bargaining power of property owners seeking to sell.
The Company will likely compete for real estate investment opportunities with, among others, insurance companies, pension and investment funds, partnerships, real estate or housing developers, investment companies, real estate investment trusts and owner/occupants.
Although the Company generally performs due diligence on prospective properties before they are acquired, and on a periodic basis after acquisition, any of the properties the Company may acquire may have characteristics or deficiencies unknown to the Company that could adversely affect the property’s value or revenue potential or, in the case of environmental or other factors, impose liability on the Company, which could be significant.
The Company is subject to substantial legal, regulatory and other requirements regarding the development of land and requires government approvals, which may be denied, and thus the Company may encounter difficulties in obtaining entitlements on a timely basis, which could limit its ability to sell land.
There are many legal, regulatory and other requirements regarding the development of land, which may delay the start of planned development activities, increase the Company’s expenses or limit the Company’s customers’ development activities. Development activities performed in connection with real estate sales include obtaining necessary governmental approvals, acquiring access to water supplies, installing utilities and necessary storm drains and building or improving roads. Numerous local, state and federal statutes, ordinances and rules and regulations, including those concerning zoning, resource protection and environmental laws, regulate these tasks. These
9
regulations often provide broad discretion to the governmental authorities that regulate these matters and from whom the Company must obtain necessary approvals. The approval process can be lengthy and delays can increase the Company’s costs, as well as the costs for the primary customers of the Company’s real estate business (residential and commercial developers). Failure to obtain necessary approvals may significantly adversely affect the Company’s real estate development activities and its results of operations.
The Company may be subject to environmental liability.
Various laws and regulations impose liability on real property owners and operators for the costs of investigating, cleaning up and removing contamination caused by hazardous or toxic substances at a property. In the Company’s role as a property owner or developer, the Company could be held liable for such costs. This liability may be imposed without regard to the legality of the original actions and without regard to whether the Company knew of, or was responsible for, the presence of the hazardous or toxic substances. If the Company fails to disclose environmental issues, it could also be liable to a buyer or lessee of the property. In addition, some environmental laws create a lien on the contaminated site in favor of the government for damages and costs incurred in connection with the contamination. If the Company incurs any such liability that is material, its results of operations would be adversely affected
.
Increases in taxes or governmental fees may increase the Company’s costs. Also, adverse changes in tax laws could reduce customer demand for land for commercial and residential development.
Increases in real estate taxes and other local governmental fees, such as fees imposed on developers to fund schools, open space and road improvements or to provide low and moderate income housing, would increase the Company’s costs and have an adverse effect on the Company’s operations. In addition, increases in local real estate taxes or changes in income tax laws that would reduce or eliminate tax deductions or incentives could adversely affect homebuilders’ potential customer demand and could adversely affect future land sales by the Company to those homebuilders.
Unless the City of Rio Rancho supplements its current water supply, development of the Company’s remaining Rio Rancho land may be adversely affected.
All of the Company’s future Rio Rancho land development will require water service from the City of Rio Rancho or from another source. While the city has not denied any development in the past due to a shortage of water supply, it has expressed concerns that its current water supply cannot support growth indefinitely. Although the city is currently pursuing various methods to supplement its water supply, if it is unsuccessful, development of the Company’s remaining Rio Rancho land could be adversely affected.
Real estate is a cyclical industry, and the Company’s results of operations could be adversely affected during cyclical downturns in the industry.
During periods of economic expansion, the real estate industry typically benefits from an increased demand for developable land. In contrast, during periods of economic contraction, the real estate industry is typically adversely affected by a decline in demand. For example, increased rates of mortgage defaults that began in early calendar 2007 led to significant losses for the companies offering such mortgages and contributed to a severe and continuing downturn in the residential housing market. Further, real estate development projects typically begin, and financial and other resources are committed, long before a real estate project comes to market, which could be during a time when the real estate market is depressed. There can be no assurance that an increase in demand or an economic expansion will occur or be sustained in the Rio Rancho market, where the Company’s core real estate business is based and operates, or in any other new market into which the Company expands its real estate operations. Any of the following (among other factors, including those mentioned elsewhere in this report) could cause a general decline in the demand for residential or commercial real estate which, in turn, could contribute to a severe downturn in the real estate development industry that could have an adverse effect on the Company’s results of operations:
|
•
|
periods of general economic slowdown or recession;
|
||
|
•
|
changes in government regulation;
|
||
|
•
|
rising interest rates and a decline in the general availability or affordability of mortgage financing;
|
||
|
•
|
adverse changes in local or regional economic conditions;
|
||
10
|
•
|
shifts in population away from the markets that the Company serves;
|
|
•
|
tax law changes, including potential limits on, or elimination of, the deductibility of certain mortgage interest expense, real property taxes and employee relocation expenses; and
|
|
•
|
acts of God, including hurricanes, earthquakes and other natural disasters.
|
Changing market conditions may adversely affect companies in the real estate industry, which rely upon credit in order to finance their purchases of land from the Company.
Changes in interest rates and other economic factors can dramatically affect the availability of capital for the Company’s developer customers. Residential and commercial developers to whom the Company frequently sells land typically rely upon third party financing to provide the capital necessary for their acquisition of land. Changes in economic and other external market conditions can and have resulted in the inability of developers to obtain suitable financing, which could adversely impact the Company’s ability to sell land, or force the Company to sell land at lower prices, which would adversely affect its results of operations.
Changes in general economic, real estate development or other business conditions may adversely affect the Company’s business and its financial results.
A significant percentage of the Company’s real estate revenues are derived from customers in the residential homebuilding business, which is particularly sensitive to changes in economic conditions and factors such as the level of employment, consumer confidence, consumer income, availability of mortgage financing and interest rates. Adverse changes in these conditions have decreased demand for homes generally, and may continue to do so, affecting the pricing of homes and in turn the price of land sold to developers, which could adversely affect the Company’s results of operations.
A number of contracts for individual Rio Rancho home site sales made prior to 1977 require the Company to exchange land in an area that is serviced by utilities for land in areas where utilities are not installed.
In connection with certain individual Rio Rancho home site sales made prior to 1977, if water, electric and telephone utilities have not reached the lot site when a purchaser is ready to build a home, the Company is obligated to exchange a lot in an area then serviced by such utilities for the lot of the purchaser, without cost to the purchaser. Although this has not been the case in the past, if the Company were to experience a large number of requests for such exchanges in the future, the Company’s results of operations could be adversely impacted.
If subcontractors are not available to assist in completing the Company’s land development projects, the Company may not be able to complete those projects on a timely basis.
The development of land on a timely basis is critical to the Company’s ability to complete development projects in accordance with the Company’s contractual obligations. The availability of subcontractors in the markets in which the Company operates can be affected by factors beyond the Company’s control, including the general demand for these subcontractors by other developers. If subcontractors are not available when the Company requires their services, the Company may experience delays or be forced to seek alternative suppliers, which may increase costs or adversely affect the Company’s ability to sell land on a timely basis.
Land investments are generally illiquid, and the Company may not be able to sell the Company’s properties when it is economically or otherwise important to do so.
Land investments generally cannot be sold quickly, and the Company’s ability to sell properties may be affected by market conditions. The Company may not be able to diversify or vary its portfolio promptly in accordance with its strategies or in response to economic or other conditions. The Company’s ability to pay down debt, reduce interest costs and acquire properties is dependent upon its ability to sell the properties it has selected for disposition at the prices and within the deadlines the Company has established for each property.
11
Risks Related to the Company’s Media Services Operations
The Company’s publisher customers face business pressures from reduced advertising revenues and increased costs for paper, printing and postal rates. These factors could have a negative affect on their operating income, and this in turn could negatively affect the Company’s media services operations.
An important source of revenue for the magazine publishing industry, the principal industry served by the Company, is advertising. As a result of the economic slowdown, there has been a well-publicized reduction in advertising at all levels which has caused a higher attrition rate of magazine titles than has been previously experienced. In addition, the Company’s publisher customers’ principal raw material is paper. Paper and printing prices have fluctuated over the past several years, and significant unanticipated increases in paper prices could adversely affect a publisher customer’s operating income. Postage for magazine distribution and direct solicitation is another significant operating expense of the Company’s publisher customers, which primarily use the U.S. Postal Service to distribute their products. Any continued softness in advertising revenues or significant increases in paper costs, printing costs or postal rates that publishers are not able to offset could have a negative affect on their operating income and number of titles published, and this in turn could negatively affect the Company’s media services operations.
The Company’s media services operations could face increased costs and business disruption from instability in the newsstand distribution channel.
The Company extends credit to various Newsstand Distribution Services customers, whose credit worthiness and financial position may be affected by changes in economic or other external conditions. Financial instruments that may potentially subject the Company to a significant concentration of risk primarily consist of trade accounts receivable from wholesalers in the magazine distribution industry. A small number of wholesalers are responsible for a significant percentage of the wholesale magazine distribution business in the United States. Recently, there has been instability in the wholesaler channel that has led to one major wholesaler abandoning the business and to certain disruptions to magazine distribution. There is the possibility of further consolidation among these wholesalers and insolvency or non-payment of its obligations by one or more of these wholesalers, which could have a material adverse impact on the Company’s results of operations and financial condition. In addition, due to the significant concentration in the industry, should there be a disruption in the wholesale channel, it could impede the Company’s ability to distribute magazines to the retail marketplace.
Almost all of the Company’s revenues in the Company’s Newsstand Distribution Services business are derived from sales made on a fully returnable basis, and an error in estimating expected returns could cause a misstatement of revenues for the period affected.
As is customary in the magazine distribution industry, almost all of the Company’s revenues in its Newsstand Distribution Services business segment are derived from sales made on a fully returnable basis, meaning that customers may return unsold copies of magazines for credit. During the Company’s fiscal year ended April 30, 2010, customers ultimately returned for credit approximately 67% of the magazines initially distributed by the Company. The Company recognizes revenues from the distribution of magazines at the time of delivery to the wholesalers, less a reserve for estimated returns that is based on historical experience and recent sales data on an issue-by-issue basis. Although the Company has the contractual right to return these magazines for offsetting credits from the publishers from whom the magazines are purchased, an error in estimating the percentage of returns at the end of an accounting period could have the effect of understating or overstating revenues in the period affected, which misstatement would have to be adjusted in a subsequent period when the actual return information becomes known.
The introduction and increased popularity of alternative technologies for the distribution of news, entertainment and other information and the resulting shift in consumer habits and advertising expenditures from print to other media has adversely affected the Company’s media services business segments.
Revenues in the Company’s media services business segments are principally derived from services the Company performs for traditional publishers. Historically, a reduction in the demand for the Company’s newsstand distribution services due to lower sales of magazines at newsstands has often been at least partially offset by an increase in demand for the Company’s subscription fulfillment services as consumers affected by the reduction in newsstand distribution instead sought publications through subscription. However, the distribution of news, entertainment and other information via the Internet has become increasingly popular, and consumers increasingly rely on electronic readers, personal computers, cellular phones and other electronic devices for such information. The resulting reduction in demand for traditional print media and the shift of advertising dollars from traditional
12
print media to online media has adversely affected the publishing industry in general and has had a negative impact on both the Company’s Subscription Fulfillment Services and Newsstand Distribution Services segments.
Competitive pressures may result in a decrease in the Company’s revenues and profitability.
The subscription fulfillment and newsstand distribution services businesses are highly competitive, and some of the Company’s competitors have financial resources that are substantially greater than the Company’s. The Company experiences significant price competition in the markets in which it competes. Competition in the Company’s media services businesses may come not only from other service providers, but also from the Company’s customers, who may choose to develop their own internal subscription fulfillment or newsstand distribution
operations, thereby reducing demand for the Company’s services. Competitive pressures could cause the Company’s media services businesses to lose market share or result in significant price erosion that could have an adverse effect on the Company’s results of operations.
The Company’s operating results depend in part on successful research, development and marketing of new or improved services and data processing capabilities and could suffer if the Company is not able to continue to successfully implement new technologies.
The Company operates in highly competitive markets that are subject to rapid change, and must therefore continue to invest in developing technologies and to improve various existing systems in order to remain competitive. There are substantial uncertainties associated with the Company’s efforts to develop new technologies and services for the subscription fulfillment and newsstand distribution markets the Company serves. The Company makes significant investments in new information processing technologies and services that may or may not prove to be profitable. Even if these developments are profitable, the operating margins resulting from their application would not necessarily result in an improvement over the Company’s historical margins.
The Company may not be able to successfully introduce new services and data processing capabilities on a timely and cost-effective basis.
The success of new and improved services depends on their initial and continued acceptance by the publishers and other customers with whom the Company conducts business. The Company’s media services businesses are affected, to varying degrees, by technological changes and shifts in customer demand. These changes result in the transition of services provided and increase the importance of being “first to market” with new services and information processing innovations. Difficulties or delays in the development, production or marketing of new services and information processing capabilities may be experienced, and may adversely affect the Company’s results of operations. These difficulties and delays could also prevent the Company from realizing a reasonable return on the investment required to bring new services and information processing capabilities to market on a timely and cost effective basis.
The Company’s operations could be disrupted if its information systems fail, causing increased expenses and loss of sales.
The Company’s business depends on the efficient and uninterrupted operation of its systems and communications capabilities, including the maintenance of customer databases for billing and label processing, and the Company’s magazine distribution order regulation system. If a key system were to fail or experience unscheduled downtime for any reason, even if only for a short period, the Company’s operations and financial results could be adversely affected. The Company’s systems could be damaged or interrupted by a security breach, fire, flood, power loss, telecommunications failure or similar event. The Company has a formal disaster recovery plan in place, but this plan may not entirely prevent delays or other complications that could arise from an information systems failure. The Company’s business interruption insurance may not adequately compensate the Company for losses that may occur.
The Company depends on the Internet to deliver some services, which may expose the Company to various risks.
Many of the Company’s operations and services, including order taking on behalf of customers and communications with customers and suppliers, involve the use of the Internet. The Company is therefore subject to factors that adversely affect Internet usage, including the reliability of Internet service providers that, from time to time may have operational problems and experience service outages. Additionally, as the Company continues to increase the services it provides using the Internet, the Company is increasingly subject to risks related to the secure transmission of confidential information over public networks. Failure to prevent security breaches of the Company’s networks or
those of its customers, or a security breach affecting the Internet in general, could adversely affect the Company’s results of operations.
T
h
e Company is subject to extensive rules and regulations of credit card associations.
The Company processes a large number of credit card transactions on behalf of its Subscription Fulfillment Services customers and is thus subject to the extensive rules and regulations of the leading credit card associations. The card associations modify their rules and regulations from time to time, and the Company’s inability to anticipate changes in such rules and regulations or in the interpretation or application thereof may result in substantial disruption to its business. In the event that the card associations or the sponsoring banks determine that the manner in which the Company processes certain card transactions is not in compliance with existing rules and regulations, or if the card associations adopt new rules or regulations that prohibit or restrict the manner in which the Company processes card transactions, the Company may be subject to substantial penalties and fines and be forced to modify the manner in which it operates, which may increase costs, or to cease processing certain types of transactions altogether, any of which could have a negative impact on its business.
13
Other Business Risks
The Company’s subsidiaries have substantial indebtedness and other financial obligations which could adversely affect the Company’s business, operating results or financial condition.
The Company’s primary sources of funding for working capital requirements are cash flow from operations and banking facilities. The Company's liquidity is affected by many factors, including some that are based on normal operations and some that are related to the industries in which the Company operates and the economy. AMREP Southwest finances its operations in part through a loan agreement which matures in December 2010. As of April 30, 2010, the outstanding principal of this loan was $22,500,000. AMREP Southwest will be initiating discussions with the bank regarding renewal of this arrangement. However, there can be no assurance that this facility can be renewed on acceptable terms. If AMREP Southwest is not able to renew this facility on acceptable terms, or refinance it with another lender, the Company would be forced to seek additional funds by selling assets or issuing equity, which it may not be able to do on favorable terms, if at all. In addition, the Company’s Kable Media Services business now finances its operations in part through a revolving credit facility which replaced a predecessor revolving credit facility in May 2010. As of April 30, 2010, no loans were outstanding under the predecessor revolving credit facility. The Company’s Kable Media Services business also relies on cash flow from operations to fund its working capital requirements, including cash flow made available to it through arrangements with customers and wholesalers that are subject to expiration and renegotiation from time to time. If AMREP Southwest does not renew or refinance its loan agreement or certain of Kable Media Services arrangements with customers and wholesalers were terminated or modified to reduce or eliminate the source of working capital funding, it would likely have a material adverse affect on the Company’s overall liquidity.
The Company may engage in future acquisitions and may encounter difficulties in integrating the acquired businesses, and, therefore, may not realize the anticipated benefits of the acquisitions in the time frames anticipated, or at all.
From time to time, the Company may seek to grow through strategic acquisitions intended to complement or expand one or more of its business segments, such as the acquisition of Palm Coast Data Holdco, Inc. in January 2007, or to enable the Company to enter a new business. The success of these transactions will depend in part on the Company’s ability to integrate the systems and personnel acquired in these transactions into its existing business without substantial costs, delays or other operational or financial problems. The Company may encounter difficulties in integrating acquisitions with the Company’s operations or in separately managing a new business. Furthermore, the Company may not realize the degree of benefits that the Company anticipates when first entering into a transaction, or the Company may realize benefits more slowly than it anticipates. Any of these problems or delays could adversely affect the Company’s results of operations.
The Company’s current management and internal systems may not be adequate to handle the Company’s growth, if any.
To manage the Company’s future growth, if any, the Company’s management must continue to improve operational and financial systems and to expand, train, retain and manage the Company’s employee base. If the Company grows, it will also likely need to recruit and retain additional qualified management personnel, and its ability to do so will depend upon a number of factors, including the Company’s results of operations and prospects and the level of competition then prevailing in the market for qualified personnel. At the same time, the Company will likely be required to manage an increasing number of relationships with various customers and other parties. If the Company’s management personnel, systems, procedures and controls are inadequate to support its operations, expansion could be slowed or halted and the opportunity to gain significant additional market share could be impaired or lost. Any inability of the Company’s management to manage the Company’s growth effectively may adversely affect its results of operations.
The Company’s business could be seriously harmed if the Company’s accounting controls and procedures are circumvented or otherwise fail to achieve their intended purposes.
Although the Company evaluates its internal controls over financial reporting and its disclosure controls and procedures at the end of each quarter, any system of controls, however well designed and operated, is based in part on certain assumptions and can provide only reasonable, not absolute, assurances that the objectives of the system will be met. Any failure or circumvention of the controls and procedures or failure to comply with regulations related to controls and procedures could have a material adverse effect on the Company’s results of operations.
In addition, there can be no assurance that the Company’s internal control systems and procedures, or the integration of its subscription fulfillment services businesses into one location in Florida or any other future acquisitions and their respective internal control systems and procedures, will not result in or lead to a future material weakness in the Company’s internal controls, or that the Company or its independent registered public accounting firm will not identify a material weakness in the Company’s internal controls in the future. If the Company’s internal controls
14
over financial reporting are not considered adequate, the Company’s financial statements could become incorrect or misleading and the Company may experience a loss of public confidence, which could subject the Company to liability and have an adverse effect on the Company’s business and the price of the Company’s common stock.
Further, deficiencies or weaknesses that are not yet identified by the Company could emerge and the identification and correction of those deficiencies or weaknesses could have an adverse effect on the Company’s results of operations.
The Company’s pension plan, which the Company froze in 2004, is currently underfunded and will require additional cash contributions.
The Company’s pension plan was underfunded on a generally accepted accounting principles basis by approximately $12.1 million at April 30, 2010. The Company froze the pension plan effective March 1, 2004 so that from that date there would be no new participants in the plan and the existing participants’ future compensation would not affect their pension benefits. A key assumption underlying the actuarial calculations upon which the Company’s accounting and reporting obligations for the pension plan are based is an assumed annual investment rate of return of eight percent. If the pension plan assets do not realize the expected rate of return, or if any other assumptions underlying the actuarial calculations are incorrect or are modified, the Company may be required to make contributions to the pension plan beyond current requirements, which could impact the Company’s financial resources.
The Company’s quarterly and annual operating results can fluctuate significantly.
The Company has experienced, and is likely to continue to experience, significant fluctuations in its quarterly and annual operating results, which may adversely affect the Company’s stock price. Future quarterly and annual operating results may not align with past trends as a result of numerous factors, including many factors that result from the unpredictability of the nature and timing of real estate land sales, the variability in gross profit margins and competitive pressures.
Changes in the Company’s income tax estimates could affect profitability.
In preparing the Company’s consolidated financial statements, significant management judgment is required to estimate the Company’s income taxes. The Company’s estimates are based on its interpretation of federal and state tax laws and regulations. The Company estimates actual current tax due and assesses temporary differences resulting from differing treatment of items for tax and accounting purposes. The temporary differences result in deferred tax assets and liabilities, which are included in the Company’s consolidated balance sheet. Adjustments may be required by a change in assessment of the Company’s deferred tax assets and liabilities, changes due to audit adjustments by federal and state tax authorities, and changes in tax laws. To the extent adjustments are required in any given period, the Company will include the adjustments in the tax provision in its financial statements. These adjustments could have an adverse effect on the Company’s financial position, cash flows and results of operations.
The price of the Company’s common stock in recent years has been volatile. This volatility may make it difficult for shareholders to sell the Company’s common stock, and the sale of substantial amounts of the Company’s common stock could adversely affect the price of the Company’s common stock.
The market price for the Company’s common stock varied between a high of $62.66 and a low of $9.70 per share during the two fiscal years ended April 30, 2010. This volatility may make it difficult for a shareholder to sell the Company’s common stock, and the sale of substantial amounts of the Company’s common stock could adversely affect the price of the common stock. The Company’s stock price is likely to continue to be volatile and subject to significant price fluctuations in response to market and other factors, including the other factors discussed in “Risk Factors”, and:
|
•
|
variations in the Company’s quarterly and annual operating results, which could be significant;
|
||
|
•
|
material announcements by the Company or the Company’s competitors;
|
||
|
•
|
sales of a substantial number of shares of the Company’s common stock; and
|
||
|
•
|
adverse changes in general market conditions or economic trends.
|
||
15
In addition to the factors discussed above, the Company’s common stock is relatively thinly traded, which means that large transactions in the Company’s common stock may be difficult to conduct in a short time frame and may cause significant fluctuations in the price of the Company’s common stock. The average trading volume in the Company’s common stock on the New York Stock Exchange over the ten-day trading period ending on April 30, 2010 was approximately 3,600 shares per day. Further, there have been, from time to time, significant “short” positions in the Company’s common stock, consisting of borrowed shares sold, or shares sold for future delivery, which may not have been borrowed. Any attempt by the short sellers to liquidate their positions over a short period of time could cause significant volatility in the price of the Company’s common stock.
In the past, following periods of volatility in the market price of their stock, many companies have been the subject of securities class action litigation. The Company has not been involved in any securities class action litigation; however, if the Company were to become involved in securities class action litigation in the future, it could result in substantial costs and diversion of the Company’s management’s attention and resources and could harm the Company’s stock price, business,
prospects, results of operations and financial condition. In addition, the broader stock market has experienced significant price and volume fluctuations in recent years. This volatility has affected the market prices of securities issued by many companies for reasons unrelated to their operating performance and may adversely affect the price of the Company’s common stock.
The Company has a principal shareholder whose interests may conflict with other investors.
The Company has a principal shareholder, Nicholas G. Karabots, who, together with certain of his affiliates, currently owns approximately 60% of the Company’s outstanding common stock. As a result, this principal shareholder exercises significant influence over the Company’s major decisions, including through his ability to vote for the members of the Company’s Board of Directors. Because of this voting power, the principal shareholder could influence the Company to make decisions that might run counter to the wishes of the Company’s other shareholders generally. In addition, publishing companies owned or controlled by the Company’s principal shareholder are also significant customers of the Company’s Newsstand Distribution Services business, as well as customers of its Subscription Fulfillment Services business, and, as a result, the shareholder may have business interests with respect to the Company that differ from or conflict with those of other holders of the Company’s common stock.
Although the Company has paid dividends in the past, no dividends have been paid since 2008; the Company has no regular dividend policy and offers no assurance of any future dividends.
The Company paid no cash dividends on its common stock in 2010 or 2009 although the Company paid special cash dividends on its common stock during the five fiscal years 2004 through 2008. The Board of Directors has stated that it may consider special dividends from time-to-time in the future in light of conditions then existing, including earnings, financial condition, cash position, and capital requirements and other needs. Notwithstanding such statement and the status of such future conditions, no assurance is given that there will be any such future dividends declared or that future dividend declarations, if any, will be commensurate in amount or frequency with past dividends.
The Company is currently a “controlled company” within the meaning of the New York Stock Exchange rules. As a result, the Company is exempt from certain corporate governance requirements and will not need to fully comply with those requirements until one year after the Company is no longer a “controlled company”.
Because Nicholas G. Karabots and certain of his affiliates together currently own more than 50% of the voting power of the Company’s common stock, the Company is considered a “controlled company” for the purposes of the rules and regulations of the New York Stock Exchange. As such, the Company is permitted, and has elected, to opt out of the New York Stock Exchange requirements that would otherwise require its compensation and human resources committee to consist entirely of independent directors. The Company has also opted not to have a nominating/corporate governance committee as required by the New York Stock Exchange for non-controlled companies. At such time, if any, as the Company is no longer considered a “controlled company” for purposes of the rules and regulations of the New York Stock Exchange, those rules and regulations provide for a twelve month transition period during which the Company will not need to fully comply with the otherwise applicable requirements. The Company will not be required to have entirely independent compensation and human resources and nominating/corporate governance committees until twelve months following the date on which it ceases to be a controlled company, although the Company will need to phase in independent members for each of these committees starting on the date that it ceases to be a controlled company. While the Company remains a controlled company and
16
during any transition period following the Company’s ceasing to be a controlled company, shareholders may not have the same protections afforded to shareholders of companies that are subject to all of the New York Stock Exchange corporate governance requirements.
The presence of a controlling shareholder of the Company, as well as certain provisions of Oklahoma law and the Company’s organic documents, may impede or discourage a takeover, which may have a limiting effect on the market price of the Company’s common stock.
The concurrence of the Company’s majority controlling shareholder is needed for any third party to acquire control of the Company, even if a change in control would be beneficial to the Company’s other shareholders.
Furthermore, the Company is an Oklahoma corporation and even in the absence of a controlling shareholder, the anti-takeover provisions of the Company’s amended certificate of incorporation and of Oklahoma law generally prohibit the Company from engaging in “business combinations” with an “interested shareholder”, as those terms are defined therein, unless the holders of at least two-thirds of the Company’s then outstanding common stock approve the transaction. In addition to this restriction, some other provisions of the Company’s amended certificate of incorporation and of its by-laws may discourage certain acts involving a fundamental change of the Company. For example, the Company’s amended certificate of incorporation and its by-laws contain certain provisions that:
|
•
|
classify the Company’s Board of Directors into three classes, each of which serves for a term of three years, with one class being elected each year; and
|
||
|
•
|
prohibit shareholders from calling a special meeting of shareholders.
|
||
Because the Company’s Board of Directors is classified and the Company’s amended certificate of incorporation and by-laws do not otherwise provide, Section 1027 of the Oklahoma General Corporation Act permits the removal of any member of the board of directors only for cause.
These factors could impede a merger, takeover or other business combination involving the Company or discourage a potential acquirer from making a tender offer for the Company’s common stock, which could have a limiting effect on the market price of the Company’s common stock.
Not applicable.
The Company’s executive offices are located in approximately 2,600 square feet of leased space in an office building in Princeton, New Jersey. Real Estate operations are based in approximately 5,400 square feet of leased space in an office building in Rio Rancho, New Mexico. In addition, other real estate inventory and investment properties are described in Item 1. Kable’s executive offices are located in New York City, and these offices together with the production, administration, sales and other facilities for its Subscription Fulfillment Services, Newsstand Distribution Services and Product Services and other businesses are located in twenty owned or leased facilities which, in the aggregate, comprise approximately 650,000 square feet of space with the principal locations being in Mt. Morris, Illinois; Palm Coast, Florida; St. Augustine, Florida; Fairfield, Ohio and New York City. The Company believes its facilities are adequate for its current requirements.
A. In June 2008, a lawsuit entitled
Haan, etc. v. Kable News Company, Inc., et al
(“Kable News”) was filed in the Circuit Court of the Fifteenth Judicial Circuit, Ogle County, Illinois, against Kable News by an insurance company as subrogee of the owner of a warehouse building leased to Kable News that was destroyed in a fire in December 2007. The lawsuit also named as a defendant a temporary staffing company that provided Kable News with an employee who is alleged to have had a role in causing the fire. Plaintiff’s claims specific to Kable News are based on allegations of negligence and willful and wanton misconduct. The damages being sought are not to expected to exceed $1,200,000. Kable News’ liability insurance carrier has undertaken its defense under a reservation of rights. Kable News is vigorously defending the lawsuit and its motion to dismiss plaintiff’s claims against Kable News on substantive grounds was recently granted. However, the possibility of an appeal of the dismissal and the other
defendant’s claim against Kable News for contribution remain. The Company is not in a position to predict the outcome of the lawsuit.
17
B. In November 2008, a lawsuit entitled
Alpinist, et al v. Haan, et al
was filed in the Circuit Court of the Fifteenth Judicial Circuit, Ogle County, Illinois, against Kable News by a magazine publisher and a number of insurance companies as the subrogees of other magazine publishers seeking damages for their property stored by Kable News in the warehouse that was destroyed in the fire referred to above. The three defendants are the warehouse owner, Kable News and the temporary staffing company that is a defendant in the lawsuit described above. Plaintiffs’ claims specific to Kable News are based on allegations of negligence, breach of contract and willful and wanton misconduct. The lawsuit has been dismissed as to a number of plaintiffs without any damages being paid by Kable News. There are two remaining plaintiffs and their damage claims total approximately $800,000. Kable News is vigorously defending the lawsuit and its motion to dismiss the two plaintiffs’ claims against Kable News on substantive grounds was recently granted. However, the possibility of an appeal of the dismissal and the other defendants’ claims against Kable News for contribution remain. The Company is not in a position to predict the outcome of the lawsuit.
C. In December 2009, Kable News received a demand for arbitration by the American Arbitration Association from
Nest, LLC
, another publisher which had copies of magazines and a book stored at the warehouse that were destroyed in the fire referred above. Claimant is seeking damages of $650,000 and is contending that the magazines were unique and artistic, that at the time of their destruction claimant was in the process of finalizing a contract for their sale, and that due to the special printing involved, the replacement cost is far in excess of the purchase price. The property and casualty insurance carrier for Kable News is providing the defense in this proceeding. Discovery of the basis for claimant’s alleged damages has yet to take place. Kable News is vigorously defending the proceeding and believes it has meritorious defenses to the asserted value of the loss. The arbitration hearing is scheduled for November 2010. The Company is not in a position to predict the outcome of this proceeding.
D. In March 2009, a civil action was commenced in the United States District Court for the Southern District of New York entitled
Anderson News, L.L.C., et al. v. American Media, Inc., et al.
Anderson News, L.L.C. (“Anderson”) was a wholesaler of magazines. Anderson has alleged that magazine publishers and distributors, including Kable Distribution Services, Inc. (“Kable Distribution”), conspired to boycott Anderson to drive it out of business, and that other wholesalers participated in this effort. Anderson has asserted claims under Section 1 of the Sherman Act (antitrust), for defamation, for tortious interference with its contracts with retailers, and for civil conspiracy. Damages have not been quantified, but would presumably be alleged to be substantial. Anderson has alleged that the distributor and publisher defendants acted in concert to cut off Anderson from its supply of magazines to enable them to gain control of the single-copy magazine distribution channel. Kable Distribution is vigorously defending the lawsuit and has moved, along with the other defendants, to dismiss the action. A decision on the motion is awaited. The Company is not in a position to predict the outcome of the lawsuit.
E. In March 2010, an action was commenced in the United States District Court for the Southern District of Florida entitled
vTRAX Technologies Licensing, Inc. v. Siemens Communications, Inc., et al.
, in which Palm Coast Data LLC (“Palm Coast”) is one of the defendants. The complaint alleges that the plaintiff is the owner of a patent covering a method and computer program for the operation of a call center system and that the patent is being infringed by each of the defendants, and seeks injunctive relief and damages. Palm Coast acquired its call center system from a co-defendant’s predecessor-in-interest. Palm Coast has filed its answer denying infringement of the patent and has raised counterclaims challenging both the infringement allegations and the validity of the patent. Palm Coast is vigorously defending the lawsuit. However, the lawsuit is at an early stage, and the Company is not in a position to predict its outcome.
F.
An employment discrimination lawsuit entitled
Garcia v. Kable Fulfillment Services, Inc. and Kable News Company, Inc.
has been pending in the Boulder County, Colorado District Court since 2005. The defendants are Kable Media subsidiaries. The case has gone through numerous proceedings including extensive motion practice, various appeals and an overturned jury verdict. In April 2010, in a second jury trial, a verdict against the defendants was rendered in which the jury awarded the plaintiff approximately $236,000 in damages. The trial remains open for the possible further award of front-end damages, and liquidated damages of as much as twice the damage award based upon the jury’s finding of a willful Age Discrimination in Employment Act violation, plus an award of plaintiff’s counsel fees and court costs. In July 2010 the defendants’ motion to reduce the jury award on various grounds was rejected by the Court. The defendants carry employment practices liability insurance coverage for their liability. Following the Court's decision, Plaintiff made a settlement demand, and the insurance carrier has indicated it is willing to cover the full amount of the settlement demand beyond the unapplied retention. Settlement on this basis is acceptable to the Company, and the Company has made no accrual related to this case in the accompanying financial statements beyond the amount of the unapplied retention of approximately $75,000.
18
G. The Company and its subsidiaries are involved in various other claims and legal actions arising in the normal course of business. While the ultimate results of these matters cannot be predicted with certainty, management believes that they will not have a material adverse effect on the Company’s consolidated financial position, liquidity or results of operations.
Executive Officers of the Registrant
Set forth below is certain information concerning persons who are the current executive officers of the Company.
|
Name
|
Office Held / Principal Occupation for Past Five Years
|
Age
|
|
|
James Wall
|
Senior Vice President of the Company since 1991; Chairman, President
|
73
|
|
|
and Chief Executive Officer of AMREP Southwest Inc. since 1991.
|
|||
|
Peter M. Pizza
|
Vice President and Chief Financial Officer of the Company since 2001;
|
59
|
|
|
Vice President and Controller of the Company from 1997 to 2001.
|
|||
|
Irving Needleman
|
Vice President, General Counsel and Secretary of the Company
|
72
|
|
|
since November 2006. Of counsel to the law firm of McElroy, Deutsch,
|
|||
|
Mulvaney & Carpenter, LLP from September 2005 to October 2006.
|
|||
|
Partner in the law firm of Jacobs Persinger & Parker for more than one
|
|||
|
year prior to September 2005.
|
|||
|
Michael P. Duloc
|
President and Chief Executive Officer of Kable Media Services, Inc.
|
53
|
|
|
since June 1, 2007; President of Kable’s Newsstand Distribution
|
|||
|
Services business since 1996 and Chief Operating Officer of that business
|
|||
|
until June 2007; President and Chief Operating Officer of Kable’s
|
|||
|
Fulfillment Services business from 2000 until January 2007.
|
|||
|
John Meneough
|
Executive Vice President, Fulfillment Services of Kable Media
|
62
|
|
|
Services, Inc. and President and Chief Operating Officer of the Company’s
|
|||
|
Subscription Fulfillment Services business since January 2007. President of
|
|||
|
Palm Coast Data Holdco, Inc. and Palm Coast Data LLC since 2002 and
|
|||
|
President of their predecessor companies since 1996.
|
The executive officers are elected or appointed by the Board of Directors of the Company or its appropriate subsidiary to serve until the appointment or election and qualification of their successors or their earlier death, resignation or removal.
|
Item 5.
|
Market for Registrant's Common Equity, Related Stockholder Matters and Issuer Purchases of Equity
|
The Company’s common stock is traded on the New York Stock Exchange under the symbol “AXR”. On June 30, 2010, there were approximately 840 holders of record of the common stock. The range of high and low sales prices of the common stock for the last two fiscal years by quarter is presented below:
|
FIRST
|
SECOND
|
THIRD
|
FOURTH
|
|||||||||||||||||||||||||||||
|
HIGH
|
LOW
|
HIGH
|
LOW
|
HIGH
|
LOW
|
HIGH
|
LOW
|
|||||||||||||||||||||||||
|
2010
|
$ | 20.60 | $ | 9.70 | $ | 15.39 | $ | 11.04 | $ | 14.79 | $ | 12.09 | $ | 15.75 | $ | 13.38 | ||||||||||||||||
|
2009
|
$ | 56.67 | $ | 41.12 | $ | 62.66 | $ | 26.91 | $ | 40.27 | $ | 22.01 | $ | 34.50 | $ | 13.18 | ||||||||||||||||
19
Dividend Policy
The Company paid no cash dividends on its common stock in 2010 or 2009. The Board of Directors has stated that it may consider special dividends from time to time in the future in light of conditions then existing, including earnings, financial condition, cash position, and capital requirements and other needs. Notwithstanding such statement and the status of such future conditions, no assurance is given that there will be any such future dividends declared or that future dividend declarations, if any, will be commensurate in amount or frequency with past dividends.
Performance Graph
The following graph compares for the five years ended April 30, 2010 the cumulative total shareholder return on the Company's common stock with the cumulative total return of the Standard & Poor's 500 Index (“S&P 500 Index”) and with an index comprised of the stock (or comparable equity interest) of 27 companies with market capitalizations at the start of the period similar to that of the Company (“Similar Cap Issuers”) (assuming the investment of $100 in the stock of the Company, the S&P 500 Index and the Similar Cap Issuers at the close of trading on April 30, 2005 and the reinvestment of all dividends). The Company cannot identify an index of issuers engaged in operations similar to those in which it is currently engaged and therefore has determined to use the Similar Cap Issuers for purposes of comparison.
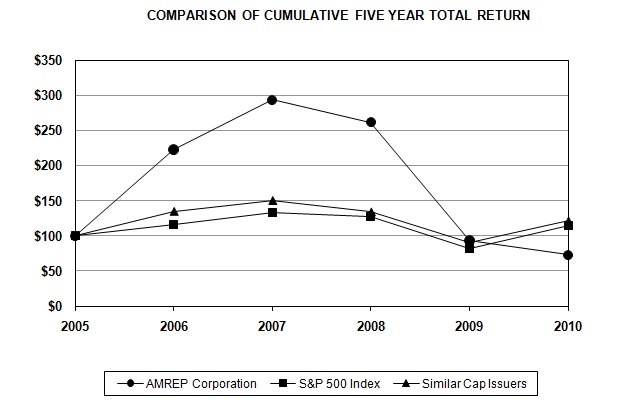
|
Company Name / Index
|
2005
|
2006
|
2007
|
2008
|
2009
|
2010
|
|
AMREP Corporation
|
100
|
222.48
|
293.29
|
261.37
|
93.17
|
72.67
|
|
S&P 500 Index
|
100
|
115.42
|
133.00
|
126.78
|
82.01
|
113.87
|
|
Similar Cap Issuers
|
100
|
134.84
|
150.35
|
133.94
|
89.73
|
121.15
|
The Similar Cap Issuers are: Aceto Corporation, AEP Industries Inc., Alnylam Pharmaceuticals, Inc., Atlantic Coast Federal Corporation, Bank of Marin Bancorp, BRT Realty Trust, Bryn Mawr Bank Corporation, Cascade Financial Corporation, Celadon Group, Inc., CenterState Banks, Inc., Cornell Companies, Inc., Curis, Inc. Dynamics Research Corporation, Eastern American Natural Gas Trust, Endologix, Inc., Gerber Scientific, Inc., Joe’s Jeans Inc., Kendle International Inc., LeCroy Corporation, National Bankshares, Inc., Nevada Gold & Casinos, Inc., Omnicell, Inc., Opnet Technologies, Inc., Sigma Designs, Inc., Team, Inc., Unifi, Inc. and Weyco Group, Inc.
20
As a result of changes in market capitalizations from year to year, only Bank of Marin Bancorp in the Similar Cap Issuer index in the Company’s 2009 Form 10-K met the criteria for inclusion in the Similar Cap Issuer index in this Form 10-K. The other companies comprising the Similar Cap Issuer index in the Company’s 2009 Form 10-K were: American Dental Partners, Inc., American Safety Insurance Holdings, Ltd., American Software, Inc., Cavalier Homes, Inc., Century Bancorp, Inc., Citizens South Banking Corporation, Combimatrix Corporation, Consolidated Water Co. Ltd., Continucare Corporation, Emcore Corporation, FNB United Corp., Frequency Electronics, Inc., Hawaiian Holdings, Inc., HMN Financial, Inc., HMS Holdings Corp., Indiana Community Bancorp, Luby’s Inc., Markwest Energy Partners, L.P., Multi-Color Corporation, Northern States Financial Corporation, Olympic Steel, Inc., Oncothyreon, Inc., Osteotech, Inc., Pennsylvania Commerce Bancorp, Inc., Syms Corp. and Utah Medical Products, Inc.
Equity Compensation Plan Information
See Item 12 of this annual report on Form 10-K that incorporates such information by reference from the Company’s Proxy Statement for its 2010 Annual Meeting of Shareholders.
The selected consolidated financial data presented below for, and as of the end of, each of the last five fiscal years has been derived from and is qualified by reference to the Company’s consolidated financial statements. The consolidated financial statements have been audited by McGladrey & Pullen, LLP, independent registered public accounting firm. The information should be read in conjunction with the consolidated financial statements and related notes thereto and “Management’s Discussion and Analysis of Financial Condition and Results of Operations”, which is Item 7 of Part II of this annual report on Form 10-K. These historical results are not necessarily indicative of the results to be expected in the future.
|
Year Ended April 30,
|
|||||||||||
|
2010(a)
|
2009(b)
|
2008
|
2007
|
2006
|
|||||||
|
(In thousands, except per share amounts)
|
|||||||||||
|
Financial Summary:
|
|||||||||||
|
Revenues
|
$ |
120,498
|
$ |
145,901
|
$ |
172,061
|
$ |
204,839
|
$
|
148,296 | |
|
Income (Loss) from Continuing
Operations
|
$ |
(9,480)
|
$ |
(43,466)
|
$ |
13,762
|
$ |
46,697
|
$
|
22,494 | |
|
Income (Loss) from Discontinued Operations, net of tax
|
$ |
-
|
$ |
-
|
$ |
(57)
|
$ |
(1,591)
|
$
|
3,556 | |
|
Net Income (Loss)
|
$ |
(9,480)
|
$ |
(43,466)
|
$ |
13,705
|
$ |
45,106
|
$
|
26,050 | |
|
Total Assets
|
$ |
211,509
|
$ |
227,652
|
$ |
284,951
|
$ |
292,659
|
$
|
189,041 | |
|
Capitalization:
|
|||||||||||
|
Shareholders’ Equity
|
$ |
86,567
|
$ |
96,281
|
$ |
145,056
|
$ |
160,004
|
$
|
118,970 | |
|
Notes Payable
|
$ |
28,654
|
$ |
37,936
|
$ |
25,980
|
$ |
32,299
|
$
|
6,016 | |
|
Per Share:
|
|||||||||||
|
Earnings (Loss) from Continuing
Operations
|
$ |
(1.58)
|
$ |
(7.25)
|
$ |
2.20
|
$ |
7.02
|
$
|
3.39 | |
|
Income (Loss) from
Discontinued Operations
|
$ |
-
|
$ |
-
|
$ |
(0.01)
|
$ |
(0.24)
|
$
|
0.54 | |
|
Earnings (Loss) -
|
|||||||||||
|
Basic and Diluted
|
$ |
(1.58)
|
$ |
(7.25)
|
$ |
2.19
|
$ |
6.78
|
$
|
3.93 | |
|
Book Value
|
$ |
14.44
|
$ |
16.06
|
$ |
24.20
|
$ |
24.05
|
$
|
17.91 | |
|
Cash Dividend
|
$ |
-
|
$ |
-
|
$ |
1.00
|
$ |
0.85
|
$
|
4.05 | |
|
Shares Outstanding, End of Year
|
5,996
|
5,996
|
5,995
|
6,654
|
|
6,644 | |||||
|
(a)
|
Includes a pre-tax charge of $2,075 related to the impairment of certain real estate ($1,307 after tax, or $0.22 per share). See Note 9 to the consolidated financial statements included in this annual report on Form 10-K for further information.
|
|
(b)
|
Includes a pre-tax charge of $50,246 related to the impairment of goodwill ($41,557 after tax, or $6.93 per share). See Note 9 to the consolidated financial statements included in this annual report on Form 10-K for further information.
|
21
|
Item 7.
|
Management’s Discussion and Analysis of Financial Condition and Results of Operations
|
INTRODUCTION
F
or a description of the Company’s business, refer to Item 1 of Part I of this annual report on Form 10-K.
As indicated in Item 1, the Company is primarily engaged in four business segments: the Real Estate business operated by AMREP Southwest Inc. and its subsidiaries (collectively, “AMREP Southwest”) and the Subscription Fulfillment Services, Newsstand Distribution Services and Product Services and Other businesses operated by Kable Media Services, Inc. and its subsidiaries (collectively, “Kable” or “Media Services”). Data concerning industry segments is set forth in Note 20 of the notes to the consolidated financial statements. The Company’s foreign sales and activities are not significant.
The following provides information that management believes is relevant to an assessment and understanding of the Company’s consolidated results of operations and financial condition. The discussion should be read in conjunction with the consolidated financial statements and accompanying notes. All references in this Item 7 to 2010, 2009 and 2008 mean the fiscal years ended April 30, 2010, 2009 and 2008, unless otherwise qualified.
CRITICAL ACCOUNTING POLICIES AND ESTIMATES
The Company prepares its financial statements in conformity with accounting principles generally accepted in the United States of America. The Company discloses its significant accounting policies in the notes to its audited consolidated financial statements.
The preparation of such financial statements requires management to make estimates and assumptions that affect the reported amounts of assets and liabilities and disclosures of contingent assets and liabilities at the dates of those financial statements as well as the reported amounts of revenues and expenses during the reporting periods. Areas that require significant judgments and estimates to be made include: (i) the determination of revenue recognition for the Newsstand Distribution Services business, which is based on estimates of allowances for magazine returns to the Company from wholesalers and the offsetting returns of magazines by the Company to publishers for credit; (ii) allowances for doubtful accounts; (iii) real estate cost of sales calculations, which are based on land development budgets and estimates of costs to complete; (iv) cash flow and valuation assumptions in performing asset impairment tests of long-lived assets, goodwill impairment and assets held for sale; (v) actuarially determined benefit obligations for pension plan accounting; (vi) risk assessment of certain uncertain tax positions; and (vii) legal contingencies. Actual results could differ from those estimates.
There are numerous critical assumptions that may influence accounting estimates in these and other areas. Management bases its critical assumptions on historical experience, third-party data and various other estimates that it believes to be reasonable under the circumstances. The most critical assumptions made in arriving at these accounting estimates include the following: (i) Newsstand Distribution Services revenues represent commissions earned from the distribution of publications for client publishers, which are recorded by the Company at the time the publications go on sale in accordance with the Financial Accounting Standards Board ("FASB") Accounting Standards Codification (“ASC”) 605. The publications generally are sold on a fully returnable basis, which is in accordance with prevailing trade practice. Accordingly, the Company provides for estimated returns by charges to income that are determined on an issue-by-issue basis utilizing historical experience and current sales information. The financial impact to the Company of a change in the sales estimate for magazine returns to it from its wholesalers is substantially offset by the simultaneous change in the Company’s estimate of its cost of purchases since it passes on the returns to publishers for credit. As a result, the effect of a difference between the actual and estimated return rates on the Company’s commission revenues is the amount of the commission attributable to the difference. The effect of an increase or decrease in the Company’s estimated rate of returns of 1% during any period would be dependent upon the mix of magazines involved and the related selling prices and commission rates, but would generally result in a change in that period’s net commission revenues of approximately $100,000; (ii) management determines the allowance for doubtful accounts by attempting to identify troubled accounts by analyzing the credit risk of specific customers and by using historical experience applied to the aging of accounts and, where appropriate within the real estate business, by reviewing any collateral which may secure a receivable; (iii) real estate development costs are incurred throughout the life of a project, and the costs of initial sales from a project frequently must include a portion of costs that have been budgeted based on engineering estimates or other studies, but not yet incurred; (iv) asset impairment determinations (including that of goodwill, which is based on the fair value of reporting units) are based upon the intended use of assets and expected future cash flows; (v) benefit obligations and other pension plan
22
accounting and disclosures are based upon numerous assumptions and estimates, including the expected rate of investment return on retirement plan assets, the discount rate used to determine the present value of liabilities, and certain employee-related factors such as turnover, retirement age and mortality. As of April 30, 2010, the effect of every 0.25% change in the investment rate of return on retirement plan assets would increase or decrease the pension expense by approximately $49,000 per year, and the effect of every 0.25% change in the discount rate would increase or decrease the subsequent year’s pension cost by approximately $39,000; (vi) the Company assesses risk for certain uncertain tax positions and recognizes the financial statement effects of a tax position when it is more likely than not that the position will be sustained upon examination by tax authorities; and (vii) the Company is currently involved in legal proceedings which are described in Item 3 of this annual report on Form 10-K. It is possible that the consolidated financial position or results of operations for any particular quarterly or annual period could be materially affected by an outcome of litigation that is significantly different from the Company’s assumptions.
RESULTS OF OPERATIONS
Year Ended April 30, 2010 Compared to Year Ended April 30, 2009
For 2010, the Company recorded a net loss of $9,480,000, or $1.58 per share, compared to a 2009 net loss of $43,466,000, or $7.25 per share. The results for 2010 included a pre-tax, non-cash impairment charge of $2,075,000 ($1,307,000 after tax, or $0.22 per share), reflecting the write-down of a real estate asset in Colorado. The results for 2009 included a pre-tax, non-cash impairment charge of $50,246,000 ($41,557,000 after tax, or $6.93 per share), reflecting the write-off of all of the goodwill of the Company’s Subscription Fulfillment Services segment, and in addition included a write-off of $6,500,000 ($4,095,000 after tax, or $0.68 per share) in respect of a receivable from a major magazine wholesaler which closed its business during 2009. Revenues for 2010 were $120,498,000 compared to $145,901,000 in the prior year.
Revenues from land sales at AMREP Southwest decreased from $8,914,000 in 2009 to $5,185,000 in 2010. AMREP Southwest has continued to experience substantially lower land sales in its principal market of Rio Rancho, New Mexico than it has historically experienced due to the prolonged severe decline in the real estate market in the greater Albuquerque-metro and Rio Rancho areas. Total acres sold were 56 in 2010 and 148 in 2009. The trend of declining permits for new home construction in the Rio Rancho area also continued, with 20% fewer single-family residential building permits issued during 2010 than in 2009. The Company believes that this decline in new home construction reflected the persistenly weak national and local New Mexico economies due to high unemployment levels, low consumer confidence, reduced credit availability and weak consumer spending, among other factors. Faced with these adverse conditions, many builders have slowed the pace of building on developed lots previously purchased from the Company in Rio Rancho and delayed or cancelled the purchase of additional developed lots. These factors have also contributed to a steep decline in the Company's sale of undeveloped land to both builders and investors.
In Rio Rancho, the Company offers for sale both developed and undeveloped lots to national, regional and local home builders, commercial and industrial property developers and others. The average selling price of land sold by the Company in Rio Rancho was $92,000 per acre in 2010 and $60,200 per acre in 2009, reflecting differences in the mix of the types of properties sold relative to the total acreage in each period. The average gross profit percentage on land sales was 40% for 2010 compared to 76% for 2009. The decrease in gross profit margin for 2010 was primarily attributable to one 2009 sale of approximately 50 acres of undeveloped land that contributed a gross profit of $3,825,000 (99%). As a result of these and other factors, including the nature and timing of specific transactions, revenues and related gross profits from real estate land sales can vary significantly from period to period and prior results are not necessarily a good indication of what may occur in future periods. In addition, in the fourth quarter of 2010, AMREP Southwest recorded an impairment charge for $2,075,000 related to real estate property held in Colorado. The adjustment was required due to a current appraisal that showed a significant deterioration in the fair market value of the property from a year ago.
Revenues from the Company’s Media Services operations decreased 16% from $136,206,000 for 2009 to $115,016,000 for 2010. Magazine publishers, who are the principal customers of the Company’s Media Services operations, continued to suffer from reduced advertising revenues and lower subscription and newsstand sales during both periods, which caused some publishers to close magazine titles or seek more favorable terms from Media Services as well as its competitors. Revenues from Subscription Fulfillment Services operations decreased from $115,964,000 for 2009 to $92,022,000 for 2010, primarily reflecting (i) customer losses and (ii) reduced and lost business that resulted from lower publisher customer volumes and a higher attrition of magazine titles than has been previously experienced. Revenues from Newsstand Distribution Services increased from $12,400,000 for 2009 to $12,947,000 in 2010 with the increase due primarily to changes in product mix and some magazine cover prices
23
increases. Revenues from Product Services and Other increased from $7,842,000 for 2009 to $10,047,000 for 2010, primarily from the full year inclusion of a product repackaging business and a temporary staffing business that were acquired in 2009, whereas in 2009 the results of these businesses were included only from the date of their asset purchases in November 2008. Media Services operating expenses decreased by $22,662,000 for 2010 compared to 2009, primarily attributable to a $11,894,000 reduction in wages and benefits associated with the revenue declines as well as from efficiencies resulting from a major project to consolidate the Subscription Fulfillment Services business which is discussed more fully below, partly offset by increased costs associated with the consolidation project, including the acceleration of depreciation and amortization of certain assets totaling $1,149,000, and the effect of the $6,500,000 write-off in respect of an uncollectible account receivable from the major newsstand distribution wholesaler in 2009 mentioned above with no similar event occurring in 2010.
Although there are multiple revenue streams in the Subscription Fulfillment Services business, including revenues from the maintenance of customer computer files and the performance of other fulfillment-related activities, including telephone call center support and graphic arts and lettershop services, a customer generally contracts for and utilizes all available services as a total package, and the Company would not normally provide ancillary services to a customer unless it was also providing the core service of maintaining a database of subscriber names. Thus, variations in Subscription Fulfillment Services revenues are the result of fluctuations in the number and sizes of customers rather than in the demand for a particular service. This is also true in the Newsstand Distribution Services business where there is only one primary service provided, which results in one revenue source, the commissions earned on the distribution of magazines. The Company competes with other companies, including three much larger companies in the Newsstand Distribution Services business and one larger company in the Subscription Fulfillment Services business, and the competition for new customers is intense in both segments, which results in a price sensitive industry that limits the Company’s ability to increase its prices.
In October 2008, the Company announced a project to consolidate its Subscription Fulfillment Services business operations from three locations in Colorado, Florida and Illinois into one existing location at Palm Coast, Florida, which is expected to streamline operations, improve service to clients and create cost efficiencies through reduced overhead costs and the elimination of operating redundancies. This project is expected to be completed by October 31, 2010. As of April 30, 2010, the Company had incurred approximately $6,300,000 for capital expenditures and $8,000,000 of non-recurring costs related to the consolidation project. The State of Florida and the City of Palm Coast agreed to provide incentives for the project, including cash and employee training grants and tax relief, which are largely contingent on job retention, job creation and capital investment. The Company recognized $255,000 and $293,000 of income for 2010 and 2009 for certain incentives related to the consolidation project, which was netted against restructuring costs of $6,018,000 and $1,414,000 for the same periods. As a result, the Company reported net charges to operations of $5,763,000 and $1,121,000 related to the consolidation project for 2010 and 2009. The items of income for incentives and of costs related to the consolidation project are included in Restructuring and fire recovery costs in the Company’s consolidated statements of operations and retained earnings.
As of April 30, 2010 and 2009, the Company had accruals for future payments related to the consolidation project of $1,982,000 and $713,000, principally for severance and facilities consolidation. Cash payments related to the project were $4,493,000 and $554,000 for 2010 and 2009. There were no significant accrual reversals in any year related to the consolidation project.
The Company anticipates approximately $300,000 of additional costs, primarely for severance, in 2011 related to the consolidation project.
In June 2009, the Company received $3,000,000 pursuant to an agreement with the State of Florida (the “Award Agreement”) as part of the incentives made available to the Company in connection with the consolidation project. The Award Agreement requires the Company to achieve certain objectives in terms of job retention, job creation and capital investment through December 31, 2011; if the objectives are not met, the Company may need to return a portion, or all, of the $3,000,000. Accordingly, the $3,000,000 has been recorded as a long term liability until the Company is irrevocably entitled to retain the award, at which time the award will be amortized into income over the life of the assets acquired with the grant monies received.
In December 2007, a warehouse leased by a Kable subsidiary in Oregon, Illinois and its contents were totally destroyed by fire. The warehouse was used principally to store back issues of magazines published by certain customers for whom the Company filled back-issue orders as part of its services. The Company was required to provide insurance for that property of certain of those customers. Through April 30, 2010, the Company’s insurance carrier had paid $348,000 to customers for lost materials.
The Company has filed various claims with its insurance provider related to the fire. As of April 30, 2010, the Company had been reimbursed a total of $1,142,000 for property lost in the fire, other expenses of relocation and professional fees. As a result of insurance reimbursements received, the Company recorded net gains totaling $216,000 for 2010 and $71,000 for 2009. The items of income and expense related to insurance proceeds and the fire recovery costs are included in Restructuring and fire recovery costs in the Company’s consolidated statements of operations and retained earnings.
24
In addition, the Company recorded other income for business interruption claims resulting from the fire that totaled $31,000 for 2010 and $287,000 for 2009. These income amounts are included in Media Services operations revenue in the Company’s consolidated statements of operations and retained earnings
.
Interest and other revenues decreased $484,000 for 2010 compared to 2009, primarily due to lower cash balances to invest.
Other operating expenses increased $1,091,000 (73%) for 2010 compared to the prior year, primarily due to an increase in real estate tax expense resulting from increased property tax valuations at AMREP Southwest.
General and administrative expenses of Media Services operations decreased $1,081,000 (9%) in 2010 compared to 2009, primarily due to increased efficiencies resulting from the Subscription Fulfillment Services business consolidation project.
The Company's effective tax rate was 38.3% in 2010 compared to 20.0% in 2009. The increase from the statutory rate in 2010 was primarily due to the recognition of previously unrecognized tax benefits associated with uncertain tax positions due to the expiration of applicable statutes of limitations. The decrease from the statutory rate in 2009 was primarily due to permanent items, the most significant being the charge against book income associated with non-amortizable goodwill.
Year Ended April 30, 2009 Compared to Year Ended April 30, 2008
The Company recorded a pre-tax, non-cash impairment charge in the fourth quarter of 2009 of $50,246,000 ($41,557,000 after tax, or $6.93 per share). This impairment charge reflected the write-off of all of the goodwill of the Company’s Subscription Fulfillment Services segment. After giving effect to this impairment charge, the Company had a net loss of $43,466,000, or $7.25 per share, for fiscal 2009 compared to net income of $13,705,000, or $2.19 per share, in 2008. Revenues for 2009 were $145,901,000 compared to $172,061,000 in the prior year.
Results for 2009 were entirely from continuing operations, including the impairment charge, while 2008’s results included a net loss from discontinued operations of $57,000, or $0.01 per share, that reflected costs incurred in connection with the settlement of all litigation related to the Company’s El Dorado, New Mexico water utility subsidiary that were in addition to costs that had been accrued for this matter in 2007. Excluding the impairment charge, the net loss from continuing operations in 2009 was $1,909,000, or $0.32 per share. This included the fourth quarter write-off in respect of a $6,500,000 receivable from a major magazine wholesaler which recently closed its business ($4,095,000 after tax, or $0.68 per share).
The primary reason for the fourth quarter 2009 non-cash goodwill impairment charge was the lower than expected fiscal 2009 revenues and operating results of the Company’s Subscription Fulfillment Services segment and a change in the Company’s internally projected future cash flows from that segment based on current industry trends. These reduced results and expectations reflected the well-publicized decline in the magazine publishing industry during fiscal 2009, which represents the Subscription Fulfillment Services segment’s principal customer base, as well as the deep recession that has impacted the entire U.S. economy and consumers and continuing economic uncertainty.
Revenues from land sales at AMREP Southwest decreased from $27,902,000 in 2008 to $8,914,000 in 2009, as AMREP Southwest experienced substantially lower land sales in its principal market of Rio Rancho, New Mexico due to the severe decline in the real estate market in the greater Albuquerque-metro and Rio Rancho areas. Total acres sold were 148 in 2009 and 406 in 2008. The trend of declining permits for new home construction in the Rio Rancho area also continued, with 27% fewer single-family residential building permits issued during 2009 than in 2008. The Company believes that this decline in new home construction was consistent with and the result of the prolonged weakening of the national economy due to high unemployment levels, the deterioration of consumer confidence and the reduction in credit availability and consumer spending. Faced with these adverse conditions, builders slowed the pace of building on developed lots previously purchased from the Company in Rio Rancho and delayed or cancelled the purchase of additional developed lots. These factors also contributed to a steep decline in the sale of undeveloped land to both builders and investors.
The average selling price of land sold by the Company in Rio Rancho was $60,200 per acre in 2009 and $68,700 per acre in 2008, reflecting differences in the mix of the types of properties sold in each period. As a result of these and other factors, including the nature and timing of specific transactions, revenues and related gross profits from real estate land sales can vary significantly from period to period and prior results are not necessarily a good indication of what may occur in future periods.
25
Revenues from the Company’s Media Services operations decreased 2% from $138,696,000 for 2008 to $136,206,000 for 2009. Magazine publishers, who are the principal customers of the Company’s Media Services operations, suffered generally from lower advertising revenues and lower subscription and newsstand sales during both periods, which led to reduced business for the Company’s Media Services operations. Revenues from Subscription Fulfillment Services operations decreased from $122,521,000 for 2008 to $115,964,000 for 2009, primarily reflecting the net effect of reduced and lost business that resulted from lower publisher customer volumes and higher attrition of magazine titles than had been previously experienced, offset in part by revenue gains from new and some existing clients. Revenues from Newsstand Distribution Services decreased from $12,916,000 for 2008 to $12,400,000 in 2009 with the decline due in part to the effects of a disruption in the wholesale distribution industry during the fourth quarter of 2009 caused by the closure of a major newsstand distribution wholesaler. Revenues from Product Fulfillment Services and Other increased from $3,259,000 for 2008 to $7,842,000 for 2009, primarily from the inclusion of a product repackaging and fulfillment business and a temporary staffing business from the date of their asset purchases in November 2008. Media Services operating expenses increased by $7,303,000 for 2009 compared to 2008, primarily attributable to the $6,500,000 write-off in respect of an uncollectible account receivable from the major newsstand distribution wholesaler that closed and, to a lesser extent, higher consulting and computer systems integration costs of the Subscription Fulfillment Services business.
In connection with the Company’s project to consolidate its Subscription Fulfillment Services business operations from three locations in Colorado, Florida and Illinois into one existing location at Palm Coast, Florida, the Company recognized $293,000 of income for 2009 for certain incentives related to the consolidation project, which was netted against restructuring costs of $1,414,000. As a result, the Company reported a net charge to operations of $1,121,000 related to the consolidation project for 2009. There was no income recognized for incentives for 2008. The items of income for incentives and of costs related to the consolidation project are included in Restructuring and fire recovery costs in the Company’s consolidated statements of operations and retained earnings. As of April 30, 2009 and 2008, the Company had accruals for future payments related to the consolidation project of $713,000 and $146,000, principally for severance.
During 2009, the Company replaced a portion of the fixed assets lost in the December 2007 fire that destroyed a warehouse leased by a Kable subsidiary. The Company recorded a $347,000 gain resulting from the recognition of insurance proceeds, which was netted against costs related to the fire, principally for legal and other advisory costs that were not covered by insurance. As a result, the Company reported a net gain to operations of $71,000 for 2009. In 2008 the Company recorded a net charge to operations of $354,000 related to fire recovery costs. The item of income related to insurance proceeds and the fire recovery costs are included in Restructuring and fire recovery costs in the Company’s consolidated statements of operations and retained earnings. In addition, the Company recorded $287,000 of other income in 2009 for a business interruption claim resulting from the fire.
Interest and other revenues decreased $4,682,000 for 2009 compared to 2008, primarily due to a pre-tax gain from the sale of a commercial property by AMREP Southwest for $1,873,000 and the forfeiture of deposits for the purchase of land by homebuilders who did not exercise purchase options of $927,000, both of which occurred in 2008, with no similar transactions occurring in 2009. In addition, interest and other revenues were also lower in 2009 compared to 2008 due to lower cash balances to invest.
Real estate commissions and selling expenses decreased $389,000, or 53%, for 2009 compared to 2008, principally due to the reduced land sales. Other operating expenses increased $649,000, or 77%, for 2009 compared to the prior year, primarily due to a net favorable $550,000 adjustment to real estate tax expense in 2008 resulting from the finalization of a property tax valuation appeal by AMREP Southwest.
General and administrative expenses of Media Services operations increased $641,000, or 5%, in 2009 compared to 2008, primarily due to the aforementioned higher consulting fees and computer system integration costs associated with the consolidation project of the Subscription Fulfillment Services business. Real estate operations and corporate general and administrative expense decreased $311,000, or 7%, for 2009 compared to 2008, primarily due to reduced professional fees.
The Company's effective tax rate from continuing operations was 20.0% in 2009 compared to 36.2% in 2008. The decrease from the statutory rate in 2009 was primarily due to permanent items, the most significant being the charge against book income associated with non-amortizable goodwill.
26
LIQUIDITY AND CAPITAL RESOURCES
The Company’s primary sources of funding for working capital requirements are cash flow from operations and banking facilities. The Company's liquidity is affected by many factors, including some that are based on normal operations and some that are related to the industries in which the Company operates and the economy. As discussed below, AMREP Southwest finances its operations in part through a loan agreement which matures in December 2010. As of April 30, 2010, the outstanding principal of this loan was $22,500,000. AMREP Southwest will be initiating discussions with the bank regarding renewal of this arrangement. However, there can be no assurance that this facility can be renewed on acceptable terms. If AMREP Southwest is not able to renew this facility on acceptable terms, or refinance it with another lender, the Company would be forced to seek additional funds by selling assets or issuing equity, which it may not be able to do on favorable terms, if at all. In addition, the Company’s Kable Media Services business now finances its operations in part through a revolving credit facility which replaced a predecessor revolving credit facility in May 2010. As of April 30, 2010, no loans were outstanding under the predecessor revolving credit facility. The Company’s Kable Media Services business also relies on cash flow from operations to fund its working capital requirements, including cash flow made available to it through arrangements with customers and wholesalers that are subject to expiration and renegotiation from time to time. If AMREP Southwest does not renew or refinance its loan agreement or certain of Kable Media Services arrangements with customers and wholesalers were terminated or modified to reduce or eliminate the source of working capital funding, it would likely have a material adverse affect on the Company’s overall liquidity.
Cash Flows From Financing Activities
On December 17, 2009, AMREP Southwest (the “Borrower”) entered into a Loan Agreement and a related Promissory Note with a bank (said Loan Agreement and Promissory Note, together, the “New ASW Credit Facility”) that replaced a revolving credit facility with the bank under which $24,000,000 was outstanding that matured on that date. The New ASW Credit Facility provides for a non-revolving loan in the original principal amount of $22,500,000 due in a single payment on December 16, 2010, subject to mandatory prepayments from a portion of the cash the Borrower may receive from its real estate sales in excess of certain thresholds. The outstanding principal ($22,500,000 at April 30, 2010) of the New ASW Credit Facility bears fluctuating interest at the annual rate of reserve adjusted 30-day LIBOR (0.28% at April 30, 2010) plus 3.5%, but not less than 5.0%, and the Borrower is required to maintain a cash reserve with the lender, initially $1,100,000 and always not less than $500,000, to fund the interest payments. At April 30, 2010, the interest rate was 5.0% and the cash reserve balance was $724,000. The New ASW Credit Facility is secured by a mortgage on certain real property of the Borrower and requires that the appraised value of the collateral be at least 2.5 times the outstanding principal of the loan.
The New ASW Credit Facility contains a number of covenants and restrictions, including covenants requiring the Borrower to maintain a minimum tangible net worth and a certain level of debt service coverage and a covenant restricting the Borrower from making distributions and other payments to the Company beyond a stated management fee. The Borrower will be initiating discussions with the lender regarding renewal of this arrangement; however, there is no assurance that the lender will offer to renew the credit arrangement or that the proposed terms of a renewal will be acceptable to the Borrower. If the Borrower is unable to renew this credit arrangement or obtain an alternate source of funds to pay the loan, which cannot be assured, among various rights to obtain payment, which the lender will have, is its right to foreclose on certain real property that collateralizes the loan.
On May 13, 2010, Kable Media Services, Inc. and certain of its subsidiaries (“Kable Media”) entered into a Revolving Credit and Security Agreement with a bank (the “New Kable Credit Agreement”), replacing another lender whose facility had matured May 1, 2010.
The New Kable Credit Agreement, which matures May 12, 2013, provides for a revolving credit loan and letter of credit facility of up to $20,000,000, with availability within that limit based upon a percentage of the borrowers’ eligible accounts receivable or recent level of accounts receivable collections. Subject to certain terms of the New Kable Credit Agreement, funds may be borrowed, repaid and re-borrowed at any time. Borrowings under the New Kable Credit Agreement are being used for Kable’s working capital needs and general business purposes, including the payment of expenses and other costs associated with the consolidation of the Company's Subscription Fulfillment Services business in Florida and, subject to Kable Media’s consolidated fixed charge coverage ratio (as defined) being at a stated level, may be used to provide further payments on certain indebtedness due Kable Media’s parent. Also, up to $3,000,000 of the facility may be borrowed specifically to be used for the payment of accounts payable to one customer of the Company’s Newsstand Distribution Services business, with availability within that limit based upon a percentage of the eligible accounts receivable from the distribution of that customer’s periodicals.
The borrowers' obligations under the New Kable Credit Agreement are secured by substantially all of their assets other than real property. The revolving loans under the New Kable Credit Agreement may be fluctuating rate borrowings or Eurodollar fixed rate based borrowings or a combination of the two as the borrowers may select. Fluctuating rate borrowings bear interest at a rate which is, at the borrowers’ option, either (i) the reserve adjusted daily published rate for one month LIBOR loans plus a margin of 3%, or (ii) the highest of two daily published market rates and the PNC base commercial lending rate in effect from time to time, but in any case not less than 3% plus a margin of 2% (that is, not less than 5%). Eurodollar fixed rate based borrowings may be for one, two or three months and bear interest at the reserve adjusted Eurodollar interest rates for borrowings of such durations, plus a margin of 3%, which may be reduced to 2.75% depending on the borrowers’ financial condition.
The New Kable Credit Agreement also contains other customary covenants and restrictions, the most significant of which limit the ability of the borrowers to declare or pay dividends or make other distributions to the Company, limit the annual amount borrowers may incur for capital expenditures, and require the borrowers to maintain a minimum fixed charge coverage ratio.
27
The New Kable Credit Agreement replaced the bank credit facility that Kable Media entered into during July 2009 (the “Prior Credit Agreement”). The Prior Credit Agreement provided for: (i) a revolving credit loan and letter of credit facility of up to $20,000,000; and (ii) a second revolving credit loan facility of up to $5,000,000 that was to be used exclusively for the payment of accounts payable under a distribution agreement with a customer of Kable's Newsstand Distribution Services business. At April 30, 2010, no loans were outstanding under either of these facilities. The Prior Credit Agreement also applied to term borrowings for capital expenditures of approximately $1,354,000 which were outstanding at April 30, 2010, bearing a weighted average interest rate of 5.12% per annum, and which were repaid in May 2010. The borrowers' obligations were collateralized by substantially all of their assets other than (i) real property and (ii) any borrower's interest in the capital securities of any other borrower or any subsidiary of any borrower. The Prior Credit Agreement also contained other customary covenants and restrictions.
Consolidated notes payable outstanding at April 30, 2010 totaled $28,654,000 compared to $37,936,000 at April 30, 2009.
Cash Flows From Operating Activities
Real estate receivables decreased from $3,367,000 at April 30, 2009 to $1,195,000 at April 30, 2010 reflecting the net effect of (i) the reclassification of approximately $1,040,000 to real estate inventory and $1,117,000 to investment assets, in both cases from delinquent mortgage notes receivable, which resulted from the Company’s acceptance of deeds in lieu of foreclosure related to delinquent mortgage notes receivable and (ii) payments received on mortgage notes held by AMREP Southwest offset in part by mortgages notes received by AMREP Southwest in connection with real estate sales that closed during 2010.
Real estate inventory amounted to $80,375,000 at April 30, 2010 compared to $81,561,000 at April 30, 2009. Inventory in the Company’s core real estate market of Rio Rancho increased from $74,121,000 at April 30, 2009 to $74,934,000 at April 30, 2010, primarily reflecting the reclassification of delinquent mortgage notes receivable to inventory discussed above and the net effect of development spending and land sales. The balance of real estate inventory consisted principally of properties in Colorado in both years, where in 2010 the Company recorded an impairment charge of $2,075,000 for one property as a result of a current appraisal.
Intangible and other assets decreased from $26,145,000 at April 30, 2009 to $18,953,000 at April 30, 2010, reflecting amortization of these assets. Property, plant and equipment decreased from $34,656,000 at April 30, 2009 to $31,174,000 at April 30, 2010, primarily due to depreciation charges.
Accounts payable and accrued expenses increased from $79,429,000 at April 30, 2009 to $79,970,000 at April 30, 2010.
The unfunded pension liability of the Company’s frozen defined benefit retirement plan increased from $10,665,000 at April 30, 2009 to $12,075,000 at April 30, 2010, primarily due to an increase in actuarial liabilities resulting from a reduction in the discount rate that was partly offset by an increase in the fair market value of the plan assets during the year as well as by Company contributions to the plan of $940,000. The Company recorded a comprehensive loss of $234,000 in 2010 and $5,324,000 in 2009, reflecting the change in the unfunded pension liability in each year net of the related deferred tax and unrecognized prepaid pension amounts.
28
Cash Flows From Investing Activities
Capital expenditures for property, plant and equipment amounted to approximately $2,884,000 and $5,212,000 in 2010 and 2009 and consisted principally of expenditures for building improvements in Palm Coast, Florida in 2010 and a purchase of an office building in Palm Coast in 2009. The Company believes that it has adequate financing capability to provide for anticipated capital expenditures in 2011, substantially all of which are expected to be in the Subscription Fulfillment Services business segment.
During November 2008, in separate transactions, the Company purchased (i) certain assets of a privately-held company engaged in the product repackaging and fulfillment industry; (ii) certain assets of a provider of temporary staffing services and (iii) a warehouse. The aggregate purchase price of the assets purchased in the three transactions was approximately $8,500,000, which included the assumption of a mortgage on the warehouse, and was financed from working capital and bank borrowings.
Future Payments Under Contractual Obligations
The table below summarizes significant contractual cash obligations as of April 30, 2010 for the items indicated (in thousands):
|
Contractual Obligations
|
Total
|
Less than
1 year
|
1-3
years
|
3-5
years
|
More than
5 years
|
|||||||||||||||
|
Notes payable
|
$ | 28,654 | $ | 24,052 | $ | 265 | $ | 249 | $ | 4,088 | ||||||||||
|
Operating leases and other
|
8,881 | 3,327 | 4,639 | 615 | 300 | |||||||||||||||
|
Total
|
$ | 37,535 | $ | 27,379 | $ | 4,904 | $ | 864 | $ | 4,388 | ||||||||||
Operating leases and other includes $1,244,000 of uncertain tax positions and related accrued interest recorded in accordance with ASC 740-10 and the 2011 expected contributions of $880,000 to the Company’s defined benefit retirement plan. Any additional future defined benefit retirement plan contributions necessary to satisfy the minimum statutory funding requirements are dependent upon actual plan asset returns, interest rates and potential changes to U.S. pension funding legislation. Refer to Notes 8, 11, 12, 16 and 17 to the consolidated financial statements included in this 2010 Form 10-K for additional information on long-term debt, pension contributions, taxes and commitments and contingencies.
Discretionary Stock Repurchase Program
In October 2007, the Company announced that its Board of Directors had authorized the repurchase of up to 500,000 shares of the Company’s common stock, which was in addition to a previously announced 500,000 share repurchase program that was completed in early October 2007. The purchases may be made from time to time either in the open market or through negotiated private transactions with non-affiliates of the Company. In 2008, the Company purchased a total of 658,400 shares under both announced programs, all in open market transactions, for a total purchase price, including commissions, of $21,363,000, or an average of $32.45 per share. All repurchases were funded from cash on hand and borrowings under bank credit facilities. The Company did not make any repurchases of stock during 2010 and 2009.
NEW AND EMERGING ACCOUNTING STANDARDS
In December 2008, the FASB issued Staff Position No. FAS 132(R)-1, “Employers’ Disclosures about Postretirement Benefit Plan Assets (FSP FAS 132(R)-1)”. FSP FAS 132(R)-1 requires more detailed disclosures about employers’ plan assets in a defined benefit pension or other postretirement plan, including employers’ investment strategies, major categories of plan assets, concentrations of risk within plan assets, and inputs and valuation techniques used to measure the fair value of plan assets. FSP FAS 132(R)-1 also requires, for fair value measurements using significant unobservable inputs (Level 3), disclosure of the effect of the measurements on changes in plan assets for the period. The disclosures about plan assets required by FSP FAS 132(R)-1 must be provided for fiscal years ending after December 15, 2009. As this pronouncement is only disclosure-related, its adoption did not have an impact on the Company’s consolidated financial position, results of operations or cash flows.
29
In May 2009, the FASB issued new guidance on subsequent events. The standard provides guidance on management’s assessment of subsequent events and incorporates this guidance into accounting literature. The standard is effective prospectively for interim and annual reporting periods ending after June 15, 2009, which the Company adopted effective beginning the quarter ended July 31, 2009. The implementation of this standard did not have a material impact on the Company’s consolidated financial position or results of operations. Since adoption, the Company has evaluated subsequent events through the date of the issuance of its consolidated financial statements.
In February 2010, the FASB issued additional guidance regarding fair value measurements and disclosures. The standard affects all entities that are required to make disclosures about recurring and nonrecurring fair value measurements. The new guidance requires certain new disclosures and clarifies two existing disclosure requirements. The new disclosures and clarification of existing disclosures are effective for interim and annual reporting periods beginning after December 15, 2009, except for disclosures about purchases, sales, issuances and settlements in the roll forward of activity in Level 3 fair value instruments. Those disclosures are effective for fiscal years beginning after December 15, 2010, and for interim periods within those fiscal years.
SEGMENT INFORMATION
Information by industry segment is presented in Note 20 to the consolidated financial statements. Industry segment information is prepared in a manner consistent with the manner in which financial information is prepared and evaluated by management for making operating decisions. A number of assumptions and estimates are required to be made in the determination of segment data, including the need to make certain allocations of common costs and expenses among segments. On an annual basis, management evaluates the basis upon which costs are allocated, and has periodically made revisions to these methods of allocation. Accordingly, the determination of “income from continuing operations before income taxes” of each segment as summarized in Note 20 to the consolidated financial statements is presented for informational purposes, and is not necessarily the amount that would be reported if the segment were an independent company.
IMPACT OF INFLATION
Operations of the Company can be impacted by inflation. Within the industries in which the Company operates, inflation can cause increases in the cost of materials, services, interest and labor. Unless such increased costs are recovered through increased sales prices or improved operating efficiencies, operating margins will decrease. Within the land development industry, the Company encounters particular risks. A large part of the Company’s real estate sales are to homebuilders who face their own inflationary concerns that rising housing costs, including interest costs, may substantially outpace increases in the income of potential purchasers and make it difficult for them to finance the purchase of a new home or sell their existing home. If this situation were to exist, the demand for the Company’s land by these homebuilder customers could decrease. In general, in recent years interest rates have been at historically low levels and other price increases have been commensurate with the general rate of inflation in the Company’s markets, and as a result the Company has not found the inflation risk to be a significant problem in any of its businesses.
FORWARD-
-
LOOKING
STATEMENTS AND RISK FACTORS
The Private Securities Litigation Reform Act of 1995 (the “Act”) provides a safe harbor for forward-looking statements made by or on behalf of the Company. The Company and its representatives may from time to time make written or oral statements that are “forward-looking”, including statements contained in this report and other filings with the Securities and Exchange Commission, reports to the Company’s shareholders and news releases. All statements that express expectations, estimates, forecasts or projections are forward-looking statements within the meaning of the Act. In addition, other written or oral statements, which constitute forward-looking statements, may be made by or on behalf of the Company. Words such as “expects”, “anticipates”, “intends”, “plans”, “believes”, “seeks”, “estimates”, “projects”, “forecasts”, “may”, “should”, variations of such words and similar expressions are intended to identify such forward-looking statements. These statements are not guarantees of future performance and involve certain risks, uncertainties and contingencies that are difficult to predict. These risks and uncertainties include, but are not limited to, the risks described above under the heading “Risk Factors”. Many of the factors that will determine the Company’s future results are beyond the ability of management to control or predict. Therefore, actual outcomes and results may differ materially from what is expressed or forecasted in or suggested by such forward-looking statements. The forward-looking statements contained in this report include, but are not limited to, statements regarding (i) the consolidation project of the Subscription Fulfillment Services business (including the
30
Company’s projected completion and related severance charges), (ii) the warehouse fire in Oregon, Illinois and the ultimate cost to resolve disputes related thereto and (iii) future financing requirements. The Company undertakes no obligation to revise or update any forward-looking statements, or to make any other forward-looking statements, whether as a result of new information, future events or otherwise.
The primary market risk facing the Company is interest rate risk on its long-term debt and fixed rate receivables. The Company does not hedge interest rate risk using financial instruments. The Company is also subject to foreign currency risk, but this risk is not material. The following table sets forth as of April 30, 2010 the Company’s debt obligations and receivables (excluding trade accounts) by scheduled fiscal year maturity, weighted average interest rate and estimated fair market value (“FMV”) (dollar amounts in thousands):
|
2011
|
2012
|
2013
|
2014
|
2015
|
There-
after
|
Total
|
FMV at
4/30/10
|
||||||||||||||||||
|
Fixed rate receivables
|
$ | 1,175 | $ | 3 | $ | 65 | - | - | - | $ | 1,243 | $ | 1,238 | ||||||||||||
|
Weighted average
interest rate
|
9.9% | 8.5% | 8.5% | - | - | - | 10.2% | ||||||||||||||||||
|
Fixed rate debt
|
$ | 1,552 | $ | 139 | $ | 126 | $ | 128 | $ | 121 | $ | 4,088 | $ | 6,154 | $ | 6,648 | |||||||||
|
Weighted average
interest rate (a)
|
5.3% | 6.7% | 6.6% | 6.6% | 6.4% | 6.4% | 6.1% | ||||||||||||||||||
|
Variable rate debt
|
$ | 22,500 | - | - | - | - | - | $ | 22,500 | $ | 22,500 | ||||||||||||||
|
Weighted average
interest rate (a)
|
5.0% | - | - | - | - | - | 5.0% | ||||||||||||||||||
(a) See Note 8 to the consolidated financial statements for information regarding revisions to variable rate loan agreements and the interest rates charged thereunder that have occurred or are expected to occur subsequent to April 30, 2010.
31
Management’s Annual Report on Internal Control Over Financial Reporting
Management is responsible for establishing and maintaining adequate internal control over financial reporting as defined in Rules 13a-15(f) and 15d-15(f) under the Securities Exchange Act of 1934, as amended. Internal control over financial reporting is designed to provide reasonable assurance regarding the reliability of financial reporting and the preparation of financial statements for external purposes in accordance with generally accepted accounting principles in the United States of America.
Because of the inherent limitations of internal control over financial reporting, including the possibility of human error and the circumvention or overriding of controls, material misstatements may not be prevented or detected on a timely basis. Accordingly, even internal controls determined to be effective can provide only reasonable assurance with respect to financial statement preparation and presentation. Furthermore, projections of any evaluation of the effectiveness to future periods are subject to the risk that such controls may become inadequate due to changes in conditions, or that the degree of compliance with the policies or procedures may deteriorate.
Management has assessed the effectiveness of internal control over financial reporting as of April 30, 2010 based upon the criteria set forth in a report entitled “Internal Control - Integrated Framework” issued by the Committee of Sponsoring Organizations of the Treadway Commission. Based on its assessment, management has concluded that, as of April 30, 2010, internal control over financial reporting was effective.
This annual report does not include an attestation report of the Company’s independent registered public accounting firm regarding internal control over financial reporting. Management’s report was not subject to attestation by the Company’s independent registered public accounting firm pursuant to temporary rules of the Securities and Exchange Commission that permit the Company to provide only management’s report in this annual report.
32
Report of Independent Registered Public Accounting Firm
To the Board of Directors
AMREP Corporation
Princeton, New Jersey
We have audited the consolidated balance sheets of AMREP Corporation and Subsidiaries as of April 30, 2010 and 2009, and the related consolidated statements of operations, shareholders’ equity and cash flows for each of the three years in the period ended April 30, 2010. Our audits also included the financial statement schedule of AMREP Corporation listed in item 15(a). These financial statements and financial statement schedule are the responsibility of the Company's management. Our responsibility is to express an opinion on these financial statements based on our audits.
We conducted our audits in accordance with the standards of the Public Company Accounting Oversight Board (United States). Those standards require that we plan and perform the audit to obtain reasonable assurance about whether the financial statements are free of material misstatement. An audit includes examining, on a test basis, evidence supporting the amounts and disclosures in the financial statements. An audit also includes assessing the accounting principles used and significant estimates made by management, as well as evaluating the overall financial statement presentation. We believe that our audits provide a reasonable basis for our opinion.
In our opinion, the consolidated financial statements referred to above present fairly, in all material respects, the financial position of AMREP Corporation and Subsidiaries as of April 30, 2010 and 2009, and the results of their operations and their cash flows for each of the three years in the period ended April 30, 2010, in conformity with U.S. generally accepted accounting principles. Also, in our opinion, the related financial statement schedule, when considered in relation to the basic consolidated financial statements taken as a whole, presents fairly in all material respects the information set forth therein.
We were not engaged to examine management's assessment of the effectiveness of AMREP Corporation and Subsidiaries’ internal control over financial reporting as of April 30, 2010, included in the accompanying Management’s Annual Report on Internal Control Over Financial Reporting and, accordingly, we do not express an opinion thereon.
/s/ McGladrey & Pullen, LLP
Cedar Rapids, Iowa
July 21, 2010
33
AMREP CORPORATION AND SUBSIDIARIES
APRIL 30, 2010 AND 2009
(Dollar amounts in thousands, except per share amount)
|
ASSETS
|
2010
|
2009
|
||||||
|
CASH AND CASH EQUIVALENTS
|
$ | 25,531 | $ | 29,018 | ||||
|
RECEIVABLES, net:
|
||||||||
|
Real estate operations and other
|
1,195 | 3,367 | ||||||
|
Media services operations
|
33,175 | 34,614 | ||||||
| 34,370 | 37,981 | |||||||
|
TAXES RECEIVABLE
|
2,126 | 3,009 | ||||||
|
REAL ESTATE INVENTORY
|
80,375 | 81,561 | ||||||
|
INVESTMENT ASSETS, net
|
12,474 | 11,389 | ||||||
|
PROPERTY, PLANT AND EQUIPMENT, net
|
31,174 | 34,656 | ||||||
|
INTANGIBLE AND OTHER ASSETS, net
|
18,953 | 26,145 | ||||||
|
DEFERRED INCOME TAXES
|
2,613 | - | ||||||
|
GOODWILL
|
3,893 | 3,893 | ||||||
|
TOTAL ASSETS
|
$ | 211,509 | $ | 227,652 | ||||
|
LIABILITIES AND SHAREHOLDERS’ EQUITY
|
||||||||
|
LIABILITIES:
|
||||||||
|
ACCOUNTS PAYABLE AND ACCRUED EXPENSES
|
$ | 79,969 | $ | 79,429 | ||||
|
NOTES PAYABLE:
Amounts due within one year
|
24,052 | 25,770 | ||||||
|
Amounts subsequently due
|
4,602 | 12,166 | ||||||
| 28,654 | 37,936 | |||||||
|
OTHER LONG TERM LIABILITIES
|
4,244 | 2,270 | ||||||
|
DEFERRED INCOME TAXES
|
- | 1,071 | ||||||
|
ACCRUED PENSION COST
|
12,075 | 10,665 | ||||||
|
TOTAL LIABILITIES
|
124,942 | 131,371 | ||||||
|
SHAREHOLDERS’ EQUITY:
Common stock, $.10 par value;
shares authorized - 20,000,000; shares issued - 7,420,704 at
April 30, 2010 and 2009
|
742 | 742 | ||||||
|
Capital contributed in excess of par value
|
46,100 | 46,100 | ||||||
|
Retained earnings
|
75,462 | 84,942 | ||||||
|
Accumulated other comprehensive loss, net
|
(9,080 | ) | (8,846 | ) | ||||
|
Treasury stock, 1,424,492 shares at April 30, 2010 and 2009, at cost
|
(26,657 | ) | (26,657 | ) | ||||
|
TOTAL SHAREHOLDERS’ EQUITY
|
86,567 | 96,281 | ||||||
|
TOTAL LIABILITIES AND SHAREHOLDERS’ EQUITY
|
$ | 211,509 | $ | 227,652 | ||||
The accompanying notes to consolidated financial statements are an
integral part of these consolidated financial statements.
34
AMREP CORPORATION AND SUBSIDIARIES
(Amounts in thousands, except per share amounts)
|
Year Ended April 30,
|
||||||||||||
|
2010
|
2009
|
2008
|
||||||||||
|
REVENUES:
|
||||||||||||
|
Real estate land sales
|
$ | 5,185 | $ | 8,914 | $ | 27,902 | ||||||
|
Media services operations
|
115,016 | 136,206 | 138,696 | |||||||||
|
Interest and other
|
297 | 781 | 5,463 | |||||||||
| 120,498 | 145,901 | 172,061 | ||||||||||
|
COSTS AND EXPENSES:
|
||||||||||||
|
Real estate land sales
|
3,137 | 2,156 | 9,760 | |||||||||
|
Operating expenses:
|
||||||||||||
|
Media services operations
|
104,662 | 127,324 | 120,021 | |||||||||
|
Real estate commissions and selling
|
368 | 342 | 731 | |||||||||
|
Restructuring and fire recovery costs
|
5,547 | 1,050 | 1,513 | |||||||||
|
Other
|
2,580 | 1,489 | 840 | |||||||||
|
General and administrative:
|
||||||||||||
|
Media services operations
|
11,613 | 12,694 | 12,053 | |||||||||
|
Real estate operations and corporate
|
4,272 | 4,239 | 4,550 | |||||||||
|
Impairment of assets
|
2,075 | 50,246 | - | |||||||||
|
Interest expense, net of capitalized amounts
|
1,615 | 715 | 1,012 | |||||||||
| 135,869 | 200,255 | 150,480 | ||||||||||
|
INCOME (LOSS) FROM CONTINUING OPERATIONS BEFORE INCOME TAXES
|
(15,371 | ) | (54,354 | ) | 21,581 | |||||||
|
PROVISION (BENEFIT) FOR INCOME TAXES FROM CONTINUING OPERATIONS
|
(5,891 | ) | (10,888 | ) | 7,819 | |||||||
|
INCOME (LOSS) FROM CONTINUING OPERATIONS
|
(9,480 | ) | (43,466 | ) | 13,762 | |||||||
|
LOSS FROM OPERATIONS OF DISCONTINUED BUSINESS (NET OF INCOME TAXES)
|
- | - | (57 | ) | ||||||||
|
NET INCOME (LOSS)
|
$ | (9,480 | ) | $ | (43,466 | ) | $ | 13,705 | ||||
|
EARNINGS (LOSS) PER SHARE FROM CONTINUING OPERATIONS
|
$ | (1.58 | ) | $ | (7.25 | ) | $ | 2.20 | ||||
|
LOSS PER SHARE FROM
DISCONTINUED OPERATIONS
|
- | - | (0.01 | ) | ||||||||
|
EARNINGS (LOSS) PER SHARE - BASIC AND DILUTED
|
$ | (1.58 | ) | $ | (7.25 | ) | $ | 2.19 | ||||
|
WEIGHTED AVERAGE NUMBER OF COMMON SHARES OUTSTANDING
|
5,996 | 5,996 | 6,248 | |||||||||
The accompanying notes to consolidated financial statements are an
integral part of these consolidated financial statements.
35
AMREP CORPORATION AND SUBSIDIARIES
CONSOLIDATED STATEMENTS OF SHAREHOLDERS’ EQUITY
(Amounts in thousands)
|
Common Stock
|
Capital Contributed in Excess of
|
Retained
|
Accumulated
Other Comprehensive
|
Treasury
Stock,
at
|
||||||||||||||||||||||||
|
Shares
|
Amount
|
Par Value
|
Earnings
|
Loss
|
Cost
|
Total
|
||||||||||||||||||||||
|
BALANCE, April 30, 2008
|
7,420 | $ | 742 | $ | 46,085 | $ | 121,333 | $ | (2,862 | ) | $ | (5,294 | ) | $ | 160,004 | |||||||||||||
|
Net income
|
- | - | - | 13,705 | - | - | 13,705 | |||||||||||||||||||||
|
Other comprehensive loss
|
- | - | - | - | (660 | ) | - | (660 | ) | |||||||||||||||||||
|
Total comprehensive income
|
13,045 | |||||||||||||||||||||||||||
|
Cash dividend, $1.00 per share
|
- | - | - | (6,630 | ) | - | - | (6,630 | ) | |||||||||||||||||||
|
Acquisition of treasury
|
||||||||||||||||||||||||||||
|
stock, 658,400 shares
|
- | - | - | - | - | (21,363 | ) | (21,363 | ) | |||||||||||||||||||
|
BALANCE, April 30, 2009
|
7,420 | 742 | 46,085 | 128,408 | (3,522 | ) | (26,657 | ) | 145,056 | |||||||||||||||||||
|
Net loss
|
- | - | - | (43,466 | ) | - | - | (43,466 | ) | |||||||||||||||||||
|
Other comprehensive loss
|
- | - | - | - | (5,324 | ) | - | (5,324 | ) | |||||||||||||||||||
|
Total comprehensive loss
|
(48,790 | ) | ||||||||||||||||||||||||||
|
Exercise of stock options
|
1 | - | 15 | - | - | - | 15 | |||||||||||||||||||||
|
BALANCE, April 30, 2010
|
7,421 | 742 | 46,100 | 84,942 | (8,846 | ) | (26,657 | ) | 96,281 | |||||||||||||||||||
|
Net loss
|
- | - | - | (9,480 | ) | - | - | (9,480 | ) | |||||||||||||||||||
|
Other comprehensive loss
|
- | - | - | - | (234 | ) | - | (234 | ) | |||||||||||||||||||
|
Total comprehensive loss
|
(9,714 | ) | ||||||||||||||||||||||||||
| 7,421 | $ | 742 | $ | 46,100 | $ | 75,462 | $ | (9,080 | ) | $ | (26,657 | ) | $ | 86,567 | ||||||||||||||
The accompanying notes to consolidated financial statements are an
integral part of these consolidated financial statements.
36
AMREP CORPORATION AND SUBSIDIARIES
(Amounts in thousands)
| Year Ended April 30, | ||||||||||||||
| 2010 | 2009 | 2008 | ||||||||||||
|
CASH FLOWS FROM OPERATING ACTIVITIES:
|
||||||||||||||
|
Net income (loss)
|
$ | (9,480 | ) | $ | (43,466 | ) | $ | 13,705 | ||||||
|
Adjustments to reconcile net income
|
||||||||||||||
|
to net cash provided by (used in) operating activities:
|
||||||||||||||
|
Impairment of assets
|
2,075 | 50,246 | - | |||||||||||
|
Depreciation and amortization
|
11,554 | 10,159 | 10,524 | |||||||||||
|
Non-cash credits and charges:
|
||||||||||||||
|
Loss (gain) on disposition of assets
|
74 | 114 | (1,679 | ) | ||||||||||
|
Provision for (recoveries of) doubtful accounts
|
(721 | ) | 6,775 | (676 | ) | |||||||||
|
Pension accrual
|
1,032 | 34 | (967 | ) | ||||||||||
|
Changes in assets and liabilities, excluding the effect of acquisitions:
|
||||||||||||||
|
Receivables
|
2,175 | 7,647 | 10,901 | |||||||||||
|
Real estate inventory
|
166 | (4,313 | ) | (19,696 | ) | |||||||||
|
Taxes receivable
|
883 | (3,009 | ) | - | ||||||||||
|
Other assets
|
1,947 | (189 | ) | 272 | ||||||||||
|
Accounts payable and accrued expenses, and deferred revenue
|
540 | (16,997 | ) | 8,535 | ||||||||||
|
Taxes payable
|
- | (980 | ) | 925 | ||||||||||
|
Deferred income taxes and long-term liabilities
|
(1,566 | ) | (8,548 | ) | 4,407 | |||||||||
|
Net cash provided by (used in) operating activities
|
8,679 | (2,527 | ) | 26,251 | ||||||||||
|
CASH FLOWS FROM INVESTING ACTIVITIES:
|
||||||||||||||
|
Capital expenditures - property, plant, and equipment
|
(2,884 | ) | (5,212 | ) | (5,169 | ) | ||||||||
|
Capital expenditures - investment assets
|
- | - | (1,208 | ) | ||||||||||
|
Proceeds from disposition of assets
|
- | - | 4,749 | |||||||||||
|
Acquisition, net of cash acquired
|
- | (3,075 | ) | 195 | ||||||||||
|
Net cash used in investing activities
|
(2,884 | ) | (8,287 | ) | (1,433 | ) | ||||||||
|
CASH FLOWS FROM FINANCING ACTIVITIES:
|
||||||||||||||
|
Proceeds from debt financing
|
26,982 | 54,136 | 86,860 | |||||||||||
|
Principal debt payments
|
(36,264 | ) | (46,927 | ) | (93,179 | ) | ||||||||
|
Exercise of stock options
|
- | 15 | - | |||||||||||
|
Acquisition of treasury stock
|
- | - | (21,363 | ) | ||||||||||
|
Cash dividends
|
- | - | (6,630 | ) | ||||||||||
|
Net cash provided by (used in) financing activities
|
(9,282 | ) | 7,224 | (34,312 | ) | |||||||||
|
DECREASE IN CASH AND CASH EQUIVALENTS
|
(3,487 | ) | (3,590 | ) | (9,494 | ) | ||||||||
|
Cash and cash equivalents, beginning of year
|
29,018 | 32,608 | 42,102 | |||||||||||
|
Cash and cash equivalents, end of year
|
$ | 25,531 | $ | 29,018 | $ | 32,608 | ||||||||
|
SUPPLEMENTAL CASH FLOW INFORMATION:
|
||||||||||||||
|
Interest paid – net of amounts capitalized
|
$ | 1,647 | $ | 694 | $ | 1,085 | ||||||||
|
Income taxes paid (refunded), net
|
$ | (2,207 | ) | $ | 1,648 | $ | 2,453 | |||||||
|
|
||||||||||||||
|
Non-cash transactions:
|
||||||||||||||
|
Repossession of real estate inventory
|
$ | 1,040 | $ | 6,979 | $ | 3,892 | ||||||||
|
|
||||||||||||||
|
Repossession of real estate investment assets
|
$ | 1,117 | $ | 1,125 | $ | - | ||||||||
The accompanying notes to consolidated financial statements are an
integral part of these consolidated financial statements.
37
AMREP CORPORATION AND SUBSIDIARIES
NOTES TO CONSOLIDATED FINANCIAL STATEMENTS
|
(1)
|
SUMMARY OF SIGNIFICANT ACCOUNTING AND FINANCIAL REPORTING POLICIES:
|
Organization and principles of consolidation
The consolidated financial statements include the accounts of AMREP Corporation, an Oklahoma corporation, and its subsidiaries (individually and collectively, as the context requires, the “Company”). The Company, through its subsidiaries, is primarily engaged in four business segments. AMREP Southwest Inc. (“AMREP Southwest”) operates in the real estate industry, principally in New Mexico, and Kable Media Services, Inc. (“Kable”) operates in the subscription fulfillment services, magazine distribution services and product services and other businesses (collectively, “media services operations”). All significant intercompany accounts and transactions have been eliminated in consolidation.
The consolidated balance sheets are presented in an unclassified format since the Company has substantial operations in the real estate industry and its operating cycle is greater than one year. Certain 2009 and 2008 balances in these financial statements have been reclassified to conform to the current year presentation.
Fiscal year
The Company’s fiscal year ends on April 30. All references to 2010, 2009 and 2008 mean the fiscal years ended April 30, 2010, 2009 and 2008, unless the context otherwise indicates.
Revenue recognition
Real Estate
- Land sales are recognized when all elements of ASC 360-20 are met, including when the parties are bound by the terms of the contract, all consideration (including adequate cash) has been exchanged, title and other attributes of ownership have been conveyed to the buyer by means of a closing and the Company is not obligated to perform further significant development of the specific property sold. Profit is recorded either in its entirety or on the installment method depending upon, among other things, the ability to estimate the collectibility of the unpaid sales price. In the event the buyer defaults on an obligation with respect to real estate inventory, the property is repossessed and recorded at fair value less estimated costs to sell.
Cost of land sales includes all direct acquisition costs and other costs specifically identified with the property, including pre-acquisition costs and capitalized real estate taxes and interest, and an allocation of certain common development costs associated with the entire project. Common development costs include the installation of utilities and roads, and may be based upon estimates of cost to complete. The allocation of costs is based on the relative fair value of the property before development. Estimates and cost allocations are reviewed on a regular basis until a project is substantially completed, and are revised and reallocated as necessary on the basis of current estimates.
When the Company enters into certain sales that require the Company to complete specified development work subsequent to closing, sales are recorded under the percentage-of-completion method. Revenues and cost of sales are recorded as development work is performed based on the percentage that incurred costs to date bear to the Company’s estimates of total costs and contract value. Cost estimates include direct and indirect costs such as labor, materials and overhead. If a contract extends over an extended period, revisions in cost estimates during the progress of work would have the effect of adjusting earnings applicable to performance in prior periods in the current period. When the current contract estimate indicates a loss, provision is made for the total anticipated loss in the current period. Consideration received in excess of amounts recognized as land sale revenues is accounted for as deferred revenue.
Media Services
- Revenues from media services operations include revenues from magazine subscription fulfillment, the distribution of periodicals and other products and activities. Revenues from Subscription Fulfillment Service activities represent fees from the maintenance of computer files for customers and other fulfillment activities including customer telephone support, product services, and graphic arts and lettershop services, all of which are billed and earned monthly as the services are provided. In accordance with ASC 605-45, certain reimbursed postage costs are accounted for on a net basis. Newsstand Distribution Services revenues principally represent commissions earned from the distribution of publications for client publishers and are recorded by the Company at the time the publications go on sale at the retail level, in accordance with ASC 605-15. Because the publications are sold throughout the distribution chain on a fully-returnable basis in accordance with prevailing industry practice, the
38
Company provides for estimated returns from wholesalers at the time the publications go on sale by charges to income that are based on historical experience and the most recent sales data for publications on an issue-by-issue basis, and then simultaneously provides for estimated credits from publishers for the related returns. Accordingly, revenues represent the difference between the Company’s estimates of its net sales to wholesalers and its net purchases from publisher clients. Estimates are continually reevaluated throughout the sales process, and final settlement is typically made 90 days after a magazine’s “off-sale” date.
Cash and cash equivalents
Cash equivalents consist of highly liquid investments that have an original maturity of ninety days or less and are readily convertible into cash.
Receivables
Receivables are carried at original invoice or closing statement amount less estimates made for doubtful receivables and, in the case of Newsstand Distribution Services receivables, return allowances. Management determines the allowances for doubtful accounts by reviewing and identifying troubled accounts and by using historical experience applied to an aging of accounts. A receivable is considered to be past due if any portion of the receivable balance is outstanding for more than 90 days. Receivables are written off when deemed uncollectible. Recoveries of receivables previously written off are recorded when received.
Receivables for the Newsstand Distribution Services business are based on estimates of allowances for magazine returns to the Company from wholesalers and the offsetting return of magazines by the Company to publishers for credit and are determined on an issue-by-issue basis utilizing historical experience and current sales information.
Real estate inventory
Land and improvements on land held for future development or sale are stated at the lower of accumulated cost (except in certain instances where inventory is repossessed as discussed above under “Revenue recognition”), which includes the development cost, certain amenities, capitalized interest and capitalized real estate taxes, or fair market value less estimated costs to sell.
Investment assets
Investment assets primarily consist of investment land, which represents vacant, undeveloped land not held for development or sale in the normal course of business, and is stated at the lower of cost or fair market value less the estimated costs to sell.
Property, plant and equipment
Items capitalized as part of property, plant and equipment are recorded at cost. Expenditures for maintenance and repair and minor renewals are charged to expense as incurred, while those expenditures that improve or extend the useful life of existing assets are capitalized. Upon the sale or other disposition of assets, their cost and the related accumulated depreciation or amortization are removed from the accounts and the resulting gain or loss, if any, is reflected in operations.
Depreciation and amortization of property, plant and equipment are provided principally by the straight-line method at various rates calculated to amortize the book values of the respective assets over their estimated useful lives, which generally are 10 years or less for furniture and fixtures (including equipment) and 25 to 40 years for buildings and improvements.
Goodwill
Goodwill is the excess of amounts paid for business acquisitions over the net fair value of the assets acquired and liabilities assumed. Goodwill arose in connection with the acquisitions of Kable News Company, Inc. in 1969 and Palm Coast Data Holdco, Inc. (“Palm Coast”) in 2007.
Goodwill is not amortized, but is reviewed at the reporting unit level for impairment annually or more frequently if indications of impairment exist. An impairment charge is generally recognized when the estimated fair value of a reporting unit is less than its carrying amount, including goodwill. Based on a review completed as of April 30, 2009, the Company recorded a non-cash impairment charge of $50,246,000 (see Note 9). There was no impairment charge related to goodwill for 2010 or 2008.
39
Long-lived assets
Long-lived assets, including real estate inventory, investment assets and property, plant and equipment, are evaluated and reviewed for impairment when events or changes in circumstances indicate the carrying value of an asset may not be recoverable. Provisions for impairment are recorded when undiscounted cash flows estimated to be generated by those assets are less than the carrying amount of the assets. The amount of impairment would be equal to the difference between the carrying value of an asset and its discounted cash flows.
During 2010, the Company recorded an impairment charge of $2,075,000 related to certain real estate inventory held in Colorado (see Note 9). There was no impairment charge related to real estate inventory in 2009 or 2008.
Income taxes
Deferred tax assets and liabilities are determined based on differences between financial reporting and tax bases of assets and liabilities, and are measured by using currently enacted tax rates expected to apply to taxable income in the years in which those differences are expected to reverse. The Company provides a valuation allowance against net deferred tax assets unless, based upon the available evidence, it is more likely than not that the deferred tax assets will be realized.
Earnings (loss) per share
Basic earnings (loss) per share is based on the weighted average number of common shares outstanding during each year. Diluted earnings per share is computed assuming the issuance of common shares for all dilutive stock options outstanding (using the treasury stock method) during the reporting period. Stock options outstanding are anti-dilutive and therefore excluded from the computation of earnings per share.
Pension plan
The Company recognizes the over-funded or under-funded status of a defined benefit postretirement plan as an asset or liability as of the date of its year-end statement of financial position and changes in that funded status in the year in which the changes occur through comprehensive income.
Comprehensive income (loss)
Comprehensive income (loss) is defined as the change in equity during a period from transactions and other events from non-owner sources. Comprehensive income (loss) is the total of net income and other comprehensive income (loss) that, for the Company, is comprised entirely of the minimum pension liability net of the related deferred income tax effect.
Management’s estimates and assumptions
The preparation of consolidated financial statements in conformity with accounting principles generally accepted in the United States requires management to make estimates and assumptions that affect the amounts reported in the financial statements and accompanying notes. The significant estimates that affect the financial statements include, but are not limited to, real estate inventory valuation and related revenue recognition, allowances for magazine returns and doubtful accounts, the recoverability of long-term assets and amortization periods, goodwill impairment, pension plan assumptions for determination of pension expense and benefit obligations, risk assessment of uncertain tax positions, and legal contingencies. The Company bases its significant estimates on historical experience and on various other assumptions that management believes are reasonable under the circumstances. Actual results could differ from these estimates.
40
New and emerging accounting standards
In December 2008, the Financial Accounting Standards Board (“FASB”) issued Staff Position No. FAS 132(R)-1, “Employers’ Disclosures about Postretirement Benefit Plan Assets (FSP FAS 132(R)-1)”. FSP FAS 132(R)-1 requires more detailed disclosures about employers’ plan assets in a defined benefit pension or other postretirement plan, including employers’ investment strategies, major categories of plan assets, concentrations of risk within plan assets, and inputs and valuation techniques used to measure the fair value of plan assets. FSP FAS 132(R)-1 also requires, for fair value measurements using significant unobservable inputs (Level 3), disclosure of the effect of the measurements on changes in plan assets for the period. The disclosures about plan assets required by FSP FAS 132(R)-1 must be provided for fiscal years ending after December 15, 2009. As this pronouncement is only disclosure-related, its adoption did not have an impact on the Company’s consolidated financial position, results of operations or cash flows.
In May 2009, the FASB issued new guidance on subsequent events. The standard provides guidance on management’s assessment of subsequent events and incorporates this guidance into accounting literature. The standard is effective prospectively for interim and annual reporting periods ending after June 15, 2009, which the Company adopted effective beginning the quarter ended July 31, 2009. The implementation of this standard did not have a material impact on the Company’s consolidated financial position or results of operations. Since adoption, the Company has evaluated subsequent events through the date of the issuance of its consolidated financial statements (see Note 19).
In February 2010, the FASB issued additional guidance regarding fair value measurements and disclosures. The standard affects all entities that are required to make disclosures about recurring and nonrecurring fair value measurements. The new guidance requires certain new disclosures and clarifies two existing disclosure requirements. The new disclosures and clarification of existing disclosures are effective for interim and annual reporting periods beginning after December 15, 2009, except for disclosures about purchases, sales, issuance, and settlements in the roll forward of activity in Level 3 fair value instruments. Those disclosures are effective for fiscal years beginning after December 15, 2010, and for interim periods within those fiscal years.
(2)
RECEIVABLES:
|
Receivables consist of:
|
April 30,
|
|||||||
|
2010
|
2009
|
|||||||
|
(Thousands)
|
||||||||
|
Real estate operations:
|
||||||||
|
Mortgage notes and other receivables
|
$ | 1,266 | $ | 3,457 | ||||
|
Less allowance for doubtful accounts
|
(71 | ) | (90 | ) | ||||
| $ | 1,195 | $ | 3,367 | |||||
|
Media services operations (maturing within one year):
|
||||||||
|
Subscription Fulfillment Services
|
$ | 17,727 | $ | 24,711 | ||||
|
Newsstand Distribution Services, net of estimated returns
|
14,112 | 8,970 | ||||||
|
Product Services and Other
|
2,165 | 1,863 | ||||||
| 34,004 | 35,544 | |||||||
|
Less allowance for doubtful accounts
|
(829 | ) | (930 | ) | ||||
| $ | 33,175 | $ | 34,614 | |||||
The Company extends credit to various companies in its real estate and media services businesses that may be affected by changes in economic or other external conditions. Financial instruments that may potentially subject the Company to a significant concentration of credit risk primarily consist of trade accounts receivable from wholesalers in the magazine distribution industry. Approximately 45% of media services net accounts receivable were due from three wholesalers at April 30, 2010 and 2009. As a result of the concentration of accounts receivable in three wholesalers, the Company could be adversely affected by adverse changes in their financial condition or other factors negatively affecting these companies. As industry practices allow, the Company’s policy is to manage its exposure to credit risk through credit approvals and limits and, on occasion (particularly in connection with real estate sales), the taking of collateral. The Company also provides an allowance for doubtful accounts for potential losses based upon factors surrounding the credit risk of specific customers, historical trends and other financial and non-financial information.
41
Real estate mortgage notes receivable at April 30, 2010 bear interest at rates ranging from 8.50% to 10.25% and result primarily from land sales. Fiscal year maturities of principal on real estate receivables at April 30, 2010 were as follows: 2011 - $1,175,000; 2012 - $3,000; 2013 - $65,000, and thereafter - none. The 2011 principal amount of $1,175,000 includes $901,000 that was due in 2010; however, no allowance is deemed necessary as the collateral value is greater than the receivable amount.
Because the publications distributed by Kable’s Newsstand Distribution Services business are sold throughout the distribution chain on a fully-returnable basis in accordance with prevailing industry practice, the Company provides for estimated returns from wholesalers at the time the publications go on sale by charges to income that are based on historical experience and most recent sales data for publications on an issue-by-issue basis, and then simultaneously provides for estimated credits from publishers for the related returns. The financial impact to the Company of a change in the sales estimate for magazine returns to it from its wholesalers is substantially offset by the simultaneous change in the Company’s estimate of its cost of purchases since it passes on the returns to publishers for credit. Newsstand Distribution Services accounts receivable are net of estimated magazine returns of $48,008,000 in 2010 and $55,212,000 in 2009. In addition, pursuant to an arrangement with one publisher customer of the Newsstand Distribution Services business, the publisher bears the ultimate credit risk of non-collection of amounts due from the customers to which the Company distributes the publisher’s magazines under this arrangement. Accounts receivable subject to this arrangement were netted ($15,840,000 and $28,565,000 were netted at April 30, 2010 and 2009) against the related accounts payable due the publisher on the accompanying balance sheets. Media services operations receivables collateralize line-of-credit arrangements utilized for Kable’s operations (see Note 8).
During the fourth quarter of 2009, Anderson News, L.L.C. (“Anderson”), a major wholesaler customer of Kable’s Newsstand Distribution Services business, which accounted for approximately 30% of the gross billings of the newsstand distribution industry at that time, ceased operations. This business closure caused a temporary disruption in the newsstand distribution industry, and Newsstand Distribution Services revenues were adversely affected for a period of time. Subsequently, magazines that previously had been distributed by Anderson were allocated to other major wholesalers, and as a result, the three remaining major wholesalers now distribute a substantial percentage of the industry product.
At the time of the closure, Newsstand Distribution Services had estimated net accounts receivable from Anderson of approximately $7,500,000, which amount was subject to adjustment by subsequent magazine return activity. No payments of accounts receivable have been received by Newsstand Distribution Services from Anderson subsequent to the closure. Based on its estimate of the allowance for magazine returns, Newsstand Distribution Services recorded a charge to operations of $6,500,000 in the fourth quarter of 2009 related to Anderson. During 2010, as a result of a final accounting of magazine return activity, Newsstand Distribution Services operating results were favorably impacted by an adjustment to bad debt expense for $557,000 related to the prior Anderson bad debt write-off.
Media Services operations provide services to publishing companies owned or controlled by a major shareholder and member of the Board of Directors. Commissions and other revenues earned on these transactions represented approximately 2% of consolidated revenues in 2010 and 2009.
(3)
REAL ESTATE INVENTORY:
Real estate inventory consists of land and improvements held for sale or development. Accumulated capitalized interest costs included in real estate inventory at April 30, 2010 and 2009 were $3,965,000 and $3,918,000. Interest costs capitalized during 2010, 2009 and 2008 were $75,000, $697,000 and $1,300,000. Accumulated capitalized real estate taxes included in the real estate inventory at April 30, 2010 and 2009 were $1,814,000 and $1,826,000. Real estate taxes capitalized during 2010, 2009 and 2008 were $21,000, $43,000 and 41,000. Previously capitalized interest costs and real estate taxes charged to real estate cost of sales were $10,000, $35,000 and $108,000 in 2010, 2009 and 2008.
During 2010 and 2009, the Company accepted deeds in lieu of foreclosure related to delinquent mortgage notes receivable on previously sold real estate inventory totaling $1,040,000 and $6,979,000, which included accrued interest, and recorded the fair value of assets received less estimated costs to sell as real estate inventory. The fair value of the asset received was based on property appraisals.
A substantial majority of the Company’s real estate assets are located in or adjacent to Rio Rancho, New Mexico. As a result of this geographic concentration, the Company could be affected by changes in economic conditions in that region.
42
(4)
INVESTMENT ASSETS:
|
Investment assets consist of:
|
April 30,
|
|||||||
|
2010
|
2009
|
|||||||
|
(Thousands)
|
||||||||
|
Land held for long-term investment
|
$ | 11,981 | $ | 10,879 | ||||
|
|
||||||||
| Other | 794 | 794 | ||||||
|
Less accumulated depreciation
|
(301 | ) | (284 | ) | ||||
| 493 | 510 | |||||||
| $ | 12,474 | $ | 11,389 | |||||
Land held for long-term investment represents property located in areas that are not planned to be developed in the near term and thus has not been offered for sale. During 2010 and 2009, the Company accepted deeds in lieu of foreclosure related to delinquent mortgage notes receivable on previously sold investment assets totaling $1,117,000 and $1,125,000, which included accrued interest.
Depreciation of investment assets charged to operations amounted to $17,000, $19,000 and $117,000 in 2010, 2009 and 2008.
(5)
PROPERTY, PLANT AND EQUIPMENT:
|
Property, plant and equipment consist of:
|
April 30,
|
|||||||
|
2010
|
2009
|
|||||||
|
(Thousands)
|
||||||||
|
Land, buildings and improvements
|
$ | 29,144 | $ | 27,397 | ||||
|
Furniture and equipment
|
40,567 | 41,950 | ||||||
| 69,711 | 69,347 | |||||||
|
Less accumulated depreciation
|
(38,537 | ) | (34,691 | ) | ||||
| $ | 31,174 | $ | 34,656 | |||||
Depreciation of property, plant and equipment charged to operations amounted to $6,292,000, $6,182,000 and $6,578,000 in 2010, 2009 and 2008.
(6)
INTANGIBLE AND OTHER ASSETS:
Intangible and other assets consist of:
|
April 30, 2010
|
April 30, 2009
|
||||||||||
|
(Thousands)
|
|||||||||||
|
Cost
|
Accumulated Amortization
|
Cost
|
Accumulated Amortization
|
||||||||
|
Software development costs
|
$ |
1,666
|
$ |
1,356
|
$ |
10,056
|
$ |
6,156
|
|||
|
Deferred order entry costs
|
2,772
|
-
|
4,835
|
-
|
|||||||
|
Prepaid expenses
|
3,661
|
-
|
3,681
|
-
|
|||||||
|
Customer contracts and relationships
|
15,000
|
4,112
|
15,000
|
2,863
|
|||||||
|
Other
|
2,042
|
720
|
2,775
|
1,183
|
|||||||
| $ |
25,141
|
$ |
6,188
|
$ |
36,347
|
$ |
10,202
|
||||
Software development costs include internal and external costs of the development of new or enhanced software programs and are generally amortized over five years. Deferred order entry costs represent costs incurred in connection with the data entry of customer subscription information to database files and are charged directly to operations over a twelve month period. Customer contracts and relationships are amortized over twelve years.
43
Amortization related to Intangible and other assets was $5,245,000, $3,958,000 and $3,829,000 in 2010, 2009 and 2008. The increase in amortization charges for 2010 was directly related to the project to consolidate the Company’s fulfillment services business operations (see Note 15), which accelerated the amortization of certain software development costs, which resulted in many of thee costs being fully amortized in 2010. Amortization of intangible and other assets for each of the next five fiscal years is estimated to be as follows: 2011 - $1,800,000; 2012 - $1,700,000; 2013 - $1,500,000; 2014 - $1,400,000; and 2015 - $1,400,000.
(7)
ACCOUNTS PAYABLE AND ACCRUED EXPENSES:
| Accounts payable and accrued expenses consist of: | April 30, | ||||||||
|
2010
|
2009 |
|
|||||||
|
(Thousands)
|
|||||||||
|
Publisher payables, net
|
$ | 64,803 | $ | 63,074 | |||||
|
Accrued expenses
|
5,643 | 4,473 | |||||||
|
Trade payables
|
3,311 | 3,772 | |||||||
|
Other
|
6,212 | 8,110 | |||||||
| $ | 79,969 | $ | 79,429 | ||||||
Pursuant to an arrangement with one publisher customer of the Newsstand Distribution Services business, the Company netted $15,840,000 and $28,565,000 of accounts receivable against the related accounts payable at April 30, 2010 and 2009 (see Note 2).
(8)
NOTES PAYABLE:
|
Notes payable consist of:
|
April 30,
|
|||||||
|
2010
|
2009
|
|||||||
|
(Thousands)
|
||||||||
|
Line-of-credit arrangements:
Real estate operations
|
$ | 22,500 | $ | 24,000 | ||||
|
Media services operations
|
1,354 | 8,866 | ||||||
|
Other notes payable
|
4,800 | 5,070 | ||||||
| $ | 28,654 | $ | 37,936 | |||||
Fiscal year maturities of principal on notes outstanding at April 30, 2010 were as follows: 2011 - $24,052,000; 2012 - $139,000; 2013 - $126,000; 2014 - $128,000; 2015 - $121,000; and thereafter - $4,088,000.
Lines-of-credit and other arrangements
Real Estate
- On December 17, 2009, AMREP Southwest (the “Borrower”) entered into a Loan Agreement and a related Promissory Note with a bank (said Loan Agreement and Promissory Note, together, the “New ASW Credit Facility”) that replaced a revolving credit facility with the bank under which $24,000,000 was outstanding that matured on that date. The New ASW Credit Facility provides for a non-revolving loan in the original principal amount of $22,500,000 due in a single payment on December 16, 2010, subject to mandatory prepayments from a portion of the cash the Borrower may receive from its real estate sales in excess of certain thresholds. The outstanding principal ($22,500,000 at April 30, 2010) of the New ASW Credit Facility bears fluctuating interest at the annual rate of reserve adjusted 30-day LIBOR (0.28% at April 30, 2010) plus 3.5%, but not less than 5.0%, and the Borrower is required to maintain a cash reserve with the lender, initially $1,100,000 and always not less than $500,000, to fund the interest payments. At April 30, 2010, the interest rate was 5.0% and the cash reserve balance was $724,000. The New ASW Credit Facility is secured by a mortgage on certain real property of the Borrower and requires that the appraised value of the collateral be at least 2.5 times the outstanding principal of the loan.
The New ASW Credit Facility contains a number of covenants and restrictions, including covenants requiring the Borrower to maintain a minimum tangible net worth and a certain level of debt service coverage and a covenant
44
restricting the Borrower from making distributions and other payments to the Company beyond a stated management fee.
Media Services
– On May 13, 2010, Kable Media Services, Inc. and certain of its subsidiaries (“Kable Media”) entered into a Revolving Credit and Security Agreement with a bank (the “New Kable Credit Agreement”), replacing another lender whose facility had matured May 1, 2010.
The New Kable Credit Agreement, which matures May 12, 2013, provides for a revolving credit loan and letter of credit facility of up to $20,000,000, with availability within that limit based upon a percentage of the borrowers’ eligible accounts receivable or recent level of accounts receivable collections. Subject to certain terms of the New Kable Credit Agreement, funds may be borrowed, repaid and re-borrowed at any time. Borrowings under the New Kable Credit Agreement are being used for Kable’s working capital needs and general business purposes, including the payment of expenses and other costs associated with the consolidation of the Company's Subscription Fulfillment Services business in Florida and, subject to Kable Media’s consolidated fixed charge coverage ratio (as defined) being at a stated level, may be used to provide further payments on certain indebtedness due Kable Media’s parent. Also, up to $3,000,000 of the facility may be borrowed specifically to be used for the payment of accounts payable to one customer of the Company’s Newsstand Distribution Services business, with availability within that limit based upon a percentage of the eligible accounts receivable from the distribution of that customer’s periodicals.
The borrowers' obligations under the New Kable Credit Agreement are secured by substantially all of their assets other than real property. The revolving loans under the New Kable Credit Agreement may be fluctuating rate borrowings or Eurodollar fixed rate based borrowings or a combination of the two as the borrowers may select. Fluctuating rate borrowings bear interest at a rate which is, at the borrowers’ option, either (i) the reserve adjusted daily published rate for one month LIBOR loans plus a margin of 3%, or (ii) the highest of two daily published market rates and the PNC base commercial lending rate in effect from time to time, but in any case not less than 3% plus a margin of 2% (that is, not less than 5%). Eurodollar fixed rate based borrowings may be for one, two or three months and bear interest at the reserve adjusted Eurodollar interest rates for borrowings of such durations, plus a margin of 3%, which may be reduced to 2.75% depending on the borrowers’ financial condition.
The New Kable Credit Agreement also contains other customary covenants and restrictions, the most significant of which limit the ability of the borrowers to declare or pay dividends or make other distributions to the Company, limit the annual amount borrowers may incur for capital expenditures, and require the borrowers to maintain a minimum fixed charge coverage ratio.
The New Kable Credit Agreement replaced the bank credit facility that Kable Media entered into during July 2009 (the “Prior Credit Agreement”). The Prior Credit Agreement provided for: (i) a revolving credit loan and letter of credit facility of up to $20,000,000; and (ii) a second revolving credit loan facility of up to $5,000,000 that was to be used exclusively for the payment of accounts payable under a distribution agreement with a customer of Kable's Newsstand Distribution Services business. At April 30, 2010, no loans were outstanding under either of these facilities. The Prior Credit Agreement also applied to term borrowings for capital expenditures of approximately $1,354,000 which were outstanding at April 30, 2010, bearing a weighted average interest rate of 5.12% per annum, and which were repaid in May 2010. The borrowers' obligations were collateralized by substantially all of their assets other than (i) real property and (ii) any borrower's interest in the capital securities of any other borrower or any subsidiary of any borrower. The Prior Credit Agreement also contained other customary covenants and restrictions.
At April 30, 2010, Other notes payable consisted of equipment financing loans with a weighted average interest rate of 6.81% and a mortgage note payable on a warehouse with an interest rate of 6.35%.
(9) IMPAIRMENT OF ASSETS
Real Estate - During the fourth quarter 2010, certain real estate inventory held in Colorado with a carrying amount of $6,202,000 was written down to its fair value of $4,190,000, less estimated cost to sell, resulting in a loss of $2,075,000, which was included in results of operations for the period. The adjustment was required due to a current appraisal that showed a significant deterioration in the fair market value of the property from a year ago.
Goodwill - Goodwill impairment is determined using a two-step process. The first step involves a comparison of the estimated fair value of a reporting unit to its carrying amount, including goodwill. In performing the first step, the Company determines the fair value of a reporting unit using a discounted cash flow (“DCF”) analysis. Determining fair value requires the exercise of significant judgments, including judgments about appropriate discount rates, perpetual growth rates and the amount and timing of expected future cash flows. The cash flows employed in the
45
DCF analyses are based on the Company’s most recent budgets and business plans for years beyond the current reporting period. Discount rate assumptions are based on an assessment of the risk inherent in the future cash flows of the respective reporting units. In addition, when a DCF analysis is used as the primary method for determining fair value, the Company assesses the reasonableness of its determined fair values by reference to other fair value indicators where available, such as comparable company public trading values, research analyst estimates and values observed in private market transactions. If the estimated fair value of a reporting unit exceeds its carrying amount, goodwill of the reporting unit is not impaired and the second step of the impairment test is not necessary. If the carrying amount of a reporting unit exceeds its estimated fair value, then the second step of the goodwill impairment test must be performed. The second step of the goodwill impairment test compares the implied fair value of the reporting unit’s goodwill with its goodwill carrying amount to measure the amount of impairment loss, if any. The implied fair value of goodwill is determined in the same manner as the amount of goodwill recognized in a business combination.
As a result of the goodwill impairment test performed as of April 30, 2010, there was no impairment of the recorded goodwill amount of $3,893,000. The goodwill impairment test performed as of April 30, 2009 resulted in the Company recording a non-cash impairment charge related to the goodwill of its Subscription Fulfillment Services segment of $50,246,000. The deterioration of the economy during 2009, particularly with respect to the publishing industry that represents the Company’s main customer base, resulted in lower than expected full year 2009 operating results due to lower customer volumes and higher attrition than had previously been experienced. These operating results, along with near-term expectations that were in line with current business trends and significant uncertainty about when the economy would recover, caused significant changes to projected cash flows from prior expectations, which in turn resulted in the impairment charge.
In connection with the goodwill impairment charge in 2009, the Company recorded a deferred income tax benefit of $8,689,000 relating to $23,483,000 of tax deductible goodwill. The $26,763,000 of non-tax deductible goodwill created a permanent difference of $9,367,000 (see Note 12).
(10)
FAIR VALUE MEASUREMENTS:
The FASB’s accounting guidance defines fair value and establishes a framework for measuring fair value. That framework provides a fair value hierarchy that prioritizes the inputs to valuation techniques used to measure fair value. The hierarchy gives the highest priority to unadjusted quoted prices in active markets for identical assets or liabilities (Level 1 measurements) and the lowest priority to unobservable inputs (Level 3 measurements). The FASB’s guidance classifies the inputs to measure fair value into the following hierarchy:
|
Level 1
|
Unadjusted quoted prices for identical assets or liabilities in active markets.
|
|
Level 2
|
Quoted prices for similar assets or liabilities in active markets; quoted prices for identical or similar assets or liabilities in inactive markets; inputs other than quoted prices that are observable for the asset or liability; and inputs that are derived principally from or corroborated by observable market data by correlation or other means. If the asset or liability has a specified (contractual) term, the Level 2 input must be observable for substantially the full term of the asset or liability.
|
|
Level 3
|
Inputs for the asset or liability are unobservable and reflect the reporting entity’s own assumptions about the assumptions that market participants would use in pricing the asset or liability.
|
The asset’s or liability’s fair value measurement level within the fair value hierarchy is based on the lowest level of any input that is significant to the fair value measurement. Valuation techniques used need to maximize the use of observable inputs and minimize the use of unobservable inputs.
46
Fair value on a non-recurring basis
Certain assets and liabilities are measured at fair value on a non-recurring basis; that is the asset or liability is not measured at fair value on an ongoing basis but is subject to fair value adjustment in certain circumstances (for example, when there is evidence of impairment). The following presents assets and liabilities carried on the balance sheet by caption and by level within the fair value hierarchy (as described above) as of April 30, 2010, for which a non-recurring change in fair value less estimated cost to sell has been recorded during the year ended April 30, 2010 (in thousands):
|
Level 1
|
Level 2
|
Level 3
|
Impairment Loss Recorded
|
|||||||||||||
|
Real estate inventory
|
$ | - | $ | - | $ | 4,190 | $ | 2,075 | ||||||||
Certain real estate inventory with a carrying amount of $6,202,000 was written down to its fair value of $4,190,000, less estimated cost to sell, resulting in a loss of $2,075,000, which was included in results of operations for the period.
The Financial Instruments Topic of the FASB Accounting Standards Codification requires disclosure of fair value information about financial instruments, whether or not recognized in the balance sheet, for which it is practicable to estimate that value. Fair value is determined under the framework discussed above. The Topic excludes all nonfinancial instruments from its disclosure requirements. Accordingly, the aggregate fair value amounts presented do not represent the underlying value of the Company. The following methods and assumptions are used in estimating fair value disclosure for financial instruments.
The carrying amounts of cash and cash equivalents, media services trade receivables and trade payables approximate fair value because of the short maturity of these financial instruments. Debt that bears variable interest rates indexed to prime or LIBOR also approximates fair value as it reprices when market interest rates change.
The estimated fair value of the Company’s long-term, fixed-rate mortgage receivables was $1,238,000 and $2,914,000 versus carrying amounts of $1,243,000 and $3,176,000 at April 30, 2010 and 2009. The estimated fair value of the Company’s long-term, fixed-rate notes payable was $6,648,000 and $8,524,000 versus carrying amounts of $6,154,000 and $7,869,000 at April 30, 2010 and 2009.
(11)
BENEFIT PLANS:
Retirement plan
The Company has a retirement plan for which accumulated benefits were frozen and future service credits were curtailed as of March 1, 2004. Prior to that date it had covered substantially all full-time employees and provided benefits based upon a percentage of the employee’s annual salary. The following tables summarize the balance sheet impact as well as the benefit obligations, assets, funded status and assumptions associated with the retirement plan.
Net periodic pension cost for 2010, 2009 and 2008 was comprised of the following components:
|
Year Ended April 30,
|
||||||||||||
|
2010
|
2009
|
2008
|
||||||||||
|
(Thousands)
|
||||||||||||
|
Interest cost on projected
benefit obligation
|
$ | 1,918 | $ | 1,806 | $ | 1,736 | ||||||
|
Expected return on assets
|
(1,307 | ) | (2,077 | ) | (2,310 | ) | ||||||
|
Plan expenses
|
190 | 253 | 146 | |||||||||
|
Recognized net actuarial loss
|
1,160 | 291 | 164 | |||||||||
|
Total cost (benefit) recognized in pretax income
|
1,961 | 273 | (264 | ) | ||||||||
|
Cost recognized in pretax other
|
||||||||||||
|
comprehensive income
|
389 | 8,586 | 1,065 | |||||||||
|
Net periodic pension cost
|
$ | 2,350 | $ | 8,859 | $ | 801 | ||||||
47
The estimated net loss, transition obligation and prior service cost for the plan that will be amortized from accumulated other comprehensive income into net periodic pension cost over the next fiscal year are $1,155,000, $0 and $0, respectively. Assumptions used in determining net periodic pension cost and the benefit obligations were:
|
Year Ended April 30,
|
|||||
|
2010
|
2009
|
2008
|
|||
|
Discount rate used to determine net periodic pension cost
|
7.08%
|
6.42%
|
5.75%
|
||
|
Discount rate used to determine pension benefit obligation
|
5.44%
|
7.08%
|
6.42%
|
||
|
Expected long-term rate of return on assets on assets
|
8.00%
|
8.00%
|
8.00%
|
||
The following table sets forth changes in the plan’s benefit obligations and assets, and summarizes components of amounts recognized in the Company's consolidated balance sheets (in thousands):
|
April 30,
|
|||||||||
|
2010
|
2009
|
2008
|
|||||||
|
Change in benefit obligation:
|
|
||||||||
|
Benefit obligation at beginning of year
|
$
|
28,247
|
$
|
29,270
|
$
|
31,283
|
|||
|
Interest cost
|
1,918
|
1,806
|
1,736
|
||||||
|
Actuarial (gain) loss
|
4,833
|
(529)
|
(1,616)
|
||||||
|
Benefits paid
|
(2,430)
|
(2,300)
|
(2,133)
|
||||||
|
Benefit obligation at end of year
|
$
|
32,568
|
$
|
28,247
|
$
|
29,270
|
|||
|
Change in plan assets:
|
|||||||||
|
Fair value of plan assets at beginning of year
|
$
|
17,582
|
$
|
27,225
|
$
|
30,040
|
|||
|
Company contributions
|
940
|
240
|
-
|
||||||
|
Actual return on plan assets
|
4,628
|
(7,393)
|
(507)
|
||||||
|
Benefits paid
|
(2,430)
|
(2,300)
|
(2,133)
|
||||||
|
Plan expenses
|
(227)
|
(190)
|
(175)
|
||||||
|
Fair value of plan assets at end of year
|
$
|
20,493
|
$
|
17,582
|
$
|
27,225
|
|||
|
Funded (underfunded) status:
|
$
|
(12,075)
|
$
|
(10,665)
|
$
|
(2,045)
|
|||
|
Recognition of underfunded status:
|
|||||||||
|
Accrued pension cost
|
$
|
(12,075)
|
$
|
(10,665)
|
$
|
(2,045)
|
|||
The funded status of the plan is equal to the net liability recognized in the consolidated balance sheet. The following table summarizes the amounts recorded in accumulated other comprehensive loss, which have not yet been recognized as a component of net periodic pension costs (in thousands):
|
2010
|
2009
|
2008
|
||||||||||
|
Pre-tax accumulated comprehensive loss
|
$ | 14,800 | $ | 14,423 | $ | 5,836 | ||||||
The following table summarizes the changes in accumulated other comprehensive loss related to the plan for the years ended April 30, 2010 and 2009 (in thousands):
|
Pension Benefits
|
||||||||
|
Pre-tax
|
Net of Tax
|
|||||||
|
Accumulated comprehensive loss, May 1, 2008
|
$ | 5,836 | $ | 3,522 | ||||
|
Net actuarial loss
|
8,877 | 5,504 | ||||||
|
Amortization of net loss
|
(290 | ) | (180 | ) | ||||
|
Accumulated comprehensive loss, April 30, 2009
|
14,423 | 8,846 | ||||||
|
Net actuarial loss
|
1,537 | 953 | ||||||
|
Amortization of net loss
|
(1,160 | ) | (719 | ) | ||||
|
Accumulated comprehensive loss, April 30, 2010
|
$ | 14,800 | $ | 9,080 | ||||
48
The Company recorded other comprehensive income (loss), net of tax, of ($234,000) in 2010, ($5,324,000) in 2009 and ($660,000) in 2008 to account for the net effect of changes to the unfunded pension liability.
The average asset allocation for the retirement plan by asset category was as follows:
|
April 30,
|
|||
|
2010
|
2009
|
||
|
Equity securities
|
78%
|
68%
|
|
|
Fixed income securities
|
19
|
28
|
|
|
Other (principally cash and cash equivalents)
|
3
|
4
|
|
|
Total
|
100%
|
100%
|
|
The investment mix between equity securities and fixed income securities is based upon seeking to achieve a desired return by balancing more volatile equity securities and less volatile fixed income securities. Plan assets are invested in portfolios of diversified public-market equity securities and fixed income securities. The plan holds no securities of the Company. Investment allocations are made across a range of markets, industry sectors, capitalization sizes and, in the case of fixed income securities, maturities and credit quality. The Company has established long-term target allocations of approximately 78% for equity securities, 21% for fixed income securities and 1% for other.
The expected return on assets for the retirement plan is based on management’s expectation of long-term average rates of return to be achieved by the underlying investment portfolios. In establishing this assumption, management considers historical and expected returns for the asset classes in which the plan is invested, as well as current economic and market conditions. The Company is currently using an 8.0% assumed rate of return for purposes of the expected return rate on assets for the development of net periodic pension costs for the retirement plan.
The Company funds the retirement plan in compliance with IRS funding requirements. The Company’s contributions to the plan totaled $940,000, $240,000 and $0 in 2010, 2009 and 2008. The Company expects to make contributions of approximately $880,000 to the retirement plan in fiscal year 2011.
The amount of future annual benefit payments is expected to be between $2,300,000 and $2,600,000 in fiscal years 2011 through 2015, and an aggregate of approximately $11,800,000 is expected to be paid in the fiscal five-year period 2016 through 2020.
The Company has adopted the new disclosure requirements in ASC 715. The new guidance requires additional fair value disclosures consistent with those required by ASC 820. The following is a description of the valuation methodologies used for retirement plan assets measured at fair value: Common stock - valued at the closing price reported on the New York Stock Exchange; Corporate bonds and debentures - valued at the closing price reported in the active market in which the bond is traded; and, U.S. Treasury and government agency securities - valued at the closing price reported in the active market in which the security is traded.
The methods described above may produce a fair value calculation that may not be indicative of net realizable value or reflective of future fair values. Furthermore, while the Company believes its valuation methods are appropriate and consistent with other market participants, the use of different methodologies or assumptions to determine the fair value of certain financial instruments could result in a different fair value measurement at the reporting date.
The following table sets forth by level within the fair value hierarchy of the retirement plan’s assets at fair value as of April 30, 2010 (in thousands):
|
Total
|
Level 1
|
Level 2
|
Level 3
|
|||||||||||||
|
Cash and cash equivalents
|
$ | 762 | $ | 762 | $ | - | $ | - | ||||||||
|
Investments at fair value:
|
||||||||||||||||
|
Equity securities
|
15,963 | 15,963 | - | - | ||||||||||||
|
Corporate bonds and debentures
|
2,583 | 2,583 | - | - | ||||||||||||
|
U.S. Treasury and government agency securities
|
1,185 | 1,185 | - | - | ||||||||||||
|
Total assets at fair value
|
$ | 20,493 | $ | 20,493 | $ | - | $ | - | ||||||||
49
Savings and salary deferral plans
The Company has a Savings and Salary Deferral Plan, commonly referred to as a 401(k) plan, in which all full-time employees (other than Palm Coast employees) with more than one year of service are eligible to participate and contribute to through salary deductions. The Company may make discretionary matching contributions, subject to the approval of its Board of Directors. During the two years ending April 30, 2009, the Company matched 66.67% of employee contributions not in excess of 6% of eligible compensation. Effective May 1, 2009, the Company suspended the matching contribution to the plan.
The Company also has a 401(k) plan in which originally all Palm Coast employees with more than six months of service were eligible to participate and contribute to through salary deductions. During the period from the acquisition of Palm Coast through April 30, 2009, pursuant to a mandatory matching provision in the plan, the Company matched 50% of the employee contributions not in excess of 6% of eligible compensation. In April 2009, the Company amended the plan making the matching provision optional and to require an employee to have one year of service for participation in the plan. Effective May 1, 2009, the Company suspended the matching contribution to the plan.
The Company's matching contributions to the two plans totaled $0, $1,181,000 and $1,263,000 in 2010, 2009 and 2008.
Equity compensation plan
The Company adopted the 2006 Equity Compensation Plan in September 2006 that provides for the issuance of up to 400,000 shares of common stock of the Company pursuant to options, grants or other awards made under the plan. As of April 30, 2010, the Company had not issued any options, grants or other awards under the plan.
Stock option plan
The Company had a stock option plan that provided for the automatic issuance of an option to purchase 500 shares of common stock to each non-employee director annually at the fair market value at the date of grant. The options are exercisable in one year and expire five years after the date of grant. The Board of Directors terminated the plan following the annual grants that were made in September 2005. Options exercised resulted in the issuance of new shares of common stock.
A summary of activity in the Company’s stock option plan is as follows:
Year ended April 30,
|
2010
|
2009
|
2008
|
||||||||||||||||||||||
|
Weighted
|
Weighted
|
Weighted
|
||||||||||||||||||||||
|
Number
|
Average
|
Number
|
Average
|
Number
|
Average
|
|||||||||||||||||||
|
of
Shares
|
Exercise
Price
|
of
Shares
|
Exercise
Price
|
of
Shares
|
Exercise
Price
|
|||||||||||||||||||
|
Options outstanding at beginning of year
|
3,500 | $ | 21.74 | 4,500 | $ | 20.28 | 4,500 | $ | 20.28 | |||||||||||||||
|
Granted
|
- | - | - | - | - | - | ||||||||||||||||||
|
Exercised
|
- | - | (1,000) | $ | 15.19 | - | - | |||||||||||||||||
|
Expired or canceled
|
(1,500) | - | - | - | - | - | ||||||||||||||||||
|
Options outstanding at
|
||||||||||||||||||||||||
|
end of year
|
2,000 | $ | 24.88 | 3,500 | $ | 21.74 | 4,500 | $ | 20.28 | |||||||||||||||
|
Available for grant at
|
||||||||||||||||||||||||
|
end of year
|
- | - | - | |||||||||||||||||||||
|
Options exercisable at
end of year
|
2,000 | 3,500 | 4,500 | |||||||||||||||||||||
|
Range of exercise prices for options exercisable at end of year
|
$ | 24.88 | $ | 17.55 to $24.88 | $ | 15.19 to $24.88 | ||||||||||||||||||
50
Options outstanding at April 30, 2010 are presently exercisable and expire in September 2010. The weighted average remaining contractual lives of options outstanding at April 30, 2010, 2009 and 2008 were 0.5, 1.0 and 1.6 years. There was no intrinsic value (the difference between the price of the underlying shares and the exercise price) of options exercisable at April 30, 2010. The total intrinsic value of options exercised during the year ended April 30, 2009 was $39,000, determined as of the date of option exercise. There were no options exercised in 2010 or 2008.
(12)
INCOME TAXES:
The provision (benefit) for income taxes consists of the following:
|
Year Ended April 30,
|
||||||||||||
|
2010
|
2009
|
2008
|
||||||||||
|
(Thousands)
|
||||||||||||
|
Current:
|
||||||||||||
|
Federal
|
$ | (2,811 | ) | $ | (3,169 | ) | $ | 5,511 | ||||
|
State and local
|
96 | 305 | (812 | ) | ||||||||
| (2,715 | ) | (2,864 | ) | 4,699 | ||||||||
|
D Deferred
:
|
||||||||||||
|
Federal
|
(3,401 | ) | (6,746 | ) | 2,777 | |||||||
|
State and local
|
225 | (1,278 | ) | 309 | ||||||||
| (3,176 | ) | (8,024 | ) | 3,086 | ||||||||
|
Total provision (benefit) for income taxes
|
$ | (5,891 | ) | $ | (10,888 | ) | $ | 7,785 | ||||
The provision (benefit) for income taxes has been allocated as follows:
|
Year Ended April 30,
|
||||||||||||
|
2010
|
2009
|
2008
|
||||||||||
|
(Thousands)
|
||||||||||||
|
Continuing operations
|
$ | (5,891 | ) | $ | (10,888 | ) | $ | 7,819 | ||||
|
Discontinued operations
|
- | - | (34 | ) | ||||||||
|
Total provision (benefit) for income taxes
|
$ | (5,891 | ) | $ | (10,888 | ) | $ | 7,785 | ||||
The components of the net deferred income taxes are as follows:
|
April 30,
|
||||||||
|
2010
|
2009
|
|||||||
|
(Thousands)
|
||||||||
|
Deferred income tax assets:
|
||||||||
|
State tax loss carryforwards
|
$ | 4,109 | $ | 3,956 | ||||
|
Accrued pension costs
|
4,597 | 3,719 | ||||||
|
Federal NOL carryforward
|
1,790 | 1,790 | ||||||
|
Vacation accrual
|
884 | 1,175 | ||||||
|
Intangibles and deductible goodwill
|
8,935 | 9,712 | ||||||
|
Other
|
225 | (195 | ) | |||||
| Total deferred income tax assets | 20,540 | 20,157 | ||||||
|
Deferred income tax liabilities:
|
||||||||
|
Real estate basis differences
|
(1,793 | ) | (1,765 | ) | ||||
|
Reserve for periodical returns
|
(1,732 | ) | (1,883 | ) | ||||
|
Depreciable assets
|
(4,865 | ) | (5,772 | ) | ||||
|
Deferred gains on investment assets
|
(5,044 | ) | (5,869 | ) | ||||
|
Capitalized costs for financial reporting
purposes, expensed for tax
|
(1,330 | ) | (3,525 | ) | ||||
|
Total deferred income tax liabilities
|
(14,764 | ) | (18,814 | ) | ||||
| Valuation allowance for realization of state tax loss carryforwards | (3,163 | ) | (2,414 | ) | ||||
| Net deferred income tax asset (liability) | $ | 2,613 | $ | (1,071 | ) | |||
51
The following table reconciles taxes computed at the U.S. federal statutory income tax rate from continuing operations to the Company's actual tax provision:
|
Year Ended April 30,
|
|||||||||||||
|
2010
|
2009
|
2008 |
|
||||||||||
|
(Thousands)
|
|||||||||||||
|
Computed tax provision (benefit) at statutory rate
|
$ | (5,379 | ) | $ | (19,013 | ) | $ | 7,554 | |||||
|
Increase (reduction) in tax resulting from:
State income taxes, net of federal
income tax effect
|
(1,058 | ) | (631 | ) | (325 | ) | |||||||
|
Expiration of state NOLs and change in
valuation allowance
|
1,267 | - | - | ||||||||||
|
Real estate charitable land contribution
|
- | - | (481 | ) | |||||||||
|
Adjustment for unrecognized tax benefits
|
(932 | ) | (481 | ) | 1,160 | ||||||||
|
Non-deductible goodwill impairment (see Note 9)
|
- | 9,367 | - | ||||||||||
|
Other
|
211 | (130 | ) | (89 | ) | ||||||||
|
Actual tax provision (benefit)
|
$ | (5,891 | ) | $ | (10,888 | ) | $ | 7,819 | |||||
A valuation allowance is provided when it is considered more likely than not that certain deferred tax assets will not be realized. The valuation allowance relates entirely to net operating loss carryforwards in states where the Company has no current operations. The current year increase in the valuation allowance relates to Colorado net operating loss carryforwards that are not expected to be realized as a result of the closure of the Colorado Subscription Fulfillment Services business operations (see Note 15). The remaining net operating loss carryforwards will expire beginning in the fiscal years ending April 30, 2011 through April 30, 2031. The deferred tax asset of $4,109,000 related to the state net operating loss carryforwards expires in future fiscal years, as follows: 2011 - $324,000; 2012 - $342,000; 2013 - $282,000; 2014 - $0; 2015 - $51,000; and thereafter - $3,110,000.
The Company has a U.S. federal net operating loss carryforward of approximately $5,000,000 resulting from the purchase of Palm Coast which will begin to expire in the fiscal year ending April 30, 2024. In addition, $17,792,000 of goodwill associated with the Palm Coast acquisition remains amortizable as of April 30, 2010. There is also a $265,000 Canadian federal net operating loss carryforward which will expire in fiscal year 2031.
The Company is subject to U.S. federal income taxes, and also to various state, local and foreign income taxes. Tax regulations within each jurisdiction are subject to the interpretation of the related tax laws and regulations and require significant judgment to apply. The Company is not currently under examination by any tax authorities with respect to its income tax returns. In nearly all jurisdictions, the tax years through the fiscal year ended April 30, 2006 are no longer subject to examination.
ASC 740-10 clarifies the accounting for uncertain tax positions, prescribing a minimum recognition threshold a tax position is required to meet before being recognized, and providing guidance on the derecognition, measurement, classification and disclosure relating to income taxes. The following table summarizes the beginning and ending gross amount of unrecognized tax benefits (in thousands):
|
2010
|
2009
|
|||||||
|
Gross unrecognized tax benefits at beginning of year
|
$ | 4,623 | $ | 5,223 | ||||
|
Gross increases:
|
||||||||
|
Additions based on tax positions related to current year
|
76 | 64 | ||||||
|
Additions based on tax positions of prior years
|
- | 589 | ||||||
|
Gross decreases:
|
||||||||
|
Reductions based on tax positions of prior years
|
(712 | ) | (406 | ) | ||||
|
Reductions based on the lapse of the applicable
statute of limitations
|
(734 | ) | (847 | ) | ||||
|
Gross unrecognized tax benefits at end of year
|
$ | 3,253 | $ | 4,623 | ||||
52
The total amount of unrecognized tax benefits at April 30, 2010 and 2009 was $851,000 and $1,585,000 which, if recognized, would have an impact on the effective tax rate. The Company believes it is reasonably possible that the liability for unrecognized tax benefits will decrease by up to approximately $918,000 in the next twelve months due to the expiration of the statute of limitations.
The Company has elected to include interest and penalties in its income tax expense. The total amount of interest payable recognized in the accompanying consolidated balance sheets was $393,000 at April 30, 2010 and $685,000 at April 30, 2009. No amount has been accrued for penalties. In 2010 and 2009, the Company recognized net credits of $292,000 and $32,000 to its income tax provision related to interest, which resulted from the reduction of unrecognized tax benefits due to the expiration of the statute of limitations, offset in part by interest accrued for existing uncertain tax positions.
(13)
SHAREHOLDERS’ EQUITY:
The Company recorded other comprehensive income (loss) of ($234,000) in 2010, ($5,324,000) in 2009 and ($660,000) in 2008 to account for the net effect of changes to the unfunded pension liability (see Note 11).
The Company from time to time has reacquired its shares to be held as treasury stock as part of a stock repurchase program. During 2008, the Board of Directors authorized the repurchase of up to 1,000,000 shares. The Company reacquired 658,400 shares under this authorization, all in open market transactions, for a total purchase price, including commissions, of $21,363,000 during 2008. There were no stock repurchases by the Company in 2010 or 2009.
(14)
DISCONTINUED OPERATIONS:
Loss from discontinued operations of $57,000, net of tax, in 2008 reflected the costs incurred in connection with the settlement of all litigation related to the Company's El Dorado, New Mexico former water utility subsidiary, which was taken through condemnation proceedings during fiscal year 2006.
(15)
RESTRUCTURING AND FIRE RECOVERY COSTS:
In 2008, the Company announced a project to consolidate its Subscription Fulfillment Services business operations from three locations in Colorado, Florida and Illinois into one existing location at Palm Coast, Florida, which is expected to streamline operations, improve service to clients and create cost efficiencies through reduced overhead costs and the elimination of operating redundancies. This project is expected to be completed by October 31, 2010. As of April 30, 2010, the Company had incurred approximately $6,300,000 for capital expenditures and $8,000,000 of non-recurring costs related to the consolidation project. The State of Florida and the City of Palm Coast agreed to provide incentives for the project, including cash and employee training grants and tax relief, which are largely contingent on job retention, job creation and capital investment. The Company recognized $255,000 and $293,000 of income for 2010 and 2009 for certain incentives related to the consolidation project, which was netted against restructuring costs of $6,018,000 and $1,414,000 for the same periods. As a result, the Company reported net charges to operations of $5,763,000 and $1,121,000 related to the consolidation project for 2010 and 2009. The items of income for incentives and of costs related to the consolidation project are included in Restructuring and fire recovery costs in the Company’s consolidated statements of operations and retained earnings.
As of April 30, 2010 and 2009, the Company had accruals for future payments related to the consolidation project of $1,982,000 and $713,000, principally for severance and facilities consolidation. Cash payments related to the project were $4,493,000 and $554,000 for 2010 and 2009. There were no significant accrual reversals in any year related to the consolidation project. The Company anticipates approximately $300,000 of additional costs, primarly for severance, in 2011 related to the consolidation project.
In June 2009, the Company received $3,000,000 pursuant to an agreement with the State of Florida (the “Award Agreement”) as part of the incentives made available to the Company in connection with the consolidation project. The Award Agreement requires the Company to achieve certain objectives in terms of job retention, job creation and capital investment through December 31, 2011; if the objectives are not met, the Company may need to return a portion, or all, of the $3,000,000. Accordingly, the $3,000,000 has been recorded as a long term liability until the Company is irrevocably entitled to retain the award, at which time the award will be amortized into income over the life of the assets acquired with the grant monies received.
53
In December 2007, a warehouse leased by a Kable subsidiary in Oregon, Illinois and its contents were totally destroyed by fire. The warehouse was used principally to store back issues of magazines published by certain customers for whom the Company filled back-issue orders as part of its services. The Company was required to provide insurance for that property of certain of those customers. Through April 30, 2010, the Company’s insurance carrier had paid $348,000 to customers for lost materials.
The Company has filed various claims with its insurance provider related to the fire. As of April 30, 2010, the Company had been reimbursed a total of $1,142,000 for property lost in the fire, other expenses of relocation and professional fees. As a result of insurance reimbursements received, the Company recorded net gains totaling $216,000 for 2010 and $71,000 for 2009. The items of income and expense related to insurance proceeds and the fire recovery costs are included in Restructuring and fire recovery costs in the Company’s consolidated statements of operations and retained earnings.
In addition, the Company recorded other income for business interruption claims resulting from the fire that totaled $31,000 for 2010 and $287,000 for 2009. These income amounts are included in Media services and other operations revenue in the Company’s consolidated statements of operations and retained earnings
.
(16)
COMMITMENTS AND CONTINGENCIES:
Non-cancelable leases
The Company is obligated under long-term, non-cancelable leases for equipment and various real estate properties. Certain real estate leases provide that the Company will pay for taxes, maintenance and insurance costs and include renewal options. Rental expense for 2010, 2009 and 2008 was approximately $5,697,000, $6,828,000 and $9,087,000. The total minimum rental commitments for fiscal years subsequent to April 30, 2010 of $6,757,000 are due as follows: 2011- $2,447,000; 2012 - $2,009,000; 2013 - $1,386,000; 2014 - $315,000; 2015 - $300,000; and thereafter - $300,000.
Lot exchanges
In connection with certain individual home site sales made prior to 1977 at Rio Rancho, New Mexico, if water, electric and telephone utilities have not reached the lot site when a purchaser is ready to build a home, the Company is obligated to exchange a lot in an area then serviced by such utilities for the lot of the purchaser, without cost to the purchaser. The Company has not incurred significant costs related to the exchange of lots.
(17)
LITIGATION:
In June 2008, a lawsuit entitled
Haan, etc. v. Kable News Company, Inc., et al
(“Kable News”) was filed in the Circuit Court of the Fifteenth Judicial Circuit, Ogle County, Illinois, against Kable News by an insurance company as subrogee of the owner of a warehouse building leased to Kable News that was destroyed in a fire in December 2007. The lawsuit also named as a defendant a temporary staffing company that provided Kable News with an employee who is alleged to have had a role in causing the fire. Plaintiff’s claims specific to Kable News are based on allegations of negligence and willful and wanton misconduct. The damages being sought are not to expected to exceed $1,200,000. Kable News’ liability insurance carrier has undertaken its defense under a reservation of rights. Kable News is vigorously defending the lawsuit and its motion to dismiss plaintiff’s claims against Kable News on substantive grounds was recently granted. However, the possibility of an appeal of the dismissal and the other defendant’s claim against Kable News for contribution remain. The Company is not in a position to predict the outcome of the lawsuit.
In November 2008, a lawsuit entitled
Alpinist, et al v. Haan, et al
was filed in the Circuit Court of the Fifteenth Judicial Circuit, Ogle County, Illinois, against Kable News by a magazine publisher and a number of insurance companies as the subrogees of other magazine publishers seeking damages for their property stored by Kable News in the warehouse that was destroyed in the fire referred to above. The three defendants are the warehouse owner, Kable News and the temporary staffing company that is a defendant in the lawsuit described above. Plaintiffs’ claims specific to Kable News are based on allegations of negligence, breach of contract and willful and wanton misconduct. The lawsuit has been dismissed as to a number of plaintiffs without any damages being paid by Kable News. There are two remaining plaintiffs and their damage claims total approximately $800,000. Kable News is vigorously defending the lawsuit and its motion to dismiss the two plaintiffs’ claims against Kable News on substantive grounds was recently granted. However, the possibility of an appeal of the dismissal and the other
54
defendants’ claims against Kable News for contribution remain. The Company is not in a position to predict the outcome of the lawsuit.
In December 2009, Kable News received a demand for arbitration by the American Arbitration Association from
Nest, LLC
, another publisher which had copies of magazines and a book stored at the warehouse that were destroyed in the fire referred above. Claimant is seeking damages of $650,000 and is contending that the magazines were unique and artistic, that at the time of their destruction claimant was in the process of finalizing a contract for their sale, and that due to the special printing involved, the replacement cost is far in excess of the purchase price. The property and casualty insurance carrier for Kable News is providing the defense in this proceeding. Discovery of the basis for claimant’s alleged damages has yet to take place. Kable News is vigorously defending the proceeding and believes it has meritorious defenses to the asserted value of the loss. The arbitration hearing is scheduled for November 2010. The Company is not in a position to predict the outcome of this proceeding.
In March 2009, a civil action was commenced in the United States District Court for the Southern District of New York entitled
Anderson News, L.L.C., et al. v. American Media, Inc., et al.
Anderson News, L.L.C. (“Anderson”) was a wholesaler of magazines. Anderson has alleged that magazine publishers and distributors, including Kable Distribution Services, Inc. (“Kable Distribution”), conspired to boycott Anderson to drive it out of business, and that other wholesalers participated in this effort. Anderson has asserted claims under Section 1 of the Sherman Act (antitrust), for defamation, for tortious interference with its contracts with retailers, and for civil conspiracy. Damages have not been quantified, but would presumably be alleged to be substantial. Anderson has alleged that the distributor and publisher defendants acted in concert to cut off Anderson from its supply of magazines to enable them to gain control of the single-copy magazine distribution channel. Kable Distribution is vigorously defending the lawsuit and has moved, along with the other defendants, to dismiss the action. A decision on the motion is awaited. The Company is not in a position to predict the outcome of the lawsuit.
In March 2010, an action was commenced in the United States District Court for the Southern District of Florida entitled
vTRAX Technologies Licensing, Inc. v. Siemens Communications, Inc., et al.
, in which Palm Coast Data LLC (“Palm Coast”) is one of the defendants. The complaint alleges that the plaintiff is the owner of a patent covering a method and computer program for the operation of a call center system and that the patent is being infringed by each of the defendants, and seeks injunctive relief and damages. Palm Coast acquired its call center system from a co-defendant’s predecessor-in-interest. Palm Coast has filed its answer denying infringement of the patent and has raised counterclaims challenging both the infringement allegations and the validity of the patent. Palm Coast is vigorously defending the lawsuit. However, the lawsuit is at an early stage, and the Company is not in a position to predict its outcome.
An employment discrimination lawsuit entitled
Garcia v. Kable Fulfillment Services, Inc. and Kable News Company, Inc.
has been pending in the Boulder County, Colorado District Court since 2005. The defendants are Kable Media subsidiaries. The case has gone through numerous proceedings including extensive motion practice, various appeals and an overturned jury verdict. In April 2010, in a second jury trial, a verdict against the defendants was rendered in which the jury awarded the plaintiff approximately $236,000 in damages. The trial remains open for the possible further award of front-end damages, and liquidated damages of as much as twice the damage award based upon the jury’s finding of a willful Age Discrimination in Employment Act violation, plus an award of plaintiff’s counsel fees and court costs. In July 2010 the defendants’ motion to reduce the jury award on various grounds was rejected by the Court. The defendants carry employment practices liability insurance coverage for their liability. Following the Court's decision, Plaintiff made a settlement demand, and the insurance carrier has indicated it is willing to cover the full amount of the settlement demand beyond the unapplied retention. Settlement on this basis is acceptable to the Company, and the Company has made no accrual related to this case in the accompanying financial statements beyond the amount of the unapplied retention of approximately $75,000.
The Company and its subsidiaries are involved in various other claims and legal actions arising in the normal course of business.
While the ultimate results of all these matters cannot be predicted with certainty, management believes that they will not have a material adverse effect on the Company’s consolidated financial position, liquidity or results of operations. Unless so noted, no provision has been made in the accompanying financial statements for the above items.
55
(18)
ACQUISITION:
During November 2008, the Company purchased, through a newly-formed subsidiary of Kable Media Services, Inc., certain assets of a privately-held company engaged in the product repackaging and fulfillment businesses located in Fairfield, Ohio. In a separate transaction, another Company subsidiary purchased a warehouse leased to the privately-held company. These transactions were expected to provide benefits to many of the customers of the Company’s product services subsidiary through the combination of that subsidiary’s services with those to be provided with the purchased assets. On the same date, another newly-formed subsidiary of Kable Media Services, Inc. purchased certain assets of a company that provided temporary staffing services that was majority-owned by the same individual who owned the privately-held company noted above. The purchase price of the three transactions was approximately $8,500,000, which included the assumption of certain liabilities, and was financed from working capital and bank borrowings. The transactions have been accounted for as a business combination. The purchase price (including closing costs and excluding cash acquired) has been applied as follows: Receivables - $1,565,000; Inventory - $118,000; Property, plant and equipment - $6,826,000; Mortgage note payable - $4,747,000, and Other liabilities - $687,000.
(19)
SUBSEQUENT EVENTS:
The Company has evaluated subsequent events through the date of the issuance of its consolidated financial statements. The Company’s Kable Media Services subsidiary, and certain of its subsidiaries, entered into a bank agreement on May 13, 2010, replacing a credit facility that had matured on May 1, 2010. See Note 8 for further detail.
(20)
INFORMATION ABOUT THE COMPANY'S OPERATIONS IN DIFFERENT
INDUSTRY SEGMENTS:
The Company has identified four reportable segments in which it currently has business operations. Real Estate operations primarily include land sales activities, which involve the obtaining of approvals and the development of large tracts of land for sale to homebuilders, commercial users and others, as well as investments in commercial and investment properties. The Company’s Media Services business has three identified segments: (i) Subscription Fulfillment Services, (ii) Newsstand Distribution Services and (iii) Product Services and Other. Subscription Fulfillment Services operations involve the performance of subscription fulfillment and other related activities on behalf of various publishers and other clients. Newsstand Distribution Services operations involve the national and, to a small degree, international distribution and sale of periodicals to wholesalers. Product Services and Other involve the performance of product fulfillment services, packaging and temporary staffing activities. Certain common expenses as well as identifiable assets are allocated among industry segments based upon management’s estimate of each segment’s absorption. Other revenues and expenses not identifiable with a specific segment are shown as a separate segment in this presentation.
The accounting policies of the segments are the same as those described in Note 1. Summarized data relative to the industry segments in which the Company has continuing operations is as follows (in thousands):
|
Real Estate
Operations
|
Subscription
Fulfillment
Services
|
Newsstand
Distribution Services
|
Product Services and Other
|
Other
|
Consolidated
|
|||||||||||||||||||
|
Year ended April 30, 2010 (a):
|
||||||||||||||||||||||||
|
Revenues
|
$ | 5,714 | $ | 92,022 | $ | 12,947 | $ | 10,047 | $ | (232 | ) | $ | 120,498 | |||||||||||
|
Income (loss) from continuing operations
|
$ | (2,688 | ) | $ | (9,168 | ) | $ | 1,671 | $ | (105 | ) | $ | 810 | $ | (9,480 | ) | ||||||||
|
Provision (benefit) for income taxes from continuing operations
|
(2,738 | ) | (4,649 | ) | 1,097 | (55 | ) | 454 | (5,891 | ) | ||||||||||||||
|
Interest expense (income), net (b)
|
877 | 2,591 | (1,197 | ) | 88 | (744 | ) | 1,615 | ||||||||||||||||
|
Depreciation and amortization
|
106 | 10,523 | 555 | 222 | 148 | 11,554 | ||||||||||||||||||
|
EBITDA (c)
|
$ | (4,443 | ) | $ | (703 | ) | $ | 2,126 | $ | 150 | $ | 668 | $ | (2,202 | ) | |||||||||
|
Goodwill
|
$ | - | $ | - | $ | 3,893 | $ | - | $ | - | $ | 3,893 | ||||||||||||
|
Total assets
|
$ | 90,260 | $ | 70,338 | $ | 37,087 | $ | 4,683 | $ | 9,141 | $ | 211,509 | ||||||||||||
|
Capital expenditures
|
$ | - | $ | 2,631 | $ | 15 | $ | 228 | $ | 10 | $ | 2,884 | ||||||||||||
56
|
Year ended April 30, 2009 (a):
|
||||||||||||||||||||||||
|
Revenues
|
$ | 9,621 | $ | 115,964 | $ | 12,400 | $ | 7,842 | $ | 74 | $ | 145,901 | ||||||||||||
|
Income (loss) from continuing operations
|
$ | 2,565 | $ | (43,839 | ) | $ | (3,510 | ) | $ | 304 | $ | 1,014 | $ | (43,466 | ) | |||||||||
|
Provision (benefit) for income taxes from continuing operations
|
465 | (10,490 | ) | (1,786 | ) | 223 | 700 | (10,888 | ) | |||||||||||||||
|
Interest expense (income), net (b)
|
73 | 2,855 | (1,050 | ) | 31 | (1,194 | ) | 715 | ||||||||||||||||
|
Depreciation and amortization
|
39 | 9,423 | 564 | 56 | 77 | 10,159 | ||||||||||||||||||
|
Goodwill impairment
|
- | 50,246 | - | - | - | 50,246 | ||||||||||||||||||
|
EBITDA (c)
|
$ | 3,142 | $ | 8,195 | $ | (5,782 | ) | $ | 614 | $ | 597 | $ | 6,766 | |||||||||||
|
Goodwill
|
$ | - | $ | - | $ | 3,893 | $ | - | $ | - | $ | 3,893 | ||||||||||||
|
Total assets
|
$ | 97,970 | $ | 56,111 | $ | 55,918 | $ | 4,618 | $ | 13,035 | $ | 227,652 | ||||||||||||
|
Capital expenditures
|
$ | 3,114 | $ | 1,698 | $ | 10 | $ | 326 | $ | 64 | $ | 5,212 | ||||||||||||
|
Year ended April 30, 2008 (a):
|
||||||||||||||||||||||||
|
Revenues
|
$ | 33,073 | $ | 122,521 | $ | 12,916 | $ | 3,259 | $ | 292 | $ | 172,061 | ||||||||||||
|
Income from continuing operations
|
$ | 12,187 | $ | (1,554 | ) | $ | 1,293 | $ | 141 | $ | 1,695 | $ | 13,762 | |||||||||||
|
Provision (benefit) for income taxes from continuing operations
|
6,932 | (830 | ) | 812 | 75 | 830 | 7,819 | |||||||||||||||||
|
Interest expense (income), net (b)
|
- | 5,041 | (1,571 | ) | - | (2,458 | ) | 1,012 | ||||||||||||||||
|
Depreciation and amortization
|
135 | 9,434 | 872 | 77 | 6 | 10,524 | ||||||||||||||||||
|
EBITDA (c)
|
$ | 19,254 | $ | 12,091 | $ | 1,406 | $ | 293 | $ | 73 | $ | 33,117 | ||||||||||||
|
Goodwill
|
$ | - | $ | 50,246 | $ | 3,893 | $ | - | $ | - | $ | 54,139 | ||||||||||||
|
Total assets
|
$ | 94,610 | $ | 135,335 | $ | 51,297 | $ | - | $ | 3,709 | $ | 284,951 | ||||||||||||
|
Capital expenditures
|
$ | 1,312 | $ | 4,888 | $ | 174 | $ | - | $ | 3 | $ | 6,377 |
|
(a)
|
Segment information reported above does not include net income (loss) from discontinued operations of $0, $0 and ($57,000) in 2010, 2009 and 2008. Revenue information provided for each segment includes amounts grouped as Interest and other in the accompanying statements of operations.
|
|
(b)
|
Interest expense (income), net includes inter-segment interest income that is eliminated in consolidation.
|
|
(c)
|
T
he Company uses EBITDA (which the Company defines as income before interest expense, net, income taxes and depreciation and amortization) in addition to net income (loss) as a key measure of profit or loss for segment performance and evaluation purposes.
|
57
(21)
SELECTED QUARTERLY FINANCIAL DATA (Unaudited):
|
(In thousands, except per share amounts)
|
||||||||||||||||
|
Quarter Ended
|
||||||||||||||||
|
Year ended April 30, 2010
:
|
July 31,
2009
|
October 31,
2009
|
January 31,
2010
|
April 30,
2010 (a)
|
||||||||||||
|
Revenues
|
$ | 32,457 | $ | 32,333 | $ | 28,916 | $ | 26,792 | ||||||||
|
Gross profit (loss)
|
$ | 2,764 | $ | 3,002 | $ | 1,739 | $ | (2,933 | ) | |||||||
|
Net loss
|
$ | (1,056 | ) | $ | (985 | ) | $ | (721 | ) | $ | (6,718 | ) | ||||
|
Loss per share – basic and diluted
|
$ | (.18 | ) | $ | (.16 | ) | $ | (.12 | ) | $ | (1.12 | ) | ||||
|
Year ended April 30, 2009
:
|
July 31,
2008
|
October 31,
2008
|
January 31,
2009
|
April 30,
2009 (c)
|
||||||||||||
|
Revenues
|
$ | 35,570 | $ | 40,290 | $ | 35,720 | $ | 34,321 | ||||||||
|
Gross profit (loss)
|
$ | 4,201 | $ | 9,443 | $ | 4,131 | $ | (3,893 | ) | |||||||
|
Net income (loss)
|
$ | 71 | $ | 2,895 | $ | (100 | ) | $ | (46,332 | ) | ||||||
|
Earnings (loss) per share – basic and diluted (b)
|
$ | .01 | $ | .48 | $ | (.02 | ) | $ | (7.73 | ) | ||||||
| (a) Includes a pre-tax charge of $2,075 related to the impairment of certain real estate assets ($1,307 after tax, or $0.22 per share), see Note 9. | ||||||||||||||||
| (b) The sum of the quarters does not equal the full year earnings per share due to rounding in 2009. | ||||||||||||||||
| (c) Includes a pre-tax charge of $50,246 related to the impairment of goodwill ($41,557 after tax, or $6.93 per share), see Note 9. | ||||||||||||||||
None
Evaluation of Disclosure Controls and Procedures
The Company’s management, with the participation of the Company’s chief financial officer and the other executive officers whose certifications accompany this annual report, has evaluated the effectiveness of the Company’s disclosure controls and procedures (as defined in Rule 13a-15(e) under the Securities Exchange Act of 1934) as of the end of the period covered by this report. As a result of such evaluation, the chief financial officer and such other executive officers have concluded that such disclosure controls and procedures are effective to provide reasonable assurance that the information required to be disclosed by the Company in the reports the Company files or submits under the Securities Exchange Act of 1934 is (i) recorded, processed, summarized and reported within the time periods specified in the Securities and Exchange Commission’s rules and forms, and (ii) accumulated and communicated to management, including the Company’s principal executive and principal financial officers or persons performing such functions, as appropriate, to allow timely decisions regarding disclosure. The Company believes that a control system, no matter how well designed and operated, cannot provide absolute assurance that the objectives of the control system are met, and no evaluation of controls can provide absolute assurance that all control issues and instances of fraud, if any, within a company have been detected.
The report called for by Item 308T(a) of Regulation S-K is incorporated herein by reference to Management’s Annual Report on Internal Control Over Financial Reporting, included in Part II, “Item 8. Financial Statements and Supplementary Data” of this report.
58
No change in the Company’s system of internal control over financial reporting occurred during the most recent fiscal quarter that has materially affected, or is reasonably likely to materially affect, internal control over financial reporting.
None
Item 10.
Directors, Executive Officers and Corporate Governance
The information set forth under the headings “Election of Directors”, “The Board of Directors and its Committees” and “Section 16(a) Beneficial Ownership Reporting Compliance” in the Company’s Proxy Statement for its 2010 Annual Meeting of Shareholders to be filed with the Securities and Exchange Commission (the “2010 Proxy Statement”) is incorporated herein by reference. In addition, information concerning the Company’s executive officers is included in Part I above under the caption “Executive Officers of the Registrant”.
Item 11.
Executive Compensation
The information set forth under the headings “Compensation of Executive Officers” and “Compensation of Directors” and the subheadings “Report of the Compensation and Human Resources Committee” and “Compensation Committee Interlocks and Insider Participation” in the 2010 Proxy Statement is incorporated herein by reference.
The information set forth under the headings “Common Stock Ownership of Certain Beneficial Owners and Management” and “Equity Compensation Plan Information” in the 2010 Proxy Statement is incorporated herein by reference.
The information set forth under the headings “The Board of Directors and its Committees” and “Certain Transactions” and the subheading “Compensation Committee Interlocks and Insider Participation” in the 2010 Proxy Statement is incorporated herein by reference.
The information set forth under the subheadings “Audit Fees” and “Pre-Approval Policies and Procedures” in the 2010 Proxy Statement is incorporated herein by reference.
59
|
Item 15.
|
Exhibits and Financial Statement Schedules
|
(a) 1.
Financial Statements
. The following consolidated financial statements and supplementary financial information are filed as part of this report:
AMREP Corporation and Subsidiaries:
|
·
|
Management’s Annual Report on Internal Control Over Financial Reporting
|
|
·
|
Report of Independent Registered Public Accounting Firm dated July 21, 2010 – McGladrey & Pullen, LLP
|
|
·
|
Consolidated Balance Sheets - April 30, 2010 and 2009
|
|
·
|
Consolidated Statements of Operations for the Three Years Ended April 30, 2010
|
|
·
|
Consolidated Statements of Shareholders' Equity for the Three Years Ended April 30, 2010
|
|
·
|
Consolidated Statements of Cash Flows for the Three Years Ended April 30, 2010
|
|
·
|
Notes to Consolidated Financial Statements
|
2
.
Financial Statement Schedules
. The following financial statement schedule is filed as part of this report:
AMREP Corporation and Subsidiaries:
·
Schedule II - Valuation and Qualifying Accounts
Financial statement schedules not included in this annual report on Form 10-K have been omitted because they are not applicable or the required information is shown in the financial statements or notes thereto.
3.
Exhibits
.
The exhibits filed in this report are listed in the Exhibit Index.
(b)
Exhibits
. See (a)3 above.
(c)
Financial Statement Schedules
. See (a)2 above.
60
SIGNATURES
Pursuant to the requirements of Section 13 or 15(d) of the Securities Exchange Act of 1934, the Registrant has duly caused this report to be signed on its behalf by the undersigned, thereunto duly authorized.
| AMREP CORPORATION | |
| (Registrant) | |
| Dated: July 21, 2010 | |
|
By: /s/ Peter M. Pizza
|
|
|
Peter M. Pizza
|
|
|
Vice President and
|
|
|
Chief Financial Officer
|
Pursuant to the requirements of the Securities Exchange Act of 1934, this report has been signed below by the following persons on behalf of the Registrant and in the capacities and on the dates indicated.
|
/s/ Peter M. Pizza
|
/s/ Albert V. Russo
|
||
|
Peter M. Pizza
|
Albert V. Russo
|
||
|
Vice President and Chief Financial Officer
|
Director
|
||
|
Principal Financial Officer
|
Dated: July 21, 2010
|
||
|
and Principal Accounting Officer*
|
|||
|
Dated: July 21, 2010
|
|||
|
|
|||
|
/s/ Edward B. Cloues, II
|
/s/ Samuel N. Seidman
|
||
|
Edward B. Cloues, II
|
Samuel N. Seidman
|
||
|
Director
|
Director
|
||
|
Dated: July 21, 2010
|
Dated: July 21, 2010
|
||
|
/s/ Lonnie A. Coombs
|
/s/ James Wall
|
||
|
Lonnie A. Coombs
|
James Wall
|
||
|
Director
|
Director*
|
||
|
Dated: July 21, 2010
|
Dated: July 21, 2010
|
||
|
|
|||
|
/s/ Nicholas G. Karabots
|
/s/ Jonathan B. Weller
|
||
|
Nicholas G. Karabots
|
Jonathan B. Weller
|
||
|
Director
|
Director
|
||
|
Dated: July 21, 2010
|
Dated: July 21, 2010
|
||
|
/s/ Michael P. Duloc
|
|||
|
Michael P. Duloc
|
|||
|
President, Kable Media Services, Inc.*
|
|||
|
Dated: July 21, 2010
|
|||
_______________________
*
The Registrant is a holding company which does substantially all of its business through two indirect wholly-owned subsidiaries (and their subsidiaries). Those indirect wholly-owned subsidiaries are AMREP Southwest Inc. (“ASW”) and Kable Media Services, Inc. (“Kable”). James Wall is the principal executive officer of ASW, and Michael P. Duloc is the principal executive officer of Kable. The Registrant has no chief executive officer. Its executive officers include James Wall, Senior Vice President and Peter M. Pizza, Vice President and Chief Financial Officer, and Michael P. Duloc, who may be deemed an executive officer by reason of his position with Kable.
61
AMREP CORPORATION AND SUBSIDIARIES
SCHEDULE II - VALUATION AND QUALIFYING ACCOUNTS
(Thousands)
|
Additions
|
||||||||||||||||
|
Charges
|
Charged
|
|||||||||||||||
|
Balance at
|
(Credits) to
|
(Credited) to
|
||||||||||||||
|
Beginning
|
Costs and
|
Other
|
Balance at End
|
|||||||||||||
|
Period
|
Expenses
|
Accounts
|
Deductions
|
of Period
|
||||||||||||
|
FOR THE YEAR ENDED
|
||||||||||||||||
|
APRIL 30, 2010:
|
||||||||||||||||
|
Allowance for doubtful accounts (included in receivables - real estate operations on the consolidated balance sheet)
|
||||||||||||||||
|
$
|
90
|
$
|
-
|
$
|
-
|
$
|
19
|
$
|
71
|
|||||||
|
Allowance for estimated returns and doubtful accounts (included in receivables - media services operations on the consolidated balance sheet)
|
||||||||||||||||
|
$
|
56,137
|
$
|
(7,105)
|
$
|
-
|
$
|
195
|
$
|
48,837
|
|||||||
|
FOR THE YEAR ENDED
|
||||||||||||||||
|
APRIL 30, 2009:
|
||||||||||||||||
|
Allowance for doubtful accounts (included in receivables - real estate operations on the consolidated balance sheet)
|
||||||||||||||||
|
$
|
112
|
$
|
-
|
$
|
-
|
$
|
22
|
$
|
90
|
|||||||
|
Allowance for estimated returns and doubtful accounts (included in receivables - media services operations on the consolidated balance sheet)
|
||||||||||||||||
|
$
|
56,585
|
$
|
(264)
|
$
|
-
|
$
|
184
|
$
|
56,137
|
|||||||
|
FOR THE YEAR ENDED
|
||||||||||||||||
|
APRIL 30, 2008:
|
||||||||||||||||
|
Allowance for doubtful accounts (included in receivables - real estate operations on the consolidated balance sheet)
|
||||||||||||||||
|
$
|
48
|
$
|
64
|
$
|
-
|
$
|
-
|
$
|
112
|
|||||||
|
Allowance for estimated returns and doubtful accounts (included in receivables – media services operations on the consolidated balance sheet)
|
||||||||||||||||
|
$
|
53,606
|
$
|
3,521
|
$
|
-
|
$
|
542
|
$
|
56,585
|
|||||||
Note: Charges (credits) recorded in media services operations include a reserve for the estimate of magazine returns from wholesalers, which are substantially offset by offsetting credits related to the return of these magazines to publishers.
62
EXHIBIT INDEX
|
NUMBER
|
ITEM
|
||
| 2.1 |
Agreement and Plan of Merger by and among AMREP Corporation, Kable Media Services, Inc., Glen Garry Acquisition, Inc., Palm Coast Data Holdco, Inc., Palm Coast Data LLC and the Sellers set forth on the signature page thereto, dated as of November 7, 2006 - Incorporated by reference to Exhibit 2.1 to Registrant’s Current Report on Form 8-K filed January 19, 2007.
|
||
| 3.1 |
Certificate of Incorporation, as amended - Incorporated by reference to Exhibit 3.1 to Registrant's Registration Statement on Form S-3 filed March 21, 2007.
|
||
| 3.2 |
By-Laws, as amended- Incorporated by reference to Exhibit 3(b) to Registrant's Quarterly Report on Form 10-Q filed December 14, 2006.
|
||
| 4.1 |
Second Amended and Restated Loan and Security Agreement dated as of January 16, 2007 among Kable Media Services, Inc., Kable News Company, Inc., Kable Distribution Services, Inc., Kable News Export, Ltd., Kable News International, Inc., Kable Fulfillment Services, Inc., Kable Fulfillment Services of Ohio, Inc., Palm Coast Data Holdco, Inc. and Palm Coast Data LLC and LaSalle Bank National Association - Incorporated by reference to Exhibit 10.1 to Registrant's Current Report on Form 8-K filed January 19, 2007.
|
||
| 4.2 |
First Modification to Loan Documents dated as of January 18, 2008, modifying the Second Amended and Restated Loan and Security Agreement dated as of January 16, 2007 among Kable News Company, Inc., Kable Distribution Services, Inc., Kable News Export, Ltd., Kable News International, Inc., Kable Fulfillment Services, Inc., Kable Fulfillment Services of Ohio, Inc., Palm Coast Data Holdco, Inc. and Palm Coast Data LLC, and LaSalle Bank National Association and related loan documents - Incorporated by reference to Exhibit 10.1 to Registrant's Current Report on Form 8-K filed February 5, 2008.
|
||
| 4.3 |
Second Modification to Loan Documents dated effective as of October 1, 2008, modifying the Second Amended and Restated Loan and Security Agreement dated as of January 16, 2007 among Kable News Company, Inc., Kable Distribution Services, Inc., Kable News Export, Ltd., Kable News International, Inc., Kable Fulfillment Services, Inc., Kable Fulfillment Services of Ohio, Inc., Palm Coast Data Holdco, Inc. and Palm Coast Data LLC, and LaSalle Bank National Association and related loan documents as the same were amended by the First Modification to Loan Documents - Incorporated by reference to Exhibit 10.1 to Registrant's Current Report on Form 8-K filed November 13, 2008.
|
||
| 4.4 |
Third Modification to Loan Documents dated effective as of April 27, 2009, modifying the Second Amended and Restated Loan and Security Agreement dated as of January 16, 2007 among Kable News Company, Inc., Kable Distribution Services, Inc., Kable News Export, Ltd., Kable News International, Inc., Kable Fulfillment Services, Inc., Kable Fulfillment Services of Ohio, Inc., Palm Coast Data Holdco, Inc. and Palm Coast Data LLC, and LaSalle Bank National Association and related loan documents as the same were amended by the First Modification to Loan Documents and the Second Modification to Loan Documents – Incorporated by reference to Exhibit 4.4 to the Registrant’s Annual Report on Form 10-K filed July 14, 2009.
|
||
| 4.5 |
Third Amended and Restated Loan and Security Agreement dated as of July 13, 2009, by and among Kable Media Services, Inc., Kable News Company, Inc., Kable Distribution Services, Inc., Kable News International, Inc., Kable Fulfillment Services, Inc., Palm Coast Data Holdco, Inc., Palm Coast Data LLC, Kable Product Services, Inc., Kable Specialty Packaging Services LLC, and Kable Staffing Resources LLC and Bank of America, N.A., as successor by merger with LaSalle Bank National Association – Incorporated by reference to Exhibit 10.1 to Registrant’s Current Report on Form 8-K filed July 14, 2009.
|
||
| 4.6 |
Revolving Credit and Security Agreement dated as of May 13, 2010, by and among Kable Media Services, Inc., Kable Distribution Services, Inc., Kable Product Services, Inc., Kable News Company, Inc., Palm Coast Data Holdco, Inc., Kable Staffing Resources LLC, Kable Specialty Packaging Services LLC, Kable News International, Inc., Kable Fulfillment Services, Inc., and Palm Coast Data LLC, and PNC Bank, National Association, as Agent and Lender – Incorporated by reference to Exhibit 10.1 to Registrant’s Current Report on Form 8-K filed May 18, 2010.
|
||
63
| 4.7 |
Loan Agreement dated January 8, 2007 between AMREP Southwest Inc. and Compass Bank - Incorporated by reference to Exhibit 10.1 to Registrant's Current Report on Form 8-K filed January 12, 2007.
|
||
| 4.8 |
$25,000,000 Promissory Note (Revolving Line of Credit) dated September 18, 2006 of AMREP Southwest Inc. payable to the order of Compass Bank - Incorporated by reference to Exhibit 10.2 to the Registrant's Current Report on Form 8-K filed September 21, 2006.
|
||
| 4.9 |
Loan Agreement dated December 17, 2009 between AMREP Southwest Inc. and Compass Bank – Incorporated by reference to Exhibit 10.1 to Registrant’s Current Report on Form 8-K filed December 22, 2009.
|
||
| 4.10 |
$22,500,000 Promissory Note dated December 17, 2009 of AMREP Southwest Inc. payable to the order of Compass Bank – Incorporated by reference to Exhibit 10.2 to Registrant’s Current Report on Form 8-K filed December 22, 2009.
|
||
| 10.1 |
Non-Employee Directors Option Plan, as amended - Incorporated by reference to Exhibit 10(i) to Registrant's Annual Report on Form 10-K for the fiscal year ended April 30, 1997.*
|
||
| 10.2 |
Amended and Restated Distribution Agreement dated as of July 1, 2008 between Kappa Publishing Group, Inc. and Kable Distribution Services, Inc. – Incorporated by reference to Exhibit 10.1 to the Registrant’s Quarterly Report on Form 10-Q filed March 12, 2009.**
|
||
| 10.3 |
2006 Equity Compensation Plan – Incorporated by reference to Appendix B to the Registrant’s Proxy Statement for its 2006 Annual Meeting of Shareholders forming a part of Registrant’s Definitive Schedule 14A filed August 14, 2006.*
|
||
| 21 |
Subsidiaries of Registrant – Filed herewith.
|
||
| 23 |
Consent of McGladrey & Pullen, LLP - Filed herewith.
|
||
| 31.1 |
Certification required by Rule 13a - 14 (a) under the Securities Exchange Act of 1934 - Filed herewith.
|
||
| 31.2 |
Certification required by Rule 13a - 14 (a) under the Securities Exchange Act of 1934 - Filed herewith.
|
||
| 31.3 |
Certification required by Rule 13a - 14 (a) under the Securities Exchange Act of 1934 - Filed herewith.
|
||
| 32.1 |
Certification required by Rule 13a - 14 (b) under the Securities Exchange Act of 1934 - Filed herewith.
|
_______________________
* Management contract or compensatory plan or arrangement in which directors or officers participate.
** Portions of this exhibit have been omitted pursuant to a request for confidential treatment under Rule 24b-2 under the Securities Exchange Act of 1934.
64
TABLE OF CONTENTS
Part IItem 1. BusinessItem 1A. Risk FactorsItem 1B. Unresolved Staff CommentsItem 2. PropertiesItem 3. Legal ProceedingsItem 4. [reserved]Part IIItem 5. Market For Registrant's Common Equity, Related Stockholder Matters and Issuer Purchases Of EquityItem 6. Selected Financial DataItem 7. Management S Discussion and Analysis Of Financial Condition and Results Of OperationsItem 7A. Quantitative and Qualitative Disclosures About Market RiskItem 8. Financial Statements and Supplementary DataItem 9. Changes in and Disagreements with Accountants on Accounting and Financial DisclosureItem 9. Changes in and Disagreements with Accountants on AccountingItem 9a(t). Controls and ProceduresItem 9a(t)Item 9B. Other InformationPart IIIItem 10. Directors, Executive Officers and Corporate GovernanceItem 11. Executive CompensationItem 12. Security Ownership Of Certain Beneficial Owners and Management and Related Stockholder MattersItem 13. Certain Relationships and Related Transactions, and Director IndependenceItem 14. Principal Accounting Fees and ServicesPart IVItem 15. Exhibits and Financial Statement Schedules