AXIS CAPITAL HOLDINGS LTD
10-Ks and 10-Qs
|
|
|
|
|
|
|
|
|
|
|
|
|
|
|
|
|
|
|
|
|
|
|
|
|
|
|
|
|
|
|
|
|
|
|
|
|
|
|
|
|
|
|
|
|
|
|
|
|
|
|
|
|
|
|
|
UNITED STATES
SECURITIES AND EXCHANGE COMMISSION
Washington, D.C. 20549
FORM 10-K
ý
ANNUAL REPORT PURSUANT TO SECTION 13 OR 15(d)
OF THE SECURITIES EXCHANGE ACT OF 1934
For the fiscal year ended
December 31, 2014
OR
¨
TRANSITION REPORT PURSUANT TO SECTION 13 OR 15(d)
OF THE SECURITIES EXCHANGE ACT OF 1934
For the transition period from to
Commission file number 001-31721
AXIS CAPITAL HOLDINGS LIMITED
(Exact name of registrant as specified in its charter)
BERMUDA
(State or other jurisdiction of incorporation or organization)
98-0395986
(I.R.S. Employer Identification No.)
92 Pitts Bay Road, Pembroke, Bermuda HM 08
(Address of principal executive offices and zip code)
(441) 496-2600
(Registrant’s telephone number, including area code)
Securities registered pursuant to Section 12(b) of the Act:
|
Title of each class
|
|
Name of each exchange on which registered
|
|
Common shares, par value $0.0125 per share
|
New York Stock Exchange
|
|
|
6.875% Series C preferred shares
|
New York Stock Exchange
|
|
|
5.50% Series D preferred shares
|
New York Stock Exchange
|
|
Securities registered pursuant to Section 12(g) of the Act:
None
Indicate by check mark if the registrant is a well-known seasoned issuer, as defined in Rule 405 of the Securities Act. Yes
ý
No
¨
Indicate by check mark if the registrant is not required to file reports pursuant to Section 13 or Section 15(d) of the Act. Yes
¨
No
ý
Indicate by check mark whether the registrant (1) has filed all reports required to be filed by Section 13 or 15(d) of the Securities Exchange Act of 1934 during the preceding 12 months (or for such shorter period that the registrant was required to file such reports), and (2) has been subject to such filing requirements for the past 90 days. Yes
ý
No
¨
Indicate by check mark whether the registrant has submitted electronically and posted on its corporate Web site, if any, every Interactive Data File required to be submitted and posted pursuant to Rule 405 of Regulation S-T (§232.405 of this chapter) during the preceding 12 months (or for such shorter period that the registrant was required to submit and post such files). Yes
ý
No
¨
Indicate by check mark if disclosure of delinquent filers pursuant to Item 405 of Regulation S-K (§229.405) is not contained herein, and will not be contained, to the best of registrant’s knowledge, in definitive proxy or information statements incorporated by reference in Part III of this Form 10-K or any amendment to this Form 10-K.
ý
Indicate by check mark whether the registrant is a large accelerated filer, an accelerated filer, a non-accelerated filer, or a smaller reporting company. See the definitions of “large accelerated filer”, “accelerated filer” and “smaller reporting company” in Rule 12b-2 of the Exchange Act.
|
Large accelerated filer
|
ý
Accelerated filer
¨
|
|
Non-accelerated filer
|
¨
(Do not check if a smaller reporting company) Smaller reporting company
¨
|
Indicate by check mark whether the registrant is a shell company (as defined in Rule 12b-2 of the Exchange Act). Yes
¨
No
ý
The aggregate market value of the voting and non-voting common equity held by non-affiliates of the registrant, computed by reference to the closing price as of the last business day of the registrant’s most recently completed second fiscal quarter,
June 30,
2014
, was approximately
$4.6 billion
.
As of
February 11,
2015
, there were outstanding
100,838,704
common shares,
$0.0125
par value per share, of the registrant.
AXIS CAPITAL HOLDINGS LIMITED
TABLE OF CONTENTS
|
|
|
Page
|
|
|
PART I
|
|
|
Item 1.
|
||
|
Item 1A.
|
||
|
Item 1B.
|
||
|
Item 2.
|
||
|
Item 3.
|
||
|
Item 4.
|
||
|
PART II
|
||
|
Item 5.
|
||
|
Item 6.
|
||
|
Item 7.
|
||
|
Item 7A.
|
||
|
Item 8.
|
||
|
Item 9.
|
||
|
Item 9A.
|
||
|
Item 9B.
|
||
|
PART III
|
||
|
Item 10.
|
||
|
Item 11.
|
||
|
Item 12.
|
||
|
Item 13.
|
||
|
Item 14.
|
||
|
PART IV
|
||
|
Item 15.
|
||
Cautionary Statement Regarding Forward-Looking Statements
This Annual Report on Form 10-K contains forward-looking statements within the meaning of section 27A of the Securities Act of 1933 and section 21E of the Securities Exchange Act of 1934. We intend these forward-looking statements to be covered by the safe harbor provisions for forward-looking statements in the United States securities laws. In some cases, these statements can be identified by the use of forward-looking words such as “may”, “should”, “could”, “anticipate”, “estimate”, “expect”, “plan”, “believe”, “predict”, “potential” and “intend”. Forward-looking statements contained in this report may include information regarding our estimates of losses related to catastrophes and other large losses, measurements of potential losses in the fair value of our investment portfolio and derivative contracts, our expectations regarding pricing and other market conditions, our growth prospects, and valuations of the potential impact of movements in interest rates, equity prices, credit spreads and foreign currency rates. Forward-looking statements only reflect our expectations and are not guarantees of performance.
These statements involve risks, uncertainties and assumptions. Accordingly, there are or will be important factors that could cause actual results to differ materially from those indicated in such statements. We believe that these factors include, but are not limited to, those described under Item 1A,
'Risk Factors'
in this report, as those factors may be updated from time to time in our periodic filings with the Securities and Exchange Commission (the "SEC"), which are accessible on the SEC's website at
http://www.sec.gov.
We undertake no obligation to update or revise publicly any forward-looking statements, whether as a result of new information, future events or otherwise.
1
|
ITEM 1.
|
BUSINESS
|
As used in this report, references to “we,” “us,” “our” or the “Company” refer to the consolidated operations of AXIS Capital Holdings Limited (“AXIS Capital”) and its direct and indirect subsidiaries and branches, including AXIS Specialty Limited (“AXIS Specialty Bermuda”), AXIS Specialty Limited (Singapore Branch), AXIS Specialty Markets Limited, AXIS Specialty Markets II Limited, AXIS Ventures Reinsurance Limited ("Ventures Re"), AXIS Specialty Europe SE (“AXIS Specialty Europe”), AXIS Specialty London, AXIS Specialty Australia, AXIS Specialty Insurance Company (“AXIS Specialty U.S.”), AXIS Re SE (“AXIS Re SE”), AXIS Reinsurance Company (“AXIS Re U.S.”), AXIS Reinsurance Company (Canadian Branch), AXIS Surplus Insurance Company (“AXIS Surplus”), AXIS Insurance Company (“AXIS Insurance Co.”), AXIS Re Europe, AXIS Specialty Finance LLC, AXIS Specialty Finance PLC and Dexta Corporation Pty Ltd (“Dexta”) unless the context suggests otherwise. Tabular dollars are in thousands. Amounts in tables may not reconcile due to rounding differences.
On January 25, 2015, the Company announced the signing of a definitive amalgamation agreement with PartnerRe Ltd. PartnerRe Ltd., through its principal operating subsidiaries, provides reinsurance and certain specialty insurance lines on a worldwide basis. The transaction is expected to close in the second half of 2015, subject to approval by the shareholders of both companies, regulatory clearance and customary closing conditions.
GENERAL
AXIS Capital is the Bermuda-based holding company for the AXIS group of companies and was incorporated on December 9, 2002. AXIS Specialty Bermuda commenced operations on November 20, 2001. AXIS Specialty Bermuda and its subsidiaries became wholly owned subsidiaries of AXIS Capital pursuant to an exchange offer consummated on December 31, 2002. We provide a broad range of specialty (re)insurance on a worldwide basis, through operating subsidiaries and branch networks based in Bermuda, the United States, Canada, Europe, Australia and Singapore. We also maintain marketing offices in Brazil, France and Spain. Our business consists of two distinct global underwriting platforms, AXIS Insurance and AXIS Re.
The markets in which we operate have historically been cyclical. During periods of excess underwriting capacity, as defined by availability of capital, competition can result in lower pricing and less favorable policy terms and conditions for (re)insurers. During periods of reduced underwriting capacity, pricing and policy terms and conditions are generally more favorable for (re)insurers. Historically, underwriting capacity has been impacted by several factors, including industry losses, catastrophes, changes in legal and regulatory guidelines, investment results and the ratings and financial strength of competitors.
At December 31,
2014
, we had common shareholders’ equity of
$5.2 billion
, total capital of
$6.8 billion
and total assets of
$20.0 billion
.
OUR BUSINESS STRATEGY
We are a global insurer and reinsurer, with our mission being to provide our clients and distribution partners with a broad range of risk transfer products and services and meaningful capacity, backed by excellent financial strength. We manage our portfolio holistically, aiming to construct the optimum consolidated portfolio of funded and unfunded risks, consistent with our risk appetite and the development of our franchise. We nurture an ethical, entrepreneurial and disciplined culture that promotes outstanding client service, intelligent risk taking and the achievement of superior risk-adjusted returns for our shareholders. We believe that the achievement of our objectives will position us as a leading global, diversified specialty insurance and reinsurance company, as measured by quality, sustainability and profitability.
We aim to execute on the following six-point strategy:
We offer a diversified range of products and services across market segments and geographies:
Our position as a well-balanced hybrid insurance and reinsurance company gives us insight into the opportunities and challenges in a variety of
2
markets. With our origins in Bermuda, today we have locations across the U.S. and in Canada, while in Europe we have offices in Dublin, London, Zurich, Barcelona, Madrid and Paris. We are addressing opportunities throughout Latin America and have a reinsurance office in Sao Paulo. We also operate a number of offices in Australia and our Singapore branch serves as our gateway to Asia.
We underwrite a balanced portfolio of risks, including complex and volatile lines,
moderating overall volatility with risk limits, diversification and risk management:
Risk management is a strategic priority embedded in our organizational structure and we are continuously monitoring, reviewing and refining our enterprise risk management practices. We combine judgment and experience with data-driven analysis, enhancing our overall risk selection process.
We modulate our risk appetite and deployment of capital across the underwriting cycle, commensurate with available market opportunities and returns:
Closely attuned to market dynamics, we recognize opportunities as they develop and react quickly as new trends emerge. Our risk analytics provide important and continuous feedback, further assisting with the ongoing assessment of our risk appetite and strategic capital deployment. We have been successful in extending our product lines, finding new distribution channels and entering new geographies. When we do not find sufficiently attractive uses for our capital, we return excess capital back to our shareholders through share repurchases or dividends.
We develop and maintain deep and trustful relationships with clients and distribution partners, offering high-levels of service and effective solutions for risk management needs:
Our management team has extensive industry experience, deep product knowledge and long-standing market relationships. We primarily transact in specialty markets, where risks are complex. Our intellectual capital and proven client-service capability attract clients and distribution partners looking for solutions.
We maintain excellent financial strength, characterized by financial discipline and transparency:
Our total capital of
$6.8 billion
at December 31,
2014
, our high-quality and liquid investment portfolio and our operating subsidiary ratings of "A+" ("Strong") by Standard & Poor's and "A+" ("Superior") by A.M. Best are key indicators of our financial strength.
We attract, develop, retain and motivate an excellent team:
We aim to attract and retain the best people in the industry and to motivate our employees to make decisions that are in the best interest of both our customers and shareholders. We nurture an ethical, risk-aware, achievement-oriented culture that promotes professionalism, responsibility, integrity, discipline and entrepreneurialism. As a result, we believe that our staff is well-positioned to make the best underwriting and strategic decisions for the Company.
Our key metrics for performance measurement include return on average common equity ("ROACE") and diluted book value per common share adjusted for dividends. We recognize that the nature of underwriting cycles and the frequency or severity of large loss events in any one year may make it difficult to achieve a profitability target in any specific period and, therefore, we set a ROACE target of 15% over the full underwriting cycle.
SEGMENT INFORMATION
Our underwriting operations are organized around two global underwriting platforms, AXIS Insurance and AXIS Re. Therefore we have
two
reportable segments, insurance and reinsurance. We do not allocate our assets by segment, with the exception of goodwill and intangible assets, as we evaluate the underwriting results of each segment separately from the results of our investment portfolio. For additional information relating to our reportable segments, see Note 3 to our Consolidated Financial Statements presented under Item 8, ‘
Financial Statements and Supplementary Data’
and
‘Management’s Discussion and Analysis of Financial Condition and Results of Operations’
under Item 7.
The table below presents gross premiums written in each of our reportable segments for each of the most recent three years.
|
Year ended December 31,
|
2014
|
2013
|
2012
|
||||||||||
|
Insurance
|
$
|
2,535,415
|
|
$
|
2,559,138
|
|
$
|
2,309,481
|
|
||||
|
Reinsurance
|
2,176,104
|
|
2,137,903
|
|
1,830,162
|
|
|||||||
|
Total
|
$
|
4,711,519
|
|
$
|
4,697,041
|
|
$
|
4,139,643
|
|
||||
3
Insurance Segment
Lines of Business and Distribution
Our insurance segment operates through offices in Bermuda, the United States, Canada, Europe, Australia and Singapore and offers specialty insurance products to a variety of niche markets on a worldwide basis. The following are the lines of business in our insurance segment:
|
•
|
Property
: provides physical loss or damage, business interruption and machinery breakdown coverage for virtually all types of property, including commercial buildings, residential premises, construction projects and onshore energy installations. This line of business consists of both primary and excess risks, some of which are catastrophe-exposed.
|
|
•
|
Marine
: provides coverage for traditional marine classes, including offshore energy, cargo, liability, recreational marine, fine art, specie, hull and war. Offshore energy coverage includes physical damage, business interruption, operators extra expense and liability coverage for all aspects of offshore upstream energy, from exploration and construction through the operation and distribution phases.
|
|
•
|
Terrorism
: provides coverage for physical damage and business interruption of an insured following an act of terrorism.
|
|
•
|
Aviation
: provides hull and liability and specific war coverage primarily for passenger airlines but also for cargo operations, general aviation operations, airports, aviation authorities, security firms and product manufacturers.
|
|
•
|
Credit and political risk:
provides credit and political risk insurance products for banks and corporations. Coverage is provided for a range of risks including sovereign default, credit default, political violence, currency inconvertibility and non-transfer, expropriation, aircraft non-repossession and contract frustration due to political events. The credit insurance coverage is primarily for lenders seeking to mitigate the risk of non-payment from their borrowers in emerging markets. For the credit insurance contracts, it is necessary for the buyer of the insurance (most often a bank) to hold an insured asset (most often an underlying loan) in order to claim compensation under the insurance contract.
|
|
•
|
Professional lines
: provides coverage for directors’ and officers’ liability, errors and omissions liability, employment practices liability, fiduciary liability, crime, professional indemnity, medical malpractice and other financial insurance related coverages for commercial enterprises, financial institutions and not-for-profit organizations. This business is predominantly written on a claims-made basis.
|
|
•
|
Liability:
primarily targets primary and low/mid-level excess and umbrella commercial liability risks in the U.S. wholesale and retail markets. Target industry sectors include construction, manufacturing, transportation and trucking and other services. We also target middle to high excess liability business in the London and Bermuda wholesale markets and primary and excess business in the Canadian marketplace.
|
|
•
|
Accident and health:
includes accidental death, travel insurance and specialty health products for employer and affinity groups, as well as accident and health reinsurance for catastrophic or per life events on a quota share and/or excess of loss basis, with aggregate and/or per person deductibles.
|
We produce business primarily through wholesale and retail brokers worldwide. Some of our insurance products are also distributed through managing general agents ("MGAs") and underwriters ("MGUs"). In the U.S., we have the ability to write business on an admitted basis using forms and rates as filed with state insurance regulators and on a non-admitted, or surplus lines, basis providing flexibility in forms and rates, as these are not filed with state regulators. Having non-admitted capability in the U.S. provides the pricing flexibility needed to write non-standard coverages. Substantially all of our insurance business is subject to aggregate limits, in addition to event limits.
4
Gross premiums written by broker, shown individually where premiums were 10% or more of the total in any of the last three years, were as follows:
|
Year ended December 31,
|
2014
|
2013
|
2012
|
|||||||||||||||||||
|
Marsh
|
$
|
437,092
|
|
17
|
%
|
$
|
422,627
|
|
17
|
%
|
$
|
427,565
|
|
19
|
%
|
|||||||
|
Aon
|
354,681
|
|
14
|
%
|
451,158
|
|
18
|
%
|
413,471
|
|
18
|
%
|
||||||||||
|
Willis
|
265,075
|
|
10
|
%
|
223,131
|
|
9
|
%
|
217,631
|
|
9
|
%
|
||||||||||
|
Other brokers
|
1,235,986
|
|
49
|
%
|
1,230,165
|
|
48
|
%
|
1,060,864
|
|
46
|
%
|
||||||||||
|
Managing general agencies and underwriters
|
242,581
|
|
10
|
%
|
232,057
|
|
8
|
%
|
189,950
|
|
8
|
%
|
||||||||||
|
Total
|
$
|
2,535,415
|
|
100
|
%
|
$
|
2,559,138
|
|
100
|
%
|
$
|
2,309,481
|
|
100
|
%
|
|||||||
No customer accounted for more than 10% of the gross premiums written in the insurance segment.
Competitive Environment
We operate in highly competitive markets. In our insurance segment, where competition is focused on price as well as availability, service and other considerations, we compete with U.S.-based companies with global insurance operations, as well as non-U.S. global carriers and indigenous companies in regional and local markets. We believe we achieve a competitive advantage through a strong capital position and the strategic and operational linking of our practices, which allows us to design insurance programs on a global basis in alignment with the global needs of many of our clients.
Reinsurance Segment
Lines of Business and Distribution
Our reinsurance segment operates through offices in Bermuda, the United States, Switzerland, Singapore, Brazil, and Canada. We write business on an excess of loss basis, whereby we typically provide an indemnification to the reinsured entity for a portion of losses, both individually and in the aggregate, in excess of a specified individual or aggregate loss deductible. We also write business on a proportional basis, receiving an agreed percentage of the underlying premium and accepting liability for the same percentage of incurred losses. Our business is written on a treaty basis and primarily produced through reinsurance brokers worldwide.
Our reinsurance segment provides non-life reinsurance to insurance companies on a worldwide basis. The following are the lines of business in our reinsurance segment:
|
•
|
Catastrophe:
provides protection for most catastrophic losses that are covered in the underlying insurance policies written by our cedants. The exposure in the underlying policies is principally property exposure but also covers other exposures including workers compensation and personal accident. The principal perils in this portfolio are hurricane and windstorm, earthquake, flood, tornado, hail and fire. In some instances, terrorism may be a covered peril or the only peril. We underwrite catastrophe reinsurance principally on an excess of loss basis.
|
|
•
|
Property:
provides coverage for property damage and related losses resulting from natural and man-made perils contained in underlying personal and commercial policies. While our predominant exposure is to property damage, other risks, including business interruption and other non-property losses, may also be covered when arising from a covered peril. While our most significant exposures typically relate to losses from windstorms, tornadoes and earthquakes, we are exposed to other perils such as freezes, riots, floods, industrial explosions, fires, hail and a number of other loss events. We assume business on both a proportional and excess of loss basis.
|
|
•
|
Professional Lines:
covers directors' and officers' liability, employment practices liability, medical malpractice, professional indemnity, environmental liability and miscellaneous errors and omissions insurance risks. The underlying business is predominantly written on a claims-made basis. Business is written on both a proportional and excess of loss basis.
|
5
|
•
|
Credit and Surety:
consists of reinsurance of trade credit insurance products and includes both proportional and excess of loss structures. The underlying insurance indemnifies sellers of goods and services in the event of a payment default by the buyer of those goods and services. Also included in this line of business is coverage for losses arising from a broad array of surety bonds issued by insurers to satisfy regulatory demands or contract obligation in a variety of jurisdictions around the world. Bonding is also known as surety insurance.
|
|
•
|
Motor:
provides coverage to cedants for motor liability and property damage losses arising out of any one occurrence. The occurrence can involve one or many claimants where the ceding insurer aggregates the claims from the occurrence.
|
|
•
|
Liability:
provides coverage to insurers of standard casualty business, excess and surplus casualty business and specialty casualty programs. The primary focus of the underlying business is general liability, although workers compensation and auto liability are also written.
|
|
•
|
Engineering:
provides coverage for all types of construction risks and risks associated with erection, testing and commissioning of machinery and plants during the construction stage. This line of business also includes coverage for losses arising from operational failures of machinery, plant and equipment and electronic equipment as well as business interruption.
|
|
•
|
Agriculture:
provides coverage for risks associated with the production of food and fiber on a global basis for primary insurance companies writing multi-peril crop insurance, crop hail, and named peril covers, as well as custom risk transfer mechanisms for agricultural dependent industries with exposures to crop yield and/or price deviations. We provide both proportional and aggregate stop loss reinsurance.
|
|
•
|
Other:
includes aviation, marine, and personal accident reinsurance.
|
The reinsurance segment also writes, primarily derivative based, risk management products designed to address weather and commodity price risks. The majority of these contracts cover the risk of variations in quantifiable weather-related phenomenon, such as temperature. In general, the portfolio of such derivatives is of short duration, with contracts being predominately seasonal in nature.
Gross premiums written by broker, shown individually where premiums were 10% or more of the total in any of the last three years, were as follows:
|
Year ended December 31,
|
2014
|
2013
|
2012
|
|||||||||||||||||||
|
Aon
|
$
|
687,458
|
|
32
|
%
|
$
|
749,751
|
|
35
|
%
|
$
|
712,588
|
|
39
|
%
|
|||||||
|
Marsh
|
591,412
|
|
27
|
%
|
643,292
|
|
30
|
%
|
468,993
|
|
26
|
%
|
||||||||||
|
Willis
|
298,628
|
|
14
|
%
|
339,761
|
|
16
|
%
|
299,097
|
|
16
|
%
|
||||||||||
|
Other brokers
|
376,712
|
|
17
|
%
|
271,458
|
|
13
|
%
|
212,941
|
|
12
|
%
|
||||||||||
|
Direct
|
221,894
|
|
10
|
%
|
133,641
|
|
6
|
%
|
136,543
|
|
7
|
%
|
||||||||||
|
Total
|
$
|
2,176,104
|
|
100
|
%
|
$
|
2,137,903
|
|
100
|
%
|
$
|
1,830,162
|
|
100
|
%
|
|||||||
No customer accounted for more than 10% of the gross premiums written in the reinsurance segment.
Competitive Environment
In our reinsurance segment where competition tends to be focused on availability, service, financial strength and, increasingly, price, we compete with major U.S. and non-U.S. reinsurers as well as reinsurance departments of numerous multi-line insurance organizations. In addition to traditional market participants, we also compete with new market entrants supported by alternative capital sources which offer forms of risk transfer protection on a collateralized or other non-traditional basis. Our clients may also acquire reinsurance protection through capital market products such as catastrophe bonds and insurance loss warranties. We believe that we achieve a competitive advantage through our strong capital position, as well as our technical expertise that allows us to respond quickly to customer needs and provide quality and innovative underwriting solutions. In addition, our customers highly value our exemplary service (including excellent claims management, promptly paying valid claims) and financial strength ratings.
6
RESERVE FOR UNPAID LOSSES AND LOSS EXPENSES
We establish a reserve for losses and loss expenses (“loss reserves”) for claims that arise from our (re)insurance products. These loss reserves are balance sheet liabilities representing management’s best estimate of the amounts we will be required to pay in the future for claims that have occurred on or before the balance sheet date, whether already reported to us (“case reserves”) or not yet reported to us (“IBNR reserves”).
The table on the following page presents the development of our loss reserves since inception. This table does not present accident year or underwriting year development data.
The top line of the table shows our initial reported gross loss reserves at the end of each year and is reconciled to our net unpaid loss reserves by adjusting for reinsurance recoverable on unpaid losses. Our net unpaid loss reserves represent the estimated amount of net losses and loss expenses arising in the current year and all prior years that remain unpaid at the balance sheet date.
The next section of the table shows our re-estimated net unpaid loss reserves at the end of each succeeding year. The cumulative favorable development on net reserves reflects cumulative differences between our initial net loss reserve estimates and the currently re-estimated net loss reserves. Annual changes in these estimates are referred to as net prior year reserve development and are recognized in our Consolidated Statements of Operations during the year of the re-estimation; these amounts are the net result of a number of underlying movements, both favorable and adverse.
The lower portion of the table shows the portion of the net unpaid loss reserve estimate that was paid (i.e. claims paid) by the end of each subsequent year. This section of the table provides an indication of the portion of the re-estimated net unpaid loss reserve that is settled and is unlikely to develop in the future.
Our historical net paid losses and loss expenses are but one of many quantitative and qualitative factors considered in establishing the amount of our loss reserves; see the ‘
Critical Accounting Estimates – Reserve for Losses and Loss Expenses
’ section of Item 7 for further information on the establishment of management’s best estimate of loss reserves on a quarterly basis. For additional information regarding the significant underlying movements in our estimate of loss reserves during the most recent three years, refer to the ‘
Underwriting Results – Group – Underwriting Expenses
’ section of Item 7. Note that the conditions and trends that affected the development of our loss reserves in the past may not necessarily recur in the future. Accordingly, it is not appropriate to project future favorable development based on the historical experience in this table.
Also included in the table is the impact of foreign exchange rate movements during each year presented. Portions of our loss reserves relate to claims expected to be paid in currencies other than our reporting currency, the U.S. dollar. Movements in foreign exchange rates, therefore, result in variations in our estimated net loss reserves. Such variations are recognized as they arise, in our Consolidated Statements of Operations. For example, during the year ended
December 31, 2014
, depreciation in the rates of exchange between the euro and the Sterling against the U.S. dollar largely drove a
$230 million
reduction
in our net loss reserves established prior to and during
2014
. To minimize the impact of foreign exchange driven volatility associated with our loss reserves denominated in foreign currencies, we generally hold cash and investments and/or derivative instruments denominated in the same currencies.
At the bottom of the table is a reconciliation of our re-estimated gross loss reserves with our re-estimated net unpaid loss reserves as of
December 31, 2014
. As our ceded reinsurance programs cover different lines of business and accident years, net and gross loss experience will not necessarily develop proportionately.
To facilitate an understanding of the information provided in the table, the following is an example using net loss reserves established at December 31,
2007
. It can be seen from the top section of the table that at December 31,
2007
, our estimate of loss reserves, net of unpaid reinsurance recoverable, was
$4,290 million
.
The next section of the table shows that our current estimate of net unpaid loss reserves for events occurring on or before December 31,
2007
is
$2,692 million
. The cumulative favorable development from our initial estimate of
$1,598 million
was recognized over the course of the following seven calendar years:
$376 million
in
2008
,
$380 million
in
2009
,
$252 million
in
2010
,
$207 million
in
2011
,
$116 million
in
2012
,
$137 million
in
2013
and the remaining
$129 million
in
2014
.
7
The following section of the table presents our cumulative claims paid at the end of each subsequent year. Of the net
$2,015 million
we have paid subsequent to December 31,
2007
,
$616 million
was paid in
2008
,
$532 million
was paid in
2009
,
$314 million
in
2010
,
$194 million
in
2011
,
$151 million
in
2012
,
$121 million
in
2013
and the remaining
$87 million
in
2014
.
In summary, at
December 31,
2007
, we estimated our net loss reserves payable for claims arising from loss events occurring on or before that date were
$4,290 million
. At
December 31, 2014
, we have paid
$2,015 million
towards settlement of these claims and now believe that we will ultimately pay
$2,692 million
for full settlement.
It is important to note that the favorable development in our loss reserves noted in the table is cumulative and, therefore, should not be added together. In
2014
, we revised our cumulative
December 31,
2007
estimate of net loss reserves from
$2,821 million
to
$2,692 million
. This
favorable
development is also included in each column to the right of the
December 31,
2007
column, recognizing that the favorable development was also embedded in our estimated loss reserves at December 31 of each of the following years.
8
|
|
Year ended December 31,
|
||||||||||||||||||||||||||||||||||||||||||||
|
|
2004
|
2005
|
2006
|
2007
|
2008
|
2009
|
2010
|
2011
|
2012
|
2013
|
2014
|
||||||||||||||||||||||||||||||||||
|
Gross reserves for losses and loss expenses
|
$
|
2,404,560
|
|
$
|
4,743,338
|
|
$
|
5,015,113
|
|
$
|
5,587,311
|
|
$
|
6,244,783
|
|
$
|
6,564,133
|
|
$
|
7,032,375
|
|
$
|
8,425,045
|
|
$
|
9,058,731
|
|
$
|
9,582,140
|
|
$
|
9,596,797
|
|
||||||||||||
|
Reinsurance recoverable
|
(564,314
|
)
|
(1,473,241
|
)
|
(1,310,904
|
)
|
(1,297,539
|
)
|
(1,314,551
|
)
|
(1,381,058
|
)
|
(1,540,633
|
)
|
(1,736,823
|
)
|
(1,825,617
|
)
|
(1,900,112
|
)
|
(1,890,280
|
)
|
|||||||||||||||||||||||
|
Net reserves for unpaid losses and loss expenses
|
1,840,246
|
|
3,270,097
|
|
3,704,209
|
|
4,289,772
|
|
4,930,232
|
|
5,183,075
|
|
5,491,742
|
|
6,688,222
|
|
7,233,114
|
|
7,682,028
|
|
7,706,517
|
|
|||||||||||||||||||||||
|
Net reserves re-estimated as of:
|
|||||||||||||||||||||||||||||||||||||||||||||
|
1 Year later
|
$
|
1,457,250
|
|
$
|
3,053,561
|
|
$
|
3,367,232
|
|
$
|
3,913,485
|
|
$
|
4,507,061
|
|
$
|
4,870,020
|
|
$
|
5,234,281
|
|
$
|
6,443,382
|
|
$
|
7,013,678
|
|
$
|
7,423,085
|
|
|||||||||||||||
|
2 Years later
|
1,179,851
|
|
2,938,734
|
|
3,076,025
|
|
3,533,313
|
|
4,235,219
|
|
4,623,109
|
|
5,018,121
|
|
6,226,591
|
|
6,730,245
|
|
|||||||||||||||||||||||||||
|
3 Years later
|
1,080,083
|
|
2,750,476
|
|
2,773,158
|
|
3,281,011
|
|
4,007,046
|
|
4,440,229
|
|
4,797,981
|
|
5,993,711
|
|
|||||||||||||||||||||||||||||
|
4 Years later
|
962,910
|
|
2,529,259
|
|
2,576,226
|
|
3,074,010
|
|
3,841,717
|
|
4,285,709
|
|
4,604,697
|
|
|||||||||||||||||||||||||||||||
|
5 Years later
|
889,190
|
|
2,429,724
|
|
2,445,150
|
|
2,957,939
|
|
3,685,823
|
|
4,113,712
|
|
|||||||||||||||||||||||||||||||||
|
6 Years later
|
863,225
|
|
2,365,515
|
|
2,376,807
|
|
2,820,852
|
|
3,540,355
|
|
|||||||||||||||||||||||||||||||||||
|
7 Years later
|
839,214
|
|
2,328,729
|
|
2,290,277
|
|
2,691,865
|
|
|||||||||||||||||||||||||||||||||||||
|
8 Years later
|
823,131
|
|
2,278,338
|
|
2,213,297
|
|
|||||||||||||||||||||||||||||||||||||||
|
9 Years later
|
799,502
|
|
2,226,407
|
|
|||||||||||||||||||||||||||||||||||||||||
|
10 Years later
|
783,879
|
|
|||||||||||||||||||||||||||||||||||||||||||
|
Cumulative favorable development on net reserves
|
$
|
1,056,367
|
|
$
|
1,043,690
|
|
$
|
1,490,912
|
|
$
|
1,597,907
|
|
$
|
1,389,877
|
|
$
|
1,069,363
|
|
$
|
887,045
|
|
$
|
694,511
|
|
$
|
502,869
|
|
$
|
258,943
|
|
|||||||||||||||
|
Cumulative net paid losses as of:
|
|||||||||||||||||||||||||||||||||||||||||||||
|
1 Year later
|
$
|
291,695
|
|
$
|
880,120
|
|
$
|
636,266
|
|
$
|
615,717
|
|
$
|
982,036
|
|
$
|
1,042,890
|
|
$
|
953,035
|
|
$
|
1,299,384
|
|
$
|
1,373,459
|
|
$
|
1,544,664
|
|
|||||||||||||||
|
2 Years later
|
432,963
|
|
1,292,738
|
|
999,280
|
|
1,147,990
|
|
1,539,713
|
|
1,592,741
|
|
1,601,082
|
|
2,187,024
|
|
2,341,376
|
|
|||||||||||||||||||||||||||
|
3 Years later
|
511,325
|
|
1,500,652
|
|
1,355,821
|
|
1,461,494
|
|
1,936,555
|
|
2,002,373
|
|
2,061,667
|
|
2,857,250
|
|
|||||||||||||||||||||||||||||
|
4 Years later
|
574,874
|
|
1,771,039
|
|
1,513,350
|
|
1,655,688
|
|
2,221,221
|
|
2,301,915
|
|
2,448,219
|
|
|||||||||||||||||||||||||||||||
|
5 Years later
|
615,920
|
|
1,873,052
|
|
1,625,423
|
|
1,807,075
|
|
2,424,791
|
|
2,553,059
|
|
|||||||||||||||||||||||||||||||||
|
6 Years later
|
650,110
|
|
1,930,682
|
|
1,705,987
|
|
1,928,489
|
|
2,581,105
|
|
|||||||||||||||||||||||||||||||||||
|
7 Years later
|
677,351
|
|
1,979,439
|
|
1,772,037
|
|
2,015,386
|
|
|||||||||||||||||||||||||||||||||||||
|
8 Years later
|
698,846
|
|
2,026,100
|
|
1,810,912
|
|
|||||||||||||||||||||||||||||||||||||||
|
9 Years later
|
706,010
|
|
2,039,246
|
|
|||||||||||||||||||||||||||||||||||||||||
|
10 Years later
|
708,641
|
|
|||||||||||||||||||||||||||||||||||||||||||
|
Impact of foreign exchange and other
|
$
|
4,664
|
|
$
|
(13,329
|
)
|
$
|
23,581
|
|
$
|
28,588
|
|
$
|
(133,345
|
)
|
$
|
82,018
|
|
$
|
(25,282
|
)
|
$
|
(16,462
|
)
|
$
|
71,084
|
|
$
|
6,184
|
|
$
|
(230,372
|
)
|
||||||||||||
|
Gross reserve for losses and loss expenses re-estimated
|
$
|
1,283,500
|
|
$
|
3,545,389
|
|
$
|
3,275,118
|
|
$
|
3,674,606
|
|
$
|
4,651,047
|
|
$
|
5,340,729
|
|
$
|
5,958,037
|
|
$
|
7,509,261
|
|
$
|
8,459,942
|
|
$
|
9,275,945
|
|
|||||||||||||||
|
Reinsurance recoverable re-estimated
|
(499,621
|
)
|
(1,318,982
|
)
|
(1,061,821
|
)
|
(982,741
|
)
|
(1,110,692
|
)
|
(1,227,017
|
)
|
(1,353,340
|
)
|
(1,515,550
|
)
|
(1,729,697
|
)
|
(1,852,860
|
)
|
|||||||||||||||||||||||||
|
Net reserve for unpaid losses and loss expenses re-estimated
|
783,879
|
|
2,226,407
|
|
2,213,297
|
|
2,691,865
|
|
3,540,355
|
|
4,113,712
|
|
4,604,697
|
|
5,993,711
|
|
6,730,245
|
|
7,423,085
|
|
|||||||||||||||||||||||||
|
Cumulative favorable development on gross reserves
|
$
|
1,121,060
|
|
$
|
1,197,949
|
|
$
|
1,739,995
|
|
$
|
1,912,705
|
|
$
|
1,593,736
|
|
$
|
1,223,404
|
|
$
|
1,074,338
|
|
$
|
915,784
|
|
$
|
598,789
|
|
$
|
306,195
|
|
|||||||||||||||
9
CASH AND INVESTMENTS
We seek to balance the investment portfolios’ objectives of (1) increasing book value with (2) the generation of relatively stable investment income, while providing sufficient liquidity to meet our claims and other obligations. Liquidity needs arising from potential claims are of primary importance and are considered in asset class participation and the asset allocation process. Intermediate maturity investment grade fixed income securities have duration characteristics similar to our expected claim payouts and are, therefore, central to our investment portfolio’s asset allocation. At
December 31,
2014
, the duration of our fixed maturities portfolio was approximately
3
years, which approximates the estimated duration of our net insurance liabilities.
To diversify risk and optimize the growth in our book value, we may invest in other asset classes such as equity securities, high yield securities and alternative investments (e.g. hedge funds) which provide higher potential total rates of return. Such individual investment classes involve varying degrees of risk, including the potential for more volatile returns and reduced liquidity. However, as part of a balanced portfolio, they also provide diversification from interest rate and credit risk.
With regard to our investment portfolio, we utilize third party investment managers for security selection and trade execution functions, subject to our guidelines and objectives for each asset class. This enables us to actively manage our investment portfolio with access to top talents specializing in various products and markets. We select the managers based on various criteria including investment style, performance history and corporate governance. Additionally, we monitor approved investment asset classes for each subsidiary through analysis of our operating environment, including expected volatility of cash flows, overall capital position, regulatory and rating agency considerations. The Finance Committee of our Board of Directors approves our overall group asset allocation targets and investment policy to ensure that they are consistent with our overall goals, strategies and objectives. We also have an Investment and Finance Committee, comprising senior management, which oversees the implementation of our investment strategy.
For additional information regarding the investment portfolio refer to the ‘
Management’s Discussion and Analysis of Financial Condition and Results of Operations – Cash and Investments
’ section under Item 7 and Note 5
–
Investments to our Consolidated Financial Statements presented under Item 8.
Refer to
‘Risk and Capital Management’
for details relating to the management of our investment risk.
10
RISK AND CAPITAL MANAGEMENT
Risk management framework – Overview
Mission and objectives
The mission of Enterprise Risk Management ("ERM") at AXIS is to promptly identify, measure, report and monitor risks that affect the achievement of our strategic, operational and financial objectives. The key objectives of our risk management framework are to:
|
•
|
Protect our capital base and earnings by monitoring our risks against our stated risk tolerances;
|
|
•
|
Promote a sound risk management culture through disciplined and informed risk taking;
|
|
•
|
Enhance value creation and contribute to an optimal risk-return profile by providing the basis for efficient capital deployment;
|
|
•
|
Support our group-wide decision making process by providing reliable and timely risk information; and
|
|
•
|
Safeguard AXIS’s reputation.
|
Risk governance
At the heart of our risk management framework is a governance process with responsibilities for taking, managing, monitoring and reporting risks. We articulate the roles and responsibilities for risk management throughout the organization, from the Board of Directors and the Chief Executive Officer to our business and functional areas, thus embedding risk management throughout the business (see ‘
Risk Governance and Risk Management Organization
’ section).
To support our governance process, we rely on our documented policies and guidelines. Our Risk Standards specify our principles, risk appetite and tolerances for managing individual and aggregate risks. We also have procedures to approve exceptions and procedures for referring risk issues to senior management and the Board of Directors. Our qualitative and quantitative risk reporting framework provides transparency and early warning indicators to senior management with regard to our overall risk profile, adherence to risk tolerances and improvement actions both at an operating entity and Group level.
Various governance and control bodies (such as Management Audit Committees) coordinate to help to ensure that objectives are being achieved, risks are identified and appropriately managed and internal controls are in place and operating effectively.
Internal capital model
An important aspect to our risk management framework is our internal capital model. Utilizing this modeling framework provides us with a holistic view of the capital we put at risk in any year by allowing us to understand the relative interaction among the risks impacting us. This integrated approach recognizes that a single risk factor can affect different sub-portfolios and that different risk factors can have different mutual dependencies. We attempt to continually review and strengthen the capabilities, functionality and user benefits of our internal capital model framework as our business, risk landscape and external environment continue to evolve.
As well as being used to measure capital adequacy (see ‘
Capital Management’
section), our internal capital model is used as a tool in managing our business and for strategic planning via capital allocations and through to portfolio monitoring, investment asset allocations and transaction evaluations.
Risk diversification
As a global (re)insurer offering a variety of products across different businesses, diversification is a key component of our business model and risk framework. Diversification enhances our ability to manage our risks by limiting the impact of a single event and contributing to relatively stable long-term results and general risk profile. The degree to which the diversification effect can be realized depends not only on the correlation between risks but also the level of relative concentration of those risks. Therefore, our aim is to maintain a balanced risk profile without any disproportionately large risks. Our internal capital model considers the level of correlation and diversification between individual risks and we
11
measure concentration risk consistently across our business units in terms of pre and post diversified internal risk capital requirements.
Risk appetite and limit framework
Our integrated risk management framework considers material risks in our business either from investments, underwriting or in our operations across the world. Large risks that might accumulate and have the potential to produce substantial losses are subject to our global risk appetite and limit framework. Our risk appetite, as authorized by our Board of Directors, represents the amount of risk that we are willing to accept within the constraints imposed by our capital resources as well as the expectations of our stakeholders as to the type of risk we hold within our business. At an annual aggregated level, we manage our total risk exposure so that the potential financial loss from all risks in any one year (at a group and operating entity level) is unlikely to exceed a defined percentage of our total capital at different return periods.
Specific risk limits are defined and translated into a consistent framework across our identified risk categories and across our operating entities, and are intended to limit the impact of individual risk types or accumulations of risk. Individual limits are established through an iterative process to ensure that the overall framework complies with our group-wide requirements on capital adequacy and risk accumulation.
We monitor risk, through, for example, risk dashboards and limit consumption reports. These are intended to allow us to detect potential deviations from our internal risk limits at an early stage.
External perspectives
Various external stakeholders, among them regulators, rating agencies, investors and accounting bodies, are placing increasing emphasis on the importance of sound risk management in our industry.
Evolving regulatory regimes, such as Solvency II in the European Union (“EU”) and the equivalent framework in Bermuda, emphasize a risk-based and economic approach, based on comprehensive quantitative and qualitative assessments and reports. Our internal capital model framework, while incorporating our internal approach to managing risks, also reflects our current interpretation of the evolving Solvency II and related standards.
Risk governance and risk management organization
The key elements of our governance framework, as it relates specifically to risk management, are described below.
Board of Directors’ Level
The Risk Committee of the Board ("Risk Committee") assists the Board of Directors in overseeing the integrity and effectiveness of our enterprise risk management framework, and ensuring that our risk assumption and risk mitigation activities are consistent with that framework. The Risk Committee reviews, approves and monitors our overall risk strategy, risk appetite and key risk tolerances and receives regular reports from the Group Risk Management function ("Group Risk") to ensure any significant risk issues are being addressed by management. The Risk Committee further reviews, with management and Internal Audit, the Group’s general policies and procedures and satisfies itself that effective systems of risk management and controls are established and maintained. Among its other responsibilities, the Risk Committee also reviews and approves our annual Own Risk and Solvency Assessment ("ORSA") report. The Risk Committee assesses the independence and objectivity of our Group Risk, approves its terms of reference and reviews its ongoing activities.
Following a recommendation by the the Chief Executive Officer, the Risk Committee also conducts a review and provides a recommendation to the Board of Directors regarding the appointment and/or removal of the Chief Risk and Actuarial Officer. The Risk Committee meets with the Chief Risk and Actuarial Officer in separate executive session on a regular basis.
The Finance Committee of our Board oversees the Group’s investment of funds and adequacy of financing facilities. This includes approval of the Group’s strategic asset allocation plan. The Risk Committee ensures compliance with the Group’s risk framework. The Audit Committee of our Board, which is supported by our internal audit function, is responsible for overseeing internal controls and compliance procedures and also reviews with management and the Chairman of the Risk Committee the Group’s guidelines and policies regarding risk assessment and risk management.
12
Group executive level
Our management Executive Committee formulates our business objectives and risk strategy within the overall risk appetite set by our Board. It allocates capital resources and sets limits across the Group, with the objective of balancing return and risk. While the management Executive Committee is responsible overall for risk management, it has delegated some authority to various committees. Three Executive level committees focus on the Group’s risk exposure:
|
•
|
Our Risk Management Committee ("RMC") has responsibility for reviewing the allocation of capital, approving individual risk limits and determining changes to our internal risk capital methodology. The RMC also reviews new business plans in the context of our risk framework and defined risk appetite.
|
|
•
|
Our Investment & Finance Committee oversees the Group’s investment activities by, among other things, monitoring market risks, the performance of our investment managers and the Group’s asset-liability management, liquidity positions and investment policies and guidelines. The Investment & Finance Committee also prepares the Group’s strategic asset allocation and presents it to the Finance Committee of the Board for approval.
|
|
•
|
Our Reinsurance Security Committee ("RSC") sets out the financial security requirements of our reinsurance counterparties and recommends tolerance levels for different types of ceded business.
|
Group risk management organization
As a general principle, management in each of our business units is responsible in the first instance for both the risks and returns of its decisions. Management is the ‘owner’ of risk management processes and is responsible for managing our business within defined risk tolerances.
Our Chief Risk and Actuarial Officer leads our independent Group Risk function, and is responsible for oversight and implementation of the Group's ERM framework as well as providing guidance and support for risk management practices. Group Risk is responsible for developing methods and processes for identifying, measuring, managing and reporting risk. This forms the basis for informing the Risk Committee and RMC of the Group’s risk profile. Group Risk develops our risk management framework and oversees the adherence to this framework at the Group and operating entity level. Our Chief Risk and Actuarial Officer regularly reports risk matters to the Chief Executive Officer, management Executive Committee and the Risk Committee.
Our global risk management network also includes Risk Officers within our business units and investment department. These local risk units, which have regular and close interaction with Group Risk, assist with implementing the risk management framework into our business.
Internal Audit, an independent, objective function, reports to the Audit Committee of the Board on the effectiveness of our risk management framework. This includes assurance that key business risks have been adequately identified and managed appropriately and that our system of internal control is operating effectively. Internal Audit also provides independent assurance around the validation of our internal capital model and coordinates risk-based audits, compliance reviews, and other specific initiatives to evaluate and address risk within targeted areas of our business.
Our risk governance structure is further complemented by our Legal Department which seeks to mitigate legal and regulatory compliance risks with support from other departments. This includes ensuring that significant developments in law and regulations are observed and that we react appropriately to impending legislative and regulatory changes and applicable court rulings.
Risk Landscape
Our risk landscape comprises strategic, insurance, credit, market, operational, liquidity and other risks that arise as a result of doing business. We provide definitions of these risk categories in the following sections as well as our related risk management. Across these risk categories, we identify and evaluate emerging threats and opportunities through a framework that includes the assessment of potential surprise factors that could affect known loss potentials.
13
Strategic Risk
Strategic risk is the risk of loss arising from the adverse effect of management decisions on both business strategies and their implementation. This includes the failure to devise or adapt a business strategy in light of changes in our internal and external environment. We assess any strategic action in the context of our risk framework by reviewing the impact of the strategy, including any incremental risk, prior to the action taking place. Additionally, what we learn about risk through our monitoring, reporting and control processes provides important feedback in terms of reevaluating our risks and, therefore, reevaluating our business strategy.
We undertake a strategic business planning process on an annual basis which is overseen by our management Executive Committee, business unit leadership and our Board of Directors. Our internal capital model provides an input into this process by providing an assessment as to whether our prospective business and investment strategies are in line with our defined risk appetite and objectives, at both the group and operating entity level. The model also provides a basis for optimizing our risk-return profile by providing consistent risk measurement across the Group. The model outputs are reviewed and supplemented with management’s judgment and business experience and expertise.
We specifically evaluate the risks of potential merger and acquisition transactions both from a quantitative and qualitative perspective. We conduct risk assessments of merger and acquisition transactions to evaluate risks specifically related to the integration of acquiring a business. Additionally, we have governance procedures in place to review and approve potential new initiatives within our existing businesses in order to evaluate whether the risks are well understood and justified by the potential rewards.
Insurance Risk
Insurance risk is the inherent uncertainty as to the occurrence, amount and timing of insurance liabilities transferred to us through the underwriting process.
Since our inception in 2001, we have expanded our international underwriting presence, with offices in Bermuda, the U.S., Europe, Singapore, Canada, Latin America and Australia. Our disciplined underwriting approach coupled with a group-wide peer review process has enabled us to manage this growth in a controlled and consistent manner.
A critical element of our management of insurance risk is our peer review process which allows us to monitor market conditions and aggregations risk-by-risk, at the highest levels within the Group. Underwriting is also conducted in accordance with other protocols, including underwriting guidelines which provide a framework for consistent pricing and risk analysis and ensuring alignment to our risk appetite. Our business units set limits on underwriting capacity, and cascade authority to individuals based on their specific expertise.
We also have significant audit coverage across our business units, including Management Initiated Audits (“MIAs”). MIAs are audits of underwriting and claims files performed by teams independent of those who originated the transactions, the purpose of which is to test the robustness of our underwriting, claims and operating processes and to recognize any early indicators of future trends in our operational risk.
Reinsurance purchasing
Another key component of our mitigation of insurance risk is the purchase of reinsurance on both a treaty (covering a portfolio of risks) and facultative (single risk) basis. We primarily purchase reinsurance within AXIS Insurance, on both our short and long tail lines of business.
For treaty reinsurance, we purchase both proportional and non-proportional cover. Under proportional reinsurance, we cede an agreed proportion of the premiums and the losses and loss adjustment expenses on the policies we underwrite. We primarily use proportional reinsurance on our liability and professional lines portfolio, whereby we protect against higher loss frequency rather than specific events. We also use non-proportional reinsurance, whereby losses up to a certain amount (i.e. our retention) are borne by us. Using non-proportional reinsurance we can limit our liability with a retention which reflects our willingness and ability to bear risk, and therefore in line with our risk appetite. We primarily purchase the following forms of non-proportional reinsurance:
14
|
•
|
Excess of loss per risk – the reinsurer indemnifies us for loss amounts of all individual policies effected, defined in the treaty terms and conditions. Per risk treaties are an effective means of risk mitigation against large single losses (e.g. a large fire claim).
|
|
•
|
Catastrophe excess of loss – provides aggregate loss cover for our insurance portfolio against the accumulation of losses incurred from a single event (e.g. windstorm).
|
We have a centralized Ceded Reinsurance department which coordinates external treaty reinsurance purchasing across the Group and is overseen by our Reinsurance Purchasing Group ("RPG"), in conjunction with the RSC. The RPG, which includes among others, our Chief Executive Officer, Chief Financial Officer, Chief Risk and Actuarial Officer and business unit leadership, approves each treaty placement, and aims to ensure that appropriate diversification exists within our counterparty panels.
Facultative reinsurance is case by case risk transfer which we may also use to complement treaty reinsurance by covering additional risks above and beyond what is already covered in treaties. Facultative reinsurance is monitored through our peer review processes.
Natural peril catastrophe risk
Natural catastrophes such as earthquakes, storms and floods represent a challenge for risk management due to their accumulation potential and occurrence volatility. In managing natural catastrophe risk, our internal risk tolerance framework aims to limit both the loss of capital due to a single event and the loss of capital that would occur from multiple (but perhaps smaller events) in any year. Within this framework, we have an established risk tolerance for single event, single zone probable maximum loss ("PML") within defined zones and at various return periods. For example, at the 1-in-250 year return period, we are not willing to expose more than 25% of our prior quarter-end common-equity from a single event within a single zone.
The table below shows our mean PML estimates for certain defined single zones which correspond to peak industry catastrophe exposures at
January 1, 2015
and
2014
:
|
At January 1,
(in millions of U.S. dollars)
|
2015
|
2014
|
|||||||||||||||||||||||||
|
Single zone/single event
|
Perils
|
50 Year
Return
Period
|
100 Year
Return
Period
|
250 Year
Return
Period
|
50 Year
Return
Period
|
100 Year
Return
Period
|
250 Year
Return
Period
|
||||||||||||||||||||
|
Southeast
|
U.S. Hurricane
|
$
|
548
|
|
$
|
773
|
|
$
|
947
|
|
$
|
502
|
|
$
|
705
|
|
$
|
887
|
|
||||||||
|
Northeast
|
U.S. Hurricane
|
55
|
|
177
|
|
325
|
|
60
|
|
206
|
|
403
|
|
||||||||||||||
|
Mid-Atlantic
|
U.S. Hurricane
|
98
|
|
305
|
|
758
|
|
107
|
|
361
|
|
772
|
|
||||||||||||||
|
Gulf of Mexico
|
U.S. Hurricane
|
351
|
|
508
|
|
773
|
|
338
|
|
507
|
|
786
|
|
||||||||||||||
|
California
|
Earthquake
|
379
|
|
544
|
|
702
|
|
352
|
|
479
|
|
558
|
|
||||||||||||||
|
Europe
|
Windstorm
|
151
|
|
224
|
|
291
|
|
264
|
|
371
|
|
479
|
|
||||||||||||||
|
Japan
|
Earthquake
|
165
|
|
270
|
|
447
|
|
216
|
|
284
|
|
482
|
|
||||||||||||||
|
Japan
|
Windstorm
|
52
|
|
83
|
|
120
|
|
68
|
|
126
|
|
172
|
|
||||||||||||||
The return period refers to the frequency with which losses of a given amount or greater are expected to occur. A zone is a geographic area in which the insurance risks are considered to be correlated to a single catastrophic event. Estimated losses from a modeled event are grouped into a single zone, as shown above, based on where the majority of the total estimated industry loss is expected to occur. In managing zonal concentrations, we aim to ensure that the geography of single events is suitably captured, but distinct enough that they track specific types of events. For example, our definition of Southeast wind encompasses five states, including Florida, while our definition of Gulf Wind encompasses four states, including Texas.
Our PMLs take into account the fact that an event may trigger claims in a number of lines of business. For instance, our U.S. hurricane modeling includes the estimated pre-tax impact to our financial results arising from our catastrophe, property, engineering, energy, marine and aviation lines of business. Our PMLs include assumptions regarding the location, size and
15
magnitude of an event, the frequency of events, the construction type and a property’s susceptibility to damage, and the cost of rebuilding the property. Loss estimates for non-U.S. zones will be subject to foreign exchange rates, although we may mitigate this currency variability from a book value point of view.
As indicated in the table above, our modeled single occurrence 1-in-100 year return period PML for a Southeast U.S. hurricane, net of reinsurance, is approximately
$0.8 billion
. According to our modeling, there is a one percent chance that on an annual basis, our losses incurred from a Southeast hurricane event could be in excess of
$0.8 billion
. Conversely, there is a 99% chance that on an annual basis, the loss from a Southeast hurricane will fall below
$0.8 billion
.
We have developed our PML estimates using multiple commercially available vendor models, including AIR and RMS (which we also use for pricing catastrophe risk). These models cover the major peril regions where we face potential exposure. We combine the outputs of catastrophe models with our estimate of non-modeled perils and other factors which we believe, from our experience, provides us with a more complete view of catastrophe risk.
Our PML estimates are based on assumptions that are inherently subject to significant uncertainties and contingencies. These uncertainties and contingencies can affect actual losses and could cause actual losses to differ materially from those expressed above. We aim to reduce the potential for model error in a number of ways, the most important of which is by ensuring that management’s judgment supplements the model outputs. We also perform ongoing model validation both within our business units and through our catastrophe model validation unit. These validation procedures include sensitivity testing of models to understand their key variables and, where possible, back testing the model outputs to actual results.
Our estimated net losses from peak zone catastrophes may change from period to period as a result of several factors, which include but are not limited to, updates to vendor catastrophe models, changes in our own modeling, changes in our underwriting portfolios, changes to our reinsurance purchasing strategy and changes in foreign exchange rates. During 2014, we rebalanced our portfolio in light of changing market conditions. This resulted in a significant reduction in our European Windstorm PML's (which were also impacted by a strengthening U.S. dollar), and a moderate increase in our Southeast Hurricane and California Earthquake PML's.
Man-made catastrophe risk
Similar to our management of natural peril catastrophe exposures, we also take a similar focused and analytical approach to our management of man-made catastrophes. Man-made catastrophes, which include such risks as train collisions, airplane crashes, hotel fires or terrorism, are harder to model in terms of assumptions regarding intensity and frequency. For these risks we couple the vendor models (where available) with our bespoke modeling and underwriting judgment and expertise. This allows us to take advantage of business opportunities relating to man-made catastrophe exposures particularly where we can measure and limit the risk sufficiently as well as obtain risk-adequate pricing.
As an example of our approach, our assessment of terrorism risk is based on a mixture of qualitative and quantitative data (e.g. for estimating property damage, business interruption, mortality and morbidity subsequent to an attack of a predefined magnitude), which we use to control, limit and manage our aggregate terrorism exposure. We use commercially available vendor modeling and bespoke modeling tools to measure accumulations around potential terrorism accumulation zones on a deterministic and probabilistic basis. We supplement the results of our modeling with underwriting judgment.
Reserving risk
Our loss reserving process demands data quality and reliability and requires a quantitative and qualitative review of both our overall reserves and individual large claims. Within a structured control framework, claims information is communicated on a regular basis throughout our organization, including to senior management, to provide an increased awareness regarding the losses that have taken place throughout the insurance markets. The detailed and analytical reserving approach that follows is designed to absorb and understand the latest information on our reported and unreported claims, to recognize the resultant exposure as quickly as possible, and to make appropriate and realistic provisions in our financial statements. We have well established processes for determining carried reserves, which we endeavor to apply consistently over time.
Reserving for long-tail lines of business represents a significant component of reserving risk. When loss trends prove to be higher than those underlying our reserving assumptions, the risk is greater because of a stacking-up effect: we carry reserves to cover claims arising from several years of underwriting activity and these reserves are likely to be adversely affected by unfavorable loss trends. We manage and mitigate reserving risk on long-tail business in a variety of ways. First, we limit the amount of long-tail business we write in line with maintaining a well-balanced and diversified global portfolio of business. In
16
2014
, our long-tail net premiums written (namely liability and motor business) represented
21%
of our total premium written. We also purchase reinsurance on the liability business written in our insurance segment to reduce our net positions. Secondly, we follow a disciplined underwriting process that utilizes available information, including industry trends.
Another significant component of reserving risk relates to the estimation of losses in the aftermath of a major catastrophe event. For further discussion on this, as well as a description of our reserving process, refer to
‘Critical Accounting Estimates – Reserve for Losses and Loss Expenses’
under Item 7.
Claims handling risk
In accepting risk, we are committing to the payment of claims and therefore these risks must be understood and controlled. We have claims teams located throughout our main business units. Our claim teams include a diverse group of experienced professionals, including claims adjusters and attorneys. We also use approved external service providers, such as independent adjusters and appraisers, surveyors, accountants, investigators and specialist attorneys, as appropriate.
We maintain claims handling guidelines and claims reporting control and escalation procedures in all our claims units. Large claims matters are reviewed during weekly claims meetings. The minutes from each meeting are circulated to our underwriters, senior management and others involved in the reserving process. To maintain communication between underwriting and claims teams, claims personnel regularly report at underwriting meetings and frequently attend client meetings.
AXIS fosters a strong culture of review among its claims teams. This includes MIAs, whereby senior claims handlers audit a sample of claim files. The process is designed to ensure consistency between the claims units and to develop group wide best practices.
When we receive notice of a claim, regardless of size, it is recorded within our underwriting and claims systems. To assist with the reporting of significant claims, we have also developed a standard format and procedure to produce “flash reports” for significant events and potential losses, regardless of whether we have exposure. Our process for flash reporting allows a direct notification to be communicated to underwriters and senior management worldwide. Similarly, for natural peril catastrophes, we have developed a catastrophe database, along with catastrophe coding in certain systems, that allows for the gathering, blending and reporting of loss information as it develops from early modeled results to fully adjusted and paid losses.
Credit Risk
Credit risk represents the risk of incurring financial loss due to the diminished creditworthiness (eroding credit rating and, ultimately, default) of our third party counterparties. We distinguish between various forms of credit exposure; the risk of issuer default from instruments in which we invest or trade, such as corporate bonds; counterparty exposure in a direct contractual relationship, such as retrocession; the credit risk related to our receivables, including those from brokers and other intermediaries; and the risk we assume through our (re)insurance contracts, such as our credit and political risk and trade credit and bond lines of business.
Credit risk aggregation
We monitor and control the aggregation of credit risk on a group-wide basis by assigning limits on the maximum credit exposure we are willing to assume by single obligors and groups, industry sector, country, region or other inter-dependencies. Our credit exposures are aggregated based on the origin of risk. Limits are based and adjusted on a variety of factors including the prevailing economic environment and the nature of the underlying credit exposures.
Our credit aggregation measurement and reporting process is facilitated by our credit risk exposure database, which contains relevant information on counterparty details and credit risk exposures. The database is accessible by management throughout the Group, thus providing transparency to allow for the implementation of active exposure management strategies. We also license third party databases to provide credit risk assessments. We monitor all our credit aggregations and, where appropriate, adjust our internal risk limits and/or have taken specific actions to reduce our risk exposures. Credit risk aggregation is also managed through minimizing overlaps in underwriting, financing and investing activities.
17
Credit risk relating to investing activities
With our fixed maturity investment portfolio, which represents approximately
$12 billion
or
61%
of our total assets, we are exposed to potential losses arising from the diminished creditworthiness of issuers of bonds as well as third party counterparties such as custodians. We limit such credit risk through diversification, issuer exposure limitation graded by ratings and, with respect to custodians, through contractual and other legal remedies. Excluding U.S. Treasury and Agency securities, we limit our concentration of credit risk to any single corporate issuer to
2%
or less of our fixed maturities portfolio for securities rated A- or above and
1%
or less of our fixed maturities portfolio for securities rated below A-.
We also have credit risk relating to our cash and cash equivalents. In order to mitigate concentration and operational risks related to cash and cash equivalents, we limit the maximum amount of cash that can be deposited with a single counterparty and additionally limit acceptable counterparties based on current rating, outlook and other relevant factors.
Credit risk relating to reinsurance recoverable assets
Within our reinsurance purchasing activities, we are exposed to the credit risk of a reinsurer failing to meet its obligations under our reinsurance contracts. To help mitigate this, all of our reinsurance purchasing is subject to financial security requirements specified by our RSC. The RSC maintains a list of approved reinsurers, performs credit risk assessments for potential new reinsurers, regularly monitors approved reinsurers with consideration for events which may have a material impact on their creditworthiness, recommends counterparty tolerance levels for different types of ceded business and monitors concentrations of credit risk. This assessment considers a wide range of individual attributes, including a review of the counterparty’s financial strength, industry position and other qualitative factors.
We monitor counterparty credit quality and exposures, with special monitoring of those cases that merit close attention.
Credit risk relating to receivables
Our largest credit risk exposure to receivables is from brokers and other intermediaries; the risk arises where they collect premiums from customers to be paid to us or pay claims to customers on our behalf. We have policies and standards in place to manage and monitor credit risk from intermediaries with a focus on day-to-day monitoring of the largest positions.
Credit risk relating to our underwriting portfolio
In our insurance segment, we provide credit insurance primarily for lenders (financial institutions) seeking to mitigate the risk of non-payment from their borrowers primarily in emerging markets. This product has complemented our more traditional political risk insurance business in recent years. For the credit insurance contracts, it is necessary for the buyer of the insurance, most often a bank, to hold an insured asset, most often an underlying loan, in order to claim compensation under the insurance contract. The vast majority of the credit insurance provided is for single-name illiquid risks, primarily in the form of senior secured bank loans that can be individually analyzed and underwritten. As part of this underwriting process, an evaluation of credit-worthiness and reputation of the obligor is critical and forms the cornerstone of the underwriting process. We generally require that our clients retain a share of each transaction that we insure. A key element to our underwriting analysis is the assessment of recovery in the event of default and, accordingly, the strength of the collateral and the enforceability of rights to the collateral are paramount. We avoid insurance for structured finance products defined by pools of risks and insurance for synthetic products that would expose us to mark-to-market losses. We also seek to avoid terms in our credit insurance contracts which introduce liquidity risk, most notably, in the form of a collateralization requirement upon a ratings downgrade. We also provide protection against sovereign default or sovereign actions that result in impairment of cross-border investments for banks and corporations. Our contracts generally include conditions precedent to our liability relating to the enforceability of the insured transaction and restricting amendments to the transaction documentation, obligations on the insured to prevent and minimize losses, subrogation rights (including rights to have the insured asset transferred to us) and waiting periods. Under most of our policies, a loss payment is made in the event the debtor failed to pay our client when payment is due subject to a waiting period of up to 180 days.
In our reinsurance segment, we provide reinsurance of credit and bond insurers exposed to the risks of financial loss arising from non-payment of trade receivables covered by a policy (credit insurance) or non-performance (bonding). Our credit insurance exposures are concentrated primarily within Western European economies, while our surety bond exposures are concentrated primarily within Latin American and Western European economies.
18
Market Risk
Market risk is the risk that our financial instruments may be negatively impacted by movements in financial market prices or rates such as equity prices, interest rates, credit spreads and foreign exchange rates. Fluctuations in market rates primarily affect our investment portfolio.
Through asset and liability management, we aim to ensure that market risks influence the economic value of our investments and that of our loss reserves and other liabilities in the same way, thus mitigating the effect of market fluctuations. For example, we reflect important features of our liabilities, such as maturity patterns and currency structures, on the assets side of the balance sheet by acquiring investments with similar characteristics.
We supplement our asset-liability management with various internal policies and limits. As part of our strategic asset allocation process, different asset strategies are simulated and stressed in order to evaluate the ‘best’ portfolio (given return objectives and risk constraints) at both the group and operating entity level. We centralize the management of asset classes to control aggregation of risk, and provide a consistent approach to constructing portfolios as well as the selection process of external asset managers. We have limits on the concentration of investments by single issuers and certain asset classes, and we limit the level of illiquid investments (see '
Liquidity Risk'
below). Further, our investment guidelines do not permit the use of leverage in any of our fixed maturity portfolios.
We stress test our investment portfolios using historical and hypothetical scenarios to analyze the impact of unusual market conditions and to ensure potential investment losses remain within our risk appetite. At an annual aggregated level, we manage the total risk exposure to our investment portfolio so that the ‘total return’ investment loss in any one year is unlikely to exceed a defined percentage of our common equity at a defined return period.
We mitigate foreign currency risk by seeking to match our estimated (re)insurance liabilities payable in foreign currencies with assets, including cash and investments that are also denominated in such currencies. Where necessary, we use derivative financial instruments for economic hedging purposes. For example, in certain circumstances, we use forward contracts and currency options, to economically hedge portions of our un-matched foreign currency exposures.
Operational Risk
Operational risk represents the risk of financial loss as a result of inadequate processes, system failures, human error or external events. We have a dedicated team within Group Risk responsible for overseeing the management of operational risks, applying a centrally coordinated methodology to identify and assess risks. We have developed a group-wide operational risk framework that focuses on early recognition of operational risks. As part of this, we maintain an operational loss-event database which helps us better monitor and analyze potential operational risk, identify any trends, and, where necessary, put in place improvement actions to avoid occurrence or recurrence of operational loss events.
We manage transaction type operational risks through the application of process controls throughout our business. In testing these controls, we supplement the work of our internal audit team, with regular underwriting and claim MIAs (as discussed above).
We have specific processes and systems in place to focus on high priority operational matters such as information security, managing business continuity, and third party vendor risk:
|
•
|
Major failures and disasters which could cause a severe disruption to working environments, facilities and personnel, represent a significant operational risk to us. Our Business Continuity Management framework strives to protect critical business functions from these effects to enable us to carry out our core tasks in time and at the quality required. During
2014
, we continued to review our Business Continuity Planning procedures through cyclical planned tests.
|
|
•
|
We have developed a number of Information Technology ("IT") platforms, applications and security controls to support our business activities worldwide. Dedicated security standards are in place for our IT systems to ensure the proper use, availability and protection of our information assets.
|
|
•
|
Our use of third party vendors exposes us to a number of increased operational risks, including the risk of security breaches, fraud, non-compliance with laws and regulations or internal guidelines and inadequate service. We manage material third party vendor risk, by, among other things, performing a thorough risk assessment on potential large vendors, reviewing a vendor’s financial stability, ability to provide ongoing service and business continuity planning.
|
19
Liquidity Risk
Liquidity risk is the risk that we may not have sufficient liquid financial resources to meet our obligations when they fall due, or would have to incur excessive costs to do so. As a (re)insurer, our core business generates liquidity primarily through premium and investment income. Our exposure to liquidity risk stems mainly from the need to cover potential extreme loss events and regulatory constraints that limit the flow of funds within the Group. To manage these risks, we have a range of liquidity policies and measures in place:
|
•
|
We maintain cash and cash equivalents and high quality, liquid investment portfolios to meet expected outflows, as well as those that could result from a range of potential stress events. We place internal limits on the maximum percentage of cash and investments which may be in a restricted form as well as a minimum percentage of our investment portfolio to mature within a defined timeframe.
|
|
•
|
We maintain committed borrowing facilities, as well as access to diverse funding sources to cover contingencies. Funding sources include asset sales, external debt issuances and lines of credit.
|
Capital Management
Our capital management strategy is to maximize long-term shareholder value by, among other things, optimizing capital allocation and minimizing our cost of capital. We also manage our capital in accordance with our desired financial strength rating, as well as regulatory and solvency requirements.
We monitor the capital positions of the Group and operating entity level and apply regular stress tests based on adverse scenarios. This allows us to take appropriate measures to ensure the continued strength of capital and solvency positions, and also enables us to take advantage of growth opportunities as they arise. Such measures are performed as and when required and include traditional capital management tools (e.g. dividends, share buy-backs, issuances of shares or debt) or through changes to our risk exposure (e.g. recalibration of our investment portfolio or changes to our reinsurance purchasing strategy).
Internal capital adequacy
Our internal capital model plays an important role in the management and allocation of internal capital. Our internal capital requirement captures the potential for severe, but rare, aggregate losses over a one-year time horizon, which we also measure, monitor and report at more extreme return periods. Our internal capital model is also used to manage risks resulting from reasonably possible smaller adverse events that could occur in the near-term, because the results allow us to analyze our exposure to each source of risk both separately and in aggregate.
Regulatory capital requirements
In each country in which we operate, the local regulator specifies the minimum amount and type of capital that each of the regulated entities must hold in support of their liabilities. We target to hold, in addition to the minimum capital required to comply with the solvency requirements, an adequate buffer to ensure that each of our operating entities meets its local capital requirements. Refer to Note 20 of the Consolidated Financial Statements, under Item 8 for further information.
Rating agency capital requirements
Rating agencies apply their own models to evaluate the relationship between the required risk capital of a company and its available capital resources. The assessment of capital adequacy is usually an integral part of the rating agency process. Meeting rating agency capital requirements and maintaining strong credit ratings are strategic business objectives of the AXIS Group. For further information on our financial strength refer to the ‘
Liquidity and Capital Resources
’ section in Item 7 of this report.
20
REGULATION
General
The business of (re)insurance is regulated in most countries, although the degree and type of regulation varies significantly from one jurisdiction to another. In addition, some jurisdictions are currently evaluating changes to their regulation and AXIS is monitoring these potential developments. To the extent AXIS is aware of impending changes in regulation, we designate project teams to prepare the organization to comply on a timely basis with such anticipated changes. The following describes the current material regulations under which the Company operates.
Bermuda
Our Bermuda insurance operating subsidiary, AXIS Specialty Bermuda, is a Class 4 general business insurer subject to the Insurance Act 1978 of Bermuda and related regulations, as amended (the “Insurance Act”). The Insurance Act provides that no person may carry on any insurance or reinsurance business in or from within Bermuda unless registered as an insurer by the Bermuda Monetary Authority (the “BMA”) under the Insurance Act. The Insurance Act imposes on Bermuda insurance companies solvency and liquidity standards and auditing and reporting requirements, and grants the BMA powers to supervise, investigate, require information and demand the production of documents and intervene in the affairs of insurance companies. Significant requirements pertaining to Class 4 insurers include the appointment of an independent auditor, the appointment of a loss reserve specialist, the appointment of a principal representative in Bermuda, the filing of annual Statutory Financial Returns, the filing of annual GAAP financial statements, the filing of an annual capital and solvency return, compliance with minimum and enhanced capital requirements, compliance with certain restrictions on reductions of capital and the payment of dividends and distributions, compliance with group solvency and supervision rules, if applicable, and compliance with the Insurance Code of Conduct.
In November 2013, AXIS Capital formed AXIS Ventures Limited and its direct subsidiary Ventures Re. Ventures Re was licensed as a Class 3A insurer under the Insurance Act and registered as a segregated accounts company under the Bermuda Segregated Accounts Companies Act 2000, as amended. Pursuant to a Direction under Section 56 of the Insurance Act issued by the BMA, Ventures Re is exempt from certain solvency and liquidity standards and reporting requirements.
The BMA acts as group supervisor of AXIS Capital and has designated AXIS Specialty Bermuda as the ‘designated insurer’ of the AXIS Capital group of insurance companies. In accordance with the group supervision and insurance group solvency rules, AXIS Capital is required to prepare and submit annual audited group GAAP financial statements, annual group statutory financial statements, an annual group statutory financial return, an annual group capital and solvency return and quarterly group unaudited GAAP financial statements, and to appoint both a group actuary and a group auditor. Enhanced group capital requirements (“ECR”) are being phased in beginning with the financial year ending December 31, 2013, when the applicable ECR was 50% of the amount prescribed by the BMA, with an additional 10% applicable each subsequent year through 2018, when the full ECR will be required.
AXIS Capital, AXIS Specialty Bermuda, AXIS Specialty Holdings Bermuda Limited, AXIS Bermuda Services Limited, AXIS Specialty Markets Limited, AXIS Specialty Markets II Limited, AXIS Ventures Limited and Ventures Re must also comply with provisions of the Bermuda Companies Act 1981, as amended (the “Companies Act”), regulating the payment of dividends and distributions. A Bermuda company may not declare or pay a dividend or make a distribution out of contributed surplus if there are reasonable grounds for believing that: (a) the company is, or would after the payment be, unable to pay its liabilities as they become due; or (b) the realizable value of the company’s assets would thereby be less than its liabilities.
The Singapore branch of AXIS Specialty Bermuda, AXIS Specialty Limited (Singapore Branch), established in 2008, is also regulated by the Monetary Authority of Singapore pursuant to The Insurance Act of Singapore and is registered by the Accounting and Corporate Regulatory Authority (“ACRA”) as a foreign company in Singapore and regulated by ACRA pursuant to the Singapore Companies Act. Prior to establishing its Singapore branch, AXIS Specialty Bermuda had maintained a representative office in Singapore since 2004.
Effective January 1, 2014, AXIS Syndicate 1686 ("AXIS Syndicate"), a Lloyd's Syndicate, is licensed through Lloyd's to write insurance and reinsurance in or from Bermuda, except for long-term business.
21
United States
U.S. Insurance Holding Company Regulation of AXIS Capital’s Insurance Subsidiaries
As members of an insurance holding company system, each of AXIS Insurance Company, AXIS Reinsurance Company, AXIS Specialty Insurance Company and AXIS Surplus Insurance Company, collectively AXIS Capital’s U.S. insurance subsidiaries (“U.S. Insurance Subsidiaries”) are subject to the insurance holding company system laws and regulations of the states in which they do business. These laws generally require each of the U.S. Insurance Subsidiaries to register with its respective domestic state insurance department and to furnish financial and other information which may materially affect the operations, management or financial condition within the holding company system. All transactions within a holding company system that involve an insurance company must be fair and equitable. Notice to the insurance departments is required prior to the consummation of transactions affecting the ownership or control of an insurer and of certain material transactions between an insurer and an entity in its holding company system, and certain transactions may not be consummated without the department’s prior approval.
State Insurance Regulation
AXIS Reinsurance Company is licensed to transact insurance and reinsurance in all 50 of the United States, the District of Columbia and Puerto Rico. AXIS Reinsurance Company is also authorized to transact insurance and reinsurance throughout Canada through its Canadian branch and has reinsurance permissions in Brazil, India and Mexico. AXIS Insurance Company is licensed to transact insurance and reinsurance in all 50 of the United States and in the District of Columbia. AXIS Specialty Insurance Company is licensed to transact insurance and reinsurance throughout the United States, except California, Iowa, Maine, New Mexico, New York, Wyoming. AXIS Surplus Insurance Company is eligible to write insurance on a surplus lines basis in all 50 of the United States, the District of Columbia and Puerto Rico.
Our U.S. Insurance Subsidiaries also are subject to regulation and supervision by their respective states of domicile and by other jurisdictions in which they do business. The regulations generally are derived from statutes that delegate regulatory and supervisory powers to an insurance official. The regulatory framework varies from state to state, but generally relates to approval of policy forms and rates, the standards of solvency that must be met and maintained, including risk-based capital standards, material transactions between an insurer and its affiliates, the licensing of insurers, agents and brokers, restrictions on insurance policy terminations, the nature of and limitations on the amount of certain investments, limitations on the net amount of insurance of a single risk compared to the insurer’s surplus, deposits of securities for the benefit of policyholders, methods of accounting, periodic examinations of the financial condition and market conduct of insurance companies, the form and content of reports of financial condition required to be filed, and reserves for unearned premiums, losses, expenses and other obligations.
Our U.S. Insurance Subsidiaries are required to file detailed quarterly statutory financial statements with state insurance regulators in each of the states in which they conduct business. In addition, the U.S. Insurance Subsidiaries’ operations and accounts are subject to financial condition and market conduct examination at regular intervals by state regulators.
Regulators and rating agencies use statutory surplus as a measure to assess our U.S. subsidiaries’ ability to support business operations and pay dividends. Our U.S. Insurance Subsidiaries are subject to various state statutory and regulatory restrictions that limit the amount of dividends that may be paid from earned surplus without prior approval from regulatory authorities. These restrictions differ by state, but generally are based on calculations using statutory surplus, statutory net income and investment income. In addition, many state regulators use the National Association of Insurance Commissioners promulgated risk-based capital requirements as a means of identifying insurance companies which may be under-capitalized.
Although the insurance industry generally is not directly regulated by the federal government, federal legislation and initiatives can affect the industry and our business. On July 21, 2010, the Dodd-Frank Wall Street Reform and Consumer Protection Act of 2010 (“Dodd-Frank”) was signed into law. Certain sections of that act pertain to the regulation and business of insurance. Specifically, the Federal Insurance Office was created (“FIO”). Initially, the FIO will have limited authority and mainly collect information and report on the business of insurance to Congress. In addition, Dodd-Frank contained the Nonadmitted and Reinsurance Reform Act of 2010 (“NRRA”). NRRA attempts to coordinate the payment of surplus lines taxes, simplify the granting of alien insurers to become surplus lines authorized and coordinates the credit for certain reinsurance. Various sections of Dodd-Frank become effective over time and regulations have yet to be drafted for certain provisions. AXIS does not anticipate that Dodd-Frank will have any material effect on its operations or finances this year, but will continue to monitor its implementation.
22
U.S. Operations of our Non-U.S. Insurance Subsidiaries
The insurance laws of each state of the United States and of many other countries regulate or prohibit the sale of (re)insurance within their jurisdictions by (re)insurers that are not admitted to do business within such jurisdictions, or conduct business pursuant to exemptions. AXIS Specialty Europe is eligible to write surplus lines business in all 50 of the United States, the District of Columbia and Puerto Rico. AXIS Syndicate is eligible to write surplus lines business throughout the United States, in the District of Columbia and in all U.S. territories. AXIS Syndicate is authorized to write insurance business, except life insurance business, in the states of Illinois, Kentucky and in the U.S. Virgin Islands under licenses held in the name of “Lloyd's underwriters” or “Underwriters at Lloyd's, London”. AXIS Syndicate is authorized to write non-life reinsurance business in all 50 of the United States, the District of Columbia and in all U.S. territories, except for accident and health reinsurance in New York. AXIS Specialty Bermuda, AXIS Re SE and Ventures Re are not licensed or eligible to write business in the United States. AXIS Specialty Bermuda, AXIS Re SE, AXIS Specialty Europe and Ventures Re do not maintain offices, solicit, advertise, underwrite, settle claims or conduct any insurance activities in any jurisdiction in the United States where the conduct of such activities would require these companies to be admitted or authorized.
In addition to the regulatory requirements imposed by the jurisdictions in which they are licensed, reinsurers’ business operations are affected by regulatory requirements in various states of the U.S. governing “credit for reinsurance” that are imposed on their ceding companies. In general, a ceding company obtaining reinsurance from a reinsurer that is licensed, accredited or approved by the jurisdiction or state in which the ceding company files statutory financial statements is permitted to reflect in its statutory financial statements a credit in an aggregate amount equal to the ceding company’s liability for unearned premiums (which are that portion of premiums written which applies to the unexpired portion of the policy period), loss reserves and loss expense reserves ceded to the reinsurer. Neither AXIS Re SE, AXIS Specialty Europe, nor Ventures Re are licensed, accredited or approved in any state in the U.S. The great majority of states, however, permit a credit to statutory surplus resulting from reinsurance obtained from a non-licensed or non-accredited reinsurer to be recognized to the extent that the reinsurer provides a letter of credit, trust fund or other acceptable security arrangement. A few states do not allow credit for reinsurance ceded to non-licensed reinsurers except in certain limited circumstances and others impose additional requirements that make it difficult to become accredited. During 2013, in connection with establishment of a Multi-Beneficiary Reinsurance Trust, AXIS Specialty Bermuda obtained accredited or trusteed reinsurer status in all U.S. jurisdictions except for California and New York.
Ireland
AXIS Specialty Europe
AXIS Specialty Europe is a European public limited liability company incorporated as a non-life insurer under the laws of Ireland. AXIS Specialty Europe is authorized and regulated by the Central Bank of Ireland (“CBI”) pursuant to the Insurance Acts 1909 to 2000, as amended, repealed or replaced, the Central Bank Acts 1942 – 2014, as amended, repealed or replaced and European Union regulation relating to general insurance and statutory instruments made thereunder. AXIS Specialty Europe is authorized to conduct business in 16 non-life insurance classes of business. AXIS Specialty Europe may also write reinsurance business within the classes of insurance business for which it is authorized. Significant additional regulation that applies to AXIS Specialty Europe includes the CBI’s Corporate Governance Code for Credit Institutions and Insurance Undertakings 2013, the Guidelines on the Reinsurance Cover of Primary Insurers and the Security of their Reinsurers, the 2014 Reserving Requirements for Non-Life Insurers and Non-Life and Life Reinsurers and the CBI’s Fit and Proper requirements.
Ireland is a member of the European Economic Area, (“EEA”), which comprises each of the countries of the European Union (“EU”) with the addition of Iceland, Lichtenstein and Norway. Ireland transposed the EU’s Third Non-Life Insurance Directive into Irish law. This directive introduced a single system for the authorization and financial supervision of non-life insurance companies by their home state. Under this system, AXIS Specialty Europe is permitted to provide insurance services to clients located in any other EEA member state (“Freedom of Services”), provided it has first notified the CBI and subject to compliance with any “general good requirements” as may be established by the applicable EEA Member State regulator. AXIS Specialty Europe has notified the CBI of its intention to provide insurance services on a Freedom of Services basis in all EEA countries.
The Third Non-Life Directive also permits AXIS Specialty Europe to carry on insurance business in any other EEA Member State under the principle of “Freedom of Establishment.” In May 2003, AXIS Specialty Europe established a branch in the United Kingdom known as AXIS Specialty London. The CBI remains responsible for the prudential supervision of the
23
branch, however, AXIS Specialty London is also regulated by the United Kingdom's Prudential Regulation Authority and Financial Conduct Authority in respect of United Kingdom business.
In July 2008, AXIS Specialty Europe established an Australian branch, trading as AXIS Specialty Australia, to transact general insurance business. While the CBI continues to be the responsible supervisory authority, the Australia Prudential Regulation Authority (“APRA”) is also responsible for the authorization of and the ongoing prudential supervision of the branch in accordance with the Insurance Act 1973, as amended, as well as regulations applicable to general insurers. AXIS Specialty Europe is also registered as a foreign company with the Australia Securities Investment Commission in accordance with Australia’s Corporations Act 2001, as amended. Significant additional regulation relates to branch capital adequacy, assets in Australia, risk management, reinsurance management, governance and audit and actuarial requirements.
AXIS Specialty Europe has obtained local regulatory permission to carry on insurance business in Jersey and Gibraltar and to write cross-border reinsurance business into India.
AXIS Re SE
AXIS Re SE is a European public limited liability company incorporated as a reinsurer under the laws of Ireland. AXIS Re SE is authorized by the CBI as a composite reinsurer (non-life and life) in accordance with the Insurance Acts 1909 to 2000, as amended, repealed or replaced, the Central Bank Acts 1942 - 2014 as amended, repealed or replaced and EU regulation applicable to reinsurance and statutory instruments made thereunder. The European Communities (Reinsurance) Regulations 2006 (the “Regulations”), as amended, which gave effect to the EU Reinsurance Directive, provide a comprehensive framework for the authorization and supervision of reinsurers in Ireland. Significant additional regulation that applies to AXIS Re SE includes the CBI’s Corporate Governance Code for Credit Institutions and Insurance Undertakings 2013, the Requirements for Composite Reinsurance Undertakings 2014, the 2014 Reserving Requirements for Non-Life Insurers and Non-Life and Life Reinsurers and the CBI’s Fit and Proper requirements.
The EU Reinsurance Directive provides that the authorization and supervision of European reinsurers is the responsibility of the EU Member State where the head office of the relevant reinsurer is located (the "home state"). Once authorized in its home state, a reinsurer is automatically entitled to conduct reinsurance business in all EEA Member States under the principles of Freedom of Establishment and Freedom of Services, similar to the system that applies to EU-based insurers. The Reinsurance Directive provides that the home state regulator is fully responsible for the financial and prudential supervision of a reinsurer, including business it carries on in other countries, either through branches or Freedom of Services.
In September 2003, AXIS Re SE established a branch in Zurich, Switzerland, known as AXIS Re Europe. The Swiss Financial Market Supervisory Authority does not impose additional regulation upon a Swiss branch of an EEA reinsurer.
AXIS Re SE has obtained local regulatory permissions to reinsure companies in Argentina, Bolivia, Brazil, Chile, Colombia, Dominican Republic, Ecuador, El Salvador, Guatemala, Honduras, India, Mexico, Panama, Paraguay, Peru and Venezuela.
AXIS Re SE has marketing offices in Brazil, France and Spain. These offices are representative offices only and no business may be written or any regulated activity conducted from these offices. AXIS Re SE Escritório de Representação No Brasil Ltda. was established in Brazil as a subsidiary of AXIS Re SE to facilitate the Brazilian regulatory requirements for approval of a representative office of AXIS Re SE.
AXIS Specialty Holdings Ireland Limited
AXIS Specialty Holdings Ireland Limited is the limited liability holding company for AXIS Specialty Europe and AXIS Re SE, incorporated under the laws of Ireland. In its capacity as a holding company of EU regulated (re)insurance companies, AXIS Specialty Holdings Ireland Limited is subject to certain CBI consolidated solvency requirements.
Certain of our European legal entities will be subject to Solvency II regulation once it becomes effective on January 1, 2016. Solvency II is a consolidation and modernization of existing European Commission ("E.C.") Solvency I (re)insurance regulation and supervision and includes a risk based solvency and capital regime. The new regulations cover three main areas: (i) the valuation of assets and liabilities and solvency and capital requirements; (ii) governance requirements including compliance, internal audit, actuarial and risk management; and (iii) new supervisory legal entity and European Union group reporting and disclosure requirements including public disclosures. The new capital requirement must be computed using the Solvency II standard formula unless regulatory approval has been received for capital to be computed using an internal model.
24
AXIS Syndicate has permission to write insurance and reinsurance business on a Freedom of Services basis in Ireland. AXIS Specialty Bermuda, Ventures Re and the U.S. Insurance Subsidiaries are not authorized to conduct insurance and/or reinsurance business in Ireland.
United Kingdom
Under the law of England and Wales, a company may only conduct insurance and/or reinsurance business in the United Kingdom upon authorization. AXIS Re SE is authorized to transact U.K. business on a Freedom of Services basis pursuant to the regulations, and AXIS Specialty Europe is authorized to transact U.K. business on a Freedom of Services basis pursuant to the Third Non-Life Insurance Directive and to conduct business in the U.K. on a Freedom of Establishment basis through its branch, AXIS Specialty London.
In November 2013, AXIS Syndicate was established having a single corporate member, AXIS Corporate Capital UK Limited, with approval to commence business at Lloyd’s from January 1, 2014. AXIS Syndicate 1686 is managed by Asta Managing Agency Ltd. Lloyd’s has a global network of licenses and authorizations across Europe, the Middle East and Africa, North and South America, Asia and Australasia and AXIS Syndicate may write business where Lloyd’s has authorized status. Lloyd’s is governed by U.K. law and regulation. The Lloyd’s Act 1982 defines the governance structure and rules under which Lloyd’s operates. Under the Lloyd's Act 1982, the Council of Lloyd’s is responsible for the management and supervision of the Lloyd’s market. Lloyd’s is dual-regulated by the UK Prudential Regulation Authority (the “PRA”) and Financial Conduct Authority (“FCA”). Lloyd's Managing Agents are also dual regulated by the PRA and FCA.
AXIS Syndicate is also subject to Solvency II once it becomes effective on January 1, 2016.
The United Kingdom is a member of the EEA. AXIS Syndicate is permitted to provide insurance and reinsurance services on a Freedom of Services basis subject to compliance with any “general good requirements” as may be established by the applicable EEA member state regulators.
AXIS Specialty Bermuda, Ventures Re and the U.S. Insurance Subsidiaries are not authorized to conduct insurance and/or reinsurance business in the United Kingdom.
Switzerland
AXIS Re SE conducts reinsurance business from its branch, AXIS Re Europe, in Zurich, Switzerland, subject to the supervision of the CBI.
AXIS Syndicate is authorized to conduct all classes of insurance business, except life, sickness and legal expenses and is authorized to write all classes of reinsurance business in Switzerland.
AXIS Specialty Bermuda, AXIS Specialty Europe, Ventures Re and the U.S. Insurance Subsidiaries are not authorized to conduct insurance or reinsurance business in Switzerland.
Singapore
AXIS Specialty Bermuda conducts (re)insurance business from its branch in Singapore, AXIS Specialty Limited (Singapore Branch), subject to the supervision of the BMA and the Monetary Authority of Singapore (the “MAS”).
AXIS Syndicate is licensed to write insurance from Singapore with the exception of certain compulsory classes and life business. Lloyd's underwriters are permitted to write reinsurance from Singapore, with the exception of life business. Singaporean business may also be written from outside of Singapore in certain circumstances where it is placed with a Singapore intermediary licensed by the MAS to place business at Lloyd's or by dealing directly with the insured.
AXIS Re SE, AXIS Specialty Europe, Ventures Re and the U.S. Insurance Subsidiaries are not authorized to conduct insurance or reinsurance business in Singapore.
25
Canada
AXIS Reinsurance Company conducts (re)insurance business from AXIS Reinsurance Company (Canadian Branch), its branch in Canada, subject to the supervision of the New York Department of Insurance and the Office of the Superintendent of Financial Institutions Canada (“OSFI”), the federal regulatory authority that supervises federal Canadian and non-Canadian insurance companies operating in Canada pursuant to the Insurance Companies Act (Canada). The branch is authorized by OSFI to transact insurance and reinsurance. In addition, the branch is subject to the laws and regulations of each of the provinces and territories in which it is licensed.
AXIS Syndicate is, subject to the laws and regulations of each of the provinces and territories in which it is licensed, authorized to write insurance in or from Canada, with the following exceptions: hail insurance in respect of crop in the province of Quebec; home warranty insurance in the province of British Columbia; life insurance; credit protection insurance; title insurance; and mortgage default insurance. AXIS Syndicate is authorized to write reinsurance in or from Canada subject to certain restrictions relating to life reinsurance.
AXIS Specialty Bermuda, AXIS Re SE, AXIS Specialty Europe, Ventures Re and the other U.S. Insurance Subsidiaries are not authorized to conduct insurance or reinsurance business in Canada.
Australia
AXIS Specialty Europe conducts (re)insurance business from its branch in Australia, subject to the supervision of the CBI and APRA. Significant additional regulation that applies to AXIS Specialty Australia relates to branch capital adequacy, assets in Australia, risk management, reinsurance management, governance and audit and actuarial requirements.
AXIS Syndicate is authorized to write insurance in or from Australia with certain exceptions. AXIS Syndicate is authorized to write reinsurance in or from Australia.
AXIS Specialty Bermuda, AXIS Re SE, Ventures Re and the U.S. Insurance Subsidiaries are not authorized to conduct insurance or reinsurance business in Australia.
Other Countries
The AXIS (re)insurance companies also (re)insure risks in many countries pursuant to regulatory permissions and exemptions available to non-admitted (re)insurers.
AXIS Syndicate may write insurance and reinsurance business where Lloyd's underwriters have authorized status.
EMPLOYEES
As of
February 20, 2015
we had approximately
1,250
employees. We believe that our employee relations are excellent.
AVAILABLE INFORMATION
We are subject to the informational requirements of the Securities Exchange Act of 1934, as amended (the “Exchange Act”), and therefore file periodic reports, proxy statements and other information, including reports filed by officers and directors under Section 16(a) of the Exchange Act, with the Securities and Exchange Commission (“SEC”). The public may read and copy any materials we file with the SEC at the SEC’s Public Reference Room at 100 F Street, NE, Washington, DC 20549. The public may obtain information on the operation of the Public Reference Room by calling the SEC at 1-800-SEC-0330. The SEC maintains an internet site that contains reports, proxy and information statements, and other information regarding issuers that file electronically with the SEC (such as us) and the address of that site is
http://www.sec.gov
. Our common shares are traded on the NYSE with the symbol “AXS” and you can review similar information concerning us at the office of the NYSE at 20 Broad Street, New York, New York, 10005. Our Internet website address is
http://www.axiscapital.com
. Information contained in our website is not part of this report.
We make available free of charge, including through our internet website, our Annual Report on Form 10-K, Quarterly Reports on Form 10-Q, Current Reports on Form 8-K, and amendments to those reports filed or furnished pursuant to
26
Section 13(a) or 15(d) of the Exchange Act as soon as reasonably practicable after such material is electronically filed with, or furnished to, the SEC. Current copies of the charter for each of our Audit Committee, Corporate Governance and Nominating Committee, Compensation Committee, Finance Committee, Executive Committee and Risk Committee, as well as our Corporate Governance Guidelines and Code of Business Conduct, are available on our internet website at
http://www.axiscapital.com
.
|
ITEM 1A.
|
RISK FACTORS
|
You should carefully consider the following risks and all of the other information set forth in this report, including our consolidated financial statements and the notes thereto:
Failure to complete our amalgamation with PartnerRe Ltd. ("PartnerRe") could impact the price of our common shares, as well as our future business and financial results, and could have an adverse effect on us.
On January 25, 2015, we entered into an Agreement and Plan of Amalgamation (the “amalgamation agreement”) with PartnerRe, a Bermuda exempted company, pursuant to which we will amalgamate with PartnerRe and the combined company will continue as a Bermuda exempted company (the “amalgamated company”). The amalgamation agreement contains a number of conditions precedent that must be satisfied or waived prior to the completion of the amalgamation. There are no assurances that all of the conditions to the amalgamation will be so satisfied or waived. If the conditions to the amalgamation are not satisfied or waived, then we and PartnerRe may be unable to complete the amalgamation.
If the amalgamation is not completed, our ongoing business may be adversely affected as follows:
|
•
|
the attention of management will have been diverted to the amalgamation instead of being directed solely to our operations and the pursuit of other opportunities that could have been beneficial to us;
|
|
•
|
under certain circumstances, we may be required to pay PartnerRe a fee of $55 million or $250 million in the event the amalgamation agreement is terminated, and costs and expenses incurred in connection with the transaction in an amount not to exceed $35 million;
|
|
•
|
uncertainties associated with the amalgamation may cause a loss of management personnel and other key employees or result in the departure some of our customers, which could adversely affect our business;
|
|
•
|
we would have incurred fees and costs such as legal, accounting and financial advisor fees;
|
|
•
|
we will be subject to business uncertainties and contractual restrictions while the proposed amalgamation is pending, which could adversely affect our business; and
|
|
•
|
the loss of time and resources.
|
Our results of operations and financial condition could be materially adversely affected by the occurrence of natural and man-made disasters.
We have substantial exposure to unexpected losses resulting from natural disasters, man-made catastrophes and other catastrophe events. Catastrophes can be caused by various events, including hurricanes, typhoons, earthquakes, hailstorms, floods, explosions, severe winter weather, fires, and other natural or man-made disasters. The incidence and severity of catastrophes are inherently unpredictable and our losses from catastrophes could be substantial.
Increases in the values and concentrations of insured property may increase the severity of these occurrences in the future. Also, changes in global climate conditions may further increase the frequency and severity of catastrophe activity and losses in the future. Examples of the impact of catastrophe events include our recognition of the net losses and loss expenses of:
|
•
|
$201 million, in aggregate, relating to various worldwide natural catastrophe and weather-related events in 2013;
|
|
•
|
$331 million in relation to Storm Sandy in 2012;
|
|
•
|
$789 million, in aggregate, in relation to the February and June earthquakes near Christchurch, New Zealand, the Japanese earthquake and tsunami, first quarter Australian weather events and the Thai floods in 2011;
|
|
•
|
$256 million, in aggregate, in relation to the Chilean and September New Zealand earthquakes in 2010; and
|
|
•
|
$408 million, in aggregate, in relation to Hurricanes Ike and Gustav in 2008.
|
27
These events materially reduced our net income in the years noted above. Although we attempt to manage our exposure to such events through the use of underwriting controls and the purchase of third-party reinsurance, catastrophe events are inherently unpredictable and the actual nature of such events when they occur could be more frequent or severe than contemplated in our pricing and risk management expectations. As a result, the occurrence of one or more catastrophe events could have a material adverse effect on our results of operations or financial condition.
The (re)insurance business is historically cyclical, and we expect to experience periods with excess underwriting capacity and unfavorable premium rates.
The (re)insurance business historically has been a cyclical industry characterized by periods of intense price competition due to excessive underwriting capacity as well as periods when shortages of capacity permitted favorable premium levels. An increase in premium levels is often offset by an increasing supply of (re)insurance capacity, via capital provided by new entrants, new capital market instruments and structures and/or the commitment of additional capital by existing (re)insurers, which may cause prices to decrease. Any of these factors could lead to a significant reduction in premium rates, less favorable policy terms and fewer submissions for our underwriting services. In addition to these considerations, changes in the frequency and severity of losses suffered by insureds and insurers may affect the cycles of the (re)insurance business significantly.
Our investment and derivative instrument portfolios are exposed to significant capital markets risk related to changes in interest rates, credit spreads and equity prices as well as other risks, which may adversely affect our results of operations, financial condition or cash flows.
The performance of our cash and investments portfolio has a significant impact on our financial results. A failure to successfully execute our investment strategy could have a significant impact on our results of operations or financial condition.
Our investment portfolio is subject to a variety of market risks, including risks relating to general economic conditions, interest rate fluctuations, equity price risk, foreign currency movements, pre-payment or reinvestment risk, liquidity risk and credit risk. Although we attempt to manage market risks through, among other things, stressing diversification and conservation of principal and liquidity in our investment guidelines, it is possible that, in periods of economic weakness or periods of turmoil in capital markets, we may experience significant losses in our portfolio.
Our fixed maturities, which represent
88%
of our total investments and
81%
of total cash and investments at
December 31, 2014
, may be adversely impacted by changes in interest rates. Increases in interest rates could cause the fair value of our investment portfolio to decrease, resulting in a lower book value (refer to Item 7A
'Quantitative and Qualitative Disclosure About Market Risk'
for a related sensitivity analysis).
In addition, a low interest rate environment, such as the current environment, can result in reductions in our investment yield as new funds and proceeds from sales and maturities of fixed income securities are invested at lower rates. This reduces our overall profitability. Interest rates are highly sensitive to many factors, including governmental monetary policies, inflation, domestic and international economic and political conditions and other factors beyond our control.
Our portfolios of "other investments" and equity securities expose us to market price variability, driven by a number of factors outside our control including, but not limited to, global equity market performance.
Given our reliance on external investment managers, we are also exposed to operational risks, which may include, but are not limited to, a failure to follow our investment guidelines, technological and staffing deficiencies and inadequate disaster recovery plans.
Our derivative instrument counterparties may default on amounts owed to us due to bankruptcy, insolvency, lack of liquidity, adverse economic conditions, operational failure, fraud or other reasons. Even if we are entitled to collateral in circumstances of default, such collateral may be illiquid or proceeds from such collateral when liquidated may not be sufficient to recover the full amount of the obligation.
28
Global economic conditions could materially and adversely affect our business, results of operations and financial condition.
During the financial crisis of 2008 and 2009, worldwide financial markets experienced unprecedented volatility and disruption including, among other things, dislocation in the mortgage and asset-backed securities markets, deleveraging and decreased liquidity generally, widening of credit spreads, bankruptcies and government intervention in a number of large financial institutions. These events resulted in extraordinary responses by governments worldwide, including the enactment of the Emergency Economic Stabilization Act of 2008 and the U.S. Recovery and Reinvestment Act in 2009 and the Dodd-Frank Wall Street Reform and Consumer Protection Act of 2010 ("Dodd Frank"). This market turmoil affected (among other aspects of our business) the demand for and claims made under our products, the ability of customers, counterparties and others to establish or maintain their relationships with us, our ability to access and efficiently use internal and external capital resources and our investment performance. Although there have been indicators of stability returning to the financial markets, there continues to be significant uncertainty regarding the timeline for a full global economic recovery. As such, evolving market conditions may continue to affect our results of operations, financial position and capital resources. In the event that there is additional deterioration or volatility in financial markets or general economic conditions, our results of operations, financial position and/or liquidity, and competitive landscape could be materially and adversely affected.
We could face unanticipated losses from war, terrorism and political unrest, and these or other unanticipated losses could have a material adverse effect on our financial condition, results of operations and/or liquidity.
We have substantial exposure to unexpected losses resulting from war, acts of terrorism and political instability. In certain instances, we specifically (re)insure risks resulting from acts of terrorism. Even in cases where we attempt to exclude losses from terrorism and certain other similar risks from some coverages written by us, there can be no assurance that a court or arbitration panel will interpret policy language or otherwise issue a ruling favorable to us. Accordingly, we can offer no assurance that our reserves will be adequate to cover losses should they materialize.
We have limited terrorism coverage in our own reinsurance program for our exposure to catastrophe losses related to acts of terrorism. Furthermore, although the Terrorism Risk Insurance Extension Act of 2005 (“TRIEA”) provides benefits in the event of certain acts of terrorism, those benefits are subject to a deductible and to other limitations. Under TRIEA, once our losses attributable to certain acts of terrorism exceed 20% of our direct commercial property and liability insurance premiums for the preceding calendar year, the federal government will reimburse us for 85% of such losses in excess of this deductible. Notably, TRIEA does not provide coverage for reinsurance losses. Given the unpredictable frequency and severity of terrorism losses, as well as the limited terrorism coverage in our own reinsurance program, future losses from acts of terrorism could materially and adversely affect our results of operations, financial condition and/or liquidity in future periods. TRIEA expired at the end of 2014 but was reauthorized, with some adjustments to its provisions, in January 2015 for six years through December 31, 2020. Over the six-year life of the reauthorized program, the federal government reimbursement percentage will drop from 85% to 80%.
Our credit and political risk insurance line of business protects insureds with interests in foreign jurisdictions in the event governmental action prevents them from exercising their contractual rights and may also protect their assets against physical damage perils. The insurance provided may include cover for loss arising from expropriation, forced abandonment, license cancellation, trade embargo, contract frustration, non-payment, war on land or political violence (including terrorism, revolution, insurrection and civil unrest).
Our credit and political risk line of business also provides non-payment coverage on specific loan obligations. We insure sovereign non-payment and corporate non-payment as a result of commercial as well as political risk events. The vast majority of the corporate non-payment credit insurance provided is for single-named illiquid risks, primarily in the form of senior bank loans that can be individually analyzed and underwritten. We avoid insurance for structured finance products defined by pools of risks and insurance for synthetic products that would expose us to mark-to-market losses. We also avoid terms in our credit insurance contracts which introduce liquidity risk, most notably, in the form of a collateralization requirement upon a ratings downgrade. Although we also attempt to manage our exposure, by among other things, setting credit limits by country, region, industry and individual counterparty and regularly reviewing our aggregate exposures, the occurrence of one or more large losses on our credit insurance portfolio could have a material adverse effect on our results of operations or financial condition.
29
If actual claims exceed our loss reserves, our financial results could be adversely affected.
While we believe that our loss reserves at
December 31, 2014
are adequate, new information, events or circumstances, unknown at the original valuation date, may lead to future developments in our ultimate losses being significantly greater or less than the reserves currently provided. The actual final cost of settling claims outstanding at
December 31, 2014
as well as claims expected to arise from the unexpired period of risk is uncertain. There are many other factors that would cause our reserves to increase or decrease, which include, but are not limited to, changes in claim severity, changes in the expected level of reported claims, judicial action changing the scope and/or liability of coverage, changes in the legislative, regulatory, social and economic environment and unexpected changes in loss inflation.
Our thirteen-year operating history, which includes periods of rapid growth, means that our loss reserve estimate places more reliance on industry benchmarks than may be the case for companies with longer operating histories; as a result, the potential for volatility in our estimated loss reserves may be more pronounced. When establishing our single point best estimate of loss reserves at
December 31, 2014
, our management considered actuarial estimates and applied informed judgment regarding qualitative factors that may not be fully captured in actuarial estimates. Such factors included, but were not limited to: the timing of the emergence of claims, volume and complexity of claims, social and judicial trends, potential severity of individual claims and the extent of internal historical loss data versus industry information.
Changes to our previous estimate of prior year loss reserves can adversely impact the reported calendar year underwriting results if reserves prove to be insufficient or favorably impact our reported results if loss reserves prove to be higher than actual claim payments. If our net income is insufficient to absorb a required increase in our loss reserves, we would incur an operating loss and could incur a reduction of our capital.
The effects of emerging claim and coverage issues on our business are uncertain.
As industry practices and legal, judicial, social, political and other environmental conditions change, unexpected issues related to claims and coverage may emerge. These issues may adversely affect our business by either extending coverage beyond our underwriting intent or by increasing the frequency and/or severity of claims. For example, the global financial crisis resulted in a higher level of claim activity on professional lines (re)insurance business. In some instances, these changes may not become apparent until some time after we have issued the insurance or reinsurance contracts that are affected by the changes. In addition, our actual losses may vary materially from our current estimate of the loss based on a number of factors (see ‘
If actual claims exceed our loss reserves, our financial results could be adversely affected’
above). As a result, the full extent of liability under an insurance or reinsurance contract may not be known for many years after such contract is issued and a loss occurs.
The failure of any of the loss limitation methods we employ could have a material adverse effect on our results of operations or financial condition.
We seek to mitigate our loss exposure by writing a number of our (re)insurance contracts on an excess of loss basis. Excess of loss (re)insurance indemnifies the insured against losses in excess of a specified amount. We generally limit the program size for each client on our insurance business and purchase reinsurance for many of our lines of business. In the case of proportional reinsurance treaties, we seek per occurrence limitations or loss and loss expense ratio caps to limit the impact of losses from any one event. In proportional reinsurance, the reinsurer shares a proportional part of the premiums and losses of the reinsured. We also seek to limit our loss exposure through geographic diversification. Geographic zone limitations involve significant underwriting judgments, including the determination of the area of the zones and the inclusion of a particular policy within a particular zone’s limits. In addition, various provisions of our insurance policies and reinsurance contracts, such as limitations or exclusions from coverage or choice of forum negotiated to limit our risks may not be enforceable in the manner we intend. We cannot be sure that any of these loss limitation methods will be effective and mitigate our loss exposure. As a result of these risks, one or more catastrophe or other events could result in claims that substantially exceed our expectations, which could have a material adverse effect on our results of operations or financial condition.
30
We utilize models to assist our decision making in key areas such as underwriting, reserving, reinsurance purchasing and the evaluation of our catastrophe risk but actual results could differ materially from model output.
We employ various modeling techniques (e.g. scenarios, predictive, stochastic and/or forecasting) to analyze and estimate exposures, loss trends and other risks associated with our assets and liabilities. We utilize modeled outputs and related analyses to assist us in decision-making, for example related to underwriting and pricing, reserving, reinsurance purchasing and the evaluation of our catastrophe risk through estimates of probable maximum losses, or "PMLs". The modeled outputs and related analyses are subject to various assumptions, uncertainties and the inherent limitations of any statistical analysis, including the use of historical internal and industry data. Consequently, our actual losses from natural catastrophes, whether from individual components (e.g. wind, flood, earthquake, etc.) or in the the aggregate, may differ materially from our modeled results. If, based upon these models or other factors, we misprice our products or underestimate the frequency and/or severity of loss events, our results of operations or financial condition may be adversely affected.
With respect to the evaluation of our catastrophe risk, our modeling utilizes a mix of historical data, scientific theory and mathematical methods. Output from multiple commercially available vendor models serves as a key input in our PML estimation process. We believe that there is considerable uncertainty in the data and parameter inputs for these vendor models. In that regard, there is no universal standard in the preparation of insured data for use in the models and the running of modeling software. In our view, the accuracy of the models depends heavily on the availability of detailed insured loss data from actual recent large catastrophes. Due to the limited number of events, there is significant potential for substantial differences between the modeled loss estimate and actual company experience for a single large catastrophe event. This potential difference could be even greater for perils with limited or no modeled annual frequency. We perform our own vendor model validation (including sensitivity analysis and backtesting, where possible) and supplement model output with historical loss information and analysis and management judgment. In addition, we derive our own estimates for non-modeled perils. Despite this, our PML estimates are subject to a high degree of uncertainty and our actual losses from catastrophe events may differ materially.
The risk associated with reinsurance underwriting could adversely affect us.
We do not always separately evaluate each of the individual risks assumed under reinsurance treaties, which is common amongst reinsurers. Therefore, we are largely dependent on the original underwriting decisions made by ceding companies. We are subject to the risk that the ceding companies may not have adequately evaluated the risks to be reinsured and that the premiums ceded may not adequately compensate us for the risks we assume.
We could be materially adversely affected if managing general agents, general agents and other producers in our program business exceed their underwriting authorities or otherwise breach obligations owed to us.
In program business conducted by our insurance segment, following our underwriting, financial, claims and information technology due diligence reviews, we authorize managing general agents, general agents and other producers to write business on our behalf within underwriting authorities prescribed by us. Once a program commences, we must rely on the underwriting controls of these agents to write business within the underwriting authorities provided by us. Although we monitor our programs on an ongoing basis, our monitoring efforts may not be adequate or our agents may exceed their underwriting authorities or otherwise breach obligations owed to us. To the extent that our agents exceed their authorities or otherwise breach obligations owed to us in the future, our results of operations and financial condition could be materially adversely affected.
If we choose to purchase reinsurance, we may be unable to do so, and if we successfully purchase reinsurance, we may be unable to collect amounts due to us.
We purchase reinsurance for our (re)insurance operations in order to mitigate the volatility of losses upon our financial results.
From time to time, market conditions have limited, and in some cases have prevented, (re)insurers from obtaining the types and amounts of reinsurance that they consider adequate for their business needs. There is no guarantee that our desired amounts of reinsurance or retrocessional reinsurance will be available in the marketplace in the future. In addition to capacity risk, the remaining capacity may not be on terms we deem appropriate or acceptable or with companies with whom we want to do business.
31
A reinsurer’s insolvency, or inability or refusal to make payments under the terms of its reinsurance agreement with us, could have a material adverse effect on our business because we remain liable to the insured. We face counterparty risk whenever we purchase reinsurance or retrocessional reinsurance. Consequently, the insolvency, inability or unwillingness of any of our present or future reinsurers to make timely payments to us under the terms of our reinsurance or retrocessional agreements could have an adverse effect on us.
If we experience difficulties with technology and/or data security, our ability to conduct our business might be negatively impacted.
While technology can streamline many business processes and ultimately reduce the cost of operations, technology initiatives present certain risks. Our business is dependent upon our employees’ and outsourcers’ ability to perform, in an efficient and uninterrupted fashion, necessary business functions such as processing policies and paying claims. A shutdown or inability to access one or more of our facilities, a power outage, or a failure of one or more of our information technology, telecommunications or other systems could significantly impair our ability to perform such functions on a timely basis. If sustained or repeated, such a business interruption, system failure or service denial could result in a deterioration of our ability to write and process business, provide customer service, pay claims in a timely manner or perform other necessary business functions. Computer viruses, hackers and other external hazards including catastrophe events could expose our data systems to security breaches. These risks could expose us to data loss and damages. As a result, our ability to conduct our business might be adversely affected.
While we have not experienced a material breach of cybersecurity to date, we have no assurance that such a breach will not occur in the future. While administrative and technical controls, along with other preventative actions, reduce the risk of cyber incidents and protect our information technology, they may be insufficient to prevent cyber attacks and/or other security breaches to our computer systems.
Our business may be adversely affected if third-party outsourced service providers fail to satisfactorily perform certain technology and business process functions.
We outsource certain technology and business process functions to third parties and may do so increasingly in the future. If we do not effectively develop and implement our outsourcing strategy, third party providers do not perform as anticipated or we experience technological or other problems with a transition, we may not realize productivity improvements or cost efficiencies and may experience operational difficulties, increased costs and a loss of business. Our outsourcing of certain technology and business process functions to third parties may expose us to enhanced risk related to data security, which could result in monetary and reputational damages. In addition, our ability to receive services from third party providers might be impacted by cultural differences, political instability, unanticipated regulatory requirements or policies. As a result, our ability to conduct our business might be adversely affected.
Our operating results may be adversely affected by currency fluctuations.
Our reporting currency is the U.S. dollar. However, a portion of our gross premiums are written in currencies other than the U.S. dollar and a portion of our loss reserves are in non-U.S. currencies. In addition, a portion of our investment portfolio is denominated in currencies other than the U.S dollar. From time to time, we may experience losses resulting from fluctuations in the values of these non-U.S. currencies, which could adversely affect our operating results. Although we attempt to manage our foreign currency exposure through matching of our major foreign-denominated assets and liabilities, as well as through use of currency derivatives, there is no guarantee that we will successfully mitigate our exposure to foreign exchange losses.
We may require additional capital in the future, which may not be available or may only be available on unfavorable terms.
Our future capital requirements depend on many factors, including regulatory requirements, our ability to write new business successfully, the frequency and severity of catastrophe events and our ability to establish premium rates and reserves at levels sufficient to cover losses. We may need to raise additional funds through financings. If we are unable to do so, it may curtail our growth and reduce our assets. Any equity or debt financing, if available at all, may be on terms that are not favorable to us. Equity financings could be dilutive to our existing shareholders and could result in the issuance of securities that have rights, preferences and privileges that are senior to those of our other securities. If we cannot obtain adequate capital on favorable terms or at all, our business, operating results and financial condition could be adversely affected.
32
Our inability to obtain the necessary credit could affect our ability to offer reinsurance in certain markets.
Neither AXIS Specialty Bermuda nor AXIS Re SE is licensed or admitted as a (re)insurer in any jurisdiction other than Bermuda, Ireland and Singapore. Because the U.S. and some other jurisdictions do not permit insurance companies to take credit on their statutory financial statements for reinsurance obtained from unlicensed or non-admitted insurers unless appropriate security mechanisms are in place, our reinsurance clients in these jurisdictions typically require AXIS Specialty Bermuda and AXIS Re SE to provide letters of credit or other collateral. Our credit facilities are used to post letters of credit. However, if our credit facilities are not sufficient or if we are unable to renew our credit facilities or arrange for other types of security on commercially affordable terms, AXIS Specialty Bermuda and AXIS Re SE could be limited in their ability to write business for some of our clients.
A downgrade in our financial strength or credit ratings by one or more rating agencies could materially and negatively impact our business, financial condition, results of operations and/or liquidity
.
As our ability to underwrite business is dependent upon the quality of our claims paying and financial strength ratings as evaluated by independent rating agencies. A downgrade, withdrawal or negative watch/outlook by any of these institutions could cause our competitive position in the (re)insurance industry to suffer and make it more difficult for us to market our products. If we experience a credit rating downgrade, withdrawal or negative watch/outlook in the future, we could incur higher borrowing costs and may have more limited means to access capital. A downgrade, withdrawal or negative watch/outlook could also result in a substantial loss of business for us, as ceding companies and brokers that place such business may move to other (re)insurers with higher ratings.
The regulatory system under which we operate, and potential changes thereto, could have a material adverse effect on our business.
In a time of financial uncertainty or a prolonged economic downturn or recession, regulators may choose to adopt more restrictive insurance laws and regulations, which may result in lower revenues and/or higher costs and thus could materially and adversely affect our results of operations.
Our (re)insurance subsidiaries conduct business globally and our businesses in each of these jurisdictions are subject to varying degrees of regulation and supervision. The laws and regulations of the jurisdictions in which our (re)insurance subsidiaries are domiciled require, among other things, that our subsidiaries maintain minimum levels of statutory capital and liquidity, meet solvency standards, participate in guaranty funds and submit to periodic examinations of their financial condition and compliance with underwriting regulations. These laws and regulations also limit or restrict payments of dividends and reductions in capital. Statutes, regulations and policies may also restrict the ability of these subsidiaries to write (re)insurance contracts, to make certain investments and to distribute funds. The purpose of insurance laws and regulations generally is to protect insureds and ceding insurance companies, not our shareholders. We may not be able to comply fully with, or obtain appropriate exemptions from, these statutes and regulations. Failure to comply with or to obtain appropriate authorizations and/or exemptions under any applicable laws could result in restrictions on our ability to do business or undertake activities that are regulated in one or more of the jurisdictions in which we conduct business and could subject us to fines and other sanctions. In addition, changes in the laws or regulations to which our (re)insurance subsidiaries are subject or in the interpretation thereof by enforcement or regulatory agencies could have an adverse effect on our business.
33
Potential government intervention in our industry as a result of recent events and instability in the marketplace for insurance products could hinder our flexibility and negatively affect the business opportunities that may be available to us in the market.
Government intervention and the possibility of future government intervention have created uncertainty in the (re)insurance markets. Government regulators are generally concerned with the protection of policyholders to the possible detriment of other constituents, including shareholders of (re)insurers. An example of such intervention was the expansion of the Florida Hurricane Catastrophe Fund in 2007, which increased the capacity of the Fund to compete against commercial providers of catastrophe reinsurance. In addition, in December 2007, the TRIEA of 2007 extended the material provisions of TRIA for an additional seven years to December 31, 2014 and expanded coverage to include domestic acts of terrorism. TRIEA expired at the end of 2014 but was reauthorized, with some adjustments to its provisions, in January 2015 for six years through December 31, 2020.
In recent years certain U.S. and non-U.S. judicial and regulatory authorities, including U.S. Attorney’s Offices and certain state attorneys general, have commenced investigations into other business practices in the insurance industry. In addition, although the U.S. federal government has not historically regulated insurance, there have been proposals from time to time, and especially after the recent global financial crisis, to impose federal regulation on the insurance industry. For example, in 2010, Dodd-Frank established a Federal Insurance Office ("FIO") within the U.S. Treasury. The FIO initially has limited regulatory authority and is empowered to gather data and information regarding the insurance industry, and has conducted and submitted a study to the U.S. Congress on how to modernize and improve insurance regulation in the U.S. This study's findings are not expected to have a significant impact on the Company. Further, Dodd-Frank gives the Federal Reserve supervisory authority over a number of financial services companies, including insurance companies, if they are designated by a two-thirds vote of a Financial Stability Oversight Council as ‘systemically important’. While we do not believe that we are systemically important, as defined in Dodd-Frank, Dodd-Frank or additional federal regulation that is adopted in the future could impose significant burdens on us, impact the ways in which we conduct our business, increase compliance costs, duplicate state regulation and/or result in a competitive disadvantage.
Certain of our European legal entities will be subject to Solvency II regulations once it becomes effective on January 1, 2016. Solvency II is a consolidation and modernization of existing European Commission (“E.C.”) Solvency I (re)insurance regulation and supervision and includes a risk based solvency and capital regime. The new regulations cover three main areas: (i) the valuation of assets and liabilities and solvency and capital requirements; (ii) governance requirements including compliance, internal audit, actuarial and risk management; and (iii) new supervisory legal entity and European Union group reporting and disclosure requirements including public disclosures. The Bermuda Monetary Authority (“BMA”) is seeking “equivalence” under the Solvency II directive and the European Insurance Occupational Pension Authority (“EIOPA”) has completed an equivalence assessment noting that the BMA meets the criteria set out in EIOPA's methodology for equivalence assessments under Solvency II for Class 4 insurers but with certain caveats. It is the responsibility of the E.C. to grant full equivalence. The Solvency II directive may require us to incur considerable expense in order to comply with its requirements. Solvency II could also increase our compliance costs and impact the way in which we conduct our business and govern our subsidiaries. Furthermore, the adoption of new solvency and capital standards could impact the levels of capital required to operate our Bermuda and European subsidiaries.
While we cannot predict the exact nature, timing or scope of possible governmental initiatives, such proposals could adversely affect our business by, among other things:
|
•
|
Providing reinsurance capacity in markets and to consumers that we target;
|
|
•
|
Requiring our further participation in industry pools and guaranty associations;
|
|
•
|
Expanding the scope of coverage under existing policies; e.g., following large disasters;
|
|
•
|
Further regulating the terms of (re)insurance contracts; or
|
|
•
|
Disproportionately benefiting the companies of one country over those of another.
|
Since we depend on a few brokers for a large portion of our revenues, loss of business provided by any one of them could adversely affect us.
We market our (re)insurance worldwide primarily through (re)insurance brokers and derive a significant portion of our business from a limited number of brokers. Marsh & McLennan Companies, Inc., including its subsidiary Guy Carpenter & Company, Inc., Aon Corporation and Willis Group Holdings Ltd., provided a total of
56%
of our gross premiums written during
2014
. Our relationships with these brokers are based on the quality of our underwriting and claim services, as well as
34
our financial strength ratings. Any deterioration in these factors could result in the brokers advising our clients to place their business with other (re)insurers. In addition, these brokers also have, or may in the future acquire, ownership interests in insurance and reinsurance companies that may compete with us and these brokers may favor their own (re)insurers over other companies. Loss of all or a substantial portion of the business provided by one or more of these brokers could have a material adverse effect on our business.
Our reliance on brokers subjects us to credit risk.
In accordance with industry practice, we pay amounts owed on claims under our (re)insurance contracts to brokers, and these brokers pay these amounts over to the clients that have purchased (re)insurance from us. Although the law is unsettled and depends upon the facts and circumstances of the particular case, in some jurisdictions, if a broker fails to make such a payment, we might remain liable to the insured or ceding insurer for the deficiency.
Conversely, in certain jurisdictions, when the insured or ceding insurer pays premiums for these policies to brokers for payment over to us, these premiums might be considered to have been paid and the insured or ceding insurer will no longer be liable to us for those amounts, whether or not we have actually received the premiums from the broker. Consequently, we assume a degree of credit risk associated with brokers with whom we transact business. These risks are heightened during periods characterized by financial market instability and/or an economic downturn or recession.
Certain of our policyholders and intermediaries may not pay premiums owed to us due to insolvency or other reasons.
Insolvency, liquidity problems, distressed financial condition or the general effects of economic recession may increase the risk that policyholders or intermediaries, such as insurance brokers, may not pay a part of or the full amount of premiums owed to us, despite an obligation to do so. The terms of our contracts may not permit us to cancel our insurance even though we have not received payment. If non-payment becomes widespread, whether as a result of insolvency, lack of liquidity, adverse economic conditions, operational failure or otherwise, it could have a material adverse impact on our revenues and results of operations.
We could be adversely affected by the loss of one or more key executives or by an inability to attract and retain qualified personnel.
Our success depends on our ability to retain the services of our existing key executives and to attract and retain additional qualified personnel in the future. The loss of the services of any of our key executives or the inability to hire and retain other highly qualified personnel in the future could adversely affect our ability to conduct our business. There can be no assurance that we will be successful in identifying, hiring or retaining successors on terms acceptable to us or on any terms.
Under Bermuda law, non-Bermudians, with some limited exceptions, may not engage in any gainful occupation in Bermuda without an appropriate governmental work permit. Work permits may be granted or extended by the Bermuda government only upon showing that, after proper public advertisement in most cases, no Bermudian or spouse of a Bermudian, holder of a permanent resident certificate or holder of a working resident certificate who meets the minimum standard requirements for the advertised position has applied for the position. Work permits may be requested for one, three, five, six or, in certain circumstances for key executives, ten years. In January 2013, the Bermuda government abolished term limits. This removed the immigration policy put in place in 2001, which limited the duration of work permits for between six to nine years. All executive officers who work in our Bermuda office that require work permits have obtained them.
Competition in the insurance industry could reduce our growth and profitability.
The (re)insurance industry is highly competitive. We compete on an international and regional basis with major U.S., Bermuda, European and other international (re)insurers and underwriting syndicates, including Lloyd's some of which have greater financial, marketing and management resources than we do. We also compete with new companies that continue to be formed to enter the (re)insurance markets. In addition, capital market participants have recently created alternative products that are intended to compete with reinsurance products. Increased competition could result in fewer submissions, lower premium rates, less favorable policy terms and conditions and greater costs of customer acquisition and retention. In addition, if industry pricing does not meet our hurdle rate, we may reduce our future underwriting activities. These factors could have a material adverse effect on our growth and profitability.
35
Our ability to pay dividends and to make payments on indebtedness may be constrained by our holding company structure.
AXIS Capital is a holding company and has no direct operations of its own. AXIS Capital has no significant operations or assets other than its ownership of the shares of its operating (re)insurance subsidiaries, AXIS Specialty Bermuda, AXIS Re SE, AXIS Specialty Europe, AXIS Re U.S., AXIS Specialty U.S., AXIS Surplus and AXIS Insurance Co. (collectively, our “Insurance Subsidiaries”). Dividends and other permitted distributions from our Insurance Subsidiaries (in some cases through our subsidiary holding companies), are our primary source of funds to meet ongoing cash requirements, including debt service payments and other expenses, and to pay dividends to our shareholders. Our Insurance Subsidiaries are subject to significant regulatory restrictions limiting their ability to declare and pay dividends and make distributions. The inability of our Insurance Subsidiaries to pay dividends in an amount sufficient to enable us to meet our cash requirements at the holding company level could have a material adverse effect on our business and our ability to pay dividends and make payments on our indebtedness.
Global climate change may have a material adverse effect on our results of operation and financial condition if we are not able to adequately assess and reserve for the increased frequency and severity of catastrophes resulting from these environmental factors.
The frequency and severity of natural catastrophe activity, including hurricanes, tornadoes, floods and droughts, has been greater in recent years. Atmospheric concentrations of carbon dioxide and other greenhouse gases have increased dramatically since the industrial revolution and there is debate as to whether this has caused a gradual increase in global average temperatures. Increasing global average temperatures may continue in the future and could impact our business in the long-term. However, there is no clear consensus in the scientific community regarding the effect of global environmental factors on the frequency and severity of catastrophes. Climatologists concur that heat from the ocean drives hurricanes, but they cannot agree on how much ocean temperature changes alter the annual outlook. In addition, it is unclear whether rising sea temperatures are part of a longer cycle.
We attempt to mitigate the risk of financial exposure from climate change through our underwriting risk management practices. This includes sensitivity to geographic concentrations of risks, the purchase of protective reinsurance and selective underwriting criteria which can include, but is not limited to, higher premiums and deductibles and more specifically excluded policy risks. However, given the scientific uncertainty about the causes of increased frequency and severity of catastrophes and the lack of adequate predictive tools, a continuation and worsening of recent trends may have a material impact on our results of operation or financial condition.
AXIS Capital is a Bermuda company and it may be difficult for you to enforce judgments against it or its directors and executive officers.
AXIS Capital is incorporated pursuant to the laws of Bermuda and our business is based in Bermuda. In addition, some of our directors and officers reside outside the United States, and all or a substantial portion of our assets and the assets of such persons are located in jurisdictions outside the United States. As a result, it may be difficult or impossible to effect service of process within the United States upon those persons or to recover against us or them on judgments of U.S. courts, including judgments predicated upon civil liability provisions of the U.S. federal securities laws. Further, it may not be possible to bring a claim in Bermuda against us or our directors and officers for violation of U.S. federal securities laws because these laws may have no extraterritorial application under Bermuda law and do not have force of law in Bermuda. A Bermuda court may, however, impose civil liability, including the possibility of monetary damages, on us or our directors and officers if the facts alleged in a complaint constitute or give rise to a cause of action under Bermuda law.
There are provisions in our organizational documents that may reduce or increase the voting rights of our shares.
Our bye-laws generally provide that shareholders have one vote for each common share held by them and are entitled to vote, on a non-cumulative basis, at all meetings of shareholders. However, the voting rights exercisable by a shareholder may be limited so that certain persons or groups are not deemed to hold 9.5% or more of the voting power conferred by our shares. Under these provisions, some shareholders may have the right to exercise their voting rights limited to less than one vote per share. Moreover, these provisions could have the effect of reducing the voting power of some shareholders who would not otherwise be subject to the limitation by virtue of their direct share ownership. In addition, our board of directors may limit a shareholder’s exercise of voting rights where it deems it necessary to do so to avoid adverse tax, legal or regulatory consequences.
36
We also have the authority under our bye-laws to request information from any shareholder for the purpose of determining whether a shareholder’s voting rights are to be limited pursuant to the bye-laws. If a shareholder fails to respond to our request for information or submits incomplete or inaccurate information in response to a request by us, we may, in our sole discretion, eliminate the shareholder’s voting rights.
There are provisions in our bye-laws that may restrict the ability to transfer common shares and which may require shareholders to sell their common shares.
Our board of directors may decline to register a transfer of any common shares under some circumstances, including if they have reason to believe that any non-de minimis adverse tax, regulatory or legal consequences to us, any of our subsidiaries or any of our shareholders may occur as a result of such transfer. Our bye-laws also provide that if our board of directors determines that share ownership by a person may result in non-de minimis adverse tax, legal or regulatory consequences to us, any of our subsidiaries or any of our shareholders, then we have the option, but not the obligation, to require that shareholder to sell to us or to third parties to whom we assign the repurchase right for fair value the minimum number of common shares held by such person which is necessary to eliminate the non-de minimis adverse tax, legal or regulatory consequences.
Applicable insurance laws may make it difficult to effect a change of control of our company.
Before a person can acquire control of a U.S. insurance company, prior written approval must be obtained from the insurance commissioner of the state where the domestic insurer is domiciled. Prior to granting approval of an application to acquire control of a domestic insurer, the state insurance commissioner will consider such factors as the financial strength of the acquirer, the integrity and management of the acquirer’s board of directors and executive officers, the acquirer’s plans for the future operations of the domestic insurer and any anti-competitive results that may arise from the consummation of the acquisition of control. Generally, state statutes provide that control over a domestic insurer is presumed to exist if any person, directly or indirectly, owns, controls, holds with the power to vote, or holds proxies representing, 10% or more of the voting securities of the domestic insurer. Because a person acquiring 10% or more of our common shares would indirectly control the same percentage of the stock of the AXIS U.S. Subsidiaries, the insurance change of control laws of Connecticut, Illinois and New York would likely apply to such a transaction.
In addition, the Insurance Acts and Regulations in Ireland require that anyone acquiring or disposing of a direct or indirect holding in an Irish authorized insurance company (such as AXIS Specialty Europe) that represents 10% or more of the capital or of the voting rights of such company or that makes it possible to exercise a significant influence over the management of such company, or anyone who proposes to decrease or increase that holding to specified levels, must first notify the CBI of their intention to do so. They also require any Irish authorized insurance company that becomes aware of any acquisitions or disposals of its capital involving the specified levels to notify the CBI. The specified levels are 20%, 33% and 50% or such other level of ownership that results in the company becoming the acquirer’s subsidiary within the meaning of article 20 of the European Communities (non-Life Insurance) Framework Regulations 1994.
The CBI has three months from the date of submission of a notification within which to oppose the proposed transaction if the CBI is not satisfied as to the suitability of the acquirer in view of the necessity “to ensure prudent and sound management of the insurance undertaking concerned.” Any person owning 10% or more of the capital or voting rights or an amount that makes it possible to exercise a significant influence over the management of AXIS Capital would be considered to have a “qualifying holding” in AXIS Specialty Europe.
While our bye-laws limit the voting power of any shareholder to less than 9.5%, there can be no assurance that the applicable regulatory body would agree that a shareholder who owned 10% or more of our shares did not, because of the limitation on the voting power of such shares, control the applicable Insurance Subsidiary. These laws may discourage potential acquisition proposals and may delay, deter or prevent a change of control of the Company, including transactions that some or all of our shareholders might consider to be desirable.
Anti-takeover provisions in our bye-laws could impede an attempt to replace our directors or to effect a change in control, which could diminish the value of our common shares.
Our bye-laws contain provisions that may make it more difficult for shareholders to replace directors and could delay or prevent a change of control that a shareholder might consider favorable. These provisions include a staggered board of directors, limitations on the ability of shareholders to remove directors other than for cause, limitations on voting rights and restrictions on transfer of our common shares. These provisions may prevent a shareholder from receiving the benefit from
37
any premium over the market price of our shares offered by a bidder in a potential takeover. Even in the absence of an attempt to effect a change in management or a takeover attempt, these provisions may adversely affect the prevailing market price of our shares if they are viewed as discouraging takeover attempts in the future.
We may become subject to taxes in Bermuda after March 31, 2035, which may have a material adverse effect on our results of operations.
The Bermuda Minister of Finance, under the Exempted Undertakings Tax Protection Act 1966 of Bermuda, as amended, has given each of our Bermuda resident companies an assurance that if any legislation is enacted in Bermuda that would impose tax computed on profits or income, or computed on any capital asset, gain or appreciation, or any tax in the nature of estate duty or inheritance tax, then the imposition of any such tax will not be applicable to our Bermuda resident companies or any of their respective operations, shares, debentures or other obligations until March 31, 2035. Given the limited duration of the Minister of Finance’s assurance, we cannot be certain that we will not be subject to any Bermuda tax after March 31, 2035.
Our non-U.S. companies may be subject to U.S. tax that may have a material adverse effect on our results of operations.
We intend to manage our business so that each of our non-U.S. companies will operate in such a manner that none of these companies should be subject to U.S. tax (other than U.S. excise tax on (re)insurance premium income attributable to insuring or reinsuring U.S. risks and U.S. withholding tax on some types of U.S. source investment income), because none of these companies should be treated as engaged in a trade or business within the United States. However, because there is considerable uncertainty as to the activities that constitute being engaged in a trade or business within the United States, we cannot be certain that the U.S. Internal Revenue Service will not contend successfully that any of its non-U.S. companies is/are engaged in a trade or business in the United States. If any of our non-U.S. companies were considered to be engaged in a trade or business in the United States, it could be subject to U.S. corporate income and additional branch profits taxes on the portion of its earnings effectively connected to such U.S. business. If this were to be the case, our results of operations could be materially adversely affected.
Our non-U.K. companies may be subject to U.K. tax that may have a material adverse effect on our results of operations.
We intend to operate in such a manner so that none of our non-U.K. companies, should be resident in the United Kingdom for tax purposes and that none of our non-U.K. resident companies, other than AXIS Specialty Europe, should have a permanent establishment in the United Kingdom. Accordingly, we expect that none of our non-U.K. resident companies other than AXIS Specialty Europe should be subject to U.K. tax. Nevertheless, because neither case law nor U.K. statutes conclusively define the activities that constitute trading in the United Kingdom through a permanent establishment, the U.K. Inland Revenue might contend successfully that any of our non-U.K. companies, in addition to AXIS Specialty Europe, is/are trading in the United Kingdom through a permanent establishment in the United Kingdom and therefore subject to U.K. tax.
In addition, there are circumstances in which companies that are neither resident in the United Kingdom, nor entitled to the protection afforded by a double tax treaty between the United Kingdom and the jurisdiction in which they are resident, may be exposed to income tax in the United Kingdom (other than by deduction or withholding) on the profits of a trade carried on there even if that trade is not carried on through a permanent establishment. We intend to operate in such a manner that none of our companies will fall within the charge to United Kingdom income tax in this respect.
If any of our non-U.K. resident companies, other than AXIS Specialty Europe were treated as being resident in the United Kingdom for U.K. corporation tax purposes, or if any of our non-U.K. companies other than AXIS Specialty Europe were to be treated as carrying on a trade in the United Kingdom, whether or not through a permanent establishment, our results of operations could be materially adversely affected.
Our U.K. operations may be affected by future changes in U.K. tax law.
Our U.K. resident companies and AXIS Specialty Europe should be treated as taxable in the United Kingdom. Any change in the basis or rate of U.K. corporation tax could materially adversely affect the operations of these companies.
38
Our non-Irish companies may be subject to Irish tax that may have a material adverse effect on our results of operations.
We intend to operate our non-Irish resident companies in such a manner so that none of our non-Irish resident companies, should be resident in Ireland for tax purposes and that they should not be treated as carrying on a trade through a branch or agency in Ireland.
Accordingly, we expect that none of our non-Irish resident companies should be subject to Irish corporation tax. Nevertheless, since the determination as to whether a company is resident in Ireland is a question of fact to be determined based on a number of different factors and since neither case law nor Irish legislation conclusively defines the activities that constitute trading in Ireland through a branch or agency, the Irish Revenue Commissioners might contend successfully that any of our non-Irish companies, is resident in or otherwise trading through a branch or agency in Ireland and therefore subject to Irish corporation tax. If this were the case, our results of operations could be materially adversely affected.
If corporate tax rates in Ireland increase, our results of operations could be materially adversely affected.
Trading income derived from the (re)insurance businesses carried on in Ireland by AXIS Specialty Europe and AXIS Re SE is generally taxed in Ireland at a rate of 12.5%. Over the past number of years, various EU member states have, from time to time, called for harmonization of the corporate tax base within the EU. Ireland, along with other member states, has consistently resisted any movement towards standardized corporate tax rates or tax base in the EU. The Government of Ireland has also made clear its commitment to retain the 12.5% rate of corporation tax. If, however, tax laws in Ireland change so as to increase the general corporation tax rate in Ireland, our results of operations could be materially adversely affected.
If investments held by AXIS Specialty Europe SE or AXIS Re SE are determined not to be integral to the (re)insurance businesses carried on by those companies, additional Irish tax could be imposed and our business and financial results could be materially adversely affected.
Based on administrative practice, taxable income derived from investments made by AXIS Specialty Europe and AXIS Re SE is generally taxed in Ireland at the rate of 12.5% on the grounds that such investments either form part of the permanent capital required by regulatory authorities, or are otherwise integral to the (re)insurance businesses carried on by those companies. AXIS Specialty Europe SE and AXIS Re SE intend to operate in such a manner so that the level of investments held by such companies does not exceed the amount that is integral to the (re)insurance businesses carried on by AXIS Specialty Europe SE and AXIS Re SE. If, however, investment income earned by AXIS Specialty Europe SE or AXIS Re SE is deemed to be non-trading income, Irish corporation tax could apply to such investment income at a higher rate (currently 25%) instead of the general 12.5% rate, and our results of operations could be materially adversely affected.
Changes in U.S. federal income tax law and other tax laws, in particular resulting from the recommendations of the OECD, could materially adversely affect us.
In the past, legislation has been introduced in the U.S. Congress intended to eliminate some perceived tax advantages of companies (including insurance companies) that have legal domiciles outside the United States, but have certain U.S. connections. It is possible that similar legislation could be introduced and enacted by the current Congress or future Congresses that could have an adverse impact on us. In addition, the U.S. federal income tax laws and interpretations are subject to change, possibly on a retroactive basis. New regulations or pronouncements interpreting or clarifying U.S. federal income tax laws relating to insurance companies may be forthcoming. We cannot be certain if, when, or in what form, such regulations or pronouncements may be provided, and whether such guidance will have a retroactive effect.
Internationally, the Organization of Economic Cooperation and Development (“OECD”) has initiated a consultation on Base Erosion and Profit Shifting. There is a risk that the final recommendations of the OECD could be implemented by certain jurisdictions in which we operate and such changes could impact us adversely. We cannot be certain what impact, if any, new tax regimes such as the U.K.'s introduction of a "Diverted Profits Tax" may have on us.
39
Our international business is subject to applicable laws and regulations relating to sanctions and foreign corrupt practices, the violation of which could adversely affect our operations.
We must comply with all applicable economic and financial sanctions, other trade controls and anti-bribery laws and regulations of the U.S. and other foreign jurisdictions where we operate, including the U.K. and the European Community, which apply to our business where we operate. U.S. laws and regulations applicable to us include the economic trade sanctions laws and regulations administered by the United States Department of Treasury’s Office of Foreign Assets Control as well as certain laws administered by the United States Department of State. In addition, we are subject to the Foreign Corrupt Practices Act and other anti-bribery laws such as the U.K. Bribery Act that generally bar corrupt payments or unreasonable gifts to foreign government officials. Although we have policies and controls in place that are designed to ensure compliance with these laws and regulations, it is possible that an employee or an agent acting on our behalf, could fail to comply with applicable laws and regulations and due to the complex nature of the risks, it may not always be possible for us to ascertain compliance with such laws and regulations. In such event, we could be exposed to civil penalties, criminal penalties and other sanctions, including fines or other unintended punitive actions. In addition, such violations could damage our business and/or our reputation. All of the foregoing could have a material adverse effect on our financial condition and operating results.
The price of our common shares may be volatile.
There has been significant volatility in the market for equity securities in recent years. During
2014
,
2013
, and 2012 the price of our common shares fluctuated from a low of $41.82 to a high of $52.21, a low of $34.95 to a high of $49.75 and from a low of $30.35 to a high of $38.80, respectively. On February 19,
2015
, our common shares closed at a price of $52.07. The price of our common shares may not remain at or exceed current levels. The following factors, in addition to those described in other risk factors above, may have an adverse impact on the market price of our common stock:
|
•
|
actual or anticipated variations in our quarterly results, including as a result of catastrophes or our investment performance;
|
|
•
|
our share repurchase program;
|
|
•
|
changes in market valuation of companies in the insurance and reinsurance industry;
|
|
•
|
changes in expectations of future financial performance or changes in estimates of securities analysts;
|
|
•
|
fluctuations in stock market processes and volumes;
|
|
•
|
issuances or sales of common shares or other securities in the future;
|
|
•
|
the addition or departure of key personnel; and
|
|
•
|
announcements by us or our competitors of acquisitions, investments or strategic alliances.
|
Stock markets in the U.S. continue to experience volatile price and volume fluctuations. Such fluctuations, as well as the general political situation, current economic conditions or interest rate or currency rate fluctuations, could adversely affect the market price of our stock.
|
ITEM 1B.
|
UNRESOLVED STAFF COMMENTS
|
We have no outstanding, unresolved comments from the SEC staff at
December 31, 2014
.
|
ITEM 2.
|
PROPERTIES
|
We maintain office facilities in the United States, Bermuda, Europe, Canada, Australia, Singapore and Latin America. We own the property in which our offices are located in Dublin, Ireland, and we lease office space in the other countries. We renew and enter into new leases in the ordinary course of business as required. Our global headquarters is located at 92 Pitts Bay Road, AXIS House, Pembroke HM 08, Bermuda. We believe that our office space is sufficient for us to conduct our operations for the foreseeable future.
40
|
ITEM 3.
|
LEGAL PROCEEDINGS
|
From time to time, we are subject to routine legal proceedings, including arbitrations, arising in the ordinary course of business. These legal proceedings generally relate to claims asserted by or against us in the ordinary course of insurance or reinsurance operations; estimated amounts payable under such proceedings are included in the reserve for losses and loss expenses in our Consolidated Balance Sheets.
We are not party to any material legal proceedings arising outside the ordinary course of business.
|
ITEM 4.
|
MINE SAFETY DISCLOSURES
|
Not Applicable.
|
ITEM 5.
|
MARKET FOR REGISTRANT’S COMMON EQUITY, RELATED STOCKHOLDER MATTERS AND ISSUER PURCHASES OF EQUITY SECURITIES
|
Our common shares are listed on the New York Stock Exchange under the symbol “AXS”. The following table provides the high and low sales prices per share of our common shares for each of the fiscal quarters in the last two fiscal years as reported on the New York Stock Exchange Composite Tape:
|
|
2014
|
2013
|
|||||||||||||||||||||||
|
|
High
|
Low
|
Dividends
Declared
|
High
|
Low
|
Dividends
Declared |
|||||||||||||||||||
|
1st Quarter
|
$
|
47.41
|
|
$
|
41.82
|
|
$
|
0.27
|
|
$
|
41.98
|
|
$
|
34.95
|
|
$
|
0.25
|
|
|||||||
|
2nd Quarter
|
$
|
47.34
|
|
$
|
43.91
|
|
$
|
0.27
|
|
$
|
46.88
|
|
$
|
41.29
|
|
$
|
0.25
|
|
|||||||
|
3rd Quarter
|
$
|
48.66
|
|
$
|
43.00
|
|
$
|
0.27
|
|
$
|
48.39
|
|
$
|
41.87
|
|
$
|
0.25
|
|
|||||||
|
4th Quarter
|
$
|
52.21
|
|
$
|
44.94
|
|
$
|
0.29
|
|
$
|
49.75
|
|
$
|
43.42
|
|
$
|
0.27
|
|
|||||||
On February 6, 2015, the number of holders of record of our common shares was
23
. This figure does not represent the actual number of beneficial owners of our common shares because shares are frequently held in “street name” by securities dealers and others for the benefit of beneficial owners who may vote the shares.
While we expect to continue paying cash dividends in the foreseeable future, the declaration and payment of future dividends will be at the discretion of our Board of Directors and will depend upon many factors, including our earnings, financial condition, business needs, capital and surplus requirements of our operating subsidiaries and regulatory and contractual restrictions, including those set forth in our credit facilities. See Item 7 ‘
Liquidity and Capital Resources
’ for further information.
41
ISSUER PURCHASES OF EQUITY SECURITIES
The following table provides information regarding the number of common shares we repurchased in the quarter ended
December 31, 2014
:
|
Period
|
Total Number
of Shares
Purchased
|
Average
Price Paid
Per Share
|
Total Number of Shares
Purchased as Part of
Publicly Announced
Plans or Programs
(a)
|
Maximum Number (or Approximate
Dollar Value) of Shares That
May Yet Be Purchased Under the
Announced Plans
or Programs
(b)
|
||||||
|
October 1-31, 2014
|
1,262
|
|
|
$46.76
|
|
—
|
|
|
$300.0
|
million
|
|
November 1-30, 2014
|
505,632
|
|
|
$49.48
|
|
501,457
|
|
|
$275.2
|
million
|
|
December 1-31, 2014
|
981,895
|
|
|
$50.51
|
|
977,069
|
|
|
$225.8
|
million
|
|
Total
|
1,488,789
|
|
1,478,526
|
|
|
$225.8
|
million
|
|||
|
(a)
|
From time to time, we purchase shares in connection with the vesting of restricted stock awards granted to our employees under our 2007 Long-Term Equity Compensation Plan. The purchase of these shares is separately authorized and is not part of our Board-authorized share repurchase program, described below.
|
|
(b)
|
On December 5, 2014, our Board of Directors authorized a new share repurchase plan for up to
$750 million
of our common shares through December 31, 2016. The new share repurchase authorization, effective January 1, 2015, replaced the previous plan which had $225.8 million available until the end of 2014. Share repurchases may be effected from time to time in open market or privately negotiated transactions, depending on market conditions.
|
42
PERFORMANCE GRAPH
Set forth below is a graph comparing the dollar change in the cumulative total shareholder return on our common shares from July 1, 2003, the date that our common shares began trading on the New York Stock Exchange, through December 31, 2014, as compared to the cumulative total return of the Standard & Poor's 500 Stock Index and the cumulative total return of the Standard & Poor's Property and Casualty Insurance Index. The cumulative total shareholder return is a concept used to compare the performance of a company's stock over time and is the ratio of the stock price change plus the cumulative amount of dividends over the specified time period (assuming dividend reinvestment), to the stock price at the beginning of the time period. This graph assumes an investment of $100 on July 1, 2003.
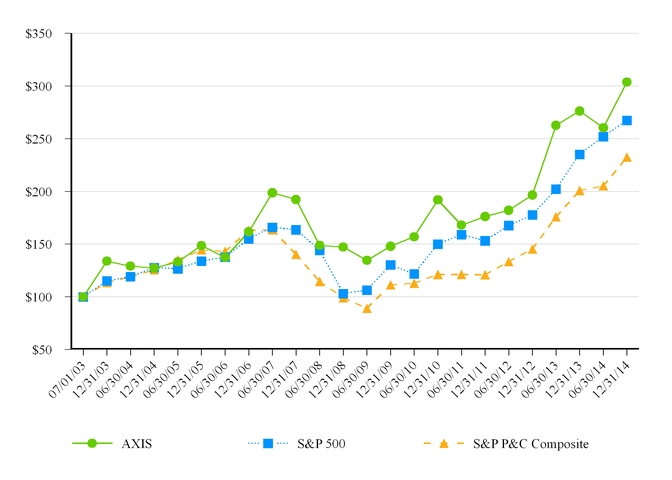
43
|
ITEM 6.
|
SELECTED FINANCIAL DATA
|
The following tables set forth our selected historical consolidated financial information for the last five years. This data should also be read in conjunction with the Consolidated Financial Statements and the accompanying notes presented under Item 8 and with
‘Management’s Discussion and Analysis of Financial Condition and Results of Operations’
under Item 7.
|
|
At and For the year Ended December 31,
|
||||||||||||||||||||
|
|
2014
|
2013
|
2012
|
2011
|
2010
|
||||||||||||||||
|
|
(in thousands, except per share amounts)
|
||||||||||||||||||||
|
|
|||||||||||||||||||||
|
Gross premiums written
|
$
|
4,711,519
|
|
$
|
4,697,041
|
|
$
|
4,139,643
|
|
$
|
4,096,153
|
|
$
|
3,750,536
|
|
||||||
|
Net premiums earned
|
3,870,999
|
|
3,707,065
|
|
3,415,463
|
|
3,314,961
|
|
2,947,410
|
|
|||||||||||
|
Net investment income
|
342,766
|
|
409,312
|
|
380,957
|
|
362,430
|
|
406,892
|
|
|||||||||||
|
Net realized investment gains
|
132,108
|
|
75,564
|
|
127,469
|
|
121,439
|
|
195,098
|
|
|||||||||||
|
Net losses and loss expenses
|
2,186,722
|
|
2,134,195
|
|
2,096,028
|
|
2,675,052
|
|
1,677,132
|
|
|||||||||||
|
Acquisition costs
|
737,197
|
|
664,191
|
|
627,653
|
|
587,469
|
|
488,712
|
|
|||||||||||
|
General and administrative expenses
|
621,876
|
|
575,390
|
|
560,981
|
|
459,151
|
|
449,885
|
|
|||||||||||
|
Interest expense and financing costs
|
74,695
|
|
61,979
|
|
61,863
|
|
62,598
|
|
55,876
|
|
|||||||||||
|
Preferred share dividends
|
40,088
|
|
40,474
|
|
38,228
|
|
36,875
|
|
36,875
|
|
|||||||||||
|
Net income available to common shareholders
(1)
|
$
|
770,657
|
|
$
|
683,910
|
|
$
|
495,004
|
|
$
|
9,430
|
|
$
|
819,848
|
|
||||||
|
Per Common Share Data:
|
|||||||||||||||||||||
|
Basic earnings per common share
|
$
|
7.38
|
|
$
|
6.02
|
|
$
|
4.05
|
|
$
|
0.08
|
|
$
|
6.74
|
|
||||||
|
Diluted earnings per common share
|
7.29
|
|
5.93
|
|
4.00
|
|
0.07
|
|
6.02
|
|
|||||||||||
|
Cash dividends declared per common share
|
$
|
1.10
|
|
$
|
1.02
|
|
$
|
0.97
|
|
$
|
0.93
|
|
$
|
0.86
|
|
||||||
|
Basic weighted average common shares outstanding
|
104,368
|
|
113,636
|
|
122,148
|
|
122,499
|
|
121,728
|
|
|||||||||||
|
Diluted weighted average common shares outstanding
|
105,713
|
|
115,328
|
|
123,654
|
|
128,122
|
|
136,199
|
|
|||||||||||
|
Operating Ratios:
(2)
|
|||||||||||||||||||||
|
Net loss and loss expense ratio
|
56.5
|
%
|
57.6
|
%
|
61.4
|
%
|
80.7
|
%
|
56.9
|
%
|
|||||||||||
|
Acquisition cost ratio
|
19.0
|
%
|
17.9
|
%
|
18.4
|
%
|
17.7
|
%
|
16.6
|
%
|
|||||||||||
|
General and administrative expense ratio
|
16.1
|
%
|
15.5
|
%
|
16.4
|
%
|
13.9
|
%
|
15.2
|
%
|
|||||||||||
|
Combined ratio
|
91.6
|
%
|
91.0
|
%
|
96.2
|
%
|
112.3
|
%
|
88.7
|
%
|
|||||||||||
|
|
|||||||||||||||||||||
|
Investments
|
$
|
13,769,979
|
|
$
|
13,780,336
|
|
$
|
13,546,894
|
|
$
|
12,466,889
|
|
$
|
11,524,166
|
|
||||||
|
Cash and cash equivalents
|
1,209,695
|
|
987,876
|
|
850,550
|
|
1,082,838
|
|
1,045,355
|
|
|||||||||||
|
Reinsurance recoverable on unpaid and paid losses
|
1,926,145
|
|
1,929,988
|
|
1,863,819
|
|
1,770,329
|
|
1,577,547
|
|
|||||||||||
|
Total assets
|
19,955,736
|
|
19,634,784
|
|
18,852,344
|
|
17,806,059
|
|
16,445,731
|
|
|||||||||||
|
Reserve for losses and loss expenses
|
9,596,797
|
|
9,582,140
|
|
9,058,731
|
|
8,425,045
|
|
7,032,375
|
|
|||||||||||
|
Unearned premiums
|
2,735,376
|
|
2,683,849
|
|
2,454,692
|
|
2,454,462
|
|
2,333,676
|
|
|||||||||||
|
Senior notes
|
990,790
|
|
995,855
|
|
995,245
|
|
994,664
|
|
994,110
|
|
|||||||||||
|
Total shareholders’ equity attributable to AXIS Capital
|
$
|
5,821,121
|
|
$
|
5,817,962
|
|
$
|
5,779,761
|
|
$
|
5,444,079
|
|
$
|
5,624,970
|
|
||||||
|
Book value per common share
(3)
|
$
|
52.23
|
|
$
|
47.40
|
|
$
|
44.75
|
|
$
|
39.37
|
|
$
|
45.60
|
|
||||||
|
Diluted book value per common share
(3)
|
$
|
50.63
|
|
$
|
45.80
|
|
$
|
42.97
|
|
$
|
38.08
|
|
$
|
39.37
|
|
||||||
|
Common shares outstanding
|
99,426
|
|
109,485
|
|
117,920
|
|
125,588
|
|
112,393
|
|
|||||||||||
|
Common shares outstanding - diluted
|
102,577
|
|
113,325
|
|
122,793
|
|
129,818
|
|
130,189
|
|
|||||||||||
|
(1)
|
The
2014
net income available to common shareholders includes an amount attributable from noncontrolling interests of
$6,181
.
|
|
(2)
|
Operating ratios are calculated by dividing the respective operating expenses by net premiums earned.
|
|
(3)
|
Book value per common share and diluted book value per common share are based on total common shareholders’ equity divided by common shares and diluted common share equivalents outstanding, respectively.
|
44
|
ITEM 7.
|
MANAGEMENT’S DISCUSSION AND ANALYSIS OF FINANCIAL CONDITION AND RESULTS OF OPERATIONS
|
The following is a discussion and analysis of our results of operations for the years ended
December 31, 2014
,
2013
and
2012
and our financial condition at
December 31, 2014
and
2013
. This should be read in conjunction with the Consolidated Financial Statements and related notes included in Item 8 of this report. Tabular dollars are in thousands, except per share amounts. Amounts in tables may not reconcile due to rounding differences.
|
|
Page
|
|
2014 Financial Highlights
|
|
|
Executive Summary
|
|
|
Underwriting Results – Group
|
|
|
Results by Segment: Years ended December 31, 2014, 2013 and 2012
|
|
|
i) Insurance Segment
|
|
|
ii) Reinsurance Segment
|
|
|
Other Expenses, Net
|
|
|
Net Investment Income and Net Realized Investment Gains/Losses
|
|
|
Cash and Investments
|
|
|
Liquidity and Capital Resources
|
|
|
Critical Accounting Estimates
|
|
|
i) Reserves for Losses and Loss Expenses
|
|
|
ii) Reinsurance Recoverable
|
|
|
iii) Premiums
|
|
|
iv) Fair Value Measurements
|
|
|
v) Other-Than-Temporary Impairments
|
|
|
Recent Accounting Pronouncements
|
|
|
Off-Balance Sheet and Special Purpose Entity Arrangements
|
|
|
Non-GAAP Financial Measures
|
|
45
2014
FINANCIAL HIGHLIGHTS
2014
Consolidated Results of Operations
|
•
|
Net income available to common shareholders of
$771 million
, or
$7.38
per common share and
$7.29
per diluted common share
|
|
•
|
Operating income
of
$563 million
, or
$5.32
per diluted common share
(1)
|
|
•
|
Gross premiums written of
$4.7 billion
|
|
•
|
Net premiums written of
$3.9 billion
|
|
•
|
Net premiums earned of
$3.9 billion
|
|
•
|
Net favorable prior year reserve development of
$259 million
|
|
•
|
Estimated aggregate natural catastrophe and weather-related pre-tax net losses of $93 million
|
|
•
|
Underwriting income of
$462 million
and combined ratio of
91.6%
|
|
•
|
Net investment income of
$343 million
|
|
•
|
Net realized investment gains of
$132 million
|
2014
Consolidated Financial Condition
|
•
|
Total cash and investments of
$15.0 billion
; fixed maturities, cash and short-term securities comprise
90%
of total cash and investments and have an average credit rating of
AA-
|
|
•
|
Total assets of
$20.0 billion
|
|
•
|
Reserve for losses and loss expenses of
$9.6 billion
and reinsurance recoverable of
$1.9 billion
|
|
•
|
Total debt of
$991 million
and a debt to total capital ratio of
14.5%
|
|
•
|
Repurchased
11.8 million
common shares for total cost of
$543 million
|
|
•
|
Common shareholders’ equity of
$5.2 billion
; diluted book value per common share of
$50.63
|
|
(1)
|
Operating income is a non-GAAP financial measure as defined in SEC Regulation G. See
‘Non-GAAP Financial Measures’
for reconciliation to nearest GAAP financial measure (net income available to common shareholders).
|
46
EXECUTIVE SUMMARY
Business Overview
We are a Bermuda-based global provider of specialty lines insurance and treaty reinsurance products with operations in Bermuda, the United States, Europe, Singapore, Canada, Australia and Latin America. Our underwriting operations are organized around our
two
global underwriting platforms, AXIS Insurance and AXIS Re.
Our mission is to provide our clients and distribution partners with a broad range of risk transfer products and services and meaningful capacity, backed by significant financial strength. We manage our portfolio holistically, aiming to construct the optimum consolidated portfolio of funded and unfunded risks, consistent with our risk appetite and development of our franchise. We nurture an ethical, entrepreneurial and disciplined culture that promotes outstanding client service, intelligent risk taking and the achievement of superior risk-adjusted returns for our shareholders. We believe that the achievement of our objectives will position us as a leading global, diversified specialty insurance and reinsurance company, as measured by quality, sustainability and profitability. Our execution on this mission in
2014
included:
|
•
|
continued expansion of our agriculture reinsurance business;
|
|
•
|
the addition of a number of underwriting and support staff, including underwriting specialists in areas such as healthcare liability insurance, as we continue to build-out the Company's global platform, explore opportunities in new and existing lines of business and grow our business internationally;
|
|
•
|
the development of our third-party capital capabilities through AXIS Ventures Reinsurance Limited which was launched to manage capital for investors interested in deploying funds directly into the property-catastrophe and related short-tail business;
|
|
•
|
continued growth of our accident and health line, which launched in 2010 and is focused on specialty accident and health products;
|
|
•
|
the growth of our Weather and Commodity Markets business unit which offers parametric risk management solutions to clients whose profit margins are exposed to adverse weather and commodity price risks;
|
|
•
|
the commencement of operations of our new syndicate at Lloyd's which provides us with access to Lloyd's worldwide licenses and an extensive distribution network; and
|
|
•
|
the continued focus on lines of business with attractive rates.
|
In addition, during March 2014 we issued $250 million aggregate principal amount of 2.65% senior unsecured notes which will mature on April 1, 2019 and $250 million aggregate principal amount of 5.15% senior unsecured notes which will mature on April 1, 2045. The net proceeds from these two offerings were used towards the repayment of
$500 million
of AXIS Capital’s
5.75%
senior unsecured notes which matured on December 1, 2014 (refer
'Liquidity and Capital Resources - Senior Notes'
for more detail).
On January 25, 2015, the Company announced the signing of a definitive amalgamation agreement with PartnerRe Ltd. PartnerRe Ltd., through its principal operating subsidiaries, provides reinsurance and certain specialty insurance lines on a worldwide basis. The transaction is expected to close in the second half of 2015, subject to approval by the shareholders of both companies, regulatory clearance and customary closing conditions.
47
Results of Operations
|
Year ended December 31,
|
2014
|
% Change
|
2013
|
% Change
|
2012
|
||||||||||||
|
Underwriting income:
|
|||||||||||||||||
|
Insurance
|
$
|
78,635
|
|
(7%)
|
$
|
84,749
|
|
29%
|
$
|
65,477
|
|
||||||
|
Reinsurance
|
382,894
|
|
12%
|
343,220
|
|
74%
|
197,660
|
|
|||||||||
|
Net investment income
|
342,766
|
|
(16%)
|
409,312
|
|
7%
|
380,957
|
|
|||||||||
|
Net realized investment gains
|
132,108
|
|
75%
|
75,564
|
|
(41%)
|
127,469
|
|
|||||||||
|
Other expenses, net
|
(131,839
|
)
|
(29%)
|
(185,380
|
)
|
(17%)
|
(224,322
|
)
|
|||||||||
|
Net income
|
804,564
|
|
11%
|
727,465
|
|
33%
|
547,241
|
|
|||||||||
|
Amounts attributable from noncontrolling interests
|
6,181
|
|
nm
|
—
|
|
nm
|
—
|
|
|||||||||
|
Preferred share dividends
|
(40,088
|
)
|
(1%)
|
(40,474
|
)
|
6%
|
(38,228
|
)
|
|||||||||
|
Loss on repurchase of preferred shares
|
—
|
|
nm
|
(3,081
|
)
|
(78%)
|
(14,009
|
)
|
|||||||||
|
Net income available to common shareholders
|
$
|
770,657
|
|
13%
|
$
|
683,910
|
|
38%
|
$
|
495,004
|
|
||||||
|
Operating income
|
$
|
562,875
|
|
(11)%
|
$
|
633,072
|
|
50%
|
$
|
421,523
|
|
||||||
nm – not meaningful
Underwriting Results
2014
versus
2013
:
The $34 million improvement in our underwriting result during 2014 was primarily due to a decrease in the level of natural catastrophe and weather-related losses. In 2014 we recognized pre-tax net losses of $93 million for various worldwide natural catastrophe and weather-related events. Comparatively, in 2013, we recognized pre-tax net aggregate losses (net of related reinstatement premiums) of $198 million related to worldwide natural catastrophe and weather-related events. The increase in net favorable prior year reserve development of $40 million also contributed to the improvement. These improvements were partially offset by increases in the current accident year loss ratios, exclusive of the natural catastrophe and weather-related losses, for both segments.
Our insurance segment's underwriting income decreased by $6 million in 2014. The decrease was primarily due to an increase in the current accident year loss ratio, after adjusting for natural catastrophe and weather-related losses, due to an increase in the loss ratio in the property lines, which were impacted by a higher level of loss activity in recent periods, and a change in the mix of business written, partially offset by better than expected loss experience in the marine and liability lines. The decrease in underwriting income was also impacted by an increase in acquisition costs and was partially offset by a $27 million decrease in natural catastrophe and weather related-losses, lower general and administrative expenses and a $13 million increase in net favorable prior year reserve development.
Our reinsurance segment's underwriting result improved by $40 million in 2014. The increase was primarily attributable to the significantly lower level of natural catastrophe and weather-related losses and a $26 million increase in net favorable prior year development. Partially offsetting these increases were an increase in the current accident year loss ratio, after adjusting for natural catastrophe and weather-related losses, and an increase in acquisition costs. The current accident year loss ratio, after adjusting for natural catastrophe and weather-related losses, increased due to a change in the mix of business and an increase in agriculture loss reserves, partially offset by improved loss experience across most other lines of business.
2013
versus
2012
:
The $165 million improvement in our underwriting result during 2013 was primarily due to a reduction in the frequency and severity of natural catastrophe and weather-related losses. Growth in net premiums earned across both segments also contributed favorably. These improvements were partially offset by increases in the current accident year loss ratios, exclusive of the natural catastrophe and weather-related losses, for both segments and a $25 million reduction in net favorable prior year reserve development.
Our insurance segment's underwriting income increased by $19 million in 2013 primarily due to a decrease in natural catastrophe and weather-related losses. Growth in net premiums earned, driven by the expansion of our business over the past year, also benefited the segment's results. The increases were partially offset by a $72 million decrease in net favorable prior year reserve development and an increase in the current accident year loss ratio, exclusive of natural catastrophe and weather-related losses.
Our reinsurance segment's underwriting result improved by $146 million in 2013. The increase was primarily attributable to the significantly lower level of natural catastrophe and weather-related losses. Other positive factors included a $46 million
48
increase in net favorable prior year reserve development and an increase in net premiums earned. These were partially offset by an increases in the current accident year loss ratio, exclusive of the natural catastrophe and weather-related losses, and an increase in general and administrative expenses.
Net Investment Income
The variability in our net investment income from 2012 through 2014 was largely attributable to the performance of our other investments. Income from this portfolio decreased by $71 million in 2014 compared to 2013, driven by lower returns from our hedge funds and reflected lower returns from global equity markets during 2014. Comparatively, income from this portfolio increased by $41 million in 2013 compared to 2012, driven by the strong performance of global equity markets during 2013.
Excluding income from our other investments, net investment income increased by $5 million in 2014, and was attributable to the increase in average fixed maturities balances during 2014. The decrease of $13 million in 2013 was largely attributable to the fixed maturity portfolio, where lower reinvestment yields drove reductions in income.
Net Realized Investment Gains
During each period presented, we realized net investment gains. During 2014 and 2013, sales of equities were the largest contributor to the net realized gains while sales of fixed maturities were the primary driver in 2012. Other-than-temporary impairment ("OTTI") charges were
$31 million
,
$9 million
and
$24 million
in 2014, 2013 and 2012, respectively. The increase in OTTI during 2014 was primarily attributable to non-U.S. denominated securities as a result of the decline in foreign exchange rates against the U.S. dollar, and related to securities that are due to mature in the near future.
Other Expenses, Net
Depreciation of the euro and Sterling against the U.S. dollar resulted in foreign exchange gains of $104 million in 2014 and primarily reflected the remeasurement of our foreign-denominated net insurance-related liabilities. Conversely appreciation of the same currencies drove foreign exchange losses of $26 million and $30 million in 2013 and 2012. The 2013 loss was partially offset by the depreciation of the Australian dollar.
Excluding these foreign exchange-related amounts, other expenses were $236 million, $159 million and $195 million in 2014, 2013 and 2012 respectively. Corporate expenses increased from $90 million in 2013 to $135 million in 2014. The $45 million increase was driven by increased personnel expenses as we expand our business globally, a reduction in certain allocated costs to segments, and information technology and professional costs related to operational excellence initiatives. These initiatives are aimed at improving the effectiveness and efficiency of our operations and are expected to result in a reduction of expenses in future periods. The decrease of $39 million in 2013 compared to 2012 is primarily attributable to senior leadership transition costs of $34 million incurred during 2012.
Tax expense increased to $26 million in 2014 compared to $7 million in 2013, due to an increase in the valuation allowance and a decrease in tax exempt income. Interest expense and financing costs were $75 million in 2014 compared to $62 million in 2013 and 2012, with the increase driven by the new senior notes issued during the first quarter of 2014.
Amounts Attributable from Noncontrolling Interest
Amounts attributable from noncontrolling interests for 2014 related to amounts attributable from the third party investors in Ventures Re. Refer to Item 8, Note 14 to our Consolidated Financial Statements for additional information.
Preferred Share Dividends and Loss on Repurchase of Preferred Shares
Preferred share dividends were comparable in 2014 and 2013. The increase in preferred share dividends in 2013 compared to 2012 was driven by an increase in preferred equity capital.
During the first half of 2013 we issued $225 million of 5.50% Series D preferred shares. The Series D preferred share proceeds were partially used to redeem the $100 million of 7.25% Series A preferred shares outstanding. The redemption of the Series A preferred shares resulted in a recognition of a loss of $3 million.
During 2012, in conjunction with the issuance of our 6.875% Series C preferred shares in the first quarter of 2012, we redeemed $150 million of our 7.25% Series A preferred shares and repurchased $247 million of our 7.50% Series B preferred shares via tender offer. The Series B tender offer along with the Series A redemption resulted in the recognition of a $14 million loss.
49
See Item 8, note 13 to the Consolidated Financial Statements for further details.
Outlook
Management expects an overall increase in gross premiums written in 2015, with a continued focus on diversification and pursuit of opportunities to expand our reach in areas where we believe returns are most attractive.
Insurance markets, which experienced positive price movements in recent periods, have seen a general leveling off of pricing. Despite the slowdown in rate improvements, there remain good fundamentals and opportunities for profitable growth in many of the insurance lines of business. While rate increases have moderated, casualty line pricing remains strong, particularly in the United States excess casualty markets. The diversity in our insurance portfolio by line and geography is serving us well in the current environment, as we have been able to place emphasis on those lines of business that have shown better performance.
In the reinsurance markets, the trading environment remains very competitive, with pressures broadly impacting all lines of business. We continue to observe great demand for multi-year commitments with non-concurrency of terms more prevalent in the marketplace. Overall, the market is experiencing margin compression in the face of rate deterioration and increased pressures on ceding commissions. While the outlook is for continuing competitive global market conditions, we have observed a customer preference towards counterparties that have the breadth and depth to provide meaningful, multi-faceted relationships, backed by financial strength and full-scale services coupled with innovation and technical strength, which positions larger players in a better position to mitigate the adverse effects of the current trading conditions.
Financial Measures
We believe that the following financial indicators are important in evaluating our performance and measuring the overall growth in value generated for our common shareholders:
|
Year ended and at December 31,
|
2014
|
2013
|
2012
|
||||||||||
|
ROACE
(1)
|
14.8
|
%
|
13.1
|
%
|
9.7
|
%
|
|||||||
|
Operating ROACE
(2)
|
10.8
|
%
|
12.1
|
%
|
8.2
|
%
|
|||||||
|
Diluted book value per common share
(3)
|
$
|
50.63
|
|
$
|
45.80
|
|
$
|
42.97
|
|
||||
|
Cash dividends declared per common share
|
1.10
|
|
1.02
|
|
0.97
|
|
|||||||
|
Increase in diluted book value per common share adjusted for dividends
|
$
|
5.93
|
|
$
|
3.85
|
|
$
|
5.86
|
|
||||
|
(1)
|
Return on average common equity (“ROACE”) is calculated by dividing net income available to common shareholders for the year by the average shareholders’ equity determined by using the common shareholders’ equity balances at the beginning and end of the year.
|
|
(2)
|
Operating ROACE is calculated by dividing operating income for the year by the average common shareholders’ equity determined by using the common shareholders’ equity balances at the beginning and end of the year. Operating ROACE is a non-GAAP financial measure, as defined in SEC Regulation G. See
‘Non-GAAP Financial Measures’
for additional information and a reconciliation to the nearest GAAP financial measure (ROACE).
|
|
(3)
|
Diluted book value ("DBV") per common share represents total common shareholders’ equity divided by the number of common shares and diluted common share equivalents outstanding, determined using the treasury stock method. Cash settled awards are excluded from the denominator.
|
Return on equity
Our objective is to generate superior returns on capital that appropriately rewards our common shareholders for the risks we assume and to grow revenue only when we expect the returns will meet or exceed our requirements. We recognize that the nature of underwriting cycles and the frequency or severity of large loss events in any one year may make it difficult to achieve a profitability target in any specific period and, therefore, established a ROACE target of 15% over the full underwriting cycle. Our average annual ROACE since inception is approximately 14%, tracking closely to our long-term goal.
The decrease in operating ROACE in 2014 compared to 2013 was driven by a decrease in net investment income and an increase in corporate expenses partially offset by an increase in underwriting income. The increase in operating ROACE in 2013 compared to 2012 was primarily driven by the improvement in our underwriting result, also aided by growth in net investment income and a decrease in corporate expenses.
In addition to the items noted above for operating ROACE, ROACE is also impacted by net realized investment gains, foreign exchange losses (gains) and the loss on repurchase of preferred shares. Net realized investment gains contributed favorably to our results in 2014, 2013 and 2012; thus ROACE exceeded operating ROACE in all three years. Foreign exchange movements also contributed favorably to our results in 2014 while 2013 and 2012 recorded foreign exchange losses, resulting in a larger increase in ROACE in 2014 compared to the two prior years.
50
Diluted book value per common share
We consider diluted book value per common share to be an appropriate measure of our returns to common shareholders, as we believe growth in our book value on a diluted basis will ultimately translate into appreciation of our stock price.
During 2014 and 2013, our diluted book value per common share appreciated by 11% and 7%, respectively, driven primarily by $771 million and $684 million in net income available to common shareholders, respectively. This was partially offset by the decrease in unrealized gains on investments which are included in accumulated other comprehensive income. The decrease in 2014 reflected the impact of the strengthening of the U.S. dollar, along with the widening of credit spreads and the realization of equity gains during the year, while in 2013 we recorded a decrease in accumulated other comprehensive income primarily due to the impact of the rise in sovereign yield curves during the year on our investment portfolio.
Cash dividends per common share
We believe in returning excess capital to our shareholders by way of dividends (as well as share repurchases) and, accordingly, our dividend policy is an integral part of the value we create for our shareholders. Our cumulatively strong earnings have permitted our Board of Directors to approve eleven successive annual increases in quarterly common share dividends.
Diluted book value per common share adjusted for dividends
Taken together, we believe that growth in diluted book value per common share and common share dividends declared represent the total value created for our common shareholders. As companies in the insurance industry have differing dividend payout policies, we believe that investors use the DBV per common share adjusted for dividends metric to measure comparable performance across the industry.
During 2014, the DBV per common share adjusted for dividends grew by $5.93 or 13% driven primarily by our diluted net income per share of $7.29 which was partially offset by unrealized losses on investments included in other comprehensive income. Despite recording a more significant impact of catastrophe and weather-related events, 2013 and 2012 also reflected positive value creation for our shareholders. In 2013 our net income, in addition to the dividends declared, more than offset the impact of the upward shift in the sovereign yield curves. In 2012 our net income, combined with valuation improvements on our available-for-sale securities and common share repurchases executed at a discount to book value led the increases in diluted book value per common share adjusted for dividends.
51
UNDERWRITING RESULTS – GROUP
The following table provides our group underwriting results for the periods indicated. Underwriting income is a pre-tax measure of underwriting profitability that takes into account net premiums earned and other insurance related income as revenues and net losses and loss expenses, acquisition costs and underwriting-related general and administrative costs as expenses.
|
Year ended December 31,
|
2014
|
% Change
|
2013
|
% Change
|
2012
|
|||||||||||||
|
Revenues:
|
||||||||||||||||||
|
Gross premiums written
|
$
|
4,711,519
|
|
—%
|
$
|
4,697,041
|
|
13%
|
$
|
4,139,643
|
|
|||||||
|
Net premiums written
|
3,906,975
|
|
(1%)
|
3,928,200
|
|
18%
|
3,337,456
|
|
||||||||||
|
Net premiums earned
|
3,870,999
|
|
4%
|
3,707,065
|
|
9%
|
3,415,463
|
|
||||||||||
|
Other insurance related income
|
650
|
|
(85)%
|
4,424
|
|
65%
|
2,676
|
|
||||||||||
|
Expenses:
|
||||||||||||||||||
|
Current year net losses and loss expenses
|
(2,445,666
|
)
|
(2,353,631
|
)
|
(2,340,868
|
)
|
||||||||||||
|
Prior year reserve development
|
258,944
|
|
219,436
|
|
244,840
|
|
||||||||||||
|
Acquisition costs
|
(737,197
|
)
|
(664,191
|
)
|
(627,653
|
)
|
||||||||||||
|
Underwriting-related general and administrative expenses
(1)
|
(486,201
|
)
|
(485,134
|
)
|
(431,321
|
)
|
||||||||||||
|
Underwriting income
(2)(3)
|
$
|
461,529
|
|
8%
|
$
|
427,969
|
|
63%
|
$
|
263,137
|
|
|||||||
|
General and administrative expenses
(1)
|
$
|
621,876
|
|
$
|
575,390
|
|
$
|
560,981
|
|
|||||||||
|
Income before income taxes
(2)
|
$
|
830,472
|
|
$
|
734,467
|
|
$
|
550,528
|
|
|||||||||
|
(1)
|
Underwriting-related general and administrative expenses is a non-GAAP measure as defined in SEC Regulation G. Our total general and administrative expenses also included
$135,675
,
$90,256
and
$129,660
of corporate expenses for
2014
,
2013
and
2012
, respectively; refer to '
Other Expenses, Net
' for additional information related to these corporate expenses. Also, refer to
'Non-GAAP Financial Measures'
for further information.
|
|
(2)
|
Group (or consolidated) underwriting income is a non-GAAP financial measure as defined in SEC Regulation G. See Item 8, Note 3 to the Consolidated Financial Statements, for a reconciliation of consolidated underwriting income to the nearest GAAP financial measures (income before income taxes) for the years indicated above. Also, refer to
'Non-GAAP Financial Measures'
for additional information related to the presentation of consolidated underwriting income.
|
|
(3)
|
AXIS Capital cedes certain of its reinsurance business to AXIS Ventures Reinsurance Limited ("Ventures Re"), the Company's third-party capital vehicle, on a fully collateralized basis. The collateral has been provided by third party investors. Ventures Re is a variable interest entity and AXIS Capital has been determined to be its primary beneficiary. Following this determination Ventures Re is consolidated in the Consolidated Financial Statements of AXIS Capital and the net impact of the cessions has been included in amounts attributable to (from) noncontrolling interests. For 2014, amounts attributable from noncontrolling interests were
$6,181
. For 2013 and 2012 amounts attributable from noncontrolling interests were $nil. Refer to Item 8, Note 14 to the Consolidated Financial Statements for more information.
|
52
UNDERWRITING REVENUES
Premiums Written:
Gross and net premiums written, by segment, were as follows:
|
|
Gross Premiums Written
|
||||||||||||||||||||
|
Year ended December 31,
|
2014
|
% Change
|
2013
|
% Change
|
2012
|
||||||||||||||||
|
Insurance
|
$
|
2,535,415
|
|
(1%)
|
$
|
2,559,138
|
|
11%
|
$
|
2,309,481
|
|
||||||||||
|
Reinsurance
|
2,176,104
|
|
2%
|
2,137,903
|
|
17%
|
1,830,162
|
|
|||||||||||||
|
Total
|
$
|
4,711,519
|
|
—%
|
$
|
4,697,041
|
|
13%
|
$
|
4,139,643
|
|
||||||||||
|
% ceded
|
|||||||||||||||||||||
|
Insurance
|
30
|
%
|
1
|
|
pt
|
29
|
%
|
(5
|
)
|
pts
|
34
|
%
|
|||||||||
|
Reinsurance
|
2
|
%
|
1
|
|
pt
|
1
|
%
|
—
|
|
pts
|
1
|
%
|
|||||||||
|
Total
|
17
|
%
|
1
|
|
pt
|
16
|
%
|
(3
|
)
|
pts
|
19
|
%
|
|||||||||
|
|
Net Premiums Written
|
||||||||||||||||||||
|
|
2014
|
% Change
|
2013
|
% Change
|
2012
|
||||||||||||||||
|
Insurance
|
$
|
1,779,501
|
|
(2%)
|
$
|
1,813,538
|
|
19%
|
$
|
1,522,245
|
|
||||||||||
|
Reinsurance
|
2,127,474
|
|
1%
|
2,114,662
|
|
16%
|
1,815,211
|
|
|||||||||||||
|
Total
|
$
|
3,906,975
|
|
(1%)
|
$
|
3,928,200
|
|
18%
|
$
|
3,337,456
|
|
||||||||||
2014
versus
2013
:
Gross premiums written in 2014 were comparable to 2013, with growth in our reinsurance segment offset by a decrease in our insurance segment.
The increase in our reinsurance segment of $38 million or 2%, was significantly impacted by the number of treaties written on a multi-year basis in the liability, property, catastrophe and motor lines, and included an increase in the written premium that related to future underwriting years of $118 million. After adjusting for the impact of the multi-year contracts, gross written premiums declined $80 million primarily driven by professional, property and catastrophe lines, partially offset by increases in liability, motor and agriculture lines. The decrease in professional lines was primarily driven by timing differences, non-renewals and decreased treaty participations. The decreases in property and catastrophe were primarily driven by variances in premium adjustments, reduced participations and non-renewals. The increase in liability primarily reflected increased treaty participations and new business. The motor lines increase was primarily driven by increased treaty participations, while the agriculture increase reflected our growth initiatives in this line of business.
The decrease in our insurance segment of $24 million or 1%, was driven by professional and property lines partially offset by increases in liability and aviation lines. The professional lines decrease was driven by the reshaping of our U.S. D&O portfolio. The property decrease was reflective of competitive market conditions. The growth in liability was attributable to growth in the U.S. casualty markets with both new business and rate increases noted. The increase in aviation was driven by timing of renewals and new business.
The ceded gross written premium ratio increased by 1% and was driven by increases in both segments. The increase in the ceded gross written premium ratio in the insurance segment related to changes in the business mix partially offset by changes in the structure of our reinsurance program. The ceded gross written premium ratio also increased in the reinsurance segment reflecting additional retrocessional covers primarily in the catastrophe lines.
In 2013, the Company obtained catastrophe protection for both our segments through a reinsurance agreement with Northshore Re Limited ("Northshore"). In connection with the reinsurance agreement, Northshore issued notes to unrelated investors in an amount equal to the full $200 million of coverage provided under the reinsurance agreement covering a three year period. The Company performed an evaluation of Northshore to determine if it meets the definition of a variable interest entity ("VIE"). The Company concluded that Northshore is a VIE, however, the Company does not have a variable interest in the entity, as the variability in results is expected to be absorbed entirely by the investors in Northshore. Accordingly, Northshore is not consolidated in the Company's consolidated financial statements. The premium ceded to Northshore during 2014 was $16 million (2013: $14 million).
53
2013
versus
2012
:
Gross premiums written growth of 13% was driven by increases in both segments. Increase of 11% in the insurance segment was driven by the accident and health, liability and professional lines. The accident and health line continued to reflect new business expansion. Liability growth was driven by select new business opportunities and, to a lesser extent, rate increases in the U.S wholesale excess casualty market. Growth in the professional lines was largely due to new business as we continue our global expansion.
Reinsurance segment gross premiums written grew by 17% reflecting growth across most lines of business with increases most pronounced in agriculture, professional and property lines. The increase in the agriculture line reflected the continuing initiative to grow this line of business and related primarily to growth on the proportional U.S. business with a contribution from global excess of loss business. The professional lines increase primarily reflected new business opportunities. The property line increased primarily due to new business and the expansion of worldwide client relationships.
The five point decrease in the ceded premium ratio for our insurance segment was driven by changes in our reinsurance purchasing and business mix changes.
Net Premiums Earned:
Net premiums earned by segment were as follows:
|
|
|
|
|
|
|
|
% Change
|
|||||||||||||||||||||
|
Year ended December 31,
|
2014
|
2013
|
2012
|
13 to 14
|
12 to 13
|
|||||||||||||||||||||||
|
Insurance
|
$
|
1,830,544
|
|
47
|
%
|
$
|
1,722,762
|
|
46
|
%
|
$
|
1,558,058
|
|
46
|
%
|
6
|
%
|
11
|
%
|
|||||||||
|
Reinsurance
|
2,040,455
|
|
53
|
%
|
1,984,303
|
|
54
|
%
|
1,857,405
|
|
54
|
%
|
3
|
%
|
7
|
%
|
||||||||||||
|
Total
|
$
|
3,870,999
|
|
100
|
%
|
$
|
3,707,065
|
|
100
|
%
|
$
|
3,415,463
|
|
100
|
%
|
4
|
%
|
9
|
%
|
|||||||||
Changes in net premiums earned reflect period to period changes in net premiums written and business mix, together with normal variability in premium earning patterns.
2014
versus
2013
:
Growth in net premiums earned of 4% reflected increases in both segments. In our insurance segment the increase reflected the expansion in the accident and health lines, growth in our liability lines in recent periods as well as the positive impact of the reductions in the professional and liability ceded reinsurance programs implemented during 2013. These increases were partially offset by decreases in our property business. The reinsurance segment increase primarily reflected growth in our liability and motor lines, continued expansion of our agriculture business and an increase in professional lines. This growth was partially offset by a decrease in premiums written in our catastrophe, property and credit and surety lines and an increase in retrocessional covers for our catastrophe lines.
2013
versus
2012
:
Growth in net premiums earned of 9% reflected increases in both segments. Growth in the insurance segment was primarily driven by the growth in gross premiums written in our accident and health line. Net premiums earned for property, liability and professional lines also increased driven by growth in gross written premiums and reductions in premiums ceded. The increase in the gross premiums written in the agriculture line during 2013 was the primary driver of the increase in net premiums earned for our reinsurance segment.
UNDERWRITING EXPENSES
The following table provides a breakdown of our combined ratio:
|
Year ended December 31,
|
2014
|
% Point
Change
|
2013
|
% Point
Change
|
2012
|
|||||||||||
|
Current accident year loss ratio
|
63.2
|
%
|
(0.3
|
)
|
63.5
|
%
|
(5.0
|
)
|
68.5
|
%
|
||||||
|
Prior year reserve development
|
(6.7
|
%)
|
(0.8
|
)
|
(5.9
|
%)
|
1.2
|
|
(7.1
|
%)
|
||||||
|
Acquisition cost ratio
|
19.0
|
%
|
1.1
|
|
17.9
|
%
|
(0.5
|
)
|
18.4
|
%
|
||||||
|
General and administrative expense ratio
(1)
|
16.1
|
%
|
0.6
|
|
15.5
|
%
|
(0.9
|
)
|
16.4
|
%
|
||||||
|
Combined ratio
|
91.6
|
%
|
0.6
|
|
91.0
|
%
|
(5.2
|
)
|
96.2
|
%
|
||||||
|
(1)
|
The general and administration expense ratio includes corporate expenses not allocated to underwriting segments of
3.5%
,
2.4%
and
3.8%
for
2014
,
2013
and
2012
, respectively. These costs are further discussed in the ‘
Other Expenses, Net
’ section.
|
54
Current Accident Year Loss Ratio:
2014
versus
2013
:
A decrease in the level of natural catastrophe and weather-related losses in 2014 was the primary driver of the reduction in our current accident year loss ratio. 2014 includes $93 million or 2.4 points of aggregate pre-tax net losses related to various worldwide natural catastrophe and weather-related events. These natural catastrophe and weather-related losses impacted both our segments, with the insurance segment reporting $66 million of pre-tax net losses and reinsurance segment incurring pre-tax net losses of $27 million. Comparatively, 2013 included $198 million (net of reinstatement premiums) or 5.4 points of aggregate pre-tax net losses related to worldwide natural catastrophe and weather-related events. These natural catastrophe and weather-related losses impacted both our segments, with the insurance segment reporting $93 million of pre-tax net losses (including reinstatement premiums) and reinsurance segment incurring pre-tax net losses of $105 million (net of reinstatement premiums).
After adjusting for the impact of the natural catastrophe and weather-related losses noted above, the current accident year loss ratio increased in 2014 driven primarily by changes in the mix of business written, an increase in agricultural loss reserves following a significant drop in agriculture commodity prices and an increase in insurance property loss ratios reflecting a higher level of loss activity in recent periods. These increases were partially offset by improved loss experience in the marine, liability, motor, credit and surety and reinsurance professional lines.
2013
versus
2012
:
A lower level of natural catastrophe and weather-related losses in 2013 was the primary driver of the 5.0 point reduction in our current accident year loss ratio. 2013 included $198 million (net of reinstatement premiums) or 5.4 points of aggregate pre-tax net losses related to worldwide natural catastrophe and weather-related events. These natural catastrophe and weather-related losses impacted both our segments, with the insurance segment reporting $93 million of pre-tax net losses (including reinstatement premiums) and reinsurance segment incurring pre-tax net losses of $105 million (net of reinstatement premiums). Comparatively, 2012 included $436 million (net of reinstatements) or 12.7 points of natural catastrophe and weather-related losses primarily related to Storm Sandy.
After adjusting for the impact of the natural catastrophe and weather-related losses noted above, the current accident year loss ratio increased in 2013 driven primarily by a change in the mix of business written. In addition, during the second half of 2013 we experienced an increased level of loss activity in our insurance professional lines which led to an associated strengthening of the professional lines' current year loss ratio. The strengthening in our professional lines was largely driven by the loss experience in certain parts of our D&O business written in the United States. An increase in the level of losses in our reinsurance agriculture line also contributed to the current year ratio increase.
For further discussion on current accident year loss ratios, refer to the insurance and reinsurance segment discussions below.
Estimates for Significant Catastrophe Events
Our estimated net losses in relation to the natural catastrophe events described above were derived from ground-up assessments of our in-force contracts and treaties providing coverage in the affected regions. These assessments take into account the latest information available from clients, brokers and loss adjusters. In addition, we consider industry insured loss estimates, market share analyses and catastrophe modeling analyses, when appropriate. Our estimates remain subject to change as additional loss data becomes available.
We continue to monitor paid and incurred loss development for catastrophe events of prior years and update our estimates of ultimate losses accordingly.
The frequency and severity of natural catastrophe and weather-related activity was high in recent years and our
December 31, 2014
net reserve for losses and loss expenses continues to include estimated amounts for numerous events. We caution that the magnitude and/or complexity of losses arising from certain of these events, in particular Storm Sandy, the Japanese earthquake and tsunami and the three New Zealand earthquakes, inherently increase the level of uncertainty and, therefore, the level of management judgment involved in arriving at our estimated net reserves for losses and loss expenses. As a result, our actual losses for these events may ultimately differ materially from our current estimates.
55
Prior Year Reserve Development:
Our favorable prior year reserve development was the net result of several underlying developments on prior accident years, identified during our quarterly reserve review process. The following table provides a breakdown of net prior year reserve development by segment:
|
Year ended December 31,
|
2014
|
2013
|
2012
|
||||||||||
|
Insurance
|
$
|
63,735
|
|
$
|
50,355
|
|
$
|
122,209
|
|
||||
|
Reinsurance
|
195,209
|
|
169,081
|
|
122,631
|
|
|||||||
|
Total
|
$
|
258,944
|
|
$
|
219,436
|
|
$
|
244,840
|
|
||||
Overview
Overall, the majority of the net favorable prior year reserve development in 2014 related to short-tail lines of business. Net favorable prior year reserve development for reinsurance of professional, liability and motor lines also contributed significantly and was partially offset by adverse development in insurance liability lines. Favorable reserve development in reinsurance liability and professional lines contributed in 2013 and was partially offset by adverse development in the insurance professional and insurance liability lines. Favorable development in professional lines contributed notably in 2012.
The underlying exposures in our property, marine and aviation reserving classes within our insurance segment and the property reserving class within our reinsurance segment largely relate to short-tail business. Development from these classes contributed
$207 million
,
$162 million
and
$186 million
of the total net favorable prior year reserve development in
2014
,
2013
and
2012
, respectively, and primarily reflected the recognition of better than expected loss emergence. The reserve releases for 2014 included $40 million of favorable development across both segments relating to natural catastrophe and weather-related losses incurred during 2013.
Our professional lines business recognized
$32 million
and
$54 million
of favorable prior year development in 2014 and 2012, respectively, while 2013 recognized
$29 million
of net adverse development. The 2014 and 2012 favorable prior year reserve developments were driven by increased weight being given to experience-based actuarial methods in selecting our ultimate loss estimates for accident years 2010 and prior. As our loss experience has generally been better than expected, this resulted in the recognition of favorable development. The increase in the reserves in 2013 was due to a
$51 million
adverse development in the insurance segment, reflecting worse than expected loss experience for the 2011-2012 accident years, following worse than expected loss experience on certain parts of our U.S. D&O business, and the 2008-2009 accident years, due to developments on certain global financial crisis-related claims. During 2013, the transition to the experience-based actuarial methods had a favorable impact on 2010 and prior years, which partially offset the adverse development discussed above.
In the first quarter of 2013, we began to give weight to actuarial methods that reflect our actual experience for liability reinsurance business, as we believe that our older accident years are now at a stage of expected development where such methods will produce meaningful actuarial indications. During 2014 and 2013, we recognized
$21 million
and
$85 million
, respectively, of net favorable prior year development, primarily reflecting the greater weight management is giving to experience based indications and our experience which has been favorable for the 2004 through 2008 accident years. This favorable development was offset in 2014 and partially offset in 2013 by adverse development in our liability insurance business of
$23 million
and
$24 million
, respectively, relating primarily to an increase in loss estimates for certain specific claim reserves.
Our motor lines recorded favorable prior year development of
$19 million
during 2014, relating to better than expected loss emergence on certain European exposures.
See
‘Critical Accounting Estimates – Reserve for Losses and Loss Expenses’
section for further details. We caution that conditions and trends that impacted the development of our reserve for losses and loss expenses in the past may not recur in the future.
The following sections provide further details on prior year reserve development by segment, reserving class and accident year.
56
Insurance Segment:
|
Year ended December 31,
|
2014
|
2013
|
2012
|
||||||||||
|
Property and Other
|
$
|
68,330
|
|
$
|
47,780
|
|
$
|
63,919
|
|
||||
|
Marine
|
6,257
|
|
48,482
|
|
37,322
|
|
|||||||
|
Aviation
|
9,076
|
|
15,349
|
|
5,017
|
|
|||||||
|
Credit and Political Risk
|
3,740
|
|
13,136
|
|
(143
|
)
|
|||||||
|
Professional Lines
|
(807
|
)
|
(50,882
|
)
|
19,458
|
|
|||||||
|
Liability
|
(22,861
|
)
|
(23,510
|
)
|
(3,364
|
)
|
|||||||
|
Total
|
$
|
63,735
|
|
$
|
50,355
|
|
$
|
122,209
|
|
||||
In
2014
, we recognized
$64 million
of net favorable prior year reserve development, the principal components of which were:
|
•
|
$68 million
of net favorable prior year reserve development on our property and other business, related to the 2013 and prior accident years and driven by better than expected loss emergence.
|
|
•
|
$9 million
of net favorable prior year reserve development on aviation business, spanning a number of accident years and largely related to better than expected loss emergence.
|
|
•
|
$23 million
of net adverse prior year reserve development on liability business, related to specific claims impacting primarily 2008, 2009 and 2011 through 2013 accident years.
|
In
2013
, we recognized
$50 million
of net favorable prior year reserve development, the principal components of which were:
|
•
|
$48 million
of net favorable prior year reserve development on our property and other business, largely related to the 2010 and 2011 accident years and driven by better than expected loss emergence.
|
|
•
|
$48 million
of net favorable prior year reserve development on marine business, spanning a number of accident years and largely related to better than expected loss emergence.
|
|
•
|
$15 million
of net favorable prior year reserve development on aviation business, spanning a number of accident years and largely related to better than expected loss emergence.
|
|
•
|
$13 million
of net favorable prior year reserve development on our credit and political risk business, largely related to the 2012 accident year and driven by better than expected loss emergence.
|
|
•
|
$51 million
of net adverse prior year reserve development on professional lines business, primarily related to strengthening of certain parts of our U.S. D&O lines in the 2011 and 2012 accident years and development on global financial crisis-related claims in our 2008 and 2009 accident years, as discussed in the overview.
|
|
•
|
$24 million
of net adverse prior year reserve development on liability business, related to developments on two particular claims and pertained to the 2009 and 2011 accident years.
|
In
2012
, we recognized
$122 million
of net favorable prior year reserve development, the principal components of which were:
|
•
|
$64 million
of net favorable prior year reserve development on our property and other business, the majority of which related to the 2009 through 2011 accident years and the 2008 accident year. While development was primarily driven by better than expected loss emergence, a portion of the 2008 accident year amount was due to the final settlement of two specific case reserves.
|
|
•
|
$37 million
of net favorable prior year reserve development on marine business, spanning a number of accident years and largely related to better than expected loss emergence. The majority of this development related to offshore energy business.
|
|
•
|
$19 million
of net favorable prior year reserve development on professional lines business, primarily related to the 2006 through 2008 accident years for the reasons discussed in the overview.
|
57
Reinsurance Segment:
|
Year ended December 31,
|
2014
|
2013
|
2012
|
||||||||||
|
Property and Other
|
$
|
122,859
|
|
$
|
50,017
|
|
$
|
79,802
|
|
||||
|
Credit and Surety
|
(713
|
)
|
6,328
|
|
12,254
|
|
|||||||
|
Professional Lines
|
32,765
|
|
21,845
|
|
34,291
|
|
|||||||
|
Motor
|
19,007
|
|
6,260
|
|
(4,328
|
)
|
|||||||
|
Liability
|
21,291
|
|
84,631
|
|
612
|
|
|||||||
|
Total
|
$
|
195,209
|
|
$
|
169,081
|
|
$
|
122,631
|
|
||||
In
2014
, we recognized
$195 million
of net favorable prior year reserve development, the principal components of which were:
|
•
|
$123 million
of net favorable prior year reserve development on property and other business, spanning a number of accident years and driven by better than expected loss emergence. Included in this net development was $31 million of favorable reserve development relating to natural catastrophe and weather-related losses incurred during 2013. In addition, the net development included $26 million of adverse development on New Zealand 2010 and 2011 earthquake events and $10 million of adverse development on agriculture reserves relating to loss experience on events occurring late in the 2013 accident year.
|
|
•
|
$33 million
of net favorable prior year reserve development on professional lines business, primarily related to the 2004 through 2007 accident years, for the reasons discussed in the overview and partially offset by reserve strengthening on the 2011 to 2013 years.
|
|
•
|
$19 million
of net favorable prior year reserve development on motor business, driven by better than expected loss emergence on certain European exposures.
|
|
•
|
$21 million
of net favorable prior year reserve development on liability business related to accident years 2008 and prior, for the reasons discussed in the overview. This favorable development was partially offset by strengthening of the reserves related to the 2009 through 2013 accident years.
|
In
2013
, we recognized
$169 million
of net favorable prior year reserve development, the principal components of which were:
|
•
|
$50 million
of net favorable prior year reserve development on property and other business, largely driven by better than expected loss emergence on the 2006 through 2009 and the 2012 accident years.
|
|
•
|
$22 million
of net favorable prior year reserve development on professional lines reinsurance business, primarily related to the 2007 through 2009 accident years and driven by better than expected loss emergence, for the reasons discussed in the overview.
|
|
•
|
$85 million
of net favorable prior year reserve development on liability reinsurance business for the reasons discussed in the overview.
|
In
2012
, we recognized
$123 million
of net favorable prior year reserve development, the principal components of which were:
|
•
|
$80 million
of net favorable prior year reserve development on property and other business largely consisting of:
|
|
•
|
$63 million of net favorable prior year reserve development on catastrophe and property business. Net favorable development was evident across all accident years, with the exception of 2011, and was largely due to better than expected loss emergence. We recognized net adverse development of $18 million on the 2011 accident year, driven by the revision in our estimates for the New Zealand earthquakes.
|
|
•
|
$16 million of net favorable prior year reserve development on crop business, largely related to the 2011 accident year and due to better than expected loss emergence. Of this amount, $6 million related to updated information for one particular claim; the remainder was due to better than expected loss emergence.
|
|
•
|
$12 million
of net favorable prior year reserve development on trade credit and bond reinsurance business, primarily related to the 2010 and 2011 accident years, in recognition of better than expected loss emergence and updated information from our cedants.
|
58
|
•
|
$34 million
of net favorable prior year reserve development on professional lines reinsurance business, primarily related to the 2007, and to a lesser extent 2006, accident years for the reasons discussed in the overview.
|
Aggregate net prior year reserve development for our liability reserving class was insignificant during 2012; however, there were underlying favorable and adverse movements by accident year, driven by an underwriting to accident year reallocation for claims associated with a particular group of treaties.
Acquisition Cost Ratio:
The acquisition cost ratio increased from
17.9%
in 2013 to
19.0%
during 2014, driven by increases in both segments. The increase in the insurance segment primarily reflected a reduction in ceding commissions following changes to our reinsurance program and a change in the mix of business. In the reinsurance segment, the increase was driven by higher acquisition costs paid on certain lines of business and variances in accruals for loss-sensitive features in underlying contracts.
The decrease in the ratio in 2013 compared to 2012 was driven by decreases in both segments. The insurance segment decrease was driven by a reduction in business written through MGAs and higher ceding commissions earned partially offset by a change in business mix. The reinsurance segment decrease was driven by variances in accruals for loss-sensitive features in underlying contracts, partially offset by higher acquisition costs paid on certain lines of business.
General and Administrative Expense Ratio:
The general and administrative expenses increased from 15.5% in 2013 to 16.1% in 2014, primarily driven by personnel costs, professional fees, information technology costs and other related expenses associated with the continued build-out of the Company's global platforms and certain operational excellence initiatives. These initiatives are aimed at improving the effectiveness and efficiency of our operations and are expected to result in a reduction of expenses in future periods. The impact on the general and administrative expense ratio was partially offset by growth in net earned premiums.
The general and administrative expenses increase during 2013 was primarily due to an increase in headcount and the costs related to various growth initiatives across the Company, while 2012 was primarily impacted by senior leadership transition costs. The impact of the increase in general and administrative expenses during 2013 was more than offset by the growth in net premiums earned reducing the overall general and administrative expense ratio.
59
RESULTS BY SEGMENT
INSURANCE SEGMENT
Results from our insurance segment were as follows:
|
Year ended December 31,
|
2014
|
% Change
|
2013
|
% Change
|
2012
|
||||||||||||
|
Revenues:
|
|||||||||||||||||
|
Gross premiums written
|
$
|
2,535,415
|
|
(1%)
|
$
|
2,559,138
|
|
11%
|
$
|
2,309,481
|
|
||||||
|
Net premiums written
|
1,779,501
|
|
(2%)
|
1,813,538
|
|
19%
|
1,522,245
|
|
|||||||||
|
Net premiums earned
|
1,830,544
|
|
6%
|
1,722,762
|
|
11%
|
1,558,058
|
|
|||||||||
|
Other insurance related income (loss)
|
(11
|
)
|
nm
|
2,436
|
|
(9)%
|
2,676
|
|
|||||||||
|
Expenses:
|
|||||||||||||||||
|
Current year net losses and loss expenses
|
(1,195,615
|
)
|
(1,100,757
|
)
|
(1,075,773
|
)
|
|||||||||||
|
Prior year reserve development
|
63,735
|
|
50,355
|
|
122,209
|
|
|||||||||||
|
Acquisition costs
|
(278,804
|
)
|
(242,363
|
)
|
(226,859
|
)
|
|||||||||||
|
General and administrative expenses
|
(341,214
|
)
|
(347,684
|
)
|
(314,834
|
)
|
|||||||||||
|
Underwriting income
|
$
|
78,635
|
|
(7%)
|
$
|
84,749
|
|
29%
|
$
|
65,477
|
|
||||||
|
|
|
% Point
Change
|
|
% Point
Change
|
|
||||||||||||
|
Ratios:
|
|||||||||||||||||
|
Current year loss ratio
|
65.3
|
%
|
1.4
|
63.9
|
%
|
(5.1)
|
69.0
|
%
|
|||||||||
|
Prior year reserve development
|
(3.5
|
%)
|
(0.6)
|
(2.9
|
%)
|
4.9
|
(7.8
|
%)
|
|||||||||
|
Acquisition cost ratio
|
15.2
|
%
|
1.1
|
14.1
|
%
|
(0.5)
|
14.6
|
%
|
|||||||||
|
General and administrative expense ratio
|
18.7
|
%
|
(1.4)
|
20.1
|
%
|
(0.1)
|
20.2
|
%
|
|||||||||
|
Combined ratio
|
95.7
|
%
|
0.5
|
95.2
|
%
|
(0.8)
|
96.0
|
%
|
|||||||||
nm – not meaningful
Gross Premiums Written:
The following table provides gross premiums written by line of business:
|
|
|
|
|
% Change
|
||||||||||||||||||||||||
|
Year ended December 31,
|
2014
|
2013
|
2012
|
13 to 14
|
12 to 13
|
|||||||||||||||||||||||
|
Property
|
$
|
644,516
|
|
26
|
%
|
$
|
671,970
|
|
27
|
%
|
$
|
651,188
|
|
27
|
%
|
(4
|
%)
|
3
|
%
|
|||||||||
|
Marine
|
238,320
|
|
9
|
%
|
229,493
|
|
9
|
%
|
252,434
|
|
11
|
%
|
4
|
%
|
(9
|
%)
|
||||||||||||
|
Terrorism
|
37,705
|
|
1
|
%
|
38,373
|
|
1
|
%
|
37,186
|
|
2
|
%
|
(2
|
%)
|
3
|
%
|
||||||||||||
|
Aviation
|
57,622
|
|
2
|
%
|
43,326
|
|
2
|
%
|
65,143
|
|
3
|
%
|
33
|
%
|
(33
|
%)
|
||||||||||||
|
Credit and Political Risk
|
45,368
|
|
2
|
%
|
60,203
|
|
2
|
%
|
39,405
|
|
2
|
%
|
(25
|
%)
|
53
|
%
|
||||||||||||
|
Professional Lines
|
862,784
|
|
34
|
%
|
900,071
|
|
35
|
%
|
836,634
|
|
36
|
%
|
(4
|
%)
|
8
|
%
|
||||||||||||
|
Liability
|
368,450
|
|
15
|
%
|
347,227
|
|
14
|
%
|
266,696
|
|
12
|
%
|
6
|
%
|
30
|
%
|
||||||||||||
|
Accident and Health
|
280,650
|
|
11
|
%
|
268,475
|
|
10
|
%
|
160,795
|
|
7
|
%
|
5
|
%
|
67
|
%
|
||||||||||||
|
Total
|
$
|
2,535,415
|
|
100
|
%
|
$
|
2,559,138
|
|
100
|
%
|
$
|
2,309,481
|
|
100
|
%
|
(1
|
%)
|
11
|
%
|
|||||||||
60
2014
versus
2013
:
The decline in gross premiums written of 1% was primarily driven by our professional, property and credit and political risk lines of business, which were partially offset by increases in our liability, aviation and accident and health lines. The reduction in professional lines was driven by the reshaping of our D&O business written in the United States. Decreases in the property lines were driven by continuing competitive market conditions. The decrease in credit and political risk was driven by reduced deal flow compared to prior year. The growth in liability can be attributed to new business and rate increases in the U.S. casualty markets. The increases in the aviation lines were a result of timing differences and new business opportunities. The increase in accident and health lines reflected higher renewal insurance premiums and new business opportunities.
2013
versus
2012
:
Growth of 11% was primarily driven by our accident & health, liability, professional and property lines of business which were partially offset by decreases in marine and aviation. Our accident & health business has shown continued growth driven by new business opportunities. Liability growth was driven by select new business opportunities and, to a lesser extent, rate increases in the U.S. wholesale excess casualty market. Growth in the professional lines was largely due to continued expansion globally with new business and certain rate increases in the U.S. also contributing. Property premiums also contributed, as growth driven by new business and select rate increases more than offset reductions due to the non-renewal of certain catastrophe-exposed business written through MGAs. The segment's premium increases were partially offset by decreases in marine, which was impacted by non-renewal of certain business written through MGAs, and aviation which was primarily impacted by timing of renewals and certain rate decreases.
Premiums Ceded:
2014
versus
2013
:
Premiums ceded in 2014 were
$756 million
, or
30%
, of gross premiums written, compared to
$746 million
, or
29%
, in 2013. The increase in premiums ceded and the related ceded ratio primarily related to changes in the business mix, driven by growth in our liability lines which are subject to significant reinsurance cessions, partially offset by changes in the structure of our reinsurance program. Changes in our reinsurance program comprised decreases implemented during 2013, which included excess of loss treaty reductions driven by both retention and rate, and proportional changes related to reductions in the cession rates on our professional lines and liability reinsurance programs. These decreases were partially offset by additional reinsurance purchased during 2014, primarily in our professional lines.
2013
versus
2012
:
Premiums ceded in 2013 were $746 million, or 29%, of gross premiums written, compared to $787 million, or 34%, in 2012. The year on year reductions in the premiums ceded and the related ceded ratio primarily related to changes in our reinsurance purchasing and business mix changes. Reductions related to changes in our reinsurance purchasing included excess of loss treaty reductions driven by both retention and rate, and proportional changes related to reductions in the cession rates on our professional lines and liability programs on renewal during 2013. Changes in business mix related to growth in our accident and health business for which we did not purchase significant reinsurance.
Net Premiums Earned:
The following table provides net premiums earned by line of business:
|
|
|
|
|
% Change
|
||||||||||||||||||||||||
|
Year ended December 31,
|
2014
|
2013
|
2012
|
13 to 14
|
12 to 13
|
|||||||||||||||||||||||
|
Property
|
$
|
444,197
|
|
25
|
%
|
$
|
462,364
|
|
28
|
%
|
$
|
408,943
|
|
26
|
%
|
(4
|
%)
|
13
|
%
|
|||||||||
|
Marine
|
178,229
|
|
10
|
%
|
179,057
|
|
10
|
%
|
171,165
|
|
11
|
%
|
—
|
%
|
5
|
%
|
||||||||||||
|
Terrorism
|
35,876
|
|
2
|
%
|
39,298
|
|
2
|
%
|
38,605
|
|
2
|
%
|
(9
|
%)
|
2
|
%
|
||||||||||||
|
Aviation
|
41,192
|
|
2
|
%
|
48,489
|
|
3
|
%
|
60,363
|
|
4
|
%
|
(15
|
%)
|
(20
|
%)
|
||||||||||||
|
Credit and Political Risk
|
63,095
|
|
3
|
%
|
68,192
|
|
4
|
%
|
87,103
|
|
6
|
%
|
(7
|
%)
|
(22
|
%)
|
||||||||||||
|
Professional lines
|
629,365
|
|
34
|
%
|
586,200
|
|
34
|
%
|
563,500
|
|
36
|
%
|
7
|
%
|
4
|
%
|
||||||||||||
|
Liability
|
146,819
|
|
8
|
%
|
110,623
|
|
6
|
%
|
86,873
|
|
6
|
%
|
33
|
%
|
27
|
%
|
||||||||||||
|
Accident and Health
|
291,771
|
|
16
|
%
|
228,539
|
|
13
|
%
|
141,506
|
|
9
|
%
|
28
|
%
|
62
|
%
|
||||||||||||
|
Total
|
$
|
1,830,544
|
|
100
|
%
|
$
|
1,722,762
|
|
100
|
%
|
$
|
1,558,058
|
|
100
|
%
|
6
|
%
|
11
|
%
|
|||||||||
2014
versus
2013
:
The increase in net premiums earned was primarily driven by the expansion in the accident and health lines, which contributed 59% of the overall net premium earned increase and reflected our continuing efforts to expand this
61
line of business. Growth in gross written premium in our liability lines as well as the positive impact of the reductions in the professional and liability ceded reinsurance programs also contributed to the increase. These increases were partially offset by decreases in our property business.
2013
versus
2012
:
Our accident & health line was the primary contributor to the year on year increase, commensurate with gross premiums written growth discussed above, and accounted for 53% of the overall growth in net premiums earned. Our property, liability and professional lines also contributed to the increase following growth in the gross premiums written and the reductions in premiums ceded discussed above.
Loss Ratio:
The table below shows the components of our loss ratio:
|
Year ended December 31,
|
2014
|
% Point
Change
|
2013
|
% Point
Change
|
2012
|
|||||||||||
|
Current accident year
|
65.3
|
%
|
1.4
|
|
63.9
|
%
|
(5.1
|
)
|
69.0
|
%
|
||||||
|
Prior year reserve development
|
(3.5
|
%)
|
(0.6
|
)
|
(2.9
|
%)
|
4.9
|
|
(7.8
|
%)
|
||||||
|
Loss ratio
|
61.8
|
%
|
0.8
|
|
61.0
|
%
|
(0.2
|
)
|
61.2
|
%
|
||||||
Current Accident Year Loss Ratio
2014
versus
2013
:
Natural catastrophe and weather-related losses impacted the current accident year loss ratios for both years.
In 2014, we recorded $66 million of aggregate pre-tax net losses related to natural catastrophe and weather-related events primarily related to Hurricane Odile and weather events in the United States. During 2013, we incurred $93 million of aggregate pre-tax net losses (inclusive of related premiums to reinstate our reinsurance protection) related to worldwide natural catastrophe and weather-related events.
After adjusting for these natural catastrophe and weather-related losses, our 2014 current accident year loss ratio increased relative to 2013 primarily due to:
|
•
|
an increase in the property loss ratio reflecting a higher level of attritional loss activity in recent periods; and
|
|
•
|
a change in the mix of business with a shift towards less volatile lines that carry a higher loss ratio; partially offset by
|
|
•
|
better than expected loss experience in the marine and liability lines.
|
2013
versus
2012
:
Natural catastrophe and weather-related losses impacted the current accident year loss ratios for both years.
In 2013, we incurred $93 million of aggregate pre-tax net losses (inclusive of related premiums to reinstate our reinsurance protection) related to worldwide natural catastrophe and weather-related events. During 2012, we recognized estimated pre-tax net losses (inclusive of related premiums to reinstate our reinsurance protection) of $222 million primarily related to Storm Sandy.
After adjusting for these natural catastrophe and weather-related losses, our 2013 current accident year loss ratio increased relative to 2012 primarily due to:
|
•
|
strengthening in our professional lines, relating to certain parts of our D&O business written in the United States, following recent loss experience; and
|
|
•
|
a change in the business mix.
|
See ‘
Prior Year Reserve Development
’ section for further details.
Acquisition Cost Ratio:
The increase in the current year acquisition cost ratio from
14.1%
in 2013 to
15.2%
in 2014 primarily reflected a reduction in ceding commissions following changes to our reinsurance program and a change in the mix of business.
62
The decrease in the acquisition cost ratio from 2012 to 2013 was largely driven by MGA reductions and to a lesser extent higher ceding commissions earned relative to 2012, partially offset by a change in the business mix.
General and Administrative Expense Ratio:
The decrease in the general and administrative expense ratio from
20.1%
in 2013 to
18.7%
in 2014 was primarily due to a reduction in the allocation of certain corporate expenses and the growth in net premiums earned, partially offset by growth in personnel expenses and costs associated with new initiatives as we build out our global platform.
The general and administrative expense ratio was comparable in 2013 versus 2012. The increase in general and administrative costs from 2012 to 2013 was driven by increased salaries and related costs following an increase in staff. The impact on the general and administrative expense ratio was fully offset by the growth in net premiums earned.
REINSURANCE SEGMENT
Results from our reinsurance segment were as follows:
|
Year ended December 31,
|
2014
|
% Change
|
2013
|
% Change
|
2012
|
||||||||||||
|
Revenues:
|
|||||||||||||||||
|
Gross premiums written
|
$
|
2,176,104
|
|
2%
|
$
|
2,137,903
|
|
17%
|
$
|
1,830,162
|
|
||||||
|
Net premiums written
|
2,127,474
|
|
1%
|
2,114,662
|
|
16%
|
1,815,211
|
|
|||||||||
|
Net premiums earned
|
2,040,455
|
|
3%
|
1,984,303
|
|
7%
|
1,857,405
|
|
|||||||||
|
Other insurance related income
|
661
|
|
(67%)
|
1,988
|
|
nm
|
—
|
|
|||||||||
|
Expenses:
|
|||||||||||||||||
|
Current year net losses and loss expenses
|
(1,250,051
|
)
|
(1,252,874
|
)
|
(1,265,095
|
)
|
|||||||||||
|
Prior year reserve development
|
195,209
|
|
169,081
|
|
122,631
|
|
|||||||||||
|
Acquisition costs
|
(458,393
|
)
|
(421,828
|
)
|
(400,794
|
)
|
|||||||||||
|
General and administrative expenses
|
(144,987
|
)
|
(137,450
|
)
|
(116,487
|
)
|
|||||||||||
|
Underwriting income
|
$
|
382,894
|
|
12%
|
$
|
343,220
|
|
74%
|
$
|
197,660
|
|
||||||
|
|
|
% Point
Change
|
|
% Point
Change
|
|
||||||||||||
|
Ratios:
|
|||||||||||||||||
|
Current year loss ratio
|
61.3
|
%
|
(1.8)
|
63.1
|
%
|
(5.0)
|
68.1
|
%
|
|||||||||
|
Prior year reserve development
|
(9.6
|
%)
|
(1.1)
|
(8.5
|
%)
|
(1.9)
|
(6.6
|
%)
|
|||||||||
|
Acquisition cost ratio
|
22.5
|
%
|
1.2
|
21.3
|
%
|
(0.3)
|
21.6
|
%
|
|||||||||
|
General and administrative expense ratio
|
7.1
|
%
|
0.2
|
6.9
|
%
|
0.6
|
6.3
|
%
|
|||||||||
|
Combined ratio
|
81.3
|
%
|
(1.5)
|
82.8
|
%
|
(6.6)
|
89.4
|
%
|
|||||||||
nm – not meaningful
63
Gross Premiums Written:
The following table provides gross premiums written by line of business for the years indicated:
|
|
|
|
|
|
|
|
% Change
|
|||||||||||||||||||||
|
Year ended December 31,
|
2014
|
2013
|
2012
|
13 to 14
|
12 to 13
|
|||||||||||||||||||||||
|
Catastrophe
|
$
|
372,925
|
|
17
|
%
|
$
|
393,652
|
|
18
|
%
|
$
|
368,314
|
|
21
|
%
|
(5
|
%)
|
7
|
%
|
|||||||||
|
Property
|
349,775
|
|
16
|
%
|
364,315
|
|
17
|
%
|
315,758
|
|
17
|
%
|
(4
|
%)
|
15
|
%
|
||||||||||||
|
Professional Lines
|
293,263
|
|
13
|
%
|
380,355
|
|
18
|
%
|
301,863
|
|
16
|
%
|
(23
|
%)
|
26
|
%
|
||||||||||||
|
Credit and Surety
|
258,865
|
|
12
|
%
|
268,494
|
|
13
|
%
|
264,572
|
|
14
|
%
|
(4
|
%)
|
1
|
%
|
||||||||||||
|
Motor
|
291,293
|
|
13
|
%
|
242,046
|
|
11
|
%
|
235,648
|
|
13
|
%
|
20
|
%
|
3
|
%
|
||||||||||||
|
Liability
|
365,466
|
|
17
|
%
|
268,673
|
|
13
|
%
|
242,817
|
|
13
|
%
|
36
|
%
|
11
|
%
|
||||||||||||
|
Agriculture
|
166,047
|
|
8
|
%
|
132,780
|
|
6
|
%
|
19,326
|
|
1
|
%
|
25
|
%
|
nm
|
|
||||||||||||
|
Engineering
|
55,450
|
|
3
|
%
|
64,258
|
|
3
|
%
|
70,597
|
|
4
|
%
|
(14
|
%)
|
(9
|
%)
|
||||||||||||
|
Other
|
23,020
|
|
1
|
%
|
23,330
|
|
1
|
%
|
11,267
|
|
1
|
%
|
(1
|
%)
|
107
|
%
|
||||||||||||
|
Total
|
$
|
2,176,104
|
|
100
|
%
|
$
|
2,137,903
|
|
100
|
%
|
$
|
1,830,162
|
|
100
|
%
|
2
|
%
|
17
|
%
|
|||||||||
nm – not meaningful
2014
versus
2013
:
The increase in gross written premium of
$38 million
was significantly impacted by a number of treaties written on a multi-year basis in the liability, property, catastrophe and motor lines and included written premium that related to future underwriting years of $131 million (2013: $13 million). After adjusting for the impact of the multi-year contracts, gross premiums written declined $80 million driven by professional, property and catastrophe lines, partially offset by increases in liability, motor and agriculture lines. The decrease in professional lines was primarily driven by timing differences, non-renewals and decreased treaty participations. The decreases in property and catastrophe were primarily driven by variances in premium adjustments, reduced participations and non-renewals. The increase in liability primarily reflected increased treaty participations and new business. The motor lines increase was primarily driven by increased treaty participations, while the agriculture increase reflected our growth initiatives for this line of business.
2013
versus
2012
:
Gross premiums written increased by $308 million, with growth across most lines of business. Our agriculture initiative was the primary driver of the expansion in gross premiums written, contributing $113 million to the increase; quota share business in the United States comprised the majority of the increase, with excess of loss business in Asia also contributing. The main driver of growth in our professional lines was new business growth, primarily in the United States, which was partially offset by non-renewals and cancellations. Our property line of business increased primarily due to new business and the expansion of our worldwide client relationships. The increase in our catastrophe line of business was due to the expansion of our European portfolio, while growth in our liability line of business primarily reflected expansion in the U.S. including increased participations with existing clients.
See
‘Critical Accounting Estimates – Premiums’
section for a further discussion of related estimates.
64
Net Premiums Earned:
The following table provides net premiums earned by line of business:
|
|
|
|
|
|
|
|
% Change
|
|||||||||||||||||||||
|
Year ended December 31,
|
2014
|
2013
|
2012
|
13 to 14
|
12 to 13
|
|||||||||||||||||||||||
|
Catastrophe
|
$
|
325,307
|
|
17
|
%
|
$
|
380,199
|
|
20
|
%
|
$
|
375,088
|
|
19
|
%
|
(14
|
%)
|
1
|
%
|
|||||||||
|
Property
|
312,443
|
|
15
|
%
|
350,970
|
|
18
|
%
|
351,470
|
|
19
|
%
|
(11
|
%)
|
—
|
%
|
||||||||||||
|
Professional Lines
|
336,058
|
|
16
|
%
|
304,754
|
|
15
|
%
|
297,726
|
|
16
|
%
|
10
|
%
|
2
|
%
|
||||||||||||
|
Credit and Surety
|
263,013
|
|
13
|
%
|
279,943
|
|
14
|
%
|
277,185
|
|
15
|
%
|
(6
|
%)
|
1
|
%
|
||||||||||||
|
Motor
|
268,678
|
|
13
|
%
|
221,844
|
|
11
|
%
|
237,006
|
|
13
|
%
|
21
|
%
|
(6
|
%)
|
||||||||||||
|
Liability
|
289,223
|
|
14
|
%
|
234,736
|
|
12
|
%
|
220,874
|
|
12
|
%
|
23
|
%
|
6
|
%
|
||||||||||||
|
Agriculture
|
164,628
|
|
8
|
%
|
126,490
|
|
6
|
%
|
17,116
|
|
1
|
%
|
30
|
%
|
nm
|
|
||||||||||||
|
Engineering
|
61,143
|
|
3
|
%
|
66,243
|
|
3
|
%
|
68,402
|
|
4
|
%
|
(8
|
%)
|
(3
|
%)
|
||||||||||||
|
Other
|
19,962
|
|
1
|
%
|
19,124
|
|
1
|
%
|
12,538
|
|
1
|
%
|
4
|
%
|
53
|
%
|
||||||||||||
|
Total
|
$
|
2,040,455
|
|
100
|
%
|
$
|
1,984,303
|
|
100
|
%
|
$
|
1,857,405
|
|
100
|
%
|
3
|
%
|
7
|
%
|
|||||||||
nm – not meaningful
2014
versus
2013
:
The increase in net premiums earned reflected growth in the business written in recent periods in liability, motor, agriculture and professional lines. This growth was partially offset by decreases in catastrophe, property and credit and surety lines, following reductions in gross premiums written in these lines of business. In addition, the catastrophe line was also impacted by an increase in premiums ceded under retrocessional treaties.
2013
versus
2012
:
Expansion of our agriculture business in 2013, described above, was the primary driver of the increase in net premiums earned.
Other Insurance Related Income:
Other insurance related income in 2014 primarily related to realized gains on economic hedges purchased to protect our agriculture line of business against fluctuations in commodity prices, which were largely offset by realized and mark-to-market losses on our weather and commodity derivative business. Other insurance related income in 2013 reflected the net results of our weather and commodity business.
65
Loss Ratio:
The table below shows the components of our loss ratio:
|
Year ended December 31,
|
2014
|
% Point
Change
|
2013
|
% Point
Change
|
2012
|
||||||||||||
|
Current accident year
|
61.3
|
%
|
(1.8
|
)
|
63.1
|
%
|
(5.0
|
)
|
68.1
|
%
|
|||||||
|
Prior year reserve development
|
(9.6
|
%)
|
(1.1
|
)
|
(8.5
|
%)
|
(1.9
|
)
|
(6.6
|
%)
|
|||||||
|
Loss ratio
|
51.7
|
%
|
(2.9
|
)
|
54.6
|
%
|
(6.9
|
)
|
61.5
|
%
|
|||||||
Current Accident Year Loss Ratio
2014
versus
2013
:
The reduced level of natural catastrophe and weather-related activity was the primary driver of the decrease in the current accident year loss ratio.
During 2014, we recognized estimated aggregate pre-tax net losses of $27 million related to worldwide natural catastrophe and weather-related events. Comparatively, in 2013, we recognized pre-tax net losses (net of related reinstatement premiums) of $105 million related to worldwide natural catastrophe and weather-related events.
After adjusting for these natural catastrophe and weather-related losses, our 2014 current accident year loss ratio increased relative to 2013 primarily due to:
|
•
|
a change in the mix of business;
|
|
•
|
an increase in agricultural loss reserves; partially offset by
|
|
•
|
improved loss experience across most lines of business.
|
2013
versus
2012
:
The significant decrease in the level of natural catastrophe and weather-related activity was the primary driver of the decrease in the 2013 current accident year loss ratio.
During 2013, we recognized estimated aggregate pre-tax net losses (net of related reinstatement premiums) of $105 million for worldwide natural catastrophe and weather-related events. Comparatively, in 2012, we recognized pre-tax net losses (net of related reinstatement premiums) of $153 million related to the impact of Storm Sandy. In addition, we recognized aggregate pre-tax net losses (net of related reinstatement premiums) of $60 million for the impact of severe drought conditions on U.S. crops, Hurricane Isaac and first and second quarter 2012 U.S. weather events.
Exclusive of these natural catastrophe and weather-related losses, our 2013 current accident year loss ratio increased relative to 2012 primarily due to changes in the business mix and an increase in losses incurred in our agriculture line.
See ‘
Prior Year Reserve Development
’ section for further details.
Acquisition Cost Ratio:
The increase in the current year acquisition cost ratio from
21.3%
in 2013 to
22.5%
in 2014 was primarily impacted by higher acquisition costs paid on certain lines of business and variances in accruals for loss-sensitive features in underlying contracts.
The decrease in the reinsurance segment’s acquisition cost ratio in 2013 was driven by accruals related to loss-sensitive features in reinsurance contracts that reduced the segment's acquisition cost ratio; conversely, such accruals increased the acquisition cost ratio in 2012. This decrease was partially offset by higher acquisition costs incurred due to higher acquisition costs in certain lines of business.
General and Administrative Expense Ratio:
The increase in the general and administrative expense ratio from
6.9%
in 2013 to
7.1%
in 2014 was attributable to an increase in personnel and information technology costs associated with the continued build-out of the Company's global platform. These increases were partially offset by growth in net earned premiums.
General and administrative expenses increased in 2013, primarily driven by staffing increases, as we continue to build-out the segment's global platform. The impact of the increases on the general and administrative expense ratio was partially tempered by the growth in net premiums earned.
66
OTHER EXPENSES, NET
The following table provides a breakdown of our other expenses, net:
|
Year ended December 31,
|
2014
|
% Change
|
2013
|
% Change
|
2012
|
||||||||||||
|
Corporate expenses
|
$
|
135,675
|
|
50%
|
$
|
90,256
|
|
(30%)
|
$
|
129,660
|
|
||||||
|
Foreign exchange losses (gains)
|
(104,439
|
)
|
nm
|
26,143
|
|
(11%)
|
29,512
|
|
|||||||||
|
Interest expense and financing costs
|
74,695
|
|
21%
|
61,979
|
|
—%
|
61,863
|
|
|||||||||
|
Income tax expense
|
25,908
|
|
270%
|
7,002
|
|
113%
|
3,287
|
|
|||||||||
|
Total
|
$
|
131,839
|
|
(29%)
|
$
|
185,380
|
|
(17%)
|
$
|
224,322
|
|
||||||
nm – not meaningful
Corporate Expenses:
Our corporate expenses include holding company costs necessary to support our worldwide insurance and reinsurance operations and costs associated with operating as a publicly-traded company. As a percentage of net premiums earned, corporate expenses were
3.5%
,
2.4%
and
3.8%
for
2014
,
2013
and
2012
, respectively. The increase in corporate expenses during 2014 compared to 2013 was primarily related to increased personnel costs as we expand our business globally, a reduction in certain allocated costs to the segments, and information technology and professional costs related to operational excellence initiatives. These initiatives are aimed at improving the effectiveness and efficiency of our operations and are expected to result in a reduction of expenses in future periods.
The decrease in corporate expenses during 2013 compared to 2012 was reflective of costs associated with our second quarter 2012 senior leadership transition; these costs included accelerated and incremental share-based compensation expenses of $20 million and separation payments of $14 million. Excluding these senior leadership transition amounts, corporate expenses were
2.8%
of net premiums earned for 2012.
Foreign Exchange Losses (Gains):
Some of our business is written in currencies other than the U.S. dollar. The foreign exchange losses (gains) for all years presented were largely driven by the re-measurement of net insurance related liabilities. During 2014, the foreign exchange gains were primarily driven by the depreciation in the euro, which decreased 12% against the U.S. dollar, and the Sterling which decreased by 6%. The appreciation of the euro and Sterling had the opposite effect in 2013 and 2012, with depreciation in the Australian dollar partially offsetting the 2013 losses.
Interest Expense and Financing Costs:
Interest expense and financing costs primarily related to interest due on our senior notes. The increase in 2014 related to the issuance during the first quarter of 2014 of $250 million of 2.65% senior unsecured notes due in 2019 and $250 million of 5.15% senior unsecured notes due in 2045. Net proceeds from these two offerings were used towards the repayment of $500 million of AXIS Capital’s 5.75% senior unsecured notes which matured on December 1, 2014.
Income Tax Expense:
Income tax expense primarily results from income generated by our foreign operations in the United States and Europe. Our effective tax rate, which is calculated as income tax expense divided by income before tax, was
3.1%
,
1.0%
and
0.6%
in
2014
,
2013
and
2012
, respectively. This effective rate can vary between years depending on the distribution of net income (loss) amongst tax jurisdictions, as well as other factors.
The increased tax rate in 2014 compared to 2013 was impacted by an increase in our valuation allowance of $9 million related primarily to operating loss tax-carryforwards generated from branch operations in Australia and certain foreign tax credits. Further increasing income tax expense in 2014 was a decrease in tax exempt income driven by a reduction in our U.S. tax-exempt portfolio.
The majority of the higher tax rate in 2013 compared to 2012 is attributable to an increase in pre-tax income in the U.S. A significant portion of our losses and loss expenses for Storm Sandy in 2012 related to insurance risks written by our U.S. subsidiaries, driving a low effective tax rate.
67
NET INVESTMENT INCOME AND NET REALIZED INVESTMENT GAINS/LOSSES
Net Investment Income
The following table provides a breakdown of income earned from our cash and investment portfolio by major asset class:
|
Year ended December 31,
|
2014
|
% Change
|
2013
|
% Change
|
2012
|
||||||||||||
|
Fixed maturities
|
$
|
296,663
|
|
1%
|
$
|
293,609
|
|
(4%)
|
$
|
304,400
|
|
||||||
|
Other investments
|
57,621
|
|
(55%)
|
128,814
|
|
47%
|
87,660
|
|
|||||||||
|
Equities
|
11,832
|
|
9%
|
10,897
|
|
(8%)
|
11,904
|
|
|||||||||
|
Cash and cash equivalents
|
11,536
|
|
82%
|
6,337
|
|
40%
|
4,528
|
|
|||||||||
|
Short-term investments
|
725
|
|
(39%)
|
1,181
|
|
98%
|
596
|
|
|||||||||
|
Gross investment income
|
378,377
|
|
(14%)
|
440,838
|
|
8%
|
409,088
|
|
|||||||||
|
Investment expense
|
(35,611
|
)
|
13%
|
(31,526
|
)
|
12%
|
(28,131
|
)
|
|||||||||
|
Net investment income
|
$
|
342,766
|
|
(16%)
|
$
|
409,312
|
|
7%
|
$
|
380,957
|
|
||||||
|
Pre-tax yield:
(1)
|
|||||||||||||||||
|
Fixed maturities
|
2.4
|
%
|
2.5
|
%
|
2.7
|
%
|
|||||||||||
|
(1)
|
Pre-tax yield is annualized and calculated as net investment income divided by the average month-end amortized cost balances for the periods indicated.
|
Fixed Maturities:
2014
versus
2013
:
The 1% increase in investment income from fixed maturities is reflective of the 3% increase in average fixed maturities balances during 2014 as additional investments in fixed maturities were funded primarily by reinvestment of net investment income. This was partially offset by lower reinvestment yields as book yields continue to decline towards market yields.
2013
versus
2012
:
The 4% reduction in investment income from fixed maturities reflected lower reinvestment yields as book yields continued to decline towards market yields. This decline was partially offset by the 5% growth in our average fixed maturities balances during 2013 as additional investments in fixed maturities were funded primarily by reinvestment of net investment income.
Other Investments:
Other investments include hedge funds, direct lending funds and both direct and indirect (through a fund structure) investments in equity tranches of collateralized loan obligations (“CLO Equities”). These investments are recorded at fair value, with the change in fair value and income distributions reported in net investment income. Consequently, the pre-tax return on other investments may vary materially period over period, particularly during volatile equity and credit markets.
The following table provides a breakdown of net investment income (loss) from other investments:
|
Year ended December 31,
|
2014
|
2013
|
2012
|
||||||||||
|
Hedge and direct lending funds
|
$
|
37,447
|
|
$
|
100,915
|
|
$
|
56,551
|
|
||||
|
CLO - Equities
|
20,174
|
|
27,899
|
|
31,109
|
|
|||||||
|
Total net investment income from other investments
|
$
|
57,621
|
|
$
|
128,814
|
|
$
|
87,660
|
|
||||
|
Pre-tax return on other investments
(1)
|
5.8
|
%
|
13.3
|
%
|
11.1
|
%
|
|||||||
|
(1)
|
The pre-tax return on other investments is calculated by dividing total income from other investments by the average month-end fair value balances held for the periods indicated.
|
68
2014
versus
2013
:
The lower pre-tax return on our other investments portfolio was primarily due to modest returns on our hedge funds during 2014, compared to the strong returns provided by these holdings in 2013. The modest returns of these funds were reflective of the lower returns from global equity markets during 2014. The decline in income from CLO Equities in dollar terms was primarily due to a reduction in our direct investments as two holdings have completed their investment cycle and have returned all capital to equity tranche holders.
2013
versus
2012
:
The improvement in the pre-tax return on our other investments portfolio was primarily driven by the returns generated by our hedge funds as a result of the continued strong performance of both global equities and bank loans. Our direct investments in CLO Equities provided strong returns again in 2013, driven by lower than anticipated default rates and higher than anticipated recovery rates for the underlying collateral (refer to the ‘
Critical Accounting Estimates – Fair Value Measurements’
for further details on the fair value measurement). The decline in income from CLO Equities in dollar terms was primarily due to a reduction in our direct investments as two holdings have entered the liquidation phase of their investment cycle and have begun returning capital to equity tranche holders.
Net Realized Investment Gains
Our fixed maturities and equities are classified as available for sale and reported at fair value. The effect of market movements on our available for sale investment portfolio impacts net income (through net realized investment gains) only when securities are sold, hedged, or impaired. Additionally, changes in the fair value of investment derivatives, mainly foreign exchange forward contracts and interest rate swaps, are recorded in net realized investment gains.
The following table provides a breakdown of net realized investment gains:
|
Year ended December 31,
|
2014
|
2013
|
2012
|
||||||||||
|
On sale of investments:
|
|||||||||||||
|
Fixed maturities and short-term investments
|
$
|
39,080
|
|
$
|
33,038
|
|
$
|
140,238
|
|
||||
|
Equities
|
133,858
|
|
44,157
|
|
12,881
|
|
|||||||
|
172,938
|
|
77,195
|
|
153,119
|
|
||||||||
|
OTTI charges recognized in earnings
|
(31,227
|
)
|
(9,362
|
)
|
(24,234
|
)
|
|||||||
|
Change in fair value of investment derivatives
|
(9,603
|
)
|
7,731
|
|
(9,170
|
)
|
|||||||
|
Fair value hedges
|
—
|
|
—
|
|
7,754
|
|
|||||||
|
Net realized investment gains
|
$
|
132,108
|
|
$
|
75,564
|
|
$
|
127,469
|
|
||||
On sale of investments:
Generally, sales of individual securities occur when there are changes in the relative value, credit quality, or duration of a particular issuer. We may also sell to rebalance our investment portfolio in order to change exposure to particular sectors or asset classes.
2014
versus
2013
:
Improvements in global equity markets during 2013 and the first half of 2014 enabled us to realize net gains on sales of our equity securities (primarily common stock) during 2014. Proceeds from these sales were reallocated to exchange-traded funds ("ETF's"). The primary source of the net realized gains on fixed maturities in 2014 was municipal debt.
2013
versus
2012
:
Lower net realized gains during 2013 are reflective of the significant declines in the pricing for our fixed maturities during 2013. The primary source of the net realized gains on fixed maturities in 2013 was corporate debt (mainly investment-grade but high yield also contributed). The strong performance of global equity markets during 2013 and 2012 enabled us to realize net gains on sales of common stock during 2013. The proceeds of common stock sales were used to fund incremental investments in hedge funds.
OTTI charges:
Refer to the ‘
Critical Accounting Estimates – OTTI
’ section for details on our impairment review process.
69
The following table provides a summary of the OTTI recognized in earnings by asset class:
|
Year ended December 31,
|
2014
|
2013
|
2012
|
||||||||||
|
Fixed maturities:
|
|||||||||||||
|
Non-U.S. government
|
$
|
17,291
|
|
$
|
120
|
|
$
|
3,281
|
|
||||
|
Corporate debt
|
8,107
|
|
5,802
|
|
1,821
|
|
|||||||
|
Non-Agency RMBS
|
7
|
|
57
|
|
2,016
|
|
|||||||
|
ABS
|
61
|
|
129
|
|
795
|
|
|||||||
|
Municipals
|
418
|
|
639
|
|
—
|
|
|||||||
|
25,884
|
|
6,747
|
|
7,913
|
|
||||||||
|
Equities:
|
|||||||||||||
|
Common stocks
|
741
|
|
2,092
|
|
7,318
|
|
|||||||
|
Exchange traded funds
|
4,602
|
|
523
|
|
9,003
|
|
|||||||
|
5,343
|
|
2,615
|
|
16,321
|
|
||||||||
|
Total OTTI recognized in earnings
|
$
|
31,227
|
|
$
|
9,362
|
|
$
|
24,234
|
|
||||
The level of OTTI losses increased in 2014 compared to 2013 due mainly to losses recorded on non-U.S. denominated securities as a result of the decline in foreign exchange rates against the U.S. dollar, and related to securities that are due to mature in the near future.
Change in Fair Value of Investment Derivatives:
From time to time, we may economically hedge the foreign exchange exposure of non-U.S. denominated securities by entering into foreign exchange forward contracts. During 2014, our foreign exchange hedges resulted in $10 million of net gains which related primarily to securities denominated in the Mexican peso, Euro and Australian dollar. Each of these currencies declined significantly against the U.S. dollar during 2014.
During 2013, we introduced the use of interest rate swaps to reduce duration risk of our fixed income portfolio. During 2014, we recorded $20 million of net losses relating to our interest rate swaps.
Hedge accounting was not applied to any of these derivatives so the corresponding net unrealized gains/losses on the hedged securities are recorded as part of accumulated other comprehensive income in shareholders' equity.
Fair Value Hedges:
In 2012 and prior, we entered into foreign exchange forward contracts to hedge the foreign currency exposure of certain available for sale fixed maturity portfolios denominated in euros. These hedges were designated and qualified as fair value hedges, resulting in the net impact of the hedges recognized in net realized investment gains (losses). During 2012, we sold all available for sale fixed maturities in the portfolios that qualified for hedge accounting and settled all of the associated foreign exchange forward contracts.
Foreign denominated assets and liabilities will continue to be substantially matched, in order to minimize any foreign exchange impact on book value.
Total Return
Our investment strategy is to take a long-term view by actively managing our investment portfolio to maximize total return within certain guidelines and constraints. In assessing returns under this approach, we include net investment income, net realized investment gains and losses and the change in unrealized gains and losses generated by our investment portfolio. The following table provides a breakdown of the total return on cash and investments, inclusive of foreign exchange impact, for the periods indicated:
70
|
Year ended December 31,
|
2014
|
2013
|
2012
|
||||||||||
|
Net investment income
|
$
|
342,766
|
|
$
|
409,312
|
|
$
|
380,957
|
|
||||
|
Net realized investments gains
|
132,108
|
|
75,564
|
|
127,469
|
|
|||||||
|
Change in net unrealized gains/losses, net of currency hedges
|
(163,877
|
)
|
(245,429
|
)
|
250,212
|
|
|||||||
|
Total
|
$
|
310,997
|
|
$
|
239,447
|
|
$
|
758,638
|
|
||||
|
Average cash and investments
(1)
|
$
|
15,334,932
|
|
$
|
14,660,012
|
|
$
|
14,098,888
|
|
||||
|
Total return on average cash and investments, pre-tax
(2)
|
2.0
|
%
|
1.6
|
%
|
5.4
|
%
|
|||||||
|
(1)
|
The average cash and investments balance is calculated by taking the average of the month-end fair value balances held for the periods indicated.
|
|
(2)
|
Excluding the foreign currency impact of securities denominated in foreign currencies, the total return would be 2.8% for 2014 (2013: 1.6%, 2012: 4.9%).
|
CASH AND INVESTMENTS
The table below provides a breakdown of our cash and investments:
|
|
December 31, 2014
|
December 31, 2013
|
|||||||||||||||
|
|
Amortized Cost
or Cost
|
Fair Value
|
Amortized Cost
or Cost
|
Fair Value
|
|||||||||||||
|
Fixed maturities
|
$
|
12,185,973
|
|
$
|
12,129,273
|
|
$
|
11,987,146
|
|
$
|
11,986,327
|
|
|||||
|
Equities
|
531,648
|
|
567,707
|
|
566,219
|
|
701,987
|
|
|||||||||
|
Other investments
|
736,599
|
|
965,465
|
|
839,177
|
|
1,045,810
|
|
|||||||||
|
Short-term investments
|
107,534
|
|
107,534
|
|
46,212
|
|
46,212
|
|
|||||||||
|
Total investments
|
$
|
13,561,754
|
|
$
|
13,769,979
|
|
$
|
13,438,754
|
|
$
|
13,780,336
|
|
|||||
|
Cash and cash equivalents
(1)
|
$
|
1,209,695
|
|
$
|
1,209,695
|
|
$
|
987,876
|
|
$
|
987,876
|
|
|||||
|
(1)
|
Includes restricted cash and cash equivalents of
$288 million
and $65 million for 2014 and 2013, respectively.
|
Overview
The cost of our total investments increased by $123 million from
December 31, 2013
, primarily due to investing a portion of our operating cash flows.
The fair value of our total investments decreased $10 million from December 31, 2013 as net contributions to fixed maturities were more than offset by lower valuations as a result of the strengthening of the US dollar and the widening of credit spreads on both investment grade and high-yield corporate debt. The decline in the fair value of equities was due to sales resulting in net realized gains during the year.
71
The following provides a further analysis on our investment portfolio.
Fixed Maturities
The following provides a breakdown of our investment in fixed maturities:
|
|
December 31, 2014
|
December 31, 2013
|
|||||||||||||
|
|
Fair Value
|
% of Total
|
Fair Value
|
% of Total
|
|||||||||||
|
Fixed maturities:
|
|||||||||||||||
|
U.S. government and agency
|
$
|
1,620,077
|
|
12
|
%
|
$
|
1,388,698
|
|
11
|
%
|
|||||
|
Non-U.S. government
|
1,033,543
|
|
9
|
%
|
1,176,382
|
|
10
|
%
|
|||||||
|
Corporate debt
|
4,361,124
|
|
36
|
%
|
3,608,238
|
|
30
|
%
|
|||||||
|
Agency RMBS
|
2,278,108
|
|
19
|
%
|
2,448,827
|
|
20
|
%
|
|||||||
|
CMBS
|
1,096,888
|
|
9
|
%
|
797,414
|
|
7
|
%
|
|||||||
|
Non-Agency RMBS
|
73,086
|
|
1
|
%
|
67,567
|
|
1
|
%
|
|||||||
|
ABS
|
1,461,586
|
|
12
|
%
|
953,451
|
|
8
|
%
|
|||||||
|
Municipals
(1)
|
204,861
|
|
2
|
%
|
1,545,750
|
|
13
|
%
|
|||||||
|
Total
|
$
|
12,129,273
|
|
100
|
%
|
$
|
11,986,327
|
|
100
|
%
|
|||||
|
Credit ratings:
|
|||||||||||||||
|
U.S. government and agency
|
$
|
1,620,077
|
|
12
|
%
|
$
|
1,388,698
|
|
11
|
%
|
|||||
|
AAA
(2)
|
4,720,852
|
|
39
|
%
|
4,160,744
|
|
35
|
%
|
|||||||
|
AA
|
1,034,047
|
|
9
|
%
|
1,795,291
|
|
15
|
%
|
|||||||
|
A
|
2,204,984
|
|
18
|
%
|
2,220,263
|
|
19
|
%
|
|||||||
|
BBB
|
1,516,815
|
|
13
|
%
|
1,468,669
|
|
12
|
%
|
|||||||
|
Below BBB
(3)
|
1,032,498
|
|
9
|
%
|
952,662
|
|
8
|
%
|
|||||||
|
Total
|
$
|
12,129,273
|
|
100
|
%
|
$
|
11,986,327
|
|
100
|
%
|
|||||
|
(1)
|
Includes bonds issued by states, municipalities, and political subdivisions.
|
|
(2)
|
Includes U.S. government-sponsored agency RMBS and CMBS.
|
|
(3)
|
Non-investment grade and non-rated securities.
|
At
December 31, 2014
, fixed maturities had a weighted average credit rating of AA- (
2013
: AA-), a book yield of 2.5% (
2013
: 2.5%) and an average duration of 3.0 years (
2013
: 3.3 years). The interest rate swap position introduced in 2013 and still in effect during 2014 reduced duration to 2.9 years. When incorporating short-term investments and cash and cash equivalents into this calculation (bringing the total to $13.4 billion), the weighted average credit rating would be AA- (
2013
: AA-) and duration (including interest rate swaps) would be 2.7 years (
2013
: 2.9 years).
Our methodology for assigning credit ratings to our fixed maturities is in line with the methodology used for the Barclays U.S. Aggregate Bond index. This methodology uses the middle of Standard & Poor's (S&P), Moody's and Fitch ratings. When ratings from only two of these agencies are available, the lower rating is used. When a rating from only one agency is available, it is used.
To calculate the weighted average credit rating for fixed maturities, we assign points to each rating with 29 points for the highest rating (AAA) and 2 points for the lowest rating (D) and then calculate the weighted average based on the fair values of the individual securities. Securities that are not rated by S&P, Moody’s or Fitch are excluded from weighted average calculations. At
December 31, 2014
, the fair value of fixed maturities not rated was $0.1 million (
2013
: $1 million).
In addition to managing our credit risk exposure within our fixed maturity portfolio we also monitor the aggregation of country risk exposure on a group-wide basis (refer to Item 1 ‘
Risk and Capital Management’
for further details). Country risk exposure is the risk that events within a country, such as currency crises, regulatory changes and other political events, will adversely affect the ability of obligors within the country to honor their obligations to us. For corporate debt and
72
structured securities, we measure the country of risk exposure based on a number of factors including, but not limited to, location of management, principal operations and country of revenues.
In light of global concerns during recent years over the creditworthiness of certain sovereign debt within the eurozone, we have actively managed our exposure. Our current non-U.S. government holdings include exposure to only two countries within the eurozone - Netherlands and Slovenia - which have a combined weighted average credit rating of AA. At
December 31, 2014
, we held no sovereign debt issued by the peripheral European countries of Greece, Ireland, Italy, Portugal and Spain.
The following table provides a breakdown of the fair value of our eurozone exposure within our fixed maturity portfolio:
|
Non-U.S.
Government
|
Corporate
|
Non-Agency
RMBS
|
ABS
|
Total
|
% of Total
|
|||||||||||||||||||
|
At December 31, 2014
|
||||||||||||||||||||||||
|
Eurozone countries:
|
||||||||||||||||||||||||
|
Germany
|
$
|
—
|
|
$
|
135,454
|
|
$
|
—
|
|
$
|
1,108
|
|
$
|
136,562
|
|
30
|
%
|
|||||||
|
Supranationals
(1)
|
107,299
|
|
8,673
|
|
—
|
|
—
|
|
115,972
|
|
25
|
%
|
||||||||||||
|
Netherlands
|
10,054
|
|
49,524
|
|
3,450
|
|
—
|
|
63,028
|
|
14
|
%
|
||||||||||||
|
France
|
—
|
|
59,792
|
|
—
|
|
64
|
|
59,856
|
|
13
|
%
|
||||||||||||
|
Luxembourg
|
—
|
|
23,510
|
|
—
|
|
—
|
|
23,510
|
|
5
|
%
|
||||||||||||
|
Ireland
|
—
|
|
10,347
|
|
—
|
|
10,600
|
|
20,947
|
|
5
|
%
|
||||||||||||
|
Italy
|
—
|
|
14,649
|
|
—
|
|
—
|
|
14,649
|
|
3
|
%
|
||||||||||||
|
Belgium
|
—
|
|
12,577
|
|
—
|
|
—
|
|
12,577
|
|
3
|
%
|
||||||||||||
|
Spain
|
—
|
|
8,619
|
|
—
|
|
—
|
|
8,619
|
|
2
|
%
|
||||||||||||
|
Slovenia
|
1,782
|
|
—
|
|
—
|
|
—
|
|
1,782
|
|
—
|
%
|
||||||||||||
|
Austria
|
—
|
|
478
|
|
—
|
|
—
|
|
478
|
|
—
|
%
|
||||||||||||
|
Total eurozone
|
$
|
119,135
|
|
$
|
323,623
|
|
$
|
3,450
|
|
$
|
11,772
|
|
$
|
457,980
|
|
100
|
%
|
|||||||
|
At December 31, 2013
|
||||||||||||||||||||||||
|
Eurozone countries:
|
||||||||||||||||||||||||
|
Germany
|
$
|
22,833
|
|
$
|
90,916
|
|
$
|
—
|
|
$
|
5,176
|
|
$
|
118,925
|
|
28
|
%
|
|||||||
|
Supranationals
(1)
|
115,777
|
|
—
|
|
—
|
|
—
|
|
115,777
|
|
28
|
%
|
||||||||||||
|
Netherlands
|
20,776
|
|
50,472
|
|
227
|
|
4,838
|
|
76,313
|
|
18
|
%
|
||||||||||||
|
France
|
—
|
|
45,366
|
|
—
|
|
3,225
|
|
48,591
|
|
11
|
%
|
||||||||||||
|
Luxembourg
|
—
|
|
17,494
|
|
—
|
|
—
|
|
17,494
|
|
4
|
%
|
||||||||||||
|
Spain
|
—
|
|
17,255
|
|
—
|
|
—
|
|
17,255
|
|
4
|
%
|
||||||||||||
|
Ireland
|
—
|
|
4,065
|
|
—
|
|
5,668
|
|
9,733
|
|
2
|
%
|
||||||||||||
|
Italy
|
—
|
|
8,112
|
|
—
|
|
—
|
|
8,112
|
|
2
|
%
|
||||||||||||
|
Belgium
|
—
|
|
6,454
|
|
—
|
|
—
|
|
6,454
|
|
2
|
%
|
||||||||||||
|
Austria
|
1,272
|
|
2,922
|
|
—
|
|
—
|
|
4,194
|
|
1
|
%
|
||||||||||||
|
Total eurozone
|
$
|
160,658
|
|
$
|
243,056
|
|
$
|
227
|
|
$
|
18,907
|
|
$
|
422,848
|
|
100
|
%
|
|||||||
|
(1)
|
Includes supranationals only within the eurozone.
|
We also have an indirect eurozone exposure through our investment of
$113 million
(2013: $125 million) in non-U.S. bond mutual funds, which are classified as equities.
73
The following is an analysis of our fixed maturity portfolio by major asset classes.
Non-U.S. Government:
Our holdings in non-U.S. government securities consisted of fixed income obligations of non-U.S. sovereigns, including government agencies, local governments and supranationals. The table below summarizes our aggregate fixed maturity exposures to governments in the eurozone and other non-U.S. government concentrations by fair value at
December 31, 2014
and
2013
:
|
|
December 31, 2014
|
December 31, 2013
|
|||||||||||||||||
|
Country
|
Fair Value
|
% of Total
|
Weighted
Average
Credit Rating
|
Fair Value
|
% of Total
|
Weighted
Average
Credit Rating
|
|||||||||||||
|
Eurozone countries:
|
|
||||||||||||||||||
|
Supranationals
(1)
|
$
|
107,299
|
|
10
|
%
|
AA+
|
$
|
115,777
|
|
10
|
%
|
AAA
|
|||||||
|
Netherlands
|
10,054
|
|
1
|
%
|
AA+
|
20,776
|
|
2
|
%
|
AAA
|
|||||||||
|
Slovenia
|
1,782
|
|
—
|
%
|
BBB+
|
—
|
|
—
|
%
|
—
|
|||||||||
|
Germany
|
—
|
|
—
|
%
|
—
|
22,833
|
|
2
|
%
|
AAA
|
|||||||||
|
Austria
|
—
|
|
—
|
%
|
—
|
1,272
|
|
—
|
%
|
AAA
|
|||||||||
|
Total eurozone
|
$
|
119,135
|
|
11
|
%
|
AA+
|
$
|
160,658
|
|
14
|
%
|
AAA
|
|||||||
|
Other concentrations:
|
|
||||||||||||||||||
|
Australia
|
$
|
190,565
|
|
18
|
%
|
AAA
|
$
|
158,056
|
|
13
|
%
|
AAA
|
|||||||
|
United Kingdom
|
172,410
|
|
17
|
%
|
AAA
|
182,230
|
|
15
|
%
|
AA+
|
|||||||||
|
Canada
|
114,430
|
|
11
|
%
|
AAA
|
165,013
|
|
14
|
%
|
AAA
|
|||||||||
|
Brazil
|
87,890
|
|
9
|
%
|
BBB
|
94,796
|
|
8
|
%
|
BBB
|
|||||||||
|
Mexico
|
67,368
|
|
7
|
%
|
A-
|
66,987
|
|
6
|
%
|
A-
|
|||||||||
|
Other
|
281,745
|
|
27
|
%
|
A
|
348,642
|
|
30
|
%
|
A-
|
|||||||||
|
Total other concentrations
|
$
|
914,408
|
|
89
|
%
|
AA-
|
$
|
1,015,724
|
|
86
|
%
|
AA-
|
|||||||
|
Total non-U.S. government
|
$
|
1,033,543
|
|
100
|
%
|
AA-
|
$
|
1,176,382
|
|
100
|
%
|
AA-
|
|||||||
|
(1)
|
Includes supranationals only within the eurozone.
|
During 2014, we continued to reduce our exposure to eurozone sovereign debt. "Other concentrations" includes our local currency emerging market debt portfolio. At
December 31, 2014
, this portfolio had a weighted average credit rating of BBB+ (2013: A-), a duration of 4.5 years (2013: 5.0 years) and a yield-to-worst of 6.8% (2013: 7.2%).
At
December 31, 2014
, our non-U.S. government debt had net unrealized losses of $47 million (
2013
: $32 million) which included gross unrealized foreign exchange losses of $51 million (
2013
: $29 million), mainly on emerging market debt securities.
74
Corporate Debt:
The composition of our corporate debt securities by sector was as follows:
|
|
December 31, 2014
|
December 31, 2013
|
|||||||||||||||||
|
|
Fair Value
|
% of Total
|
Weighted
Average
Credit Rating
|
Fair Value
|
% of Total
|
Weighted
Average
Credit Rating
|
|||||||||||||
|
Financial institutions:
|
|
||||||||||||||||||
|
U.S. banking
|
$
|
1,079,729
|
|
25
|
%
|
A-
|
$
|
942,437
|
|
26
|
%
|
A-
|
|||||||
|
Corporate/commercial finance
|
317,676
|
|
7
|
%
|
BBB
|
209,074
|
|
6
|
%
|
BBB
|
|||||||||
|
Foreign banking
|
214,188
|
|
5
|
%
|
AA-
|
45,320
|
|
1
|
%
|
A+
|
|||||||||
|
Insurance
|
116,687
|
|
3
|
%
|
A
|
166,987
|
|
5
|
%
|
A
|
|||||||||
|
Investment brokerage
|
11,059
|
|
—
|
%
|
BBB+
|
15,750
|
|
—
|
%
|
BB
|
|||||||||
|
Consumer finance
|
—
|
|
—
|
%
|
—
|
16,345
|
|
—
|
%
|
BB
|
|||||||||
|
Total financial institutions
|
1,739,339
|
|
40
|
%
|
A-
|
1,395,913
|
|
38
|
%
|
A-
|
|||||||||
|
Communications
|
507,911
|
|
12
|
%
|
BBB-
|
450,490
|
|
12
|
%
|
BBB-
|
|||||||||
|
Consumer cyclical
|
487,968
|
|
11
|
%
|
BBB-
|
400,798
|
|
11
|
%
|
BBB-
|
|||||||||
|
Consumer non-cyclicals
|
437,377
|
|
10
|
%
|
BBB
|
345,114
|
|
10
|
%
|
BBB-
|
|||||||||
|
Industrials
|
401,033
|
|
9
|
%
|
BB+
|
298,159
|
|
8
|
%
|
BB+
|
|||||||||
|
Energy
|
277,201
|
|
7
|
%
|
BBB-
|
196,991
|
|
6
|
%
|
BB+
|
|||||||||
|
Utilities
|
139,576
|
|
3
|
%
|
BBB
|
263,615
|
|
7
|
%
|
BBB
|
|||||||||
|
Non-U.S. government guaranteed
|
99,063
|
|
2
|
%
|
AAA
|
64,982
|
|
2
|
%
|
AA+
|
|||||||||
|
Other
|
271,656
|
|
6
|
%
|
BBB
|
192,176
|
|
6
|
%
|
BBB-
|
|||||||||
|
Total
|
$
|
4,361,124
|
|
100
|
%
|
BBB
|
$
|
3,608,238
|
|
100
|
%
|
BBB
|
|||||||
|
Credit quality summary:
|
|||||||||||||||||||
|
Investment grade
|
$
|
3,376,110
|
|
77
|
%
|
A-
|
$
|
2,707,591
|
|
75
|
%
|
A-
|
|||||||
|
Non-investment grade
|
985,014
|
|
23
|
%
|
B+
|
900,647
|
|
25
|
%
|
B+
|
|||||||||
|
Total
|
$
|
4,361,124
|
|
100
|
%
|
BBB
|
$
|
3,608,238
|
|
100
|
%
|
BBB
|
|||||||
The increase in investment grade corporate debt holdings during 2014 was due to attractive valuations, with much of the proceeds from the sale of municipal debt holdings being invested in this sector. The increase in non-investment grade holdings is due to additional funds being allocated to our short duration high yield strategy during 2014. At
December 31, 2014
, our short duration high yield portfolio had a fair value of $985 million (
2013
: $916 million), a weighted average credit rating of B+ (
2013
: B+) and duration of 2.0 years (2013: 1.6 years). At
December 31, 2014
, our total corporate debt portfolio, including short duration high yield securities, had a duration of 2.8 years (
2013
: 2.4 years).
75
Mortgage-Backed Securities:
The following table provides a breakdown of the fair value of our RMBS and CMBS portfolios by credit rating:
|
|
December 31, 2014
|
December 31, 2013
|
|||||||||||||||
|
|
RMBS
|
CMBS
|
RMBS
|
CMBS
|
|||||||||||||
|
Government agency
|
$
|
2,278,108
|
|
$
|
—
|
|
$
|
2,448,827
|
|
$
|
—
|
|
|||||
|
AAA
|
22,360
|
|
701,316
|
|
12,261
|
|
411,811
|
|
|||||||||
|
AA
|
338
|
|
218,188
|
|
370
|
|
233,360
|
|
|||||||||
|
A
|
6,329
|
|
123,623
|
|
5,891
|
|
73,932
|
|
|||||||||
|
BBB
|
12,574
|
|
51,990
|
|
8,095
|
|
76,493
|
|
|||||||||
|
Below BBB
(1)
|
31,485
|
|
1,771
|
|
40,950
|
|
1,818
|
|
|||||||||
|
Total
|
$
|
2,351,194
|
|
$
|
1,096,888
|
|
$
|
2,516,394
|
|
$
|
797,414
|
|
|||||
|
(1)
|
Non-investment grade securities
|
Residential MBS:
Our RMBS portfolio consists primarily of AAA-rated U.S. agency issues and is supported by loans that are diversified across geographical areas. Due to an increase in prepayment expectations, the duration of our agency MBS holdings reduced from 4.9 years at December 31, 2013 to 4.0 years at December 31, 2014.
At
December 31, 2014
, our non-agency RMBS had an average duration and weighted average life of 0.5 years (
2013
: 0.5 years) and 4.3 years (
2013
: 4.0 years), respectively.
Commercial MBS:
Our CMBS portfolio continues to be rated highly, with approximately 84% rated AA or better (
2013
: 81%). Additionally, the weighted average estimated subordination percentage for the portfolio was 30% at
December 31, 2014
(
2013
: 30%), which represents the current weighted average estimated percentage of the capital structure subordinated to the investment holding that is available to absorb losses before the security incurs the first dollar loss of principal. At
December 31, 2014
, the average duration and weighted average life was 3.2 years (
2013
: 2.5 years) and 3.8 years (
2013
: 2.6 years), respectively.
76
Asset-Backed Securities:
The following table provides a breakdown of the fair value of our ABS by underlying collateral and credit rating:
|
|
Asset-backed securities
|
||||||||||||||||||||||||
|
|
AAA
|
AA
|
A
|
BBB
|
Below BBB
(3)
|
Total
|
|||||||||||||||||||
|
At December 31, 2014
|
|||||||||||||||||||||||||
|
CLO - debt tranches
|
$
|
769,755
|
|
$
|
266,928
|
|
$
|
—
|
|
$
|
—
|
|
$
|
108
|
|
$
|
1,036,791
|
|
|||||||
|
Auto
|
170,521
|
|
39,818
|
|
29,815
|
|
21,761
|
|
—
|
|
261,915
|
|
|||||||||||||
|
Student loan
|
52,751
|
|
8,061
|
|
—
|
|
—
|
|
—
|
|
60,812
|
|
|||||||||||||
|
Credit card
|
21,517
|
|
—
|
|
—
|
|
—
|
|
—
|
|
21,517
|
|
|||||||||||||
|
Other
|
51,114
|
|
594
|
|
25,819
|
|
226
|
|
2,798
|
|
80,551
|
|
|||||||||||||
|
Total
|
$
|
1,065,658
|
|
$
|
315,401
|
|
$
|
55,634
|
|
$
|
21,987
|
|
$
|
2,906
|
|
$
|
1,461,586
|
|
|||||||
|
% of total
|
73%
|
22%
|
4%
|
1%
|
—%
|
100%
|
|||||||||||||||||||
|
At December 31, 2013
|
|||||||||||||||||||||||||
|
CLO - debt tranches
|
$
|
399,736
|
|
$
|
179,318
|
|
$
|
5,575
|
|
$
|
8,902
|
|
$
|
484
|
|
$
|
594,015
|
|
|||||||
|
Auto
|
82,982
|
|
41,911
|
|
29,828
|
|
23,394
|
|
—
|
|
178,115
|
|
|||||||||||||
|
Student loan
|
67,767
|
|
15,156
|
|
—
|
|
—
|
|
—
|
|
82,923
|
|
|||||||||||||
|
Credit card
|
7,110
|
|
—
|
|
—
|
|
—
|
|
—
|
|
7,110
|
|
|||||||||||||
|
Other
|
79,316
|
|
1,496
|
|
2,979
|
|
4,756
|
|
2,741
|
|
91,288
|
|
|||||||||||||
|
Total
|
$
|
636,911
|
|
$
|
237,881
|
|
$
|
38,382
|
|
$
|
37,052
|
|
$
|
3,225
|
|
$
|
953,451
|
|
|||||||
|
% of total
|
67%
|
25%
|
4%
|
4%
|
—%
|
100%
|
|||||||||||||||||||
The increase in the total fair value during 2014 was primarily due to incremental investments in CLO Debt securities. The CLO Debt is predominantly floating rate and is anticipated to reduce the impact of potential future increases in interest rates while not compromising the high credit quality of our fixed maturities portfolio. These securities were purchased primarily as new issues and all had ratings of AA- or better. The average duration and weighted average life of our ABS portfolio at
December 31, 2014
was 0.5 years (
2013
: 0.6 years) and 3.7 years (
2013
: 4.0 years), respectively.
77
Municipals:
Our holdings in municipal debt are primarily held within the taxable portfolios of our U.S. subsidiaries and include debt issuance from states, municipalities and political subdivisions. The following table provides a breakdown of the fair value of our municipal debt portfolio by state and between Revenue and General Obligation (“G.O.”) bonds:
|
G.O.
|
Revenue
|
Total
|
% of Total
Fair Value
|
Gross
Unrealized
Gains
|
Gross
Unrealized
Losses
|
Weighted
Average
Credit Rating
|
|||||||||||||||||||
|
At December 31, 2014
|
|
||||||||||||||||||||||||
|
California
|
$
|
38,155
|
|
$
|
24,827
|
|
$
|
62,982
|
|
31%
|
$
|
2,794
|
|
$
|
(86
|
)
|
A+
|
||||||||
|
New York
|
16,497
|
|
20,351
|
|
36,848
|
|
18%
|
319
|
|
(377
|
)
|
AA
|
|||||||||||||
|
Ohio
|
—
|
|
12,854
|
|
12,854
|
|
6%
|
404
|
|
(1
|
)
|
A-
|
|||||||||||||
|
Michigan
|
—
|
|
12,672
|
|
12,672
|
|
6%
|
—
|
|
(82
|
)
|
A
|
|||||||||||||
|
Pennsylvania
|
—
|
|
7,876
|
|
7,876
|
|
4%
|
241
|
|
(32
|
)
|
AA-
|
|||||||||||||
|
Other
|
15,640
|
|
55,989
|
|
71,629
|
|
35%
|
1,524
|
|
(254
|
)
|
AA-
|
|||||||||||||
|
|
$
|
70,292
|
|
$
|
134,569
|
|
$
|
204,861
|
|
100%
|
$
|
5,282
|
|
$
|
(832
|
)
|
AA-
|
||||||||
|
At December 31, 2013
|
|
||||||||||||||||||||||||
|
New York
|
$
|
68,633
|
|
$
|
199,160
|
|
$
|
267,793
|
|
17%
|
$
|
4,973
|
|
$
|
(3,406
|
)
|
AA
|
||||||||
|
California
|
70,302
|
|
134,786
|
|
205,088
|
|
13%
|
7,390
|
|
(1,871
|
)
|
AA-
|
|||||||||||||
|
Texas
|
50,685
|
|
125,201
|
|
175,886
|
|
11%
|
2,707
|
|
(1,690
|
)
|
AA
|
|||||||||||||
|
Florida
|
13,307
|
|
78,903
|
|
92,210
|
|
6%
|
2,982
|
|
(170
|
)
|
AA-
|
|||||||||||||
|
Illinois
|
15,523
|
|
68,095
|
|
83,618
|
|
5%
|
1,947
|
|
(533
|
)
|
A
|
|||||||||||||
|
Other
|
162,231
|
|
558,924
|
|
721,155
|
|
48%
|
12,433
|
|
(6,846
|
)
|
A
|
|||||||||||||
|
|
$
|
380,681
|
|
$
|
1,165,069
|
|
$
|
1,545,750
|
|
100%
|
$
|
32,432
|
|
$
|
(14,516
|
)
|
AA-
|
||||||||
During 2014, we reduced our allocation to municipal debt securities after spreads tightened and their after-tax valuations became less attractive.
G.O. bonds are backed by the full faith and credit of the authority that issued the debt and are secured by the taxing powers of those authorities. Revenue bonds are backed by the revenue stream generated by the services provided by the issuer (e.g. sewer, water or utility projects). As issuers of revenue bonds do not have the ability to draw from tax revenues or levy taxes to fund obligations, revenue bonds may carry a greater risk of default than G.O. bonds. At
December 31, 2014
, the top three revenue streams related to transportation (42%), university (17%) and hospital (7%) (
2013
: transportation (25%), school (11%) and power (11%)).
Additionally, certain of our holdings in municipal debt are insured by financial guarantee companies. At
December 31, 2014
, we held insurance enhanced municipal bonds in the amount of $4 million (
2013
: $150 million), with a weighted average credit rating of A- (
2013
: AA-). In the event the financial guarantors are unable to make good on their guarantee on a defaulted security, we would then be exposed to the credit loss. Excluding the insurance benefit from the financial guarantee companies, the weighted average credit quality of our insured bond holdings would be AA- (
2013
: AA-). At
December 31, 2014
, our largest exposures to financial guarantors were National Public Finance Guarantee Corporation for $2 million (
2013
: $43 million) and Financial Guaranty Insurance Company for $2 million (
2013
: Assured Guaranty Corp for $65 million). We had no direct investments in either of these companies at
December 31, 2014
and
2013
.
78
Gross Unrealized Losses:
At
December 31, 2014
, the gross unrealized losses on our fixed maturities portfolio were
$173 million
(
2013
: $180 million).
The following table provides information on the severity of the unrealized loss position as a percentage of amortized cost for all investment grade fixed maturities in an unrealized loss position and includes any impact of foreign exchange:
|
|
December 31, 2014
|
December 31, 2013
|
|||||||||||||||||||||
|
Severity of
Unrealized Loss
|
Fair Value
|
Gross
Unrealized
Losses
|
% of
Total Gross
Unrealized
Losses
|
Fair Value
|
Gross
Unrealized
Losses
|
% of
Total Gross
Unrealized
Losses
|
|||||||||||||||||
|
0-10%
|
$
|
5,229,362
|
|
$
|
(88,627
|
)
|
65
|
%
|
$
|
4,689,773
|
|
$
|
(117,975
|
)
|
66
|
%
|
|||||||
|
10-20%
|
203,227
|
|
(28,578
|
)
|
21
|
%
|
290,477
|
|
(40,494
|
)
|
23
|
%
|
|||||||||||
|
20-30%
|
48,010
|
|
(15,141
|
)
|
11
|
%
|
35,503
|
|
(10,713
|
)
|
6
|
%
|
|||||||||||
|
30-40%
|
9,068
|
|
(4,236
|
)
|
3
|
%
|
17,317
|
|
(8,673
|
)
|
5
|
%
|
|||||||||||
|
40-50%
|
—
|
|
—
|
|
—
|
%
|
—
|
|
—
|
|
—
|
%
|
|||||||||||
|
> 50%
|
—
|
|
—
|
|
—
|
%
|
—
|
|
—
|
|
—
|
%
|
|||||||||||
|
Total
|
$
|
5,489,667
|
|
$
|
(136,582
|
)
|
100
|
%
|
$
|
5,033,070
|
|
$
|
(177,855
|
)
|
100
|
%
|
|||||||
The decrease in gross unrealized losses on investment-grade securities is primarily due to the downward shift in sovereign yield curves. This was mostly offset by the negative movement in foreign exchange rates as a result of the strengthening of the US dollar and the widening of credit spreads on investment grade corporate debt securities.
The following table provides information on the severity of the unrealized loss position as a percentage of amortized cost for all non-investment grade fixed maturities in an unrealized loss position at
December 31, 2014
and
2013
:
|
|
December 31, 2014
|
December 31, 2013
|
|||||||||||||||||||||
|
Severity of
Unrealized Loss
|
Fair
Value
|
Gross
Unrealized
Losses
|
% of
Total Gross
Unrealized
Losses
|
Fair
Value
|
Gross
Unrealized
Losses
|
% of
Total Gross
Unrealized
Losses
|
|||||||||||||||||
|
0-10%
|
$
|
594,960
|
|
$
|
(11,887
|
)
|
31
|
%
|
$
|
125,663
|
|
$
|
(1,880
|
)
|
86
|
%
|
|||||||
|
10-20%
|
30,574
|
|
(5,412
|
)
|
15
|
%
|
2,349
|
|
(302
|
)
|
14
|
%
|
|||||||||||
|
20-30%
|
17,471
|
|
(5,371
|
)
|
15
|
%
|
—
|
|
—
|
|
—
|
%
|
|||||||||||
|
30-40%
|
14,696
|
|
(7,887
|
)
|
22
|
%
|
—
|
|
—
|
|
—
|
%
|
|||||||||||
|
40-50%
|
7,955
|
|
(6,099
|
)
|
17
|
%
|
—
|
|
—
|
|
—
|
%
|
|||||||||||
|
> 50%
|
—
|
|
—
|
|
—
|
%
|
—
|
|
—
|
|
—
|
%
|
|||||||||||
|
Total
|
$
|
665,656
|
|
$
|
(36,656
|
)
|
100
|
%
|
$
|
128,012
|
|
$
|
(2,182
|
)
|
100
|
%
|
|||||||
The increase in gross unrealized losses on non-investment grade securities is primarily due to the widening of credit spreads on energy sector high-yield corporate debt securities.
Equities
During 2014, we sold all holdings of common stocks, with the proceeds reallocated to the more passive strategy of holding exchange-traded funds. At
December 31, 2014
, our equities portfolio had net unrealized gains of $36 million (
2013
: $136 million); the decline was primarily due to sales of common stocks resulting in net realized gains of $129 million during the year, offset by improved valuations reflective of markets.
79
Other Investments
The composition of our other investment portfolio is summarized as follows:
|
|
December 31, 2014
|
December 31, 2013
|
|||||||||||||
|
Hedge funds
|
|||||||||||||||
|
Multi-strategy funds
|
$
|
324,020
|
|
34
|
%
|
$
|
285,155
|
|
27
|
%
|
|||||
|
Long/short equity funds
|
298,907
|
|
31
|
%
|
425,444
|
|
41
|
%
|
|||||||
|
Event-driven funds
|
185,899
|
|
19
|
%
|
190,458
|
|
18
|
%
|
|||||||
|
Leveraged bank loan funds
|
9,713
|
|
1
|
%
|
48,753
|
|
5
|
%
|
|||||||
|
Total hedge funds
|
818,539
|
|
85
|
%
|
949,810
|
|
91
|
%
|
|||||||
|
Direct lending funds
|
54,438
|
|
6
|
%
|
22,134
|
|
2
|
%
|
|||||||
|
Total hedge and direct lending funds
|
872,977
|
|
91
|
%
|
971,944
|
|
93
|
%
|
|||||||
|
CLO - Equities
|
92,488
|
|
9
|
%
|
73,866
|
|
7
|
%
|
|||||||
|
Total other investments
|
$
|
965,465
|
|
100
|
%
|
$
|
1,045,810
|
|
100
|
%
|
|||||
The $131 million decrease in the fair value of our total hedge funds in 2014 was driven by $165 million of net redemptions offset by $34 million of price appreciation as our hedge funds benefited from the performance of the global equity and credit markets during the first half of 2014. Certain of these funds may be subject to restrictions on redemptions which may limit our ability to liquidate these investments in the short term. See Item 8, Note 5(b) of our Consolidated Financial Statements for further details on these restrictions.
We have made total commitments of $140 million to managers of direct lending funds. To date, $52 million of this commitment has been called. During 2013, we made a
$60 million
commitment as a limited partner in a multi-strategy hedge fund, of which $25 million has been called to date.
In addition to our existing portfolio of direct investments in CLO-Equities, we made total commitments of
$60 million
as a limited partner in a fund that invest
s
primarily in CLO equities ("CLO fund"), the remaining $27 million was called during 2014. This is the primary reason for the increase in the fair value of our CLO - Equities during the year. In addition, our direct investments in CLO - Equities provided $18 million of net investment income during the year, offset by the receipt of $21 million of cash distributions. See Item 8, Note 5(b) of our Consolidated Financial Statements for further details on the investment terms relating to these commitments.
80
Restricted Investments
In order to support our obligations in regulatory jurisdictions where we operate as a non-admitted carrier, we provide collateral in the form of assets held in trust and, to a lesser extent, letters of credit. Refer to Item 8, Note 10(b) to our Consolidated Financial Statements for further information on our collateral requirements upon issuance of certain letters of credit. The fair value of our restricted investments primarily relates to these items, as noted in the table below. Our restricted investments primarily consist of high-quality fixed maturity and short-term investment securities.
|
At December 31,
|
2014
|
2013
|
|||||||
|
Collateral in Trust for inter-company agreements
|
$
|
2,792,461
|
|
$
|
2,261,081
|
|
|||
|
Collateral for secured letter of credit facility
|
468,923
|
|
777,828
|
|
|||||
|
Collateral in Trust for third party agreements
(1)
|
567,060
|
|
276,839
|
|
|||||
|
Securities on deposit with regulatory authorities
|
58,476
|
|
58,327
|
|
|||||
|
Total restricted investments
|
$
|
3,886,920
|
|
$
|
3,374,075
|
|
|||
|
(1)
|
Includes
$245 million
of fixed income securities deposited directly with Lloyd's to support the underwriting capacity of the Company's Lloyd's Syndicate, AXIS Syndicate 1686.
|
LIQUIDITY AND CAPITAL RESOURCES
LIQUIDITY
Liquidity is a measure of a company’s ability to generate cash flows sufficient to meet the short-term and long-term cash requirements of its business operations. We manage our liquidity at both the holding company and operating subsidiary level.
Holding Company
As a holding company, AXIS Capital has no operations of its own and its assets consist primarily of investments in its subsidiaries. Accordingly, AXIS Capital’s future cash flows depend on the availability of dividends or other statutorily permissible distributions, such as returns of capital, from its subsidiaries. The ability to pay such dividends and/or distributions is limited by the applicable laws and regulations of the various countries and states in which AXIS Capital’s subsidiaries operate (refer to Item 8, Note 20, to the Consolidated Financial Statements for further information), as well as the need to maintain capital levels to adequately support (re)insurance operations and to preserve financial strength ratings issued by independent rating agencies. During
2014
, AXIS Capital received
$1,221 million
(
2013
:
$566 million
;
2012
:
$525 million
) of distributions from its subsidiaries. AXIS Capital’s primary uses of funds are dividend payments to both common and preferred shareholders, share repurchases, interest and principal payments on debt, capital investments in subsidiaries and payment of corporate operating expenses. We believe the dividend/distribution capacity of AXIS Capital’s subsidiaries, which was over
$1 billion
at
December 31, 2014
, will provide AXIS Capital with sufficient liquidity for the foreseeable future.
Operating Subsidiaries
AXIS Capital’s operating subsidiaries primarily derive cash from the net inflow of premiums less claim payments related to underwriting activities and from net investment income. Historically, these cash receipts have been sufficient to fund the operating expenses of these subsidiaries, as well as to fund dividend payments to AXIS Capital. The subsidiaries’ remaining cash flows are generally reinvested in our investment portfolio, although they have also been used to fund common share repurchases in recent periods.
The (re)insurance business of our operating subsidiaries inherently provides liquidity, as premiums are received in advance (sometimes substantially in advance) of the time claims are paid. However, the amount of cash required to fund claim payments can fluctuate significantly from period to period, due to the low frequency/high severity nature of certain types of business we write.
81
The following table summarizes our consolidated cash flows from operating, investing and financing activities in the last three years:
|
Total cash provided by (used in)
(1)
|
2014
|
2013
|
2012
|
||||||||||
|
Operating activities
|
$
|
862,182
|
|
$
|
1,096,968
|
|
$
|
1,120,617
|
|
||||
|
Investing activities
|
(154,076
|
)
|
(489,287
|
)
|
(862,381
|
)
|
|||||||
|
Financing activities
|
(686,015
|
)
|
(441,094
|
)
|
(481,811
|
)
|
|||||||
|
Effect of exchange rate changes on cash
|
(23,587
|
)
|
(3,078
|
)
|
1,543
|
|
|||||||
|
Increase (decrease) in cash and cash equivalents
|
$
|
(1,496
|
)
|
$
|
163,509
|
|
$
|
(222,032
|
)
|
||||
|
(1)
|
See Consolidated Statements of Cash Flows included in Item 8, ‘
Financial Statements and Supplementary Data
’, of this report for additional information.
|
|
•
|
Net cash provided by operating activities was
$0.9 billion
in
2014
, compared to
$1.1 billion
in
2013
and
2012
. The Company's insurance and reinsurance operations typically receive principal cash inflows from premiums and reinsurance recoverables. Our principal cash outflows are for the payment of claims and loss adjustment expenses, premium payments to reinsurers, policy acquisition costs and operating expenses. Cash provided by operating activities can fluctuate due to timing differences in the collection of premium receivable and reinsurance recoverables and the payment of losses and ceded premiums payable. The reductions in operating cash flows in 2014 and 2013 were primarily driven by an increase in net paid losses as we settled losses incurred in prior years. In 2014, the increase was primarily attributable to increased loss payments in the professional, liability and motor lines, while in 2013, the increase was primarily attributable to an increase in paid losses relating to natural catastrophe and weather-related events. Net paid losses in 2014 were also impacted by an increase in claims paid in the agriculture lines, however this increase was more than offset by the growth in the premiums collected for these lines of business.
|
|
•
|
The cash outflows from investing activities for
2014
related principally to the net purchase of fixed maturities of
$0.2 billion
(
2013
:
$0.6 billion
,
2012
:
$0.9 billion
). This was a result of reinvesting net investment income across a variety of fixed income asset classes. The decrease in the investing cash flows compared to prior years relates to an increased allocation to cash and cash equivalents during the year.
|
|
•
|
Dividends paid to common and preferred shareholders are the primary source of recurring cash flows used in financial activities and totaled
$158 million
in
2014
(
2013
:
$158 million
,
2012
:
$159 million
). Financing cash outflows also included common share repurchases totaling
$543 million
,
$472 million
and
$318 million
in
2014
,
2013
and
2012
, respectively. We note that market share repurchases are completely discretionary; the timing and amount of the additional repurchase transactions will depend on a variety of factors including, but not limited to, global (re)insurance and financial market conditions and opportunities, capital management and regulatory considerations (see
‘Capital Resources – Share Repurchases’
below). Cash outflows in
2014
and
2013
were partially offset by $15 million and $50 million third party investment in shares issued by Ventures Re, respectively (See noncontrolling interests discussion in Item 8, Note 14 of the Consolidated Financial Statements). During 2013 and 2012, financing cash flows also included a net $118 million inflow and $11 million outflow, respectively, related to the preferred share transactions discussed under
'Capital Resources - Preferred Shares'
below.
|
Our diversified underwriting portfolio has demonstrated an ability to withstand catastrophic losses. Since 2003, with the only exception being 2009, our annual cash flows from operations were in excess of $0.8 billion, with 2009 being adversely impacted by claims arising from the global financial crisis. Besides 2009, these positive cash flows were generated notwithstanding the impacts of the global financial crisis on other financial years and the recognition of significant natural catastrophe-related losses during the period: our net losses and loss expenses, gross of reinstatement premiums, included $266 million for Hurricanes Charley, Frances, Ivan and Jeanne in 2004; $1,019 million for Hurricanes Katrina, Rita and Wilma in 2005; $408 million for Hurricanes Gustav and Ike in 2008; $256 million for the Chilean and New Zealand earthquakes in 2010; $944 million for numerous natural catastrophe and weather events in 2011;
and $331 million for Storm Sandy in 2012. There remains significant uncertainty associated with our estimates of net losses for certain of these events (see
‘Underwriting Results – Group – Underwriting Expenses’
for further details), as well as the timing of the associated cash outflows.
Should claim payment obligations accelerate beyond our ability to fund payments from operating cash flows, we would utilize our cash and cash equivalent balances and/or liquidate a portion of our investment portfolio. Our investment portfolio
82
is heavily weighted towards conservative, high quality and highly liquid securities. We expect that, if necessary, approximately $12.8 billion of cash and invested assets at
December 31, 2014
could be available in one to three business days under normal market conditions; of this amount, $3.9 billion relates to restricted assets, which primarily support our obligations in regulatory jurisdictions where we operate as a non-admitted carrier (see Item 8, Note 5(e) to the Consolidated Financial Statements for further details). For context, our largest 1-in-250 year return period, single occurrence, single-zone modeled probable maximum loss (Southeast U.S. Hurricane) is approximately
$0.9 billion
, net of reinsurance; our claim payments pertaining to such an event would be paid out over a period spanning many months. Our internal risk tolerance framework aims to limit both the loss of capital due to a single event, and the loss of capital that would occur from multiple but perhaps smaller events, in any year. Refer to the ‘
Risk and Capital Management
’ section of Item 1 for further information.
We continue to expect that cash flows generated from our operations, combined with the liquidity provided by our investment portfolio, will be sufficient to cover our required cash outflows and other contractual commitments through the foreseeable future. Refer to the ‘
Contractual Obligations and Commitments’
section below for further information about the anticipated amounts and timing of our contractual obligations and commitments.
CAPITAL RESOURCES
In addition to common equity, we have utilized other external sources of financing, including debt, preferred shares and letters of credit to support our business operations. We believe that we hold sufficient capital to allow us to take advantage of market opportunities and to maintain our financial strength ratings, as well as to comply with various local statutory regulations. We monitor our capital adequacy on a regular basis and will seek to adjust our capital base (up or down) according to the needs of our business (see
‘Risk and Capital Management’
in Item 1).
The following table summarizes our consolidated capital position for the periods indicated:
|
At December 31,
|
2014
|
2013
|
|||||||
|
Long-term debt
|
$
|
990,790
|
|
$
|
995,855
|
|
|||
|
Preferred shares
|
627,843
|
|
627,843
|
|
|||||
|
Common equity
|
5,193,278
|
|
5,190,119
|
|
|||||
|
Shareholders’ equity attributable to AXIS Capital
|
5,821,121
|
|
5,817,962
|
|
|||||
|
Total capital
|
$
|
6,811,911
|
|
$
|
6,813,817
|
|
|||
|
Ratio of debt to total capital
|
14.5
|
%
|
14.6
|
%
|
|||||
|
Ratio of debt and preferred equity to total capital
|
23.8
|
%
|
23.8
|
%
|
|||||
We finance our operations with a combination of debt and equity capital. Our debt to total capital and debt and preferred equity to total capital ratios provide an indication of our capital structure, along with some insight into our financial strength. A company with higher ratios in comparison to industry average may show weak financial strength because the cost of its debts may adversely affect results of operations and/or increase its default risk. We believe that our financial flexibility remains strong.
Preferred Shares:
During 2005, we issued
$250 million
of 7.25% Series A and
$250 million
of 7.50% Series B non-cumulative preferred shares.
During March 2012, we issued 16 million newly designated 6.875% Series C preferred shares with a liquidation preference of $25.00 per share for gross proceeds of $400 million. Dividends on the Series C preferred shares are non-cumulative; to the extent declared, dividends will accumulate, with respect to each dividend period, in an amount per share equal to 6.875% of the liquidation preference per annum. We may redeem the shares on or after April 15, 2017 at a redemption price of $25.00 per share.
83
Concurrent with the closing of the Series C preferred share issuance, we redeemed 6 million of our previously outstanding Series A preferred shares at the $25.00 per share redemption price, for a total redemption of $150 million. Following this redemption, 4 million Series A preferred shares, representing $100 million in aggregate liquidation preference, remained outstanding.
During April 2012, we closed a cash tender offer for any and all of our outstanding Series B preferred shares at a price of $102.81 per share. As a result, we repurchased 2,471,570 Series B Preferred shares, for $254 million. At December 31, 2012, 28,430 Series B preferred shares, representing $3 million in aggregate liquidation preference, remained outstanding. We may redeem these shares on or after December 1, 2015, at a redemption price of $100.00 per share.
During May 2013, we issued 9 million newly designated 5.50% Series D preferred shares with a liquidation preference of $25.00 per share for gross proceeds of $225 million. Dividends on the Series D preferred shares are non-cumulative; to the extent declared, dividends will accumulate, with respect to each dividend period, in an amount per share equal to 5.50% of the liquidation preference per annum. We may redeem these shares on or after June 1, 2018 at a redemption price of $25.00 per share.
Concurrent with the closing of the Series D preferred share issuance, we redeemed the remaining 4 million of 7.25% Series A preferred shares outstanding at a $25.00 per share redemption price for a total of $100 million.
On a combined basis, these five transactions resulted in a 99 basis point reduction in the weighted average annual dividend rate on our preferred equity.
Common Equity:
Underlying movements in the value of our common equity over the past two years are outlined in the following table:
|
Year ended December 31,
|
2014
|
2013
|
||||||||
|
Common equity - opening
|
$
|
5,190,119
|
|
$
|
5,276,918
|
|
||||
|
Net income attributable to AXIS Capital
|
810,745
|
|
727,465
|
|
||||||
|
Change in unrealized appreciation on available for sale investments, net of tax
|
(153,137
|
)
|
(223,383
|
)
|
||||||
|
Share repurchases
|
(543,202
|
)
|
(472,263
|
)
|
||||||
|
Common share dividends
|
(117,859
|
)
|
(118,993
|
)
|
||||||
|
Preferred share dividends
|
(40,088
|
)
|
(40,474
|
)
|
||||||
|
Share-based compensation
|
51,382
|
|
48,475
|
|
||||||
|
Series C and D preferred share issue costs (included in additional paid-in capital)
|
—
|
|
(6,551
|
)
|
||||||
|
Other
|
(4,682
|
)
|
(1,075
|
)
|
||||||
|
Common equity - closing
|
$
|
5,193,278
|
|
$
|
5,190,119
|
|
||||
Credit and Letter of Credit Facilities
We routinely enter into agreements with financial institutions to obtain secured and unsecured credit facilities. These facilities are primarily used for the issuance of letters of credit, in the normal course of operations, to certain (re)insurance operations that purchase reinsurance protection from us. These letters of credit allow those operations to take credit, under local insurance regulations, for reinsurance obtained in jurisdictions where AXIS Capital’s subsidiaries are not licensed or otherwise admitted as an insurer. The value of our letters of credit outstanding is driven by, amongst other factors, loss development on existing reserves, the payment patterns of such reserves, the expansion of our business and the loss experience of such business. A portion of these facilities may also be used for liquidity purposes.
Each of our existing facilities is described further below; refer to Item 8, Note 10(b) to our Consolidated Financial Statements for additional information.
Secured Letter of Credit Facilities
We maintain a secured
$750 million
letter of credit facility (the “LOC Facility”). This facility is subject to certain covenants, including the requirement to maintain sufficient collateral to cover all of our obligations under the facility. Such obligations
84
include contingent reimbursement obligations for outstanding letters of credit and fees payable to the lender. In the event of default, the lender may exercise certain remedies, including the exercise of control over pledged collateral and the termination of the availability of the facility to any or all of the participating operating subsidiaries.
On March 31, 2014, AXIS Capital's subsidiary, AXIS Specialty Limited, terminated the $170 million secured letter of credit facility (the "Lloyd's LOC Facility") with ING Bank N.V., London Branch ("ING"). The Funds at Lloyd's requirements for the Company's subsidiary, AXIS Corporate Capital UK Limited, to support the underwriting capacity of the Company's Lloyd's syndicate, AXIS Syndicate 1686, are now being met by capital pledged in the form of fixed income securities deposited directly with Lloyd's.
Credit Facility
During 2013, we terminated and replaced our previously existing credit facility that was scheduled for expiration. We are now party to a
$250 million
credit facility (the “Credit Facility”), which provides us with combined borrowing and letter of credit issuance capacity up to the aggregate amount of the facility. At our request, and subject to certain conditions, the aggregate commitment of this facility may be increased by up to
$150 million
. Interest on loans issued under this facility is payable based on underlying market rates at the time of loan issuance. While any loans are unsecured, we have the option to issue letters of credit on a secured basis in order to reduce associated fees. This facility is subject to certain non-financial covenants that we believe are customary for facilities of this type, including limitations on fundamental changes, the incurrence of additional indebtedness and liens and certain transactions with affiliates and investments, as defined in the facility documents.
Compliance with certain financial covenants that we believe are customary for (re)insurance companies in credit facilities of this type is also required. These covenants include:
|
(i)
|
Maintenance of a minimum consolidated net worth, with the minimum being equal to the sum of $3.802 billion plus 25% of consolidated net income (if positive) for each semi-annual fiscal period ending on or after June 30, 2013 plus 25% of the net cash proceeds received by AXIS Capital from the issuance of its capital stock during each such semi-annual fiscal period. For the purposes of this covenant, consolidated net worth excludes unrealized appreciation (depreciation) on our available for sale investments.
|
|
(ii)
|
Maintenance of a maximum debt to total capital ratio of 0.35 to 1. For the purposes of this covenant, unrealized appreciation (depreciation) on our available for sale investments is excluded from total capital.
|
|
(iii)
|
Maintenance of an A.M. Best Company, Inc. (“A.M. Best”) financial strength rating of at least B++ for each of AXIS Capital’s material insurance/reinsurance subsidiaries that are party to the Credit Facility.
|
At
December 31, 2014
, this facility required a minimum consolidated net worth of $4.223 billion and our actual consolidated net worth, as calculated under the provisions of the Credit Facility, was $5.849 billion. We had a consolidated debt to total capital ratio, calculated in accordance with the Credit Facility provisions, of 0.14 to 1 and each of our material insurance/reinsurance subsidiaries party to the agreement had an A.M. Best financial strength rating of A+.
In the event of default, including a breach of the covenants outlined above, the lenders may exercise certain remedies including the termination of the facility, the declaration of all principal and interest amounts related to facility loans to be immediately due and the requirement that any outstanding letters of credit that we opted to obtain on an unsecured basis be collateralized.
Additionally, the facility allows for an adjustment to the level of pricing should AXIS Capital experience a change in its senior unsecured debt ratings.
In addition to replacing our expiring credit facility in 2013, we also entered into an amendment to the Credit Facility in order to permit AXIS Capital and its subsidiaries to enter into swap contracts and other arrangements related to weather derivative transactions. All other material terms and conditions remained unchanged.
Available Capacity
At
December 31, 2014
, we had
$423 million
and $nil letters of credit outstanding under the LOC Facility and the Credit Facility, respectively. The remaining available capacity under these three facilities was
$577 million
, not taking into
85
consideration the
$150 million
potential increase in the amount available under the Credit Facility. There was
no
debt outstanding under the Credit Facility. We were in compliance with all covenants of the facilities at
December 31, 2014
.
Share Repurchases
As part of our capital management strategy, our Board of Directors authorizes common share repurchase programs. On December 5, 2014, our Board of Directors authorized a new share repurchase plan for up to $750 million of our common shares through December 31, 2016. The new share repurchase authorization, effective January 1, 2015, replaced the previous plan which had $225.8 million available as at
December 31, 2014
(see to Item 5 ‘
Market for Registrant’s Common Equity, Related Stockholder Matters and Issue Purchases of Equity Securities’
). As noted above, repurchases under this program are entirely discretionary; the timing and amount of the additional repurchase transactions will depend on a variety of factors including, but not limited to, global (re)insurance and financial market conditions and opportunities, capital management and regulatory considerations.
Following the Company's announcement of the signing of the definitive amalgamation agreement with PartnerRe Ltd., we currently expect that our share repurchase program will be suspended until the closing date of the amalgamation transaction.
Shelf Registrations
On January 16, 2014, we filed an unallocated universal shelf registration statement with the SEC, which became effective upon filing. Pursuant to the shelf registration, we may issue an unlimited amount of equity, debt, warrants, purchase contracts or a combination of those securities. Our intent and ability to issue securities pursuant to this registration statement will depend on market conditions at the time of any proposed offering.
Financial Strength Ratings
Our principal (re)insurance operating subsidiaries are assigned financial strength ratings from internationally recognized rating agencies, including Standard & Poor’s, A.M. Best and Moody’s Investors Service. These ratings are publicly announced and are available directly from the agencies, as well as on our website.
Such financial strength ratings represent the opinions of the rating agencies on the overall financial strength of a company and its capacity to meet the obligations of its (re)insurance contracts. Independent ratings are one of the important factors that establish our competitive position in (re)insurance markets. The rating agencies consider many factors in determining the financial strength rating of an insurance company, including the relative level of statutory surplus necessary to support the business operations of the company. These ratings are based upon factors considered by the rating agencies to be relevant to policyholders, agents and intermediaries and are not directed toward the protection of investors. Such ratings are not recommendations to buy, sell or hold securities.
86
The following are the most recent financial strength ratings from internationally recognized agencies in relation to our principal (re)insurance operating subsidiaries:
|
Rating agency
|
|
Agency’s description of rating
|
|
Rating
|
|
Agency’s rating
definition
|
|
Ranking of rating
|
||
|
Standard & Poor’s
|
|
An “opinion about the financial security characteristics of an insurance organization, with respect to its ability to pay under its insurance policies and contracts, in accordance with their terms”.
|
|
A+
(Stable)
(1)
|
|
“Strong financial security characteristics”
|
|
The ‘A’ grouping is the third highest out of ten major rating categories. The first seven major rating categories may be modified by the addition of a plus or minus sign to show relative standing within the major rating categories.
|
||
|
|
|
|||||||||
|
A.M. Best
|
|
An “opinion of an insurer’s financial strength and ability to meet its ongoing insurance policy and contract obligations”.
|
|
A+
(Stable)
(2)
|
|
“Superior ability to meet ongoing insurance obligations”
|
|
The ‘A+’ grouping is the second highest ratings category out of fifteen. Ratings outlooks (‘Positive’, ‘Negative’ and ‘Stable’) are assigned to indicate a rating’s potential direction over an intermediate term, generally defined as 12 - 36 months.
|
||
|
|
|
|||||||||
|
Moody’s Investors Service
|
|
“Opinions of the ability of insurance companies to pay punctually senior policyholder claims and obligations.”
|
|
A2 (Stable)
(3)
|
|
“Upper-medium grade and subject to low credit risk”
|
|
The ‘A’ grouping is the third highest out of nine rating categories. Each of the second through seventh categories are subdivided into three subcategories, as indicated by an appended numerical modifier of ‘1’, ‘2’ and ‘3’. The ‘1’ modifier indicates that the obligation ranks in the higher end of the rating category, the ‘2’ modifier indicates a mid-category ranking and the ‘3’ modifier indicates a ranking in the lower end of the rating category.
|
||
|
(1)
|
On January 25, 2015, the Company announced the signing of a definitive amalgamation agreement with PartnerRe Ltd. Following this announcement, Standard and Poor's placed our rating on Creditwatch with negative implications. The status reflects Standard and Poor's uncertainty around the effective execution of the merger and successful integration of the two entities. We expect that the Creditwatch placement will be resolved or updated within the three months after the announcement date, following Standard and Poor's discussions with the Company's management.
|
|
(2)
|
Following the amalgamation announcement, A.M. Best placed our rating under review with negative implications, reflecting the uncertainties related to the merger's size, scope and complexity. A.M. Best has indicated that the under review status will be removed once the merger transaction has closed and the final integration plan has been reviewed.
|
|
(3)
|
Following the amalgamation announcement, Moody's placed AXIS Capital's ratings on review for a possible upgrade of the Company. Moody's expects to conclude its review following completion of the merger.
|
87
CONTRACTUAL OBLIGATIONS AND COMMITMENTS
The following table provides a breakdown of our contractual obligations and commitments at
December 31, 2014
by period due:
|
|
Payment Due By Period
|
|||||||||||||||||||||
|
Contractual Obligations and Commitments
|
Total
|
Less than 1
year
|
1-3 years
|
3-5 years
|
More than
5 years
|
|||||||||||||||||
|
Operating activities
|
||||||||||||||||||||||
|
Estimated gross loss and loss expense payments
(1)
|
$
|
9,596,797
|
|
$
|
2,516,826
|
|
$
|
2,791,744
|
|
$
|
1,597,297
|
|
$
|
2,690,930
|
|
|||||||
|
Operating lease obligations
(2)
|
140,893
|
|
27,609
|
|
43,384
|
|
33,448
|
|
36,452
|
|
||||||||||||
|
Reinsurance purchase commitments
(3)
|
78,451
|
|
67,254
|
|
11,197
|
|
—
|
|
—
|
|
||||||||||||
|
Investing activities
|
||||||||||||||||||||||
|
Unfunded investment commitments
(4)
|
$
|
147,211
|
|
$
|
147,211
|
|
—
|
|
—
|
|
—
|
|
||||||||||
|
Financing activities
|
||||||||||||||||||||||
|
Senior notes (including interest payments)
(5)
|
1,584,063
|
|
48,875
|
|
97,750
|
|
344,438
|
|
1,093,000
|
|
||||||||||||
|
Total
|
$
|
11,547,415
|
|
$
|
2,807,775
|
|
$
|
2,944,075
|
|
$
|
1,975,183
|
|
$
|
3,820,382
|
|
|||||||
|
(1)
|
We are obligated to pay claims for specified loss events covered by the (re)insurance contracts we write. Such loss payments represent our most significant future payment obligation. In contrast to our other contractual obligations, our cash payments are not determinable from the terms specified within the underlying contracts. The total amount in the table above reflects our best estimate of our reserve for losses and loss expenses. However, the actual amounts and timing may differ materially; refer to the ‘
Critical Accounting Estimates – Reserve for Losses and Loss Expenses
’ for further information. We have not taken into account corresponding reinsurance recoverable amounts that would be due to us.
|
|
(2)
|
We lease office space under operating leases which expire at various dates. We renew and enter into new leases in the ordinary course of business, as required.
|
|
(3)
|
We purchase reinsurance protection for our insurance lines of business. The minimum premiums are contractually due in advance on a quarterly basis.
|
|
(4)
|
We have $123 million of unfunded investment commitments related to our investments in hedge and credit funds, which are callable by our investment managers. We have assumed that such investments will be called in the next year but such funding may occur over a longer period of time, due to market conditions and other factors. For further details, see Item 8, Note 5(b) to the Consolidated Financial Statements. In addition we have a $25 million commitment to purchase securities with one of our fixed income managers at December 31, 2014.
|
|
(5)
|
For further details on the terms of our senior unsecured debt, see Item 8, Note 10(a) to the Consolidated Financial Statements.
|
CRITICAL ACCOUNTING ESTIMATES
Our Consolidated Financial Statements include certain amounts that are inherently uncertain and judgmental in nature. As a result, we are required to make assumptions and best estimates in order to determine the reported values. We consider an accounting estimate to be critical if: (1) it requires that significant assumptions be made in order to deal with uncertainties and (2) changes in the estimate could have a material impact on our results of operations, financial condition or liquidity.
We believe that the material items requiring such subjective and complex estimates are our:
|
•
|
reserves for losses and loss expenses;
|
|
•
|
reinsurance recoverable balances;
|
|
•
|
premiums;
|
|
•
|
fair value measurements for our financial assets and liabilities; and
|
|
•
|
assessments of other-than-temporary impairments.
|
Nevertheless, other significant accounting policies are important to understanding our Consolidated Financial Statements. See Item 8, Note 2
‘Significant Accounting Policies’
to the Consolidated Financial Statements for further information.
We believe that the amounts included in our Consolidated Financial Statements reflect our best judgment. However, factors such as those described in Item 1A
‘Risk Factors’
could cause actual events or results to differ materially from our underlying assumptions and estimates; this could lead to a material adverse impact on our results of operations, financial condition and/or liquidity.
88
RESERVE FOR LOSSES AND LOSS EXPENSES
Overview
We believe the most significant accounting judgment we make is the estimate of our reserve for losses and loss expenses (“loss reserves”). Our loss reserves represent management’s estimate of the unpaid portion of our ultimate liability for losses and loss expenses (“ultimate losses”) for (re)insured events that have occurred at or before the balance sheet date. Our loss reserves reflect both claims that have been reported to us (“case reserves”) and claims that have been incurred but not yet reported to us (“IBNR”). Our loss reserves represent our best estimate of what the ultimate settlement and administration of claims will cost, based on our assessment of facts and circumstances known at that particular point in time.
Loss reserves are not an exact calculation of liability but instead are complex estimates. The process of estimating loss reserves involves a number of variables (see
‘Selection of Reported Reserves (Management’s Best Estimate)’
) below for further details). We review our estimate of loss reserves each reporting period and consider all significant facts and circumstances then known. As additional experience and other data become available and/or laws and legal interpretations change, we may adjust our previous estimates of loss reserves; these adjustments are recognized in the period they are determined and, therefore, can impact that period’s underwriting results either favorably (when reserves established in prior years can be released) or adversely (when reserves established in prior years require upward adjustment).
Case Reserves
With respect to our insurance operations, we are generally notified of insured losses by our insureds and/or their brokers. Based on this information, our claims personnel estimate our ultimate losses arising from the claim, including the cost of administering the claims settlement process. These estimates reflect the judgment of our claims personnel based on general reserving practices, the experience and knowledge of such personnel regarding the nature of the specific claim and, where appropriate, the advice of legal counsel, loss adjusters and other relevant consultants.
For our reinsurance business, case reserves for reported claims are generally established based on reports received from ceding companies and/or their brokers. For excess of loss contracts, we are typically notified of insured losses on specific contracts and record a case reserve for the estimated ultimate liability arising from the claim. With respect to contracts written on a proportional basis, we typically receive aggregated claims information and record a case reserve based on that information. However, our proportional reinsurance contracts typically require that losses in excess of pre-defined amounts be separately notified so that we can adequately evaluate them. Our claims department evaluates each specific loss notification we receive and records additional case reserves when a ceding company’s reserve for a claim is not considered adequate.
In deciding whether to provide treaty reinsurance, we carefully review and analyze a cedant’s underwriting and risk management practices to ensure appropriate underwriting, data capture and reporting procedures. We also undertake an extensive program of cedant audits, using outsourced legal and industry experience where necessary. This allows us to review cedants’ claims administration practices to ensure that reserves are consistent with exposures, adequately established and properly reported in a timely manner and also allows us to verify that claims are appropriately handled.
IBNR
The estimation of IBNR is necessary due to the time lags between when a loss event occurs and when it is actually reported to us, referred to as the reporting lag. Reporting lags may arise from a number of factors, including but not limited to the nature of the loss, the use of intermediaries and complexities in the claims adjusting process. By definition, we do not have specific information on IBNR so it must be estimated. IBNR is calculated by deducting incurred losses (i.e. paid losses and case reserves) from management’s best estimate of ultimate losses. In contrast to case reserves, which are established at the contract level, IBNR reserves are generally estimated at an aggregate level and cannot be identified as reserves for a particular loss event or contract. Refer to the
‘Reserving For Significant Catastrophic Events’
section below for additional information on reserving for such events.
89
Reserving Process
Sources of Information
Our quarterly reserving process begins with the collection and analysis of paid and incurred claim data for each of our segments. The segmental data is disaggregated by reserving class and further disaggregated by either accident year (i.e. the year in which the loss event occurred) or by underwriting year (i.e., the year in which the contract generating premium and losses incepted). We use underwriting year information to analyze our reinsurance business and subsequently allocate reserves to the respective accident years. Our reserving classes are selected to ensure that the underlying contracts have homogeneous loss development characteristics, while remaining large enough to make the estimation of trends credible. We review our reserving classes on a regular basis and adjust them over time as our business evolves. This data, in addition to industry benchmarks, serves as a key input to many of the methods employed by our actuaries. The relative weights assigned to our own historical loss data versus industry data vary according to the length of the development profile for the reserving class being evaluated. At present, we generally give more weight to our own experience (and, correspondingly, less weight to industry data) for reserving classes with short and medium claim tails; the converse is true for reserving classes with longer claim tails. (
See ‘Claim Tail Analysis’
below for more detailed information by claim tail class.)
Actuarial Analysis
Multiple actuarial methods are available to estimate ultimate losses. Each method has its own assumptions and its own advantages and disadvantages, with no single estimation method being better than the others in all situations and no one set of assumption variables being meaningful for all reserving classes. The relative strengths and weaknesses of the particular estimation methods when applied to a particular group of claims can also change over time.
The following is a brief description of the reserve estimation methods commonly employed by our actuaries and a discussion of their particular strengths and weaknesses:
|
•
|
Expected Loss Ratio Method (“ELR”): This method estimates ultimate losses for an accident year or underwriting year by applying an expected loss ratio to the earned or written premium for that year. Generally, expected loss ratios are based on one or more of (a) an analysis of historical loss experience to date, (b) pricing information and (c) industry data, adjusted as appropriate, to reflect changes in rates and terms and conditions. This method is insensitive to actual incurred losses for the accident year or underwriting year in question and is, therefore, often useful in the early stages of development when very few losses have been incurred. Conversely, the lack of sensitivity to incurred/paid losses for the accident year or underwriting year in question means that this method is usually inappropriate in later stages of an accident year or underwriting year’s development.
|
|
•
|
Loss Development Method (also referred to as the Chain Ladder Method or Link Ratio Method): This method assumes that the losses incurred/paid for each accident year or underwriting year at a particular development stage follow a relatively similar pattern. It assumes that on average, every accident year or underwriting year will display the same percentage of ultimate losses incurred/paid at the same point in time after the inception of that year. The percentages incurred/paid are established for each development stage (e.g. 12 months, 24 months, etc.) after examining historical averages from historical loss development data and/or external industry benchmark information. Ultimate losses are then estimated by multiplying the actual incurred/paid losses by the reciprocal of the established incurred/paid percentage. The strengths of this method are that it reacts to loss emergence/payments and that it makes full use of historical claim emergence/payment experience. However, this method has weaknesses when the underlying assumption of stable loss development/payment patterns is not valid. This could be the consequence of changes in business mix, claim inflation trends or claim reporting practices and/or the presence of large claims, amongst other things. Furthermore, this method tends to produce volatile estimates of ultimate losses where there is volatility in the underlying incurred/paid patterns. In particular, where the expected percentage of incurred/paid losses is low, small deviations between actual and expected claims can lead to very volatile estimates of ultimate losses. As a result, this method is often unsuitable at early development stages for an accident year or underwriting year.
|
|
•
|
Bornhuetter-Ferguson Method (“BF”): This method can be seen as a combination of the ELR and Loss Development Methods, under which the Loss Development Method is given progressively more weight as an accident year or underwriting year matures. The main advantage of the BF Method is that it provides a more stable estimate of ultimate losses than the Loss Development Method at earlier stages of development, while remaining more sensitive to emerging loss development than the ELR Method. In addition, the BF Method allows for the incorporation of external market
|
90
information through the use of expected loss ratios, whereas the Loss Development Method does not incorporate such information.
As part of our quarterly loss reserve review process, our actuaries employ the estimation method(s) that they believe will produce the most reliable estimate of ultimate losses, at that particular evaluation date, for each reserving class and accident year or underwriting year combination. Often, this is a blend (i.e. weighted average) of the results of two or more appropriate actuarial methods. These ultimate loss estimates are generally utilized to evaluate the adequacy of our ultimate loss estimates for previous accident or underwriting years, as established in the prior reporting period. For the initial estimate of the current accident or underwriting year, the available claim data is typically insufficient to produce a reliable estimate of ultimate losses. As a result, our initial estimate for an accident or underwriting year is generally based on the ELR Method for longer tailed lines and a BF method for shorter tailed lines. The initial ELR for each reserving class is established collaboratively by our actuaries, underwriters and management at the start of the year as part of the planning process, taking into consideration prior accident years’ or underwriting years' experience and industry benchmarks, adjusted after considering factors such as exposure trends, rate differences, changes in contract terms and conditions, business mix changes and other known differences between the current year and prior accident or underwriting years. The initial expected loss ratios for a given accident or underwriting year may be modified over time if the underlying assumptions, such as loss development or premium rate changes, differ from the original assumptions.
Reserving for Credit and Political Risk Business
Our credit and political risk insurance business consists primarily of credit insurance and confiscation, expropriation, nationalization and deprivation coverages (“CEND”). Claims for this business tend to be characterized by their severity risk, as opposed to their frequency risk. Therefore, claim payment and reporting patterns are anticipated to be volatile. Under the notification provisions of our credit insurance, we anticipate being advised of an insured event within a relatively short time period. As a result, we generally estimate ultimate losses based on a contract-by-contract analysis which considers the contracts’ terms, the facts and circumstances of underlying loss events and qualitative input from claims managers.
An important and distinguishing feature of many of these contracts, though, is our contractual right, subsequent to payment of a claim to our insured, to be subrogated to, or otherwise have an interest in, the insured’s rights of recovery under an insured loan or facility agreement. These estimated recoveries are recorded as an offset to our credit and political risk loss reserves. The lag between the date of a claim payment and our ultimate recovery from the corresponding security can result in negative case reserves at a point in time (as was the case at December 31,
2014
and
2013
). The nature of the underlying collateral is specific to each transaction and we also estimate the value of this collateral on a contract-by-contract basis. This valuation process is inherently subjective and involves the application of management’s judgment because active markets for the collateral often do not exist. Our estimates of value are based on numerous inputs, including information provided by our insureds, as well as third party sources including rating agencies, asset valuation specialists and other publicly available information. We also assess any post-event circumstances, including restructurings, liquidations and possession of asset proposals/agreements.
In some instances, upon becoming aware of a loss event related to our credit and political risk business, we negotiate a final settlement of all of our policy liabilities for a fixed amount. In most circumstances, this occurs when the insured moves to realize the benefit of the collateral that underlies the insured loan or facility and presents us with a net settlement proposal that represents a full and final payment by us under the terms of the policy. In consideration for this payment, we secure a cancellation of the policy, or a release of all claims, and waive our right to pursue a recovery of these settlement payments against the security that may have been available to us under the insured loan or facility agreement. In certain circumstances, cancellation by way of net settlement or full payment can result in an adjustment of the net premium to be received and earned on the policy.
91
Reserving For Significant Catastrophic Events
We cannot estimate losses from widespread catastrophic events, such as hurricanes and earthquakes, using the traditional actuarial methods described above. Rather, loss reserves for such events are estimated by management after a catastrophe occurs by completing an in-depth analysis of individual contracts which may potentially be impacted by the catastrophic event. This in-depth analysis may rely on several sources of information, including: (1) estimates of the size of insured industry losses from the catastrophic event and our corresponding market share; (2) a review of our portfolio of contracts performed to identify those contracts which may be exposed to the catastrophic event; (3) a review of modeled loss estimates based on information previously reported by customers and brokers, including exposure data obtained during the underwriting process; (4) discussions of the impact of the event with our customers and brokers and (5) catastrophe bulletins published by various independent statistical reporting agencies. We generally use a blend of these information sources to arrive at our aggregate estimate of the ultimate losses arising from the catastrophic event. In subsequent reporting periods, we review changes in paid and incurred losses in relation to each significant catastrophe and adjust our estimates of ultimate losses for each event if there are developments that are different from our previous expectations; such adjustments are recorded in the period in which they are identified.
There are additional risks affecting our ability to accurately estimate ultimate losses for catastrophic events. For example, the estimation of loss reserves related to hurricanes and earthquakes can be affected by factors including, but not limited to: the inability to access portions of impacted areas, infrastructure disruptions, the complexity of factors contributing to losses, legal and regulatory uncertainties, complexities involved in estimating business interruption losses and additional living expenses, the impact of demand surge, fraud and the limited nature of information available. For hurricanes, additional complex coverage factors may include determining whether damage was caused by flooding versus wind, evaluating general liability and pollution exposures, and mold damage. The timing of a catastrophe, for example near the end of a reporting period, can also affect the level of information available to us to estimate reserves for that reporting period.
Our results of operations for each of 2014, 2013 and 2012 were impacted by natural catastrophe activity. See Item 7
‘Underwriting Results – Group, Underwriting Expenses’
for a discussion of these events and the remaining associated uncertainties.
Key Actuarial Assumptions
The use of the above actuarial methods requires us to make certain explicit assumptions, the most significant of which are: (1) expected loss ratios and (2) loss development patterns.
We began operations in late 2001. In our earlier years, we placed significant reliance on industry benchmarks in establishing our expected loss ratios. Over time, we have placed more reliance on our historical loss experience in establishing these ratios where we believe the weight of our own actual experience has become sufficiently credible for consideration. The weight given to our experience differs for each of our three claim tail classes and is discussed further in the
‘Claim Tail Analysis’
section below. In establishing expected loss ratios for our insurance segment, we give consideration to a number of other factors, including exposure trends, rate adequacy on new and renewal business, ceded reinsurance costs, changes in claims emergence and our underwriters’ view of terms and conditions in the market environment. For our reinsurance segment, expected loss ratios are based on a contract-by-contract review, which considers information provided by clients together with estimates provided by our underwriters and actuaries about the impact of changes in pricing, terms and conditions and coverage. We also have considered the market experience of some classes of business as compiled and analyzed by an independent actuarial firm, as appropriate.
Similarly, we also placed significant reliance on industry benchmarks in selecting our loss development patterns in earlier years. Over time, we have given varying degrees of weight to our own historical loss experience, as further discussed in the
‘Claim Tail Analysis’
section.
Selection of Reported Reserves (Management’s Best Estimate)
Our quarterly reserving process involves the collaboration of our underwriting, claims, actuarial, legal, ceded reinsurance and finance departments, includes various segmental committee meetings and culminates with the approval of a single point best estimate by our Group Reserving Committee, which comprises senior management. In selecting this best estimate, management considers actuarial estimates and applies informed judgment regarding qualitative factors that may not be fully captured in these actuarial estimates. Such factors include, but are not limited to: the timing of the emergence of claims, volume and complexity of claims, social and judicial trends, potential severity of individual claims and the extent of internal
92
historical loss data versus industry information. While these qualitative factors are considered in arriving at the point estimate, no specific provisions for qualitative factors are established.
Beginning in 2013, the Company significantly enhanced the capabilities and resources dedicated to the actuarial reserving function. During the first quarter of 2014, management began to rely upon its internal actuarial reserving function for the quarterly reserve evaluation process rather than utilizing the services of an independent actuarial firm and plans to continue to rely on its internal actuarial function for future quarterly reserving processes. On an annual basis, the Company uses an independent actuarial firm to provide an actuarial opinion on the reasonableness of our loss reserves for each of our operating subsidiaries and statutory reporting entities; such actuarial opinions are required to meet various insurance regulatory requirements. The actuarial firm also discusses its conclusions from the annual review with management and presents its findings to our Board of Directors.
Claim Tail Analysis
The following table shows our total loss reserves for each of our reportable segments, segregated between case reserves and IBNR and by significant reserving class. This table is presented on a gross basis and, therefore, does not include the benefit of reinsurance recoveries.
|
|
2014
|
2013
|
|||||||||||||||||||||||
|
At December 31,
|
Case Reserves
|
IBNR
|
Total
|
Case Reserves
|
IBNR
|
Total
|
|||||||||||||||||||
|
Insurance segment:
|
|||||||||||||||||||||||||
|
Property and other
|
$
|
476,106
|
|
$
|
309,228
|
|
$
|
785,334
|
|
$
|
565,930
|
|
$
|
292,067
|
|
$
|
857,997
|
|
|||||||
|
Marine
|
151,733
|
|
116,384
|
|
268,117
|
|
143,126
|
|
136,452
|
|
279,578
|
|
|||||||||||||
|
Aviation
|
26,644
|
|
21,147
|
|
47,791
|
|
16,159
|
|
31,940
|
|
48,099
|
|
|||||||||||||
|
Credit and political risk
|
(45,691
|
)
|
93,569
|
|
47,878
|
|
(59,101
|
)
|
72,860
|
|
13,759
|
|
|||||||||||||
|
Professional lines
|
788,480
|
|
1,921,467
|
|
2,709,947
|
|
716,279
|
|
1,796,205
|
|
2,512,484
|
|
|||||||||||||
|
Liability
|
183,089
|
|
1,020,991
|
|
1,204,080
|
|
171,923
|
|
989,344
|
|
1,161,267
|
|
|||||||||||||
|
Total Insurance
|
1,580,361
|
|
3,482,786
|
|
5,063,147
|
|
1,554,316
|
|
3,318,868
|
|
4,873,184
|
|
|||||||||||||
|
Reinsurance segment:
|
|||||||||||||||||||||||||
|
Property and other
|
607,061
|
|
489,505
|
|
1,096,566
|
|
809,384
|
|
496,881
|
|
1,306,265
|
|
|||||||||||||
|
Credit and surety
|
116,718
|
|
217,105
|
|
333,823
|
|
141,255
|
|
209,485
|
|
350,740
|
|
|||||||||||||
|
Professional lines
|
311,865
|
|
885,733
|
|
1,197,598
|
|
314,827
|
|
840,683
|
|
1,155,510
|
|
|||||||||||||
|
Motor
|
410,483
|
|
466,947
|
|
877,430
|
|
428,453
|
|
464,048
|
|
892,501
|
|
|||||||||||||
|
Liability
|
259,187
|
|
769,046
|
|
1,028,233
|
|
251,582
|
|
752,358
|
|
1,003,940
|
|
|||||||||||||
|
Total Reinsurance
|
1,705,314
|
|
2,828,336
|
|
4,533,650
|
|
1,945,501
|
|
2,763,455
|
|
4,708,956
|
|
|||||||||||||
|
Total
|
$
|
3,285,675
|
|
$
|
6,311,122
|
|
$
|
9,596,797
|
|
$
|
3,499,817
|
|
$
|
6,082,323
|
|
$
|
9,582,140
|
|
|||||||
The overall increase in our gross loss reserves during 2014 was driven by growth in our business and the continued accumulation of reserves for medium and longer-tailed lines.
In order to capture the key dynamics of our loss reserve development and potential volatility, our reserving classes should be considered according to their potential expected length of loss emergence and settlement, generally referred to as the “tail”. We consider our business to consist of three claim tail classes: short-tail, medium-tail and long-tail. Below is a discussion of the specifics of our loss reserve process as they apply to each claim tail class, as well as commentary on the factors contributing to our historical loss reserve development for each class. Favorable development on prior accident year reserves indicates that our current estimates are lower than our previous estimates, while adverse development indicates that our current estimates are higher than our previous estimates.
93
Short-Tail Business
Our short-tail business generally includes exposures for which losses are usually known and paid within a relatively short period of time after the underlying loss event has occurred. Our short-tail business primarily relates to property coverages and includes the majority of our property, terrorism and marine business and certain aviation business within our insurance segment, together with the property, catastrophe and agriculture business within our reinsurance segment.
The key actuarial assumptions for our short-tail business in our early accident years were primarily developed with reference to industry benchmarks for both expected loss ratios and loss development patterns. As our own historical loss experience amassed, it gained credibility and became relevant for consideration in establishing these key actuarial assumptions. As a result, we gradually increased the weighting assigned to our own historical experience in selecting the expected loss ratios and loss development patterns utilized to establish our estimates of ultimate losses for an accident year.
Due to the relatively short reporting and settlement patterns for our short-tail business, we generally place more weight upon experience-based methods and other qualitative considerations in establishing reserves for both our recent and more mature accident years. As our experience developed more favorably than our initial expectations, we recognized favorable prior year development on short-tail business in recent years. See '
Underwriting Results - Group - Prior Year Reserve Development
' for a discussion of the net favorable reserve development recognized when re-estimating our ultimate losses for short-tail business during the past three years.
Although our estimates of ultimate losses for our short-tail business are inherently less uncertain than for our medium and long-tail business, significant judgment is still required. For example, because much of our excess insurance and excess of loss reinsurance business has high attachment points, it is often difficult to estimate whether claims will exceed those attachment points. Also, the inherent uncertainties relating to catastrophe events previously discussed, together with our typically large line sizes, further add to the complexity of estimating our potential exposure. In addition, we use MGAs and other producers for certain business within our insurance segment; this can delay the reporting of loss information to us. We expect that the majority of development for an accident year or underwriting year will be recognized in the subsequent one to three years.
Medium-Tail Business
Our medium-tail business primarily consists of professional lines (re)insurance and trade credit and surety reinsurance business. Certain other classes of business, including aviation hull and offshore energy insurance and engineering reinsurance, are also considered to have a medium-tail. Claim reporting and settlement periods on these classes are generally longer than those of our short-tail reserving classes. We also consider our credit and political risk insurance business to have a medium tail, due to the complex nature of claims and the potential additional time that may be required to realize our subrogation assets.
For our earliest accident and underwriting years, our initial key actuarial expected loss ratio and loss development assumptions were established utilizing industry benchmarks. Due to the longer claim tail, the length of time required to develop our own credible loss history for use in the reserving process is greater for our medium-tail business than for our short-tail business. As a result, the number of years where we relied heavily on industry benchmarks to establish our key actuarial assumptions is greater for our medium-tail business. Our reserving approach for medium-tail business is tailored by line of business, with our significant lines being specifically addressed below.
Professional Lines (Re)insurance
For our professional lines business, claim payment and reporting patterns are typically medium to long-tail in nature. The underlying business is predominantly written on a claims-made basis, with the majority of reinsurance treaties being written on a risks attaching basis. With respect to our key actuarial assumptions, we are progressively giving more weight to our own experience when establishing our expected loss ratios and our selected loss development patterns, though we continue to consider industry benchmarks.
Loss reporting patterns for professional lines business tend to be volatile, causing instability in actuarial indications based on incurred loss data until an accident year matures for a number of years. Consequently, our initial loss reserves for an accident year or underwriting year are generally based upon an ELR method and the consideration of relevant qualitative factors. As accident years and underwriting years mature, we increasingly give more weight to methods that reflect our actual experience until our selections are based almost exclusively on experience-based methods. We evaluate the appropriateness of the
94
transition to experience-based methods at the reserving class level, commencing this transition when we believe that our incurred loss development is sufficient to produce meaningful actuarial indications. The rate at which we transition fully to sole reliance on experience-based methods can vary by reserving class and by year, depending on our assessment of the stability and relevance of such indications. For some professional lines in our insurance segment, we also rely upon the evaluation of the open claim inventory in addition to the commonly employed actuarial methods when establishing reserves.
Our transition from the ELR method to experience-based methods began during 2008, when we commenced gradual transition for the 2004 and prior accident years. As our loss history continued to develop, the transition was expanded to include additional accident years. With the exception of the experience in the insurance professional lines during 2013 and 2014, our actual loss experience has generally been more favorable than initial expectations and the transition led to the recognition of net favorable prior year reserve development in recent years. During 2013, the insurance professional lines actual loss development was worse than expected for accident years 2011 and 2012. Management recognized this experience by relying upon experience-based methods, an evaluation of the open claims inventory and other qualitative factors, resulting in a higher ultimate loss estimate than initial expected loss ratios. During 2014, Management continued to rely upon experience-based methods, an evaluation of the open claims inventory and other qualitative factors in establishing the ultimate loss estimates for the insurance professional lines portfolio. See '
Underwriting Results - Group - Prior Year Development
' for a discussion of the development recognized during the last three years.
We believe that there continues to be a relatively higher level of uncertainty around ultimate loss estimates for the business classes impacted by the global financial crisis in the 2007 to 2009 accident years. As a result, we continue to rely upon the evaluation of the open claims inventory in addition to the consideration of the actuarial indications, while exercising a greater degree of caution in recognizing potential favorable loss emergence, when establishing loss reserves for these accident years.
Trade Credit and Surety Reinsurance
For our trade credit and surety reinsurance business, our initial and most recent underwriting year loss projections are generally based on the ELR method, with consideration given to qualitative factors. Given that there is a quicker and more stable reporting pattern for trade credit business, we generally commence the transition to experience-based methods sooner than for the surety business.
Credit and Political Risk Insurance
Refer to the previous discussions of this business under ‘
Reserving Process – Actuarial Analysis
’ and
‘Reserving Process – Reserving for Credit and Political Risk Business’
above for a discussion of specific loss reserve issues related to this business. When considering prior accident year reserve development for this line of business, it is important to note that the multi-year nature of the credit business distorts loss ratios when a single accident year is considered in isolation. In recent years, the average term of these contracts has been four to five years. The premiums we receive are generally earned evenly over the contract term, thus spanning multiple accident years. In contrast, losses incurred on these contracts, which can be characterized as low in frequency and high in severity, are reflected in a single accident year.
As previously described, the estimation of the value of our recoveries on credit and political risk business requires significant management judgment. At December 31, 2014, our total estimated recoveries on credit insurance business were $79 million, while comparatively, at December 31, 2013, our estimated recoveries were $84 million. The reduction in 2014 primarily reflected the settlement of a recovery.
Long-Tail Business
In contrast to our short and medium-tail business, the claim tail for our long-tail business is expected to be notably longer, as claims are often reported and ultimately paid or settled years, or even decades, after the related loss events occur. Our long-tail business primarily relates to liability business written in our insurance and reinsurance segments, as well as our motor reinsurance business.
As a general rule, our estimates of accident year or underwriting year ultimate losses for our long-tail business are notably more uncertain than those for our short and medium-tail business. Factors that contribute additional uncertainty to estimates for our long-tail business include, but are not limited to:
|
•
|
The more significant weight given to industry benchmarks in forming our key actuarial assumptions;
|
95
|
•
|
The potential volatility of actuarial estimates, given the number of years of development it takes to produce a meaningful incurred loss as a percentage of ultimate losses;
|
|
•
|
Inherent uncertainties about loss trends, claims inflation (e.g. medical, judicial, social) and general economic conditions; and
|
|
•
|
The possibility of future litigation, legislative or judicial change that may impact future loss experience relative to the prior industry loss experience relied upon in reserve estimation.
|
To date, our key actuarial assumptions for our long-tail business have been derived extensively from industry benchmarks supplemented with our own historical experience. Given our relatively short operating history in comparison to the development tail for this business, we do not believe that our own historical loss development for our long-tail business has amassed an appropriate volume to serve as a fully credible input into the key actuarial assumptions previously outlined. While we consider industry benchmarks that we believe reflect the nature and coverage of our business, our actual loss experience may differ from the benchmarks based on industry averages.
Due to the length of the development tail for this business, our reserve estimates for most accident years and underwriting years are predominantly based on the BF or ELR method and the consideration of qualitative factors. As part of our quarterly reserving process, we monitor actual paid and incurred loss emergence relative to expected loss emergence based on our selected loss development patterns. The drivers of any unfavorable loss emergence are investigated and, as a result, have led to an immediate recognition of adverse development in some instances. Prior to the fourth quarter of 2012 (see additional details below), we did not recognize any favorable loss emergence. As a result, during some periods, we have recognized net adverse development for our liability insurance business in light of unfavorable loss emergence for certain reserving class and accident year combinations.
See '
Underwriting Results Group - Prior Year Reserve Development
' for further details on the recognition of adverse development for our long-tail business during the last three years.
Commencing with our fourth quarter 2012 reserving process, we began to give weight to actuarial methods that reflect our actual experience for liability business as we believed that our oldest accident years were at a stage of expected development where such methods would produce meaningful actuarial indications. In 2014, we continued to give weight to experience-based methods for the insurance liability classes for accident years 2007 and prior, which led to the recognition of $14m of net favorable prior year reserve development during the calendar year on those accident years 2007 and prior. For the reinsurance liability lines, we continued to give weight to experience-based methods for accident years 2008 and prior, resulting in the recognition of $87 million of net favorable prior year reserve development for these years in calendar year 2014.
Sensitivity Analysis
While we believe that our loss reserves at December 31,
2014
are adequate, new information, events or circumstances may result in ultimate losses that are materially greater or less than provided for in our loss reserves. As previously noted, there are many factors that may cause our reserves to increase or decrease, particularly those related to catastrophe losses and long-tail lines of business.
Our expected loss ratios are a key assumption in our estimate of ultimate losses for business at an early stage of development. All else remaining equal, a higher expected loss ratio would result in a higher ultimate loss estimate, and vice versa. Our assumed loss development patterns are another significant assumption in estimating our loss reserves. All else remaining equal, accelerating a loss reporting pattern (i.e. shortening the claim tail) would result in lower ultimate losses, as the estimated proportion of losses already incurred would be higher. The uncertainty in the timing of the emergence of claims (i.e. the length of the development pattern) is generally greater for a company like ours with a limited operating history which, therefore, must rely on industry benchmarks to a certain extent when establishing loss reserve estimates.
The following tables show the effect on our estimate of gross loss reserves of reasonably likely changes in the two key assumptions used to estimate our gross loss reserves at
December 31, 2014
.
The results show the cumulative increase (decrease) in our loss reserves across all accident years. For example, if our assumed loss development pattern for our property and other insurance business was three months shorter with no accompanying change in our ELR assumption, our loss reserves may decrease by approximately
$33 million
. Each of the impacts set forth in the tables is estimated individually, without consideration for any correlation among key assumptions or among reserving classes. Therefore, it would be inappropriate to take each of the amounts and add them together in an
96
attempt to estimate total volatility. While we believe the variations in the expected loss ratios and loss development patterns presented could be reasonably expected, our own historical data regarding variability is generally limited and actual variations may be greater or less than these amounts. It is also important to note that the variations are not meant to be a “best-case” or “worst-case” series of scenarios and, therefore, it is possible that future variations in our loss reserves may be more or less than the amounts presented. While we believe that these are reasonably likely scenarios, we do not believe this sensitivity analysis should be considered an actual reserve range.
|
INSURANCE
|
|||||||||||||
|
Development Pattern
|
Expected Loss Ratio
|
||||||||||||
|
Property and Other
|
5% lower
|
Unchanged
|
5% higher
|
||||||||||
|
3 months shorter
|
$
|
(37,306
|
)
|
$
|
(33,354
|
)
|
$
|
(29,401
|
)
|
||||
|
Unchanged
|
(5,620
|
)
|
—
|
|
5,620
|
|
|||||||
|
3 months longer
|
53,504
|
|
62,236
|
|
70,968
|
|
|||||||
|
Marine
|
5% lower
|
Unchanged
|
5% higher
|
||||||||||
|
3 months shorter
|
$
|
(25,716
|
)
|
$
|
(20,936
|
)
|
$
|
(16,156
|
)
|
||||
|
Unchanged
|
(5,827
|
)
|
—
|
|
5,827
|
|
|||||||
|
3 months longer
|
24,456
|
|
31,876
|
|
39,297
|
|
|||||||
|
Aviation
|
5% lower
|
Unchanged
|
5% higher
|
||||||||||
|
3 months shorter
|
$
|
(4,942
|
)
|
$
|
(4,158
|
)
|
$
|
(3,373
|
)
|
||||
|
Unchanged
|
(992
|
)
|
—
|
|
992
|
|
|||||||
|
3 months longer
|
4,692
|
|
5,984
|
|
7,275
|
|
|||||||
|
Credit and Political Risk
|
10% lower
|
Unchanged
|
10% higher
|
||||||||||
|
3 months shorter
|
$
|
(7,907
|
)
|
$
|
—
|
|
$
|
7,907
|
|
||||
|
Unchanged
|
(7,907
|
)
|
—
|
|
7,907
|
|
|||||||
|
3 months longer
|
(7,907
|
)
|
—
|
|
7,907
|
|
|||||||
|
Professional Lines
|
10% lower
|
Unchanged
|
10% higher
|
||||||||||
|
6 months shorter
|
$
|
(348,670
|
)
|
$
|
(74,923
|
)
|
$
|
198,825
|
|
||||
|
Unchanged
|
(281,239
|
)
|
—
|
|
281,239
|
|
|||||||
|
6 months longer
|
(209,418
|
)
|
79,801
|
|
369,021
|
|
|||||||
|
Liability
|
10% lower
|
Unchanged
|
10% higher
|
||||||||||
|
6 months shorter
|
$
|
(168,570
|
)
|
$
|
(45,128
|
)
|
$
|
78,315
|
|
||||
|
Unchanged
|
(127,955
|
)
|
—
|
|
127,955
|
|
|||||||
|
6 months longer
|
(78,348
|
)
|
55,119
|
|
188,586
|
|
|||||||
97
|
REINSURANCE
|
|||||||||||||
|
Development Pattern
|
Expected Loss Ratio
|
||||||||||||
|
Property and Other
|
5% lower
|
Unchanged
|
5% higher
|
||||||||||
|
3 months shorter
|
$
|
(67,198
|
)
|
$
|
(30,506
|
)
|
$
|
20,460
|
|
||||
|
Unchanged
|
(45,077
|
)
|
—
|
|
45,077
|
|
|||||||
|
3 months longer
|
(16,030
|
)
|
45,821
|
|
77,350
|
|
|||||||
|
Credit and Surety
|
10% lower
|
Unchanged
|
10% higher
|
||||||||||
|
6 months shorter
|
$
|
(41,795
|
)
|
$
|
(19,915
|
)
|
$
|
17,875
|
|
||||
|
Unchanged
|
(31,293
|
)
|
—
|
|
31,293
|
|
|||||||
|
6 months longer
|
(5,284
|
)
|
33,400
|
|
74,267
|
|
|||||||
|
Professional Lines
|
10% lower
|
Unchanged
|
10% higher
|
||||||||||
|
6 months shorter
|
$
|
(117,040
|
)
|
$
|
(20,244
|
)
|
$
|
74,376
|
|
||||
|
Unchanged
|
(86,796
|
)
|
—
|
|
100,206
|
|
|||||||
|
6 months longer
|
(44,970
|
)
|
30,864
|
|
136,559
|
|
|||||||
|
Motor
|
10% lower
|
Unchanged
|
10% higher
|
||||||||||
|
6 months shorter
|
$
|
(86,089
|
)
|
$
|
(20,534
|
)
|
$
|
55,611
|
|
||||
|
Unchanged
|
(69,163
|
)
|
—
|
|
69,163
|
|
|||||||
|
6 months longer
|
(51,296
|
)
|
33,089
|
|
126,565
|
|
|||||||
|
Liability
|
10% lower
|
Unchanged
|
10% higher
|
||||||||||
|
6 months shorter
|
$
|
(113,553
|
)
|
$
|
(16,839
|
)
|
$
|
85,909
|
|
||||
|
Unchanged
|
(97,078
|
)
|
—
|
|
97,078
|
|
|||||||
|
6 months longer
|
(87,557
|
)
|
17,739
|
|
122,079
|
|
|||||||
98
REINSURANCE RECOVERABLE
In the normal course of business, we purchase reinsurance to protect our business from losses due to exposure aggregation and to limit ultimate losses from catastrophic events. The purchase of reinsurance does not discharge our liabilities under contracts written by us. Consequently, an exposure exists with respect to reinsurance recoverable to the extent that any of our reinsurers are unwilling or unable to pay our claims.
The following table shows the composition of our reinsurance recoverable on unpaid losses for each of our reportable segments, segregated between those related to case reserves and those related to IBNR and by significant line of business:
|
|
2014
|
2013
|
|||||||||||||||||||||||
|
At December 31,
|
Case
Reserves
|
IBNR
|
Total
|
Case
Reserves
|
IBNR
|
Total
|
|||||||||||||||||||
|
Insurance segment:
|
|||||||||||||||||||||||||
|
Property and other
|
$
|
139,193
|
|
$
|
82,047
|
|
$
|
221,240
|
|
$
|
163,228
|
|
$
|
80,175
|
|
$
|
243,403
|
|
|||||||
|
Marine
|
54,681
|
|
29,549
|
|
84,230
|
|
63,097
|
|
36,830
|
|
99,927
|
|
|||||||||||||
|
Aviation
|
198
|
|
320
|
|
518
|
|
264
|
|
1,311
|
|
1,575
|
|
|||||||||||||
|
Credit and political risk
|
—
|
|
—
|
|
—
|
|
—
|
|
—
|
|
—
|
|
|||||||||||||
|
Professional lines
|
297,246
|
|
586,441
|
|
883,687
|
|
268,318
|
|
575,625
|
|
843,943
|
|
|||||||||||||
|
Liability
|
92,276
|
|
605,321
|
|
697,597
|
|
92,036
|
|
609,948
|
|
701,984
|
|
|||||||||||||
|
Total Insurance
|
583,594
|
|
1,303,678
|
|
1,887,272
|
|
586,943
|
|
1,303,889
|
|
1,890,832
|
|
|||||||||||||
|
Reinsurance segment:
|
|||||||||||||||||||||||||
|
Property and other
|
985
|
|
1,469
|
|
2,454
|
|
—
|
|
4,543
|
|
4,543
|
|
|||||||||||||
|
Credit and surety
|
—
|
|
—
|
|
—
|
|
—
|
|
—
|
|
—
|
|
|||||||||||||
|
Professional lines
|
—
|
|
—
|
|
—
|
|
—
|
|
231
|
|
231
|
|
|||||||||||||
|
Motor
|
—
|
|
—
|
|
—
|
|
—
|
|
—
|
|
—
|
|
|||||||||||||
|
Liability
|
—
|
|
554
|
|
554
|
|
—
|
|
4,506
|
|
4,506
|
|
|||||||||||||
|
Total Reinsurance
|
985
|
|
2,023
|
|
3,008
|
|
—
|
|
9,280
|
|
9,280
|
|
|||||||||||||
|
Total
|
$
|
584,579
|
|
$
|
1,305,701
|
|
$
|
1,890,280
|
|
$
|
586,943
|
|
$
|
1,313,169
|
|
$
|
1,900,112
|
|
|||||||
Reinsurance recoverable on unpaid losses as a percentage of gross loss reserves was
20%
at
December 31,
2014
and
2013
. At
December 31,
2014
and
2013
, respectively,
98.5%
and
98.8%
of our gross reinsurance recoverable (i.e. excluding the provision for uncollectible amounts) were collectible from reinsurers rated A- or better by A.M. Best. For an analysis of the credit risk associated with our reinsurance recoverable balances at
December 31,
2014
, refer to Item 8, Note 11 to the Consolidated Financial Statements.
The recognition of reinsurance recoverable on unpaid losses and loss expenses requires two key estimates. The first estimate is the amount of loss reserves to be ceded to our reinsurers. This amount consists of two elements, those related to our gross case reserves and those related to our gross IBNR. Reinsurance recoveries related to our gross case reserves are estimated on a case-by-case basis by applying the terms of any applicable reinsurance coverage to our individual case reserve estimates. Our estimate of ceded IBNR is generally developed as part of our loss reserving process and, consequently, its estimation is subject to similar risks and uncertainties as the estimation of gross IBNR. Estimates of amounts to be ceded under non-proportional reinsurance contracts also take into account pricing information for those contracts and require greater judgment than estimates for proportional contracts.
The second estimate is the amount of reinsurance recoverable on unpaid and paid losses that we will ultimately be unable to recover from reinsurers. The majority of our reinsurance recoverable on unpaid losses will not be due for collection until some point in the future. As a result, the amount we ultimately collect may differ from our estimate due to the ability and willingness of reinsurers to pay our claims, which may be negatively impacted by factors such as insolvency, contractual disputes over contract language or coverage and/or other reasons. Additionally, over the period of time before the amounts become due to us, economic conditions and/or operational performance of a particular reinsurer may deteriorate and this
99
could also affect the willingness and ability of a reinsurer to meet their contractual obligations to us. Accordingly, we review our reinsurance recoverable on a quarterly basis and estimate and record an offsetting provision for uncollectible amounts. Any changes in this provision are reflected in net income. We are selective in choosing our reinsurers, placing reinsurance principally with reinsurers with a strong financial condition and industry ratings.
We apply case-specific provisions against certain recoveries that we deem unlikely to be collected in full. In addition, we use a default analysis to estimate our provision for uncollectible amounts on the remainder of the balance. The principal components of the default analysis are reinsurance recoverable by reinsurer and default factors applied to estimate uncollectible amounts based on our reinsurers’ credit ratings. The default factors are based on a model developed by a major rating agency. The provision recorded against reinsurance recoverable was
$18 million
at
December 31,
2014
and
2013
. We have not written off any significant reinsurance recoverable balances in the last three years. At
December 31,
2014
, the use of different assumptions within our approach could have a material effect on our provision for uncollectible reinsurance recoverable. To the extent the creditworthiness of our reinsurers was to deteriorate due to an adverse event affecting the reinsurance industry, such as a large number of major catastrophes, actual uncollectible amounts could be significantly greater than our provision. Given the various considerations used to estimate our uncollectible provision, we cannot precisely quantify the effect a specific industry event may have on our provision.
PREMIUMS
Our revenues are primarily generated from gross premiums written originating from our underwriting operations. The basis for our recognized gross premiums written varies by contract type.
Insurance Segment
For the majority of our insurance business, we receive a fixed premium which is identified in the policy and recorded as unearned premium on the inception date of the contract. This premium will be adjusted only if the underlying insured values ultimately differ. Accordingly, we actively monitor underlying insured values and record adjustment premiums in the period in which amounts are reasonably determinable. Gross premiums written on a fixed premium basis accounted for approximately 91%, 90% and 93% of the segment’s total for the years ended
December 31, 2014
,
2013
and
2012
, respectively. A portion of this business is written through MGAs, third parties granted authority to bind risks on our behalf in accordance with our underwriting guidelines. For this business, we record premiums based on monthly statements received from the MGAs. Due to inherent reporting delays, we generally record premiums written via MGAs one month in arrears. In the event that a significant individual statement is not received, we record our best estimate based upon our historical experience.
A limited portion of our insurance business is written on a line slip or proportional basis, under which we assume a fixed percentage of the premiums and losses on a particular risk or group of risks along with numerous other unrelated insurers. Although premiums on this business are not contractually stated, we recognize gross premiums written based on an estimate provided by the client via the broker. For further details on the estimation process, see the discussion provided for the reinsurance segment below. We review these estimates on a quarterly basis and record significant adjustments in premium estimates when identified. Gross premiums written on a line slip/proportional basis comprised 9%, 10% and 7% of the segment’s total for the years ended
December 31, 2014
,
2013
and
2012
, respectively, and therefore the associated impact of these estimates on our pre-tax net income was immaterial. The decrease in 2014 compared to 2013 was driven by a decrease in the amount of proportional business written in our accident and health line. The increase in 2013 when compared to 2012, was driven by growth in our accident and health lines, a large portion of which related to proportional business.
In our credit and political risk line of business, we write certain policies on a multi-year basis with premiums generally payable in installments. We record premiums at the inception of the policy based on our best estimate of total premiums, including assumptions relating to prepayments/refinancings. Furthermore, certain contracts within this line of business meet the U.S. GAAP definition of a financial guarantee insurance contract. Premiums for such contracts are recognized as the present value of the contractual premiums due or expected to be collected using a discount rate that reflects the risk-free rate at the inception of contract. Due to the scope exemption for insurance contracts that are similar to financial guarantee insurance contracts, the determination of whether certain of our credit and political risk contracts fall within the scope of the U.S. GAAP definition for financial guarantee contracts requires significant management judgment. For the years ended
December 31, 2014
and
2013
, our total premiums from financial guarantee insurance contracts were immaterial in the context of total gross premiums written for the segment. At
December 31, 2014
, the average duration of the outstanding unearned premiums written for our credit and political risk line of business was 4.3 years (
2013
: 4.4 years).
100
Reinsurance Segment
We provide excess of loss and proportional coverage to cedants (i.e. insurance companies). In most cases, cedants seek protection from us for business that they have not yet written at the time they enter into agreements with us. As a result, cedants must estimate their underlying premiums when purchasing reinsurance coverage from us.
For multi-year contracts where reinsurance premiums are payable in annual installments, premiums are recorded at the inception of the contract based on management’s best estimate of total premiums to be received. However, premiums are recognized on an annual basis for multi-year contracts where the cedant has the ability to unilaterally commute or cancel coverage within the term of the policy. The remaining annual premiums are included as written at each successive anniversary date within the multi-year term.
Our excess of loss reinsurance contracts with cedants typically include provisions for a deposit or minimum premiums payable to us, which are generally considered to be the best estimate of the excess of loss reinsurance written premium at inception. The minimum/deposit premium is normally adjusted at the end of the contract period to reflect changes in the underlying risks in force during the contract period. We record adjustments to the deposit/minimum premiums in the period during which they become determinable. Excess of loss contracts accounted for 38%, 42% and 47% of our reinsurance segment’s total gross premiums written for the years ended
December 31, 2014
,
2013
and
2012
, respectively. The decrease during 2014 compared to 2013 was primarily driven by an increase in proportional multi-year premiums written in our liability lines and an increase in the portion of motor and agriculture business written on a proportional basis, partially offset by the renewal timing of a large proportional treaty in professional lines. The decrease during 2013 when compared to 2012, was primarily driven by the growth in our agriculture line and repositioning of our catastrophe portfolio.
Many of our excess of loss contracts also include provisions that require an automatic reinstatement of coverage in the event of a loss. In a year of large loss events, reinstatement premiums will be higher than in a year in which there are no such events. Reinstatement premiums are recognized when a triggering loss event occurs and losses are recorded by us. While the reinstatement premium amount is defined by contract terms, our recognition of reinstatement premiums is dependent on our estimate of losses and loss expenses, which reflect management’s best judgment as described above in
‘Critical Accounting Estimates – Reserves for Losses and Loss Expenses
’.
For business written under proportional contracts, our initial recognition of gross premiums written is based on estimates of premiums written at contract inception. We review these premium estimates on a quarterly basis and evaluate their reasonability in light of actual premiums reported to date by cedants. Factors contributing to changes from the initial premium estimates may include:
|
•
|
changes in renewal rates or rates of new business accepted by cedants (such changes could result from changes in the relevant insurance market that could affect more than one of our cedants or could be a consequence of changes in the marketing strategy or risk appetite of an individual cedant);
|
|
•
|
changes in underlying exposure values; and/or
|
|
•
|
changes in rates being charged by cedants.
|
As a result of this review process, any adjustments to estimates are recognized in gross premiums written during the period they are determined. Such changes in premium estimates could be material to gross premiums written and the resulting adjustments may directly and significantly impact net premiums earned favorably or unfavorably in the period they are determined because the adjustment may be substantially or fully earned. Gross premiums written for proportional contracts, including amounts related to the adjustment of premium estimates established in prior years, accounted for 62%, 58% and 53% of our reinsurance segment’s gross premiums written for the years ended
December 31, 2014
,
2013
and
2012
, respectively.
101
We made estimates on proportional treaties incepting during the year as follows:
|
Year ended December 31,
|
2014
|
2013
|
2012
|
||||||||||
|
Catastrophe
|
$
|
9,227
|
|
$
|
3,896
|
|
$
|
2,264
|
|
||||
|
Property
|
200,977
|
|
195,435
|
|
169,214
|
|
|||||||
|
Professional lines
|
168,799
|
|
280,242
|
|
199,732
|
|
|||||||
|
Credit and surety
|
226,254
|
|
222,486
|
|
232,998
|
|
|||||||
|
Motor
|
207,218
|
|
177,834
|
|
158,230
|
|
|||||||
|
Liability
|
180,388
|
|
152,790
|
|
116,208
|
|
|||||||
|
Agriculture
|
139,640
|
|
103,869
|
|
3,800
|
|
|||||||
|
Engineering
|
50,441
|
|
47,295
|
|
55,846
|
|
|||||||
|
Other
|
13,685
|
|
11,582
|
|
7,118
|
|
|||||||
|
Total estimated premiums
|
$
|
1,196,629
|
|
$
|
1,195,429
|
|
$
|
945,410
|
|
||||
|
Gross premiums written (reinsurance segment)
|
2,176,104
|
|
2,137,903
|
|
1,830,162
|
|
|||||||
|
As a % of total gross premiums written
|
55
|
%
|
56
|
%
|
52
|
%
|
|||||||
Since inception, our historical experience has shown that cumulative adjustments to our annual initial premium estimates on proportional reinsurance contracts have ranged from a negative revision of 4% to a favorable revision of 9%. Giving more weight to recent years where premium volume was comparable to current levels, we believe that a reasonably likely change in our
2014
proportional reinsurance gross premiums written estimate would be 5% in either direction. Such a change would result in a variance in our gross premiums written of approximately $60 million and an immaterial impact on our pre-tax net income. However, larger variations, both positive and negative, are possible.
Earning Basis
Our premiums are earned over the period during which we are exposed to the underlying risk. Changes in circumstance subsequent to contract inception can impact the earning period. For example, when our exposure limit for a contract is reached, we fully earn any associated unearned premium. This can have a significant impact on net premiums earned, particularly for multi-year contracts such as those in our credit and political risk line of business.
Our fixed premium insurance and excess of loss reinsurance contracts are generally written on a “losses occurring” or “claims made” basis over the term of the contract. Accordingly, we earn the premium evenly over the contract term, which is generally 12 months.
Line slip and proportional (re)insurance contracts are generally written on a “risks attaching” basis, covering claims that relate to the underlying policies written during the terms of such contracts. As the underlying business incepts throughout the contract term (typically one year) and typically has a one-year coverage period, we generally earn these premiums evenly over a 24-month period.
FAIR VALUE MEASUREMENTS
Our estimates of fair value for financial assets and financial liabilities are based on the framework established in U.S. GAAP. This framework is based on the inputs used in valuation and gives the highest priority to unadjusted quoted prices in active markets and the lowest priority to unobservable inputs that reflect our significant market assumptions. The three levels of the hierarchy are as follows:
|
•
|
Level 1 – Valuations based on unadjusted quoted prices in active markets for identical assets or liabilities that we have the ability to access. Valuation adjustments and block discounts are not applied to Level 1 instruments.
|
|
•
|
Level 2 – Valuations based on quoted prices in active markets for similar assets or liabilities, quoted prices for identical assets or liabilities in inactive markets, or for which significant inputs are observable (e.g. interest rates, yield curves, prepayment speeds, default rates, loss severities, etc.) or can be corroborated by observable market data.
|
102
|
•
|
Level 3 – Valuations based on inputs that are unobservable and significant to the overall fair value measurement. The unobservable inputs reflect our own assumptions about assumptions that market participants might use.
|
Refer to Item 8, Note 6 of the Consolidated Financial Statements for further details on the valuation techniques and assumptions used in estimating the fair value of our financial instruments.
Our estimated fair value of a financial instrument may differ from the amount that could be realized if the security was sold in an immediate sale, e.g., a forced transaction. Additionally, the valuation of fixed maturities is more subjective when markets are less liquid due to the lack of market based inputs, as was the case during the global financial market crisis in late 2008 and early 2009. This may lead us to change the selection of our valuation technique (from market to income approach) or may cause us to use multiple valuation techniques to estimate the fair value of a financial instrument. This circumstance may require significant management judgment and could cause an instrument to be reclassified between levels of the fair value hierarchy.
Fixed Maturities and Equities
Since 2009, significant liquidity has returned to the financial markets, resulting in an increase in observable market prices for our financial instruments. At December 31, 2014, the fair value for 97% (2013: 94%) of our total fixed maturities and equities was based on prices provided by globally recognized independent pricing services where we have a current and detailed understanding of how their prices were derived. The remaining securities were priced by either non-binding broker quotes or internal valuation models.
Generally, we obtain quotes directly from broker-dealers who are active in the corresponding markets when prices are unavailable from independent pricing services. This may also be the case if the pricing from pricing services is not reflective of current market levels, as detected by our pricing control tolerance procedures. Generally, broker-dealers value securities through their trading desks based on observable market inputs. Their pricing methodologies include mapping securities based on trade data, bids or offers, observed spreads and performance on newly issued securities. They may also establish pricing through observing secondary trading of similar securities.
At December 31, 2014 and 2013, we have not adjusted any pricing provided by independent pricing services (see ‘
Management Pricing Validation
’ below). Additionally, our total Level 3 fixed maturities and equities amounted to $74 million (2013: $35 million), less than 1% of total fixed maturities and equities. Refer to Item 8, Note 6 to our Consolidated Financial Statements for further information.
Management Pricing Validation
While we obtain pricing from pricing services and/or broker-dealers, management is ultimately responsible for determining the fair value measurements for all securities. To ensure fair value measurement is applied consistently and in accordance with U.S. GAAP, we periodically update our understanding of the pricing methodologies used by the pricing services and broker-dealers.
We also challenge any prices we believe may not be representative of fair value under current market conditions. Our review process includes, but is not limited to: (i) initial and ongoing evaluation of the pricing methodologies and valuation models used by outside parties to calculate fair value; (ii) quantitative analysis; (iii) a review of multiple quotes obtained in the pricing process and the range of resulting fair values for each security, if available, and (iv) randomly selecting purchased or sold securities and comparing the executed prices to the fair value estimates provided by the independent pricing sources and broker-dealers.
Other Investments
Hedge Funds, Direct Lending Funds and CLO Equity Funds
We measure the fair value for hedge, direct lending and CLO equity funds by obtaining the net asset value (NAV) as advised by our external fund manager or third party administrator. For any funds for which we did not receive a December 31, 2014 net asset value, we have recorded an estimate of the change in fair value for the latest period based on return estimates obtained from the fund managers. Accordingly, we do not typically have a reporting lag in our fair value measurements for these funds. Historically, our estimated NAVs have not significantly diverged from the subsequent final audited NAVs. Where
103
we have the ability to liquidate our holdings at the reported NAV in the near term, these holdings are classified as Level 2 within the fair value hierarchy while the remaining holdings are classified as Level 3.
CLO – Equity Securities
We have also invested directly in CLO Equities, also known as “cash flow CLOs” in the industry. In 2014, the CLO – Equity market continues to be mostly inactive with only a small number of transactions being observed in the market and even fewer still involving deals we hold. Accordingly, we continue to rely on the use of our internal discounted cash flow model (income approach) to estimate the fair value of CLO – Equities. At December 31, 2014, the estimated fair value for CLO – Equities was $37 million (2013: $40 million), based on the following significant inputs used in our valuation model.
|
At December 31,
|
2014
|
2013
|
|||
|
Default rates
|
4.0% - 5.0%
|
4.0% - 5.0%
|
|||
|
Loss severity rate
|
53.5%
|
53.5%
|
|||
|
Collateral spreads
|
3.0% - 3.5%
|
2.6% - 3.4%
|
|||
|
Estimated maturity dates
|
3.1 - 4.2 years
|
2.1 - 4.6 years
|
|||
Of these significant inputs, the default and loss severity rates are the most judgmental unobservable market inputs to which the valuation of CLO – Equities is most sensitive.
Actual default rates at November 30, 2014 for our CLO – Equities varied from 0% to 2.7% (November 30, 2013: 0.5% to 3.0%) on the remaining underlying collateral. While, on average, these default rates are much lower than our default rate assumptions noted above, we remain cautious on this favorable development given the continuing global economic uncertainty. Due to the use of significant unobservable inputs in our discounted cash flow model, we continue to classify the CLO – Equities as Level 3.
OTHER-THAN-TEMPORARY IMPAIRMENTS (“OTTI”)
Because our available-for-sale ("AFS") investment portfolio is the largest component of our consolidated assets and a multiple of shareholders’ equity, OTTI could be material to our financial condition and operating results particularly during periods of dislocation in the financial markets. During 2014, we recorded a total OTTI charge in earnings of $31 million (2013: $9 million; 2012: $24 million). Refer to the
‘Net Investment Income and Net Realized Investment Gains/Losses’
section above for further details.
A security is “impaired” when its fair value is below its amortized cost (for fixed maturities) or cost (for equities). On a quarterly basis, we review all impaired AFS securities to determine if the impairment is other-than-temporary. The OTTI assessment is inherently judgmental, especially where securities have experienced severe declines in fair value in a short period. Our review process begins with a quantitative analysis to identify securities to be further evaluated for potential OTTI. For all identified securities, further fundamental analysis is performed that considers the following quantitative and qualitative factors:
|
•
|
The length of time and extent to which the fair value has been less than the amortized cost for fixed maturities or cost for equity securities.
|
|
•
|
The financial condition, near-term and long-term prospects for the issuer of the security, including the relevant industry conditions and trends, and implications of rating agency actions and offering prices.
|
|
•
|
The historical and implied volatility of the fair value.
|
|
•
|
The collateral structure and credit support.
|
104
The following provides further details regarding our OTTI recognition and processes for AFS fixed maturities and equity securities.
Fixed Maturities
For an impaired fixed maturity, we recognize an OTTI in earnings when we:
|
1)
|
have the intent to sell the security,
|
|
2)
|
more likely than not will be required to sell the security before its anticipated recovery, or
|
|
3)
|
do not anticipate to recover fully the amortized cost based on projected cash flows to be collected (i.e. a credit loss exists).
|
For the first two criteria above, the OTTI charge is the entire difference between the security’s fair value and its amortized cost. However, if the impairment arises due to an anticipated credit loss on the security (third criterion above), we recognize only the credit loss component of the OTTI amount in earnings with a corresponding adjustment to amortized cost (new cost basis). The non-credit component (e.g. interest rates, market conditions, etc.) of the OTTI amount is recognized in other comprehensive income in our shareholders’ equity.
From time to time, we may sell fixed maturities subsequent to the balance sheet date that we did not intend to sell at the balance sheet date. Conversely, we may not sell fixed maturities that we previously asserted that we intended to sell at the balance sheet date. Such changes in intent may arise due to events occurring subsequent to the balance sheet date. The types of events that may result in a change in intent include, but are not limited to, significant changes in the economic facts and circumstances related to the specific issuer, changes in liquidity needs, or changes in tax laws or the regulatory environment.
For impaired investment-grade securities (i.e. rated BBB- or above) that we do not intend to sell and it is more likely than not that we will not be required to sell, we have established some parameters for identifying securities with potential credit impairments. Our parameters focus primarily on the extent and duration of the decline, including but not limited to:
|
•
|
declines in value greater than 20% for nine consecutive months, and
|
|
•
|
declines in value greater than 10% for twelve consecutive months.
|
For impaired securities held within our high yield portfolios (i.e. managed under a mandate to invest primarily in non-investment grade securities), we have established separate parameters for our credit loss assessment. Due to the additional volatility inherent in high yield securities relative to investment-grade securities, we focus on the severity of the impairment and work closely with our external high yield investment managers to identify securities with significant potential credit impairments.
If a security meets one of the above criteria, we then perform a fundamental analysis by considering the qualitative factors noted above. Our OTTI review process for credit impairment excludes all fixed maturities guaranteed by the U.S. government and its agencies because we anticipate these securities will not be settled below amortized costs. However, these securities are still evaluated for intention to sell at a loss.
The credit loss component of OTTI recognized in earnings is calculated based on the difference between the amortized cost of the security and the net present value of its projected future cash flows discounted at the effective interest rate implicit in the debt security prior to the impairment. The significant inputs and the methodology used to estimate the credit losses are disclosed in Item 8, Note 5(d) to the Consolidated Financial Statements.
Equities
We consider our ability and intent to hold an equity security in an unrealized loss position for a reasonable period of time to allow for a full recovery. As an equity security does not have a maturity date, the forecasted recovery for an equity security is inherently more judgmental than for a fixed maturity security.
In light of the volatile global equity markets we have experienced in recent years, we generally impair any equities for which we do not forecast a recovery to cost within three years. Further, we generally impair an equity security if its value has been below its cost by 30% or more for nine consecutive months or by 20% or more for twelve consecutive months. We have also
105
established parameters for identifying potential impaired equity securities for fundamental analysis based on the severity, in either percentage or absolute dollar terms, of the unrealized loss position.
From time to time, we may sell our AFS equities subsequent to the balance sheet date that were considered temporarily impaired at the balance sheet date. This may occur due to events occurring subsequent to the balance sheet date that result in a change in our intent or ability to hold an equity security. Such subsequent events that may result in a sale include significant deterioration in the financial condition of the issuer, significant unforeseen changes in our liquidity needs, or changes in tax laws or the regulatory environment.
RECENT ACCOUNTING PRONOUNCEMENTS
See Item 8, Note 2(l) to the Consolidated Financial Statements for a discussion of recently issued accounting pronouncements that we have not yet adopted.
OFF-BALANCE SHEET AND SPECIAL PURPOSE ENTITY ARRANGEMENTS
At
December 31, 2014
, the Company is not party to any off-balance sheet arrangements, as defined by Item 303(a)(4) of Regulation S-K to which an entity unconsolidated with the Company is a party that management believes is reasonably likely to have a current or future effect on its financial condition, revenues or expenses, results of operations, liquidity, capital expenditures or capital resources that the Company believes is material to investors.
NON-GAAP FINANCIAL MEASURES
In this report, we present operating income, consolidated underwriting income and underwriting-related general and administrative expenses, which are “non-GAAP financial measures” as defined in Regulation G.
Operating income represents after-tax operational results without consideration of after-tax net realized investment gains, foreign exchange losses (gains) and losses on repurchase of preferred shares. We also present diluted operating income per common share and operating return on average common equity (“operating ROACE”), which are derived from the non-GAAP operating income measure.
Consolidated underwriting income is a pre-tax measure of underwriting profitability that takes into account net premiums earned and other insurance related income as revenues and net losses and loss expenses, acquisition costs and underwriting-related general and administrative costs as expenses. Underwriting-related general and administrative expenses include those general and administrative expenses that are incremental and/or directly attributable to our individual underwriting operations. While these measures are presented in Item 8, Note 3 to our Consolidated Financial Statements, they are considered non-GAAP financial measures when presented elsewhere on a consolidated basis.
106
Operating income, diluted operating income per common share and operating ROACE can be reconciled to the nearest GAAP financial measures as follows:
|
Year ended December 31,
|
2014
|
2013
|
2012
|
||||||||||
|
Net income available to common shareholders
|
$
|
770,657
|
|
$
|
683,910
|
|
$
|
495,004
|
|
||||
|
Net realized investment gains, net of tax
(1)
|
(106,196
|
)
|
(77,603
|
)
|
(115,854
|
)
|
|||||||
|
Foreign exchange losses (gains), net of tax
(2)
|
(101,586
|
)
|
23,684
|
|
28,364
|
|
|||||||
|
Loss on repurchase of preferred shares, net of tax
(3)
|
—
|
|
3,081
|
|
14,009
|
|
|||||||
|
Operating income
|
$
|
562,875
|
|
$
|
633,072
|
|
$
|
421,523
|
|
||||
|
Earnings per common share - diluted
|
$
|
7.29
|
|
$
|
5.93
|
|
$
|
4.00
|
|
||||
|
Net realized investment gains, net of tax
|
(1.00
|
)
|
(0.68
|
)
|
(0.94
|
)
|
|||||||
|
Foreign exchange losses (gains), net of tax
|
(0.97
|
)
|
0.21
|
|
0.24
|
|
|||||||
|
Loss on repurchase of preferred shares, net of tax
|
—
|
|
0.03
|
|
0.11
|
|
|||||||
|
Operating income per common share - diluted
|
$
|
5.32
|
|
$
|
5.49
|
|
$
|
3.41
|
|
||||
|
Weighted average common shares and common share equivalents - diluted
(4)
|
105,713
|
|
115,328
|
|
123,654
|
|
|||||||
|
Average common shareholders’ equity
|
$
|
5,191,699
|
|
$
|
5,233,519
|
|
$
|
5,110,449
|
|
||||
|
ROACE
|
14.8
|
%
|
13.1
|
%
|
9.7
|
%
|
|||||||
|
Operating ROACE
|
10.8
|
%
|
12.1
|
%
|
8.2
|
%
|
|||||||
|
(1)
|
Tax cost (benefit) of
$25,912
, (
$2,039
) and
$11,615
for
2014
,
2013
and
2012
, respectively. Tax impact is estimated by applying the statutory rates of applicable jurisdictions, after consideration of other relevant factors including the ability to utilize capital losses.
|
|
(2)
|
Tax cost (benefit) of
$2,853
, (
$2,459
) and (
$1,148
) for
2014
,
2013
and
2012
, respectively. Tax impact is estimated by applying the statutory rates of applicable jurisdictions, after consideration of other relevant factors including the tax status of specific foreign exchange transactions.
|
|
(3)
|
Tax impact is nil.
|
|
(4)
|
Refer to Note 12 to the Consolidated Financial Statements for further details on the dilution calculation.
|
A reconciliation of consolidated underwriting income to income before income taxes (the nearest GAAP financial measure) can be found in Item 8, Note 3 to the Consolidated Financial Statements. Underwriting-related general and administrative are reconciled to general and administrative expenses (the nearest GAAP financial measure) within
'Underwriting Results - Group'
.
We present our results of operations in the way we believe will be most meaningful and useful to investors, analysts, rating agencies and others who use our financial information to evaluate our performance. This includes the presentation of “operating income” (in total and on a per share basis), “annualized operating return on average common equity” (which is based on the “operating income” measure) and "consolidated underwriting income", which incorporates "underwriting-related general and administrative expenses".
Operating Income
Although the investment of premiums to generate income and realized investment gains (or losses) is an integral part of our operations, the determination to realize investment gains (or losses) is independent of the underwriting process and is heavily influenced by the availability of market opportunities. Furthermore, many users believe that the timing of the realization of investment gains (or losses) is somewhat opportunistic for many companies.
107
Foreign exchange gains (or losses) in our Consolidated Statements of Operations are primarily driven by the impact of foreign exchange rate movements on net insurance related-liabilities. However, this movement is only one element of the overall impact of foreign exchange rate fluctuations on our financial position. In addition, we recognize unrealized foreign exchange gains (or losses) on our available-for-sale investments in other comprehensive income and foreign exchange gains (or losses) realized upon the sale of these investments in net realized investments gain (or losses). These unrealized and realized foreign exchange rate movements generally offset a large portion of the foreign exchange gains (or losses) reported separately in earnings, thereby minimizing the impact of foreign exchange rate movements on total shareholders’ equity. As such, the Statement of Operations foreign exchange gains (or losses) in isolation are not a fair representation of the performance of our business.
Losses on repurchase of preferred shares arise from capital transactions and, therefore, are not reflective of underlying business performance.
In this regard, certain users of our financial statements evaluate earnings excluding after-tax net realized investment gains (or losses), foreign exchange gains (or losses) and losses on repurchase of preferred shares to understand the profitability of recurring sources of income.
We believe that showing net income available to common shareholders exclusive of net realized gains (or losses), foreign exchange gains (or losses) and losses on repurchase of preferred shares reflects the underlying fundamentals of our business. In addition, we believe that this presentation enables investors and other users of our financial information to analyze performance in a manner similar to how our management analyzes the underlying business performance. We also believe this measure follows industry practice and, therefore, facilitates comparison of our performance with our peer group. We believe that equity analysts and certain rating agencies that follow us, and the insurance industry as a whole, generally exclude these items from their analyses for the same reasons.
Consolidated Underwriting Income/Underwriting-Related General and Administrative Expenses
Corporate expenses include holding company costs necessary to support our worldwide (re)insurance operations and costs associated with operating as a publicly-traded company. As these costs are not incremental and/or directly attributable to our individual underwriting operations, we exclude them from underwriting-related general and administrative expenses and, therefore, consolidated underwriting income. Interest expense and financing costs primarily relate to interest payable on our senior notes and are excluded from consolidated underwriting income for the same reason.
We evaluate our underwriting results separately from the performance of our investment portfolio. As such, we believe it appropriate to exclude net investment income and net realized investment gains (or losses) from our underwriting profitability measure.
As noted above, foreign exchange gains (or losses) in our Consolidated Statement of Operations primarily relate to our net insurance-related liabilities. However, we manage our investment portfolio in such a way that unrealized and realized foreign exchange rate gains (or losses) on our investment portfolio generally offset a large portion of the foreign exchange gains (or losses) arising from our underwriting portfolio. As a result, we believe that foreign exchange gains (or losses) are not a meaningful contributor to our underwriting performance and, therefore, exclude them from consolidated underwriting income.
We believe that presentation of underwriting-related general and administrative expenses and consolidated underwriting income provides investors with an enhanced understanding of our results of operations, by highlighting the underlying pre-tax profitability of our underwriting activities.
108
|
ITEM 7A.
|
QUANTITATIVE AND QUALITATIVE DISCLOSURE ABOUT MARKET RISK
|
Market risk represents the potential for an economic loss due to adverse changes in the fair value of financial instruments. Refer to ‘
Risk and Capital Management’
section under Item 1 for further details on how we manage market risk relating to our financial instruments.
Our Balance Sheets include a substantial amount of assets whose fair values are subject to market risks. Our fixed income and equity securities are classified as available-for-sale and, as such, changes in fair value caused by changes in interest rates, equity prices and foreign currency exchange rates will have an immediate impact on our comprehensive income, shareholders’ equity and book value but may not have an immediate impact on consolidated net income. Changes in these market risks will only impact our consolidated net income when, and if, securities are sold or an OTTI charge is recorded. Further, we have alternative investments including hedge funds, direct lending funds and CLO – Equities at
December 31, 2014
and
2013
. These investments are also exposed to market risks, with the change in fair value reported immediately in earnings.
The following is a sensitivity analysis of our primary market risk exposures at
December 31, 2014
and
2013
. Our policies to address these risks in
2014
were not materially different from
2013
. We do not currently anticipate significant changes in our primary market risk exposures or in how those exposures are managed in future reporting periods based upon what is known or expected to be in effect in future reporting periods.
SENSITIVITY ANALYSIS
Interest Rate and Credit Spread Risk
Interest rate risk includes fluctuations in interest rates and credit spreads that have a direct impact on the fair value of our fixed maturities. As interest rates rise and credit spreads widen, the fair value of fixed maturities falls, and the converse is also true.
We monitor our sensitivity to interest rate changes and credit spread changes by revaluing our fixed maturities using a variety of different interest rates (inclusive of credit spreads). We use duration and convexity at the security level to estimate the change in fair value that would result from a change in each security’s yield. Duration measures the price sensitivity of an asset to changes in yield rates. Convexity measures how the duration of the security changes with interest rates. The duration and convexity analysis takes into account changes in prepayment expectations for MBS and ABS securities. The analysis is performed at the security level and aggregated up to the asset category levels for reporting in the tables below.
109
The following table presents the estimated pre-tax impact on the fair value of our fixed maturities at
December 31, 2014
and
2013
due to an instantaneous increase in the U.S. yield curve of 100 basis points and an additional 100 basis point credit spread widening for corporate debt, non-agency residential and commercial MBS, ABS and municipal bond securities.
|
|
Fair Value
|
Potential Adverse Change in Fair Value
|
|||||||||||||||
|
Increase in
interest rate
by 100
basis points
|
Widening of
credit spreads
by 100
basis points
|
Total
|
|||||||||||||||
|
At December 31, 2014
|
|||||||||||||||||
|
U.S. government and agency
|
$
|
1,620,077
|
|
$
|
(64,012
|
)
|
$
|
—
|
|
$
|
(64,012
|
)
|
|||||
|
Non-U.S. government
|
1,033,543
|
|
(31,598
|
)
|
—
|
|
(31,598
|
)
|
|||||||||
|
Agency MBS
|
2,278,108
|
|
(91,539
|
)
|
—
|
|
(91,539
|
)
|
|||||||||
|
Securities exposed to credit spreads:
|
|||||||||||||||||
|
Corporate debt
|
4,361,124
|
|
(123,518
|
)
|
(136,219
|
)
|
(259,737
|
)
|
|||||||||
|
CMBS
|
1,096,888
|
|
(34,920
|
)
|
(35,313
|
)
|
(70,233
|
)
|
|||||||||
|
Non agency RMBS
|
73,086
|
|
(363
|
)
|
(2,322
|
)
|
(2,685
|
)
|
|||||||||
|
ABS
|
1,461,586
|
|
(7,073
|
)
|
(48,192
|
)
|
(55,265
|
)
|
|||||||||
|
Municipals
|
204,861
|
|
(11,230
|
)
|
(11,127
|
)
|
(22,357
|
)
|
|||||||||
|
|
$
|
12,129,273
|
|
$
|
(364,253
|
)
|
$
|
(233,173
|
)
|
$
|
(597,426
|
)
|
|||||
|
At December 31, 2013
|
|||||||||||||||||
|
U.S. government and agency
|
$
|
1,388,698
|
|
$
|
(56,590
|
)
|
$
|
—
|
|
$
|
(56,590
|
)
|
|||||
|
Non-U.S. government
|
1,176,382
|
|
(37,274
|
)
|
—
|
|
(37,274
|
)
|
|||||||||
|
Agency MBS
|
2,448,827
|
|
(119,533
|
)
|
—
|
|
(119,533
|
)
|
|||||||||
|
Securities exposed to credit spreads:
|
|||||||||||||||||
|
Corporate debt
|
3,608,238
|
|
(87,210
|
)
|
(96,590
|
)
|
(183,800
|
)
|
|||||||||
|
CMBS
|
797,414
|
|
(19,710
|
)
|
(19,931
|
)
|
(39,641
|
)
|
|||||||||
|
Non agency RMBS
|
67,567
|
|
(343
|
)
|
(2,398
|
)
|
(2,741
|
)
|
|||||||||
|
ABS
|
953,451
|
|
(5,827
|
)
|
(34,255
|
)
|
(40,082
|
)
|
|||||||||
|
Municipals
|
1,545,750
|
|
(68,785
|
)
|
(69,610
|
)
|
(138,395
|
)
|
|||||||||
|
|
$
|
11,986,327
|
|
$
|
(395,272
|
)
|
$
|
(222,784
|
)
|
$
|
(618,056
|
)
|
|||||
U.S. government agencies have a limited range of spread widening, therefore, 100 basis points of spread widening for these securities is highly improbable in normal market conditions. As previously noted, our non-U.S. government debt obligations are highly-rated, with no remaining exposure to the European peripheral countries. Accordingly, we believe the potential for future widening of credit spreads would also be limited for these securities. Further, certain of our holdings in non-agency RMBS and ABS have floating interest rates, which mitigate our interest rate risk exposure.
The above sensitivity analysis reflects our view of changes that are reasonably possible over a one-year period. Note this should not be construed as our prediction of future market events, but rather an illustration of the impact of such events.
As the performance of our investment in leveraged bank loan funds are driven by the valuation of the underlying bank loans, these funds are also exposed to credit spreads movement. At
December 31, 2014
, the impact of an instantaneous 15% decline in the fair value of our investment in leveraged bank loan funds would be
$1 million
(
2013
:
$7 million
), on a pre-tax basis. Our investment in CLO – Equities is also exposed to interest rate risk, but it would have an insignificant impact to its fair value in the event the risk free yield curve increase by 100 basis points.
110
Additionally, our investment in foreign bond mutual funds is exposed to interest rate risk; however, this exposure is largely mitigated by the short duration of the underlying securities.
Equity Price Risk
Our portfolio of equity securities, excluding the foreign bond mutual funds, has exposure to equity price risk. This risk is defined as the potential loss in fair value resulting from adverse changes in stock prices. Our global equity portfolio is correlated with a blend of the S&P 500 and MSCI World indices and changes in this blend of indices would approximate the impact on our portfolio. The fair value of our equity securities at
December 31, 2014
was
$455 million
(
2013
:
$577 million
). At
December 31, 2014
, the impact of a 20% decline in the overall market prices of our equity exposures would be
$91 million
(
2013
:
$115 million
), on a pre-tax basis.
Our investment in hedge funds has significant exposure to equity strategies with net long positions. At
December 31, 2014
, the impact of an instantaneous 15% decline in the fair value of our investment in hedge funds would be
$123 million
(
2013
:
$142 million
), on a pre-tax basis.
Foreign Currency Risk
The table below provides a sensitivity analysis of our total net foreign currency exposures.
|
AUD
|
NZD
|
CAD
|
EUR
|
GBP
|
JPY
|
Other
|
Total
|
||||||||||||||||||||||||||
|
At December 31, 2014
|
|||||||||||||||||||||||||||||||||
|
Net managed assets (liabilities), excluding derivatives
|
$
|
41,680
|
|
$
|
(145,842
|
)
|
$
|
70,389
|
|
$
|
(95,224
|
)
|
$
|
(184,288
|
)
|
$
|
25,773
|
|
$
|
(61,365
|
)
|
$
|
(348,877
|
)
|
|||||||||
|
Foreign currency derivatives, net
|
(28,583
|
)
|
150,534
|
|
(63,280
|
)
|
70,789
|
|
135,535
|
|
(5,424
|
)
|
489
|
|
260,060
|
|
|||||||||||||||||
|
Net managed foreign currency exposure
|
13,097
|
|
4,692
|
|
7,109
|
|
(24,435
|
)
|
(48,753
|
)
|
20,349
|
|
(60,876
|
)
|
(88,817
|
)
|
|||||||||||||||||
|
Other net foreign currency exposure
|
2,221
|
|
—
|
|
—
|
|
46,911
|
|
764
|
|
6
|
|
211,195
|
|
261,097
|
|
|||||||||||||||||
|
Total net foreign currency exposure
|
$
|
15,318
|
|
$
|
4,692
|
|
$
|
7,109
|
|
$
|
22,476
|
|
$
|
(47,989
|
)
|
$
|
20,355
|
|
$
|
150,319
|
|
$
|
172,280
|
|
|||||||||
|
Net foreign currency exposure as a percentage of total shareholders’ equity
|
0.3
|
%
|
0.1
|
%
|
0.1
|
%
|
0.4
|
%
|
(0.8
|
%)
|
0.3
|
%
|
2.6
|
%
|
2.9
|
%
|
|||||||||||||||||
|
Pre-tax impact of net foreign currency exposure on shareholders’ equity given a hypothetical 10% rate movement
(1)
|
$
|
1,532
|
|
$
|
469
|
|
$
|
711
|
|
$
|
2,248
|
|
$
|
(4,799
|
)
|
$
|
2,036
|
|
$
|
15,032
|
|
$
|
17,229
|
|
|||||||||
|
At December 31, 2013
|
|||||||||||||||||||||||||||||||||
|
Net managed assets (liabilities), excluding derivatives
|
$
|
(6,661
|
)
|
$
|
(195,714
|
)
|
$
|
72,846
|
|
$
|
(99,409
|
)
|
$
|
(132,980
|
)
|
$
|
35,115
|
|
$
|
(41,504
|
)
|
$
|
(368,307
|
)
|
|||||||||
|
Foreign currency derivatives, net
|
(22,315
|
)
|
172,144
|
|
(56,455
|
)
|
42,735
|
|
16,567
|
|
(32,301
|
)
|
(4,011
|
)
|
116,364
|
|
|||||||||||||||||
|
Net managed foreign currency exposure
|
(28,976
|
)
|
(23,570
|
)
|
16,391
|
|
(56,674
|
)
|
(116,413
|
)
|
2,814
|
|
(45,515
|
)
|
(251,943
|
)
|
|||||||||||||||||
|
Other net foreign currency exposure
|
4,203
|
|
—
|
|
779
|
|
31,225
|
|
12,497
|
|
12,838
|
|
308,446
|
|
369,988
|
|
|||||||||||||||||
|
Total net foreign currency exposure
|
$
|
(24,773
|
)
|
$
|
(23,570
|
)
|
$
|
17,170
|
|
$
|
(25,449
|
)
|
$
|
(103,916
|
)
|
$
|
15,652
|
|
$
|
262,931
|
|
$
|
118,045
|
|
|||||||||
|
Net foreign currency exposure as a percentage of total shareholders’ equity
|
(0.4
|
%)
|
(0.4
|
%)
|
0.3
|
%
|
(0.4
|
%)
|
(1.8
|
%)
|
0.3
|
%
|
4.5
|
%
|
2.0
|
%
|
|||||||||||||||||
|
Pre-tax impact of net foreign currency exposure on shareholders’ equity given a hypothetical 10% rate movement
(1)
|
$
|
(2,477
|
)
|
$
|
(2,357
|
)
|
$
|
1,717
|
|
$
|
(2,545
|
)
|
$
|
(10,392
|
)
|
$
|
1,565
|
|
$
|
26,293
|
|
$
|
11,804
|
|
|||||||||
|
(1)
|
Assumes 10% appreciation in underlying currencies relative to the U.S. dollar.
|
111
Net Managed Foreign Currency Exposure
Our net managed foreign currency exposure is subject to our internal risk tolerance standards. For significant foreign currency exposures, defined as those where our net asset/liability position exceeds the greater of 1% of our shareholders' equity or $50 million, the value of assets denominated in those currencies should fall within a range of 90 - 110% of liabilities denominated in the same currency. In addition, our aggregate foreign currency exposure is subject to the same tolerance range. We may use derivative instruments to maintain net managed foreign currency exposures within our risk tolerance levels.
New business written as part of the January
2015
renewal season is expected to serve as a natural offset versus the
$89 million
net short managed foreign currency exposure at
December 31, 2014
. Remaining un-matched foreign currency exposure will be economically hedged with foreign currency derivatives to ensure our net exposure remains within our risk tolerances.
Other Net Foreign Currency Exposure
Other net foreign currency exposure includes those assets managed by specific investment managers who have the discretion to hold foreign currency exposures as part of their total return strategy. At December 31, 2014, other net foreign currency exposure primarily consisted of our emerging market debt securities portfolio and a euro-denominated exchange traded fund. See
'Cash and Investments - Fixed Maturities - Non-U.S. Government' in
Item 7 for further details on this portfolio.
112
|
ITEM 8.
|
FINANCIAL STATEMENTS AND SUPPLEMENTARY DATA
|
|
Index to Consolidated Financial Statements and Related Notes
|
Page
|
|
Report of Independent Registered Public Accounting Firm
|
|
|
Consolidated Balance Sheets at December 31, 2014 and 2013
|
|
|
Consolidated Statements of Operations for the years ended December 31, 2014, 2013 and 2012
|
|
|
Consolidated Statements of Comprehensive Income for the years ended December 31, 2014, 2013 and 2012
|
|
|
Consolidated Statements of Changes in Shareholders' Equity for the years ended December 31, 2014, 2013 and 2012
|
|
|
Consolidated Statements of Cash Flows for the years ended December 31, 2014, 2013 and 2012
|
|
|
Notes to Consolidated Financial Statements
|
|
|
Note 1 – History
|
|
|
Note 2 – Significant Accounting Policies
|
|
|
Note 3 – Segment Information
|
|
|
Note 4 – Goodwill and Intangible Assets
|
|
|
Note 5 – Investments
|
|
|
Note 6 – Fair Value Measurements
|
|
|
Note 7 – Derivative Instruments
|
|
|
Note 8 – Reserves for Losses and Loss Expenses
|
|
|
Note 9 – Reinsurance
|
|
|
Note 10 – Debt and Financing Arrangements
|
|
|
Note 11 – Commitments and Contingencies
|
|
|
Note 12 – Earnings Per Common Share
|
|
|
Note 13 – Shareholders’ Equity
|
|
|
Note 14 – Noncontrolling Interest
|
|
|
Note 15 – Retirement Plans
|
|
|
Note 16 – Share-Based Compensation
|
|
|
Note 17 – Related Party Transactions
|
|
|
Note 18 – Income Taxes
|
|
|
Note 19 – Other Comprehensive Income (Loss)
|
|
|
Note 20 – Statutory Financial Information
|
|
|
Note 21 – Unaudited Condensed Quarterly Financial Data
|
|
|
Note 22 – Subsequent Events
|
|
113
REPORT OF INDEPENDENT REGISTERED PUBLIC ACCOUNTING FIRM
To the Board of Directors and Shareholders of
AXIS Capital Holdings Limited
We have audited the accompanying consolidated balance sheets of AXIS Capital Holdings Limited and subsidiaries (the “Company”) as of
December 31, 2014
and
2013
, and the related consolidated statements of operations, comprehensive income, changes in shareholders’ equity, and cash flows for each of the three years in the period ended
December 31, 2014
. These financial statements are the responsibility of the Company’s management. Our responsibility is to express an opinion on the financial statements based on our audits.
We conducted our audits in accordance with the standards of the Public Company Accounting Oversight Board (United States). Those standards require that we plan and perform the audit to obtain reasonable assurance about whether the financial statements are free of material misstatement. An audit includes examining, on a test basis, evidence supporting the amounts and disclosures in the financial statements. An audit also includes assessing the accounting principles used and significant estimates made by management, as well as evaluating the overall financial statement presentation. We believe that our audits provide a reasonable basis for our opinion.
In our opinion, such consolidated financial statements present fairly, in all material respects, the financial position of AXIS Capital Holdings Limited and subsidiaries as of
December 31, 2014
and
2013
, and the results of their operations and their cash flows for each of the three years in the period ended
December 31, 2014
, in conformity with accounting principles generally accepted in the United States of America.
We have also audited, in accordance with the standards of the Public Company Accounting Oversight Board (United States), the Company’s internal control over financial reporting as of
December 31, 2014
, based on the criteria established in Internal Control - Integrated Framework (2013) issued by the Committee of Sponsoring Organizations of the Treadway Commission and our report dated
February 20,
2015
expressed an unqualified opinion on the effectiveness of the Company’s internal control over financial reporting.
|
/s/ Deloitte Ltd.
|
|
Hamilton, Bermuda
|
|
February 20, 2015
|
114
AXIS CAPITAL HOLDINGS LIMITED
CONSOLIDATED BALANCE SHEETS
DECEMBER 31,
2014
AND
2013
|
2014
|
2013
|
||||||
|
|
(in thousands)
|
||||||
|
Assets
|
|||||||
|
Investments:
|
|||||||
|
Fixed maturities, available for sale, at fair value
(Amortized cost 2014: $12,185,973; 2013: $11,987,146)
|
$
|
12,129,273
|
|
$
|
11,986,327
|
|
|
|
Equity securities, available for sale, at fair value
(Cost 2014: $531,648; 2013: $566,219)
|
567,707
|
|
701,987
|
|
|||
|
Other investments, at fair value
|
965,465
|
|
1,045,810
|
|
|||
|
Short-term investments, at fair value and amortized cost
|
107,534
|
|
46,212
|
|
|||
|
Total investments
|
13,769,979
|
|
13,780,336
|
|
|||
|
Cash and cash equivalents
|
921,830
|
|
923,326
|
|
|||
|
Restricted cash and cash equivalents
|
287,865
|
|
64,550
|
|
|||
|
Accrued interest receivable
|
83,070
|
|
97,132
|
|
|||
|
Insurance and reinsurance premium balances receivable
|
1,808,620
|
|
1,688,957
|
|
|||
|
Reinsurance recoverable on unpaid and paid losses
|
1,926,145
|
|
1,929,988
|
|
|||
|
Deferred acquisition costs
|
466,987
|
|
456,122
|
|
|||
|
Prepaid reinsurance premiums
|
351,441
|
|
330,261
|
|
|||
|
Receivable for investments sold
|
169
|
|
1,199
|
|
|||
|
Goodwill and intangible assets
|
88,960
|
|
89,528
|
|
|||
|
Other assets
|
250,670
|
|
273,385
|
|
|||
|
Total assets
|
$
|
19,955,736
|
|
$
|
19,634,784
|
|
|
|
Liabilities
|
|||||||
|
Reserve for losses and loss expenses
|
$
|
9,596,797
|
|
$
|
9,582,140
|
|
|
|
Unearned premiums
|
2,735,376
|
|
2,683,849
|
|
|||
|
Insurance and reinsurance balances payable
|
249,186
|
|
234,412
|
|
|||
|
Senior notes
|
990,790
|
|
995,855
|
|
|||
|
Payable for investments purchased
|
188,176
|
|
21,744
|
|
|||
|
Other liabilities
|
315,471
|
|
248,822
|
|
|||
|
Total liabilities
|
14,075,796
|
|
13,766,822
|
|
|||
|
Commitments and Contingencies
|
|
|
|||||
|
Shareholders’ equity
|
|||||||
|
Preferred shares
|
627,843
|
|
627,843
|
|
|||
|
Common shares
(2014: 175,478; 2013: 174,134 shares issued
and 2014: 99,426; 2013: 109,485 shares outstanding)
|
2,191
|
|
2,174
|
|
|||
|
Additional paid-in capital
|
2,285,016
|
|
2,240,125
|
|
|||
|
Accumulated other comprehensive income (loss)
|
(45,574
|
)
|
117,825
|
|
|||
|
Retained earnings
|
5,715,504
|
|
5,062,706
|
|
|||
|
Treasury shares, at cost
(2014: 76,052; 2013: 64,649 shares)
|
(2,763,859
|
)
|
(2,232,711
|
)
|
|||
|
Total shareholders’ equity attributable to AXIS Capital
|
5,821,121
|
|
5,817,962
|
|
|||
|
Noncontrolling interests
|
58,819
|
|
50,000
|
|
|||
|
Total shareholders’ equity
|
5,879,940
|
|
5,867,962
|
|
|||
|
Total liabilities and shareholders’ equity
|
$
|
19,955,736
|
|
$
|
19,634,784
|
|
|
See accompanying notes to Consolidated Financial Statements.
115
AXIS CAPITAL HOLDINGS LIMITED
CONSOLIDATED STATEMENTS OF OPERATIONS
FOR THE YEARS ENDED DECEMBER 31,
2014
,
2013
, AND
2012
|
2014
|
2013
|
2012
|
|||||||||
|
|
(in thousands, except for per share data)
|
||||||||||
|
Revenues
|
|||||||||||
|
Net premiums earned
|
$
|
3,870,999
|
|
$
|
3,707,065
|
|
$
|
3,415,463
|
|
||
|
Net investment income
|
342,766
|
|
409,312
|
|
380,957
|
|
|||||
|
Other insurance related income
|
650
|
|
4,424
|
|
2,676
|
|
|||||
|
Net realized investment gains
|
|||||||||||
|
Other-than-temporary impairment ("OTTI") losses
|
(31,227
|
)
|
(9,362
|
)
|
(24,234
|
)
|
|||||
|
Other net realized investment gains
|
163,335
|
|
84,926
|
|
151,703
|
|
|||||
|
Total net realized investment gains
|
132,108
|
|
75,564
|
|
127,469
|
|
|||||
|
Total revenues
|
4,346,523
|
|
4,196,365
|
|
3,926,565
|
|
|||||
|
Expenses
|
|||||||||||
|
Net losses and loss expenses
|
2,186,722
|
|
2,134,195
|
|
2,096,028
|
|
|||||
|
Acquisition costs
|
737,197
|
|
664,191
|
|
627,653
|
|
|||||
|
General and administrative expenses
|
621,876
|
|
575,390
|
|
560,981
|
|
|||||
|
Foreign exchange losses (gains)
|
(104,439
|
)
|
26,143
|
|
29,512
|
|
|||||
|
Interest expense and financing costs
|
74,695
|
|
61,979
|
|
61,863
|
|
|||||
|
Total expenses
|
3,516,051
|
|
3,461,898
|
|
3,376,037
|
|
|||||
|
Income before income taxes
|
830,472
|
|
734,467
|
|
550,528
|
|
|||||
|
Income tax expense
|
25,908
|
|
7,002
|
|
3,287
|
|
|||||
|
Net income
|
804,564
|
|
727,465
|
|
547,241
|
|
|||||
|
Amounts attributable from noncontrolling interests
|
(6,181
|
)
|
—
|
|
—
|
|
|||||
|
Net income attributable to AXIS Capital
|
810,745
|
|
727,465
|
|
547,241
|
|
|||||
|
Preferred share dividends
|
40,088
|
|
40,474
|
|
38,228
|
|
|||||
|
Loss on repurchase of preferred shares
|
—
|
|
3,081
|
|
14,009
|
|
|||||
|
Net income available to common shareholders
|
$
|
770,657
|
|
$
|
683,910
|
|
$
|
495,004
|
|
||
|
Per share data
|
|||||||||||
|
Net income per common share
|
|||||||||||
|
Basic net income
|
$
|
7.38
|
|
$
|
6.02
|
|
$
|
4.05
|
|
||
|
Diluted net income
|
$
|
7.29
|
|
$
|
5.93
|
|
$
|
4.00
|
|
||
|
Weighted average number of common shares outstanding - basic
|
104,368
|
|
113,636
|
|
122,148
|
|
|||||
|
Weighted average number of common shares outstanding - diluted
|
105,713
|
|
115,328
|
|
123,654
|
|
|||||
See accompanying notes to Consolidated Financial Statements.
116
AXIS CAPITAL HOLDINGS LIMITED
CONSOLIDATED STATEMENTS OF COMPREHENSIVE INCOME
FOR THE YEARS ENDED DECEMBER 31,
2014
,
2013
, AND
2012
|
2014
|
2013
|
2012
|
|||||||||
|
|
(in thousands)
|
||||||||||
|
Net income
|
$
|
804,564
|
|
$
|
727,465
|
|
$
|
547,241
|
|
||
|
Other comprehensive income (loss), net of tax:
|
|||||||||||
|
Available for sale investments:
|
|||||||||||
|
Unrealized investment gains (losses) arising during the year
|
(38,667
|
)
|
(161,832
|
)
|
348,510
|
|
|||||
|
Adjustment for re-classification of net realized investment gains and OTTI losses recognized in net income
|
(114,470
|
)
|
(61,551
|
)
|
(116,278
|
)
|
|||||
|
Unrealized investment gains (losses) arising during the year, net of reclassification adjustment
|
(153,137
|
)
|
(223,383
|
)
|
232,232
|
|
|||||
|
Non-credit portion of OTTI losses
|
—
|
|
—
|
|
—
|
|
|||||
|
Foreign currency translation adjustment
|
(10,262
|
)
|
(21,414
|
)
|
510
|
|
|||||
|
Net change in benefit plan assets and obligations recognized in equity and
reclassification adjustment
|
—
|
|
—
|
|
1,718
|
|
|||||
|
Total other comprehensive income (loss), net of tax
|
(163,399
|
)
|
(244,797
|
)
|
234,460
|
|
|||||
|
Comprehensive income
|
$
|
641,165
|
|
$
|
482,668
|
|
$
|
781,701
|
|
||
See accompanying notes to Consolidated Financial Statements.
117
AXIS CAPITAL HOLDINGS LIMITED
CONSOLIDATED STATEMENTS OF CHANGES IN SHAREHOLDERS’ EQUITY
FOR THE YEARS ENDED DECEMBER 31,
2014
,
2013
, AND
2012
|
2014
|
2013
|
2012
|
|||||||||
|
|
(in thousands)
|
||||||||||
|
Preferred shares
|
|||||||||||
|
Balance at beginning of year
|
$
|
627,843
|
|
$
|
502,843
|
|
$
|
500,000
|
|
||
|
Shares issued
|
—
|
|
225,000
|
|
400,000
|
|
|||||
|
Shares repurchased
|
—
|
|
(100,000
|
)
|
(397,157
|
)
|
|||||
|
Balance at end of year
|
627,843
|
|
627,843
|
|
502,843
|
|
|||||
|
Common shares (par value)
|
|||||||||||
|
Balance at beginning of year
|
2,174
|
|
2,146
|
|
2,125
|
|
|||||
|
Shares issued
|
17
|
|
28
|
|
21
|
|
|||||
|
Balance at end of year
|
2,191
|
|
2,174
|
|
2,146
|
|
|||||
|
Additional paid-in capital
|
|||||||||||
|
Balance at beginning of year
|
2,240,125
|
|
2,179,034
|
|
2,105,386
|
|
|||||
|
Shares issued - common shares
|
158
|
|
3,422
|
|
2,582
|
|
|||||
|
Cost of treasury shares reissued
|
(12,054
|
)
|
(4,225
|
)
|
—
|
|
|||||
|
Issue costs on newly issued preferred shares
|
—
|
|
(6,551
|
)
|
(6,456
|
)
|
|||||
|
Reversal of issue costs on repurchase of preferred shares
|
—
|
|
3,081
|
|
7,093
|
|
|||||
|
Stock options exercised
|
5,405
|
|
16,889
|
|
2,517
|
|
|||||
|
Share-based compensation expense
|
51,382
|
|
48,475
|
|
67,912
|
|
|||||
|
Balance at end of year
|
2,285,016
|
|
2,240,125
|
|
2,179,034
|
|
|||||
|
Accumulated other comprehensive income (loss)
|
|||||||||||
|
Balance at beginning of year
|
117,825
|
|
362,622
|
|
128,162
|
|
|||||
|
Unrealized gains (losses) on available for sale investments, net of tax:
|
|||||||||||
|
Balance at beginning of year
|
124,945
|
|
348,328
|
|
116,096
|
|
|||||
|
Unrealized gains (losses) arising during the year, net of reclassification adjustment
|
(153,137
|
)
|
(223,383
|
)
|
232,232
|
|
|||||
|
Non-credit portion of OTTI losses
|
—
|
|
—
|
|
—
|
|
|||||
|
Balance at end of year
|
(28,192
|
)
|
124,945
|
|
348,328
|
|
|||||
|
Cumulative foreign currency translation adjustments, net of tax:
|
|||||||||||
|
Balance at beginning of year
|
(7,120
|
)
|
14,294
|
|
13,784
|
|
|||||
|
Foreign currency translation adjustment
|
(10,262
|
)
|
(21,414
|
)
|
510
|
|
|||||
|
Balance at end of year
|
(17,382
|
)
|
(7,120
|
)
|
14,294
|
|
|||||
|
Supplemental Executive Retirement Plans ("SERPs"):
|
|||||||||||
|
Balance at beginning of year
|
—
|
|
—
|
|
(1,718
|
)
|
|||||
|
Net change in benefit plan assets and obligations recognized in equity
|
—
|
|
—
|
|
1,718
|
|
|||||
|
Balance at end of year
|
—
|
|
—
|
|
—
|
|
|||||
|
Balance at end of year
|
(45,574
|
)
|
117,825
|
|
362,622
|
|
|||||
|
Retained earnings
|
|||||||||||
|
Balance at beginning of year
|
5,062,706
|
|
4,497,789
|
|
4,155,392
|
|
|||||
|
Net income
|
804,564
|
|
727,465
|
|
547,241
|
|
|||||
|
Amounts attributable from noncontrolling interests
|
6,181
|
|
—
|
|
|
—
|
|
||||
|
Preferred share dividends
|
(40,088
|
)
|
(40,474
|
)
|
(38,228
|
)
|
|||||
|
Loss on repurchase of preferred shares
|
—
|
|
(3,081
|
)
|
(14,009
|
)
|
|||||
|
Common share dividends
|
(117,859
|
)
|
(118,993
|
)
|
(152,607
|
)
|
|||||
|
Balance at end of year
|
5,715,504
|
|
5,062,706
|
|
4,497,789
|
|
|||||
|
Treasury shares, at cost
|
|||||||||||
|
Balance at beginning of year
|
(2,232,711
|
)
|
(1,764,673
|
)
|
(1,446,986
|
)
|
|||||
|
Shares repurchased for treasury
|
(543,202
|
)
|
(472,263
|
)
|
(317,687
|
)
|
|||||
|
Treasury shares reissued
|
12,054
|
|
4,225
|
|
—
|
|
|||||
|
Balance at end of year
|
(2,763,859
|
)
|
(2,232,711
|
)
|
(1,764,673
|
)
|
|||||
|
Total shareholders’ equity attributable to AXIS Capital
|
5,821,121
|
|
5,817,962
|
|
5,779,761
|
|
|||||
|
Noncontrolling interests
|
58,819
|
|
50,000
|
|
—
|
|
|||||
|
Total shareholders' equity
|
$
|
5,879,940
|
|
$
|
5,867,962
|
|
$
|
5,779,761
|
|
||
See accompanying notes to Consolidated Financial Statements.
118
AXIS CAPITAL HOLDINGS LIMITED
FOR THE YEARS ENDED DECEMBER 31,
2014
,
2013
, AND
2012
|
2014
|
2013
|
2012
|
|||||||||
|
|
(in thousands)
|
||||||||||
|
Cash flows from operating activities:
|
|||||||||||
|
Net income
|
$
|
804,564
|
|
$
|
727,465
|
|
$
|
547,241
|
|
||
|
Adjustments to reconcile net income to net cash provided by operating activities:
|
|||||||||||
|
Net realized investment gains
|
(132,108
|
)
|
(75,564
|
)
|
(127,469
|
)
|
|||||
|
Net realized and unrealized gains on other investments
|
(57,621
|
)
|
(128,814
|
)
|
(87,623
|
)
|
|||||
|
Amortization of fixed maturities
|
113,879
|
|
139,667
|
|
135,297
|
|
|||||
|
Other amortization and depreciation
|
24,970
|
|
23,272
|
|
13,821
|
|
|||||
|
Share-based compensation expense
|
63,237
|
|
57,168
|
|
67,912
|
|
|||||
|
Changes in:
|
|||||||||||
|
Accrued interest receivable
|
13,788
|
|
88
|
|
1,126
|
|
|||||
|
Reinsurance recoverable balances
|
(16,204
|
)
|
(66,169
|
)
|
(93,490
|
)
|
|||||
|
Deferred acquisition costs
|
(11,026
|
)
|
(66,874
|
)
|
18,279
|
|
|||||
|
Prepaid reinsurance premiums
|
(25,185
|
)
|
(14,585
|
)
|
(77,053
|
)
|
|||||
|
Reserve for loss and loss expenses
|
46,903
|
|
523,409
|
|
633,686
|
|
|||||
|
Unearned premiums
|
58,376
|
|
229,157
|
|
230
|
|
|||||
|
Insurance and reinsurance balances, net
|
(102,593
|
)
|
(250,463
|
)
|
3,218
|
|
|||||
|
Other items
|
81,202
|
|
(789
|
)
|
85,442
|
|
|||||
|
Net cash provided by operating activities
|
862,182
|
|
1,096,968
|
|
1,120,617
|
|
|||||
|
Cash flows from investing activities:
|
|||||||||||
|
Purchases of:
|
|||||||||||
|
Fixed maturities
|
(12,047,004
|
)
|
(12,230,274
|
)
|
(13,513,143
|
)
|
|||||
|
Equity securities
|
(564,562
|
)
|
(240,926
|
)
|
(377,749
|
)
|
|||||
|
Other investments
|
(75,542
|
)
|
(166,835
|
)
|
(110,084
|
)
|
|||||
|
Short-term investments
|
(669,494
|
)
|
(198,168
|
)
|
(383,981
|
)
|
|||||
|
Proceeds from the sale of:
|
|||||||||||
|
Fixed maturities
|
10,799,112
|
|
10,261,256
|
|
11,144,351
|
|
|||||
|
Equity securities
|
740,900
|
|
323,423
|
|
468,473
|
|
|||||
|
Other investments
|
213,508
|
|
93,277
|
|
53,590
|
|
|||||
|
Short-term investments
|
526,460
|
|
197,690
|
|
354,924
|
|
|||||
|
Proceeds from redemption of fixed maturities
|
1,086,244
|
|
1,407,676
|
|
1,456,553
|
|
|||||
|
Proceeds from redemption of short-term investments
|
80,474
|
|
61,715
|
|
69,751
|
|
|||||
|
Purchase of other assets
|
(20,857
|
)
|
(24,304
|
)
|
(35,322
|
)
|
|||||
|
Change in restricted cash and cash equivalents
|
(223,315
|
)
|
26,183
|
|
10,256
|
|
|||||
|
Net cash used in investing activities
|
(154,076
|
)
|
(489,287
|
)
|
(862,381
|
)
|
|||||
|
Cash flows from financing activities:
|
|||||||||||
|
Net proceeds from issuance of senior notes
|
494,344
|
|
—
|
|
—
|
|
|||||
|
Redemption of senior notes
|
(500,000
|
)
|
—
|
|
—
|
|
|||||
|
Net proceeds from issuance of preferred shares
|
—
|
|
218,449
|
|
393,544
|
|
|||||
|
Repurchase of preferred shares
|
—
|
|
(100,000
|
)
|
(404,073
|
)
|
|||||
|
Repurchase of common shares
|
(543,202
|
)
|
(472,263
|
)
|
(317,687
|
)
|
|||||
|
Dividends paid - common shares
|
(117,619
|
)
|
(118,426
|
)
|
(120,487
|
)
|
|||||
|
Dividends paid - preferred shares
|
(40,088
|
)
|
(39,193
|
)
|
(38,228
|
)
|
|||||
|
Proceeds from issuance of common shares
|
5,550
|
|
20,339
|
|
5,120
|
|
|||||
|
Sale of shares to noncontrolling interests
|
25,000
|
|
50,000
|
|
—
|
|
|||||
|
Return of capital to noncontrolling interests
|
(10,000
|
)
|
—
|
|
—
|
|
|||||
|
Net cash used in financing activities
|
(686,015
|
)
|
(441,094
|
)
|
(481,811
|
)
|
|||||
|
Effect of exchange rate changes on foreign currency cash and cash equivalents
|
(23,587
|
)
|
(3,078
|
)
|
1,543
|
|
|||||
|
Increase (decrease) in cash and cash equivalents
|
(1,496
|
)
|
163,509
|
|
(222,032
|
)
|
|||||
|
Cash and cash equivalents - beginning of year
|
923,326
|
|
759,817
|
|
981,849
|
|
|||||
|
Cash and cash equivalents - end of year
|
$
|
921,830
|
|
$
|
923,326
|
|
$
|
759,817
|
|
||
|
Supplemental disclosures of cash flow information:
|
|||||||||||
|
Income taxes paid
|
$
|
7,654
|
|
$
|
22,472
|
|
$
|
10,897
|
|
||
|
Interest paid
|
$
|
68,850
|
|
$
|
58,125
|
|
$
|
58,125
|
|
||
See accompanying notes to Consolidated Financial Statements.
119
AXIS CAPITAL HOLDINGS LIMITED
NOTES TO CONSOLIDATED FINANCIAL STATEMENTS
DECEMBER 31, 2014, 2013 AND 2012
|
1.
|
HISTORY
|
AXIS Capital Holdings Limited (“AXIS Capital”) is the Bermuda-based holding company for the AXIS group of companies, collectively the “Company”. AXIS Capital was incorporated on December 9, 2002, under the laws of Bermuda. Through its subsidiaries and branches organized in Bermuda, the United States, Europe, Singapore, Canada, Australia and Latin America, AXIS Capital provides a broad range of (re)insurance products on a worldwide basis under two distinct global underwriting platforms, AXIS Insurance and AXIS Re. In these notes, the terms “we,” “us,” “our,” or the “Company” refer to AXIS Capital and its direct and indirect subsidiaries.
On January 25, 2015, the Company announced the signing of a definitive amalgamation agreement with PartnerRe Ltd. PartnerRe Ltd., through its principal operating subsidiaries, provides reinsurance and certain specialty insurance lines on a worldwide basis. The transaction is expected to close in the second half of 2015, subject to approval by the shareholders of both companies, regulatory clearance and customary closing conditions.
|
2.
|
SIGNIFICANT ACCOUNTING POLICIES
|
Basis of Presentation
These consolidated financial statements have been prepared in accordance with accounting principles generally accepted in the United States (“U.S. GAAP”) and include the accounts of AXIS Capital, its wholly-owned subsidiaries, and variable interest entities (“VIEs”) in which the Company is considered the primary beneficiary. All inter-company accounts and transactions have been eliminated.
A VIE is an entity that either: (a) does not have equity investors with voting rights or (b) has equity investors that do not provide sufficient financial resources for the entity to support its activities. We are the primary beneficiary of a VIE if we have a controlling financial interest in the VIE, based on the following two characteristics: a) the power to direct the activities of the VIE that most significantly impact the economic performance of the VIE, and b) the obligation to absorb losses of the VIE that could potentially be significant to the VIE or the right to receive benefits from the VIE that could potentially be significant to the VIE.
Tabular dollar and share amounts are in thousands, with the exception of per share amounts. All amounts are reported in U.S. dollars.
Use of Estimates
The preparation of these consolidated financial statements requires management to make estimates and assumptions that affect the reported amount of assets and liabilities and disclosure of contingent assets and liabilities at the date of the consolidated financial statements and the reported amounts of revenues and expenses during the reporting period. While management believes that the amounts included in the consolidated financial statements reflect its best estimates and assumptions, actual results could differ from those estimates. The Company’s principal estimates include:
|
•
|
reserve for losses and loss expenses;
|
|
•
|
reinsurance recoverable on unpaid losses, including the provision for uncollectible amounts;
|
|
•
|
gross and net premiums written and net premiums earned;
|
|
•
|
other-than-temporary impairments (“OTTI”) in the carrying value of available-for-sale investment securities; and
|
|
•
|
fair value measurements for our financial assets and liabilities.
|
120
AXIS CAPITAL HOLDINGS LIMITED
NOTES TO CONSOLIDATED FINANCIAL STATEMENTS
DECEMBER 31, 2014, 2013 AND 2012
|
2.
|
SIGNIFICANT ACCOUNTING POLICIES (CONTINUED)
|
Our significant accounting policies are:
|
a)
|
Investments
|
Investments available for sale
Our fixed maturities and equities classified as “available for sale” are reported at fair value at the balance sheet date. See Note 6 – Fair Value Measurements for additional information regarding the determination of fair value. The change in fair value (net unrealized gain or loss) on our available for sale investments, net of tax, is included as a separate component of accumulated other comprehensive income (loss) (“AOCI”) in shareholders’ equity.
Net investment income includes interest and dividend income and the amortization of market premiums and discounts and is presented net of investment expenses. Investment income is recognized when earned. Purchases and sales of investments are recorded on a trade-date basis and realized gains/losses on sales of investments are determined based on the specific identification method.
We recognize investment income from fixed maturities based on the constant effective yield method, which includes an adjustment for estimated principal repayments, if any. The effective yield used to determine the amortization for fixed maturities subject to prepayment risk (e.g. asset-backed, loan-backed and other structured securities) is recalculated and adjusted periodically based upon actual historical and/or projected future cash flows. The adjustments to the yield for highly-rated prepayable fixed maturities are accounted for using the retrospective method. The adjustments to the yield for other prepayable fixed maturities are accounted for using the prospective method.
On a quarterly basis, we assess whether unrealized losses on available for sale investments represent impairments that are other than temporary. Several factors are considered in this assessment including, but not limited to: (i) the extent and duration of the decline, (ii) the reason for the decline (e.g. credit spread widening, credit event, foreign exchange rate movements), (iii) the historical and implied future volatility of the fair value, (iv) the financial condition and near-term prospects of the issuer and (v) the collateral structure and credit support of the security, if applicable.
A fixed maturity is impaired when the fair value is below its amortized cost. For an impaired fixed maturity where we intend to sell the security or it is more likely than not that we will be required to sell the security before its anticipated recovery, the full amount of the impairment is charged to earnings and is included in net realized investment gains (losses). Where we intend to hold the impaired fixed maturity, we estimate the anticipated credit loss of the security and recognize only this portion of the impairment in earnings, with the remaining non-credit related balance of the impairment (i.e. related to interest rates, market conditions, etc.) recognized in AOCI.
We impair an equity security in an unrealized loss position when we do not have the ability and intent to hold the security for a reasonable period of time to allow for a full recovery. The full impairment is charged to earnings and is included in net realized investment gains (losses).
Upon recognition of an OTTI, the new cost basis for the security is the previous amortized cost for a fixed maturity or cost for an equity security less the OTTI recognized in earnings. The new cost basis is not adjusted for subsequent recoveries in fair value; except for fixed maturities whereby the difference between the new cost basis and the expected cash flows is accreted on a quarterly basis to net investment income over the remaining life of the fixed maturity.
Other investments
We record other investments at fair value (see Note 6 – Fair Value Measurements), with both changes in fair value and realized gains/losses reported in net investment income.
121
AXIS CAPITAL HOLDINGS LIMITED
NOTES TO CONSOLIDATED FINANCIAL STATEMENTS
DECEMBER 31, 2014, 2013 AND 2012
|
2.
|
SIGNIFICANT ACCOUNTING POLICIES (CONTINUED)
|
Short-term investments
Short-term investments primarily comprise highly-liquid debt securities with maturities greater than three months but less than one year from the date of purchase. These investments are carried at amortized cost, which approximates fair value.
|
b)
|
Cash and cash equivalents
|
Cash equivalents include money-market funds and fixed interest deposits placed with a maturity of under 90 days when purchased. Cash and cash equivalents are recorded at amortized cost, which approximates fair value due to the short-term, liquid nature of these securities. Our restricted cash balance primarily relates to funds held in trust in support of our obligations in regulatory jurisdictions where we operate as a non-admitted carrier.
|
c)
|
Premiums and Acquisition Costs
|
Premiums
Insurance premiums written are recorded in accordance with the terms of the underlying policies. Reinsurance premiums are recorded at the inception of the contract and are estimated based upon information received from ceding companies. For multi-year contracts where (re)insurance premiums are payable in annual installments, premiums are recorded at the inception of the contract based on management’s best estimate of total premiums to be received. However, premiums are normally recognized on an annual basis for multi-year contracts where the cedant has the ability to unilaterally commute or cancel coverage within the term of the policy. The remaining annual premiums are included as written at each successive anniversary date within the multi-year term.
Any subsequent differences arising on insurance and reinsurance premium estimates are recorded in the period they are determined.
(Re)insurance premiums are earned evenly over the period during which we are exposed to the underlying risk, which is generally one to two years with the exception of multi-year contracts. Unearned premiums represent the portion of premiums written which is applicable to the unexpired risks under contracts in force.
Reinstatement premiums are recognized and earned at the time a loss event occurs, where the coverage limits for the remaining life of the contract are reinstated under pre-defined contract terms. The accrual of reinstatement premiums is based on our estimate of losses and loss adjustment expenses, which reflects management’s judgment, as described in Note 2(d) – Losses and Loss Expenses below.
Premiums receivable balances are reviewed for impairment at least quarterly and an allowance is established for amounts considered uncollectible. The need for charge-off of any amounts previously reserved as uncollectible is assessed on a quarterly basis.
Acquisition Costs
Acquisition costs vary with and are directly related to the acquisition of (re)insurance contracts and consist primarily of fees and commissions paid to brokers and premium taxes. Premiums receivable are presented net of applicable acquisition costs when contract terms provide for the right of offset. Acquisition costs are shown net of commissions earned on ceded reinsurance. Our net acquisition costs are deferred and charged to expense as the related premium is earned.
Anticipated losses and loss expenses, other costs and investment income related to these premiums are considered in assessing the recoverability of our deferred acquisition costs. If deferred amounts are estimated to be unrecoverable, they are expensed. Compensation expenses for personnel involved in contract acquisition, as well as advertising costs, are expensed as incurred.
122
AXIS CAPITAL HOLDINGS LIMITED
NOTES TO CONSOLIDATED FINANCIAL STATEMENTS
DECEMBER 31, 2014, 2013 AND 2012
|
2.
|
SIGNIFICANT ACCOUNTING POLICIES (CONTINUED)
|
|
d)
|
Losses and Loss Expenses
|
Our reserve for losses and loss expenses represents an estimate of the unpaid portion of our ultimate liability for losses and loss expenses for (re)insured events that have occurred at or before the balance sheet date. The balance reflects both claims that have been reported to us (“case reserves”) and claims that have been incurred but not yet reported to us (“IBNR”). These amounts are reduced for estimated amounts of salvage and subrogation recoveries.
We review our reserve for losses and loss expenses on a quarterly basis. Case reserves are primarily established based on amounts reported from insureds and/or their brokers. Management estimates IBNR after reviewing detailed actuarial analyses and applying informed judgment regarding qualitative factors that may not be fully captured in the actuarial estimates. A variety of actuarial methods are utilized in this process, including the Expected Loss Ratio, Bornhuetter-Ferguson and Chain Ladder methods. Our estimate is highly dependent on management’s judgment as to which method(s) are most appropriate for a particular accident year and class of business. Our historical claims data is often supplemented with industry benchmarks when applying these methodologies.
Any adjustments to our previous reserve for losses and loss expenses estimates are recognized in the period they are determined. While we believe that our reserves for losses and loss expenses are adequate, this estimate requires significant judgment and new information, events or circumstances may result in ultimate losses that are materially greater or less than provided for in the Consolidated Balance Sheets.
|
e)
|
Reinsurance
|
In the normal course of business, we purchase reinsurance protection to limit our ultimate losses from catastrophic events and to reduce our loss aggregation risk. The premiums paid to our reinsurers (i.e. premiums ceded) are expensed over the coverage period. Prepaid reinsurance premiums represent the portion of premiums ceded applicable to the unexpired term of the contracts in force. Reinstatement-related premiums ceded are recorded at the time a loss event occurs and our coverage limits for the remaining life of a contract are reinstated under pre-defined contract terms; such premiums are expensed over the remaining risk period.
Reinsurance recoverable related to our case reserves is estimated on a case-by-case basis by applying the terms of any applicable reinsurance coverage to our individual case reserve estimates. Our estimate of reinsurance recoverable related to our IBNR reserves is generally developed as part of our loss reserving process.
Our reinsurance recoverable is presented net of a provision for uncollectible amounts, reflecting the amount we believe will ultimately not be recovered due to reinsurer insolvency, contractual disputes and/or some other reason. We apply case-specific provisions against certain recoveries that we deem unlikely to be collected in full. In addition, we use a default analysis to estimate our provision for uncollectible amounts on the remainder of the balance.
The estimates of our reinsurance recoverable and the associated provision require management’s judgment and are reviewed in detail on a quarterly basis. Any adjustments to amounts recognized in prior periods are reported in our net losses and loss expenses in the Consolidated Statements of Operations for the period when the adjustments were identified. The charge-off of amounts previously reserved as uncollectible is also considered on a case-by-case basis as part of this quarterly process.
|
f)
|
Foreign Exchange
|
The Company’s reporting currency is the U.S. dollar. In translating the financial statements of our subsidiaries or branches where the functional currency is other than the U.S. dollar, assets and liabilities are converted into U.S. dollars using the rates of exchange in effect at the balance sheet dates and revenues and expenses are converted using the weighted average foreign exchange rates for the period. The effect of translation adjustments is reported as a separate component of AOCI in shareholders’ equity.
123
AXIS CAPITAL HOLDINGS LIMITED
NOTES TO CONSOLIDATED FINANCIAL STATEMENTS
DECEMBER 31, 2014, 2013 AND 2012
|
2.
|
SIGNIFICANT ACCOUNTING POLICIES (CONTINUED)
|
In recording foreign currency transactions, revenue and expense items are converted to the relevant functional currency at the exchange rate prevailing at the transaction date. Assets and liabilities originating in currencies other than the functional currency are translated into the functional currency at the rates of exchange in effect at the balance sheet date. The resulting foreign currency gains or losses are recognized in the Consolidated Statements of Operations, with the exception of those related to foreign-denominated available for sale investments. For these investments, exchange rate fluctuations represent an unrealized appreciation/depreciation in the value of the securities and are included in the related component of AOCI.
|
g)
|
Share-Based Compensation
|
The Company is authorized to issue restricted stock awards and units, stock options and other equity-based awards to its employees and directors. The fair value of service-based awards is measured at the grant date, with the associated expense recognized on a straight-line basis over the service period. The fair value of performance-based awards ("PSUs") is measured at the grant date based on pre-established targets relating to certain performance based measures achieved by the Company, with the associated expense recognized on a straight-line basis over the applicable performance and vesting period. The compensation expense for PSUs is subject to a periodic review and adjustment taking into account actual performance of the Company. The fair value of the liability associated with cash-settled awards is re-measured at each balance sheet date, with the effects recognized as an increase or decrease to share-based compensation expense for the period. Forfeiture benefits are estimated at the time of grant and incorporated in the determination of share-based compensation expense.
|
h)
|
Derivative Instruments
|
Derivative Instruments not Designated as Hedging Instruments
We may enter into derivative instruments such as futures, options, interest rate swaps and foreign currency forward contracts as part of our overall foreign currency risk management strategy, to obtain exposure to a particular financial market or for yield enhancement. During 2013, we began to write derivative based risk management products designed to address weather and commodity price risks, with the objective of generating profits on a portfolio basis. From time to time we may also enter into (re)insurance contracts that meet the FASB’s definition of a derivative contract.
We measure all derivative instruments at fair value (see Note 6 – Fair Value Measurements) and recognize them as either assets or liabilities in the Consolidated Balance Sheets. Subsequent changes in fair value and any realized gains or losses are recognized in the Consolidated Statements of Operations.
Derivative Instruments Designated as Hedging Instruments
We may designate a currency derivative as a hedge of foreign exchange rate-related movements in the fair value of certain investment portfolios. This is referred to as a fair value hedge. Changes in the fair value of the designated fair value hedge, along with the changes in the fair value of the hedged asset attributable to the hedged risk, are recorded in net realized investment gains (losses) in the Consolidated Statements of Operations, along with any hedge ineffectiveness.
To qualify for hedge accounting treatment, a derivative must be highly effective in mitigating the designated changes in value of the hedged item. Further, the hedge relationship must be designated and formally documented at the inception, detailing the particular risk management objective and strategy for the hedge, including the item and risk that is being hedged, the derivative that is being used, and how effectiveness will be assessed. We formally measure the hedge effectiveness at inception and on an ongoing basis. We evaluate the effectiveness on a retrospective and prospective basis, using the period-to-period dollar offset method. Using this method, if the hedge correlation is within the range of 80% to 125%, we consider the hedge effective and apply hedge accounting. Cash flows from derivative instruments designated as hedging instruments are presented as operating activities in the Consolidated Statements of Cash Flows.
124
AXIS CAPITAL HOLDINGS LIMITED
NOTES TO CONSOLIDATED FINANCIAL STATEMENTS
DECEMBER 31, 2014, 2013 AND 2012
|
2.
|
SIGNIFICANT ACCOUNTING POLICIES (CONTINUED)
|
|
i)
|
Goodwill and Intangible Assets
|
We classify intangible assets into three categories: (1) intangible assets with finite lives subject to amortization, (2) intangible assets with indefinite lives not subject to amortization, and (3) goodwill.
We amortize intangible assets with finite lives over their estimated useful lives in proportion to the estimated economic benefits of the intangible assets. We also test these assets for impairment if circumstances indicate that the carrying value may not be fully recoverable. Such circumstances may include an economic downturn in a geographic market or a change in the assessment of future operations. If, as a result of such an evaluation, we determine that the carrying value of the finite-lived intangible assets is not recoverable, the value of the assets will be reduced to fair value with the difference being expensed in the Consolidated Statements of Operations.
Our intangible assets with indefinite lives include licenses held by certain subsidiaries in various jurisdictions that allow such subsidiaries to write insurance and/or reinsurance business. These intangible assets are carried at or below estimated fair value and are tested annually for impairment, either qualitatively or quantitatively, and between annual tests if events or changes in circumstances indicate that it is more likely than not that the asset is impaired.
We have recorded goodwill in connection with certain acquisitions. Goodwill represents the excess of the cost of acquisitions over the fair value of the net assets acquired and is assigned to applicable reporting unit(s) on the acquisition date, based upon the expected benefit to be received by the reporting unit. We determine the expected benefit based on several factors, including the purpose of the business combination, our strategy subsequent to the business combination and the structure of the acquired company subsequent to the business combination. Goodwill is not subject to amortization. We test goodwill for potential impairment during the fourth quarter each year and between annual tests if an event occurs or circumstances change that would more likely than not reduce the fair value of a reporting unit to a level below its carrying amount. We have the option to first make this assessment on a qualitative basis. Should we choose to forgo this option, or if our qualitative assessment indicates that fair value is more likely than not below carrying value, we conduct a quantitative two-step impairment evaluation at the reporting unit level. First, we identify potential impairment by comparing the estimated fair values of the reporting units to estimated book values, including goodwill. The fair value of each reporting unit is derived based upon valuation techniques and assumptions that we believe market participants would use to value our business. The estimated fair values are generally determined utilizing methodologies that incorporate discounted cash flow analyses. The values derived from the analyses are then compared to recent market transactions for reasonableness. We derive the net book value of our reporting units by estimating the amount of shareholders’ equity required to support the activities of each reporting unit. If the estimated fair value of a reporting unit exceeds the estimated book value, goodwill is not considered impaired. If the book value exceeds the estimated fair value, the second step compares the implied fair value of the reporting unit’s goodwill with the carrying amount of the goodwill in order to determine the magnitude of impairment to be recognized. The implied fair value of goodwill is determined by deducting the fair value of a reporting unit’s identifiable assets and liabilities from the fair value of the reporting unit as a whole. The excess of the carrying value of goodwill above the implied goodwill, if any, would be recognized as an impairment charge in the Consolidated Statements of Operations.
|
j)
|
Income Taxes
|
Certain subsidiaries and branches of the Company operate in jurisdictions where they are subject to taxation. Current and deferred income taxes are charged or credited to net income, or in certain cases to AOCI, based upon enacted tax laws and rates applicable in the relevant jurisdiction in the period in which the tax becomes accruable or realizable. Deferred income taxes are provided for all temporary differences between the bases of assets and liabilities used in the Consolidated Balance Sheets and those used in the various jurisdictional tax returns. When our assessment indicates that it is more likely than not that a portion of a deferred tax asset will not be realized in the foreseeable future, a valuation allowance against deferred tax assets is recorded. We recognize the tax benefits of uncertain tax positions only when the position is more-likely-than-not to be sustained upon audit by the relevant taxing authorities.
125
AXIS CAPITAL HOLDINGS LIMITED
NOTES TO CONSOLIDATED FINANCIAL STATEMENTS
DECEMBER 31, 2014, 2013 AND 2012
|
2.
|
SIGNIFICANT ACCOUNTING POLICIES (CONTINUED)
|
|
k)
|
Treasury Shares
|
Common shares repurchased by the Company and not subsequently canceled are classified as treasury shares and are recorded at cost. This results in a reduction of shareholders’ equity in the Consolidated Balance Sheets. When shares are reissued from treasury, we use the average cost method to determine the cost of the reissued shares. Gains on sales/reissuances of treasury shares are credited to additional paid-in capital, while losses are charged to additional paid-in capital to the extent that previous net gains from reissued treasury shares were included therein; otherwise losses are charged to retained earnings.
|
l)
|
Recently Issued Accounting Standards Not Yet Adopted
|
Revenue From Contracts With Customers
In May 2014, the Financial Accounting Standards Board ("FASB") issued new guidance on revenue recognition affecting any entity that either enters into contracts with customers to transfer goods or services or enters into contracts for the transfer of nonfinancial assets unless those contracts are within the scope of other standards (for example, insurance contracts are not in scope of the new guidance). The core principle of the guidance is that an entity should recognize revenue to depict the transfer of promised goods or services to customers in an amount that reflects the consideration to which the entity expects to be entitled in exchange for those goods or services. This guidance is effective for reporting periods beginning after December 15, 2016, and early adoption is not permitted. The Company is currently evaluating the impact of this guidance on our results of operations, financial condition and liquidity.
Share-Based Compensation
In June 2014, the FASB issued new guidance for share-based payments where a performance target could be achieved after the requisite service period has ended, requiring that compensation costs be recognized in the period in which it becomes probable that the performance target will be achieved and to represent the compensation cost attributable to the period(s) for which the requisite service has already been rendered. This guidance is effective for reporting periods beginning after December 15, 2015. As the new guidance was issued to clarify treatment where there was divergence in accounting practice, the adoption of this guidance is not expected to impact our results of operations, financial condition or liquidity.
Consolidation
In February 2015, the FASB issued new guidance making changes to both the variable interest model and the voting model for consolidation. This new guidance could lead to changes in consolidation conclusions. The new guidance is effective for reporting periods beginning after December 15, 2015, with early adoption permitted. The Company is currently evaluating the impact of this guidance on our results of operations, financial condition and liquidity.
|
3.
|
SEGMENT INFORMATION
|
Our underwriting operations are organized around our global underwriting platforms, AXIS Insurance and AXIS Re. Therefore we have determined that we have
two
reportable segments, insurance and reinsurance. We do not allocate our assets by segment, with the exception of goodwill and intangible assets, as we evaluate the underwriting results of each segment separately from the results of our investment portfolio.
Insurance
Our insurance segment provides insurance coverage on a worldwide basis. The product lines in this segment are property, marine, terrorism, aviation, credit and political risk, professional lines, liability and accident and health.
126
AXIS CAPITAL HOLDINGS LIMITED
NOTES TO CONSOLIDATED FINANCIAL STATEMENTS
DECEMBER 31, 2014, 2013 AND 2012
|
3.
|
SEGMENT INFORMATION (CONTINUED)
|
Reinsurance
Our reinsurance segment provides non-life treaty reinsurance to insurance companies on a worldwide basis. The product lines in this segment are catastrophe, property, professional lines, credit and surety, motor, liability, agriculture, engineering and other. The reinsurance segment also writes derivative based risk management products designed to address weather and commodity price risks.
The following tables summarize the underwriting results of our reportable segments, as well as the carrying values of allocated goodwill and intangible assets:
|
At and year ended December 31, 2014
|
Insurance
|
Reinsurance
|
Total
|
||||||||||
|
Gross premiums written
|
$
|
2,535,415
|
|
$
|
2,176,104
|
|
$
|
4,711,519
|
|
||||
|
Net premiums written
|
1,779,501
|
|
2,127,474
|
|
3,906,975
|
|
|||||||
|
Net premiums earned
|
1,830,544
|
|
2,040,455
|
|
3,870,999
|
|
|||||||
|
Other insurance related income (loss)
|
(11
|
)
|
661
|
|
650
|
|
|||||||
|
Net losses and loss expenses
|
(1,131,880
|
)
|
(1,054,842
|
)
|
(2,186,722
|
)
|
|||||||
|
Acquisition costs
|
(278,804
|
)
|
(458,393
|
)
|
(737,197
|
)
|
|||||||
|
General and administrative expenses
|
(341,214
|
)
|
(144,987
|
)
|
(486,201
|
)
|
|||||||
|
Underwriting income
|
$
|
78,635
|
|
$
|
382,894
|
|
461,529
|
|
|||||
|
Corporate expenses
|
(135,675
|
)
|
|||||||||||
|
Net investment income
|
342,766
|
|
|||||||||||
|
Net realized investment gains
|
132,108
|
|
|||||||||||
|
Foreign exchange gains
|
104,439
|
|
|||||||||||
|
Interest expense and financing costs
|
(74,695
|
)
|
|||||||||||
|
Income before income taxes
|
$
|
830,472
|
|
||||||||||
|
Net loss and loss expense ratio
|
61.8
|
%
|
51.7
|
%
|
56.5
|
%
|
|||||||
|
Acquisition cost ratio
|
15.2
|
%
|
22.5
|
%
|
19.0
|
%
|
|||||||
|
General and administrative expense ratio
|
18.7
|
%
|
7.1
|
%
|
16.1
|
%
|
|||||||
|
Combined ratio
|
95.7
|
%
|
81.3
|
%
|
91.6
|
%
|
|||||||
|
Goodwill and intangible assets
|
$
|
88,960
|
|
$
|
—
|
|
$
|
88,960
|
|
||||
127
AXIS CAPITAL HOLDINGS LIMITED
NOTES TO CONSOLIDATED FINANCIAL STATEMENTS
DECEMBER 31, 2014, 2013 AND 2012
|
3.
|
SEGMENT INFORMATION (CONTINUED)
|
|
At and year ended December 31, 2013
|
Insurance
|
Reinsurance
|
Total
|
||||||||||
|
Gross premiums written
|
$
|
2,559,138
|
|
$
|
2,137,903
|
|
$
|
4,697,041
|
|
||||
|
Net premiums written
|
1,813,538
|
|
2,114,662
|
|
3,928,200
|
|
|||||||
|
Net premiums earned
|
1,722,762
|
|
1,984,303
|
|
3,707,065
|
|
|||||||
|
Other insurance related income
|
2,436
|
|
1,988
|
|
4,424
|
|
|||||||
|
Net losses and loss expenses
|
(1,050,402
|
)
|
(1,083,793
|
)
|
(2,134,195
|
)
|
|||||||
|
Acquisition costs
|
(242,363
|
)
|
(421,828
|
)
|
(664,191
|
)
|
|||||||
|
General and administrative expenses
|
(347,684
|
)
|
(137,450
|
)
|
(485,134
|
)
|
|||||||
|
Underwriting income
|
$
|
84,749
|
|
$
|
343,220
|
|
427,969
|
|
|||||
|
Corporate expenses
|
(90,256
|
)
|
|||||||||||
|
Net investment income
|
409,312
|
|
|||||||||||
|
Net realized investment gains
|
75,564
|
|
|||||||||||
|
Foreign exchange losses
|
(26,143
|
)
|
|||||||||||
|
Interest expense and financing costs
|
(61,979
|
)
|
|||||||||||
|
Income before income taxes
|
$
|
734,467
|
|
||||||||||
|
Net loss and loss expense ratio
|
61.0
|
%
|
54.6
|
%
|
57.6
|
%
|
|||||||
|
Acquisition cost ratio
|
14.1
|
%
|
21.3
|
%
|
17.9
|
%
|
|||||||
|
General and administrative expense ratio
|
20.1
|
%
|
6.9
|
%
|
15.5
|
%
|
|||||||
|
Combined ratio
|
95.2
|
%
|
82.8
|
%
|
91.0
|
%
|
|||||||
|
Goodwill and intangible assets
|
$
|
89,528
|
|
$
|
—
|
|
$
|
89,528
|
|
||||
128
AXIS CAPITAL HOLDINGS LIMITED
NOTES TO CONSOLIDATED FINANCIAL STATEMENTS
DECEMBER 31, 2014, 2013 AND 2012
|
3.
|
SEGMENT INFORMATION (CONTINUED)
|
|
At and year ended December 31, 2012
|
Insurance
|
Reinsurance
|
Total
|
||||||||||
|
Gross premiums written
|
$
|
2,309,481
|
|
$
|
1,830,162
|
|
$
|
4,139,643
|
|
||||
|
Net premiums written
|
1,522,245
|
|
1,815,211
|
|
3,337,456
|
|
|||||||
|
Net premiums earned
|
1,558,058
|
|
1,857,405
|
|
3,415,463
|
|
|||||||
|
Other insurance related income
|
2,676
|
|
—
|
|
2,676
|
|
|||||||
|
Net losses and loss expenses
|
(953,564
|
)
|
(1,142,464
|
)
|
(2,096,028
|
)
|
|||||||
|
Acquisition costs
|
(226,859
|
)
|
(400,794
|
)
|
(627,653
|
)
|
|||||||
|
General and administrative expenses
|
(314,834
|
)
|
(116,487
|
)
|
(431,321
|
)
|
|||||||
|
Underwriting income
|
$
|
65,477
|
|
$
|
197,660
|
|
263,137
|
|
|||||
|
Corporate expenses
|
(129,660
|
)
|
|||||||||||
|
Net investment income
|
380,957
|
|
|||||||||||
|
Net realized investment gains
|
127,469
|
|
|||||||||||
|
Foreign exchange losses
|
(29,512
|
)
|
|||||||||||
|
Interest expense and financing costs
|
(61,863
|
)
|
|||||||||||
|
Income before income taxes
|
$
|
550,528
|
|
||||||||||
|
Net loss and loss expense ratio
|
61.2
|
%
|
61.5
|
%
|
61.4
|
%
|
|||||||
|
Acquisition cost ratio
|
14.6
|
%
|
21.6
|
%
|
18.4
|
%
|
|||||||
|
General and administrative expense ratio
|
20.2
|
%
|
6.3
|
%
|
16.4
|
%
|
|||||||
|
Combined ratio
|
96.0
|
%
|
89.4
|
%
|
96.2
|
%
|
|||||||
|
Goodwill and intangible assets
|
$
|
97,493
|
|
$
|
—
|
|
$
|
97,493
|
|
||||
129
AXIS CAPITAL HOLDINGS LIMITED
NOTES TO CONSOLIDATED FINANCIAL STATEMENTS
DECEMBER 31, 2014, 2013 AND 2012
|
3.
|
SEGMENT INFORMATION (CONTINUED)
|
The following table presents our gross premiums written by the geographical location of our subsidiaries:
|
Year ended December 31,
|
2014
|
2013
|
2012
|
||||||||||
|
Bermuda
|
$
|
618,273
|
|
$
|
718,904
|
|
$
|
684,588
|
|
||||
|
Europe
|
1,784,139
|
|
1,699,748
|
|
1,561,701
|
|
|||||||
|
United States
|
2,309,107
|
|
2,278,389
|
|
1,893,354
|
|
|||||||
|
Total gross premium written
|
$
|
4,711,519
|
|
$
|
4,697,041
|
|
$
|
4,139,643
|
|
||||
The following table presents our net premiums earned by segment and line of business:
|
Year ended December 31,
|
2014
|
2013
|
2012
|
||||||||||
|
Insurance
|
|||||||||||||
|
Property
|
$
|
444,197
|
|
$
|
462,364
|
|
$
|
408,943
|
|
||||
|
Marine
|
178,229
|
|
179,057
|
|
171,165
|
|
|||||||
|
Terrorism
|
35,876
|
|
39,298
|
|
38,605
|
|
|||||||
|
Aviation
|
41,192
|
|
48,489
|
|
60,363
|
|
|||||||
|
Credit and Political Risk
|
63,095
|
|
68,192
|
|
87,103
|
|
|||||||
|
Professional Lines
|
629,365
|
|
586,200
|
|
563,500
|
|
|||||||
|
Liability
|
146,819
|
|
110,623
|
|
86,873
|
|
|||||||
|
Accident and Health
|
291,771
|
|
228,539
|
|
141,506
|
|
|||||||
|
Total Insurance
|
1,830,544
|
|
1,722,762
|
|
1,558,058
|
|
|||||||
|
Reinsurance
|
|||||||||||||
|
Catastrophe
|
325,307
|
|
380,199
|
|
375,088
|
|
|||||||
|
Property
|
312,443
|
|
350,970
|
|
351,470
|
|
|||||||
|
Professional Lines
|
336,058
|
|
304,754
|
|
297,726
|
|
|||||||
|
Credit and Surety
|
263,013
|
|
279,943
|
|
277,185
|
|
|||||||
|
Motor
|
268,678
|
|
221,844
|
|
237,006
|
|
|||||||
|
Liability
|
289,223
|
|
234,736
|
|
220,874
|
|
|||||||
|
Agriculture
|
164,628
|
|
126,490
|
|
17,116
|
|
|||||||
|
Engineering
|
61,143
|
|
66,243
|
|
68,402
|
|
|||||||
|
Other
|
19,962
|
|
19,124
|
|
12,538
|
|
|||||||
|
Total Reinsurance
|
2,040,455
|
|
1,984,303
|
|
1,857,405
|
|
|||||||
|
Total
|
$
|
3,870,999
|
|
$
|
3,707,065
|
|
$
|
3,415,463
|
|
||||
130
AXIS CAPITAL HOLDINGS LIMITED
NOTES TO CONSOLIDATED FINANCIAL STATEMENTS
DECEMBER 31, 2014, 2013 AND 2012
|
4.
|
GOODWILL AND INTANGIBLE ASSETS
|
The following table shows an analysis of goodwill and intangible assets:
|
Goodwill
|
Intangible
assets with an
indefinite life
|
Intangible
assets with a
finite life
|
Total
|
||||||||||||||
|
Net balance at December 31, 2012
|
$
|
49,635
|
|
$
|
26,036
|
|
$
|
21,822
|
|
$
|
97,493
|
|
|||||
|
Amortization
|
n/a
|
|
n/a
|
|
(2,233
|
)
|
(2,233
|
)
|
|||||||||
|
Foreign currency translation adjustment
|
(3,213
|
)
|
—
|
|
(2,519
|
)
|
(5,732
|
)
|
|||||||||
|
Net balance at December 31, 2013
|
46,422
|
|
26,036
|
|
17,070
|
|
89,528
|
|
|||||||||
|
Amortization
|
n/a
|
|
n/a
|
|
(1,982
|
)
|
(1,982
|
)
|
|||||||||
|
Foreign currency translation adjustment
|
726
|
|
—
|
|
688
|
|
1,414
|
|
|||||||||
|
Net balance at December 31, 2014
|
$
|
47,148
|
|
$
|
26,036
|
|
$
|
15,776
|
|
$
|
88,960
|
|
|||||
|
Gross balance at December 31, 2014
|
$
|
42,237
|
|
$
|
26,036
|
|
$
|
35,596
|
|
$
|
103,869
|
|
|||||
|
Accumulated amortization
|
n/a
|
|
n/a
|
|
(25,583
|
)
|
(25,583
|
)
|
|||||||||
|
Foreign currency translation adjustment
|
4,911
|
|
—
|
|
5,763
|
|
10,674
|
|
|||||||||
|
Net balance at December 31, 2014
|
$
|
47,148
|
|
$
|
26,036
|
|
$
|
15,776
|
|
$
|
88,960
|
|
|||||
n/a – not applicable
We estimate that the annual amortization expense for our total intangible assets with a finite life will be approximately
$2 million
in 2015 and 2016 and
$1 million
in 2017 through to 2019. The estimated remaining useful lives of these assets range from
five
to
twenty-four
years.
Intangible assets with an indefinite life consist primarily of U.S. state licenses that provide a legal right to transact business indefinitely. Our impairment reviews for goodwill and indefinite lived intangibles did not result in the recognition of impairment losses for the years ended December 31,
2014
,
2013
and
2012
.
131
AXIS CAPITAL HOLDINGS LIMITED
NOTES TO CONSOLIDATED FINANCIAL STATEMENTS
DECEMBER 31, 2014, 2013 AND 2012
|
5.
|
INVESTMENTS
|
|
a)
|
Fixed Maturities and Equities
|
The amortized cost or cost and fair values of our fixed maturities and equities were as follows:
|
Amortized
Cost or
Cost
|
Gross
Unrealized
Gains
|
Gross
Unrealized
Losses
|
Fair
Value
|
Non-credit
OTTI
in AOCI
(5)
|
|||||||||||||||||
|
At December 31, 2014
|
|||||||||||||||||||||
|
Fixed maturities
|
|||||||||||||||||||||
|
U.S. government and agency
|
$
|
1,645,068
|
|
$
|
3,337
|
|
$
|
(28,328
|
)
|
$
|
1,620,077
|
|
$
|
—
|
|
||||||
|
Non-U.S. government
|
1,080,601
|
|
7,383
|
|
(54,441
|
)
|
1,033,543
|
|
—
|
|
|||||||||||
|
Corporate debt
|
4,386,432
|
|
40,972
|
|
(66,280
|
)
|
4,361,124
|
|
—
|
|
|||||||||||
|
Agency RMBS
(1)
|
2,241,581
|
|
40,762
|
|
(4,235
|
)
|
2,278,108
|
|
—
|
|
|||||||||||
|
CMBS
(2)
|
1,085,618
|
|
13,289
|
|
(2,019
|
)
|
1,096,888
|
|
—
|
|
|||||||||||
|
Non-Agency RMBS
|
71,236
|
|
2,765
|
|
(915
|
)
|
73,086
|
|
(889
|
)
|
|||||||||||
|
ABS
(3)
|
1,475,026
|
|
2,748
|
|
(16,188
|
)
|
1,461,586
|
|
—
|
|
|||||||||||
|
Municipals
(4)
|
200,411
|
|
5,282
|
|
(832
|
)
|
204,861
|
|
—
|
|
|||||||||||
|
Total fixed maturities
|
$
|
12,185,973
|
|
$
|
116,538
|
|
$
|
(173,238
|
)
|
$
|
12,129,273
|
|
$
|
(889
|
)
|
||||||
|
Equity securities
|
|||||||||||||||||||||
|
Common stocks
|
—
|
|
—
|
|
—
|
|
—
|
|
|||||||||||||
|
Exchange-traded funds
|
416,063
|
|
43,583
|
|
(4,756
|
)
|
454,890
|
|
|||||||||||||
|
Non-U.S. bond mutual funds
|
115,585
|
|
—
|
|
(2,768
|
)
|
112,817
|
|
|||||||||||||
|
Total equity securities
|
$
|
531,648
|
|
$
|
43,583
|
|
$
|
(7,524
|
)
|
$
|
567,707
|
|
|||||||||
|
At December 31, 2013
|
|||||||||||||||||||||
|
Fixed maturities
|
|||||||||||||||||||||
|
U.S. government and agency
|
$
|
1,421,245
|
|
$
|
1,405
|
|
$
|
(33,952
|
)
|
$
|
1,388,698
|
|
$
|
—
|
|
||||||
|
Non-U.S. government
|
1,208,384
|
|
17,990
|
|
(49,992
|
)
|
1,176,382
|
|
—
|
|
|||||||||||
|
Corporate debt
|
3,533,585
|
|
84,881
|
|
(10,228
|
)
|
3,608,238
|
|
—
|
|
|||||||||||
|
Agency RMBS
(1)
|
2,485,139
|
|
21,979
|
|
(58,291
|
)
|
2,448,827
|
|
—
|
|
|||||||||||
|
CMBS
(2)
|
790,095
|
|
11,285
|
|
(3,966
|
)
|
797,414
|
|
—
|
|
|||||||||||
|
Non-Agency RMBS
|
65,590
|
|
2,375
|
|
(398
|
)
|
67,567
|
|
(868
|
)
|
|||||||||||
|
ABS
(3)
|
955,274
|
|
6,871
|
|
(8,694
|
)
|
953,451
|
|
—
|
|
|||||||||||
|
Municipals
(4)
|
1,527,834
|
|
32,432
|
|
(14,516
|
)
|
1,545,750
|
|
—
|
|
|||||||||||
|
Total fixed maturities
|
$
|
11,987,146
|
|
$
|
179,218
|
|
$
|
(180,037
|
)
|
$
|
11,986,327
|
|
$
|
(868
|
)
|
||||||
|
Equity securities
|
|||||||||||||||||||||
|
Common stocks
|
345,759
|
|
98,742
|
|
(6,183
|
)
|
438,318
|
|
|||||||||||||
|
Exchange-traded funds
|
106,762
|
|
32,085
|
|
—
|
|
138,847
|
|
|||||||||||||
|
Non-U.S. bond mutual funds
|
113,698
|
|
11,124
|
|
—
|
|
124,822
|
|
|||||||||||||
|
Total equity securities
|
$
|
566,219
|
|
$
|
141,951
|
|
$
|
(6,183
|
)
|
$
|
701,987
|
|
|||||||||
|
(1)
|
Residential mortgage-backed securities (RMBS) originated by U.S. agencies.
|
|
(2)
|
Commercial mortgage-backed securities (CMBS).
|
|
(3)
|
Asset-backed securities (ABS) include debt tranched securities collateralized primarily by auto loans, student loans, credit cards, and other asset types. This asset class also includes collateralized loan obligations (CLOs) and collateralized debt obligations (CDOs).
|
|
(4)
|
Municipals include bonds issued by states, municipalities and political subdivisions.
|
|
(5)
|
Represents the non-credit component of the other-than-temporary impairment (OTTI) losses, adjusted for subsequent sales of securities. It does not include the change in fair value subsequent to the impairment measurement date.
|
132
AXIS CAPITAL HOLDINGS LIMITED
NOTES TO CONSOLIDATED FINANCIAL STATEMENTS
DECEMBER 31, 2014, 2013 AND 2012
|
5.
|
INVESTMENTS (CONTINUED)
|
In the normal course of investing activities, we actively manage allocations to non-controlling tranches of structured securities (variable interests) issued by VIEs. These structured securities include RMBS, CMBS and ABS and are included in the above table. Additionally, within our other investments portfolio, we also invest in limited partnerships (hedge funds) and CLO equity tranched securities, which are all variable interests issued by VIEs (see Note 5(b)). For these variable interests, we do not have the power to direct the activities that are most significant to the economic performance of the VIEs and accordingly we are not the primary beneficiary for any of these VIEs. Our maximum exposure to loss on these interests is limited to the amount of our investment. We have not provided financial or other support with respect to these structured securities other than our original investment.
Contractual Maturities
The contractual maturities of fixed maturities are shown below. Expected maturities may differ from contractual maturities because borrowers may have the right to call or prepay obligations with or without call or prepayment penalties.
|
Amortized
Cost
|
Fair
Value
|
% of Total
Fair Value
|
||||||||||
|
At December 31, 2014
|
||||||||||||
|
Maturity
|
||||||||||||
|
Due in one year or less
|
$
|
424,077
|
|
$
|
423,265
|
|
3.5
|
%
|
||||
|
Due after one year through five years
|
4,925,780
|
|
4,892,411
|
|
40.3
|
%
|
||||||
|
Due after five years through ten years
|
1,755,248
|
|
1,695,641
|
|
14.0
|
%
|
||||||
|
Due after ten years
|
207,407
|
|
208,288
|
|
1.7
|
%
|
||||||
|
|
7,312,512
|
|
7,219,605
|
|
59.5
|
%
|
||||||
|
Agency RMBS
|
2,241,581
|
|
2,278,108
|
|
18.8
|
%
|
||||||
|
CMBS
|
1,085,618
|
|
1,096,888
|
|
9.0
|
%
|
||||||
|
Non-Agency RMBS
|
71,236
|
|
73,086
|
|
0.6
|
%
|
||||||
|
ABS
|
1,475,026
|
|
1,461,586
|
|
12.1
|
%
|
||||||
|
Total
|
$
|
12,185,973
|
|
$
|
12,129,273
|
|
100.0
|
%
|
||||
|
At December 31, 2013
|
||||||||||||
|
Maturity
|
||||||||||||
|
Due in one year or less
|
$
|
710,079
|
|
$
|
717,052
|
|
5.9
|
%
|
||||
|
Due after one year through five years
|
5,030,728
|
|
5,116,060
|
|
42.7
|
%
|
||||||
|
Due after five years through ten years
|
1,852,877
|
|
1,791,835
|
|
14.9
|
%
|
||||||
|
Due after ten years
|
97,364
|
|
94,121
|
|
0.8
|
%
|
||||||
|
|
7,691,048
|
|
7,719,068
|
|
64.3
|
%
|
||||||
|
Agency RMBS
|
2,485,139
|
|
2,448,827
|
|
20.4
|
%
|
||||||
|
CMBS
|
790,095
|
|
797,414
|
|
6.7
|
%
|
||||||
|
Non-Agency RMBS
|
65,590
|
|
67,567
|
|
0.6
|
%
|
||||||
|
ABS
|
955,274
|
|
953,451
|
|
8.0
|
%
|
||||||
|
Total
|
$
|
11,987,146
|
|
$
|
11,986,327
|
|
100.0
|
%
|
||||
133
AXIS CAPITAL HOLDINGS LIMITED
NOTES TO CONSOLIDATED FINANCIAL STATEMENTS
DECEMBER 31, 2014, 2013 AND 2012
|
5.
|
INVESTMENTS (CONTINUED)
|
Gross Unrealized Losses
The following table summarizes fixed maturities and equities in an unrealized loss position and the aggregate fair value and gross unrealized loss by length of time the security has continuously been in an unrealized loss position:
|
|
12 months or greater
|
Less than 12 months
|
Total
|
||||||||||||||||||||||
|
|
Fair
Value
|
Unrealized
Losses
|
Fair
Value
|
Unrealized
Losses
|
Fair
Value
|
Unrealized
Losses
|
|||||||||||||||||||
|
At December 31, 2014
|
|||||||||||||||||||||||||
|
Fixed maturities
|
|||||||||||||||||||||||||
|
U.S. government and agency
|
$
|
388,551
|
|
$
|
(24,319
|
)
|
$
|
786,850
|
|
$
|
(4,009
|
)
|
$
|
1,175,401
|
|
$
|
(28,328
|
)
|
|||||||
|
Non-U.S. government
|
143,602
|
|
(29,171
|
)
|
435,670
|
|
(25,270
|
)
|
579,272
|
|
(54,441
|
)
|
|||||||||||||
|
Corporate debt
|
26,708
|
|
(2,221
|
)
|
2,199,672
|
|
(64,059
|
)
|
2,226,380
|
|
(66,280
|
)
|
|||||||||||||
|
Agency RMBS
|
259,914
|
|
(3,084
|
)
|
333,288
|
|
(1,151
|
)
|
593,202
|
|
(4,235
|
)
|
|||||||||||||
|
CMBS
|
68,624
|
|
(925
|
)
|
256,225
|
|
(1,094
|
)
|
324,849
|
|
(2,019
|
)
|
|||||||||||||
|
Non-Agency RMBS
|
6,689
|
|
(613
|
)
|
13,442
|
|
(302
|
)
|
20,131
|
|
(915
|
)
|
|||||||||||||
|
ABS
|
425,663
|
|
(10,325
|
)
|
750,679
|
|
(5,863
|
)
|
1,176,342
|
|
(16,188
|
)
|
|||||||||||||
|
Municipals
|
34,462
|
|
(644
|
)
|
25,284
|
|
(188
|
)
|
59,746
|
|
(832
|
)
|
|||||||||||||
|
Total fixed maturities
|
$
|
1,354,213
|
|
$
|
(71,302
|
)
|
$
|
4,801,110
|
|
$
|
(101,936
|
)
|
$
|
6,155,323
|
|
$
|
(173,238
|
)
|
|||||||
|
Equity securities
|
|||||||||||||||||||||||||
|
Common stocks
|
$
|
—
|
|
$
|
—
|
|
$
|
—
|
|
$
|
—
|
|
$
|
—
|
|
$
|
—
|
|
|||||||
|
Exchange-traded funds
|
—
|
|
—
|
|
91,275
|
|
(4,756
|
)
|
91,275
|
|
(4,756
|
)
|
|||||||||||||
|
Non-U.S. bond mutual funds
|
—
|
|
—
|
|
112,817
|
|
(2,768
|
)
|
112,817
|
|
(2,768
|
)
|
|||||||||||||
|
Total equity securities
|
$
|
—
|
|
$
|
—
|
|
$
|
204,092
|
|
$
|
(7,524
|
)
|
$
|
204,092
|
|
$
|
(7,524
|
)
|
|||||||
|
At December 31, 2013
|
|||||||||||||||||||||||||
|
Fixed maturities
|
|||||||||||||||||||||||||
|
U.S. government and agency
|
$
|
—
|
|
$
|
—
|
|
$
|
982,307
|
|
$
|
(33,952
|
)
|
$
|
982,307
|
|
$
|
(33,952
|
)
|
|||||||
|
Non-U.S. government
|
35,577
|
|
(3,430
|
)
|
420,622
|
|
(46,562
|
)
|
456,199
|
|
(49,992
|
)
|
|||||||||||||
|
Corporate debt
|
27,696
|
|
(802
|
)
|
606,592
|
|
(9,426
|
)
|
634,288
|
|
(10,228
|
)
|
|||||||||||||
|
Agency RMBS
|
144,468
|
|
(5,247
|
)
|
1,478,527
|
|
(53,044
|
)
|
1,622,995
|
|
(58,291
|
)
|
|||||||||||||
|
CMBS
|
13,319
|
|
(116
|
)
|
298,863
|
|
(3,850
|
)
|
312,182
|
|
(3,966
|
)
|
|||||||||||||
|
Non-Agency RMBS
|
4,287
|
|
(315
|
)
|
5,319
|
|
(83
|
)
|
9,606
|
|
(398
|
)
|
|||||||||||||
|
ABS
|
37,765
|
|
(2,941
|
)
|
553,803
|
|
(5,753
|
)
|
591,568
|
|
(8,694
|
)
|
|||||||||||||
|
Municipals
|
8,408
|
|
(615
|
)
|
543,474
|
|
(13,901
|
)
|
551,882
|
|
(14,516
|
)
|
|||||||||||||
|
Total fixed maturities
|
$
|
271,520
|
|
$
|
(13,466
|
)
|
$
|
4,889,507
|
|
$
|
(166,571
|
)
|
$
|
5,161,027
|
|
$
|
(180,037
|
)
|
|||||||
|
Equity securities
|
|||||||||||||||||||||||||
|
Common stocks
|
$
|
3,499
|
|
$
|
(398
|
)
|
$
|
48,828
|
|
$
|
(5,785
|
)
|
$
|
52,327
|
|
$
|
(6,183
|
)
|
|||||||
|
Exchange-traded funds
|
—
|
|
—
|
|
—
|
|
—
|
|
—
|
|
—
|
|
|||||||||||||
|
Non-U.S. bond mutual funds
|
—
|
|
—
|
|
—
|
|
—
|
|
—
|
|
—
|
|
|||||||||||||
|
Total equity securities
|
$
|
3,499
|
|
$
|
(398
|
)
|
$
|
48,828
|
|
$
|
(5,785
|
)
|
$
|
52,327
|
|
$
|
(6,183
|
)
|
|||||||
134
AXIS CAPITAL HOLDINGS LIMITED
NOTES TO CONSOLIDATED FINANCIAL STATEMENTS
DECEMBER 31, 2014, 2013 AND 2012
|
5.
|
INVESTMENTS (CONTINUED)
|
Fixed Maturities
At
December 31, 2014
,
1,388
fixed maturities (
2013
:
1,127
) were in an unrealized loss position of
$173 million
(
2013
:
$180 million
) of which
$36 million
(
2013
:
$2 million
) was related to securities below investment grade or not rated.
At
December 31, 2014
,
223
securities (
2013
:
99
) had been in a continuous unrealized loss position for 12 months or greater and had a fair value of
$1,354 million
(
2013
:
$272 million
). Following our credit impairment review, we concluded that these securities as well as the remaining securities in an unrealized loss position in the above table were temporarily depressed at
December 31, 2014
, and were expected to recover in value as the securities approach maturity. Further, at
December 31, 2014
, we did not intend to sell these securities in an unrealized loss position and it is more likely than not that we will not be required to sell these securities before the anticipated recovery of their amortized costs.
Equity Securities
At
December 31, 2014
,
9
securities (
2013
:
63
) were in an unrealized loss position of
$8 million
(
2013
:
$6 million
).
At
December 31, 2014
, there were no securities that had been in a continuous unrealized loss position for 12 months or greater (
2013
:
9
securities with a fair value of
$3 million
). Based on our impairment review process and our ability and intent to hold these securities for a reasonable period of time sufficient for a full recovery, we concluded that the above equities in an unrealized loss position were temporarily impaired at
December 31, 2014
and
2013
.
|
b)
|
Other Investments
|
The following tables provide a breakdown of our investments in hedge funds, direct lending funds and CLO Equities, together with additional information relating to the liquidity of each category:
|
|
Fair Value
|
Redemption Frequency
(if currently eligible)
|
Redemption
Notice Period
|
|||||||||
|
At December 31, 2014
|
||||||||||||
|
Long/short equity funds
|
$
|
298,907
|
|
31
|
%
|
Quarterly, Semi-annually
|
30-60 days
|
|||||
|
Multi-strategy funds
|
324,020
|
|
34
|
%
|
Quarterly, Semi-annually
|
60-95 days
|
||||||
|
Event-driven funds
|
185,899
|
|
19
|
%
|
Quarterly, Annually
|
45-60 days
|
||||||
|
Leveraged bank loan funds
|
9,713
|
|
1
|
%
|
Quarterly
|
65 days
|
||||||
|
Direct lending funds
|
54,438
|
|
6
|
%
|
n/a
|
n/a
|
||||||
|
CLO - Equities
|
92,488
|
|
9
|
%
|
n/a
|
n/a
|
||||||
|
Total other investments
|
$
|
965,465
|
|
100
|
%
|
|||||||
|
At December 31, 2013
|
||||||||||||
|
Long/short equity funds
|
$
|
425,444
|
|
41
|
%
|
Monthly, Quarterly, Semi-annually
|
30-60 days
|
|||||
|
Multi-strategy funds
|
285,155
|
|
27
|
%
|
Quarterly, Semi-annually
|
60-95 days
|
||||||
|
Event-driven funds
|
190,458
|
|
18
|
%
|
Quarterly, Annually
|
45-60 days
|
||||||
|
Leveraged bank loan funds
|
48,753
|
|
5
|
%
|
Quarterly
|
65 days
|
||||||
|
Direct lending funds
|
22,134
|
|
2
|
%
|
n/a
|
n/a
|
||||||
|
CLO - Equities
|
73,866
|
|
7
|
%
|
n/a
|
n/a
|
||||||
|
Total other investments
|
$
|
1,045,810
|
|
100
|
%
|
|||||||
n/a – not applicable
135
AXIS CAPITAL HOLDINGS LIMITED
NOTES TO CONSOLIDATED FINANCIAL STATEMENTS
DECEMBER 31, 2014, 2013 AND 2012
|
5.
|
INVESTMENTS (CONTINUED)
|
The investment strategies for the above funds are as follows:
|
•
|
Long/short equity funds
: Seek to achieve attractive returns primarily by executing an equity trading strategy involving both long and short investments in publicly-traded equities.
|
|
•
|
Multi-strategy funds
: Seek to achieve above-market returns by pursuing multiple investment strategies to diversify risks and reduce volatility. This category includes funds of hedge funds which invest in a large pool of hedge funds across a diversified range of hedge fund strategies.
|
|
•
|
Event-driven funds
: Seek to achieve attractive returns by exploiting situations where announced or anticipated events create opportunities.
|
|
•
|
Leveraged bank loan funds
: Seek to achieve attractive returns by investing primarily in bank loan collateral that has limited interest rate risk exposure.
|
|
•
|
Direct lending funds
: Seek to achieve attractive risk-adjusted returns, including current income generation, by investing in funds which provide financing directly to borrowers.
|
Two common redemption restrictions which may impact our ability to redeem our hedge funds are gates and lockups. A gate is a suspension of redemptions which may be implemented by the general partner or investment manager of the fund in order to defer, in whole or in part, the redemption request in the event the aggregate amount of redemption requests exceeds a predetermined percentage of the fund’s net assets which may otherwise hinder the general partner or investment manager’s ability to liquidate holdings in an orderly fashion in order to generate the cash necessary to fund extraordinarily large redemption payouts. A lockup period is the initial amount of time an investor is contractually required to hold the security before having the ability to redeem. During
2014
and
2013
, neither of these restrictions impacted our redemption requests. At
December 31, 2014
,
$87 million
(
2013
:
$99 million
), representing
11%
(
2013
:
10%
) of our total hedge funds, relate to holdings where we are still within the lockup period. The expiry of these lockup periods range from March, 2015 to March, 2016.
At
December 31, 2014
,
$6 million
(
2013
:
$11 million
) was invested in hedge funds that are not accepting redemption requests. Of this amount, substantially all relates to a leveraged bank loan fund in a period of planned principal distributions. Based on market conditions and payments made to date, management's current expectation is that the distribution process will be completed in 2015.
At
December 31, 2014
, we have
$88 million
(
2013
:
$88 million
) of unfunded commitments within our other investments portfolio relating to our future investments in direct lending funds. Once the full amount of committed capital has been called by the General Partner of each of these funds, the assets will not be fully returned until the completion of the fund's investment term. These funds have investment terms ranging from
5
-
10
years and the General Partners of certain funds have the option to extend the term by up to
three
years.
During 2013, we made a
$60 million
commitment as a limited partner in a multi-strategy hedge fund. Once the full amount of committed capital has been called by the General Partner, the assets will not be fully returned until the completion of the fund's investment term which ends in December, 2018. The General Partner then has the option to extend the term by up to
three
years. At
December 31, 2014
,
$35 million
of our commitment remains unfunded and the current fair value of the funds called to date are included in the multi-strategy funds line of the table above.
136
AXIS CAPITAL HOLDINGS LIMITED
NOTES TO CONSOLIDATED FINANCIAL STATEMENTS
DECEMBER 31, 2014, 2013 AND 2012
|
5.
|
INVESTMENTS (CONTINUED)
|
|
c)
|
Net Investment Income
|
Net investment income was derived from the following sources:
|
Year ended December 31,
|
2014
|
2013
|
2012
|
||||||||||
|
Fixed maturities
|
$
|
296,663
|
|
$
|
293,609
|
|
$
|
304,400
|
|
||||
|
Other investments
|
57,621
|
|
128,814
|
|
87,660
|
|
|||||||
|
Equity securities
|
11,832
|
|
10,897
|
|
11,904
|
|
|||||||
|
Cash and cash equivalents
|
11,536
|
|
6,337
|
|
4,528
|
|
|||||||
|
Short-term investments
|
725
|
|
1,181
|
|
596
|
|
|||||||
|
Gross investment income
|
378,377
|
|
440,838
|
|
409,088
|
|
|||||||
|
Investment expenses
|
(35,611
|
)
|
(31,526
|
)
|
(28,131
|
)
|
|||||||
|
Net investment income
|
$
|
342,766
|
|
$
|
409,312
|
|
$
|
380,957
|
|
||||
|
d)
|
Net Realized Investment Gains
|
The following table provides an analysis of net realized investment gains:
|
Year ended December 31,
|
2014
|
2013
|
2012
|
||||||||||
|
Gross realized gains
|
|||||||||||||
|
Fixed maturities and short-term investments
(1)
|
$
|
126,023
|
|
$
|
120,932
|
|
$
|
242,082
|
|
||||
|
Equities
|
149,783
|
|
54,564
|
|
36,411
|
|
|||||||
|
Gross realized gains
|
275,806
|
|
175,496
|
|
278,493
|
|
|||||||
|
Gross realized losses
|
|||||||||||||
|
Fixed maturities and short-term investments
|
(86,943
|
)
|
(87,894
|
)
|
(101,844
|
)
|
|||||||
|
Equities
|
(15,925
|
)
|
(10,407
|
)
|
(23,530
|
)
|
|||||||
|
Gross realized losses
|
(102,868
|
)
|
(98,301
|
)
|
(125,374
|
)
|
|||||||
|
Net OTTI recognized in earnings
|
(31,227
|
)
|
(9,362
|
)
|
(24,234
|
)
|
|||||||
|
Change in fair value of investment derivatives
(2)
|
(9,603
|
)
|
7,731
|
|
(9,170
|
)
|
|||||||
|
Fair value hedges
(2)
|
—
|
|
—
|
|
7,754
|
|
|||||||
|
Net realized investment gains
|
$
|
132,108
|
|
$
|
75,564
|
|
$
|
127,469
|
|
||||
|
(1)
|
Includes
$37 million
of gains in 2012 relating to previously unrealized foreign exchange currency amounts on the hedged fixed maturity portfolios. The hedged portfolio was sold and all associated foreign exchange contracts were fully settled during 2012 so there is no impact on the 2013 or 2014 figures.
|
|
(2)
|
Refer to Note 7 – Derivative Instruments
|
137
AXIS CAPITAL HOLDINGS LIMITED
NOTES TO CONSOLIDATED FINANCIAL STATEMENTS
DECEMBER 31, 2014, 2013 AND 2012
|
5.
|
INVESTMENTS (CONTINUED)
|
The following table summarizes the OTTI recognized in earnings by asset class:
|
Year ended December 31,
|
2014
|
2013
|
2012
|
||||||||||
|
Fixed maturities:
|
|||||||||||||
|
Non-U.S. government
|
$
|
17,291
|
|
$
|
120
|
|
$
|
3,281
|
|
||||
|
Corporate debt
|
8,107
|
|
5,802
|
|
1,821
|
|
|||||||
|
Non-Agency RMBS
|
7
|
|
57
|
|
2,016
|
|
|||||||
|
ABS
|
61
|
|
129
|
|
795
|
|
|||||||
|
Municipals
|
418
|
|
639
|
|
—
|
|
|||||||
|
|
25,884
|
|
6,747
|
|
7,913
|
|
|||||||
|
Equity Securities
|
|||||||||||||
|
Common stocks
|
741
|
|
2,092
|
|
7,318
|
|
|||||||
|
Exchange-traded funds
|
4,602
|
|
523
|
|
9,003
|
|
|||||||
|
5,343
|
|
2,615
|
|
16,321
|
|
||||||||
|
Total OTTI recognized in earnings
|
$
|
31,227
|
|
$
|
9,362
|
|
$
|
24,234
|
|
||||
Fixed Maturities
The following table provides a roll forward of the credit losses (“credit loss table”), before income taxes, for which a portion of the OTTI was recognized in AOCI:
|
Year ended December 31,
|
2014
|
2013
|
|||||||
|
Balance at beginning of period
|
$
|
1,594
|
|
$
|
1,809
|
|
|||
|
Credit impairments recognized on securities not previously impaired
|
—
|
|
—
|
|
|||||
|
Additional credit impairments recognized on securities previously impaired
|
—
|
|
—
|
|
|||||
|
Change in timing of future cash flows on securities previously impaired
|
—
|
|
—
|
|
|||||
|
Intent to sell of securities previously impaired
|
—
|
|
—
|
|
|||||
|
Securities sold/redeemed/matured
|
(63
|
)
|
(215
|
)
|
|||||
|
Balance at end of period
|
$
|
1,531
|
|
$
|
1,594
|
|
|||
Credit losses are calculated based on the difference between the amortized cost of the security and the net present value of its projected future cash flows discounted at the effective interest rate implicit in the debt security prior to the impairment. The following provides a summary of the credit loss activities by asset class for the above table as well as the significant inputs and the methodology used to estimate these credit losses.
U.S. Government, U.S. Agency and U.S. Agency RMBS:
Unrealized losses on securities issued or backed (either explicitly or implicitly) by the U.S. government are generally not analyzed for OTTI. We have concluded that the possibility of any credit losses on these securities is highly unlikely due to the explicit U.S. government guarantee on certain securities (e.g. GNMA issuances) and, on others, the implicit guarantee that has been validated by past actions (e.g. U.S. government bailout of FNMA and FHLMC during the 2008 credit crisis). Although not generally analyzed for credit losses, the securities are still evaluated for intention to sell at a loss.
138
AXIS CAPITAL HOLDINGS LIMITED
NOTES TO CONSOLIDATED FINANCIAL STATEMENTS
DECEMBER 31, 2014, 2013 AND 2012
|
5.
|
INVESTMENTS (CONTINUED)
|
Non-U.S. Government:
Non-U.S. government obligations are evaluated for credit loss primarily through qualitative assessments of the likelihood of credit loss using information such as duration and severity of unrealized losses, as well as credit ratings and price volatility. At
December 31, 2014
, our holdings in sovereign debt, including
$119 million
(
2013
:
$161 million
) relating to the eurozone countries, were substantially all investment-grade securities. The gross unrealized losses of
$54 million
at
December 31, 2014
were mainly due to pricing and foreign exchange losses on emerging market debt. Based on our analysis, we do not anticipate any credit losses on our non-U.S. government fixed maturities at
December 31, 2014
. In 2014, the OTTI charges on Non-U.S. government fixed maturities mainly related to unrealized foreign exchange losses on certain securities where forecasted recovery was uncertain.
Corporate Debt:
To estimate credit losses for corporate debt securities, our projected cash flows are primarily driven by our assumptions regarding the probability of default and the severity associated with those defaults. Our default and loss severity rates are based on credit rating, credit analysis, industry analyst reports and forecasts, Moody’s historical default data and any other data relevant to the recoverability of the security. In
2014
, the OTTI charges on corporate debt securities were mainly related to our intent to sell, as well as unrealized foreign exchange losses on certain securities where forecasted recovery was uncertain.
CMBS:
Our investments in CMBS are diversified and highly rated, with a weighted average estimated subordination percentage of
30%
at
December 31, 2014
(
2013
:
30%
). Based on discounted cash flows at
December 31, 2014
, the current level of subordination is sufficient to cover the estimated loan losses on the underlying collateral of the CMBS.
Non-agency RMBS:
For non-agency RMBS, our projected cash flows incorporated underlying data from widely accepted third-party data sources along with certain internal assumptions and judgments regarding the future performance of the security. These assumptions included the following: default, delinquency, loss severity and prepayment rates. The assumptions used to calculate the credit losses in
2014
have not changed significantly since
December 31, 2013
. At
December 31, 2014
, the fair value of our non-agency RMBS was
$73 million
(
2013
:
$68 million
), consisting primarily of
$49 million
(
2013
:
$41 million
) of Prime and
$17 million
(
2013
:
$19 million
) of Alt-A MBS. We have concluded there are no credit losses anticipated for any of our non-agency RMBS at
December 31, 2014
, other than those already recorded.
ABS:
Our investments in ABS at
December 31, 2014
consist mainly of CLO debt tranched securities (“CLO Debt”) purchased primarily as new issues during 2012-2014. Of these new issues all had credit ratings of AA- or better. We utilize a scenario-based approach to reviewing our CLO Debt portfolio based on the current asset market price. We also review subordination levels of our securities to determine their ability to absorb credit losses of underlying collateral. If losses are forecast to be below the subordination level for the tranche held by us, the security is determined not to be impaired. We have concluded there are no credit losses anticipated for any of our CLO Debt at
December 31, 2014
.
Equity Securities
The OTTI losses on common stocks in
2014
and
2013
are primarily due to the severity and duration of their unrealized loss positions, for which we concluded the forecast recovery period was uncertain. The recognition of such losses does not necessarily indicate that sales will occur or that sales are imminent or planned. At
December 31, 2014
, the fair value of our equities was
$568 million
(
2013
:
$702 million
), which included
$8 million
(
2013
:
$6 million
) of gross unrealized losses.
139
AXIS CAPITAL HOLDINGS LIMITED
NOTES TO CONSOLIDATED FINANCIAL STATEMENTS
DECEMBER 31, 2014, 2013 AND 2012
|
5.
|
INVESTMENTS (CONTINUED)
|
|
e)
|
Restricted Investments
|
In order to support our obligations in regulatory jurisdictions where we operate as a non-admitted carrier, we provide collateral in the form of assets held in trust and, to a lesser extent, letters of credit. Refer to Note 10(b) for further information on our collateral requirements upon issuance of certain letters of credit. The fair value of our restricted investments primarily relates to these items, as noted in the table below. Our restricted investments primarily consist of high-quality fixed maturity and short-term investment securities.
|
At December 31,
|
2014
|
2013
|
||||||||
|
Collateral in Trust for inter-company agreements
|
$
|
2,792,461
|
|
$
|
2,261,081
|
|
||||
|
Collateral for secured letter of credit facility
|
468,923
|
|
777,828
|
|
||||||
|
Collateral in Trust for third party agreements
(1)
|
567,060
|
|
276,839
|
|
||||||
|
Securities on deposit with regulatory authorities
|
58,476
|
|
58,327
|
|
||||||
|
Total restricted investments
|
$
|
3,886,920
|
|
$
|
3,374,075
|
|
||||
|
(1)
|
Includes
$245 million
of fixed income securities deposited directly with Lloyd's to support the underwriting capacity of the Company's Lloyd's Syndicate, AXIS Syndicate 1686.
|
|
f)
|
Reverse Repurchase Agreements
|
At
December 31, 2014
, we held
$110 million
(
2013
:
$34 million
) of reverse repurchase agreements. These loans are fully collateralized, are generally outstanding for a short period of time and are presented on a gross basis as part of cash and cash equivalents on our consolidated balance sheet. The required collateral for these loans is either cash or U.S. Treasuries at a minimum rate of
102%
of the loan principal. Upon maturity, we receive principal and interest income.
|
6.
|
FAIR VALUE MEASUREMENTS
|
Fair Value Hierarchy
Fair value is defined as the price to sell an asset or transfer a liability (i.e. the “exit price”) in an orderly transaction between market participants. We use a fair value hierarchy that gives the highest priority to quoted prices in active markets and the lowest priority to unobservable data. The hierarchy is broken down into three levels as follows:
|
•
|
Level 1 - Valuations based on unadjusted quoted prices in active markets for identical assets or liabilities that we have the ability to access.
|
|
•
|
Level 2 - Valuations based on quoted prices in active markets for similar assets or liabilities, quoted prices for identical assets or liabilities in inactive markets, or for which significant inputs are observable (e.g. interest rates, yield curves, prepayment speeds, default rates, loss severities, etc.) or can be corroborated by observable market data.
|
|
•
|
Level 3 - Valuations based on inputs that are unobservable and significant to the overall fair value measurement. The unobservable inputs reflect our own judgments about assumptions that market participants might use.
|
The availability of observable inputs can vary from financial instrument to financial instrument and is affected by a wide variety of factors including, for example, the type of financial instrument, whether the financial instrument is new and not yet established in the marketplace, and other characteristics particular to the transaction. To the extent that valuation is based on models or inputs that are less observable or unobservable in the market, the determination of fair value requires significantly more judgment.
140
AXIS CAPITAL HOLDINGS LIMITED
NOTES TO CONSOLIDATED FINANCIAL STATEMENTS
DECEMBER 31, 2014, 2013 AND 2012
|
6.
|
FAIR VALUE MEASUREMENTS (CONTINUED)
|
Accordingly, the degree of judgment exercised by management in determining fair value is greatest for instruments categorized in Level 3. In periods of market dislocation, the observability of prices and inputs may be reduced for many instruments. This may lead us to change the selection of our valuation technique (from market to cash flow approach) or may cause us to use multiple valuation techniques to estimate the fair value of a financial instrument. This circumstance could cause an instrument to be reclassified between levels within the fair value hierarchy.
We used the following valuation techniques and assumptions in estimating the fair value of our financial instruments as well as the general classification of such financial instruments pursuant to the above fair value hierarchy.
Fixed Maturities
At each valuation date, we use the market approach valuation technique to estimate the fair value of our fixed maturities portfolio, when possible. This market approach includes, but is not limited to, prices obtained from third party pricing services for identical or comparable securities and the use of “pricing matrix models” using observable market inputs such as yield curves, credit risks and spreads, measures of volatility, and prepayment speeds. Pricing from third party pricing services is sourced from multiple vendors, when available, and we maintain a vendor hierarchy by asset type based on historical pricing experience and vendor expertise. When prices are unavailable from pricing services, we obtain non-binding quotes from broker-dealers who are active in the corresponding markets.
The following describes the significant inputs generally used to determine the fair value of our fixed maturities by asset class.
U.S. government and agency
U.S. government and agency securities consist primarily of bonds issued by the U.S. Treasury and mortgage pass-through agencies such as the Federal National Mortgage Association, the Federal Home Loan Mortgage Corporation and the Government National Mortgage Association. As the fair values of our U.S. Treasury securities are based on unadjusted market prices in active markets, they are classified within Level 1. The fair values of U.S. government agency securities are priced using the spread above the risk-free yield curve. As the yields for the risk-free yield curve and the spreads for these securities are observable market inputs, the fair values of U.S. government agency securities are classified within Level 2.
Non-U.S. government
Non-U.S. government securities comprise bonds issued by non-U.S. governments and their agencies along with supranational organizations (collectively also known as sovereign debt securities). The fair value of these securities is based on prices obtained from international indices or a valuation model that includes the following inputs: interest rate yield curves, cross-currency basis index spreads, and country credit spreads for structures similar to the sovereign bond in terms of issuer, maturity and seniority. As the significant inputs are observable market inputs, the fair value of non-U.S. government securities are classified within Level 2.
Corporate debt
Corporate debt securities consist primarily of investment-grade debt of a wide variety of corporate issuers and industries. The fair values of these securities are generally determined using the spread above the risk-free yield curve. These spreads are generally obtained from the new issue market, secondary trading and broker-dealer quotes. As these spreads and the yields for the risk-free yield curve are observable market inputs, the fair values of our corporate debt securities are classified within Level 2. Where pricing is unavailable from pricing services, we obtain non-binding quotes from broker-dealers to estimate fair value. This is generally the case when there is a low volume of trading activity and current transactions are not orderly. In this event, securities are classified within Level 3.
141
AXIS CAPITAL HOLDINGS LIMITED
NOTES TO CONSOLIDATED FINANCIAL STATEMENTS
DECEMBER 31, 2014, 2013 AND 2012
|
6.
|
FAIR VALUE MEASUREMENTS (CONTINUED)
|
MBS
Our portfolio of RMBS and CMBS are originated by both agencies and non-agencies. The fair values of these securities are determined through the use of a pricing model (including Option Adjusted Spread) which uses prepayment speeds and spreads to determine the appropriate average life of the MBS. These spreads are generally obtained from the new issue market, secondary trading and broker-dealer quotes. As the significant inputs used to price MBS are observable market inputs, the fair values of the MBS are classified within Level 2. Where pricing is unavailable from pricing services, we obtain non-binding quotes from broker-dealers to estimate fair value. This is generally the case when there is a low volume of trading activity and current transactions are not orderly. These securities are classified within Level 3.
ABS
ABS include mostly investment-grade bonds backed by pools of loans with a variety of underlying collateral, including automobile loan receivables, student loans, credit card receivables, and CLO Debt originated by a variety of financial institutions. Similarly to MBS, the fair values of ABS are priced through the use of a model which uses prepayment speeds and spreads sourced primarily from the new issue market. As the significant inputs used to price ABS are observable market inputs, the fair values of ABS are classified within Level 2. Where pricing is unavailable from pricing services, we obtain non-binding quotes from broker-dealers.
Municipals
Our municipal portfolio comprises revenue and general obligation bonds issued by U.S. domiciled state and municipal entities. The fair value of these securities is determined using spreads obtained from broker-dealers, trade prices and the new issue market. As the significant inputs used to price the municipals are observable market inputs, municipals are classified within Level 2.
Equity Securities
Equity securities include U.S. and non-U.S. common stocks, exchange-traded funds, and non-U.S. bond mutual funds. For common stocks and exchange-traded funds, we classified these within Level 1 as their fair values are based on unadjusted quoted market prices in active markets. Our investments in non-U.S. bond mutual funds have daily liquidity, with redemption based on the net asset value (''NAV'') of the funds. Accordingly, we have classified these investments as Level 2.
Other Investments
As a practical expedient, we estimate fair values for hedge funds, direct lending funds and the CLO fund using NAVs as advised by external fund managers or third party administrators. For each of these funds, the NAV is based on the manager's or administrator's valuation of the underlying holdings in accordance with the fund's governing documents and in accordance with U.S. GAAP. For any funds for which we have not yet received a NAV concurrent with our period end date, we record an estimate of the change in fair value for the period subsequent to the most recent NAV. Such estimates are based on return estimates for the period between the most recently issued NAV and the period end date; these estimates are obtained from the relevant fund managers. Accordingly, we do not typically have a reporting lag in our fair value measurements for these funds. Historically, our valuation estimates incorporating these return estimates have not significantly diverged from the subsequent NAVs.
Within the hedge fund, direct lending fund and CLO fund industries, there is a general lack of transparency necessary to facilitate a detailed independent assessment of the values placed on the securities underlying the NAV provided by the fund manager or fund administrator. To address this, on a quarterly basis, we perform a number of monitoring procedures designed to assist us in the assessment of the quality of the information provided by managers and administrators. These procedures include, but are not limited to, regular review and discussion of each fund's performance with its manager, regular
142
AXIS CAPITAL HOLDINGS LIMITED
NOTES TO CONSOLIDATED FINANCIAL STATEMENTS
DECEMBER 31, 2014, 2013 AND 2012
|
6.
|
FAIR VALUE MEASUREMENTS (CONTINUED)
|
evaluation of fund performance against applicable benchmarks and the backtesting of our fair value estimates against subsequently received NAVs. Backtesting involves comparing our previously reported values for each individual fund against NAVs per audited financial statements (for year-end values) and final NAVs from fund managers and fund administrators (for interim values).
For our hedge fund investments with liquidity terms allowing us to fully redeem our holdings at the applicable NAV in the near term, we have classified these investments as Level 2. Certain investments in hedge funds, all of our direct lending funds and our CLO fund have redemption restrictions (see Note 5(b) for further details) that prevent us from redeeming in the near term and therefore we have classified these investments as Level 3.
At
December 31, 2014
, our direct investments in CLO - Equities were classified within Level 3 as we estimated the fair value for these securities using an income approach valuation technique (discounted cash flow model) due to the lack of observable and relevant trades in the secondary markets.
Short-Term Investments
Short-term investments primarily comprise highly liquid securities with maturities greater than three months but less than one year from the date of purchase. These securities are classified within Level 2 because these securities are typically not actively traded due to their approaching maturity and, as such, their amortized cost approximates fair value.
Derivative Instruments
Our foreign currency forward contracts and interest rate swaps are customized to our economic hedging strategies and trade in the over-the-counter derivative market. We use the market approach valuation technique to estimate the fair value for these derivatives based on significant observable market inputs from third party pricing vendors, non-binding broker-dealer quotes and/or recent trading activity. Accordingly, we classified these derivatives within Level 2.
We also participate in non-exchange traded derivative-based risk management products addressing weather risks. We use observable market inputs and unobservable inputs in combination with industry or internally-developed valuation and forecasting techniques to determine fair value. We classify these instruments within Level 3.
Cash Settled Awards
Cash settled awards comprise restricted stock units that form part of our compensation program. Although the fair value of these awards is determined using observable quoted market prices in active markets, the stock units themselves are not actively traded. Accordingly, we have classified these liabilities within Level 2.
143
AXIS CAPITAL HOLDINGS LIMITED
NOTES TO CONSOLIDATED FINANCIAL STATEMENTS
DECEMBER 31, 2014, 2013 AND 2012
|
6.
|
FAIR VALUE MEASUREMENTS (CONTINUED)
|
The table below presents the financial instruments measured at fair value on a recurring basis:
|
Quoted Prices in
Active Markets for
Identical Assets
(Level 1)
|
Significant
Other Observable
Inputs
(Level 2)
|
Significant
Unobservable
Inputs
(Level 3)
|
Total Fair
Value
|
||||||||||||||
|
At December 31, 2014
|
|||||||||||||||||
|
Assets
|
|||||||||||||||||
|
Fixed maturities
|
|||||||||||||||||
|
U.S. government and agency
|
$
|
1,497,922
|
|
$
|
122,155
|
|
$
|
—
|
|
$
|
1,620,077
|
|
|||||
|
Non-U.S. government
|
—
|
|
1,033,543
|
|
—
|
|
1,033,543
|
|
|||||||||
|
Corporate debt
|
—
|
|
4,345,287
|
|
15,837
|
|
4,361,124
|
|
|||||||||
|
Agency RMBS
|
—
|
|
2,278,108
|
|
—
|
|
2,278,108
|
|
|||||||||
|
CMBS
|
—
|
|
1,079,125
|
|
17,763
|
|
1,096,888
|
|
|||||||||
|
Non-Agency RMBS
|
—
|
|
73,086
|
|
—
|
|
73,086
|
|
|||||||||
|
ABS
|
—
|
|
1,421,555
|
|
40,031
|
|
1,461,586
|
|
|||||||||
|
Municipals
|
—
|
|
204,861
|
|
—
|
|
204,861
|
|
|||||||||
|
|
1,497,922
|
|
10,557,720
|
|
73,631
|
|
12,129,273
|
|
|||||||||
|
Equity securities
|
|||||||||||||||||
|
Common stocks
|
—
|
|
—
|
|
—
|
|
—
|
|
|||||||||
|
Exchange-traded funds
|
454,890
|
|
—
|
|
—
|
|
454,890
|
|
|||||||||
|
Non-U.S. bond mutual funds
|
—
|
|
112,817
|
|
—
|
|
112,817
|
|
|||||||||
|
|
454,890
|
|
112,817
|
|
—
|
|
567,707
|
|
|||||||||
|
Other investments
|
|||||||||||||||||
|
Hedge funds
|
—
|
|
347,621
|
|
470,918
|
|
818,539
|
|
|||||||||
|
Direct lending funds
|
—
|
|
—
|
|
54,438
|
|
54,438
|
|
|||||||||
|
CLO-Equities
|
—
|
|
—
|
|
92,488
|
|
92,488
|
|
|||||||||
|
—
|
|
347,621
|
|
617,844
|
|
965,465
|
|
||||||||||
|
Short-term investments
|
—
|
|
107,534
|
|
—
|
|
107,534
|
|
|||||||||
|
Derivative instruments (see Note 7)
|
—
|
|
7,153
|
|
111
|
|
7,264
|
|
|||||||||
|
Total Assets
|
$
|
1,952,812
|
|
$
|
11,132,845
|
|
$
|
691,586
|
|
$
|
13,777,243
|
|
|||||
|
Liabilities
|
|||||||||||||||||
|
Derivative instruments (see Note 7)
|
$
|
—
|
|
$
|
3,041
|
|
$
|
15,288
|
|
$
|
18,329
|
|
|||||
|
Cash settled awards (see Note 16)
|
—
|
|
20,518
|
|
—
|
|
20,518
|
|
|||||||||
|
Total Liabilities
|
$
|
—
|
|
$
|
23,559
|
|
$
|
15,288
|
|
$
|
38,847
|
|
|||||
|
At December 31, 2013
|
|||||||||||||||||
|
Assets
|
|||||||||||||||||
|
Fixed maturities
|
|||||||||||||||||
|
U.S. government and agency
|
$
|
1,119,632
|
|
$
|
269,066
|
|
$
|
—
|
|
$
|
1,388,698
|
|
|||||
|
Non-U.S. government
|
—
|
|
1,176,382
|
|
—
|
|
1,176,382
|
|
|||||||||
|
Corporate debt
|
—
|
|
3,608,238
|
|
—
|
|
3,608,238
|
|
|||||||||
|
Agency RMBS
|
—
|
|
2,448,827
|
|
—
|
|
2,448,827
|
|
|||||||||
|
CMBS
|
—
|
|
793,396
|
|
4,018
|
|
797,414
|
|
|||||||||
|
Non-Agency RMBS
|
—
|
|
67,567
|
|
—
|
|
67,567
|
|
|||||||||
|
ABS
|
—
|
|
922,652
|
|
30,799
|
|
953,451
|
|
|||||||||
|
Municipals
|
—
|
|
1,545,750
|
|
—
|
|
1,545,750
|
|
|||||||||
|
|
1,119,632
|
|
10,831,878
|
|
34,817
|
|
11,986,327
|
|
|||||||||
|
Equity securities
|
|||||||||||||||||
|
Common stocks
|
438,318
|
|
—
|
|
—
|
|
438,318
|
|
|||||||||
|
Exchange-traded funds
|
138,847
|
|
—
|
|
—
|
|
138,847
|
|
|||||||||
|
Non-U.S. bond mutual funds
|
—
|
|
124,822
|
|
—
|
|
124,822
|
|
|||||||||
|
|
577,165
|
|
124,822
|
|
—
|
|
701,987
|
|
|||||||||
|
Other investments
|
|||||||||||||||||
|
Hedge funds
|
—
|
|
488,755
|
|
461,055
|
|
949,810
|
|
|||||||||
|
Direct lending funds
|
—
|
|
—
|
|
22,134
|
|
22,134
|
|
|||||||||
|
CLO-Equities
|
—
|
|
—
|
|
73,866
|
|
73,866
|
|
|||||||||
|
—
|
|
488,755
|
|
557,055
|
|
1,045,810
|
|
||||||||||
|
Short-term investments
|
—
|
|
46,212
|
|
—
|
|
46,212
|
|
|||||||||
|
Derivative instruments (see Note 7)
|
—
|
|
6,824
|
|
984
|
|
7,808
|
|
|||||||||
|
Total Assets
|
$
|
1,696,797
|
|
$
|
11,498,491
|
|
$
|
592,856
|
|
$
|
13,788,144
|
|
|||||
|
Liabilities
|
|||||||||||||||||
|
Derivative instruments (see Note 7)
|
$
|
—
|
|
$
|
1,152
|
|
$
|
815
|
|
$
|
1,967
|
|
|||||
|
Cash settled awards (see Note 16)
|
—
|
|
8,693
|
|
—
|
|
8,693
|
|
|||||||||
|
Total Liabilities
|
$
|
—
|
|
$
|
9,845
|
|
$
|
815
|
|
$
|
10,660
|
|
|||||
144
AXIS CAPITAL HOLDINGS LIMITED
NOTES TO CONSOLIDATED FINANCIAL STATEMENTS
DECEMBER 31, 2014, 2013 AND 2012
|
6.
|
FAIR VALUE MEASUREMENTS (CONTINUED)
|
During
2014
and
2013
, we had no transfers between Levels 1 and 2.
Level 3 Fair Value Measurements
Except for hedge funds, direct lending funds and our CLO fund priced using NAV as a practical expedient and certain fixed maturities priced using broker-dealer quotes (underlying inputs are not available), the following table quantifies the significant unobservable inputs we have used in estimating fair value at
December 31, 2014
for our investments classified as Level 3 in the fair value hierarchy. These significant unobservable inputs have not changed significantly from December 31, 2013.
|
Fair Value
|
Valuation Technique
|
Unobservable Input
|
Range
|
Weighted
Average
|
|||||
|
Other investments - CLO Equities
|
$
|
37,046
|
|
Discounted cash flow
|
Default rates
|
4.0% - 5.0%
|
4.3%
|
||
|
|
|
Loss severity rate
|
53.5%
|
53.5%
|
|||||
|
|
|
Collateral spreads
|
3.0% - 3.5%
|
3.3%
|
|||||
|
Estimated maturity dates
|
3.1 - 4.2 years
|
3.8 years
|
|||||||
|
Derivatives - Weather derivatives, net
|
$
|
(15,177
|
)
|
Simulation model
|
Weather curve
|
32 - 3,370
(1)
|
n/a
(2)
|
||
|
Weather standard deviation
|
3 - 250
(1)
|
n/a
(2)
|
|||||||
(1) Measured in Heating Degree Days ("HDD") which is the number of degrees the daily temperature is below a reference temperature. The cumulative HDD for the duration of the derivatives contract is compared to the strike value to determine the necessary settlement.
|
(2)
|
Due to the diversity of the portfolio, the range of unobservable inputs is widespread; therefore, presentation of a weighted average is not useful. Weather parameters may include various temperature and/or precipitation measures that will naturally vary by geographic location of each counterparty's operations.
|
The CLO - Equities market continues to be mostly inactive with only a small number of transactions being observed in the market and fewer still involving transactions in our CLO - Equities. Accordingly, we continue to rely on the use of our internal discounted cash flow model (income approach) to estimate fair value of our direct investments in CLO - Equities. Of the significant inputs into this model, the default and loss severity rates are the most judgmental unobservable market inputs to which the valuation of CLO - Equities is most sensitive. A significant increase (decrease) in either of these significant inputs in isolation would result in lower (higher) fair value estimates for direct investments in our CLO - Equities and, in general, a change in default rate assumptions will be accompanied by a directionally similar change in loss severity rate assumptions. Collateral spreads and estimated maturity dates are less judgmental inputs as they are based on the historical average of actual spreads and the weighted average life of the current underlying portfolios, respectively. A significant increase (decrease) in either of these significant inputs in isolation would result in higher (lower) fair value estimates for direct investments in our CLO - Equities. In general, these inputs have no significant interrelationship with each other or with default and loss severity rates.
On a quarterly basis, our valuation process for CLO - Equities includes a review of the underlying cash flows and key assumptions used in the discounted cash flow model. We review and update the above significant unobservable inputs based on information obtained from secondary markets, including from the managers of the CLOs we hold. These inputs are the responsibility of management and, in order to ensure fair value measurement is applied consistently and in accordance with U.S. GAAP, we update our assumptions through regular communication with industry participants and ongoing monitoring of the deals in which we participate (e.g. default and loss severity rate trends), we maintain a current understanding of the market conditions, historical results, as well as emerging trends that may impact future cash flows. By maintaining this current understanding, we are able to assess the reasonableness of the inputs we ultimately use in our model.
145
AXIS CAPITAL HOLDINGS LIMITED
NOTES TO CONSOLIDATED FINANCIAL STATEMENTS
DECEMBER 31, 2014, 2013 AND 2012
|
6.
|
FAIR VALUE MEASUREMENTS (CONTINUED)
|
Weather derivatives relate to non-exchange traded risk management products addressing weather risks. We use observable market inputs and unobservable inputs in combination with industry or internally-developed simulation models to determine fair value; these models may reference market price information for similar instruments. The pricing models are internally reviewed by Risk Management personnel prior to implementation and are reviewed periodically thereafter.
Observable and unobservable inputs to these models vary by contract type and would typically include the following:
|
•
|
Observable inputs: market prices for similar instruments, notional, option strike, term to expiry, contractual limits;
|
|
•
|
Unobservable inputs: correlation; and
|
|
•
|
Both observable and unobservable inputs: weather curves, weather standard deviation.
|
In general, weather curves are the most significant contributing input to fair value determination; changes in this variable can result in higher or lower fair value depending on the underlying position. In addition, changes in any or all of the unobservable inputs identified above may contribute positively or negatively to overall portfolio value. The correlation input will quantify the interrelationship, if any, amongst the other variables.
146
AXIS CAPITAL HOLDINGS LIMITED
NOTES TO CONSOLIDATED FINANCIAL STATEMENTS
DECEMBER 31, 2014, 2013 AND 2012
|
6.
|
FAIR VALUE MEASUREMENTS (CONTINUED)
|
The following tables present changes in Level 3 for financial instruments measured at fair value on a recurring basis for the periods indicated:
|
Opening
Balance
|
Transfers
into
Level 3
|
Transfers
out of
Level 3
|
Included in
earnings
(1)
|
Included
in OCI
(2)
|
Purchases
|
Sales
|
Settlements/
Distributions
|
Closing
Balance
|
Change in
unrealized
investment
gain/loss
(3)
|
||||||||||||||||||||||||||||||||
|
|
|
||||||||||||||||||||||||||||||||||||||||
|
Year ended December 31, 2014
|
|||||||||||||||||||||||||||||||||||||||||
|
Fixed maturities
|
|
|
|
|
|
|
|
|
|
|
|||||||||||||||||||||||||||||||
|
Corporate debt
|
$
|
—
|
|
$
|
—
|
|
$
|
—
|
|
$
|
—
|
|
$
|
(95
|
)
|
$
|
15,957
|
|
$
|
—
|
|
$
|
(25
|
)
|
$
|
15,837
|
|
$
|
—
|
|
|||||||||||
|
Non-Agency RMBS
|
—
|
|
—
|
|
—
|
|
—
|
|
—
|
|
—
|
|
—
|
|
—
|
|
—
|
|
—
|
|
|||||||||||||||||||||
|
CMBS
|
4,018
|
|
9,447
|
|
—
|
|
—
|
|
1,381
|
|
5,027
|
|
—
|
|
(2,110
|
)
|
17,763
|
|
—
|
|
|||||||||||||||||||||
|
ABS
|
30,799
|
|
1,125
|
|
(6,165
|
)
|
—
|
|
2,350
|
|
39,800
|
|
—
|
|
(27,878
|
)
|
40,031
|
|
—
|
|
|||||||||||||||||||||
|
|
34,817
|
|
10,572
|
|
(6,165
|
)
|
—
|
|
3,636
|
|
60,784
|
|
—
|
|
(30,013
|
)
|
73,631
|
|
—
|
|
|||||||||||||||||||||
|
Other investments
|
|||||||||||||||||||||||||||||||||||||||||
|
Hedge funds
|
461,055
|
|
12,355
|
|
(32,255
|
)
|
24,790
|
|
—
|
|
19,500
|
|
—
|
|
(14,527
|
)
|
470,918
|
|
24,651
|
|
|||||||||||||||||||||
|
Direct lending funds
|
22,134
|
|
—
|
|
—
|
|
3,515
|
|
—
|
|
30,101
|
|
—
|
|
(1,312
|
)
|
54,438
|
|
3,515
|
|
|||||||||||||||||||||
|
CLO-Equities
|
73,866
|
|
—
|
|
—
|
|
20,173
|
|
—
|
|
25,941
|
|
—
|
|
(27,492
|
)
|
92,488
|
|
20,173
|
|
|||||||||||||||||||||
|
|
557,055
|
|
12,355
|
|
(32,255
|
)
|
48,478
|
|
—
|
|
75,542
|
|
—
|
|
(43,331
|
)
|
617,844
|
|
48,339
|
|
|||||||||||||||||||||
|
Other assets
|
|||||||||||||||||||||||||||||||||||||||||
|
Derivative instruments
|
984
|
|
—
|
|
—
|
|
5,112
|
|
—
|
|
—
|
|
—
|
|
(5,985
|
)
|
111
|
|
101
|
|
|||||||||||||||||||||
|
984
|
|
—
|
|
—
|
|
5,112
|
|
—
|
|
—
|
|
—
|
|
(5,985
|
)
|
111
|
|
101
|
|
||||||||||||||||||||||
|
Total assets
|
$
|
592,856
|
|
$
|
22,927
|
|
$
|
(38,420
|
)
|
$
|
53,590
|
|
$
|
3,636
|
|
$
|
136,326
|
|
$
|
—
|
|
$
|
(79,329
|
)
|
$
|
691,586
|
|
$
|
48,440
|
|
|||||||||||
|
|
|
|
|||||||||||||||||||||||||||||||||||||||
|
Other liabilities
|
|||||||||||||||||||||||||||||||||||||||||
|
Derivative instruments
|
815
|
|
—
|
|
—
|
|
10,604
|
|
—
|
|
12,715
|
|
—
|
|
(8,846
|
)
|
15,288
|
|
6,621
|
|
|||||||||||||||||||||
|
Total liabilities
|
$
|
815
|
|
$
|
—
|
|
$
|
—
|
|
$
|
10,604
|
|
$
|
—
|
|
$
|
12,715
|
|
$
|
—
|
|
$
|
(8,846
|
)
|
$
|
15,288
|
|
$
|
6,621
|
|
|||||||||||
|
Year ended December 31, 2013
|
|||||||||||||||||||||||||||||||||||||||||
|
Fixed maturities
|
|
|
|
|
|
|
|
|
|
|
|||||||||||||||||||||||||||||||
|
Corporate debt
|
$
|
1,550
|
|
$
|
—
|
|
$
|
—
|
|
$
|
1,550
|
|
$
|
—
|
|
$
|
—
|
|
$
|
—
|
|
$
|
(3,100
|
)
|
$
|
—
|
|
$
|
—
|
|
|||||||||||
|
Non-Agency RMBS
|
1,110
|
|
—
|
|
(1,222
|
)
|
—
|
|
135
|
|
—
|
|
—
|
|
(23
|
)
|
—
|
|
—
|
|
|||||||||||||||||||||
|
CMBS
|
4,296
|
|
—
|
|
—
|
|
—
|
|
(278
|
)
|
—
|
|
—
|
|
—
|
|
4,018
|
|
—
|
|
|||||||||||||||||||||
|
ABS
|
63,975
|
|
—
|
|
—
|
|
(111
|
)
|
1,794
|
|
—
|
|
—
|
|
(34,859
|
)
|
30,799
|
|
—
|
|
|||||||||||||||||||||
|
|
70,931
|
|
—
|
|
(1,222
|
)
|
1,439
|
|
1,651
|
|
—
|
|
—
|
|
(37,982
|
)
|
34,817
|
|
—
|
|
|||||||||||||||||||||
|
Other investments
|
|||||||||||||||||||||||||||||||||||||||||
|
Hedge funds
|
359,996
|
|
—
|
|
—
|
|
58,293
|
|
—
|
|
86,138
|
|
—
|
|
(43,372
|
)
|
461,055
|
|
58,293
|
|
|||||||||||||||||||||
|
Direct lending funds
|
—
|
|
—
|
|
—
|
|
(125
|
)
|
—
|
|
22,317
|
|
—
|
|
(58
|
)
|
22,134
|
|
(125
|
)
|
|||||||||||||||||||||
|
CLO-Equities
|
62,435
|
|
—
|
|
—
|
|
27,898
|
|
—
|
|
34,016
|
|
—
|
|
(50,483
|
)
|
73,866
|
|
27,898
|
|
|||||||||||||||||||||
|
|
422,431
|
|
—
|
|
—
|
|
86,066
|
|
—
|
|
142,471
|
|
—
|
|
(93,913
|
)
|
557,055
|
|
86,066
|
|
|||||||||||||||||||||
|
Other assets
|
|||||||||||||||||||||||||||||||||||||||||
|
Derivative instruments
|
—
|
|
—
|
|
—
|
|
2,084
|
|
—
|
|
(1,100
|
)
|
—
|
|
—
|
|
984
|
|
2,084
|
|
|||||||||||||||||||||
|
—
|
|
—
|
|
—
|
|
2,084
|
|
—
|
|
(1,100
|
)
|
—
|
|
—
|
|
984
|
|
2,084
|
|
||||||||||||||||||||||
|
Total assets
|
$
|
493,362
|
|
$
|
—
|
|
$
|
(1,222
|
)
|
$
|
89,589
|
|
$
|
1,651
|
|
$
|
141,371
|
|
$
|
—
|
|
$
|
(131,895
|
)
|
$
|
592,856
|
|
$
|
88,150
|
|
|||||||||||
|
Other liabilities
|
|||||||||||||||||||||||||||||||||||||||||
|
Derivative instruments
|
—
|
|
—
|
|
—
|
|
98
|
|
—
|
|
717
|
|
—
|
|
—
|
|
815
|
|
98
|
|
|||||||||||||||||||||
|
Total liabilities
|
$
|
—
|
|
$
|
—
|
|
$
|
—
|
|
$
|
98
|
|
$
|
—
|
|
$
|
717
|
|
$
|
—
|
|
$
|
—
|
|
$
|
815
|
|
$
|
98
|
|
|||||||||||
|
|
|
|
|
|
|
|
|
|
|
|
|||||||||||||||||||||||||||||||
|
(1)
|
Gains and losses included in earnings on fixed maturities are included in net realized investment gains (losses). Gains and (losses) included in earnings on other investments are included in net investment income. Gains (losses) on weather derivatives included in earnings are included in other insurance-related income.
|
|
(2)
|
Gains and losses included in other comprehensive income (“OCI”) on fixed maturities are included in unrealized gains (losses) arising during the period.
|
|
(3)
|
Change in unrealized investment gain/(loss) relating to assets held at the reporting date.
|
147
AXIS CAPITAL HOLDINGS LIMITED
NOTES TO CONSOLIDATED FINANCIAL STATEMENTS
DECEMBER 31, 2014, 2013 AND 2012
|
6.
|
FAIR VALUE MEASUREMENTS (CONTINUED)
|
The transfers into and out of fair value hierarchy levels reflect the fair value of the securities at the end of the reporting period.
Transfers into Level 3 from Level 2
The transfers to Level 3 from Level 2 made during 2014 were due to redemption provisions in hedge fund holdings and the lack of observable market inputs and multiple quotes from pricing vendors and broker-dealers for certain fixed maturities. There were no transfers from level 2 into level 3 during 2013.
Transfers out of Level 3 into Level 2
The transfers to Level 2 from Level 3 made during 2014 were primarily due to the availability of observable market inputs and multiple quotes from pricing vendors and broker-dealers on CLO Debt securities and also due to certain hedge funds
where we have the ability to liquidate holdings at the reported NAV in the near term due to the expiry of lockup provisions. The transfers from Level 3 to Level 2 made during 2013 were primarily due to the availability of observable market inputs and multiple quotes from pricing vendors and broker-dealers.
Financial Instruments Not Carried at Fair Value
U.S. GAAP guidance over disclosures about the fair value of financial instruments are also applicable to financial instruments not carried at fair value, except for certain financial instruments, including insurance contracts.
The carrying values of cash equivalents (including restricted amounts), accrued investment income, receivable for investments sold, certain other assets, payable for investments purchased and certain other liabilities approximated their fair values at
December 31, 2014
, due to their respective short maturities. As these financial instruments are not actively traded, their respective fair values are classified within Level 2.
At
December 31, 2014
, our senior notes are recorded at amortized cost with a carrying value of
$991 million
(
2013
:
$996 million
) and have a fair value of
$1,089 million
(
2013
:
$1,073 million
). The fair values of these securities were obtained from a third party pricing service and pricing was based on the spread above the risk-free yield curve. These spreads are generally obtained from the new issue market, secondary trading and broker-dealer quotes. As these spreads and the yields for the risk-free yield curve are observable market inputs, the fair values of our senior notes are classified within Level 2.
148
AXIS CAPITAL HOLDINGS LIMITED
NOTES TO CONSOLIDATED FINANCIAL STATEMENTS
DECEMBER 31, 2014, 2013 AND 2012
|
7.
|
DERIVATIVE INSTRUMENTS
|
The following table summarizes the balance sheet classification of derivatives recorded at fair value. The notional amount of derivative contracts represents the basis upon which pay or receive amounts are calculated and is presented in the table to quantify the volume of our derivative activities. Notional amounts are not reflective of credit risk.
|
|
At December 31, 2014
|
At December 31, 2013
|
|||||||||||||||||||||||
|
|
Derivative
Notional
Amount
|
Asset
Derivative
Fair
Value
(1)
|
Liability
Derivative
Fair
Value
(1)
|
Derivative
Notional
Amount
|
Asset
Derivative
Fair
Value
(1)
|
Liability
Derivative
Fair
Value
(1)
|
|||||||||||||||||||
|
Derivatives not designated as hedging instruments
|
|||||||||||||||||||||||||
|
Relating to investment portfolio:
|
|||||||||||||||||||||||||
|
Foreign exchange forward contracts
|
$
|
161,678
|
|
$
|
3,925
|
|
$
|
12
|
|
$
|
254,023
|
|
$
|
1,214
|
|
$
|
1,032
|
|
|||||||
|
Interest rate swaps
|
140,000
|
|
—
|
|
248
|
|
281,250
|
|
873
|
|
—
|
|
|||||||||||||
|
Relating to underwriting portfolio:
|
|||||||||||||||||||||||||
|
Foreign exchange forward contracts
|
577,836
|
|
3,228
|
|
2,781
|
|
390,663
|
|
4,737
|
|
120
|
|
|||||||||||||
|
Weather-related contracts
|
58,124
|
|
111
|
|
15,288
|
|
24,451
|
|
984
|
|
815
|
|
|||||||||||||
|
Total derivatives
|
$
|
7,264
|
|
$
|
18,329
|
|
$
|
7,808
|
|
$
|
1,967
|
|
|||||||||||||
|
(1)
|
Asset and liability derivatives are classified within other assets and other liabilities on the Consolidated Balance Sheets.
|
Offsetting Assets and Liabilities
Our derivative instruments are generally traded under International Swaps and Derivatives Association master netting agreements, which establish terms that apply to all transactions. In the event of a bankruptcy or other stipulated event, master netting agreements provide that individual positions be replaced with a new amount, usually referred to as the termination amount, determined by taking into account market prices and converting into a single currency. Effectively, this contractual close-out netting reduces credit exposure from gross to net exposure. The table below presents a reconciliation of our gross derivative assets and liabilities to the net amounts presented in our Consolidated Balance Sheets, with the difference being attributable to the impact of master netting agreements.
|
December 31, 2014
|
December 31, 2013
|
||||||||||||||||||||
|
Gross Amounts
|
Gross Amounts Offset
|
Net
Amounts
(1)
|
Gross Amounts
|
Gross Amounts Offset
|
Net
Amounts
(1)
|
||||||||||||||||
|
Derivative assets
|
$
|
15,125
|
|
$
|
(7,861
|
)
|
$
|
7,264
|
|
$
|
9,796
|
|
$
|
(1,988
|
)
|
$
|
7,808
|
|
|||
|
Derivative liabilities
|
$
|
26,190
|
|
$
|
(7,861
|
)
|
$
|
18,329
|
|
$
|
3,955
|
|
$
|
(1,988
|
)
|
$
|
1,967
|
|
|||
|
(1)
|
Net asset and liability derivatives are classified within other assets and other liabilities on the Consolidated Balance Sheets.
|
Refer to
Note 5 - Investments
for information on reverse repurchase agreements.
Fair Value Hedges
During 2012, we sold all available for sale fixed maturities in the portfolios that qualified for hedge accounting and settled all of the associated foreign exchange forward contracts. The hedges were designated and qualified as fair value hedges, resulting in the net impact of the hedges recognized in net realized investment gains (losses).
149
AXIS CAPITAL HOLDINGS LIMITED
NOTES TO CONSOLIDATED FINANCIAL STATEMENTS
DECEMBER 31, 2014, 2013 AND 2012
|
7.
|
DERIVATIVE INSTRUMENTS (CONTINUED)
|
The following table provides the total impact on earnings of applying hedge accounting for foreign exchange contracts designated as fair value hedges along with the impact of the related hedged investment portfolio for the periods indicated:
|
Year ended December 31,
|
2014
|
2013
|
2012
|
||||||||||
|
Foreign exchange forward contracts
|
$
|
—
|
|
$
|
—
|
|
$
|
10,853
|
|
||||
|
Hedged investment portfolio
|
—
|
|
—
|
|
(3,099
|
)
|
|||||||
|
Hedge ineffectiveness recognized in earnings
|
$
|
—
|
|
$
|
—
|
|
$
|
7,754
|
|
||||
Derivative Instruments not Designated as Hedging Instruments
a) Relating to Investment Portfolio
Foreign Currency Risk
Within our investment portfolio we are exposed to foreign currency risk. Accordingly, the fair values for our investment portfolio are partially influenced by the change in foreign exchange rates. We may enter into foreign currency forward contracts to manage the effect of this foreign currency risk. These foreign currency hedging activities are not designated as specific hedges for financial reporting purposes.
Interest Rate Risk
Our investment portfolio contains a large percentage of fixed maturities which exposes us to significant interest rate risk. As part of our overall management of this risk, we may use interest rate swaps. The interest rate swaps held at December 31, 2014 convert part of our overall fixed rate exposure to a variable rate exposure which effectively reduces the duration of our overall portfolio.
b) Relating to Underwriting Portfolio
Foreign Currency Risk
Our (re)insurance subsidiaries and branches operate in various foreign countries. Consequently, some of our business is written in currencies other than the U.S. dollar and, therefore, our underwriting portfolio is exposed to significant foreign currency risk. We manage foreign currency risk by seeking to match our foreign-denominated net liabilities under (re)insurance contracts with cash and investments that are denominated in such currencies. We may also use derivative instruments, specifically forward contracts and currency options, to economically hedge foreign currency exposures.
Weather Risk
During 2013, we began to write derivative-based risk management products designed to address weather risks with the objective of generating profits on a portfolio basis. The majority of this business consists of receiving a payment at contract inception in exchange for bearing the risk of variations in a quantifiable weather-related phenomenon, such as temperature. Where a client wishes to minimize the upfront payment, these transactions may be structured as swaps or collars. In general, our portfolio of such derivative contracts is of short duration, with contracts being predominantly seasonal in nature. In order to economically hedge a portion of this portfolio, we may also purchase weather derivatives.
150
AXIS CAPITAL HOLDINGS LIMITED
NOTES TO CONSOLIDATED FINANCIAL STATEMENTS
DECEMBER 31, 2014, 2013 AND 2012
|
7.
|
DERIVATIVE INSTRUMENTS (CONTINUED)
|
Commodity Risk
Within our (re)insurance portfolio we are exposed to commodity price risk. During 2014, we began to hedge this price risk by entering into commodity derivative contracts. All commodity derivative contracts entered into during 2014 were settled at December 31, 2014.
The total unrealized and realized gains (losses) recognized in earnings for derivatives not designated as hedges were as follows:
|
|
Location of Gain (Loss) Recognized
in Income on Derivative
|
Amount of Gain (Loss) Recognized in
Income on Derivative
|
||||||||||||
|
|
2014
|
2013
|
2012
|
|||||||||||
|
Derivatives not designated as hedging instruments
|
||||||||||||||
|
Relating to investment portfolio:
|
||||||||||||||
|
Foreign exchange forward contracts
|
Net realized investment gains
|
$
|
10,333
|
|
$
|
10,843
|
|
$
|
(9,170
|
)
|
||||
|
Interest rate swaps
|
Net realized investment gains
|
(19,936
|
)
|
(3,112
|
)
|
—
|
|
|||||||
|
Relating to underwriting portfolio:
|
||||||||||||||
|
Foreign exchange forward contracts
|
Foreign exchange gains (losses)
|
(10,363
|
)
|
1,690
|
|
26,612
|
|
|||||||
|
Weather-related contracts
|
Other insurance related income
|
(5,373
|
)
|
1,987
|
|
—
|
|
|||||||
|
Commodity contracts
|
Other insurance related income
|
8,328
|
|
—
|
|
—
|
|
|||||||
|
Total
|
$
|
(17,011
|
)
|
$
|
11,408
|
|
$
|
17,442
|
|
|||||
|
8.
|
RESERVE FOR LOSSES AND LOSS EXPENSES
|
Our reserve for losses and loss expenses comprise the following:
|
As of December 31,
|
2014
|
2013
|
|||||||
|
Reserve for reported losses and loss expenses
|
$
|
3,285,675
|
|
$
|
3,499,817
|
|
|||
|
Reserve for losses incurred but not reported
|
6,311,122
|
|
6,082,323
|
|
|||||
|
Reserve for losses and loss expenses
|
$
|
9,596,797
|
|
$
|
9,582,140
|
|
|||
151
AXIS CAPITAL HOLDINGS LIMITED
NOTES TO CONSOLIDATED FINANCIAL STATEMENTS
DECEMBER 31, 2014, 2013 AND 2012
|
8.
|
RESERVE FOR LOSSES AND LOSS EXPENSES (CONTINUED)
|
The following table presents a reconciliation of our beginning and ending gross reserve for losses and loss expenses and net reserve for unpaid losses and loss expenses for the years indicated:
|
Year ended December 31,
|
2014
|
2013
|
2012
|
||||||||||
|
Gross reserve for losses and loss expenses, beginning of year
|
$
|
9,582,140
|
|
$
|
9,058,731
|
|
$
|
8,425,045
|
|
||||
|
Less reinsurance recoverable on unpaid losses, beginning of year
|
(1,900,112
|
)
|
(1,825,617
|
)
|
(1,736,823
|
)
|
|||||||
|
Net reserve for unpaid losses and loss expenses, beginning of year
|
7,682,028
|
|
7,233,114
|
|
6,688,222
|
|
|||||||
|
Net incurred losses and loss expenses related to:
|
|||||||||||||
|
Current year
|
2,445,666
|
|
2,353,631
|
|
2,340,868
|
|
|||||||
|
Prior years
|
(258,944
|
)
|
(219,436
|
)
|
(244,840
|
)
|
|||||||
|
|
2,186,722
|
|
2,134,195
|
|
2,096,028
|
|
|||||||
|
Net paid losses and loss expenses related to:
|
|||||||||||||
|
Current year
|
(387,197
|
)
|
(318,006
|
)
|
(322,836
|
)
|
|||||||
|
Prior years
|
(1,544,664
|
)
|
(1,373,459
|
)
|
(1,299,384
|
)
|
|||||||
|
|
(1,931,861
|
)
|
(1,691,465
|
)
|
(1,622,220
|
)
|
|||||||
|
Foreign exchange and other
|
(230,372
|
)
|
6,184
|
|
71,084
|
|
|||||||
|
Net reserve for unpaid losses and loss expenses, end of year
|
7,706,517
|
|
7,682,028
|
|
7,233,114
|
|
|||||||
|
Reinsurance recoverable on unpaid losses, end of year
|
1,890,280
|
|
1,900,112
|
|
1,825,617
|
|
|||||||
|
Gross reserve for losses and loss expenses, end of year
|
$
|
9,596,797
|
|
$
|
9,582,140
|
|
$
|
9,058,731
|
|
||||
We write business with loss experience generally characterized as low frequency and high severity in nature, which can result in volatility in our financial results. During
2014
,
2013
and
2012
, respectively, we recognized aggregate net losses and loss expenses of
$93 million
,
$201 million
and
$438 million
in relation to natural catastrophe and weather-related events.
Prior year reserve development arises from changes to loss and loss expense estimates related to loss events that occurred in previous calendar years. Such development is summarized by segment in the following table:
|
Insurance
|
Reinsurance
|
Total
|
|||||||||||
|
Year ended December 31, 2014
|
$
|
63,735
|
|
$
|
195,209
|
|
$
|
258,944
|
|
||||
|
Year ended December 31, 2013
|
50,355
|
|
169,081
|
|
219,436
|
|
|||||||
|
Year ended December 31, 2012
|
122,209
|
|
122,631
|
|
244,840
|
|
|||||||
Overall, the majority of the net favorable prior year reserve development in 2014 related to short-tail lines of business. Net favorable prior year reserve development for reinsurance professional, liability and motor lines also contributed significantly and was partially offset by adverse development in insurance liability lines. Favorable reserve development in reinsurance liability and professional lines contributed in 2013 and was partially offset by adverse development in the insurance professional and insurance liability lines. Favorable development in professional lines contributed notably in 2012.
The underlying exposures in our property, marine and aviation reserving classes within our insurance segment and the property reserving class within our reinsurance segment largely relate to short-tail business. Development from these classes contributed
$207 million
,
$162 million
and
$186 million
of the total net favorable prior year reserve development in
2014
,
2013
and
2012
, respectively, and primarily reflected the recognition of better than expected loss emergence.
152
AXIS CAPITAL HOLDINGS LIMITED
NOTES TO CONSOLIDATED FINANCIAL STATEMENTS
DECEMBER 31, 2014, 2013 AND 2012
|
8.
|
RESERVE FOR LOSSES AND LOSS EXPENSES (CONTINUED)
|
Our professional lines business recognized
$32 million
and
$54 million
of favorable prior year development in 2014 and 2012, respectively, while 2013 recognized
$29 million
of net adverse development. The 2014 and 2012 favorable prior year reserve developments were driven by increased weight being given to experience-based actuarial methods in selecting our ultimate loss estimates for accident years 2010 and prior. As our loss experience has generally been better than expected, this resulted in the recognition of favorable development. The increase in the reserves in 2013 was due to a
$51 million
adverse development in the insurance segment, reflecting worse than expected loss experience for the 2011-2012 accident years, following worse than expected loss experience on certain parts of our U.S. D&O business, and the 2008-2009 accident years, due to developments on certain global financial crisis-related claims. During 2013, the transition to the experience-based actuarial methods had a favorable impact on 2010 and prior years, which partially offset the adverse development discussed above.
In the first quarter of 2013, we began to give weight to actuarial methods that reflect our actual experience for liability reinsurance business, as we believe that our older accident years are now at a stage of expected development where such methods will produce meaningful actuarial indications. During 2014 and 2013, we recognized
$21 million
and
$85 million
, respectively, of net favorable prior year development, primarily reflecting the greater weight management is giving to experience based indications and our experience which has been favorable for the 2004 through 2008 accident years. This favorable development was offset in 2014 and partially offset in 2013 by adverse development in our liability insurance business of
$23 million
and
$24 million
, respectively, relating primarily to an increase in loss estimates for certain specific claim reserves.
Our motor lines recorded favorable prior year development of
$19 million
during 2014, relating to better than expected loss emergence on certain European exposures.
The frequency and severity of natural catastrophe and weather-related activity was high for 2012 and prior periods and our
December 31, 2014
net reserve for losses and loss expenses continues to include estimated amounts for numerous events. We caution that the magnitude and/or complexity of losses arising from certain of these events, in particular Storm Sandy, the Japanese earthquake and tsunami and the three New Zealand earthquakes, inherently increase the level of uncertainty and, therefore, the level of management judgment involved in arriving at our estimated net reserves for losses and loss expenses. As a result, our actual losses for these events may ultimately differ materially from our current estimates.
|
9.
|
REINSURANCE
|
We purchase treaty and facultative reinsurance to reduce exposure to significant losses. Facultative reinsurance provides coverage for all or a portion of the losses incurred for a single policy and we separately negotiate each facultative contract. Treaty reinsurance provides coverage for a specified type or category of risks. Our treaty reinsurance agreements provide this coverage on either an excess of loss or a proportional basis. Excess of loss covers provide a contractually set amount of coverage after a specified loss amount has been reached. These covers can be purchased on a package policy basis, which provide us with coverage for a number of lines of business within one contract. In contrast, proportional covers provide us with a specified percentage of coverage from the first dollar of loss.
All of these reinsurance covers provide us the right to recover a portion of specified losses and loss expenses from reinsurers. However, to the extent that our reinsurers do not meet their obligations under these agreements due to solvency issues, contractual disputes or other reasons, we remain liable. We predominantly cede our business to reinsurers rated A- or better by A.M. Best.
153
AXIS CAPITAL HOLDINGS LIMITED
NOTES TO CONSOLIDATED FINANCIAL STATEMENTS
DECEMBER 31, 2014, 2013 AND 2012
|
9.
|
REINSURANCE (CONTINUED)
|
Gross and net premiums written and earned were as follows:
|
Year ended December 31,
|
2014
|
2013
|
2012
|
||||||||||||||||||||||
|
|
Premiums
written
|
Premiums
earned
|
Premiums
written
|
Premiums
earned
|
Premiums
written
|
Premiums
earned
|
|||||||||||||||||||
|
Gross
|
$
|
4,711,519
|
|
$
|
4,652,345
|
|
$
|
4,697,041
|
|
$
|
4,459,269
|
|
$
|
4,139,643
|
|
$
|
4,141,037
|
|
|||||||
|
Ceded
|
(804,544
|
)
|
(781,346
|
)
|
(768,841
|
)
|
(752,204
|
)
|
(802,187
|
)
|
(725,574
|
)
|
|||||||||||||
|
Net
|
$
|
3,906,975
|
|
$
|
3,870,999
|
|
$
|
3,928,200
|
|
$
|
3,707,065
|
|
$
|
3,337,456
|
|
$
|
3,415,463
|
|
|||||||
During the year ended
December 31,
2014
, we recognized ceded losses and loss expenses of
$401 million
(
2013
:
$415 million
;
2012
:
$396 million
).
Our provision for unrecoverable reinsurance was
$18 million
at
December 31,
2014
(
2013
:
$18 million
). At
December 31,
2014
,
98.5%
(
2013
:
98.8%
) of our gross reinsurance recoverables were collectible from reinsurers rated A- or better by A.M. Best.
|
10.
|
DEBT AND FINANCING ARRANGEMENTS
|
|
a)
|
Senior Notes
|
On November 15, 2004, AXIS Capital issued
$500 million
aggregate principal amount of
5.75%
senior unsecured debt (the ''
5.75%
Senior Notes'') at an issue price of
99.785%
, generating net proceeds of
$496 million
. Interest on the
5.75%
Senior Notes was payable semi-annually in arrears on June 1 and December 1 of each year, beginning on June 1, 2005. AXIS Capital repaid the full $
500 million
of its outstanding
5.75%
Senior Notes upon their scheduled maturity of December 1, 2014.
On March 23, 2010, AXIS Specialty Finance LLC, a
100%
owned finance subsidiary, issued
$500 million
aggregate principal amount of
5.875%
senior unsecured debt (the ''
5.875%
Senior Notes'') at an issue price of
99.624%
. The net proceeds of the issuance, after consideration of the offering discount and underwriting expenses and commissions, totaled approximately
$495 million
. Interest on the
5.875%
Senior Notes is payable semi-annually in arrears on June 1 and December 1 of each year, beginning on June 1, 2010. Unless previously redeemed, the
5.875%
Senior Notes will mature on June 1, 2020. The
5.875%
Senior Notes are ranked as unsecured senior obligations of AXIS Specialty Finance LLC. AXIS Capital has fully and unconditionally guaranteed all obligations of AXIS Specialty Finance LLC under the
5.875%
Senior Notes. AXIS Capital’s obligations under this guarantee are unsecured and senior and rank equally with all other senior obligations of AXIS Capital.
On March 13, 2014, AXIS Specialty Finance PLC, a
100%
owned finance subsidiary, issued $
250 million
aggregate principal amount of
2.65%
senior unsecured notes (the "
2.65%
Senior Notes") at an issue price of
99.896%
and $
250 million
aggregate principal amount of
5.15%
senior unsecured notes (the "
5.15%
Senior Notes", and, together with the
5.875%
Senior Notes and the
2.65%
Senior Notes, the "Senior Notes") at an issue price of
99.474%
. The net proceeds of the issuance, after consideration of the offering discount and underwriting expenses and commissions, totaled approximately $
248 million
and $
246 million
for the
2.65%
Senior Notes and the
5.15%
Senior Notes, respectively. Interest on the
2.65%
Senior Notes and the
5.15%
Senior Notes is payable semi-annually in arrears on April 1 and October 1 of each year, beginning on October 1, 2014. Unless previously redeemed, the
2.65%
Senior Notes and the
5.15%
Senior Notes will mature on April 1, 2019 and April 1, 2045, respectively. The
2.65%
Senior Notes and the
5.15%
Senior Notes are ranked as unsecured senior obligations of AXIS Specialty Finance PLC. AXIS Capital has fully and unconditionally guaranteed all obligations of AXIS Specialty Finance PLC under the
2.65%
Senior Notes and the
5.15%
Senior Notes. AXIS Capital's obligations under this guarantee are unsecured and senior and rank equally with all other senior obligations of AXIS Capital. Net proceeds from these two offerings were used towards the repayment of
$500 million
of AXIS Capital’s
5.75%
senior unsecured notes which matured on December 1, 2014.
154
AXIS CAPITAL HOLDINGS LIMITED
NOTES TO CONSOLIDATED FINANCIAL STATEMENTS
DECEMBER 31, 2014, 2013 AND 2012
|
10.
|
DEBT AND FINANCING ARRANGEMENTS (CONTINUED)
|
We have the option to redeem the Senior Notes at any time and from time to time, in whole or in part, at a ''make-whole'' redemption price, which is equal to the greater of the aggregate principal amount or the sum of the present values of the remaining scheduled payments of principal and interest. The related indentures contain various covenants, including limitations on liens on the stock of restricted subsidiaries, restrictions as to the disposition of the stock of restricted subsidiaries and limitations on mergers and consolidations. We were in compliance with all the covenants contained in the indentures at
December 31,
2014
.
Interest expense recognized in relation to our Senior Notes includes interest payable, amortization of the offering discounts and amortization of debt offering expenses. The offering discounts and debt offering expenses are amortized over the period of time during which the Senior Notes are outstanding. During
2014
, we incurred interest expense of
$72 million
(
2013
:
$59 million
,
2012
:
$59 million
).
|
b)
|
Credit Facilities
|
On March 26, 2013, in advance of the scheduled August expiration, we terminated and replaced our previously existing credit facility. AXIS Capital and certain subsidiaries are now party to a
$250 million
credit facility (the "Credit Facility"), which was issued by a syndication of lenders pursuant to a Credit Agreement and other ancillary documents (together, the "Facility Documents") and will expire in March 2017. At the request of the Company and subject to the satisfaction of certain conditions, the aggregate commitment available under the Credit Facility may be increased by up to
$150 million
. Under the terms of the Credit Facility, loans are available for general corporate purposes and letters of credit may be issued in the ordinary course of business, with total usage not to exceed the aggregate commitment available. Interest on loans issued under the Credit Facility is payable based on underlying market rates at the time of loan issuance. While loans under the Credit Facility are unsecured, we have the option to issue letters of credit on a secured basis in order to reduce associated fees. Letters of credit issued under the Credit Facility would principally be used to support the (re)insurance obligations of our operating subsidiaries. Each of AXIS Capital, AXIS Specialty Finance LLC and AXIS Specialty Holdings Bermuda Limited guarantees the obligations of the other parties to the Credit Facility. The Credit Facility is subject to certain non-financial covenants, including limitations on fundamental changes, the incurrence of additional indebtedness and liens and certain transactions with affiliates and investments, as defined in the Facility Documents. The Credit Facility also requires compliance with certain financial covenants, including a maximum debt to capital ratio and a minimum consolidated net worth requirement. In addition, each of AXIS Capital’s material (re)insurance subsidiaries party to the Credit Facility must maintain a minimum A.M. Best Company, Inc. financial strength rating. In the event of default, including a breach of these covenants, the lenders may exercise certain remedies including the termination of the Credit Facility, the declaration of all principal and interest amounts related to Credit Facility loans to be immediately due and the requirement that all outstanding letters of credit be collateralized.
On September 18, 2013, we entered into an amendment to the Credit Facility in order to permit AXIS Capital and its subsidiaries to enter into swap contracts and other arrangements related to weather derivative transactions. All other material terms and conditions remained unchanged.
Effective February 10, 2014, AXIS Specialty Finance PLC was added as a guarantor to the Credit Facility.
On November 20, 2013, certain of AXIS Capital’s operating subsidiaries entered into an amendment to extend the term of the Company's secured
$750 million
letter of credit facility (the ''LOC Facility'') with Citibank Europe plc (''Citibank'') pursuant to a Master Reimbursement Agreement and other ancillary documents (together, the ''LOC Facility Documents''). The LOC Facility may be terminated by Citibank on December 31, 2016 upon
thirty days
prior notice. Under the terms of the LOC Facility, letters of credit to a maximum aggregate amount of
$750 million
are available for issuance on behalf of the operating subsidiaries. These letters of credit will principally be used to support the reinsurance obligations of the operating subsidiaries. The LOC Facility is subject to certain covenants, including the requirement to maintain sufficient collateral, as defined in the LOC Facility Documents, to cover all of the obligations under the LOC Facility. Such obligations include contingent reimbursement obligations for outstanding letters of credit and fees payable to Citibank. In the event of default,
155
AXIS CAPITAL HOLDINGS LIMITED
NOTES TO CONSOLIDATED FINANCIAL STATEMENTS
DECEMBER 31, 2014, 2013 AND 2012
|
10.
|
DEBT AND FINANCING ARRANGEMENTS (CONTINUED)
|
Citibank may exercise certain remedies, including the exercise of control over pledged collateral and the termination of the availability of the LOC Facility to any or all of the operating subsidiaries party to the LOC Facility Documents.
On March 31, 2014, AXIS Capital's subsidiary, AXIS Specialty Limited, terminated the $170 million secured letter of credit facility with ING Bank N.V., London Branch. The Funds at Lloyd's requirements for the Company's subsidiary, AXIS Corporate Capital UK Limited, to support the underwriting capacity of the Company's Lloyd's syndicate, AXIS Syndicate 1686, are now being met by capital pledged in the form of fixed income securities deposited directly with Lloyd's.
At
December 31,
2014
, letters of credit outstanding under the LOC Facility and the Credit Facility totaled
$423 million
and $
nil
respectively. There was
no
debt outstanding under the Credit Facility. We were in compliance with all LOC Facility and Credit Facility covenants at
December 31,
2014
.
|
11.
|
COMMITMENTS AND CONTINGENCIES
|
|
a)
|
Concentrations of Credit Risk
|
Credit Risk Aggregation
We monitor and control the aggregation of credit risk on a consolidated basis by assigning limits on the maximum credit exposure we are willing to assume by single obligors and groups, industry sector, country, region or other inter-dependencies. Our credit exposures are aggregated based on the origin of risk. Limits are based and adjusted on a variety of factors, including the prevailing economic environment and the nature of the underlying credit exposures. Our credit aggregation measurement and reporting process is facilitated by an exposure database, which contains relevant information on counterparties and credit risk; we also license third party databases to provide credit risk assessments.
Credit risk aggregation is also managed through minimizing overlaps in underwriting, financing and investing activities.
The assets that potentially subject us to concentrations of credit risk consist principally of cash and investments, reinsurance recoverable and (re)insurance premiums receivable balances, as described below:
Cash and Investments
In order to mitigate concentration and operational risks related to cash and cash equivalents, we limit the maximum amount of cash that can be deposited with a single counterparty and additionally limit acceptable counterparties based on current rating, outlook and other relevant factors.
Our investment portfolio is managed by external investment managers in accordance with our investment guidelines. We limit credit risk through diversification, issuer exposure limitation graded by ratings and, with respect to custodians, through contractual and other legal remedies. Excluding U.S. government and agency securities, we limit our concentration of credit risk to any single corporate issuer to
2%
or less of our fixed maturities portfolio for securities rated A- or above and
1%
or less of our fixed maturities portfolio for securities rated below A-. At
December 31,
2014
, we were in compliance with these limits.
Reinsurance Recoverable Balances
With respect to our reinsurance recoverable balances, we are exposed to the risk of a reinsurer failing to meet its obligations under coverage we have purchased. To mitigate this risk, all reinsurance coverage we purchase is subject to requirements established by our Reinsurance Security Committee. This Committee maintains a list of approved reinsurers, performs credit risk assessments for potential new reinsurers, regularly monitors approved reinsurers with consideration for events which may have a material impact on their creditworthiness, recommends counterparty tolerance levels for different types of ceded business and monitors concentrations of credit risk. The assessment of each reinsurer considers a range of attributes,
156
AXIS CAPITAL HOLDINGS LIMITED
NOTES TO CONSOLIDATED FINANCIAL STATEMENTS
DECEMBER 31, 2014, 2013 AND 2012
|
11.
|
COMMITMENTS AND CONTINGENCIES (CONTINUED)
|
including a review of financial strength, industry position and other qualitative factors. Generally, the Committee requires that reinsurers who do not meet specified requirements provide collateral.
The
three
largest balances by reinsurer accounted for
13%
,
11%
and
11%
of total reinsurance recoverable on unpaid and paid losses at
December 31,
2014
(
2013
:
14%
,
11%
and
11%
). Amounts related to our reinsurers with the ten largest balances comprised
77%
of
December 31,
2014
balance (
2013
:
77%
) and had a weighted average A.M. Best rating of
A+
(
2013
:
A+
).
Premiums Receivable Balances
The diversity of our client base limits the credit risk associated with our premiums receivable. In addition, for insurance contracts we have contractual rights to cancel coverage for non-payment of premiums and for reinsurance contracts we have contractual rights to offset premiums receivable with corresponding payments for losses and loss expenses.
Brokers and other intermediaries collect premiums from customers to be paid to us. We have policies and standards in place to manage and monitor credit risk from intermediaries with a focus on day-to-day monitoring of the largest positions.
These contractual rights contribute to the mitigation of credit risk, as does our monitoring of aged receivable balances. In light of these mitigating factors, and considering that a significant portion of our premiums receivable are not currently due based on the terms of the underlying contracts, we do not utilize specific credit quality indicators to monitor our premiums receivable balance. At
December 31,
2014
, we recorded an allowance for estimated uncollectible premiums receivable of
$4 million
(
2013
:
$3 million
). The corresponding bad debts expense charges for
2014
,
2013
and
2012
were insignificant.
|
b)
|
Brokers
|
We produce our business through brokers and direct relationships with insurance companies. During
2014
,
three
brokers accounted for
56%
(
2013
:
61%
;
2012
:
61%
) of our total gross premiums written. Aon Corporation accounted for
22%
(
2013
:
26%
;
2012
:
27%
), Marsh, Inc. (including its subsidiary Guy Carpenter and Company) for
22%
(
2013
:
23%
;
2012
:
22%
), and Willis Group Holdings Ltd. for
12%
(
2013
:
12%
;
2012
:
12%
). No other broker and no one insured or reinsured accounted for more than 10% of our gross premiums written in any of the last three years.
|
c)
|
Lease Commitments
|
We lease office space under operating leases which expire at various dates. We renew and enter into new leases in the ordinary course of business, as required. During
2014
, total rent expense with respect to these operating leases was
$27 million
(
2013
:
$29 million
;
2012
:
$29 million
).
Future minimum lease payments under our leases are expected to be as follows:
|
Year ended December 31,
|
|||||
|
2015
|
$
|
27,609
|
|
||
|
2016
|
23,074
|
|
|||
|
2017
|
20,310
|
|
|||
|
2018
|
17,511
|
|
|||
|
2019
|
15,937
|
|
|||
|
Later years
|
36,452
|
|
|||
|
Total future minimum lease payments
|
$
|
140,893
|
|
||
157
AXIS CAPITAL HOLDINGS LIMITED
NOTES TO CONSOLIDATED FINANCIAL STATEMENTS
DECEMBER 31, 2014, 2013 AND 2012
|
11.
|
COMMITMENTS AND CONTINGENCIES (CONTINUED)
|
|
d)
|
Reinsurance Purchase Commitment
|
We purchase reinsurance coverage for our insurance lines of business. The minimum reinsurance premiums are contractually due in advance on a quarterly basis. Accordingly at
December 31,
2014
, we have an outstanding reinsurance purchase commitment of
$78 million
, of which $
67 million
is due in 2015 while the remaining $
11 million
is due in 2016. Actual payments under the reinsurance contracts will depend on the underlying subject premium and may exceed the minimum premium.
|
e)
|
Legal Proceedings
|
From time to time, we are subject to routine legal proceedings, including arbitrations, arising in the ordinary course of business. These legal proceedings generally relate to claims asserted by or against us in the ordinary course of insurance or reinsurance operations; estimated amounts payable under such proceedings are included in the reserve for losses and loss expenses in our Consolidated Balance Sheets.
We are not party to any material legal proceedings arising outside the ordinary course of business.
|
f)
|
Investments
|
At December 31, 2014 we have $
123 million
(2013: $
168 million
) of unfunded investment commitments related to our investments in hedge and direct-lending funds, which are callable by our investment managers. For further details, see Note 5(b). In addition, we have a $
25 million
commitment to purchase securities with one of our fixed income managers at December 31, 2014.
158
AXIS CAPITAL HOLDINGS LIMITED
NOTES TO CONSOLIDATED FINANCIAL STATEMENTS
DECEMBER 31, 2014, 2013 AND 2012
|
12.
|
EARNINGS PER COMMON SHARE
|
The following table sets forth the comparison of basic and diluted earnings per common share:
|
At and year ended December 31,
|
2014
|
2013
|
2012
|
||||||||||
|
Basic earnings per common share
|
|||||||||||||
|
Net income
|
$
|
804,564
|
|
$
|
727,465
|
|
$
|
547,241
|
|
||||
|
Less: noncontrolling interests
|
(6,181
|
)
|
—
|
|
—
|
|
|||||||
|
Less: preferred share dividends
|
40,088
|
|
40,474
|
|
38,228
|
|
|||||||
|
Less: loss on repurchase of preferred shares
|
—
|
|
3,081
|
|
14,009
|
|
|||||||
|
Net income available to common shareholders
|
$
|
770,657
|
|
$
|
683,910
|
|
$
|
495,004
|
|
||||
|
Weighted average common shares outstanding - basic
|
104,368
|
|
113,636
|
|
122,148
|
|
|||||||
|
Basic earnings per common share
|
$
|
7.38
|
|
$
|
6.02
|
|
$
|
4.05
|
|
||||
|
Diluted earnings per common share
|
|||||||||||||
|
Net income available to common shareholders
|
$
|
770,657
|
|
$
|
683,910
|
|
$
|
495,004
|
|
||||
|
Weighted average common shares outstanding - basic
|
104,368
|
|
113,636
|
|
122,148
|
|
|||||||
|
Stock compensation plans
|
1,345
|
|
1,692
|
|
1,506
|
|
|||||||
|
Weighted average common shares outstanding - diluted
|
105,713
|
|
115,328
|
|
123,654
|
|
|||||||
|
Diluted earnings per common share
|
$
|
7.29
|
|
$
|
5.93
|
|
$
|
4.00
|
|
||||
|
Anti-dilutive shares excluded from the dilutive computation
|
282
|
|
250
|
|
614
|
|
|||||||
159
AXIS CAPITAL HOLDINGS LIMITED
NOTES TO CONSOLIDATED FINANCIAL STATEMENTS
DECEMBER 31, 2014, 2013 AND 2012
|
13.
|
SHAREHOLDERS' EQUITY
|
|
a)
|
Common Shares
|
At
December 31,
2014
, and
2013
, our authorized share capital was
800,000,000
common shares, par value of
$0.0125
per share.
The following table presents our common shares issued and outstanding, excluding restricted shares under our stock compensation plans (see Note 16 – Share-based Compensation):
|
Year ended December 31,
|
2014
|
2013
|
2012
|
|||||||
|
Shares issued, balance at beginning of year
|
174,134
|
|
171,867
|
|
170,159
|
|
||||
|
Shares issued
|
1,344
|
|
2,267
|
|
1,708
|
|
||||
|
Total shares issued at end of year
|
175,478
|
|
174,134
|
|
171,867
|
|
||||
|
Treasury shares, balance at beginning of year
|
(64,649
|
)
|
(53,947
|
)
|
(44,571
|
)
|
||||
|
Shares repurchased
|
(11,752
|
)
|
(10,830
|
)
|
(9,376
|
)
|
||||
|
Shares reissued from treasury
|
349
|
|
128
|
|
—
|
|
||||
|
Total treasury shares at end of year
|
(76,052
|
)
|
(64,649
|
)
|
(53,947
|
)
|
||||
|
Total shares outstanding
|
99,426
|
|
109,485
|
|
117,920
|
|
||||
During
2014
, the total cash dividends declared per common share were
$1.10
(
2013
:
$1.02
;
2012
:
$0.97
).
Treasury shares
On December 5, 2014, our Board of Directors authorized a new share repurchase plan for up to
$750 million
of our common shares through December 31, 2016. The new plan is effective January 1, 2015.
160
AXIS CAPITAL HOLDINGS LIMITED
NOTES TO CONSOLIDATED FINANCIAL STATEMENTS
DECEMBER 31, 2014, 2013 AND 2012
|
13.
|
SHAREHOLDERS' EQUITY (CONTINUED)
|
The following table presents our common share repurchase activities, which are held in treasury:
|
Year ended December 31,
|
2014
|
2013
|
2012
|
||||||||||
|
In the open market:
|
|||||||||||||
|
Total shares
|
11,317
|
|
7,362
|
|
6,057
|
|
|||||||
|
Total cost
|
$
|
524,168
|
|
$
|
337,083
|
|
$
|
203,704
|
|
||||
|
Average price per share
(1)
|
$
|
46.32
|
|
$
|
45.79
|
|
$
|
33.63
|
|
||||
|
From employees:
(2)
|
|||||||||||||
|
Total shares
|
435
|
|
468
|
|
319
|
|
|||||||
|
Total cost
|
$
|
19,034
|
|
$
|
19,080
|
|
$
|
10,483
|
|
||||
|
Average price per share
(1)
|
$
|
43.82
|
|
$
|
40.75
|
|
$
|
32.85
|
|
||||
|
From founding shareholder:
(3)
|
|||||||||||||
|
Total shares
|
—
|
|
3,000
|
|
3,000
|
|
|||||||
|
Total cost
|
$
|
—
|
|
$
|
116,100
|
|
$
|
103,500
|
|
||||
|
Average price per share
(1)
|
$
|
—
|
|
$
|
38.70
|
|
$
|
34.50
|
|
||||
|
Total
|
|||||||||||||
|
Total shares
|
11,752
|
|
10,830
|
|
9,376
|
|
|||||||
|
Total cost
|
$
|
543,202
|
|
$
|
472,263
|
|
$
|
317,687
|
|
||||
|
Average price per share
(1)
|
$
|
46.22
|
|
$
|
43.61
|
|
$
|
33.88
|
|
||||
|
(1)
|
Calculated using whole figures.
|
|
(2)
|
To satisfy withholding tax liabilities upon vesting of restricted stock, restricted stock units, and exercise of stock options. Share repurchases from employees are excluded from the authorized share repurchase plans noted above.
|
|
(3)
|
Represents privately negotiated repurchases of
3,000,000
of our common shares from Trident II, L.P and affiliated entities in both 2013 and 2012.
|
|
b)
|
Preferred Shares
|
Series A Preferred Shares
During October 2005, we issued
$250 million
of
7.25%
Series A preferred shares, par value
$0.0125
per share, with a liquidation preference of
$25.00
per share. In 2012, concurrent with the issuance of our Series C preferred shares (see below), we redeemed
6,000,000
of the
7.25%
Series A preferred shares, representing
$150 million
in aggregate liquidation preference, without accumulation of any undeclared dividends. In connection with this redemption, we recognized a
$5 million
loss on redemption (calculated as the difference between the redemption price and the carrying value), which was recognized as a reduction in determining our net income available to common shareholders.
During June 2013, we redeemed the remaining
4,000,000
Series A preferred shares outstanding, representing an aggregate liquidation preference of
$100 million
. In connection with this redemption, we recognized a
$3 million
loss.
In
2013
, the total dividends declared on Series A preferred shares were
$0.9063
per share. In 2013, dividends of
$1.3594
per share were paid, of which
$0.4531
had been declared in
2012
. In
2012
, the total dividends declared and paid on Series A preferred shares were
$1.8125
per share.
161
AXIS CAPITAL HOLDINGS LIMITED
NOTES TO CONSOLIDATED FINANCIAL STATEMENTS
DECEMBER 31, 2014, 2013 AND 2012
|
13.
|
SHAREHOLDERS' EQUITY (CONTINUED)
|
Series B Preferred Shares
During November 2005, we issued
$250 million
of
7.50%
Series B preferred shares, par value
$0.0125
per share, with a liquidation preference of
$100.00
per share. We may redeem the shares on or after December 1, 2015 at a redemption price of
$100.00
per share. Dividends on the Series B preferred shares if, as and when declared by our board of directors will be payable initially at a fixed rate per annum equal to
7.50%
of the liquidation preference on the first day of March, June, September and December of each year, commencing on March 1, 2006, up to but not including
December 1, 2015
. Commencing on March 1, 2016, the dividend rate on the Series B preferred shares will be payable at a floating rate. During a floating rate period, the floating rate per annum will be reset quarterly at a rate equal to
3.4525%
plus the
3 month
LIBOR Rate. Dividends on the Series B preferred shares are non-cumulative.
During April 2012, we closed a cash tender offer for any and all of our outstanding
7.50%
Series B preferred shares at a purchase price of
$102.81
per share. As a result, we purchased
2,471,570
Series B preferred shares for
$254 million
. In connection with this tender offer, we recognized a
$9 million
loss on redemption (calculated as the difference between the redemption price and the carrying value), which was recognized as a reduction in determining our net income available to common shareholders. Following the completion of the tender offer,
28,430
Series B preferred shares, representing
$3 million
in aggregate liquidation preference, remain outstanding.
In
2014
,
2013
and
2012
, total dividends declared and paid on Series B preferred shares were
$7.50
per share.
Series C Preferred Shares
During
March 2012
, we issued
$400 million
of
6.875%
Series C preferred shares, par value
$0.0125
per share, with a liquidation preference of
$25.00
per share. We may redeem the Series C preferred shares on or after
April 15, 2017
at a redemption price of
$25.00
per share. Dividends on the Series C preferred shares are non-cumulative. Consequently, if the board of directors does not authorize and declare a dividend for any period, holders of the Series C preferred shares will not be entitled to receive a dividend for such period, and such undeclared dividend will not accumulate and be payable. Holders of the Series C preferred shares will be entitled to receive, only when, as and if declared by the board of directors, non-cumulative cash dividends from the original issue date, quarterly in arrears on the fifteenth day of January, April, July and October of each year, commencing on July 15, 2012, without accumulation of any undeclared dividends. To the extent declared, these dividends will accumulate, with respect to each dividend period, in an amount per share equal to
6.875%
of the liquidation preference per annum.
For
2014
and
2013
, the total dividends declared and paid on Series C preferred shares were
$1.7188
per share in each year. For 2012, the total dividends declared on Series C preferred shares were
$1.4132
per share. Of this amount,
$0.9835
was paid in 2012 and the remaining
$0.4297
was subsequently paid in 2013.
Series D Preferred Shares
During May 2013, we issued
$225 million
of
5.50%
Series D preferred shares, par value
$0.0125
per share, with a liquidation preference of
$25.00
per share. We may redeem the Series D preferred shares on or after
June 1, 2018
at a redemption price of
$25.00
per share. Dividends on the Series D preferred shares are non-cumulative. Consequently, if the Board of Directors does not authorize and declare a dividend for any period, holders of the Series D preferred shares will not be entitled to receive a dividend for such period, and such undeclared dividend will not accumulate and be payable. Holders of the Series D preferred shares will be entitled to receive, only when, as and if declared by the Board of Directors, non-cumulative cash dividends from the original issue date, quarterly in arrears on the first day of March, June, September and December of each year, commencing on September 1, 2013, without accumulation of any undeclared dividends. To the extent declared, these dividends will accumulate, with respect to each dividend period, in an amount per share equal to
5.50%
of the liquidation preference per annum.
162
AXIS CAPITAL HOLDINGS LIMITED
NOTES TO CONSOLIDATED FINANCIAL STATEMENTS
DECEMBER 31, 2014, 2013 AND 2012
|
13.
|
SHAREHOLDERS' EQUITY (CONTINUED)
|
In
2014
, total dividends declared and paid on Series D preferred shares were
$1.3750
per share. In
2013
, the total dividends declared on Series D preferred shares were
$0.6875
per share. Of this amount,
$0.3438
was paid in 2013 and the remaining
$0.3438
was subsequently paid in 2014.
The holders of the Series D preferred shares, as well as our previously issued preferred shares, have no voting rights other than the right to elect a specified number of directors if preferred share dividends are not declared and paid for a specified period.
|
c)
|
Out of Period Adjustment
|
Common share dividends were historically recognized as a reduction of retained earnings when paid. During 2012, we recognized a
$31 million
adjustment in our Consolidated Statement of Shareholders' Equity in order to reflect dividends within retained earnings when declared, with a corresponding increase in other liabilities in our Consolidated Balance Sheet. This adjustment did not impact net income or net income available to common shareholders.
We believe that this matter was quantitatively and qualitatively immaterial to our previously issued financial statements and that the recognition of the adjustment in 2012 was similarly immaterial.
|
14.
|
NONCONTROLLING INTERESTS
|
During November 2013, the Company formed AXIS Ventures Reinsurance Limited ("Ventures Re"), a Bermuda domiciled insurer. Ventures Re was formed to write reinsurance on a fully collateralized basis.
Following the formation of Ventures Re, third party investors purchased
$50 million
of Class A non-voting redeemable preferred share capital issued by this entity. The Ventures Re Class A preferred shares are redeemable at the sole discretion of Ventures Re's Board of Directors. During the third quarter of 2014,
$10 million
was returned to the Ventures Re Class A preferred share capital holders as part of a reduction of Ventures Re's share premium account.
During the third quarter of 2014, third party investors purchased
$25 million
of Class B non-voting redeemable preferred share capital issued by Ventures Re. The Ventures Re Class B preferred shares are redeemable at the sole discretion of Ventures Re's Board of Directors.
Ventures Re is considered to be a variable interest entity. The Company has concluded that it is the primary beneficiary of Ventures Re as it has the power to direct, and has more than an insignificant economic interest in, the activities of this entity. Following this determination, Ventures Re was consolidated by the Company. Shareholders' equity attributable to Ventures Re's third party investors is recorded in the Consolidated Financial Statements as noncontrolling interests.
At December 31, 2014, total assets of Ventures Re were
$97 million
(2013:
$50 million
), consisting primarily of cash and cash equivalents and insurance receivables. Total liabilities were
$38 million
(2013: $
nil
) consisting primarily of loss reserves. The assets of Ventures Re can only be used to settle its own liabilities, and there is no recourse to the Company for any liabilities incurred by this entity.
163
AXIS CAPITAL HOLDINGS LIMITED
NOTES TO CONSOLIDATED FINANCIAL STATEMENTS
DECEMBER 31, 2014, 2013 AND 2012
|
14.
|
NONCONTROLLING INTERESTS (CONTINUED)
|
The reconciliation of the beginning and ending balance of the noncontrolling interests in Ventures Re for the year was as follows:
|
Total
|
|||||
|
2014
|
|||||
|
Balance at January 1, 2014
|
$
|
50,000
|
|
||
|
Increase from issuance of preferred equity to noncontrolling interests
|
25,000
|
|
|||
|
Decrease from return of capital to noncontrolling interests
|
(10,000
|
)
|
|||
|
Amounts attributable from noncontrolling interests
|
(6,181
|
)
|
|||
|
Balance at December 31, 2014
|
$
|
58,819
|
|
||
|
15.
|
RETIREMENT PLANS
|
We provide defined contribution plans that are self directed to eligible employees through various plans sponsored by us. Generally, mutual funds are made available pursuant to which employees and we contribute a percentage of the employee’s gross salary into the plan each month.
For eligible U.S. employees, we provide a non-qualified deferred compensation plan that enables them to make salary contributions in excess of those permitted under the AXIS 401(k) Plan, to make additional employee contributions from their bonus payments, and to receive discretionary employer contributions.
We also provided supplemental executive retirement plans (“SERP”) to both the Chairman and the former CEO. We settled all obligations under our SERP during the third quarter of 2012, resulting in the recognition of an insignificant loss.
During
2014
, our total pension expenses were
$21 million
(
2013
:
$20 million
and
2012
:
$20 million
) for the above retirement benefits.
164
AXIS CAPITAL HOLDINGS LIMITED
NOTES TO CONSOLIDATED FINANCIAL STATEMENTS
DECEMBER 31, 2014, 2013 AND 2012
|
16.
|
SHARE-BASED COMPENSATION
|
In May 2007, our shareholders approved the establishment of the AXIS Capital Holdings Limited 2007 Long-Term Equity Compensation Plan (“2007 Plan”). The 2007 Plan provides for, among other things, the grant of restricted stock, restricted stock units, non-qualified and incentive stock options, and other equity-based awards to our employees and directors. The 2007 Plan authorized the issuance of a total of
5,000,000
shares. In May of 2009 and 2012, our shareholders approved amendments to the 2007 Plan to increase the number of common shares authorized for issuance by
4,000,000
and
6,000,000
respectively, to bring the total number of common shares authorized for issuance to
15,000,000
. As a result of the adoption of the 2007 Plan, the 2003 Long-Term Equity Compensation and 2003 Directors Long-Term Equity Compensation Plan were terminated, except that all related outstanding awards will remain in effect.
We currently issue restricted stock and restricted stock units to our employees with service conditions, vesting generally over a period of 3 or
4 years
. The
3
year awards are subject to cliff vesting at the end of the 3 year period. With the 4 year awards,
25%
of the award vests annually. We also grant performance-based stock awards to certain employees in order to promote long-term growth and profitability. Performance-based awards represent the right to receive a specified number of common shares in the future, based upon the achievement of established performance criteria during the applicable performance period. Some awards have a scaled performance metric, but the actual award could be higher or lower than target. At
December 31, 2014
, we anticipate that the established performance based criterion for these awards are likely to be achieved.
Grants provided under the 2007 Plan generally allow for accelerated vesting provisions upon the employee’s death, permanent disability, or certain terminations following a change in control of the Company occurring within
two years
of the change in control event. Notwithstanding these vesting provisions, the Compensation Committee of our Board has broad authority to accelerate vesting at its own discretion.
At
December 31, 2014
,
5,868,286
equity-based awards remained available for grant under the 2007 Plan. Between January 1, 2015 and February 11, 2015, a total of
977,253
service-based restricted stock units and
78,441
performance-based restricted stock units were approved for grant by the board of directors. Included in the total restricted stock awards approved for grant subsequent to
December 31, 2014
were
485,784
awards which will be settled in cash upon vesting.
The total fair value of restricted stock and cash settled awards vested during
2014
was
$68 million
(
2013
:
$70 million
;
2012
:
$43 million
). At
December 31, 2014
, we had unrecognized compensation costs of
$112 million
(
2013
:
$98 million
) which are expected to be recognized over the weighted average period of
2.3 years
(
2013
:
2.4 years
).
We have granted stock options under the 2003 Plans; however, none have been issued since 2005. All outstanding stock options are fully vested and exercisable, and expire
ten years
from the date of the grant. All outstanding options were exercised on or before January 12, 2015.
165
AXIS CAPITAL HOLDINGS LIMITED
NOTES TO CONSOLIDATED FINANCIAL STATEMENTS
DECEMBER 31, 2014, 2013 AND 2012
|
16.
|
SHARE-BASED COMPENSATION (CONTINUED)
|
|
a)
|
Restricted Stock
|
The following table provides a reconciliation of the beginning and ending balance of nonvested restricted stock (including restricted stock units) for the year ended
December 31, 2014
:
|
Performance-based Stock Awards
|
Service-based Stock Awards
|
||||||||||||||
|
Number of
Restricted
Stock
|
Weighted Average
Grant Date
Fair Value
|
Number of
Restricted
Stock
|
Weighted Average
Grant Date
Fair Value
|
||||||||||||
|
Nonvested restricted stock - beginning of year
|
283
|
|
$
|
35.74
|
|
3,430
|
|
$
|
34.72
|
|
|||||
|
Granted
|
68
|
|
44.33
|
|
1,053
|
|
44.47
|
|
|||||||
|
Vested
|
—
|
|
—
|
|
(1,474
|
)
|
33.83
|
|
|||||||
|
Forfeited
|
(4
|
)
|
44.33
|
|
(241
|
)
|
36.96
|
|
|||||||
|
Nonvested restricted stock - end of year
|
347
|
|
$
|
37.34
|
|
2,768
|
|
$
|
38.70
|
|
|||||
(1) Fair value is based on the closing price of our common shares on the New York Stock Exchange on the day of the grant.
During
2014
, we granted
1,121,066
restricted stock awards (
2013
:
1,007,425
;
2012
:
2,447,700
) to our employees with a weighted average grant-date fair value per share of
$44.46
(
2013
:
$39.52
;
2012
:
$32.20
).
During
2014
, we incurred a compensation cost of
$73 million
(
2013
:
$57 million
;
2012
:
$68 million
) in respect of all restricted stock, restricted stock units, and cash awards, and recorded tax benefits thereon of
$14 million
(
2013
:
$10 million
;
2012
:
$8 million
). Compensation costs incurred in 2012 includes
$20 million
of accelerated and incremental expenses associated with the transition in our senior leadership. The retirement of
one
senior leader resulted in the modification of that leader's outstanding restricted stock awards to eliminate the previously existing service condition. The unanticipated termination without cause of another senior officer lead to the early satisfaction of employment obligations and resulted in the service condition associated with that officer's outstanding restricted stock awards being fully satisfied.
166
AXIS CAPITAL HOLDINGS LIMITED
NOTES TO CONSOLIDATED FINANCIAL STATEMENTS
DECEMBER 31, 2014, 2013 AND 2012
|
16.
|
SHARE-BASED COMPENSATION (CONTINUED)
|
|
b)
|
Cash-settled Awards
|
During 2014, we also granted
1,018,083
restricted stock units that will settle in cash rather than shares when the awards ultimately vest (
2013
:
847,425
). At
December 31, 2014
, the compensation expense recorded in the income statement, and corresponding liability for cash-settled awards, included in other liabilities on the Consolidated Balance Sheets, was
$21 million
(
2013
:
$9 million
).
|
c)
|
Stock options
|
The following is a summary of stock options outstanding and exercisable at
December 31, 2014
and related activity for the year ended:
|
Number
of Stock
Options
|
Weighted
Average
Exercise
Price
|
Weighted
Average
Remaining
Contractual
Term
|
Aggregate
Intrinsic
Value
(1)
|
|||||||||||
|
Outstanding and exercisable - beginning of year
|
213
|
|
$
|
27.98
|
|
|||||||||
|
Granted
|
—
|
|
—
|
|
||||||||||
|
Exercised
|
(193
|
)
|
27.97
|
|
||||||||||
|
Expired
|
—
|
|
—
|
|
||||||||||
|
Outstanding and exercisable - end of year
|
20
|
|
$
|
28.02
|
|
0.0
|
$
|
461
|
|
|||||
|
(1)
|
The aggregate intrinsic value in the table above represents the total pre-tax intrinsic value (the difference between our closing stock price at
December 31, 2014
and the exercisable price, multiplied by the number of in-the-money-options) that would have been received by the stock option holder had all stock option holders exercised their stock options on
December 31, 2014
.
|
The total intrinsic value of stock options exercised during
2014
was
$4 million
(
2013
:
$10 million
) and we received proceeds of
$5 million
(
2013
:
$17 million
). For these exercised stock options, we issued new shares from the authorized share capital pool rather than from our treasury pool.
|
17.
|
RELATED PARTY TRANSACTIONS
|
The transactions listed below are classified as related party transactions as each counterparty had or has had either a direct or indirect shareholding in us or has been a board member during any period covered by the financial statements.
The collateral manager of
four
of our CLOs is Blackstone Debt Advisors L.P., is entitled to management fees payable by the collateralized obligations in the ordinary course of business. We also have investments in
two
hedge funds managed by Blackstone Alternative Asset Management, LP, who is entitled to management fees in the ordinary course of business. On June 30, 2012, Blackstone Group ceased to be a related party. Fees due or paid for the six months ended June 30, 2012 were
$1 million
.
In the ordinary course of business, we engage SKY Harbor Capital Management, LLC for asset management services for certain of our short duration high yield debt portfolios and StoneRiver RegEd for broker and adjuster licensing, appointment and compliance services. During
2014
, total fees paid to these Stone Point Group companies were
$4 million
(
2013
:
$2 million
;
2012
:
$2 million
).
We currently have
$30 million
committed to the NXT Capital Senior Loan Fund II. The manager of NXT Capital Senior Loan Fund II is an indirect subsidiary of NXT Capital Holdings, L.P. ("NXT Capital"). Stone Point Capital, LLC, through an affiliated fund, owns approximately
45%
of NXT Capital. During 2014, fees paid to NXT Capital totaled less than
$1 million
.
167
AXIS CAPITAL HOLDINGS LIMITED
NOTES TO CONSOLIDATED FINANCIAL STATEMENTS
DECEMBER 31, 2014, 2013 AND 2012
|
17.
|
RELATED PARTY TRANSACTIONS (CONTINUED)
|
Our Chairman, Mr. Butt, received
$1 million
in consulting fee payments in 2014 pursuant to the terms of a consulting agreement by and between Mr. Butt and the Company dated May 3, 2012, as amended December 5, 2013, and December 4, 2014 (2013:
$1 million
; 2012:
nil
).
|
18.
|
INCOME TAXES
|
Under current Bermuda law, our Bermuda domiciled companies are not required to pay any taxes in Bermuda on income or capital gains. We have received an assurance from the Minister of Finance in Bermuda that, in the event of any taxes being imposed, we will be exempt from taxation in Bermuda until March 2035. Our primary Bermuda subsidiary has an operating branch in Singapore, which is subject to the relevant taxes in that jurisdiction. The branch is not under examination in this tax jurisdiction, but remains subject to examination for tax years 2011 through 2014.
Our U.S. subsidiaries are subject to federal, state and local corporate income taxes and other taxes applicable to U.S. corporations. The provision for federal income taxes has been determined under the principles of the consolidated tax provisions of the U.S. Internal Revenue Code and Regulations. Should the U.S. subsidiaries pay a dividend outside the U.S. group, withholding taxes will apply. Our U.S. subsidiaries are not under examination but remain subject to examination in the U.S. for tax years 2011 through 2014.
In Canada, our U.S. reinsurance company operates through a branch and our U.S. service company has an unlimited liability company subsidiary based in Canada. These Canadian operations are subject to the relevant taxes in that jurisdiction and generally remain subject to examination for tax years 2010 through 2014.
We also have subsidiaries in Ireland, the United Kingdom (U.K.), Australia and Brazil. These subsidiaries and their branches, are not under examination, but generally remain subject to examination in all applicable jurisdictions for tax years 2010 through 2014.
The following table provides an analysis of our income tax expense and net tax assets:
|
Year ended December 31,
|
2014
|
2013
|
2012
|
||||||||||
|
Current income tax expense (benefit)
|
|||||||||||||
|
United States
|
$
|
8,411
|
|
$
|
12,466
|
|
$
|
4,931
|
|
||||
|
Europe
|
16,582
|
|
9,039
|
|
8,566
|
|
|||||||
|
Other
|
1
|
|
—
|
|
(174
|
)
|
|||||||
|
Deferred income tax expense (benefit)
|
|||||||||||||
|
United States
|
1,313
|
|
(13,976
|
)
|
(10,749
|
)
|
|||||||
|
Europe
|
(399
|
)
|
(526
|
)
|
713
|
|
|||||||
|
Other
|
—
|
|
(1
|
)
|
—
|
|
|||||||
|
Total income tax expense
|
$
|
25,908
|
|
$
|
7,002
|
|
$
|
3,287
|
|
||||
|
Net current tax receivables (payables)
|
$
|
(11,203
|
)
|
$
|
5,689
|
|
$
|
1,164
|
|
||||
|
Net deferred tax assets
|
89,405
|
|
80,258
|
|
52,794
|
|
|||||||
|
Net tax assets
|
$
|
78,202
|
|
$
|
85,947
|
|
$
|
53,958
|
|
||||
168
AXIS CAPITAL HOLDINGS LIMITED
NOTES TO CONSOLIDATED FINANCIAL STATEMENTS
DECEMBER 31, 2014, 2013 AND 2012
|
18.
|
INCOME TAXES (CONTINUED)
|
Deferred income taxes reflect the tax impact of temporary differences between the carrying amounts of assets and liabilities for financial reporting and income tax purposes. The significant components of our deferred tax assets and liabilities were as follows:
|
At December 31,
|
2014
|
2013
|
|||||||
|
Deferred tax assets:
|
|||||||||
|
Discounting of loss reserves
|
$
|
59,852
|
|
$
|
59,023
|
|
|||
|
Unearned premiums
|
39,661
|
|
39,146
|
|
|||||
|
Operating loss carryforwards
|
26,016
|
|
20,316
|
|
|||||
|
Accruals not currently deductible
|
44,082
|
|
39,018
|
|
|||||
|
Other investment adjustments and impairments
|
4,001
|
|
7,859
|
|
|||||
|
Tax credits
|
15,412
|
|
11,886
|
|
|||||
|
Depreciation
|
—
|
|
2,410
|
|
|||||
|
Other deferred tax assets
|
1,324
|
|
2,906
|
|
|||||
|
Deferred tax assets before valuation allowance
|
190,348
|
|
182,564
|
|
|||||
|
Valuation allowance
|
(34,094
|
)
|
(25,542
|
)
|
|||||
|
Deferred tax assets net of valuation allowance
|
156,254
|
|
157,022
|
|
|||||
|
Deferred tax liabilities:
|
|||||||||
|
Deferred acquisition costs
|
(37,712
|
)
|
(37,226
|
)
|
|||||
|
Net unrealized gains on investments
|
(12,792
|
)
|
(23,200
|
)
|
|||||
|
Amortization of intangible assets and goodwill
|
(10,778
|
)
|
(10,059
|
)
|
|||||
|
Accrued market discounts
|
(707
|
)
|
(1,151
|
)
|
|||||
|
Equalization reserves
|
(3,554
|
)
|
(2,080
|
)
|
|||||
|
Other deferred tax liabilities
|
(1,306
|
)
|
(3,048
|
)
|
|||||
|
Deferred tax liabilities
|
(66,849
|
)
|
(76,764
|
)
|
|||||
|
Net deferred tax assets
|
$
|
89,405
|
|
$
|
80,258
|
|
|||
At
December 31, 2014
, the total operating loss carryforwards for our Singapore and Australian branches were
$110 million
(
2013
:
$115 million
) and
$68 million
(
2013
:
$45 million
), respectively. Such operating losses are currently available to offset future taxable income of the branches and may be carried forward indefinitely in each jurisdiction. At
December 31, 2014
, our European subsidiaries have a
$7 million
(
2013
:
$4 million
) foreign tax credit which can be carried forward indefinitely. In addition, at
December 31, 2014
, our U.S. companies have a
$8 million
(
2013
:
$7 million
) alternative minimum tax credit that can be carried forward indefinitely.
169
AXIS CAPITAL HOLDINGS LIMITED
NOTES TO CONSOLIDATED FINANCIAL STATEMENTS
DECEMBER 31, 2014, 2013 AND 2012
|
18.
|
INCOME TAXES (CONTINUED)
|
The following table provides an analysis of the movement in our valuation allowance:
|
At December 31,
|
2014
|
2013
|
|||||||
|
Income tax expense:
|
|||||||||
|
Valuation allowance - beginning of year
|
$
|
27,070
|
|
$
|
33,933
|
|
|||
|
Operating loss carryforwards
|
3,044
|
|
(794
|
)
|
|||||
|
Capital loss carryforwards
|
1,262
|
|
—
|
|
|||||
|
Foreign tax credit
|
3,194
|
|
1,762
|
|
|||||
|
Australian CTA and accruals and rate differentials
|
1,052
|
|
—
|
|
|||||
|
Change in investment-related items
|
(757
|
)
|
(7,831
|
)
|
|||||
|
Valuation allowance - end of year
|
34,865
|
|
27,070
|
|
|||||
|
Accumulated other comprehensive income:
|
|||||||||
|
Valuation allowance - beginning of year
|
(1,528
|
)
|
(9,359
|
)
|
|||||
|
Change in investment-related items
|
757
|
|
7,831
|
|
|||||
|
Valuation allowance - end of year
|
(771
|
)
|
(1,528
|
)
|
|||||
|
Total valuation allowance - end of year
|
$
|
34,094
|
|
$
|
25,542
|
|
|||
At
December 31, 2014
and
2013
, we established a full valuation allowance on: (1) operating loss carryforwards relating to branch operations in Australia and Singapore due to cumulative losses in recent years; (2) unutilized foreign tax credits available in Ireland and (3) certain other deferred tax assets related to branch operations.
Although realization is not assured, management believes it is more likely than not that the tax benefit of the recorded net deferred tax assets will be realized. Other than the items discussed above, the remaining gross deferred tax assets relate substantially to our U.S. operations. In evaluating our ability to recover these tax assets within the jurisdiction from which they arise, we consider all available positive and negative evidence, including historical results, operating loss carryback potential and scheduled reversals of deferred tax liabilities. Our U.S. operations have produced significant taxable income in prior periods and have deferred tax liabilities that will reverse in future periods such that we believe sufficient ordinary taxable income is available to utilize all remaining ordinary deferred tax assets. In
2014
and
2013
, there were sufficient net unrealized gains to offset remaining impairments, therefore a valuation allowance on such impairments in the U.S., was not considered necessary.
There were no unrecognized tax benefits at December 31,
2014
and
2013
.
170
AXIS CAPITAL HOLDINGS LIMITED
NOTES TO CONSOLIDATED FINANCIAL STATEMENTS
DECEMBER 31, 2014, 2013 AND 2012
|
18.
|
INCOME TAXES (CONTINUED)
|
The following table presents the distribution of income before income taxes between domestic and foreign jurisdictions as well as a reconciliation of the actual income tax rate to the amount computed by applying the effective tax rate of
0%
under Bermuda law to income before income taxes:
|
Year ended December 31,
|
2014
|
2013
|
2012
|
||||||||||
|
Income before income taxes
|
|||||||||||||
|
Bermuda (domestic)
|
$
|
690,517
|
|
$
|
625,490
|
|
$
|
485,613
|
|
||||
|
Foreign
|
139,955
|
|
108,977
|
|
64,915
|
|
|||||||
|
Total income before income taxes
|
$
|
830,472
|
|
$
|
734,467
|
|
$
|
550,528
|
|
||||
|
Reconciliation of effective tax rate (% of income before income taxes)
|
|||||||||||||
|
Expected tax rate
|
0.0
|
%
|
0.0
|
%
|
0.0
|
%
|
|||||||
|
Foreign taxes at local expected rates:
|
|||||||||||||
|
United States
|
1.8
|
%
|
2.1
|
%
|
0.4
|
%
|
|||||||
|
Europe
|
1.5
|
%
|
1.0
|
%
|
1.4
|
%
|
|||||||
|
Other
|
—
|
%
|
0.3
|
%
|
—
|
%
|
|||||||
|
Valuation allowance
|
1.1
|
%
|
(0.7
|
)%
|
0.6
|
%
|
|||||||
|
Net tax exempt income
|
(0.7
|
)%
|
(1.3
|
)%
|
(1.5
|
)%
|
|||||||
|
Other
|
(0.6
|
)%
|
(0.4
|
)%
|
(0.3
|
)%
|
|||||||
|
Actual tax rate
|
3.1
|
%
|
1.0
|
%
|
0.6
|
%
|
|||||||
171
AXIS CAPITAL HOLDINGS LIMITED
NOTES TO CONSOLIDATED FINANCIAL STATEMENTS
DECEMBER 31, 2014, 2013 AND 2012
|
19.
|
OTHER COMPREHENSIVE INCOME (LOSS)
|
The tax effects allocated to each component of other comprehensive income (loss) were as follows:
|
Before Tax Amount
|
Tax (Expense) Benefit
|
Net of Tax Amount
|
|||||||||||
|
Year ended December 31, 2014
|
|||||||||||||
|
Available for sale investments:
|
|||||||||||||
|
Unrealized investment losses arising during the year
|
$
|
(22,704
|
)
|
$
|
(15,963
|
)
|
$
|
(38,667
|
)
|
||||
|
Adjustment for reclassification of net realized investment gains and OTTI losses recognized in net income
|
(141,172
|
)
|
26,702
|
|
(114,470
|
)
|
|||||||
|
Unrealized investment losses arising during the year, net of reclassification adjustment
|
(163,876
|
)
|
10,739
|
|
(153,137
|
)
|
|||||||
|
Non-credit portion of OTTI losses
|
—
|
|
—
|
|
—
|
|
|||||||
|
Foreign currency translation adjustment
|
(10,262
|
)
|
—
|
|
(10,262
|
)
|
|||||||
|
Total other comprehensive loss
|
$
|
(174,138
|
)
|
$
|
10,739
|
|
$
|
(163,399
|
)
|
||||
|
Year ended December 31, 2013
|
|||||||||||||
|
Available for sale investments:
|
|||||||||||||
|
Unrealized investment losses arising during the year
|
$
|
(169,614
|
)
|
$
|
7,782
|
|
$
|
(161,832
|
)
|
||||
|
Adjustment for reclassification of net realized investment gains and OTTI losses recognized in net income
|
(67,156
|
)
|
5,605
|
|
(61,551
|
)
|
|||||||
|
Unrealized investment losses arising during the year, net of reclassification adjustment
|
(236,770
|
)
|
13,387
|
|
(223,383
|
)
|
|||||||
|
Non-credit portion of OTTI losses
|
—
|
|
—
|
|
—
|
|
|||||||
|
Foreign currency translation adjustment
|
(21,414
|
)
|
—
|
|
(21,414
|
)
|
|||||||
|
Total other comprehensive loss
|
$
|
(258,184
|
)
|
$
|
13,387
|
|
$
|
(244,797
|
)
|
||||
|
Year ended December 31, 2012
|
|||||||||||||
|
Available for sale investments:
|
|||||||||||||
|
Unrealized investment gains arising during the year
|
$
|
378,040
|
|
$
|
(29,530
|
)
|
$
|
348,510
|
|
||||
|
Adjustment for reclassification of net realized investment gains and OTTI losses recognized in net income
|
(127,828
|
)
|
11,550
|
|
(116,278
|
)
|
|||||||
|
Unrealized investment gains arising during the year, net of reclassification adjustment
|
250,212
|
|
(17,980
|
)
|
232,232
|
|
|||||||
|
Non-credit portion of OTTI losses
|
—
|
|
—
|
|
—
|
|
|||||||
|
Foreign currency translation adjustment
|
510
|
|
—
|
|
510
|
|
|||||||
|
Net change in benefit plan assets and obligations recognized in equity and reclassification adjustment
|
1,718
|
|
—
|
|
1,718
|
|
|||||||
|
Total other comprehensive income
|
$
|
252,440
|
|
$
|
(17,980
|
)
|
$
|
234,460
|
|
||||
172
AXIS CAPITAL HOLDINGS LIMITED
NOTES TO CONSOLIDATED FINANCIAL STATEMENTS
DECEMBER 31, 2014, 2013 AND 2012
|
19.
|
OTHER COMPREHENSIVE INCOME (LOSS) (CONTINUED)
|
Reclassifications out of AOCI into net income available to common shareholders were as follows:
|
Amount Reclassified from AOCI
(1)
|
|||||||||||||||
|
Details About AOCI Components
|
Consolidated Statement of Operations Line Item That Includes Reclassification
|
Year ended December 31,
|
|||||||||||||
|
2014
|
2013
|
2012
|
|||||||||||||
|
Unrealized appreciation on available for sale investments
|
|||||||||||||||
|
Other realized investment gains
|
$
|
172,399
|
|
$
|
76,518
|
|
$
|
152,062
|
|
||||||
|
OTTI losses
|
(31,227
|
)
|
(9,362
|
)
|
(24,234
|
)
|
|||||||||
|
Total before tax
|
141,172
|
|
67,156
|
|
127,828
|
|
|||||||||
|
Tax expense
|
(26,702
|
)
|
(5,605
|
)
|
(11,550
|
)
|
|||||||||
|
Net of tax
|
$
|
114,470
|
|
$
|
61,551
|
|
$
|
116,278
|
|
||||||
|
Supplemental Executive Retirement Plans (SERPs)
|
|||||||||||||||
|
Net change in benefit plan assets and obligations
|
General and administrative expenses
|
$
|
—
|
|
$
|
—
|
|
$
|
(1,718
|
)
|
|||||
|
Tax benefit
|
—
|
|
—
|
|
—
|
|
|||||||||
|
Net of tax
|
$
|
—
|
|
$
|
—
|
|
$
|
(1,718
|
)
|
||||||
|
(1)
|
Amounts in parentheses are debits to net income available to common shareholders
|
|
20.
|
STATUTORY FINANCIAL INFORMATION
|
Our (re)insurance operations are subject to insurance and/or reinsurance laws and regulations in the jurisdictions in which they operate, the most significant of which include Bermuda, Ireland and the United States. These regulations include certain restrictions on the amount of dividends or other distributions, such as loans or cash advances, available to shareholders without prior approval of the insurance regulatory authorities.
The statutory capital and surplus in each of our most significant regulatory jurisdictions at
December 31,
2014
and
2013
was as follows:
|
Bermuda
|
Ireland
|
United States
|
||||||||||||||||||||
|
At December 31,
|
2014
|
2013
|
2014
|
2013
|
2014
|
2013
|
||||||||||||||||
|
Required statutory capital and surplus
|
$
|
1,972,951
|
|
$
|
1,996,794
|
|
$
|
299,758
|
|
$
|
315,258
|
|
$
|
415,011
|
|
$
|
385,651
|
|
||||
|
Available statutory capital and surplus
|
$
|
3,729,925
|
|
$
|
3,839,840
|
|
$
|
788,882
|
|
$
|
792,427
|
|
$
|
1,443,032
|
|
$
|
1,348,861
|
|
||||
Under the Insurance Act 1978, amendments thereto and Related Regulations of Bermuda (the "Act"), our Bermuda subsidiary, AXIS Specialty Bermuda is required to maintain minimum statutory capital and surplus equal to the greater of a minimum solvency margin ("MSM") and the Enhanced Capital Requirement ("ECR"). The MSM is the greater of
$100 million
,
50%
of net written premiums or
15%
of the net reserve for losses and loss adjustment expenses and the ECR is calculated based on either an internally developed risk-based capital model or a standard risk-based capital model developed by the Bermuda Monetary Authority. Under the Act, AXIS Specialty Bermuda is restricted as to the payment of dividends and/or distributions for amounts greater than
25%
of the prior year’s statutory capital and surplus, whereby a signed affidavit by at least
two
members of the Board of Directors attesting that a dividend and/or distribution in excess of this amount would
173
AXIS CAPITAL HOLDINGS LIMITED
NOTES TO CONSOLIDATED FINANCIAL STATEMENTS
DECEMBER 31, 2014, 2013 AND 2012
|
20.
|
STATUTORY FINANCIAL INFORMATION (CONTINUED)
|
not cause the company to fail to meet its relevant margins is required. At
December 31,
2014
, the maximum dividend/distribution AXIS Specialty Bermuda could pay, without a signed affidavit, having met minimum levels of statutory capital and surplus requirements, was approximately
$932 million
.
Our Irish subsidiaries, AXIS Specialty Europe SE and AXIS Re SE, are required to maintain minimum levels of statutory and capital surplus. At
December 31,
2014
, our subsidiaries were in compliance with these requirements. Our Irish subsidiaries may declare dividends out of retained earnings subject to meeting their solvency and capital requirements, which are to hold statutory capital and surplus equal to or exceeding the Required Solvency Margin ("RSM"). The RSM is calculated with reference to Solvency I regulations. The maximum dividend is limited to "profits available for distribution", which consists of accumulated realized profits less accumulated realized losses and statutory reserves. At
December 31,
2014
, the maximum dividend our Irish subsidiaries could pay out of retained earnings, after obtaining prior approval from the Irish regulator, was approximately
$177 million
.
Our U.S. operations required statutory capital and surplus is determined using risk based capital tests, which is the threshold that constitutes the authorized control level. If a company falls below the control level, the commissioner is authorized to take whatever regulatory actions may be considered necessary to protect policyholders and creditors. The maximum dividend that may be paid by our U.S. insurance subsidiaries is restricted by the regulatory requirements of the domiciliary states. Generally, the maximum dividend that may be paid by each of our U.S. insurance subsidiaries is limited to unassigned surplus (statutory equivalent of retained earnings) and may also be limited to statutory net income, net investment income or
10%
of total statutory capital and surplus. At
December 31,
2014
, the maximum dividend that our U.S. insurance operations could pay without regulatory approval was approximately
$144 million
.
Our operating subsidiaries in Bermuda and the United States maintain branch offices in Singapore and Canada, respectively. Our Irish operating subsidiaries maintain branch offices in Switzerland, Australia and the United Kingdom. As branch offices are not considered separate entities for regulatory purposes, the required and actual statutory capital and surplus amounts for each jurisdiction in the table above include amounts related to the applicable branch offices. Our Singaporean, Australian and Canadian branch offices are subject to additional minimum capital or asset requirements in their countries of domicile. At
December 31,
2014
and
2013
, the actual capital/assets for each of these branches exceeded the relevant local regulatory requirements.
Total statutory net income of our operating subsidiaries was
$884 million
,
$766 million
,
$697 million
for
2014
,
2013
and
2012
, respectively. The differences between statutory financial statements and statements prepared in accordance with U.S. GAAP vary by jurisdiction; however, the primary differences are that statutory financial statements do not reflect deferred acquisition costs, certain net deferred tax assets, goodwill and intangible assets, unrealized appreciation on debt securities or certain unauthorized reinsurance recoverables.
174
AXIS CAPITAL HOLDINGS LIMITED
NOTES TO CONSOLIDATED FINANCIAL STATEMENTS
DECEMBER 31, 2014, 2013 AND 2012
21. UNAUDITED CONDENSED QUARTERLY FINANCIAL DATA
The following is an unaudited summary of our quarterly financial results:
|
Quarters ended
|
Mar 31
|
Jun 30
|
Sep 30
|
Dec 31
|
|||||||||||||
|
2014
|
|||||||||||||||||
|
Net premiums earned
|
$
|
945,949
|
|
$
|
1,000,400
|
|
$
|
966,138
|
|
$
|
958,517
|
|
|||||
|
Net investment income
|
82,744
|
|
114,867
|
|
66,562
|
|
78,595
|
|
|||||||||
|
Net realized investment gains
|
10,620
|
|
33,261
|
|
77,448
|
|
10,779
|
|
|||||||||
|
Underwriting income
|
108,766
|
|
126,581
|
|
113,464
|
|
112,720
|
|
|||||||||
|
Net income attributable to AXIS Capital
|
147,249
|
|
200,686
|
|
289,126
|
|
173,685
|
|
|||||||||
|
Net income available to common shareholders
|
137,227
|
|
190,664
|
|
279,104
|
|
163,663
|
|
|||||||||
|
Earnings per common share - basic
|
$
|
1.26
|
|
$
|
1.81
|
|
$
|
2.71
|
|
$
|
1.63
|
|
|||||
|
Earnings per common share - diluted
|
$
|
1.24
|
|
$
|
1.79
|
|
$
|
2.68
|
|
$
|
1.60
|
|
|||||
|
2013
|
|||||||||||||||||
|
Net premiums earned
|
$
|
874,039
|
|
$
|
945,873
|
|
$
|
945,242
|
|
$
|
941,911
|
|
|||||
|
Net investment income
|
108,908
|
|
83,112
|
|
103,429
|
|
113,863
|
|
|||||||||
|
Net realized investment gains (losses)
|
44,478
|
|
16,235
|
|
(4,708
|
)
|
19,558
|
|
|||||||||
|
Underwriting income
|
170,799
|
|
9,921
|
|
153,088
|
|
94,159
|
|
|||||||||
|
Net income attributable to AXIS Capital
|
311,557
|
|
83,725
|
|
150,635
|
|
181,546
|
|
|||||||||
|
Net income available to common shareholders
|
302,816
|
|
72,447
|
|
137,121
|
|
171,524
|
|
|||||||||
|
Earnings per common share - basic
|
$
|
2.59
|
|
$
|
0.63
|
|
$
|
1.23
|
|
$
|
1.55
|
|
|||||
|
Earnings per common share - diluted
|
$
|
2.55
|
|
$
|
0.62
|
|
$
|
1.21
|
|
$
|
1.52
|
|
|||||
|
22.
|
SUBSEQUENT EVENTS
|
On January 25, 2015, the Company announced the signing of a definitive amalgamation agreement with PartnerRe Ltd. PartnerRe Ltd., through its principal operating subsidiaries, provides reinsurance and certain specialty insurance lines on a worldwide basis. The transaction is expected to close in the second half of 2015, subject to approval by the shareholders of both companies, regulatory clearance and customary closing conditions.
175
|
ITEM 9.
|
CHANGES IN AND DISAGREEMENTS WITH ACCOUNTANTS ON ACCOUNTING AND FINANCIAL DISCLOSURE
|
None.
|
ITEM 9A.
|
CONTROLS AND PROCEDURES
|
Disclosure Controls and Procedures
The Company’s management has performed an evaluation, with the participation of the Company’s Chief Executive Officer and Chief Financial Officer, of the effectiveness of our disclosure controls and procedures (as defined in Rules 13a-15(e) and 15d-15(e) of the Securities Exchange Act of 1934 (the “Exchange Act”)) as of
December 31, 2014
. Based upon that evaluation, our Chief Executive Officer and Chief Financial Officer concluded that, as of
December 31, 2014
, our disclosure controls and procedures are effective to ensure that information required to be disclosed by us in reports that we file or submit under the Exchange Act is recorded, processed, summarized and reported within the time periods specified in the rules and forms of the SEC and is accumulated and communicated to management, including its principal executive and principal financial officers, as appropriate to allow timely decisions regarding required disclosures.
Management’s Annual Report on Internal Control Over Financial Reporting
The Company’s management is responsible for establishing and maintaining adequate internal control over financial reporting (as defined in Rules 13a-15(f) and 15d-15(f) of the Exchange Act). The Company’s management has performed an assessment, with the participation of the Company’s Chief Executive Officer and the Company’s Chief Financial Officer, of our internal control over financial reporting as of
December 31, 2014
. In making this assessment, management used the criteria set forth by the Committee of Sponsoring Organizations of the Treadway Commission in Internal Control-Integrated Framework (2013). Based upon that assessment, the Company’s management believes that, as of
December 31, 2014
, our internal control over financial reporting is effective to provide reasonable assurance regarding the reliability of financial reporting and the preparation of financial statements for external purposes in accordance with generally accepted accounting principles.
Our independent registered public accounting firm has issued an audit report on our assessment of our internal control over financial reporting as of
December 31, 2014
. This report appears below.
All internal control systems, no matter how well designed, have inherent limitations. As a result, even those internal control systems determined to be effective can provide only reasonable assurance with respect to financial reporting and the preparation of financial statements.
Changes in Internal Control Over Financial Reporting
The Company’s management has performed an evaluation, with the participation of the Company’s Chief Executive Officer and the Company’s Chief Financial Officer, of changes in the Company’s internal control over financial reporting that occurred during the quarter ended
December 31, 2014
. Based upon that evaluation, there were no changes in our internal control over financial reporting that occurred during the quarter ended
December 31, 2014
that have materially affected, or are reasonably likely to materially affect, our internal control over financial reporting.
176
Attestation Report of the Independent Registered Public Accounting Firm
REPORT OF INDEPENDENT REGISTERED PUBLIC ACCOUNTING FIRM
To the Board of Directors and Shareholders of
AXIS Capital Holdings Limited
We have audited the internal control over financial reporting of AXIS Capital Holdings Limited and subsidiaries (the “Company”) as of
December 31, 2014
, based on criteria established in Internal Control – Integrated Framework (2013) issued by the Committee of Sponsoring Organizations of the Treadway Commission. The Company’s management is responsible for maintaining effective internal control over financial reporting and for its assessment of the effectiveness of internal control over financial reporting, included in the accompanying Management’s Annual Report on Internal Controls Over Financial Reporting. Our responsibility is to express an opinion on the Company’s internal control over financial reporting based on our audit.
We conducted our audit in accordance with the standards of the Public Company Accounting Oversight Board (United States). Those standards require that we plan and perform the audit to obtain reasonable assurance about whether effective internal control over financial reporting was maintained in all material respects. Our audit included obtaining an understanding of internal control over financial reporting, assessing the risk that a material weakness exists, testing and evaluating the design and operating effectiveness of internal control based on the assessed risk, and performing such other procedures as we considered necessary in the circumstances. We believe that our audit provides a reasonable basis for our opinion.
A company’s internal control over financial reporting is a process designed by, or under the supervision of, the company’s principal executive and principal financial officers, or persons performing similar functions, and effected by the company’s board of directors, management, and other personnel to provide reasonable assurance regarding the reliability of financial reporting and the preparation of financial statements for external purposes in accordance with generally accepted accounting principles. A company’s internal control over financial reporting includes those policies and procedures that (1) pertain to the maintenance of records that, in reasonable detail, accurately and fairly reflect the transactions and dispositions of the assets of the company; (2) provide reasonable assurance that transactions are recorded as necessary to permit preparation of financial statements in accordance with generally accepted accounting principles, and that receipts and expenditures of the company are being made only in accordance with authorizations of management and directors of the company; and (3) provide reasonable assurance regarding prevention or timely detection of unauthorized acquisition, use, or disposition of the company’s assets that could have a material effect on the financial statements.
Because of the inherent limitations of internal control over financial reporting, including the possibility of collusion or improper management override of controls, material misstatements due to error or fraud may not be prevented or detected on a timely basis. Also, projections of any evaluation of the effectiveness of the internal control over financial reporting to future periods are subject to the risk that the controls may become inadequate because of changes in conditions, or that the degree of compliance with the policies or procedures may deteriorate.
In our opinion, the Company maintained, in all material respects, effective internal control over financial reporting as of
December 31, 2014
, based on the criteria established in Internal Control – Integrated Framework (2013) issued by the Committee of Sponsoring Organizations of the Treadway Commission.
We have also audited, in accordance with the standards of the Public Company Accounting Oversight Board (United States), the consolidated financial statements as of and for the year ended
December 31, 2014
of the Company and our report dated
February 20,
2015
expressed an unqualified opinion on those financial statements.
|
/s/ Deloitte Ltd.
|
|
Hamilton, Bermuda
|
|
February 20, 2015
|
177
|
ITEM 9B.
|
OTHER INFORMATION
|
Not applicable.
|
ITEM 10.
|
DIRECTORS, EXECUTIVE OFFICERS AND CORPORATE GOVERNANCE
|
Directors and Executive Officers of the Registrant
The directors and executive officers of AXIS Capital Holdings Limited as of the date of this filing are:
|
Name
|
Age
|
Position
|
|
Michael A. Butt
|
72
|
Chairman of the Board of Directors
|
|
Albert A. Benchimol
|
57
|
Chief Executive Officer and President
|
|
Christopher N. DiSipio
|
52
|
Chief Executive Officer, AXIS Accident & Health
|
|
Joseph C. Henry
|
62
|
Executive Vice President and Chief Financial Officer
|
|
John D. Nichols
|
54
|
Chief Executive Officer, AXIS Reinsurance
|
|
Peter W. Wilson
|
55
|
Chief Executive Officer, AXIS Insurance
|
|
Geoffrey Bell
|
75
|
Independent Director
|
|
Jane Boisseau
|
69
|
Independent Director
|
|
Charles A. Davis
|
66
|
Independent Director
|
|
Robert L. Friedman
|
71
|
Independent Director
|
|
Christopher V. Greetham
|
70
|
Independent Director
|
|
Maurice A. Keane
|
73
|
Independent Director
|
|
Sir Andrew Large
|
72
|
Independent Director
|
|
Cheryl-Ann Lister
|
58
|
Independent Director
|
|
Thomas C. Ramey
|
71
|
Independent Director
|
|
Henry B. Smith
|
66
|
Independent Director
|
|
Alice Young
|
64
|
Independent Director
|
|
Wilhelm Zeller
|
70
|
Independent Director
|
Michael A. Butt
has served as Chairman of the Board or a director since September 2002. Mr. Butt has over 46 years of insurance industry experience. From 1982 to 1986, Mr. Butt was the Chairman of Sedgwick Limited and Vice Chairman of the Sedgwick Group plc. From 1987 to 1992, Mr. Butt served as Chairman and Chief Executive Officer of Eagle Star Holdings plc and Eagle Star Insurance Company. From 1993 to 1998, Mr. Butt was Chief Executive Officer and President of Mid Ocean Limited. From 1998 to August 2002, Mr. Butt was a director of XL Capital Ltd. Mr. Butt also is a former director of the Farmers Insurance Group, BAT Industries and Instituto Nazionale delle Assicuranzioni. Mr. Butt also was the Chairman of the Association of Bermuda Insurers and Reinsurers from January 2008 through December 2009. In 2011, Mr. Butt was appointed as an Officer of the Order of the British Empire to commemorate his distinguished contributions over the past 20 years toward the building of the Bermuda reinsurance industry.
Albert A. Benchimol
was appointed President and Chief Executive Officer of AXIS Capital Holdings Limited in May 2012 and has served as a director since January 2012. Mr. Benchimol joined the Company as Executive Vice President and Chief Financial Officer in January 2011. He formerly served as Executive Vice President and Chief Financial Officer of PartnerRe Ltd. from April 2000 through September 2010, and Chief Executive Officer of PartnerRe Ltd.’s Capital Markets Group business unit from June 2007 through September 2010. Prior to joining PartnerRe, Mr. Benchimol was Senior Vice President and Treasurer at Reliance Group Holdings, Inc. for 11 years and was previously with the Bank of Montreal from 1982 to 1989.
178
Joseph C. Henry
joined AXIS Capital as Chief Financial Officer in June 2012. He previously had served as Executive Vice President and Chief Financial Officer of XL Insurance since 2006. From 2003 to 2006, Mr. Henry was the Global Controller for XL Global Services and the Corporate Controller for XL Capital. Prior to joining XL, he held various senior leadership positions at Meadowbrook Insurance Group including Chief Operating Officer and Chief Financial Officer. Mr. Henry began his career at KPMG where he became an Audit Partner before leaving to join the Hanover Insurance Companies as its Chief Financial Officer and Treasurer in 1987.
Christopher N. DiSipio
develops and implements Accident & Health strategy worldwide. He has 29 years of experience in the insurance industry, specifically in A&H business. Prior to joining AXIS, he had been with the Chubb Corporation since 1999, most recently as the Chief Operating Officer and Senior Vice President for Life, Accident and Health. Mr. DiSipio began his insurance career in 1984 as an underwriter with CNA Insurance Company, where he helped start and subsequently led the company's international Accident & Health division.
John “Jay” D. Nichols
joined the Company in April 2012 as Chief Executive Officer of AXIS Re. Mr. Nichols is the former President of RenaissanceRe Ventures Ltd., where he and his team were responsible for business development and management of RenaissanceRe’s Joint Ventures and Venture Capital businesses. In his role at RenaissanceRe, he was responsible for the formation of DaVinci Reinsurance and Top Layer Reinsurance, as well as several sidecars and other ventures. Prior to joining RenaissanceRe in 1995, Mr. Nichols held various positions at Hartford Steam Boiler, Monarch Capital and the accounting firm of Matson, Driscoll and D’Amico.
Peter W. Wilson
was appointed Chief Executive Officer of AXIS Insurance in April 2014. He joined AXIS Capital in May 2013 as President of U.S. Insurance. Prior to joining the Company, Mr. Wilson served as President and Chief Operating Officer for CNA Specialty, a unit of CNA Financial Corporation, which is focused on professional and management liability, healthcare, surety and other specialized insurance products and services. During his more than 20-year tenure with CNA Financial Corporation, Mr. Wilson served in a number of leadership positions and had management responsibility for a diverse group of business units operating both in the U.S. and internationally. Prior to CNA, he served as an Executive Vice President at AIG, where he managed AIG’s commercial public D&O business in the U.S.
Geoffrey Bell
has served as a director since September 2006. He currently is President of Geoffrey Bell and Company formed in 1982 as a consultant to major corporations and banks internationally providing advice on capital market transactions as well as undertaking economic, financial and country risk analysis. He is also a Founding member of the Board of Directors of the Consultative Group of International Economic and Monetary Affairs known as the Group of 30.
Jane Boisseau
was elected as a director in December 2012. Ms. Boisseau is a former partner and Co-Chair of the Insurance Regulatory Department of the law firm Dewey & LeBoeuf LLP with substantial experience in a variety of insurance regulatory, compliance and transactional matters. She began her legal career in 1985 at LeBoeuf, Lamb, Leiby & MacRae, the predecessor firm to Dewey & LeBoeuf LLP. Ms. Boisseau holds a law degree from the New York University School of Law.
Charles A. Davis
has served as a director since our inception. Since June 2005, Mr. Davis has been a member and the Chief Executive Officer of Stone Point Capital LLC (“Stone Point”). From 1998 until May 2005, he was with MMC Capital, Inc., a subsidiary of Marsh & McLennan Companies, Inc., serving as the Chief Executive Officer from 1999 to 2005 and Chairman from 2002 to 2005. He also served as a Vice Chairman of Marsh & McLennan Companies, Inc. from 1999 to November 2004. Prior to joining MMC Capital in 1998, Mr. Davis spent 23 years at Goldman, Sachs & Co., where, among other positions, he served as head of Investment Banking Services worldwide, head of the Financial Services Industry Group, a General Partner, a Senior Director and a Limited Partner. Mr. Davis also is a director of The Hershey Company and The Progressive Corporation.
Robert L. Friedman
has served as a director since our inception. Since July 2012, Mr. Friedman has been a Senior Advisor of The Blackstone Group L.P. (“Blackstone”). From February 1999 to June 2012, he was a Senior Managing Director of that firm, and from January 2003 to August 2010 he was also its Chief Legal Officer. Prior to joining Blackstone, Mr. Friedman was a partner at Simpson Thacher & Bartlett LLP for 25 years, where he served as a senior member of that law firm’s mergers and acquisitions practice. Mr. Friedman currently serves as a director of TRW Automotive Holdings Corp, Orbitz Worldwide Inc. and YRC Worldwide Inc.
179
Christopher V. Greetham
has served as a director since October 2006. From 1996 to 2006, he served as Chief Investment Officer of XL Capital Ltd. From 1982 to 1996, Mr. Greetham was Chief Financial Officer of OIL Insurance Ltd. and President of OIL Investment Corporation Ltd. Between 1975 and 1982, Mr. Greetham served as an investment analyst and a portfolio manager at Bankers Trust Company.
Maurice A. Keane
has served as a director since September 2002. Mr. Keane formerly was the Group Chief Executive Officer of the Bank of Ireland, a position he held from 1998 until 2002. He was Deputy Group Chief Executive Officer from 1991 through 1997, having been a Managing Director since 1983. He was a member of the National Pension Reserve Fund Commission from February 2007 until December 2014. He served as a director of Irish Bank Resolution Corporation Limited (formerly Anglo Irish Bank Corporation Limited) from the time of its nationalization in January 2009 until February 2013.
Sir Andrew Large
has served as a director since December 2006. He retired as Deputy Governor for Financial Stability at the Bank of England and as a member of the Bank’s Monetary Policy Committee in 2006. Prior to his appointment to the Bank of England in September 2002, he was Deputy Chairman of the Board of Barclays Bank plc from May 1998 when he also chaired the Group of 30 Project on Clearing and Settlement. From 1992 to 1997, he chaired the Securities and Investments Board in the United Kingdom. He was an investment banker from 1970 through 1990 at Orion Bank and Swiss Bank Corporation of which he was a member of the Management Board from 1987 through 1989. He began his career at British Petroleum in 1964.
Cheryl-Ann Lister
was elected as a director in September 2008. Ms. Lister began her career in 1980 in the investment department of the Bank of N.T. Butterfield & Son Limited. From 1987 to 1992, she served as the manager of the investment department at Bermuda Commercial Bank. In 1992, she joined EBT Securities Limited, a privately held international investment trading company, and ultimately served as a director with responsibilities for the company’s operations in Bermuda and Brazil. From 1999 through 2006, Ms. Lister served in both the Chairperson and Chief Executive Officer roles at the Bermuda Monetary Authority, which is responsible for regulating and supervising financial institutions in Bermuda. Ms. Lister was a founding member and President of the Bermuda Society of Financial Analysts and served as a Governor for the Association of Investment Management and Research (now the CFA Institute). She also served as President of the International Society of Financial Analysts. Ms. Lister currently serves as a consultant to the Bermuda Ministry of Justice on matters relating to anti-money laundering and anti-terrorism financing, is the Chairperson of the National Anti-Money Laundering Committee and serves as a director of FIL Limited.
Thomas C. Ramey
was elected as a director in July 2009. Mr. Ramey was Chairman and President of Liberty International, a wholly owned subsidiary of Liberty Mutual Group, from 1997 to 2009. He also served as Executive Vice President of Liberty Mutual Group from 1995 through 2009. Prior to joining Liberty, he was President and Chief Executive Officer of American International Healthcare, a subsidiary of AIG, and founder and President of an international healthcare trading company. He is currently a trustee of the Brookings Institution. Mr. Ramey was formerly a Director of The Warranty Group, the International Insurance Society, the Coalition of Services Industries and Chairman of the International Fund for Animal Welfare. He was also formerly a member of the Chongqing, China Mayor’s International Advisory Council.
Henry B. Smith
has served as a director since May 2004. Mr. Smith served as the Chief Executive Officer and President of W.P. Stewart & Co., Ltd. from May 2005 to March 2006. Mr. Smith is the former Chief Executive Officer of the Bank of Bermuda Limited, a position he held from March 1997 until March 2004. He joined the Bank of Bermuda in 1973 as a management trainee and held various senior positions within the Bank of Bermuda, including Executive Vice President and Chief Operations Officer, Executive Vice President, Europe and Senior Vice President and General Manager, Retail Banking.
Alice Young
was elected as a director in February 2013. From 1994 until her retirement in 2015, Ms. Young served as a partner at the international law firm Kaye Scholer LLP and also as Chairperson of the firm’s Asia Pacific practice. She has extensive experience advising multinational entities and entrepreneurs on their business and investment activities in the United States and Asia. Ms. Young also serves as a member of the Board of Directors and on the Executive and Examining Committees of Mizuho Trust & Banking Co. (USA); as a Lifetime Trustee of the Aspen Institute and Trustee of The Asia Foundation; and as an Associate Fellow of Davenport College, Yale University. Ms. Young is also a member of the Council on Foreign Relations, Committee of 100, Asia Society, the US-China Business Council and Japan Society.
Wilhelm Zeller
was elected as a director in July 2009. From 1996 to June 2009, Mr. Zeller served as the Chairman of the Executive Board of Hannover Re. Prior to joining Hannover Re, he was a member of the Executive Board of Cologne Re from 1977 through 1995. In 1995, he was also a member of the Executive Council of General Re Corporation, the new
180
principal shareholder of Cologne Re. From 1970 through 1977, Mr. Zeller served as the head of the Casualty Department and International Department Non-Life at Zurich Insurance Company. A NACD board leadership fellow, he currently is a corporate director and consultant, serving as a director of EIS Group Ltd. and Towers Watson & Co.
Corporate Governance Highlights
Corporate governance is an area of significant focus for our Board and is a critical component to our success in driving sustained shareholder value. Highlights of our corporate governance standards are provided below:
|
Ÿ
|
Majority vote standard for election of directors.
Each director must be elected by a majority of
votes cast, not a plurality.
|
Ÿ
|
Independent lead director.
|
|
|
Ÿ
|
No “over-boarding”. None of our directors serve
on the board of directors of more than three
other publicly-held corporations.
|
Ÿ
|
Shareholders holding 10% or more of our outstanding stock have the right to call a special meeting.
|
|
|
Ÿ
|
Shareholder engagement. We engage with our shareholders to better understand their perspectives.
|
Ÿ
|
Majority independent Board. Our Board comprises all independent directors, except our CEO and Chairman.
|
|
|
Ÿ
|
Regular Board and committee self-evaluation process.
|
Ÿ
|
Independent Audit, Compensation and Corporate Governance and Nominating Committees.
|
|
|
Ÿ
|
No hedging the economic risk of owning AXIS stock or pledging of AXIS stock for loans or other obligations.
|
Ÿ
|
Robust Code of Business Conduct. AXIS is committed to operating our business with the highest level of ethical conduct and has adopted the Code of Business Conduct that applies to all employees as well as the Board of Directors. Our Code of Business Conduct is available at www.axiscapital.com.
|
|
Director Independence
Our Board currently consists of 14 directors, of whom 12 are independent directors. The Board has affirmatively determined that each of Messrs. Bell, Davis, Friedman, Greetham, Keane, Large, Ramey, Smith and Zeller and Mmes. Boisseau, Lister and Young is independent as defined in the listing standards of the NYSE and in accordance with the Company’s Corporate Governance Guidelines. Mr. Benchimol serves as our Chief Executive Officer and President and therefore is not independent. Similarly, because Mr. Butt was an employee of the Company until his May 3, 2012 retirement, and he currently serves as a consultant to the Company, he is not independent under the NYSE listing standards. Mr. Butt continues to serve as Chairman of the Board in his capacity as a non-management director. The Board has made these determinations based primarily on a review of the responses of the directors to questions regarding employment and compensation history, family relationships and affiliations and discussions with the directors.
With respect to Mr. Charles A. Davis, the Board reviewed his current relationship with Stone Point, assets that we currently have under management with affiliates of Stone Point and contracts for services we have with affiliates of Stone Point. The Board determined that none of these relationships constitute a material relationship with us as defined in the listing standards of the NYSE.
Board Committees
Our Board maintains Executive, Audit, Compensation, Corporate Governance and Nominating, Finance and Risk Committees. Current copies of the charter for each of these committees, as well as our Corporate Governance Guidelines, are available on our website at www.axiscapital.com. The table below provides current membership and meeting information for each committee. In addition, the table identifies the independent directors, as determined by our Board in February 2015, within the meaning of the NYSE listing standards, applicable SEC regulations and our Corporate Governance Guidelines.
181
|
Name
|
Executive
|
Audit
|
Compensation
|
Corporate
Governance
and
Nominating
|
Finance
|
Risk
|
Independent
Director
|
|
Mr. Bell
|
|
|
Member
|
Member
|
Member
|
X
|
|
|
Mr. Benchimol
|
Member
|
|
|
|
|
|
|
|
Ms. Boisseau
|
|
Member
|
|
Member
|
|
|
X
|
|
Mr. Butt
|
Member
|
|
|
|
|
|
|
|
Mr. Davis
|
Member
|
|
|
|
Chair
|
|
X
|
|
Mr. Friedman
|
|
|
Member
|
|
Member
|
|
X
|
|
Mr. Greetham
|
|
|
Member
|
|
Member
|
Chair
|
X
|
|
Mr. Keane
|
|
Member
|
|
Member
|
|
Member
|
X
|
|
Sir Andrew Large
|
|
|
|
Member
|
|
Member
|
X
|
|
Ms. Lister
|
|
|
|
Member
|
|
Member
|
X
|
|
Mr. Ramey
|
|
Chair
|
Member
|
|
|
|
X
|
|
Mr. Smith
|
Chair
|
Member
|
Chair
|
Chair
|
|
|
X
|
|
Ms. Young
|
|
Member
|
|
Member
|
|
|
X
|
|
Mr. Zeller
|
|
|
|
|
Member
|
Member
|
X
|
|
2014 Meetings
|
1
|
8
|
6
|
4
|
4
|
5
|
|
Executive Committee
. The Executive Committee may exercise the authority of the Board when the entire Board is not available to meet, except in cases where the action of the entire Board is required by our memorandum of association, our bye-laws or applicable law.
Audit Committee
. The Audit Committee has general responsibility for the oversight of the integrity of our financial statements, our compliance with legal and regulatory requirements, our independent auditor’s qualifications and independence and the performance of our internal audit functions and independent auditors. The Committee appoints, retains and determines the compensation for our independent auditors, pre-approves fees and services of the independent auditors and reviews the scope and results of their audit. The Audit Committee has been established in accordance with Section 3(a)(58)(A) of the U.S. Securities Exchange Act of 1934, as amended (the “Exchange Act”). Each member of the Audit Committee is a non-management director and is independent as defined in the listing standards of the NYSE, our Corporate Governance Guidelines and under the Exchange Act. Our Board has determined that Mr. Ramey qualifies as an audit committee financial expert pursuant to the rules and regulations of the Securities and Exchange Commission, or SEC.
Compensation Committee
. The Compensation Committee establishes compensation for our Chief Executive Officer and certain other executives in light of our established corporate performance goals and makes recommendations to our Board with respect to overall officer, management and employee compensation policies, incentive compensation plans, equity-based plans and director compensation. Each member of this Committee is a “non-employee director” for purposes of Rule 16b-3 under the Exchange Act and is independent as defined in the listing standards of the NYSE.
Corporate Governance and Nominating Committee
. The Corporate Governance and Nominating Committee takes a leadership role in shaping our corporate governance by identifying and proposing qualified director nominees, overseeing the purpose, structure and composition of our Board committees, overseeing the annual evaluation of the Board and its committees and periodically reviewing our Code of Business Conduct and Corporate Governance Guidelines. Each member of this Committee is a non-management director and is independent as defined in the listing standards of the NYSE.
Finance Committee
. The Finance Committee oversees the finance function of the Company, including the investment of funds and financing facilities. It also is responsible for establishing our investment policies and guidelines, reviewing the selection of investment managers, evaluating the performance of investment managers, monitoring the need for additional financing and ensuring compliance with outstanding debt facility covenants.
Risk Committee
. The Risk Committee assists the Board in its oversight of risks to which the Company is exposed and to monitor our compliance with our aggregate risk standards and risk appetite. The Risk Committee also evaluates
182
compensation practices to determine whether our policies and plans are consistent with the Company’s risk framework and do not encourage excessive risk taking.
Meetings of the Board and its Committees
Pursuant to our Corporate Governance Guidelines, we expect directors to attend all meetings of our Board, all meetings of all committees of the Board on which they serve and each annual general meeting, absent exigent circumstances. Our Board met nine times during the year ended December 31, 2014. No director attended fewer than 75% of the aggregate of the total number of meetings of the Board and the total number of meetings of all committees of the Board on which the director served (during the period that each director served on the Board or such committee(s). All of our directors attended our 2014 Annual General Meeting.
Meetings of Non-Management Directors
The Board believes that one of the key elements of effective, independent oversight is that the independent directors meet in executive session on a regular basis without the presence of management. In 2014, as part of the agenda for each of the five regularly scheduled Board meetings, the independent directors met in executive session with the Lead Independent Director presiding at such meetings.
Lead Independent Director
The Board believes that the role of Lead Independent Director enhances effective governance. The Company’s Corporate Governance Guidelines provide that the non-management directors will elect a Lead Independent Director for a three-year term of office or until his or her successor shall be duly appointed. The Lead Independent Director may serve for a maximum of two consecutive three-year terms. Mr. Smith has served as Lead Independent Director since May 2012. In addition to presiding at executive sessions of the non-management directors as well as all meetings at which the Chairman is not present, the Lead Independent Director’s duties include:
|
•
|
providing input on meeting scheduling, agendas and information that is provided to the Board;
|
|
•
|
acting as a liaison between the independent directors and the Chairman;
|
|
•
|
recommending, as appropriate, that the Board retain consultants who will report directly to the Board; and
|
|
•
|
consulting and communicating with major shareholders on a per request basis.
|
Board Leadership Structure
The Board believes that the decision of whether to combine or separate the positions of Chief Executive Officer and Chairman will vary company to company and depends upon a company’s particular circumstances at a given point in time. For our Company, the Board currently believes that separating the Chief Executive Officer and Chairman positions is the appropriate leadership structure and is in the best interests of our shareholders. In addition, the Board also believes that AXIS’s leadership structure does not affect the Board’s role in risk oversight of the Company. Accordingly, Mr. Butt serves as our Chairman of the Board, while Mr. Benchimol serves as our Chief Executive Officer and President. Our Board believes that this structure best encourages the free and open dialogue of alternative views and provides for strong checks and balances. Additionally, Mr. Butt’s attention to Board and committee matters allows Mr. Benchimol to focus more specifically on overseeing the Company’s day-to-day operations and underwriting activities as well as strategic opportunities and planning.
Code of Business Conduct
We have adopted a Code of Business Conduct that applies to all of our directors, officers and employees, including our Chief Executive Officer and President, our Chief Financial Officer and our Controller. Our Code of Business Conduct and our Corporate Governance Guidelines are available on our website at www.axiscapital.com. We intend to disclose on our website any required amendment to, or waiver of, a provision of the Code of Business Conduct that applies to our Chief Executive Officer and President, our Chief Financial Officer or our Controller. In addition, waivers of the Code of Business Conduct for our directors and executive officers may be made only by our Board or the Corporate Governance and Nominating
183
Committee and will be promptly disclosed to shareholders on our website in accordance with the listing standards of the NYSE.
Corporate Governance Guidelines
We have adopted Corporate Governance Guidelines which, along with our Code of Business Conduct and the charters of the committees of our Board of Directors, provide a framework for the corporate governance of the Company addressing matters such as director qualification standards, director responsibilities and duties and the compensation of our directors. Our Corporate Governance Guidelines and the charters for each of the committees of our Board of Directors are available on our website at www.axiscapital.com.
Section 16(a) Beneficial Ownership Reporting Compliance
Section 16(a) of the Exchange Act requires our directors and executive officers and persons who own more than 10% of a registered class of our equity securities to file with the SEC and the NYSE reports on Forms 3, 4 and 5 concerning their ownership of the common shares and other equity securities of the Company. Under SEC rules, we must be furnished with copies of these reports.
Based on our review of these reports, we believe that all of our directors, executive officers and shareholders who are required to file reports filed all of such reports on a timely basis during the year ended December 31, 2014.
|
ITEM 11.
|
EXECUTIVE COMPENSATION
|
Compensation Discussion and Analysis
Named Executive Officers
The Compensation Discussion and Analysis section which follows explains the Company’s executive compensation program as it relates to our named executive officers (the “NEOs”) whose compensation information is presented in the tables following this discussion in accordance with SEC rules. Our NEOs for 2014 were:
|
Albert A. Benchimol
|
Chief Executive Officer and President (“CEO”)
|
|
Christopher N. DiSipio
|
Chief Executive Officer, AXIS Accident & Health
|
|
John W. Gressier
(1)
|
Former Chief Operating Officer
|
|
Joseph C. Henry
|
Chief Financial Officer (“CFO”)
|
|
John D. Nichols
|
Chief Executive Officer, AXIS Reinsurance
|
|
Peter W. Wilson
|
Chief Executive Officer, AXIS Insurance
|
|
(1)
|
On June 23, 2014, Mr. Gressier provided notice to the Company of his voluntary resignation effective June 30, 2015 and his then-current responsibilities were distributed among other executive officers.
|
Executive Summary
2014 Business Highlights
For AXIS, 2014 was a year of achievement of numerous key objectives and continued progress in pursuing the following four strategic initiatives previously established by our CEO:
|
•
|
Investing in our people and culture
|
|
•
|
Delivering diversified growth
|
|
•
|
Optimizing our enterprise-wide risk portfolio
|
|
•
|
Enhancing operational excellence
|
184
Financially, 2014 was a year of solid profitability. Gross premiums written were flat for the full year in response to the more competitive market. In many of our operations, we consolidated our position and, in others for which we could reasonably expect more attractive returns such as accident and health, we achieved significant growth. Despite competitive markets and a difficult interest rate environment, we grew our book value and improved our return on equity. We rewarded investors by again returning an amount in excess of our operating profits through dividends and buybacks. AXIS finished the year with net income available to common shareholders of $771 million ($684 million in 2013), or $7.29 per diluted common share ($5.93 per diluted common share in 2013). Additionally, diluted book value per share, or DBVPS, increased year over year by 11% to $50.63 per share and we achieved a return on average common equity, or ROACE, of 14.8%. For 2014, our value creation, or growth in DBVPS adjusted for common share dividends declared, was 12.9%. With respect to the financial metrics used within our executive incentive plans, as described in more detail below, AXIS achieved an annual operating ROACE of 10.8%, which equated to 108% of our 2014 operating ROACE target of 10%. In addition, we grew our 24-month DBVPS by 14.5% compared to 17.0% for our peer group median as of September 30, 2014, our annual measurement date for this metric.
As for our Company non-financial objectives, the following are among the highlights of our achievements during 2014 in advancing our strategic initiatives and were considered in evaluating the non-financial performance of our NEOs:
|
•
|
Continued strong growth in our AXIS Accident and Health line of business, supporting achievement of full operating leverage in the unit
|
|
•
|
Meaningful progress on targeted portfolio enhancements for underperforming businesses
|
|
•
|
Focus on profitable growth opportunities, with the recruitment of a new Medical Malpractice team, expansion of our U.S. casualty efforts and the first full year of our AXIS Syndicate 1686 Lloyd’s underwriting platform
|
|
•
|
Enhanced marketing efforts through the development of our broker and distribution management function
|
|
•
|
Advancement of our third party capital activities, including a number of transactions that supported risk management objectives and delivered non-risk bearing revenue for the year
|
|
•
|
Increased activity in evaluating strategic partnership opportunities, including mergers, acquisitions and other strategic investments, to support achievement of corporate goals
|
|
•
|
Delivered on risk management initiatives that support the achievement of a best-in-class risk management culture throughout the Company
|
|
•
|
Progressed a number of initiatives supporting the achievement of enhanced usage of data and analytics throughout the Company, including the in-sourcing of our reserving function
|
|
•
|
Introduced new business initiatives intended to provide further balance and diversification to our underwriting portfolios and designed to reduce volatility in our results
|
|
•
|
Continued progress in delivering on critical information technology projects and an efficient and effective outsourced service delivery system
|
|
•
|
Meaningful progress on expense management initiatives
|
|
•
|
Effected further enhancements to our compensation practices and policies to improve alignment of our compensation with our performance, and, therefore, shareholder’s interests
|
|
•
|
Continued investment in a training and development initiative designed to enhance the capabilities of our staff and improve staff retention
|
Based on these results, the Compensation Committee approved the following with respect to the 2014 performance year:
|
•
|
No change to base salaries in 2014 for our NEOs
|
|
•
|
Bonuses awarded to our NEOs ranging between 100% and 120% of target
|
|
•
|
Equity grants for our NEOs granted at 90% of target, with vesting for 50% of the awards subject to satisfying Company specified performance conditions
|
Shareholder Outreach
Following the 2013 Annual General Meeting of Shareholders and in connection with designing the 2014 executive compensation program, the Company actively solicited feedback from shareholders on their concerns with our executive compensation program and any other matters of importance. As part of that outreach effort, our Compensation Committee Chairman and Lead Independent Director, as well as members of senior management, met with a number of the Company’s
185
largest shareholders. After carefully considering the feedback received during the shareholder outreach efforts, we made significant changes to the 2014 executive compensation program, as disclosed in our 2014 Proxy Statement.
At the 2014 Annual General Meeting of Shareholders, more than 79% of our shareholders voted to approve the Company’s 2014 executive compensation program for our NEOs. We believe that these voting results reflect our shareholder’s endorsement of the structural changes made for the 2014 executive compensation program and the current direction of our executive compensation program.
Although we are pleased with the voting results at the 2014 Annual General Meeting of Shareholders, we continue to implement our planned changes and maintain an open dialogue with our shareholders to identify ways to further refine and improve our executive compensation program. Also, the Compensation Committee’s decisions to make the specific additional changes described below illustrate our ongoing efforts to better align the executive compensation program with shareholder interests. We are confident that our program effectively addresses shareholder concerns, promotes our business strategy and directly aligns pay with performance.
Executive Compensation Program Changes for 2014
In February 2014, the Compensation Committee adopted the 2014 Executive Annual Incentive Plan (the “2014 Annual Incentive Plan”). Under this plan, our sole financial metric for bonus awards is operating ROACE, eliminating the growth in DBVPS metric, which is now only used to evaluate grants and payouts of equity awards. This change resulted in distinct financial metrics for our 2013 Executive Long-Term Equity Compensation Program (the "2013 Equity Program") and 2014 Annual Incentive Plan, which we have been advised represents a compensation program design best practice. Further, the Compensation Committee approved the introduction of business unit financial performance metrics within our 2014 Annual Incentive Plan and adjusted the weightings of the metrics for our business unit and corporate function leaders, further enhancing the correlation between executive pay and performance.
Previously Implemented Changes
The structural changes to our executive compensation program described above are in addition to the following best practices previously approved and implemented by the Compensation Committee that are intended to align executive compensation with the long-term interests of our shareholders:
|
ü
|
Fixed-dollar equity targets. We converted equity targets from a fixed number of shares or units to a fixed-dollar target allowing for closer targeting of market pay levels.
|
ü
|
Equity awards adjust based on performance. Our performance-vesting equity awards are adjusted at the time of vesting and our time-vesting equity award targets are adjusted at the time of grant, in both cases based on growth in diluted book value per share over a three-year period as compared to our peers.
|
|
|
ü
|
Equity awards split between performance-vesting and time-vesting awards. Beginning in 2014,
equity grants for our NEOs and other senior executives (other than our CEO, who did not receive an annual equity award in 2014) are split evenly between performance-vesting and time-vesting awards.
|
ü
|
Stock ownership guidelines. We maintain stock ownership guidelines and holding requirements that apply to our senior executives to encourage a long-term focus in managing our business.
|
|
|
ü
|
No tax gross-ups. The employment agreements for our NEOs do not contain excise tax gross-up provisions and we do not provide other tax gross-ups beyond what is generally available for all employees.
|
ü
|
Double-trigger in the event of a change-in-control. We replaced “single-trigger” change-in-control vesting provisions within our equity program to ensure that awards will only vest automatically upon a change in control of the Company if the employee is subsequently terminated.
|
|
|
ü
|
Independent compensation consultant. Our Compensation Committee engages an independent compensation consultant that reports directly to them.
|
ü
|
No hedging or pledging of AXIS stock. Our Insider Trading Policy prohibits all employees and directors from hedging the economic risk of owning AXIS stock or pledging AXIS stock for loans or other obligations.
|
|
186
|
ü
|
Cash-settlement for a portion of equity awards.
Implemented cash-settlement at vesting for 50% of each equity award, excluding awards to our NEOs, in order to reduce the overall number of equity awards utilized, or burn rate, under our equity plan.
|
ü
|
Clawback Policy. Our executive compensation Clawback Policy allows us to recoup compensation paid to our NEOs under certain circumstances.
|
|
|
ü
|
No individual executive retirement plans.
|
ü
|
Limited executive perquisites.
|
|
Executive Compensation Philosophy
At AXIS, our mission is to become the leading diversified global specialty insurance and reinsurance company as measured by quality, sustainability and profitability. Accordingly, it is critical that we recruit, retain and motivate the best talent in the global marketplace. To achieve these goals, we have designed our executive compensation programs to retain and award leaders who create long-term value for our shareholders. The combination of fixed and variable compensation that we pay to our NEOs is structured to reward above-median performance with above-median levels of compensation and conversely, to provide below-median compensation for below-median performance. A large portion of our NEOs’ compensation is variable, or “at risk”, and consists of annual incentive awards and long-term equity awards, while the fixed component of their compensation is designed to reflect their significant level of responsibility and overall contributions to our success. In addition to leading the Company’s day-to-day underwriting and operating activities, our NEOs manage and lead a team of senior professionals that we believe is one of the strongest teams in our industry. The significant diversity of our operations and successful management of these operations ultimately serve to maintain our capital and drive long-term shareholder returns. Therefore, we have designed our NEOs’ compensation to reflect this situation, both to compensate them for the functions they perform and to ensure that their compensation is connected to the successes attributable to their skills and responsibilities. The primary consideration for our compensation decisions continues to be the assessment of our overall financial performance based on certain short-term and long-term financial metrics. For 2014, our incentive compensation programs were tied to Company financial performance and both Company and individual non-financial performance.
Company and Business Unit Financial Metrics
The financial metrics against which we measure our Company performance against are operating ROACE and growth in DBVPS as compared to our peer group. We believe operating ROACE represents an appropriate short-term measure as it reflects the rate of return the Company is earning on its capital and surplus. Generally, the higher the return, the greater use the Company is making of the funds invested by its shareholders, assuming risk is measured and managed appropriately. As for our long-term Company financial performance measure, we use growth in DBVPS adjusted for dividends as compared to our peers, as we believe that the evidence demonstrates that this measure best reflects long-term financial success for insurers and reinsurers. Each year, the Compensation Committee sets a target operating ROACE after considering the Company’s business plan for the current year. Under our growth in DBVPS metric, “target” performance is achieved only if the Company achieves growth at or above the 60th percentile of our peer group. Under our 2014 Annual Incentive Plan we use operating ROACE as the sole Company financial performance metric. Additionally, our 2014 Annual Incentive Plan incorporates a business unit financial metric to further enhance the pay-for-performance linkage for our business unit CEOs. Similarly, beginning in 2014, the growth in DBVPS metric was used as the sole Company financial performance measure under our equity program.
Company and Individual Non-Financial Metrics
Our CEO establishes the Company’s non-financial objectives, as described under the “2014 Business Highlights” section above. Our CEO evaluates and makes a recommendation to the Compensation Committee on the performance of the NEOs against these objectives. The Compensation Committee in turn reviews the individual performance of each NEO, considers the recommendations from our CEO (except with regard to his own individual performance) and makes a final determination for this element of each NEO’s compensation.
In summary, the Company made significant changes in both 2013 and 2014 to enhance the link between incentive compensation and Company, business unit and individual performance, as described in detail under “Executive Summary,” “Annual Incentive Awards” and “Long-Term Incentive Awards” in this Compensation Discussion and Analysis section. These
187
changes reflect feedback from our shareholders, shareholder advisory services and compensation consultants along with market data and analysis in an effort to better align our executives’ compensation with the best interests of our shareholders.
Compensation Committee Process
Under our Compensation Committee’s charter, the Committee sets the CEO’s annual compensation after evaluating his performance under corporate goals and objectives set by the Committee each year. The Compensation Committee also has the authority to:
|
•
|
approve initial offers of employment for senior executives;
|
|
•
|
make recommendations to the Board regarding compensation programs and policies affecting our executives as well as our other employees;
|
|
•
|
make recommendations on the form and amount of director compensation;
|
|
•
|
approve all equity awards to our executives and set the pool for all other equity awards; and
|
|
•
|
approve the design of our incentive and equity compensation plans and any changes or amendments to those plans.
|
Our Compensation Committee generally receives proposals and information from our Chief Human Resources Officer and CEO for their consideration regarding executive compensation and also receives input from our Chief Human Resources Officer and the Compensation Committee’s independent consultant, as necessary, regarding director compensation. The Compensation Committee is permitted to delegate any of its responsibilities to subcommittees in its discretion, but to date has not done so.
At the beginning of each calendar year, our Compensation Committee:
|
•
|
reviews the incentive plan results from the prior year;
|
|
•
|
makes final determinations regarding salaries for the current year;
|
|
•
|
approves equity awards and incentive cash payments for prior-year performance;
|
|
•
|
establishes the performance goals under the incentive plans for the current year;
|
|
•
|
approves the Compensation Committee’s report for our proxy statement or Form 10-K; and
|
|
•
|
conducts a self-assessment.
|
Mid-year, the Compensation Committee reviews the compensation consultant’s report regarding our executive compensation program and reviews our employee compensation programs. In the fall of every year, the Compensation Committee reviews our director compensation program, approves any needed changes to the director compensation program and conducts a preliminary assessment of our performance for the year. Our Compensation Committee generally meets at the end of each calendar year to make preliminary decisions regarding the salaries for the next calendar year and to determine the equity awards and incentive cash payments that will be made at the beginning of the next calendar year, subject to final year-end results. In February of the following year, and before any awards are distributed, the Compensation Committee considers the final audited year-end financial results and either confirms or adjusts the preliminary awards accordingly based upon their review.
Risk Management and Compensation
In line with the Company's Compensation Risk Standard, the Compensation Committee seeks to ensure that our executive compensation program does not encourage executives to take risks that are inconsistent with the long-term success of the Company. The Compensation Committee believes that AXIS’s executive compensation program does not encourage inappropriate risk-taking. Specifically, the annual incentive pool for the Company’s 2014 Annual Incentive Plan is tied to our operating ROACE, which ensures that our shareholders’ long-term interests are at the forefront of decision-making for our employees and NEOs.
Additionally,
|
•
|
our Compensation Committee retains downward discretion in overseeing our compensation programs, such that meaningful reductions in compensation are possible if our financial results do not meet our expectations, as was the
|
188
case in 2011 when no annual bonuses were paid to our NEOs, or if our risk management policies or tolerances have been breached;
|
•
|
our executive compensation Clawback Policy ensures that our executives are not inappropriately rewarded in the event that we are required to restate our financial results, as described above;
|
|
•
|
our stock ownership guidelines are designed to ensure that the long-term interests of our executives are aligned with those of our shareholders; and
|
|
•
|
our Compensation Committee retains an independent compensation consultant, apart from the consultant retained by management, as discussed in detail below.
|
Compensation Committee Consultant
Our Compensation Committee has sole authority to select, retain and terminate any consultants or advisors used to provide independent advice to the Compensation Committee and evaluate executive compensation, including sole authority to approve the fees and any other retention terms for any such consultant or advisor. The Compensation Committee engaged Pearl Meyer & Partners (“PM&P”) as its independent compensation consultant for 2014 to assist in establishing compensation policies and programs. During 2014, PM&P:
|
•
|
reviewed and advised the Compensation Committee on matters concerning compensation of the CEO and our other NEOs;
|
|
•
|
prepared formal presentations for the Compensation Committee in May 2014 regarding executive compensation; and
|
|
•
|
reviewed director compensation biennially, with its last review and formal report occurring in September 2014.
|
PM&P did not provide any services to the Company or any of the Company’s affiliates other than advising the Compensation Committee on director and executive officer compensation. In February 2014, the Compensation Committee evaluated whether any work performed by PM&P raised any conflict of interest and determined that it did not.
In December 2014, the Compensation Committee engaged Farient Advisors LLC as its independent compensation consultant for 2015.
From time to time, management also engages its own external compensation consultant to advise it with regard to our compensation programs generally, prepare reports that compare our compensation programs to those of peer companies and help ensure the competitiveness and appropriateness of our compensation programs. While the external compensation consultant has acted as management’s compensation consultant for general compensation programs in various capacities with respect to our employees worldwide, and assists management with regard to its compensation recommendations for our executive officers, the Compensation Committee has separately engaged PM&P and Farient Advisors LLC as its independent compensation consultants to avoid any conflicts of interest.
2014 Peer Benchmarking
Although AXIS gives careful consideration to each element of total compensation, we evaluate our competitive position with respect to our NEOs on a total direct compensation basis, which consists of base salary and short and long-term incentives. We consider market pay practices when setting executive compensation, as the Compensation Committee uses benchmarking to guide decision-making with respect to executive pay levels. As a part of its evaluation, PM&P provided executive compensation data, information on current market practices and alternatives to consider when determining compensation for our NEOs. In 2014, PM&P benchmarked our executive compensation program design, executive pay, and performance against a peer group of insurance and reinsurance companies listed below that are publicly traded and comparable to AXIS in product offerings, market segment, geography, annual revenues, premiums, assets and market value. The Committee reviews the composition of the peer group with its independent compensation consultant annually.
Peer Group Companies
|
•
|
ACE Limited
|
|
•
|
XL Group plc
|
|
•
|
Everest Re Group, Ltd.
|
189
|
•
|
PartnerRe Ltd.
|
|
•
|
Arch Capital Group Ltd.
|
|
•
|
Endurance Specialty Holdings Ltd.
|
|
•
|
Platinum Underwriters Holdings, Ltd.
|
|
•
|
Renaissance Re Holdings Ltd.
|
|
•
|
Aspen Insurance Holdings Limited
|
|
•
|
Allied World Assurance Company Holdings, Ltd.
|
|
•
|
Validus Holdings Ltd.
|
Key Components of Compensation
The following table lists the elements of target direct compensation for our 2014 executive compensation program. The program uses a mix of fixed and variable compensation elements and provides alignment with both short- and long-term business goals through annual and long-term incentives. Our incentives are designed to drive overall Company and individual performance using financial and non-financial measures the Committee believes are correlated to gains in shareholder value. The Committee establishes the performance measures and ranges of performance for the variable compensation elements. For 2014, the Committee also introduced business unit performance as an additional performance metric for our business unit leaders.
|
Component
|
Purpose
|
|
|
Fixed
|
Base Salary
|
Ÿ
Attract and retain executives
Ÿ
Compensate executives for level of responsibility and experience
|
|
Variable
|
Annual Incentive Awards
|
Ÿ
Reward achievement of annual Company financial and non-financial objectives, which include individual and, for 2014, business unit performance goals
Ÿ
Promote accountability and strategic decision-making
|
|
Long-Term Incentive Awards
|
Ÿ
Align the interests of our NEOs with those of our shareholders by rewarding the achievement of long-term goals
Ÿ
Encourage strategic decision-making
Ÿ
Promote accountability
Ÿ
Retain key executives
|
|
Base Salary
Salaries are the most basic form of compensation and are integral to any employment arrangement. Our main consideration in determining base salaries is to remain competitive. We also seek to balance a logical salary structure within the Company globally with the demands of the market for executive talent. A competitive salary allows us to attract and retain key staff. In addition, salaries enable our NEOs to maintain an appropriate standard of living in the locations where we operate and, accordingly, base salaries differ by geographic location.
Placement of our NEOs within a salary range is based on the market data for an individual’s position, the candidate’s historical compensation, geographic location, individual performance and the Compensation Committee’s determination of competitiveness and appropriate levels based on the CEO’s recommendations (other than with respect to his own salary).
The base salary for Mr. Benchimol was established in May 2012 when he was appointed as our CEO and President after previously serving as our Chief Financial Officer and is reflective of his increased level of responsibility. Mr. Benchimol’s salary was determined by the Compensation Committee, after review of peer company chief executive officer compensation, and was set at and remains $1.1 million per year. Messrs. DiSipio, Gressier, Henry, Nichols and Wilson’s salaries are governed by their employment agreements within the salary structure discussed above.
The CEO recommends annual salary increases, if any, for our NEOs (except for himself) at the end of each calendar year. The Compensation Committee reviews and approves the increases, if any, using the guidelines described above. The Compensation Committee reviews and evaluates the performance of the CEO and approves any changes to his salary. Those decisions are then reviewed and ratified by the independent directors of our Board.
190
The following table reflects the Compensation Committee’s decision to make no changes to our NEOs’ base salaries for 2015:
|
Name
|
FY 2014 Base Salary
|
FY 2015 Base Salary
|
|
Albert A. Benchimol
|
$1,100,000
|
$1,100,000
|
|
Christopher N. DiSipio
|
$500,000
|
$500,000
|
|
John W. Gressier
|
£600,000
|
£600,000
(1)
|
|
Joseph C. Henry
|
$565,000
|
$565,000
|
|
John D. Nichols
|
$900,000
|
$900,000
|
|
Peter W. Wilson
|
$800,000
|
$800,000
|
(1) On June 23, 2014, Mr. Gressier provided notice to the Company of his voluntary resignation effective June 30, 2015.
Annual Incentive Awards
Annual incentive compensation for our NEOs is provided under our 2014 Annual Incentive Plan adopted by our Compensation Committee in February 2014. The 2014 Annual Incentive Plan is intended to provide for more formulaic annual incentive payouts to our NEOs and serves as a critical tool for rewarding the achievement of our annual corporate goals.
In order to achieve a competitive total compensation package, we established individual annual incentive targets expressed as a percentage of salary for each NEO. Annual incentive targets for our NEOs are governed by the terms of their employment agreements, but are not guaranteed. The individual annual incentive targets for our NEOs for 2014 and 2015 are as follows:
|
Name
|
2014 Bonus Target
|
2015 Bonus Target
|
|
|
Albert A. Benchimol
|
175%
|
175%
|
|
|
Christopher N. DiSipio
|
80%
|
100
|
%
|
|
John W. Gressier
|
135%
|
N/A
(1)
|
|
|
Joseph C. Henry
|
100%
|
100%
|
|
|
John D. Nichols
|
125%
|
125%
|
|
|
Peter W. Wilson
|
125%
|
125%
|
|
(1) On June 23, 2014, Mr. Gressier provided notice to the Company of his voluntary resignation effective June 30, 2015.
To further strengthen the link between pay and performance, in February 2014, the Compensation Committee made changes to the metrics used to determine our NEOs’ annual incentive compensation. The annual incentive compensation is determined based on operating ROACE and business unit financial metrics and Company, business unit and individual non-financial metrics, as follows:
|
•
|
For the operating ROACE metric, payout factors ranged from 0% to 200%, with 10% operating ROACE yielding 100% of target payout and 20% operating ROACE yielding a 200% of target payout and pro-rata funding based on other operating ROACE results.
|
|
•
|
For the achievement of Company non-financial metrics, business unit financial metrics (where applicable) and individual non-financial metrics, payout factors can also range between 0% and 200%.
|
191
Additionally, the Compensation Committee approved 2014 weightings for each of these metrics for our CEO and other NEOs as follows:
|
Metric
|
Financial Metric Weighting
|
Non-Financial Weighting
|
Business Unit Financial Metric Weighting
|
|
CEO
|
85%
|
15%
|
N/A
|
|
Business Unit Leaders
|
50%
|
20%
|
30%
|
|
Corporate Function Leaders
|
75%
|
25%
|
N/A
|
Performance Results & Payouts
With respect to our financial goals for the year, AXIS achieved an annual operating ROACE ("OROACE") of 10.8%, which resulted in a payout factor of 108%. For the business unit financial metric, payout factors ranged from 70% to 135%. For non-financial metrics, payout factors ranged from 125% to 140%, based on Company performance and each NEO’s relative contribution to the advancement of our strategic initiatives, as described in the 2014 Business Highlights section above.
The combined, adjusted weighting for all metrics resulted in bonus payments to our NEOs ranging from 100% to 120% of their 2014 bonus targets. The tables below illustrate the calculation used for each of our NEOs under the 2014 Annual Incentive Plan to determine bonus payouts:
|
Albert A. Benchimol
|
|||||
|
2014 Metric
|
Payout Factor
|
x Weighting
|
= Adjusted Weighting
|
X Target Bonus
|
= Bonus Payout
|
|
OROACE
|
108%
|
85%
|
91.8%
|
$1,925,000
|
$1,767,150
|
|
Non-Financial
|
125%
|
15%
|
18.8%
|
$360,938
|
|
|
TOTAL
|
110.6%
|
$2,128,088
|
|||
|
Christopher N. DiSipio
|
|||||
|
2014 Metric
|
Payout Factor
|
x Weighting
|
= Adjusted Weighting
|
X Target Bonus
|
= Bonus Payout
|
|
OROACE
|
108%
|
50%
|
54.0%
|
$400,000
|
$216,000
|
|
Business Unit Financial
|
130%
|
30%
|
39.0%
|
$156,000
|
|
|
Non-Financial
|
125%
|
20%
|
25.0%
|
$100,000
|
|
|
TOTAL
|
|
|
118.0%
|
|
$472,000
|
|
John W. Gressier
|
|
|
|
|
|
|
2014 Metric
|
Payout Factor
|
x Weighting
|
= Adjusted Weighting
|
X Target Bonus
(1)
|
= Bonus Payout
|
|
OROACE
|
100%
|
75%
|
75.0%
|
$1,262,500
|
$946,875
|
|
Non-Financial
|
100%
|
25%
|
25.0%
|
$315,625
|
|
|
TOTAL
|
|
|
100.0%
|
|
$1,262,500
|
|
(1)
|
Converted from pounds sterling based on December 31, 2014 exchange rate of 1.5586418347
|
|
Joseph C. Henry
|
|||||
|
2014 Metric
|
Payout Factor
|
x Weighting
|
= Adjusted Weighting
|
X Target Bonus
|
= Bonus Payout
|
|
OROACE
|
108%
|
75%
|
81.0%
|
$565,000
|
$457,650
|
|
Non-Financial
|
140%
|
25%
|
35.0%
|
$197,750
|
|
|
TOTAL
|
|
|
116.0%
|
|
$655,400
|
192
|
John D. Nichols
|
|||||
|
2014 Metric
|
Payout Factor
|
x Weighting
|
= Adjusted Weighting
|
X Target Bonus
|
= Bonus Payout
|
|
OROACE
|
108%
|
50%
|
54.0%
|
$1,125,000
|
$607,500
|
|
Business Unit Financial
|
135%
|
30%
|
40.56%
|
$456,300
|
|
|
Non-Financial
|
125%
|
20%
|
25.0%
|
$281,250
|
|
|
TOTAL
|
|
|
119.6%
|
|
$1,345,050
|
|
Peter W. Wilson
|
|||||
|
2014 Metric
|
Payout Factor
|
x Weighting
|
= Adjusted Weighting
|
X Target Bonus
|
= Bonus Payout
|
|
OROACE
|
108%
|
50%
|
54.0%
|
$1,000,000
|
$540,000
|
|
Business Unit Financial
|
70%
|
30%
|
21.0%
|
$210,000
|
|
|
Non-Financial
|
125%
|
20%
|
25.0%
|
$250,000
|
|
|
TOTAL
|
|
|
100.0%
|
|
$1,000,000
|
The graphs below summarize the Company’s financial targets within our 2014 Annual Incentive Plan along with actual results and the corresponding bonus payouts to our CEO and other NEOs:
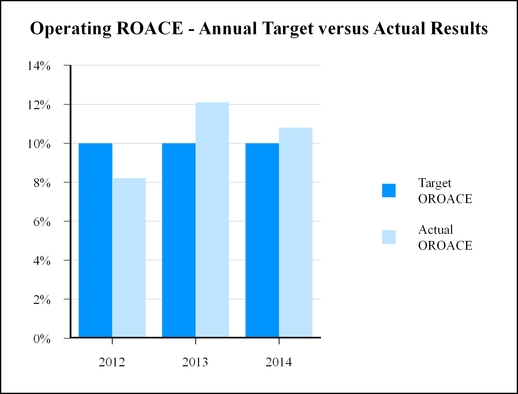
193
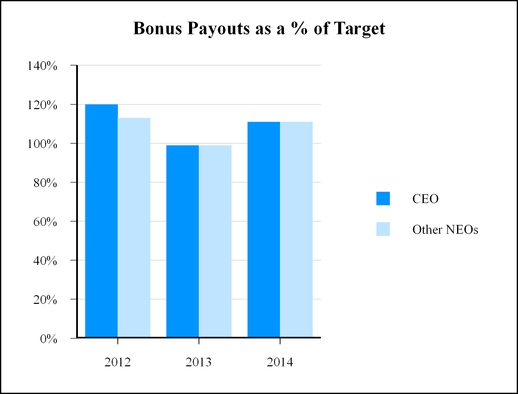
Long-Term Incentive Awards
In 2014, we provided long-term incentive compensation through equity awards under our shareholder-approved 2007 Long-Term Equity Compensation Plan (the “2007 LTEP”). Equity awards are an especially valuable tool in linking the personal interests of our NEOs to those of our shareholders as the amount the executive will ultimately receive under these awards is determined by our stock price. A higher stock price benefits our shareholders and increases the value of the executive’s equity awards. In addition, the vesting requirement for our equity awards is a valuable retention tool that we consider very important in a competitive industry. Furthermore, because other employers with whom we compete for executive talent grant equity as part of their compensation packages, we include this as an element of our executive compensation to be competitive in the market for executive talent.
In March 2014, two types of equity awards were granted to our NEOs: (a) time-vesting awards with performance-based adjustments at the time of grant (“RSUs”); and (b) performance-vesting awards with performance-based adjustments applied at the time of vesting (“PSUs”).
Performance-vesting awards were included in the 2013 Equity Program and approved by the Compensation Committee in December 2013. The PSUs vest in a single installment on the third anniversary of the grant date, if performance metrics are met, while the RSUs vest 25% per year over four years. The equity awards below reflect performance for the 2013 fiscal year and were granted early in 2014. They are included in the “Summary Compensation Table” and the “Grants of Plan-Based Awards Table” in this Form 10-K.
194
|
Name
|
2013 Equity Target ($)
|
PSUs and RSUs ($) Awarded in 2014
(1)
(2013 Performance)
|
|
Albert A. Benchimol
|
N/A
|
N/A
|
|
Christopher N. DiSipio
|
$720,000
|
$719,919
|
|
John W. Gressier
|
$1,400,000
|
$1,399,941
|
|
Joseph C. Henry
|
$1,200,000
|
$1,199,924
|
|
John D. Nichols
|
$1,400,000
|
$1,399,941
|
|
Peter W. Wilson
|
$720,000
|
$1,157,940
(2)
|
|
(1)
|
50/50 split between PSUs and RSUs for Messrs. DiSipio, Gressier, Henry and Nichols. Mr. Wilson did not receive any PSUs in 2014. Amounts represent the $44.33 grant date fair value per share of the RSU and PSU awards granted on March 1, 2014.
|
|
(2)
|
Includes a one-time special equity award of $360,000 which will vest in a single installment on the third anniversary of the grant date.
|
As detailed on the following pages, our CEO did not receive an annual equity award in either 2014 or 2015, for 2013 and 2014 performance, respectively. Mr. Benchimol was granted a one-time equity award in 2012 in lieu of annual equity grants that traditionally would be made over the three-year life of his employment agreement. The table below illustrates 2013 and 2014 equity targets, expressed as a fixed-dollar amount, as well as the 50/50 split between time-vesting and performance-vesting awards:
|
Name
|
|
|
2014 Target - Split
|
|
|
2013 RSU Target ($)
|
2014 RSU Target ($)
|
RSUs
(1)
|
PSUs
(2)
|
|
|
Albert A. Benchimol
|
N/A
|
N/A
|
N/A
|
N/A
|
|
Christopher N. DiSipio
|
$720,000
|
$720,000
|
$360,000
|
$360,000
|
|
John W. Gressier
|
$1,400,000
|
$1,400,000
|
$700,000
|
$700,000
|
|
Joseph C. Henry
|
$1,200,000
|
$1,200,000
|
$600,000
|
$600,000
|
|
John D. Nichols
|
$1,400,000
|
$1,400,000
|
$700,000
|
$700,000
|
|
Peter W. Wilson
|
$720,000
|
$900,000
|
$450,000
|
$450,000
|
|
(1)
|
The RSUs will vest in four equal installments on the first, second, third and fourth anniversaries of the date of grant.
|
|
(2)
|
The PSUs will vest in a single installment on the third anniversary of the grant date.
|
Historically, at the end of each fiscal year, the Compensation Committee determines the actual awards to be made in its discretion, considering competitiveness, retention needs, Company and individual performance and any other factors it deemed relevant. However, based on shareholder feedback and with the adoption of the 2013 Equity Program, the determination of adjusted targets for RSUs and ultimate vesting payouts for PSUs is now based on pre-determined criteria, as follows:
|
•
|
RSU targets are adjusted at time of grant based on a three-year look-back in growth in DBVPS adjusted for dividends as compared to our peers, measured as of September 30 of the performance year. Adjustments to time-based targets can range from 75% to 125% of target, depending on our growth in DBVPS percentile as compared to our peer group.
|
|
•
|
PSU targets are adjusted at time of vesting based on a three-year look-back in growth in DBVPS adjusted for dividends as compared to our peers as of the September 30 preceding the PSU vesting date. Adjustments at vesting can range from 10% to 200% of target, depending on our growth in DBVPS percentile as compared to our peer group.
|
The adjustments to RSUs are being phased in over a three-year period. For grants made in early 2014, we used a one-year look back period with minimum adjustments to target of 100%; for grants made in early 2015, we used a two-year look back period with minimum adjustments to target of 90%; and grants to be made in early 2016 will use the full three-year look back and the full range of potential adjustments to target.
195
The table below illustrates the annual equity target and 50/50 split between RSUs and PSUs for equity awards granted in early 2015 and the potential payouts, without regard to movement in share price, under each grant.
|
Name
|
|
Value Ranges
|
Total Value Ranges Based on Performance
|
||||||||||||||
|
2014 Equity
Target ($)
|
RSUs (50%)
|
PSUs (50%)
|
|||||||||||||||
|
75%
|
100%
|
125%
|
10%
|
100%
|
200%
|
Minimum
|
Maximum
|
||||||||||
|
Albert A. Benchimol
|
N/A
|
—
|
|
—
|
|
—
|
|
—
|
|
—
|
|
—
|
|
—
|
|
—
|
|
|
Christopher N. DiSipio
|
$720,000
|
$270,000
|
|
$360,000
|
|
$450,000
|
|
$36,000
|
|
$360,000
|
|
$720,000
|
|
$306,000
|
|
$1,170,000
|
|
|
John W. Gressier
|
$1,400,000
|
$525,000
|
|
$700,000
|
|
$875,000
|
|
$70,000
|
|
$700,000
|
|
$1,400,000
|
|
$595,000
|
|
$2,275,000
|
|
|
Joseph C. Henry
|
$1,200,000
|
$450,000
|
|
$600,000
|
|
$750,000
|
|
$60,000
|
|
$600,000
|
|
$1,200,000
|
|
$510,000
|
|
$1,950,000
|
|
|
John D. Nichols
|
$1,400,000
|
$525,000
|
|
$700,000
|
|
$875,000
|
|
$70,000
|
|
$700,000
|
|
$1,400,000
|
|
$595,000
|
|
$2,275,000
|
|
|
Peter W. Wilson
|
$900,000
|
$337,500
|
|
$450,000
|
|
$562,500
|
|
$45,000
|
|
$450,000
|
|
$900,000
|
|
$382,500
|
|
$1,462,500
|
|
The Compensation Committee believes the significant range between the minimum and maximum equity payouts, as displayed above, highlights the meaningful amount of NEO compensation that is at risk under the 2013 Equity Program and reflects the Company’s commitment to a pay-for-performance compensation structure in alignment with the interests of our shareholders.
Performance Results
For the two year performance period ending September 30, 2014, our annual measurement date for this metric, AXIS ranked 7
th
among the 12 company peer group which put us in the 42
nd
percentile of our peer group. This would have resulted in adjusting our RSUs to 85% of target. However, because the 2014 performance year minimum target adjustment was 90%, due to 2014 being a transition year, as discussed above, the Compensation Committee approved the following equity awards in early 2015 for 2014 performance. These awards, approved in February 2015, will be reflected in the Summary Compensation Table and the Grants of Plan-Based Awards Table in next year’s public disclosures.
|
Name
|
RSUs
|
PSUs
|
|
Albert A. Benchimol
|
N/A
|
N/A
|
|
Christopher N. DiSipio
|
$324,000
|
$360,000
|
|
Joseph C. Henry
|
$540,000
|
$600,000
|
|
John W. Gressier
|
N/A
|
N/A
|
|
John D. Nichols
|
$630,000
|
$700,000
|
|
Peter W. Wilson
|
$405,000
|
$450,000
|
Vesting
RSU awards vest in four equal installments over a four-year vesting period, while PSU awards “cliff vest” on the third anniversary of the date of grant, subject to satisfying certain Company performance criteria. Because our PSUs were first granted in 2014, none of our PSUs have vested.
196
Mix of Pay
The tables below display the 2013 mix of pay for our NEOs based on data presented in the 2014 proxy statement and the 2014 mix of pay as disclosed in the "Summary Compensation Table" included in this Form 10-K. Mix of pay includes base salary, annual incentive (bonus) payment and awards of RSUs and PSUs.
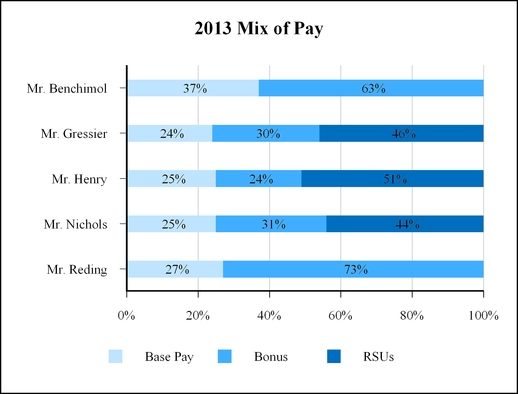
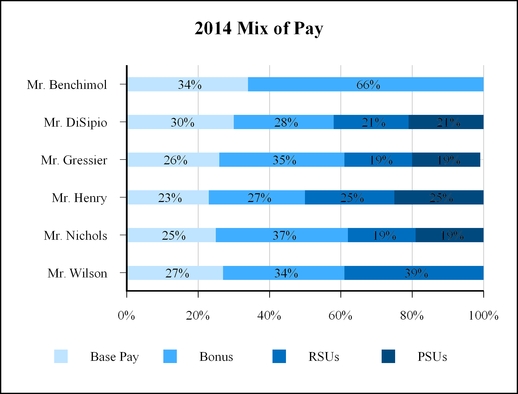
197
As illustrated above, in 2014, our CEO had 66% of his pay at risk. Our other NEOs’ at-risk pay for 2014 ranges from 73% to 77%. Mr. Benchimol did not receive an equity award in 2013 or 2014.
CEO’S Mix of Pay
Total direct compensation for our CEO, as set forth in the “Summary Compensation Table” below increased by 12% from 2013 to 2014. In connection with Mr. Benchimol’s appointment as CEO and President in May 2012, he was granted an award of 500,000 shares of restricted stock. Under the terms of this award, 250,000 of the shares will vest in three equal installments on the first, second and third anniversary of the May 2012 award date, while the remaining 250,000 shares will be eligible to vest in May 2015 only if our three-year growth in DBVPS, measured as of March 31, 2015, is greater than that of the median of the Company’s peer group. If the performance conditions are not satisfied, the entire 50% portion of the award that is dependent upon performance will be forfeited. The award was intended to:
|
•
|
align the long-term interests of our new CEO with those of our shareholders; and
|
|
•
|
reward him in the event our performance exceeds the median of our peer group over a three-year period.
|
The one-time award in 2012 was granted in lieu of annual equity grants that traditionally would be made over the three-year life of his employment agreement. Consistent with this intent, Mr. Benchimol did not receive an annual equity award in either 2013 or 2014, for 2012 and 2013 performance, respectively, unlike the other NEOs who received annual equity awards.
The table below illustrates the actual amounts of total direct compensation (base salary and bonus compensation, as reported in the “Summary Compensation Table” in this Form 10-K) for 2013 and 2014 for Mr. Benchimol.
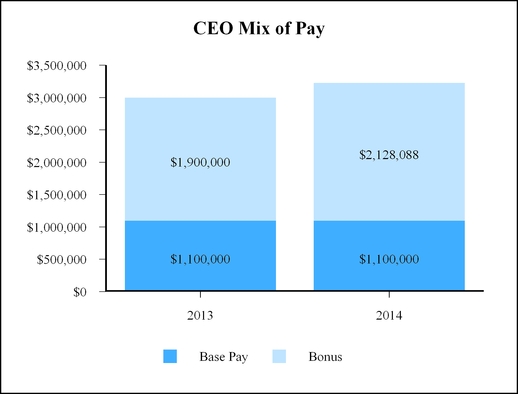
Perquisites and Other Personal Benefits
Because our business is global and we are headquartered in Bermuda, many of our NEOs are required to relocate or to maintain a second residence or travel for business in order to work for us. To reduce the likelihood that this factor will discourage talented executive officers from joining AXIS, we provide reimbursements for a certain amount of personal travel for return trips home to NEOs who work away from their home countries, as well as, in some cases, housing allowances to help defray the cost of maintaining a second residence or working in multiple locations. We also pay for certain U.S. tax
198
expenses for any non-U.S. resident, Bermuda-based employee who may be subject to incremental taxes as a result of travel to the U.S. for business purposes. These payments are designed to make whole our Bermuda-based non-U.S. citizen employees who, but for required business travel, would not otherwise have incurred an obligation for U.S. taxes. We also provide certain other perquisites and benefits, as well as the general health plan and other benefits provided to all employees, which make us a competitive employer and do not represent a significant cost to us. These benefits also provide our NEOs with the security and convenience that allows them to focus their attention on carrying out their responsibilities to AXIS.
Severance Benefits
Although we do not maintain a general severance plan for our NEOs, each of our NEOs has rights upon termination of his employment under his employment agreement. The terms and conditions of the separation benefits and payments are described in detail in the section entitled “Potential Payments Upon Termination or Change in Control.” We provide these benefits in order to be competitive as an employer. We also provide various benefits in connection with a change in control, in part because a change in control situation often undermines our NEOs’ job security, and it is to the benefit of AXIS and its shareholders to encourage the NEOs to seek out beneficial business transactions and to remain with us through the closing of the transaction, even though their futures may be uncertain as a result. As such, we structured the change in control provisions in each of the employment agreements for our NEOs with a “double trigger,” which requires termination of the executive without cause or termination by the executive for good reason in connection with a change in control. Because the consummation of a transaction alone would not trigger this benefit, this structure essentially places the decision of whether or not to trigger change in control benefits largely in the hands of the acquiring company.
We provide our NEOs with benefits and severance payments if we terminate them without cause and in some cases if they voluntarily leave under certain circumstances. These benefits add a level of security to the NEO’s position. We believe these benefits are needed to attract and retain talented executives in our industry. These provisions encourage individuals to move from other firms in the industry and help attract individuals from outside of the industry to take a position in our industry, which is generally more volatile. In addition, we face significant competition within our industry for experienced leaders, and we believe these benefits are needed to remain competitive as an employer as it is a common feature in many of our competitors’ compensation programs. Furthermore, we provide these benefits in part so we can obtain valuable agreements from the NEOs to assign to us certain intellectual property rights, not to compete with us for a certain period of time after leaving, not to solicit our employees or customers after leaving and to maintain the confidentiality of our information. Moreover, providing termination payments allows us to obtain a release of claims from the NEO upon his or her departure from AXIS, which we consider a valuable benefit to us.
Restriction on Trading By Directors and Officers/Anti-Hedging and Pledging
The Company’s policy on insider trading generally permits directors and executive officers (including our NEOs) to engage in transactions involving the Company’s common stock and other securities only (a) during a Company-prescribed trading window of limited duration; and (b) after seeking pre-clearance to avoid trading while in possession of material non-public information. In addition, the Company’s policy on insider trading prohibits all employees and directors from engaging in hedging transactions with respect to the Company’s securities and also prohibits pledging, or using as collateral, the Company’s securities in order to secure personal loans or other obligations.
Stock Ownership Guidelines for Executive Officers
We believe it is important to align the financial interests of our senior executives with those of our shareholders. Accordingly, we have adopted guidelines which specify the minimum amount of AXIS securities that we expect our NEOs and key senior management employees to own on a direct basis, meaning stock which is subject to market risk, not simply held under option. Our stock ownership guidelines require our CEO to hold AXIS securities with a value equal to a minimum of five times his annual base salary and require the other NEOs and covered members of senior management to hold AXIS securities with a value equal to a minimum of two to three times their annual base salary. Individuals subject to the guidelines have five years to meet the applicable minimum requirement from the later of (a) September 2009 (the date of adoption of the guidelines); or (b) the date of promotion or appointment to a position subject to the guidelines.
199
U.S. Tax Considerations
Section 162(m) of the Internal Revenue Code generally disallows a tax deduction to public companies for compensation in excess of $1 million paid to certain executives, although performance-based compensation arrangements may qualify for an exemption from the deduction limit if they satisfy various requirements under Section 162(m). For AXIS, this rule has limited effect because our Company is headquartered in Bermuda and U.S. tax law only affects a portion of our income. Therefore, although we are aware of and consider the impact of this rule when developing and implementing our executive compensation program, compliance with the requirements of Section 162(m) has not been a driving factor in the operation of our executive compensation program.
Opportunity for Shareholder Feedback
We value feedback from our shareholders about our executive compensation philosophy and program, and welcome shareholders to express their views to the Board in writing. Shareholders and other interested parties may send communications to our Board by sending written notice to our Secretary at our headquarters at 92 Pitts Bay Road, Pembroke, Bermuda HM 08. The notice may specify whether the communication is directed to the entire Board, to the non-management directors, to the Lead Independent Director or to a particular Board committee or other director. Our Secretary will handle routine inquiries and requests for information or will otherwise determine whether the communication is made for a valid purpose and is relevant to the Company and its business and, if he so determines, will forward the communication to our Chairman of the Board, to the non-management directors or to the appropriate committee chairman or director. At each meeting of our Board, our Secretary presents a summary of all communications received since the last meeting that were not forwarded and makes those communications available to the directors on request.
Compensation Committee Report
The Compensation Committee has reviewed and discussed with management the Compensation Discussion and Analysis included in this Form 10-K. Based on the review and discussions referred to above, the Compensation Committee recommended to the Board that the Compensation Discussion and Analysis be included in this Form 10-K.
COMPENSATION COMMITTEE
Henry B. Smith, Chairman
Geoffrey Bell
Robert L. Friedman
Christopher V. Greetham
Thomas C. Ramey
200
Executive Compensation
Summary Compensation Table
The following table sets forth compensation earned by our named executive officers for the years ended December 31, 2014, 2013 and 2012.
|
Name & Principal Position
|
Year
|
Salary
($)
|
Bonus
($)
|
|
Stock Awards
($)
(1)
|
|
Non-Equity Incentive Plan Compensation
($)
|
All Other Compensation
($)
(2)
|
Total
($)
|
|
Albert A. Benchimol
CEO, President and Director
|
2014
|
$1,100,000
|
$203,088
|
|
—
|
|
$1,925,000
|
$576,518
|
$3,804,606
|
|
2013
|
$1,100,000
|
—
|
|
—
|
|
$1,900,000
|
$653,631
|
$3,653,631
|
|
|
2012
|
$1,032,038
|
$385,000
|
|
$18,863,225
|
|
$1,925,000
|
$468,758
|
$22,674,021
|
|
|
Christopher N. DiSipio
CEO, AXIS Accident & Health
|
2014
|
$500,000
|
$72,000
|
|
$719,919
|
|
$400,000
|
$54,017
|
$1,745,936
|
|
John W. Gressier
Former Chief Operating Officer
|
2014
|
$929,340
|
—
|
|
$1,399,941
|
|
$1,262,500
|
$145,974
|
$3,737,755
|
|
2013
|
$915,153
|
—
|
|
$1,753,200
|
|
$1,175,543
|
$732,739
|
$4,576,636
|
|
|
2012
|
$910,000
|
$112,500
|
|
$1,673,175
|
|
$1,137,500
|
$493,361
|
$4,326,536
|
|
|
Joseph C. Henry
CFO
|
2014
|
$565,000
|
$90,400
|
|
$1,199,924
|
|
$565,000
|
$64,750
|
$2,489,074
|
|
2013
|
$565,000
|
—
|
|
$1,168,800
|
|
$548,050
|
$63,721
|
$2,345,571
|
|
|
2012
|
$285,577
|
$55,000
|
|
$487,050
|
|
$550,000
|
$97,584
|
$1,475,211
|
|
|
John D. Nichols
CEO, AXIS Reinsurance
|
2014
|
$900,000
|
$220,050
|
|
$1,399,941
|
|
$1,125,000
|
$435,431
|
$4,080,422
|
|
2013
|
$900,000
|
—
|
|
$1,558,400
|
|
$1,091,250
|
$235,390
|
$3,785,040
|
|
|
2012
|
$657,692
|
$75,000
|
|
$1,666,500
|
|
$1,125,000
|
$25,000
|
$3,549,192
|
|
|
Peter W. Wilson
CEO, AXIS Insurance
|
2014
|
$786,346
|
—
|
|
$1,157,900
|
|
$1,000,000
|
$78,635
|
$3,022,881
|
|
(1)
|
The grant date fair value of the awards is based on the closing price of our common stock on the NYSE on the date of the grant without taking into account estimated forfeitures.
|
|
(2)
|
The All Other Compensation for 2014-Supplemental Table below provides details regarding the 2014 amounts.
|
All Other Compensation for 2014 - Supplemental Table
The following table describes the incremental cost of other benefits provided in 2014 that are included in the “All Other Compensation” column.
|
Name
|
Personal Use of Aircraft ($)
(1)
|
Housing Allowance ($)
|
Retirement Contributions ($)
(2)
|
Other Compensation ($)
(3)
|
All Other Compensation ($)
|
|
Albert A. Benchimol
|
$144,893
|
$300,000
|
$26,000
|
$105,625
|
$576,518
|
|
Christopher N. DiSipio
|
|
|
$50,000
|
$4,017
|
$54,017
|
|
John W. Gressier
|
|
|
$139,401
|
$6,573
|
$145,974
|
|
Joseph C. Henry
|
|
|
$26,000
|
$42,750
|
$68,750
|
|
John D. Nichols
|
|
$300,000
|
$26,000
|
$109,431
|
$435,431
|
|
Peter W. Wilson
|
|
|
$78,635
|
|
$78,635
|
|
(1)
|
This amount represents the incremental cost to the Company of the aircraft that we lease. We calculate our incremental cost for personal use of corporate aircraft based on variable operating costs including fuel costs, crew travel, hourly costs, landing fees and other miscellaneous variable costs. Fixed costs that do not change based on usage, such as the lease cost for the aircraft, are not included. On certain occasions, a family member or guest may accompany the executive on a flight.
|
|
(2)
|
The amounts for Messrs. Benchimol, Henry, and Nichols represent a Company contribution under the AXIS 401(k) Plan. The amounts for Messrs. DiSipio and Wilson represent Company contributions under the AXIS 401(k) Plan, and the AXIS Specialty U.S. Services, Inc. Supplemental Retirement Plan ("U.S. Supplemental Plan"). The amount for Mr. Gressier is the Company’s contribution to the London Stakeholder Pension Plan.
|
|
(3)
|
Other Compensation includes: (i) a cash payment in lieu of a Company contribution to the U.S. Supplemental Plan for Messrs. Benchimol ($105,625), Henry ($38,750), and Nichols ($80,625), as these executives are no longer eligible participants due to changes in Section 457A of the Internal Revenue code; (ii) a home leave benefit for Messrs. Gressier ($6,573) and Nichols ($21,112); (iii) the cost of executive physicals for Messrs. Henry and Nichols; and (iv) a service award with a tax gross-up adjustment for Mr. DiSipio.
|
201
Grants of Plan-Based Awards in 2014
The following table provides information on annual incentive payments and restricted stock awards granted in 2014 to each of our NEOs.
|
Name
|
|
Estimated Future Payouts Under
Non-Equity Incentive Plan Awards
|
|
Estimated Future Payouts Under Equity Incentive Plan Awards
(5)
|
All Other Stock Awards: Shares of Stock or Units (#)
(9)
|
Grant Date Fair Value of Stock
($)
(10)
|
||||
|
Grant Date
(1)
|
Threshold ($)
(2)
|
Target ($)
(3)
|
Maximum ($)
(4)
|
|
Threshold ($)
(6)
|
Target ($)
(7)
|
Maximum ($)
(8)
|
|||
|
Albert A. Benchimol
|
N/A
|
$0
|
$1,925,000
|
$3,850,000
|
|
—
|
—
|
—
|
—
|
—
|
|
Christopher N. DiSipio
|
3/1/2014
|
|
|
|
|
$35,996
|
$359,960
|
$719,919
|
8,120
|
$719,919
|
|
|
N/A
|
$0
|
$400,000
|
$800,000
|
|
|
|
|||
|
John W. Gressier
|
3/1/2014
|
|
|
|
|
$69,997
|
$699,971
|
$1,399,941
|
15,790
|
$1,399,941
|
|
|
N/A
|
$0
|
$1,262,500
|
$2,525,000
|
|
|
|
|||
|
Joseph C. Henry
|
3/1/2014
|
|
|
|
|
$59,978
|
$599,962
|
$1,199,924
|
13,534
|
$1,199,924
|
|
|
N/A
|
$0
|
$565,000
|
$1,130,000
|
|
|
|
|||
|
John D. Nichols
|
3/1/2014
|
|
|
|
|
$69,997
|
$699,971
|
$1,399,941
|
15,790
|
$1,399,941
|
|
|
N/A
|
$0
|
$1,125,000
|
$2,250,000
|
|
|
|
|||
|
Peter W. Wilson
|
3/1/2014
|
|
|
|
|
|
26,120
|
$1,157,900
|
||
|
|
N/A
|
$0
|
$1,000,000
|
$2,000,000
|
|
|
|
|||
|
(1)
|
Effective date of grants of RSU and PSU awards under our 2007 LTEP, the terms of which are summarized under “Compensation Discussion and Analysis - Long-Term Equity Compensation Plans.”
|
|
(2)
|
Amounts represent the minimum incentive bonus opportunity pursuant to the 2014 Annual Incentive Plan.
|
|
(3)
|
Amounts represent the annual target incentive bonus opportunity pursuant to each NEO’s employment agreement.
|
|
(4)
|
Amounts represent the maximum incentive bonus opportunity pursuant to the 2014 Annual Incentive Plan.
|
|
(5)
|
Messrs. DiSipio, Gressier, Henry and Nichols received a 50/50 split of RSUs and PSUs. Amounts represent PSU award. The PSUs will vest in one installment on the third anniversary of the grant date.
|
|
(6)
|
Amounts represent guaranteed minimum payout for PSU award.
|
|
(7)
|
Amounts represent target payout for PSU award provided certain Company performance conditions are satisfied.
|
|
(8)
|
Amounts represent maximum payout for PSU award provided certain Company performance conditions are satisfied.
|
|
(9)
|
Messrs. DiSipio, Gressier, Henry and Nichols received a 50/50 split of RSUs and PSUs. Amounts represent RSU award. The RSUs will vest in four equal installments on the first, second, third and fourth anniversaries of the date of the grant of RSUs. Mr. Wilson received RSUs with the same terms as those granted to the other NEOs, and a special equity award ($360,000) which will vest in one installment on the third anniversary of the grant date.
|
|
(10)
|
Amounts represent the $44.33 grant date fair value per share of the RSU and PSU awards granted on March 1, 2014.
|
Employment and Other Agreements with Named Executive Officers
Albert A. Benchimol
Under the terms of an employment agreement between Mr. Benchimol and the Company dated May 3, 2012, Mr. Benchimol serves as our Chief Executive Officer and President for a term of service to May 3, 2015, and is entitled to: (i) an annual base salary of no less than $1,100,000; (ii) participation in our Annual Incentive Plan at an annual bonus target of 175% of base salary should performance targets be met; (iii) participation in our 2013 Equity Program; (iv) a monthly housing allowance of $25,000 for a residence in Bermuda; (v) up to 30 hours of personal use of the Company aircraft each calendar year; (vi) participation in any employment benefit plans made available to our executives; and (vii) any fringe benefits provided to our executives generally. These benefits are reflected above in the “All Other Compensation” column of the “Summary Compensation Table” and the related footnote.
Mr. Benchimol’s employment agreement provides for certain benefits upon termination of his employment for various reasons, as described below under “Potential Payments Upon Termination or Change in Control.”
202
The employment agreement also provides for a 12-month notice period should Mr. Benchimol desire to voluntarily terminate his employment with the Company and non-competition and non-solicitation provisions for a period of 24 months from the date of any termination.
Christopher N. DiSipio
Mr. DiSipio serves as the Chief Executive Officer of AXIS Accident & Health under an employment agreement dated February 27, 2014 for a term of service to December 31, 2016 and is entitled to: (i) an annual base salary of no less than $500,000; (ii) participation in our Annual Incentive Plan at an initial annual bonus target of 80% of base salary should performance targets be met; (iii) participation in our 2013 Equity Program with an initial annual target restricted stock unit award valued at $720,000; (iv) participation in any employment benefit plans generally made available to our executives; and (v) any fringe benefits we provide to our executives generally. These benefits are reflected above in the “All Other Compensation” column of the “Summary Compensation Table” and the related footnote.
Mr. DiSipio’s employment agreement provides for certain benefits upon termination of his employment for various reasons, as described below under “Potential Payments Upon Termination or Change in Control.”
The employment agreement also provides for a six month notice period should Mr. DiSipio desire to voluntarily terminate his employment with the Company, a non-competition provision for a six month period from the date of his voluntary termination or termination by the Company for cause and a non-solicitation provision for a period of 12 months from the date of any termination.
John W. Gressier
Under the terms of an employment agreement dated December 5, 2013, Mr. Gressier served as the Chief Executive Officer of AXIS Insurance until April 1, 2014, when he became Chief Operating Officer, for a term of service to December 31, 2016 and was entitled to: (i) an annual base salary of no less than £585,000; (ii) participation in our Annual Incentive Plan at an initial annual bonus target of 125% of base salary should performance targets be met; (iii) participation in the Company’s 2013 Equity Program with an annual target share or unit award valued at $1,400,000; (iv) participation in any employment benefit plans generally made available to our executives; and (v) any fringe benefits we provide to our executives generally. These benefits are reflected above in the “All Other Compensation” column of the “Summary Compensation Table” and the related footnote.
The employment agreement provides for a 12-month notice period in the event of a voluntary termination by Mr. Gressier and non-competition and non-solicitation provisions for a period of 12 months from the date of termination.
On June 23, 2014, Mr. Gressier provided notice of his voluntary resignation effective June 30, 2015. In connection with his notice of resignation, on August 5, 2014, the Company entered into a separation arrangement with Mr. Gressier. Under the terms of the agreement, Mr. Gressier agreed to extend the non-competition and non-solicitation provisions under his employment agreement from June 30, 2015 to June 30, 2016 in consideration of the Company’s agreeing to provide for: (i) the continued vesting of his outstanding but unvested equity awards during the one-year extension period, as if no termination of employment has occurred; and (ii) the accelerated vesting at June 30, 2016 of any additional outstanding equity awards that remain unvested as of that date.
Joseph C. Henry
Under the terms of an employment agreement dated January 23, 2015, Mr. Henry serves as our Chief Financial Officer for a term of service to December 31, 2017 and is entitled to: (i) an annual base salary of $565,000; (ii) participation in our Annual Incentive Plan at an annual bonus target of 100% of base salary should performance targets be met; (iii) participation in our 2013 Equity Program with an annual target restricted stock unit award valued at $1,200,000; (iv) participation in any employment benefit plans generally made available to our executives; and (v) any fringe benefits we provide to our executives generally. These benefits are reflected above in the “All Other Compensation” column of the “Summary Compensation Table” and the related footnote.
203
Mr. Henry’s employment agreement provides for certain benefits upon termination of his employment for various reasons, as described below under “Potential Payments Upon Termination or Change in Control.”
The employment agreement also provides for a 12-month notice period should Mr. Henry desire to voluntarily terminate his employment with the Company and non-competition and non-solicitation provisions for a period of 12 months from the date of termination for any reason.
John D. Nichols
Mr. Nichols serves as the Chief Executive Officer of AXIS Reinsurance under an employment agreement dated January 23, 2015 for a term of service to December 31, 2017 and is entitled to: (i) an annual base salary of $900,000; (ii) participation in our Annual Incentive Plan at an annual bonus target of 125% of base salary should performance targets be met; (iii) participation in our 2013 Equity Program with an annual target restricted stock unit award valued at $1,400,000; (iv) participation in any employment benefit plans generally made available to our executives; and (v) any fringe benefits we provide to our executives generally. These benefits are reflected above in the “All Other Compensation” column of the “Summary Compensation Table” and the related footnote.
Mr. Nichol’s employment agreement provides for certain benefits upon termination of his employment for various reasons, as described below under “Potential Payments Upon Termination or Change in Control.”
The employment agreement also provides for a 12-month notice period should Mr. Nichols desire to voluntarily terminate his employment with the Company and non-competition and non-solicitation provisions for a period of 12 months from the date of termination for any reason.
Peter W. Wilson
Under the terms of an employment agreement dated June 23, 2014, Mr. Wilson serves as our Chief Executive Officer of AXIS Insurance for a term of service to December 31, 2016 and is entitled to: (i) an annual base salary of no less than $800,000; (ii) participation in our Annual Incentive Plan at an annual bonus target of 125% of base salary should performance targets be met; (iii) participation in our 2013 Equity Program with an initial annual target restricted stock unit award valued at $900,000; (iv) participation in any employment benefit plans generally made available to our executives; and (v) any fringe benefits we provide to our executives generally. These benefits are reflected above in the “All Other Compensation” column of the “Summary Compensation Table” and the related footnote.
Mr. Wilson’s employment agreement provides for certain benefits upon termination of his employment for various reasons, as described below under “Potential Payments Upon Termination or Change in Control.”
The employment agreement also provides for a 12-month notice period should Mr. Wilson desire to voluntarily terminate his employment with the Company and non-competition and non-solicitation provisions for a period of 12 months from the date of termination for any reason.
Long-Term Equity Compensation
In 2007, our Board adopted and our shareholders approved the AXIS Capital Holdings Limited 2007 Long-Term Equity Compensation Plan as amended with shareholder approval in 2009 and 2012 ("2007 LTEP"). The 2007 LTEP provides for the grant of nonqualified stock options, incentive stock options, stock appreciation rights, restricted stock awards, restricted stock unit awards, performance unit awards and other equity-based or equity-related awards to our employees, directors and consultants. The Compensation Committee has broad authority to administer the plan, including the authority to select plan participants, determine when awards will be made, determine the type and amount of awards, determine the exercise price of options and stock appreciation rights, determine any limitations, restrictions or conditions applicable to each award and determine the terms of any agreement or other document that evidences an award. During 2014, only RSUs and PSUs were awarded under the 2007 LTEP to our NEOs.
Awards of RSUs and PSUs represent a promise to grant shares of our common stock once certain vesting conditions are met or after a certain passage of time, subject to restrictions on transfer of the shares, any other restrictions the Compensation Committee imposes and forfeiture of the shares if the participant terminates employment before the shares vest. All of the
204
RSU awards granted to our NEOs during 2014 vest (and the restrictions lapse) in four equal installments on the first, second, third and fourth anniversaries of the date of grant. All of the PSU awards granted to our NEOs during 2014 vest in a single installment on the third anniversary of the date of grant, if performance metrics are met. Vesting is fully accelerated upon the death or permanent disability of the participant or termination in connection with a change in control, as described below under “Potential Payments Upon Termination or Change in Control.” Holders of RSU and PSU awards receive accumulated dividend equivalents paid with respect to the underlying units only upon vesting.
2014 Annual Incentive Plan
We provide annual incentive payments under our 2014 Annual Incentive Plan to provide performance-based cash annual bonuses for our NEOs and other members of our executive committee. For a full description of the funding for our 2014 Annual Incentive Plan, see “Compensation Discussion and Analysis”-“Annual Incentive Awards” above.
Retirement Benefits
Our NEOs participate in our International Pension Plan, our London Stakeholder Pension Plan, our U.S. 401(k) Plan and our U.S. Supplemental Plan. Mr. Gressier participated in our International Pension Plan and our London Stakeholder Pension Plan during 2014. Messrs. Benchimol, DiSipio, Henry, Nichols and Wilson participated in the AXIS 401(k) Plan during 2014 and Messrs. DiSipio and Wilson participated in our U.S. Supplemental Plan during 2014.
The International Pension Plan permits participants to make contributions to their own accounts in the plan, and requires us to contribute an amount equal to at least 10% of each participant’s base salary each year, reduced by any amounts that we are required to contribute to another plan, although we may contribute more in our discretion. For 2014, we contributed an amount equal to 10% of Mr. Gressier’s eligible earnings to the International Pension Plan. Our contributions to the International Pension Plan vest fully after the participant has been in the plan for two years. Benefits are paid after termination of employment or upon death or disability either in cash or by transfer to another retirement plan or retirement product.
The London Stakeholder Pension Plan permits employees to make contributions to their own account in the plan, and requires us to contribute an amount equal to 15% of each participant’s base salary earned each year. Our contributions to the London Stakeholder Pension Plan vest immediately. Benefits are distributable upon death, retirement or by transfer to another pension plan provider. Benefits are distributable upon disability if an early annuity is requested due to ill health.
In the United States, we maintain the AXIS 401(k) Plan under which participants may contribute a portion of their earnings on a tax-deferred basis and we make matching contributions. We also may make annual employer discretionary contributions. For 2014, we made matching contributions equal to 100% of each participant’s contributions, subject to a maximum match of 4% of eligible earnings. We also made annual employer discretionary contributions equal to 6% of each participant’s eligible earnings. For purposes of calculating the matching and employer discretionary contributions, only the first $260,000 of each NEO’s earnings was taken into account, due to limitations imposed by the Internal Revenue Code. NEOs are always fully vested in our matching contributions, and vest in our employer discretionary contributions 25% per year, with full vesting after four years of service. Benefits are distributable upon death, disability, retirement, termination of employment or upon reaching age 59-1/2.
We also maintain the U.S. Supplemental Plan in the United States which is designed to permit eligible participants to accumulate additional retirement income through a nonqualified deferred compensation plan that enables them to make salary deferrals of up to 100% of their salary in excess of deferrals allowed under the AXIS 401(k) Plan, to make additional deferrals from their bonus payments of up to 100% of their bonus and to receive discretionary employer contributions. Each year, we make a discretionary contribution to all participants in the U.S. Supplemental Plan expressed as a percentage of the participant’s base salary that is above the Internal Revenue Code maximum under the AXIS 401(k) Plan.
Additional Benefits
Each of our NEOs are encouraged to participate in our Executive Health Examination Program which entitled each of them to have a physical examination in 2014. We pay the full cost of the physical examination plus any travel-related expenses. In 2014, Messrs. Henry and Nichols each completed a physical examination. Amounts reimbursed to Messrs. Henry and Nichols are included in the 2014 "All Other Compensation" column of the "Summary Compensation Table".
205
In 2005, our Compensation Committee adopted a formal practice permitting personal use of corporate aircraft by certain of our executive officers. Mr. Benchimol is currently our only executive eligible for personal usage of the aircraft and his employment contract provides for up to 30 hours of personal usage per calendar year.
Outstanding Equity Awards at 2014 Fiscal Year-End
The following table sets forth information regarding all outstanding equity awards held by our NEOs.
|
Name
|
Option Awards
|
|
Stock Awards
|
|||||||||||
|
Number of Securities Underlying Unexercised Options (#) Exercisable
|
Option Exercise Price ($)
|
Option Expiration Date
|
|
Grant Date
|
Number of Shares or Number Units of Stock that have Not Vested
(#)
(1)
|
Market Value of Shares or Units of Stock That Have Not Vested
($)
(2)
|
Equity Incentive Plan Awards:
# of Unearned Shares, Units or Other Rights That Have Not Vested
(#)
(1)
|
Equity Incentive Plan Awards: Market or Payout Value of Unearned Shares, Units or Other Rights That Have Not Vested
($)
(2)
|
||||||
|
|
||||||||||||||
|
|
||||||||||||||
|
|
||||||||||||||
|
|
||||||||||||||
|
|
||||||||||||||
|
Albert A. Benchimol
|
—
|
|
—
|
|
—
|
|
|
1/17/2011
|
25,000
|
$1,277,250
|
—
|
|
—
|
|
|
|
|
|
|
|
|
|
|
2/6/2012
|
26,250
|
$1,341,113
|
—
|
|
—
|
|
|
|
|
|
|
|
|
|
5/3/2012
|
83,334
|
$4,257,534
|
250,000
|
|
$12,772,500
|
|
|
|
|
|
|
|
|
|
|
|
|
|
|
|
Aggregate Market Value:
|
|
|
|
|
|
|
|
|
|
|
|
|
|
|
|
|
$19,648,397
|
|
|
Christopher N. DiSipio
|
—
|
|
—
|
|
—
|
|
|
2/7/2011
|
3,750
|
$191,588
|
—
|
|
—
|
|
|
|
|
|
|
|
|
|
2/6/2012
|
10,350
|
$528,782
|
—
|
|
—
|
|
|
|
|
|
|
|
|
|
|
|
2/4/2013
|
18,750
|
$957,938
|
—
|
|
—
|
|
|
|
|
|
|
|
|
|
|
3/1/2014
|
8,120
|
$414,851
|
8,120
|
|
$414,851
|
|
|
|
|
|
|
|
|
|
|
|
|
|
|
|
Aggregate Market Value:
|
|
|
|
|
|
|
|
|
|
|
|
|
|
|
|
$2,508,010
|
|
|
John W. Gressier
|
—
|
|
—
|
|
—
|
|
|
2/7/2011
|
12,500
|
$638,625
|
—
|
|
—
|
|
|
|
|
|
|
|
|
|
|
2/6/2012
|
26,250
|
$1,341,113
|
—
|
|
—
|
|
|
|
|
|
|
|
|
|
|
2/4/2013
|
33,750
|
$1,724,288
|
—
|
|
—
|
|
|
|
|
|
|
|
|
|
|
3/1/2014
|
15,790
|
$806,711
|
15,790
|
|
$806,711
|
|
|
|
|
|
|
|
|
|
|
|
|
|
|
|
Aggregate Market Value:
|
|
|
|
|
|
|
|
|
|
|
|
|
|
|
|
$5,317,448
|
|
|
Joseph C. Henry
|
—
|
|
—
|
|
—
|
|
|
6/18/2012
|
7,500
|
$383,175
|
—
|
|
—
|
|
|
|
|
|
|
|
|
|
|
2/4/2013
|
22,500
|
$1,149,525
|
—
|
|
—
|
|
|
|
|
|
|
|
|
|
|
3/1/2014
|
13,534
|
$691,452
|
13,534
|
|
$691,452
|
|
|
|
|
|
|
|
|
|
|
|
|
|
|
|
Aggregate Market Value:
|
|
|
|
|
|
|
|
|
|
|
|
|
|
|
|
$2,915,604
|
|
|
John D. Nichols
|
—
|
|
—
|
|
—
|
|
|
4/2/2012
|
25,000
|
$1,277,250
|
—
|
|
—
|
|
|
|
|
|
|
|
|
|
|
2/4/2013
|
30,000
|
$1,532,700
|
—
|
|
—
|
|
|
|
|
|
|
|
|
|
|
3/1/2014
|
15,790
|
$806,711
|
15,790
|
|
$806,711
|
|
|
|
|
|
|
|
|
|
|
|
|
|
|
|
Aggregate Market Value:
|
|
|
|
|
|
|
|
|
|
|
|
|
|
|
|
$4,423,372
|
|
|
Peter W. Wilson
|
—
|
|
—
|
|
—
|
|
|
5/6/2013
|
18,750
|
$957,938
|
—
|
|
—
|
|
|
|
|
|
|
|
|
|
|
3/1/2014
|
26,120
|
$1,334,471
|
—
|
|
—
|
|
|
|
|
|
|
|
|
|
|
|
|
|
|
|
Aggregate Market Value:
|
|
|
|
|
|
|
|
|
|
|
|
|
|
$2,292,409
|
|
||
(1)
The RSUs granted on January 17, 2011, February 7, 2011, February 6, 2012, April 2, 2012, June 18, 2012, February 4, 2013, and March 1, 2014 all vest equally at 25% per year over a four-year period. The PSUs granted on March 1, 2014 to Messrs. DiSipio, Gressier, Henry, and Nichols will vest in a single installment on the third anniversary of the grant date, provided certain performance conditions are satisfied. The market value of the PSUs is based on target performance. The special equity grant ($360,000) awarded to Mr. Wilson on March 1, 2014 will vest in a single installment on the third anniversary of the grant date. The performance award granted on to Mr. Benchimol on May 3, 2012 will vest on May 3, 2015 provided certain performance conditions are satisfied. The remaining RSUs ($4,257,534) awarded to Mr. Benchimol on May 3, 2012 vest equally at one-third per year over a three-year period.
|
(2)
|
The market value is based on the closing price of common stock on December 31, 2014 ($51.09).
|
206
Option Exercises and Stock Vested in 2014
The following table sets forth information regarding the amounts received by our NEOs as a result of the exercise of stock options and vesting of restricted stock held by our NEOs during the 2014 fiscal year.
|
Option Awards
|
|
Stock Awards
|
|||
|
Name
|
Number of Shares Acquired on Exercise (#)
|
Value Realized on Exercise ($)
|
|
Number of Shares Acquired on Vesting
(#)
|
Value Realized on Vesting
($)
|
|
|
|||||
|
|
|||||
|
Albert A. Benchimol
|
—
|
—
|
|
121,458
|
$5,465,427
(1)
|
|
Christopher N. DiSipio
|
—
|
—
|
|
18,175
|
$785,905
(2)
|
|
John W. Gressier
|
—
|
—
|
|
46,875
|
$2,018,138
(3)
|
|
Joseph C. Henry
|
—
|
—
|
|
11,250
|
$505,688
(4)
|
|
John D. Nichols
|
—
|
—
|
|
22,500
|
$1,013,050
(5)
|
|
Peter W. Wilson
|
—
|
—
|
|
6,250
|
$277,563
(6)
|
(1)
Total shares vested for Mr. Benchimol consisted of:
- 25,000 on January 17, 2014 based on the closing price of our common stock on January 17, 2014 of $45.56
- 13,125 on February 6, 2014 based on the closing price of our common stock on February 6, 2014 of $42.84
- 83,333 on May 3, 2014 based on the closing price of our common stock on May 3, 2014 of $45.17
(2)
Total shares vested for Mr. DiSipio consisted of:
- 6,250 on February 4, 2014 based on the closing price of our common stock on February 4, 2014 of $44.33
- 5,175 on February 6, 2014 based on the closing price of our common stock on February 6, 2014 of $42.84
- 3,750 on February 7, 2014 based on the closing price of our common stock on February 7, 2014 of $42.54
- 3,000 on February 8, 2014 based on the closing price of our common stock on February 8, 2014 of $42.54
(3)
Total shares vested for Mr. Gressier consisted of:
- 11,250 on February 4, 2014 based on the closing price of our common stock on February 4, 2014 of $44.33
- 13,125 on February 6, 2014 based on the closing price of our common stock on February 6, 2014 of $42.84
- 12,500 on February 7, 2014 based on the closing price of our common stock on February 7, 2014 of $42.54
- 10,000 on February 8, 2014 based on the closing price of our common stock on February 8, 2014 of $42.54
(4)
Total shares vested for Mr. Henry consisted of:
- 7,500 on February 4, 2014 based on the closing price of our common stock on February 4, 2014 of $44.33
- 3,750 on June 18, 2014 based on the closing price of our common stock on June 18, 2014 of $46.19
(5)
Total shares vested for Mr. Nichols consisted of:
- 10,000 on February 4, 2014 based on the closing price of our common stock on February 4, 2014 of $44.33
- 12,500 on April 2, 2014 based on the closing price of our common stock on April 2, 2014 of $45.58
(6)
Total shares vested for Mr. Wilson consisted of:
- 6,250 on May 6, 2014 based on the closing price of our common stock on May 6, 2014 of $44.41
Pension Benefits for 2014
We have no pension benefits for our NEOs.
Non-Qualified Deferred Compensation for 2014
The following table sets forth information regarding our NEOs’ deferred compensation arrangements that are not tax qualified.
|
Name
|
Executive Contributions in Last FY ($)
|
Registrant Contributions in Last FY ($)
(1)
|
Aggregate Earnings in Last FY
|
Aggregate Withdrawals / Distributions ($)
(2)
|
Aggregate Balance at Last FYE ($)
(3)
|
|
|
Albert A. Benchimol
|
—
|
—
|
—
|
—
|
—
|
|
|
Christopher N. DiSipio
|
$156,380
|
$24,000
|
$41,232
|
—
|
$606,100
|
|
|
John W. Gressier
(2)
|
—
|
—
|
—
|
$1,043
|
—
|
|
|
Joseph C. Henry
|
—
|
—
|
—
|
—
|
—
|
|
|
John D. Nichols
|
—
|
—
|
—
|
—
|
—
|
|
|
Peter W. Wilson
|
—
|
$52,635
|
$2,079
|
—
|
$24,706
|
|
(1)
These amounts include contributions and/or balances in the U.S. Supplemental Plan for Mr. DiSipio and Mr. Wilson. Employer contributions for the 2014 plan year were made in January 2015. Messrs. Benchimol, Henry and Nichols have never been eligible to participate in the U.S. Supplemental Plan due to IRS regulation 457A.
207
|
(2)
|
Mr. Gressier received a final distribution from the International Pension Plan in January 2014 in connection with his relocation to the United Kingdom in December 2013.
|
|
(3)
|
Includes the following amount that has been reported in the “All Other Compensation” column of the Summary of Compensation Table for 2014 and previous years.
|
|
Name
|
2014
|
Previous Years
|
|
Albert A. Benchimol
|
—
|
—
|
|
Christopher N. DiSipio
|
—
|
—
|
|
John W. Gressier
|
—
|
$619,082
|
|
Joseph C. Henry
|
—
|
—
|
|
John D. Nichols
|
—
|
—
|
|
Peter W. Wilson
|
—
|
—
|
Each NEO’s own contributions under the U.S. Supplemental Plan are always fully vested. Our contributions vest based on the participant’s years of service at a rate of 25% per year, with full vesting after four years of service is completed. The NEO’s own contributions may be distributed upon separation of employment or upon the earlier of separation of employment or a specified date in either a lump sum or over a period of annual installments between two and 10 years. Benefits will be paid immediately in a lump sum in the event of the executive’s death.
Internationally, we maintain the International Pension Plan and the London Stakeholder Pension Plan. Mr. Gressier participated in the International Pension Plan and the London Stakeholder Pension Plan during 2014. These plans are discussed in more detail in the narrative following “Summary Compensation Table” and “Grants of Plan-Based Awards in 2014 Table” above.
Potential Payments Upon Termination or Change in Control
This section describes payments that would be made to our NEOs upon a change in control of AXIS or following termination of employment or upon the NEO’s death or disability. In the first part of this section, we describe benefits under general plans that apply to any NEO participating in those plans. We then describe specific benefits to which each NEO is entitled, along with estimated amounts of benefits assuming a triggering event on December 31, 2014.
2007 Long-Term Equity Compensation Plan.
Under the 2007 LTEP, as described above, upon the occurrence of a change in control, unless otherwise provided in the applicable award agreement or other agreement and unless provision is made in connection with the change of control for the assumption of awards previously granted or substitution for such awards of new awards covering stock of a successor corporation, executive officers receive the following benefits:
|
•
|
Options and stock appreciation rights become immediately exercisable, and remain exercisable throughout their entire term, unless exercised, cashed out, or replaced
|
|
•
|
Performance units are paid out as if the date of the change in control were the last day of the applicable performance period and “target performance levels” had been attained
|
|
•
|
All other outstanding awards will automatically be deemed exercisable and vested and all restrictions and forfeiture provisions related to the awards will lapse
|
However, our current award agreements contain a “double trigger” vesting provision under which awards will automatically vest upon a change of control of the Company only upon an awardee’s subsequent termination of employment: (a) by the Company without cause; or (b) by the awardee with good reason, in each case within 24 months of the change of control.
In addition to the benefits described above for all executive officers, our NEOs, collectively referred to as “Executives” for purposes of this summary, are entitled to additional benefits under their respective employment agreements upon termination of their employment.
In particular, the Executives’ employment will automatically terminate upon death, and we may terminate the Executives’ employment as a result of their disability if they are unable to work for 181 days in any 12-month period due to illness or injury. We may terminate the Executives’ employment without cause upon 30 days’ notice, except that we may only terminate Mr. Benchimol’s employment without cause upon 12-months’ notice. The Executives may terminate their employment upon at least 12-months’ notice to us, except for Mr. DiSipio whose notice period to us is six months. In
208
addition, the Executives’ employment may be terminated as a result of either party declining to extend the term of their respective employment agreement.
Under each of the Executives’ employment agreements, we may terminate the Executives’ employment for cause upon the Executives’:
|
(i)
|
material breach of the terms of their employment;
|
|
(ii)
|
conviction for a felony or commission of any act which would rise to the level of a felony;
|
|
(iii)
|
commission of a lesser crime or offense that materially harms or could harm our business or reputation;
|
|
(iv)
|
willful violation of our specific directives;
|
|
(v)
|
commission of a dishonest or wrongful act involving fraud, misrepresentation or moral turpitude causing us damage or potential damage;
|
|
(vi)
|
willful failure to perform a substantial part of their duties; or
|
|
(vii)
|
breach of fiduciary duty.
|
Under each of the Executives’ employment agreements, except for Mr. DiSipio, in the event the Executive is terminated for cause, the Executives are given 15 days to cure the event that is the basis for the Company’s termination for cause, except that the right to cure will not apply in the event of a termination for cause due to any of the acts described in (ii), (iii) or (v) above.
Under the employment agreements, the Executives may terminate their employment for good reason if: (i) (a) the scope of their respective position, authority or duties is materially adversely changed, (b) their compensation is not paid or their base salary or target bonus is reduced below the levels specified in the agreement or there is a material adverse change in their employee benefits, (c) they are required to relocate away from their current primary place of employment, (d) they are assigned duties that are materially inconsistent with their position with the Company, (e) their immediate reporting relationships are changed or, in the case of Mr. Benchimol, he is required to report to any person or entity other than the Board, (f) with respect to Mr. Benchimol, the Company fails to offer him continuing employment on terms no less favorable than set forth in his agreement at least six months before the end of his employment term; (ii) with respect to Mr. DiSipio, he gives the Company written notice of his intent to terminate his employment as a result of such event within 30 days of such event occurring; and with respect to Messrs. Henry, Nichols and Wilson, they give the Company written notice of their intent to terminate their employment as a result of such event within 60 days of such event occurring; (iii) with respect to Mr. DiSipio, the Company does not make the necessary corrections within 30 days of receipt of such written notice; and with respect to Messrs. Henry, Nichols and Wilson, the Company does not make the necessary corrections within 60 days of receipt of such written notice; and (iv) with respect to Messrs. DiSipio, Henry, Nichols and Wilson, they terminate their employment no later than 10 days following the end of their respective notice period.
In the event the Executives’ employment is terminated for any reason, they are entitled to receive payment for any accrued but unpaid base salary up to the date of termination, any bonus awarded in respect of a prior year’s target annual bonus but not yet paid as of the date of termination, any accrued but unpaid reimbursable expenses, any unused vacation accrued to the date of termination, any unpaid housing allowance, if applicable, accrued to the date of termination and reimbursement for reasonable relocation costs incurred within six months of termination.
In the event that the Executives’ employment is terminated due to death or disability, then their beneficiaries or they will be paid a pro-rata portion of the annual bonus that they would have been entitled to receive for the calendar year in which their termination occurred, except for Mr. Benchimol, whose beneficiary or he will be paid a cash lump sum amount equal to one year’s base salary and annual bonus that he would have been entitled to receive for the calendar year in which his termination occurred. Additionally, any and all outstanding and unvested restricted shares of the Company’s common stock or restricted stock units held by the Executives pursuant to our 2007 LTEP shall immediately vest.
In the event that the Executives’ employment is terminated by the Company without cause or by them with good reason, they will be entitled to: (i) a lump sum amount equal to one year’s base salary, except for Mr. Benchimol who will be entitled to a
209
lump sum amount equal to two year’s base salary; (ii) an amount equal to the annual bonus that they would have been entitled to receive for the calendar year in which their termination occurs, except for Mr. Benchimol who will be entitled to an amount equal to two times the higher of (a) the highest annual bonus earned for any of the three calendar years preceding the date of termination, or (b) the annual bonus that he would have been entitled to receive for the calendar year in which his termination occurs; (iii) a pro-rata portion of the annual bonus that they would have been entitled to receive for the calendar year in which their termination occurs; (iv) continued payment by the Company of medical coverage or COBRA premiums for a 12-month period, or less in the event they cease to be eligible for COBRA continuation coverage; and (v) all outstanding and unvested restricted shares of the Company’s common stock and RSUs and PSUs held by them pursuant to the 2007 LTEP shall continue to vest on the applicable dates set forth in the applicable award agreements.
In the event that the Executives’ employment is terminated by the Company without cause or by them, in each case within 24 months following a change in control, they will be entitled to: (i) a lump sum amount equal to one year’s base salary, except for Mr. Benchimol who will be entitled to a lump sum amount equal to two year’s base salary; (ii) an amount equal to two times the annual bonus that they would have been entitled to receive for the calendar year in which their termination occurs, except for Mr. Benchimol who will be entitled to an amount equal to three times the higher of (a) the highest annual bonus earned for any of the three calendar years preceding the date of termination, or (b) the annual bonus that he would have been entitled to receive for the calendar year in which his termination occurs; (iii) a pro-rata portion of the annual bonus that they would have been entitled to receive for the calendar year in which their termination occurs; (iv) continued payment by the Company of medical coverage or COBRA premiums for a 12-month period, or less in the event that they cease to be eligible for COBRA continuation coverage; and (v) all outstanding and unvested restricted shares of the Company’s common stock and RSUs and PSUs held by them pursuant to the 2007 LTEP shall immediately vest upon the termination.
In the event that the employment agreements for Messrs. Henry, Nichols and Wilson are not renewed by the Company at the end of their respective terms of employment and on at least as favorable terms and conditions, Messrs. Henry, Nichols and Wilson will be entitled to those benefits payable under a termination of employment by the Company without cause as described above.
Under the employment agreements, the Executives are required to execute a general release and waiver of claims against us and to resign from their positions upon termination of their employment for any reason. The Executives are subject to non-competition and non-solicitation (of our employees and customers) provisions for a period of 12 months after termination for any reason, except for: (i) Mr. DiSipio who is subject to a non-competition provision for a period of six months from the date of his voluntary termination or the Company’s termination of his employment for cause and a non-solicitation provision for a period of 12 months from the date of termination for any reason; and (ii) Mr. Benchimol who is subject to non-competition and non-solicitation (of our employees and customers) provisions for a period of 24 months after termination of employment. Additionally, the Executives are subject to ongoing confidentiality requirements.
210
The following table sets forth the termination and/or change in control benefits payable to each NEO, except for Mr. Gressier who provided notice to the Company of his voluntary resignation effective June 30, 2015, under the benefits applicable to all executive officers as well as under each NEO’s applicable employment agreement, assuming termination of employment on December 31, 2014. With the exception of insured benefits, all termination payments will be made by us.
|
Name
|
Death or
Disability
|
Executive
Termination for
Good Reason or
Company
Termination
Without Cause
(pre-Change in
Control)
|
Executive
Termination for
Good Reason or
Company
Termination
Without Cause in
Connection with
Change in Control
(1)
|
|
|
Albert A. Benchimol
|
|
|
|
|
|
Base Pay ($)
|
1,100,000
|
|
2,200,000
|
2,200,000
|
|
Separation Bonus ($)
|
1,925,000
|
|
6,545,000
|
8,855,000
|
|
Value of Equity Awards
(2)
($)
|
19,648,397
|
|
19,648,397
|
19,648,397
|
|
Benefits and Perquisites: Medical, Dental, Vision
(3)
($)
|
—
|
|
21,003
|
21,003
|
|
Total ($)
|
22,673,397
|
|
28,414,400
|
30,724,400
|
|
Christopher N. DiSipio
|
||||
|
Base Pay ($)
|
—
|
|
500,000
|
500,000
|
|
Separation Bonus ($)
|
400,000
|
|
800,000
|
1,200,000
|
|
Value of Equity Awards
(2)
($)
|
2,508,000
|
|
2,508,000
|
2,508,000
|
|
Benefits and Perquisites: Medical ($)
(3)
|
—
|
|
14,557
|
14,557
|
|
Total ($)
|
2,908,000
|
|
3,822,557
|
4,222,557
|
|
Joseph C. Henry
|
|
|
|
|
|
Base Pay ($)
|
—
|
|
565,000
|
565,000
|
|
Separation Bonus ($)
|
565,000
|
|
1,130,000
|
1,695,000
|
|
Value of Equity Awards
(2)
($)
|
2,915,604
|
|
2,915,604
|
2,915,604
|
|
Benefits and Perquisites: Medical, Dental, Vision
(3)
($)
|
—
|
|
14,578
|
14,578
|
|
Total ($)
|
3,480,604
|
|
4,625,182
|
5,190,182
|
|
John D. Nichols
|
|
|
|
|
|
Base Pay ($)
|
—
|
|
900,000
|
900,000
|
|
Separation Bonus ($)
|
1,125,000
|
|
2,250,000
|
3,375,000
|
|
Value of Equity Awards
(2)
($)
|
4,423,372
|
|
4,423,372
|
4,423,372
|
|
Benefits and Perquisites: Medical, Dental, Vision
(3)
($)
|
—
|
|
21,003
|
21,003
|
|
Total ($)
|
5,548,372
|
|
7,594,375
|
8,719,375
|
|
Peter W. Wilson
|
|
|
|
|
|
Base Pay ($)
|
—
|
|
800,000
|
800,000
|
|
Separation Bonus ($)
|
1,000,000
|
|
2,000,000
|
3,000,000
|
|
Value of Equity Awards
(2)
($)
|
2,292,409
|
|
2,292,409
|
2,292,409
|
|
Benefits and Perquisites: Medical, Dental, Vision ($)
(3)
|
—
|
|
14,578
|
14,578
|
|
Total ($)
|
3,292,409
|
|
5,106,987
|
6,106,987
|
|
(1)
|
Under the 2007 LTEP and each of our NEO’s employment agreements, a “change in control” occurs if: (i) a person, company, government, or political subdivision, agency, or instrumentality of a government becomes the beneficial owner of 50% or more of the combined voting power of our outstanding voting securities, except for: (a) any acquisition directly from us, (b) any acquisition by us, (c) any acquisition by one of our employee benefit plans, or (d) any acquisition that complies with clauses (a), (b) and (c) of paragraph (iii) below; (ii) our Board is no longer composed of a majority of individuals who were either members as of the date the 2003 LTEP was adopted, or whose election or nomination for election was approved by a majority of the directors then comprising the incumbent Board; (iii) a merger, sale of substantially all of the assets or other similar transaction occurs between us and another person, company, government, or political subdivision, agency, or instrumentality of a government, unless, following the transaction, (a) substantially all of the beneficial owners of our voting securities immediately before the transaction beneficially own more than 50% of the combined voting power of the successor entity, in substantially the same proportions as their ownership of our voting securities immediately prior to the transaction; (b) no person, company, government, or political subdivision, agency, or instrumentality of a government (excluding the successor entity) beneficially owns 50% or more of the outstanding shares of our common stock or the combined voting power of the successor entity, or owns all or
|
211
substantially all of our assets, except to the extent that such ownership existed with respect to us before the transaction; and (c) at least a majority of the members of the board of directors of the successor entity or person that owns all or substantially all of our assets as a result of the transaction were members of our incumbent Board at the time of the execution of the initial agreement, or of the action of the Board, pursuant to which the merger or other transaction occurs; or (iv) our shareholders approve a complete liquidation or dissolution of AXIS Capital Holdings Limited, or the sale or other disposition of all or substantially all of our assets.
|
(2)
|
Indicates value of unvested equity awards for which vesting accelerates upon termination for death or disability and for which vesting continues in accordance with the vesting terms set forth in the applicable award agreements in the case of Company termination without cause or termination by each NEO for good reason. In the case of each NEO’s termination without cause by the Company or for good reason by the NEO after a change in control, unvested equity awards, including those subject to performance conditions, immediately vest. Aggregate value of unvested equity awards calculated at a price of $51.09, the closing price of our common stock on December 31, 2014.
|
|
(3)
|
Value of continued coverage under medical, dental, vision assumes the Company is paying full cost of COBRA premiums for one year.
|
2014 Director Compensation
Non-Management Directors
The table below sets forth information regarding compensation earned by our non-management directors in 2014.
|
Name
|
Fees Earned or Paid in Cash
($)
(1)
|
All Other Compensation ($)
|
Total ($)
|
|
|
Geoffrey Bell
|
$219,500
|
—
|
$219,500
|
|
|
Jane Boisseau
|
$218,000
|
—
|
$218,000
|
|
|
Michael A. Butt
|
$402,000
(2)
|
$950,000
(3)
|
$1,352,000
|
|
|
Charles A. Davis
|
$216,000
|
—
|
$216,000
|
|
|
Robert L. Friedman
|
$215,000
|
—
|
$215,000
|
|
|
Christopher V. Greetham
|
$276,000
(2)
|
—
|
$276,000
|
|
|
Maurice A. Keane
|
$277,500
(2)
|
—
|
$277,500
|
|
|
Sir Andrew Large
|
$225,500
|
—
|
$225,500
|
|
|
Cheryl-Ann Lister
|
$213,500
|
—
|
$213,500
|
|
|
Thomas C. Ramey
|
$251,000
|
—
|
$251,000
|
|
|
Henry B. Smith
|
$311,500
(2)
|
—
|
$311,500
|
|
|
Alice Young
|
$215,000
|
—
|
$215,000
|
|
|
Wilhelm Zeller
|
$213,500
|
—
|
$213,500
|
|
|
(1)
|
Under the terms of the 2014 Directors Annual Compensation Program, all or half of the annual cash retainer and all of the committee meeting fees can be distributed to the Directors in common shares in lieu of cash, pursuant to individual elections. For 2014, the following directors elected to have 50% of their annual retainer delivered in common shares resulting in the following common share payments: Mr. Bell (2,177), Ms. Boisseau (2,177), Mr. Greetham (2,177), Mr. Keane (2,177), Ms. Lister (2,177), Mr. Smith (2,177), Ms. Young (2,177), and Mr. Zeller (2,177). Mr. Friedman received 4,714 common shares, based on his election to have 100% of his annual retainer, and $16,500 related to 2013 meeting fees, delivered in common shares. All common share amounts are derived using the fair market value of our common stock on the tenth business day in January of the applicable year, pursuant to our 2014 Directors Annual Compensation Program.
|
|
(2)
|
Cash payment to Messrs. Butt, Greetham, Keane, and Smith includes $52,000 for serving on the Boards of our Irish subsidiaries, AXIS Re SE and AXIS Specialty Europe SE, during 2014.
|
|
(3)
|
Mr. Butt received $950,000 in consulting fee payments pursuant to the terms of a consulting agreement by and between Mr. Butt and the Company dated May 3, 2012, as amended December 5, 2013 and December 5, 2014.
|
2014 Directors Annual Compensation Program
Compensation for our directors generally consists of cash compensation in the form of annual retainer and meeting fees. Directors may elect to receive common shares of the Company in lieu of all or 50% of the annual retainer and all committee fees payable to them by notifying the Company of their election prior to January 1 of the year for which the election will be effective. The number of common shares issued to participants is based on the closing fair market value of the Company’s shares on the tenth trading day in January.
Directors who also are employees do not receive compensation for their service as directors. Pursuant to the 2014 Directors Annual Compensation Program, our non-management directors received an annual retainer of $200,000 for service on the Board. Our non-management Chairman of the Board receives an additional retainer of $150,000, pro-rated based on months of services as Chairman in the applicable year. The Chairman of the Audit Committee receives an annual fee of $30,000, the Chairman of the Risk Committee receives an annual fee of $15,000, the Chairman of each of the Finance Committee and
212
Compensation Committee receives an annual fee of $10,000, the Chairman of the Corporate Governance and Nominating Committee receives an annual fee of $7,500 and the Lead Independent Director receives an annual fee of $15,000. Non-management directors also receive $1,500 for each committee meeting attended. Non-management directors who become directors after January 1 of any year are entitled to a pro-rated portion of the annual director compensation based on months of service in that year.
In addition to compensation received for service on our Board, directors who serve on the Boards of our Irish subsidiaries, AXIS Re SE and AXIS Specialty Europe SE, received an annual retainer in the amount of $40,000 for service as director plus $3,000 for each meeting attended.
Director Compensation for 2015.
In September 2014, our Board, based on the recommendations of our Compensation Committee, approved the 2015 Director’s Annual Compensation Program with no changes from the 2014 program.
Compensation Committee Interlocks and Insider Participation
During the year ended December 31, 2014, none of our executive officers served as a member of the compensation committee or as a director of another entity, one of whose executive officers served on our Compensation Committee or as one of our directors.
|
ITEM 12.
|
SECURITY OWNERSHIP OF CERTAIN BENEFICIAL OWNERS AND MANAGEMENT AND RELATED STOCKHOLDER MATTERS
|
Equity Compensation Plan Information
The following table presents information concerning our equity compensation plans as of December 31, 2014.
|
Plan Category
|
Number of
Securities to be
Issued Upon
Exercise of
Outstanding
Options,
Warrants and
Rights
(1)
|
Weighted-
Average
Exercise Price
Outstanding
Options,
Warrants and
Rights
(2)
|
Number of
Securities
Remaining
Available for
Future Issuance
under Equity
Compensation
Plans (Excluding
Securities
Reflected in the
First Column)
(3)
|
|
Equity compensation plans approved by security holders
|
1,863,953
|
$28.02
|
5,868,286
|
|
Equity compensation plans not approved by security holders
|
—
|
—
|
—
|
|
Total
|
1,863,953
|
$28.02
|
5,868,286
|
|
(1)
|
Includes: (i) 20,000 stock options granted under our 2003 LTEP and the AXIS Capital Holdings Limited 2003 Directors Long-Term Equity Compensation Plan; (ii) 13,174 phantom stock units granted under the AXIS Capital Holdings Limited 2003 Directors Long-Term Equity Compensation Plan and 13,246 phantom stock units granted under our 2007 LTEP; and (iii) 1,720,577 restricted stock units and 96,956 performance units granted under our 2007 LTEP. This balance does not include 1,343,147 outstanding restricted shares, 1,451,539 cash-settled restricted stock units or 51,841 cash-settled performance units.
|
|
(2)
|
Represents the weighted-average exercise price of the 20,000 outstanding options. The weighted-average remaining term of all outstanding options is 12 days (or 0.03 years).
|
|
(3)
|
Includes common shares available for issuance under our 2007 LTEP pursuant to awards of stock options, stock appreciation rights, restricted stock awards, restricted stock unit awards, performance unit awards and other equity-based or equity-related awards.
|
213
Principal Shareholders
The following table sets forth information as of February 13, 2015 regarding beneficial ownership of our common shares by each of the following, in each case based on information provided by these individuals:
|
•
|
Each person or group known to us to be the beneficial owner of more than 5% of our common shares
|
|
•
|
Each of our directors
|
|
•
|
Each of our Named Executive Officers
|
|
•
|
All of our directors and executive officers as a group
|
|
Directors and Executive Officers
|
Number of
Common
Shares
(1)
|
Percent of
Outstanding
Common
Shares
(1)
|
|
Geoffrey Bell
|
13,454
|
*
|
|
Albert A. Benchimol
|
515,006
|
*
|
|
Jane Boisseau
|
6,971
|
*
|
|
Michael A. Butt
|
1,215,956
|
1.2%
|
|
Charles A. Davis
|
—
|
*
|
|
Robert L. Friedman
|
47,183
|
*
|
|
Christopher V. Greetham
|
24,949
|
*
|
|
Maurice A. Keane
|
95,880
|
*
|
|
Sir Andrew Large
|
9,711
|
*
|
|
Cheryl-Ann Lister
|
23,716
|
*
|
|
Thomas C. Ramey
|
12,276
|
*
|
|
Henry B. Smith
|
38,309
|
*
|
|
Alice Young
|
2,177
|
*
|
|
Wilhelm Zeller
|
12,527
|
*
|
|
Christopher N. DiSipio
|
59,462
|
*
|
|
John W. Gressier
|
242,816
|
*
|
|
Joseph C. Henry
|
17,905
|
*
|
|
John D. Nichols
|
73,481
|
*
|
|
Peter W. Wilson
|
9,673
|
*
|
|
All directors and executive officers as a group (19 persons)
|
2,421,452
|
2.4%
|
|
Other Shareholders
|
|
|
|
FMR LLC and related entities
(2)
|
9,777,217
|
9.56%
|
|
Pzena Investment Management, LLC
(3)
|
7,078,975
|
6.93%
|
|
The Vanguard Group
(4)
|
7,742,888
|
7.57%
|
|
BlackRock, Inc.
(5)
|
5,205,588
|
5.1%
|
*Less than 1%
|
(1)
|
Unless otherwise indicated, the number of common shares beneficially owned and percentage ownership are based on 100,784,936 common shares outstanding as of January 19, 2015 adjusted as required by rules promulgated by the SEC. Beneficial ownership is determined in accordance with the rules of the SEC and includes sole or shared voting or investment power with respect to such shares. Except as indicated in the footnotes to the table, based on information provided by the persons named in the table, such persons have sole voting and investment power with respect to all common shares shown as beneficially owned by them. Our bye-laws reduce the total voting power of any shareholder owning 9.5% or more of our common shares to less than 9.5% of the voting power of our capital stock, but only in the event that a U.S. Shareholder, as defined in our bye-laws, owning 9.5% or more of our common shares is first determined to exist.
|
|
(2)
|
The number of common shares beneficially owned and the information set forth below is based solely on information contained in Amendment No. 11 to the Schedule 13G/A filed on February 13, 2015 by FMR LLC, 245 Summer Street, Boston Massachusetts, 02210, and includes common shares beneficially owned as of December 31, 2014. FMR LLC has sole voting power over 528,665 common shares and sole dispositive power over 9,777,217 common shares; Edward C. Johnson 3d is a Director and the Chairman of FMR LLC and has sole dispositive power over 9,777,217 common shares; Abigail P. Johnson is a Director, the Vice Chairman, the Chief Executive Officer and the President of FMR LLC and has sole dispositive power over 9,777,217 common shares; Fidelity Low-Priced Stock Fund has sole voting power over 7,484,300 common shares. Neither FMR LLC nor Edward C. Johnson 3d nor Abigail P. Johnson has the sole power to vote or direct the voting of the shares owned directly by the various investment companies registered under the Investment Company Act (“Fidelity Funds”) advised by Fidelity Management & Research Company, a wholly owned subsidiary of FMR LLC, which power resides with the Fidelity Funds’ Boards of Trustees. Fidelity Management & Research Company carries out the voting of the shares under written guidelines established by the Fidelity Funds’ Boards of Trustees.
|
214
|
(3)
|
The number of common shares beneficially owned and the information set forth below is based solely on information contained in Schedule 13G filed on January 29, 2015 by Pzena Investment Management, LLC (“Pzena”),120 West 45
th
Street, 20
th
Floor, New York, NY 10036, and includes common shares beneficially owned as of December 31, 2014. Pzena has sole voting power over 3,862,876 common shares and sole dispositive power over 7,078,975 common shares.
|
|
(4)
|
The number of common shares beneficially owned and the information set forth below is based solely on information contained in Schedule 13G filed on February 10, 2015 by The Vanguard Group (“Vanguard”), 100 Vanguard Blvd., Malvern, PA 19355, and includes common shares beneficially owned as of December 31, 2014. Vanguard has sole voting power over 100,257 common shares and sole dispositive power over 7,658,702 common shares.
|
|
(5)
|
The number of common shares beneficially owned and the information set forth below is based solely on information contained in Schedule 13G filed on February 3, 2015 by BlackRock, Inc. (“BlackRock”), 55 East 52
nd
Street, New York, NY 10022, and includes common shares beneficially owned as of December 31, 2014. BlackRock has sole voting power over 4,429,021 common shares and sole dispositive power over 5,205,588 common shares.
|
|
ITEM 13.
|
CERTAIN RELATIONSHIPS AND RELATED TRANSACTIONS, AND DIRECTOR INDEPENDENCE
|
Policies and Procedures for Transactions with Related Persons
We analyze all transactions in which AXIS participates and in which a related person may have a direct or indirect material interest, both due to the potential for a conflict of interest and to determine whether disclosure of the transaction is required under applicable SEC rules and regulations. Related persons include any of our directors, director nominees or executive officers, certain of our shareholders and their respective immediate family members. A conflict of interest occurs when an individual’s private interest interferes, or appears to interfere, in any way with our interests. Our Code of Business Conduct requires all directors, officers and employees who may have a potential or apparent conflict of interest to fully disclose all the relevant facts promptly to our General Counsel.
In addition to the reporting requirements under the Code of Business Conduct, to identify related person transactions, each year we submit and require our directors and executive officers to complete Director and Officer Questionnaires identifying any transactions with us in which the officer or director or their family members have an interest. Any potential related person transactions are reviewed by our Corporate Governance and Nominating Committee, which pursuant to its charter is responsible for reviewing and approving any proposed transaction with any related person.
Certain Relationships and Related Transactions
Our Chairman, Mr. Butt, received $950,000 in consulting fee payments in 2014 pursuant to the terms of a consulting agreement by and between Mr. Butt and the Company dated May 3, 2012, as amended December 5, 2013 and December 5, 2014.
Mr. Davis is the Chief Executive Officer of Stone Point. We have contracted with StoneRiver RegEd Inc., an affiliate of Stone Point, for broker and adjuster licensing, appointment and compliance services. In 2014, we paid $408,852 to StoneRiver RegEd Inc. for these services. We also have funds invested in an account managed by SKY Harbor Capital Management, LLC, an affiliate of Stone Point. In 2014, we paid SKY Harbor $3,106,525 in management fees for their services. Additionally, we currently have $30 million committed to the NXT Capital Senior Loan Fund II. The manager of NXT Capital Senior Loan Fund II is an indirect subsidiary of NXT Capital Holdings, L.P. ("NXT Capital"). Stone Point, through an affiliated fund, owns approximately 45% of NXT Capital. During 2014, fees paid to NXT Capital totaled $228,880.
We provide insurance in the ordinary course of business to various entities that are affiliated with some of our directors and/or principal shareholders. These transactions are negotiated on an arm’s-length basis.
Director Independence
Please refer to Item 10 - “Directors, Executive Officers and Corporate Governance” for information on director independence.
215
|
ITEM 14.
|
PRINCIPAL ACCOUNTING FEES AND SERVICES
|
Aggregate fees for professional services rendered for us by Deloitte Ltd. for the fiscal years ended December 31, 2014 and 2013 are set forth below.
|
|
Fiscal Year 2014
|
|
Fiscal Year 2013
|
|
|
Audit Fees
(1)
|
$4,595,368
|
|
$4,206,921
|
|
|
Audit-Related Fees
(2)
|
75,994
|
|
148,425
|
|
|
Tax Fees
(3)
|
23,633
|
|
423,977
|
|
|
All Other Fees
(4)
|
—
|
|
—
|
|
|
Total
|
$4,694,995
|
|
$4,779,323
|
|
|
(1)
|
Audit Fees for the years ended December 31, 2014 and 2013 were for professional services rendered for the audit of our annual financial statements, for the review of the financial statements included in our quarterly reports on Form 10-Q, for services in connection with the audits for insurance statutory and regulatory purposes in the various jurisdictions in which we operate and for the provision of opinions and consents relating to our filings with the Securities and Exchange Commission.
|
|
(2)
|
Audit-Related Fees for the years ended December 31, 2014, and December 31, 2013, related to the provision of comfort letters in relation to a debt offering, the repurchase of common shares formerly held by Stone Point Capital LLC and its affiliates and an issuance of preferred securities. The amounts also included fees related to an actuarial external peer review and preparation of an annual regulatory certificate in Australia and New York and the audit of employees’ pension plans.
|
|
(3)
|
Tax fees for the year ended December 31, 2014 included $13,782 for tax consulting services and $9,851 for tax compliance services.
|
|
(4)
|
There were no fees in the All Other Fees category for the fiscal years ended December 31, 2014 or 2013.
|
Pre-Approval Policy
In September 2003, our Board adopted a policy regarding the procurement of audit services and non-audit services. The primary purpose of the policy is to ensure that we engage public accountants as external auditors to provide only audit and non-audit services that are compatible with maintaining independence. The policy requires that the Audit Committee pre-approve all audit and non-audit services for which our auditors are engaged. The Audit Committee may delegate the authority to grant pre-approvals to the Chairman of the Audit Committee or, in the event of his non-availability, to any other Audit Committee member. The Chairman of the Audit Committee or such other Audit Committee member must present to the Audit Committee at each scheduled meeting any pre-approvals that are granted. For the years ended December 31, 2014 and 2013, 100% of the audit fees, the audit-related fees and the tax fees were pre-approved.
216
|
ITEM 15.
|
EXHIBITS AND FINANCIAL STATEMENT SCHEDULES
|
|
(a)
|
Financial Statements, Financial Statement Schedules and Exhibits
|
|
1.
|
Financial Statements
|
Included in Part II – see Item 8 of this report.
|
2.
|
Financial Statement Schedules
|
Report of Independent Registered Public Accounting Firm
|
Schedule II
|
– Condensed Financial Information of Registrant
|
|
Schedule III
|
– Supplementary Insurance Information
|
|
Schedule IV
|
– Supplementary Reinsurance Information
|
Schedules I, V and VI have been omitted as the information is provided in Item 8, Consolidated Financial Statements, or in the above schedules.
|
3.
|
Exhibits
|
|
Exhibit
Number
|
Description of Document
|
|
|
2.1
|
Agreement and Plan of Amalgamation, dated as of January 25, 2015, by and among PartnerRe Ltd. and AXIS Capital Holdings Limited (incorporated by reference to Exhibit 2.1 to the Company's Current Report on Form 8-K filed on January 29, 2015).
|
|
|
3.1
|
Certificate of Incorporation and Memorandum of Association of AXIS Capital Holdings Limited (incorporated by reference to Exhibit 3.1 to the Company's Registration Statement on Form S-1 (Amendment No. 1) (No. 333-103620) filed on April 16, 2003).
|
|
|
3.2
|
Amended and Restated Bye-laws of AXIS Capital Holdings Limited (incorporated by reference to Exhibit 4.2 to the Company's Registration Statement on Form S-8 filed on May 15, 2009).
|
|
|
4.1
|
Specimen Common Share Certificate (incorporated by reference to Exhibit 4.1 to the Company's Registration Statement on Form S-1 (Amendment No. 3) (No. 333-103620) filed on June 10, 2003).
|
|
|
4.2
|
Senior Indenture between AXIS Capital Holdings Limited and The Bank of New York, as trustee, dated as of November 15, 2004 (incorporated by reference to Exhibit 4.1 to the Company's Current Report on Form 8-K filed on November 15, 2004).
|
|
|
4.3
|
First Supplemental Indenture between AXIS Capital Holdings Limited and The Bank of New York, as trustee, dated as of November 15, 2004 (incorporated by reference to Exhibit 4.2 to the Company's Current Report on Form 8-K filed on November 15, 2004).
|
|
|
4.4
|
Senior Indenture among AXIS Specialty Finance LLC, AXIS Capital Holdings Limited and The Bank of New York Mellon Trust Company, N.A., as trustee, dated as of March 23, 2010 (incorporated by reference to Exhibit 4.4 to the Company's Quarterly Report on Form 10-Q filed on April 27, 2010).
|
|
|
4.5
|
Senior Indenture, dated as of March 13, 2014, among AXIS Specialty Finance PLC, as issuer, the Company, as guarantor, and The Bank of New York Mellon Trust Company, N.A., as trustee (incorporated by reference to Exhibit 4.1 to the Company's Current Report on Form 8-K filed on March 13, 2014).
|
|
|
4.6
|
Form of 2.650% Senior Notes due 2019 (incorporated by reference to Exhibit 4.2 to the Company's Current Report on Form 8-K filed on March 13, 2014).
|
|
|
4.7
|
Form of 5.150% Senior Notes due 2045 (incorporated by reference to Exhibit 4.3 to the Company's Current Report on Form 8-K filed on March 13, 2014).
|
|
217
|
4.8
|
Certificate of Designations setting forth the specific rights, preferences, limitations and other terms of the Series A Preferred Shares (incorporated by reference to Exhibit 3.1 to the Company's Current Report on Form 8-K filed on October 4, 2005).
|
|
|
4.9
|
Certificate of Designations setting forth the specific rights, preferences, limitations and other terms of the Series B Preferred Shares (incorporated by reference to Exhibit 3.1 to the Company's Current Report on Form 8-K filed on November 23, 2005).
|
|
|
4.10
|
Certificate of Designations setting from the specific rights, preferences, limitations and other terms of the Series C Preferred Shares (incorporated by reference to Exhibit 3.1 to the Company's Current Report on Form 8-K filed on March 19, 2012).
|
|
|
4.11
|
Certificate of Designations setting from the specific rights, preferences, limitations and other terms of the Series D Preferred Shares (incorporated by reference to Exhibit 3.1 to the Company's Current Report on Form 8-K filed on May 20, 2013).
|
|
|
10.1
|
Amended and Restated Shareholders Agreement dated December 31, 2002, among AXIS Capital Holdings Limited and each of the persons listed on Schedule A thereto (incorporated by reference to Exhibit 10.1 to the Company's Registration Statement on Form S-1 (Amendment No. 3) (No. 333-103620) filed on June 10, 2003).
|
|
|
*10.2
|
Consulting Agreement by and between Michael A. Butt and AXIS Specialty Limited dated May 3, 2012 (incorporated by reference to Exhibit 10.5 to the Company's Current Report on Form 8-K/A filed on May 9, 2012).
|
|
|
*10.3
|
Amendment No. 1 to Consulting Agreement by and between Michael A. Butt and AXIS Specialty Limited dated December 5, 2013 (incorporated by reference to Exhibit 10.4 to the Company's Current Report on Form 8-K filed on December 9, 2013).
|
|
|
*†10.4
|
Amendment No. 2 to Consulting Agreement by and between Michael A. Butt and AXIS Specialty Limited dated December 5, 2014.
|
|
|
*10.5
|
Employment Agreement by and among Albert Benchimol, AXIS Capital Holdings Limited and AXIS Specialty U.S. Services, Inc. dated May 3, 2012 (incorporated by reference to Exhibit 10.1 to the Company's Current Report on Form 8-K/A filed on May 9, 2012).
|
|
|
*10.6
|
Restricted Stock Agreement for Albert Benchimol pursuant to the AXIS Capital Holdings Limited 2007 Long-Term Equity Compensation Plan (incorporated by reference to Exhibit 10.2 to the Company's Current Report on Form 8-K/A filed on May 9, 2012).
|
|
|
*10.7
|
Employment Agreement by and between John Gressier and AXIS Specialty Europe SE dated December 5, 2013 (incorporated by by reference to Exhibit 10.3 to the Company's Current Report on Form 8-K filed on December 9, 2013).
|
|
|
*10.8
|
Separation Agreement entered into by and between John Gressier and AXIS Specialty Europe SE dated August 5, 2014 (incorporated by reference to Exhibit 10.1 to the Company’s Current Report on Form 8-K filed on August 7, 2014).
|
|
|
*10.9
|
Letter Agreement by and between John D. Nichols, Jr. and AXIS Specialty U.S. Services, Inc. dated July 8, 2013 (incorporated by reference to Exhibit 10.1 to the Company's Current Report on Form 8-K filed on July 12, 2013).
|
|
|
*10.10
|
Employment Agreement by and between John D. Nichols, Jr. and AXIS Specialty U.S. Services, Inc. dated January 23, 2015 (incorporated by reference to Exhibit 10.1 to the Company's Current Report on Form 8-K filed on January 29, 2015).
|
|
|
*10.11
|
Employment Agreement by and between Joseph C. Henry and AXIS Specialty U.S. Services, Inc. dated January 23, 2015 (incorporated by reference to Exhibit 10.2 to the Company's Current Report on Form 8-K filed on January 29, 2015).
|
|
|
*†10.12
|
Employment Agreement by and between Peter W. Wilson and AXIS Specialty U.S. Services, Inc. dated June 23, 2014.
|
|
|
*†10.13
|
Employment Agreement by and between Chris DiSipio and AXIS Specialty U.S. Services, Inc. dated February 27, 2014.
|
|
|
*10.14
|
2003 Long-Term Equity Compensation Plan (incorporated by reference to Exhibit 10.12 to the Company's Registration Statement on Form S-1 (Amendment No. 2) (No. 333-103620) filed on May 17, 2003).
|
|
218
|
*10.15
|
2007 Long-Term Equity Compensation Plan, as amended (incorporated by reference to Exhibit 4.4 to the Company's Registration Statement on Form S-8 filed on May 15, 2012).
|
|
|
*10.16
|
Form of Employee Restricted Stock Agreement (incorporated by reference to Exhibit 10.1 to the Company's Current Report on Form 8-K filed on September 28, 2010).
|
|
|
*10.17
|
Form of Employee Restricted Stock Unit Agreement (Performance Vesting) (incorporated by reference to Exhibit 10.23 to the Company's Annual Report on Form 10-K filed on February 21, 2014).
|
|
|
*10.18
|
Form of Employee Restricted Stock Unit Agreement (incorporated by reference to Exhibit 10.24 to the Company's Annual Report on Form 10-K filed on February 21, 2014).
.
|
|
|
*10.19
|
2013 Executive Long-Term Equity Compensation Program (incorporated by by reference to Exhibit 10.1 to the Company's Current Report on Form 8-K filed on December 9, 2013).
|
|
|
*10.20
|
2014 Executive Annual Incentive Plan (incorporated by by reference to Exhibit 10.1 to the Company's Current Report on Form 8-K filed on February 26, 2014).
|
|
|
*10.21
|
2003 Directors Long-Term Equity Compensation Plan (incorporated by reference to Exhibit 4.5 to the Company's Registration Statement on Form S-8 (No. 333-110228) filed on November 4, 2003).
|
|
|
*10.22
|
2003 Directors Deferred Compensation Plan, as amended and restated (incorporated by reference to Exhibit 10.2 to the Company's Quarterly Report on Form 10-Q filed on April 28, 2009).
|
|
|
*10.23
|
2015 Directors Annual Compensation Program (incorporated by reference to Exhibit 10.2 to the Company's Quarterly Report on Form 10-Q filed on October 31, 2014).
|
|
|
*10.24
|
AXIS Specialty U.S. Services, Inc. Supplemental Retirement Plan (incorporated by reference to Exhibit 10.23 to the Company's Annual Report on Form 10-K filed on February 26, 2008).
|
|
|
10.25
|
Master Reimbursement Agreement, dated as of May 14, 2010, by and among AXIS Specialty Limited, AXIS Re Limited, AXIS Specialty Europe Limited, AXIS Insurance Company, AXIS Surplus Insurance Company, AXIS Specialty Insurance Company, AXIS Reinsurance Company and Citibank Europe plc (incorporated by reference to Exhibit 10.1 to the Company's Current Report on Form 8-K filed on May 19, 2010).
|
|
|
10.26
|
Amendment to Master Reimbursement Agreement dated January 27, 2012 by and among AXIS Specialty Limited, AXIS Re Limited, AXIS Specialty Europe Limited, AXIS Insurance Company, AXIS Surplus Insurance Company, AXIS Specialty Insurance Company and AXIS Reinsurance Company and Citibank Europe plc (incorporated by reference to Exhibit 10.1 to the Company's Current Report on Form 8-K filed on January 30, 2012).
|
|
|
10.27
|
Amendment to Committed Facility Letter dated November 20, 2013 by and among AXIS Specialty Limited, AXIS Re SE, AXIS Specialty Europe SE, AXIS Insurance Company, AXIS Surplus Insurance Company and AXIS Reinsurance Company and Citibank Europe plc (incorporated by reference to Exhibit 10.1 to the Company's Current Report on Form 8-K filed on November 21, 2013).
|
|
|
10.28
|
Credit Agreement dated March 26, 2013 by and among AXIS Capital Holdings Limited, certain subsidiaries of AXIS Capital Holdings Limited party thereto, Wells Fargo Bank, National Association, as Administrative Agent, Fronting Bank and L/C Administrator and the other lenders party thereto (incorporated by reference to Exhibit 10.1 to the Company's Current Report on Form 8-K filed on March 29, 2013).
|
|
|
10.29
|
First Amendment to Credit Agreement dated September 18, 2013 by and among AXIS Capital Holdings Limited, certain subsidiaries of AXIS Capital Holdings Limited party thereto, Wells Fargo Bank, National Association, as Administrative Agent, Fronting Bank and L/C Administrator and the other lenders party thereto (incorporated by reference to Exhibit 10.1 to the Company's Current Report on Form 8-K filed on September 24, 2013).
|
|
|
10.30
|
Letter of Credit Facility dated November 6, 2013 by and between AXIS Specialty Limited and ING Bank N.V., London Branch (incorporated by reference to Exhibit 10.1 to the Company's Current Report on Form 8-K filed on November 8, 2013).
|
|
219
|
10.31
|
Guaranty dated February 10, 2014 by AXIS Specialty Finance PLC in favor of the Lenders, the Administrative Agent, the Fronting Banks and the L/C Administrator under the Credit Agreement dated March 26, 2013, as amended, by and among AXIS Capital Holdings Limited, certain subsidiaries of AXIS Capital Holdings Limited party thereto, Wells Fargo Bank, National Association, as Administrative Agent, Fronting Bank and L/C Administrator and the other lenders party thereto (incorporated by reference to Exhibit 10.1 to the Company’s Current Report on Form 8-K filed on February 11, 2014).
|
|
|
†12.1
|
Computation of Ratio of Earnings to Fixed Charges and Preferred Dividends.
|
|
|
†21.1
|
Subsidiaries of the registrant.
|
|
|
†23.1
|
Consent of Deloitte Ltd.
|
|
|
†24.1
|
Power of Attorney (included as part of signature pages hereto).
|
|
|
†31.1
|
Certification of Chief Executive Officer pursuant to Section 302 of the Sarbanes-Oxley Act of 2002.
|
|
|
†31.2
|
Certification of Chief Financial Officer pursuant to Section 302 of the Sarbanes-Oxley Act of 2002.
|
|
|
†32.1
|
Certification of Chief Executive Officer pursuant to Section 906 of the Sarbanes-Oxley Act of 2002.
|
|
|
†32.2
|
Certification of Chief Financial Officer pursuant to Section 906 of the Sarbanes-Oxley Act of 2002.
|
|
|
†101
|
The following financial information from AXIS Capital Holdings Limited’s Annual Report on Form 10-K for the year ended December 31, 2014 formatted in XBRL: (i) Consolidated Balance Sheets at December 31, 2014 and 2013; (ii) Consolidated Statements of Operations for the years ended December 31, 2014, 2013 and 2012; (iii) Consolidated Statements of Comprehensive Income for the years ended December 31, 2014, 2013 and 2012; (iv) Consolidated Statements of Changes in Shareholders' Equity for the years ended December 31, 2014, 2013 and 2012; (v) Consolidated Statements of Cash Flows for the years ended December 31, 2014, 2013 and 2012; and (vi) Notes to Consolidated Financial Statements, tagged as blocks of text and in detail.
|
|
|
*
|
Exhibits 10.2 through 10.24 represent a management contract, compensatory plan or arrangement in which directors and/or executive officers are eligible to participate.
|
|
†
|
Filed herewith.
|
The agreements and other documents filed as exhibits to this report are not intended to provide factual information or other disclosure other than with respect to the terms of the agreements or other documents themselves, and you should not rely on them for that purpose. In particular, any representations and warranties made by us in these agreements or other documents were made solely within the specific context of the relevant agreement or document and may not describe the actual state of affairs as of the date they were made or at any other time.
220
SIGNATURES
Pursuant to the requirements of Section 13 or 15(d) of the Securities Exchange Act of 1934, the registrant has duly caused this report to be signed on its behalf by the undersigned, thereunto duly authorized on
February 20,
2015
.
|
|
AXIS CAPITAL HOLDINGS LIMITED
|
|||||
|
|
By:
|
|
/s/ ALBERT BENCHIMOL
|
|
||
|
|
|
Albert Benchimol
|
|
|||
|
|
|
President and Chief Executive Officer
|
|
|||
POWER OF ATTORNEY
We, the undersigned directors and executive officers of AXIS Capital Holdings Limited, hereby appoint Joseph Henry and Richard T. Gieryn, Jr., and each of them singly, as our true and lawful attorneys with full power to them and each of them to sign for us, and in our names in the capacities indicated below, any and all amendments to the Annual Report on Form 10-K filed with the Securities and Exchange Commission, hereby ratifying and confirming our signatures as they may be signed by our said attorneys to any and all amendments to said Annual Report on Form 10-K.
Pursuant to the requirements of the Securities Exchange Act of 1934, this report has been signed below by the following persons on behalf of the registrant and in the capacities indicated on
February 20,
2015
.
|
Signature
|
|
Title
|
|
/s/ ALBERT BENCHIMOL
|
Chief Executive Officer, President and Director
(Principal Executive Officer)
|
|
|
Albert Benchimol
|
|
|
|
/s/ JOSEPH HENRY
|
Chief Financial Officer
(Principal Financial Officer)
|
|
|
Joseph Henry
|
|
|
|
/s/ JAMES O'SHAUGHNESSY
|
Controller
(Principal Accounting Officer)
|
|
|
James O'Shaughnessy
|
|
|
|
/s/ GEOFFREY BELL
|
Director
|
|
|
Geoffrey Bell
|
|
|
|
/s/ JANE BOISSEAU
|
Director
|
|
|
Jane Boisseau
|
||
|
/s/ MICHAEL A. BUTT
|
Director
|
|
|
Michael A. Butt
|
|
|
|
/s/ CHARLES A. DAVIS
|
Director
|
|
|
Charles A. Davis
|
|
|
|
/s/ ROBERT L. FRIEDMAN
|
Director
|
|
|
Robert L. Friedman
|
|
|
221
|
Signature
|
|
Title
|
|
/s/ CHRISTOPHER V. GREETHAM
|
||
|
Christopher V. Greetham
|
|
Director
|
|
/s/ MAURICE A. KEANE
|
||
|
Maurice A. Keane
|
|
Director
|
|
/s/ SIR ANDREW LARGE
|
||
|
Sir Andrew Large
|
|
Director
|
|
/s/ CHERYL-ANN LISTER
|
||
|
Cheryl-Ann Lister
|
|
Director
|
|
/s/ THOMAS C. RAMEY
|
||
|
Thomas C. Ramey
|
|
Director
|
|
/s/ HENRY B. SMITH
|
||
|
Henry B. Smith
|
|
Director
|
|
/s/ ALICE YOUNG
|
Director
|
|
|
Alice Young
|
||
|
/s/ WILHELM ZELLER
|
||
|
Wilhelm Zeller
|
|
Director
|
222
REPORT OF INDEPENDENT REGISTERED PUBLIC ACCOUNTING FIRM
To the Board of Directors and Shareholders of
AXIS Capital Holdings Limited
We have audited the consolidated financial statements of AXIS Capital Holdings Limited and subsidiaries (the “Company”) as of
December 31, 2014
, and
2013
, and for each of the three years in the period ended
December 31, 2014
, and the Company’s internal control over financial reporting as of
December 31, 2014
, and have issued our report thereon dated
February 20,
2015
; such consolidated financial statements and reports are included elsewhere in this Form 10-K and are incorporated herein by reference. Our audits also included the consolidated financial statement schedules of the Company listed in Item 15. These consolidated financial statement schedules are the responsibility of the Company’s management. Our responsibility is to express an opinion based on our audits. In our opinion, such consolidated financial statement schedules, when considered in relation to the basic consolidated financial statements taken as a whole, present fairly, in all material respects, the information set forth therein.
|
/s/ Deloitte Ltd.
|
|
Hamilton, Bermuda
|
|
February 20, 2015
|
223
SCHEDULE II
AXIS CAPITAL HOLDINGS LIMITED
CONDENSED BALANCE SHEETS – PARENT COMPANY
DECEMBER 31,
2014
AND
2013
|
2014
|
2013
|
||||||
|
|
(in thousands)
|
||||||
|
Assets
|
|||||||
|
Investments in subsidiaries on equity basis
|
$
|
6,114,436
|
|
$
|
6,581,368
|
|
|
|
Cash and cash equivalents
|
7,041
|
|
4,414
|
|
|||
|
Other assets
|
2,642
|
|
3,179
|
|
|||
|
Total assets
|
$
|
6,124,119
|
|
$
|
6,588,961
|
|
|
|
Liabilities
|
|||||||
|
Intercompany payable
|
$
|
213,149
|
|
$
|
204,877
|
|
|
|
Senior notes
|
—
|
|
499,906
|
|
|||
|
Dividends payable
|
48,197
|
|
47,959
|
|
|||
|
Other liabilities
|
41,652
|
|
18,257
|
|
|||
|
Total liabilities
|
302,998
|
|
770,999
|
|
|||
|
Shareholders’ equity
|
|||||||
|
Preferred shares
|
627,843
|
|
627,843
|
|
|||
|
Common shares
(2014: 175,478; 2013: 174,134 shares issued
and 2014: 99,426; 2013: 109,485 shares outstanding)
|
2,191
|
|
2,174
|
|
|||
|
Additional paid-in capital
|
2,285,016
|
|
2,240,125
|
|
|||
|
Accumulated other comprehensive income (loss)
|
(45,574
|
)
|
117,825
|
|
|||
|
Retained earnings
|
5,715,504
|
|
5,062,706
|
|
|||
|
Treasury shares, at cost
(2014: 76,052; 2013: 64,649 shares)
|
(2,763,859
|
)
|
(2,232,711
|
)
|
|||
|
Total shareholders’ equity
|
5,821,121
|
|
5,817,962
|
|
|||
|
Total liabilities and shareholders’ equity
|
$
|
6,124,119
|
|
$
|
6,588,961
|
|
|
|
(1)
|
On November 15, 2004, AXIS Capital issued
$500 million
aggregate principal amount of
5.75%
senior unsecured debt (“Senior Notes”) at an issue price of
99.785%
, generating net proceeds of
$496 million
. Interest of the
5.75%
Senior Notes is payable semi-annually in arrears on June 1 and December 1 of each year, beginning on June 1, 2005. AXIS Capital repaid the full
$500 million
of its outstanding
5.75%
Senior Notes upon their scheduled maturity of December 1, 2014.
|
|
(2)
|
AXIS Capital has fully and unconditionally guaranteed all obligations of AXIS Specialty Finance LLC, a
100%
owned finance subsidiary, related to the issuance of
$500 million
aggregate principal amount of
5.875%
senior unsecured notes. AXIS Capital’s obligations under this guarantee are unsecured and senior and rank equally with all other senior obligations of AXIS Capital.
|
|
(3)
|
AXIS Capital has fully and unconditionally guaranteed all obligations of AXIS Specialty Finance PLC,, a
100%
owned finance subsidiary, related to the issuance of
$250 million
aggregate principal amount of
2.65%
and
$250 million
aggregate principal amount of
5.15%
senior unsecured notes. AXIS Capital's obligations under this guarantee are unsecured and senior and rank equally with all other senior obligations of AXIS Capital.
|
|
(4)
|
AXIS Capital has fully and unconditionally guaranteed the obligations of AXIS Specialty Finance LLC, AXIS Specialty Finance PLC and AXIS Specialty Holdings Bermuda Limited related to the
$250 million
credit facility issued by a syndication of lenders. At
December 31,
2014
, debt outstanding under the credit facility was $
nil
.
|
|
(5)
|
AXIS Capital has fully and unconditionally guaranteed the derivative instrument obligations of certain of its
100%
owned operating subsidiaries. At December 31, 2014, the fair value of guaranteed obligations utilized aggregated to
$68 million
(2013: $
28 million
).
|
224
SCHEDULE II
AXIS CAPITAL HOLDINGS LIMITED
CONDENSED STATEMENTS OF OPERATIONS – PARENT COMPANY
YEARS ENDED
DECEMBER 31,
2014
,
2013
AND
2012
|
2014
|
2013
|
2012
|
|||||||||
|
|
(in thousands)
|
||||||||||
|
Revenues
|
|||||||||||
|
Net investment income
|
$
|
3
|
|
$
|
5
|
|
$
|
25
|
|
||
|
Total revenues
|
3
|
|
5
|
|
25
|
|
|||||
|
Expenses
|
|||||||||||
|
General and administrative expenses
|
57,998
|
|
40,565
|
|
62,293
|
|
|||||
|
Interest expense and financing costs
|
26,749
|
|
29,201
|
|
29,201
|
|
|||||
|
Total expenses
|
84,747
|
|
69,766
|
|
91,494
|
|
|||||
|
Loss before equity in net earnings of subsidiaries
|
(84,744
|
)
|
(69,761
|
)
|
(91,469
|
)
|
|||||
|
Equity in net earnings of subsidiaries
|
895,489
|
|
797,226
|
|
638,710
|
|
|||||
|
Net income
|
810,745
|
|
727,465
|
|
547,241
|
|
|||||
|
Preferred share dividends
|
40,088
|
|
40,474
|
|
38,228
|
|
|||||
|
Loss on repurchase of preferred shares
|
—
|
|
3,081
|
|
14,009
|
|
|||||
|
Net income available to common shareholders
|
$
|
770,657
|
|
$
|
683,910
|
|
$
|
495,004
|
|
||
|
Comprehensive income
|
$
|
641,165
|
|
$
|
482,668
|
|
$
|
781,701
|
|
||
225
SCHEDULE II
AXIS CAPITAL HOLDINGS LIMITED
CONDENSED STATEMENTS OF CASH FLOWS – PARENT COMPANY
YEARS ENDED
DECEMBER 31,
2014
,
2013
AND
2012
|
2014
|
2013
|
2012
|
|||||||||
|
|
(in thousands)
|
||||||||||
|
Cash flows from operating activities:
|
|||||||||||
|
Net income
|
$
|
810,745
|
|
$
|
727,465
|
|
$
|
547,241
|
|
||
|
Adjustments to reconcile net income to net cash provided by operating activities:
|
|||||||||||
|
Equity in net earnings of subsidiaries
|
(895,489
|
)
|
(797,226
|
)
|
(638,710
|
)
|
|||||
|
Change in intercompany payable
|
8,272
|
|
(38,375
|
)
|
(7,667
|
)
|
|||||
|
Dividends received from subsidiaries
|
724,000
|
|
566,000
|
|
525,000
|
|
|||||
|
Other items
|
53,865
|
|
34,803
|
|
56,425
|
|
|||||
|
Net cash provided by operating activities
|
701,393
|
|
492,667
|
|
482,289
|
|
|||||
|
Cash flows from investing activities:
|
|||||||||||
|
Capital repaid from subsidiary
|
496,593
|
|
—
|
|
—
|
|
|||||
|
Net cash provided by investing activities
|
496,593
|
|
—
|
|
—
|
|
|||||
|
Cash flows from financing activities:
|
|||||||||||
|
Redemption of senior notes
|
(500,000
|
)
|
—
|
|
—
|
|
|||||
|
Net proceeds from issuance of preferred shares
|
—
|
|
218,449
|
|
393,544
|
|
|||||
|
Repurchase of preferred shares
|
—
|
|
(100,000
|
)
|
(404,073
|
)
|
|||||
|
Repurchase of common shares
|
(543,202
|
)
|
(472,263
|
)
|
(317,687
|
)
|
|||||
|
Dividends paid - common shares
|
(117,619
|
)
|
(118,426
|
)
|
(120,487
|
)
|
|||||
|
Dividends paid - preferred shares
|
(40,088
|
)
|
(39,193
|
)
|
(38,228
|
)
|
|||||
|
Proceeds from issuance of common shares
|
5,550
|
|
20,339
|
|
5,120
|
|
|||||
|
Net cash used in financing activities
|
(1,195,359
|
)
|
(491,094
|
)
|
(481,811
|
)
|
|||||
|
Increase in cash and cash equivalents
|
2,627
|
|
1,573
|
|
478
|
|
|||||
|
Cash and cash equivalents - beginning of year
|
4,414
|
|
2,841
|
|
2,363
|
|
|||||
|
Cash and cash equivalents - end of year
|
$
|
7,041
|
|
$
|
4,414
|
|
$
|
2,841
|
|
||
|
Supplemental disclosures of cash flow information:
|
|||||||||||
|
Interest paid
|
$
|
28,750
|
|
$
|
28,750
|
|
$
|
28,750
|
|
||
226
SCHEDULE III
AXIS CAPITAL HOLDINGS LIMITED
SUPPLEMENTARY INSURANCE INFORMATION
|
|
At and year ended December 31, 2014
|
|||||||||||||||||||||||||||||||||||
|
(in thousands)
|
Deferred
Acquisition
Costs
|
Reserve
for Losses
and Loss
Expenses
|
Unearned
Premiums
|
Net
Premiums
Earned
|
Net
Investment
Income
(1)
|
Losses
And Loss
Expenses
|
Amortization
of Deferred
Acquisition
Costs
|
Other
Operating
Expenses
(2)
|
Net
Premiums
Written
|
|||||||||||||||||||||||||||
|
Insurance
|
$
|
135,111
|
|
$
|
5,063,147
|
|
$
|
1,506,925
|
|
$
|
1,830,544
|
|
$
|
—
|
|
$
|
1,131,880
|
|
$
|
278,804
|
|
$
|
341,214
|
|
$
|
1,779,501
|
|
|||||||||
|
Reinsurance
|
331,876
|
|
4,533,650
|
|
1,228,451
|
|
2,040,455
|
|
—
|
|
1,054,842
|
|
458,393
|
|
144,987
|
|
2,127,474
|
|
||||||||||||||||||
|
Corporate
|
—
|
|
—
|
|
—
|
|
—
|
|
342,766
|
|
—
|
|
—
|
|
135,675
|
|
—
|
|
||||||||||||||||||
|
Total
|
$
|
466,987
|
|
$
|
9,596,797
|
|
$
|
2,735,376
|
|
$
|
3,870,999
|
|
$
|
342,766
|
|
$
|
2,186,722
|
|
$
|
737,197
|
|
$
|
621,876
|
|
$
|
3,906,975
|
|
|||||||||
|
|
At and year ended December 31, 2013
|
|||||||||||||||||||||||||||||||||||
|
(in thousands)
|
Deferred
Acquisition
Costs
|
Reserve
for Losses
and Loss
Expenses
|
Unearned
Premiums
|
Net
Premiums
Earned
|
Net
Investment
Income
(1)
|
Losses
And Loss
Expenses
|
Amortization
of Deferred
Acquisition
Costs
|
Other
Operating
Expenses
(2)
|
Net
Premiums
Written
|
|||||||||||||||||||||||||||
|
Insurance
|
$
|
150,109
|
|
$
|
4,873,184
|
|
$
|
1,548,653
|
|
$
|
1,722,762
|
|
$
|
—
|
|
$
|
1,050,402
|
|
$
|
242,363
|
|
$
|
347,684
|
|
$
|
1,813,538
|
|
|||||||||
|
Reinsurance
|
306,013
|
|
4,708,956
|
|
1,135,196
|
|
1,984,303
|
|
—
|
|
1,083,793
|
|
421,828
|
|
137,450
|
|
2,114,662
|
|
||||||||||||||||||
|
Corporate
|
—
|
|
—
|
|
—
|
|
—
|
|
409,312
|
|
—
|
|
—
|
|
90,256
|
|
—
|
|
||||||||||||||||||
|
Total
|
$
|
456,122
|
|
$
|
9,582,140
|
|
$
|
2,683,849
|
|
$
|
3,707,065
|
|
$
|
409,312
|
|
$
|
2,134,195
|
|
$
|
664,191
|
|
$
|
575,390
|
|
$
|
3,928,200
|
|
|||||||||
|
|
At and year ended December 31, 2012
|
|||||||||||||||||||||||||||||||||||
|
(in thousands)
|
Deferred
Acquisition
Costs
|
Reserve
for Losses
and Loss
Expenses
|
Unearned
Premiums
|
Net
Premiums
Earned
|
Net
Investment
Income
(1)
|
Losses
And Loss
Expenses
|
Amortization
of Deferred
Acquisition
Costs
|
Other
Operating
Expenses
(2)
|
Net
Premiums
Written
|
|||||||||||||||||||||||||||
|
Insurance
|
$
|
128,311
|
|
$
|
4,492,553
|
|
$
|
1,456,318
|
|
$
|
1,558,058
|
|
$
|
—
|
|
$
|
953,564
|
|
$
|
226,859
|
|
$
|
314,834
|
|
$
|
1,522,245
|
|
|||||||||
|
Reinsurance
|
260,937
|
|
4,566,178
|
|
998,374
|
|
1,857,405
|
|
—
|
|
1,142,464
|
|
400,794
|
|
116,487
|
|
1,815,211
|
|
||||||||||||||||||
|
Corporate
|
—
|
|
—
|
|
—
|
|
—
|
|
380,957
|
|
—
|
|
—
|
|
129,660
|
|
—
|
|
||||||||||||||||||
|
Total
|
$
|
389,248
|
|
$
|
9,058,731
|
|
$
|
2,454,692
|
|
$
|
3,415,463
|
|
$
|
380,957
|
|
$
|
2,096,028
|
|
$
|
627,653
|
|
$
|
560,981
|
|
$
|
3,337,456
|
|
|||||||||
|
(1)
|
As we evaluate the underwriting results of each of our reportable segments separately from the results of our investment portfolio, we do not allocate net investment income to our reportable segments.
|
|
(2)
|
Amounts related to our reportable segments reflect underwriting-related general and administrative expenses, including those incurred directly by segment personnel and certain corporate overhead costs allocated based on estimated consumption, headcount and other variables deemed relevant. Other corporate overhead costs, which are are not incremental and/or directly attributable to our individual underwriting operations, are not allocated to our reportable segments and are presented separately as corporate expenses.
|
227
SCHEDULE IV
AXIS CAPITAL HOLDINGS LIMITED
SUPPLEMENTARY REINSURANCE INFORMATION
YEARS ENDED
DECEMBER 31,
2014
,
2013
AND
2012
|
(in thousands)
|
DIRECT
GROSS
PREMIUM
|
CEDED TO
OTHER
COMPANIES
|
ASSUMED
FROM
OTHER
COMPANIES
|
NET
AMOUNT
|
PERCENTAGE
OF AMOUNT
ASSUMED TO
NET
|
||||||||||||||||
|
2014
|
|||||||||||||||||||||
|
Property and Casualty
|
$
|
1,882,695
|
|
$
|
786,555
|
|
$
|
2,548,174
|
|
$
|
3,644,314
|
|
69.9
|
%
|
|||||||
|
Accident and Health
|
127,279
|
|
17,989
|
|
153,371
|
|
262,661
|
|
58.4
|
%
|
|||||||||||
|
Total
|
$
|
2,009,974
|
|
$
|
804,544
|
|
$
|
2,701,545
|
|
$
|
3,906,975
|
|
69.1
|
%
|
|||||||
|
2013
|
|||||||||||||||||||||
|
Property and Casualty
|
$
|
1,920,203
|
|
$
|
767,374
|
|
$
|
2,508,363
|
|
$
|
3,661,192
|
|
68.5
|
%
|
|||||||
|
Accident and Health
|
54,712
|
|
1,467
|
|
213,763
|
|
267,008
|
|
80.1
|
%
|
|||||||||||
|
Total
|
$
|
1,974,915
|
|
$
|
768,841
|
|
$
|
2,722,126
|
|
$
|
3,928,200
|
|
69.3
|
%
|
|||||||
|
2012
|
|||||||||||||||||||||
|
Property and Casualty
|
$
|
1,765,407
|
|
$
|
800,466
|
|
$
|
2,213,441
|
|
$
|
3,178,382
|
|
69.6
|
%
|
|||||||
|
Accident and Health
|
40,480
|
|
1,721
|
|
120,315
|
|
159,074
|
|
75.6
|
%
|
|||||||||||
|
Total
|
$
|
1,805,887
|
|
$
|
802,187
|
|
$
|
2,333,756
|
|
$
|
3,337,456
|
|
69.9
|
%
|
|||||||
228
TABLE OF CONTENTS
Part IItem 1. BusinessItem 1A. Risk FactorsItem 1B. Unresolved Staff CommentsItem 2. PropertiesItem 3. Legal ProceedingsItem 4. Mine Safety DisclosuresPart IIItem 5. Market For Registrant S Common Equity, Related Stockholder Matters and Issuer Purchases Of Equity SecuritiesItem 6. Selected Financial DataItem 7. Management S Discussion and Analysis Of Financial Condition and Results Of OperationsItem 7A. Quantitative and Qualitative Disclosure About Market RiskItem 7 For Further Details on This PortfolioItem 8. Financial Statements and Supplementary DataNote 5 - InvestmentsItem 9. Changes in and Disagreements with Accountants on Accounting and Financial DisclosureItem 9A. Controls and ProceduresItem 9B. Other InformationPart IIIItem 10. Directors, Executive Officers and Corporate GovernanceItem 11. Executive CompensationItem 12. Security Ownership Of Certain Beneficial Owners and Management and Related Stockholder MattersItem 13. Certain Relationships and Related Transactions, and Director IndependenceItem 14. Principal Accounting Fees and ServicesPart IVItem 15. Exhibits and Financial Statement Schedules