AXALTA COATING SYSTEMS LTD.
10-Ks and 10-Qs
|
|
|
|
|
|
|
|
|
|
|
|
|
|
|
|
|
|
|
|
|
|
|
|
|
|
|
|
|
|
|
|
|
|
|
|
|
|
|
|
|
UNITED STATES
SECURITIES AND EXCHANGE COMMISSION
Washington, D.C. 20549
FORM 10-K
|
ý
|
ANNUAL REPORT PURSUANT TO SECTION 13 OR 15(d) OF THE SECURITIES EXCHANGE ACT OF 1934
|
For the fiscal year ended
December 31, 2016
or
|
¨
|
TRANSITION REPORT PURSUANT TO SECTION 13 OR 15(d) OF THE SECURITIES EXCHANGE ACT OF 1934
|
For the transition period from
to
.
Commission File Number: 001-36733
AXALTA COATING SYSTEMS LTD.
(Exact name of registrant as specified in its charter)
|
Bermuda
|
2851
|
98-1073028
|
||
|
(State or other jurisdiction of
incorporation or organization)
|
(Primary Standard Industrial
Classification Code Number)
|
(I.R.S. Employer
Identification No.)
|
||
Two Commerce Square
2001 Market Street
Suite 3600
Philadelphia, Pennsylvania 19103
(855) 547-1461
(Address, including zip code, and telephone number, including area code, of the registrant’s principal executive offices)
Securities registered pursuant to Section 12(b) of the Act:
|
Common Shares, $1.00 par value
|
New York Stock Exchange
|
|||
|
(title of class)
|
(Exchange on which registered)
|
|||
Securities registered pursuant to Section 12(g) of the Act:
None
Indicate by check mark if the registrant is a well-known seasoned issuer, as defined in Rule 405 of the Securities Act Yes
ý
No
¨
Indicate by check mark if the registrant is not required to file reports pursuant to Section 13 or 15(d) of the Act Yes
¨
No
ý
Indicate by check mark whether the registrant (1) has filed all reports required to be filed by Section 13 or 15(d) of the Securities Exchange Act of 1934 during the preceding 12 months (or for such shorter period that the registrant was required to file such reports), and (2) has been subject to such filing requirements for the past 90 days. Yes
ý
No
¨
Indicate by check mark whether the registrant has submitted electronically and posted on its corporate Web site, if any, every Interactive Data File required to be submitted and posted pursuant to Rule 405 of Regulation S-T (§232.405 of this chapter) during the preceding 12 months (or for such shorter period that the registrant was required to submit and post such files). Yes
ý
No
¨
Indicate by check mark if the disclosure of delinquent filers pursuant to Item 405 of Regulation S-K (§229.405 of this chapter) is not contained herein, and will not be contained, to the best of the registrant's knowledge, in definitive proxy or information statements incorporated by reference in Part III of this Form 10-K or any amendment to this Form 10-K.
ý
Indicate by check mark whether the Company is a large accelerated filer, an accelerated filer, a non-accelerated filer, or a smaller reporting company. See definitions of “large accelerated filer,” “accelerated filer,” and “smaller reporting company” in Rule 12b-2 of the Exchange Act. (Check one): Large accelerated filer
ý
Non-accelerated filer
¨
Accelerated filer
¨
Small reporting company
¨
Indicate by a check mark whether the registrant is a shell company (as defined in Rule 12b-2 of the Exchange Act). Yes
¨
No
ý
As of June 30, 2016, the last day of the registrant's most recently completed second fiscal quarter, the aggregate market value of the registrant's common stock held by non-affiliates of the registrant was approximately
$5.2 billion
(based on the closing sale price of the common stock on that date on the New York Stock Exchange).
As of
February 23, 2017
, there were
241,340,450
shares of the registrant’s common shares outstanding.
DOCUMENTS INCORPORATED BY REFERENCE
Part III incorporates information by reference from the registrant's Proxy Statement for the 2017 Annual Meeting of the Shareholders. Such proxy statement will be filed with the Securities and Exchange Commission within 120 days of the close of the registrant's fiscal year ended December 31, 2016.
Table of Contents
2
Axalta Coating Systems Ltd. ("Axalta," the "Company," "we," "our" and "us"), a Bermuda exempted company formed at the direction of an affiliate of The Carlyle Group L.P. ("Carlyle"), was incorporated on August 24, 2012 for the purpose of consummating the acquisition of DuPont Performance Coatings ("DPC"), a business formerly owned by E. I. du Pont de Nemours and Company ("DuPont"), including certain assets of DPC and all of the capital stock and other equity interests of certain entities engaged in the DPC business (the "Acquisition"). Axalta, through its wholly-owned indirect subsidiaries, acquired DPC on February 1, 2013.
We are a leading global manufacturer, marketer and distributor of high performance coatings systems. Based on recent market information, we generate approximately 90% of our revenue in markets where we hold the #1 or #2 global market position, including the #1 position in our core automotive refinish end-market with approximately a 25% global market share. We have over a 150-year heritage in the coatings industry and are known for manufacturing high-quality products with well-recognized brands supported by market-leading technology and customer service. Over the course of our history we have remained at the forefront of our industry by continually developing innovative coatings technologies designed to enhance the performance and appearance of our customers' products, while improving their productivity and profitability.
Our diverse global footprint of
46
manufacturing facilities,
four
technology centers,
47
customer training centers and more than
13,000
employees allows us to meet the needs of customers in over
130
countries. We serve our customer base through an extensive sales force and technical support organization, as well as through approximately
4,000
independent, locally-based distributors. Our scale and strong local presence are critical to our success, allowing us to leverage our technology portfolio and customer relationships globally while meeting customer demands locally.
We operate our business in two operating segments, Performance Coatings and Transportation Coatings, serving four end-markets globally as highlighted below. See further discussion in Note 24 to our consolidated financial statements included elsewhere in this Annual Report on Form 10-K.
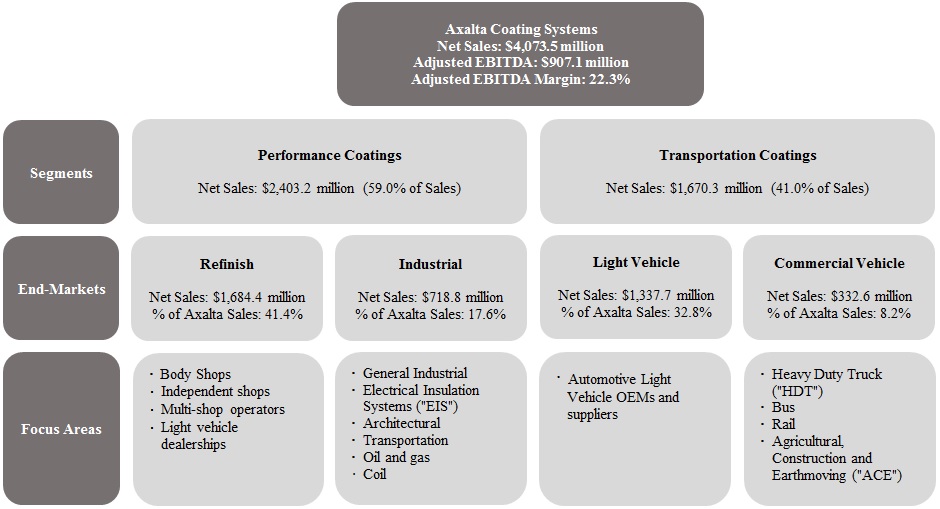
Table above reflects numbers for the year ended December 31, 2016. Adjusted EBITDA Margin is calculated as Adjusted EBITDA divided by Net Sales.
3
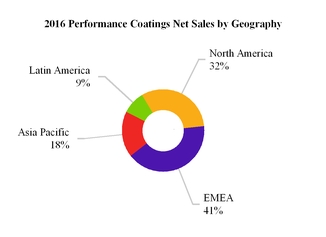
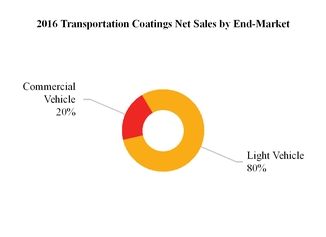
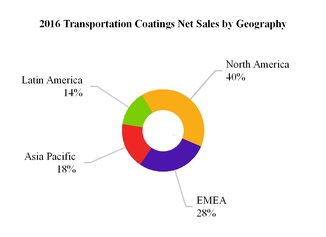
Net sales for our four end-markets and four regions for the year ended December 31, 2016 are highlighted below:
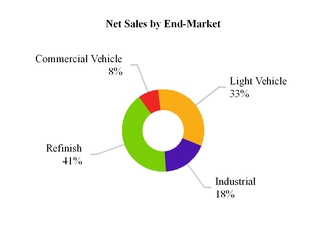
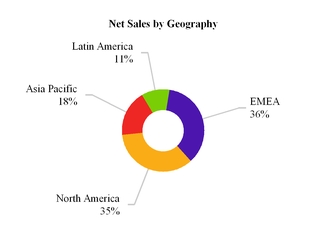
Note: Latin America includes Mexico. EMEA represents Europe, Middle East and Africa.
SEGMENT OVERVIEW
Performance Coatings
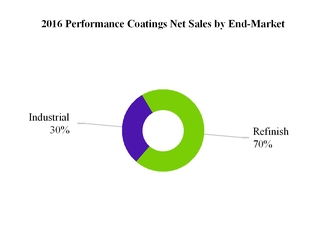
Through our Performance Coatings segment we provide high-quality liquid and powder coatings solutions to a fragmented and local customer base. We are one of only a few suppliers with the technology to provide precise color matching and highly durable coatings systems. The end-markets within this segment are refinish and industrial.
Performance Coatings End-Markets
Refinish
Sales in the refinish end-market are driven by the number of vehicle collisions, owners’ propensity to repair their vehicles, the number of miles vehicle owners drive and the size of the car parc. Although refinish coatings typically represent only a small portion of the overall vehicle repair cost, they are critical to the vehicle owner’s satisfaction given their impact on appearance. As a result, body shop operators are most focused on coatings brands with a strong track record of performance and reliability. Body shops look for suppliers and brands with productivity enhancements, regulatory compliance, consistent quality, the presence of ongoing technical support and exact color match technologies. Color matching is a critical component of coatings supplier selection, since inexact matching adversely impacts vehicle appearance and, if repainting is required due to a poor match, can significantly impact the speed and volume of repairs at a given shop.
We develop, market and supply a complete portfolio of innovative coatings systems and color matching technologies to facilitate faster automotive collision repairs relative to competing technologies. Our color matching technology provides Axalta-specific formulations that enable body shops to accurately match thousands of vehicle colors, regardless of vehicle brand, color, age or supplier of the original paint during production. It would be time consuming and costly for a new entrant to create such an extensive color inventory.
4
Industrial
The industrial end-market is comprised of liquid and powder coatings used in a broad array of end-market applications. Within the industrial end-market, we focus on the following:
|
•
|
General Industrial
: coatings for a wide and diverse array of applications, including HVAC, shelving, appliances and electrical storage components, metal furniture, and playground equipment as well as ACE, fencing, valves and specialized coatings used for coating the interior of metal drums and packaging.
|
|
•
|
Electrical Insulation Systems
: coatings to insulate copper wire used in motors and transformers and coatings to insulate sheets forming magnetic circuits of motors and transformers, computer elements and other electrical components.
|
|
•
|
Architectural
: exterior powder coatings typically used in the construction of commercial structures, residential windows, doors and cladding, as well as liquid interior and exterior house paint.
|
|
•
|
Transportation
: liquid and powder coatings for vehicle components, chassis and wheels to protect against corrosion, provide increased durability and impart appropriate aesthetics.
|
|
•
|
Oil & Gas
: liquid and powder products to coat tanks, pipelines, valves and fittings protecting against chemicals, corrosion and extreme temperatures in the oil & gas industry.
|
|
•
|
Coil:
coatings utilized in various applications such as metal building and wall panels, roofing, commercial appliances, lighting, garage doors, HVAC, office furniture and truck trailers.
|
Demand in this end-market is driven by a wide variety of macroeconomic factors, such as growth in GDP and industrial production. There has also been an increase in demand for products that enhance environmental sustainability, corrosion resistance and productivity. These global trends are bolstered by regional and industry specific trends. Customers select industrial coatings based on protection, durability and appearance.
Performance Coatings Products and Brands
We offer a comprehensive range of specially-formulated waterborne and solventborne products and systems used by the global automotive repair industry to refinish damaged vehicles. Our refinish products and systems include a range of coatings layers required to match the vehicle’s color and appearance, producing a repair surface indistinguishable from the adjacent surface.
We provide systems that enable body shops to match more than
180,000
color variations, using a database with more than four million formulations, in the global market. Our color technology is manifested in the pigment technology that goes into our tints, one of the most technologically advanced parts of the refinish coatings system, which makes up the majority of our products in a body shop. We have a large color library and a number of well-known, long-standing premium brands, including Cromax
®
, Standox
®
, Spies Hecker
®
, and our newest mainstream product, Syrox™, which was introduced in EMEA in 2016, as well as other regional and local brands.
Our color matching and retrieval systems allow customers to quickly match any color, preventing body shop technicians from having to repeat the color matching process, saving time and materials. The color matching process begins with a technician scanning a damaged vehicle with one of our advanced color matching tools, such as our Acquire Plus EFX™ hand-held spectrophotometer. The Acquire Plus EFX lens reads the color, evaluating both the unique flake and color characteristics of the specific vehicle. These characteristics may vary significantly, even for vehicles of the same make, model and original color, due to a variety of factors, including a vehicle’s age, plant at which it was assembled, weather conditions and operating history. The Acquire Plus EFX electronically connects with our ColorNet
®
database and generates for the paint technician the precise mix of tints and colors needed to recreate that specific color needed for the part being repaired. In addition to the Acquire Plus EFX, we offer customers several other color matching tools, including our VINdicator
®
database, which identifies vehicle color based on its vehicle identification number, and traditional color matching wheels and fan decks.
5
We are also a leading global developer, manufacturer and supplier of functional and decorative liquid and powder coatings for a large number of diversified applications in the industrial end-market. We provide a full portfolio of products for applications including architectural cladding and fittings, automotive coatings, general industrial, job coaters, electrical insulation coatings, HVAC, appliances, rebar and oil & gas pipelines. Through organic growth and a recent acquisition, we have also become a leading manufacturer and supplier of coil coatings in North America. Our liquid systems are used to provide insulation and corrosion protection for electrical conductors and components, provide chemical resistance for the interiors of metal packaging drums, protect automotive parts and serve as basecoats for alloy and steel wheels. Powder coatings products are often an environmentally responsible, lower cost alternative to liquid coatings. These coatings are typically electrostatically sprayed using a specialized spray gun and cured to create a uniform, high-quality finish. In the oil & gas industry our powder products are used to protect components from corrosion and severe conditions such as extreme temperatures.
Our major industrial brands include Voltatex
®
, AquaEC™, Durapon™, Hydropon™, Ceranamel™, and XT for liquid coatings and Alesta
®
, Nap-Gard
®
and Abcite
®
for powder.
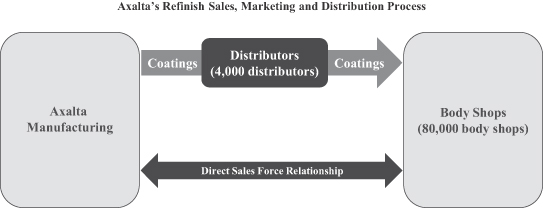
Performance Coatings Sales, Marketing and Distribution
We leverage a large global refinish sales and technical support team to effectively serve our broad refinish customer base of approximately
80,000
body shops. The majority of our products are supplied by our network of approximately
4,000
independent local distributors. In select regions, such as in parts of Europe, we also sell directly to customers. Distributors maintain an inventory of our products to fill orders from body shops in their market and assume credit risk and responsibility for logistics, delivery and billing. In certain countries, we utilize importers that buy directly from us and actively market our products to body shops. Our relationships with our top ten distributors are longstanding and continue to contribute to our success in the global refinish market.
Our large sales force manages relationships directly with our customers to drive demand for our products, which in turn are purchased through our distributor network. Due to the local nature of the refinish industry, our sales force operates on a regional/country basis to provide clients with responsive customer service and local insight. As part of their coverage efforts, salespeople introduce new products to body shops and provide technical support and ongoing training. We have established
47
customer training centers, which helps to deepen our customer relationships.
Our sales force also helps to drive shop productivity improvements and to install or upgrade body shop color matching and mixing equipment to improve shop profitability. Once a coating and color system is installed, a body shop almost exclusively uses its specific supplier’s products. The proprietary nature of a coatings supplier’s color systems, the substantial inventory needed to support a body shop and the body shop’s familiarity with an established brand lead to high levels of customer retention. Our customer retention rate levels have been and continue to be strong.
To effectively reach our customers in the industrial end-market we generally ship directly and leverage a dedicated sales force and technical service team that operates on a regional basis. We are one of only three truly global powder coatings producers that can satisfy the needs and specifications of a customer in multiple regions of the world, while maximizing productivity from the broad scale and scope of our operations.
Performance Coatings Customers
Within our Performance Coatings segment, we sell coatings to customers in more than
130
countries. Our top ten customers accounted for approximately
18%
of our Performance Coatings net sales during the year ended December 31, 2016.
We serve a broad, fragmented customer base of approximately
80,000
body shops, including:
|
•
|
Independent Body Shops:
Single location body shops that utilize premium, mainstream or economy brands based on the local market.
|
6
|
•
|
Multi-Shop Operators ("MSOs"):
Body shops with more than one location focused on providing premium paint jobs with industry leading efficiency. MSOs use premium/mainstream coatings and state-of-the-art painting technology to increase shop productivity, allowing them to repair more vehicles faster.
|
|
•
|
Original Equipment Manufacturer ("OEM") Dealership Body Shops
: High-productivity body shops, located in OEM car dealerships, that operate like MSOs and provide premium services to customers using premium/mainstream coatings.
|
Performance Coatings Competition
Our primary competitors in the refinish end-market include PPG, BASF and Akzo Nobel, but we also compete against regional players in local markets. Similarly, in industrial coatings, we compete against multi-national suppliers, such as Akzo Nobel, PPG, Valspar and BASF, and regional players in local markets. We are one of the few performance coatings companies that can provide the customer service, technology, color design capability and product performance necessary to deliver exceptional value to our customers.
Transportation Coatings
Through our Transportation Coatings segment, we provide advanced coating technologies to OEMs of light and commercial vehicles. These increasingly global customers require a high level of technical support coupled with cost-effective, environmentally responsible coatings systems that can be applied with a high degree of precision, consistency and speed.
Transportation Coatings End-Markets
Light Vehicle
Demand for light vehicle products is driven by the production of light vehicles in a particular region. Light vehicle OEMs select coatings providers on the basis of their global ability to deliver advanced technological solutions that improve exterior appearance and durability and provide long-term corrosion protection. Customers also look for suppliers that can enhance process efficiency to reduce overall manufacturing costs and provide on-site technical support. Rigorous environmental and durability testing as well as obtaining engineering approvals are also key criteria used by global light vehicle OEMs when selecting coatings providers. Globally integrated suppliers are important because they offer products with consistent standards across regions and are able to deliver high-quality products in sufficient quantity while meeting OEM service requirements. Our global scale, differentiated technology platform and customer focus, including on-site support, position us to be a global partner and solutions provider to the most discerning and demanding light vehicle OEMs. We are one of the few coatings producers that can provide OEMs with global product specifications, standardized color development, compatibility with an ever-increasing number of substrates, increasingly complex colors and environmentally responsible coatings while continuing to simplify and reduce steps in the coatings application process.
Commercial Vehicle
Sales in the commercial vehicle end-market are generated from a variety of applications including non-automotive transportation (
e.g.
, HDT, bus and rail) and ACE, as well as related markets such as trailers, recreational vehicles and personal sport vehicles. This end-market is primarily driven by global commercial vehicle production, which is influenced by overall economic activity, government infrastructure spending, equipment replacement cycles and evolving environmental standards.
7
Commercial vehicle OEMs select coatings providers on the basis of their ability to consistently deliver advanced technological solutions that improve exterior appearance, protection and durability and provide extensive color libraries and matching capabilities at the lowest total cost-in-use, while meeting stringent environmental requirements. Particularly for HDT applications, truck owners demand a greater variety of custom colors and advanced product technologies to enable custom designs. Our strong market position and growth are driven by our ability to provide customers with our market-leading brand, Imron
®
, as well as leveraging our global product lines, regional knowledge and service. Additionally, to capture further growth we are launching a new suite of products to meet our customers’ evolving needs.
Transportation Coatings Products and Brands
We develop and supply a complete coatings product line for light vehicle OEMs for the original coating of new vehicles. Products are designed to enhance the styling and appearance of a vehicle’s exterior while providing protection from the elements, extending the life of the vehicle. Widely recognized in the industry for our advanced and patented technologies, our products not only increase productivity and profitability for OEMs but also produce attractive and durable finishes. Our light vehicle coatings portfolio is one of the broadest in the industry.
The coatings operation is a critical component of the vehicle assembly process, requiring a high degree of precision and speed. The paint shop process typically includes a dip process, three application zones and three high-temperature ovens that cure each coating layer at temperatures ranging from 320°F to 400°F (
i.e.
, "high bake"). Our key products consist of the four main coatings layers: electrocoat, primer, basecoat and clearcoat.
The coatings process accounts for a majority of the total energy consumed during the vehicle manufacturing process. As a result, we have developed Harmonized Coating Technologies
TM
, including 3-Wet, Eco-Concept and 2-Wet Monocoat, that help our OEM customers lower costs by reducing energy consumption while increasing productivity.
OEMs are also increasingly looking to reduce the weight of vehicles in response to increasing vehicle emissions and fuel consumption regulations. As a result, OEMs are constructing vehicle platforms using a variety of new materials in addition to steel and plastic, including aluminum, carbon fiber and other substrates, each of which requires specialized coatings formulations to create a uniform color and finish. We continue to innovate with our OEM customers in driving this trend, as evidenced by use of our coatings on their flagship vehicle platforms.
We also develop and supply a wide array of coatings systems for a broad range of commercial applications including HDT, bus, rail and ACE. These products simultaneously enhance aesthetic appearance and provide protection from the elements. We meet the demands of commercial vehicle customers with our extensive offering of over 73,000 different colors. In the HDT market, because the metal and composite components are painted simultaneously in an automatic process, most truck OEMs use low bake coatings to ensure that the plastic composite parts on a truck’s exterior do not deform during the process. Truck owners demand a wide variety of custom colors that are formulated using a combination of on-site mixing machines at the OEM or direct shipments of premixed high volume colors from us. Our commercial vehicle brands include Imron, Imron ExcelPro, Imron Elite, Centari
®
, Rival
®
, Corlar
®
epoxy undercoats and AquaEC.
Transportation Coatings Sales, Marketing and Distribution
We have full-time technical representatives stationed at OEM facilities around the world. These on-site representatives provide customer support, monitor the painting process and track paint demand at each assembly plant. Monitoring OEM line performance in real-time allows our technical support teams to help improve paint department operating efficiency and provide performance feedback to our formulating chemists and paint manufacturing teams. Our customer technical support representatives also help OEMs manage their physical inventory by forecasting facility coatings demand based on the customer’s build schedule.
We sell and ship products directly to light vehicle OEM customers in each of our four regions coordinated via a global point of contact for each customer and assist OEMs with on-site customer support. Located in
13
countries, our manufacturing facilities provide a local presence that enables us to cultivate strong relationships, gain intimate customer knowledge, provide superior technical support to our key customers and maintain "just-in-time" product delivery capabilities critical to OEMs. Our local presence also allows us to quickly react to changing local dynamics, offer high-quality products and provide excellent customer service.
In the commercial vehicle end-market, we employ a dedicated sales and technical service team to support our diverse customer base, including a direct sales force supporting the HDT market. We ship our coatings directly to commercial vehicle OEMs and provide on-site technical service representatives that play an important role by helping optimize the painting process and by providing responsive customer support.
8
Transportation Coatings Customers
We provide our products to light and commercial vehicle customers at over
200
assembly plants worldwide, including nine of the top ten global automotive manufacturers. We have a stable customer base with several relationships dating back approximately 90 years and believe we are well positioned with the fastest growing OEMs in both the developed and emerging markets. Our top ten customers accounted for approximately 68% of our Transportation Coatings net sales during the year ended December 31, 2016.
Transportation Coatings Competition
We primarily compete against large multi-national suppliers such as PPG and BASF in the light and commercial vehicle end-markets. Additionally, we compete against certain regional players in Asia Pacific. With our state-of-the-art coatings solutions and local presence in key OEM markets, we are one of the few competitors in the industry that offers global manufacturers the combination of high-quality products, personalized, top-rate technical service and short lead-times for product delivery.
KEY RAW MATERIALS
We use thousands of different raw materials, which fall into seven broad categories: liquid resins, powder resins, pigments, solvents, monomers, isocyanates and additives. On average, our total raw material spend represents between 45% and 55% of our cost of sales. We purchase raw materials from a diverse group of suppliers, with our top ten suppliers representing approximately
30%
of our
2016
spending on raw materials.
Approximately
67%
of the raw materials we procure are derived from crude oil and natural gas. While prices for these raw materials fluctuate with energy prices, such fluctuations are mitigated by the fact that the majority of our raw materials are fourth to sixth generation derivatives of crude oil and natural gas. The dynamics of supply and demand play as important a role in our cost of raw materials as does the price of crude oil. Non-petrochemical based inputs such as minerals that are used to manufacture coating pigments are not significantly affected by volatility in crude oil prices.
Historically, to manage raw material volatility, we have used a combination of price increases to customers and, in limited circumstances, contractual raw material recovery mechanisms. Since 2001, our company's variable cost of sales have remained stable between
35%
and
42%
of net sales.
RESEARCH AND DEVELOPMENT
Our focus on technology has allowed us to proactively provide customers with next-generation offerings that enhance product performance, improve productivity and satisfy increasingly strict environmental regulations. Since our entry into the coatings industry over
150
years ago, we believe we have consistently been at the forefront of coatings technology innovation. These innovations have played a fundamental role in our ability to maintain and grow our global market share as well as deliver substantial financial returns.
We believe that we are a technology leader well positioned to benefit from continued industry shifts in customer needs. Our markets are amongst the most demanding in the coatings industry with high levels of product performance that continuously evolves, with increasing expectations for productivity on customer lines and with environmentally responsible products. Our technology development is led by a highly experienced and educated workforce that is focused on new product development, color development, technical customer support and improving our manufacturing processes. As such, our technology development covers two critical interrelated aspects for us, research and development as well as technical support and manufacturing. In total, as of
December 31, 2016
, we have approximately
1,300
employees dedicated to technology development. For the years ended
December 31, 2016
,
2015
and 2014, our total technology costs incurred were
$179.8 million
,
$169.0 million
and
$176.5 million
, respectively, of which research and development expenses comprised
$57.7 million
,
$51.6 million
and
$49.5 million
, respectively, with the balance recorded within selling, general and administrative expenses. We operate
four
major technology centers throughout the world where we develop and align our technology investments with regional business needs complemented by over 30 regional laboratories which provide local connection to our global customer base.
PATENTS, LICENSES AND TRADEMARKS
As of
December 31, 2016
, we had a portfolio of
643
issued patents and more than
365
trademarks. We actively apply for and obtain U.S. and foreign patents and trademarks on new products and process innovations and as of
December 31, 2016
,
183
patent applications were pending throughout the world.
Our primary purpose in obtaining patents is to protect the results of our research for use in operations and licensing. We are also party to a substantial number of patent licenses and other technology agreements. We have a substantial number of trademarks and trademark registrations in the United States and in other countries, as described below.
9
We own or otherwise have rights to the trademarks, service marks, copyrights and trade names used in conjunction with the marketing and sale of our products and services. These trademarks include Abcite
®
,
Alesta
®
, AquaEC
®
, Audurra
TM
, Centari
®
, Ceranamel
TM
, Challenger
TM
, Chemophan
TM
,
ColorNet
®
, Corlar
®
, Cromax
®
, Cromax Mosaic
®
, Durapon
TM
, Duxone
TM
, Harmonized Coating Technologies
TM
, Hydropon
TM
, Imron
®
, Imron Elite
TM
, Imron ExcelPro
TM
, Lutophen
TM
, Nap-Gard
®
, Nason
®
, Rival
®
, Spies Hecker
®
, Standox
®
, Stollaquid
TM
, Syntopal
TM
, Syrox
TM
, Vermeera
®
and Voltatex
®
,
which are protected under applicable intellectual property laws and are the property of us and our subsidiaries.
Although we consider that our patents, licenses and trademarks in the aggregate constitute a valuable asset, we do not regard our business as being materially dependent on any single or group of related patents, licenses or trademarks.
JOINT VENTURES
We are party to
12
joint ventures, six of which are focused on the industrial end-market. We are the majority shareholder, exercise control and fully consolidate all but three of our joint ventures. Our fully consolidated joint venture-related net sales were
$231.7 million
and
$204.5 million
for the years ended
December 31, 2016
and
2015
, respectively. See Part I, Item 1A, "Risk Factors—Risks Related to our Business—Risks Related to Other Aspects of our Business—Our joint ventures may not operate according to our business strategy if our joint venture partners fail to fulfill their obligations."
EMPLOYEES
As of
December 31, 2016
, we had approximately
13,000
employees located throughout the world consisting of sales, technical, manufacturing operations, supply chain and customer service personnel.
As of
December 31, 2016
, approximately
41%
of our employees globally were covered by organized labor agreements, including works councils, with fewer than
50
employees in the United States covered by organized labor agreements. We consider our employee relations to be good overall.
HEALTH, SAFETY AND ENVIRONMENTAL
At Axalta, we are committed to being good stewards of the environment by using natural resources efficiently to preserve and protect the communities in which we operate. We understand that industrial manufacturing processes can pose impacts to the environment and safety risks to our employees and others when not managed properly. As such, we are subject to various laws and regulations around the world which govern the protection of the environment and health and safety of our employees and neighboring communities, including the discharge of pollutants to air and water and the management and disposal of hazardous substances.
We build safety into the way we do business and are committed to operating safe and secure workplaces. Our program is structured on the foundation that every employee is engaged in and committed to improving operating practices. One of Axalta’s key objectives is the continued progress toward reducing employee injuries and illnesses worldwide. When health and safety instances do occur, we are committed to determining the root cause and eliminating the potential so that future incidents can be prevented. In 2016, Axalta’s injury and illness performance resulted in
0.34
OSHA Recordable Incident Rate, compared to the
1.2
OSHA Recordable Incident Rate for the General Chemical Industry (according to the US Bureau of Labor Statistics).
Our Environment, Health, Safety and Sustainability (EHS&S) Policy provides the foundation on which we develop, market, manufacture, and distribute products and services to our global customers. This policy is implemented through Axalta’s integrated EHS&S management system, which is our global program designed to ensure the compliance with applicable laws and regulations, internal standards for manufacturing, the management of potential risks and continuous improvement. We operate all of our manufacturing facilities using a common set of internal standards as part of our EHS&S management system, applicable for our business. These standards have been developed using a risk-based approach which will support the advancement of each site’s performance, while building capability and consistency across all levels of the organization. We believe that all of our manufacturing and distribution facilities are operated in compliance in all material respects to existing environmental requirements, including the operating permits required thereunder at our facilities.
Many of our manufacturing sites have a long history of industrial operations and cleanup is or may be required at a number of these locations. Although we are indemnified by DuPont for certain environmental liabilities and we do not expect outstanding cleanup obligations to have a material impact on our financial position, the ultimate cost of cleanup is subject to a number of variables and difficult to accurately predict. We may also incur significant additional costs as a result of contamination that is discovered and/or cleanup obligations that are imposed at these or other properties in the future.
In April of 2016, Axalta achieved a global, multi-site certification for RC14001. This certification incorporates the elements of the American Chemistry Council’s Responsible Care Program including product safety and compliance, process safety and security, as well as the ISO 14001 certification specifically related to our environmental stewardship program.
10
WHERE YOU CAN FIND MORE INFORMATION
Our website address is www.axaltacs.com. We post, and shareholders may access without charge, our recent filings and any amendments thereto of our annual reports on Form 10-K, quarterly reports on Form 10-Q and proxy statements as soon as reasonably practicable after such reports are filed with the Securities and Exchange Commission ("SEC"). We also post all financial press releases, including earnings releases, to our website. All other reports filed or furnished to the SEC on the SEC’s website, www.sec.gov, including current reports on Form 8-K, are available via direct link on our website. Reference to our and the SEC’s websites herein do not incorporate by reference any information contained on those websites and such information should not be considered part of this Form 10-K.
11
As a global manufacturer, marketer and distributor of high performance coatings systems, we operate in a business environment that includes risks. These risks are not unlike the risks we have faced in the recent past nor are they unlike risks faced by our competitors. If any of the events contemplated by the following discussion of risks should occur, our business, results of operations, financial condition and cash flows could suffer significantly. While the factors listed here are considered to be the more significant factors, they should not be considered to be a complete statement of all potential risks and uncertainties. Unlisted factors may present significant additional obstacles which may adversely affect our businesses and our results of operations.
Risks Related to our Business
Risks Related to Execution of our Strategic and Operating Plans
Our business performance is impacted by economic conditions and, particularly, by conditions in the light and commercial vehicle end-markets. Adverse developments in the global economy, in regional economies or in the light and commercial vehicle end-markets could adversely affect our business, financial condition and results of operations.
The growth of our business and demand for our products is affected by changes in the health of the overall global economy, regional economies and, in particular, the light and commercial vehicle end-markets. Our business is adversely affected by decreases in the general level of global economic activity, such as decreases in business and consumer spending, construction activity and industrial manufacturing. Economic developments affect businesses such as ours in a number of ways. For example, a tightening of credit in financial markets could adversely affect the ability of our customers and suppliers to obtain financing for significant purchases and operations, could result in a decrease in or cancellation of orders for our products and services and could impact the ability of our customers to make payments owed to us. Similarly, a tightening of credit in financial markets could adversely affect our supplier base and increase the potential for one or more of our suppliers to experience financial distress or bankruptcy.
Our financial position, results of operations and cash flows could be materially adversely affected by difficult economic conditions and/or significant volatility in the capital, credit and commodities markets.
Several of the end-markets we serve are cyclical, and macroeconomic and other factors beyond our control could reduce demand from these end-markets for our products, materially adversely affecting our business, financial condition and results of operations. Weak economic conditions could depress new car sales and/or production, reducing demand for our light vehicle OEM coatings and limit the growth of the car parc. These factors could, in turn, cause a related decline in demand for our automotive refinish coatings because, as the age of a vehicle increases, the propensity of car owners to pay for cosmetic repairs generally decreases. Also, during difficult economic times, car owners may refrain from seeking repairs for their damaged vehicles. Similarly, periods of reduced global economic activity could hinder global industrial output, which could decrease demand for our industrial and commercial coating products.
Our global business is adversely affected by decreases in the general level of economic activity, such as decreases in business and consumer spending, construction activity and industrial manufacturing. Disruptions in the United States, Europe or other economies, or weakening of emerging markets, such as Brazil or Venezuela, could adversely affect our sales, profitability and/or liquidity.
We may be unable to successfully execute on our growth initiatives, business strategies or operating plans.
We are executing on a number of growth initiatives, strategies and operating plans designed to enhance our business. For example, we are undertaking certain operational improvement initiatives with respect to realigning our manufacturing facilities in Europe and are growing our sales force in emerging markets and end-markets where we are underrepresented. The anticipated benefits from these efforts are based on several assumptions that may prove to be inaccurate. Moreover, we may not be able to successfully complete these growth initiatives, strategies and operating plans and realize all of the benefits, including growth targets and cost savings, we expect to achieve or it may be more costly to do so than we anticipate. A variety of risks could cause us not to realize some or all of the expected benefits. These risks include, among others, delays in the anticipated timing of activities related to such growth initiatives, strategies and operating plans; increased difficulty and cost in implementing these efforts; and the incurrence of other unexpected costs associated with operating the business. Further, our continued implementation of these programs may disrupt our operations and performance. As a result, we cannot assure you that we will realize these benefits. If, for any reason, the benefits we realize are less than our estimates or the implementation of these growth initiatives, strategies and operating plans adversely affect our operations or cost more or take longer to effectuate than we expect, or if our assumptions prove inaccurate, our results of operations may be materially adversely affected.
12
Increased competition may adversely affect our business, financial condition and results of operations.
We face substantial competition from many international, national, regional and local competitors of various sizes in the manufacturing, distribution and sale of our coatings and related products. Some of our competitors are larger than us and have greater financial resources than we do. Other competitors are smaller and may be able to offer more specialized products. We believe that technology, product quality, product innovation, breadth of product line, technical expertise, distribution, service, local presence and price are the key competitive factors for our business. Competition in any of these areas may reduce our net sales and adversely affect our earnings or cash flow by resulting in decreased sales volumes, reduced prices and increased costs of manufacturing, distributing and selling our products.
Weather conditions may reduce the demand for some of our products and could have a negative effect on our business, financial condition and results of operations.
From time to time, weather conditions have an adverse effect on our sales of coatings and related products. For example, unusually mild weather during winter months may lead to fewer vehicle collisions, reducing market demand for our refinish coatings. Conversely, harsh weather conditions can force our customers to reduce or suspend operations, thereby reducing the amount of products they purchase from us. Any such reductions in customer purchases could have a material adverse effect on our business, financial condition and results of operations.
Improved safety features on vehicles and insurance company influence may reduce the demand for some of our products and could have a negative effect on our business, financial condition and results of operations.
Vehicle manufacturers continue to develop new safety features such as collision avoidance technology and self-driving vehicles that may reduce vehicle collisions in the future, potentially negatively impacting demand for our refinish coatings. In addition, insurance companies may influence vehicle owners to use body shops that do not use our products, which could also potentially negatively impact demand for our refinish coatings. Any resulting reduction in demand for our refinish coatings could have a material adverse effect on our business, financial condition and results of operations.
The loss of any of our largest customers or the consolidation of MSOs, distributors and/or body shops could adversely affect our business, financial condition and results of operations.
We have some customers that purchase a large amount of products from us and we are also reliant on distributors to assist us in selling our products. Our largest single customer accounted for approximately 7.5% of our 2016 net sales and our largest distributor accounted for approximately 4.7% of our 2016 net sales. Consolidation of any of our customers, including MSOs, distributors and body shops, could decrease our customer base and impact our results of operations if the resulting business chooses to use one of our competitors for the consolidated business. The loss of any of our large customers or distributors, as a result of changes in business conditions, product requirements, consolidation or otherwise, could have a material adverse effect on our business, financial condition and results of operations.
We rely on our distributor network and third-party delivery services for the distribution and export of certain of our products. A significant disruption in these services or significant increases in prices for those services may disrupt our ability to export material or increase our costs.
We ship a significant portion of our products to our customers through our distributor network as well as independent third-party delivery companies. If any of our key distributors or third-party delivery providers experiences a significant disruption such that our products cannot be delivered in a timely fashion or such that we incur additional shipping costs that we could not pass on to our customers, our costs may increase and our relationships with certain of our customers may be adversely affected. In addition, if our distributors or third-party delivery providers increase prices and we are not able to pass along these increases to customers, find comparable alternatives or adjust our delivery network, our business, financial condition and results of operations could be adversely affected.
We take on credit risk exposure from our customers in the ordinary course of our business.
We routinely offer customers pre-bates, loans and other financial incentives to purchase our products. These arrangements generally obligate the customer to purchase products from us and/or repay us for products over time. In the event that a customer is unwilling or unable to fulfill its obligations under these arrangements, we may incur a financial loss. In addition, in the ordinary course of our business, we guarantee certain of our customers’ obligations to third parties. Any default by our customers on their obligations could force us to make payments to the applicable creditor. It is possible that customer defaults on obligations owed to us and on third-party obligations that we have guaranteed could be significant, which could have a material adverse effect on our business, financial condition and results of operations.
13
Price increases or interruptions in the supply of raw materials could have a significant impact on our ability to grow or sustain earnings.
Our manufacturing processes consume significant amounts of raw materials, the costs of which are subject to worldwide supply and demand as well as other factors beyond our control. We use a significant amount of raw materials derived from crude oil and natural gas. As a result, volatile oil and gas prices can cause significant variations in our raw materials costs, affecting our operating results. In rising raw material price environments, we may be unable to pass along these increased costs to our customers. In declining raw material price environments, customers may seek price concessions from us greater than any raw material cost savings we realize. If we are not able to fully offset the effects of higher raw materials costs, or if customers demand greater raw material price concessions than we obtain in low raw material cost environments, our financial results could deteriorate. In addition to the risks associated with raw materials prices, supplier capacity constraints, supplier production disruptions or the unavailability of certain raw materials could result in supply imbalances that may have a material adverse effect on our business, financial condition and results of operations.
Failure to develop and market new products and manage product life cycles could impact our competitive position and have a material adverse effect on our business, financial condition and results of operations.
Our operating results are largely dependent on our development and management of our portfolio of current, new and developing products and services as well as our ability to bring those products and services to market. We plan to grow our business by focusing on developing and marketing our solutions to meet increasing demand for productivity. Our ability to execute this strategy and our other growth plans successfully could be adversely affected by difficulties or delays in product development, such as the inability to identify viable new products, successfully complete research and development, obtain relevant regulatory approvals, effectively manage our manufacturing process or costs, obtain intellectual property protection, or gain market acceptance of new products and services. Because of the lengthy and costly development process, technological challenges and intense competition, we cannot assure you that any of the products we are currently developing, or that we may develop in the future, will achieve substantial commercial success. For example, in addition to developing technologically advanced products, commercial success of those products will depend on customer acceptance and implementation of those products. A failure to develop commercially successful products or to develop additional uses for existing products could materially adversely affect our business, financial results or results of operations. Further, sales of our new products could replace sales of some of our current products, offsetting the benefit of even a successful product introduction.
Our business, financial condition and results of operations could be adversely impacted by business disruptions and security threats.
Business disruptions, including supply disruptions, increasing costs for energy, temporary plant and/or power outages could harm our operations as well as the operations of our customers, distributors or suppliers. We face security threats and risks of security breaches to our facilities. Although it is impossible to predict the occurrence or consequences of business disruptions or security threats, they could harm our reputation, subject us to material liabilities, result in reduced demand for our products, make it difficult or impossible for us to deliver products to our customers or distributors or to receive raw materials from suppliers and create delays and inefficiencies in our supply chain.
Our information technology systems are subject to cyber security risks.
We rely on information technology systems to conduct business. Information security risks have generally increased in recent years because of the proliferation of new technologies and the increased sophistication and activities of cyber attackers. In addition, by utilizing third parties to perform certain business and administrative functions, we may be exposed to greater risk of data security breaches. Targeted attacks on our systems (or on systems of third parties that we rely on), failure or non-availability of a key information technology system or a breach in our security measures could result in theft, misuse, modification and destruction of information, including trade secrets and confidential business information, and cause business disruptions, reputational damage and third-party claims, any of which could have a material adverse effect on our business, financial condition or results of operations. While we have designed and implemented controls to restrict access to our data and information technology infrastructure, it is still vulnerable to unauthorized access through cyber attacks, theft and other security breaches, and these measures may not be adequate to ensure that our operations will not be disrupted, should such an event occur.
Our ability to conduct our business might be negatively impacted if we experience difficulties with outsourcing and similar third-party relationships.
We outsource certain business and administrative functions and rely on third parties to perform certain services on our behalf. We may do so increasingly in the future. If we fail to develop and implement our outsourcing strategies, such strategies prove to be ineffective or fail to provide expected cost savings, or our third party providers fail to perform as anticipated, we may experience operational difficulties, increased costs, reputational damage and a loss of business that may have a material adverse effect on our business, financial condition and results of operations.
14
Risks Related to our Global Operations
As a global business, we are subject to risks associated with our non-U.S. operations that are not present in the United States.
We conduct our business on a global basis, with approximately 70% of our 2016 net sales occurring outside the United States. We anticipate that international sales will continue to represent a substantial portion of our net sales and that our strategy for continued growth and profitability will entail further international expansion, particularly in emerging markets. Changes in local and regional economic conditions could affect product demand in our non-U.S. operations. Specifically, our financial results could be affected by changes in trade, monetary and fiscal policies, laws and regulations, or other activities of U.S. and non-U.S. governments, agencies and similar organizations. These conditions include, but are not limited to, changes in a country’s or region’s social, economic or political conditions, trade regulations affecting production, pricing and marketing of products, local labor conditions and regulations, reduced protection of intellectual property rights in some countries, changes in the regulatory or legal environment, restrictions on currency exchange activities, burdensome taxes and tariffs and other trade barriers, as well as the imposition of economic or other trade sanctions, each of which could impact our ability to do business in certain jurisdictions or with certain persons. For example, if the U.S. withdraws from or engages in renegotiation of trade agreements such as the North American Free Trade Agreement and the Trans-Pacific Partnership, or more aggressively prosecutes trade disputes with countries like China, our ability to do business and execute our growth strategies could be adversely affected. Our international operations also present risks associated with terrorism, political hostilities, war and other civil disturbances, the occurrence of which could lead to reduced net sales and profitability. Our international sales and operations are also sensitive to changes in foreign national priorities, including government budgets.
Our day-to-day operations outside the United States are subject to cultural and language barriers and the need to adopt different business practices in different geographic areas. In addition, we are required to create compensation programs, employment policies and other administrative programs that comply with the laws of multiple countries. We also must communicate and monitor standards and directives across our global operations. Our failure to successfully manage our geographically diverse operations could impair our ability to react quickly to changing business and market conditions and to enforce compliance with non-U.S. standards and procedures.
Any payment of distributions, loans or advances to and from our subsidiaries could be subject to restrictions on or taxation of, dividends or repatriation of earnings under applicable local law, monetary transfer restrictions, foreign currency exchange regulations in the jurisdictions in which our subsidiaries operate or other restrictions imposed by current or future agreements, including debt instruments, to which our non-U.S. subsidiaries may be a party. In particular, our operations in Brazil, China, India and Venezuela where we maintain local currency cash balances are subject to import authorization or pricing controls.
Social, political and economic conditions in Venezuela may continue to materially adversely affect our business, financial condition and results of operations.
We conduct operations in Venezuela through our Venezuelan subsidiary. Our operations in Venezuela continue to be subject to the risks associated with the volatility in economic conditions caused by the weakening of the Venezuelan bolivar and general uncertainty in the political environment. From December 31, 2014 through June 30, 2015, we used the Complementary System of Foreign Currency Administration (SICAD) rate of 12.0 Venezuelan bolivars to 1.0 U.S. dollar. At June 30, 2015, we changed the exchange rate we used to remeasure our Venezuelan bolivars from the SICAD rate to the Marginal Foreign Exchange System (SIMADI) rate of 197.7 Venezuelan bolivars to 1.0 U.S. dollar.
In March 2016, the Venezuelan government enacted additional changes to its foreign currency exchange regime. The changes resulted in a reduction of its three-tiered exchange rate system to two tiers by eliminating the SICAD rate. The changes also devalued the official DIPRO rate (formerly CENCOEX), to 10.0 Venezuelan bolivars to 1.0 U.S. dollar from 6.3 Venezuelan bolivars to 1.0 U.S. dollar, while also creating a replacement floating supplementary market exchange rate, DICOM, which fully replaced SIMADI. DICOM is intended to provide limited access to a free market rate of exchange. At December 31, 2016, DIPRO remained at 10.0 Venezuelan bolivars to 1.0 U.S. dollar and the exchange rate for DICOM was
673.8
Venezuelan bolivars to 1.0 U.S. dollar.
As of and for the year ended December 31, 2016, approximately 1% of our consolidated net revenues and approximately 3% of our consolidated net assets are derived from our Venezuelan subsidiary, while less than 1% of our consolidated cash and cash equivalents are held in local Venezuelan currency by our Venezuelan subsidiary.
As a result of the continued economic uncertainty and the general deterioration in the economy, as well as various other triggering events identified during the fourth quarter 2016, we recognized an impairment charge of $57.9 million on the long-lived assets of our Venezuela subsidiary for the year ended December 31, 2016.
15
Any further volatility in economic conditions in Venezuela caused by general uncertainty in the political environment, change in the currency exchange mechanisms or fluctuation of the SIMADI rate, which may vary in the future, could adversely affect our financial position resulting in additional potential impairments or devaluation of our assets and liabilities. These events could result in a material unfavorable impact to our results of operations and financial condition, both for any period in which we determine to remeasure using another rate and on a going forward basis following any such devaluation.
Our results of operations and/or financial condition could be adversely impacted, possibly materially, if we are unable to successfully manage these and other risks of international operations in a volatile environment.
See further discussion in Note 26 to our consolidated financial statements included elsewhere in this Annual Report on Form 10-K.
Currency risk may adversely affect our financial condition and cash flows.
We derive a significant portion of our net sales from outside the United States and conduct our business and incur costs in the local currency of most countries in which we operate. Because our financial statements are presented in U.S. dollars, we must translate our financial results as well as assets and liabilities into U.S. dollars for financial statement reporting purposes at exchange rates in effect during or at the end of each reporting period, as applicable. Therefore, increases or decreases in the value of the U.S. dollar against other currencies in countries where we operate will affect our results of operations and the value of balance sheet items denominated in foreign currencies. In particular, we are exposed to the Euro, the Brazilian real, the Chinese yuan, the Venezuelan bolívar, the British pound, the Mexican peso and the Russian ruble. For example, unfavorable movement in the Euro negatively impacted our results of operations in recent periods and a further decline of the Euro could affect future periods. Furthermore, many of our local businesses import or buy raw materials in a currency other than their functional currency, which can impact the operating results for these operations if we are unable to mitigate the impact of the currency exchange fluctuations. We cannot accurately predict the effects of exchange rate fluctuations upon our future operating results because of the number of currencies involved, the variability of currency exposures and the potential volatility of currency exchange rates. Accordingly, fluctuations in foreign exchange rates may have an adverse effect on our financial condition and cash flows.
Terrorist acts, conflicts, wars and natural disasters may materially adversely affect our business, financial condition and results of operations.
As a multinational company with a large international footprint, we are subject to increased risk of damage or disruption to us, our employees, facilities, partners, suppliers, distributors, resellers or customers due to terrorist acts, conflicts, wars, adverse weather conditions, natural disasters, power outages, pandemics or other public health crises and environmental incidents, wherever located around the world. The potential for future terrorist attacks and natural disasters, the national and international responses to terrorist attacks and natural disasters or perceived threats to national security and other actual or potential conflicts or wars may create economic and political uncertainties. In addition, as a multinational company with headquarters and significant operations located in the United States, actions against or by the United States could result in a decrease in demand for our products, make it difficult or impossible to deliver products to our customers or to receive components from our suppliers, create delays and inefficiencies in our supply chain and pose risks to our employees, resulting in the need to impose travel restrictions. A catastrophic loss of the use of all or a portion of one of our key manufacturing facilities due to accident, labor issues, weather conditions, acts of war, political unrest, geopolitical risk, terrorist activity, natural disaster or otherwise, whether short- or long-term, and any interruption in production capability could require us to make substantial capital expenditures to remedy the situation, which could negatively affect our business, financial condition and results of operations.
16
The results of the United Kingdom’s referendum on withdrawal from the European Union may have a negative effect on global economic conditions, financial markets and our business.
In June 2016, a majority of voters in the United Kingdom elected to withdraw from the European Union in a national referendum. The referendum was advisory, and the terms of any withdrawal are subject to a negotiation period that could last at least two years after the government of the United Kingdom formally initiates a withdrawal process. Nevertheless, the referendum has created significant uncertainty about the future relationship between the United Kingdom and the European Union, including with respect to the laws and regulations that will apply as the United Kingdom determines which European Union laws to replace or replicate in the event of a withdrawal. The referendum has also given rise to calls for the governments of other European Union member states to consider withdrawal. We have substantial R&D and manufacturing operations in Europe and a significant portion of our business involves cross border transactions throughout the region. We cannot predict how the British referendum or similar votes by other European Union member states will impact our operations and business. In addition, these developments, or the perception that any of them could occur, have caused and may continue to cause significant volatility in the global financial markets as well as business conditions in Europe and beyond. This volatility may significantly reduce global market liquidity and restrict the ability of key market participants to operate in certain financial markets. Any of these factors could depress economic activity and restrict our access to capital, which could have a material adverse effect on our business, financial condition and results of operations and reduce the price of our common shares.
Risks Related to Legal and Regulatory Compliance and Litigation
Our failure to comply with the anti-corruption laws of the United States and various international jurisdictions could negatively impact our reputation and results of operations.
Doing business on a global basis requires us to comply with the laws and regulations of the U.S. government and those of various international and sub-national jurisdictions, and our failure to successfully comply with these rules and regulations may expose us to liabilities. These laws and regulations apply to companies, individual directors, officers, employees and agents, and may restrict our operations, trade practices, investment decisions and partnering activities. In particular, our international operations are subject to U.S. and foreign anti-corruption laws and regulations, such as the U.S. Foreign Corrupt Practices Act (the "FCPA"), the United Kingdom Bribery Act 2010 (the "Bribery Act") as well as anti-corruption laws of the various jurisdictions in which we operate. The FCPA, the Bribery Act and other laws prohibit us and our officers, directors, employees and agents acting on our behalf from corruptly offering, promising, authorizing or providing anything of value to foreign officials for the purposes of influencing official decisions or obtaining or retaining business or otherwise obtaining favorable treatment. As part of our business, we deal with state-owned business enterprises, the employees and representatives of which may be considered foreign officials for purposes of the FCPA or the Bribery Act. We are subject to the jurisdiction of various governments and regulatory agencies outside of the United States, which may bring our personnel into contact with foreign officials responsible for issuing or renewing permits, licenses or approvals or for enforcing other governmental regulations. In addition, some of the international locations in which we operate lack a developed legal system and have elevated levels of corruption. Our global operations expose us to the risk of violating, or being accused of violating, the foregoing or other anti-corruption laws. Such violations could be punishable by criminal fines, imprisonment, civil penalties, disgorgement of profits, injunctions and exclusion from government contracts, as well as other remedial measures. Investigations of alleged violations can be very expensive, disruptive and damaging to our reputation. Although we have implemented anti-corruption policies and procedures and introduced training since becoming an independent company, there can be no guarantee that these policies, procedures and training will effectively prevent violations by our employees or representatives in the future. Additionally, we face a risk that our distributors and other business partners may violate the FCPA, the Bribery Act or similar laws or regulations. Such violations could expose us to FCPA and Bribery Act liability and/or our reputation may potentially be harmed by their violations and resulting sanctions and fines.
Our international operations require us to comply with anti-terrorism laws and regulations and applicable trade embargoes.
We are subject to trade and economic sanctions laws and other restrictions on international trade. The U.S. and other governments and their agencies impose sanctions and embargoes on certain countries, their governments and designated parties. In the United States, the economic and trade sanctions programs are principally administered and enforced by the U.S. Treasury Department’s Office of Foreign Assets Control. If we fail to comply with these laws, we could be subject to civil or criminal penalties, other remedial measures and legal expenses, which could adversely affect our business, financial condition and results of operations. Although we have implemented trade-related policies and procedures and introduced training since becoming an independent company, we cannot assure you that such policies, procedures and training will effectively prevent violations in the future, particularly as the scope of certain laws may be unclear and may be subject to changing interpretations.
17
We cannot predict the nature, scope or effect of future regulatory requirements to which our international sales and manufacturing operations might be subject or the manner in which existing laws might be administered or interpreted. Future regulations could limit the countries in which some of our products may be manufactured or sold, or could restrict our access to, or increase the cost of obtaining, products from foreign sources. The occurrence of any of the foregoing could have a material adverse effect on our business, financial condition and results of operations.
We are subject to complex and evolving data privacy laws.
Our business is subject to complex and evolving U.S. and foreign laws and regulations regarding privacy, data protection and other matters. We could be liable for loss or misuse of our customers’ personal information and/or our employee’s personally-identifiable information if we fail to prevent or mitigate such misuse or breach. Although we have developed systems and processes that are designed to protect customer and employee information and prevent misuse of such information and other security breaches, failure to prevent or mitigate such misuse or breaches may affect our reputation and operating results negatively and may require significant management time and attention.
As a result of our current and past operations and/or products, including operations and/or products related to our businesses prior to the Acquisition, we could incur significant environmental liabilities and costs.
We are subject to various laws and regulations around the world governing the protection of the environment and health and safety, including the discharge of pollutants to air and water and the management and disposal of hazardous substances. These laws and regulations not only govern our current operations and products, but also impose potential liability on us for our or our predecessors’ past operations. We could incur fines, penalties and other sanctions as a result of violations of such laws and regulations. In addition, as a result of our operations and/or products, including our past operations and/or products related to our businesses prior to the Acquisition, we could incur substantial costs, including costs relating to remediation and restoration activities and third-party claims for property damage or personal injury. The ultimate costs under environmental laws and the timing of these costs are difficult to accurately predict. Our accruals for costs and liabilities at sites where contamination is being investigated or remediated may not be adequate because the estimates on which the accruals are based depend on a number of factors including the nature of the matter, the complexity of the site, site geology, the nature and extent of contamination, the type of remedy, the outcome of discussions with regulatory agencies and, at multi-party sites, other Potentially Responsible Parties ("PRPs") and the number and financial viability of other PRPs. Additional contamination may also be identified, and/or additional cleanup obligations may be incurred, at these or other sites in the future. For example, periodic monitoring or investigation activities are ongoing at a number of our sites where contaminants have been detected or are suspected, and we may incur additional costs if more active or extensive remediation is required. In addition, in connection with the Acquisition, DuPont has, subject to certain exceptions and exclusions, agreed to indemnify us for certain liabilities relating to environmental remediation obligations and certain claims relating to the exposure to hazardous substances and products manufactured prior to our separation from DuPont. We could incur material additional costs if DuPont fails to meet its obligations, if the indemnification proves insufficient or if we otherwise are unable to recover costs associated with such liabilities. The costs of our current operations complying with complex environmental laws and regulations, as well as internal voluntary programs, are significant and will continue to be so for the foreseeable future as environmental regulations become more stringent. These laws and regulations also change frequently, and we may incur additional costs complying with stricter environmental requirements that are promulgated in the future. Concerns over global climate change as well as more frequent and severe weather events have also promoted a number of legal and regulatory measures as well as social initiatives intended to reduce greenhouse gas and other carbon emissions. We cannot predict the impact that changing climate conditions or more frequent and severe weather events, if any, will have on our business, results of operations or financial condition. Moreover, we cannot predict how legal, regulatory and social responses to concerns about global climate change will impact our business.
As a producer of coatings, we transport certain materials that are inherently hazardous due to their toxic nature.
In our business, we handle and transport hazardous materials. If mishandled or released into the environment, these materials could cause substantial property damage or personal injuries resulting in significant legal claims against us. In addition, evolving regulations concerning the handling and transportation of certain materials could result in increased future capital or operating costs.
18
Our results of operations could be adversely affected by litigation.
We face risks arising from various litigation matters that have been asserted against us or that may be asserted against us in the future, including, but not limited to, claims for product liability, patent and trademark infringement, antitrust, warranty, contract and third party property damage or personal injury. For instance, we have noted a nationwide trend in purported class actions against chemical manufacturers generally seeking relief such as medical monitoring, property damages, off-site remediation and punitive damages arising from alleged environmental torts without claiming present personal injuries. We have also noted a trend in public and private nuisance suits being filed on behalf of states, counties, cities and utilities alleging harm to the general public. In addition, various factors or developments can lead to changes in current estimates of liabilities such as a final adverse judgment, significant settlement or changes in applicable law. A future adverse ruling or unfavorable development could result in future charges that could have a material adverse effect on us. An adverse outcome in any one or more of these matters could be material to our business, financial condition and results of operations. In particular, product liability claims, regardless of their merits, could be costly, divert management’s attention and adversely affect our reputation and demand for our products.
Risks Related to Human Resources
We may not be able to recruit and retain the experienced and skilled personnel we need to compete.
Our future success depends on our ability to attract, retain, develop and motivate highly skilled personnel. We must have talented personnel to succeed and competition for senior management in our industry is intense. Our ability to meet our performance goals depends upon the personal efforts and abilities of the principal members of our senior management who provide strategic direction, develop our business, manage our operations and maintain a cohesive and stable work environment. We cannot assure you that we will retain or successfully recruit senior executives, or that their services will remain available to us.
We rely on qualified managers and skilled employees, such as scientists, with technical and manufacturing industry experience in order to operate our business successfully. From time to time, there may be a shortage of skilled labor, which may make it more difficult and expensive for us to attract and retain qualified employees. If we are unable to attract and retain sufficient numbers of qualified individuals or our costs to do so increase significantly, our operations could be materially adversely affected.
If we are required to make unexpected payments to any pension plans applicable to our employees, our financial condition may be adversely affected.
We have defined benefit pension plans in which many of our current and former employees outside the United States participate or have participated. Many of these plans are underfunded or unfunded and the liabilities in relation to these plans will need to be satisfied as they mature from our operating reserves. In jurisdictions where the defined benefit pension plans are intended to be funded with assets in a trust or other funding vehicle, the liabilities exceed the corresponding assets in many of the plans. Various factors, such as changes in actuarial estimates and assumptions (including as to life expectancy, discount rates and rate of return on assets) as well as actual return on assets, can increase the expenses and liabilities of the defined benefit pension plans. The assets and liabilities of the plans must be valued from time to time under applicable funding rules and as a result we may be required to increase the cash payments we make in relation to these defined benefit pension plans.
Our financial condition and results of operations may be adversely affected to the extent that we are required to make any additional payments to any relevant defined benefit pension plans in excess of the amounts assumed in our current projections and assumptions or report higher pension plan expenses under relevant accounting rules.
We are subject to work stoppages, union negotiations, labor disputes and other matters associated with our labor force, which may adversely impact our operations and cause us to incur incremental costs.
Many of our employees globally are in unions or otherwise covered by labor agreements, including works councils. As of
December 31, 2016
, approximately 0.4% of our U.S. workforce was unionized and approximately 77% of our workforce outside the United States was unionized or otherwise covered by labor agreements. Consequently, we may be subject to potential union campaigns, work stoppages, union negotiations and other potential labor disputes. Additionally, negotiations with unions or works councils in connection with existing labor agreements may result in significant increases in our cost of labor, divert management’s attention away from operating our business or break down and result in the disruption of our operations. The occurrence of any of the preceding outcomes could impair our ability to manufacture our products and result in increased costs and/or decreased operating results. Further, we may be impacted by work stoppages at our suppliers or customers that are beyond our control.
19
Risks Related to Intellectual Property
Our inability to protect and enforce our intellectual property rights could adversely affect our financial results.
Intellectual property rights both in the United States and in foreign countries, including patents, trade secrets, confidential information, trademarks and trade names, are important to our business and will be critical to our ability to grow and succeed in the future. We make strategic decisions on whether to apply for intellectual property protection and what kind of protection to pursue based on a cost benefit analysis. While we endeavor to protect our intellectual property rights in certain jurisdictions in which our products are produced or used and in jurisdictions into which our products are imported, the decision to file for intellectual property protection is made on a case-by-case basis. Because of the differences in foreign trademark, patent and other laws concerning proprietary rights, our intellectual property rights may not receive the same degree of protection in foreign countries as they would in the United States. Our failure to obtain or maintain adequate protection of our intellectual property rights for any reason could have a material adverse effect on our business, financial condition and results of operations.
We have applied for patent protection relating to certain existing and proposed products, processes and services in certain jurisdictions. While we generally consider applying for patents in those countries where we intend to make, have made, use or sell patented products, we may not accurately assess all of the countries where patent protection will ultimately be desirable. If we fail to timely file a patent application in any such country, we may be precluded from doing so at a later date. Furthermore, we cannot assure you that our pending patent applications will not be challenged by third parties or that such applications will eventually be issued by the applicable patent offices as patents. We also cannot assure you that the patents issued as a result of our foreign patent applications will have the same scope of coverage as our U.S. patents. It is possible that only a limited number of the pending patent applications will result in issued patents, which may have a materially adverse effect on our business and results of operations.
The patents we own could be challenged, invalidated or circumvented by others and may not be of sufficient scope or strength to provide us with any meaningful protection or commercial advantage. Furthermore, our existing patents are subject to challenges from third parties that may result in invalidations and will all eventually expire, after which we will not be able to prevent our competitors from using our previously patented technologies, which could materially adversely affect our competitive advantage stemming from those products and technologies. We also cannot assure you that competitors will not infringe our patents, or that we will have adequate resources to enforce our patents.
We also rely on unpatented proprietary technology. It is possible that others will independently develop the same or similar technology or otherwise obtain access to our unpatented technology. To protect our trade secrets and other proprietary information, we require certain employees, consultants, advisors and collaborators to enter into confidentiality agreements as we deem appropriate. We cannot assure you that we will be able to enter into these confidentiality agreements or that these agreements will provide meaningful protection for our trade secrets, know-how or other proprietary information in the event of any unauthorized use, misappropriation or disclosure of such trade secrets, know-how or other proprietary information. If we are unable to maintain the proprietary nature of our technologies, we could be materially adversely affected.
We rely on our trademarks, trade names and brand names to distinguish our products from the products of our competitors, and have registered or applied to register many of these trademarks. We cannot assure you that our trademark applications will be approved. Third parties may also oppose our trademark applications, or otherwise challenge our use of the trademarks. In the event that our trademarks are successfully challenged, we could be forced to rebrand our products, which could result in loss of brand recognition, and could require us to devote resources to advertising and marketing new brands. Further, we cannot assure you that competitors will not infringe our trademarks, or that we will have adequate resources to enforce our trademarks. We also license third parties to use our trademarks. In an effort to preserve our trademark rights, we enter into license agreements with these third parties that govern the use of our trademarks and contain limitations on their use. Although we make efforts to police the use of our trademarks by our licensees, we cannot assure you that these efforts will be sufficient to ensure that our licensees abide by the terms of their licenses. In the event that our licensees fail to do so, our trademark rights could be diluted.
If we are sued for infringing intellectual property rights of third parties, it may be costly and time consuming, and an unfavorable outcome in any litigation could harm our business.
We cannot assure you that our activities will not, unintentionally or otherwise, infringe on the patents, trademarks or other intellectual property rights owned by others. We may spend significant time and effort and incur significant litigation costs if we are required to defend ourselves against intellectual property rights claims brought against us, regardless of whether the claims have merit. If we are found to have infringed on the patents, trademarks or other intellectual property rights of others, we may be subject to substantial claims for damages, which could materially impact our cash flow, business, financial condition and results of operations. We may also be required to cease development, use or sale of the relevant products or processes, or we may be required to obtain a license on the disputed rights, which may not be available on commercially reasonable terms, if at all.
20
Risks Related to Other Aspects of our Business
We may continue to engage in acquisitions and divestitures, and may encounter difficulties integrating acquired businesses with, or disposing of divested businesses from, our current operations and, as a result, we may not realize the anticipated benefits of these acquisitions and divestitures.
We may continue to seek to grow through strategic acquisitions, joint ventures or other arrangements. Our due diligence reviews in these transactions may not identify all of the material issues necessary to accurately estimate the cost or potential loss contingencies with respect to a particular transaction, including potential exposure to regulatory sanctions resulting from a counterparty’s previous activities. We may incur unanticipated costs or expenses, including post-closing asset impairment charges, expenses associated with eliminating duplicate facilities, litigation and other liabilities. We may also face regulatory scrutiny as a result of perceived concentration in certain markets, which could cause additional delay or prevent us from completing certain acquisitions that would be beneficial to our business. We may also encounter difficulties in integrating acquisitions with our operations, applying our internal controls processes to these acquisitions or in managing strategic investments. Additionally, we may not achieve the benefits we anticipate when we first enter into a transaction in the amount or timeframe anticipated. Any of the foregoing could adversely affect our business and results of operations. In addition, accounting requirements relating to business combinations, including the requirement to expense certain acquisition costs as incurred, may cause us to experience greater earnings volatility and generally lower earnings during periods in which we acquire new businesses. Furthermore, we may make strategic divestitures from time to time. These divestitures may result in continued financial involvement in the divested businesses, such as through indemnities, guarantees or other financial arrangements. These arrangements could result in financial obligations imposed upon us and could affect our future financial condition and results of operations. Acquisitions and divestitures may also require us to devote significant internal resources and could divert management's attention away from operating our business.
Our joint ventures may not operate according to our business strategy if our joint venture partners fail to fulfill their obligations.
As part of our business, we have entered into certain joint venture arrangements, and may enter into additional joint venture arrangements in the future. The nature of a joint venture requires us to share control over significant decisions with unaffiliated third parties. Since we may not exercise control over our current or future joint ventures, we may not be able to require our joint ventures to take actions that we believe are necessary to implement our business strategy. Additionally, differences in views among joint venture participants may result in delayed decisions or failures to agree on major issues. If these differences cause the joint ventures to deviate from our business strategy, our results of operations could be materially adversely affected.
The insurance we maintain may not fully cover all potential exposures.
Our product liability, property, business interruption and casualty insurance coverages may not cover all risks associated with the operation of our business and may not be sufficient to offset the costs of any losses, lost sales or increased costs experienced during business interruptions. For some risks, we may elect not to obtain insurance. As a result of market conditions, premiums and deductibles for certain insurance policies can increase substantially and, in some instances, certain insurance policies may become unavailable or available only for reduced amounts of coverage. As a result, we may not be able to renew our insurance policies or procure other desirable insurance on commercially reasonable terms, if at all. Losses and liabilities from uninsured or underinsured events and delay in the payment of insurance proceeds could have a material adverse effect on our business, financial condition and results of operations.
We may need to recognize impairment charges related to goodwill, identifiable intangible assets and fixed assets.
Under the acquisition method of accounting, the net assets acquired were recorded at fair value as of the date of the Acquisition, with any excess purchase price allocated to goodwill. The Acquisition resulted in significant balances of goodwill and identifiable intangible assets. We are required to test goodwill and any other intangible asset with an indefinite life for possible impairment on the same date each year, unless conditions exist that would require a more frequent evaluation. We are also required to evaluate amortizable intangible assets and fixed assets for impairment if there are indicators of a possible impairment.
There is significant judgment required in the analysis of a potential impairment of goodwill, identified intangible assets and fixed assets. If, as a result of a general economic slowdown, deterioration in one or more of the markets in which we operate or impairment in our financial performance and/or future outlook, the estimated fair value of our long-lived assets decreases, we may determine that one or more of our long-lived assets is impaired. An impairment charge would be determined based on the estimated fair value of the assets and any such impairment charge could have a material adverse effect on our results of operations and financial position.
21
Our Predecessor financial information may not be comparable to the Successor financial information.
Our Predecessor financial information may not reflect what our results of operations and cash flows would have been had we been a separate, standalone entity during those periods and may not be indicative of what our results of operations and cash flows will be in the future. As a result, you have limited information on which to evaluate our business. This is primarily because:
|
•
|
Our Predecessor combined financial information has been derived from the financial statements and accounting records of DuPont and reflects assumptions made by DuPont. Those assumptions and allocations may be different from the comparable expenses we would have incurred as a standalone company;
|
|
•
|
Certain general corporate expenses were historically allocated to the Predecessor period by DuPont that, while reasonable, may not be indicative of the actual expenses that would have been incurred had we been operating as a standalone company, nor are they indicative of the costs that will be incurred in the future as a standalone company;
|
|
•
|
Our working capital requirements historically were satisfied as part of DuPont’s corporate-wide cash management policies. Since becoming a standalone company, we no longer rely on DuPont for working capital. In connection with the Acquisition, we incurred a large amount of indebtedness and will therefore assume significant debt service costs. As a result, our cost of debt and capitalization is significantly different from that reflected in the Predecessor financial information; and
|
|
•
|
Following the Acquisition, we have experienced increases in our costs, including the cost to establish an appropriate accounting and reporting system, debt service obligations, providing healthcare and other costs of being a standalone company.
|
DuPont’s potential breach of its obligations in connection with the Acquisition, including failure to comply with its indemnification obligations, may materially affect our business and operating results.
Although the Acquisition closed on February 1, 2013, DuPont still has performance obligations to us, including fulfilling indemnification requirements. We could incur material additional costs if DuPont fails to meet its obligations or if we otherwise are unable to recover costs associated with such liabilities.
We could be subject to changes in our tax rates and the adoption of tax legislation or exposure to additional tax liabilities that may adversely affect our results of operations.
We are subject to taxes in the U.S. and non-U.S. jurisdictions where our subsidiaries are organized. Due to economic and political conditions, tax rates in various jurisdictions may be subject to significant change. Our future effective tax rates could be affected by changes in the mix of earnings in countries with differing statutory tax rates, changes in the valuation of deferred tax assets and liabilities, and changes in tax laws or their interpretation, such as interpretations as to the legality of tax advantages granted under the European Union ("EU") state aid rules. Our tax returns and other tax matters are subject to examination by local tax authorities and governmental bodies. We regularly assess the likelihood of an adverse outcome resulting from these examinations to determine the adequacy of our provision for taxes. There can be no assurance as to the outcome of these examinations. If our effective tax rates were to increase, or if the ultimate determination of the taxes owed by us is for an amount in excess of amounts previously accrued, our operating results, cash flows and financial condition could be adversely affected.
If we are treated as a financial institution under FATCA, withholding tax may be imposed on payments on our common shares.
Sections 1471 through 1474 of the U.S. Internal Revenue Code of 1986, as amended (the “Code”), and applicable Treasury Regulations commonly referred to as “FATCA” may impose 30% withholding on “foreign passthru payments” made by a “foreign financial institution” (as defined in the Code) that has entered into an agreement with the U.S. Internal Revenue Service to perform certain diligence and reporting obligations with respect to the foreign financial institution’s U.S.-owned accounts. Such withholding on “foreign passthru payments” will apply from January 1, 2019 at the earliest. The applicable Treasury Regulations treat an entity as a “financial institution” if it is a holding company formed in connection with or availed of by a private equity fund or other similar investment vehicle established with an investment strategy of investing, reinvesting or trading in financial assets. The term “foreign passthru payment” is currently not defined. The United States has entered into an intergovernmental agreement (an “IGA”) with Bermuda, which modifies the FATCA withholding regime described above. It is not clear whether we would be treated as a financial institution subject to the diligence, reporting and withholding obligations under FATCA or the Bermuda IGA. Furthermore, it is not yet clear how the Bermuda IGA will address foreign passthru payments. Prospective investors should consult their tax advisors regarding the potential impact of FATCA, the Bermuda IGA and any non-U.S. legislation implementing FATCA, on their investment in our common shares.
22
We may be classified as a passive foreign investment company, which could result in adverse U.S. federal income tax consequences to U.S. holders of our common shares.
Based on the market price of our common shares and the composition of our income, assets and operations, we do not expect to be treated as a passive foreign investment company ("PFIC") for U.S. federal income tax purposes for the current taxable year or in the foreseeable future. However, the application of the PFIC rules is subject to uncertainty in several respects, and we cannot assure you the U.S. Internal Revenue Service will not take a contrary position. Furthermore, this is a factual determination that must be made annually after the close of each taxable year. If we are a PFIC for any taxable year during which a U.S. person holds our common shares, certain adverse U.S. federal income tax consequences could apply to such U.S. person.
Our substantial indebtedness could adversely affect our ability to raise additional capital to fund our operations, limit our ability to react to changes in the economy and our industry, expose us to interest rate risk to the extent of our variable rate debt and prevent us from meeting our obligations with respect to our indebtedness.
As of
December 31, 2016
, we had approximately
$3.3 billion
of indebtedness on a consolidated basis, including
$500.0 million
of our 2024 Dollar Senior Notes (as defined herein),
$349.7 million
of our 2024 Euro Senior Notes (as defined herein),
$469.8 million
of our 2025 Euro Senior Notes (as defined herein),
$1,545.0 million
of the 2023 Dollar Term Loan facility (as defined herein) and
$417.6 million
of the 2023 Euro Term Loan facility (as defined herein). In addition, as of
December 31, 2016
, we had approximately
$378.7 million
in borrowing capacity available under our Revolving Credit Facility, after giving effect to
$21.3 million
of outstanding letters of credit. As of
December 31, 2016
, we were in compliance with all of the covenants under our outstanding debt instruments.
Our substantial indebtedness could have important consequences to you. For example, it could:
|
•
|
limit our ability to obtain additional financing to fund future working capital, capital expenditures, acquisitions, general corporate purposes or other purposes;
|
|
•
|
require us to devote a substantial portion of our annual cash flow to the payment of interest on our indebtedness;
|
|
•
|
expose us to the risk of increased interest rates as, over the term of our debt, the interest cost on a significant portion of our indebtedness is subject to changes in interest rates;
|
|
•
|
hinder our ability to adjust rapidly to changing market conditions;
|
|
•
|
limit our ability to secure adequate bank financing in the future with reasonable terms and conditions or at all; and
|
|
•
|
increase our vulnerability to and limit our flexibility in planning for, or reacting to, a potential downturn in general economic conditions or in one or more of our businesses.
|
We are more leveraged than some of our competitors, which could adversely affect our business plans. A relatively greater portion of our cash flow is used to service debt and other financial obligations. This reduces the funds we have available for working capital, capital expenditures, acquisitions and other purposes and may make it more difficult for us to borrow in the future. Similarly, our relatively greater leverage increases our vulnerability to, and limits our flexibility in planning for, adverse economic and industry conditions and creates other competitive disadvantages compared with other companies with relatively less leverage.
In addition, the indentures governing the New Senior Notes (as defined herein) and the agreements governing our Senior Secured Credit Facilities (as defined herein) contain affirmative and negative covenants that limit our and certain of our subsidiaries’ ability to engage in activities that may be in our long-term best interests. Our failure to comply with those covenants could result in an event of default that, if not cured or waived, could result in the acceleration of all of our debts.
To service all of our indebtedness, we will require a significant amount of cash and our ability to generate cash depends on many factors beyond our control.
Our operations are conducted through our subsidiaries and our ability to make cash payments on our indebtedness will depend on the earnings and the distribution of funds from our subsidiaries. None of our subsidiaries, however, is obligated to make funds available to us for payment on our indebtedness. Further, the terms of the instruments governing our indebtedness significantly restrict our subsidiaries from paying dividends and otherwise transferring assets to us. Our ability to make cash payments on and refinance our debt obligations, to fund planned capital expenditures and to meet other cash requirements will depend on our financial condition and operating performance, which are subject to prevailing economic and competitive conditions and to financial, business, legislative, regulatory and other factors beyond our control. We might not be able to maintain a level of cash flows from operating activities sufficient to permit us to pay the principal, premium, if any, and interest on our indebtedness.
23
Our business may not generate sufficient cash flow from operations and future borrowings may not be available under our Senior Secured Credit Facilities in an amount sufficient to enable us to pay our indebtedness, or to fund our other liquidity needs, including planned capital expenditures. In such circumstances, we may need to refinance all or a portion of our indebtedness on or before maturity. We may not be able to refinance any of our indebtedness on commercially reasonable terms or at all. If we cannot service our indebtedness, we may have to take actions such as selling assets, issuing additional equity or reducing or delaying capital expenditures, strategic acquisitions, investments and alliances. Such actions, if necessary, may not be effected on commercially reasonable terms or at all. The instruments governing our indebtedness restrict our ability to sell assets and our use of the proceeds from such sales, and we may not be able to consummate those dispositions or to obtain proceeds in an amount sufficient to meet any debt service obligations then due.
If we are unable to generate sufficient cash flow or are otherwise unable to obtain funds necessary to meet required payments of principal, premium, if any, and interest on our indebtedness, or if we otherwise fail to comply with the various covenants in the instruments governing our indebtedness, we could be in default under the terms of the agreements governing such indebtedness. In the event of such default, the holders of such indebtedness could elect to declare all the funds borrowed thereunder to be due and payable, together with accrued and unpaid interest, the lenders under our Revolving Credit Facility could elect to terminate their commitments thereunder, cease making further loans and institute foreclosure proceedings against our assets, and we could be forced into bankruptcy or liquidation. If our operating performance declines, we may in the future need to obtain waivers from the required lenders under the credit agreement governing our Senior Secured Credit Facilities to avoid being in default. If we breach our covenants under our Senior Secured Credit Facilities or we are in default thereunder and seek a waiver, we may not be able to obtain a waiver from the required lenders. If this occurs, we would be in default under the credit agreement governing our Senior Secured Credit Facilities, the lenders could exercise their rights, as described above, and we could be forced into bankruptcy or liquidation.
Despite our current level of indebtedness and restrictive covenants, we and our subsidiaries may incur additional indebtedness or we may pay dividends in the future. This could further exacerbate the risks associated with our substantial financial leverage.
We and our subsidiaries may incur significant additional indebtedness under the agreements governing our indebtedness. Although the indentures governing the New Senior Notes and the credit agreement governing our Senior Secured Credit Facilities contain restrictions on the incurrence of additional indebtedness, these restrictions are subject to a number of thresholds, qualifications and exceptions, and the additional indebtedness incurred in compliance with these restrictions could be substantial. Additionally, these restrictions also will not prevent us from incurring obligations that, although preferential to our common shares in terms of payment, do not constitute indebtedness. As of
December 31, 2016
, we had
$378.7 million
of additional borrowing capacity under our Revolving Credit Facility, after giving effect to
$21.3 million
of outstanding letters of credit.
In addition, if new debt is added to our and/or our subsidiaries’ debt levels, the related risks that we now face as a result of our leverage would intensify. See Part II, Item 7, "Management’s Discussion and Analysis of Financial Condition and Results of Operations—Liquidity and Capital Resources—Financial Condition."
We are dependent upon our lenders for financing to execute our business strategy and meet our liquidity needs. If our lenders are unable or unwilling to fund borrowings under their credit commitments or we are unable to borrow, it could negatively impact our business.
We are dependent upon our lenders for financing to execute our business strategy and meet our liquidity needs. If our lenders are unable to fund borrowings under their credit commitments or we are unable to borrow from them for any reason, our business could be negatively impacted. During periods of volatile credit markets, there is risk that any lenders, even those with strong balance sheets and sound lending practices, could fail or refuse to honor their legal commitments and obligations under existing credit commitments, including, but not limited to, extending credit up to the maximum permitted by a credit facility, allowing access to additional credit features and otherwise accessing capital and/or honoring loan commitments. If our lenders are unable or unwilling to fund borrowings under their revolving credit commitments or we are unable to borrow from them, it could be difficult in such environments to obtain sufficient liquidity to meet our operational needs.
Our ability to obtain additional capital on commercially reasonable terms may be limited.
Although we believe our cash and cash equivalents, together with cash we expect to generate from operations and unused capacity available under our Revolving Credit Facility, provide adequate resources to fund ongoing operating requirements, we may need to seek additional financing to compete effectively.
24
If we are unable to obtain capital on commercially reasonable terms, it could:
|
•
|
reduce funds available to us for purposes such as working capital, capital expenditures, research and development, strategic acquisitions and other general corporate purposes;
|
|
•
|
restrict our ability to introduce new products or exploit business opportunities;
|
|
•
|
increase our vulnerability to economic downturns and competitive pressures in the markets in which we operate; and
|
|
•
|
place us at a competitive disadvantage.
|
Difficult and volatile conditions in the capital, credit and commodities markets and in the overall economy could have a material adverse effect on our financial position, results of operations and cash flows.
Difficult global economic conditions, including concerns about sovereign debt and significant volatility in the capital, credit and commodities markets, could have a material adverse effect on our financial position, results of operations and cash flows. These global economic factors, combined with low levels of business and consumer confidence and high levels of unemployment in certain parts of the world, have precipitated a slow recovery from the global recession and concern about a return to recessionary conditions. The difficult conditions in these markets and the overall economy affect our business in a number of ways. For example:
|
•
|
as a result of the volatility in commodity prices, we may encounter difficulty in achieving sustained market acceptance of past or future price increases, which could have a material adverse effect on our financial position, results of operations and cash flows;
|
|
•
|
under difficult market conditions there can be no assurance that borrowings under our Revolving Credit Facility would be available or sufficient, and in such a case, we may not be able to successfully obtain additional financing on reasonable terms, or at all;
|
|
•
|
in order to respond to market conditions, we may need to seek waivers from various provisions in the credit agreement governing our Senior Secured Credit Facilities, and in such case, there can be no assurance that we can obtain such waivers at a reasonable cost, if at all;
|
|
•
|
market conditions could cause the counterparties to the derivative financial instruments we may use to hedge our exposure to interest rate, commodity or currency fluctuations to experience financial difficulties and, as a result, our efforts to hedge these exposures could prove unsuccessful and, furthermore, our ability to engage in additional hedging activities may decrease or become more costly; and
|
|
•
|
market conditions could result in our key customers experiencing financial difficulties and/or electing to limit spending, which in turn could result in decreased sales and earnings for us.
|
In general, downturns in economic conditions can cause fluctuations in demand for our and our customers’ products, product prices, volumes and margins. Future economic conditions may not be favorable to our industry and future growth in demand for our products, if any, may not be sufficient to alleviate any existing or future conditions of excess industry capacity. A decline in the demand for our products or a shift to lower-margin products due to deteriorating economic conditions could have a material adverse effect on our financial condition and results of operations and could also result in impairments of certain of our assets. We do not know if market conditions or the state of the overall economy will continue to improve in the near future. We cannot provide assurance that a continuation of current economic conditions or a further economic downturn in one or more of the geographic regions in which we sell our products would not have a material adverse effect on our business, financial condition and results of operations.
Our debt obligations may limit our flexibility in managing our business.
The indentures governing our New Senior Notes and the credit agreement governing our Senior Secured Credit Facilities require us to comply with a number of customary financial and other covenants, such as maintaining leverage ratios in certain situations and maintaining insurance coverage. See Part II, Item 7, "Management’s Discussion and Analysis of Financial Condition and Results of Operations—Liquidity and Capital Resources—Financial Condition." These covenants may limit our flexibility in our operations, and breaches of these covenants could result in defaults under the instruments governing the applicable indebtedness even if we had satisfied our payment obligations. If we were to default on the indentures governing our New Senior Notes, the credit agreement governing our Senior Secured Credit Facilities or other debt instruments, our financial condition and liquidity would be adversely affected.
25
Risks Related to Ownership of our Common Shares
Axalta Coating Systems Ltd. is a holding company with no operations of its own. Because our operations are conducted almost entirely through our subsidiaries and joint ventures, we are largely dependent on our receipt of distributions and dividends or other payments from our subsidiaries and joint ventures for cash to fund all of our operations and expenses, including to make future dividend payments, if any.
Our operations are conducted almost entirely through our subsidiaries and our ability to generate cash to meet our debt service obligations or to make future dividend payments, if any, is highly dependent on the earnings and the receipt of funds from our subsidiaries in the form of dividends, loans or advances and through repayment of loans or advances from us. Payments to us by our subsidiaries and joint ventures will be contingent upon our subsidiaries’ or joint ventures’ earnings and other business considerations and may be subject to statutory or contractual restrictions. We do not currently expect to declare or pay dividends on our common shares for the foreseeable future; however, to the extent that we determine in the future to pay dividends on our common shares, the credit agreement governing our Senior Secured Credit Facilities and the indentures governing the New Senior Notes have certain restrictions over the ability of our subsidiaries to pay dividends or otherwise transfer assets to us. In addition, Bermuda law imposes requirements that may restrict our ability to pay dividends to holders of our common shares. In addition, there may be significant tax and other legal restrictions on the ability of foreign subsidiaries or joint ventures to remit money to us.
The price of our common shares may fluctuate significantly, and you could lose all or part of your investment.
Volatility in the market price of our common shares may prevent you from being able to sell your common shares at or above the price you paid for your common shares. The market price of our common shares could fluctuate significantly for various reasons, including:
|
•
|
our operating and financial performance and prospects;
|
|
•
|
our quarterly or annual earnings or those of other companies in our industry;
|
|
•
|
the public’s reaction to our press releases, our other public announcements and our filings with the SEC;
|
|
•
|
changes in, or failure to meet, earnings estimates or recommendations by research analysts who track our common shares or the stock of other companies in our industry;
|
|
•
|
the failure of research analysts to cover our common shares;
|
|
•
|
strategic actions by us, our customers or our competitors, such as acquisitions or restructurings;
|
|
•
|
new laws or regulations or new interpretations of existing laws or regulations applicable to our business;
|
|
•
|
changes in accounting standards, policies, guidance, interpretations or principles;
|
|
•
|
the impact on our profitability temporarily caused by the time lag between when we experience cost increases until these increases flow through cost of sales because of our method of accounting for inventory, or the impact from our inability to pass on such price increases to our customers;
|
|
•
|
material litigations or government investigations;
|
|
•
|
changes in general conditions in the United States and global economies or financial markets, including those resulting from war, incidents of terrorism or responses to such events;
|
|
•
|
changes in key personnel;
|
|
•
|
sales of common shares by us, Berkshire Hathaway Inc.'s affiliate ("Berkshire") or members of our management team;
|
|
•
|
the granting of restricted common shares, stock options and other equity awards;
|
|
•
|
volume of trading in our common shares; and
|
|
•
|
the realization of any risks described under this “Risk Factors” section.
|
In addition, over the past several years, the stock markets have experienced significant price and volume fluctuations. This volatility has had a significant impact on the market price of securities issued by many companies, including companies in our industry. The changes frequently appear to occur without regard to the operating performance of the affected companies. Hence, the price of our common shares could fluctuate based upon factors that have little or nothing to do with our company, and these fluctuations could materially reduce our share price and cause you to lose all or part of your investment. Further, in the past, market fluctuations and price declines in a company’s stock have led to securities class action litigations. If such a suit were to arise, it could have a substantial cost and divert our resources regardless of the outcome.
26
If we fail to maintain proper and effective internal controls over financial reporting, our ability to produce accurate and timely financial statements could be impaired and investors’ views of us could be harmed.
The Sarbanes-Oxley Act of 2002 (the "Sarbanes-Oxley Act") requires, among other things, that we maintain effective internal control over financial reporting and disclosure controls and procedures. One key aspect of the Sarbanes-Oxley Act is that we must perform system and process evaluation and testing of our internal control over financial reporting to allow management and our independent registered public accounting firm to report on the effectiveness of our internal control over financial reporting, as required by Section 404 of the Sarbanes-Oxley Act, with auditor attestation of the effectiveness of our internal controls. If we are not able to comply with the requirements of Section 404 in a timely manner, or if we or our independent registered public accounting firm identify deficiencies in our internal control over financial reporting that are deemed to be material weaknesses, the market price of our common shares could decline and we could be subject to sanctions or investigations by the New York Stock Exchange ("NYSE"), the SEC or other regulatory authorities, which would require additional financial and management resources.
Our ability to successfully implement our business plan and comply with the Sarbanes-Oxley Act requires us to be able to prepare timely and accurate financial statements, among other requirements. Any delay in the implementation of, or disruption in the transition to, new or enhanced systems, procedures or controls, may cause our operations to suffer and we may be unable to conclude that our internal control over financial reporting is effective and to obtain an unqualified report on internal controls from our auditors. Moreover, we cannot be certain that these measures would ensure that we implement and maintain adequate controls over our financial processes and reporting in the future. Even if we were to conclude, and our independent registered public accounting firm were to concur, that our internal control over financial reporting provided reasonable assurance regarding the reliability of financial reporting and the preparation of financial statements for external purposes in accordance with accounting principles generally accepted in the United States of America ("U.S. GAAP"), because of its inherent limitations, internal control over financial reporting may not prevent or detect fraud or misstatements. This, in turn, could have an adverse impact on the market price for our common shares, and could adversely affect our ability to access the capital markets.
We have incurred and will continue to incur increased costs as a result of operating as a publicly traded company, and our management will be required to devote substantial time to new compliance initiatives.
As a publicly traded company, we have incurred and will continue to incur additional legal, accounting and other expenses. In addition, the Sarbanes-Oxley Act, the Dodd-Frank Wall Street Reform and Consumer Protection Act and the rules of the SEC and the NYSE impose various requirements on public companies. Our management and other personnel devote a substantial amount of time to these compliance initiatives as well as investor relations. Moreover, these rules and regulations have increased our legal and financial compliance costs and have made some activities more time-consuming and costly. For example, these rules and regulations make it more difficult and more expensive for us to obtain director and officer liability insurance, and we have incurred additional costs to maintain such coverage.
Furthermore, if we are not able to continue to comply with these requirements, the market price of our common shares could decline and we could be subject to potential delisting by the NYSE and review by the NYSE, the SEC or other regulatory authorities, which would require the expenditure by us of additional financial and management resources and could harm our business and the market price of our common shares.
We do not intend to pay dividends on our common shares and, consequently, your ability to achieve a return on your investment will depend on appreciation in the price of our common shares.
We do not intend to declare and pay dividends on our common shares for the foreseeable future. Therefore, you are not likely to receive any dividends on your common shares for the foreseeable future and the success of an investment in our common shares will depend upon any future appreciation in their value. There is no guarantee that our common shares will appreciate in value or even maintain the price at which our shareholders have purchased their shares. The payment of future dividends, however, will be at the discretion of our Board of Directors and will depend on, among other things, our earnings, financial condition, capital requirements, level of indebtedness, statutory and contractual restrictions applying to the payment of dividends and other considerations that our Board of Directors deems relevant. The credit agreement governing our Senior Secured Credit Facilities and the indentures governing the New Senior Notes also effectively limit our ability to pay dividends. As a consequence of these limitations and restrictions, we may not be able to make, or may have to reduce or eliminate, the payment of dividends on our common shares.
Future sales of our common shares in the public market could lower our share price, and any additional capital raised by us through the sale of equity or convertible debt securities may dilute your ownership in us and may adversely affect the market price of our common shares.
We and our shareholders may sell additional common shares in subsequent offerings. We may also issue additional common shares or convertible debt securities. As of
February 23, 2017
, we had 1,000,000,000 common shares authorized and
241,340,450
common shares outstanding.
27
We cannot predict the size of future issuances or sales of our common shares or the effect, if any, that future issuances and sales of our common shares will have on the market price of our common shares. Sales of substantial amounts of our common shares (including sales that may occur pursuant to the registration rights of Berkshire, sales by members of management and shares that may be issued in connection with an acquisition), or the perception that such sales could occur, may adversely affect prevailing market prices for our common shares. See Part III, Item 13, “Certain Relationships and Related Transactions and Director Independence.”
We are a Bermuda company and it may be difficult for you to enforce judgments against us or our directors and executive officers.
We are a Bermuda exempted company. As a result, the rights of our shareholders are governed by Bermuda law and our memorandum of association and bye-laws. The rights of shareholders under Bermuda law may differ from the rights of shareholders of companies incorporated in another jurisdiction, and a substantial portion of our assets are located outside the United States. As a result, it may be difficult for investors to effect service of process on those persons in the United States or to enforce in the United States judgments obtained in U.S. courts against us or those persons based on the civil liability provisions of the U.S. securities laws. It is doubtful whether courts in Bermuda will enforce judgments obtained in other jurisdictions, including the United States, against us or our directors or officers under the securities laws of those jurisdictions or entertain actions in Bermuda against us or our directors or officers under the securities laws of other jurisdictions.
Bermuda law differs from the laws in effect in the United States and may afford less protection to our shareholders.
We are organized under the laws of Bermuda. As a result, our corporate affairs are governed by the Companies Act 1981 (the "Companies Act"), which differs in some material respects from laws typically applicable to U.S. corporations and shareholders, including the provisions relating to interested directors, amalgamations, mergers and acquisitions, takeovers, shareholder lawsuits and indemnification of directors. Generally, the duties of directors and officers of a Bermuda company are owed to the company only. Shareholders of Bermuda companies typically do not have rights to take action against directors or officers of the company and may only do so in limited circumstances. Shareholder class actions are not available under Bermuda law. The circumstances in which shareholder derivative actions may be available under Bermuda law are substantially more proscribed and less clear than they would be to shareholders of U.S. corporations. The Bermuda courts, however, would ordinarily be expected to permit a shareholder to commence an action in the name of a company to remedy a wrong to the company where the act complained of is alleged to be beyond the corporate power of the company or illegal, or would result in the violation of the company’s memorandum of association or bye-laws. Furthermore, consideration would be given by a Bermuda court to acts that are alleged to constitute a fraud against the minority shareholders or, for instance, where an act requires the approval of a greater percentage of the company’s shareholders than those who actually approved it.
When the affairs of a company are being conducted in a manner that is oppressive or prejudicial to the interests of some shareholders, one or more shareholders may apply to the Supreme Court of Bermuda, which may make such order as it sees fit, including an order regulating the conduct of the company’s affairs in the future or ordering the purchase of the shares of any shareholders by other shareholders or by the company. Additionally, under our bye-laws and as permitted by Bermuda law, each shareholder has waived any claim or right of action against our directors or officers for any action taken by directors or officers in the performance of their duties, except for actions involving fraud or dishonesty. In addition, the rights of our shareholders and the fiduciary responsibilities of our directors under Bermuda law are not as clearly established as under statutes or judicial precedent in existence in jurisdictions in the United States, particularly the State of Delaware. Therefore, our shareholders may have more difficulty protecting their interests than would shareholders of a corporation incorporated in a jurisdiction within the United States.
We have anti-takeover provisions in our bye-laws that may discourage a change of control.
Our bye-laws contain provisions that could make it more difficult for a third party to acquire us without the consent of our Board of Directors. These provisions provide for:
|
•
|
a classified Board of Directors with staggered three-year terms;
|
|
•
|
directors only to be removed for cause;
|
|
•
|
restrictions on the time period in which directors may be nominated; and
|
|
•
|
our Board of Directors to determine the powers, preferences and rights of our preference shares and to issue the preference shares without shareholder approval.
|
These anti-takeover defenses could discourage, delay or prevent a transaction involving a change in control of our company and may prevent our shareholders from receiving the benefit from any premium to the market price of our common shares offered by a bidder in a takeover context. Even in the absence of a takeover attempt, the existence of these provisions may adversely affect the prevailing market price of our common shares if the provisions are viewed as discouraging takeover attempts in the future. These provisions could also discourage proxy contests, make it more difficult for you and other shareholders to elect directors of your choosing and cause us to take corporate actions other than those you desire.
28
None.
Our corporate headquarters is located in Philadelphia, PA. Our extensive geographic footprint is comprised of
46
manufacturing facilities (including 16 manufacturing sites operated by our joint ventures),
four
major technology centers and
47
customer training centers supporting our global operations. The table below presents summary information regarding our facilities as of
December 31, 2016
.
29
|
Type of Facility/Country
|
|
Location
|
|
Segment
|
|
Manufacturing Facilities
|
|
|
||
|
North America
|
|
|
||
|
Canada
|
|
Ajax
|
|
Transportation
|
|
United States of America
|
|
Front Royal, VA
|
|
Performance; Transportation
|
|
|
Ft. Madison, IA
|
|
Performance; Transportation
|
|
|
|
Houston, TX
|
|
Performance
|
|
|
|
Hilliard, OH
|
|
Performance
|
|
|
|
Mt. Clemens, MI
|
|
Performance; Transportation
|
|
|
|
Toledo, OH
|
|
Performance; Transportation
|
|
|
Orrville, OH
|
Performance
|
|||
|
Latin America
|
|
|
||
|
Brazil
|
|
Guarulhos
|
|
Performance; Transportation
|
|
Mexico
|
|
Monterrey
|
|
Performance
|
|
|
Ocoyoacac
|
|
Performance; Transportation
|
|
|
|
Tlalnepantla
|
|
Performance; Transportation
|
|
|
Venezuela
|
|
Valencia
|
|
Performance; Transportation
|
|
Argentina
|
Buenos Aires
|
Performance; Transportation
|
||
|
EMEA
|
|
|
||
|
Austria
|
|
Guntramsdorf
|
|
Performance; Transportation
|
|
Belgium
|
|
Mechelen
|
|
Performance; Transportation
|
|
France
|
|
Montbrison
|
|
Performance
|
|
Germany
|
|
Wuppertal
|
|
Performance; Transportation
|
|
|
Landshut
|
|
Performance
|
|
|
Sweden
|
|
Vastervik
|
|
Performance
|
|
Switzerland
|
|
Bulle
|
|
Performance
|
|
Turkey
|
|
Gebze
|
|
Performance; Transportation
|
|
United Kingdom
|
|
Darlington
|
|
Performance
|
|
Asia Pacific
|
|
|
||
|
Australia
|
|
Riverstone
|
|
Performance; Transportation
|
|
China
|
|
Changchun
|
|
Performance; Transportation
|
|
|
Jiading
|
|
Performance; Transportation
|
|
|
India
|
|
Savli
|
|
Performance; Transportation
|
|
Malaysia
|
|
Kuala Lumpur
|
|
Performance
|
|
Shah Alam
|
Performance
|
|||
|
Thailand
|
Bangplee
|
Performance
|
||
|
Joint Venture Manufacturing
Facilities
|
|
|
||
|
China
|
|
Chengdu
|
|
Performance
|
|
|
Dongguan
|
|
Performance
|
|
|
|
Huangshan
|
|
Performance
|
|
|
|
Qingpu
|
|
Performance
|
|
|
|
Shangdong
|
|
Performance
|
|
|
Colombia
|
|
Cartagena de Indias
|
|
Performance
|
|
Indonesia
|
|
Cikarang
|
|
Performance
|
|
Taiwan
|
|
Taipei
|
|
Transportation
|
|
Guatemala
|
|
Amatitlan
|
|
Performance
|
|
United States of America
|
Madison, AL
|
Performance
|
||
|
Riverside, CA
|
Performance
|
|||
30
|
Type of Facility/Country
|
|
Location
|
|
Segment
|
|
Joint Venture Partner Manufacturing Facilities
|
|
|
||
|
Japan
|
|
Amagasaki
|
|
Transportation
|
|
|
Chiba
|
|
Transportation
|
|
|
South Africa
|
|
Durban
|
|
Transportation
|
|
|
Port Elizabeth
|
|
Transportation
|
|
|
Russia
|
|
Moscow
|
|
Transportation
|
|
Technology Centers
|
|
|
||
|
China
|
|
Shanghai
|
|
Performance; Transportation
|
|
Germany
|
|
Wuppertal
|
|
Performance; Transportation
|
|
United States of America
|
|
Mt. Clemens, MI
|
|
Performance; Transportation
|
|
|
Wilmington, DE
|
|
Performance; Transportation
|
|
|
Customer Training Centers
|
|
Location by Region
|
|
Number of Facilities
|
|
|
North America
|
|
11
|
|
|
|
Latin America
|
|
8
|
|
|
|
EMEA
|
|
19
|
|
|
|
Asia Pacific
|
|
9
|
|
We are from time to time party to legal proceedings that arise in the ordinary course of business. We are not involved in any litigation other than that which has arisen in the ordinary course of business. We do not expect that any currently pending lawsuits will have a material effect on us as discussed in Note 8 to the consolidated financial statements included elsewhere in this Annual Report on Form 10-K. See Part I, Item 1A, "Risk Factors—Risks Related to our Business—Risks Related to Legal and Regulatory Compliance and Litigation—Our results of operations could be adversely affected by litigation" and Part I, Item 1A, "Risk Factors—Risks Related to our Business—Risks Related to Other Aspects of our Business—DuPont’s potential breach of its obligations in connection with the Acquisition, including failure to comply with its indemnification obligations, may materially affect our business and operating results."
Not applicable.
31
Share Price and Dividends
Our common shares are traded on the NYSE under the symbol "AXTA." The high and low sales prices for our common shares for the two most recent fiscal years were as follows:
|
2016
|
2015
|
|||||||||||
|
Quarter Ended
|
High
|
Low
|
High
|
Low
|
||||||||
|
First Quarter (March 31)
|
$
|
29.66
|
|
$
|
20.67
|
|
$
|
29.64
|
|
$
|
24.74
|
|
|
Second Quarter (June 30)
|
30.45
|
|
24.80
|
|
36.50
|
|
27.20
|
|
||||
|
Third Quarter (September 30)
|
29.59
|
|
25.79
|
|
33.63
|
|
23.94
|
|
||||
|
Fourth Quarter (December 31)
|
28.37
|
|
24.27
|
|
30.02
|
|
25.01
|
|
||||
As of
February 23, 2017
, there were 5 registered holders of record of Axalta’s common stock as shown on the records of the Company’s transfer agent. A substantially greater number of holders of Axalta common stock are “street name” or beneficial holders, whose shares of record are held by banks, brokers and other financial institutions. Since our incorporation in August 2012, we have not paid dividends on our common shares, and we do not currently intend to pay dividends in the foreseeable future. The declaration and payment of any dividends in the future will be determined by our Board of Directors, in its discretion, and will depend on a number of factors, including our earnings, capital requirements, overall financial condition and contractual restrictions, including covenants in the agreements governing our New Senior Notes and Senior Secured Credit Facilities, which may limit our ability to pay dividends.
Recent Sales of Unregistered Securities
None.
32
Stock Performance
The line graph illustrated below compares the cumulative total shareholder value return of our common shares since our initial public offering with the cumulative total returns of an overall stock market index, the Standard & Poor's (Composite 500 Index ("S&P 500"), and our peer group index, Standard & Poor's 500 Chemicals Index ("S&P 500 Chemicals"). This graph assumes an investment of $100 in our common shares and each index (with all dividends reinvested) on November 12, 2014, the date on which our common shares began trading on the NYSE.
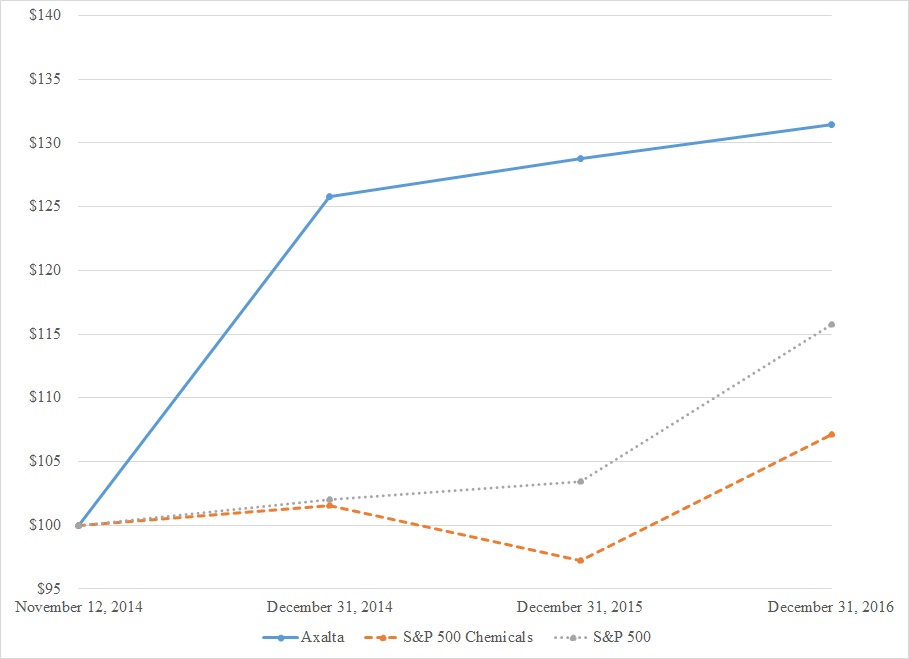
33
The following table sets forth selected historical consolidated and combined financial data and other information of Axalta. As a result of the Acquisition, we applied acquisition accounting whereby the purchase price paid was allocated to the acquired assets and liabilities at fair value. The financial reporting periods presented are as follows:
|
•
|
The year ended December 31, 2012 and the period from January 1, 2013 through January 31, 2013 ("Predecessor" periods) reflect the combined results of operations of the DPC business.
|
|
•
|
The years ended December 31, 2013 through 2016 ("Successor" periods) reflect the consolidated results of operations of Axalta, which include the effects of acquisition accounting commencing on the acquisition date of February 1, 2013.
|
The historical results of operations and cash flow data for the years ended December 31, 2013 through 2016 and the historical balance sheet data as of December 31, 2013 through 2016 presented below were derived from our audited financial statements and the related notes thereto these should be read in conjunction with “Management’s Discussion and Analysis of Financial Condition and Results of Operations” and the Consolidated Financial Statements and related notes included elsewhere in this Annual Report on Form 10-K.
As of and for the Successor period of August 24, 2012 (inception date) through December 31, 2012, the Successor had no operations or activity prior to the Acquisition, other than merger and acquisition costs of $29.0 million, which consisted primarily of investment banking, legal and other professional advisory services costs.
The historical combined financial data for the year ended December 31, 2012 as well as the period January 1, 2013 through January 31, 2013 have been derived from the Predecessor audited combined financial statements and the related notes thereto for the DPC business.
34
|
|
Successor
|
Predecessor
|
||||||||||||||||
|
|
Year Ended December 31,
|
Period from January 1
through
January 31,
|
Year Ended December
31,
|
|||||||||||||||
|
(In millions, except per share data)
|
2016
|
2015
|
2014
|
2013
|
2013
|
2012
|
||||||||||||
|
Statements of Operations Data:
|
||||||||||||||||||
|
Net sales
|
$
|
4,073.5
|
|
$
|
4,087.2
|
|
$
|
4,361.7
|
|
$
|
3,951.1
|
|
$
|
326.2
|
|
$
|
4,219.4
|
|
|
Other revenue
|
23.9
|
|
26.1
|
|
29.8
|
|
35.7
|
|
1.1
|
|
37.4
|
|
||||||
|
Total revenue
|
4,097.4
|
|
4,113.3
|
|
4,391.5
|
|
3,986.8
|
|
327.3
|
|
4,256.8
|
|
||||||
|
Cost of goods sold
(1)
|
2,527.6
|
|
2,597.3
|
|
2,897.2
|
|
2,772.8
|
|
232.2
|
|
2,932.6
|
|
||||||
|
Selling, general and administrative expenses
(2)
|
962.5
|
|
914.8
|
|
991.5
|
|
1,040.6
|
|
70.8
|
|
873.4
|
|
||||||
|
Venezuela asset impairment
|
57.9
|
|
—
|
|
—
|
|
—
|
|
—
|
|
—
|
|
||||||
|
Research and development expenses
|
57.7
|
|
51.6
|
|
49.5
|
|
40.5
|
|
3.7
|
|
41.5
|
|
||||||
|
Amortization of acquired intangibles
|
83.4
|
|
80.7
|
|
83.8
|
|
79.9
|
|
—
|
|
—
|
|
||||||
|
Merger and acquisition related expenses
|
—
|
|
—
|
|
—
|
|
28.1
|
|
—
|
|
—
|
|
||||||
|
Income from operations
|
408.3
|
|
468.9
|
|
369.5
|
|
24.9
|
|
20.6
|
|
409.3
|
|
||||||
|
Interest expense, net
|
178.2
|
|
196.5
|
|
217.7
|
|
215.1
|
|
—
|
|
—
|
|
||||||
|
Bridge financing commitment fees
|
—
|
|
—
|
|
—
|
|
25.0
|
|
—
|
|
—
|
|
||||||
|
Other expense, net
|
142.7
|
|
111.2
|
|
115.0
|
|
48.5
|
|
5.0
|
|
16.3
|
|
||||||
|
Income (loss) before income taxes
|
87.4
|
|
161.2
|
|
36.8
|
|
(263.7
|
)
|
15.6
|
|
393.0
|
|
||||||
|
Provision (benefit) for income taxes
|
39.8
|
|
63.3
|
|
2.1
|
|
(44.8
|
)
|
7.1
|
|
145.2
|
|
||||||
|
Net income (loss)
|
47.6
|
|
97.9
|
|
34.7
|
|
(218.9
|
)
|
8.5
|
|
247.8
|
|
||||||
|
Less: Net income attributable to noncontrolling interests
|
5.8
|
|
4.2
|
|
7.3
|
|
6.0
|
|
0.6
|
|
4.5
|
|
||||||
|
Net income (loss) attributable to controlling interests
|
$
|
41.8
|
|
$
|
93.7
|
|
$
|
27.4
|
|
$
|
(224.9
|
)
|
$
|
7.9
|
|
$
|
243.3
|
|
|
Per share data:
|
||||||||||||||||||
|
Net income (loss) per share:
|
||||||||||||||||||
|
Basic net income (loss) per share
|
$
|
0.18
|
|
$
|
0.40
|
|
$
|
0.12
|
|
$
|
(0.97
|
)
|
||||||
|
Diluted net income (loss) per share
|
$
|
0.17
|
|
$
|
0.39
|
|
$
|
0.12
|
|
$
|
(0.97
|
)
|
||||||
|
Basic weighted average shares outstanding
|
238.1
|
|
233.8
|
|
229.3
|
|
228.3
|
|
||||||||||
|
Diluted weighted average shares outstanding
|
244.4
|
|
239.7
|
|
230.3
|
|
228.3
|
|
||||||||||
|
|
|
|
|
|||||||||||||||
|
Other Financial Data:
|
||||||||||||||||||
|
Cash flows from:
|
||||||||||||||||||
|
Operating activities
|
$
|
559.3
|
|
$
|
409.8
|
|
$
|
251.4
|
|
$
|
376.8
|
|
$
|
(37.7
|
)
|
$
|
388.8
|
|
|
Investing activities
|
(257.0
|
)
|
(166.2
|
)
|
(173.8
|
)
|
(5,011.2
|
)
|
(8.3
|
)
|
(88.2
|
)
|
||||||
|
Financing activities
|
(232.6
|
)
|
(84.7
|
)
|
(123.2
|
)
|
5,098.1
|
|
43.0
|
|
(290.6
|
)
|
||||||
|
Depreciation and amortization
|
322.1
|
|
307.7
|
|
308.7
|
|
300.7
|
|
9.9
|
|
110.7
|
|
||||||
|
Capital expenditures
|
(136.2
|
)
|
(138.1
|
)
|
(188.4
|
)
|
(107.3
|
)
|
(2.4
|
)
|
(73.2
|
)
|
||||||
35
|
|
Successor
|
Predecessor
|
|||||||||||||
|
|
December 31,
|
December 31,
|
|||||||||||||
|
(In millions)
|
2016
|
2015
|
2014
|
2013
|
2012
|
||||||||||
|
Balance sheet data:
|
|||||||||||||||
|
Cash and cash equivalents
|
$
|
535.4
|
|
$
|
485.0
|
|
$
|
382.1
|
|
$
|
459.3
|
|
$
|
28.7
|
|
|
Working capital
(3)
|
1,000.3
|
|
972.8
|
|
869.1
|
|
927.7
|
|
592.7
|
|
|||||
|
Total assets
|
5,854.8
|
|
5,830.1
|
|
6,143.9
|
|
6,625.4
|
|
2,875.0
|
|
|||||
|
Indebtedness
|
3,263.9
|
|
3,441.5
|
|
3,614.3
|
|
3,822.1
|
|
0.2
|
|
|||||
|
Total liabilities
|
4,597.2
|
|
4,688.9
|
|
5,031.9
|
|
5,413.6
|
|
1,178.0
|
|
|||||
|
Total shareholders’ equity/combined equity
|
1,257.6
|
|
1,141.2
|
|
1,112.0
|
|
1,211.8
|
|
1,697.0
|
|
|||||
|
Cash dividends declared per common share
|
—
|
|
—
|
|
—
|
|
—
|
|
—
|
|
|||||
Note: The above financial information has been amended to reflect the adoption of certain Accounting Standard adoptions, described further in Note 4 to the consolidated financial statements included elsewhere in this Annual Report on Form 10-K.
|
(1)
|
Cost of goods sold includes the impacts attributable to the increases in inventory value resulting from the fair value adjustments associated with our acquisition accounting for inventories.
|
|
(2)
|
Selling, general and administrative expense included costs associated with transition-related and cost-savings initiatives of
$77.6 million
, $64.4 million,
$127.1 million
and $231.5 million for the Successor years ended December 31, 2016, 2015, 2014 and 2013, respectively. Additionally, during the Predecessor year ended December 31, 2012, $0.7 million in employee separation and asset related costs were recorded.
|
|
(3)
|
Working capital is defined as current assets less current liabilities.
|
36
The following discussion and analysis of our financial condition and results of operations includes statements regarding industry outlook, our expectations regarding the performance of our business and other forward-looking statements within the meaning of the Private Securities Litigation Reform Act of 1995 that are subject to numerous risks and uncertainties, including, but not limited to, the risks and uncertainties described in "Non-GAAP Financial Measures," and "Forward-Looking Statements" as well as "Risk Factors" in this Annual Report on Form 10-K. These statements include those that are related to estimates reflected in our financial results as well as management’s plan and outlook. Our actual results may differ materially from those contained in or implied by any forward-looking statements. The following discussion and analysis of our financial condition and results of operations should be read in conjunction with our consolidated financial statements and the notes thereto included elsewhere in this Annual Report on Form 10-K, as well as the information presented under Part II, Item 6, "Selected Financial Data" of this Annual Report on Form 10-K.
FORWARD-LOOKING STATEMENTS
Many statements made in this Annual Report on Form 10-K that are not statements of historical fact, including statements about our beliefs and expectations, are "forward-looking statements" within the meaning of Section 27A of the Securities Act of 1933, as amended (the "Securities Act") and should be evaluated as such. Forward-looking statements include information concerning possible or assumed future results of operations, including descriptions of our business plan and strategies. These statements often include words such as "anticipate," "expect," "suggests," "plan," "believe," "intend," "estimates," "targets," "projects," "should," "could," "would," "may," "will," "forecast" and other similar expressions. We base these forward-looking statements or projections on our current expectations, plans and assumptions that we have made in light of our experience in the industry, as well as our perceptions of historical trends, current conditions, expected future developments and other factors we believe are appropriate under the circumstances and at such time. As you read and consider this Annual Report on Form 10-K, you should understand that these statements are not guarantees of performance or results. The forward-looking statements and projections are subject to and involve risks, uncertainties and assumptions and you should not place undue reliance on these forward-looking statements or projections. Although we believe that these forward-looking statements and projections are based on reasonable assumptions at the time they are made, you should be aware that many factors could affect our actual financial results or results of operations and could cause actual results to differ materially from those expressed in the forward-looking statements and projections. Factors that may materially affect such forward-looking statements and projections include:
|
•
|
adverse developments in economic conditions and, particularly, in conditions in the automotive and transportation industries;
|
|
•
|
volatility in the capital, credit and commodities markets;
|
|
•
|
our inability to successfully execute on our growth strategy;
|
|
•
|
increased competition;
|
|
•
|
weather conditions that may temporarily reduce the demand for some of our products;
|
|
•
|
reduced demand for some of our products as a result of improved safety features on vehicles and insurance company influence;
|
|
•
|
risks of the loss of any of our significant customers or the consolidation of MSOs, distributors and/or body shops;
|
|
•
|
our reliance on our distributor network and third-party delivery services for the distribution and export of certain of our products;
|
|
•
|
price increases or interruptions in our supply of raw materials;
|
|
•
|
failure to develop and market new products and manage product life cycles;
|
|
•
|
business disruptions, security threats and security breaches, including cyber security risks;
|
|
•
|
risks associated with our non-U.S. operations, including our Venezuelan operations;
|
|
•
|
currency-related risks;
|
|
•
|
terrorist acts, conflicts, wars and natural disasters that may materially adversely affect our business, financial condition and results of operations;
|
|
•
|
failure to comply with the anti-corruption laws of the United States and various international jurisdictions;
|
37
|
•
|
failure to comply with anti-terrorism laws and regulations and applicable trade embargoes;
|
|
•
|
significant environmental liabilities and costs as a result of our current and past operations or products, including operations or products related to our business prior to the Acquisition;
|
|
•
|
transporting certain materials that are inherently hazardous due to their toxic nature;
|
|
•
|
litigation and other commitments and contingencies;
|
|
•
|
ability to recruit and retain the experienced and skilled personnel we need to compete;
|
|
•
|
unexpected liabilities under any pension plans applicable to our employees;
|
|
•
|
work stoppages, union negotiations, labor disputes and other matters associated with our labor force;
|
|
•
|
our ability to protect and enforce intellectual property rights;
|
|
•
|
intellectual property infringement suits against us by third parties;
|
|
•
|
our ability to realize the anticipated benefits of any acquisitions and divestitures;
|
|
•
|
our joint ventures’ ability to operate according to our business strategy should our joint venture partners fail to fulfill their obligations;
|
|
•
|
risk that the insurance we maintain may not fully cover all potential exposures;
|
|
•
|
the risk of impairment charges related to goodwill, identifiable intangible assets and fixed assets;
|
|
•
|
our substantial indebtedness;
|
|
•
|
our ability to obtain additional capital on commercially reasonable terms may be limited;
|
|
•
|
the amount of the costs, fees, expenses and charges related to being a public company;
|
|
•
|
any statements of belief and any statements of assumptions underlying any of the foregoing;
|
|
•
|
other factors disclosed in this Annual Report on Form 10-K; and
|
|
•
|
other factors beyond our control.
|
These cautionary statements should not be construed by you to be exhaustive and are made only as of the date of this Annual Report on Form 10-K. We undertake no obligation to update or revise any forward-looking statements, whether as a result of new information, future events or otherwise.
OVERVIEW
We are a leading global manufacturer, marketer and distributor of high performance coatings systems. We have over a
150
-year heritage in the coatings industry and are known for manufacturing high-quality products with well-recognized brands supported by market-leading technologies and customer service. Our diverse global footprint of
46
manufacturing facilities,
four
technology centers,
47
customer training centers and approximately
13,000
employees allows us to meet the needs of customers in over
130
countries. We serve our customers through an extensive sales force and technical support organization, as well as through approximately
4,000
independent, locally based distributors.
We operate our business in two operating segments, Performance Coatings and Transportation Coatings. Our segments are based on the type and concentration of customers served, service requirements, methods of distribution and major product lines.
Through our Performance Coatings segment we provide high-quality liquid and powder coatings solutions to a fragmented and local customer base. We are one of only a few suppliers with the technology to provide precise color matching and highly durable coatings systems. The end-markets within this segment are refinish and industrial.
Through our Transportation Coatings segment we provide advanced coating technologies to OEMs of light and commercial vehicles. These increasingly global customers require a high level of technical support coupled with cost-effective, environmentally responsible, coatings systems that can be applied with a high degree of precision, consistency and speed. The end-markets within this segment are light vehicle and commercial vehicle.
38
BUSINESS HIGHLIGHTS
General Business Highlights
Our net sales
decreased
0.3%
for the year ended
December 31, 2016
compared to the year ended
December 31, 2015
, due to a decline of 4.6% from unfavorable currency translation. This decrease was largely offset as a result of higher average selling prices as well as stronger volumes which together contributed to 4.3% of growth. The following trends have impacted our segment and end-market sales performance for the year ended
December 31, 2016
:
|
•
|
Performance Coatings:
Net sales excluding currency translation increased approximately 6.6% driven by increases in average selling price within our refinish end-market, particularly within North America and Latin America. Furthering these increases was volume growth in both our refinish and industrial end-markets, including the benefits associated with our acquisitions completed during 2016.
|
|
•
|
Transportation Coatings:
Net sales excluding currency translation increased approximately 1.1% driven primarily by volume growth within our light vehicle end-market as a result of business wins and increased vehicle builds in North America and Asia offset by volume declines within our commercial vehicle end-market in North America as a result of overall industry demand.
|
Our business serves four end-markets globally as follows:
|
(In millions)
|
Year Ended December 31,
|
2016 vs 2015
|
2015 vs 2014
|
||||||||||
|
|
2016
|
2015
|
2014
|
% change
|
% change
|
||||||||
|
Performance Coatings
|
|||||||||||||
|
Refinish
|
$
|
1,684.4
|
|
$
|
1,702.0
|
|
$
|
1,850.8
|
|
(1.0
|
)%
|
(8.0
|
)%
|
|
Industrial
|
718.8
|
|
683.1
|
|
734.2
|
|
5.2
|
%
|
(7.0
|
)%
|
|||
|
Total Net sales Performance Coatings
|
2,403.2
|
|
2,385.1
|
|
2,585.0
|
|
0.8
|
%
|
(7.7
|
)%
|
|||
|
Transportation Coatings
|
|||||||||||||
|
Light Vehicle
|
1,337.7
|
|
1,310.6
|
|
1,384.5
|
|
2.1
|
%
|
(5.3
|
)%
|
|||
|
Commercial Vehicle
|
332.6
|
|
391.5
|
|
392.2
|
|
(15.0
|
)%
|
(0.2
|
)%
|
|||
|
Total Net sales Transportation Coatings
|
1,670.3
|
|
1,702.1
|
|
1,776.7
|
|
(1.9
|
)%
|
(4.2
|
)%
|
|||
|
Total Net sales
|
$
|
4,073.5
|
|
$
|
4,087.2
|
|
$
|
4,361.7
|
|
(0.3
|
)%
|
(6.3
|
)%
|
Acquisitions Highlights
During the year ended December 31, 2016, we successfully completed multiple strategic business acquisitions across both of our segments. These include a refinish business based in Southeast Asia, a light vehicle business specializing in interior coatings based in North America, a fifty-one percent controlling interest in a North American industrial business specializing in coil and spray coatings, and a refinish distributor in Western Europe. Our 2016 aggregate spending for these acquisitions was $114.8 million, net of cash acquired, and contributed
$50.4 million
to net sales in 2016.
Capital and Liquidity Highlights
During the year ended December 31, 2016, we refinanced or amended our Senior Notes and Credit Agreement, including extending the maturity date on our Revolving Credit Facility, allowing us to lower interest rates, extend maturity profiles, rebalance our Dollar and Euro mix of debt and favorably change certain debt covenants. In addition, we made prepayments on our 2020 Term Loans (as defined herein) totaling $474.4 million during 2016. The benefits of these transactions are anticipated to save approximately $35.0 million in annual cash interest. For additional information, refer to Note 21 to the consolidated financial statements included elsewhere in the Annual Report on Form 10-K and our Liquidity and Capital Resource discussion within this Item 7.
Other Highlights
Effective with the August 2016 Carlyle Offering, Carlyle no longer has any beneficial interest in Axalta's common shares, other than de minimis amounts held or owned in the ordinary course of business purchased subsequent to the initial February 1, 2013 acquisition. See Note 1 to the consolidated financial statements included elsewhere in this Annual Report on Form 10-K.
In July of 2016, we announced the opening of our new European headquarters in Basel, Switzerland. Members of European leadership are now centered in Switzerland. We expect with the centering of our management team, we will leverage synergies and drive further focus on our core strategy of growth in the markets we serve. This initiative should lead to improved profitability over the long-term for the region.
39
Factors Affecting Our Operating Results
The following discussion sets forth certain components of our statements of operations as well as factors that impact those items.
Net sales
We generate revenue from the sale of our products across all major geographic areas. Our net sales include total sales less estimates for returns and price allowances. Price allowances include discounts for prompt payment as well as volume-based incentives. Our overall net sales are generally impacted by the following factors:
|
•
|
fluctuations in overall economic activity within the geographic markets in which we operate;
|
|
•
|
underlying growth in one or more of our end-markets, either worldwide or in particular geographies in which we operate;
|
|
•
|
the type of products used within existing customer applications, or the development of new applications requiring products similar to ours;
|
|
•
|
changes in product sales prices (including volume discounts and cash discounts for prompt payment);
|
|
•
|
changes in the level of competition faced by our products, including price competition and the launch of new products by competitors;
|
|
•
|
our ability to successfully develop and launch new products and applications; and
|
|
•
|
fluctuations in foreign exchange rates.
|
While the factors described above impact net sales in each of our operating segments, the impact of these factors on our operating segments can differ, as described below. For more information about risks relating to our business, see Part I, Item 1A, "Risk Factors—Risks Related to our Business."
Other revenue
Other revenue consists primarily of consulting and other service revenue and royalty income.
Cost of goods sold ("cost of sales")
Our cost of sales consists principally of the following:
|
•
|
Production materials costs
. We purchase a significant amount of the materials used in production on a global lowest-cost basis.
|
|
•
|
Employee costs
. These include the compensation and benefit costs for employees involved in our manufacturing operations. These costs generally increase on an aggregate basis as production volumes increase and may decline as a percent of net sales as a result of economies of scale associated with higher production volumes.
|
|
•
|
Depreciation expense.
Property, plant and equipment are stated at cost and depreciated or amortized on a straight-line basis over their estimated useful lives. Property, plant and equipment acquired through the Acquisition were recorded at their estimated fair value on the acquisition date resulting in a new cost basis for accounting purposes.
|
|
•
|
Other
. Our remaining cost of sales consists of freight costs, warehousing expenses, purchasing costs, costs associated with closing or idling of production facilities, functional costs supporting manufacturing, product claims and other general manufacturing expenses, such as expenses for utilities and energy consumption.
|
The main factors that influence our cost of goods sold as a percentage of net sales include:
|
•
|
changes in the price of raw materials;
|
|
•
|
production volumes;
|
|
•
|
the implementation of cost control measures aimed at improving productivity, including reduction of fixed production costs, refinements in inventory management and the coordination of purchasing within each subsidiary and at the business level; and
|
|
•
|
fluctuations in foreign exchange rates.
|
40
Selling, general and administrative expenses
Our selling, general and administrative expense consists of all expenditures incurred in connection with the sales and marketing of our products, as well as administrative overhead costs, including:
|
•
|
compensation and benefit costs for management, sales personnel and administrative staff, including share-based compensation expense. Expenses relating to our sales personnel increase or decrease principally with changes in sales volume due to the need to increase or decrease sales personnel to meet changes in demand. Expenses relating to administrative personnel generally do not increase or decrease directly with changes in sales volume; and
|
|
•
|
depreciation, advertising and other selling expenses, such as expenses incurred in connection with travel and communications.
|
Changes in selling, general and administrative expense as a percentage of net sales have historically been impacted by a number of factors, including:
|
•
|
changes in sales volume, as higher volumes enable us to spread the fixed portion of our administrative expense over higher sales;
|
|
•
|
changes in our customer base, as new customers may require different levels of sales and marketing attention;
|
|
•
|
new product launches in existing and new markets, as these launches typically involve a more intense sales activity before they are integrated into customer applications;
|
|
•
|
customer credit issues requiring increases to the allowance for doubtful accounts; and
|
|
•
|
fluctuations in foreign exchange rates.
|
Research and development expenses
Research and development expense represents costs incurred to develop new products, services, processes and technologies or to generate improvements to existing products or processes.
Interest expense, net
Interest expense, net consists primarily of interest expense on institutional borrowings and other financing obligations and changes in fair value of interest rate derivative instruments, net of capitalized interest expense. Interest expense, net also includes the amortization of debt issuance costs and debt discounts associated with our Senior Secured Credit Facilities and other indebtedness.
Other expense, net
Other expense, net represents costs incurred, net of income, on various non-operational items including costs incurred in conjunction with our debt refinancing and extinguishment transactions, historical management expenses to Carlyle (prior to the change in control as defined herein), indemnity gains and losses associated with the Acquisition (as defined herein), as well as foreign exchange gains and losses and impairment losses on assets that are not part of our core operational activities.
Provision for income taxes
We and our subsidiaries are subject to income tax in the various jurisdictions in which we operate. While the extent of our future tax liability is uncertain, changes to the debt and equity capitalization of our subsidiaries, and the realignment of the functions performed and risks assumed by the various subsidiaries are among the factors that will determine the future book and taxable income of the respective subsidiary and the Company as a whole.
NON-GAAP FINANCIAL MEASURES
Reconciliation of Net Income to EBITDA and Adjusted EBITDA
To supplement our financial information presented in accordance with U.S. GAAP, we use the following non-GAAP financial measures to clarify and enhance an understanding of past performance: EBITDA and Adjusted EBITDA. We believe that the presentation of these financial measures enhances an investor’s understanding of our financial performance. We further believe that these financial measures are useful financial metrics to assess our operating performance from period-to-period by excluding certain items that we believe are not representative of our core business. We define our core business as those operations relating to the Company's ongoing performance and the concept is used to make resource allocation and performance evaluation decisions. We use certain of these financial measures for business planning purposes and in measuring our performance relative to that of our competitors. We utilize Adjusted EBITDA as the primary measure of segment performance.
41
EBITDA consists of net income before interest, taxes, depreciation and amortization. Adjusted EBITDA consists of EBITDA adjusted for (i) non-cash items included within net income, (ii) items the Company does not believe are indicative of ongoing operating performance or (iii) non-recurring, unusual or infrequent items that the Company believes are not reasonably likely to recur within the next two years. We believe that making such adjustments provides investors meaningful information to understand our operating results and ability to analyze financial and business trends on a period-to-period basis.
We believe these financial measures are commonly used by investors to evaluate our performance and that of our competitors. However, our use of the terms EBITDA and Adjusted EBITDA may vary from that of others in our industry. These financial measures should not be considered as alternatives to income before income taxes, net income, earnings per share or any other performance measures derived in accordance with U.S. GAAP as measures of operating performance.
EBITDA and Adjusted EBITDA have important limitations as analytical tools and you should not consider them in isolation or as substitutes for analysis of our results as reported under U.S. GAAP. Some of these limitations are:
|
•
|
EBITDA and Adjusted EBITDA:
|
|
•
|
do not reflect the significant interest expense on our debt, including the Senior Secured Credit Facilities and the New Senior Notes (as defined herein); and
|
|
•
|
eliminate the impact of income taxes on our results of operations;
|
|
•
|
although depreciation and amortization are non-cash charges, the assets being depreciated and amortized will often have to be replaced in the future, and EBITDA and Adjusted EBITDA do not reflect any expenditures for such replacements; and
|
|
•
|
other companies in our industry may calculate EBITDA and Adjusted EBITDA differently than we do, limiting their usefulness as comparative measures.
|
We compensate for these limitations by using EBITDA and Adjusted EBITDA along with other comparative tools, together with U.S. GAAP measurements, to assist in the evaluation of operating performance. Such U.S. GAAP measurements include income before income taxes, net income, earnings per share and other performance measures.
In evaluating these financial measures, you should be aware that in the future we may incur expenses similar to those eliminated in this presentation. Our presentation of EBITDA and Adjusted EBITDA should not be construed as an inference that our future results will be unaffected by the excluded items noted above.
42
The following table reconciles net income to the EBITDA and Adjusted EBITDA measures discussed above for the periods presented:
|
|
Year Ended December 31,
|
||||||||
|
|
2016
|
2015
|
2014
|
||||||
|
Net income
|
$
|
47.6
|
|
$
|
97.9
|
|
$
|
34.7
|
|
|
Interest expense, net
|
178.2
|
|
196.5
|
|
217.7
|
|
|||
|
Provision for income taxes
|
39.8
|
|
63.3
|
|
2.1
|
|
|||
|
Depreciation and amortization
|
322.1
|
|
307.7
|
|
308.7
|
|
|||
|
EBITDA
|
587.7
|
|
665.4
|
|
563.2
|
|
|||
|
Debt extinguishment and refinancing related costs (a)
|
97.6
|
|
2.5
|
|
6.1
|
|
|||
|
Foreign exchange remeasurement losses (b)
|
30.6
|
|
93.7
|
|
81.2
|
|
|||
|
Long-term employee benefit plan adjustments (c)
|
1.5
|
|
(0.3
|
)
|
(0.6
|
)
|
|||
|
Termination benefits and other employee related costs (d)
|
61.8
|
|
36.6
|
|
18.4
|
|
|||
|
Consulting and advisory fees (e)
|
10.4
|
|
23.9
|
|
36.3
|
|
|||
|
Transition-related costs (f)
|
—
|
|
(3.4
|
)
|
101.8
|
|
|||
|
Offering and transactional costs (g)
|
6.0
|
|
(1.5
|
)
|
22.3
|
|
|||
|
Stock-based compensation (h)
|
41.1
|
|
30.2
|
|
8.0
|
|
|||
|
Other adjustments (i)
|
5.0
|
|
(5.8
|
)
|
6.0
|
|
|||
|
Dividends in respect of noncontrolling interest (j)
|
(3.0
|
)
|
(4.7
|
)
|
(2.2
|
)
|
|||
|
Asset impairments (k)
|
68.4
|
|
30.6
|
|
—
|
|
|||
|
Adjusted EBITDA
|
$
|
907.1
|
|
$
|
867.2
|
|
$
|
840.5
|
|
|
(a)
|
During the years ended December 31, 2016, 2015 and 2014 we prepaid principal on our term loans, resulting in non-cash losses on extinguishment of
$9.6 million
,
$2.5 million
and
$3.0 million
, respectively. During the years ended December 31, 2016 and 2014 we amended our Credit Agreement and refinanced our indebtedness, resulting in additional losses of $88.0 million and
$3.1 million
, respectively. We do not consider these items to be indicative of our ongoing operating performance.
|
|
(b)
|
Eliminates foreign exchange losses resulting from the remeasurement of assets and liabilities denominated in foreign currencies, net of the impacts of our foreign currency instruments used to hedge our balance sheet exposures. Exchange effects attributable to the remeasurement of our Venezuelan subsidiary represented losses of
$23.5 million
,
$51.5 million
, and gains of
$11.9 million
for the years ended December 31, 2016, 2015 and 2014, respectively.
|
|
(c)
|
Eliminates the non-cash non-service components of long-term employee benefit costs.
|
|
(d)
|
Represents expenses primarily related to employee termination benefits including our initiative to improve the overall cost structure within the European region as well as costs associated with our Axalta Way initiatives, which are not considered indicative of our ongoing operating performance. In 2014, termination benefits include the costs associated with our headcount initiatives for establishment of new roles and elimination of old roles and other employee costs associated with cost-saving opportunities that were related to our transition to a standalone entity.
|
|
(e)
|
Represents fees paid to consultants for professional services primarily related to our Axalta Way initiatives, which are not considered indicative of our ongoing operating performance. Amounts incurred during 2014 relate to services rendered in conjunction with our transition to a standalone entity.
|
|
(f)
|
Represents charges and a change in estimate associated with the transition costs from DuPont to a standalone entity, including certain Acquisition indemnities. We do not consider these items to be indicative of our ongoing operating performance.
|
|
(g)
|
Represents costs associated with the offerings of our common shares by Carlyle, including the November 2014 IPO, and acquisition-related expenses, including changes in the fair value of contingent consideration, all of which are not considered indicative of our ongoing operating performance.
|
|
(h)
|
Represents non-cash costs associated with stock-based compensation, including
$8.2 million
of expense during the year ended December 31, 2015 attributable to the accelerated vesting of all issued and outstanding stock options issued under the 2013 Plan as a result of the Change in Control.
|
|
(i)
|
Represents costs for certain non-operational or non-cash (gains) and losses, unrelated to our core business and which we do not consider indicative of ongoing operations, including equity investee dividends, indemnity losses (gains) associated with the Acquisition, losses (gains) on sale and disposal of property, plant and equipment, losses (gains) on the remaining foreign currency derivative instruments, Carlyle management fees incurred prior to the Change in Control and non-cash fair value inventory adjustments associated with our business combinations.
|
|
(j)
|
Represents the payment of dividends to our joint venture partners by our consolidated entities that are not wholly owned, which are reflected to show the cash operating performance of these entities on Axalta's financial statements.
|
43
|
(k)
|
As a result of currency devaluations in Venezuela, we recorded non-cash impairment charges relating to a real estate investment of
$10.5 million
and
$30.6 million
during the years ended December 31, 2016 and 2015, respectively. Additionally, during the year ended December 31, 2016, we recorded a
$57.9 million
non-cash impairment on long-lived assets associated with our Venezuela operations. We do not consider these impairments to be indicative of our ongoing operating performance.
|
RESULTS OF OPERATIONS
The following discussion should be read in conjunction with the information contained in the accompanying financial statements and related notes included elsewhere in this Annual Report on Form 10-K. Our historical results of operations set forth below may not necessarily reflect what would have occurred if we had been a separate standalone entity prior to the Acquisition or what will occur in the future.
Year ended
December 31, 2016
compared to year ended
December 31, 2015
The following table was derived from the consolidated statements of operations for the years ended
December 31, 2016
and
2015
included elsewhere in this Annual Report on Form 10-K.
|
|
Year Ended December 31,
|
|||||
|
(In millions)
|
2016
|
2015
|
||||
|
Net sales
|
$
|
4,073.5
|
|
$
|
4,087.2
|
|
|
Other revenue
|
23.9
|
|
26.1
|
|
||
|
Total revenue
|
4,097.4
|
|
4,113.3
|
|
||
|
Cost of goods sold
|
2,527.6
|
|
2,597.3
|
|
||
|
Selling, general and administrative expenses
|
962.5
|
|
914.8
|
|
||
|
Venezuela asset impairment
|
57.9
|
|
—
|
|
||
|
Research and development expenses
|
57.7
|
|
51.6
|
|
||
|
Amortization of acquired intangibles
|
83.4
|
|
80.7
|
|
||
|
Income from operations
|
408.3
|
|
468.9
|
|
||
|
Interest expense, net
|
178.2
|
|
196.5
|
|
||
|
Other expense, net
|
142.7
|
|
111.2
|
|
||
|
Income before income taxes
|
87.4
|
|
161.2
|
|
||
|
Provision for income taxes
|
39.8
|
|
63.3
|
|
||
|
Net income
|
47.6
|
|
97.9
|
|
||
|
Less: Net income attributable to noncontrolling interests
|
5.8
|
|
4.2
|
|
||
|
Net income attributable to controlling interests
|
$
|
41.8
|
|
$
|
93.7
|
|
Net sales
Net sales
decreased
$13.7 million
, or
0.3%
, to
$4,073.5 million
for the year ended
December 31, 2016
compared to net sales of
$4,087.2 million
for the year ended
December 31, 2015
. The net sales decrease for the year ended
December 31, 2016
compared to the year ended
December 31, 2015
was attributable to unfavorable impacts of currency translation, which reduced net sales by 4.6% due primarily to the weakening of certain currencies within Latin America and Asia compared to the U.S. dollar. This net sales decline was partially offset by higher average selling prices across both our segments, primarily in Latin America, which contributed to an increase of 2.6% compared to the year ended December 31, 2015. Increases in volumes across both our segments, in Europe, Asia and North America, attributable mainly to a 2.2% increase from our acquisitions, also contributed to net sales growth of
1.7%
.
Other revenue
Other revenue
decreased
$2.2 million
, or
8.4%
, to
$23.9 million
for the year ended
December 31, 2016
as compared to
$26.1 million
for the year ended
December 31, 2015
. This decrease was primarily related to declines in service revenue combined with the impacts of weakening currencies against the U.S. dollar, which caused a decrease of $0.8 million, or 3.1%.
44
Cost of sales
Cost of sales
decreased
$69.7 million
, or
2.7%
, to
$2,527.6 million
for the year ended
December 31, 2016
compared to
$2,597.3 million
for the year ended
December 31, 2015
. The decrease for the year ended
December 31, 2016
compared to the year ended
December 31, 2015
resulted primarily from a 2.1% decrease associated with currency translation due to the impact of the weakening of certain currencies within Latin America, Asia and Europe. The decrease from currency translation was slightly offset by the contribution of higher volumes of
1.7%
which includes impacts of our acquisitions completed during 2016. Cost of sales as a percentage of net sales decreased from
63.5%
for the year ended
December 31, 2015
to
62.0%
for the year ended
December 31, 2016
primarily as a result of reductions associated with lower raw material prices, favorable pricing on our product mix and impacts of our cost savings initiatives.
Selling, general and administrative expenses
Selling, general and administrative expenses
increased
$47.7 million
, or
5.2%
, to
$962.5 million
for the year ended
December 31, 2016
compared to
$914.8 million
for the year ended
December 31, 2015
. Selling, general and administrative expenses for the year ended
December 31, 2016
included
$77.6 million
of costs related to our cost-savings initiatives as compared to $64.4 million of costs for the year ended
December 31, 2015
associated with our transition-related activities and cost-savings initiatives, resulting in an increase of $13.2 million over the comparable period. In addition, there was an increase of $8.0 million in stock-based compensation for the year ended
December 31, 2016
. Further contributing to the increase during the year ended December 31, 2016 over the comparable period were increases in selling expense associated with increased sales volumes and $17.5 million in costs related to our recent acquisitions. Offsetting these increases were favorable impacts of currency exchange during the year ended
December 31, 2016
, which contributed to an approximately 1.7% reduction in selling, general and administrative expenses due primarily to the weakening of certain currencies within Latin America compared to the U.S. dollar.
Venezuela asset impairment
Venezuela asset impairment relates to the impairment charge of
$57.9 million
recognized during the year ended December 31, 2016 relating to our long-lived assets within our Venezuelan subsidiary. There was no comparative impairment recorded during the year ended
December 31, 2015
.
Research and development expenses
Research and development expenses
increased
$6.1 million
, or
11.8%
, to
$57.7 million
for the year ended
December 31, 2016
compared to
$51.6 million
for the year ended
December 31, 2015
. This increase was driven by additional spending as we focus on developing new and existing coatings products as well as sourcing additional capabilities. The impacts of currency exchange did not have a material impact on the comparable periods.
Amortization of acquired intangibles
Amortization of acquired intangibles
increased
$2.7 million
, or
3.3%
, to
$83.4 million
for the year ended
December 31, 2016
compared to
$80.7 million
for the year ended
December 31, 2015
. This increase was a result of our recent acquisitions, which contributed
$3.5 million
, offset slightly by the impacts of weakening currencies in all regions against the U.S. dollar.
Interest expense, net
Interest expense, net
decreased
$18.3 million
, or
9.3%
, to
$178.2 million
for the year ended
December 31, 2016
compared to
$196.5 million
for the year ended
December 31, 2015
. The decrease was driven by the prepayment of principal balances associated with our 2020 Dollar Term Loans made in 2015 and 2016 and the prepayment on the principal balance of our 2020 Euro Term Loans made in 2016. Additionally, refinancing of our senior indebtedness during the year ended December 31, 2016, reduced the overall interest rates of our debt portfolio and further contributed to the decrease.
Other expense, net
Other expense, net
increased
$31.5 million
, or
28.3%
, to
$142.7 million
for the year ended
December 31, 2016
compared to
$111.2 million
for the year ended
December 31, 2015
. The amendment to our Credit Agreement, refinancing of our indebtedness and prepayments of our Term Loans during the year ended December 31, 2016 resulted in an increase in other expense over the comparable period of $95.1 million.
During the year ended
December 31, 2016
there were $4.3 million in losses on derivative instruments associated with our foreign currency contracts compared to $5.6 million in gains during the year ended
December 31, 2015
, resulting in a $9.9 million increase. In addition, we recognized a gain of $5.4 million for the year ended December 31, 2015 resulting from the remeasurement of our previously held interest in an equity method investee upon the acquisition of a controlling interest whereas no similar gain was recognized during the year ended December 31, 2016, thereby resulting in an increase in other expense, net for the comparable periods.
45
During the year ended
December 31, 2016
our Venezuelan subsidiary continued to be impacted by a significant devaluation of its currency translation rates. This devaluation resulted in impairment charges of $10.5 million and $30.6 million for the years ended December 31, 2016 and 2015, respectively, based on our evaluation of the carrying value associated with our real estate investment, resulting in a decrease of $20.1 million over the comparable period.
Offsetting the year over year loss, foreign exchange losses, net, decreased from $93.7 million for the year ended December 31, 2015 to $30.6 million for the year ended December 31, 2016. This decrease was primarily driven by the revaluation of our Venezuela subsidiary which resulted in
$51.5 million
for the year ended December 31, 2015 compared to
$23.5 million
for the year ended December 31, 2016. The remaining decrease primarily related to the remeasurement of intercompany transactional exposures denominated in currencies different from the functional currency of the relevant subsidiary.
Provision for income taxes
We recorded a provision for income taxes of
$39.8 million
for the year ended
December 31, 2016
, which represents a
45.6%
effective tax rate in relation to the income before income taxes of
$87.4 million
. The effective tax rate for the year ended December 31, 2016 differs from the U.S. Federal statutory rate by 10.6%, which is the result of various items that impacted the rate both favorably and unfavorably. We recorded adjustments for earnings in jurisdictions where the statutory rate is lower than the U.S. Federal rate, primarily related to China, Germany, Luxembourg, Netherlands and Switzerland, which had a net favorable impact of $45.6 million, and current year excess tax benefits related to share-based compensation of $13.4 million, which are now required to be reflected in the consolidated statements of operations as a component of the provision for income taxes due to our early adoption of ASU 2016-09 (See Note 4 to the consolidated financial statements included elsewhere in the Annual Report on Form 10-K). These adjustments were offset by the pre-tax impairment charges in Venezuela of $68.4 million related to the impairment of operational assets as well as a non-operating real estate investment which had an unfavorable $23.8 million impact on the effective rate as it was nondeductible. In addition, the unfavorable impact of pre-tax losses attributable to jurisdictions where a tax benefit is not expected to be realized of $9.6 million, the impact of non-deductible expenses and interest of $11.4 million and the increase in unrecognized tax benefits of $7.1 million.
We recorded a provision for income taxes of
$63.3 million
for the year ended
December 31, 2015
, which represents a
39.3%
effective tax rate in relation to the income before income taxes of
$161.2 million
. The effective tax rate for the year ended
December 31, 2015
differs from the U.S. Federal statutory rate by
4.3%
, which is the result of various items that impacted the rate both favorably and unfavorably. We recorded adjustments for earnings in jurisdictions where the statutory rate is lower than the U.S. Federal rate, primarily related to China, Germany, Luxembourg and Netherlands, which had a net favorable impact of
$41.4 million
. These adjustments were offset by the pre-tax impairment charge in Venezuela of $30.6 million which had an unfavorable $10.7 million impact on the effective rate as it was nondeductible, the unfavorable impact of pre-tax losses attributable to jurisdictions where a tax benefit is not expected to be realized of
$34.4 million
, and the impact of non-deductible expenses and interest of
$10.4 million
.
46
RESULTS OF OPERATIONS
The following discussion should be read in conjunction with the information contained in the accompanying financial statements and related notes included elsewhere in this Annual Report on Form 10-K. Our historical results of operations set forth below may not necessarily reflect what would have occurred if we had been a separate standalone entity prior to the Acquisition or what will occur in the future.
Year ended
December 31, 2015
compared to year ended
December 31, 2014
The following table was derived from the consolidated statements of operations for the years ended
December 31, 2015
and
2014
included elsewhere in this Annual Report on Form 10-K.
|
|
Year Ended December 31,
|
|||||
|
(In millions)
|
2015
|
2014
|
||||
|
Net sales
|
$
|
4,087.2
|
|
$
|
4,361.7
|
|
|
Other revenue
|
26.1
|
|
29.8
|
|
||
|
Total revenue
|
4,113.3
|
|
4,391.5
|
|
||
|
Cost of goods sold
|
2,597.3
|
|
2,897.2
|
|
||
|
Selling, general and administrative expenses
|
914.8
|
|
991.5
|
|
||
|
Research and development expenses
|
51.6
|
|
49.5
|
|
||
|
Amortization of acquired intangibles
|
80.7
|
|
83.8
|
|
||
|
Income from operations
|
468.9
|
|
369.5
|
|
||
|
Interest expense, net
|
196.5
|
|
217.7
|
|
||
|
Other expense, net
|
111.2
|
|
115.0
|
|
||
|
Income before income taxes
|
161.2
|
|
36.8
|
|
||
|
Provision for income taxes
|
63.3
|
|
2.1
|
|
||
|
Net income
|
97.9
|
|
34.7
|
|
||
|
Less: Net income attributable to noncontrolling interests
|
4.2
|
|
7.3
|
|
||
|
Net income attributable to controlling interests
|
$
|
93.7
|
|
$
|
27.4
|
|
Net sales
Net sales
decreased
$274.5 million
, or
6.3%
, to
$4,087.2 million
for the year ended
December 31, 2015
compared to net sales of
$4,361.7 million
for the year ended
December 31, 2014
. Our net sales decrease for the year ended
December 31, 2015
compared to the year ended
December 31, 2014
was primarily attributable to unfavorable impacts of currency translation, which reduced net sales by 11.6% due mainly to the weakening Euro and certain currencies within Latin America and Asia compared to the U.S. dollar. This net sales decline was partially offset by increases in volumes across all regions, which contributed to net sales growth of 3.9%. Higher average selling prices, primarily in Latin America, also contributed to an increase of 1.4%.
Other revenue
Other revenue
decreased
$3.7 million
, or
12.4%
, to
$26.1 million
for the year ended
December 31, 2015
as compared to
$29.8 million
for the year ended
December 31, 2014
. This decrease in other revenue was primarily related to the impacts of weakening currencies against the U.S. dollar, which caused a decrease of $5.1 million, or 17.3%.
Cost of sales
Cost of sales
decreased
$299.9 million
, or
10.4%
, to
$2,597.3 million
for the year ended
December 31, 2015
compared to
$2,897.2 million
for the year ended
December 31, 2014
. The decrease for the year ended
December 31, 2015
compared to the year ended
December 31, 2014
resulted primarily from a 9.4% decrease associated with currency exchange due to the impact of the weakening Euro and certain currencies within Latin America and Asia. The decrease from currency translation was slightly offset by higher volumes of 3.9%, as well as the impacts of stock-based compensation resulting primarily from the impact of the accelerated vesting of all outstanding stock options issued under the 2013 Plan. Cost of sales as a percentage of net sales decreased from 66.4% for the year ended
December 31, 2014
to 63.5% for the year ended
December 31, 2015
primarily as a result of reductions associated with our cost-savings initiatives as well as lower raw material prices.
47
Selling, general and administrative expenses
Selling, general and administrative expenses
decreased
$76.7 million
, or
7.7%
, to
$914.8 million
for the year ended
December 31, 2015
compared to
$991.5 million
for the year ended
December 31, 2014
. Selling, general and administrative expenses for the year ended
December 31, 2015
included $64.4 million of costs related to our 2015 cost-savings initiatives as compared to $127.1 million of costs for the year ended
December 31, 2014
associated with our transition-related activities and cost-savings initiatives, resulting in a decrease of $62.7 million over the comparable period. In addition, favorable impacts of currency exchange during the year ended
December 31, 2015
contributed to an approximately 10.4% reduction in selling, general and administrative expenses due to the weakening Euro and certain currencies within Latin America compared to the U.S. dollar. Offsetting the decrease over comparable periods was an increase in selling expense associated with increased sales volumes as well as an increase of $14.2 million in stock-based compensation for the year ended
December 31, 2015
, resulting primarily from the impact of the accelerated vesting of all outstanding stock options issued under the 2013 Plan. Further offsetting the decrease compared to the year ended
December 31, 2014
was the absence of $14.3 million in gains for the amendments of benefit plans, as well as an increase in spending in 2015 as we focused on opportunities to expand our market presence.
Research and development expenses
Research and development expenses
increased
$2.1 million
, or
4.2%
, to
$51.6 million
fo
r the year ended
December 31, 2015
compared to
$49.5 million
for the year ended
December 31, 2014
. This increase was driven by additional spending as we focus on developing new and existing coatings products. The impacts of currency exchange did not have a material impact on the comparable periods.
Amortization of acquired intangibles
Amortization of acquired intangibles
decreased
$3.1 million
, or
3.7%
, to
$80.7 million
for the year ended
December 31, 2015
compared to
$83.8 million
for the year ended
December 31, 2014
. This decrease was a result of the impact of currency exchange primarily as a result of the weakening Euro compared to the U.S. dollar.
Interest expense, net
Interest expense, net
decreased
$21.2 million
, or
9.7%
, to
$196.5 million
for the year ended
December 31, 2015
compared to
$217.7 million
for the year ended
December 31, 2014
. Interest expense, net for the year ended
December 31, 2015
reflects a full year of interest expense after refinancing our 2020 Term Loans in February of 2014 resulting in a benefit of $2.1 million compared to 2014. Additionally, the year ended
December 31, 2015
included a full year of the impact of the 25 basis point step-down in interest rates on our 2020 Term Loans resulting from a reduction in our leverage ratio, as well as reductions in principal balances throughout 2014 and 2015. Further contributing to the decrease in interest expense over the comparable periods was a decrease of $3.3 million in losses on an interest rate cap on our 2020 Euro Term Loan as well as the impacts of the weakening Euro against the U.S. dollar on our Euro borrowings.
Other expense, net
Other expense, net
decreased
$3.8 million
, or
3.3%
, to
$111.2 million
for the year ended
December 31, 2015
compared to
$115.0 million
for the year ended
December 31, 2014
. This net decrease was the result of various positive and negative drivers. There were net decreases of $18.8 million and $16.6 million as compared to 2014 relating to Acquisition indemnity provisions and management fee expenses, respectively. For the year ended
December 31, 2014
, there was a $17.8 million loss compared to a $1.0 million gain for the year ended
December 31, 2015
resulting from changes in indemnity provisions. Management fee expenses of $16.6 million for the year ended
December 31, 2014
, including the termination fee of the management agreement, upon the consummation of our IPO did not recur in 2015.
In addition, during the year ended
December 31, 2015
there were $5.6 million in gains on derivative instruments associated with our foreign currency contracts compared to $1.4 million in losses during the year ended
December 31, 2014
, resulting in a $7.0 million decrease. In addition to this decrease, we recognized a gain of $5.4 million for the year ended
December 31, 2015
resulting from the remeasurement of our previously held interest in an equity method investee upon the acquisition of a controlling interest whereas no similar gain was recognized during the year ended
December 31, 2014
, thereby resulting in a decrease in other expense, net for the comparable periods.
During the year ended
December 31, 2015
our Venezuelan subsidiary was impacted by a significant devaluation of its currency translation rates. This devaluation resulted in an impairment charge of $30.6 million for the year ended
December 31, 2015
based on our evaluation of the carrying value associated with our real estate investment.
48
Exchange losses were $93.7 million during the year ended
December 31, 2015
as compared to exchange losses of $81.2 million for the year ended December 31, 2014, resulting in an increase in expense of $12.5 million. This increase was primarily driven by the devaluation of our Venezuelan subsidiary's net monetary assets and liabilities resulting in an increase of $70.2 million over the comparable period. Furthering this increase in expense, was a
$24.5 million
decrease in gains on our Euro denominated borrowings over the comparable period. The offsetting decrease of $82.2 million was related to the remeasurement of intercompany transactions denominated in currencies different from the functional currency of the relevant subsidiary.
Provision for income taxes
We recorded a provision for income taxes of
$63.3 million
for the year ended
December 31, 2015
, which represents a
39.3%
effective tax rate in relation to the income before income taxes of
$161.2 million
. The effective tax rate for the year ended
December 31, 2015
differs from the U.S. Federal statutory rate by
4.3%
, which is the result of various items that impacted the rate both favorably and unfavorably. We recorded adjustments for earnings in jurisdictions where the statutory rate is lower than the U.S. Federal rate, primarily related to China, Germany, Luxembourg and Netherlands, which had a net favorable impact of
$41.4 million
. These adjustments were offset by the pre-tax impairment charge in Venezuela of $30.6 million which had an unfavorable $10.7 million impact on the effective rate as it was nondeductible, the unfavorable impact of pre-tax losses attributable to jurisdictions where a tax benefit is not expected to be realized of
$34.4 million
, and the impact of non-deductible expenses and interest of
$10.4 million
.
We recorded a provision for income taxes of
$2.1 million
for the year ended December 31, 2014, which represents a
5.7%
effective tax rate in relation to the income before income taxes of
$36.8 million
. The effective tax rate for the year ended December 31, 2014 differs from the U.S. Federal statutory rate by
29.3%
, which is the result of various items that impacted the rate both favorably and unfavorably. We recorded adjustments for earnings in jurisdictions where the statutory rate is lower than the U.S. Federal rate, primarily related to China, Germany, Luxembourg and Netherlands, which had a net favorable impact of
$46.7 million
, and unrecognized tax benefit adjustments primarily related to acquisition tax matters of
$44.0 million
. These adjustments were partially offset by the unfavorable impact of pre-tax losses attributable to jurisdictions where a tax benefit is not expected to be realized of
$44.4 million
and non-deductible expenses and interest of
$29.6 million
.
49
SEGMENT RESULTS
Year ended December 31, 2016 compared to the year ended December 31, 2015
The following table presents net sales by segment and segment Adjusted EBITDA for the following periods:
|
|
Year Ended December 31,
|
|||||
|
(In millions)
|
2016
|
2015
|
||||
|
Net Sales
|
||||||
|
Performance Coatings
|
$
|
2,403.2
|
|
$
|
2,385.1
|
|
|
Transportation Coatings
|
1,670.3
|
|
1,702.1
|
|
||
|
Total
|
$
|
4,073.5
|
|
$
|
4,087.2
|
|
|
Segment Adjusted EBITDA
|
||||||
|
Performance Coatings
|
$
|
554.4
|
|
$
|
539.1
|
|
|
Transportation Coatings
|
352.7
|
|
328.1
|
|
||
|
Total
|
$
|
907.1
|
|
$
|
867.2
|
|
Performance Coatings Segment
Net sales
increased
$18.1 million
, or
0.8%
, to
$2,403.2 million
for the year ended
December 31, 2016
compared to net sales of
$2,385.1 million
for the year ended
December 31, 2015
. The increase in net sales for the year ended
December 31, 2016
was a result of higher average selling prices and volumes which contributed 3.8% and 2.8%, respectively. Contributions from price included a stronger product mix which was driven by our North America and Latin America regions. Volume growth in both our refinish and industrial end-markets included a 3.2% benefit from our acquisitions, slightly offset by the negative volume contribution from Latin America. These increases were partially offset by the unfavorable impacts of weakening currencies across all regions, which contributed to a 5.8% reduction in net sales.
Adjusted EBITDA
increased
$15.3 million
, or
2.8%
, to
$554.4 million
for the year ended
December 31, 2016
compared to Adjusted EBITDA of
$539.1 million
for the year ended
December 31, 2015
. The increase in Adjusted EBITDA for the year ended
December 31, 2016
was primarily driven by higher average selling prices, primarily in our refinish end-market, increases in sales volumes in both end-markets combined with lower variable costs across all regions and the impacts related to our recent acquisitions. Offsetting this increase were unfavorable impacts of currency exchange across all regions, due mainly to the weakening of certain currencies within Latin America compared to the U.S. dollar.
Transportation Coatings Segment
Net sales
decreased
$31.8 million
, or
1.9%
, to
$1,670.3 million
for the year ended
December 31, 2016
compared to net sales of
$1,702.1 million
for the year ended
December 31, 2015
. The decrease in net sales for the year ended
December 31, 2016
was primarily driven by unfavorable impacts of weakening currencies across all regions, which contributed to a 3.0% reduction in net sales. Offsetting the decline in net sales was a 1.0% increase in average selling prices primarily driven by Latin America. Volume of 0.1% was driven by strong performances in North America and Asia, including a 0.7% impact from acquisitions, which was largely offset by weaker volumes in Latin America.
Adjusted EBITDA
increased
$24.6 million
, or
7.5%
, to
$352.7 million
for the year ended
December 31, 2016
compared to Adjusted EBITDA of
$328.1 million
for the year ended
December 31, 2015
. The increase in Adjusted EBITDA for the year ended
December 31, 2016
was primarily driven by higher average selling prices and lower variable costs. This increase was partially offset by higher operating costs combined with the unfavorable impacts of the weakening of certain currencies within Latin America compared to the U.S. dollar.
50
SEGMENT RESULTS
Year ended December 31, 2015 compared to the year ended December 31, 2014
The following table presents net sales by segment and segment Adjusted EBITDA for the following periods:
|
|
Year Ended December 31,
|
|||||
|
(In millions)
|
2015
|
2014
|
||||
|
Net Sales
|
||||||
|
Performance Coatings
|
$
|
2,385.1
|
|
$
|
2,585.0
|
|
|
Transportation Coatings
|
1,702.1
|
|
1,776.7
|
|
||
|
Total
|
$
|
4,087.2
|
|
$
|
4,361.7
|
|
|
Segment Adjusted EBITDA
|
||||||
|
Performance Coatings
|
$
|
539.1
|
|
$
|
547.6
|
|
|
Transportation Coatings
|
328.1
|
|
292.9
|
|
||
|
Total
|
$
|
867.2
|
|
$
|
840.5
|
|
Performance Coatings Segment
Net sales decreased $199.9 million, or 7.7%, to $2,385.1 million for the year ended December 31, 2015 compared to net sales of $2,585.0 million for the year ended December 31, 2014. The decrease in net sales for the year ended December 31, 2015 was primarily a result of unfavorable impacts of currency exchange across all regions, which contributed approximately 12.9% to the reduction in net sales. The negative currency exchange impacts were primarily related to the weakening Euro and certain currencies within Latin America compared to the U.S. dollar. The decrease in net sales was partially offset by increases in average selling price, primarily in Latin America, which contributed to an increase of 2.4%. Further offsetting this decrease was an increase in volume across all regions, which contributed to a net sales increase of 2.8%.
Adjusted EBITDA decreased $8.5 million, or 1.6%, to $539.1 million for the year ended December 31, 2015 compared to Adjusted EBITDA of $547.6 million for the year ended December 31, 2014. The decrease in Adjusted EBITDA for the year ended December 31, 2015 was primarily driven by unfavorable impacts of currency exchange across all regions, due mainly to the weakening Euro and certain currencies within Latin America compared to the U.S. dollar. This decrease was partially offset by higher average selling prices primarily within Latin America. Further offsetting the decline were increases driven by higher volumes and lower variable costs. Additionally, dividends from our consolidated joint ventures to our noncontrolling partners negatively impacted Adjusted EBITDA by $3.1 million for the year ended December 31, 2015 as compared to $0.1 million for the year ended December 31, 2014.
Transportation Coatings Segment
Net sales decreased $74.6 million, or 4.2%, to $1,702.1 million for the year ended December 31, 2015 compared to net sales of $1,776.7 million for the year ended December 31, 2014. The decrease in net sales for the year ended December 31, 2015 was primarily driven by unfavorable impacts of currency exchange across all regions, which contributed to an approximately 9.6% reduction in net sales resulting primarily from the impacts of the weakening Euro and certain currencies within Latin America compared to the U.S. dollar. Further contributing to the decline in net sales was a 0.2% decrease in average selling prices primarily within North America, Europe and Asia. The decrease in net sales was partially offset by volume increases primarily within North America and Asia, which contributed to a net sales increase of 5.6%.
Adjusted EBITDA increased $35.2 million, or 12.0%, to $328.1 million for the year ended December 31, 2015 compared to Adjusted EBITDA of $292.9 million for the year ended December 31, 2014. The increase in Adjusted EBITDA for the year ended December 31, 2015 was primarily driven by higher volumes and lower variable costs. This increase was partially offset by unfavorable impacts of the weakening Euro and certain currencies within Latin America compared to the U.S. dollar.
LIQUIDITY AND CAPITAL RESOURCES
Our primary sources of liquidity are cash on hand, cash flow from operations and available borrowing capacity under our Senior Secured Credit Facilities.
At
December 31, 2016
, availability under the Revolving Credit Facility was
$378.7 million
, net of
$21.3 million
of letters of credit outstanding. All such availability may be utilized without violating any covenants under the credit agreement governing such facility or the indentures governing the New Senior Notes. At
December 31, 2016
, we had $7.2 million of outstanding borrowings under other lines of credit. Our remaining available borrowing capacity under other lines of credit in certain non-U.S. jurisdictions totaled $5.8 million.
51
We or our affiliates, at any time and from time to time, may purchase shares of our common stock, the New Senior Notes or other indebtedness. Any such purchases may be made through the open market or privately negotiated transactions with third parties or pursuant to one or more redemption, tender or exchange offers or otherwise, upon such terms and at such prices, as well as with such consideration, as we, or any of our affiliates, may determine.
Our operations in Venezuela are subject to foreign exchange and price controls which have historically limited our ability to convert Venezuelan bolivars to U.S. dollars and transfer funds out of Venezuela. Approximately 0.5% and 2.7% of the consolidated cash and cash equivalents as of
December 31, 2016
and 2015, respectively, were held in Venezuela. In Venezuela, government restrictions on the transfer of cash out of the country have limited our ability to repatriate cash. We do not consider the net assets of Venezuela to be integral to our ability to service our debt and operational requirements.
Cash Flows
Years ended December 31, 2016, 2015 and 2014
|
Year Ended December 31,
|
|||||||||
|
(In millions)
|
2016
|
2015
|
2014
|
||||||
|
Net cash provided by (used for):
|
|||||||||
|
Operating activities:
|
|||||||||
|
Net income
|
$
|
47.6
|
|
$
|
97.9
|
|
$
|
34.7
|
|
|
Depreciation and amortization
|
322.1
|
|
307.7
|
|
308.7
|
|
|||
|
Amortization of financing costs and original issue discount
|
17.8
|
|
20.6
|
|
21.0
|
|
|||
|
Debt extinguishment
|
97.6
|
|
2.5
|
|
6.1
|
|
|||
|
Deferred income taxes
|
(14.2
|
)
|
(5.0
|
)
|
(38.2
|
)
|
|||
|
Realized and unrealized foreign exchange losses, net
|
35.5
|
|
93.7
|
|
75.1
|
|
|||
|
Stock-based compensation
|
41.1
|
|
30.2
|
|
8.0
|
|
|||
|
Asset impairments
|
68.4
|
|
30.6
|
|
—
|
|
|||
|
Other non-cash items
|
(1.9
|
)
|
12.5
|
|
(25.3
|
)
|
|||
|
Net income adjusted for non-cash items
|
614.0
|
|
590.7
|
|
390.1
|
|
|||
|
Changes in operating assets and liabilities
|
(54.7
|
)
|
(180.9
|
)
|
(138.7
|
)
|
|||
|
Operating activities
|
559.3
|
|
409.8
|
|
251.4
|
|
|||
|
Investing activities
|
(257.0
|
)
|
(166.2
|
)
|
(173.8
|
)
|
|||
|
Financing activities
|
(232.6
|
)
|
(84.7
|
)
|
(123.2
|
)
|
|||
|
Effect of exchange rate changes on cash
|
(19.3
|
)
|
(58.0
|
)
|
(26.9
|
)
|
|||
|
Net increase (decrease) in cash
|
$
|
50.4
|
|
$
|
100.9
|
|
$
|
(72.5
|
)
|
Year Ended December 31, 2016
Net Cash Provided by Operating Activities
Net cash provided by operating activities for the year ended December 31, 2016 was
$559.3 million
. Net income before deducting depreciation, amortization and other non-cash items generated cash of
$614.0 million
. This was partially offset by net increases in operating assets and liabilities of $
54.7 million
. The most significant drivers were increases in accounts receivables and other assets of $132.3 million primarily due to the seasonal timing of net sales and upfront customer payments, offset by net increases in current and non-current liabilities of $79.3 million primarily related to cost savings initiatives and timing of operating activities, which includes increases in accounts payable of $32.3 million.
Net Cash Used in Investing Activities
Net cash used in investing activities for the year ended December 31, 2016 was
$257.0 million
. This use was substantially driven by purchases of property, plant and equipment of
$136.2 million
, business acquisitions of
$114.8 million
(net of cash acquired), and
$6.0 million
of other investing activities that includes $3.9 million of asset acquisitions.
52
Net Cash Used in Financing Activities
Net cash used in financing activities for the year ended December 31, 2016 was
$232.6 million
. This use was driven by payments of
$1,755.7 million
relating to the redemption of our 2021 Dollar and Euro Senior Notes, the net paydown and early repayments of our 2020 Term Loans, and quarterly principal payments as required under the Credit Agreement. These payments were offset by proceeds of $
1,604.3 million
relating to the issuance of our new 2024 Dollar and Euro Senior Notes and our new 2025 Euro Senior Notes, as well as the increase in principal on our 2023 Euro Term Loans as a part of the refinancing. The issuance and refinancing of our new indebtedness required us to pay financing costs of
$86.3 million
, which included a premium for early redemption of our 2021 Dollar and Euro Senior Notes of $56.6 million.
In addition, we had cash received from stock options exercised for
$16.7 million
, which is offset by repayments of short-term borrowings of
$8.6 million
, dividends paid to noncontrolling interests of
$3.0 million
, and
$0.2 million
of other financing activities.
Other Impacts on Cash
Currency exchange impacts on cash for the year ended December 31, 2016 were
$19.3 million
primarily driven by the impacts on cash resulting from the weakening of our translation rates compared to the U.S. dollar for our Venezuelan subsidiary which contributed $14.0 million.
Year Ended December 31, 2015
Net Cash Provided by Operating Activities
Net cash provided by operating activities for the year ended
December 31, 2015
was
$409.8 million
.
Net income before deducting depreciation, amortization and other non-cash items generated cash of
$590.7 million
. This was partially offset by net increases in operating assets and liabilities of
$180.9 million
. The most significant drivers in working capital were increases in accounts receivables and other assets of
$126.7 million
due primarily to the mix of credit terms which drove an increase in days sales outstanding and increased inventory builds of
$35.2 million
to support ongoing operational demands. Cash flows associated with accounts payable and other liabilities of
$29.1 million
related to payments of normal operating activities incurred in 2014 and paid during 2015.
Net Cash Used for Investing Activities
Net cash used for investing activities for the year ended December 31, 2015 was
$166.2 million
.
This use was primarily driven by purchases of property, plant and equipment of
$138.1 million
and acquisitions of
$29.6 million
(net of cash received).
Net Cash Used for Financing Activities
Net cash used for financing activities for the year ended December 31, 2015 was
$84.7 million
. Th
e change was primarily driven by repayment of term lo
ans of
$127.3 million
. T
hese payments were comprised of
a
$100.0 million
p
repayment on our 2020 Dollar Term Loans made during the year ended December 31, 2015, along wi
th
$27.3 million
of
quarterly principal repayments as required under the Credit Agreement. In addition to these payments, we also paid dividends to non-controlling interests of
$4.7 million
. Offsetting these payments were cash received from stock option exercises for
$62.4 million
, and proceeds received from short-term borrowings during the period of
$2.0 million
.
Other Impacts on Cash
Currency exchange impacts on cash for the year ended December 31, 2015 were
$58.0 million
primarily driven by the impacts on cash resulting from the weakening of our translation rates compared to the U.S. dollar for our Venezuelan subsidiary which contributed $37.4 million.
Year ended December 31, 2014
Net Cash Provided by Operating Activities
Net cash provided by operating activities for the year ended December 31, 2014 was
$251.4 million
. Net income before deducting depreciation, amortization and other non-cash items generated cash of
$390.1 million
. This was partially offset by net increases in operating assets and liabilities of
$138.7 million
. The most significant drivers in working capital were increases in receivables, inventory and other assets of $119.0 million due primarily to increased net sales and inventory builds to support ongoing operational demands compared to the year ended December 31, 2013, as well as reductions of other accrued liabilities of $54.8 million primarily related to the payment of transition-related costs, including restructuring costs, partially offset by a $53.6 million increase in accounts payable.
53
Net Cash Used for Investing Activities
Net cash used for investing activities for the year ended December 31, 2014 was
$173.8 million
. This use was driven primarily by purchases of property, plant and equipment of
$188.4 million
and the purchase of increased ownership in a majority owned joint venture of $6.5 million, partially offset by $21.3 million of proceeds from sales of assets. Purchases of property, plant and equipment includes approximately $74.8 million associated with our transition-related capital projects including our information technology systems and finalization of our transition of our global office relocations.
Net Cash Provided by Financing Activities
Net cash used for financing activities for the year ended December 31, 2014 was
$123.2 million
. The change was primarily driven by repayments of term loans of
$121.1 million
. These payments were comprised of a $100.0 million prepayment on our 2020 Dollar Term Loans made during the year ended December 31, 2014, along with $21.1 million of quarterly principal repayments as required under the Credit Agreement. In addition, we repaid short-term borrowings of
$33.8 million
partially offset by proceeds received from short-term borrowing during the period of
$30.7 million
. During the year ended December 31, 2014, we paid $3.0 million in fees related to the amendment of the Senior Secured Credit Facilities. We received
$2.5 million
through the sale of common shares during the year ended December 31, 2014. We also received
$3.0 million
related to the exercise of stock options. Dividends paid to noncontrolling interests totaled
$2.2 million
for the year ended December 31, 2014.
Other Impacts on Cash
Currency exchange impacts on cash for the year ended December 31, 2014 were
$26.9 million
driven by the impacts on cash resulting from the weakening of our translation rates compared to the U.S. dollar for our various foreign subsidiaries.
Financial Condition
We had cash and cash equivalents at
December 31, 2016
and
2015
of
$535.4 million
and
$485.0 million
, respectively. Of these balances, $366.7 million and $372.6 million were maintained in non-U.S. jurisdictions as of
December 31, 2016
and
2015
, respectively. We believe our organizational structure allows us the necessary flexibility to move funds throughout our subsidiaries to meet our operational working capital needs.
Our business may not generate sufficient cash flow from operations and future borrowings may not be available under our Senior Secured Credit Facilities in an amount sufficient to enable us to pay our indebtedness, or to fund our other liquidity needs, including planned capital expenditures. In such circumstances, we may need to refinance all or a portion of our indebtedness on or before maturity. We may not be able to refinance any of our indebtedness on commercially reasonable terms or at all. If we cannot service our indebtedness, we may have to take actions such as selling assets, seeking additional equity or reducing or delaying capital expenditures, strategic acquisitions, investments and alliances. See Part I, Item 1A, “Risk Factors-Risks Related to our Indebtedness-To service all of our indebtedness, we will require a significant amount of cash and our ability to generate cash depends on many factors beyond our control.” Our primary sources of liquidity are cash on hand, cash flow from operations and available borrowing capacity under our Revolving Credit Facility. Based on our forecasts, we believe that cash flow from operations, available cash on hand and available borrowing capacity under our Senior Secured Credit Facilities and existing lines of credit will be adequate to service debt, fund our cost-savings initiatives, meet liquidity needs and fund necessary capital expenditures for the next twelve months.
Our ability to make scheduled payments of principal or interest on, or to refinance, our indebtedness or to fund working capital requirements, capital expenditures and other current obligations will depend on our ability to generate cash from operations. Such cash generation is subject to general economic, financial, competitive, legislative, regulatory and other factors that are beyond our control.
If required, our ability to raise additional financing and our borrowing costs may be impacted by short and long-term debt ratings assigned by independent rating agencies, which are based, in significant part, on our performance as measured by certain credit metrics such as interest coverage and leverage ratios. Our highly leveraged nature may limit our ability to procure additional financing in the future.
54
The following table details our borrowings outstanding at the periods indicated:
|
December 31,
|
||||||
|
(In millions)
|
2016
|
2015
|
||||
|
2020 Dollar Term Loans
|
$
|
—
|
|
$
|
2,042.5
|
|
|
2020 Euro Term Loans
|
—
|
|
428.0
|
|
||
|
2023 Dollar Term Loans
|
1,545.0
|
|
—
|
|
||
|
2023 Euro Term Loans
|
417.6
|
|
—
|
|
||
|
2021 Dollar Senior Notes
|
—
|
|
750.0
|
|
||
|
2021 Euro Senior Notes
|
—
|
|
274.4
|
|
||
|
2024 Dollar Senior Notes
|
500.0
|
|
—
|
|
||
|
2024 Euro Senior Notes
|
349.7
|
|
—
|
|
||
|
2025 Euro Senior Notes
|
469.8
|
|
—
|
|
||
|
Short-term and other borrowings
|
39.8
|
|
26.5
|
|
||
|
Unamortized original issue discount
|
(10.0
|
)
|
(14.0
|
)
|
||
|
Deferred financing costs, net
|
(48.0
|
)
|
(65.9
|
)
|
||
|
$
|
3,263.9
|
|
$
|
3,441.5
|
|
|
|
Less:
|
||||||
|
Short term borrowings
|
$
|
8.3
|
|
$
|
22.7
|
|
|
Current portion of long-term borrowings
|
19.6
|
|
27.4
|
|
||
|
Long-term debt
|
$
|
3,236.0
|
|
$
|
3,391.4
|
|
Our indebtedness, including the Senior Secured Credit Facilities, 2021 Senior Notes and New Senior Notes, are more fully described in Note 21 to the consolidated financial statements included elsewhere in this Annual Report on Form 10-K.
Our liquidity requirements are significant due to the highly leveraged nature of our company as well as our working capital requirements. At
December 31, 2016
and
2015
, there were no borrowings under the Revolving Credit Facility with total availability under the Revolving Credit Facility of
$378.7 million
and
$375.1 million
,
respectively, all of which may be borrowed by us without violating any covenants under the credit agreement governing such facility or the indentures governing the New Senior Notes.
The following tables detail our borrowings outstanding and the associated interest expense, including amortization of debt issuance costs and debt discounts, and average effective interest rates for such borrowings for the years ended
December 31, 2016
and
2015
, respectively:
|
Year Ended December 31, 2016
|
||||||||
|
(In millions)
|
Principal
|
Average Effective
Interest Rate
|
Interest
Expense
|
|||||
|
Term Loans
|
$
|
1,962.6
|
|
4.4
|
%
|
$
|
100.3
|
|
|
Revolving Credit Facility
|
—
|
|
N/A
|
|
3.0
|
|
||
|
Senior Notes
|
1,319.5
|
|
6.1
|
%
|
69.9
|
|
||
|
Short-term and other borrowings
|
39.8
|
|
Various
|
|
5.0
|
|
||
|
Total
|
$
|
3,321.9
|
|
$
|
178.2
|
|
||
|
Year Ended December 31, 2015
|
||||||||
|
(In millions)
|
Principal
|
Average Effective
Interest Rate
|
Interest
Expense
|
|||||
|
Term Loans
|
$
|
2,470.5
|
|
4.6
|
%
|
$
|
112.7
|
|
|
Revolving Credit Facility
|
—
|
|
N/A
|
|
3.9
|
|
||
|
Senior Notes
|
1,024.4
|
|
7.4
|
%
|
75.4
|
|
||
|
Short-term and other borrowings
|
26.5
|
|
Various
|
|
1.2
|
|
||
|
Total
|
$
|
3,521.4
|
|
$
|
193.2
|
|
||
55
Contractual Obligations
The following table summarizes our contractual obligations at
December 31, 2016
:
|
Contractual Obligations Due In:
|
|||||||||||||||
|
(In millions)
|
Total
|
2017
|
2018-2019
|
2020-2021
|
Thereafter
|
||||||||||
|
Debt, including current portion (1)
|
|||||||||||||||
|
Senior Secured Credit Facilities, consisting of the following:
|
|||||||||||||||
|
Term Loan Facilities:
|
|||||||||||||||
|
2023 Dollar Term Loans
|
$
|
1,545.0
|
|
$
|
15.5
|
|
$
|
30.9
|
|
$
|
30.9
|
|
$
|
1,467.7
|
|
|
2023 Euro Term Loans
|
417.6
|
|
4.2
|
|
8.4
|
|
8.4
|
|
396.6
|
|
|||||
|
Senior Notes, consisting of the following:
|
|||||||||||||||
|
2024 Dollar Senior Notes
|
500.0
|
|
—
|
|
—
|
|
—
|
|
500.0
|
|
|||||
|
2024 Euro Senior Notes
|
349.7
|
|
—
|
|
—
|
|
—
|
|
349.7
|
|
|||||
|
2025 Euro Senior Notes
|
469.8
|
|
—
|
|
—
|
|
—
|
|
469.8
|
|
|||||
|
Other borrowings (2)
|
10.8
|
|
8.2
|
|
1.6
|
|
0.5
|
|
0.5
|
|
|||||
|
Interest payments (3)
|
854.3
|
|
127.0
|
|
252.0
|
|
248.6
|
|
226.7
|
|
|||||
|
Sale-leaseback financing (4)
|
27.4
|
|
1.0
|
|
3.4
|
|
3.4
|
|
19.6
|
|
|||||
|
Operating leases
|
215.6
|
|
37.7
|
|
53.2
|
|
33.8
|
|
90.9
|
|
|||||
|
Pension contributions (5)
|
12.8
|
|
12.8
|
|
—
|
|
—
|
|
—
|
|
|||||
|
Purchase obligations (6)
|
198.9
|
|
61.2
|
|
117.6
|
|
7.3
|
|
12.8
|
|
|||||
|
Uncertain tax positions, including interest and penalties (7)
|
—
|
|
—
|
|
—
|
|
—
|
|
—
|
|
|||||
|
Total
|
$
|
4,601.9
|
|
$
|
267.6
|
|
$
|
467.1
|
|
$
|
332.9
|
|
$
|
3,534.3
|
|
|
(1)
|
During the year ended December 31, 2016 we refinanced our 2021 Dollar Senior Notes with 2024 Senior Notes and our 2021 Euro Senior Notes with our 2025 Senior Notes and refinanced our 2020 Dollar Term Loans and 2020 Euro Term Loans with 2023 Dollar Term Loans and 2023 Euro Term Loans (see Note 21 to the consolidated financial statements included elsewhere in this Annual Report on Form 10-K). This resulted in a significant increase in our obligations for the years thereafter 2021. Amounts assume that the Senior Secured Credit Facilities and New Senior Notes are repaid upon maturity, and the Revolving Credit Facility remains undrawn, which may or may not reflect future events.
|
|
(2)
|
Other borrowings excludes debt associated with a lease treated as indebtedness, discussed within end-note 4, below, and a build-to-suit lease arrangement, as these amounts do not reflect the contractual cash obligations of the Company.
|
|
(3)
|
Future interest payments include commitment fees on the unused portion of the Revolving Credit Facility, and reflect the interest payments on our New Dollar Term Loans, New Euro Term Loans and the New Senior Notes. Future interest payments assume December 31, 2016 interest rates will prevail throughout all future periods. Represents the timing of interest accruals. Actual interest payments and repayment amounts may change.
|
|
(4)
|
During the year ended December 31, 2016 we began treating one of our leases as a sale-leaseback financing obligation, which was previously treated as a build-to-suit lease (discussed further at Note 8 to the consolidated financial statements included elsewhere in this Annual Report on Form 10-K). The cash rental costs to be paid over the term of the lease are reflected within the table above.
|
|
(5)
|
We expect to make contributions to our defined benefit pension plans beyond 2017; however, the amount of any contributions are dependent on the future economic environment and investment returns, and we are unable to reasonably estimate the pension contributions beyond 2017.
|
|
(6)
|
During the year ended December 31, 2016 we completed two business acquisitions, which required certain commitments, including to fund the remaining purchase price, acquire remaining interests and pay contingent consideration. At December 31, 2016 we are committed to pay $3.9 million during the year ended 2017, and $32.0 million during each of the years ended December 31, 2018 and 2019. Commitments related to contingent consideration arrangements are subject to change based on future performance.
|
|
(7)
|
At December 31, 2016, we had approximately $13.4 million of gross uncertain tax positions, including interest and penalties that could result in potential payments. Due to the high degree of uncertainty regarding future timing of cash flows associated with these liabilities, we are unable to estimate the years in which settlement will occur with the respective taxing authorities.
|
56
Scheduled Maturities
Below is a schedule of required future repayments of all borrowings outstanding at
December 31, 2016
.
|
(In millions)
|
|||
|
2017
|
$
|
27.9
|
|
|
2018
|
21.3
|
|
|
|
2019
|
20.5
|
|
|
|
2020
|
20.4
|
|
|
|
2021
|
20.3
|
|
|
|
Thereafter
|
3,193.8
|
|
|
|
Total
|
$
|
3,304.2
|
|
Off Balance Sheet Arrangements
We directly guarantee certain obligations under agreements with third parties. As of
December 31, 2016
and
2015
these off balance sheet arrangements were not material to our consolidated financial statements included elsewhere in this Annual Report on Form 10-K.
Recent Accounting Guidance
See Note 4 to the consolidated financial statements included elsewhere in this Annual Report on Form 10-K for a summary of recent accounting guidance.
CRITICAL ACCOUNTING POLICIES AND ESTIMATES
Our discussion and analysis of results of operations and financial condition are based upon our financial statements. These financial statements have been prepared in accordance with U.S. GAAP unless otherwise noted. The preparation of these financial statements requires us to make estimates and judgments that affect the amounts reported in the financial statements. We base our estimates and judgments on historical experiences and assumptions believed to be reasonable under the circumstances and re-evaluate them on an ongoing basis. Actual results could differ from our estimates under different assumptions or conditions. Our significant accounting policies, which may be affected by our estimates and assumptions, are more fully described in Note 3 to the consolidated financial statements included elsewhere in this Annual Report on Form 10-K.
An accounting policy is deemed to be critical if it requires an accounting estimate to be made based on assumptions about matters that are highly uncertain at the time the estimate is made, and if different estimates that reasonably could have been used, or changes in the accounting estimates that are reasonably likely to occur periodically, could materially impact the financial statements. Management believes the following critical accounting policies reflect its most significant estimates and assumptions used in the preparation of the financial statements.
Accounting for Business Combinations
We account for business combinations under the acquisition method of accounting. This method requires the recording of acquired assets, including separately identifiable intangible assets, and assumed liabilities at their acquisition date fair values. The excess of the purchase price over the fair value of assets acquired and liabilities assumed is recorded as goodwill. Determining the fair value of assets acquired and liabilities assumed requires management’s judgment and often involves the use of significant estimates and assumptions, including assumptions with respect to future cash inflows and outflows, discount rates, royalty rates, asset lives and market multiples, among other items.
The fair values of intangible assets were estimated using an income approach, either the excess earnings method (customer relationships) or the relief from royalty method (technology and trademarks). Under the excess earnings method, an intangible asset’s fair value is equal to the present value of the incremental after-tax cash flows attributable solely to the intangible asset over its remaining useful life. Under the relief from royalty method, fair value is measured by estimating future revenue associated with the intangible asset over its useful life and applying a royalty rate to the revenue estimate. These intangible assets enable us to secure markets for our products, develop new products to meet the evolving business needs and competitively produce our existing products.
The fair value of real properties acquired was based on the consideration of their highest and best use in the market. The fair values of property, plant and equipment, other than real properties, were based on the consideration that unless otherwise identified, they will continue to be used "as is" and as part of the ongoing business. In contemplation of the in-use premise and the nature of the assets, the fair value was developed primarily using a cost approach.
57
The determination of the fair value of assets acquired and liabilities assumed involves assessing factors such as the expected future cash flows associated with individual assets and liabilities and appropriate discount rates at the date of the acquisition.
The fair value of the noncontrolling interests, related to the acquired joint venture was estimated by applying an income approach. This fair value measurement was based on significant inputs that are not observable in the market and thus represents a fair value measurement categorized within Level 3 of the fair value hierarchy. Key assumptions in the valuation of noncontrolling interest included a discount rate, a terminal value based on a range of long-term sustainable growth rates and adjustments because of the lack of control that market participants would consider when measuring the fair value of the noncontrolling interests.
The fair value of the contingent consideration liabilities were estimated by applying an income approach using the Black-Scholes option pricing model. The fair value measurements are based on significant inputs that are not observable in the market and thus represents a fair value measurement categorized within Level 3 of the fair value hierarchy. Key assumptions in the valuation of contingent consideration liabilities included discount rates, expected terms, volatility rates and operating results as applicable based on the targets identified in the respective acquisition agreements.
The results of operations for businesses acquired are included in the financial statements from the date of the acquisition.
See Note 5 to the consolidated financial statements included elsewhere in this Annual Report on Form 10-K for further detail on the related accounting.
Asset Impairments
Factors that could result in future impairment charges, among others, include changes in worldwide economic conditions, changes in technology, changes in competitive conditions and customer preferences, and fluctuations in foreign currency exchange rates. These risk factors are discussed in Part I, Item 1A, "Risk Factors," included elsewhere in this Annual Report on Form 10-K.
Goodwill and indefinite-lived intangible assets
As discussed in Note 3 to the consolidated financial statements included elsewhere in this Annual Report on Form 10-K, the Company tests goodwill and identifiable intangible assets with indefinite lives for impairment at least annually as of October 1st. We initially test goodwill and indefinite-lived intangible assets for impairment by performing a qualitative evaluation. The qualitative evaluation is an assessment of factors, including reporting unit or asset specific operating results and cost factors, as well as industry, market and macroeconomic conditions, to determine whether it is more likely than not (more than 50%) that the fair values of a reporting unit or asset is less than the respective carrying amounts, including goodwill when testing goodwill for impairment. In the event the qualitative assessment indicates that an impairment is more likely than not, we would be required to perform a quantitative impairment test, otherwise no further analysis is required. We may elect to bypass this qualitative assessment for some or all of our reporting units and indefinite-lived intangible assets and perform a two-step quantitative test. Fair values under the quantitative test are estimated using a combination of discounted projected future earnings or cash flow methods, that are based on projections of the amounts and timing of future revenue and cash flows, and multiples of earnings in estimating fair value.
For the
2016
impairment tests of our goodwill and indefinite-lived intangible assets, management concluded that the carrying values equaled or exceeded the respective fair values and no impairments existed.
The inputs utilized in a quantitative analysis are classified as Level 3 inputs within the fair value hierarchy as defined in ASC 820,
Fair Value Measurement
. The process of evaluating the potential impairment of goodwill and indefinite-lived intangible assets is subjective because it requires the use of estimates and assumptions as to our future cash flows, discount rates commensurate with the risks involved in the assets, future economic and market conditions, as well as other key assumptions. We believe that the amounts recorded in the financial statements related to goodwill and indefinite-lived intangible assets are based on the best estimates and judgments of the appropriate Axalta management, although actual outcomes could differ from our estimates.
Goodwill is allocated to, and evaluated for impairment at, the reporting unit level, which is defined as an operating segment or one level below an operating segment. We have two operating segments - Performance Coatings and Transportation Coatings - that also serve as our reportable segments. We have goodwill allocated to four of our five reporting units. At December 31,
2016
, our
$961.0 million
in total goodwill is allocated to reportable segments as follows:
$886.5 million
in Performance Coatings and
$74.5 million
in Transportation Coatings.
Other intangible assets
Definite-lived intangible assets, such as technology, trademarks, customer relationships and non-compete agreements are amortized over their estimated useful lives, generally for periods ranging from 2 to 20 years. The reasonableness of the useful lives of these assets is continually evaluated. Once these assets are fully amortized, they are removed from the balance sheet.
58
The in-process research and development projects we acquired in conjunction with the Acquisition are considered indefinite-lived intangible assets until the abandonment or completion of the associated research and development efforts. Upon completion of the research and development process, the carrying values of acquired in process research and development projects are reclassified as definite-lived assets and are amortized over their useful lives. If the project is abandoned, we record the write-off as a loss in the statement of operations.
Long-Lived Assets
Long-lived assets, which includes property, plant and equipment, and definite-lived intangible assets, are assessed for impairment whenever events or changes in circumstances indicate the carrying amount of the asset may not be recoverable. The impairment testing involves comparing the carrying amount of the asset to the forecasted undiscounted future cash flows generated by that asset. In the event the carrying amount of the asset exceeds the undiscounted future cash flows generated by that asset and the carrying amount is not considered recoverable, an impairment exists. An impairment loss is measured as the excess of the asset’s carrying amount over its fair value. An impairment loss is recognized in the statement of operations in the period that the impairment occurs.
We evaluated the impacts to our Venezuelan operations caused by the volatility of the economic conditions in Venezuela including the weakening of the Venezuelan bolivar and general uncertainty in the political environment. During the fourth quarter of 2016, we concluded an impairment indicator existed and performed a formal recovery test on our long-lived assets resulting in an impairment to our long-lived assets of $57.9 million for the year ended December 31, 2016, comprised of a
$49.3 million
write-down to customer relationship intangibles and an
$8.6 million
write-down to the net book value of our property, plant and equipment.
The outcome of future changes in economic and political conditions within Venezuela could have a material impact on (1) our ability to predict the impacts of future sustained price increases, (2) timing of changes to inflation or exchange rates and (3) impacts on liquidity and demand from our customers. Changes in any of these assumptions may result in reductions to the estimated future cash flows of our Venezuelan subsidiary resulting in the potential further impairment to the carrying amount of the long-lived assets. Such impairment charges could materially impact our results of operations in future periods.
See Note 26 to the consolidated financial statements included elsewhere in this Annual Report on Form 10-K for further detail on Venezuela operations.
Stock-Based Compensation
Compensation expense related to service-based, non-qualified stock options is equivalent to the grant-date fair value of the awards determined under the Black-Scholes option pricing model and is being recognized as compensation expense over the service period utilizing graded vesting attribution method.
Compensation expense related to the restricted stock awards and restricted stock units is equal to the grant-date fair value of the awards determined by the closing share price on the date of the grant. The related expense is being recognized as compensation expense over the service period utilizing the graded vesting attribution method.
Compensation expense related to performance stock awards and performance share units is equivalent to the grant-date fair value of the awards determined using a valuation methodology (Monte Carlo simulation model) to account for the market conditions linked to these awards. These awards are tied to the Company’s total shareholder return ("TSR") relative to the TSR of a selected industry peer group. Each award covers a three-year performance cycle with a three-year service period vesting requirement. Awards will cliff vest upon meeting the applicable TSR thresholds and the three-year service requirement. The actual number of shares awarded is adjusted to between
zero
and
200%
of the target award amount based upon achievement of pre-determined objectives. TSR relative to peers is considered a market condition under applicable authoritative guidance. The related expense is being recognized as compensation expense over the service period utilizing the graded vesting attribution method.
We recognize compensation expense net of forfeitures, which we have elected to record at the time of occurrence.
The fair value of non-qualified stock options granted from 2014 through 2016 and the respective principal weighted average assumptions used in applying the Black-Scholes model were as follows:
|
Key Assumptions
|
2016 Grants
|
2015 Grants
|
2014 Grants
|
|||
|
Expected Term
|
6.00 years
|
|
6.00 years
|
|
7.81 years
|
|
|
Volatility
|
21.63
|
%
|
22.19
|
%
|
28.28
|
%
|
|
Dividend Yield
|
—
|
%
|
—
|
%
|
—
|
%
|
|
Discount Rate
|
1.45
|
%
|
1.79
|
%
|
2.21
|
%
|
|
Fair Value of Options Per Share
|
$5.68 - $6.95
|
|
$6.27 - $8.88
|
|
$1.51 - $3.01
|
|
59
To estimate the expected stock option term for the $5.92 and $7.21 stock options referred to in Note 10 to the consolidated financial statements, we used the simplified method, as the options strike price equaled the grant date fair value, we were a privately-held company at the grant date and we had no exercise history. Based upon this simplified method, the $5.92 and $7.21 per share stock options have an expected term of 6.5 years. The strike price for the $8.88 and $11.84 per share tranches of options exceeded the fair value at the grant date, which required the use of an estimate of an implicitly longer holding period, resulting in the term of 8.25 years.
Because we were a privately-held company with no trading history at the time of these grants, expected volatility was estimated using trading data derived from publicly held peer group companies over the expected term of the options. We do not anticipate paying cash dividends in the foreseeable future and, therefore, use an expected dividend yield of zero. The discount rate was derived from the U.S. Treasury yield curve.
For the 2014 stock awards, we estimated the per share fair value of our common shares using a contemporaneous valuation consistent with the American Institute of Certified Public Accountants Practice Aid, "Valuation of Privately-Held Company Equity Securities Issued as Compensation" (the "Practice Aid"). In conducting this valuation, we considered the objective and subjective factors that we believed to be relevant, including our best estimate of our business condition, prospects and operating performance. Within this contemporaneous valuation, a range of factors, assumptions and methodologies were used. The significant factors included:
|
•
|
the fact that we were a private company with illiquid securities;
|
|
•
|
our historical operating results;
|
|
•
|
our discounted future cash flows, based on our projected operating results;
|
|
•
|
valuations of comparable public companies; and
|
|
•
|
the risk involved in the investment, as related to earnings stability, capital structure, competition and market potential.
|
For the contemporaneous valuation of our common shares, management estimated, as of the issuance date, our enterprise value on a continuing operations basis, using the income and market approaches, as described in the Practice Aid. The income approach utilized the discounted cash flow ("DCF") methodology based on our financial forecasts and projections, as detailed below. The market approach utilized the Guideline Public Company and Guideline Transactions methods, as detailed below.
For the DCF methodology, we prepared annual projections of future cash flows through 2018. Beyond 2018, projected cash flows through the terminal year were projected at long-term sustainable growth rates consistent with long-term inflationary and industry expectations. Our projections of future cash flows were based on our estimated net debt-free cash flows and were discounted to the valuation date using a weighted-average cost of capital estimated based on market participant assumptions.
For the Guideline Public Company and Guideline Transactions methods, we identified a group of comparable public companies and recent transactions within the chemicals industry. For the comparable companies, we estimated market multiples based on trading prices and trailing 12 months EBITDA. These multiples were then applied to our trailing 12 months EBITDA. When selecting comparable companies, consideration was given to industry similarity, their specific products offered, financial data availability and capital structure.
For the comparable transactions, we estimated market multiples based on prices paid for the related transactions and trailing 12 months EBITDA. These multiples were then applied to our trailing 12 months EBITDA. The results of the market approaches corroborated the fair value determined using the income approach.
Awards issued subsequent to our IPO have been, and will continue to be, valued based on the closing market price of the shares on the date of the grant.
See Note 10 to the consolidated financial statements included elsewhere in this Annual Report on Form 10-K for further detail on stock based compensation.
Retirement Benefits
The amounts recognized in the audited financial statements related to pension and other long-term employee benefits are determined from actuarial valuations. Inherent in these valuations are assumptions including expected return on plan assets, discount rates at which liabilities could have been settled, rate of increase in future compensations levels, and mortality rates. These assumptions are updated annually and are disclosed in Note 9 to the consolidated financial statements included elsewhere in this Annual Report on Form 10-K. In accordance with U.S. GAAP, actual results that differed from the assumptions are accumulated and amortized over future periods and therefore, affect expense recognized and obligations recorded in future periods.
60
For the majority of our defined benefit pension obligations, we utilize prevailing long-term high quality corporate bond indices applicable to the respective country at each measurement date. In countries where established corporate bond markets do not exist, we utilize other index movement and duration analysis to determine discount rates. The calculation separately discounts benefit payments using the spot rates from a long-term, high-quality corporate bond yield curve.
The estimated impact of a 100 basis point increase of the discount rate to the net periodic benefit cost for 2017 would result in an increase of $0.4 million, while the impact of a 100 basis point decrease of the discount rate would result in an increase of approximately $0.2 million. The estimated impact of a 100 basis point increase of the expected return on asset assumption on the net periodic benefit cost for 2016 would result in a decrease of approximately $2.1 million, while the impact of a 100 basis point decrease would result in an increase of $2.1 million.
Income taxes
The provision for income taxes was determined using the asset and liability approach of accounting for income taxes. Under this approach, deferred taxes represent the future tax consequences expected to occur when the reported amounts of assets and liabilities are recovered or paid. The provision for income taxes represents income taxes paid or payable for the current year plus the change in deferred taxes during the period. Deferred taxes result from differences between the financial and tax basis of our assets and liabilities and are adjusted for changes in tax rates and tax laws when changes are enacted. Valuation allowances are recorded to reduce deferred tax assets when it is more likely than not that a tax benefit will not be realized. Deferred tax assets and liabilities are measured using enacted tax rates applicable in the years in which they are expected to be recovered or settled. The effect on deferred tax assets and liabilities of a change in tax law is recognized in income in the period that includes the enactment date.
At December 31, 2016, we had a net deferred tax asset balance of $153.9 million, after valuation allowances of $135.4 million. At December 31, 2015, we had a net deferred tax asset balance of $124.6 million, after valuation allowances of $127.8 million. Such assets arise because of temporary differences between the financial reporting and tax bases of assets and liabilities, as well as from net operating loss, interest and tax credit carryforwards. The Company records a valuation allowance if, based upon the weight of the available evidence, it is more likely than not that some or all of the deferred tax assets will not be realized. The Company must generate approximately $384.5 million of taxable income to fully realize its consolidated net deferred tax assets as of December 31, 2016.
We evaluate the recoverability of deferred tax assets on a jurisdictional basis by assessing the adequacy of future expected taxable income from all sources, including the reversal of taxable temporary differences, forecasted core business earnings and available tax planning strategies. Of our net deferred tax asset balance as of December 31, 2016, $234.9 million relates to our operations within the U.S. In instances where we are in a three-year cumulative loss, including the U.S., we assess all positive and negative factors including any potential aberrational items which may be included within our taxable results. The aberrational items which have impacted our results include transition-related costs associated with the separation from our Predecessor coupled with significant taxable losses associated with the exercises of pre-IPO stock options that were deep in the money at the time they were exercised, as well as debt extinguishment and refinancing related costs. We believe, and have assumed, these types of losses are not indicative of our core earnings for purposes of assessing the appropriateness of a valuation allowance. Assumptions around sources of taxable income inherently rely heavily on estimates. We use our historical experience and our short and long-range business forecasts to provide insight. While the Company believes that its judgements and estimations regarding deferred tax assets are appropriate, significant differences in actual experience may require the Company to adjust its valuation allowance and could materially affect the Company’s future financial results.
We provide for income and foreign withholding taxes, where applicable, on unremitted earnings of all subsidiaries and related companies to the extent that such earnings are not deemed to be permanently invested. At December 31,
2016
and
2015
deferred income taxes of approximately
$5.8 million
and
$6.3 million
have been provided on such subsidiary earnings, respectively. At December 31, 2016, and 2015, we have not recorded a deferred tax liability related to withholding taxes of approximately $3.0 million and $1.4 million, respectively, on unremitted earnings of subsidiaries that are permanently invested.
The breadth of our operations and the global complexity of tax regulations require assessments of uncertainties and judgments in estimating taxes we will ultimately pay. The final taxes paid are dependent upon many factors, including negotiations with taxing authorities in various jurisdictions, outcomes of tax litigation and resolution of disputes arising from federal, state and international tax audits in the normal course of business. A liability for unrecognized tax benefits is recorded when management concludes that the likelihood of sustaining such positions upon examination by taxing authorities is less than "more likely than not." Interest and penalties accrued related to unrecognized tax benefits are included in the provision for income taxes. At December 31,
2016
and
2015
, the Company had gross unrecognized tax benefits for both domestic and foreign operations of
$12.3 million
and
$4.7 million
, respectively.
See Note 13 to the consolidated financial statements included elsewhere in this Annual Report on Form 10-K for further detail on our accounting for income taxes.
61
Derivatives and Hedging
For derivatives designated as cash flow hedges, if any, we measure hedge effectiveness by formally assessing, at least quarterly, the probable high correlation of the expected future cash flows of the hedged item and the derivative hedging instrument. The ineffective portions of the hedges are recorded in the consolidated statement of operations in the current period. If the hedging relationship ceases to be highly effective or it becomes probable that an expected transaction will no longer occur, future gains or losses on the derivative instrument are recorded in the statement of operations.
We account for interest rate swaps related to our existing long-term borrowings as cash flow hedges. As of December 31, 2016 the fair values of the derivatives are classified as current in the balance sheet based upon the maturity of the underlying derivative in 2017. The effective portions of the changes in the fair values of these derivatives are recorded in other comprehensive income and are reclassified to interest expense in the period in which earnings are impacted by the hedged items or in the period that the transaction no longer qualifies as a cash flow hedge. The ineffective portions of the changes in fair values of the derivatives are recorded in interest expense in the period ineffectiveness is determined.
If no hedging relationship is designated, derivatives are marked to market through the statement of operations. Cash flows from derivatives are recognized in the statement of cash flows in a manner consistent with the underlying transactions.
See Note 23 to the consolidated financial statements included elsewhere in this Annual Report on Form 10-K for further detail on our derivatives and hedging instruments.
Foreign Currency Translation
Our reporting currency is the U.S. dollar. As a result of the Acquisition, we reevaluated our functional currency accounting conclusions. Due primarily to our new legal entity organization structure, global cash management and raw material sourcing strategies, we determined that the functional currency of certain subsidiaries operating outside of the United States is the local currency of the respective subsidiaries. Assets and liabilities of these operations are translated into U.S. dollars at end-of-period exchange rates; income and expenses are translated using the average exchange rates for the reporting period. Resulting cumulative translation adjustments are recorded as a component of shareholders’ equity in the consolidated balance sheet.
Gains and losses from transactions denominated in foreign currencies other than an entities’ functional currency are included in the consolidated statement of operations in other expense, net.
Allowance for doubtful accounts
We maintain an allowance for doubtful accounts that reduces receivables to amounts that are expected to be collected. In estimating the allowance, management considers factors such as current overall geographic and industry-specific economic conditions, statutory requirements, accounts receivable turnover, historical and anticipated customer performance, historical experience with write-offs as a standalone company and the level of past-due amounts. Changes in these conditions may result in additional allowances. After all attempts to collect a receivable have failed and local legal requirements are met, the receivable is written off against the allowance.
Contingencies
Contingencies, by their nature, relate to uncertainties that require management to exercise judgment both in assessing the likelihood that a liability has been incurred as well as in estimating the amount of potential loss. The most important contingencies impacting our financial statements are those related to environmental remediation, pending or threatened litigation against the Company and the resolution of matters related to open tax years.
Environmental remediation costs are accrued when it is probable that a liability has been incurred and the amount can be reasonably estimated. Estimates of environmental reserves require evaluating government regulation, available technology, site-specific information and remediation alternatives. We accrue an amount equal to our best estimate of the costs to remediate based upon the available information. The extent of environmental impacts may not be fully known and the processes and costs of remediation may change as new information is obtained or technology for remediation is improved. Our process for estimating the expected cost for remediation considers the information available, technology that can be utilized and estimates of the extent of environmental damage. Adjustments to our estimates are made periodically as additional information received as remediation progresses.
62
We are subject to legal proceedings and claims arising out of our business operations. We routinely assess the likelihood of any adverse outcomes to these matters, as well as ranges of probable losses. A determination of the amount of the reserves required, if any, for these contingencies is made after analysis of each known claim. We have an active risk management program consisting of numerous insurance policies secured from many carriers. These policies often provide coverage that is intended to minimize the financial impact, if any, of the legal proceedings. The required reserves may change in the future due to new developments in each matter.
For more information on these matters, see Note 8 and Note 13 to the consolidated financial statements included elsewhere in this Annual Report on Form 10-K.
63
We are exposed to changes in interest rates and foreign currency exchange rates because we finance certain operations through fixed and variable rate debt instruments and denominate our transactions in a variety of foreign currencies. We are also exposed to changes in the prices of certain commodities that we use in production. Changes in these rates and commodity prices may have an impact on future cash flow and earnings.
We manage these risks through normal operating and financing activities and, when deemed appropriate, through the use of derivative financial instruments. We do not enter into derivative financial instruments for trading or speculative purposes.
By using derivative instruments, we are subject to credit and market risk. The fair market value of the derivative instruments is determined by using valuation models whose inputs are derived using market observable inputs, including interest rate yield curves, as well as foreign exchange and commodity spot and forward rates, and reflects the asset or liability position as of the end of each reporting period. When the fair value of a derivative contract is positive, the counterparty owes us, thus creating a receivable risk for us. We are exposed to counterparty credit risk in the event of non-performance by counterparties to our derivative agreements. We minimize counterparty credit (or repayment) risk by entering into transactions with major financial institutions of investment grade credit rating.
Our exposure to market risk is not hedged in a manner that completely eliminates the effects of changing market conditions on earnings or cash flow.
Interest rate risk
We are subject to interest rate market risk in connection with our borrowings. A one-eighth percent change in the applicable interest rate for borrowings under the Senior Secured Credit Facilities (assuming the Revolving Credit Facility is undrawn and to the extent that the Eurocurrency Rate (as defined in the credit agreement governing the Senior Secured Credit
Facilities) is in excess of the floor rate of the Senior Secured Credit Facilities) would have an annual impact of a benefit of approxim
ately $1.0 million o
n c
ash interest expense considering the impact of our hedging positions currently in place.
We selectively use derivative instruments to reduce market risk associated with changes in interest rates. The use of derivatives is intended for hedging purposes only and we do not enter into derivative instruments for speculative purposes.
During the year ended December 31, 2013, we entered into five interest rate swaps with notional amounts totaling
$1,173.0 million
to hedge interest rate exposures related to our variable rate borrowings under the Senior Secured Credit Facilities. The interest rate swaps qualified and were designated as cash flow hedges. The interest rate swaps are in place through September 2017. In addition to interest rate swaps, we purchased a €300.0 million 1.5% interest rate cap on our Euro Term Loans that mature on September 29, 2017. The interest rate cap is not designated as a hedging instrument. As such, the changes in fair value of the interest rate cap are recorded in interest expense in the current period.
As discussed in Note 21 to the consolidated financial statements included elsewhere in this Annual Report on Form 10-K, we took additional measures to reduce our cost of borrowing by entering into amendments to the Senior Secured Credit Facilities during the three years ended December 31, 2014 through 2016. The re-pricing enacted pursuant to the amendment reduced the margin applicable to our cost of borrowing on our Dollar Term Loans from 3.5% to 2.5% for Eurocurrency Rate Loans and from 2.5% to 1.5% for Base Rate Loans and our cost of borrowing under the Euro Term Loan facility from 4.0% to 2.25%. Prior to the Fourth Amendment, there was a provision for an additional reduction of these rates by 25 basis points if the Total Net Leverage Ratio was less than or equal to 4.50:1.00. The Fourth Amendment does not include this provision. In addition, the LIBOR floor on each term loan was reduced from 1.00% to .75% and the base rate floor on the Dollar Term Loan facility was reduced from 2.25% to 1.75%.
Foreign exchange rates risk
We are exposed to foreign currency exchange risk by virtue of the translation of our international operations from local currencies into the U.S. dollar. The majority of our net sales for the years ended December 31, 2016, 2015 and 2014 were from operations outside the United States. At December 31, 2016, 2015 and 2014, the accumulated other comprehensive loss account on the consolidated balance sheets included a cumulative translation loss of $59.5 million, $164.3 million and $101.1 million, respectively. A hypothetical 10% increase in the value of the US dollar relative to all foreign currencies would have increased the cumulative translation loss by $7.1 million. This sensitivity analysis is inherently limited as it assumes that rates of multiple foreign currencies are moving in the same direction relative to the value of the U.S. dollar.
Uncertainty in the global market conditions has resulted in, and may continue to cause, significant volatility in foreign currency exchange rates which could increase these risks, especially in Latin America, which has historically been subject to considerable foreign currency exchange rate volatility, especially in Venezuela. See further discussion in Note 26 to the consolidated financial statements included elsewhere in this Annual Report on Form 10-K.
64
In the majority of our jurisdictions, we earn revenue and incur costs in the local currency of such jurisdiction. We incur significant revenues and incur significant costs in foreign currencies including the Euro, Mexican peso, Brazilian real, the Chinese yuan/renminbi and the Venezuelan bolívar. As a result, movements in exchange rates could cause our revenues and expenses to materially fluctuate, impacting our future profitability and cash flows. Our purchases of raw materials in Latin America, EMEA and Asia Pacific and future business operations and opportunities, including the continued expansion of our business outside North America, may further increase the risk that cash flows resulting from these activities may be adversely affected by changes in currency exchange rates. If and when appropriate, we intend to manage these risks through foreign currency hedges and/or by utilizing local currency funding of these expansions. We do not intend to hold financial instruments for trading or speculative purposes.
Our 2024 and 2025 Euro Senior Notes and the Euro Term Loans are denominated in Euro. As a result, movements in the Euro exchange rate in relation to the U.S. dollar could cause the amount of Euro Senior Notes and Euro Term Loans borrowings to fluctuate, impacting our future profitability and cash flows.
Additionally, in order to fund the purchase price for certain assets of DPC and the capital stock and other equity interests of certain non-U.S. entities, a combination of equity contributions and intercompany loans were utilized to capitalize certain non-U.S. subsidiaries. In certain instances, the intercompany loans are denominated in currencies other than the functional currency of the affected subsidiaries. Where intercompany loans are not a component of permanently invested capital of the affected subsidiaries, increases or decreases in the value of the subsidiaries’ functional currency against other currencies will affect our results of operations.
Commodity price risk
We are subject to changes in our cost of sales caused by movements in underlying commodity prices (primarily oil and natural gas). Approximately
50%
of our cost of sales is represented by raw materials. A substantial portion of the purchased raw materials include monomers, pigments, resins and solvents. Our price fluctuations generally follow industry indices. We historically have not entered into long-term purchase contracts related to the purchase of raw materials. If and when appropriate, we intend to manage these risks using purchase contracts with our suppliers.
Treasury policy
Our treasury policy seeks to ensure that adequate financial resources are available for the development of our businesses while managing our currency and interest rate risks. Our policy is to not engage in speculative transactions. Our policies with respect to the major areas of our treasury activity are set forth above.
65
Report of Independent Registered Public Accounting Firm
To the Board of Directors and Shareholders of Axalta Coating Systems Ltd.
In our opinion, the accompanying consolidated balance sheets and the related consolidated statements of operations, of comprehensive income (loss), of changes in shareholders’ equity and of cash flows present fairly, in all material respects, the financial position of Axalta Coating Systems Ltd.
and its subsidiaries
at December 31, 2016 and 2015, and the results of their operations and their cash flows for each of the three years in the period ended December 31, 2016 in conformity with accounting principles generally accepted in the United States of America. In addition, in our opinion, the financial statement schedule listed in the index appearing under Item 15(a)(2) for each of the three years in the period ended December 31, 2016 presents fairly, in all material respects, the information set forth therein when read in conjunction with the related consolidated financial statements. Also in our opinion, the Company maintained, in all material respects, effective internal control over financial reporting as of December 31, 2016, based on criteria established in
Internal Control - Integrated Framework 2013
issued by the Committee of Sponsoring Organizations of the Treadway Commission (COSO). The Company’s management is responsible for these financial statements, and financial statement schedule, for maintaining effective internal control over financial reporting and for its assessment of the effectiveness of internal control over financial reporting, included in Management’s Report on Internal Control over Financial Reporting appearing under Item 9A. Our responsibility is to express opinions on these financial statements, on the financial statement schedule and on the Company’s internal control over financial reporting based on our integrated audit. We conducted our audits in accordance with the standards of the Public Company Accounting Oversight Board (United States). Those standards require that we plan and perform the audits to obtain reasonable assurance about whether the financial statements are free of material misstatement and whether effective internal control over financial reporting was maintained in all material respects. Our audits of the financial statements included examining, on a test basis, evidence supporting the amounts and disclosures in the financial statements, assessing the accounting principles used and significant estimates made by management, and evaluating the overall financial statement presentation. Our audit of internal control over financial reporting included obtaining an understanding of internal control over financial reporting, assessing the risk that a material weakness exists, and testing and evaluating the design and operating effectiveness of internal control based on the assessed risk. Our audits also included performing such other procedures as we considered necessary in the circumstances. We believe that our audits provide a reasonable basis for our opinions.
As discussed in Note 4 to the consolidated financial statements, the Company changed the manner in which it accounts for deferred income taxes and stock based compensation.
A company’s internal control over financial reporting is a process designed to provide reasonable assurance regarding the reliability of financial reporting and the preparation of financial statements for external purposes in accordance with generally accepted accounting principles. A company’s internal control over financial reporting includes those policies and procedures that (i) pertain to the maintenance of records that, in reasonable detail, accurately and fairly reflect the transactions and dispositions of the assets of the company; (ii) provide reasonable assurance that transactions are recorded as necessary to permit preparation of financial statements in accordance with generally accepted accounting principles, and that receipts and expenditures of the company are being made only in accordance with authorizations of management and directors of the company; and (iii) provide reasonable assurance regarding prevention or timely detection of unauthorized acquisition, use, or disposition of the company’s assets that could have a material effect on the financial statements.
Because of its inherent limitations, internal control over financial reporting may not prevent or detect misstatements. Also, projections of any evaluation of effectiveness to future periods are subject to the risk that controls may become inadequate because of changes in conditions, or that the degree of compliance with the policies or procedures may deteriorate.
/s/ PricewaterhouseCoopers LLP
Philadelphia, Pennsylvania
February 28, 2017
66
AXALTA COATING SYSTEMS LTD.
Consolidated Statements of Operations
(In millions, except per share data)
|
|
Year Ended December 31,
|
||||||||
|
2016
|
2015
|
2014
|
|||||||
|
Net sales
|
$
|
4,073.5
|
|
$
|
4,087.2
|
|
$
|
4,361.7
|
|
|
Other revenue
|
23.9
|
|
26.1
|
|
29.8
|
|
|||
|
Total revenue
|
4,097.4
|
|
4,113.3
|
|
4,391.5
|
|
|||
|
Cost of goods sold
|
2,527.6
|
|
2,597.3
|
|
2,897.2
|
|
|||
|
Selling, general and administrative expenses
|
962.5
|
|
914.8
|
|
991.5
|
|
|||
|
Venezuela asset impairment
|
57.9
|
|
—
|
|
—
|
|
|||
|
Research and development expenses
|
57.7
|
|
51.6
|
|
49.5
|
|
|||
|
Amortization of acquired intangibles
|
83.4
|
|
80.7
|
|
83.8
|
|
|||
|
Income from operations
|
408.3
|
|
468.9
|
|
369.5
|
|
|||
|
Interest expense, net
|
178.2
|
|
196.5
|
|
217.7
|
|
|||
|
Other expense, net
|
142.7
|
|
111.2
|
|
115.0
|
|
|||
|
Income before income taxes
|
87.4
|
|
161.2
|
|
36.8
|
|
|||
|
Provision for income taxes
|
39.8
|
|
63.3
|
|
2.1
|
|
|||
|
Net income
|
47.6
|
|
97.9
|
|
34.7
|
|
|||
|
Less: Net income attributable to noncontrolling interests
|
5.8
|
|
4.2
|
|
7.3
|
|
|||
|
Net income attributable to controlling interests
|
$
|
41.8
|
|
$
|
93.7
|
|
$
|
27.4
|
|
|
Basic net income per share
|
$
|
0.18
|
|
$
|
0.40
|
|
$
|
0.12
|
|
|
Diluted net income per share
|
$
|
0.17
|
|
$
|
0.39
|
|
$
|
0.12
|
|
|
Basic weighted average shares outstanding
|
238.1
|
|
233.8
|
|
229.3
|
|
|||
|
Diluted weighted average shares outstanding
|
244.4
|
|
239.7
|
|
230.3
|
|
|||
The accompanying notes are an integral part of these consolidated financial statements.
67
AXALTA COATING SYSTEMS LTD.
Consolidated Statements of Comprehensive Income (Loss)
(In millions)
|
|
Year Ended December 31,
|
||||||||
|
2016
|
2015
|
2014
|
|||||||
|
Net income
|
$
|
47.6
|
|
$
|
97.9
|
|
$
|
34.7
|
|
|
Other comprehensive income (loss), before tax:
|
|||||||||
|
Foreign currency translation adjustments
|
(59.5
|
)
|
(164.3
|
)
|
(101.1
|
)
|
|||
|
Unrealized gain on securities
|
0.3
|
|
0.3
|
|
0.7
|
|
|||
|
Unrealized gain (loss) on derivatives
|
2.0
|
|
(5.5
|
)
|
(4.6
|
)
|
|||
|
Unrealized loss on pension and other benefit plan obligations
|
(28.9
|
)
|
(2.2
|
)
|
(55.6
|
)
|
|||
|
Other comprehensive loss, before tax
|
(86.1
|
)
|
(171.7
|
)
|
(160.6
|
)
|
|||
|
Income tax benefit related to items of other comprehensive income
|
4.9
|
|
2.1
|
|
18.6
|
|
|||
|
Other comprehensive loss, net of tax
|
(81.2
|
)
|
(169.6
|
)
|
(142.0
|
)
|
|||
|
Comprehensive loss
|
(33.6
|
)
|
(71.7
|
)
|
(107.3
|
)
|
|||
|
Less: Comprehensive income attributable to noncontrolling interests
|
5.7
|
|
0.6
|
|
2.6
|
|
|||
|
Comprehensive loss attributable to controlling interests
|
$
|
(39.3
|
)
|
$
|
(72.3
|
)
|
$
|
(109.9
|
)
|
The accompanying notes are an integral part of these consolidated financial statements.
68
AXALTA COATING SYSTEMS LTD.
Consolidated Balance Sheets
(In millions, except per share data)
|
December 31,
|
||||||
|
2016
|
2015
|
|||||
|
Assets
|
||||||
|
Current assets:
|
||||||
|
Cash and cash equivalents
|
$
|
535.4
|
|
$
|
485.0
|
|
|
Restricted cash
|
2.7
|
|
2.7
|
|
||
|
Accounts and notes receivable, net
|
801.9
|
|
765.8
|
|
||
|
Inventories
|
529.7
|
|
530.7
|
|
||
|
Prepaid expenses and other
|
50.3
|
|
63.6
|
|
||
|
Total current assets
|
1,920.0
|
|
1,847.8
|
|
||
|
Property, plant and equipment, net
|
1,315.7
|
|
1,382.9
|
|
||
|
Goodwill
|
961.0
|
|
928.2
|
|
||
|
Identifiable intangibles, net
|
1,130.3
|
|
1,191.6
|
|
||
|
Other assets
|
527.8
|
|
479.6
|
|
||
|
Total assets
|
$
|
5,854.8
|
|
$
|
5,830.1
|
|
|
Liabilities, Shareholders’ Equity
|
|
|
||||
|
Current liabilities:
|
|
|
||||
|
Accounts payable
|
$
|
474.2
|
|
$
|
454.7
|
|
|
Current portion of borrowings
|
27.9
|
|
50.1
|
|
||
|
Other accrued liabilities
|
417.6
|
|
370.2
|
|
||
|
Total current liabilities
|
919.7
|
|
875.0
|
|
||
|
Long-term borrowings
|
3,236.0
|
|
3,391.4
|
|
||
|
Accrued pensions and other long-term employee benefits
|
249.1
|
|
252.3
|
|
||
|
Deferred income taxes
|
160.2
|
|
148.0
|
|
||
|
Other liabilities
|
32.2
|
|
22.2
|
|
||
|
Total liabilities
|
4,597.2
|
|
4,688.9
|
|
||
|
Commitments and contingent liabilities (Note 8)
|
|
|
||||
|
Shareholders’ equity
|
|
|
||||
|
Common shares, $1.00 par, 1,000.0 shares authorized, 240.5 and 237.9 shares issued and outstanding at December 31, 2016 and 2015, respectively
|
239.3
|
|
237.0
|
|
||
|
Capital in excess of par
|
1,294.3
|
|
1,238.8
|
|
||
|
Accumulated deficit
|
(47.1
|
)
|
(132.8
|
)
|
||
|
Accumulated other comprehensive loss
|
(350.4
|
)
|
(269.3
|
)
|
||
|
Total Axalta shareholders’ equity
|
1,136.1
|
|
1,073.7
|
|
||
|
Noncontrolling interests
|
121.5
|
|
67.5
|
|
||
|
Total shareholders’ equity
|
1,257.6
|
|
1,141.2
|
|
||
|
Total liabilities and shareholders’ equity
|
$
|
5,854.8
|
|
$
|
5,830.1
|
|
The accompanying notes are an integral part of these consolidated financial statements.
69
AXALTA COATING SYSTEMS LTD.
Consolidated Statement of Changes in Shareholders’ Equity
(In millions)
|
|
Common
Shares
|
Capital In
Excess Of
Par
|
Accumulated
Deficit
|
Accumulated
Other
Comprehensive
Income (Loss)
|
Noncontrolling
Interests
|
Total
|
||||||||||||
|
Balance December 31, 2013
|
$
|
229.1
|
|
$
|
1,133.7
|
|
$
|
(253.9
|
)
|
$
|
34.0
|
|
$
|
68.9
|
|
$
|
1,211.8
|
|
|
Comprehensive income (loss):
|
||||||||||||||||||
|
Net income
|
—
|
|
—
|
|
27.4
|
|
—
|
|
7.3
|
|
34.7
|
|
||||||
|
Net unrealized gain on securities, net of tax of $0.0
|
—
|
|
—
|
|
—
|
|
0.7
|
|
—
|
|
0.7
|
|
||||||
|
Net realized and unrealized loss on derivatives, net of tax of $1.7
|
—
|
|
—
|
|
—
|
|
(2.9
|
)
|
—
|
|
(2.9
|
)
|
||||||
|
Long-term employee benefit plans, net of tax of $16.9
|
—
|
|
—
|
|
—
|
|
(38.7
|
)
|
—
|
|
(38.7
|
)
|
||||||
|
Foreign currency translation, net of tax of $0.0 million
|
—
|
|
—
|
|
—
|
|
(96.4
|
)
|
(4.7
|
)
|
(101.1
|
)
|
||||||
|
Total comprehensive income (loss)
|
—
|
|
—
|
|
27.4
|
|
(137.3
|
)
|
2.6
|
|
(107.3
|
)
|
||||||
|
Equity contributions
|
0.3
|
|
2.2
|
|
—
|
|
—
|
|
—
|
|
2.5
|
|
||||||
|
Recognition of stock-based compensation
|
—
|
|
8.0
|
|
—
|
|
—
|
|
—
|
|
8.0
|
|
||||||
|
Exercises of stock options and associated tax benefits
|
0.4
|
|
2.6
|
|
—
|
|
—
|
|
—
|
|
3.0
|
|
||||||
|
Noncontrolling interests of acquired subsidiaries
|
—
|
|
(1.8
|
)
|
—
|
|
—
|
|
(2.0
|
)
|
(3.8
|
)
|
||||||
|
Dividends declared to noncontrolling interests
|
—
|
|
—
|
|
—
|
|
—
|
|
(2.2
|
)
|
(2.2
|
)
|
||||||
|
Balance December 31, 2014
|
$
|
229.8
|
|
$
|
1,144.7
|
|
$
|
(226.5
|
)
|
$
|
(103.3
|
)
|
$
|
67.3
|
|
$
|
1,112.0
|
|
|
Comprehensive income (loss):
|
||||||||||||||||||
|
Net income
|
—
|
|
—
|
|
93.7
|
|
—
|
|
4.2
|
|
97.9
|
|
||||||
|
Net unrealized gain on securities, net of tax of $0.0
|
—
|
|
—
|
|
—
|
|
0.3
|
|
—
|
|
0.3
|
|
||||||
|
Net realized and unrealized loss on derivatives, net of tax of $2.1
|
—
|
|
—
|
|
—
|
|
(3.4
|
)
|
—
|
|
(3.4
|
)
|
||||||
|
Long-term employee benefit plans, net of tax of $0.0
|
—
|
|
—
|
|
—
|
|
(2.2
|
)
|
—
|
|
(2.2
|
)
|
||||||
|
Foreign currency translation, net of tax of $0.0 million
|
—
|
|
—
|
|
—
|
|
(160.7
|
)
|
(3.6
|
)
|
(164.3
|
)
|
||||||
|
Total comprehensive income (loss)
|
—
|
|
—
|
|
93.7
|
|
(166.0
|
)
|
0.6
|
|
(71.7
|
)
|
||||||
|
Recognition of stock-based compensation
|
—
|
|
30.2
|
|
—
|
|
—
|
|
—
|
|
30.2
|
|
||||||
|
Exercises of stock options and associated tax benefits
|
7.2
|
|
63.9
|
|
—
|
|
—
|
|
—
|
|
71.1
|
|
||||||
|
Noncontrolling interests of acquired subsidiaries
|
—
|
|
—
|
|
—
|
|
—
|
|
4.3
|
|
4.3
|
|
||||||
|
Dividends declared to noncontrolling interests
|
—
|
|
—
|
|
—
|
|
—
|
|
(4.7
|
)
|
(4.7
|
)
|
||||||
|
Balance December 31, 2015
|
$
|
237.0
|
|
$
|
1,238.8
|
|
$
|
(132.8
|
)
|
$
|
(269.3
|
)
|
$
|
67.5
|
|
$
|
1,141.2
|
|
|
Comprehensive income (loss):
|
|
|
|
|
|
|
||||||||||||
|
Net income
|
—
|
|
—
|
|
41.8
|
|
—
|
|
5.8
|
|
47.6
|
|
||||||
|
Net unrealized gain on securities, net of tax of $0.0
|
—
|
|
—
|
|
—
|
|
0.3
|
|
—
|
|
0.3
|
|
||||||
|
Net realized and unrealized gain on derivatives, net of tax of $0.8
|
—
|
|
—
|
|
—
|
|
1.2
|
|
—
|
|
1.2
|
|
||||||
|
Long-term employee benefit plans, net of tax benefit of $5.7
|
—
|
|
—
|
|
—
|
|
(23.2
|
)
|
—
|
|
(23.2
|
)
|
||||||
|
Foreign currency translation, net of tax of $0.0 million
|
—
|
|
—
|
|
—
|
|
(59.4
|
)
|
(0.1
|
)
|
(59.5
|
)
|
||||||
|
Total comprehensive income (loss)
|
—
|
|
—
|
|
41.8
|
|
(81.1
|
)
|
5.7
|
|
(33.6
|
)
|
||||||
|
Cumulative effect of an accounting change (Note 4)
|
—
|
|
—
|
|
43.9
|
|
—
|
|
—
|
|
43.9
|
|
||||||
|
Recognition of stock-based compensation
|
—
|
|
41.1
|
|
—
|
|
—
|
|
—
|
|
41.1
|
|
||||||
|
Exercises of stock options and vesting of restricted stock
|
2.3
|
|
14.4
|
|
—
|
|
—
|
|
—
|
|
16.7
|
|
||||||
|
Noncontrolling interests of acquired subsidiaries
|
—
|
|
—
|
|
—
|
|
—
|
|
51.3
|
|
51.3
|
|
||||||
|
Dividends declared to noncontrolling interests
|
—
|
|
—
|
|
—
|
|
—
|
|
(3.0
|
)
|
(3.0
|
)
|
||||||
|
Balance December 31, 2016
|
$
|
239.3
|
|
$
|
1,294.3
|
|
$
|
(47.1
|
)
|
$
|
(350.4
|
)
|
$
|
121.5
|
|
$
|
1,257.6
|
|
The accompanying notes are an integral part of these consolidated financial statements.
70
AXALTA COATING SYSTEMS LTD.
Consolidated Statements of Cash Flows
(In millions)
|
Year Ended December 31,
|
|||||||||
|
2016
|
2015
|
2014
|
|||||||
|
Operating activities:
|
|||||||||
|
Net income
|
$
|
47.6
|
|
$
|
97.9
|
|
$
|
34.7
|
|
|
Adjustment to reconcile net income to cash provided by operating activities:
|
|
|
|||||||
|
Depreciation and amortization
|
322.1
|
|
307.7
|
|
308.7
|
|
|||
|
Amortization of financing costs and original issue discount
|
17.8
|
|
20.6
|
|
21.0
|
|
|||
|
Debt extinguishment and refinancing related costs
|
97.6
|
|
2.5
|
|
6.1
|
|
|||
|
Deferred income taxes
|
(14.2
|
)
|
(5.0
|
)
|
(38.2
|
)
|
|||
|
Realized and unrealized foreign exchange losses, net
|
35.5
|
|
93.7
|
|
75.1
|
|
|||
|
Stock-based compensation
|
41.1
|
|
30.2
|
|
8.0
|
|
|||
|
Asset impairments
|
68.4
|
|
30.6
|
|
—
|
|
|||
|
Other non-cash, net
|
(1.9
|
)
|
12.5
|
|
(25.3
|
)
|
|||
|
Changes in operating assets and liabilities:
|
|
|
|||||||
|
Trade accounts and notes receivable
|
(67.8
|
)
|
(61.1
|
)
|
(40.2
|
)
|
|||
|
Inventories
|
(1.7
|
)
|
(35.2
|
)
|
(24.7
|
)
|
|||
|
Prepaid expenses and other
|
(64.5
|
)
|
(65.6
|
)
|
(54.1
|
)
|
|||
|
Accounts payable
|
32.3
|
|
(6.7
|
)
|
53.6
|
|
|||
|
Other accrued liabilities
|
54.0
|
|
10.1
|
|
(54.8
|
)
|
|||
|
Other liabilities
|
(7.0
|
)
|
(22.4
|
)
|
(18.5
|
)
|
|||
|
Cash provided by operating activities
|
559.3
|
|
409.8
|
|
251.4
|
|
|||
|
Investing activities:
|
|
|
|||||||
|
Business acquisitions (net of cash acquired)
|
(114.8
|
)
|
(29.6
|
)
|
—
|
|
|||
|
Purchase of property, plant and equipment
|
(136.2
|
)
|
(138.1
|
)
|
(188.4
|
)
|
|||
|
Proceeds from sale of a business
|
—
|
|
—
|
|
17.5
|
|
|||
|
Other investing activities
|
(6.0
|
)
|
1.5
|
|
(2.9
|
)
|
|||
|
Cash used for investing activities
|
(257.0
|
)
|
(166.2
|
)
|
(173.8
|
)
|
|||
|
Financing activities:
|
|
|
|||||||
|
Proceeds from short-term borrowings
|
0.2
|
|
2.0
|
|
30.7
|
|
|||
|
Proceeds from long-term borrowings
|
1,604.3
|
|
—
|
|
0.7
|
|
|||
|
Payments on short-term borrowings
|
(8.6
|
)
|
(16.9
|
)
|
(33.8
|
)
|
|||
|
Payments on long-term borrowings
|
(1,755.7
|
)
|
(127.3
|
)
|
(121.1
|
)
|
|||
|
Refinancing related costs
|
(86.3
|
)
|
—
|
|
(3.0
|
)
|
|||
|
Dividends paid to noncontrolling interests
|
(3.0
|
)
|
(4.7
|
)
|
(2.2
|
)
|
|||
|
Proceeds from option exercises
|
16.7
|
|
62.4
|
|
3.0
|
|
|||
|
Other financing activities
|
(0.2
|
)
|
(0.2
|
)
|
2.5
|
|
|||
|
Cash used for financing activities
|
(232.6
|
)
|
(84.7
|
)
|
(123.2
|
)
|
|||
|
Increase (decrease) in cash and cash equivalents
|
69.7
|
|
158.9
|
|
(45.6
|
)
|
|||
|
Effect of exchange rate changes on cash
|
(19.3
|
)
|
(58.0
|
)
|
(26.9
|
)
|
|||
|
Cash at beginning of period
|
487.7
|
|
386.8
|
|
459.3
|
|
|||
|
Cash at end of period
|
$
|
538.1
|
|
$
|
487.7
|
|
$
|
386.8
|
|
|
|
|
|
|||||||
|
Cash at end of period reconciliation:
|
|
|
|||||||
|
Cash and cash equivalents
|
$
|
535.4
|
|
$
|
485.0
|
|
$
|
382.1
|
|
|
Restricted cash
|
2.7
|
|
2.7
|
|
4.7
|
|
|||
|
Cash at end of period
|
$
|
538.1
|
|
$
|
487.7
|
|
$
|
386.8
|
|
|
|
|
|
|||||||
|
Supplemental cash flow information
|
|
|
|||||||
|
Cash paid during the year for:
|
|
|
|||||||
|
Interest, net of amounts capitalized
|
$
|
169.4
|
|
$
|
172.5
|
|
$
|
192.0
|
|
|
Income taxes, net of refunds
|
39.2
|
|
52.4
|
|
57.0
|
|
|||
|
Non-cash investing activities:
|
|
|
|
|
|||||
|
Accrued capital expenditures
|
$
|
28.7
|
|
$
|
33.8
|
|
$
|
29.4
|
|
The accompanying notes are an integral part of these consolidated financial statements.
71
Notes to Consolidated Financial Statements
(In millions, unless otherwise noted)
(1) GENERAL AND DESCRIPTION OF THE BUSINESS
Axalta Coating Systems Ltd. ("Axalta," the "Company," "we," "our" and "us"), a Bermuda exempted company limited by shares formed at the direction of The Carlyle Group L.P. ("Carlyle"), was incorporated on August 24, 2012 for the purpose of consummating the acquisition of DuPont Performance Coatings ("DPC"), a business formerly owned by E. I. du Pont de Nemours and Company ("DuPont"), including certain assets of DPC and all of the capital stock and other equity interests of certain entities engaged in the DPC business (the "Acquisition"). Axalta, through its wholly-owned indirect subsidiaries, acquired DPC on February 1, 2013.
Axalta is a holding company with no business operations or assets other than primarily cash and cash equivalents and
100%
of the ownership interest of Axalta Coating Systems Luxembourg Top S.à r.l. (formerly Axalta Coating Systems Dutch Co. Top Coöperatief U.A.), which itself is a holding company with no operations or assets other than
100%
of the capital stock of Axalta Coating Systems Dutch Holdings A B.V. ("Dutch A B.V."), which itself is a holding company with no operations or assets other than
100%
of the capital stock of Axalta Coating Systems Dutch Holdings B B.V. ("Dutch B B.V."). Dutch B B.V., together with its indirect wholly-owned subsidiary, Axalta Coating Systems U.S. Holdings, Inc. ("Axalta US Holdings"), are co-borrowers under the Senior Secured Credit Facilities and the Revolving Credit Facility (each as defined below). Dutch B B.V., is also an issuer of and a guarantor of the New Senior Notes and Axalta Coating Systems, LLC is an issuer of the 2024 Senior Notes. Our global operations are conducted by indirect wholly-owned subsidiaries and indirect majority-owned subsidiaries.
We are a leading global manufacturer, marketer and distributor of high performance coatings products primarily serving the transportation industry. We have an approximately 150-year heritage in the coatings industry and are known for manufacturing high-quality products with well-recognized brands supported by market-leading technology and customer service.
The Carlyle Offerings
In November 2014, we priced our initial public offering ("IPO") in which certain selling shareholders affiliated with Carlyle sold
57,500,000
common shares at a price of
$19.50
per share.
Subsequent to the IPO, Carlyle completed
six
secondary offerings for an aggregate of
170.3 million
common shares from April 2015 through August 2016 with offering prices ranging from
$27.93
to
$29.75
("Carlyle Offerings"). We did
no
t receive any proceeds from the sale of common shares in any of the Carlyle Offerings.
Effective with the August 2016 Carlyle Offering, Carlyle no longer has any beneficial interest in Axalta's common shares, other than de minimis amounts held or owned in the ordinary course of business purchased subsequent to the Acquisition.
(2) BASIS OF PRESENTATION OF THE CONSOLIDATED FINANCIAL STATEMENTS
The accompanying consolidated balance sheets of Axalta at
December 31, 2016
and
2015
and the related consolidated statements of operations, consolidated statements of comprehensive income (loss), consolidated statements of cash flows and consolidated statements of changes in shareholders' equity for the years ended
December 31, 2016
,
2015
and
2014
included herein are audited. In the opinion of management, these statements include all adjustments, consisting only of normal, recurring adjustments, necessary for a fair statement of the financial position of Axalta. All intercompany balances and transactions have been eliminated. These consolidated financial statements should be read in conjunction with the consolidated financial statements and notes included herein the Company’s Annual Report on Form 10-K for the year ended December 31, 2016.
The annual audited consolidated financial statements include the accounts of Axalta and its subsidiaries, and entities in which a controlling interest is maintained. Certain of our joint ventures are accounted for on a one-month lag basis, the effect of which is not material.
(3) SUMMARY OF SIGNIFICANT ACCOUNTING POLICIES
The consolidated financial statements of Axalta and its subsidiaries have been prepared in accordance with accounting principles generally accepted in the United States of America ("GAAP"). In the opinion of management, all adjustments considered necessary for a fair presentation of the financial statements have been included.
72
Use of Estimates
The preparation of financial statements in conformity with GAAP requires us to make estimates and assumptions that affect the reported amounts of assets and liabilities at the date of the financial statements and the reported amounts of sales and expenses during the period. The estimates and assumptions include, but are not limited to, receivable and inventory valuations, fixed asset valuations, valuations of goodwill and identifiable intangible assets, including analysis of impairment, valuations of long-term employee benefit obligations, income taxes, environmental matters, litigation, stock-based compensation, restructuring, and allocations of costs. Our estimates are based on historical experience, facts and circumstances available at the time and various other assumptions that are believed to be reasonable. Actual results could differ materially from those estimates.
Accounting for Business Combinations
We account for business combinations under the acquisition method of accounting. This method requires the recording of acquired assets, including separately identifiable intangible assets and assumed liabilities at their acquisition date fair values. The method records any excess purchase price over the fair value of acquired net assets as goodwill. Included in the determination of the purchase price is the fair value of contingent consideration, if applicable, based on the terms and applicable targets described within the acquisition agreements (e.g., projected revenues or EBITDA). Subsequent to the acquisition date, the fair value of the liability, if determined to be payable in cash, is revalued at each balance sheet date with adjustments recorded within earnings.
The determination of the fair value of assets acquired, liabilities assumed, and noncontrolling interests involves assessments of factors such as the expected future cash flows associated with individual assets and liabilities and appropriate discount rates at the closing date of the acquisition. When necessary, we consult with external advisors to help determine fair value. For non-observable market values determined using Level 3 assumptions, we determine fair value using acceptable valuation principles (e.g., multiple excess earnings, relief from royalty and cost methods).
We included the results of operations from the acquisition date in the financial statements for all businesses acquired.
Principles of Consolidation
The consolidated financial statements include the accounts of Axalta and its subsidiaries, and entities in which a controlling interest is maintained. For those consolidated subsidiaries in which the Company’s ownership is less than
100%
, the outside shareholders’ interests are shown as noncontrolling interests. Investments in companies in which Axalta, directly or indirectly, owns
20%
to
50%
of the voting stock and has the ability to exercise significant influence over operating and financial policies of the investee are accounted for using the equity method of accounting. As a result, Axalta’s share of the earnings or losses of such equity affiliates is included in the accompanying consolidated statements of operations and our share of these companies’ stockholders’ equity is included in the accompanying consolidated balance sheet.
We eliminated all intercompany accounts and transactions in the preparation of the accompanying consolidated financial statements.
Revenue Recognition
We recognize revenue after completing the earnings process. We recognize revenue for product sales when we ship products to the customer in accordance with the terms of the agreement, when there is persuasive evidence of the arrangement, title and risk of loss have been transferred, collectability is reasonably assured and pricing is fixed or determinable.
For a majority of our product sales, title transfers at the shipping point and delivery is considered complete. For certain OEM customers, revenue is recognized at the time the customer applies our coatings to its vehicles, as this represents the point in time that risk of loss has been transferred and delivery is considered complete.
We accrue for sales returns and other allowances based on our historical experience.
73
We incur up-front costs in order to obtain contracts with certain customers, referred to as Business Incentive Plan assets ("BIPs"). We capitalized these up-front costs as a component of other assets and amortize the related amounts over the estimated life of the contract as a reduction of net sales. The Company receives volume commitments and/or sole supplier status from its customers over the life of the contractual arrangements, which approximates a
five
-year weighted average useful life.
The termination clauses in these contractual arrangements include standard clawback provisions that enable the Company to collect monetary damages in the event of a customer’s failure to meet its commitments under the relevant contract. As of December 31, 2016 and 2015,
$170.8 million
and
$147.3 million
, respectively, were deferred within other assets on the consolidated balance sheets. For the years ended December 31, 2016, 2015 and 2014,
$53.5 million
,
$50.6 million
and
$43.0 million
, respectively, were recorded as reductions of net sales in the consolidated statement of operations.
We include the amounts billed to customers for shipping and handling fees in net sales and costs incurred for the delivery of goods as cost of goods sold in the statement of operations.
Recognition for licensing and royalty income occurs in accordance with agreed upon terms, when performance obligations are satisfied, the amount is fixed or determinable, and collectability is reasonably assured.
Cash and Cash Equivalents
Cash equivalents represent highly liquid investments considered readily convertible to known amounts of cash within three months or less from time of purchase. They are carried at cost plus accrued interest, which approximates fair value because of the short-term maturity of these instruments. Cash balances may exceed government insured limits in certain jurisdictions.
Fair Value Measurements
GAAP defines a fair value hierarchy that prioritizes the inputs to valuation techniques used to measure fair value. The hierarchy gives the highest priority to unadjusted quoted prices in active markets for identical assets or liabilities (Level 1 measurements) and the lowest priority to unobservable inputs (Level 3 measurements). A financial instrument’s level within the fair value hierarchy is based on the lowest level of any input that is significant to the fair value measurement.
The following valuation techniques are used to measure fair value for assets and liabilities:
Level 1—Quoted market prices in active markets for identical assets or liabilities;
Level 2—Significant other observable inputs (e.g., quoted prices for similar items in active markets, quoted prices for identical or similar items in markets that are not active, inputs other than quoted prices that are observable such as interest rate and yield curves, and market-corroborated inputs); and
Level 3—Unobservable inputs for the asset or liability, which are valued based on management’s estimates of assumptions that market participants would use in pricing the asset or liability.
Derivatives and Hedging
The Company from time to time utilizes derivatives to manage exposures to currency exchange rates and interest rate risk. The fair values of all derivatives are recognized as assets or liabilities at the balance sheet date. Changes in the fair value of these instruments are reported in income or accumulated other comprehensive income ("AOCI"), depending on the use of the derivative and whether it qualifies for hedge accounting treatment and is designated as such.
Gains and losses on derivatives that qualify and are designated as cash flow hedging instruments are recorded in AOCI, to the extent the hedges are effective, until the underlying transactions are recognized in income.
Gains and losses on derivatives qualifying and designated as fair value hedging instruments, as well as the offsetting losses and gains on the hedged items, are reported in income in the same accounting period. Derivatives not designated as hedging instruments are marked-to-market at the end of each accounting period with the results included in income.
Cash flows from derivatives are recognized in the consolidated statements of cash flows in a manner consistent with the underlying transactions.
74
Receivables and Allowance for Doubtful Accounts
Receivables are recognized net of an allowance for doubtful accounts receivable. The allowance for doubtful accounts receivable reflects the best estimate of losses inherent in the accounts receivable portfolio determined on the basis of historical experience, specific allowances for known troubled accounts and other available evidence. Accounts receivable are written down or off when a portion or all of such account receivable is determined to be uncollectible.
Inventories
Inventories are valued at the lower of cost or net realizable value with cost being determined on the weighted average cost method. Elements of cost in inventories include:
|
•
|
raw materials,
|
|
•
|
direct labor, and
|
|
•
|
manufacturing and indirect overhead.
|
Stores and supplies are valued at the lower of cost or net realizable value; cost is generally determined by the weighted average cost method. Inventories deemed to have costs greater than their respective market values are reduced to net realizable value with a loss recorded in income in the period recognized.
Property, Plant and Equipment
Property, plant and equipment acquired in an acquisition are recorded at fair value as of the acquisition date and are depreciated over the estimated useful life using the straight-line method. Subsequent additions to property, plant and equipment, including the fair value of any asset retirement obligations upon initial recognition of the liability, are recorded at cost and are depreciated over the estimated useful life using the straight-line method. See Note 17 for a range of estimated useful lives used for each property, plant and equipment class.
Software included in property, plant and equipment represents the costs of software developed or obtained for internal use. Software costs are amortized on a straight-line basis over their estimated useful lives. Upgrades and enhancements are capitalized if they result in added functionality, which enables the software to perform tasks it was previously incapable of performing. Software maintenance and training costs are expensed in the period in which they are incurred.
Goodwill and Other Identifiable Intangible Assets
Goodwill represents the excess of purchase price over the fair values of underlying net assets acquired in an acquisition. Goodwill and indefinite-lived intangible assets are tested for impairment on an annual basis as of October 1; however, these tests are performed more frequently if events or changes in circumstances indicate that the asset may be impaired. The fair value methodology is based on prices of similar assets or other valuation methodologies including discounted cash flow techniques.
When testing goodwill and indefinite-lived intangible assets for impairment, we first have an option to assess qualitative factors to determine whether the existence of events or circumstances leads to a determination that it is more likely than not (more than
50%
) that an impairment exists. Such qualitative factors may include the following: macroeconomic conditions; industry and market considerations; cost factors; overall financial performance; and other relevant entity-specific events. In the event the qualitative assessment indicates that an impairment is more likely than not, we would be required to perform a quantitative impairment test, otherwise no further analysis is required.
Under the quantitative goodwill impairment test, the evaluation of impairment involves comparing the current fair value of each reporting unit to its carrying value, including goodwill. If the carrying amount of a reporting unit, including goodwill, exceeds the estimated fair value, then individual assets (including identifiable intangible assets) and liabilities of the reporting unit are estimated at fair value. The excess of the estimated fair value of the reporting unit over the estimated fair value of its net assets would establish the implied value of goodwill. The excess of the recorded amount of goodwill over the implied value is then charged to earnings as an impairment loss.
75
Definite-lived intangible assets, such as technology, trademarks, customer relationships and non-compete agreements are amortized over their estimated useful lives, generally for periods ranging from
two
to
20 years
. The reasonableness of the useful lives of these assets is regularly evaluated. Once these assets are fully amortized, they are removed from the balance sheet. We evaluate these assets for impairment whenever events or changes in circumstances indicate that the carrying amount of these assets might not be recoverable.
Impairment of Long-Lived Assets
The carrying value of long-lived assets to be held and used is evaluated when events or changes in circumstances indicate the carrying value may not be recoverable. The carrying value of a long-lived asset is considered impaired when the total projected undiscounted cash flows from the asset are less than its carrying value. In that event, a loss is recognized based on the amount by which the carrying value exceeds the fair value of the long-lived asset. The fair value methodology used is an estimate of fair market value and is based on prices of similar assets or other valuation methodologies including present value techniques. Long-lived assets to be disposed of other than by sale are classified as held for use until their disposal. Long-lived assets to be disposed of by sale are classified as held for sale and are reported at the lower of carrying amount or fair market value less cost to sell. Depreciation is discontinued for long-lived assets classified as held for sale.
Research and Development
Research and development costs incurred in the normal course of business consist primarily of employee-related costs and are expensed as incurred. In process research and development projects acquired in a business combination are recorded as intangible assets at their fair value as of the acquisition date, using Level 3 assumptions. Subsequent costs related to acquired in process research and development projects are expensed as incurred. Research and development intangible assets are considered indefinite-lived until the abandonment or completion of the associated research and development efforts. These indefinite-lived intangible assets are tested for impairment consistent with the impairment testing performed on other indefinite-lived intangible assets discussed above. Upon completion of the research and development process, the carrying value of acquired in process research and development projects is reclassified as a finite-lived asset and is amortized over its useful life.
Environmental Liabilities and Expenditures
Accruals for environmental matters are recorded when it is probable that a liability has been incurred and the amount of the liability can be reasonably estimated. Accrued environmental liabilities are not discounted. Claims for recovery from third parties, if any, are reflected separately as an asset. We record recoveries at the earlier of when the gain is probable and reasonably estimable, or realized. For the years ending
December 31, 2016
,
2015
and
2014
, we have not recognized income associated with recoveries from third parties.
Costs related to environmental remediation are charged to expense in the period incurred. Other environmental costs are also charged to expense in the period incurred, unless they increase the value of the property or reduce or prevent contamination from future operations, in which case, they are capitalized and depreciated.
Litigation
We accrue for liabilities related to litigation matters when available information indicates that the liability is probable and the amount can be reasonably estimated. Legal costs such as outside counsel fees and expenses are charged to expense in the period incurred.
Income Taxes
Deferred tax assets and liabilities are recognized for the future tax consequences attributable to differences between the financial statement carrying amounts of assets and liabilities and their respective tax basis. Deferred tax assets are also recognized for operating losses, interest and tax credit carry forwards. Valuation allowances are recorded to reduce deferred tax assets when it is more likely than not that a tax benefit will not be realized. Deferred tax assets and liabilities are measured using enacted tax rates applicable in the years in which they are expected to be recovered or settled. The effect on deferred tax assets and liabilities of a change in tax law is recognized in income in the period that includes the enactment date.
76
Where we do not intend to indefinitely reinvest earnings of our subsidiaries, we provide for income taxes and withholding taxes, where applicable, on unremitted earnings. We do not provide for income taxes on unremitted earnings of our subsidiaries that are intended to be indefinitely reinvested.
We recognize the benefit of an income tax position only if it is "more likely than not" that the tax position will be sustained. The tax benefits recognized are measured based on the largest benefit that has a greater than
50%
likelihood of being realized. Additionally, we recognize interest and penalties accrued related to unrecognized tax benefits as a component of provision for income taxes. The current portion of unrecognized tax benefits is included in "Income taxes payable" and the long-term portion is included in the long-term income tax payable in the accompanying consolidated balance sheets.
Foreign Currency Translation
The reporting currency is the U.S. dollar. In most cases, our non-U.S. based subsidiaries use their local currency as the functional currency for their respective business operations. Assets and liabilities of these operations are translated into U.S. dollars at end-of-period exchange rates; income and expenses are translated using the average exchange rates for the reporting period. Resulting cumulative translation adjustments are recorded as a component of shareholders’ equity in the accompanying consolidated balance sheet in Accumulated other comprehensive income (loss).
Gains and losses from transactions denominated in currencies other than the functional currencies are included in the consolidated statement of operations in other expense, net.
Employee Benefits
Defined benefit plans specify an amount of pension benefit that an employee will receive upon retirement, usually dependent on factors such as age, years of service and compensation. The net obligation in respect of defined benefit plans is calculated separately for each plan by estimating the amount of the future benefits that employees have earned in return for their service in the current and prior periods. These benefits are then discounted to determine the present value of the obligations and are then adjusted for the impact of any unamortized prior service costs. The discount rate used is based upon market indicators in the region (generally, the yield on bonds that are denominated in the currency in which the benefits will be paid) and that have maturity dates approximating the terms of the obligations. The calculations are performed by qualified actuaries using the projected unit credit method.
Stock-Based Compensation
Our stock-based compensation is comprised of Axalta stock options, restricted stock awards, restricted stock units, performance stock awards and performance share units and are measured at fair value on the grant date or date of modification, as applicable. We recognize compensation expense on a graded-vesting attribution basis over the requisite service period. Compensation expense is recorded net of forfeitures, which we elect to record in the period they occur.
Earnings per Common Share
Basic earnings per common share is computed by dividing net income attributable to Axalta’s common shareholders by the weighted average number of shares outstanding during the period. Diluted earnings per common share is computed by dividing net income attributable to Axalta’s common shareholders by the weighted average number of shares outstanding during the period increased by the number of additional shares that would have been outstanding related to potentially dilutive securities; anti-dilutive securities are excluded from the calculation. These potentially dilutive securities are calculated under the treasury stock method and consist of stock options, restricted stock awards, restricted stock units, performance stock awards and performance share units.
77
(4) RECENT ACCOUNTING GUIDANCE
Accounting Guidance Issued and Adopted
In November 2016, the Financial Accounting Standards Board ("FASB") issued Accounting Standards Update ("ASU") 2016-18, "Statement of Cash Flows: Restricted Cash", which requires that a statement of cash flows explain the change during the period in the total of cash, cash equivalents and amounts generally described as restricted cash or restricted cash equivalents. Therefore, amounts generally described as restricted cash and restricted cash equivalents should be included with cash and cash equivalents when reconciling the beginning-of-period and end-of-period total amounts shown on the statement of cash flows. The standard is effective for fiscal years beginning after December 15, 2016, with early adoption permitted. The Company elected to early adopt this standard for the year ended December 31, 2016, which increased net cash used in investing activities by
$1.9 million
and decreased net cash used in investing activities by
$4.7 million
for the years ended December 31, 2015 and 2014, respectively.
In March 2016, the FASB issued ASU 2016-09, "Stock Compensation", which provides various areas of simplification surrounding the accounting for stock-based compensation. This standard is effective for fiscal years beginning after December 15, 2016, with early adoption permitted. Our adoption of this standard for the year ended December 31, 2016 requires us to reflect any reclassifications as of January 1, 2016, the beginning of the fiscal year of adoption.
The new standard resulted in the recognition of excess tax benefits in our provision for income taxes. Upon adoption, this resulted in a cumulative effect of an accounting change reclassification of
$43.9 million
to accumulated deficit on the balance sheet as of January 1, 2016 with offsetting amounts to non-current deferred tax assets and liabilities on the consolidated balance sheet. It also resulted in a decrease to the tax provision and corresponding increase to net income of
$10.8 million
for the previously reported nine months ended September 30, 2016. The effect on our dilutive shares is disclosed in Note 27.
We elected to retrospectively apply the changes in presentation to the consolidated statements of cash flows and no longer classify excess tax benefits or employee taxes paid for withheld shares as financing activities, which increased net cash provided by operating activities and decreased net cash used in financing activities by
$10.2 million
for the year ended December 31, 2015. We also elected to account for forfeitures as they occur prospectively.
The following table summarizes the impact to our consolidated balance sheet, including the net amount charged to retained earnings as of January 1, 2016 as well as the retrospective impacts on our consolidated statement of cash flows:
|
January 1, 2016
|
||||||
|
As Reported
|
Recasted
1
|
|||||
|
Other assets (non-current assets)
|
$
|
434.2
|
|
$
|
393.7
|
|
|
Deferred income taxes (non-current liabilities)
|
$
|
165.5
|
|
$
|
162.1
|
|
|
Accumulated deficit
|
$
|
(132.8
|
)
|
$
|
(88.9
|
)
|
1
Recasted financial information does not include the reclassifications addressed within ASU 2015-17 below.
|
Year ended December 31, 2015
|
||||||
|
As Reported
|
Recasted
|
|||||
|
Net cash provided by operating activities
|
$
|
399.6
|
|
$
|
409.8
|
|
|
Net cash used for financing activities
|
$
|
(74.5
|
)
|
$
|
(84.7
|
)
|
In November 2015, the FASB issued ASU 2015-17, "Balance Sheet Classification of Deferred Taxes", which requires that all deferred tax assets and liabilities be classified as non-current on the balance sheet. The standard is effective for fiscal years beginning after December 15, 2016, with early adoption permitted. The Company elected to early adopt this standard for the year ended December 31, 2016 and elected to apply the amendments retrospectively. The adoption did not have any impact on the Company's results of operations, cash flows or net assets.
78
The following table summarizes the impact to our consolidated balance sheet at December 31, 2015:
|
December 31, 2015
|
||||||
|
As Reported
|
Recasted
|
|||||
|
Deferred income taxes (current assets)
|
$
|
69.5
|
|
$
|
—
|
|
|
Other assets (non-current assets)
|
$
|
434.2
|
|
$
|
479.6
|
|
|
Deferred income taxes (current liabilities)
|
$
|
6.6
|
|
$
|
—
|
|
|
Deferred income taxes (non-current liabilities)
|
$
|
165.5
|
|
$
|
148.0
|
|
In May 2015, the FASB issued ASU No. 2015-07, “Fair Value Measurement (Topic 820): Disclosures for Investments in Certain Entities That Calculate Net Asset Value ("NAV") per Share (or its Equivalent)”, which removes the requirement to categorize within the fair value hierarchy all investments for which fair value is measured using the NAV per share practical expedient. However, sufficient information must be provided to permit reconciliation of the fair value of assets categorized within the fair value hierarchy to the total fair value of plan assets. The amendments also remove the requirement to make certain disclosures for all investments that are eligible to be measured at fair value using the NAV per share practical expedient. The standard is effective for fiscal years beginning after December 15, 2015, and interim periods within those fiscal years. The Company adopted this standard for the year ended December 31, 2016 and applied this update retrospectively. The adoption of the standard resulted in the investment of certain debt asset backed securities and hedge funds for a combined fair value of
$16.2 million
being represented outside of the fair value hierarchy schedule at December 31, 2016, within Note 9. There were no retrospective reclassifications required as these investments did not exist at or prior to December 31, 2015.
Accounting Guidance Issued But Not Yet Adopted
In January 2017, the FASB issued ASU 2017-04, "Simplifying the Test for Goodwill Impairment", which eliminates the second step in the goodwill impairment test which requires an entity to determine the implied fair value of the reporting unit’s goodwill. Instead, an entity should recognize an impairment loss if the carrying value of the net assets assigned to the reporting unit exceeds the fair value of the reporting unit, with the impairment loss not to exceed the amount of goodwill allocated to the reporting unit. The standard is effective for annual and interim goodwill impairment tests conducted in fiscal years beginning after December 15, 2019, with early adoption permitted. This standard is not expected to have a material impact on our financial statements unless an impairment indicator is identified on our reporting units.
In February 2016, the FASB issued ASU 2016-02, "Leases", which requires lessees to recognize the assets and liabilities arising from all leases (both finance and operating) on the balance sheet. In addition to this main provision, this standard included a number of additional changes to lease accounting. This standard is effective for fiscal years beginning after December 15, 2018, including interim periods within those fiscal years. Early adoption is permitted prior to this date. We are in the process of assessing the impact the adoption of this standard will have on our balance sheets, statements of operations and statements of cash flows. At a minimum, total assets and total liabilities will increase in the period the ASU is adopted.
In May 2014, the FASB issued ASU 2014-09, "Revenue from Contracts with Customers (Topic 606)", which sets forth the guidance that an entity should use related to revenue recognition. This standard was effective for fiscal years beginning after December 15, 2016, and interim periods within those fiscal years. In August 2015, the FASB issued ASU 2015-14, "Revenue from Contracts with Customers: Deferral of the Effective Date," which delayed the effective date of the new revenue accounting standard to fiscal years beginning after December 15, 2017, and the interim periods within those fiscal years. Companies will be allowed to early adopt the guidance as of the original effective date. Early adoption is not permitted prior to this date.
79
In April 2016, the FASB issued ASU 2016-10, "Revenue from Contracts with Customers: Identifying Performance Obligations and Licensing," which provides clarification around identifying performance obligations and the treatment of different licensing contracts. Additional standards related to revenue from contracts with customers have been issued during 2016 to provide narrow scope improvements and clarification. During the year ended December 31, 2016, we have continued to assess the potential impact of the revised guidance on our consolidated financial statements. In addition to the expanded disclosures regarding revenue, this guidance may impact our accounting and reporting for certain arrangements, including the periods in which we recognize revenue and the potential recording of contract assets for the sale of our products or services. To conclude on these matters, we are involving leadership within our various organizations with specific knowledge of the arrangements to understand the legal, operational and financial matters.
(5) ACQUISITIONS AND DIVESTITURES
Acquisitions
During the year ended December 31, 2016, we completed multiple acquisitions. Included in these acquisitions were a refinish business based in Southeast Asia, a light-vehicle business specializing in interior coatings based in North America,
fifty-one
percent controlling interest in an industrial business specializing in coil and spray coatings in North America, and a refinish distributor in Western Europe (together, the "2016 Acquisitions" or combined with immaterial acquisitions completed during 2015 and 2016, the "2016 and 2015 Acquisitions"). Under the terms of the
fifty-one
percent acquisition, we are committed to purchase the remaining non-controlling interest of the entity in
two
equal installments in 2018 and 2019. The fair value of the non-controlling interest was
$51.3 million
as of the acquisition date. The 2016 Acquisitions were accounted for as business combinations and the overall impacts to our consolidated financial statements were not considered material, either individually or in the aggregate, as of and for the year ended December 31, 2016. The total fair value of consideration paid or payable was
$126.6 million
. Net sales for the 2016 Acquisitions on our consolidated statements of operations for the year ended December 31, 2016 was
$50.4 million
.
At December 31, 2016, we have not finalized the purchase accounting related to the 2016 Acquisitions and the amounts reflected in our consolidated balance sheet represent preliminary values. We expect to finalize our purchase accounting during the respective measurement periods which will be no later than one year following the closing dates.
Divestitures
In September 2014, we completed the sale of a business within the Performance Coatings reportable segment, which primarily included technology that had been developed as an integrated software solution for the collision repair supply chain market. The sale resulted in the receipt of
$17.5 million
during the year ended December 31, 2014. As a result, we recognized a pre-tax gain on sale of
$1.2 million
(
$0.7 million
after tax) recorded within other expense, net for the year ended December 31, 2014.
(6) GOODWILL AND IDENTIFIABLE INTANGIBLE ASSETS
During the year ended December 31, 2016, we completed multiple business acquisitions, see Note 5 for further details on the 2016 Acquisitions. The fair value associated with definite-lived intangible assets from the 2016 Acquisitions was
$102.6 million
, comprised of
$17.7 million
in technology,
$10.7 million
of trademarks,
$73.7 million
of customer relationships and
$0.5 million
of non-compete agreements.
80
Goodwill
The following table shows changes in the carrying amount of goodwill from December 31, 2015 to
December 31, 2016
by reportable segment:
|
Performance
Coatings
|
Transportation
Coatings
|
Total
|
|||||||
|
December 31, 2014
|
$
|
933.6
|
|
$
|
67.5
|
|
$
|
1,001.1
|
|
|
Goodwill from acquisitions
|
17.2
|
|
0.7
|
|
$
|
17.9
|
|
||
|
Foreign currency translation
|
(84.7
|
)
|
(6.1
|
)
|
$
|
(90.8
|
)
|
||
|
December 31, 2015
|
$
|
866.1
|
|
$
|
62.1
|
|
$
|
928.2
|
|
|
Goodwill from acquisitions
|
64.2
|
|
15.5
|
|
79.7
|
|
|||
|
Foreign currency translation
|
(43.8
|
)
|
(3.1
|
)
|
(46.9
|
)
|
|||
|
December 31, 2016
|
$
|
886.5
|
|
$
|
74.5
|
|
$
|
961.0
|
|
Identifiable Intangible Assets
The following table summarizes the gross carrying amounts and accumulated amortization of identifiable intangible assets by major class:
|
December 31, 2016
|
Gross Carrying
Amount
|
Accumulated
Amortization
|
Net Book
Value
|
Weighted average
amortization periods (years)
|
||||||
|
Technology
|
$
|
417.1
|
|
$
|
(153.6
|
)
|
$
|
263.5
|
|
10.2
|
|
Trademarks—indefinite-lived
|
273.2
|
|
—
|
|
273.2
|
|
Indefinite
|
|||
|
Trademarks—definite-lived
|
55.0
|
|
(11.4
|
)
|
43.6
|
|
14.8
|
|||
|
Customer relationships
|
672.6
|
|
(123.3
|
)
|
549.3
|
|
18.7
|
|||
|
Non-compete agreements
|
2.4
|
|
(1.7
|
)
|
0.7
|
|
4.6
|
|||
|
Total
|
$
|
1,420.3
|
|
$
|
(290.0
|
)
|
$
|
1,130.3
|
|
|
|
December 31, 2015
|
Gross Carrying
Amount
|
Accumulated
Amortization
|
Net Book
Value
|
Weighted average
amortization periods (years)
|
||||||
|
Technology
|
$
|
413.0
|
|
$
|
(117.2
|
)
|
$
|
295.8
|
|
10.0
|
|
Trademarks—indefinite-lived
|
284.4
|
|
—
|
|
284.4
|
|
Indefinite
|
|||
|
Trademarks—definite-lived
|
45.2
|
|
(8.5
|
)
|
36.7
|
|
14.7
|
|||
|
Customer relationships
|
676.1
|
|
(102.1
|
)
|
574.0
|
|
19.3
|
|||
|
Non-compete agreements
|
1.9
|
|
(1.2
|
)
|
0.7
|
|
4.6
|
|||
|
Total
|
$
|
1,420.6
|
|
$
|
(229.0
|
)
|
$
|
1,191.6
|
|
|
Activity related to in process research and development projects for the years ended
December 31, 2015
and
2016
:
|
In Process Research and Development
|
Activity
|
||
|
Balance at December 31, 2014
|
$
|
5.2
|
|
|
Completed
|
(3.5
|
)
|
|
|
Abandoned
|
(0.1
|
)
|
|
|
Balance at December 31, 2015
|
$
|
1.6
|
|
|
Completed
|
—
|
|
|
|
Abandoned
|
—
|
|
|
|
Foreign currency translation
|
(0.1
|
)
|
|
|
Balance at December 31, 2016
|
$
|
1.5
|
|
81
The estimated amortization expense related to the fair value of acquired intangible assets for each of the succeeding five years is:
|
2017
|
$
|
80.5
|
|
|
2018
|
$
|
80.5
|
|
|
2019
|
$
|
80.5
|
|
|
2020
|
$
|
80.4
|
|
|
2021
|
$
|
80.4
|
|
(7) RESTRUCTURING
In accordance with the applicable guidance for Nonretirement Postemployment Benefits, we accounted for termination benefits and recognized liabilities when the loss was considered probable that employees were entitled to benefits and the amounts could be reasonably estimated.
We have incurred costs in connection with involuntary termination benefits associated with our corporate-related initiatives, including our transition to a standalone entity and cost-saving opportunities associated with our Fit For Growth and Axalta Way initiatives. During the years ended
December 31, 2016
,
2015
and
2014
we incurred restructuring costs of
$58.5 million
,
$31.9 million
and
$8.5 million
, respectively. These amounts are recorded within selling, general and administrative expenses in the consolidated statements of operations. The payments associated with these actions are expected to be completed within
12
to
15
months from the balance sheet date.
The following table summarizes the activity related to the restructuring reserves and expenses for the years ended December 31, 2016, 2015 and 2014:
|
Balance at December 31, 2013
|
$
|
98.4
|
|
|
Expense recorded
|
8.5
|
|
|
|
Payments made
|
(51.6
|
)
|
|
|
Foreign currency translation
|
(6.8
|
)
|
|
|
Balance at December 31, 2014
|
$
|
48.5
|
|
|
Expense recorded
|
31.9
|
|
|
|
Payments made
|
(33.8
|
)
|
|
|
Foreign currency translation
|
(5.3
|
)
|
|
|
Balance at December 31, 2015
|
$
|
41.3
|
|
|
Expense recorded
|
58.5
|
|
|
|
Payments made
|
(31.0
|
)
|
|
|
Foreign currency translation
|
(2.7
|
)
|
|
|
Balance at December 31, 2016
|
$
|
66.1
|
|
|
(8)
|
COMMITMENTS AND CONTINGENCIES
|
Leases
At December 31, 2016, we have recorded approximately
$11.8 million
in property, plant and equipment representing our landlord's estimated costs incurred to construct a property under a separate build-to-suit lease arrangement. This lease commenced construction during 2015 with construction expected to be completed during 2017. The construction related to the build-to-suit lease has estimated total costs of approximately
$37.9 million
.
For accounting purposes, we are deemed the owner of the assets during the construction period and are required to record these costs as construction in progress during the construction period, with an offsetting liability in the same amount recorded to current and long-term borrowings, depending on the expected construction completion dates. These costs do not reflect the Company’s cash obligations, but represent the landlord’s costs to construct the properties, including costs for tenant improvements.
82
During the year ended December 31, 2016, one of our leases previously treated as a build-to-suit lease arrangement completed construction and is now treated as a sale-leaseback financing. The lessor's building costs will be depreciated over an estimated useful life. At December 31, 2016, the net book value of the building was
$17.2 million
, with a corresponding offset within long-term borrowings. The table below reflects the total cash payments related to the transaction during the rental term as of December 31, 2016:
|
|
Sale-leaseback obligations
|
||
|
2017
|
$
|
1.0
|
|
|
2018
|
1.7
|
|
|
|
2019
|
1.7
|
|
|
|
2020
|
1.7
|
|
|
|
2021
|
1.7
|
|
|
|
Thereafter
|
19.6
|
|
|
|
Total minimum payments
|
$
|
27.4
|
|
We use various leased facilities and equipment in our operations. The terms for these leased assets vary depending on the lease agreement. Net rental expense under operating leases were
$48.0 million
,
$48.2 million
and
$61.6 million
for the years ended December 31, 2016, 2015 and 2014, respectively.
At December 31, 2016, future minimum payments under non-cancelable operating leases were as follows:
|
|
Operating
Leases
|
||
|
2017
|
$
|
37.7
|
|
|
2018
|
31.0
|
|
|
|
2019
|
22.2
|
|
|
|
2020
|
18.2
|
|
|
|
2021
|
15.6
|
|
|
|
Thereafter
|
90.9
|
|
|
|
Total minimum payments
|
$
|
215.6
|
|
Other
We are subject to various pending lawsuits and other claims including civil, regulatory and environmental matters. Certain of these lawsuits and other claims may have an impact on us. These litigation matters may involve indemnification obligations by third parties and/or insurance coverage covering all or part of any potential damage awards against DuPont and/or us. All of the above matters are subject to many uncertainties and, accordingly, we cannot determine the ultimate outcome of the lawsuits at this time.
The potential effects, if any, on the financial statements of Axalta will be recorded in the period in which these matters are probable and estimable.
In addition to the aforementioned matters, we are party to various legal proceedings in the ordinary course of business. Although the ultimate resolution of these various proceedings cannot be determined at this time, management does not believe that such proceedings, individually or in the aggregate, will have a material adverse effect on the financial statements of Axalta.
(9) LONG-TERM EMPLOYEE BENEFITS
Defined Benefit Pension and Other Long-Term Employee Benefits Plans
Defined Benefit Pensions
Axalta has defined benefit plans that cover certain employees worldwide, with over
85%
of the pension benefit obligation within the European region as of
December 31, 2016
.
83
Other Long-Term Employee Benefits
We also have certain long-term employee health care and life insurance benefits for certain eligible employees. These programs require retiree contributions based on retiree-selected coverage levels for certain retirees. In conjunction with the plan amendments completed in 2014, these plans are now immaterial to Axalta.
Obligations and Funded Status
The measurement date used to determine defined benefit obligations was December 31. The following table sets forth the changes to the projected benefit obligations ("PBO") and plan assets for the years ended
December 31, 2016
and
2015
and the funded status and amounts recognized in the accompanying consolidated balance sheets at
December 31, 2016
and
2015
for the Company’s defined benefit pension plans:
|
|
Defined Benefits
|
|||||
|
Year Ended December 31,
|
||||||
|
Obligations and Funded Status
|
2016
|
2015
|
||||
|
Change in benefit obligation:
|
||||||
|
Projected benefit obligation at beginning of year
|
$
|
541.7
|
|
$
|
613.1
|
|
|
Service cost
|
10.7
|
|
12.0
|
|
||
|
Interest cost
|
15.1
|
|
16.9
|
|
||
|
Participant contributions
|
1.0
|
|
0.9
|
|
||
|
Actuarial losses (gains), net
|
57.4
|
|
(12.0
|
)
|
||
|
Plan curtailments, settlements and special termination benefits
|
(2.0
|
)
|
(4.7
|
)
|
||
|
Benefits paid
|
(21.8
|
)
|
(27.4
|
)
|
||
|
Amendments
|
—
|
|
2.7
|
|
||
|
Currency translation adjustment
|
(54.5
|
)
|
(59.8
|
)
|
||
|
Projected benefit obligation at end of year
|
547.6
|
|
541.7
|
|
||
|
Change in plan assets:
|
||||||
|
Fair value of plan assets at beginning of year
|
278.4
|
|
294.5
|
|
||
|
Actual return on plan assets
|
41.1
|
|
6.0
|
|
||
|
Employer contributions
|
27.0
|
|
31.1
|
|
||
|
Participant contributions
|
1.0
|
|
0.9
|
|
||
|
Benefits paid
|
(21.8
|
)
|
(27.4
|
)
|
||
|
Settlements
|
(1.2
|
)
|
(4.7
|
)
|
||
|
Currency translation adjustment
|
(35.8
|
)
|
(22.0
|
)
|
||
|
Fair value of plan assets at end of year
|
288.7
|
|
278.4
|
|
||
|
Funded status, net
|
$
|
(258.9
|
)
|
$
|
(263.3
|
)
|
|
Amounts recognized in the consolidated balance sheets consist of:
|
||||||
|
Other assets
|
$
|
0.3
|
|
$
|
0.2
|
|
|
Other accrued liabilities
|
(10.1
|
)
|
(11.2
|
)
|
||
|
Accrued pension and other long-term employee benefits
|
(249.1
|
)
|
(252.3
|
)
|
||
|
Net amount recognized
|
$
|
(258.9
|
)
|
$
|
(263.3
|
)
|
The projected benefit obligation for other long-term benefit plans was reduced to
zero
during the year ended December 31, 2015 when the plan was effectively settled from the
$0.1 million
projected benefit obligation at the beginning of the 2015.
The PBO is the actuarial present value of benefits attributable to employee service rendered to date, including the effects of estimated future pay increases. The accumulated benefit obligation ("ABO") is the actuarial present value of benefits attributable to employee service rendered to date, but does not include the effects of estimated future pay increases.
84
The following table reflects the ABO for all defined benefit pension plans as of
December 31, 2016
and
2015
. Further, the table reflects the aggregate PBO, ABO and fair value of plan assets for pension plans with PBO in excess of plan assets and for pension plans with ABO in excess of plan assets.
|
Year Ended December 31,
|
||||||
|
2016
|
2015
|
|||||
|
ABO
|
$
|
516.4
|
|
$
|
500.1
|
|
|
Plans with PBO in excess of plan assets:
|
||||||
|
PBO
|
$
|
542.6
|
|
$
|
537.1
|
|
|
ABO
|
$
|
511.6
|
|
$
|
495.7
|
|
|
Fair value plan assets
|
$
|
283.4
|
|
$
|
273.7
|
|
|
Plans with ABO in excess of plan assets:
|
||||||
|
PBO
|
$
|
488.2
|
|
$
|
532.0
|
|
|
ABO
|
$
|
461.3
|
|
$
|
492.7
|
|
|
Fair value plan assets
|
$
|
232.6
|
|
$
|
270.3
|
|
The pre-tax amounts not yet reflected in net periodic benefit cost and included in accumulated other comprehensive loss include the following related to defined benefit plans:
|
Year Ended December 31,
|
||||||
|
|
2016
|
2015
|
||||
|
Accumulated net actuarial losses
|
$
|
(76.6
|
)
|
$
|
(48.3
|
)
|
|
Accumulated prior service credit
|
0.9
|
|
1.5
|
|
||
|
Total
|
$
|
(75.7
|
)
|
$
|
(46.8
|
)
|
Accumulated net actuarial losses and prior service credits related to other long-term benefit plans were reduced to
zero
for the year ended December 31, 2015 when the plan was effectively settled.
The accumulated net actuarial losses for pensions relate primarily to differences between the actual net periodic expense and the expected net periodic expense resulting from differences in the significant assumptions, including return on assets, discount rates and compensation trends, used in these estimates. For individual plans in which the accumulated net actuarial losses exceed
10%
of the higher of the market value of plan assets or the PBO at the beginning of the year, amortization of such excess has been included in net periodic benefit costs for pension and other long-term employee benefits. The amortization period is the average remaining service period of active employees expected to receive benefits unless a plan is mostly inactive in which case the amortization period is the average remaining life expectancy of the plan participants. Accumulated prior service credit is amortized over the future service periods of those employees who are active at the dates of the plan amendments and who are expected to receive benefits.
The estimated pre-tax amounts that are expected to be amortized from accumulated other comprehensive loss into net periodic benefit cost during
2017
for the defined benefit plans is as follows:
|
|
2017
|
||
|
Amortization of net actuarial losses
|
$
|
(1.8
|
)
|
|
Amortization of prior service credit
|
—
|
|
|
|
Total
|
$
|
(1.8
|
)
|
85
Components of Net Periodic Benefit Cost
The following table sets forth the pre-tax components of net periodic benefit costs for the years ended
December 31, 2016
,
2015
and
2014
.
|
|
Defined Benefits
|
||||||||
|
|
Year Ended December 31,
|
||||||||
|
2016
|
2015
|
2014
|
|||||||
|
Components of net periodic benefit cost and amounts recognized in other comprehensive (income) loss:
|
|||||||||
|
Net periodic benefit cost:
|
|||||||||
|
Service cost
|
$
|
10.7
|
|
$
|
12.0
|
|
$
|
15.4
|
|
|
Interest cost
|
15.1
|
|
16.9
|
|
22.9
|
|
|||
|
Expected return on plan assets
|
(12.6
|
)
|
(14.6
|
)
|
(14.8
|
)
|
|||
|
Amortization of actuarial (gain) loss, net
|
0.4
|
|
0.4
|
|
(0.3
|
)
|
|||
|
Amortization of prior service credit
|
—
|
|
(0.1
|
)
|
—
|
|
|||
|
Curtailment gain
|
(1.1
|
)
|
—
|
|
(7.3
|
)
|
|||
|
Settlement (gain) loss
|
(0.5
|
)
|
0.5
|
|
0.1
|
|
|||
|
Special termination benefit loss
|
0.2
|
|
—
|
|
—
|
|
|||
|
Net periodic benefit cost
|
12.2
|
|
15.1
|
|
16.0
|
|
|||
|
Changes in plan assets and benefit obligations recognized in other comprehensive (income) loss:
|
|||||||||
|
Net actuarial (gain) loss, net
|
27.7
|
|
(3.4
|
)
|
60.6
|
|
|||
|
Amortization of actuarial gain (loss), net
|
(0.4
|
)
|
(0.4
|
)
|
0.3
|
|
|||
|
Prior service (credit) cost
|
—
|
|
2.7
|
|
(4.3
|
)
|
|||
|
Amortization of prior service credit
|
—
|
|
0.1
|
|
—
|
|
|||
|
Curtailment gain
|
1.1
|
|
—
|
|
7.3
|
|
|||
|
Settlement gain (loss)
|
0.5
|
|
(0.5
|
)
|
(0.1
|
)
|
|||
|
Other adjustments
|
—
|
|
—
|
|
(4.9
|
)
|
|||
|
Total (gain) loss recognized in other comprehensive (income) loss
|
28.9
|
|
(1.5
|
)
|
58.9
|
|
|||
|
Total recognized in net periodic benefit cost and other comprehensive (income) loss
|
$
|
41.1
|
|
$
|
13.6
|
|
$
|
74.9
|
|
86
|
|
Other Long-Term Employee Benefits
|
||||||||
|
|
Year Ended December 31,
|
||||||||
|
2016
|
2015
|
2014
|
|||||||
|
Components of net periodic benefit (gain) cost and amounts recognized in other comprehensive (income) loss:
|
|||||||||
|
Net periodic benefit (gain) cost:
|
|||||||||
|
Service cost
|
$
|
—
|
|
$
|
—
|
|
$
|
0.1
|
|
|
Interest cost
|
—
|
|
—
|
|
0.1
|
|
|||
|
Amortization of actuarial loss, net
|
—
|
|
—
|
|
0.1
|
|
|||
|
Amortization of prior service credit
|
—
|
|
(3.7
|
)
|
(1.4
|
)
|
|||
|
Settlement loss
|
—
|
|
0.3
|
|
—
|
|
|||
|
Net periodic benefit (gain) cost
|
—
|
|
(3.4
|
)
|
(1.1
|
)
|
|||
|
Changes in plan assets and benefit obligations recognized in other comprehensive (income) loss:
|
|||||||||
|
Net actuarial (gain) loss
|
—
|
|
—
|
|
(4.6
|
)
|
|||
|
Amortization of actuarial gain (loss)
|
—
|
|
—
|
|
(0.1
|
)
|
|||
|
Amortization of prior service credit
|
—
|
|
3.7
|
|
1.4
|
|
|||
|
Settlement loss
|
—
|
|
(0.3
|
)
|
—
|
|
|||
|
Other adjustments
|
—
|
|
0.3
|
|
—
|
|
|||
|
Total (gain) loss recognized in other comprehensive income
|
—
|
|
3.7
|
|
(3.3
|
)
|
|||
|
Total recognized in net periodic benefit cost and other comprehensive (income) loss
|
$
|
—
|
|
$
|
0.3
|
|
$
|
(4.4
|
)
|
Significant Events
During the year ended December 31, 2014, we recorded a curtailment gain of
$7.3 million
within selling, general and administrative expenses due to an amendment to one of our pension plans. In addition, amendments to our long-term employee benefit plans resulted in increases to accumulated other comprehensive income of
$12.0 million
at December 31, 2014. These amounts will continue to be recognized in earnings over the remaining future service periods of active participants.
87
Assumptions
We used the following assumptions in determining the benefit obligations and net periodic benefit cost:
|
|
2016
|
2015
|
2014
|
|||
|
Pension Benefits
|
||||||
|
Weighted-average assumptions:
|
||||||
|
Discount rate to determine benefit obligation
|
2.52
|
%
|
3.05
|
%
|
3.23
|
%
|
|
Discount rate to determine net cost
|
3.05
|
%
|
3.23
|
%
|
4.11
|
%
|
|
Rate of future compensation increases to determine benefit obligation
|
3.07
|
%
|
3.03
|
%
|
3.57
|
%
|
|
Rate of future compensation increases to determine net cost
|
3.03
|
%
|
3.57
|
%
|
3.52
|
%
|
|
Rate of return on plan assets to determine net cost
|
4.75
|
%
|
5.21
|
%
|
5.23
|
%
|
|
|
2016
|
2015
|
2014
|
|||
|
Other Long-Term Employee Benefits
|
||||||
|
Weighted-average assumptions:
|
||||||
|
Discount rate to determine benefit obligation
|
—
|
|
—
|
|
1.50
|
%
|
|
Discount rate to determine net cost
|
—
|
|
1.50
|
%
|
4.80
|
%
|
|
Rate of future compensation increases to determine benefit obligation
|
—
|
|
—
|
|
—
|
|
|
Rate of future compensation increases to determine net cost
|
—
|
|
—
|
|
—
|
|
The discount rates used reflect the expected future cash flow based on plan provisions, participant data and the currencies in which the expected future cash flows will occur. For the majority of our defined benefit pension obligations, we utilize prevailing long-term high quality corporate bond indices applicable to the respective country at the measurement date. In countries where established corporate bond markets do not exist, we utilize other index movement and duration analysis to determine discount rates. The long-term rate of return on plan assets assumptions reflect economic assumptions applicable to each country and assumptions related to the preliminary assessments regarding the type of investments to be held by the respective plans.
Estimated future benefit payments
The following reflects the total benefit payments expected to be paid for defined benefits:
|
Year ended December 31,
|
Benefits
|
||
|
2017
|
$
|
25.2
|
|
|
2018
|
$
|
24.1
|
|
|
2019
|
$
|
27.5
|
|
|
2020
|
$
|
25.7
|
|
|
2021
|
$
|
25.3
|
|
|
2022—2026
|
$
|
164.2
|
|
There are
no
future benefit payments expected to be paid for other long-term employee benefits as this plan was effectively settled at December 31, 2015.
Plan Assets
The defined benefit pension plans for our subsidiaries represent single-employer plans and the related plan assets are invested within separate trusts. Each of the single-employer plans is managed in accordance with the requirements of local laws and regulations governing defined benefit pension plans for the exclusive purpose of providing pension benefits to participants and their beneficiaries. Pension plan assets are typically held in a trust by financial institutions. Our asset allocation targets established are intended to achieve the plan’s investment strategies.
88
Equity securities include varying market capitalization levels. U.S. equity securities are primarily large-cap companies. Fixed income investments include corporate issued, government issued and asset backed securities. Corporate debt securities include a range of credit risk and industry diversification. Other investments include real estate and private market securities such as insurance contracts, interests in private equity, and venture capital partnerships. Assets measured using NAV a practical expedient, as described in Note 4, include debt asset backed securities and hedge funds. Debt asset backed securities primarily consist of collateralized debt obligations. The market values for these assets are based on the net asset values multiplied by the number of shares owned.
Fair value calculations may not be indicative of net realizable value or reflective of future fair values. Furthermore, although we believe the valuation methods are appropriate and consistent with other market participants, the use of different methodologies or assumptions to determine the fair value of certain financial instruments could result in a different fair value measurement at the reporting date.
The Company’s investment strategy in pension plan assets is to generate earnings over an extended time to help fund the cost of benefits while maintaining an adequate level of diversification for a prudent level of risk. The table below summarizes the weighted average actual and target pension plan asset allocations at December 31 for all funded Axalta defined benefit plans.
|
Asset Category
|
2016
|
2015
|
Target Allocation
|
|
Equity securities
|
30-35%
|
30-35%
|
30-35%
|
|
Debt securities
|
35-40%
|
35-40%
|
35-40%
|
|
Real estate
|
0-5%
|
0-5%
|
0-5%
|
|
Other
|
25-30%
|
20-25%
|
25-30%
|
89
The table below presents the fair values of the defined benefit pension plan assets by level within the fair value hierarchy, as described in Note 3, at
December 31, 2016
and
2015
, respectively.
|
|
Fair value measurements at
December 31, 2016
|
|||||||||||
|
|
Total
|
Level 1
|
Level 2
|
Level 3
|
||||||||
|
Asset Category:
|
||||||||||||
|
Cash and cash equivalents
|
$
|
2.8
|
|
$
|
2.8
|
|
$
|
—
|
|
$
|
—
|
|
|
U.S. equity securities
|
30.7
|
|
30.7
|
|
—
|
|
—
|
|
||||
|
Non-U.S. equity securities
|
63.9
|
|
63.5
|
|
0.3
|
|
0.1
|
|
||||
|
Debt securities—government issued
|
60.9
|
|
48.0
|
|
12.9
|
|
—
|
|
||||
|
Debt securities—corporate issued
|
38.4
|
|
31.0
|
|
5.3
|
|
2.1
|
|
||||
|
Hedge funds
|
0.2
|
|
0.2
|
|
—
|
|
—
|
|
||||
|
Private market securities
|
64.4
|
|
0.2
|
|
0.1
|
|
64.1
|
|
||||
|
Real estate investments
|
11.2
|
|
—
|
|
—
|
|
11.2
|
|
||||
|
Total
|
$
|
272.5
|
|
$
|
176.4
|
|
$
|
18.6
|
|
$
|
77.5
|
|
|
Debt asset backed securities at NAV
|
8.8
|
|
||||||||||
|
Hedge funds at NAV
|
7.4
|
|
||||||||||
|
$
|
288.7
|
|
||||||||||
|
|
Fair value measurements at
December 31, 2015
|
|||||||||||
|
|
Total
|
Level 1
|
Level 2
|
Level 3
|
||||||||
|
Asset Category:
|
||||||||||||
|
Cash and cash equivalents
|
$
|
2.8
|
|
$
|
2.8
|
|
$
|
—
|
|
$
|
—
|
|
|
U.S. equity securities
|
23.6
|
|
23.6
|
|
—
|
|
—
|
|
||||
|
Non-U.S. equity securities
|
70.3
|
|
69.8
|
|
0.4
|
|
0.1
|
|
||||
|
Debt—government issued
|
64.8
|
|
53.0
|
|
11.8
|
|
—
|
|
||||
|
Debt—corporate issued
|
44.4
|
|
37.7
|
|
4.5
|
|
2.2
|
|
||||
|
Hedge funds
|
0.2
|
|
0.2
|
|
—
|
|
—
|
|
||||
|
Private market securities
|
63.8
|
|
0.4
|
|
0.1
|
|
63.3
|
|
||||
|
Real estate investments
|
8.5
|
|
—
|
|
—
|
|
8.5
|
|
||||
|
Total
|
$
|
278.4
|
|
$
|
187.5
|
|
$
|
16.8
|
|
$
|
74.1
|
|
Level 3 assets are primarily insurance contracts pledged on behalf of employees with benefits in certain countries, ownership interests in investment partnerships, trusts that own private market securities, real estate investments, and other debt and equity investments. The fair values of our insurance contracts are determined based on the present value of the expected future benefits to be paid under the contract, discounted at a rate consistent with the related benefit obligation. Our real estate investments are primarily comprised of investments in commercial property funds externally valued using third party pricing methodologies, which are not actively traded on public exchanges. Debt and equity securities consist primarily of small investments in other investments that are valued at different frequencies based on the value of the underlying investments. The table below presents a roll forward of activity for these assets for the years ended
December 31, 2016
and
2015
.
90
|
|
Level 3 assets
|
|||||||||||
|
|
Total
|
Private
market
securities
|
Debt and Equity
|
Real
estate investments
|
||||||||
|
Ending balance at December 31, 2014
|
$
|
65.8
|
|
$
|
63.0
|
|
$
|
2.4
|
|
$
|
0.4
|
|
|
Realized (loss)
|
—
|
|
—
|
|
—
|
|
—
|
|
||||
|
Change in unrealized gain
|
(5.2
|
)
|
(5.2
|
)
|
(0.1
|
)
|
0.1
|
|
||||
|
Purchases, sales, issues and settlements
|
13.5
|
|
5.5
|
|
—
|
|
8.0
|
|
||||
|
Transfers in/(out) of Level 3
|
—
|
|
—
|
|
—
|
|
—
|
|
||||
|
Ending balance at December 31, 2015
|
$
|
74.1
|
|
$
|
63.3
|
|
$
|
2.3
|
|
$
|
8.5
|
|
|
Realized (loss)
|
—
|
|
—
|
|
—
|
|
—
|
|
||||
|
Change in unrealized gain
|
1.3
|
|
(1.4
|
)
|
(0.1
|
)
|
2.8
|
|
||||
|
Purchases, sales, issues and settlements
|
2.1
|
|
2.2
|
|
—
|
|
(0.1
|
)
|
||||
|
Transfers in/(out) of Level 3
|
—
|
|
—
|
|
—
|
|
—
|
|
||||
|
Ending balance at December 31, 2016
|
$
|
77.5
|
|
$
|
64.1
|
|
$
|
2.2
|
|
$
|
11.2
|
|
Assumptions and Sensitivities
The discount rate is determined as of each measurement date, based on a review of yield rates associated with long-term, high-quality corporate bonds. The calculation separately discounts benefit payments using the spot rates from a long-term, high-quality corporate bond yield curve.
The long-term rate of return assumption represents the expected average rate of earnings on the funds invested to provide for the benefits included in the benefit obligations. The long-term rate of return assumption is determined based on a number of factors, including historical market index returns, the anticipated long-term asset allocation of the plans, historical plan return data, plan expenses and the potential to outperform market index returns. For
2017
, the expected long-term rate of return is
4.73%
.
Anticipated Contributions to Defined Benefit Plan
For funded pension plans, our funding policy is to fund amounts for pension plans sufficient to meet minimum requirements set forth in applicable benefit laws and local tax laws. Based on the same assumptions used to measure our benefit obligations at
December 31, 2016
we expect to contribute
$12.8 million
to our defined benefit plans during
2017
.
No
plan assets are expected to be returned to the Company in
2017
.
Defined Contribution Plans
The Company sponsors defined contribution plans in both its US and non-US subsidiaries, under which salaried and certain hourly employees may defer a portion of their compensation. Eligible participants may contribute to the plan up to the allowable amount as determined by the plan of their regular compensation before taxes. All contributions and Company matches are invested at the direction of the employee. Company matching contributions vest immediately and aggregated to
$43.3 million
,
$36.7 million
and
$35.9 million
for the years ended
December 31, 2016
,
2015
and 2014, respectively.
(10) STOCK-BASED COMPENSATION
During the years ended
December 31, 2016
,
2015
and
2014
, we recogni
zed
$41.1 million
,
$30.2 million
and
$8.0 million
, respectively, in stock-based compensation expense which was allocated between costs of goods sold and selling, general and administrative expenses on the consolidated statements of operations. We recognized a tax benefit on stock-based compensation of
$14.0 million
,
$10.7 million
and
$2.8 million
and for the years ended
December 31, 2016
,
2015
and
2014
, respectively.
91
Included in the
$30.2 million
of stock-based compensation expense recorded during the year ended December 31, 2015 was
$8.2 million
of stock-based compensation expense attributable to accelerated vesting of all issued and outstanding stock options issued under the Axalta Coating Systems Bermuda Co., Ltd. 2013 Equity Incentive Plan (the "2013 Plan"), as a result of the April 2015 Carlyle Offerings which reduced Carlyle's interest in Axalta to below
50%
, triggering a liquidity event (the "Liquidity Event") as defined in the 2013 Plan.
Compensation cost is recorded for the fair values of the awards over the requisite service period of the awards using the graded-vesting attribution method net of forfeitures. As a result of our adoption of ASU 2016-09, "Stock Compensation" as of January 1, 2016 (discussed further at Note 4) we have elected to recognize forfeitures as they occur. As our forfeiture rate prior to this adoption was estimated at
0%
, this adoption did not result in a change to our financial statements.
Description of Equity Incentive Plan
In 2013, Axalta’s Board of Directors approved the 2013 Plan which reserved an aggregate of
19,839,143
common shares of the Company for issuance to employees, directors and consultants. The 2013 Plan provided for the issuance of stock options, restricted stock or other stock-based awards. No further awards may be granted pursuant to the 2013 Plan.
In 2014, Axalta's Board of Directors approved the Axalta Coating Systems Ltd. 2014 Incentive Award Plan (the "2014 Plan") which reserved an aggregate
11,830,000
shares of common stock of the Company for issuance to employees, directors and consultants. The 2014 Plan provides for the issuance of stock options, restricted stock or other stock-based awards. All awards granted pursuant to the 2014 Plan must be authorized by the Board of Directors of Axalta or a designated committee thereof. Our Board of Directors has generally delegated responsibility for administering the 2014 Plan to our Compensation Committee.
The terms of the options may vary with each grant and are determined by the Compensation Committee within the guidelines of the 2013 and 2014 Plans. Option life cannot exceed
ten years
and the Company may settle option exercises by issuing new shares, treasury shares or shares purchased on the open market.
For all awards subsequent to the IPO, the market value (and exercise price for stock options) of the award is equal to the closing price of the stock on the date of grant. Valuation of awards prior to this date are discussed below.
Stock Options
The Black-Scholes option pricing model was used to estimate fair values of the options as of the date of the grant. The weighted average fair values of options granted in 2016, 2015 and 2014 were
$5.69
,
$8.15
and
$1.92
per share, respectively. Options granted in 2016 and 2015 have a
three
-year vesting period. Principal weighted average assumptions used in applying the Black-Scholes model were as follows:
|
|
2016 Grants
|
2015 Grants
|
2014 Grants
|
|||
|
Expected Term
|
6.00 years
|
|
6.00 years
|
|
7.81 years
|
|
|
Volatility
|
21.63
|
%
|
22.19
|
%
|
28.28
|
%
|
|
Dividend Yield
|
—
|
|
—
|
|
—
|
|
|
Discount Rate
|
1.45
|
%
|
1.79
|
%
|
2.21
|
%
|
During the year ended December 31, 2014, we granted options with strike prices of
$5.92
,
$7.21
,
$8.88
and
$11.84
. The per share fair value of our common stock for those awards was estimated using a contemporaneous valuation consistent with the American Institute of Certified Public Accountants Practice Aid, "Valuation of Privately-Held Company Equity Securities Issued as Compensation" (the "Practice Aid"). In conducting this valuation, we considered objective and subjective factors that we believed to be relevant, including our best estimate of our business condition, prospects and operating performance. Within this contemporaneous valuation, a range of factors, assumptions and methodologies were used. The significant factors included:
|
•
|
the fact that we were a private company with illiquid securities;
|
|
•
|
our historical operating results;
|
|
•
|
our discounted future cash flows, based on our projected operating results;
|
|
•
|
valuations of comparable public companies; and
|
92
|
•
|
the risk involved in the investment, as related to earnings stability, capital structure, competition and market potential.
|
For the contemporaneous valuation of our common stock, management estimated, as of the issuance date, our enterprise value on a continuing operations basis, using the income and market approaches, as described in the Practice Aid. The income approach utilized the discounted cash flow ("DCF") methodology based on our financial forecasts and projections, as detailed below. The market approach utilized the Guideline Public Company and Guideline Transactions methods, as detailed below.
For the DCF methodology, we prepared annual projections of future cash flows through 2018. Beyond 2018, projected cash flows through the terminal year were projected at long-term sustainable growth rates consistent with long-term inflationary and industry expectations. Our projections of future cash flows were based on our estimated net debt-free cash flows and were discounted to the valuation date using a weighted-average cost of capital estimated based on market participant assumptions.
For the Guideline Public Company and Guideline Transactions methods, we identified a group of comparable public companies and recent transactions within the chemicals industry. For the comparable companies, we estimated market multiples based on trading prices and trailing 12 months EBITDA. These multiples were then applied to our trailing 12 months EBITDA. When selecting comparable companies, consideration was given to industry similarity, their specific products offered, financial data availability and capital structure.
For the comparable transactions, we estimated market multiples based on prices paid for the related transactions and trailing 12 months EBITDA. These multiples were then applied to our trailing 12 months EBITDA. The results of the market approaches corroborated the fair value determined using the income approach.
To estimate the expected stock option term for the
$5.92
and
$7.21
stock options referred to above, we used the simplified method as the options strike price equaled the grant date fair value and Axalta, a privately-held company, had no exercise history. Based upon this simplified method the
$5.92
and
$7.21
per share stock options have an expected term of
6.5 years
. The strike price for the
$8.88
per share and
$11.84
per share tranches of options exceeded fair value at the grant date which required the use of an estimate of an implicitly longer holding period, resulting in the term of
8.25 years
.
The expected term assumptions used for the 2015 and 2016 grants were also determined using the simplified method and resulted in an expected term of
6.0 years
. We do not anticipate paying cash dividends in the foreseeable future and, therefore, use an expected dividend yield of
zero
. Volatility for outstanding grants is based upon the peer group since the Company was either privately-held at the date of grant or had a limited history as a public company. The discount rate was derived from the U.S. Treasury yield curve.
A summary of stock option award activity as of and for the year ended
December 31, 2016
is presented below:
|
Awards
(in millions)
|
Weighted-
Average
Exercise
Price
|
Aggregate
Intrinsic
Value
(in millions)
|
Weighted
Average
Remaining
Contractual
Life (years)
|
||||||
|
Outstanding at December 31, 2015
|
11.0
|
|
$
|
12.19
|
|
||||
|
Granted
|
1.1
|
|
$
|
23.28
|
|
||||
|
Exercised
|
(2.1
|
)
|
$
|
7.92
|
|
||||
|
Forfeited
|
(0.4
|
)
|
$
|
11.40
|
|
||||
|
Outstanding at December 31, 2016
|
9.6
|
|
$
|
14.40
|
|
||||
|
Vested and expected to vest at December 31, 2016
|
9.6
|
|
$
|
14.40
|
|
$
|
128.3
|
|
7.17
|
|
Exercisable at December 31, 2016
|
7.7
|
|
$
|
11.42
|
|
$
|
124.0
|
|
6.79
|
Cash received by the Company upon exercise of options in
2016
was
$30.1 million
, inclusive of tax benefits of
$13.4 million
. The intrinsic value of options exercised in 2016 and 2015 was
$42.5 million
and
$166.8 million
, respectively. The intrinsic value of options exercised in 2014 was not material.
The fair value of shares vested during 2016 and 2015 was
$3.4 million
and
$24.3 million
, respectively.
93
At
December 31, 2016
, there was
$4.8 million
of unrecognized compensation cost relating to outstanding unvested stock options expected to be recognized over the weighted average period of
1.8 years
.
Restricted Stock Awards and Restricted Stock Units
During the years ended
December 31, 2016
and 2015, we issued
0.9 million
shares and
1.7 million
shares of restricted stock awards and restricted stock units, respectively, with average grant prices of
$23.64
per share and
$32.22
per share, respectively. A portion of these awards vests ratably over three years. Other awards granted to certain members of management cliff vest over two and three year periods and are subject to accelerated vesting in the event of the award recipient's termination of employment under certain circumstances.
A summary of restricted stock and restricted stock unit award activity as of
December 31, 2016
is presented below:
|
Awards
(millions)
|
Weighted-Average
Fair Value
|
||||
|
Outstanding at January 1, 2016
|
1.7
|
|
$
|
32.22
|
|
|
Granted
|
0.9
|
|
$
|
23.64
|
|
|
Vested
|
(0.2
|
)
|
$
|
31.60
|
|
|
Forfeited
|
(0.1
|
)
|
$
|
26.91
|
|
|
Outstanding at December 31, 2016
|
2.3
|
|
$
|
29.18
|
|
At
December 31, 2016
, there was
$25.0 million
of unamortized expense relating to unvested restricted stock awards and restricted stock units that is expected to be amortized over a weighted average period of
1.7
years. Compensation expense is recognized for the fair values of the awards over the requisite service period of the awards using the graded-vesting attribution method.
The intrinsic value of awards vested during 2016 was
$5.5 million
. The total fair value of awards vested during 2016 was
$6.2 million
. No shares vested prior to 2016.
Performance Stock Awards and Performance Share Units
During the year ended
December 31, 2016
, the Company granted performance stock awards and performance share units (collectively referred to as "PSUs") to certain employees of the Company as part of their annual equity compensation award.
PSUs are tied to the Company’s total shareholder return ("TSR") relative to the TSR of a selected industry peer group. Each award covers a
three
-year performance cycle starting January 1, 2016 through December 31, 2018 with a
three
-year service period vesting requirement. Awards will cliff vest upon meeting the applicable TSR thresholds and the
three
-year service requirement. The actual number of shares awarded is adjusted to between
zero
and
200%
of the target award amount based upon achievement of pre-determined objectives. TSR relative to peers is considered a market condition under applicable authoritative guidance.
A summary of performance stock and performance share unit award activity as of
December 31, 2016
is presented below:
|
Awards
(millions)
|
Weighted-Average
Fair Value
|
||||
|
Outstanding at January 1, 2016
|
—
|
|
$
|
—
|
|
|
Granted
|
0.3
|
|
$
|
24.74
|
|
|
Vested
|
—
|
|
$
|
—
|
|
|
Forfeited
|
—
|
|
$
|
—
|
|
|
Outstanding at December 31, 2016
|
0.3
|
|
$
|
27.74
|
|
At
December 31, 2016
, there was
$6.0 million
of unamortized expense relating to unvested PSUs that is expected to be amortized over a weighted average period of
2.1 years
. Compensation expense is recognized for the fair values of the awards over the requisite service period of the awards using the graded-vesting attribution method.
94
(11) RELATED PARTY TRANSACTIONS
The Carlyle Group L.P. and its affiliates ("Carlyle")
We entered into a consulting agreement with Carlyle Investment Management L.L.C. ("Carlyle Investment"), an affiliate of Carlyle pursuant to which Carlyle Investment provided certain consulting services to Axalta. Under this agreement, subject to certain conditions, we were required to pay an annual consulting fee to Carlyle Investment of
$3.0 million
payable in equal quarterly installments and reimburse Carlyle Investment for out-pocket expenses incurred in providing the consulting services. During the year ended December 31, 2014, we recorded expense of
$3.2 million
in regular monthly management fees and out of pocket costs as well as a
$13.4 million
charge related to the termination of the agreement upon completion of the IPO.
Service King Collision Repair
Service King Collision Repair, a portfolio company of funds affiliated with Carlyle, has purchased products from our distributors in the past and may continue to do so in the future. During the year ended December 31, 2014, Carlyle sold their majority interest in Service King Collision Repair, thus making the entity no longer a related party. Related party sales prior to this transaction were
$4.0 million
for the year ended December 31, 2014.
(12) OTHER EXPENSE, NET
|
|
Year Ended December 31,
|
||||||||
|
2016
|
2015
|
2014
|
|||||||
|
Foreign exchange losses, net
|
$
|
30.6
|
|
$
|
93.7
|
|
$
|
81.2
|
|
|
Management fees and expenses
|
—
|
|
—
|
|
16.6
|
|
|||
|
Impairment of real estate investment
|
10.5
|
|
30.6
|
|
—
|
|
|||
|
Indemnity (gains) losses associated with the Acquisition
|
(0.7
|
)
|
(1.0
|
)
|
17.8
|
|
|||
|
Debt extinguishment and refinancing related costs
|
97.6
|
|
2.5
|
|
6.1
|
|
|||
|
Other miscellaneous expense (income), net
|
4.7
|
|
(14.6
|
)
|
(6.7
|
)
|
|||
|
Total
|
$
|
142.7
|
|
$
|
111.2
|
|
$
|
115.0
|
|
Our net foreign exchange losses for the years ended
December 31, 2016
, 2015 and 2014 consist primarily of the impacts related to the remeasurement of our non-U.S. dollar denominated monetary assets and liabilities at our Venezuelan subsidiary, which is a U.S. dollar functional entity. In addition, as discussed further in Note 26, during the years ended December 31, 2016 and 2015, we recorded impairment charges on our non-operational real estate investment.
Expense related to debt extinguishment and refinancing related costs includes premiums on the redemption of our 2021 Dollar Senior Notes and 2021 Euro Senior Notes (collectively, the "2021 Senior Notes") during the year ended
December 31, 2016
. In addition, the refinancing of our 2021 Senior Notes, the amendment of our 2020 Dollar Term Loans and 2020 Euro Term Loans (collectively, the “2020 Term Loans”), an amendment to our Revolving Credit Facility, as well as multiple pre-payments on our 2020 Term Loans resulted in losses on extinguishment and the write-off of unamortized deferred financing costs and original issue discounts.
Other miscellaneous income, net included a gain for the year ended December 31, 2015 resulting from the acquisition of an additional
25%
interest in an equity method investee for a purchase price of
$4.3 million
. As a result of the acquisition, we obtained a controlling interest and recognized a gain of
$5.4 million
on the remeasurement of our previously held equity interest as of the acquisition date. Also included in other miscellaneous income, net for the year ended December 31, 2015 was the recognition of a
$5.6 million
gain on derivative contracts compared to losses of
$4.3 million
and
$1.4 million
for the years ended December 31, 2016 and 2014, respectively.
95
(13) INCOME TAXES
Domestic and Foreign Components of Income Before Income Taxes
|
|
Year Ended December 31,
|
||||||||
|
2016
|
2015
|
2014
|
|||||||
|
Domestic
|
$
|
31.9
|
|
$
|
(19.4
|
)
|
$
|
(8.8
|
)
|
|
Foreign
|
55.5
|
|
180.6
|
|
45.6
|
|
|||
|
Total
|
$
|
87.4
|
|
$
|
161.2
|
|
$
|
36.8
|
|
Provision (Benefit) for Income Taxes
|
Year Ended December 31, 2016
|
Year Ended December 31, 2015
|
Year Ended December 31, 2014
|
|||||||||||||||||||||||||
|
|
Current
|
Deferred
|
Total
|
Current
|
Deferred
|
Total
|
Current
|
Deferred
|
Total
|
||||||||||||||||||
|
U.S. federal
|
$
|
0.9
|
|
$
|
(0.2
|
)
|
$
|
0.7
|
|
$
|
—
|
|
$
|
19.2
|
|
$
|
19.2
|
|
$
|
—
|
|
$
|
(2.1
|
)
|
$
|
(2.1
|
)
|
|
U.S. state and local
|
3.7
|
|
8.3
|
|
12.0
|
|
3.1
|
|
8.6
|
|
11.7
|
|
2.0
|
|
(2.9
|
)
|
(0.9
|
)
|
|||||||||
|
Foreign
|
49.4
|
|
(22.3
|
)
|
27.1
|
|
65.2
|
|
(32.8
|
)
|
32.4
|
|
38.3
|
|
(33.2
|
)
|
5.1
|
|
|||||||||
|
Total
|
$
|
54.0
|
|
$
|
(14.2
|
)
|
$
|
39.8
|
|
$
|
68.3
|
|
$
|
(5.0
|
)
|
$
|
63.3
|
|
$
|
40.3
|
|
$
|
(38.2
|
)
|
$
|
2.1
|
|
Reconciliation to U.S. Statutory Rate
|
Year Ended December 31, 2016
|
Year Ended December 31, 2015
|
Year Ended December 31, 2014
|
|||||||||||||
|
Statutory U.S. federal income tax rate
(1)
|
$
|
30.6
|
|
35.0
|
%
|
$
|
56.4
|
|
35.0
|
%
|
$
|
12.9
|
|
35.0
|
%
|
|
Foreign income taxed at rates other than 35%
|
(45.6
|
)
|
(52.2
|
)
|
(41.4
|
)
|
(25.6
|
)
|
(46.7
|
)
|
(127.0
|
)
|
|||
|
Changes in valuation allowances
|
9.6
|
|
11.0
|
|
34.4
|
|
21.3
|
|
44.4
|
|
120.9
|
|
|||
|
Foreign exchange gain (loss), net
|
3.1
|
|
3.5
|
|
(10.5
|
)
|
(6.5
|
)
|
8.7
|
|
23.7
|
|
|||
|
Unrecognized tax benefits
(2)
|
7.1
|
|
8.1
|
|
0.4
|
|
0.3
|
|
(44.0
|
)
|
(119.7
|
)
|
|||
|
Foreign taxes
|
4.5
|
|
5.1
|
|
5.8
|
|
3.6
|
|
1.2
|
|
3.3
|
|
|||
|
Non-deductible interest
|
6.7
|
|
7.6
|
|
4.9
|
|
3.0
|
|
15.4
|
|
41.9
|
|
|||
|
Non-deductible expenses
|
4.7
|
|
5.4
|
|
5.5
|
|
3.4
|
|
14.2
|
|
38.6
|
|
|||
|
Tax credits
|
(6.7
|
)
|
(7.7
|
)
|
(5.5
|
)
|
(3.4
|
)
|
(5.1
|
)
|
(13.8
|
)
|
|||
|
Excess tax benefits relating to share-based compensation
(3)
|
(13.4
|
)
|
(15.4
|
)
|
—
|
|
—
|
|
—
|
|
—
|
|
|||
|
Venezuela impairment
|
23.8
|
|
27.2
|
|
10.7
|
|
6.6
|
|
—
|
|
—
|
|
|||
|
U.S. state and local taxes, net
|
7.8
|
|
9.0
|
|
8.1
|
|
5.0
|
|
—
|
|
—
|
|
|||
|
Other - net
|
7.6
|
|
9.0
|
|
(5.5
|
)
|
(3.4
|
)
|
1.1
|
|
2.8
|
|
|||
|
Total income tax provision (benefit) / effective tax rate
|
$
|
39.8
|
|
45.6
|
%
|
$
|
63.3
|
|
39.3
|
%
|
$
|
2.1
|
|
5.7
|
%
|
|
(1)
|
The U.S. statutory rate has been used as management believes it is more meaningful to the Company.
|
|
(2)
|
Within this amount, the Company released an unrecognized tax benefit of
$21.1 million
in 2014 and recorded an unrecognized tax benefit of
$3.6 million
in 2016, both of which related to non-deductible interest and debt acquisition costs. These adjustments were fully offset by changes in the valuation allowance.
|
|
(3)
|
During the year ended December 31, 2016, the Company early adopted ASU 2016-09, which now requires the excess tax benefits related to share-based compensation to be reflected in the consolidated statements of operations as a component of provision for income taxes. Refer to Note 4 to the consolidated financial statements for further information.
|
96
|
Deferred Tax Balances
|
Year Ended December 31,
|
|||||
|
2016
|
2015
|
|||||
|
Deferred tax asset
|
||||||
|
Tax loss, credit and interest carryforwards
|
$
|
263.7
|
|
$
|
227.4
|
|
|
Goodwill and intangibles
|
48.1
|
|
93.6
|
|
||
|
Compensation and employee benefits
|
92.8
|
|
93.8
|
|
||
|
Accruals and other reserves
|
31.7
|
|
30.4
|
|
||
|
Research and development capitalization
|
15.7
|
|
—
|
|
||
|
Other
|
16.4
|
|
12.1
|
|
||
|
Total deferred tax assets
|
468.4
|
|
457.3
|
|
||
|
Less: Valuation allowance
|
(135.4
|
)
|
(127.8
|
)
|
||
|
Net deferred tax assets
|
333.0
|
|
329.5
|
|
||
|
Deferred tax liabilities
|
||||||
|
Property, plant & equipment
|
(168.4
|
)
|
(191.5
|
)
|
||
|
Equity investment & other securities
|
(0.7
|
)
|
(0.5
|
)
|
||
|
Unremitted earnings
|
(5.8
|
)
|
(6.3
|
)
|
||
|
Long-term debt
|
(4.2
|
)
|
(6.6
|
)
|
||
|
Total deferred tax liabilities
|
(179.1
|
)
|
(204.9
|
)
|
||
|
Net deferred tax asset
|
$
|
153.9
|
|
$
|
124.6
|
|
|
Non-current assets
1
|
314.1
|
|
272.6
|
|
||
|
Non-current liability
1
|
(160.2
|
)
|
(148.0
|
)
|
||
|
Net deferred tax asset
|
$
|
153.9
|
|
$
|
124.6
|
|
1
The non-current deferred tax asset and deferred tax liabilities balances for the year ended December 31, 2016 and December 31, 2015 are inclusive of effects of the adoption of ASU 2015-17, discussed further at Note 4 to the consolidated financial statements.
At
December 31, 2016
, the Company had
$152.8 million
of net operating loss carryforwards (tax effected) in certain non-U.S. jurisdictions, net of uncertain tax positions. Of these,
$63.2 million
have indefinite carryforward periods, and the remaining
$89.6 million
are subject to expiration between the years 2018 through 2026. Non-U.S. tax credit carryforwards at December 31, 2016 amounted to
$1.9 million
. Of these,
$1.8 million
have indefinite carryforward period, and the remaining are subject to expiration between the years 2018 and 2021.
In the U.S., there were approximately
$62.8 million
of federal net operating loss carryforwards (tax effected) subject to expiration in years beyond 2032, and
$2.5 million
of state net operating loss carryforwards (tax effected) subject to expiration between the years 2018 and 2035. U.S. tax credit carryforwards at
December 31, 2016
amounted to
$26.0 million
subject to expiration between the years 2019 and 2035. U.S. interest carryforwards at
December 31, 2016
of
$17.7 million
have an indefinite carryforward period. Utilization of our U.S. net operating loss and tax credit carryforwards may be subject to annual limitations due to the ownership change limitations provided by the Internal Revenue Code and similar state provisions. Such annual limitations could result in the expiration of the net operating loss and tax credit carryforwards before their utilization.
At December 31, 2015, the Company had
$144.4 million
of net operating loss carryforwards (tax effected) in certain non-U.S. jurisdictions, net of uncertain tax positions. Of these,
$76.4 million
have indefinite carryforward periods, and the remaining
$68.0 million
are subject to expiration between the years 2018 through 2025. Non-U.S. tax credit carryforwards at December 31, 2015 amounted to
$0.9 million
. Of these,
$0.6 million
have indefinite carryforward period, and the remaining are subject to expiration between the years 2018 and 2020.
97
In the U.S., there were approximately
$86.3 million
of federal net operating loss carryforwards (tax effected) subject to expiration in years beyond 2032, and
$4.2 million
of state net operating loss carryforwards (tax effected) subject to expiration between the years 2018 and 2035. U.S. tax credit carryforwards at December 31, 2015 amounted to
$18.7 million
subject to expiration between the years 2019 and 2035. U.S. interest carryforwards at December 31, 2015 of
$16.8 million
have an indefinite carryforward period. Utilization of our U.S. net operating loss and tax credit carryforwards may be subject to annual limitations due to the ownership change limitations provided by the Internal Revenue Code and similar state provisions. Such annual limitations could result in the expiration of the net operating loss and tax credit carryforwards before their utilization.
At December 31, 2015, of the net operating loss, credit and interest carryforwards (tax-effected),
$43.9 million
was not benefited, as it related to the windfall tax benefit on share-based compensation that occurred in 2015 which did not reduce income taxes payable. Upon adoption of ASU 2016-09, excess tax benefits relating to share-based compensation totaling
$43.9 million
that were previously not recognized were recorded on a modified retrospective basis through a cumulative-effect reclassification to retained earnings, thereby increasing the net operating loss carryforward at January 1, 2016 by
$43.9 million
.
Valuation allowances relate primarily to the increase in tax loss carryforwards in foreign jurisdictions where the Company does not believe the associated net deferred tax assets will be realized, due to expiration, limitation or insufficient future taxable income. A significant portion of the valuation allowance balances relates to the Company’s operations in Luxembourg and the Netherlands, which amount to
$113.8 million
and
$110.1 million
for years ended December 31, 2016 and December 31, 2015, respectively. In the Netherlands, the Company’s tax loss carryforwards have a
nine
-year carryforward period and are subject to expiration between years 2022 through 2025. In Luxembourg, the Company’s tax loss carryforwards have an indefinite carryforward period.
Total Gross Unrecognized Tax Benefits
|
|
Year Ended December 31,
|
||||||||
|
2016
|
2015
|
2014
|
|||||||
|
Balance at January 1
|
$
|
4.7
|
|
$
|
5.3
|
|
$
|
38.9
|
|
|
Increases related to acquisition
|
—
|
|
—
|
|
—
|
|
|||
|
Increases related to positions taken on items from prior years
|
—
|
|
—
|
|
—
|
|
|||
|
Decreases related to positions taken on items from prior years
|
(0.2
|
)
|
(0.6
|
)
|
(33.6
|
)
|
|||
|
Increases related to positions taken in the current year
|
7.8
|
|
—
|
|
—
|
|
|||
|
Settlement of uncertain tax positions with tax authorities
|
—
|
|
—
|
|
—
|
|
|||
|
Decreases due to expiration of statutes of limitations
|
—
|
|
—
|
|
—
|
|
|||
|
Balance at December 31
|
$
|
12.3
|
|
$
|
4.7
|
|
$
|
5.3
|
|
At
December 31, 2016
, 2015 and 2014, the total amount of gross unrecognized tax benefits was
$12.3 million
,
$4.7 million
and
$5.3 million
, of which
$8.5 million
,
$4.7 million
and
$5.3 million
would impact the effective tax rate, if recognized, respectively.
Interest and penalties associated with gross unrecognized tax benefits are included as components of the "Provision (benefit) for income taxes," and totaled an income tax expense of
$0.3 million
,
$0.4 million
and
$6.8 million
in
2016
, 2015 and 2014, respectively. Accrued interest and penalties are included within the related tax liability line in the balance sheet. The Company’s accrual for interest and penalties at
December 31, 2016
,
2015
and 2014 was
$1.1 million
,
$0.7 million
and
$0.3 million
, respectively.
During 2014, resolution on
two
separate tax matters resulted in the adjustment of gross unrecognized tax benefits. In April 2014, documentation was secured to support tax deductions related to pre-acquisition activities. Additionally, in December 2014, the Company received affirmative guidance with respect to the treatment of certain 2013 charges. As a result, the Company believes it is more likely than not to sustain the position and adjusted the unrecognized tax benefits related to these matters, resulting in a tax benefit of
$31.0 million
(offset by an unfavorable change in the valuation allowance of
$21.1 million
).
98
The Company is subject to income tax in approximately
52
jurisdictions outside the U.S. The Company’s significant operations outside the U.S. are located in Belgium, China, Germany and Mexico. The statute of limitations varies by jurisdiction with 2006 being the oldest tax year still open in the material jurisdictions. The Company is currently under audit in certain jurisdictions for tax years under responsibility of the predecessor, as well as tax periods under the Company's ownership. Pursuant to the acquisition agreement, all tax liabilities related to tax years prior to 2013 acquisition will be indemnified by DuPont.
As of
December 31, 2016
,
2015
and 2014, we had gross unrecognized tax benefits of
$13.4 million
,
$5.4 million
and
$5.6 million
, respectively, including interest and penalties. Due to the high degree of uncertainty regarding future timing of cash flows associated with these liabilities, we are unable to estimate the years in which settlement will occur with the respective taxing authorities.
(14) NET INCOME PER COMMON SHARE
Basic net income per common share excludes the dilutive impact of potentially dilutive securities and is computed by dividing net income by the weighted average number of common shares outstanding for the period. Diluted net income per common share includes the effect of potential dilution from the hypothetical exercise of outstanding stock options and vesting of restricted shares and performance shares. Potentially dilutive securities have been excluded in the weighted average number of common shares used for the calculation of net income per share in periods of net loss because the effect of such securities would be anti-dilutive. A reconciliation of our basic and diluted net income per common share is as follows:
|
Year Ended December 31,
|
|||||||||
|
(In millions, except per share data)
|
2016
(1)
|
2015
|
2014
|
||||||
|
Net income to common shareholders
|
$
|
41.8
|
|
$
|
93.7
|
|
$
|
27.4
|
|
|
Basic weighted average shares outstanding
|
238.1
|
|
233.8
|
|
229.3
|
|
|||
|
Diluted weighted average shares outstanding
|
244.4
|
|
239.7
|
|
230.3
|
|
|||
|
Net income per common share:
|
|||||||||
|
Basic net income per share
|
$
|
0.18
|
|
$
|
0.40
|
|
$
|
0.12
|
|
|
Diluted net income per share
|
$
|
0.17
|
|
$
|
0.39
|
|
$
|
0.12
|
|
(1)
Net income per common share for the year ended December 31, 2016 is inclusive of effects of the adoption of ASU 2016-09, discussed further at Note 4 which increased diluted weighted average shares outstanding by
1.7 million
shares.
The number of anti-dilutive shares that have been excluded in the computation of diluted net income per share for the years ended
December 31, 2016
,
2015
and 2014 were
1.3 million
,
0.7 million
and
7.2 million
, respectively.
Basic and diluted weighted average shares outstanding have been adjusted to reflect the Company’s
1.69
for 1 stock split which occurred in October 2014.
(15) ACCOUNTS AND NOTES RECEIVABLE, NET
|
Year Ended December 31,
|
||||||
|
|
2016
|
2015
|
||||
|
Accounts receivable—trade, net
|
$
|
640.4
|
|
$
|
647.2
|
|
|
Notes receivable
|
68.7
|
|
43.0
|
|
||
|
Other
|
92.8
|
|
75.6
|
|
||
|
Total
|
$
|
801.9
|
|
$
|
765.8
|
|
Accounts and notes receivable are carried at amounts that approximate fair value. Accounts receivable—trade, net are net of allowances of $
13.7 million
and
$10.7 million
at
December 31, 2016
and
2015
, respectively. Bad debt expense was
$3.4 million
,
$4.9 million
and
$5.1 million
for the years ended
December 31, 2016
,
2015
and
2014
, respectively.
99
(16) INVENTORIES
|
Year Ended December 31,
|
||||||
|
|
2016
|
2015
|
||||
|
Finished products
|
$
|
315.2
|
|
$
|
313.1
|
|
|
Semi-finished products
|
87.5
|
|
88.5
|
|
||
|
Raw materials and supplies
|
127.0
|
|
129.1
|
|
||
|
Total
|
$
|
529.7
|
|
$
|
530.7
|
|
Stores and supplies inventories of
$20.2 million
and
$20.8 million
at
December 31, 2016
and
2015
, respectively, were valued under the weighted average cost method.
(17) PROPERTY, PLANT AND EQUIPMENT, NET
Depreciation expense amounted to
$176.8 million
,
$169.1 million
and
$176.6 million
for the years ended
December 31, 2016
,
2015
and
2014
, respectively.
|
Year Ended December 31,
|
|||||||||
|
|
Useful Lives (years)
|
2016
|
2015
|
||||||
|
Land
|
$
|
85.2
|
|
$
|
84.4
|
|
|||
|
Buildings and improvements
|
5
|
-
|
25
|
454.0
|
|
423.5
|
|
||
|
Machinery and equipment
|
3
|
-
|
25
|
1,087.5
|
|
1,040.2
|
|
||
|
Software
|
5
|
-
|
7
|
139.7
|
|
132.1
|
|
||
|
Other
|
3
|
-
|
20
|
35.6
|
|
36.2
|
|
||
|
Construction in progress
|
131.0
|
|
138.9
|
|
|||||
|
Total
|
1,933.0
|
|
1,855.3
|
|
|||||
|
Accumulated depreciation
|
(617.3
|
)
|
(472.4
|
)
|
|||||
|
Property, plant and equipment, net
|
$
|
1,315.7
|
|
$
|
1,382.9
|
|
|||
(18) OTHER ASSETS
|
Year Ended December 31,
|
||||||
|
|
2016
|
2015
|
||||
|
Available for sale securities
|
$
|
4.4
|
|
$
|
4.2
|
|
|
Deferred income taxes—non-current
|
314.1
|
|
272.6
|
|
||
|
Other assets
|
209.3
|
|
202.8
|
|
||
|
Total
|
$
|
527.8
|
|
$
|
479.6
|
|
(19) ACCOUNTS PAYABLE
|
Year Ended December 31,
|
||||||
|
|
2016
|
2015
|
||||
|
Trade payables
|
$
|
429.5
|
|
$
|
418.6
|
|
|
Non-income taxes
|
27.2
|
|
22.4
|
|
||
|
Other
|
17.5
|
|
13.7
|
|
||
|
Total
|
$
|
474.2
|
|
$
|
454.7
|
|
100
(20) OTHER ACCRUED LIABILITIES
|
|
Year Ended December 31,
|
|||||
|
2016
|
2015
|
|||||
|
Compensation and other employee-related costs
|
$
|
145.8
|
|
$
|
140.0
|
|
|
Current portion of long-term employee benefit plans
|
10.1
|
|
11.2
|
|
||
|
Restructuring
|
66.1
|
|
41.3
|
|
||
|
Discounts, rebates, and warranties
|
97.4
|
|
74.8
|
|
||
|
Income taxes payable
|
23.3
|
|
18.8
|
|
||
|
Derivative liabilities
|
1.3
|
|
1.8
|
|
||
|
Other
|
73.6
|
|
82.3
|
|
||
|
Total
|
$
|
417.6
|
|
$
|
370.2
|
|
(21) BORROWINGS
Borrowings are summarized as follows:
|
Year Ended December 31,
|
||||||
|
2016
|
2015
|
|||||
|
2020 Dollar Term Loans
|
$
|
—
|
|
$
|
2,042.5
|
|
|
2020 Euro Term Loans
|
—
|
|
428.0
|
|
||
|
2023 Dollar Term Loans
|
1,545.0
|
|
—
|
|
||
|
2023 Euro Term Loans
|
417.6
|
|
—
|
|
||
|
2021 Dollar Senior Notes
|
—
|
|
750.0
|
|
||
|
2021 Euro Senior Notes
|
—
|
|
274.4
|
|
||
|
2024 Dollar Senior Notes
|
500.0
|
|
—
|
|
||
|
2024 Euro Senior Notes
|
349.7
|
|
—
|
|
||
|
2025 Euro Senior Notes
|
469.8
|
|
—
|
|
||
|
Short-term and other borrowings
|
39.8
|
|
26.5
|
|
||
|
Unamortized original issue discount
|
(10.0
|
)
|
(14.0
|
)
|
||
|
Unamortized deferred financing costs
|
(48.0
|
)
|
(65.9
|
)
|
||
|
$
|
3,263.9
|
|
$
|
3,441.5
|
|
|
|
Less:
|
||||||
|
Short term borrowings
|
$
|
8.3
|
|
$
|
22.7
|
|
|
Current portion of long-term borrowings
|
19.6
|
|
27.4
|
|
||
|
Long-term debt
|
$
|
3,236.0
|
|
$
|
3,391.4
|
|
Senior Secured Credit Facilities, as amended
On February 3, 2014 (the "Second Amendment Effective Date"), Axalta Coating Systems Dutch B B.V., as "Dutch Borrower", and its indirect wholly-owned subsidiary, Axalta Coating Systems U.S. Holdings Inc., as "U.S. Borrower", executed the second amendment to the Senior Secured Credit Facilities (the "Second Amendment"). The Second Amendment (i) converted all of the outstanding Dollar Term Loans (
$2,282.8 million
) into a new class of term loans (the "2020 Dollar Term Loans"), and (ii) converted all of the outstanding Euro Term Loans (€
397.0 million
) into a new class of term loans (the "2020 Euro Term Loans" and, together with the 2020 Dollar Term Loans (the "2020 Term Loans").
101
On December 15, 2016 (the "Fourth Amendment Effective Date"), Dutch B B.V. and Axalta US Holdings executed the fourth amendment to the Senior Secured Credit Facilities (the "Fourth Amendment"). The Fourth Amendment (i) converted all of the outstanding 2020 Dollar Term Loans (
$1,775.3 million
) into a new tranche of term loans issued at par with principal of
$1,545.0 million
(the "2023 Dollar Term Loans"), (ii) converted all of the outstanding 2020 Euro Term Loans (
€199.0 million
) into a new tranche of term loans issued at par with principal of
€400.0 million
(the "2023 Euro Term Loans" and, together with the 2023 Dollar Term Loans (the "2023 Term Loans") and the Revolving Credit Facility (as defined herein), the "Senior Secured Credit Facilities").
Interest was and is payable quarterly on both the 2020 Term Loans and 2023 Term Loans.
The 2023 Dollar Term Loans are subject to a floor of
0.75%
, plus an applicable rate after the Fourth Amendment Effective Date. The applicable rate for such 2023 Dollar Term Loans is
2.50%
per annum for Eurocurrency Rate Loans as defined in the credit agreement governing the Senior Secured Credit Facilities (the "Credit Agreement") and
1.50%
per annum for Base Rate Loans as defined in the Credit Agreement. The 2023 Euro Term Loans are also subject to a floor of
0.75%
, plus an applicable rate after the Fourth Amendment Effective Date. The applicable rate for such New Euro Term Loans is
2.25%
per annum for Eurocurrency Rate Loans. The 2023 Euro Term Loans may not be Base Rate Loans.
Prior to the Fourth Amendment, interest on the 2020 Dollar Term Loans was subject to a floor of
1.00%
, plus an applicable rate after the Second Amendment Effective Date. The applicable rate for such 2020 Dollar Term Loans was
3.00%
per annum for Eurocurrency Rate Loans and
2.00%
per annum for Base Rate Loans. The applicable rate for both Eurocurrency Rate Loans as well as Base Rate Loans was subject to a further
25
basis point reduction if the Total Net Leverage Ratio as defined in the Credit Agreement governing the Senior Secured Credit Facilities is less than or equal to
4.50
:1.00. The 2020 Euro Term Loans were also subject to a floor of
1.00%
, plus an applicable rate after the Second Amendment Effective Date. The applicable rate for such 2020 Euro Term Loans was
3.25%
per annum for Eurocurrency Rate Loans. The 2020 Euro Term Loans were not to be Base Rate Loans. The applicable rate was subject to a further
25
basis point reduction if the Total Net Leverage Ratio was less than or equal to
4.50
:1.00. During the third quarter of 2014, our Total Net Leverage Ratio was less than
4.50
:1.00. Consequently, the applicable rates were changed to
2.75%
for the 2020 Dollar Term Loans and
3.00%
for the 2020 Euro Term Loans through the Fourth Amendment Effective Date.
Prior to the Second Amendment, interest on the Dollar Term Loans was subject to a floor of
1.25%
for Eurocurrency Rate Loans plus an applicable rate of
3.50%
. For Base Rate Loans, the interest was subject to a floor of the greater of the federal funds rate plus
0.50%
, the Prime Lending Rate, an Adjusted Eurocurrency Rate, or
2.25%
plus an applicable rate of
2.50%
. Interest on the Euro Term Loans, a Eurocurrency Loan, was subject to a floor of
1.25%
plus an applicable rate of
4.00%
.
Any indebtedness under the Senior Secured Credit Facilities may be voluntarily prepaid in whole or in part, in minimum amounts, subject to the provisions set forth in the Credit Agreement. Such indebtedness is subject to mandatory prepayments amounting to the proceeds of asset sales over
$75.0 million
annually, proceeds from certain debt issuances not otherwise permitted under the Credit Agreement and
50%
(subject to a step-down to
25.0%
or
0%
if the First Lien Leverage Ratio falls below
4.25
:1.00 or
3.50
:1.00, respectively) of Excess Cash Flow.
The Senior Secured Credit Facilities are secured by substantially all assets of Axalta Coating Systems Dutch A B. V. ("Dutch A B.V.") and the guarantors. The 2023 Dollar Term Loans and 2023 Euro Term Loans mature on February 1, 2023. Principal is paid quarterly on both the 2023 Dollar Term Loans and the 2023 Euro Term Loans based on
1%
per annum of the original principal amount outstanding on the Fourth Amendment Effective Date with the unpaid balance due at maturity.
We are subject to customary negative covenants in addition to the First Lien Leverage Ratio financial covenant for purposes of determining any Excess Cash Flow mandatory payment. Further, the Senior Secured Credit Facilities, among other things, include customary restrictions (subject to certain exceptions) on the Company's ability to incur certain indebtedness, grant certain liens, make certain investments, declare or pay certain dividends, or repurchase shares of the Company's common stock. As of
December 31, 2016
, the Company is in compliance with all covenants under the Senior Secured Credit Facilities.
102
Revolving Credit Facility
On August 1, 2016 (the "Third Amendment Effective Date"), Dutch B B.V. and Axalta US Holdings executed the third amendment to the Senior Secured Credit Facilities (the "Third Amendment"). The Third Amendment impacted the Revolving Credit Facility by (i) extending the maturity of the Revolving Credit Facility to
five
years from the Third Amendment Effective Date, or August 1, 2021, provided that such date will be accelerated to the date that is
91
days prior to the maturity of the term loans borrowed under the Credit Agreement if the maturity of such term loans precedes the maturity of the Revolving Credit Facility, (ii) decreasing the applicable interest margins, and (iii) amending the financial covenant applicable to the Revolving Credit Facility to be applicable only when greater than
30%
(previously
25%
) of the Revolving Credit Facility (including letters of credit not cash collateralized to at least
103%
) is outstanding at the end of the fiscal quarter. If such conditions are met, the First Lien Net Leverage Ratio (as defined by the Credit Agreement) at the end of the quarter is required to be greater than
5.50
:1.00. At
December 31, 2016
, the financial covenant is not applicable as there were no borrowings.
Under the Third Amendment, interest on any outstanding borrowings under the Revolving Credit Facility is subject to a floor of
0.00%
for Adjusted Eurocurrency Rate Loans (as defined in the Credit Agreement) plus an applicable rate of
2.75%
(previously
3.50%
) subject to an additional step-down to
2.50%
or
2.25%
, if the First Lien Net Leverage Ratio falls below
3.00
:1.00 or
2.50
:1.00, respectively. For Base Rate Loans, the interest is subject to a floor of the greater of the federal funds rate plus
0.50%
, the Prime Lending Rate or an Adjusted Eurocurrency Rate plus
1%
, plus an applicable rate of
1.75%
(previously
2.50%
), subject to an additional step-down to
1.50%
or
1.25%
, if the First Lien Net Leverage Ratio falls below
3.00
:1.00 and
2.50
:1.00, respectively.
Under circumstances described in the Credit Agreement, we may increase available revolving or term facility borrowings by up to
$400.0 million
plus an additional amount subject to the Company not exceeding a maximum first lien leverage ratio described in the Credit Agreement.
There have been
no
borrowings outstanding on the Revolving Credit Facility since the issuance of the Senior Secured Credit Facilities. At
December 31, 2016
and December 31, 2015, letters of credit issued under the Revolving Credit Facility totaled
$21.3 million
and
$24.9 million
, respectively, which reduced the availability under the Revolving Credit Facility. Availability under the Revolving Credit Facility was
$378.7 million
and
$375.1 million
at
December 31, 2016
and December 31, 2015, respectively.
Significant Transactions
In connection with the Third Amendment to the Credit Agreement discussed above, we recorded a loss on extinguishment for the year ended December 31, 2016 of
$2.3 million
.
In connection with the Fourth Amendment, we recorded a
$10.4 million
loss on extinguishment and other financing-related costs for the year ended
December 31, 2016
. The loss was comprised of the write-off of unamortized deferred financing costs and original issue discounts attributable to the 2020 Term Loans of
$4.7 million
and
$1.5 million
, respectively, and other fees directly associated with the Fourth Amendment of
$4.2 million
.
Prior to the December refinancing, in April and October of 2016, we voluntarily prepaid
$100.0 million
and
$150.0 million
in principal of the outstanding 2020 Dollar Term Loans, respectively, and
€200.0 million
in principal of the outstanding 2020 Euro Term Loans. As a result, we recorded losses on extinguishment for the year ended
December 31, 2016
of
$9.6 million
, consisting of the write-off of
$9.1 million
and
$0.5 million
of unamortized deferred financing costs and original issue discounts, respectively.
During each of the years ended December 31, 2015 and 2014, we voluntarily prepaid
$100.0 million
of the outstanding 2020 Dollar Term Loans. For the year ended December 31, 2015, this action resulted in a loss on extinguishment of
$2.5 million
, consisting of the write-off of
$1.8 million
and
$0.7 million
of unamortized deferred financing costs and original issue discounts, respectively. For the year ended December 31, 2014, this action resulted in a loss on extinguishment of
$3.0 million
, consisting of the write-off of
$2.2 million
and
$0.8 million
of unamortized deferred financing costs and original issue discounts, respectively.
103
Significant Terms of the 2021 Senior Notes
On February 1, 2013, Dutch B B.V, as the “Dutch Issuer”, an indirect, wholly owned subsidiary of the Company, and Axalta US Holdings, as the “U.S. Issuer” (collectively the "Issuers") issued
$750.0 million
aggregate principal amount of
7.375%
senior unsecured notes due
2021
(the "2021 Dollar Senior Notes") and related guarantees thereof. Additionally, the Issuers issued €
250.0 million
aggregate principal amount of
5.750%
senior secured notes due
2021
(the "2021 Euro Senior Notes" and, together with the Dollar Senior Notes, the "2021 Senior Notes") and related guarantees thereof. The 2021 Senior Notes were unconditionally guaranteed on a senior basis by Dutch A B.V. and certain of the Issuers’ subsidiaries.
The indentures governing the 2021 Senior Notes contained covenants that restricted the ability of the Issuers and their subsidiaries to, among other things, incur additional debt, make certain payments including payment of dividends or repurchase equity interest of the Issuers, make loans or acquisitions or capital contributions and certain investments, incur certain liens, sell assets, merge or consolidate or liquidate other entities, and enter into transactions with affiliates.
Issuance of New Senior Notes and Redemption of 2021 Senior Notes
On August 16, 2016, Axalta Coating Systems, LLC ("New U.S. Issuer"), issued
$500.0 million
in aggregate principal amount of
4.875%
Senior Unsecured Notes (the “2024 Dollar Senior Notes”) and
€335.0 million
in aggregate principal amount of
4.250%
Senior Unsecured Notes (the “2024 Euro Senior Notes”), each due August 2024 (collectively the “2024 Senior Notes” and with the 2025 Euro Senior Notes, the “New Senior Notes”, each of which is described in detail below), for the primary purpose of redeeming the 2021 Dollar Senior Notes (the “August Refinancing”). Consistent with the terms of the 2021 Dollar Senior Notes, we extinguished the principal at a redemption price equal to
105.531%
.
In connection with the August Refinancing, we recorded a
$56.9 million
loss on extinguishment and other financing-related costs for the year ended
December 31, 2016
. The loss was comprised of the redemption premium of
$41.5 million
, write-off of unamortized deferred financing costs attributable to the 2021 Dollar Senior Notes of
$13.0 million
and other fees directly associated with the transaction of
$2.4 million
.
The 2024 Senior Notes are fully and unconditionally guaranteed by Dutch B B.V., an indirect, wholly owned subsidiary of the Company (“Parent Guarantor”).
In addition, on September 27, 2016, the Dutch Issuer issued
€450.0 million
in aggregate principal amount of
3.750%
Euro Senior Unsecured Notes due January 2025 (the “2025 Euro Senior Notes”) for the primary purpose of redeeming the 2021 Euro Senior Notes and the partial prepayment of the 2020 Euro Term Loans (the “September Refinancing”). Consistent with the original terms of the 2021 Euro Senior Notes, we extinguished the principal at a redemption price equal to
104.313%
.
In connection with the September Refinancing, we recorded an
$18.4 million
loss on extinguishment and other financing-related costs for the year ended
December 31, 2016
. The loss was comprised of the redemption premium of
$12.1 million
, write-off of unamortized deferred financing costs attributable to the 2021 Euro Senior Notes of
$5.6 million
and other fees directly associated with the transaction of
$0.7 million
.
The indentures governing the New Senior Notes contain covenants that restrict the ability of the Issuers and their subsidiaries to, among other things, incur additional debt, make certain payments including payment of dividends or repurchase equity interest of the Issuers, make loans or acquisitions or capital contributions and certain investments, incur certain liens, sell assets, merge or consolidate or liquidate other entities, and enter into transactions with affiliates.
104
i)
2024 Dollar Senior Notes
The 2024 Dollar Senior Notes were issued at
99.951%
of par, or
$2.0 million
discount, and are due August 15, 2024. The 2024 Dollar Senior Notes bear interest at
4.875%
and are payable semi-annually on February 15 and August 15. We have the option to redeem all or part of the 2024 Dollar Senior Notes at the following redemption prices (expressed as percentages of principal amount) on or after August 15 of the years indicated:
|
Period
|
2024 Dollar Notes Percentage
|
|
|
2019
|
103.656
|
%
|
|
2020
|
102.438
|
%
|
|
2021
|
101.219
|
%
|
|
2022 and thereafter
|
100.000
|
%
|
Notwithstanding the foregoing, at any time and from time to time prior to August 15, 2019, we may at our option redeem in the aggregate up to
40%
of the original aggregate principal amount of the 2024 Dollar Senior Notes with the net cash proceeds of one or more Equity Offerings (as defined in the indenture governing the 2024 Dollar Senior Notes) at a redemption price of
104.875%
plus accrued and unpaid interest, if any, to the redemption date. At least
50%
of the original aggregate principal of the notes must remain outstanding after each such redemption.
Upon the occurrence of certain events constituting a change of control, holders of the 2024 Dollar Senior Notes have the right to require us to repurchase all or any part of the 2024 Dollar Senior Notes at a purchase price equal to
101%
of the principal amount plus accrued and unpaid interest, if any, to the repurchase date.
The 2024 Dollar Senior Notes, subject to local law limitations, will initially be jointly and severally guaranteed on a senior unsecured basis by each of the Parent Guarantor’s existing and future direct and indirect subsidiaries that is a borrower under or that guarantees the Senior Secured Credit Facilities. Under certain circumstances, the guarantors may be released from their guarantees without the consent of the holders of the applicable series of notes.
The indebtedness issued through the 2024 Dollar Senior Notes is senior unsecured indebtedness of the New U.S. Issuer, is senior in right of payment to all future subordinated indebtedness of the New U.S. Issuer and guarantors and is equal in right of payment to all existing and future senior indebtedness of the New U.S. Issuer and guarantors. The 2024 Dollar Senior Notes are effectively subordinated to any secured indebtedness of the New U.S. Issuer and guarantors (including indebtedness outstanding under the Senior Secured Credit Facilities) to the extent of the value of the assets securing such indebtedness.
(ii)
2024 Euro Senior Notes
The 2024 Euro Senior Notes were issued at par and are due August 15, 2024. The 2024 Euro Senior Notes bear interest at
4.250%
and are payable semi-annually on February 15 and August 15. We have the option to redeem all or part of the 2024 Euro Senior Notes at the following redemption prices (expressed as percentages of principal amount) on or after August 15 of the years indicated:
|
Period
|
2024 Euro Notes Percentage
|
|
|
2019
|
103.188
|
%
|
|
2020
|
102.125
|
%
|
|
2021
|
101.063
|
%
|
|
2022 and thereafter
|
100.000
|
%
|
Notwithstanding the foregoing, at any time and from time to time prior to August 15, 2019, we may at our option redeem in the aggregate up to
40%
of the original aggregate principal amount of the 2024 Euro Senior Notes with the net cash proceeds of one or more Equity Offerings (as defined in the indenture governing the 2024 Euro Senior Notes) at a redemption price of
104.250%
plus accrued and unpaid interest, if any, to the redemption date. At least
50%
of the original aggregate principal of the notes must remain outstanding after each such redemption.
105
Upon the occurrence of certain events constituting a change of control, holders of the 2024 Euro Senior Notes have the right to require us to repurchase all or any part of the 2024 Euro Senior Notes at a purchase price equal to
101%
of the principal amount plus accrued and unpaid interest, if any, to the repurchase date.
The 2024 Euro Senior Notes, subject to local law limitations, will initially be jointly and severally guaranteed on a senior unsecured basis by each of the Parent Guarantor’s existing and future direct and indirect subsidiaries that is a borrower under or that guarantees the Senior Secured Credit Facilities. Under certain circumstances, the guarantors may be released from their guarantees without the consent of the holders of the applicable series of notes.
The indebtedness issued through the 2024 Euro Senior Notes is senior unsecured indebtedness of the New U.S. Issuer, is senior in right of payment to all future subordinated indebtedness of the New U.S. Issuer and guarantors and is equal in right of payment to all existing and future senior indebtedness of the New U.S. Issuer and guarantors. The 2024 Euro Senior Notes are effectively subordinated to any secured indebtedness of the New U.S. Issuer and guarantors (including indebtedness outstanding under the Senior Secured Credit Facilities) to the extent of the value of the assets securing such indebtedness.
(iii)
2025
Euro Senior Notes
The 2025 Euro Senior Notes were issued at par and are due January 15, 2025. The 2025 Euro Senior Notes bear interest at
3.750%
and are payable semi-annually on January 15 and July 15. We have the option to redeem all or part of the 2025 Euro Senior Notes at the following redemption prices (expressed as percentages of principal amount) on or after January 15 of the years indicated:
|
Period
|
2025 Euro Notes Percentage
|
|
|
2019
|
102.813
|
%
|
|
2020
|
101.875
|
%
|
|
2021
|
100.938
|
%
|
|
2022 and thereafter
|
100.000
|
%
|
Notwithstanding the foregoing, at any time and from time to time prior to January 15, 2020, we may at our option redeem in the aggregate up to
40%
of the original aggregate principal amount of the 2025 Euro Senior Notes with the net cash proceeds of one or more Equity Offerings (as defined in the indenture governing the 2025 Euro Senior Notes) at a redemption price of
103.750%
plus accrued and unpaid interest, if any, to the redemption date. At least
50%
of the original aggregate principal of the notes must remain outstanding after each such redemption.
Upon the occurrence of certain events constituting a change of control, holders of the 2025 Euro Senior Notes have the right to require us to repurchase all or any part of the 2025 Euro Senior Notes at a purchase price equal to
101%
of the principal amount plus accrued and unpaid interest, if any, to the repurchase date.
The 2025 Euro Senior Notes, subject to local law limitations, will initially be jointly and severally guaranteed on a senior unsecured basis by each of the Dutch Issuer’s existing and future direct and indirect subsidiaries that is a borrower under or that guarantees the Senior Secured Credit Facilities. Under certain circumstances, the guarantors may be released from their guarantees without the consent of the holders of the applicable series of notes.
The indebtedness issued through the 2025 Euro Senior Notes is senior unsecured indebtedness of the Dutch Issuer, is senior in right of payment to all future subordinated indebtedness of the Dutch Issuer and guarantors and is equal in right of payment to all existing and future senior indebtedness of the Dutch Issuer and guarantors. The 2025 Euro Senior Notes are effectively subordinated to any secured indebtedness of the Dutch Issuer and guarantors (including indebtedness outstanding under the Senior Secured Credit Facilities) to the extent of the value of the assets securing such indebtedness.
106
Future repayments
Below is a schedule of required future repayments of all borrowings outstanding at
December 31, 2016
.
|
2017
|
$
|
27.9
|
|
|
2018
|
21.3
|
|
|
|
2019
|
20.5
|
|
|
|
2020
|
20.4
|
|
|
|
2021
|
20.3
|
|
|
|
Thereafter
|
3,193.8
|
|
|
|
$
|
3,304.2
|
|
|
The table above excludes
$17.7 million
of debt associated with our build-to-suit lease arrangement and our sale-leaseback financing that will not be settled with cash.
(22) FAIR VALUE ACCOUNTING
Assets measured at fair value on a non-recurring basis
During the years ended December 31,
2015
and
2014
we recorded impairment losses of
$0.1 million
and
$0.1 million
, respectively, associated with the abandonment of certain in process research and development projects. There were
no
impairment losses recorded during the year ended December 31, 2016.
During the years ended
December 31, 2016
and 2015, we recorded impairment losses of
$10.5 million
and
$30.6 million
, respectively, at our Venezuelan subsidiary to write down the carrying value of a real estate investment to its fair value. Additionally, during the year ended December 31, 2016, we recorded an impairment loss of
$57.9 million
on our productive long-lived assets with associated with our Venezuela operations.
No
impairments were recorded during the year ended December 31, 2014.
Fair value of financial instruments
Available for sale securities
- The fair values of available for sale securities at
December 31, 2016
and
2015
were
$4.4 million
and
$4.2 million
, respectively. The fair value was based upon either Level 1 inputs when the securities are actively traded with quoted market prices or Level 2 when the securities are not frequently traded.
Long-term borrowings
- The fair values of the 2024 Dollar Senior Notes, 2024 Euro Senior Notes and 2025 Euro Senior Notes at
December 31, 2016
were
$500.0 million
,
$363.8 million
and
$472.2 million
, respectively. The fair values of the 2021 Dollar Senior Notes and 2021 Euro Senior Notes at
December 31, 2015
were
$787.5 million
and
$285.4 million
, respectively. The estimated fair values of these notes are based on recent trades and current trending. Due to the infrequency of trades of these notes, these inputs are considered to be Level 2 inputs.
The fair values of the 2023 Dollar Term Loans and the 2023 Euro Term Loans at
December 31, 2016
were
$1,560.5 million
and
$421.8 million
, respectively. The fair values of the 2020 Dollar Term Loans and the 2020 Euro Term Loans at
December 31, 2015
were
$2,024.6 million
and
$427.5 million
, respectively. The estimated fair values of the 2023 Dollar Term Loans and the 2023 Euro Term Loans are based on recent trades, as reported by a third party pricing service. Due to the infrequency of trades of the 2023 Dollar Term Loans and the 2023 Euro Term Loans, these inputs are considered to be Level 2 inputs.
Fair value of contingent consideration
During the year ended
December 31, 2016
, we recorded the fair value of contingent consideration associated with certain of our acquisitions based on the terms of the applicable targets described within the acquisition agreements. The fair value of these liabilities are valued at each balance sheet date with adjustments recorded within selling, general and administrative expenses on the consolidated statement of operations. The fair value of contingent consideration at
December 31, 2016
was
$10.0 million
, which included adjustments recorded to earnings based on changes to the fair value of
$0.8 million
for the year ended December 31, 2016.
107
(23) DERIVATIVE FINANCIAL INSTRUMENTS
We selectively use derivative instruments to reduce market risk associated with changes in foreign currency exchange rates and interest rates. The use of derivatives is intended for hedging purposes only and we do not enter into derivative instruments for speculative purposes. A description of each type of derivative used to manage risk is included in the following paragraphs.
During the year ended December 31, 2013, we entered into
five
interest rate swaps with notional amounts totaling
$1,173.0 million
to hedge interest rate exposures related to variable rate borrowings under the Senior Secured Credit Facilities. The interest rate swaps are in place until
September 29, 2017
. The interest rate swaps qualify and are designated as effective cash flow hedges.
The following table presents the location and fair values using Level 2 inputs of derivative instruments that qualify and have been designated as cash flow hedges included in the accompanying consolidated balance sheet:
|
|
Year Ended December 31,
|
|||||
|
2016
|
2015
|
|||||
|
Prepaid and other assets:
|
||||||
|
Interest rate swaps
|
$
|
0.1
|
|
$
|
0.4
|
|
|
Total assets
|
$
|
0.1
|
|
$
|
0.4
|
|
|
Other accrued liabilities:
|
||||||
|
Interest rate swaps
|
$
|
0.8
|
|
$
|
—
|
|
|
Other liabilities:
|
||||||
|
Interest rate swaps
|
$
|
—
|
|
$
|
1.8
|
|
|
Total liabilities
|
$
|
0.8
|
|
$
|
1.8
|
|
We periodically enter into foreign currency forward and option contracts to reduce market risk and hedge our balance sheet exposures and cash flows for subsidiaries with exposures denominated in currencies different from the functional currency of the relevant subsidiary. These contracts have not been designated as hedges and all gains and losses are marked to market through other expense, net in the consolidated statement of operations.
The following table presents the location and fair values using Level 2 inputs of derivative instruments that have not been designated as hedges included in our consolidated balance sheet:
|
|
Year Ended December 31,
|
|||||
|
2016
|
2015
|
|||||
|
Prepaid and other assets:
|
||||||
|
Foreign currency contracts
|
$
|
0.1
|
|
$
|
0.3
|
|
|
Total assets
|
$
|
0.1
|
|
$
|
0.3
|
|
|
Other accrued liabilities:
|
||||||
|
Foreign currency contracts
|
$
|
0.5
|
|
$
|
—
|
|
|
Total liabilities:
|
0.5
|
|
—
|
|
||
For derivative instruments that qualify and are designated as cash flow hedges, the effective portion of the gain or loss on the derivative is reported as a component of accumulated other comprehensive loss and reclassified into earnings in the same period or periods during which the hedged transaction affects earnings. Gains and losses on the derivative representing either hedge ineffectiveness or hedge components excluded from the assessment of effectiveness are recognized in current earnings.
108
The following table sets forth the locations and amounts recognized during the years ended
December 31, 2016
,
2015
, and
2014
respectively, for these cash flow hedges.
|
Derivatives in Cash Flow Hedging
Relationships in 2016:
|
Amount of
(Gain) Loss
Recognized
in OCI on
Derivatives
(Effective
Portion)
|
Location of (Gain) Loss Reclassified from
Accumulated OCI into Income (Effective Portion)
|
Amount of
(Gain) Loss
Reclassified
from
Accumulated
OCI to
Income
(Effective
Portion)
|
Location of
(Gains) Losses
Recognized in Income on
Derivatives (Ineffective Portion)
|
Amount of
(Gain) Loss
Recognized
in Income on
Derivatives
(Ineffective
Portion)
|
||||||
|
Interest rate contracts
|
$
|
2.0
|
|
Interest expense, net
|
$
|
5.9
|
|
Interest expense, net
|
$
|
1.2
|
|
|
Derivatives in Cash Flow Hedging Relationships in 2015:
|
Amount of
(Gain) Loss
Recognized
in OCI on
Derivatives
(Effective
Portion)
|
Location of (Gain) Loss Reclassified from
Accumulated OCI into Income (Effective Portion)
|
Amount of
(Gain) Loss
Reclassified
from
Accumulated
OCI to
Income
(Effective
Portion)
|
Location of
(Gain) Loss
Recognized in Income on
Derivatives (Ineffective Portion)
|
Amount of
(Gain) Loss
Recognized
in Income on
Derivatives
(Ineffective
Portion)
|
||||||
|
Interest rate contracts
|
$
|
5.5
|
|
Interest expense, net
|
$
|
6.5
|
|
Interest expense, net
|
$
|
0.4
|
|
|
Derivatives in Cash Flow Hedging Relationships in 2014:
|
Amount of
(Gain) Loss
Recognized
in OCI on
Derivatives
(Effective
Portion)
|
Location of (Gain) Loss Reclassified from
Accumulated OCI into Income (Effective Portion)
|
Amount of
(Gain) Loss
Reclassified
from
Accumulated
OCI to
Income
(Effective
Portion)
|
Location of
(Gain) Loss
Recognized in Income on
Derivatives (Ineffective Portion)
|
Amount of
(Gain) Loss
Recognized
in Income on
Derivatives
(Ineffective
Portion)
|
||||||
|
Interest rate contracts
|
$
|
4.6
|
|
Interest expense, net
|
$
|
6.5
|
|
Interest expense, net
|
$
|
0.3
|
|
Also during the year ended December 31, 2013, we purchased a €
300.0 million
1.5%
interest rate cap on our Euro Term Loans that is in place until
September 29, 2017
. We paid a premium of
$3.1 million
for the interest rate cap. The interest rate cap was not designated as a hedge and the changes in the fair value of the derivative instrument are recorded in current period earnings and are included in interest expense.
Fair value gains and losses of derivative contracts, as determined using Level 2 inputs, that do not qualify for hedge accounting treatment are recorded in income as follows:
|
Derivatives Not Designated as
Hedging Instruments under
ASC 815
|
Location of (Gain) Loss
Recognized in Income on
Derivatives
|
Year Ended December 31, 2016
|
Year Ended December 31, 2015
|
Year Ended December 31, 2014
|
||||||
|
Foreign currency forward contracts
|
Other expense, net
|
$
|
4.3
|
|
$
|
(5.6
|
)
|
$
|
1.4
|
|
|
Interest rate cap
|
Interest expense, net
|
—
|
|
0.1
|
|
3.4
|
|
|||
|
$
|
4.3
|
|
$
|
(5.5
|
)
|
$
|
4.8
|
|
||
(24) SEGMENTS
The Company identifies an operating segment as a component: (i) that engages in business activities from which it may earn revenues and incur expenses; (ii) whose operating results are regularly reviewed by the Chief Operating Decision Maker ("CODM") to make decisions about resources to be allocated to the segment and assess its performance; and (iii) that has available discrete financial information.
109
We have
two
operating segments, which are also our reportable segments: Performance Coatings and Transportation Coatings. The CODM reviews financial information at the operating segment level to allocate resources and to assess the operating results and financial performance for each operating segment. Our CODM is identified as the Chief Executive Officer because he has final authority over performance assessment and resource allocation decisions. Our segments are based on the type and concentration of customers served, service requirements, methods of distribution and major product lines.
Through our Performance Coatings segment, we provide high-quality liquid and powder coatings solutions to a fragmented and local customer base. We are one of only a few suppliers with the technology to provide precise color matching and highly durable coatings systems. The end-markets within this segment are refinish and industrial.
Through our Transportation Coatings segment, we provide advanced coating technologies to OEMs of light and commercial vehicles. These increasingly global customers require a high level of technical support coupled with cost-effective, environmentally responsible coatings systems that can be applied with a high degree of precision, consistency and speed. The end-markets within this segment are light vehicle and commercial vehicle.
Our business serves four end-markets globally as follows:
|
|
Year Ended December 31,
|
||||||||
|
|
2016
|
2015
|
2014
|
||||||
|
Performance Coatings
|
|||||||||
|
Refinish
|
$
|
1,684.4
|
|
$
|
1,702.0
|
|
$
|
1,850.8
|
|
|
Industrial
|
718.8
|
|
683.1
|
|
734.2
|
|
|||
|
Total Net sales Performance Coatings
|
2,403.2
|
|
2,385.1
|
|
2,585.0
|
|
|||
|
Transportation Coatings
|
|||||||||
|
Light Vehicle
|
1,337.7
|
|
1,310.6
|
|
1,384.5
|
|
|||
|
Commercial Vehicle
|
332.6
|
|
391.5
|
|
392.2
|
|
|||
|
Total Net sales Transportation Coatings
|
1,670.3
|
|
1,702.1
|
|
1,776.7
|
|
|||
|
Total Net sales
|
$
|
4,073.5
|
|
$
|
4,087.2
|
|
$
|
4,361.7
|
|
110
Asset information is not reviewed or included with our internal management reporting. Therefore, the Company has not disclosed asset information for each reportable segment.
|
|
Performance
Coatings
|
Transportation
Coatings
|
Total
|
||||||
|
For the Year ended December 31, 2016
|
|||||||||
|
Net sales
(1)
|
$
|
2,403.2
|
|
$
|
1,670.3
|
|
$
|
4,073.5
|
|
|
Equity in earnings in unconsolidated affiliates
|
(0.2
|
)
|
0.4
|
|
0.2
|
|
|||
|
Adjusted EBITDA
(2)
|
554.4
|
|
352.7
|
|
907.1
|
|
|||
|
Investment in unconsolidated affiliates
|
2.5
|
|
11.1
|
|
13.6
|
|
|||
|
|
Performance
Coatings
|
Transportation
Coatings
|
Total
|
||||||
|
For the Year ended December 31, 2015
|
|||||||||
|
Net sales
(1)
|
$
|
2,385.1
|
|
$
|
1,702.1
|
|
$
|
4,087.2
|
|
|
Equity in earnings in unconsolidated affiliates
|
0.6
|
|
0.6
|
|
1.2
|
|
|||
|
Adjusted EBITDA
(2)
|
539.1
|
|
328.1
|
|
867.2
|
|
|||
|
Investment in unconsolidated affiliates
|
4.0
|
|
8.4
|
|
12.4
|
|
|||
|
|
Performance
Coatings
|
Transportation
Coatings
|
Total
|
||||||
|
For the Year ended December 31, 2014
|
|||||||||
|
Net sales
(1)
|
$
|
2,585.0
|
|
$
|
1,776.7
|
|
$
|
4,361.7
|
|
|
Equity in losses in unconsolidated affiliates
|
(1.2
|
)
|
(0.2
|
)
|
(1.4
|
)
|
|||
|
Adjusted EBITDA
(2)
|
547.6
|
|
292.9
|
|
840.5
|
|
|||
|
Investment in unconsolidated affiliates
|
7.2
|
|
7.1
|
|
14.3
|
|
|||
|
(1)
|
The Company has
no
intercompany sales between segments.
|
|
(2)
|
The primary measure of segment operating performance is Adjusted EBITDA, which is defined as net income before interest, taxes, depreciation and amortization and select other items impacting operating results. These other items impacting operating results are items that management has concluded are (1) non-cash items included within net income, (2) items the Company does not believe are indicative of ongoing operating performance or (3) non-recurring, unusual or infrequent items that the Company believes are not reasonably likely to recur within the next two years. Adjusted EBITDA is a key metric that is used by management to evaluate business performance in comparison to budgets, forecasts and prior year financial results, providing a measure that management believes reflects the Company’s core operating performance, which represents EBITDA adjusted for the select items referred to above. Reconciliation of Adjusted EBITDA to income before income taxes follows:
|
111
|
|
Year Ended December 31,
|
||||||||
|
|
2016
|
2015
|
2014
|
||||||
|
Income before income taxes
|
$
|
87.4
|
|
$
|
161.2
|
|
$
|
36.8
|
|
|
Interest expense, net
|
178.2
|
|
196.5
|
|
217.7
|
|
|||
|
Depreciation and amortization
|
322.1
|
|
307.7
|
|
308.7
|
|
|||
|
EBITDA
|
587.7
|
|
665.4
|
|
563.2
|
|
|||
|
Debt extinguishment and refinancing related costs (a)
|
97.6
|
|
2.5
|
|
6.1
|
|
|||
|
Foreign exchange remeasurement losses (b)
|
30.6
|
|
93.7
|
|
81.2
|
|
|||
|
Long-term employee benefit plan adjustments (c)
|
1.5
|
|
(0.3
|
)
|
(0.6
|
)
|
|||
|
Termination benefits and other employee related costs (d)
|
61.8
|
|
36.6
|
|
18.4
|
|
|||
|
Consulting and advisory fees (e)
|
10.4
|
|
23.9
|
|
36.3
|
|
|||
|
Transition-related costs (f)
|
—
|
|
(3.4
|
)
|
101.8
|
|
|||
|
Offering and transactional costs (g)
|
6.0
|
|
(1.5
|
)
|
22.3
|
|
|||
|
Stock-based compensation (h)
|
41.1
|
|
30.2
|
|
8.0
|
|
|||
|
Other adjustments (i)
|
5.0
|
|
(5.8
|
)
|
6.0
|
|
|||
|
Dividends in respect of noncontrolling interest (j)
|
(3.0
|
)
|
(4.7
|
)
|
(2.2
|
)
|
|||
|
Asset impairments (k)
|
68.4
|
|
30.6
|
|
—
|
|
|||
|
Adjusted EBITDA
|
$
|
907.1
|
|
$
|
867.2
|
|
$
|
840.5
|
|
|
(a)
|
During the years ended December 31, 2016, 2015 and 2014 we prepaid principal on our term loans, resulting in non-cash losses on extinguishment of
$9.6 million
,
$2.5 million
and
$3.0 million
, respectively. During the years ended December 31, 2016 and 2014 we amended our Credit Agreement and refinanced our indebtedness, resulting in additional losses of
$88.0 million
and
$3.1 million
, respectively. We do not consider these items to be indicative of our ongoing operating performance.
|
|
(b)
|
Eliminates foreign exchange losses resulting from the remeasurement of assets and liabilities denominated in foreign currencies, net of the impacts of our foreign currency instruments used to hedge our balance sheet exposures. Exchange effects attributable to the remeasurement of our Venezuelan subsidiary represented losses of
$23.5 million
,
$51.5 million
, and gains of
$11.9 million
for the years ended December 31, 2016, 2015 and 2014, respectively.
|
|
(c)
|
Eliminates the non-cash non-service components of long-term employee benefit costs (discussed further at Note 9).
|
|
(d)
|
Represents expenses primarily related to employee termination benefits including our initiative to improve the overall cost structure within the European region as well as costs associated with our Axalta Way initiatives, which are not considered indicative of our ongoing operating performance. In 2014, termination benefits include the costs associated with our headcount initiatives for establishment of new roles and elimination of old roles and other employee costs associated with cost-saving opportunities that were related to our transition to a standalone entity.
|
|
(e)
|
Represents fees paid to consultants for professional services primarily related to our Axalta Way initiatives, which are not considered indicative of our ongoing operating performance. Amounts incurred during 2014 relate to services rendered in conjunction with our transition to a standalone entity.
|
|
(f)
|
Represents charges and a change in estimate associated with the transition costs from DuPont to a standalone entity, including certain Acquisition indemnities. We do not consider these items to be indicative of our ongoing operating performance.
|
|
(g)
|
Represents costs associated with the offerings of our common shares by Carlyle, including the November 2014 IPO, and acquisition-related expenses, including changes in the fair value of contingent consideration, all of which are not considered indicative of our ongoing operating performance.
|
|
(h)
|
Represents non-cash costs associated with stock-based compensation, including
$8.2 million
of expense during the year ended December 31, 2015 attributable to the accelerated vesting of all issued and outstanding stock options issued under the 2013 Plan as a result of the Change in Control.
|
|
(i)
|
Represents costs for certain non-operational or non-cash (gains) and losses, unrelated to our core business and which we do not consider indicative of ongoing operations, including equity investee dividends, indemnity losses (gains) associated with the Acquisition, losses (gains) on sale and disposal of property, plant and equipment, losses (gains) on the remaining foreign currency derivative instruments, Carlyle management fees incurred prior to the Change in Control and non-cash fair value inventory adjustments associated with our business combinations.
|
112
|
(j)
|
Represents the payment of dividends to our joint venture partners by our consolidated entities that are not wholly owned, which are reflected to show the cash operating performance of these entities on Axalta's financial statements.
|
|
(k)
|
As a result of currency devaluations in Venezuela, we recorded non-cash impairment charges relating to a real estate investment of
$10.5 million
and
$30.6 million
during the years ended December 31, 2016 and 2015, respectively. Additionally, during the year ended December 31, 2016, we recorded a
$57.9 million
non-cash impairment on long-lived assets associated with our Venezuela operations (discussed further at Note 26). We do not consider these impairments to be indicative of our ongoing operating performance.
|
Geographic Area Information:
The information within the following tables provides disaggregated information related to our net sales and long-lived assets.
Net sales by region were as follows:
|
|
Year Ended December 31,
|
||||||||
|
2016
|
2015
|
2014
|
|||||||
|
North America
|
$
|
1,431.4
|
|
$
|
1,371.9
|
|
$
|
1,307.8
|
|
|
EMEA
|
1,455.3
|
|
1,425.3
|
|
1,672.0
|
|
|||
|
Asia Pacific
|
723.9
|
|
717.4
|
|
715.0
|
|
|||
|
Latin America
|
462.9
|
|
572.6
|
|
666.9
|
|
|||
|
Total
(a)
|
$
|
4,073.5
|
|
$
|
4,087.2
|
|
$
|
4,361.7
|
|
Net long-lived assets by region were as follows:
|
Year Ended December 31,
|
||||||
|
|
2016
|
2015
|
||||
|
North America
|
$
|
419.3
|
|
$
|
449.1
|
|
|
EMEA
|
456.9
|
|
493.2
|
|
||
|
Asia Pacific
|
248.0
|
|
234.5
|
|
||
|
Latin America
|
191.5
|
|
206.1
|
|
||
|
Total
(b)
|
$
|
1,315.7
|
|
$
|
1,382.9
|
|
|
(a)
|
Net Sales are attributed to countries based on location of the customer. Sales to external customers in China represented approximately
13%
,
13%
and
11%
of the total for the years ended
December 31, 2016
,
2015
and
2014
, respectively. Sales to external customers in Germany represented approximately
9%
,
9%
and
10%
of the total for the years ended
December 31, 2016
,
2015
and
2014
, respectively. Mexico represented
6%
of the total for the years ended
December 31, 2016
,
2015
and
2014
. Canada, which is included in the North America region, represents approximately
4%
of total net sales for the year ended December 31, 2016 and
3%
for the years ended December 31, 2015 and 2014.
|
|
(b)
|
Long-lived assets consist of property, plant and equipment, net. Germany long-lived assets amounted to approximately
$262.2 million
and
$280.4 million
in the years ended
December 31, 2016
and
2015
, respectively. China long-lived assets amounted to
$204.0 million
and
$194.7 million
in the years ended
December 31, 2016
and
2015
, respectively. Brazil long-lived assets amounted to approximately
$94.9 million
and
$88.5 million
in the years ended
December 31, 2016
and
2015
, respectively. Canada long-lived assets, which are included in the North America region, amounted to approximately
$20.0 million
and
$20.7 million
in the years ended
December 31, 2016
and
2015
, respectively.
|
113
(25) ACCUMULATED OTHER COMPREHENSIVE LOSS
|
Unrealized
Currency
Translation
Adjustments
|
Pension Plan
Adjustments
|
Unrealized
Gain (Loss) on
Securities
|
Unrealized
Gain (Loss) on
Derivatives
|
Accumulated
Other
Comprehensive
Income
|
|||||||||||
|
Balance, December 31, 2015
|
$
|
(232.8
|
)
|
$
|
(33.4
|
)
|
$
|
0.1
|
|
$
|
(3.2
|
)
|
$
|
(269.3
|
)
|
|
Current year deferrals to AOCI
|
(59.4
|
)
|
(22.3
|
)
|
0.3
|
|
(2.5
|
)
|
(83.9
|
)
|
|||||
|
Reclassifications from AOCI to Net income
|
—
|
|
(0.9
|
)
|
—
|
|
3.7
|
|
2.8
|
|
|||||
|
Net Change
|
(59.4
|
)
|
(23.2
|
)
|
0.3
|
|
1.2
|
|
(81.1
|
)
|
|||||
|
Balance, December 31, 2016
|
$
|
(292.2
|
)
|
$
|
(56.6
|
)
|
$
|
0.4
|
|
$
|
(2.0
|
)
|
$
|
(350.4
|
)
|
The cumulative income tax benefit related to the adjustments for pension benefits at
December 31, 2016
was
$19.1 million
. The cumulative income tax benefit related to the adjustments for unrealized gain on derivatives at
December 31, 2016
was
$1.1 million
.
|
Unrealized
Currency
Translation
Adjustments
|
Pension and
Other
Long-term
Employee
Benefit
Adjustments
|
Unrealized
Gain (Loss) on
Securities
|
Unrealized
Gain (Loss) on Derivatives |
Accumulated
Other
Comprehensive
Income
|
|||||||||||
|
Balance, December 31, 2014
|
$
|
(72.1
|
)
|
$
|
(31.2
|
)
|
$
|
(0.2
|
)
|
$
|
0.2
|
|
$
|
(103.3
|
)
|
|
Current year deferrals to AOCI
|
(160.7
|
)
|
(4.3
|
)
|
0.3
|
|
0.6
|
|
(164.1
|
)
|
|||||
|
Reclassifications from AOCI to Net income
|
—
|
|
2.1
|
|
—
|
|
(4.0
|
)
|
(1.9
|
)
|
|||||
|
Net Change
|
(160.7
|
)
|
(2.2
|
)
|
0.3
|
|
(3.4
|
)
|
(166.0
|
)
|
|||||
|
Balance, December 31, 2015
|
$
|
(232.8
|
)
|
$
|
(33.4
|
)
|
$
|
0.1
|
|
$
|
(3.2
|
)
|
$
|
(269.3
|
)
|
The cumulative income tax benefit related to the adjustments for pension and other long-term employee benefits at
December 31, 2015
was
$13.4 million
. The cumulative income tax benefit related to the adjustments for unrealized gain on derivatives at
December 31, 2015
was
$1.9 million
.
|
Unrealized
Currency
Translation
Adjustments
|
Pension and
Other
Long-term
Employee
Benefit
Adjustments
|
Unrealized
Gain (Loss) on Securities |
Unrealized
Gain (Loss) on
Derivatives
|
Accumulated
Other
Comprehensive
Income
|
|||||||||||
|
Balance, December 31, 2013
|
$
|
24.3
|
|
$
|
7.5
|
|
$
|
(0.9
|
)
|
$
|
3.1
|
|
$
|
34.0
|
|
|
Current year deferrals to AOCI
|
(96.4
|
)
|
(29.7
|
)
|
0.7
|
|
3.6
|
|
(121.8
|
)
|
|||||
|
Reclassifications from AOCI to Net income
|
—
|
|
(9.0
|
)
|
—
|
|
(6.5
|
)
|
(15.5
|
)
|
|||||
|
Net Change
|
(96.4
|
)
|
(38.7
|
)
|
0.7
|
|
(2.9
|
)
|
(137.3
|
)
|
|||||
|
Balance, December 31, 2014
|
$
|
(72.1
|
)
|
$
|
(31.2
|
)
|
$
|
(0.2
|
)
|
$
|
0.2
|
|
$
|
(103.3
|
)
|
Included within reclassifications from AOCI to Net income for the year ended December 31, 2014 was
$7.3 million
of curtailment gains related to an amendment to one of our pension plans. The cumulative income tax benefit related to the adjustments for pension and other long-term employee benefits at December 31, 2014 was
$13.4 million
. The cumulative income tax expense related to the adjustments for unrealized gain on derivatives at December 31, 2014 were
$0.2 million
.
114
(26) VENEZUELA
Currency Devaluation
As a result of challenging economic conditions and changes to Venezuela’s foreign currency exchange mechanisms our Venezuela operations have continued to be impacted.
Based on our participation in Venezuela’s Complementary System of Foreign Currency Administration (SICAD I) auction process during the year ended December 31, 2014, we changed the exchange rate we used to remeasure our Venezuelan subsidiary’s bolivar denominated monetary assets and liabilities into U.S. dollars to an exchange rate of
12.0
Venezuelan bolivars to
1.0
U.S. dollar at December 31, 2014 from the Official Rate of
6.3
Venezuelan bolivars to
1.0
U.S. dollar.
From December 31, 2014 through June 30, 2015, we used the SICAD rate of 12.0 Venezuelan bolivars to 1.0 U.S. dollar. At June 30, 2015, we changed the exchange rate we used to remeasure our Venezuelan bolivars from the SICAD rate to the Marginal Foreign Exchange System (SIMADI) rate of 197.7 Venezuelan bolivars to 1.0 U.S. dollar. We believed it was appropriate to move from using the SICAD rate to using the SIMADI rate based on the culmination of relevant facts and circumstances, including our expectation that future dividend remittances would be made at the SIMADI rate.
In March 2016, the Venezuelan government enacted additional changes to its foreign currency exchange regime. The changes resulted in a reduction of its three-tiered exchange rate system to two tiers by eliminating the SICAD rate. The changes also devalued the official rate, DIPRO (formerly CENCOEX), to 10.0 Venezuelan bolivars to 1.0 U.S. dollar from 6.3 Venezuelan bolivars to 1.0 U.S. dollar, while also creating a replacement floating supplementary market exchange rate, DICOM, which fully replaced SIMADI. DICOM is intended to provide limited access to a free market rate of exchange and the rate utilized to remeasure the monetary assets and liabilities of our operations as our subsidiary is a U.S. dollar functional entity. At
December 31, 2016
, DICOM was
673.8
Venezuelan bolivars to 1.0 U.S. dollar.
We believe that significant uncertainty still exists regarding the exchange mechanisms in Venezuela, including how any such mechanisms will operate in the future and the availability of U.S. dollars under each mechanism.
The devaluations of the exchange rates for the year ended December 31, 2014 resulted in net gains of
$17.0 million
primarily due to our determination at December 31, 2014 to change from the CENCOEX rate to SICAD I and our Venezuelan operations being in a net monetary liability position.
Primarily as a result of the devalued Venezuelan bolivar, we recorded currency exchange losses of
$23.5 million
and
$51.5 million
for the years ended
December 31, 2016
and 2015, respectively. Included in the loss for the year ended December 31, 2015 was a loss of
$53.2 million
resulting from the devaluation caused by the change in exchange mechanism used at June 30, 2015.
Venezuela Financial Results and Impairment Considerations
As a result of the continued economic uncertainty, negative volume trends including fourth quarter 2016 performance, further deterioration in the economy as evidenced by the dramatic devaluation in the unofficial parallel exchange markets and the completion of our 2017 budget process which highlighted a material decline in our profitability, we concluded there was a formal triggering event to assess the carrying value of our long-lived assets during the fourth quarter of 2016. Based on the internal projections developed by management, the Company determined that the undiscounted future cash flows expected to result from the use of our productive long-lived assets were not sufficient to recover the carrying value. A third-party valuation of our Venezuelan operations was performed as of December 1, 2016 to assist management in determining the fair value utilizing standard valuation approaches, which incorporated Level 3 inputs. Based on the results of the valuations, the Company recorded an impairment charge of
$57.9 million
in the fourth quarter of 2016, comprised of a
$49.3 million
write-down to customer relationship intangibles and an
$8.6 million
write-down to the net book value of our property, plant and equipment. The impairment charge was recorded within income from operations on the consolidated statement of operations, with
$30.6 million
and
$27.3 million
allocated to our Performance Coatings and Transportation Coatings operating segments, respectively.
115
With the exception of intercompany inventory purchases, our operations in Venezuela were and are expected to continue to be self-funded. Our Venezuelan operations continue to have the ability to procure raw materials through Axalta subsidiaries, and generate positive cash flow sufficient to fund its operations even with our lower projected results for Venezuela. As a result, we currently do not foresee any material impact on our Venezuelan subsidiary's ability to continue to operate. We have no current need or intention to repatriate Venezuelan earnings and remain committed to the business for the foreseeable future based on our current expectations.
If assumptions regarding our continued demand and ability to successfully implement and sustain price increases differ from actual results, or our ability to control the operations of our Venezuelan subsidiary change as a result of economic uncertainty or political instability, there is a risk that our productive long-lived assets may be further impaired. Additionally, if DICOM continues to weaken, this could result in a material unfavorable impact on our results of operations and financial condition.
At June 30, 2016, we performed a separate evaluation of the carrying value of our non-operating real estate investment. Based on this evaluation, we concluded that the carrying value of the real estate investment of
$21.5 million
was impaired as a result of the current real estate market prices and movement of our translation rate from
270.5
Venezuelan bolivars to 1.0 U.S. dollar at March 31, 2016 to 626.0 Venezuelan bolivars to 1.0 U.S. dollar at June 30, 2016. At December 31, 2016, we re-assessed the carrying value of our non-operating real estate investment. Based on the third-party valuation performed, we concluded that the carrying value of the real estate investment of
$10.9 million
was not impaired.
Impairments of
$10.5 million
and
$30.6 million
were recorded within other expense, net for the years ended December 31, 2016 and 2015, respectively. The method used to determine fair values of the real estate investment included using Level 2 inputs in the form of observable market quotes from local real estate broker service firms.
At December 31, 2016 and 2015, our Venezuelan subsidiary had total assets of
$82.7 million
and
$152.9 million
, respectively, and total liabilities of
$42.3 million
and
$42.2 million
, respectively. Total liabilities include
$32.8 million
and
$25.9 million
of intercompany trade liabilities designated in U.S. dollars as of December 31, 2016 and 2015, respectively. At December 31, 2016 and 2015, total non-monetary assets, net, were
$34.8 million
and
$112.4 million
, respectively.
For the years ended December 31, 2016, 2015 and 2014, our Venezuelan subsidiary's net sales represented
$50.8 million
,
$131.2 million
and
$136.5 million
of our consolidated net sales, respectively. For the years ended December 31, 2016, 2015 and 2014, our Venezuelan subsidiary represented a loss of
$36.5 million
, income of
$63.0 million
and
$60.0 million
of our consolidated income from operations, respectively. For the years ended December 31, 2016, 2015 and 2014, our Venezuelan subsidiary represented net losses of
$68.5 million
and
$32.0 million
and net income of
$52.6 million
of our consolidated net income, respectively.
116
(27) QUARTERLY FINANCIAL INFORMATION (UNAUDITED)
The following is a summary of the quarterly results of operations for the years ended December 31, 2016 and 2015, respectively (in millions, except per share data):
|
2016
(1)
|
March 31
|
June 30
(2)
|
September 30
|
December 31
(3)
|
Full Year
|
||||||||||
|
Total revenue
|
$
|
961.6
|
|
$
|
1,072.1
|
|
$
|
1,029.1
|
|
$
|
1,034.6
|
|
$
|
4,097.4
|
|
|
Cost of goods sold
|
606.4
|
|
649.0
|
|
630.4
|
|
641.8
|
|
2,527.6
|
|
|||||
|
Net income (loss)
|
31.8
|
|
53.3
|
|
(3.1
|
)
|
(34.4
|
)
|
47.6
|
|
|||||
|
Net income (loss) attributable to controlling interests
|
30.9
|
|
51.7
|
|
(4.3
|
)
|
(36.5
|
)
|
41.8
|
|
|||||
|
Basic net income (loss) per share
|
0.13
|
|
0.22
|
|
(0.02
|
)
|
(0.15
|
)
|
0.18
|
|
|||||
|
Diluted net income (loss) per share
|
0.13
|
|
0.21
|
|
(0.02
|
)
|
(0.15
|
)
|
0.17
|
|
|||||
|
2015
|
March 31
|
June 30
(a)
|
September 30
|
December 31
|
Full Year
|
||||||||||
|
Total revenue
|
$
|
997.5
|
|
$
|
1,101.1
|
|
$
|
1,005.1
|
|
$
|
1,009.6
|
|
$
|
4,113.3
|
|
|
Cost of goods sold
|
649.8
|
|
679.7
|
|
628.6
|
|
639.2
|
|
2,597.3
|
|
|||||
|
Net income (loss)
|
46.7
|
|
(24.3
|
)
|
36.4
|
|
39.1
|
|
97.9
|
|
|||||
|
Net income (loss) attributable to controlling interests
|
45.1
|
|
(25.1
|
)
|
35.1
|
|
38.6
|
|
93.7
|
|
|||||
|
Basic net income (loss) per share
|
0.20
|
|
(0.11
|
)
|
0.15
|
|
0.16
|
|
0.40
|
|
|||||
|
Diluted net income (loss) per share
|
0.19
|
|
(0.11
|
)
|
0.15
|
|
0.16
|
|
0.39
|
|
|||||
(1) The table above includes the impacts of our adoption of ASU 2016-09 which, as previously discussed in Note 4, provides for a benefit to net income and an increase in diluted shares used in the calculation of diluted net income per share. Previously disclosed net income (loss) was
$29.7 million
,
$48.5 million
and
$(10.7) million
for the three months ended March 31, 2016, June 30, 2016 and September 30, 2016, respectively. Previously disclosed diluted net income (loss) per share was
$0.12
,
$0.20
and
($0.04)
for the three months ended March 31, 2016, June 30, 2016 and September 30, 2016, respectively.
(2) During the three months ended June 30, 2016 and 2015, the Company recorded an impairment charge of
$10.5 million
and
$30.6 million
, respectively, based on our evaluation of the carrying value associated with our real estate investment in Venezuela. See further discussion in Note 26.
(3) During the three months ended December 31, 2016, the Company recorded an impairment charge of
$57.9 million
, based on our evaluation of the carrying value associated with our long-lived operating assets in Venezuela. See further discussion in Note 26. Also during the three months ended December 31, 2016, we recorded restructuring costs associated with our Axalta Way initiatives for
$36.6 million
.
None.
Evaluation of disclosure controls and procedures
As required by Rules 13a-15(b) or 15d-15(b) under the Securities Exchange Act of 1934 (the "Exchange Act"), the Company carried out an evaluation, under the supervision and with the participation of management, including its Chief Executive Officer and Chief Financial Officer, of the effectiveness of the design and operation of the Company's disclosure controls and procedures (as defined in Rules 13a-15(e) or 15d-15(e) under Exchange Act) as of the end of the period covered by this Annual Report on Form 10-K. There are inherent limitations to the effectiveness of any system of disclosure controls and procedures. No matter how well designed and operated, disclosure controls and procedures can provide only reasonable, rather than absolute, assurance of achieving the desired control objectives. Based on the foregoing, the Company's Chief Executive Officer and Chief Financial Officer concluded that the Company's disclosure controls and procedures were effective at a reasonable assurance level as of
December 31, 2016
.
117
Management report on internal control over financial reporting
Management is responsible for establishing and maintaining adequate internal control over financial reporting (as defined in Rules 13a-15(f) and 15d-15(f) under the Exchange Act).
Management assessed the effectiveness of the Company’s internal control over financial reporting based on the criteria set forth by the Committee of Sponsoring Organizations of the Treadway Commission (“COSO”) in
Internal Control—Integrated Framework
(2013). Based on this assessment, management concluded that, as of
December 31, 2016
, the Company's internal control over financial reporting was effective.
The effectiveness of our internal control over financial reporting has been audited by PricewaterhouseCoopers LLP, an independent registered public accounting firm, as stated in its report which is included herein.
Changes in internal control over financial reporting
There were no changes in the Company’s internal control over financial reporting that occurred during the quarter ended
December 31, 2016
that have materially affected, or are reasonably likely to materially affect, the Company’s internal control over financial reporting.
None.
118
The information about the Company’s directors required by Item 10 and not otherwise set forth below is contained under the caption "Proposal No. 1: Election of Directors" in Axalta’s definitive Proxy Statement for the 2017 Annual General Meeting of Members (the "Proxy Statement") which the Company anticipates filing with the Securities and Exchange Commission, pursuant to Regulation 14A, not later than 120 days after the end of the Company’s fiscal year, and is incorporated herein by reference.
The executive officers of the Company are appointed by the Board of Directors. The information required by this item concerning the Company’s executive officers is incorporated by reference herein from Part I of the Proxy Statement under the caption "Executive Officers."
Information regarding the Company’s Audit Committee, code of ethics, and compliance with Section 16(a) of the Exchange Act is included in the Proxy Statement under the captions "Corporate Governance Matters and Committees of the Board of Directors", and "Section 16(a) Beneficial Ownership Reporting Compliance", respectively and is incorporated herein by reference.
The information required by Item 11 is contained in the Proxy Statement under the captions "Compensation Discussion and Analysis", "Executive Compensation", "Compensation Committee Interlocks and Insider Participation", and "Compensation Committee Report" and is incorporated herein by reference.
The information required by Item 12 is contained in the Proxy Statement under the captions "Security Ownership of Certain Beneficial Owners and Management" and "Equity Compensation Plan Information" and is incorporated herein by reference.
The information required by Item 13 is contained in the Proxy Statement under the captions "Director Independence" and "Certain Relationships and Related Transactions" and is incorporated herein by reference.
The information required by Item 14 is contained in the Proxy Statement under the caption "Proposal No. 2: Approve the Appointment of the Independent Registered Public Accounting Firm and Auditor" and is incorporated herein by reference.
119
(a)(1) The Company's 2016 Consolidated Financial Statements and Reports of Independent Registered Public Accounting Firm are included in Part II, Item 8 of this Annual Report on Form 10-K.
(a)(2) Consolidated Financial Statement Schedule for the years ended December 31, 2016, 2015 and 2014.
The following Consolidated Financial Statement Schedule should be read in conjunction with the previously referenced financial statements:
Schedule II Valuation and Qualifying Accounts
(a)(3) Exhibits - See the Exhibit Index for the exhibits filed with this Annual Report on Form 10-K or incorporated by reference.
120
None.
121
SCHEDULE II - VALUATION AND QUALIFYING ACCOUNTS
Allowance for Doubtful Accounts for the years ended December 31:
|
(in millions)
|
Balance at Beginning of Year
|
Additions
|
Deductions
(1)
|
Balance at End of Year
|
||||||
|
2016
|
$
|
10.7
|
|
3.4
|
|
(0.4
|
)
|
$
|
13.7
|
|
|
2015
|
9.9
|
|
4.9
|
|
(4.1
|
)
|
10.7
|
|
||
|
2014
|
$
|
6.5
|
|
5.1
|
|
(1.7
|
)
|
$
|
9.9
|
|
|
(1)
|
Deductions include uncollectible accounts written off and foreign currency translation impact.
|
Deferred tax asset valuation allowances for the years ended December 31:
|
(in millions)
|
Balance at Beginning of Year
|
Additions
|
Deductions
(1)
|
Balance at End of Year
|
||||||
|
2016
|
$
|
127.8
|
|
9.6
|
|
(2.0
|
)
|
$
|
135.4
|
|
|
2015
|
101.9
|
|
34.4
|
|
(8.5
|
)
|
127.8
|
|
||
|
2014
|
$
|
63.4
|
|
44.4
|
|
(5.9
|
)
|
$
|
101.9
|
|
|
(1)
|
Deductions include charges to goodwill and foreign currency translation impact.
|
122
SIGNATURES
Pursuant to the requirements of Section 13 or 15(d) of the Securities Exchange Act of 1934, the Registrant has duly caused this report to be signed on its behalf by the undersigned thereunto duly authorized on
February 28, 2017
.
|
AXALTA COATING SYSTEMS LTD.
|
||
|
By:
|
|
/s/ Charles W. Shaver
|
|
|
Charles W. Shaver
|
|
|
|
Chairman of the Board and Chief
Executive Officer
|
|
Pursuant to the requirements of the Securities Exchange Act of 1934, the registrant has duly caused this report to be signed on its behalf by the undersigned duly authorized.
|
Signature
|
|
Title
|
|
Date
|
|
/s/ Charles W. Shaver
|
|
Chairman of the Board and Chief Executive Officer
(Principal Executive Officer)
|
|
February 28, 2017
|
|
Charles W. Shaver
|
|
|
||
|
/s/ Robert W. Bryant
|
|
Executive Vice President and Chief Financial Officer (Principal Financial Officer)
|
|
February 28, 2017
|
|
Robert W. Bryant
|
|
|
||
|
/s/ Sean M. Lannon
|
|
Vice President, Corporate Finance and Global Controller
(Principal Accounting Officer)
|
|
February 28, 2017
|
|
Sean M. Lannon
|
|
|
||
|
/s/ Mark Garrett
|
|
Director
|
|
February 28, 2017
|
|
Mark Garrett
|
|
|
||
|
/s/ Deborah J. Kissire
|
|
Director
|
|
February 28, 2017
|
|
Deborah J. Kissire
|
|
|
||
|
/s/ Andreas C. Kramvis
|
|
Director
|
|
February 28, 2017
|
|
Andreas C. Kramvis
|
|
|
||
|
/s/ Gregory S. Ledford
|
|
Director
|
|
February 28, 2017
|
|
Gregory S. Ledford
|
|
|
||
|
/s/ Robert M. McLaughlin
|
|
Director
|
|
February 28, 2017
|
|
Robert M. McLaughlin
|
|
|
||
|
/s/ Lori J. Ryerkerk
|
|
Director
|
|
February 28, 2017
|
|
Lori J. Ryerkerk
|
|
|
||
|
/s/ Samuel L. Smolik
|
|
Director
|
|
February 28, 2017
|
|
Samuel L. Smolik
|
|
|
||
123
EXHIBIT INDEX
|
EXHIBIT NO.
|
DESCRIPTION OF EXHIBITS
|
|
2.1*
|
Purchase Agreement, dated as of August 30, 2012, by and between E. I. du Pont de Nemours and Company and Flash Bermuda Co. Ltd. (n/k/a Axalta Coating Systems Ltd.) (incorporated by reference to Exhibit 2.1 to the Registrant's Registration Statement on Form S-1 (File No. 333-198271) originally filed with the SEC on August 20, 2014)
|
|
2.2*
|
Amendment to Purchase Agreement, dated as of January 31, 2013, by and between E. I. du Pont de Nemours and Company and Flash Bermuda Co. Ltd. (n/k/a Axalta Coating Systems Ltd.) (incorporated by reference to Exhibit 2.2 to the Registrant's Registration Statement on Form S-1 (File No. 333-198271), originally filed with the SEC on August 20, 2014)
|
|
3.1*
|
Amended Memorandum of Association of Axalta Coating Systems Ltd. (incorporated by reference to Exhibit 3.1 of Amendment No. 2 to the Registrant's Registration Statement on Form S-1 (File No. 333-198271), filed with the SEC on October 14, 2014)
|
|
3.2*
|
Amended and Restated Bye-laws of Axalta Coating Systems Ltd. (incorporated by reference to Exhibit 3.1 to the Registrant’s Quarterly Report on Form 10-Q (File No. 001-36733), filed with the SEC on November 11, 2014)
|
|
4.1*
|
Specimen Common Share Certificate (incorporated by reference to Exhibit 4.21 to Amendment No. 3 to the Registrant's Registration Statement on Form S-1 (File No. 333-198271), filed with the SEC on October 30, 2014)
|
|
4.2*
|
Indenture, dated as of August 16, 2016, by and among Axalta Coating Systems, LLC, as the issuer, the guarantors named therein, Wilmington Trust, National Association, as trustee, Citigroup Global Markets Deutschland AG, as euro notes registrar, and Citibank N.A., London Branch, as euro notes paying agent and euro notes authenticating agent (including form of Dollar Note and form of Euro Note) (incorporated by reference to Exhibit 4.1 to the Registrant's Current Report on Form 8-K (File No. 001-36733), filed with the SEC on August 17, 2016)
|
|
4.3*
|
Indenture, dated as of September 27, 2016, by and among Axalta Coating Systems Dutch Holding B B.V., as the issuer, the guarantors named therein, Wilmington Trust, National Association, as trustee, Citigroup Global Markets Deutschland AG, as registrar, and Citibank N.A., London Branch, as paying agent and authenticating agent (including form of Note) (incorporated by reference to Exhibit 4.1 to the Registrant's Current Report on Form 8-K (File No. 001-36733), originally filed with the SEC on September 27, 2016)
|
|
10.1*
|
Credit Agreement, dated as of February 1, 2013, among Flash Dutch 2 B.V. (n/k/a Axalta Coating Systems Dutch Holding B B.V.) and U.S. Coatings Acquisition Inc. (n/k/a Axalta Coating Systems U.S. Holdings, Inc.), as borrowers, Flash Dutch 1 B.V. (n/k/a Axalta Coating Systems Dutch Holding A B.V.), Coatings Co. U.S. Inc. (n/k/a Axalta Coating Systems U.S., Inc.), Barclays Bank PLC, as administrative agent, collateral agent, swing line lender and L/C issuer, and the other lenders party thereto (incorporated by reference to Exhibit 10.1 to the Registrant's Registration Statement on Form S-1 (File No. 333-198271), originally filed with the SEC on August 20, 2014)
|
|
10.2*
|
Amendment No. 1 Agreement to the Credit Agreement, dated as of May 24, 2013, among Flash Dutch 2 B.V. (n/k/a Axalta Coating Systems Dutch Holding B B.V.), as Dutch borrower, Axalta Coating Systems U.S. Holdings, Inc., as U.S. borrower, and Barclays Bank PLC, as administrative agent (incorporated by reference to Exhibit 10.2 to the Registrant's Registration Statement on Form S-1 (File No. 333-198271), originally filed with the SEC on August 20, 2014)
|
|
10.3*
|
Second Amendment to Credit Agreement, dated as of February 3, 2014, by and among Axalta Coating Systems Dutch Holding B B.V. and Axalta Coating Systems U.S. Holdings, Inc., as borrowers, Axalta Coating Systems U.S., Inc. (f/k/a Coatings Co. U.S. Inc.), Axalta Coating Systems Dutch Holding A B.V., and Barclays Bank PLC, as administrative agent, collateral agent and designated 2014 Specified Refinancing Term Lender (incorporated by reference to Exhibit 10.3 to the Registrant's Registration Statement on Form S-1 (File No. 333-198271), originally filed with the SEC on August 20, 2014)
|
|
10.4*
|
Amendment No. 3 to the Credit Agreement, dated as of August 1, 2016, among Axalta Coating Systems Dutch Holding B B.V. and Axalta Coating Systems U.S. Holdings, Inc., as borrowers, Axalta Coating Systems U.S., Inc., Axalta Coating Systems Dutch Holding A B.V., the several banks and other financial institutions or entities from time to time parties thereto as lenders, Barclays Bank PLC, as administrative agent and collateral agent, and the other agents and arrangers party thereto (incorporated by reference to Exhibit 10.1 to the Registrant's Current Report on Form 8-K (File No. 001-36733), filed with the SEC on August 2, 2016)
|
124
|
10.5*
|
Amendment No. 4 to the Credit Agreement, dated as of December 15, 2016, among Axalta Coating Systems Dutch Holding B B.V. and Axalta Coating Systems U.S. Holdings, Inc., as borrowers, Axalta Coating Systems U.S., Inc., Axalta Coating Systems Dutch Holding A B.V., the several banks and other financial institutions or entities from time to time parties thereto as lenders, Barclays Bank PLC, as administrative agent and collateral agent, and the other agents and arrangers party thereto (incorporated by reference to Exhibit 10.1 to the Registrant's Current Report on Form 8-K (File No. 001-36733), filed with the SEC on December 15, 2016)
|
|
10.6*
|
Security Agreement, dated February 1, 2013, among the grantors referred to therein and Barclays Bank PLC, as collateral agent (incorporated by reference to Exhibit 10.4 to the Registrant’s Registration Statement on Form S-1 (File No. 333-198271), originally filed with the SEC on August 20, 2014)
|
|
10.7*
|
Intellectual Property Security Agreement, dated February 1, 2013, between U.S. Coatings IP Co. LLC (n/k/a Axalta Coating Systems USA IP Co. LLC) and Barclays Bank PLC, as collateral agent (incorporated by reference to Exhibit 10.6 to the Registrant’s Registration Statement on Form S-1 (File No. 333-198271), originally filed with the SEC on August 20, 2014)
|
|
10.8*
|
Subsidiary Guaranty, dated as of February 1, 2013, among the guarantors named therein, the additional guarantors referred to therein and Barclays Bank PLC, as administrative agent (incorporated by reference to Exhibit 10.8 to the Registrant’s Registration Statement on Form S-1 (File No. 333-198271), originally filed with the SEC on August 20, 2014)
|
|
10.9*
|
Holdings Guaranty, dated as of February 1, 2013, between Flash Dutch 1 B.V. (n/k/a Axalta Coating Systems Dutch Holding A B.V.) and Barclays Bank PLC, as administrative agent (incorporated by reference to Exhibit 10.9 to the Registrant’s Registration Statement on Form S-1 (File No. 333-198271), originally filed with the SEC on August 20, 2014)
|
|
10.10*
|
First Lien Intercreditor Agreement, dated as of February 1, 2013, among Barclays Bank PLC as bank collateral agent under the Credit Agreement, and as notes foreign collateral agent under the Indenture, Wilmington Trust, National Association, as notes collateral agent under the Indenture, each Grantor party thereto and each Additional Agent from time to time party thereto (incorporated by reference to Exhibit 10.10 to the Registrant’s Registration Statement on Form S-1 (File No. 333-198271), originally filed with the SEC on August 20, 2014)
|
|
10.11*
|
Share Pledge Agreement in respect of shares in DuPont Performance Coatings Belgium BVBA (n/k/a Axalta Coating Systems Belgium BVBA), dated 1 February 2013, between Coatings Co (UK) Limited (n/k/a Axalta Coating Systems UK Holding Limited), Teodur B.V. and Barclays Bank PLC, as collateral agent (incorporated by reference to Exhibit 10.11 to the Registrant’s Registration Statement on Form S-1 (File No. 333-198271), originally filed with the SEC on August 20, 2014)
|
|
10.12*
|
Bank Accounts Pledge Agreement, entered into September 17, 2013, among Axalta Coating Systems Brasil Ltda., Wilmington Trust, National Association, as Notes Collateral Agent, and Barclays Bank PLC, as collateral agent (incorporated by reference to Exhibit 10.13 to the Registrant’s Registration Statement on Form S-1 (File No. 333-198271), originally filed with the SEC on August 20, 2014)
|
|
10.13*
|
Quota Pledge Agreement, entered into September 17, 2013, among Brazil Coatings Co. Participações Ltda., Axalta Coating Systems Dutch Holding 2 B.V., Barclays Bank PLC, as collateral agent, and Wilmington Trust, National Association, as notes collateral agent (incorporated by reference to Exhibit 10.14 to the Registrant’s Registration Statement on Form S-1 (File No. 333-198271), originally filed with the SEC on August 20, 2014)
|
|
10.14*
|
Security Agreement, dated as of May 10, 2013, between Axalta Coating Systems Canada Company (f/k/a DuPont Performance Coatings Canada Company), Flash Lux Co S.à r.l. (n/k/a Axalta Coating Systems Luxembourg Holding S.à r.l.), the additional grantors from time to time party thereto, and Barclays Bank PLC, as collateral agent for the secured parties (incorporated by reference to Exhibit 10.15 to the Registrant’s Registration Statement on Form S-1 (File No. 333-198271), originally filed with the SEC on August 20, 2014)
|
|
10.15*
|
Securities Account Pledge Agreement in relation to the shares issued by France Coatings Co. (n/k/a Axalta Coating Systems France Holding SAS), dated 26 April 2013, between Flash Lux Co S.à r.l. (n/k/a Axalta Coating Systems Luxembourg Holding S.à r.l.), Barclays Bank PLC, as notes foreign collateral agent, and France Coatings Co. (n/k/a Axalta Coating Systems France Holding SAS) (incorporated by reference to Exhibit 10.17 to the Registrant’s Registration Statement on Form S-1 (File No. 333-198271), originally filed with the SEC on August 20, 2014)
|
|
10.16*
|
Pledge of Receivables Agreement, dated 26 April 2013, between Lux FinCo Coatings S.à r.l. (n/k/a Axalta Coating Systems Finance 1 S.à r.l.) and Barclays Bank PLC, as notes foreign collateral agent (incorporated by reference to Exhibit 10.18 to the Registrant’s Registration Statement on Form S-1 (File No. 333-198271), originally filed with the SEC on August 20, 2014)
|
125
|
10.17*
|
Securities Account Pledge Agreement in relation to the shares issued by DuPont Performance Coatings France SAS (n/k/a Axalta Coating Systems France SAS), dated 26 April 2013, between France Coatings Co. (n/k/a Axalta Coating Systems France Holding SAS), Barclays Bank PLC, as notes foreign collateral agent, and DuPont Performance Coatings France SAS (n/k/a Axalta Coating Systems France SAS) (incorporated by reference to Exhibit 10.19 to the Registrant’s Registration Statement on Form S-1 (File No. 333-198271), originally filed with the SEC on August 20, 2014)
|
|
10.18*
|
Account Pledge Agreement, made on 29 July 2013, between Axalta Coating Systems Verwaltungs GmbH (f/k/a Flash German Co. GmbH), Axalta Coating Systems Deutschland Holding GmbH & Co. KG (f/k/a Germany Coatings GmbH & Co. KG), Axalta Coating Systems Beteiligungs GmbH (f/k/a Germany Coatings Co GmbH), Standox GmbH, Spies Hecker GmbH, Axalta Coating Systems Germany GmbH (f/k/a DuPont Performance Coatings GmbH), Barclays Bank PLC, as collateral agent under the Credit Agreement, and Wilmington Trust, National Association, as notes collateral agent under the EUR Notes Indenture (incorporated by reference to Exhibit 10.20 to the Registrant’s Registration Statement on Form S-1 (File No. 333-198271), originally filed with the SEC on August 20, 2014)
|
|
10.19*
|
Global Assignment Agreement, made on 29 July 2013, between Axalta Coating Systems Deutschland Holding GmbH & Co. KG (f/k/a Germany Coatings GmbH & Co. KG) and Barclays Bank PLC, as collateral agent and collateral sub-agent (incorporated by reference to Exhibit 10.21 to the Registrant’s Registration Statement on Form S-1 (File No. 333-198271), originally filed with the SEC on August 20, 2014)
|
|
10.20*
|
Global Assignment Agreement, made on 29 July 2013, between Axalta Coating Systems Germany GmbH (f/k/a DuPont Performance Coatings GmbH) and Barclays Bank PLC, as collateral agent and collateral sub-agent (incorporated by reference to Exhibit 10.23 to the Registrant’s Registration Statement on Form S-1 (File No. 333-198271), originally filed with the SEC on August 20, 2014)
|
|
10.21*
|
Global Assignment Agreement, made on 29 July 2013, between Spies Hecker GmbH and Barclays Bank PLC, as collateral agent and collateral sub-agent (incorporated by reference to Exhibit 10.24 to the Registrant’s Registration Statement on Form S-1 (File No. 333-198271), originally filed with the SEC on August 20, 2014)
|
|
10.22*
|
Global Assignment Agreement, made on 29 July 2013, between Standox GmbH and Barclays Bank PLC, as collateral agent and collateral sub-agent (incorporated by reference to Exhibit 10.25 to the Registrant’s Registration Statement on Form S-1 (File No. 333-198271), originally filed with the SEC on August 20, 2014)
|
|
10.23*
|
Partnership Interest Pledge Agreement, made on 29 July 2013, between Axalta Coating Systems Luxembourg Holding 2 S.à r.l. (f/k/a Luxembourg Coatings S.à r.l.), Axalta Coating Systems Verwaltungs GmbH (f/k/a Flash German Co. GmbH), Barclays Bank PLC, as collateral agent under the Credit Agreement, and Wilmington Trust, National Association, as notes collateral agent under the EUR Notes Indenture (incorporated by reference to Exhibit 10.26 to the Registrant’s Registration Statement on Form S-1 (File No. 333-198271), originally filed with the SEC on August 20, 2014)
|
|
10.24*
|
Security Purpose Agreement, made on 29 July 2013, between Axalta Coating Systems Germany GmbH (f/k/a DuPont Performance Coatings GmbH) and Barclays Bank PLC, as collateral agent and collateral sub-agent (incorporated by reference to Exhibit 10.28 to the Registrant’s Registration Statement on Form S-1 (File No. 333-198271), originally filed with the SEC on August 20, 2014)
|
|
10.25*
|
Security Transfer Agreement, made on 29 July 2013, between Axalta Coating Systems Germany GmbH (f/k/a DuPont Performance Coatings GmbH) and Barclays Bank PLC, as collateral agent and collateral sub-agent (incorporated by reference to Exhibit 10.29 to the Registrant’s Registration Statement on Form S-1 (File No. 333-198271), originally filed with the SEC on August 20, 2014)
|
|
10.26*
|
Global Assignment Agreement, made on 1 July 2014, between Axalta Coating Systems Logistik Germany GmbH & Co. KG and Barclays Bank PLC, as collateral agent and collateral sub-agent (incorporated by reference to Exhibit 10.30 to the Registrant’s Registration Statement on Form S-1 (File No. 333-198271), originally filed with the SEC on August 20, 2014)
|
|
10.27*
|
Partnership Interest Pledge Agreement, made on 1 July 2014, between Axalta Coating Systems Germany GmbH, Axalta Coating Systems Verwaltungs GmbH (f/k/a Flash German Co. GmbH), Barclays Bank PLC, as collateral agent under the Credit Agreement, and Wilmington Trust, National Association as collateral agent under the EUR Note Indenture (incorporated by reference to Exhibit 10.31 to the Registrant’s Registration Statement on Form S-1 (File No. 333-198271), originally filed with the SEC on August 20, 2014)
|
126
|
10.28*
|
Account Pledge Agreement, made on 1 July 2014, between Axalta Coating Systems Logistik Germany GmbH & Co. KG, Barclays Bank PLC, as collateral agent under the Credit Agreement, and Wilmington Trust, National Association, as collateral agent under the EUR Notes Indenture (incorporated by reference to Exhibit 10.32 to the Registrant’s Registration Statement on Form S-1 (File No. 333-198271), originally filed with the SEC on August 20, 2014)
|
|
10.29*
|
Security Transfer Agreement, made on 1 July 2014, between Axalta Coating Systems Logistik Germany GmbH & Co. KG and Barclays Bank PLC, as collateral agent and collateral sub-agent (incorporated by reference to Exhibit 10.33 to the Registrant’s Registration Statement on Form S-1 (File No. 333-198271), originally filed with the SEC on August 20, 2014)
|
|
10.30*
|
Pledge Agreement without Transfer of Possession, dated September 18, 2013, between Axalta Coating Systems México, S. de R.L. de C.V. (f/k/a/ DuPont Performance Coatings México, S. de R.L. de C.V.) and Barclays Bank PLC, as collateral agent (incorporated by reference to Exhibit 10.34 to the Registrant’s Registration Statement on Form S-1 (File No. 333-198271), originally filed with the SEC on August 20, 2014)
|
|
10.31*
|
Pledge Agreement without Transfer of Possession, dated September 18, 2013, between Axalta Coating Systems Servicios México, S. de R.L. de C.V. (f/k/a/ DuPont Performance Coatings Servicios México, S. de R.L. de C.V.) and Barclays Bank PLC, as collateral agent (incorporated by reference to Exhibit 10.35 to the Registrant’s Registration Statement on Form S-1 (File No. 333-198271), originally filed with the SEC on August 20, 2014)
|
|
10.32*
|
Equity Interest Pledge Agreement, dated September 18, 2013, among Axalta Coating Systems LA Holding II B.V. (f/k/a DuPont Performance Coatings LA Holding II B.V.), Axalta Coating Systems México, S. de R.L. de C.V. (f/k/a/ DuPont Performance Coatings México, S. de R.L. de C.V.), Axalta Coating Systems Servicios México, S. de R.L. de C.V. (f/k/a/ DuPont Performance Coatings Servicios México, S. de R.L. de C.V.) and Barclays Bank PLC, as collateral agent (incorporated by reference to Exhibit 10.36 to the Registrant’s Registration Statement on Form S-1 (File No. 333-198271), originally filed with the SEC on August 20, 2014)
|
|
10.33*
|
Equity Interest Pledge Agreement, dated September 18, 2013, among Axalta Coating Systems LA Holding II B.V. (f/k/a DuPont Performance Coatings LA Holding II B.V.), Axalta Coating Systems Servicios México, S. de R.L. de C.V. (f/k/a/ DuPont Performance Coatings Servicios México, S. de R.L. de C.V.), Axalta Coating Systems México, S. de R.L. de C.V. (f/k/a/ DuPont Performance Coatings México, S. de R.L. de C.V.) and Barclays Bank PLC, as collateral agent (incorporated by reference to Exhibit 10.37 to the Registrant’s Registration Statement on Form S-1 (File No. 333-198271), originally filed with the SEC on August 20, 2014)
|
|
10.34*
|
Share Pledge Agreement, dated September 18, 2013, between Axalta Powder Coating Systems USA, Inc. (f/k/a DuPont Powder Coatings USA, Inc.), Axalta Powder Coating Systems México, S.A. de C.V. (f/k/a DuPont Powder Coatings de México, S.A. de C.V.) and Barclays Bank PLC, as collateral agent (incorporated by reference to Exhibit 10.38 to the Registrant’s Registration Statement on Form S-1 (File No. 333-198271), originally filed with the SEC on August 20, 2014)
|
|
10.35*
|
Debenture, dated 1 February 2013, by Coatings Co (UK) Limited (n/k/a Axalta Coating Systems UK Holding Limited), DuPont Performance Coatings (U.K.) Limited (n/k/a Axalta Coating Systems UK Limited) and DuPont Powder Coatings UK Limited (n/k/a Axalta Powder Coating Systems UK Limited), in favour of Barclays Bank PLC, as collateral agent appointed pursuant to the Credit Agreement (incorporated by reference to Exhibit 10.40 to the Registrant’s Registration Statement on Form S-1 (File No. 333-198271), originally filed with the SEC on August 20, 2014)
|
|
10.36*
|
Security Over Shares Agreement, dated 1 February 2013, between Flash Lux Co S.à r.l. (n/k/a Axalta Coating Systems Luxembourg Holding S.à r.l.) and Barclays Bank PLC, as collateral agent appointed pursuant to the Credit Agreement (incorporated by reference to Exhibit 10.42 to the Registrant’s Registration Statement on Form S-1 (File No. 333-198271), originally filed with the SEC on August 20, 2014)
|
|
10.37*
|
Debenture, dated 25 March 2014, by Axalta Coating Systems U.K. (2) Limited in favour of Barclays Bank PLC, as collateral agent appointed pursuant to the Credit Agreement (incorporated by reference to Exhibit 10.44 to the Registrant’s Registration Statement on Form S-1 (File No. 333-198271), originally filed with the SEC on August 20, 2014)
|
|
10.38*
|
Security Over Shares Agreement, dated 25 March 2014, between Axalta Coating Systems Belgium BVBA and Barclays Bank PLC, as collateral agent appointed pursuant to the Credit Agreement (incorporated by reference to Exhibit 10.46 to the Registrant’s Registration Statement on Form S-1 (File No. 333-198271), originally filed with the SEC on August 20, 2014)
|
127
|
10.39*
|
Amended and Restated Stockholders Agreement, dated July 31, 2013, among Axalta Coating Systems Bermuda Co., Ltd. (n/k/a Axalta Coating Systems Ltd.), the Initial Carlyle Stockholders and the Management Stockholders party thereto (incorporated by reference to Exhibit 10.47 to Amendment No. 2 to the Registrant’s Registration Statement on Form S-1 (File No. 333-198271), filed with the SEC on October 14, 2014)
|
|
10.40*
|
Form of Indemnification Agreement (incorporated by reference to Exhibit 10.48 to Amendment No. 3 to the Registrant’s Registration Statement on Form S-1 (File No. 333-198271), filed with the SEC on October 30, 2014)
|
|
10.41*
|
Axalta Coating Systems Bermuda Co., Ltd. 2013 Equity Incentive Plan (incorporated by reference to Exhibit 10.54 to Amendment No. 2 to the Registrant’s Registration Statement on Form S-1 (File No. 333-198271), filed with the SEC on October 14, 2014)
|
|
10.42*
|
Form of Stock Option Agreement under the Axalta Coating Systems Bermuda Co., Ltd. 2013 Equity Incentive Plan (incorporated by reference to Exhibit 10.55 to Amendment No. 2 to the Registrant’s Registration Statement on Form S-1 (File No. 333-198271), filed with the SEC on October 14, 2014)
|
|
10.43*
|
Axalta Coating Systems Ltd. 2014 Equity Incentive Plan (incorporated by reference to Exhibit 10.56 to Amendment No. 3 to the Registrant’s Registration Statement on Form S-1 (File No. 333-198271), filed with the SEC on October 30, 2014)
|
|
10.44*
|
Form of Stock Option Agreement under the Axalta Coating Systems Ltd. 2014 Equity Incentive Plan (incorporated by reference to Exhibit 10.57 to Amendment No. 3 to the Registrant’s Registration Statement on Form S-1 (File No. 333-198271), filed with the SEC on October 30, 2014)
|
|
10.45*
|
Form of Restricted Stock Agreement under the Axalta Coating Systems Ltd. 2014 Equity Incentive Plan (incorporated by reference to Exhibit 10.58 to Amendment No. 3 to the Registrant’s Registration Statement on Form S-1 (File No. 333-198271), filed with the SEC on October 30, 2014)
|
|
10.46*
|
Form of Restricted Stock Unit Agreement under the Axalta Coating Systems Ltd. 2014 Equity Incentive Plan (incorporated by reference to Exhibit 10.59 to Amendment No. 3 to the Registrant’s Registration Statement on Form S-1 (File No. 333-198271), filed with the SEC on October 30, 2014)
|
|
10.47*
|
Axalta Coating Systems LLC Retirement Savings Restoration Plan (incorporated by reference to Exhibit 10.60 to Amendment No. 2 to the Registrant’s Registration Statement on Form S-1 (File No. 333-198271), filed with the SEC on October 14, 2014)
|
|
10.48*
|
Axalta Coating Systems, LLC Nonqualified Deferred Compensation Plan (incorporated by reference to Exhibit 10.61 to Amendment No. 2 to the Registrant’s Registration Statement on Form S-1 (File No. 333-198271), filed with the SEC on October 14, 2014)
|
|
10.49*
|
Registration Rights Agreement by and among Axalta Coating Systems Ltd. and Government Employees Insurance Company (incorporated by reference to Exhibit 10.63 to the Registrant's Quarterly Report on Form 10-Q (File No. 001-36733) filed with the SEC on May 6, 2015)
|
|
10.50*
|
Form of Executive Restrictive Covenant and Severance Agreement (incorporated by reference to Exhibit 10.60 to the Registrant’s Annual Report on Form 10-K (File No. 001-36733) filed with the SEC on February 29, 2016)
|
|
21.1
|
List of Subsidiaries
|
|
23.2
|
Consent of PricewaterhouseCoopers LLP
|
|
31.1
|
Certification of Chief Executive Officer Pursuant to Section 302 of the Sarbanes-Oxley Act of 2002
|
|
31.2
|
Certification of Chief Financial Officer Pursuant to Section 302 of the Sarbanes-Oxley Act of 2002
|
|
32.1††
|
Certification of Chief Executive Officer Pursuant to 18 U.S.C. Section 1350, as adopted pursuant to Section 906 of the Sarbanes-Oxley Act of 2002
|
|
32.2††
|
Certification of Chief Financial Officer Pursuant to 18 U.S.C. Section 1350, as adopted pursuant to Section 906 of the Sarbanes-Oxley Act of 2002
|
|
101†
|
INS - XBRL Instance Document
|
|
101†
|
SCH - XBRL Taxonomy Extension Schema Document
|
|
101†
|
CAL - XBRL Taxonomy Extension Calculation Linkbase Document
|
128
|
101†
|
DEF - XBRL Taxonomy Extension Definition Linkbase Document
|
|
101†
|
LAB - XBRL Taxonomy Extension Label Linkbase Document
|
|
101†
|
PRE - XBRL Taxonomy Extension Presentation Linkbase Document
|
|
*
|
Previously filed.
|
|
†
|
In accordance with Rule 406T of Regulation S-T, the information in these exhibits is furnished and deemed not filed or part of a registration statement or prospectus for purposes of sections 11 or 12 of the Securities Act of 1933, is deemed not filed for purposes of section 18 of the Exchange Act of 1934, and otherwise is not subject to liability under these sections.
|
|
††
|
In accordance with Item 601(b)(32)(ii) of Regulation S-K and SEC Release No. 33-8238 and 34-47986, Final Rule: Management’s Reports on Internal Control Over Financial Reporting and Certification of Disclosure in Exchange Act Periodic Reports, the certifications furnished in Exhibits 32.1 and 32.2 hereto are deemed to accompany this Form 10-K and will not be deemed "filed" for purposes of section 18 of the Exchange Act. Such certifications will not be deemed to be incorporated by reference into any filings under the Securities Act or the Exchange Act, except to the extent that the registrant specifically incorporates it by reference.
|
129
TABLE OF CONTENTS
Part IItem 1. BusinessItem 1A. Risk FactorsItem 1B. Unresolved Staff CommentsItem 2. PropertiesItem 3. Legal ProceedingsItem 4. Mine Safety DisclosuresPart IIItem 5. Market For The Registrant S Common Equity, Related Shareholder Matters and Issuer Purchases Of Equity SecuritiesItem 6. Selected Financial DataItem 7. Management's Discussion and Analysis Of Financial Condition and Results Of OperationsItem 7A. Quantitative and Qualitative Disclosures About Market RiskItem 8. Financial Statements and Supplementary DataItem 9. Changes in and Disagreements with Accountants on Accounting and Financial DisclosureItem 9A. Controls and ProceduresItem 9B. Other InformationPart IIIItem 10. Directors, Executive Officers and Corporate GovernanceItem 11. Executive CompensationItem 12. Security Ownership Of Certain Beneficial Owners and Management and Related Shareholder MattersItem 13. Certain Relationships and Related Transactions and Director IndependenceItem 14. Principal Accountant Fees and ServicesPart IVItem 15. Exhibits and Financial Statement SchedulesItem 16. Form 10-k Summary