AXT INC
10-Ks and 10-Qs
|
|
|
|
|
|
|
|
|
|
|
|
|
|
|
|
|
|
|
|
|
|
|
|
|
|
|
|
|
|
|
|
|
|
|
|
|
|
|
|
|
|
|
|
|
|
|
|
|
|
|
|
|
|
|
|
|
|
|
Fint
UNITED STATES
SECURITIES AND EXCHANGE COMMISSION
Washington, D.C. 20549
Form 10-K
(Mark One)
|
x
|
ANNUAL REPORT PURSUANT TO SECTION 13 OR 15(d) OF THE SECURITIES EXCHANGE ACT OF 1934
|
For the fiscal year ended December 31, 2013
OR
|
o
|
TRANSITION REPORT PURSUANT TO SECTION 13 OR 15(d) OF THE SECURITIES EXCHANGE ACT OF 1934
|
For the transition period from to
Commission file number: 000-24085
AXT, INC.
(Exact name of registrant as specified in its charter)
|
Delaware
|
|
94-3031310
|
|
(State or other jurisdiction of incorporation or organization)
|
|
(I.R.S. Employer Identification No.)
|
|
4281 Technology Drive, Fremont, California
|
|
94538
|
|
(Address of principal executive offices)
|
|
(Zip Code)
|
Registrant’s telephone number, including area code:
(510) 683-5900
Securities registered pursuant to Section 12(b) of the Act:
|
Title of each class
|
|
Name of each exchange on which registered
|
|
Common Stock, $0.001 par value
|
|
The NASDAQ Stock Market LLC
|
Securities registered pursuant to Section 12(g) of the Act:
None
Indicate by checkmark if the registrant is a well-known seasoned issuer, as defined in Rule 405 of the Securities Act
o
Yes
x
No
Indicate by checkmark if the registrant is not required to file reports pursuant to Section 13 or Section 15(d) of the Act.
o
Yes
x
No
Indicate by checkmark whether the registrant (1) has filed all reports required to be filed by Section 13 or 15 (d) of the Securities Exchange Act of 1934 during the preceding 12 months (or for such shorter period that the registrant was required to file such reports), and (2) has been subject to such filing requirements for the past 90 days.
x
Yes
o
No
Indicate by check mark whether the registrant has submitted electronically and posted on its corporate Web site, if any, every Interactive Data File required to be submitted and posted pursuant to Rule 405 of Regulation S-T (§ 232.405 of this chapter) during the preceding 12 months (or for such shorter period that the registrant was required to submit and post such files).
x
Yes
o
No
Indicate by checkmark if disclosure of delinquent filers pursuant to Item 405 of Regulation S-K (§ 229.405 of this chapter) is not contained herein, and will not be contained, to the best of registrant’s knowledge, in definitive proxy or information statements incorporated by reference in Part III of this Form 10-K or any amendment to this Form 10-K.
o
Indicate by checkmark whether the registrant is a large accelerated filer, an accelerated filer, a non-accelerated filer or a smaller reporting company. See the definitions of “large accelerated filer,” “accelerated filer,” and “smaller reporting company” in Rule 12b-2 of the Act. (Check one):
|
Large accelerated filer
o
|
Accelerated filer
x
|
Non‑accelerated filer
o
|
Smaller reporting company
o
|
|
|
|
(Do not check if a smaller
reporting company) |
|
Indicate by checkmark whether the registrant is a shell company (as defined in Rule 12b-2 of the Act).
o
Yes
x
No
The aggregate market value of the voting stock held by non-affiliates of the registrant, based upon the closing sale price of $2.70 for the common stock on June 28, 2013 as reported on the Nasdaq Global Market, was approximately $69,868,000. Shares of common stock held by each officer, director and by each person who owns 5% or more of the outstanding common stock have been excluded in that such persons may be deemed to be affiliates. This determination of affiliate status is not a conclusive determination for other purposes.
As of March 3, 2014, 32,604,958 shares, $0.001 par value, of the registrant’s common stock were outstanding.
DOCUMENTS INCORPORATED BY REFERENCE
Portions of the definitive proxy statement for the registrant’s 2014 annual meeting of stockholders to be filed with the Commission pursuant to Regulation 14A not later than 120 days after the end of the fiscal year covered by this form are incorporated by reference into Part III of this Form 10-K report. Except for those portions specifically incorporated by reference herein, such document shall not be deemed to be filed with the Commission as part of this Form 10-K.
|
|
|
Page
|
|
PART I
|
||
|
Item 1.
|
2
|
|
|
Item 1A.
|
10
|
|
|
Item 1B.
|
23
|
|
|
Item 2.
|
24
|
|
|
Item 3.
|
24
|
|
|
Item 4.
|
24
|
|
|
PART II
|
||
|
Item 5.
|
25
|
|
|
Item 6.
|
27
|
|
|
Item 7.
|
28
|
|
|
Item 7A.
|
41
|
|
|
Item 8.
|
43
|
|
|
Item 9.
|
43
|
|
|
Item 9A.
|
43
|
|
|
Item 9B.
|
44
|
|
|
PART III
|
||
|
Item 10.
|
46
|
|
|
Item 11.
|
46
|
|
|
Item 12.
|
46
|
|
|
Item 13.
|
46
|
|
|
Item 14.
|
46
|
|
|
PART IV
|
||
|
Item 15.
|
47
|
|
PART I
This Annual Report (including the following section regarding Management’s Discussion and Analysis of Financial Condition and Results of Operations) contains forward‑looking statements regarding our business, financial condition, results of operations and prospects. Words such as “expects,” “anticipates,” “intends,” “plans,” “believes,” “seeks,” “estimates,” “goals,” “should,” “continues,” “would,” “could” and similar expressions or variations of such words are intended to identify forward‑looking statements, but are not the exclusive means of identifying forward‑looking statements in this Annual Report. Additionally, statements concerning future matters such as industry trends, customer demand, the development of new products, enhancements or technologies, sales levels, expense levels, planned investments and other statements regarding matters that are not historical are forward‑looking statements.
Although forward‑looking statements in this Annual Report reflect the good faith judgment of our management, such statements can only be based on facts and factors currently known by us. Consequently, forward‑looking statements are inherently subject to risks and uncertainties and actual results and outcomes may differ materially from the results and outcomes discussed in or anticipated by the forward‑looking statements. Factors that could cause or contribute to such differences in results and outcomes include without limitation those discussed under the heading “Risk Factors” in Item 1A below, as well as those discussed elsewhere in this Annual Report. Readers are urged not to place undue reliance on these forward‑looking statements, which speak only as of the date of this Annual Report. We undertake no obligation to revise or update any forward‑looking statements in order to reflect any event or circumstance that may arise after the date of this Annual Report. Readers are urged to carefully review and consider the various disclosures made in this Annual Report, which attempt to advise interested parties of the risks and factors that may affect our business, financial condition, results of operations and prospects.
AXT, Inc. (“AXT”, “we,” “us,” and “our” refer to AXT, Inc. and all of its subsidiaries) is a leading worldwide developer and producer of high-performance compound and single element semiconductor substrates, including substrates made from gallium arsenide (GaAs), indium phosphide (InP) and germanium (Ge). We currently sell the following substrate products in the sizes and for the applications indicated:
|
Substrates
|
Substrate
Diameter |
Applications
|
||
|
GaAs (semi-insulating)
|
2”, 3”, 4”, 5”, 6”
|
•
Power amplifiers and radio frequency integrated circuits for wireless handsets (cell phones)
•
Direct broadcast television
•
High-performance transistors
•
Satellite communications
|
||
|
GaAs (semi-conducting)
|
2”, 3”, 4”,6”
|
•
High brightness light emitting diodes
•
Lasers
•
Optical couplers
|
||
|
InP
|
2”, 3”, 4”
|
•
Broadband and fiber optic communications
|
||
|
Ge
|
2”, 4”, 6”
|
•
Satellite and terrestrial solar cells
•
Optical applications
|
We manufacture all of our semiconductor substrates using our proprietary vertical gradient freeze (VGF) technology. Most of our revenue is from sales of GaAs substrates. We manufacture all of our products in the People’s Republic of China (PRC or China), which generally has favorable costs for facilities and labor compared with comparable facilities in the United States, Europe or Japan. We also have joint ventures in China, which provide us pricing advantages, reliable supply and enhanced sourcing lead-times for key raw materials which are central to our final manufactured products. These joint ventures produce products including 99.99% pure gallium (4N Ga), high purity gallium, arsenic, germanium, germanium dioxide, pyrolytic boron nitride (pBN) crucibles and boron oxide (B2O3). Our ownership interest in these entities ranges from 20% to 83%. We consolidate, for accounting purposes, the joint ventures in which we have majority or controlling financial interest and significant influence on management, and employ equity accounting for the joint ventures in which we have a smaller ownership interest. We purchase portions of the materials produced by these joint ventures for our own use and the joint ventures sell the remainder of their production to third parties. We use our direct sales force in the United States and China, and independent sales representatives in Europe and other parts of Asia to market and sell our substrates.
The industries in the wireless device, LED and solar cell markets became more competitive and negatively affected our business during 2013, as well as the falling price of raw gallium sold by our joint ventures. We believe these factors will continue to affect our business operations in 2014. However, the strong proliferation of wireless devices and improving market for satellite solar cells will ultimately drive the demand for our substrates in the future. Although our qualification progress in gallium arsenide substrates was slow in 2013 due to consolidation within the base of customers for our products, we will continue our effort and expect it will improve in 2014.
We were incorporated in California in December 1986 and reincorporated in Delaware in May 1998. We changed our name from American Xtal Technology, Inc. to AXT, Inc. in July 2000. Our principal corporate office is located at 4281 Technology Drive, Fremont, California 94538, and our telephone number at this address is (510) 683-5900.
Industry Background
Certain electronic and opto-electronic applications have performance requirements that exceed the capabilities of conventional silicon substrates and often require high-performance compound or single element substrates. Examples of higher performance non-silicon based substrates include GaAs, InP, gallium nitride (GaN), silicon carbide (SiC) and Ge.
For example, power amplifiers and radio frequency integrated circuits for wireless handsets and other wireless devices are made with semi-insulating GaAs substrates. Semi-conducting GaAs substrates are used to create opto-electronic products including high brightness light emitting diodes (HBLEDs) that are often used to backlight wireless handsets and liquid crystal display (LCD) TVs and are also used for automotive panels, signage, display and lighting applications. InP is a high performance semiconductor substrate used in broadband and fiber optic applications. Ge substrates are used in emerging applications such as solar cells for space and terrestrial photovoltaic applications.
The AXT Advantage
We believe that we benefit from the following advantages:
| • | Low-cost manufacturing operation in the PRC. Since 2004, we have manufactured all of our products in China, which generally has favorable costs for facilities and labor compared to comparable facilities in the United States or Europe. As of December 31, 2013, approximately 1,232 of our 1,255 employees (including employees at our consolidated joint ventures) are in China. Our primary competitors have their major manufacturing operations in Germany or Japan and have limited manufacturing operations in China. |
| • |
Favorable access to raw materials.
Our joint ventures in China provide us reliable supply and shorter lead-times for raw materials central to our final manufactured products. These materials include gallium, arsenic, germanium, germanium dioxide, pyrolytic boron nitride crucibles and boron oxide. As a result, we believe that our joint ventures will enable us to meet potential increases in demand from our customers by providing a more stable
and quicker
supply of raw materials
|
| • | Flexible manufacturing infrastructure. Our total manufacturing space in China is approximately 190,000 square feet which we currently use for wafer processing. We believe that our competitors typically purchase crystal growing furnaces from original equipment manufacturers. In contrast, we design and build our own VGF crystal growing furnaces, which we believe should allow us to increase our production capacity more quickly and cost effectively. |
Strategy
Our goal is to become the leading worldwide supplier of high-performance compound and single element semiconductor substrates. Key elements of our strategy include:
Continue to provide customers high and consistent quality products and service.
We seek to improve our manufacturing processes continually in order to meet and exceed our customers’ high product quality standards, ensure on-time delivery of our products and optimize the cost of ownership. We expect to continue to improve our manufacturing processes in 2014 by adding additional equipment, automating additional processes, and streamlining performance. In addition, we plan to continue to enhance our support functions, including service and applications engineering.
Increase market share.
We intend to leverage our product quality, competitive pricing and lead times both to establish relationships with new customers and to increase our market share with current customers in the integrated circuits for wireless devices and HBLED markets.
Flexible capacity to meet customers’ increasing demand for substrates.
Although the demand for substrates has been fluctuating in the past year, as we enter 2014, we are reviewing our GaAs substrate capacity and demand for all sizes to make appropriate adjustments in our capacity.
In January 2012,
we agreed with the Administrative Commission of Tianjin Economy and Technology Development Zone to establish a second manufacturing facility in Tianjin, China. The arrangement provides us with land use rights for approximately 32 acres of industrial land located in Yixian Scientific and Industrial Park to construct a compound semiconductor substrate manufacturing facility that would be completed in phases by 2017. We have committed to invest $12.5 million in the first phase of the construction of the facility and have an understanding with our BoYu joint venture that it will commit the RMB 32.0 million, or approximately $5.0 million, that is anticipated to be required for the portion of the project devoted to crystal support, in exchange for land use rights, enterprise and individual income tax rebates, employee hiring and development subsidies, and other benefits.
We expect to fund the first phase of the construction of the facility with cash flow generated by our normal operations supplemented by our existing line of credit. However, we have delayed our participation in the project at this time due to the volatility in our substrate business. It is possible that the investment of $5.0 million will still be funded by our BoYu joint venture for crystal support later in 2014.
Establish leadership in emerging substrate applications.
We intend to expand our served markets by exploring new opportunities for our substrates and we continue to work with our customers to enhance our substrate product offering. For example, we have worked on the development of a 6” Ge substrate because the larger usable area in a 6-inch wafer over a 4-inch wafer will substantially reduce the cost of Ge solar cell manufacturing, which we believe is essential for commercial adoption of Ge solar cell technology for terrestrial applications.
Technology enhancements.
We continue to focus on technology development in the area of VGF technology enhancement. We are working to increase the VGF ingot length and improve our single crystal yield rate. We also continue to work to improve our wafer processing technologies to give us better yield, lower production costs and better quality and performance for our customers.
Technology
There are basically three technologies for crystal growth in our business: Vertical Gradient Freeze (VGF), Liquid Encapsulated Czochralski (LEC), and Czochralski (CZ). Our core technologies include our proprietary VGF technique used to produce high-quality crystals that are processed into compound substrates, and the technologies of our joint venture companies, which enable us to manufacture a range of products that are used in the manufacture of compound semiconductor substrates or can be sold as raw materials to third parties.
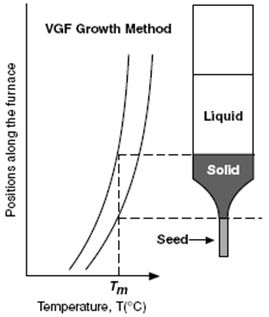
Our VGF technique is designed to control the crystal‑growth process with minimal temperature variation and is the current technique we use to produce our GaAs, InP and Ge substrates. Unlike traditional techniques, our VGF technique places the hot compound melt above the cool crystal, and minimizes the temperature gradient between the crystal and the melt which reduces the turbulence at the interface of the melt and the solid crystal. In comparison, in the LEC technique the melt and crystal are inverted, there is a higher temperature gradient between the melt and the crystal, and more turbulence at the interface of the melt and solid crystal. These aspects of the VGF technique enable us to grow crystals that have a relatively low defect density and high uniformity. The crystal and the resulting substrate are mechanically strong, resulting in lower breakage rates during a customer’s manufacturing process. Since the temperature gradient is controlled electronically rather than by physical movement, the sensitive crystal is not disturbed as it may be during some of our competitors’ VGF-like growth processes. In addition, the melt and growing crystal are contained in a closed chamber, which isolates the crystal from the outside environment to reduce potential contamination. This substrate isolation allows for more precise control of the gallium-to-arsenic ratio, resulting in better consistency and uniformity of the crystals.
We believe that our VGF technique offers several benefits for producing our GaAs substrates when compared to traditional crystal growing technologies. The Horizontal Bridgman (HB) technique is the traditional method for producing semi-conducting GaAs substrates for opto-electronic applications, but because of the techniques used to hold the GaAs melt, the HB technique cannot be used cost-effectively to produce substrates greater than three inches in diameter. In addition, the HB technique houses the GaAs melt in a quartz container during the growth process, which can contaminate the GaAs melt with silicon impurities, making it unsuitable for producing semi-insulating GaAs substrates.
We believe our VGF technique also offers advantages over the LEC technique for producing semi-insulating GaAs substrates for wireless applications. Unlike the VGF technique, the LEC technique can result in greater turbulence in the melt, and at a temperature gradient that is significantly higher than the VGF technique, which can cause LEC-grown crystals to have a higher dislocation density than VGF-grown crystals, resulting in a higher rate of breakage during the device manufacturing process. However, the LEC technique can be useful for GaAs semi-conducting substrates since the LED application specifications and requirements are less stringent than those of wireless applications.
Products
We design, develop, manufacture and distribute high-performance semiconductor substrates. We make semi-insulating GaAs substrates used in applications such as amplifiers and switches for wireless devices, and semi-conducting GaAs substrates used to create opto-electronic products including HBLEDs, which are often used to backlight wireless handsets and LCD TVs and for automotive, signage, display and lighting applications. InP is a high-performance semiconductor substrate used in broadband and fiber optic applications. Ge substrates are used in emerging applications such as triple junction solar cells for space and terrestrial photovoltaic applications and for optical applications.
The table below sets forth our products and selected applications:
|
Product
|
Applications
|
||||
|
Substrates
|
Electronic
|
Opto-electronic
|
|||
|
GaAs
|
•
|
Cellular phones
|
•
|
LEDs
|
|
|
|
•
|
Direct broadcast television
|
•
|
Lasers
|
|
|
|
•
|
High-performance transistors
|
•
|
Optical couplers
|
|
|
|
•
|
Satellite communications
|
|
|
|
|
InP
|
•
|
Fiber optic communications
|
•
|
Lasers
|
|
|
|
•
|
Satellite communications
|
|
|
|
|
|
•
|
High-performance transistors
|
|
|
|
|
|
•
|
Automotive collision avoidance radar
|
|
|
|
|
Ge
|
•
|
Satellite and terrestrial solar cells
|
•
|
Optical applications
|
|
Substrates.
We currently sell compound substrates manufactured from GaAs and InP, as well as single‑element substrates manufactured from Ge. We supply
both semi-insulating and semiconducting
GaAs substrates in two-, three‑, four-, five- and six-inch diameters. We supply InP substrates in two-, three‑ and four-inch diameters, and Ge substrates in two-, four- and six-inch diameters.
Materials.
We participate in joint ventures in China that sell raw materials used by us in substrate manufacturing and by others. These joint ventures produce products including 99.99% pure gallium (4N Ga), high purity gallium, arsenic, and germanium, germanium dioxide, pyrolytic boron nitride (pBN) crucibles, and boron oxide (B2O3). In 2013, 2012
and 2011
, sales of raw materials by these joint ventures to third parties were approximately $21.0 million, $22.2 million
and $23.6 million
, respectively.
The primary costs of manufacturing compound semiconductor substrates are labor, raw materials and manufacturing equipment such as crystal growing furnaces. Accordingly, substrate manufacturers, including us, are continuing to shift production to larger wafers to reduce manufacturing costs.
Customers
We sell our compound semiconductor substrates and materials worldwide. Our top ten revenue producing customers in 2013 by revenue in alphabetical order were:
|
• Azur Space Solar Power GmbH
|
• Nan Da Guang Dang
|
|
• Guangxi Debang Technology Co., Ltd
|
• Osram Opto Semiconductors GmbH
|
|
• IQE Group
|
• Soitec Specialty Electronics
|
|
• Landmark Optoelectronics Inc.
|
• TianJin Sanan Optoelectronics Co. Ltd.
|
|
• Molycorp Rare Metals Inc.
|
• Visual Photonic Epitaxy Co.
|
Historically, we have sold a significant portion of our products in any particular period to a limited number of customers. No
customer represented more than 10% of our revenue for the year ended December 31, 2013.
IQE Group represented approximately 17% and 18% of our revenue for the years ended December 31, 2012 and 2011, respectively. Our top five customers, although not the same five customers for each period, represented 31%, 37% and 35% of our revenue for the year ended December 31, 2013, 2012 and 2011, respectively. We expect that sales to a small number of customers will continue to comprise a significant portion of our revenue in the future.
There were
three third party customers for the raw materials revenue from our joint ventures that accounted for 11%, 10% and 10% of the revenue from raw materials sales for the year ended December 31, 2013,
one third party customer for the raw materials revenue from our joint ventures that accounted for 19% of the revenue from raw materials sales for the year ended December 31, 2012, two third party customers for the raw materials revenue from our joint ventures that accounted for 15% and 13% of the revenue from raw materials sales for the year ended December 31, 2011. Raw material sales in 2013, 2012 and 2011 approximated $
21.0
million, $22.2 million and $23.6 million respectively. Our joint ventures are a key strategic benefit for us as they give us a strong competitive advantage by allowing our customers to work with one supplier for their substrate and raw material requirements. Our raw materials customers include chemical companies. Additionally, we sell raw materials to some of the competitors to our substrate business.
Manufacturing, Raw Materials and Supplies
We believe that our operating results reflect our manufacturing efficiency and high product yields and we continually emphasize quality and process control throughout our manufacturing operations. We manufacture all of our products at our facilities in Beijing, China, which generally has favorable costs for facilities and labor compared to our previous manufacturing in the United States. Although some of our manufacturing operations are fully automated and computer monitored or controlled, enhancing reliability and yield, we expect to continue to improve our processes and increase the number of automated processes in 2014.
On February 25, 2014, we announced a restructuring plan with respect to our wholly-owned subsidiary, Beijing Tongmei Xtal Technology Co, Ltd. (“Tongmei”) in order to better align demand with manufacturing capacity. Under the restructuring plan, Tongmei will implement certain workforce reductions with respect to its manufacturing facility in China. The Company expects to substantially complete the restructuring plan by March 31, 2014, depending on local legal requirements. In connection with the restructuring plan, the Company expects to incur aggregate pre-tax restructuring charges comprised of severance and other termination benefits of approximately $900,000, but the charges could range from $850,000 to $1.1 million, all of which are currently expected to be recorded in the first fiscal quarter of 2014
.
We have joint ventures in China that provide us with reliable supply and shorter lead-times for raw materials central to our manufactured products including gallium, arsenic, germanium, germanium dioxide, pyrolitic boron nitride crucibles, and boron oxide. We believe that these joint ventures have been and will continue to be advantageous in allowing us to procure materials to support our planned growth. In addition, we purchase supply parts, components and raw materials from several other domestic and international suppliers. We depend on a single or limited number of suppliers for certain critical materials used in the production of our substrates, such as quartz tubing, and polishing solutions. We generally purchase these materials through standard purchase orders and not pursuant to long-term supply contracts. Although we seek to maintain sufficient inventory levels of certain materials to guard against interruptions in supply and to meet our near term needs, and have to date been able to obtain sufficient supplies of materials in a timely manner, in the future, we may experience shortages of certain key materials, such as gallium.
Sales and Marketing
We advertise in trade publications, distribute promotional materials, conduct marketing and sales programs, and participate in industry trade shows and conferences in order to raise market awareness of our products.
We sell our substrate products directly to customers through our direct salesforce in the United States and China and through independent sales representatives in Europe and other parts of Asia to market and sell our substrates. Our direct salesforce is knowledgeable in the use of compound and single‑element substrates. Our applications engineers work with customers during all stages of the substrate manufacturing process, from developing the precise composition of the substrate through manufacturing to processing the substrate to the customer’s specifications. We believe that maintaining a close relationship with customers and providing them with ongoing engineering support improves customer satisfaction and will provide us with a competitive advantage in selling other substrates to our customers.
International Sales.
International sales are an important part of our business. Sales to customers outside North America (primarily the United States) accounted for 88% of our revenue in 2013, 83% of our revenue in 2012, and 80% of our revenue in 2011. The primary markets for sales of our substrate products outside of the United States are to customers located in Asia and Western Europe.
We also sell through our joint ventures raw materials including 4N, 5N, 6N, 7N and 8N gallium, boron oxide, germanium, arsenic, germanium dioxide, pyrolytic boron nitride crucibles used in crystal growth and parts for MBE (Molecular Beam Epitaxy). Our joint ventures are a key strategic benefit for us as they give us a strong competitive advantage by allowing our customers to work with one supplier for all their substrate and raw material requirements. Our joint ventures have their own separate salesforce where they also sell directly to their own customers in addition to their supply of raw materials to us.
Research and Development
To maintain and improve our competitive position, we focus our research and development efforts on designing new proprietary processes and products, improving the performance of existing products and reducing manufacturing costs. We have assembled a multi‑disciplinary team of skilled scientists, engineers and technicians to meet our research and development objectives.
Our current substrate research and development activities focus on continued development and enhancement of GaAs, InP and Ge substrates, including improved yield, enhanced surface and electrical characteristics and uniformity, greater substrate strength and increased crystal length. During 2013, we continued to focus research and development resources to reduce surface quality problems we experienced with our substrates for some customers, particularly related to surface morphology. Although some major problems related to surface quality have been resolved, we still need to continue to improve in this area and expect that this effort in research and development will continue in 2014. One of our joint ventures has been working on research and development projects to qualify for a government incentive program for reduced future tax rates in China and will continue this effort in
2014
. We focus our research and development effort to utilize more of our VGF technique to produce high-purity gallium.
Research and development expenses were $3.4 million in 2013, compared with $3.5 million in 2012 and $2.5 million in 2011. We expect our rate of expenditure on research and development costs in 2014 to remain constant with 2013 as our company and our joint ventures will continue their effort in research and development.
Competition
The semiconductor substrate industry is characterized by rapid technological change and price erosion, as well as intense foreign and domestic competition. We compete in the market for GaAs substrates with our expertise in VGF technology, product quality, response times and prices. However, we face actual and potential competition from a number of established domestic and international companies who may have advantages not available to us including substantially greater financial, technical and marketing resources; greater name recognition; and more established relationships in the industry and may utilize these advantages to expand their product offerings more quickly, adapt to new or emerging technologies and changes in customer requirements more quickly, and devote greater resources to the marketing and sale of their products.
We believe that the primary competitive factors in the markets in which our substrate products compete are:
| • | quality; |
| • | price; |
| • | performance; |
| • | capacity; |
| • | meeting customer specifications; and |
| • | customer support and satisfaction. |
Our ability to compete in target markets also depends on factors such as:
| • | the timing and success of the development and introduction of new products and product features by us and our competitors; |
| • | the availability of adequate sources of raw materials; |
| • | protection of our products by effective use of intellectual property laws; and |
| • | general economic conditions. |
A compound semiconductor substrate customer typically has two or three substrate suppliers that it has qualified for the production of its products. These qualified suppliers must meet industry‑standard specifications for quality, on-time delivery and customer support. Once a substrate supplier has qualified with a customer, price, consistent quality and current and future product delivery lead times become the most important competitive factors. A supplier that cannot meet customers’ current lead times or that a customer perceives will not be able to meet future demand and provide consistent quality can lose current market share. Our primary competition in the market for compound semiconductor substrates includes Freiberger Compound Materials, Hitachi Cable, and Sumitomo Electric Industries. We believe that at least two of our competitors are shipping high volumes of GaAs substrates manufactured using a technique similar to our VGF technique. In addition, we also face competition from compound semiconductor device manufacturers that produce substrates for their own internal use, including Hitachi, and from companies such as TriQuint Semiconductors,
RFMD and Skyworks
that are actively developing alternative compound semiconductor materials. Furthermore, silicon on insulator (SOI) technology, a semiconductor wafer technology that produces higher performing and lower power consumption devices, has been proven in the market. In the past year, SOI technology has been increasingly adopted for certain types of radio frequency (RF) applications that have historically been gallium arsenide-based.
However, we believe we are the only compound semiconductor substrate supplier to offer a full suite of raw materials and we believe that this gives us a strong competitive advantage in our marketplace.
Protection of our Intellectual Property
Our success and the competitive position of our VGF technique depend on our ability to maintain trade secrets and other intellectual property protections. We rely on a combination of patents, trademark and trade secret laws, non-disclosure agreements and other intellectual property protection methods to protect our proprietary technology. We believe that, due to the rapid pace of technological innovation in the markets for our products, our ability to establish and maintain a position of technology leadership depends as much on the skills of our research and development personnel as upon the legal protections afforded our existing technologies. To protect our trade secrets, we take certain measures to ensure their secrecy, such as executing non-disclosure agreements with our employees, customers and suppliers. However, reliance on trade secrets is only an effective business practice insofar as trade secrets remain undisclosed and a proprietary product or process is not reverse engineered or independently developed.
To date, we have been issued twenty-seven (27) patents that relate to our VGF products and processes, eight (8) in the United States (US), two (2) in Japan (JP), fourteen (14) in China (CN), one (1) in Europe (EP), one (1) in Canada (CA), and one (1) in Korea (KR), which expire in 2016 (2 US), 2017 (1 US), 2018 (1 CN), 2021 (6 CN), 2020 (4 CN), 2022 (1 US, 1 CA, 1 EP, 2 JP, 1 KR), 2027 (2 US), 2028 (1 US, 3 CN), 2030(1 US), 2032 (1 US). We have one allowed JP patent application. We have one (1) US patent application pending and eighteen (18) foreign patent applications pending in Europe (2), China (9), Japan (5) and Taiwan (2).
In the normal course of business, we periodically receive and make inquiries regarding possible patent infringement. In dealing with such inquiries, it may become necessary or useful for us to obtain or grant licenses or other rights. However, there can be no assurance that such licenses or rights will be available to us on commercially reasonable terms. If we are not able to resolve or settle claims, obtain necessary licenses on commercially reasonable terms and/or successfully prosecute or defend our position, our business, financial condition and results of operations could be materially and adversely affected.
Environmental Regulations
We are subject to federal, state and local environmental laws and regulations, including laws in China as well as in the United States. These laws, rules and regulations govern the use, storage, discharge and disposal of hazardous chemicals during manufacturing, research and development and sales demonstrations. We maintain a number of environmental, health and safety programs that are primarily preventive in nature. As part of these programs, we regularly monitor ongoing compliance. If we fail to comply with applicable regulations, we could be subject to substantial liability for clean-up efforts, personal injury and fines or suspension or cessation of our operations.
Employees
As of December 31, 2013, we had 1,255 employees, of whom 1,050 were principally engaged in manufacturing, 133 in sales and administration, and 72 in research and development. Of these employees, 23 were located in the United States and 1,232 in China.
As of December 31, 2013, 1,069 employees in China were represented by unions, but we have never experienced a work stoppage. We consider our relations with our employees to be good.
Geographical Information
Please see Note 15 of our Notes to Consolidated Financial Statements for information regarding our foreign operations, and see “Risks related to international aspects of our business” under Item 1A. Risk Factors for further information on risks attendant to our foreign operations and dependence.
Available Information
Our principal executive offices are located at 4281 Technology Drive, Fremont, CA 94538, and our main telephone number at this address is (510) 683-5900. Our Internet website address is www.axt.com. Our website address is given solely for informational purposes; we do not intend, by this reference, that our website should be deemed to be part of this Annual Report on Form 10-K or to incorporate the information available at our Internet address into this Annual Report on Form 10-K.
We file electronically with the Securities and Exchange Commission, or SEC, our annual reports on Form 10-K, quarterly reports on Form 10-Q, current reports on Form 8-K, and amendments to those reports filed or furnished pursuant to Section 13(a) or 15(d) of the Securities Exchange Act of 1934, as amended. We make these reports available free of charge through our Internet website as soon as reasonably practicable after we have electronically filed such material with the SEC. These reports can also be obtained from the SEC’s Internet website at www.sec.gov or at the SEC's Public Reference Room at 100 F Street, N.E., Washington, D.C. 20549. The public may obtain information on the operation of the Public Reference Room by calling the SEC at 1-800-SEC-0330.
For ease of reference, we have divided these risks and uncertainties into the following general categories:
| • | Risks related to our general business; |
| • | Risks related to international aspects of our business; |
| • | Risks related to our financial results and capital structure; |
| • | Risks related to our intellectual property; and |
| • | Risks related to compliance and other legal matters. |
Risks Related to Our General Business
Underutilizing our manufacturing facilities may result in declines in our gross margins.
An important factor in our success is the extent to which we are able to utilize the available capacity in our manufacturing facilities. A number of factors and circumstances may reduce utilization rates, including periods of industry overcapacity, low levels of customer orders, operating inefficiencies, mechanical failures and disruption of operations due to expansion, power interruptions, fire, flood or other natural disasters or calamities. Because many portions of our manufacturing costs are relatively fixed, high utilization rates are critical to our gross margins and operating results. If we fail to achieve acceptable manufacturing volumes or experience product shipment delays, our results of operations could be negatively affected. During periods of decreased demand, we have underutilized our manufacturing lines. If we are unable to improve utilization levels at our facilities during periods of decreased demand and correctly manage capacity, the increased expense levels will have an adverse effect on our business, financial condition and results of operations. Our gross profit margins have fluctuated from period to period, and these fluctuations are expected to continue in the future. Within the last two years, our gross profit margin has fluctuated from
34.9
% in the quarter ended
March 31
, 2012 to 15.1% for the quarter ended December 31, 2013.
In February, 2014, we announced a restructuring plan with respect to our wholly-owned subsidiary, Beijing Tongmei Xtal Technology Co, Ltd. (“Tongmei”) in order to better align demand with manufacturing capacity. Under the restructuring plan, Tongmei will implement certain workforce reductions with respect to its manufacturing facility in China. Significant risks associated with this plan that may impair our ability to achieve anticipated cost reductions or that may otherwise harm our business include delays in implementation of anticipated workforce reductions due to highly regulated local legal requirements, decreases in employee morale and the failure to meet operational targets due to the loss of employees
.
If we receive fewer customer orders than forecasted or if our customers delay or cancel orders, we may not be able to reduce our manufacturing costs in the short-term and our gross margins would be negatively affected. In addition, lead times required by our customers are shrinking which reduces our ability to forecast revenue and adjust our costs in the short-term.
Shifts in our product mix may result in declines in gross margins.
Our gross profit margins vary among our product families, and are generally higher on our larger diameter wafers. In addition, historically our gross margins have been higher on our raw materials sales. Accordingly, our overall gross margins have fluctuated from period to period as a result of shifts in product mix, the introduction of new products, decreases in average selling prices for products and our ability to reduce product costs, and these fluctuations are expected to continue in the future.
We do not control the prices at which our joint venture companies sell their raw materials products to third parties. However, as we consolidate the results of three of these companies with our own, any reduction in their gross margins could have a significant, adverse impact on our overall gross margins. One or more of our joint venture companies has in the past and may in the future sell raw materials at significantly reduced prices in order to gain volume sales, or sales to new customers. In such an event, our gross margin may be adversely impacted. In addition, one of our joint ventures has in the past been subject to capacity constraints requiring it to source product from other third party suppliers in order to meet customer demand, resulting in decreased gross margin and adversely impacting our gross margin. This joint venture may in the future continue to experience such capacity restraints, causing our gross margin, and consequently our operating results, to be adversely impacted.
The average selling prices of our products may decline over relatively short periods, which may reduce our gross margins.
The market for our products is characterized by declining average selling prices resulting from factors such as increased competition, overcapacity, the introduction of new products and decreased sales of products incorporating our products and as a result average selling prices for our products may decline over relatively short time periods. We have in the past experienced, and in the future may experience, substantial period-to-period fluctuations in operating results due to declining average selling prices. On average, we have experienced average selling price declines over the course of the past twelve months of anywhere from approximately 5% to 20% per year depending on the product. It is also possible for the pace of average selling price declines to accelerate beyond these levels for certain products in a commoditizing market. We anticipate that average selling prices will decrease in the future in response to the unstable demand environment, product introductions by competitors or us, or by other factors, including pricing pressures from significant customers. When our average selling prices decline, our gross profits decline unless we are able to sell more products or reduce the cost to manufacture our products. We generally attempt to combat average selling price declines by improving yields, manufacturing efficiency and working to reduce the costs of our raw materials and of manufacturing our products. We have in the past and may in the future experience declining sales prices, which could negatively impact our revenues, gross profits and financial results. We therefore need to sell our current products in increasing volumes to offset any decline in their average selling prices, and introduce new products, which we may not be able to do, or do on a timely basis.
We may be unable to reduce the cost of our products sufficiently to enable us to compete with others. Our cost reduction efforts may not allow us to keep pace with competitive pricing pressures and could adversely affect our margins. In order to remain competitive, we must continually reduce the cost of manufacturing our products through design and engineering changes. We cannot assure you that any changes effected by us will result in sufficient cost reductions to allow us to reduce the price of our products to remain competitive or improve our gross margins.
Ongoing financial market volatility and adverse changes in the domestic and global economic environment could have a significant adverse impact on our business, financial condition and operating results.
We are subject to the risks arising from adverse changes and uncertainty in domestic and global economies. Uncertain global economic conditions and low or negative growth in China, Europe and the United States, along with difficulties in the financial markets, national debt and fiscal concerns in various regions are posing challenges to our industry.
The possible duration and severity of this adverse economic cycle is unknown. Although we remain well-capitalized and have not suffered any liquidity issues as a result of those events, the cost and availability of funds may be adversely affected by illiquid credit markets. Continued turbulence in U.S. and international markets and economies may adversely affect our liquidity, financial condition and profitability. Another severe or prolonged economic downturn could result in a variety of risks to our business, including:
| • | increased volatility in our stock price; |
| • | increased volatility in foreign currency exchange rates; |
| • | delays in, or curtailment of, purchasing decisions by our customers or potential customers either as a result of overall economic uncertainty or as a result of their inability to access the liquidity necessary to engage in purchasing initiatives; |
| • | increased credit risk associated with our customers or potential customers, particularly those that may operate in industries most affected by the economic downturn, such as financial services; and |
| • | impairment of our intangible or other assets. |
We have experienced and expect to continue to experience delays in customer purchasing decisions or disruptions in normal volume of customer orders that we believe are in part due to the uncertainties in the global economy and an adverse impact on consumer spending. During challenging and uncertain economic times and in tight credit markets, many customers delay or reduce technology purchases. To the extent that the current economic downturn worsens or persists, or any of the above risks occur, our business and operating results could be significantly and adversely affected.
Current global economic conditions may have an impact on our business and financial condition in ways that we currently cannot predict.
Our operations and financial results depend on worldwide economic conditions and their impact on levels of business spending, which had deteriorated significantly in many countries and regions in previous years and may be depressed for the foreseeable future. Uncertainties in the financial and credit markets have caused our customers to postpone deliveries of ordered systems and placement of new orders. Continued uncertainties may reduce future sales of our products and services. The revenue growth and profitability of our business depends on the overall demand for our substrates, and we are particularly dependent on the market conditions for the wireless, solid‑state illumination, fiber optics and telecommunications industries. Because our sales are primarily to major corporate customers whose businesses fluctuate with general economic and business conditions, a softening of demand for products that use our substrates, caused by a weakening economy, may result in decreased revenue. Customers may find themselves facing excess inventory from earlier purchases, and may defer or reconsider purchasing products due to the downturn in their business and in the general economy. If market conditions deteriorate, we may experience increased collection times and greater write-offs, either of which could have a material adverse effect on our profitability and our cash flow.
In addition, the tightening of credit markets and concerns regarding the availability of credit may make it more difficult for our customers to raise capital, whether debt or equity, to finance their purchases of capital equipment, including the products we sell. Delays in our customers’ ability to obtain such financing, or the unavailability of such financing, would adversely affect our product sales and revenues and therefore harm our business and operating results. We cannot predict the timing, duration of or effect on our business of the economic slowdown or the timing or strength of any subsequent recovery.
The loss of one or more of our key substrate customers would significantly hurt our operating results.
A small number of substrate customers have historically accounted for a substantial portion of our total revenue. For the year ended December 31, 2013, IQE Group represented 8% of our revenue, compared to 17% in the year ended December 31, 2012 and 18% in 2011. Our top five customers, although not the same customers for each period, represented 31% of revenue for the year ended December 31, 2013, 37% of revenue for the year ended December 31, 2012, and 35% of revenue for the year ended December 31, 2011. We expect that a significant portion of our future revenue will continue to be derived from a limited number of substrate customers. Most of our customers are not obligated to purchase a specified quantity of our products or to provide us with binding forecasts of product purchases. In addition, our customers may reduce, delay or cancel orders at any time without any significant penalty. In the past, we have experienced slower bookings, significant push-outs and cancellation of orders from customers. If we lose a major customer or if a customer cancels, reduces or delays orders, or reduces the prices paid for our products, our revenue would decline. In addition, customers that have accounted for significant revenue in the past may not continue to generate revenue for us in any future period. Any delay in scheduled shipments of our products could cause revenue to fall below our expectations and the expectations of market analysts or investors, causing our stock price to decline.
Defects in our products could diminish demand for our products.
Our products are complex and may contain defects. We have experienced quality control problems with some of our products, which caused customers to return products to us, reduce orders for our products, or both. We believe that we continue to experience some reduction in orders as a result of our product quality problems. If we continue to experience quality control problems, or experience these or other problems in new products, customers may cancel or reduce orders or purchase products from our competitors, we may be unable to maintain or increase sales to our customers and sales of our products could decline. Defects in our products could cause us to incur higher manufacturing costs and suffer product returns and additional service expenses, all of which could adversely impact our operating results.
If new products developed by us contain defects when released, our customers may be dissatisfied and we may suffer negative publicity or customer claims against us, lose sales or experience delays in market acceptance of our new products.
If we do not successfully develop new products to respond to rapidly changing customer requirements, our ability to generate revenue, obtain new customers, and retain existing customers may suffer.
Our success depends on our ability to offer new products and product features that incorporate leading technology and respond to technological advances. In addition, our new products must meet customer needs and compete effectively on quality, price and performance. The life cycles of our products are difficult to predict because the markets for our products are characterized by rapid technological change, changing customer needs and evolving industry standards. If our competitors introduce products employing new technologies or performance characteristics, our existing products could become obsolete and unmarketable. During the past few years, we have seen our competitors selling more substrates manufactured using a crystal growth technology similar to ours, which has eroded our technological differentiation. Other companies, including TriQuint Semiconductors,
RFMD and Skyworks
are actively developing substrate materials that could be used to manufacture devices that could provide the same high-performance, low-power capabilities as GaAs-based devices at competitive prices. For examples, silicon on insulator (SOI) technology uses layered silicon-insulator-silicon substrate in place of conventional silicon substrates in semiconductor manufacturing; complementary metal-oxide-semiconductor (CMOS) technology is used for constructing
power amplifier
circuits. If these substrate materials or VGF-derived products are successfully developed and semiconductor device manufacturers adopt them, demand for our GaAs substrates could decline and our revenue could suffer.
The development of new products can be a highly complex process, and we may experience delays in developing and introducing new products. Any significant delay could cause us to fail to timely introduce and gain market acceptance of new products. Further, the costs involved in researching, developing and engineering new products could be greater than anticipated. If we fail to offer new products or product enhancements or fail to achieve higher quality products, we may not generate sufficient revenue to offset our development costs and other expenses or meet our customers’ requirements.
The cyclical nature of the semiconductor industry may limit our ability to maintain or increase net sales and operating results during industry downturns.
The semiconductor industry is highly cyclical and periodically experiences significant economic downturns characterized by diminished product demand, resulting in production overcapacity and excess inventory in the markets we serve. A downturn can result in lower unit volumes and rapid erosion of average selling prices. The semiconductor industry has experienced significant downturns, often in connection with, or in anticipation of, maturing product cycles of both semiconductor companies’ and their customers’ products or a decline in general economic conditions. This may adversely affect our results of operations and the value of our business.
Our continuing business depends in significant part upon manufacturers of electronic and opto-electronic compound semiconductor devices, as well as the current and anticipated market demand for these devices and products using these devices. As a supplier to the compound semiconductor industry, we are subject to the business cycles that characterize the industry. The timing, length and volatility of these cycles are difficult to predict. The compound semiconductor industry has historically been cyclical due to sudden changes in demand, the amount of manufacturing capacity and changes in the technology employed in compound semiconductors. The rate of changes in demand, including end demand, is high, and the effect of these changes upon us occurs quickly, exacerbating the volatility of these cycles. These changes have affected the timing and amounts of customers’ purchases and investments in new technology. These industry cycles create pressure on our revenue, gross margin and net income.
Our industry has in the past experienced periods of oversupply and is currently experiencing a period of oversupply that result in significantly reduced demand and prices for compound semiconductor devices and components, including our products, both as a result of general economic changes and overcapacity. When these periods occur and our operating results and financial condition are adversely affected, oversupply causes greater price competition and can cause our revenue, gross margins and net income to decline. Inventory buildups in telecommunications products and slower than expected sales of computer equipment resulted in overcapacity and led to reduced sales by our customers, and therefore reduced purchases of our products in 2013. During periods of weak demand such as those experienced historically, customers typically reduce purchases, delay delivery of products and/or cancel orders of component parts such as our products. In 2013, we experienced cancellations, price reductions, delays and push-outs of orders, which have resulted in reduced revenue. Further order cancellations, reductions in order size or delays in orders could occur and would materially adversely affect our business and results of operations. Actions to reduce our costs may be insufficient to align our structure with prevailing business conditions. We may be required to undertake additional cost-cutting measures, and may be unable to invest in marketing, research and development and engineering at the levels we believe are necessary to maintain our competitive position. Our failure to make these investments could seriously harm our business.
We base our planned operating expenses in part on our expectations of future revenue, and a significant portion of our expenses is relatively fixed in the short term. If revenue for a particular quarter is lower than we expect, we likely will be unable to proportionately reduce our operating expenses for that quarter, which would harm our operating results for that quarter. In 2013, we experienced significantly declining gross margins due to the allocation of fixed costs across a lower volume of sales than anticipated.
Our results of operations may suffer if we do not effectively manage our inventory.
We must manage our inventory of component parts, work-in-process and finished goods effectively to meet changing customer requirements, while keeping inventory costs down and improving gross margins. Some of our products and supplies have in the past and may in the future become obsolete while in inventory due to changing customer specifications, or become excess inventory due to decreased demand for our products and an inability to sell the inventory within a foreseeable period. Furthermore, if current costs of production increase or sales prices drop below the standard prices at which we value inventory, we may need to take a charge for a reduction in inventory values. We have in the past had to take inventory valuation and impairment charges. Any future unexpected changes in demand or increases in costs of production that cause us to take additional charges for un-saleable, obsolete or excess inventory, or to reduce inventory values, could adversely affect our results of operations.
If we have low product yields, the shipment of our products may be delayed and our operating results may be adversely impacted.
Our products are manufactured using complex technologies, and the number of usable substrates we produce can fluctuate as a result of many factors, including:
| • |
impurities in the materials used;
|
| • | contamination of the manufacturing environment; |
| • | substrate breakage; |
| • | equipment failure, power outages or variations in the manufacturing process; and |
| • | performance of personnel involved in the manufacturing process. |
If our yields decrease, our revenue could decline if we are unable to produce needed product on time. At the same time, our manufacturing costs could remain fixed, or could increase. We have experienced product shipment delays and difficulties in achieving acceptable yields on both new and older products, and delays and poor yields have adversely affected our operating results. We may experience similar problems in the future and we cannot predict when they may occur or their duration or severity. In particular, many of our manufacturing processes are new and are still being refined, which can result in lower yields.
If our manufacturing processes result in defects in our products making them unfit for use by our customers, our products would be rejected, resulting in compensation costs paid to our customers, and possible disqualification. This could lead to revenue loss and market share loss.
Intense competition in the markets for our products could prevent us from increasing revenue and sustaining profitability.
The markets for our products are intensely competitive. We face competition for our substrate products from other manufacturers of substrates, such as Freiberger Compound Materials, Hitachi Cable, Sumitomo Electric Industries
and
CCTC in China
, from semiconductor device manufacturers that produce substrates for their own use, and from companies, such as TriQuint Semiconductors,
RFMD and Skyworks
that are actively developing alternative materials to GaAs and marketing semiconductor devices using these alternative materials. We believe that at least two of our major competitors are shipping high volumes of GaAs substrates manufactured using a technique similar to our VGF technique. Other competitors may develop and begin using similar technology. If we are unable to compete effectively, our revenue may not increase and we may be unable to remain profitable. We face many competitors that have a number of significant advantages over us, including:
| • | greater experience in the business; |
| • | more manufacturing experience; |
| • | extensive intellectual property; |
| • | broader name recognition; and |
| • | significantly greater financial, technical and marketing resources. |
Our competitors could develop new or enhanced products that are more effective than our products.
The level and intensity of competition has increased over the past year and we expect competition to continue to increase in the future. Competitive pressures caused by the current economic conditions have resulted in reductions in the prices of our products, and continued or increased competition could reduce our market share, require us to further reduce the prices of our products, affect our ability to recover costs and result in reduced gross margins.
In addition, new competitors have and may continue to emerge, such as a crystal growing company established by a former employee in China that is supplying semi-conducting GaAs wafers to the LED market. Competition from sources such as this could increase, particularly if these competitors are able to obtain large capital investments.
The Chinese government has previously imposed manufacturing restrictions that, if imposed again in the future on our facilities, could materially and adversely impact our results of operations and our financial condition.
The Chinese government has in the past imposed restrictions on manufacturing facilities, such as the restrictions imposed on polluting factories for the 2008 Olympics and Paralympics, including a shut-down of transportation of materials and power plants to reduce air pollution. If, in the future, restrictions are imposed on our operations, our ability to meet customer demand or supply current or new orders would be significantly impacted. Customers could then be required to purchase product from our competitors, causing our competitors to take market share from us, and could result in our customers supplying future needs from our competitors. Restrictions on transportation of materials could limit our ability to transport our product, and could result in bottlenecks at shipping ports, limiting our ability to deliver products to our customers. During periods of such restrictions, we may increase our stock of critical materials (such as arsenic, gallium, and other chemicals) for use during the period that these restrictions are likely to last, which will increase our use of cash and increase our inventory level, such as occurred during 2008. Any of these restrictions could materially and adversely impact our results of operations and our financial condition.
Demand for our products may decrease if our customers experience difficulty manufacturing, marketing or selling their products.
Our products are used as components in our customers’ products. Accordingly, demand for our products is subject to factors affecting the ability of our customers to introduce and market their products successfully, including:
| • | the competition our customers face in their particular industries; |
| • | the technical, manufacturing, sales and marketing and management capabilities of our customers; |
| • | the financial and other resources of our customers; and |
| • | the inability of our customers to sell their products if they infringe third‑party intellectual property rights. |
If demand for the end-user applications for which our products are used decreases, or our customers are unable to develop, market and sell their products, demand for our products will decrease.
The financial condition of our customers may affect their ability to pay amounts owed to us.
Many of our customers are facing business downturns that have reduced their cash balances and their prospects. We frequently allow our customers extended payment terms after shipping products to them. Subsequent to our shipping a product, some customers have been unable to make payments when due, reducing our cash balances and causing us to incur charges to allow for a possibility that some accounts might not be paid. Customers may also be forced to file for bankruptcy. If our customers do not pay their accounts when due, we will be required to incur charges that would reduce our earnings.
We purchase critical raw materials and parts for our equipment from single or limited sources, and could lose sales if these sources fail to fill our needs.
We depend on a limited number of suppliers for certain raw materials, components and equipment used in manufacturing our products, including key materials such as quartz tubing and polishing solutions. Although several of these raw materials are purchased from suppliers in which we hold an ownership interest, we generally purchase these materials through standard purchase orders and not pursuant to long-term supply contracts, and no supplier guarantees supply of raw materials or equipment to us. If we lose any of our key suppliers, our manufacturing efforts could be significantly hampered and we could be prevented from timely producing and delivering products to our customers. Prior to investing in our raw material joint ventures, we sometimes experienced delays obtaining critical raw materials and spare parts, including gallium, due to shortages of these materials and we could experience such delays again in the future due to shortages of materials and may be unable to obtain an adequate supply of materials. These shortages and delays could result in higher materials costs and cause us to delay or reduce production of our products. If we have to delay or reduce production, we could fail to meet customer delivery schedules and our revenue and operating results could suffer.
We have made and may continue to make strategic investments in raw materials suppliers, which may not be successful and may result in the loss of all or part of our investment.
We have made investments through our joint ventures in raw material suppliers in China, which provide us with opportunities to gain supplies of key raw materials that are important to our substrate business. These affiliates each have a market beyond that provided by us. We do not have influence over all of these companies and in some we have made only a strategic, minority investment. We may not be successful in achieving the financial, technological or commercial advantage upon which any given investment is premised, and we could end up losing all or part of our investment.
Our substrate products have a long qualification cycle that makes it difficult to plan our expenses and forecast our results.
New customers typically place orders with us for our substrate products three months to a year or more after our initial contact with them. The sale of our products may be subject to delays due to our customers’ lengthy internal budgeting, approval and evaluation processes. During this time, we may incur substantial expenses and expend sales, marketing and management efforts while the customers evaluate our products. These expenditures may not result in sales of our products. If we do not achieve anticipated sales in a period as expected, we may experience an unplanned shortfall in our revenue. As a result, we may not be able to cover expenses, causing our operating results to vary. In addition, if a customer decides not to incorporate our products into its initial design, we may not have another opportunity to sell products to this customer for many months or even years. In the current competitive and economic climate, the average sales cycle for our products has lengthened even further and is expected to continue to make it difficult for us to forecast our future sales accurately. We anticipate that sales of any future substrate products will also have lengthy sales cycles and will, therefore, be subject to risks substantially similar to those inherent in the lengthy sales cycles of our current substrate products.
Problems incurred by our joint ventures or venture partners could result in a material adverse impact on our financial condition or results of operations.
We have invested in joint venture operations in China that produce products including 99.99% pure gallium (4N Ga), high purity gallium, arsenic, germanium, germanium dioxide, pyrolytic boron nitride (pBN) crucibles and boron oxide (B2O3). We purchase a portion of the materials produced by these ventures for our use and sell the remainder of their production to third parties. Our ownership interest in these entities ranges from 20% to 83%. We consolidate the joint ventures in which we have a majority or controlling financial interest and employ equity accounting for the joint ventures in which we have a smaller ownership interest. Several of these joint ventures occupy space within larger facilities owned and/or operated by one of the other venture partners. Several of these venture partners are engaged in other manufacturing activities at or near the same facility. In some facilities, we share access to certain functions, including water, hazardous waste treatment or air quality treatment. If any of our joint venture partners in any of these ventures experiences problems with its operations, disruptions of our joint venture operations could result, having a material adverse effect on the financial condition and results of operation of our joint ventures, and correspondingly on our financial condition or results of operations. For example, since gallium is a by-product of aluminum, our gallium joint venture in China, which is housed in and receives services from an affiliated aluminum plant, could generate lower production of gallium as a result of reduced by-product services provided by the aluminum plant. Accordingly, in order to meet customer supply obligations, our joint venture may have to source finished products from another independent third party supplier, resulting in reduced gross margin.
In addition, if any of our joint ventures or venture partners with which our joint ventures share facilities is deemed to have violated applicable laws, rules or regulations governing the use, storage, discharge or disposal of hazardous chemicals during manufacturing, research and development, or sales demonstrations, the operations of our joint ventures could be adversely affected and we could be subject to substantial liability for clean-up efforts, personal injury and fines or suspension or cessation of our joint venture operations as a result of the actions of the joint ventures or other venture partners. Employees working for our joint ventures or any of the other venture partners could bring litigation against us as a result of actions taken at the joint venture or venture partner facilities, even though we are not directly controlling the operations, including actions for exposure to chemicals or other hazardous materials at the facilities of our joint ventures or the facilities of any venture partner that are shared by our joint ventures. While we would expect to defend ourselves vigorously in any litigation that is brought against us, litigation is inherently uncertain and it is possible that our business, financial condition, results of operations or cash flows could be affected. Even if we are not deemed responsible for the actions of the joint ventures or venture partners, litigation could be costly, time consuming to defend and divert management attention; in addition, if we are deemed to be the most financially viable of the partners, plaintiffs may decide to pursue us for damages.
We believe that continuing to invest in additional joint ventures will be important to remaining competitive in our marketplace and ensuring a supply of critical raw materials. However, we may not be able to identify complementary joint venture opportunities or, even once opportunities are identified, we may not be able to reach agreement on the terms of the venture with the other venture partners. Additional joint ventures could cause us to incur contingent liabilities or other expenses, any of which could adversely affect our financial condition and operating results.
Since all of our joint venture activity is expected to occur in China, these activities could subject us to a number of risks associated with conducting operations internationally, including:
| • | difficulties in managing geographically disparate operations; |
| • | difficulties in enforcing agreements through non-U.S. legal systems; |
| • | unexpected changes in regulatory requirements that may limit our ability to export the venture products or sell into particular jurisdictions or impose multiple conflicting tax laws and regulations; |
| • | political and economic instability, civil unrest or war; |
| • | terrorist activities that impact international commerce; |
| • | difficulties in protecting our intellectual property rights, particularly in countries where the laws and practices do not protect proprietary rights to as great an extent as do the laws and practices of the United States; |
| • | changing laws and policies affecting economic liberalization, foreign investment, currency convertibility or exchange rates, taxation or employment; and |
| • | nationalization of foreign‑owned assets, including intellectual property. |
The effect of terrorist threats and actions on the general economy could decrease our revenue.
The United States continues to be on alert for terrorist activity. The potential near- and long-term impact terrorist activities may have in regards to our suppliers, customers and markets for our products and the U.S. economy is uncertain. There may be embargos of ports or products, or destruction of shipments or our facilities, or attacks that affect our personnel. There may be other potentially adverse effects on our operating results due to significant events that we cannot foresee. Since we perform all of our manufacturing operations in China, and a significant portion of our customers are located outside of the United States, terrorist activity or threats against U.S.‑owned enterprise are a particular concern to us.
If any of our facilities is damaged by occurrences such as fire, explosion, or natural disaster, we might not be able to manufacture our products.
The ongoing operation of our manufacturing and production facilities in China is critical to our ability to meet demand for our products. If we are not able to use all or a significant portion of our facilities for prolonged periods for any reason, we would not be able to manufacture products for our customers. For example, a fire or explosion caused by our use of combustible chemicals and high temperatures during our manufacturing processes or power interruption caused by severe weather situation could render some or all of our facilities inoperable for an indefinite period of time. Actions outside of our control, such as earthquakes or other natural disasters, could also damage our facilities, rendering them inoperable. If we are unable to operate our facilities and manufacture our products, we would lose customers and revenue and our business would be harmed.
We depend on the continuing efforts of our senior management team and other key personnel. If we lose members of our senior management team or other key personnel, or are unable to successfully retain, recruit and train qualified personnel, our ability to manufacture and sell our products could be harmed.
Our future success depends on the continuing services of members of our senior management team and other key personnel. Our industry is characterized by high demand and intense competition for talent, and the turnover rate can be high. We compete for qualified management and other personnel with other semiconductor companies. Our employees could leave our company with little or no prior notice and would be free to work for a competitor. If one or more of our senior executives or other key personnel were unable or unwilling to continue in their present positions, we may not be able to replace them easily or at all, and other senior management may be required to divert attention from other aspects of the business. The loss of any of these individuals or our ability to attract or retain qualified personnel could adversely affect our business. Raymond Low, our former Chief Financial Officer, has recently resigned and we are currently actively searching for a new Chief Financial Officer.
Risks Related to International Aspects of Our Business
Changes in tariffs, import restrictions, export restrictions Chinese regulations or other trade barriers may reduce gross margins.
We may incur increases in costs due to changes in tariffs, import or export restrictions, or other trade barriers, or unexpected changes in regulatory requirements, any of which could reduce our gross margins. For example, in July 2012, we received notice of retroactive value-added taxes (VATs) levied by the tax authorities in the PRC which applied for the period from July 1, 2011 to June 30, 2012. We expensed the retroactive VATs of approximately $1.3 million in the quarter ended June 30, 2012, which resulted in a 505 basis point decrease in our gross margins. Tax authorities in the PRC revised tax regulations and levied VAT on materials imported not forming part of the final product as foreign-owned enterprises. These VATs will continue to negatively impact our gross margins for the future quarters. Given the relatively fluid regulatory environment in the PRC, there could be additional tax or other regulatory changes in the future. Any such changes could directly and materially adversely impact our financial results and general business condition.
Our operating results depend in large part on continued customer acceptance of our substrate products manufactured in China and continued improvements in product quality.
We manufacture all of our products in China, and source most of our raw materials in China. Accordingly, we continue to seek customer qualification of our China‑manufactured products. In addition, we have in the past experienced quality problems with our China‑manufactured products. Our previous quality problems caused us to lose market share to our competitors, as some customers reduced their orders from us until our surface quality was as good and consistent as that offered by competitors and customers allocated their requirements for compound semiconductor substrates across more of our competitors. If we are unable to continue to achieve customer qualifications for our products, or if continue to experience quality problems, customers may not increase purchases of our products, our China facility will become underutilized, and we will be unable to achieve expected revenue growth. In addition, in early 2012, we entered into an arrangement to establish a second manufacturing facility in China, which if completed will further our reliance on Chinese manufacturing facilities. We may again lose sales of our products to competitors and experience loss of market share. If we are unable to recover and retain our market share, we may be unable to grow our business.
We derive a significant portion of our revenue from international sales, and our ability to sustain and increase our international sales involves significant risks.
Our revenue growth depends in part on the expansion of our international sales and operations. International sales represented 88%, 83% and 80% our total revenue for the years ended December 31, 2013, 2012 and 2011, respectively. We expect that sales to customers outside the United States, particularly sales to customers in Asia, will continue to represent a significant portion of our revenue.
Currently, a significant percentage of our sales is to customers headquartered in Asia. All of our manufacturing facilities and some of our suppliers are also located outside the U.S. Managing our overseas operations presents challenges, including periodic regional economic downturns, trade balance issues, varying business conditions and demands, political instability, variations in enforcement of intellectual property and contract rights in different jurisdictions, differences in the ability to develop relationships with suppliers and other local businesses, changes in U.S. and international laws and regulations including U.S. export restrictions, fluctuations in interest and currency exchange rates, the ability to provide sufficient levels of technical support in different locations, cultural differences, shipping delays and terrorist acts or acts of war, among other risks. Many of these challenges are present in China, which represents a large potential market for semiconductor devices and where we anticipate significant opportunity for growth. Global uncertainties with respect to: (i) economic growth rates in various countries; (ii) sustainability of demand for electronics products; (iii) capital spending by semiconductor manufacturers; (iv) price weakness for certain semiconductor devices; and (v) political instability in regions where we have operations may also affect our business, financial condition and results of operations.
Our dependence on international sales involves a number of risks, including:
| • | changes in tariffs, import restrictions, export restrictions, or other trade barriers; |
| • | unexpected changes in regulatory requirements; |
| • | longer periods to collect accounts receivable; |
| • | changes in export license requirements; |
| • | political and economic instability; |
| • | unexpected changes in diplomatic and trade relationships; and |
| • | foreign exchange rate fluctuations. |
Our sales are denominated in U.S. dollars, except for sales to our Japanese customers which are denominated in Japanese yen. Thus, increases in the value of the U.S. dollar could increase the price of our products in non-U.S. markets and make our products more expensive than competitors’ products in these markets.
Also, denominating some sales in Japanese yen subjects us to fluctuations in the exchange rates between the U.S. dollar and the Japanese yen. The functional currency of our Chinese subsidiary and joint ventures is the local currency. We incur transaction gains or losses resulting from consolidation of expenses incurred in local currencies for these entities, as well as in translation of the assets and liabilities of their assets at each balance sheet date. If we do not effectively manage the risks associated with international sales, our revenue, cash flows and financial condition could be adversely affected.
Changes in China’s political, social and economic environment may affect our financial performance.
Our financial performance may be affected by changes in China’s political, social and economic environment. The role of the Chinese central and local governments in the Chinese economy is significant. Chinese policies toward economic liberalization, and laws and policies affecting technology companies, foreign investment, currency exchange rates and other matters could change, resulting in greater restrictions on our ability to do business and operate our manufacturing facilities in China. Any imposition of surcharges or any increase in Chinese tax rates or reduction or elimination of Chinese tax benefits could hurt our operating results. The Chinese government could revoke, terminate or suspend our license for national security and similar reasons without compensation to us. If the Chinese government were to take any of these actions, we would be prevented from conducting all or part of our business. Any failure on our part to comply with governmental regulations could result in the loss of our ability to manufacture our products in China.
If there are power shortages in the PRC, we may have to temporarily close our China operations, which would adversely impact our ability to manufacture our products and meet customer orders, and would result in reduced revenue.
In the past, the Chinese government has faced a power shortage resulting in power demand outstripping supply in peak periods. Instability in electrical supply in past years has caused sporadic outages among residential and commercial consumers causing the Chinese government to implement tough measures to ease the energy shortage. If further problems with power shortages occur in the future, we are required to make temporary closures of our subsidiary and joint venture operations, we may be unable to manufacture our products, and would then be unable to meet customer orders except from inventory on hand. As a result, our revenue could be adversely impacted, and our relationships with our customers could suffer, impacting our ability to generate future revenue. In addition, if power is shut off at our Beijing subsidiary at any time, either voluntarily or as a result of unplanned brownouts, during certain phases of our manufacturing process including our crystal growth phase, the work in process may be ruined and rendered unusable, causing us to incur expense that will not be covered by revenue, and negatively impacting our cost of revenue and gross margins.
An outbreak of contagious disease such as Severe Acute Respiratory Syndrome (SARS) or the Avian Flu may adversely impact our manufacturing operations and some of our key suppliers and customers.
Any reoccurrence of SARS or an outbreak of a contagious disease, such as Avian Flu, may cause us to temporarily close our manufacturing operations. Similarly, if one or more of our key suppliers is required to close for an extended period, we might not have enough raw material inventories to continue manufacturing operations. In addition, while we possess management skills among our China staff that enable us to maintain our manufacturing operations with minimal on-site supervision from our U.S.‑based staff, our business could also be harmed if travel to or from Asia and the United States is restricted or inadvisable. If our manufacturing operations were closed for a significant period, we could lose revenue and market share, which would depress our financial performance and could be difficult to recapture. Finally, if one of our key customers is required to close for an extended period, we might not be able to ship product to them, our revenue would decline and our financial performance would suffer.
Risks Related to Our Financial Results and Capital Structure
If we fail to manage periodic contractions, we may utilize our cash balances, resulting in the decline of our existing cash, cash equivalents and investment balances.
We anticipate that our existing cash resources will fund our operations and purchases of capital equipment, as well as provide adequate working capital for the next twelve months. However, our liquidity is affected by many factors including, among others, the extent to which we pursue additional capital expenditures, the level of our production, and other factors related to the uncertainties of the industry and global economies. If we fail to manage our contractions successfully we may draw down our cash reserves, which would adversely affect our operating results and financial condition, reduce our value and possibly impinge our ability to raise debt and equity funding in the future, at a time when we might be required to raise additional cash. Accordingly, there can be no assurance that events in the future will not require us to seek additional capital or, if required, that such capital would be available on terms acceptable to us, if at all. As part of our effort to reduce costs, we may lose key staff, production resources and technology that we will need to replenish when end markets recover. These events could reduce our ability to grow profitably as markets recover.
If we are not able to fund our capital commitments to expand our facilities in China, our business and operating results may be adversely affected.
We and one of our joint ventures
have agreed
to invest up to approximately $17.5 million in capital projects at our China facilities, including a manufacturing facility in Tianjin, in the future to expand our manufacturing capabilities to optimize the utilization of our resources. If we are unable to fund these projects due to an unexpected decrease in our cash reserves or an inability to raise additional funds, our business and operating results may be materially adversely impacted.
Unpredictable fluctuations in our operating results could disappoint analysts or our investors, which could cause our stock price to decline.
We have experienced and may continue to experience significant fluctuations in our revenue and earnings. Our quarterly and annual revenue and operating results have varied significantly in the past and may vary significantly in the future due to a number of factors, including:
| • | our ability to develop, manufacture and deliver high quality products in a timely and cost-effective manner; |
| • | decline in general economic conditions or downturns in the industry in which we compete; |
| • | fluctuations in demand for our products; |
| • | expansion of our manufacturing capacity; |
| • | expansion of our operations in China; |
| • | limited availability and increased cost of raw materials; |
| • | the volume and timing of orders from our customers, and cancellations, push-outs and delays of customer orders once made; |
| • | fluctuation of our manufacturing yields; |
| • | decreases in the prices of our or our competitors’ products; |
| • | costs incurred in connection with any future acquisitions of businesses or technologies; and |
| • | increases in our expenses, including expenses for research and development. |
Due to these factors, we believe that period-to-period comparisons of our operating results may not be meaningful indicators of our future performance.
A substantial percentage of our operating expenses are fixed in the short term, and we may be unable to adjust spending to compensate for an unexpected shortfall in revenue. As a result, any delay in generating revenue could cause our operating results to be below the expectations of market analysts or investors, which could also cause our stock price to fall.
If our operating results and financial performance do not meet the guidance that we have provided to the public, our stock price may decline.
We provide public guidance on our expected operating and financial results for future periods. Although we believe that this guidance provides our stockholders, investors and analysts with a better understanding of our expectations for the future, such guidance is comprised of forward-looking statements subject to the risks and uncertainties described in this report and in our other public filings and public statements. Our actual results may not meet the guidance we have provided. If our operating or financial results do not meet our guidance or the expectations of investment analysts, our stock price may decline.
We have adopted certain anti-takeover measures that may make it more difficult for a third party to acquire us.
Our board of directors has the authority to issue up to 2,000,000 shares of preferred stock and to determine the price, rights, preferences and privileges of those shares without any further vote or action by the stockholders. The rights of the holders of common stock will be subject to, and may be adversely affected by, the rights of the holders of any preferred stock that may be issued in the future. The issuance of shares of preferred stock could have the effect of making it more difficult for a third party to acquire a majority of our outstanding voting stock. We have no present intention to issue additional shares of preferred stock.
Provisions in our amended and restated certificate of incorporation and amended and restated bylaws may have the effect of delaying or preventing a merger, acquisition or change of control, or changes in our management, which could adversely affect the market price of our common stock. The following are some examples of these provisions:
| • | the division of our board of directors into three separate classes, each with three-year terms; |
| • | the right of our board to elect a director to fill a space created by a board vacancy or the expansion of the board; |
| • | the ability of our board to alter our amended and restated bylaws; and |
| • | the requirement that only our board or the holders of at least 10% of our outstanding shares may call a special meeting of our stockholders. |
Furthermore, because we are incorporated in Delaware, we are subject to the provisions of Section 203 of the Delaware General Corporation Law. These provisions prohibit us from engaging in any business combination with any interested stockholder (a stockholder who owns 15% or more of our outstanding voting stock) for a period of three years following the time that such stockholder became an interested stockholder, unless:
| • | 66 2 / 3 % of the shares of voting stock not owned by the interested stockholder approve the merger or combination, or |
| • | the board of directors approves the merger or combination or the transaction which resulted in the stockholder becoming an interested stockholder. |
Our common stock may be delisted from The Nasdaq Global Select Market, which could negatively impact the price of our common stock and our ability to access the capital markets.
Our common stock is listed on The Nasdaq Global Select Market. The bid price of our common stock has in the past closed below the $1.00 minimum per share bid price required for continued inclusion on The Nasdaq Global Select Market under Marketplace Rule 5450(a). If the bid price of our common stock remains below $1.00 per share for thirty consecutive business days, we could be subject to delisting from the Nasdaq Global Select Market.
Any delisting from The Nasdaq Global Select Market could have an adverse effect on our business and on the trading of our common stock. If a delisting of our common stock were to occur, our common stock would trade on the OTC Bulletin Board or on the “pink sheets” maintained by the National Quotation Bureau, Inc. Such alternatives are generally considered to be less efficient markets, and our stock price, as well as the liquidity of our common stock, may be adversely impacted as a result. Delisting from The Nasdaq Global Select Market could also have other negative results, including the potential loss of confidence by suppliers and employees, the loss of institutional investor interest and fewer business development opportunities, as well as the loss of liquidity for our stockholders.
Risks Related to Our Intellectual Property
Intellectual property infringement claims may be costly to resolve and could divert management attention.
Other companies may hold or obtain patents on inventions or may otherwise claim proprietary rights to technology necessary to our business. The markets in which we compete are comprised of competitors that in some cases hold substantial patent portfolios covering aspects of products that could be similar to ours. We could become subject to claims that we are infringing patent, trademark, copyright or other proprietary rights of others. For example, we have in the past been involved in lawsuits alleging patent infringement, and could in the future be involved in similar litigation.
If we are unable to protect our intellectual property, we may lose valuable assets or incur costly litigation.
We rely on a combination of patents, copyrights, trademark and trade secret laws, non-disclosure agreements and other intellectual property protection methods to protect our proprietary technology. However, we believe that, due to the rapid pace of technological innovation in the markets for our products, our ability to establish and maintain a position of technology leadership also depends on the skills of our development personnel. Despite our efforts to protect our intellectual property, third parties can develop products or processes similar to ours. Our means of protecting our proprietary rights may not be adequate, and our competitors may independently develop similar technology, duplicate our products or design around our patents. We believe that at least two of our competitors have begun to ship GaAs substrates produced using a process similar to our VGF technique. Our competitors may also develop and patent improvements to the VGF technology upon which we rely, and thus may limit any exclusivity we enjoy by virtue of our patents or trade secrets.
It is possible that pending or future United States or foreign patent applications made by us will not be approved, that our issued patents will not protect our intellectual property, or that third parties will challenge our ownership rights or the validity of our patents. In addition, the laws of some foreign countries may not protect our proprietary rights to as great an extent as do the laws of the United States and it may be more difficult to monitor the use of our intellectual property. Our competitors may be able to legitimately ascertain non-patented proprietary technology embedded in our systems. If this occurs, we may not be able to prevent the development of technology substantially similar to ours.
We may have to resort to costly litigation to enforce our intellectual property rights, to protect our trade secrets or know-how or to determine their scope, validity or enforceability. Enforcing or defending our proprietary technology is expensive, could cause us to divert resources and may not prove successful. Our protective measures may prove inadequate to protect our proprietary rights, and if we fail to enforce or protect our rights, we could lose valuable assets.
Risks Related to Compliance and Other Legal Matters
We need to continue to improve or implement our systems, procedures and controls.
The shift of our manufacturing operations to China and growth of our business has placed and continues to place a significant strain on our operations and management resources. We have upgraded our inventory control systems, but continue to rely on certain manual processes in our operations and in connection with consolidation of our financial results. If we fail to manage a transition from manual processes to automated processes effectively, our operations may be disrupted.
To manage our business effectively, we may need to implement additional and improved management information systems, further develop our operating, administrative, financial and accounting systems and controls, add experienced senior level managers, and maintain close coordination among our executive, engineering, accounting, marketing, sales and operations organizations.
We are subject to internal control evaluations and attestation requirements of Section 404 of the Sarbanes‑Oxley Act.
Pursuant to Section 404 of the Sarbanes‑Oxley Act of 2002, we must include in our Annual Report on Form 10-K a report of management on the effectiveness of our internal control over financial reporting. Ongoing compliance with this requirement is complex, costly and time-consuming. If: (1) we fail to maintain effective internal control over financial reporting; or (2) our management does not timely assess the adequacy of such internal control, we could be subject to regulatory sanctions and the public’s perception of us may be adversely impacted.
If we fail to comply with environmental and safety regulations, we may be subject to significant fines or forced to cease our operations; in addition, we could be subject to suits for personal injuries caused by hazardous materials.
We are subject to federal, state and local environmental and safety laws and regulations in all of our operating locations, including laws and regulations of China, such as laws and regulations related to the development, manufacture and use of our products, the operation of our facilities, and the use of our real property. These laws and regulations govern the use, storage, discharge and disposal of hazardous chemicals during manufacturing, research and development, and sales demonstrations. If we fail to comply with applicable regulations, we could be subject to substantial liability for clean-up efforts, personal injury and fines or suspension or be forced to cease our operations, and/or suspend or terminate the development, manufacture or use of certain of our products, the use of our facilities, or the use of our real property, each of which could have a material adverse effect on our business, financial condition and results of operations.
A complaint was previously filed against us and two current officers, alleging personal injury, general negligence, intentional tort, wage loss and other damages, including punitive damages, as a result of exposure of plaintiffs to high levels of gallium arsenide in gallium arsenide wafers, and methanol. Other current and/or former employees could bring litigation against us in the future. Although we have put in place engineering, administrative and personnel protective equipment programs to address these issues, our ability to expand or continue to operate our present locations could be restricted or we could be required to acquire costly remediation equipment or incur other significant expenses if we were found liable for failure to comply with environmental and safety regulations. Existing or future changes in laws or regulations in the United States and China may require us to incur significant expenditures or liabilities, or may restrict our operations. In addition, our employees could be exposed to chemicals or other hazardous materials at our facilities and we may be subject to lawsuits seeking damages for wrongful death or personal injuries allegedly caused by exposure to chemicals or hazardous materials at our facilities.
Litigation is inherently uncertain and while we would expect to defend ourselves vigorously, it is possible that our business, financial condition, results of operations or cash flows could be affected in any particular period by litigation pending and any additional litigation brought against us. In addition, future litigation could divert management’s attention from our business and operations, causing our business and financial results to suffer. We could incur defense or settlement costs in excess of the insurance covering these litigation matters, or that could result in significant judgments against us or cause us to incur costly settlements, in excess of our insurance limits.
None.
Our principal properties as of February 28, 2014 are as follows:
|
Location
|
Square
Feet |
Principal Use
|
Ownership
|
||||
|
Fremont, CA
|
20,767
|
Administration
|
Operating lease, expires November 2015
|
||||
|
Beijing, China
|
33,000
|
Production
|
Owned
|
||||
|
Beijing, China
|
34,000
|
Production
|
Owned
|
||||
|
Beijing, China
|
48,000
|
Production
|
Owned
|
||||
|
Beijing, China
|
22,000
|
Production and Administration
|
Owned
|
||||
|
Beijing, China
|
53,000
|
Production
|
Owned
|
||||
|
Xianxi, China
|
56,500
|
Production
|
Owned by Beijing Ji Ya Semiconductor Material, Co., Ltd.*
|
||||
|
Xianxi, China
|
7,500
|
Administration
|
Owned by Beijing Ji Ya Semiconductor Material, Co., Ltd.*
|
||||
|
Beijing, China
|
2,000
|
Administration
|
Operating lease by Beijing Ji Ya Semiconductor Material, Co., Ltd., expires February 2014
|
||||
|
Nanjing, China
|
22,000
|
Production
|
Owned by Nanjing Jin Mei Gallium Co., Ltd.*
|
||||
|
Nanjing, China
|
5,700
|
R&D and Administration
|
Owned by Nanjing Jin Mei Gallium Co., Ltd.*
|
||||
|
Nanjing, China
|
3,900
|
Production
|
Owned by Nanjing Jin Mei Gallium Co., Ltd.*
|
||||
|
Beijing, China
|
14,720
|
Production
|
Owned by Bo Yu Semiconductor Vessel Craftwork Technology Co., Ltd.
|
||||
| Beijing, China |
7,600
|
Production and
Administration
|
Operating leases by Bo Yu Semiconductor Vessel Craftwork Technology Co., Ltd., expire in various terms until June 2014
|
||||
| * | Joint ventures in which we hold an interest and consolidate in our financial statements. We hold a 46% interest in Beijing Ji Ya Semiconductor Material Co., Ltd., a 83% interest in Nanjing Jin Mei Gallium Co., Ltd., and a 70% interest in Beijing BoYu Semiconductor Vessel Craftwork Technology Co., Ltd. |
We consider each facility to be in good operating condition and adequate for its present use, and believe that each facility has sufficient plant capacity to meet its current and anticipated operating requirements.
From time to time we may be involved in judicial or administrative proceedings concerning matters arising in the ordinary course of business. We do not expect that any of these matters, individually or in the aggregate, will have a material adverse effect on our business, financial condition, cash flows or results of operation.
Not applicable.
PART II
Item 5.
Market for Registrant’s Common Equity, Related Stockholder Matters and Issuer Purchases of Equity Securities
Our common stock has been trading publicly on the NASDAQ Global Market (NASDAQ) under the symbol “AXTI” since May 20, 1998, the date we consummated our initial public offering, and beginning on January 3, 2011, our common stock began trading on the NASDAQ Global Select Market under the same symbol. The following table sets forth the range of high and low sales prices of the common stock for the periods indicated, as reported by NASDAQ.
|
|
High
|
Low
|
||||||
|
2013
|
|
|
||||||
|
First Quarter
|
$
|
3.43
|
$
|
2.73
|
||||
|
Second Quarter
|
$
|
3.04
|
$
|
2.50
|
||||
|
Third Quarter
|
$
|
2.86
|
$
|
2.27
|
||||
|
Fourth Quarter
|
$
|
2.64
|
$
|
2.10
|
||||
|
2012
|
||||||||
|
First Quarter
|
$
|
6.84
|
$
|
4.25
|
||||
|
Second Quarter
|
$
|
6.53
|
$
|
3.55
|
||||
|
Third Quarter
|
$
|
4.14
|
$
|
2.75
|
||||
|
Fourth Quarter
|
$
|
3.55
|
$
|
2.60
|
||||
As of March 3, 2014, there were 76 holders of record of our common stock. Because many shares of AXT’s common stock are held by brokers and other institutions on behalf of stockholders, we are unable to estimate the total number of beneficial owners of our common stock.
We have never paid or declared any cash dividends on our common stock and do not anticipate paying cash dividends in the foreseeable future. Dividends accrue on our outstanding Series A preferred stock at the rate of $0.20 per annum per share of Series A preferred stock. The 883,000 shares of $0.001 par value Series A preferred stock issued and outstanding as of both December 31, 2013 and 2012 are valued at $3,532,000 and are non-voting and non-convertible preferred stock with a 5.0% cumulative annual dividend rate payable when declared by our board of directors, and $4 per share liquidation preference over common stock, and must be paid before any distribution is made to common stockholders. These preferred shares were issued to Lyte Optronics, Inc. stockholders in connection with the completion of our acquisition of Lyte Optronics, Inc. on May 28, 1999.
Issuer Purchases of Equity Securities
On February 21, 2013, our Board of Directors approved a stock repurchase program pursuant to which we may repurchase up to $6.0 million of our outstanding common stock through February 27, 2014. These purchases can be made from time to time in the open market and are funded from our existing cash balances and cash generated from operations. During 2013, we repurchased approximately 285,000 shares at an average price of $2.52 per share for a total purchase price of $716,000 under the stock repurchase program.
During
three months
ended December 31, 2013, we repurchased the following shares of our common stock:
|
Period
|
Total Number
of Shares Purchased |
Average Price
Paid Per Share |
Total Number of
Shares Purchased as Part of a Publicly Announced Plan or Program(1) |
Approximate
Dollar Value of Shares That May Yet Be Purchased Under the Plan or Program |
||||||||||||
|
Oct. 1, 2013 through Oct. 31, 2013
|
—
|
—
|
—
|
$
|
5,712,809
|
|||||||||||
|
Nov. 1, 2013 through Nov. 30, 2013
|
182,106
|
2.36
|
182,106
|
5,283,245
|
||||||||||||
|
Dec. 1, 2013 through Dec. 31, 2013
|
—
|
—
|
—
|
5,283,245
|
||||||||||||
|
Total
|
182,106
|
2.36
|
182,106
|
$
|
5,283,245
|
|||||||||||
During the year ended December 31, 2012, we did not repurchase any shares of our common stock. During the year ended December 31, 2013, we repurchased the following shares of our common stock:
| (1) |
Pursuant to a Plan publicly announced on February 25, 2013, in accordance with Rule 10b-18 of the Securities Exchange Act of 1934 to provide for the repurchase of up to $6 million of the Company’s common stock. Repurchases were made from time to time in the open market during the twelve-month period ended February 27, 2014, at prevailing market prices. Repurchases were made under the program using the Company’s own cash resources. As of December 31, 2013, we had 32,604,958 shares of common stock outstanding and 284,878
shares
were repurchased in 2013 under this program.
|
Comparison of Stockholder Return
Set forth below is a line graph comparing the annual percentage change in the cumulative total return to the stockholders of the Company on our common stock with the CRSP Total Return Index for the Nasdaq Stock Market (U.S. Companies) and the Nasdaq Electronic Components Index for the period commencing December 31, 2008 and ending December 31, 2013.
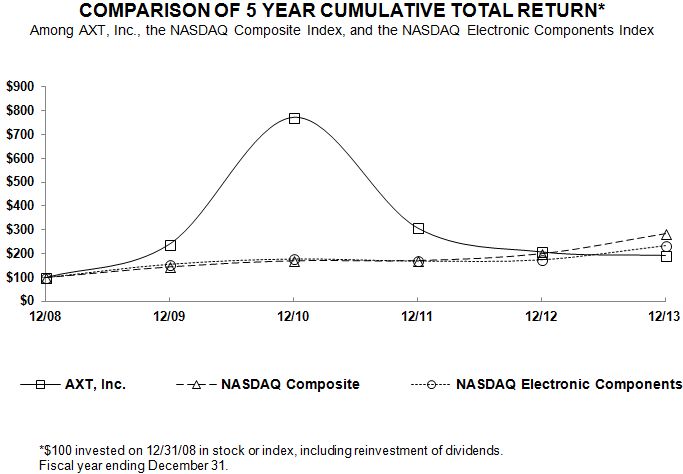
|
|
12/08
|
12/09
|
12/10
|
12/11
|
12/12
|
12/13
|
||||||||||||||||||
|
AXT, Inc.
|
$
|
100.00
|
$
|
240.74
|
$
|
773.33
|
$
|
308.89
|
$
|
208.15
|
$
|
193.33
|
||||||||||||
|
NASDAQ Composite
|
$
|
100.00
|
$
|
144.88
|
$
|
170.58
|
$
|
171.30
|
$
|
199.99
|
$
|
283.39
|
||||||||||||
|
NASDAQ Electronic Components
|
$
|
100.00
|
$
|
156.84
|
$
|
178.93
|
$
|
170.31
|
$
|
175.62
|
$
|
235.40
|
The following selected consolidated financial data is derived from and should be read in conjunction with our consolidated financial statements and related notes set forth in Item 8 below, and in our previously filed reports on Form 10-K. See also Item 7. “Management’s Discussion and Analysis of Financial Condition and Results of Operations” for further information relating to items reflecting our results of operations and financial condition.
|
|
Years Ended December 31,
|
|||||||||||||||||||
|
|
2013
|
2012
|
2011
|
2010
|
2009
|
|||||||||||||||
|
|
(in thousands, except per share data)
|
|||||||||||||||||||
|
Statements of Operations Data:
|
|
|
|
|
|
|||||||||||||||
|
Revenue
|
$
|
85,335
|
$
|
88,374
|
$
|
104,121
|
$
|
95,493
|
$
|
55,364
|
||||||||||
|
Cost of revenue
|
73,507
|
63,522
|
59,339
|
58,998
|
41,495
|
|||||||||||||||
|
Gross profit
|
11,828
|
24,852
|
44,782
|
36,495
|
13,869
|
|||||||||||||||
|
Operating expenses:
|
||||||||||||||||||||
|
Selling, general, and administrative
|
16,066
|
15,419
|
14,836
|
13,972
|
13,389
|
|||||||||||||||
|
Research and development
|
3,424
|
3,468
|
2,473
|
2,339
|
1,569
|
|||||||||||||||
|
Restructuring charge
|
—
|
—
|
—
|
—
|
507
|
|||||||||||||||
|
Total operating expenses
|
19,490
|
18,887
|
17,309
|
16,311
|
15,465
|
|||||||||||||||
|
Income (loss) from operations
|
(7,662
|
)
|
5,965
|
27,473
|
20,184
|
(1,596
|
)
|
|||||||||||||
|
Interest income, net
|
408
|
518
|
449
|
53
|
177
|
|||||||||||||||
|
Equity in earnings of unconsolidated joint ventures
|
1,377
|
1,281
|
741
|
259
|
484
|
|||||||||||||||
|
Other income (expense), net
|
(748
|
)
|
(761
|
)
|
(45
|
)
|
2,203
|
(99
|
)
|
|||||||||||
|
Income (loss) before provision for income taxes
|
(6,625
|
)
|
7,003
|
28,618
|
22,699
|
(1,034
|
)
|
|||||||||||||
|
Provision for (benefit from) income taxes
|
188
|
853
|
2,795
|
2,323
|
471
|
|||||||||||||||
|
Net income (loss)
|
(6,813
|
)
|
6,150
|
25,823
|
20,376
|
(1,505
|
)
|
|||||||||||||
|
Less: Net income attributable to noncontrolling interest
|
1,145
|
3,040
|
5,503
|
1,723
|
393
|
|||||||||||||||
|
Net income (loss) attributable to AXT, Inc.
|
$
|
(7,958
|
)
|
$
|
3,110
|
$
|
20,320
|
$
|
18,653
|
$
|
(1,898
|
)
|
||||||||
|
Net income (loss) attributable to AXT, Inc. per common share:
|
||||||||||||||||||||
|
Basic
|
$
|
(0.25
|
)
|
$
|
0.09
|
$
|
0.63
|
$
|
0.60
|
$
|
(0.07
|
)
|
||||||||
|
Diluted
|
$
|
(0.25
|
)
|
$
|
0.09
|
$
|
0.61
|
$
|
0.57
|
$
|
(0.07
|
)
|
||||||||
|
Shares used in per share calculations:
|
||||||||||||||||||||
|
Basic
|
32,700
|
32,144
|
31,872
|
31,008
|
30,500
|
|||||||||||||||
|
Diluted
|
32,700
|
32,865
|
33,061
|
32,512
|
30,500
|
|||||||||||||||
|
|
December 31,
|
|||||||||||||||||||
|
|
2013
|
2012
|
2011
|
2010
|
2009
|
|||||||||||||||
|
|
(in thousands)
|
|||||||||||||||||||
|
Balance Sheet Data:
|
||||||||||||||||||||
|
Cash and cash equivalents
|
$
|
24,961
|
$
|
30,634
|
$
|
26,156
|
$
|
23,724
|
$
|
16,934
|
||||||||||
|
Investments
|
22,644
|
19,461
|
14,486
|
17,251
|
18,469
|
|||||||||||||||
|
Working capital
|
84,114
|
93,376
|
92,220
|
82,116
|
70,681
|
|||||||||||||||
|
Total assets
|
163,822
|
167,589
|
162,488
|
140,251
|
107,946
|
|||||||||||||||
|
Long-term debt, net of current portion
|
—
|
—
|
—
|
—
|
420
|
|||||||||||||||
|
Stockholders’ equity
|
145,546
|
150,914
|
147,049
|
119,804
|
97,251
|
|||||||||||||||
In addition to historical information, the following discussion contains forward‑looking statements that are subject to risks and uncertainties. Actual results may differ substantially from those referred to herein due to a number of factors, including but not limited to risks described in the section entitled Item 1A. “Risk Factors” and elsewhere in this Annual Report. This discussion should be read in conjunction with Item 6. “Selected Consolidated Financial Data” and our consolidated financial statements and related notes included elsewhere in this Form 10-K.
Critical Accounting Policies and Estimates
We prepare our consolidated financial statements in accordance with accounting principles generally accepted in the United States of America. Accordingly, we make estimates, assumptions and judgments that affect the amounts reported on our consolidated financial statements. These estimates, assumptions and judgments about future events and their effects on our results cannot be determined with certainty, and are made based upon our historical experience and on other assumptions that are believed to be reasonable under the circumstances. These estimates may change as new events occur or additional information is obtained, and we may periodically be faced with uncertainties, the outcomes of which are not within our control and may not be known for a prolonged period of time.
We have identified the policies below as critical to our business operations and understanding of our financial condition and results of operations. Critical accounting policies are material to the presentation of our consolidated financial statements and require us to make difficult, subjective or complex judgments that could have a material effect on our financial condition and results of operations. They may require us to make assumptions about matters that are highly uncertain at the time of the estimate, and different estimates that we could have used, or changes in the estimate that are reasonably likely to occur, may have a material impact on our financial condition or results of operations. We also refer you to Note 1 to our consolidated financial statements included elsewhere in this Form 10-K.
Revenue Recognition
We manufacture and sell high-performance compound semiconductor substrates and sell certain raw materials including gallium, germanium dioxide, and pBN crucibles. After we ship our products, there are no remaining obligations or customer acceptance requirements that would preclude revenue recognition. Our products are typically sold pursuant to a purchase order placed by our customers, and our terms and conditions of sale do not require customer acceptance. We recognize revenue upon shipment and transfer of title of products to our customers, which is either upon shipment from our dock, receipt at the customer’s dock, or removal from consignment inventory at the customer’s location, provided that we have received a signed purchase order, the price is fixed or determinable, title and risk of ownership have transferred, collection of resulting receivables is probable, and product returns are reasonably estimable. We do not provide training, installation or commissioning services.
We provide for future returns based on historical experience, current economic trends and changes in customer demand at the time revenue is recognized.
Accounts Receivable and Allowance for Doubtful Accounts
We periodically review the likelihood of collection on our accounts receivable balances and provide an allowance for doubtful accounts receivable primarily based upon the age of these accounts. We evaluate receivables from U.S. customers with an emphasis on balances in excess of 90 days and for receivables from customers located outside the U.S. with an emphasis on balances in excess of 120 days and reserve allowance on the receivable balances if needed. The reason for the difference in the evaluation of receivables between foreign and U.S. customers is that U.S. customers have historically made payments in a shorter period of time than foreign customers. Foreign business practices generally require
us
to allow customer payment terms that are longer than those accepted in the United States. We assess the probability of collection based on a number of factors, including the length of time a receivable balance has been outstanding, our past history with the customer and their creditworthiness.
As of December 31, 2013 and December 31, 2012, our accounts receivable, net, balance was $14.9 million and $17.9 million, respectively, which was net of an allowance for doubtful accounts of $869,000 and zero, respectively. During 2013 we increased our allowance for doubtful accounts by $869,000 because of the poor financial condition of a few customers in China. During 2011, we decreased our allowance for doubtful accounts by $99,000 compared to the amount as of December 31, 2010 primarily for improved collections worldwide. If actual uncollectible accounts differ substantially from our estimates, revisions to the estimated allowance for doubtful accounts would be required, which could have a material impact on our financial results for the future periods.
The allowance for sales returns is also deducted from gross accounts receivable. During 2013, we utilized $189,000 and charged an additional $130,000 resulting in the allowance for sales returns of $186,000 as of December 31, 2013. During 2012, we utilized $426,000 and reserved an additional $547,000 resulting in the allowance for sales returns of $245,000 as of December 31, 2012. During 2011, we utilized $144,000 and reduced allowance of $194,000
from the beginning balance of $462,000
resulting in the allowance for sales returns of $124,000 as of December 31, 2011.
Warranty Reserve
We maintain a warranty reserve based upon our claims experience during the prior twelve months. Warranty costs are accrued at the time revenue is recognized. As of December 31, 2013 and 2012, accrued product warranties totaled $1.0 million and $588,000, respectively. The increase in accrued product warranties is primarily attributable to increased claims for quality issues experienced by some customers. If actual warranty costs differ substantially from our estimates, revisions to the estimated warranty liability would be required, which could have a material impact on our financial condition and results of operations for future periods.
Inventory Valuation
Inventories are stated at the lower of cost or market. Cost is determined using the weighted average cost method. Our inventory consists of raw materials as well as finished goods and work-in-process that include material, labor and manufacturing overhead costs. Given the nature of our substrate products, and the materials used in the manufacturing process, the wafers and ingots comprising work-in-process may be held in inventory for up to two years and three years, respectively, as the risk of obsolescence for these materials is low. We routinely evaluate the levels of our inventory in light of current market conditions in order to identify excess and obsolete inventory, and we provide a valuation allowance for certain inventories based upon the age and quality of the product and the projections for sale of the completed products. As of December 31, 2013 and 2012, we had an inventory reserve of $11.0 million and $10.1 million, respectively, for excess and obsolete inventory. If actual demand for our products were to be substantially lower than estimated, additional inventory adjustments for excess or obsolete inventory might be required, which could have a material impact on our business, financial condition and results of operations.
Impairment of Investments
We classify our investments in debt and equity securities as available-for-sale securities in accordance with ASC topic 320,
Investments—Debt and Equity Securities
(“ASC 320”). All available-for-sale securities with a quoted market value below cost (or adjusted cost) are reviewed in order to determine whether the decline is other-than-temporary. Factors considered in determining whether a loss is temporary include the magnitude of the decline in market value, the length of time the market value has been below cost (or adjusted cost), credit quality, and our ability and intent to hold the securities for a period of time sufficient to allow for any anticipated recovery in market value.
We invest in equity instruments of privately-held companies in China for business and strategic purposes. These investments are classified as other assets and are accounted for under the cost method as we do not have the ability to exercise significant influence over their operations. We monitor our investments for impairment and record reductions in carrying value when events or changes in circumstances indicate that the carrying value may not be recoverable. Determination of impairment is highly subjective and is based on a number of factors, including an assessment of the strength of investee’s management, the length of time and extent to which the fair value has been less than our cost basis, the financial condition and near-term prospects of the investee, fundamental changes to the business prospects of the investee, share prices of subsequent offerings, and our intent and ability to hold the investment for a period of time sufficient to allow for any anticipated recovery in our carrying value. We had no write‑downs in 2013, 2012 and 2011.
Fair Value of Investments
ASC topic 820,
Fair Value Measurement
(“ASC 820”) establishes three levels of inputs that may be used to measure fair value.
Level 1 instruments represent quoted prices in active markets. Therefore, determining fair value for Level 1 instruments does not require significant management judgment, and the estimation is not difficult.
Level 2 instruments include observable inputs other than Level 1 prices, such as quoted prices for identical instruments in markets with insufficient volume or infrequent transactions (less active markets), issuer credit ratings, non-binding market consensus prices that can be corroborated with observable market data, model-derived valuations in which all significant inputs are observable or can be derived principally from or corroborated with observable market data for substantially the full term of the assets or liabilities, or quoted prices for similar assets or liabilities. These Level 2 instruments require more management judgment and subjectivity compared to Level 1 instruments, including:
| · | Determining which instruments are most similar to the instrument being priced requires management to identify a sample of similar securities based on the coupon rates, maturity, issuer, credit rating, and instrument type, and subjectively select an individual security or multiple securities that are deemed most similar to the security being priced. |
| · | Determining which model-derived valuations to use in determining fair value requires management judgment. When observable market prices for identical securities or similar securities are not available, we price our marketable debt instruments using non-binding market consensus prices that are corroborated with observable market data or pricing models, such as discounted cash flow models, with all significant inputs derived from or corroborated with observable market data. |
Level 3 instruments include unobservable inputs to the valuation methodology that are significant to the measurement of fair value of assets or liabilities. The determination of fair value for Level 3 instruments requires the most management judgment and subjectivity. As of December 31, 2013 and 2012, we did not have any assets or liabilities without observable market values that would require a high level of judgment to determine fair value (Level 3 assets).
Impairment of Long-Lived Assets
We evaluate the recoverability of property, equipment and intangible assets in accordance with ASC topic 360,
Property, Plant and Equipment
(“ASC 360”). When events and circumstances indicate that long-lived assets may be impaired, we compare the carrying value of the long-lived assets to the projection of future undiscounted cash flows attributable to such assets. In the event that the carrying value exceeds the future undiscounted cash flows, we record an impairment charge against income equal to the excess of the carrying value over the asset’s fair value. Fair values are determined based on quoted market values, discounted cash flows or internal and external appraisals, as applicable. Assets held for sale are carried at the lower of carrying value or estimated net realizable value. We had no “Assets held for sale” on the consolidated balance sheet as of December 31, 2013 and 2012.
Stock Based Compensation
We account for stock-based compensation in accordance with ASC topic 718,
Stock-based Compensation
(“ASC 718”). Share-based awards granted include stock options and restricted stock awards. We utilize the Black‑Scholes option pricing model to estimate the grant date fair value of stock options, which requires the input of highly subjective assumptions, including estimating stock price volatility and expected term. Historical volatility was used while the expected term for our options was estimated based on historical option exercise behavior and post-vesting forfeitures of options, and the contractual term, the vesting period and the expected term of the outstanding options. Further, we apply an expected forfeiture rate in determining the amount of share-based compensation. We use historical forfeitures to estimate the future forfeitures rates. Changes in these inputs and assumptions can materially affect the measure of estimated fair value of our stock compensation. The cost of restricted stock awards is determined using the fair value of our common stock on the date of grant.
We recognize the compensation costs net of an estimated forfeiture rate over the requisite service period of the options award, which is generally the vesting term of four years. Compensation expense for restricted stock awards is recognized over the vesting period, which is generally three years or four years. Stock-based compensation expense is recorded in cost of revenue, research and development, and selling, general and administrative expenses. (see Note 1—Summary of Significant Accounting Policies—Stock‑Based Compensation).
Income Taxes
We account for income taxes in accordance with ASC topic 740,
Income Taxes
(“ASC 740”) which requires that deferred tax assets and liabilities be recognized using enacted tax rates for the effect of temporary differences between the book and tax bases of recorded assets and liabilities. ASC 740 also requires that deferred tax assets be reduced by a valuation allowance if it is more likely than not that a portion of the deferred tax asset will not be realized.
We provide for income taxes based upon the geographic composition of worldwide earnings and tax regulations governing each region, particularly China. The calculation of tax liabilities involves significant judgment in estimating the impact of uncertainties in the application of complex tax laws, particularly in foreign countries such as China.
See Note 13—”Income Taxes” in the consolidated financial statements for additional information.
Results of Operations
Overview
We were founded in 1986 to commercialize and enhance our proprietary vertical gradient freeze (VGF) technique for producing high-performance compound semiconductor substrates. We have one operating segment: our substrate business, with limited additional raw materials sales. We recorded our first substrate sales in 1990 and our substrate division currently sells gallium arsenide (GaAs), indium phosphide (InP) and germanium (Ge) substrates to manufacturers of semiconductor devices for use in applications such as fiber optic and wireless telecommunications, light emitting diodes (LEDs), lasers and for solar cells for space and terrestrial photovoltaic applications. We also sell raw materials including gallium and germanium through our participation in majority‑ and minority‑owned joint ventures.
Operating Results
We manufacture all of our semiconductor substrates using our proprietary vertical gradient freeze (VGF) technology. Most of our revenue is from sales of GaAs substrates. We manufacture all of our products in the People’s Republic of China (PRC or China), which generally has favorable costs for facilities and labor compared to comparable facilities in the United States or Europe. We also have joint ventures in China that provide us reliable supply and shorter lead-times for raw materials central to our final manufactured products.
Our business and operating results depend in significant part upon capital expenditures of semiconductor designers and manufacturers, which in turn depend upon the current and anticipated market demand for products incorporating semiconductors from these designers and manufacturers. Our business also depends in part on worldwide economic conditions. During 2013, we experienced some fluctuation in the customer demand for the semi-insulating GaAs substrates that are used for end-products in the wireless market and the semi-conducting GaAs substrate used in the light emitting diode (LED) market. We believe consolidation within the base of customers for our products was likely the reason for slower qualifications for our business, but may create more opportunities in the future. The increased adoption of SOI technology also impacted the overall industry.
Ge substrate revenue increased primarily due to more planned satellite launches in 2013 compared to 2012 and from increased demand from concentrated photovoltaic applications for solar terrestrial cells. We expect Ge substrate revenue to increase in the future as we are seeing increased demand from concentrated photovoltaic applications for solar terrestrial cells; however, we expect Ge raw material cost remains high in 2014
.
Revenue from InP substrates increased as the demand from customers in the optical networking industry increased. Our raw materials revenue decreased primarily due to decreased selling prices of raw gallium.
As we move into 2014, we expect that the demand for GaAs products will be continually driven by the proliferation of smart phones and tablets. These devices, which enable full performance of video, gaming and Internet browsing capabilities, are driving increases in wireless subscribers in major geographic areas around the world as well as an upgrade cycle for new devices. We expect the demand for semi-conducting GaAs substrates in the LED market will increase; however, we need to penetrate into a few key accounts in order to capture more market share. We also expect Ge substrates sales will improve in 2014 as there is increasing interest in the replacement of fossil fuel resources with sustainable alternatives such as solar power and solar modules and a renewed interest in renewable energy technology, particularly in Europe and China. At the same time, we believe that improvements in conversion efficiency for Ge has been occurring, which we believe will continue to enable this technology to become more affordable and therefore, more widely utilized, in the future. We also expect InP substrate sales, which currently represents a smaller portion of revenue, will increase due to growing demand in the optical networking industry. For raw materials sales, we believe the selling price of gallium has slowed its decline and we expect this will favorably affect our raw material revenue in 2014.
Revenue
|
|
|
|
|
2012 to 2013
|
2011 to 2012
|
|||||||||||||||||||||||
|
|
Years Ended Dec. 31,
|
Increase
|
|
Increase
|
|
|||||||||||||||||||||||
|
|
2013
|
2012
|
2011
|
(Decrease)
|
% Change
|
(Decrease)
|
% Change
|
|||||||||||||||||||||
|
($ in thousands, except percentages)
|
|
|
|
|
|
|
|
|||||||||||||||||||||
|
GaAs
|
$
|
40,234
|
$
|
51,368
|
$
|
63,697
|
$
|
(11,134
|
)
|
(21.7
|
)%
|
$
|
(12,329
|
)
|
(19.4
|
)%
|
||||||||||||
|
InP
|
7,128
|
6,024
|
5,182
|
1,104
|
18.3
|
%
|
842
|
16.2
|
%
|
|||||||||||||||||||
|
Ge
|
16,962
|
8,734
|
11,635
|
8,228
|
94.2
|
%
|
(2,901
|
)
|
(24.9
|
)%
|
||||||||||||||||||
|
Raw Materials and other
|
21,011
|
22,248
|
23,607
|
(1,237
|
)
|
(5.6
|
)%
|
(1,359
|
)
|
(5.8
|
)%
|
|||||||||||||||||
|
Total revenue
|
$
|
85,335
|
$
|
88,374
|
$
|
104,121
|
$
|
(3,039
|
)
|
(3.4
|
)%
|
$
|
(15,747
|
)
|
(15.1
|
)%
|
||||||||||||
Revenue decreased by $3.0 million or 3.4%, to $85.3 million in 2013 from $88.4 million in 2012. Total GaAs substrate revenue decreased $11.1 million, or 21.7%, to $40.2 million in 2013 from $51.3 million in 2012. The decrease in revenue was primarily due to the softer demand from our current customer base in the LED market and reduced orders from a few big customers as demand fell in the wireless market compared to 2012.
Sales of 2 inch, 3 inch and 4 inch diameter GaAs substrates, which are mainly used in LED applications, decreased by $6.6 million to $27.7 million in 2013 compared to $34.3 million in 2012 primarily due to weaker demand from our current customers in LED applications in all geographic regions.
Sales of 5 inch and 6 inch diameter GaAs substrates, which are mainly used in wireless devices, decreased by $4.5 million to $12.6 million in 2013 compared to $17.0 million in 2012 primarily due to reduced orders from a few big customers as demand fell in the wireless market.
Revenue decreased by $15.7 million or 15.1%, to $88.4 million in 2012 from $104.1 million in 2011. Total GaAs substrate revenue decreased $12.3 million, or 19.4%, to $51.4 million in 2012 from $63.7 million in 2011. The decrease in revenue was primarily due to the softer demand from our customer base in both the LED market and wireless devices market compared to 2011.
Sales of 2 inch, 3 inch and 4 inch diameter GaAs substrates, decreased by $8.7 million to $34.3 million in 2012 compared to $43.0 million in 2011 primarily due to weaker demand from our customers in LED applications in all geographic regions except Taiwan which was particularly strong in the first half of 2012.
Sales of 5 inch and 6 inch diameter GaAs substrates decreased by $3.7 million to $17.0 million in 2012 compared to $20.7 million in 2011 primarily due to lower demand for semi-insulating GaAs substrate from our customers in the wireless devices market compared to prior year.
InP substrate revenue increased by $1.1 million, or 18.3%, to $7.1 million in 2013 compared to $6.0 million in 2012 as demand from customers in the optical networking industry increased. We continued and expect to see renewed demand for these substrates as investment in high-speed optical communications continue to increase worldwide in 2014. InP substrate revenue increased by $842,000, or 16.2%, to $6.0 million in 2012 compared to $5.2 million in 2011 as demand from customers in the optical networking industry increased.
Ge substrate revenue increased by $8.2 million, or 94.2%, to $17.0 million in 2013 from $8.7 million in 2012. Our Ge substrate revenue increased primarily due to more planned satellite launches in 2013 compared 2012 and from increased demand from concentrated photovoltaic applications for solar terrestrial cells. Ge substrate revenue decreased by $2.9 million, or 24.9%, to $8.7 million in 2012 from $11.6 million in 2011 due to fewer planned satellite launches in 2012 particularly in Asia.
Raw materials and other revenue decreased by $1.2 million, or 5.6%, to $21.0 million in 2013 from $22.2 million in 2012 primarily due to decreased selling prices which was partially offset by increased tonnage sold, as well as by increased revenue from pyrolytic boron nitride (pBN) crucibles due to increased demand. Raw materials and other revenue decreased by $1.4 million, or 5.8%, to $22.2 million in 2012 from $23.6 million in 2011 primarily due to decreased selling prices which was partially offset by increased tonnage sold, as well as by increased revenue from pyrolytic boron nitride (pBN) crucibles due to increased demand.
Although our raw materials revenue decreased
in 2013
due to decreased selling prices, it remains an important part of our business, as it provides us protection against raw materials pricing increases and supply constraints. Since we are able to supply raw materials necessary for the production of our substrates at favorable prices, our ability to sell such materials in the open market, at market prices, also provides us with pricing protection. We expect to continue to expand our raw materials sales efforts
Revenue by Geographic Region
|
|
|
2012 to 2013
|
2011 to 2012
|
|||||||||||||||||||||||||
|
|
Years Ended Dec. 31,
|
Increase
|
|
Increase
|
|
|||||||||||||||||||||||
|
|
2013
|
2012
|
2011
|
(Decrease)
|
% Change
|
(Decrease)
|
% Change
|
|||||||||||||||||||||
|
($ in thousands, except percentages)
|
|
|
|
|
|
|
|
|||||||||||||||||||||
|
North America*
|
$
|
10,665
|
$
|
15,391
|
$
|
20,471
|
$
|
(4,726
|
)
|
(30.7
|
)%
|
$
|
(5,080
|
)
|
(24.8
|
)%
|
||||||||||||
|
% of total revenue
|
12
|
%
|
17
|
%
|
20
|
%
|
||||||||||||||||||||||
|
Europe
|
21,387
|
18,170
|
21,082
|
3,217
|
17.7
|
%
|
(2,912
|
)
|
(13.8
|
)%
|
||||||||||||||||||
|
% of total revenue
|
25
|
%
|
21
|
%
|
20
|
%
|
||||||||||||||||||||||
|
Japan
|
9,041
|
9,346
|
13,749
|
(305
|
)
|
(3.3
|
)%
|
(4,403
|
)
|
(32.0
|
)%
|
|||||||||||||||||
|
% of total revenue
|
11
|
%
|
11
|
%
|
13
|
%
|
||||||||||||||||||||||
|
Taiwan
|
10,131
|
10,985
|
9,813
|
(854
|
)
|
(7.8
|
)%
|
1,172
|
11.9
|
%
|
||||||||||||||||||
|
% of total revenue
|
12
|
%
|
12
|
%
|
9
|
%
|
||||||||||||||||||||||
|
China
|
24,946
|
19,815
|
25,181
|
5,131
|
25.9
|
%
|
(5,366
|
)
|
(21.3
|
%)
|
||||||||||||||||||
|
% of total revenue
|
29
|
%
|
22
|
%
|
24
|
%
|
||||||||||||||||||||||
|
Asia Pacific (excluding China, Japan and Taiwan)
|
9,165
|
14,667
|
13,825
|
(5,502
|
)
|
(37.5
|
)%
|
842
|
6.1
|
%
|
||||||||||||||||||
|
% of total revenue
|
11
|
%
|
17
|
%
|
14
|
%
|
||||||||||||||||||||||
|
Total revenue
|
$
|
85,335
|
$
|
88,374
|
$
|
104,121
|
$
|
(3,039
|
)
|
(3.4
|
)%
|
$
|
(15,747
|
)
|
(15.1
|
)%
|
||||||||||||
| * | Primarily the United States. |
Sales to customers located outside of North America represented approximately 88%, 83%, and 80% of our revenue during 2013, 2012 and 2011, respectively.
Revenue from customers located in North America decreased by $4.7 million, or 30.7%, to $10.7 million in 2013 from $15.4 million in 2012. This decrease in 2013 was primarily due to decreased demand for raw materials primarily from 4N raw gallium and decreased demand for GaAs substrates, reflecting the slower demand in the wireless market, which is partially offset by increased demand for InP substrates used in the optical networking industry. Revenue from customers located in North America decreased by $5.1 million, or 24.8%, to $15.4 million in 2012 from $20.5 million in 2011. This decrease in 2012 was primarily due to decreased sales of GaAs substrates partially offset by increased sales of 4N raw gallium.
Revenue from customers located in Europe increased by $3.2 million, or 17.7%, to $21.4 million in 2013 from $18.2 million in 2012. This increase in 2013 was primarily due to increased sales of Ge substrates and raw material sales to customers in Germany, partially offset by decreased demand for GaAs substrates from customers in Germany. Revenue from customers located in Europe decreased by $2.9 million, or 13.8%, to $18.2 million in 2012 from $21.1 million in 2011. This decrease in 2012 was primarily due to decreased sales of GaAs substrates to customers in Germany and United Kingdom, decreased raw material sales to customers in Germany and Slovakia, partially offset by increased substrates sales to customers in France.
Revenue from customers located in Japan decreased by $305,000, or 3.3%, to $9.0 million in 2013 from $9.3 million in 2012. This decrease in 2013 was primarily due to decreased sales of GaAs substrates and 4N raw gallium, offset by increased sales from pyrolytic boron nitride (pBN) crucibles. Revenue from customers located in Japan decreased by $4.4 million, or 32.0%, to $9.3 million in 2012 from $13.7 million in 2011. This decrease in 2012 was primarily due to decreased sales of GaAs substrates and 4N raw gallium.
Revenue from customers in Taiwan decreased by $854,000, or 7.8%, to $10.1 million in 2013 from $11.0 million in 2012. This decrease in 2013 was primarily due to decreased sales of semi-conducting GaAs substrates, partially offset by increased sales of semi-insulating GaAs substrates to a major customer. Revenue from customers in Taiwan increased by $1.2 million, or 11.9%, to $11.0 million in 2012 from $9.8 million in 2011. This increase in 2012 was primarily due to increased sales of semi-conducting GaAs substrates and InP substrates, partially offset by decreased sales of semi-insulating GaAs substrates to a major customer.
Revenue from customers in China increased by $5.1 million, or 25.9%, to $25.0 million in 2013 from $19.8 million in 2012. This increase in 2013 was contributed by increased sales from all of our products in China and the most noticeable increase came from Ge substrate sales. Revenue from customers in China decreased by $5.4 million, or 21.3%, to $19.8 million in 2012 from $25.2 million in 2011. This decrease in 2012 was primarily due to decreased sales of 4N raw gallium, Ge substrates and semi-conducting GaAs substrates.
Revenue from customers in the Asia Pacific region (excluding China, Japan and Taiwan) decreased by $5.5 million, or 37.5%, to $9.2 million in 2013 from $14.7 million in 2012. This decrease in 2013 was primarily due to decreased sales of semi-insulating GaAs substrates to customers in Singapore, partially offset by increased sales of Ge substrates to customers in Malaysia. Revenue from customers in the Asia Pacific region (excluding China, Japan and Taiwan) increased by $842,000, or 6.1%, to $14.7 million in 2012 from $13.8 million in 2011. This increase in 2012 was primarily due to increased sales of semi-insulating GaAs substrates, partially offset by decreased sales of semi-conducting to customers in Singapore.
Gross Margin
|
|
|
2012 to 2013
|
2011 to 2012
|
|||||||||||||||||||||||||
|
|
Years Ended Dec. 31,
|
Increase
|
|
Increase
|
|
|||||||||||||||||||||||
|
|
2013
|
2012
|
2011
|
(Decrease)
|
% Change
|
(Decrease)
|
% Change
|
|||||||||||||||||||||
|
($ in thousands, except percentages)
|
|
|||||||||||||||||||||||||||
|
Gross profit
|
$
|
11,828
|
$
|
24,852
|
$
|
44,782
|
$
|
(13,024
|
)
|
(52.4
|
)%
|
$
|
(19,930
|
)
|
(44.5
|
)%
|
||||||||||||
|
Gross Margin %
|
13.9
|
%
|
28.1
|
%
|
43.0
|
%
|
||||||||||||||||||||||
Gross margin decreased to 13.9% of total revenue in 2013 from 28.1% of total revenue in 2012. Lower revenue and lower average selling prices due to product mix and customer mix negatively impacted the gross margins for GaAs substrates for 2013. Although Ge substrate sales increased by $8.2 million, gross margins for Ge substrate was decreased due to higher priced raw material in our inventory and lower average selling prices in 2013. Gross margins for raw material sales also decreased due to decreased selling prices of 4N raw gallium compared to
2012
. The 2013 quarter gross margin for the first quarter to the fourth quarter of 15.6%,
13.5
%, 11.9% and 15.1%, respectively, also reflects the impact of lower rate of absorption of manufacturing overhead across lower production volume compared to last year.
Gross margin decreased to 28.1% of total revenue in 2012 from 43.0% of total revenue in 2011. Approximately $1.3 million, or 1.5% of total revenue for the year of 2012 was expensed for supplemental and retroactive VATs levied by the tax authorities in China which was applicable for the period from July 1, 2011 to June 30, 2012. In addition, higher priced raw material in our inventory and lower average selling prices due to product mix and customer mix also negatively impacted the gross margins for all substrates for 2012. Gross margins for raw material sales also decreased due to decreased selling prices of 4N raw gallium compared to 2
011
. The 2012 quarterly trend of gross margin for the first quarter to the fourth quarter of 34.9%, 29.8%, 26.3% and 19.5%, respectively, also reflects the impact of lower rate of absorption of manufacturing overhead across lower production volume compared to the prior year.
Selling, General and Administrative Expenses
|
|
|
2012 to 2013
|
2011 to 2012
|
|||||||||||||||||||||||||
|
|
Years Ended Dec. 31,
|
Increase
|
|
Increase
|
|
|||||||||||||||||||||||
|
|
2013
|
2012
|
2011
|
(Decrease)
|
% Change
|
(Decrease)
|
% Change
|
|||||||||||||||||||||
|
($ in thousands, except percentages)
|
|
|||||||||||||||||||||||||||
|
Selling, general and administrative expenses
|
$
|
16,066
|
$
|
15,419
|
$
|
14,836
|
$
|
647
|
4.2
|
%
|
$
|
583
|
3.9
|
%
|
||||||||||||||
|
% of total revenue
|
18.8
|
%
|
17.4
|
%
|
14.2
|
%
|
||||||||||||||||||||||
Selling, general and administrative expenses increased $647,000 to $16.1 million for 2013 compared to $15.4 million for 2012. This increase in 2013 was primarily due to an increase in bad debt expense and higher rent expense primarily from early termination penalty of our
lease for our
U.S.
office
, partially offset by decreased sales commission expenses resulting from lower revenue and lower office supply expenses. We expect our selling, general administrative expenses may decrease in the future due to the implementation of our restructuring plan in our manufacturing facility in China in 2014.
Selling, general and administrative expenses increased $583,000 to $15.4 million for 2012 compared to $14.8 million for 2011. This increase in 2012 was primarily due to higher personnel related costs including salaries and retirement benefits for employees in our joint ventures, higher stock-based compensation expenses resulting from the new options and awards granted in 2011 and 2012, absence of bad debt reversal credit recorded in 2011, partially offset by lower bonus from unfavorable financial results and lower sales commission expenses from lower commissionable substrates sales.
Research and Development Expenses
|
|
|
2012 to 2013
|
2011 to 2012
|
|||||||||||||||||||||||||
|
|
Years Ended Dec. 31,
|
Increase
|
|
Increase
|
|
|||||||||||||||||||||||
|
|
2013
|
2012
|
2011
|
(Decrease)
|
% Change
|
(Decrease)
|
% Change
|
|||||||||||||||||||||
|
($ in thousands, except percentages)
|
|
|||||||||||||||||||||||||||
|
Research and development expenses
|
$
|
3,424
|
$
|
3,468
|
$
|
2,473
|
$
|
(44
|
)
|
(1.3
|
)%
|
$
|
995
|
40.2
|
%
|
|||||||||||||
|
% of total revenue
|
4.0
|
%
|
3.9
|
%
|
2.4
|
%
|
||||||||||||||||||||||
Research and development expenses decreased $44,000, or 1.3%, to $3.4 million for 2013 from $3.5 million for 2012. Research and development expenses decreased slightly primarily due to lower
personnel
related costs including the fact that no bonuses were paid due to lack of achievement of financial metrics and lower product
development
and testing costs, partially offset by higher consulting expenses for product testing. We expect our rate of expenditures on research and development costs in 2014 to be stable as our joint ventures continue to maintain their efforts in research and development.
Research and development expenses increased $995,000, or 40.2%, to $3.5 million for 2012 from $2.5 million for 2011. This increase in 2012 was primarily due to higher personnel related costs including salaries and bonuses and higher stock-based compensation expenses mainly related to the hiring of a Chief Scientist in March 2012, higher product testing costs and higher health insurance cost.
Interest Income, Net
|
|
|
2012 to 2013
|
2011 to 2012
|
|||||||||||||||||||||||||
|
|
Years Ended Dec. 31,
|
Increase
|
|
Increase
|
|
|||||||||||||||||||||||
|
|
2013
|
2012
|
2011
|
(Decrease)
|
% Change
|
(Decrease)
|
% Change
|
|||||||||||||||||||||
|
($ in thousands, except percentages)
|
|
|||||||||||||||||||||||||||
|
Interest income, net
|
$
|
408
|
$
|
518
|
$
|
449
|
$
|
(110
|
)
|
(21.2
|
)%
|
$
|
69
|
15.4
|
%
|
|||||||||||||
|
% of total revenue
|
0.5
|
%
|
0.6
|
%
|
0.4
|
%
|
||||||||||||||||||||||
Interest income, net decreased $110,000 to $408,000 for 2013 from $518,000 for 2012 primarily due to lower returns from various investment portfolio mix,
lower investment balances
and lower interest income earned by our consolidated joint ventures from their bank.
Interest income, net increased $69,000 to $518,000 for 2012 from $449,000 for 2011 primarily due to higher interest income earned by our consolidated joint ventures from their bank deposits and interest income on loan from one of our consolidated joint ventures to its equity investment entity.
Equity in Earnings of Unconsolidated Joint Ventures
|
|
|
2012 to 2013
|
2011 to 2012
|
|||||||||||||||||||||||||
|
|
Years Ended Dec. 31,
|
Increase
|
|
Increase
|
|
|||||||||||||||||||||||
|
|
2013
|
2012
|
2011
|
(Decrease)
|
% Change
|
(Decrease)
|
% Change
|
|||||||||||||||||||||
|
($ in thousands, except percentages)
|
|
|||||||||||||||||||||||||||
|
Equity in earnings of unconsolidated joint ventures
|
$
|
1,377
|
$
|
1,281
|
$
|
741
|
$
|
96
|
7.5
|
%
|
$
|
540
|
72.9
|
%
|
||||||||||||||
|
% of total revenue
|
1.6
|
%
|
1.5
|
%
|
0.7
|
%
|
||||||||||||||||||||||
Equity in earnings of unconsolidated joint ventures is primarily net income from our minority-owned joint ventures that are not consolidated. Equity in earnings of unconsolidated joint ventures increased $96,000 to $1.4 million for 2013 from $1.3 million for 2012 primarily due to higher net income recorded by our consolidated joint ventures from their minority investments.
Equity in earnings of unconsolidated joint ventures increased $540,000 to $1.3 million for 2012 from $741,000 for 2011 primarily due to higher net income recorded by our consolidated joint ventures from their new minority investments.
Other Income (Expense), Net
|
|
|
2012 to 2013
|
2011 to 2012
|
|||||||||||||||||||||||||
|
|
Years Ended Dec. 31,
|
Increase
|
|
Increase
|
|
|||||||||||||||||||||||
|
|
2013
|
2012
|
2011
|
(Decrease)
|
% Change
|
(Decrease)
|
% Change
|
|||||||||||||||||||||
|
($ in thousands, except percentages)
|
|
|||||||||||||||||||||||||||
|
Other income (expense), net
|
$
|
(748
|
)
|
$
|
(761
|
)
|
$
|
(45
|
)
|
$
|
13
|
1.7
|
%
|
$
|
(716
|
)
|
(1,591.1
|
)%
|
||||||||||
|
% of total revenue
|
(0.9
|
)%
|
(0.9
|
)%
|
(0.0
|
)%
|
||||||||||||||||||||||
Other expense, net decreased $13,000 to $748,000 for 2013 from $761,000 for 2012 primarily due to the gain recognized from the sale of our 35% ownership in our cost method investee in its pre-IPO placement in Taiwan, the absence of loss on disposal of equipment from the same period in the prior year,
partially
offset by higher foreign exchange losses
in 2013.
Other expense, net increased $716,000 to $761,000 for 2012 from $45,000 for 2011 primarily due to higher net foreign exchange transaction losses mainly on our Yen denominated accounts receivable, higher withholding tax on foreign dividends from our consolidated joint ventures and higher losses on disposal of equipment.
Noncontrolling Interest
|
|
|
2012 to 2013
|
2011 to 2012
|
|||||||||||||||||||||||||
|
|
Years Ended Dec. 31,
|
Increase
|
|
Increase
|
|
|||||||||||||||||||||||
|
|
2013
|
2012
|
2011
|
(Decrease)
|
% Change
|
(Decrease)
|
% Change
|
|||||||||||||||||||||
|
($ in thousands, except percentages)
|
|
|||||||||||||||||||||||||||
|
Noncontrolling interest
|
$
|
1,145
|
$
|
3,040
|
$
|
5,503
|
$
|
(1,895
|
)
|
(62.3
|
)%
|
$
|
(2,463
|
)
|
(44.8
|
)%
|
||||||||||||
|
% of total revenue
|
1.3
|
%
|
3.4
|
%
|
5.3
|
%
|
||||||||||||||||||||||
Noncontrolling interest in earnings of consolidated joint ventures for the years ended December 31, 2013, 2012 and 2011 were $1.1 million, $3.0 million, and $5.5 million, respectively. The decrease in
noncontrolling interes
t from 2012 to 2013 and 2011 to 2012 was due to lower profitability from our China joint venture operations as profits from raw materials sales have decreased due to decreased selling prices.
Provision for Income Taxes
|
|
|
2012 to 2013
|
2011 to 2012
|
|||||||||||||||||||||||||
|
|
Years Ended Dec. 31,
|
Increase
|
|
Increase
|
|
|||||||||||||||||||||||
|
|
2013
|
2012
|
2011
|
(Decrease)
|
% Change
|
(Decrease)
|
% Change
|
|||||||||||||||||||||
|
($ in thousands, except percentages)
|
|
|||||||||||||||||||||||||||
|
Provision for income taxes
|
$
|
188
|
$
|
853
|
$
|
2,795
|
$
|
(665
|
)
|
(78.0
|
)%
|
$
|
(1,942
|
)
|
(69.5
|
)%
|
||||||||||||
|
% of total revenue
|
0.2
|
%
|
1.0
|
%
|
2.7
|
%
|
||||||||||||||||||||||
Provision for income taxes for 2013 was $188,000, which was mostly related to our China subsidiary and our China joint venture operations. The decrease in provision for income taxes from 2012 to 2013 was due to decreased net income of our foreign subsidiaries as well as lower taxable income for state tax purposes in the U.S. Furthermore, the provision for income taxes was partially offset by tax refunds received by our China joint ventures. Besides the state tax liabilities, no income taxes
or benefit
have been provided for U.S. operations due to
the
l
oss in the U.S. and the uncertainty of generating future profit in the U.S. which has resulted in our deferred tax asset being fully reserved
. Our estimated tax rate can vary greatly from year to year because of the change or benefit in the mix of taxable income between our U.S. and China based operations.
Provision for income taxes for 2012 was $853,000, which was mostly related to our China subsidiary and our China joint venture operations. The decrease in provision for income taxes from 2011 to 2012 was due to decreased sales and net income of our foreign subsidiaries as well as lower taxable income for state tax purposes in the U.S. Furthermore, the provision for income taxes was partially offset by tax refunds received for state income taxes in the U.S. and received by our China joint ventures. Besides the state taxes liabilities, no income taxes
or benefit
have been provided for U.S. operations due to
the loss in U.S. and the uncertainty of generating future profit in the U.S. which has resulted in our deferred tax asset being fully reserved
.
Provision for income taxes for 2011 was $2.8 million, which was mostly related to our foreign subsidiaries. The increase in provision for income taxes from 2010 to 2011 was due to increased net income of our foreign subsidiaries as well as higher taxable income for state tax purposes in the U.S. Besides the state tax liabilities, no income taxes have been provided for U.S. operations due to
the use of
available federal net operating loss carryforwards.
Due to our uncertainty regarding our future profitability, we recorded a full valuation allowance against our net deferred tax assets of $58 million in 2013, $51 million in 2012 and $49.6 million in 2011.
Liquidity and Capital Resources
|
|
Years Ended December 31,
|
|||||||||||
|
|
2013
|
2012
|
2011
|
|||||||||
|
|
($ in thousands)
|
|||||||||||
|
Net cash provided by (used in):
|
|
|
|
|||||||||
|
Operating activities
|
$
|
2.509
|
$
|
21,302
|
$
|
18,132
|
||||||
|
Investing activities
|
(6,212
|
)
|
(13,168
|
)
|
(15,430
|
)
|
||||||
|
Financing activities
|
(2,513
|
)
|
(3,792
|
)
|
(999
|
)
|
||||||
|
Effect of exchange rate changes
|
543
|
136
|
729
|
|||||||||
|
Net change in cash and cash equivalents
|
(5,673
|
)
|
4,478
|
2,432
|
||||||||
|
Cash and cash equivalents—beginning period
|
30,634
|
26,156
|
23,724
|
|||||||||
|
Cash and cash equivalents—end of period
|
24,961
|
30,634
|
26,156
|
|||||||||
|
Short and long-term investments—end of period
|
22,644
|
19,461
|
14,486
|
|||||||||
|
Total cash, cash equivalents and short-term and long-term investments
|
$
|
47,605
|
$
|
50,095
|
$
|
40,642
|
||||||
We consider cash and cash equivalents, short-term investments and long-term investments as liquid and available for use within two years in our current operations. Short-term investments and long-term investments are comprised of U.S. government securities and investment-grade
corporate notes and bonds
. Also included in short-term investments is our investment in common stock of Intelligent Epitaxy Technology, Inc (IntelliEPI), a Taiwan publicly-traded company. In 2013, we re-categorized our IntelliEPI investment from cost method to short-term investments as they completed their initial public offering in 2013. As of December 31, 2013, our principal sources of liquidity were $47.6 million of cash and investments of which $10.0 million of cash and cash equivalent was held by our consolidated joint ventures, which are not available for use in the United States without paying income taxes, consisting of cash and cash equivalents of $
25.0
million, short-term investments of $12.5 million and long-term investments of $10.1 million, a decrease of $2.5 million from $50.1 million as of December 31, 2012. The $5.7 million combined decrease in cash and cash equivalents was primarily due to net cash provided by operating activities of $2
.5
million, offset by net cash used in investing activities of $
6.2
million and net cash used in financing activities of $2.5 million. Short-term and long-term investments increased by $
3.2
million to $22.6 million from $19.5 million.
As of December 31, 2013, we and our consolidated joint ventures held approximately $18.7 million in cash and investments in foreign bank accounts which are not available for use in the United States without paying income taxes.
Cash and cash equivalents and short-term and long-term investments increased $9.5 million to $50.1 million as of December 31, 2012 from $40.6 million as of December 31, 2011. The $4.5 million combined increase in cash and cash equivalents was primarily due to net cash provided by operating activities of $21.3 million, offset by net cash used in investing activities of $13.2 million and net cash used in financing activities of $3.8 million. Short-term and long-term investments increased by $5.0 million to $19.5 million from $14.5 million.
Net cash provided by operating activities of $2
.5
million for 2013 was primarily comprised of our net loss of $6.8 million, adjusted for non-cash items of depreciation and amortization of $5.5 million, stock‑based compensation of $1.3 million, provision for doubtful accounts of $869,000, amortization of marketable securities premium of $518,000, offset by gain on sale of cost method investment of $811,000, a gain on disposal of property, plant and equipment of $9,000 and a net change of $
2.0
million in assets and liabilities. The $
2.0
million net change in assets and liabilities primarily resulted from a $1.4 million decrease in inventories, a $
645,00
0
increase
in prepaid expenses and other current assets, a $2.2 million decrease in accounts receivable, a $1.9 million increase in other assets, a $2.2 million increase in accounts payable, a $899,000 decrease in accrued liabilities and a $373,000 decrease in other long-term liabilities.
Net cash provided by operating activities of $21.3 million for 2012 was primarily comprised of our net income of $6.2 million, adjusted for non-cash items of depreciation and amortization of $3.9 million, stock‑based compensation of $1.2 million, amortization of marketable securities premium of $323,000, a loss on disposal of property, plant and equipment of $195,000 and a net change of $9.5 million in assets and liabilities. The $9.5 million net change in assets and liabilities primarily resulted from a $5.7 million decrease in inventories, a $1.8 million decrease in prepaid expenses and other current assets, a $54,000 decrease in accounts receivable, a $174,000 increase in other assets, a $2.6 million increase in accounts payable, a $461,000 increase in accrued liabilities and a $900,000 decrease in other long-term liabilities.
Net cash provided by operating activities of $18.1 million for 2011 was primarily comprised of our net income of $25.8 million, adjusted for non-cash items of depreciation and amortization of $3.4 million, stock‑based compensation of $896,000, amortization of marketable securities premium of $368,000, a realized loss on sale of investments of $8,000 and a net change of $12.4 million in assets and liabilities. The $12.4 million net change in assets and liabilities primarily resulted from a $9.8 million increase in inventories, a $4.0 million decrease in accounts payable and accrued liabilities, a $3.3 million increase in prepaid expenses, other current assets and a $781,000 decrease in other long-term liabilities, a $5.2 million decrease in accounts receivable and a $426,000 decrease in other assets.
Net cash used in investing activities of $
6.2
million for 2013 was primarily from the purchase of property, plant and equipment of $5.4 million mainly in our China facilities and the purchase of investments totaling $14.1 million offset by the sale of investments totaling $12.5 million.
Net cash used in investing activities of $13.2 million for 2012 was primarily from the purchase of property, plant and equipment of $7.1 million mainly in our China facilities, loan from our consolidated joint venture to its equity investment entity of $875,000 and the purchase of investments totaling $12.1 million offset by the sale of investments totaling $6.9 million.
Net cash used in investing activities of $15.4 million for 2011 was primarily from the purchase of property, plant and equipment of $13.1 million mainly in capital projects at our China facilities, investments in new joint ventures of $3.0 million, loans from our consolidated joint ventures to their equity investment entities of $1.6 million offset by net proceeds from investment securities totaling $2.2 million.
In January 2012, we agreed with the Administrative Commission of Tianjin Economy and Technology Development Zone to establish a second manufacturing facility in Tianjin, China. The arrangement, if completed, would provide us with land use rights for approximately 32 acres of industrial land located in Yixian Scientific and Industrial Park to construct a compound semiconductor substrate manufacturing facility that would be completed in phases over a number of years. We agreed to provide $12.5 million in the first phase of the construction of the facility and have an understanding with our BoYu joint venture that it will provide the RMB 32.0 million, or approximately $5.0 million, that is anticipated to be required for the portion of the project devoted to crystal support, in exchange for land use rights, enterprise and individual income tax rebates, employee hiring and development subsidies, and other benefits. We expect to fund the first phase of the construction of the facility with cash flow generated by our normal operations supplemented by our existing line of credit. However, we have delayed our participation in the project at this time due to the volatility in our substrate business. It is possible that the investment of $5.0 million will still be funded by our BoYu joint venture for crystal support.
In January 2012, we increased the credit facility line of credit, secured by the marketable securities, with a bank from $3.0 million to $10.0 million at an annual interest rate of 1.65% above the current 30-day LIBOR (London Interbank Offered Rate).
As of December 31, 2013 and 2012, we had not used the line of credit.
Net cash used in financing activities was $2.5 million for 2013 consisted of $2.3 million net dividends paid by our consolidated joint ventures and $716,000 of repurchases of shares of our common stock, partially offset by net proceeds of $
532,000
on the issuance of common stock pursuant to stock option exercises.
Net cash used in financing activities was $3.8 million for 2012 consisted of $4.1 million net dividends paid by our consolidated joint ventures partially offset by net proceeds of $294,000 on the issuance of common stock pursuant to stock option exercises.
Net cash used in financing activities was $999,000 for 2011 consisted of $1.6 million of dividends paid by joint ventures, offset by $637,000 from the proceeds from the exercise of employee stock options.
On September 13, 2011, our registration statement on Form S-3 was declared effective by the Securities and Exchange Commission (SEC). We may from time to time offer up to $60.0 million of common stock, preferred stock, depositary shares, warrants, debt securities and/or units in one or more offerings and in any combination. We intend to use the net proceeds from any sale of securities under the shelf registration statement for general corporate purposes, which may include capital expenditures in connection with our planned expansion of our manufacturing facilities in China. The timing of any offering will be at our discretion and will depend on many factors, including the prevailing market conditions. Specific terms and share prices of any future offering under the registration statement will be established at the time of any such offering, and will be described in a prospectus supplement that we will file with the SEC.
On February 21, 2013, our Board of Directors approved a stock repurchase program that complies with Rule 10b-18 of the Securities Exchange Act of 1934, as amended, authorizing us to purchase up to $6.0 million of our outstanding common stock. The timing, actual number and value of the shares that are repurchased under this program are dependent on market conditions and other corporate considerations, including price, corporate and regulatory requirements and alternative investment opportunities. The program is funded from existing cash balances and cash generated from operations. We are not obligated to repurchase any particular amount of common stock during any period and may choose to suspend or discontinue the repurchase program at any time.
During 2013, we repurchased approximately 285,000 shares at an average price of $2.51 per share for a total purchase price of $716,000 under the stock repurchase program. As of December 31, 2013, approximately $5.3 million remained available for future repurchases under this program.
We believe that we have adequate cash and investments to meet our needs over the next 12 months. If our sales decrease, however, our ability to generate cash from operations will be adversely affected which could adversely affect our future liquidity, require us to use cash at a more rapid rate than expected, and require us to seek additional capital. There can be no assurance that such additional capital will be available or, if available it will be on terms acceptable to us.
Cash from operations could be affected by various risks and uncertainties, including, but not limited to those set forth below under Item 1A. “Risk Factors” above.
Off-Balance Sheet Arrangements
We do not have any off-balance sheet financing arrangements and have never established any special purpose entities. We have not entered into any options on non-financial assets.
Contractual Obligations
We lease certain office space, manufacturing facilities and equipment under long-term operating leases expiring at various dates through February 2016. The lease agreement for the facility at Fremont, California with approximately 27,760 square feet commenced on December 1, 2008 for a term of seven years, with an option by us to cancel the lease after five years, upon forfeiture of the security deposit and payment of one-half of the fifth year’s rent. On June 28, 2013, we sent a notice to terminate the lease effective November 30, 2013 with an early termination penalty of $142,000 which was recorded as an expense in the third quarter of 2013. On August 2, 2013, we signed a new lease agreement for the current facility with reduced footage of 20,767 square feet, which commenced on December 1, 2013 for a term of two years. The reduced square footage, the reduced rate per square foot, and the expected reduced operating costs, would save us approximately $382,000 during 2014 and 2015.Total rent expenses under these operating leases were approximately $638,000, $447,000 and $460,000 for the years ended December 31, 2013, 2012 and 2011, respectively.
We entered into a royalty agreement with a vendor effective December 3, 2010 with a term of eight years, terminating December 31, 2018. We and our related companies are granted a worldwide, nonexclusive, royalty bearing, irrevocable license to certain patents for the term on the agreement. We shall pay a total of $7.0 million royalty payment over eight years that began in 2011 based on future royalty bearing sales. This agreement contains a clause that allows us to claim for credit, starting in 2013, in the event that the royalty bearing sales for the year is lower than a pre-determined amount set forth in this agreement. Royalty expense under this agreement
for 201
3 was $530,000, which was net of claim for credit of $270,000, $1.4 million
and $1.3 million
for the years ended December 31,
2012
and
2011
, respectively, and was included in cost of revenue.
The following table summarizes our contractual obligations as of December 31, 2013 (in thousands):
|
|
Payments due by period
|
|||||||||||||||||||
|
Contractual Obligations
|
Total
|
Less than 1 year
|
1-3
years |
3-5
years |
More than
5 years |
|||||||||||||||
|
Operating leases
|
$
|
438
|
$
|
174
|
$
|
174
|
$
|
38
|
$
|
52
|
||||||||||
|
Royalty agreement
|
3,325
|
800
|
1,375
|
1,150
|
—
|
|||||||||||||||
|
Total
|
$
|
3,763
|
$
|
974
|
$
|
1,549
|
$
|
1,188
|
$
|
52
|
||||||||||
Selected Quarterly Results of Operations
The following table sets forth unaudited quarterly results for the eight quarters ended December 31, 2013. The information for each of these quarters is unaudited but has been prepared on the same basis as the audited consolidated financial statements. We believe that all necessary adjustments, consisting only of normal recurring adjustments, have been included in the amounts stated below to present fairly such quarterly information. The operating results for any quarter are not necessarily indicative of results for any subsequent period.
|
|
Quarters Ended
|
|||||||||||||||||||||||||||||||
|
(in thousands, except for per share amounts)
|
Dec. 31,
2013 |
Sept. 30,
2013 |
June 30,
2013 |
Mar. 31,
2013 |
Dec. 31,
2012 |
Sept. 30,
2012 |
June 30,
2012 |
Mar. 31,
2012 |
||||||||||||||||||||||||
|
Revenue
|
$
|
18,603
|
$
|
20,521
|
$
|
23,831
|
$
|
22,380
|
$
|
18,927
|
$
|
20,808
|
$
|
25,153
|
$
|
23,486
|
||||||||||||||||
|
Cost of revenue
|
15,790
|
18,075
|
20,746
|
18,896
|
15,243
|
15,342
|
17,645
|
15,292
|
||||||||||||||||||||||||
|
Gross profit
|
2,813
|
2,446
|
3,085
|
3,484
|
3,684
|
5,466
|
7,508
|
8,194
|
||||||||||||||||||||||||
|
Operating expenses:
|
||||||||||||||||||||||||||||||||
|
Selling, general and administrative
|
3,631
|
4,303
|
4,207
|
3,925
|
3,710
|
3,950
|
3,974
|
3,785
|
||||||||||||||||||||||||
|
Research and development
|
797
|
766
|
1,039
|
822
|
875
|
844
|
914
|
835
|
||||||||||||||||||||||||
|
Total operating expenses
|
4,428
|
5,069
|
5,246
|
4,747
|
4,585
|
4,794
|
4,888
|
4,620
|
||||||||||||||||||||||||
|
Income (loss) from operations
|
(1,615
|
)
|
(2,623
|
)
|
(2,161
|
)
|
(1,263
|
)
|
(901
|
)
|
672
|
2,620
|
3,574
|
|||||||||||||||||||
|
Interest income, net
|
272
|
55
|
50
|
31
|
316
|
52
|
62
|
88
|
||||||||||||||||||||||||
|
Equity in earnings of unconsolidated joint ventures
|
278
|
346
|
471
|
282
|
495
|
348
|
284
|
154
|
||||||||||||||||||||||||
|
Other income (expense), net
|
(257
|
)
|
(47
|
)
|
381
|
(825
|
)
|
(289
|
)
|
144
|
(127
|
)
|
(489
|
)
|
||||||||||||||||||
|
Income (loss) before provision for income taxes
|
(1,322
|
)
|
(2,269
|
)
|
(1,259
|
)
|
(1,775
|
)
|
(379
|
)
|
1,216
|
2,839
|
3,327
|
|||||||||||||||||||
|
Provision for (benefit from) income
taxes |
(134
|
)
|
(204
|
)
|
(342
|
)
|
184
|
294
|
(228
|
)
|
412
|
375
|
||||||||||||||||||||
|
Net income (loss)
|
(1,188
|
)
|
(2,065
|
)
|
(1,601
|
)
|
(1,959
|
)
|
(673
|
)
|
1,444
|
2,427
|
2,952
|
|||||||||||||||||||
|
Less: Net income attributable to noncontrolling interest
|
(40
|
)
|
(230
|
)
|
(434
|
)
|
(441
|
)
|
(83
|
)
|
(512
|
)
|
(1,128
|
)
|
(1,317
|
)
|
||||||||||||||||
|
Net income (loss) attributable to AXT, Inc
|
$
|
(1,228
|
)
|
$
|
(2,295
|
)
|
$
|
(2,035
|
)
|
$
|
(2,400
|
)
|
$
|
(756
|
)
|
$
|
932
|
$
|
1,299
|
$
|
1,635
|
|||||||||||
|
Net income (loss) attributable to AXT, Inc. per common share:
|
||||||||||||||||||||||||||||||||
|
Basic
|
$
|
(0.04
|
)
|
$
|
(0.07
|
)
|
$
|
(0.06
|
)
|
$
|
(0.08
|
)
|
$
|
(0.02
|
)
|
$
|
0.03
|
$
|
0.04
|
$
|
0.05
|
|||||||||||
|
Diluted
|
$
|
(0.04
|
)
|
$
|
(0.07
|
)
|
$
|
(0.06
|
)
|
$
|
(0.08
|
)
|
$
|
(0.02
|
)
|
$
|
0.03
|
$
|
0.04
|
$
|
0.05
|
|||||||||||
|
Weighted average number of common shares outstanding:
|
||||||||||||||||||||||||||||||||
|
Basic
|
32,628
|
32,366
|
32,382
|
32,297
|
32,220
|
32,183
|
32,138
|
32,034
|
||||||||||||||||||||||||
|
Diluted
|
32,628
|
32,366
|
32,382
|
32,297
|
32,220
|
32,769
|
32,944
|
33,018
|
||||||||||||||||||||||||
Recent Accounting Pronouncements
Recent accounting pronouncements are detailed in Note 1 to our Consolidated Financial Statements included in this Annual Report on Form 10-K.
Foreign Currency Risk
A significant portion of our business is conducted in currencies other than the U.S. dollar. The functional currency for our foreign operations is the Renminbi, the local currency of China. Since most of our operations are conducted in China, most of our costs are incurred in Chinese Renminbi, which subjects us to fluctuations in the exchange rates between the U.S. dollar and the Chinese Renminbi. We incur transaction gains or losses resulting from consolidation of expenses incurred in local currencies for our Chinese subsidiaries, including our joint ventures, as well as in translation of the assets and liabilities at each balance sheet date. Our financial results could be adversely affected by factors such as changes in foreign currency exchange rates or weak economic conditions in foreign markets, including the revaluation by China of the Renminbi, and any future adjustments that China may make to its currency such as any move it might make to a managed float systems with opportunistic interventions. We may also experience foreign exchange losses on our non-functional currency denominated receivables and payables to the extent that we have not mitigated our exposure utilizing foreign currency forward exchange contracts. Foreign exchange losses could have a material adverse effect on our operating results and cash flows. If we do not effectively manage the risks associated with this currency risk, our revenue, cash flows and financial condition could be adversely affected.
We manage against these risks by actively monitoring the exchange rate exposure.
Our foreign operations, however, in most instances act as a natural hedge since both operating expenses as well as revenues and both assets and liabilities are generally denominated in their respective local currency. In these instances, although an unfavorable change in the exchange rate of foreign currencies against the U.S. dollar will result in lower revenues when translated into U.S. dollars, the operating expenses will be lower as well.
We do not use short-term forward exchange contracts for hedging purposes to reduce the effects of adverse foreign exchange rate movements. We cannot be certain that any such hedging activities will be effective, or available to us at commercially reasonable rates. As of December 31, 2013 and 2012, we had no outstanding commitments with respect to foreign exchange contracts.
During 2013, we recorded net realized foreign exchange losses of $1.3 million, included as part of other income (expense), net in our consolidated statements of operations. We incurred foreign currency transaction exchange gains and losses due to operations in general. In the future we may experience foreign exchange losses on our non-functional currency denominated receivables and payables to the extent that we have not mitigated our exposure utilizing foreign currency forward exchange contracts. Foreign exchange losses could have a materially adverse effect on our operating results and cash flows. During 2013, we recorded unrealized foreign currency gains of $1.6 million related to currency translation which are included in the balance of “accumulated other comprehensive income” on our consolidated balance sheets.
Interest Rate Risk
Cash and cash equivalents earning interest and certain variable rate debt instruments are subject to interest rate fluctuations. The following table sets forth the probable impact of a 10% change in interest rates (in thousands):
|
Instrument
|
Balance as of
December 31, 2013 |
Current
Interest Rate |
Projected Annual
Interest Income/(Expense) |
Proforma 10%
Interest Rate Decline Income/(Expense) |
Proforma 10%
Interest Rate Increase Income/(Expense) |
|||||||||||||||
|
Cash
|
$
|
24,852
|
0.67
|
%
|
$
|
167
|
$
|
150
|
$
|
123
|
||||||||||
|
Cash equivalents
|
109
|
0.02
|
0
|
0
|
0
|
|||||||||||||||
|
Investment in debt and equity instruments
|
22,644
|
3.07
|
695
|
626
|
765
|
|||||||||||||||
|
|
$
|
862
|
$
|
776
|
$
|
948
|
||||||||||||||
The primary objective of our investment activities is to preserve principal while maximizing income without significantly increasing risk. Financial instruments that potentially subject us to concentration of credit risk consist primarily of cash and cash equivalents, short-term investments, and trade accounts receivable. We invest primarily in money market accounts, certificates of deposits, corporate bonds and notes, and government securities. We are exposed to credit risks in the event of default by the issuers to the extent of the amount recorded on the consolidated balance sheets. These securities are generally classified as available-for-sale and consequently are recorded on the balance sheet at fair value with unrealized gains or losses reported as a separate component of accumulated other comprehensive income, net of estimated tax. Our cash, cash equivalents and short-term investments and long-term investments are in high-quality securities placed with major banks and financial institutions and commercial paper. We have no investments in auction rate securities.
Credit Risk
We perform periodic credit evaluations of our customers’ financial condition and generally do not require collateral. One customer accounted for 20% of our trade accounts receivable balance as of December 31, 2013. One customer accounted for 28% of our trade accounts receivable balance as of December 31, 2012.
Equity Risk
We maintain minority investments directly, and indirectly through our joint ventures in privately-held companies located in China. These minority investments are reviewed for other than temporary declines in value on a quarterly basis. These investments are classified as other assets in the consolidated balance sheets and are either accounted for under the cost method or under equity method consolidated through joint ventures as we do not have the ability to exercise significant influence over their operations. We monitor our investments for impairment and record reductions in carrying value when events or changes in circumstances indicate that the carrying value may not be recoverable. Reasons for other than temporary declines in value include whether the related company would have insufficient cash flow to operate for the next twelve months, significant changes in the operating performance and changes in market conditions. As of and December 31, 2013 and 2012, the direct minority investments totaled $325,000 and 392,000, respectively, and the indirect minority investments by our joint ventures totaled $3.4 million and $2.0 million, respectively.
The consolidated financial statements, related notes thereto and financial statement schedule required by this item are listed and set forth beginning on page 48, and are incorporated by reference here. Supplementary financial information regarding quarterly financial information required by this item is set forth under the caption “Selected Quarterly Results of Operations” in Item 7. “Management’s Discussion and Analysis of Financial Condition and Results of Operations,” and is incorporated by reference here.
None.
Evaluation of disclosure controls and procedures.
Our management, with the participation of our Chief Executive Officer and our
interim
Chief Financial Officer, evaluated the effectiveness of the design and operation of our disclosure controls and procedures as of the end of the period covered by this Annual Report on Form 10-K. Based upon this evaluation, our Chief Executive Officer and
interim
Chief Financial Officer have concluded that our disclosure controls and procedures as defined under Exchange Act Rules 13a-15(e) and 15d-15(e) were effective at the reasonable assurance level to ensure that information required to be disclosed in our Securities Exchange Act reports is recorded, processed, summarized and reported within the time periods specified by the Securities and Exchange Commission and is accumulated and communicated to management, including our Chief Executive Officer and our
interim
Chief Financial Officer, as appropriate to allow timely decisions regarding required disclosure.
Our disclosure controls and procedures include components of our internal control over financial reporting. Management’s assessment of the effectiveness of our internal control over financial reporting is expressed at the level of reasonable assurance because a control system, no matter how well designed and operated, can provide only reasonable assurance that the control system’s objectives will be met.
Management’s report on internal control over financial reporting
Our management is responsible for establishing and maintaining adequate internal control over financial reporting, as such term is defined in Rules 13a-15(f) and 15d-15(f) under the Exchange Act. Internal control over financial reporting is a process designed by, or under the supervision of, our Chief Executive Officer and Chief Financial Officer, and implemented by our Board of Directors, management and other personnel to provide reasonable assurance regarding the reliability of financial reporting and the preparation of financial statements for external purposes in accordance with accounting principles generally accepted in the United States. Internal control over financial reporting includes those policies and procedures that:
| • | pertain to the maintenance of records that in reasonable detail accurately and fairly reflect our transactions and dispositions of our assets; |
| • | provide reasonable assurance that transactions are recorded as necessary to permit preparation of financial statements in accordance with GAAP, and that receipts and expenditures are being made only in accordance with authorizations of our management and directors; and |
| • | provide reasonable assurance regarding prevention or timely detection of unauthorized acquisition, use or disposition of our assets that could have a material effect on the financial statements. |
Because of inherent limitations, internal control over financial reporting may not prevent or detect misstatements. Also, projections of any evaluation of effectiveness to future periods are subject to the risk that controls may become inadequate because of changes in conditions, or that the degree of compliance with the policies or procedures may deteriorate.
Our management, under the supervision and with the participation of our Chief Executive Officer and i
nterim
Chief Financial Officer, has assessed the effectiveness of our internal control over financial reporting as of December 31, 2013 based on the criteria established in
Internal Control—Integrated Framework
issued by the Committee of Sponsoring Organizations of the Treadway Commission (COSO). Management has concluded that our internal control over financial reporting was effective as of December 31, 2013.
Our independent registered public accounting firm, Burr Pilger Mayer, Inc. has audited the consolidated financial statements included in this Annual Report on Form 10-K and has issued its report on the effectiveness of our internal control over financial reporting as of December 31, 2013.
Changes in internal control over financial reporting.
There were no changes in our internal control over financial reporting that occurred during the year ended December 31, 2013 that has materially affected, or is reasonably likely to materially affect, our internal control over financial reporting.
None.
REPORT OF INDEPENDENT REGISTERED PUBLIC ACCOUNTING FIRM
To the Board of Directors and Stockholders of
AXT, Inc.
We have audited the internal control over financial reporting of AXT, Inc. and its subsidiaries (the “Company”) as of December 31, 2013, based on criteria established in
Internal Control — Integrated Framework
issued by the Committee of Sponsoring Organizations of the Treadway Commission (COSO). The Company’s management is responsible for maintaining effective internal control over financial reporting and for its assessment of the effectiveness of internal control over financial reporting included in the accompanying
Management’s Report on Internal Control Over Financial Reporting,
appearing in item 9A. Our responsibility is to express an opinion on the Company’s internal control over financial reporting based on our audit.
We conducted our audit in accordance with the standards of the Public Company Accounting Oversight Board (United States). Those standards require that we plan and perform the audit to obtain reasonable assurance about whether effective internal control over financial reporting was maintained in all material respects. Our audit included obtaining an understanding of internal control over financial reporting, assessing the risk that a material weakness exists, testing and evaluating the design and operating effectiveness of internal control based on the assessed risk, and performing such other procedures as we considered necessary in the circumstances. We believe that our audit provides a reasonable basis for our opinion.
A company’s internal control over financial reporting is a process designed to provide reasonable assurance regarding the reliability of financial reporting and the preparation of financial statements for external purposes in accordance with generally accepted accounting principles. A company’s internal control over financial reporting includes those policies and procedures that (1) pertain to the maintenance of records that, in reasonable detail, accurately and fairly reflect the transactions and dispositions of the assets of the company; (2) provide reasonable assurance that transactions are recorded as necessary to permit preparation of financial statements in accordance with generally accepted accounting principles, and that receipts and expenditures of the company are being made only in accordance with authorizations of management and directors of the company; and (3) provide reasonable assurance regarding prevention or timely detection of unauthorized acquisition, use, or disposition of the company’s assets that could have a material effect on the financial statements.
Because of its inherent limitations, internal control over financial reporting may not prevent or detect misstatements. Also, projections of any evaluation of effectiveness to future periods are subject to the risk that controls may become inadequate because of changes in conditions, or that the degree of compliance with the policies or procedures may deteriorate.
In our opinion, AXT, Inc. and its subsidiaries maintained, in all material respects, effective internal control over financial reporting as of December 31, 2013, based on the COSO criteria.
We also have audited, in accordance with the standards of the Public Company Accounting Oversight Board (United States), the consolidated balance sheets of AXT, Inc. and its subsidiaries as of December 31, 2013 and 2012, and the related consolidated statements of operations, comprehensive income (loss), stockholders’ equity and cash flows for each of the three years in the period ended December 31, 2013 and our report dated March 14, 2014 expressed an unqualified opinion thereon.
/s/ Burr Pilger Mayer, Inc.
San Jose, California
March 14, 2014
PART III
The United States Securities and Exchange Commission (“SEC”) allows us to include information required in this report by referring to other documents or reports we have already or will soon be filing. This is called “Incorporation by Reference.” We intend to file our definitive proxy statement for our annual meeting of stockholders to be held on May 13, 2014 (the “Proxy Statement”) pursuant to Regulation 14A not later than 120 days after the end of the fiscal year covered by this report, and certain information therein is incorporated in this report by reference.
The information required by this item with respect to identification of directors is incorporated by reference to the information contained in the section captioned “Information About our Board of Directors” in the Proxy Statement. The information with respect to our executive officers, is incorporated by reference to the information contained in the section captioned “Executive Officers” in the Proxy Statement. Information with respect to Items 405 of Regulation S-K is incorporated by reference to the information contained in the sections of the Proxy Statement captioned “Section 16(a) Beneficial Ownership Reporting Compliance.” There will be no disclosure under Item 407(c)(3). Information with respect to Items 407(d)(4) and 407(d)(5) is incorporated by reference to the information contained in the sections of the Proxy Statement captioned “Corporate Governance—Committees of the Board of Directors.”
The Board of Directors of AXT, Inc. has adopted a Code of Conduct and Ethics (the “Code”) that applies to our principal executive officers, principal financial officer, and corporate controller, as well as other employees. A copy of this Code has been posted on our Internet website at
www.axt.com
. Any amendments to, or waivers from, a provision of our Code that applies to our principal executive officer, principal financial officer, controller, or persons performing similar functions and that relates to any element of the Code enumerated in paragraph (b) of Item 406 of Regulation S-K shall be disclosed by posting such information on our website.
The information required by this Item is incorporated herein by reference to information set forth in our Proxy Statement under the section entitled “Executive Compensation and Other Matters.”
Item 12.
Security Ownership of Certain Beneficial Owners and Management and Related Stockholder Matters
The information required by this Item is incorporated herein by reference to information set forth in our Proxy Statement under the section entitled “Security Ownership of Certain Beneficial Owners and Management” and “Equity Compensation Plan Information.”
Information required by this item will be set forth in our Proxy Statement under the headings “Compensation Committee Interlocks and Insider Participation” and “Certain Relationships and Related Transactions,” which information is incorporated herein by reference.
The information required by this Item is incorporated herein by reference to information set forth in our Proxy Statement under the section entitled “Ratification of Appointment of Independent Registered Public Accountants.”
PART IV
(a)
The following documents are filed as part of this report:
(1)
Financial Statements:
INDEX TO CONSOLIDATED FINANCIAL STATEMENTS
|
47
|
|
|
48
|
|
|
49
|
|
|
50
|
|
|
51
|
|
|
52
|
|
|
53
|
(2)
Financial Statement Schedules
All schedules have been omitted because the required information is not applicable or because the information required is included in the consolidated financial statements or notes thereto.
(b)
Exhibits
See Index to Exhibits attached elsewhere to this Form 10-K. The exhibits listed in the accompanying Index to Exhibits are filed as part of, or incorporated by reference into, this report on Form 10-K.
To the Board of Directors and Stockholders of
AXT, Inc.
We have audited the accompanying consolidated balance sheets of AXT, Inc. and its subsidiaries (the “Company”) as of December 31, 2013 and 2012, and the related consolidated statements of operations, comprehensive income (loss), stockholders’ equity and cash flows for each of the three years in the period ended December 31, 2013. These consolidated financial statements are the responsibility of the Company’s management. Our responsibility is to express an opinion on these consolidated financial statements based on our audits.
We conducted our audits in accordance with the standards of the Public Company Accounting Oversight Board (United States). Those standards require that we plan and perform the audit to obtain reasonable assurance about whether the financial statements are free of material misstatement. An audit includes examining, on a test basis, evidence supporting the amounts and disclosures in the financial statements. An audit also includes assessing the accounting principles used and significant estimates made by management, as well as evaluating the overall financial statement presentation. We believe that our audits provide a reasonable basis for our opinion.
In our opinion, the consolidated financial statements referred to above present fairly, in all material respects, the financial position of AXT, Inc. and its subsidiaries as of December 31, 2013 and 2012, and the results of their operations and their cash flows for each of the three years in the period ended December 31, 2013, in conformity with accounting principles generally accepted in the United States of America.
We also have audited, in accordance with the standards of the Public Company Accounting Oversight Board (United States), the Company’s internal control over financial reporting as of December 31, 2013, based on criteria established in
Internal Control — Integrated Framework
issued by the Committee of Sponsoring Organizations of the Treadway Commission and our report dated March 14, 2014 expressed an unqualified opinion thereon.
/s/ Burr Pilger Mayer, Inc.
San Jose, California
March 14, 2014
AXT, INC.
(In thousands, except per share data)
|
|
December 31,
|
|||||||
|
|
2013
|
2012
|
||||||
|
ASSETS
|
|
|
||||||
|
Current assets
|
|
|
||||||
|
Cash and cash equivalents
|
$
|
24,961
|
$
|
30,634
|
||||
|
Short-term investments
|
12,499
|
10,270
|
||||||
|
Accounts receivable, net of allowances of $1,054 and $245 as of December 31, 2013 and 2012, respectively
|
14,943
|
17,912
|
||||||
|
Inventories
|
39,127
|
40,352
|
||||||
|
Related party notes receivable - current
|
—
|
2,036
|
||||||
|
Prepaid expenses and other current assets
|
8,010
|
5,268
|
||||||
|
Total current assets
|
99,540
|
106,472
|
||||||
|
Long-term investments
|
10,145
|
9,191
|
||||||
|
Property, plant and equipment, net
|
37,621
|
37,235
|
||||||
|
Related party notes receivable – long-term
|
1,715
|
416
|
||||||
|
Other assets
|
14,801
|
14,275
|
||||||
|
Total assets
|
$
|
163,822
|
167,589
|
|||||
|
LIABILITIES AND STOCKHOLDERS’ EQUITY
|
||||||||
|
Current liabilities
|
||||||||
|
Accounts payable
|
$
|
8,140
|
$
|
5,894
|
||||
|
Accrued liabilities
|
7,286
|
7,202
|
||||||
|
Total current liabilities
|
15,426
|
13,096
|
||||||
|
Long-term portion of royalty payments
|
2,525
|
3,325
|
||||||
|
Other long-term liabilities
|
325
|
254
|
||||||
|
Total liabilities
|
18,276
|
16,675
|
||||||
|
Commitments and contingencies (Note 17)
|
||||||||
|
Stockholders’ equity:
|
||||||||
|
Preferred stock, $0.001 par value; 2,000 shares authorized; 883 shares issued and outstanding as of December 31, 2013 and 2012 (Liquidation preference of $6.1 million and $5.9 million as of December 31, 2013 and 2012, respectively)
|
3,532
|
3,532
|
||||||
|
Common stock, $0.001 par value; 70,000 shares authorized; 32,605 and 32,471 shares issued and outstanding as of December 31, 2013 and 2012, respectively
|
32
|
32
|
||||||
|
Additional paid-in-capital
|
194,156
|
193,063
|
||||||
|
Accumulated deficit
|
(67,005
|
)
|
(59,047
|
)
|
||||
|
Accumulated other comprehensive income
|
8,953
|
6,033
|
||||||
|
Total AXT, Inc. stockholders’ equity
|
139,668
|
143,613
|
||||||
|
Noncontrolling interests
|
5,878
|
7,301
|
||||||
|
Total stockholders’ equity
|
145,546
|
150,914
|
||||||
|
Total liabilities and stockholders’ equity
|
$
|
163,822
|
$
|
167,589
|
||||
See accompanying notes to consolidated financial statements.
AXT, INC.
(In thousands, except per share data)
|
|
Years Ended December 31,
|
|||||||||||
|
|
2013
|
2012
|
2011
|
|||||||||
|
|
|
|||||||||||
|
Revenue
|
$
|
85,335
|
$
|
88,374
|
$
|
104,121
|
||||||
|
Cost of revenue
|
73,507
|
63,522
|
59,339
|
|||||||||
|
Gross profit
|
11,828
|
24,852
|
44,782
|
|||||||||
|
Operating expenses:
|
||||||||||||
|
Selling, general, and administrative
|
16,066
|
15,419
|
14,836
|
|||||||||
|
Research and development
|
3,424
|
3,468
|
2,473
|
|||||||||
|
Total operating expenses
|
19,490
|
18,887
|
17,309
|
|||||||||
|
Income (loss) from operations
|
(7,662
|
)
|
5,965
|
27,473
|
||||||||
|
Interest income, net
|
408
|
518
|
449
|
|||||||||
|
Equity in earnings of unconsolidated joint ventures
|
1,377
|
1,281
|
741
|
|||||||||
|
Other income (expense), net
|
(748
|
)
|
(761
|
)
|
(45
|
)
|
||||||
|
Income (loss) before provision for income taxes
|
(6,625
|
)
|
7,003
|
28,618
|
||||||||
|
Provision for income taxes
|
188
|
853
|
2,795
|
|||||||||
|
Net income (loss)
|
(6,813
|
)
|
6,150
|
25,823
|
||||||||
|
Less: Net income attributable to noncontrolling interest
|
1,145
|
3,040
|
5,503
|
|||||||||
|
Net income (loss) attributable to AXT, Inc
|
$
|
(7,958
|
)
|
$
|
3,110
|
$
|
20,320
|
|||||
|
Net income (loss) attributable to AXT, Inc. per common share:
|
||||||||||||
|
Basic
|
$
|
(0.25
|
)
|
$
|
0.09
|
$
|
0.63
|
|||||
|
Diluted
|
$
|
(0.25
|
)
|
$
|
0.09
|
$
|
0.61
|
|||||
|
Weighted average number of common shares outstanding:
|
||||||||||||
|
Basic
|
32,700
|
32,144
|
31,872
|
|||||||||
|
Diluted
|
32,700
|
32,865
|
33,061
|
|||||||||
See accompanying notes to consolidated financial statements.
AXT, INC.
(In thousands)
|
|
Years Ended December 31,
|
|||||||||||
|
|
2013
|
2012
|
2011
|
|||||||||
|
|
|
|||||||||||
|
Net Income (loss)
|
$
|
(6,813
|
)
|
$
|
6,150
|
$
|
25,823
|
|||||
|
Other comprehensive income (loss), net of tax:
|
||||||||||||
|
Change in cumulative foreign currency translation adjustment, net of tax
|
1,568
|
207
|
1,686
|
|||||||||
|
Change in unrealized gain (loss) on available-for-sale investments, net of tax
|
1,682
|
85
|
(161
|
)
|
||||||||
|
Total other comprehensive income (loss), net of tax
|
3,250
|
292
|
1,525
|
|||||||||
|
Comprehensive income (loss)
|
(3,563
|
)
|
6,442
|
27,348
|
||||||||
|
Less: Comprehensive income attributable to noncontrolling interest
|
1,475
|
3,117
|
5,862
|
|||||||||
|
Comprehensive income (loss) attributable to AXT, Inc
|
$
|
(5,038
|
)
|
$
|
3,325
|
$
|
21,486
|
|||||
See accompanying notes to consolidated financial statements.
AXT, INC.
(In thousands)
|
|
|
Common Stock
|
|
|
|
|
|
|||||||||||||||||||||||||||||||||
|
|
Preferred
Stock |
|
|
Additional
Paid In |
Accumulated
|
Other
Comprehensive |
AXT, Inc.
stockholders’ |
Noncontrolling
|
Total
stockholders’ |
|||||||||||||||||||||||||||||||
|
|
Shares
|
$
|
Shares
|
$
|
Capital
|
Deficit
|
Income/(loss)
|
equity
|
interests
|
equity
|
||||||||||||||||||||||||||||||
|
|
|
|||||||||||||||||||||||||||||||||||||||
|
January 1, 2011
|
883
|
3,532
|
31,877
|
32
|
190,021
|
(82,477
|
)
|
4,652
|
115,760
|
4,044
|
$
|
119,804
|
||||||||||||||||||||||||||||
|
Common stock options exercised
|
251
|
637
|
637
|
637
|
||||||||||||||||||||||||||||||||||||
|
Stock‑based compensation
|
896
|
896
|
896
|
|||||||||||||||||||||||||||||||||||||
|
Issuance of common stock in the form of restricted stock
|
94
|
|||||||||||||||||||||||||||||||||||||||
|
Comprehensive income:
|
||||||||||||||||||||||||||||||||||||||||
|
Net income
|
20,320
|
20,320
|
5,503
|
25,823
|
||||||||||||||||||||||||||||||||||||
|
Dividend declared by joint ventures
|
(1,636
|
)
|
(1,636
|
)
|
||||||||||||||||||||||||||||||||||||
|
Change in unrealized (loss) gain on marketable securities
|
(161
|
)
|
(161
|
)
|
(161
|
)
|
||||||||||||||||||||||||||||||||||
|
Currency translation adjustment
|
1,327
|
1,327
|
359
|
1,686
|
||||||||||||||||||||||||||||||||||||
|
Balance as of December 31, 2011
|
883
|
3,532
|
32,222
|
32
|
191,554
|
(62,157
|
)
|
5,818
|
138,779
|
8,270
|
147,049
|
|||||||||||||||||||||||||||||
|
Common stock options exercised
|
136
|
294
|
294
|
294
|
||||||||||||||||||||||||||||||||||||
|
Stock‑based compensation
|
1,215
|
1,215
|
1,215
|
|||||||||||||||||||||||||||||||||||||
|
Issuance of common stock in the form of restricted stock
|
113
|
|||||||||||||||||||||||||||||||||||||||
|
Comprehensive income:
|
||||||||||||||||||||||||||||||||||||||||
|
Net income
|
3,110
|
3,110
|
3,040
|
6,150
|
||||||||||||||||||||||||||||||||||||
|
Dividend declared by joint ventures
|
(4,086
|
)
|
(4,086
|
)
|
||||||||||||||||||||||||||||||||||||
|
Change in unrealized (loss) gain on marketable securities
|
85
|
85
|
85
|
|||||||||||||||||||||||||||||||||||||
|
Currency translation adjustment
|
130
|
130
|
77
|
207
|
||||||||||||||||||||||||||||||||||||
|
Balance as of December 31, 2012
|
883
|
3,532
|
32,471
|
32
|
193,063
|
(59,047
|
)
|
6,033
|
143,613
|
7,301
|
150,914
|
|||||||||||||||||||||||||||||
|
Common stock options exercised
|
331
|
532
|
532
|
532
|
||||||||||||||||||||||||||||||||||||
|
Common stock repurchased
|
(285
|
)
|
(716
|
)
|
(716
|
)
|
(716
|
)
|
||||||||||||||||||||||||||||||||
|
Stock‑based compensation
|
1,277
|
1,277
|
1,277
|
|||||||||||||||||||||||||||||||||||||
|
Issuance of common stock in the form of restricted stock
|
88
|
|||||||||||||||||||||||||||||||||||||||
|
Comprehensive income:
|
||||||||||||||||||||||||||||||||||||||||
|
Net income (loss)
|
(7,958
|
)
|
(7,958
|
)
|
1,145
|
(6,813
|
)
|
|||||||||||||||||||||||||||||||||
|
Net dividend declared by joint ventures
|
(2,898
|
)
|
(2,898
|
)
|
||||||||||||||||||||||||||||||||||||
|
Change in unrealized (loss) gain on marketable securities
|
1,682
|
1,682
|
1,682
|
|||||||||||||||||||||||||||||||||||||
|
Currency translation adjustment
|
1,238
|
1,238
|
330
|
1,568
|
||||||||||||||||||||||||||||||||||||
|
Balance as of December 31, 2013
|
883
|
$
|
3,532
|
32,605
|
$
|
32
|
$
|
194,156
|
$
|
(67,005
|
)
|
$
|
8.953
|
$
|
139,668
|
$
|
5,878
|
$
|
145,546
|
|||||||||||||||||||||
See accompanying notes to consolidated financial statements.
AXT, INC.
(In thousands)
|
|
Years Ended December 31,
|
|||||||||||
|
|
2013
|
2012
|
2011
|
|||||||||
|
Cash flows from operating activities:
|
|
|
|
|||||||||
|
Net income (loss)
|
$
|
(6,813
|
)
|
$
|
6,150
|
$
|
25,823
|
|||||
|
Adjustments to reconcile net income (loss) to net cash provided by operations:
|
||||||||||||
|
Depreciation and amortization
|
5,470
|
3,927
|
3,410
|
|||||||||
|
Amortization of marketable securities premium
|
518
|
323
|
368
|
|||||||||
|
Stock‑based compensation
|
1,277
|
1,215
|
896
|
|||||||||
|
Provision for doubtful accounts
|
869
|
—
|
—
|
|||||||||
|
Realized loss (gain) on sale of investments
|
—
|
—
|
8
|
|||||||||
|
Gain on sale of cost method investment
|
(811
|
)
|
—
|
—
|
||||||||
|
Loss (gain) on disposal of property, plant and equipment
|
(9
|
)
|
195
|
6
|
||||||||
|
Changes in assets and liabilities:
|
||||||||||||
|
Accounts receivable, net
|
2,160
|
54
|
5,165
|
|||||||||
|
Inventories
|
1,439
|
5,659
|
(9,839
|
)
|
||||||||
|
Prepaid expenses and other current assets
|
(645
|
) |
1,784
|
(3,313
|
)
|
|||||||
|
Other assets
|
(1,859
|
)
|
(174
|
)
|
426
|
|||||||
|
Accounts payable
|
2,185
|
2,608
|
(3,840
|
)
|
||||||||
|
Accrued liabilities
|
(899
|
)
|
461
|
(197
|
)
|
|||||||
|
Other long-term liabilities
|
(373
|
)
|
(900
|
)
|
(781
|
)
|
||||||
|
Net cash provided by operating activities
|
2,509
|
21,302
|
18,132
|
|||||||||
|
Cash flows from investing activities:
|
||||||||||||
|
Purchases of property, plant and equipment
|
(5,424
|
)
|
(7,079
|
)
|
(13,102
|
)
|
||||||
|
Proceeds from disposal of property, plant and equipment
|
—
|
2
|
33
|
|||||||||
|
Purchases of available for sale securities
|
(14,092
|
)
|
(12,116
|
)
|
(13,951
|
)
|
||||||
|
Proceeds from sales and maturities of available for sale securities
|
12,486
|
6,900
|
16,179
|
|||||||||
|
Investments in joint ventures
|
—
|
—
|
(3,024
|
)
|
||||||||
|
Repayment from (Loans to) related parties
|
818
|
(875
|
)
|
(1,565
|
)
|
|||||||
|
Net cash used in investing activities
|
(6,212
|
)
|
(13,168
|
)
|
(15,430
|
)
|
||||||
|
Cash flows from financing activities:
|
||||||||||||
|
Proceeds from common stock options exercised
|
532
|
294
|
637
|
|||||||||
|
Repurchase of the Company’s common stock, including commission
|
(716
|
)
|
—
|
—
|
||||||||
|
Dividends paid by joint ventures
|
(2,329
|
)
|
(4,086
|
)
|
(1,636
|
)
|
||||||
|
Net cash provided by (used in) financing activities
|
(2,513
|
)
|
(3,792
|
)
|
(999
|
)
|
||||||
|
Effect of exchange rate changes on cash and cash equivalents
|
543
|
136
|
729
|
|||||||||
|
Net increase (decrease) in cash and cash equivalents
|
(5,673
|
)
|
4,478
|
2,432
|
||||||||
|
Cash and cash equivalents at the beginning of the year
|
30,634
|
26,156
|
23,724
|
|||||||||
|
Cash and cash equivalents at the end of the year
|
$
|
24,961
|
$
|
30,634
|
$
|
26,156
|
||||||
|
Supplemental disclosures:
|
||||||||||||
|
Income taxes paid
|
$
|
782
|
$
|
1,729
|
$
|
3,234
|
||||||
See accompanying notes to consolidated financial statements.
AXT, INC.
Note 1. The Company and Summary of Significant Accounting Policies
The Company
AXT, Inc. (“AXT”, “we,” “us,” and “our” refer to AXT, Inc. and all of its subsidiaries) designs, develops, manufactures and distributes high-performance compound semiconductor substrates. Our substrate products are used primarily in wireless communications, lighting display applications, and fiber optic communications. We believe our vertical gradient freeze, or VGF, technique for manufacturing semiconductor substrates provides significant benefits over other methods and enabled us to become a leading manufacturer of such substrates. We pioneered the commercial use of VGF technology to manufacture gallium arsenide (GaAs) substrates and subsequently used VGF technology to manufacture substrates from indium phosphide (InP), and germanium (Ge). We also manufacture and sell raw materials related to our substrate business through our joint ventures located in China. These joint ventures produce products including 99.99% pure gallium (4N Ga), high purity gallium, arsenic, and germanium, germanium dioxide, pyrolytic boron nitride (pBN) crucibles, and boron oxide (B2O3). AXT’s ownership interest in these entities ranges from 20 percent to 83 percent. We consolidate the joint ventures in which we own a majority or controlling share and employ equity method accounting for the joint ventures in which we have a smaller ownership interest. We purchase the materials produced by these ventures for our own use and sell other portions of their production to third parties.
Principles of Consolidation
The consolidated financial statements include the accounts of AXT, our wholly-owned subsidiary, Beijing Tongmei Xtal Technology Co, Ltd., and our majority‑owned subsidiaries, Beijing JiYa Semiconductor Material Co., Ltd, Nanjing Jin Mei Gallium Co., Ltd and Beijing BoYu Semiconductor Vessel Craftwork Technology Co., Ltd. All significant inter‑company accounts and transactions have been eliminated. Investments in business entities in which we do not have control, but have the ability to exercise significant influence over operating and financial policies (generally 20-50% ownership), are accounted for by the equity method. For majority-owned subsidiaries, we reflect the noncontrolling interest of the portion we do not own on our consolidated balance sheets in stockholders’ equity and in our consolidated statements of operations.
Use of Estimates
The preparation of financial statements in conformity with accounting principles generally accepted in the United States of America requires management to make estimates, judgments and assumptions.
We believe that the estimates, judgments, and assumptions upon which it relies are reasonable based on information available at the time that these estimates, judgments, and assumptions are made. These estimates, judgments, and assumptions can affect the reported amounts of assets and liabilities as of the date of the financial statements as well as the reported amounts of revenues and expenses during the periods presented. To the extent there are material differences between these estimates and actual results, our consolidated financial statements would be affected
.
Fair Value of Financial Instruments
The carrying amounts of certain of our financial instruments including cash and cash equivalents, accounts receivable, short-term investments and long-term investments, accounts payable and accrued liabilities approximate fair value due to their short maturities. Certain cash equivalents and investments are required to be adjusted to fair value on a recurring basis. See Note 2.
Fair Value of Investments
ASC topic 820,
Fair value measurement
(“ASC 820”) establishes three levels of inputs that may be used to measure fair value.
Level 1 instruments represent quoted prices in active markets. Therefore, determining fair value for Level 1 instruments does not require significant management judgment, and the estimation is not difficult.
Level 2 instruments include observable inputs other than Level 1 prices, such as quoted prices for identical instruments in markets with insufficient volume or infrequent transactions (less active markets), issuer credit ratings, non-binding market consensus prices that can be corroborated with observable market data, model-derived valuations in which all significant inputs are observable or can be derived principally from or corroborated with observable market data for substantially the full term of the assets or liabilities, or quoted prices for similar assets or liabilities. These Level 2 instruments require more management judgment and subjectivity compared to Level 1 instruments, including:
| · | Determining which instruments are most similar to the instrument being priced requires management to identify a sample of similar securities based on the coupon rates, maturity, issuer, credit rating, and instrument type, and subjectively select an individual security or multiple securities that are deemed most similar to the security being priced. |
| · | Determining which model-derived valuations to use in determining fair value requires management judgment. When observable market prices for identical securities or similar securities are not available, we price our marketable debt instruments using non-binding market consensus prices that are corroborated with observable market data or pricing models, such as discounted cash flow models, with all significant inputs derived from or corroborated with observable market data. |
Level 3 instruments include unobservable inputs to the valuation methodology that are significant to the measurement of fair value of assets or liabilities. The determination of fair value for Level 3 instruments requires the most management judgment and subjectivity. As of December 31, 2013, we did not have any assets or liabilities without observable market values that would require a high level of judgment to determine fair value (Level 3 assets).
Foreign Currency Translation
The functional currencies of our Chinese subsidiaries are the local currencies. Transaction gains and losses resulting from transactions denominated in currencies other than the U.S. dollar or in the functional currencies of our subsidiaries are included in “other income (expense), net” for the periods presented. The transaction losses for the years ended December 31, 2013, 2012 and 2011 totaled $1.3 million, $445,000 and $1000,000 respectively.
The assets and liabilities of the subsidiaries are translated at the rates of exchange on the balance sheet date. Revenue and expense items are translated at the average rate of exchange for the period. Gains and losses from foreign currency translation are included in “other comprehensive income (loss)” in consolidated statements of comprehensive income (loss).
Revenue Recognition
We recognize revenue upon the shipment of our products to customers when:
| • | we have received a signed purchase order placed by our customers, |
| • | the price is fixed or determinable, |
| • | title and risk of ownership has transferred to our customers upon shipment from our dock, receipt at customer’s dock, or removal from consignment inventory at customer’s location, |
| • | collection of resulting receivables is probable, and |
| • | product returns are reasonably estimable. |
We do not provide training, installation or commissioning services. Our terms and conditions of sale do not require customer acceptance. We assess the probability of collection based on a number of factors including past history with the customer and credit worthiness. We provide for future returns based on historical experience, current economic trends and changes in customer demand at the time revenue is recognized. Additionally, we do not provide discounts or other incentives to customers. We present our revenue net of any taxes assessed by any governmental authority.
Accounting for Sales Taxes in Net Revenues
We report sales taxes collected on sales of our products as a component of net revenues and
for amounts not yet remitted to tax authorities
as accrued liabilities on our consolidated balance sheets. The amount is immaterial for fiscal years 2013, 2012 and 2011.
Risks and Concentration of Credit Risk
Our business is very dependent on the semiconductor industry, which is highly cyclical and has historically experienced downturns as a result of economic changes, overcapacity, and technological advancements. Significant technological changes in the industry or customer requirements, or the emergence of competitive products with new capabilities or technologies, could adversely affect operating results. In addition, a significant portion of our revenues and net income is derived from international sales. Fluctuations of the United States dollar against foreign currencies and changes in local regulatory or economic conditions, particularly in an emerging market such as China, could adversely affect operating results.
We depend on a single or limited number of suppliers for certain critical materials used in the production of our substrates, such as quartz tubing and polishing solutions. We generally purchase these materials through standard purchase orders and not pursuant to long-term supply contracts.
Financial instruments that potentially subject us to concentration of credit risk consist primarily of cash equivalents, short-term investments, and trade accounts receivable. We invest primarily in money market accounts, commercial paper instruments, and investment grade securities with high quality financial institutions. The composition and maturities are regularly monitored by management. Such deposits are in excess of the amount of the insurance provided by the federal government on such deposits. We are exposed to credit risks in the event of default by the issuers to the extent of the amount recorded on the consolidated balance sheets.
We perform ongoing credit evaluations of our customers’ financial condition, and limit the amount of credit extended when deemed necessary, but generally do not require collateral. The credit risk in our accounts receivable is substantially mitigated by our credit evaluation process, reasonably short collection terms and the geographical dispersion of sales transactions. One customer accounted for 20% and 28% of our trade accounts receivable balance as of December 31, 2013 and 2012, respectively.
No customer represented more than 10% of our revenue for the year ended December 31, 2013 while one customer represented 17% and 18% of revenue for the years ended December 31, 2012 and 2011, respectively. Our top five customers, although not the same five customers for each period
,
represented 31%, 37% and 35% of revenue for the years ended December 31, 2013, 2012 and 2011, respectively. We expect that sales to a small number of customers will continue to comprise a significant portion of our revenue in the future.
Cash and Cash Equivalents
We consider investments in highly liquid instruments purchased with an original maturity of three months or less to be cash equivalents. Cash equivalents consist primarily of money market funds. Cash and cash equivalents are stated at cost, which approximates fair value.
Short-Term and Long-Term Investments
We classify our investments in debt and equity securities as available-for-sale securities in accordance with ASC topic 320,
Investments
-
Debt and Equity Securities
(“ASC 320”)
.
Short-term and long-term investments are comprised of available-for-sale marketable debt securities, which consist primarily of certificates of deposit, U.S. government securities, and investment-grade corporate notes and bonds.
These investments are reported at fair value as of the respective balance sheet dates with unrealized gains and losses included in accumulated other comprehensive income within stockholders’ equity on the consolidated balance sheets. The amortized cost of securities is adjusted for amortization of premiums and accretion of discounts to maturity. Such amortization is included in “other income (expense), net” in the consolidated statements of operations. Realized gains and losses and declines in value judged to be other than temporary on available-for-sale securities are also included in “other income (expense), net” in the consolidated statements of operations. The cost of securities sold is based upon the specific identification method.
Accounts Receivable and Allowance for Doubtful Accounts and Sales Returns
Accounts receivable are recorded at the invoiced amount and are not interest bearing. We periodically review the likelihood of collection on our accounts receivable balances and provide an allowance for doubtful accounts receivable primarily based upon the age of these accounts. We evaluate receivables from U.S. customers with an emphasis on balances in excess of 90 days and for receivables from customers located outside the U.S. with an emphasis on balances in excess of 120 days and
establish a
reserve allowance on the receivable balances if needed. We assess the probability of collection based on a number of factors, including the length of time a receivable balance has been outstanding, our past history with the customer and their credit worthiness. We exercise judgment when determining the adequacy of these reserves as we evaluate historical bad debt trends, general economic conditions in the United States and internationally, and changes in customer financial conditions. Uncollectible receivables are recorded as bad debt expense when all efforts to collect have been exhausted and recoveries are recognized when they are received. As of December 31, 2013 and December 31, 2012, our accounts receivable, net, balance was $14.9 million and $17.9 million, respectively, which was net of an allowance for doubtful accounts of $869,000 and zero, respectively. During 2013 we increased our allowance for doubtful accounts by $869,000 because of the poor financial condition of a few customers in China. During 2011, we decreased this allowance for doubtful accounts by $99,000 primarily for improved collections worldwide. No amounts have been written off. If actual uncollectible accounts differ substantially from our estimates, revisions to the estimated allowance for doubtful accounts would be required, which could have a material impact on our financial results for future periods.
The allowance for sales returns is also deducted from gross accounts receivable. During 2013, we utilized $189,000 and charged an additional $130,000 resulting in the allowance for sales returns of $186,000 as of December 31, 2013. During 2012, we utilized $426,000 and charged an additional $547,000 resulting in the allowance for sales returns of $245,000 as of December 31, 2012. During 2011, we utilized $144,000 and reduced allowance of $194,000
from the beginning balance of $462,000
resulting in the allowance for sales returns of $124,000 as of December 31, 2011.
Warranty Reserve
Warranty reserve is based upon our claims experience during the prior twelve months. Warranty costs are accrued at the time revenue is recognized. As of December 31, 2013 and 2012, accrued product warranties totaled $1.0 million and $588,000, respectively. The increase in accrued product warranties is primarily attributable to increased claims for quality issues experienced by some customers. If actual warranty costs differ substantially from our estimates, revisions to the estimated warranty liability would be required, which could have a material impact on our financial condition and results of operations for future periods.
Inventories
Inventories are stated at the lower of cost (approximated by standard cost) or market. Cost is determined using the weighted average cost method. Our inventory consists of raw materials as well as finished goods and work-in-process that include material, labor and manufacturing overhead costs. We routinely evaluate the levels of our inventory in light of current market conditions in order to identify excess and obsolete inventory, and we provide a valuation allowance for certain inventories based upon the age and quality of the product and the projections for sale of the completed products.
Property, Plant and Equipment
Property, plant and equipment are stated at cost less accumulated depreciation computed using the straight-line method over the estimated economic lives of the assets, which vary from 3 to 27.5 years. Leasehold improvements are amortized using the straight-line method over the shorter of the estimated useful life or the term of the lease. We generally depreciate computers, software, office equipment, furniture and fixtures over 3 years, automobiles over 5 years, leasehold and building improvements over 10 years, or lease term if shorter, and buildings over 27.5 years. Repairs and maintenance costs are expensed as incurred.
Impairment of Long-Lived Assets
We evaluate the recoverability of property, equipment and intangible assets in accordance with ASC topic 360,
Property, Plant and Equipment
(“ASC 360”). When events and circumstance indicate that long-lived assets may be impaired, our management compares the carrying value of the long-lived assets to the projection of future undiscounted cash flows attributable to such assets. In the event that the carrying value exceeds the future undiscounted cash flows, we record an impairment charge against income equal to the excess of the carrying value over the asset’s fair value. Fair values are determined based on quoted market values, discounted cash flows or internal and external appraisals, as applicable. We did not recognize any impairment charges of long-lived assets in 2013, 2012 and 2011.
Impairment of Investments
All available-for-sale securities are periodically reviewed for impairment. Investments are considered to be impaired when its fair value is less than its amortized cost basis and it is more likely than not that we will be required to sell the impaired security before recovery of its amortized cost basis. Factors considered in determining whether a loss is temporary include the magnitude of the decline in market value, the length of time the market value has been below cost (or adjusted cost), credit quality, and our ability and intent to hold the securities for a period of time sufficient to allow for any anticipated recovery in market value.
We also invest in equity instruments of privately-held companies for business and strategic purposes. These investments are classified as other assets and are accounted for under the
equity or
cost method as we do not have the ability to exercise significant influence over their operations. We monitor our investments for impairment and record reductions in carrying value when events or changes in circumstances indicate that the carrying value may not be recoverable. Determination of impairment is highly subjective and is based on a number of factors, including an assessment of the strength of investee’s management, the length of time and extent to which the fair value has been less than our cost basis, the financial condition and near-term prospects of the investee, fundamental changes to the business prospects of the investee, share prices of subsequent offerings, and our intent and ability to hold the investment for a period of time sufficient to allow for any anticipated recovery in our carrying value.
We estimate fair value of our cost method investments considering available information
such as pricing in recent rounds of financing, current cash positions, earnings and cash flow forecasts, recent operational performance and any other readily available market data.
Segment Reporting
We operate in one segment for the design, development, manufacture and distribution of high-performance compound semiconductor substrates and sale of materials. In accordance with ASC topic 280,
Segment Reporting,
our chief operating decision-maker has been identified as the chief executive officer, who reviews operating results to make decisions about allocating resources and assessing our performance. While we obtain financial statements from all of our joint ventures in order to prepare our consolidated financial statements, we do not review them either individually or in the aggregate when making operating decisions for our business. We manage our Company on a consolidated basis with a review of revenue by product. We discuss revenue and capacity for both AXT and our joint ventures collectively, when determining capacity constraints and need for raw materials in our business, and consider their capacity when determining our strategic and product marketing and advertising strategies. While we consolidate our majority-owned joint ventures, we do not allocate resources to any of them, nor allocate any portion of overhead, interest and other income, interest expense or taxes to them. We therefore have determined that our joint venture operations do not constitute an operating segment.
Stock‑Based Compensation
We have employee stock option plans, which are described more fully in Note 11—Employee Benefit Plans and Stock-based Compensation. We account for stock‑based compensation in accordance with the provisions of ASC topic 718,
Compensation-Stock Compensation
(“ASC 718”). We utilize the Black-Scholes option pricing model to determine the fair value of the stock options granted. Stock‑based compensation cost is measured at each grant date, based on the fair value of the award, and is recognized as expense over the requisite service period of the award. All of our stock compensation is accounted for as an equity instrument.
Research and Development
Research and development costs consist primarily of salaries including stock-based compensation expense and related personnel costs, depreciation and product testing and are expensed as incurred.
Advertising Costs
Advertising costs, included in selling, general and administrative expenses, are expensed as incurred. Advertising costs for the years ended December 31, 2013, 2012, and 2011 were $12,000, $19,000 and $16,000, respectively.
Shipping and Handling costs
We include fees billed to customers and costs incurred for shipping and handling as a component of cost of sales.
Income Taxes
We account for income taxes in accordance with ASC topic 740,
Income Taxes
(“ASC 740”) which requires that deferred tax assets and liabilities be recognized using enacted tax rates for the effect of temporary differences between the book and tax bases of recorded assets and liabilities. ASC 740 also requires that deferred tax assets be reduced by a valuation allowance if it is more likely than not that a portion of the deferred tax asset will not be realized. The impact of ASC 740 is more fully described in Note 13.
Comprehensive Income (loss)
We report comprehensive income (loss) in accordance with the provisions of ASC topic 220
Comprehensive Income
(“ASC 220”) which establishes standards for reporting comprehensive income or loss and its components in the financial statements. The components of other comprehensive income consist of unrealized gains and losses on marketable securities and foreign currency translation adjustments. Comprehensive income is presented in the consolidated statements of comprehensive income (loss).
Net Income (loss) Per Share
Basic net income (loss) per share is computed using the weighted average number of common shares outstanding during the periods less shares of common stock subject to repurchase and non-vested stock awards. Diluted net income (loss) per share is computed using the weighted average number of common shares outstanding and potentially dilutive common shares outstanding during the periods. The dilutive effect of outstanding stock options and restricted stock awards is reflected in diluted earnings per share by application of the treasury stock method. Potentially dilutive common shares consist of common shares issuable upon the exercise of stock options and vesting of restricted stock awards.
Recent Accounting Pronouncements
In February 2013, the FASB issued Accounting Standards Update (“ASU”) No. 2013-02,
Other Comprehensive Income (Topic 220).
The amendments in this Update supersede and replace the presentation requirements for reclassifications out of accumulated other comprehensive for all public and private organizations. The amendments require an entity to provide additional information about reclassifications out of accumulated other comprehensive income. The amendments in this Update are effective for the reporting periods beginning after December 15, 2012. The Company is in compliance with the amendments as of December 31, 2013.
In July 2013, the FASB issued Accounting Standards Update (“ASU”) No. 2013-11,
Income Taxes (Topic 740).
The amendments in this Update provide guidance on the financial statement presentation of an unrecognized tax benefit when a net operating loss carryforward, similar tax loss, or tax credit carryforward exists. An unrecognized tax benefit, or a portion of an unrecognized tax benefit, should be presented in the financial statements as a reduction to a deferred tax asset for a net operating loss carryforward, a similar tax loss, or a tax credit carryforward. The amendments in this Update are effective for fiscal years, and interim periods within those years, beginning after December 15, 2013. The Company will begin complying with this during the first quarter of fiscal 2014 which will just alter our required presentation of these tax matters.
Note 2. Cash, Cash Equivalents and Investments
Our cash, cash equivalents and investments are classified as follows (in thousands):
|
|
December 31, 2013
|
December 31, 2012
|
||||||||||||||||||||||||||||||
|
|
Amortized
Cost |
Gross
Unrealized Gain |
Gross
Unrealized (Loss) |
Fair
Value |
Amortized
Cost |
Gross
Unrealized Gain |
Gross
Unrealized (Loss) |
Fair
Value |
||||||||||||||||||||||||
|
Classified as:
|
|
|
|
|
|
|
|
|
||||||||||||||||||||||||
|
Cash
|
$
|
24,852
|
$
|
—
|
$
|
—
|
$
|
24,852
|
$
|
26,250
|
$
|
—
|
$
|
—
|
$
|
26,250
|
||||||||||||||||
|
Cash equivalents:
|
||||||||||||||||||||||||||||||||
|
Money market fund
|
109
|
—
|
—
|
109
|
4,384
|
—
|
—
|
4,384
|
||||||||||||||||||||||||
|
Total cash and cash equivalents
|
24,961
|
—
|
—
|
24,961
|
30,634
|
—
|
—
|
30,634
|
||||||||||||||||||||||||
|
Investments(available for sale):
|
||||||||||||||||||||||||||||||||
|
Certificates of Deposit
|
6,320
|
2
|
(4
|
)
|
6,318
|
6,638
|
9
|
(2
|
)
|
6,645
|
||||||||||||||||||||||
|
Corporate bonds
|
14,276
|
8
|
(6
|
)
|
14,278
|
12,872
|
7
|
(63
|
)
|
12,816
|
||||||||||||||||||||||
|
Corporate equity security
|
125
|
1,923
|
—
|
2,048
|
—
|
—
|
—
|
—
|
||||||||||||||||||||||||
|
Total investments
|
20,721
|
1,933
|
(10
|
)
|
22,644
|
19,510
|
16
|
(65
|
)
|
19,461
|
||||||||||||||||||||||
|
Total cash, cash equivalents and investments
|
$
|
45,682
|
$
|
1,933
|
$
|
(10
|
)
|
$
|
47,605
|
$
|
50,144
|
$
|
16
|
$
|
(65
|
)
|
$
|
50,095
|
||||||||||||||
|
Contractual maturities on investments:
|
||||||||||||||||||||||||||||||||
|
Due within 1 year
|
$
|
10,569
|
$
|
12,499
|
$
|
10,288
|
$
|
10,270
|
||||||||||||||||||||||||
|
Due after 1 through 5 years
|
10,152
|
10,145
|
9,222
|
9,191
|
||||||||||||||||||||||||||||
|
|
$
|
20,721
|
$
|
22,644
|
$
|
19,510
|
$
|
19,461
|
||||||||||||||||||||||||
We manage our investments as a single portfolio of highly marketable securities that is intended to be available to meet our current cash requirements. We have no investments in auction rate securities. There were no sales of available-for-sales securities and no realized gains and losses for the year ended December 31, 2013 and 2012. For the year ended December 31, 2011, we had $8,000 gross realized losses on sales of our available-for-sale securities.
Also included in short-term investments
at December 31, 2013
is our investment in common stock of Intelligent Epitaxy Technology, Inc (IntelliEPI), a Taiwan publicly-traded company. We began classifying this asset as an available-for- sale security upon its initial public offering (IPO) in 2013. Prior to the IPO in 2013, we sold some of our stock in IntelliEPI and realized a gain of approximately $800,000. An unrealized gain of $1.6 million net of tax was recorded in 2013 for the write-up to market valuation. These securities are valued at fair market value at December 31, 2013. There is no assurance that the Company will realize this value when the securities are sold in the future.
The gross unrealized losses related to our portfolio of available-for-sale securities were primarily due to changes in interest rates and market and credit conditions of the underlying securities. We have determined that the gross unrealized losses on some of our available-for-sale securities as of December 31, 2013 are temporary in nature. We periodically review our investment portfolio to identify and evaluate investments that have indications of possible impairment. Factors considered in determining whether a loss is temporary include the magnitude of the decline in market value, the length of time the market value has been below cost (or adjusted cost), credit quality, and our ability and intent to hold the securities for a period of time sufficient to allow for any anticipated recovery in market value.
The following table summarizes the fair value and gross unrealized losses related to available-for-sale securities, aggregated by investment category and length of time that individual securities have been in a continuous unrealized loss position as of December 31, 2013 (in thousands):
|
In Loss Position
< 12 months |
In Loss Position
> 12 months |
Total In
Loss Position |
||||||||||||||||||||||
|
Fair
Value
|
Gross
Unrealized
|
Fair
Value
|
Gross
Unrealized
|
Fair
Value
|
Gross
Unrealized
|
|||||||||||||||||||
| Investments: | ||||||||||||||||||||||||
|
Certificates of deposit
|
$
|
3,425
|
$
|
(4
|
)
|
$
|
720
|
$
|
(0
|
)
|
$
|
4,145
|
$
|
(4
|
)
|
|||||||||
|
Corporate bonds
|
4,473
|
(5
|
) |
3,711
|
(1
|
) |
8,184
|
(6
|
) | |||||||||||||||
|
Total in loss position
|
$
|
7,898
|
$
|
(9
|
)
|
$
|
4,431
|
$
|
(1
|
)
|
$
|
12,329
|
$
|
(10
|
)
|
|||||||||
The following table summarizes the fair value and gross unrealized losses related to available-for-sale securities, aggregated by investment category and length of time that individual securities have been in a continuous unrealized loss position as of December 31, 2012 (in thousands):
|
In Loss Position
< 12 months |
In Loss Position
> 12 months |
Total In
Loss Position |
||||||||||||||||||||||
|
Fair
Value
|
Gross
Unrealized
|
Fair
Value
|
Gross
Unrealized
|
Fair
Value
|
Gross
Unrealized
|
|||||||||||||||||||
| Investments: | ||||||||||||||||||||||||
|
Certificates of deposit
|
$
|
1,877
|
$
|
(1
|
)
|
$
|
199
|
$
|
(1
|
)
|
$
|
2,076
|
$
|
(2
|
)
|
|||||||||
|
Corporate bonds
|
6,446
|
(40
|
) |
1,502
|
(23
|
) |
7,948
|
(63
|
) | |||||||||||||||
|
Total in loss position
|
$
|
8,323
|
$
|
(41
|
)
|
$
|
1,701
|
$
|
(24
|
)
|
$
|
10,024
|
$
|
(65
|
)
|
|||||||||
Investments in Privately-held Companies
We have made strategic investments in private companies located in China in order to gain access at a competitive cost to raw materials that are critical to our substrate business (see Note 6). The investment balances for all the companies, including minority investments indirectly in privately-held companies by our consolidated joint ventures, accounted for under the equity method are included in “other assets” in the consolidated balance sheets and totaled $10.9 million and $9.4 million as of December 31, 2013 and 2012, respectively.
We also maintain minority investments in companies which are accounted for under the cost method as we do not have the ability to exercise significant influence over their operations. We had two companies which are accounted for under the cost method in 2012 and one company in 2013. In 2013, one of the two investments was re-categorized as available for sale short-term investments and written-up to market value. Our investments under the cost method are reviewed for other than temporary declines in value on a quarterly basis. We monitor our investments for impairment and record reductions in carrying value when events or changes in circumstances indicate that the carrying value may not be recoverable. As of December 31, 2013 and 2012, our investments in these unconsolidated companies had a carrying value of $200,000 and $392,000, respectively, and were also included in “other assets” in the condensed consolidated balance sheets.
Fair Value Measurements
ASC topic 820, Fair value measurement (“ASC 820”) establishes three levels of inputs that may be used to measure fair value. Level 1 instrument valuations are obtained from real-time quotes for transactions in active exchange markets involving identical assets. Level 2 instrument valuations are obtained from readily-available pricing sources for comparable instruments. Level 3 instrument valuations are obtained from unobservable inputs in which there is little or no market data, which require us to develop our own assumptions. As of December 31, 2013, we did not have any Level 3 assets or liabilities. On a recurring basis, we measure certain financial assets and liabilities at fair value, primarily consisting of our short-term and long-term investments.
The type of instrument valued based on quoted market prices in active markets include our money market funds, which are generally classified within Level 1 of the fair value hierarchy. Other than corporate equity securities which are based on quoted market prices and classified as Level 1, we classify our available-for-sale securities including certificates of deposit, corporate bonds as having Level 2 inputs. The valuation techniques used to measure the fair value of these financial instruments having Level 2 inputs were derived from quoted market prices, broker or dealer quotations, or alternative pricing sources with reasonable levels of price transparency. There were no changes in valuation techniques or related inputs in the year ended December 31, 2013.
There have been no transfers between fair value measurement levels during the year ended December 31
, 2013.
The following table summarizes our financial assets and liabilities measured at fair value on a recurring basis in accordance with ASC 820 as of December 31, 2013 (in thousands):
|
|
Balance as of
December 31, 2013 |
Quoted Prices in
Active Markets of Identical Assets (Level 1) |
Significant Other
Observable Inputs (Level 2) |
|||||||||
|
Assets:
|
|
|
|
|||||||||
|
Cash equivalents and investments:
|
|
|
|
|||||||||
|
Money market fund
|
$
|
109
|
$
|
109
|
$
|
—
|
||||||
|
Certificates of deposit
|
6,318
|
—
|
6,318
|
|||||||||
|
Corporate bonds
|
14,278
|
—
|
14,278
|
|||||||||
|
Corporate equity securities
|
2,048
|
2,048
|
—
|
|||||||||
|
Total
|
$
|
22,753
|
$
|
2,157
|
$
|
20,596
|
||||||
|
Liabilities
|
$
|
—
|
$
|
—
|
$
|
—
|
||||||
The following table summarizes our financial assets and liabilities measured at fair value on a recurring basis in accordance with ASC 820 as of December 31, 2012 (in thousands):
|
|
Balance as of
December 31, 2012 |
Quoted Prices in
Active Markets of Identical Assets (Level 1) |
Significant Other
Observable Inputs (Level 2) |
|||||||||
|
Assets:
|
|
|
|
|||||||||
|
Cash equivalents and investments:
|
|
|
|
|||||||||
|
Money market fund
|
$
|
4,384
|
$
|
4,384
|
$
|
—
|
||||||
|
Certificates of deposit
|
6,645
|
—
|
6,645
|
|||||||||
|
Corporate bonds
|
12,816
|
—
|
12,816
|
|||||||||
|
Total
|
$
|
23,845
|
$
|
4,384
|
$
|
19,461
|
||||||
|
Liabilities
|
$
|
—
|
$
|
—
|
$
|
—
|
||||||
Items Measured at Fair Value on a Nonrecurring Basis
Certain assets that are subject to nonrecurring fair value measurements are not included in the table above. These assets include investments in privately-held companies accounted for by equity and cost method (See Note 6). We did not record other-than-temporary impairment charges for either of these investments during 2013.
Note 3. Inventories
The components of inventory are summarized below (in thousands):
|
|
As of December 31,
|
|||||||
|
|
2013
|
2012
|
||||||
|
Inventories:
|
|
|
||||||
|
Raw materials
|
$
|
21,063
|
$
|
20,003
|
||||
|
Work in process
|
14,027
|
15,608
|
||||||
|
Finished goods
|
4,037
|
4,741
|
||||||
|
|
$
|
39,127
|
$
|
40,352
|
||||
As of December 31, 2013 and 2012, carrying values of inventories were net of inventory reserve of $11.0 million and $10.1 million, respectively, for excess and obsolete inventory.
Note 4. Related Party Transactions
In August 2011, our consolidated joint venture, Beijing JiYa Semiconductor Material Co., Ltd (JiYa), entered into a non-interest bearing note agreement in the amount of $1.7 million (Rmb 10,485,200) with one of its equity investment entities. Under the loan agreement, JiYa loaned $811,000 (Rmb 4,959,000) to its equity investment entity in August 2011 and the remaining amount of $904,000 (Rmb 5,526,200) was loaned during the three months ended March 31, 2012. The original term of the loan is two years and ten months and the loan is payable to JiYa in three installments with the first installment of $429,000 (Rmb 2,620,000) due in December 2012, the second installment of $857,000 (Rmb 5,240,000) due in December 2013, and the last installment of $429,000 (Rmb 2,625,200) due in May 2014.
In December, 2012 and June 2013, the parties signed two addendums to the note agreement to delay the first repayment of $429,000 (Rmb 2,620,000) to June 2013 and June 2014, respectively. In December 2013, the parties agreed to delay all three repayments to December 2016. As of December 31, 2013, we included $1.7 million (Rmb
10,485,200
) in “Related party notes receivable – long term” in our consolidated balance sheets. As of December 31, 2012, we included $1.2 million (Rmb 7,860,000) in “Related party notes receivable – short term” and $416,000 (Rmb 2,625,200) in “related party notes receivable – long term” in the consolidated balance sheets.
In August 2011, our consolidated joint venture, Nanjing Jin Mei Gallium Co., Ltd. (Jin Mei) loaned $818,000 (Rmb 5,000,000) to its equity investment entity for construction purposes. During the three months ended December 31, 2012, the parties signed a note agreement retroactively to set forth the terms for the loan. The loan bears interest at 6.7% per annum, subject to adjustment to market rate, and the principal is due on December 31, 2013. Interest income of $54,000 (RMB 333,000) and $76,000 (Rmb 478,000), including retroactive interest income of $23,000 (Rmb 144,000) for 2011, were included in “other income (expense), net” in the consolidated statements of operations for the year ended December 31, 2013 and 2012, respectively. In December 2013, the repayment of the principal $
818,000
(RMB 5,000,000) was received by our consolidated joint venture. As of December 31, 2013 and 2012, we included $0 and $792,000 (RMB 5,000,000) in “related party notes receivable – short term” in our consolidated balance sheets. Beginning in 2012, JiYa is contractually obligated under an agency sales agreement to sell raw material on behalf of one of its equity investment entities. Jiya bills to the customers and remits the receipts, net of its portions of sales commission, to this equity investment entity. For the year ended December 31, 2013 and 2012, JiYa has recorded $23,000 and $70,000 income from agency sales, respectively, which was included in “other income (expense), net” in the consolidated statements of operations. As of December 31, 2013 and 2012, amounts payable of $0 and $257,000, respectively, to this equity investment entity for delivery in transit were included in “accrued liabilities” in our consolidated balance sheets.
JiYa also purchases raw materials from one of its equity investment entities for production in the ordinary course of business. As of December 31, 2013 and 2012, payables of $1.5 million and $1.1 million were included in “accounts payable” in the consolidated balance sheets.
Beginning in 2012, Jin Mei is contractually obligated under an agency sales agreement to sell raw material on behalf of its equity investment entity. Jin Mei bills to the customers and remits the receipts, net of its portions of sales commission, to this equity investment entity. For the year ended December 31, 2013 and 2012, Jin Mei has recorded $128,000 and $144,000 income from agency sales, respectively, which were included in “other income (expense), net” in the consolidated statements of operations.
In March 2012, our wholly-owned subsidiary, Beijing Tongmei Xtal Technology Co., Ltd. (Tongmei), entered into an operating lease for the land it owns with our consolidated joint venture Beijing BoYu Semiconductor Vessel Craftwork Technology Co., Ltd. The lease agreement for the land with approximately 22,081 square feet commenced on January 1, 2012 for a term of 10 years with annual lease payments of $24,000 (Rmb 150,000) subject to a 5% increase at each third year anniversary. The annual lease payment is due by January 31 of each year.
Our wholly-owned subsidiary, Beijing Tongmei Xtal Technology Co, Ltd., has paid $121,000 (Rmb 740,924) on behalf of Donghai County Dongfang High Purity Electronic Materials Co., Ltd. its equity investment entity, to purchase materials. As of December 31, 2013, this balance was included in "prepaid expenses and other current assets" in our consolidated balance sheets.
Our Related Party Transactions Policy seeks to prohibit all conflicts of interest in transactions between related parties and us, unless they have been approved by our Board of Directors. This policy applies to all of our employees and directors, our subsidiaries and our joint ventures. Our executive officers retain board seats on the Board of Directors of the companies in which we have invested in our China joint ventures. See Note 6 for further details.
Note 5. Property, Plant and Equipment, Net
The components of our property, plant and equipment are summarized below (in thousands):
|
|
As of December 31,
|
|||||||
|
|
2013
|
2012
|
||||||
|
Property, plant and equipment:
|
|
|
||||||
|
Building
|
$
|
30,369
|
$
|
28,089
|
||||
|
Machinery and equipment
|
40,764
|
37,334
|
||||||
|
Leasehold improvements
|
4,493
|
3,578
|
||||||
|
Construction in progress
|
2,879
|
3,946
|
||||||
|
|
78,505
|
72,947
|
||||||
|
Less: accumulated depreciation and amortization
|
(40,884
|
)
|
(35,712
|
)
|
||||
|
|
$
|
37,621
|
$
|
37,235
|
||||
Depreciation and amortization expense was $5.5 million, $3.9 million, and $3.4 million for the years ended 2013, 2012, and 2011, respectively.
Note 6. Investments in Privately-held Companies
We have made strategic investments in private companies located in China in order to gain access to raw materials at a competitive cost that are critical to our substrate business.
Our investments are summarized below (in thousands):
|
|
Investment Balance as of
|
|
|
||||||||||
|
|
December 31,
|
December 31,
|
Accounting
|
Ownership
|
|||||||||
|
Company
|
2013
|
2012
|
Method
|
Percentage
|
|||||||||
|
Beijing JiYa Semiconductor Material Co., Ltd
|
$
|
3,331
|
$
|
3,331
|
Consolidated
|
46
|
%
|
||||||
| Nanjing Jin Mei Gallium Co., Ltd |
592
|
592
|
Consolidated
|
83
|
% | ||||||||
| Beijing BoYu Semiconductor Vessel Craftwork Technology Co., Ltd |
1,346
|
410
|
Consolidated
|
70
|
% | ||||||||
|
|
$
|
5,269
|
$
|
4,333
|
|
||||||||
|
Donghai County Dongfang High Purity Electronic Materials Co., Ltd.
|
$
|
1,900
|
$
|
2,038
|
Equity
|
46
|
%
|
||||||
|
Xilingol Tongli Germanium Co. Ltd
|
4,692
|
4,246
|
Equity
|
25
|
%
|
||||||||
| Emeishan Jia Mei High Purity Metals Co., Ltd | 945 |
1,042
|
Equity
|
25
|
%
|
||||||||
|
|
$
|
7,537
|
$
|
7,326
|
|
||||||||
Our ownership of Beijing JiYa Semiconductor Material Co., Ltd. (JiYa) is 46%. We continue to consolidate JiYa as we have significant influence in management and have majority control of the board. Our Chief Executive Officer is chairman of the JiYa board, while our president of China operations and our vice president of China administration and our vice president of wafer production are also members of the board.
Our ownership of Nanjing Jin Mei Gallium Co., Ltd. (Jin Mei) is 83%. We continue to consolidate Jin Mei as we have significant influence in management and have majority control of the board. Our Chief Executive Officer is chairman of the Jin Mei board, while our president of China operations and our vice president of China administration are also members of the board.
Our ownership of Beijing BoYu Semiconductor Vessel Craftwork Technology Co., Ltd (BoYu) is 70%. We continue to consolidate BoYu as we have a significant influence in management and have majority control of the board. Our Chief Executive Officer is chairman of the BoYu board, while our president of China operations and our vice president of China administration are also members of the board.
Although we have representation on the boards of directors of each of these companies, the daily operations of each of these companies are managed by local management and not by us. Decisions concerning their respective short term strategy and operations, any capacity expansion and annual capital expenditures, and decisions concerning sales of finished product, are made by local management with some inputs from us.
During 2013, 2012 and 2011, the three consolidated joint ventures generated $3.5 million, $7.4 million and $12.5 million of income, respectively, of which $1.1 million, $3.0 million and $5.5 million, respectively was allocated to minority interests, resulting in $2.4 million, $4.4 million and $7.0 million, respectively to our net income.
For the three equity investment entities that are not consolidated, the investment balances are included in “other assets” in our consolidated balance sheets and totaled $7.5 million and $7.3 million as of December 31, 2013 and 2012, respectively. We own 46% of the ownership interests in one of these companies and 25% in each of the other two companies. These three companies are not considered variable interest entities because:
| · | all three companies have sustainable businesses of their own; |
| · | our voting power is proportionate to our ownership interests; |
| · | we only recognize our respective share of the losses and/or residual returns generated by the companies if they occur; and |
| · | we do not have controlling financial interest in, do not maintain operational or management control of, do not control the board of directors of, and are not required to provide additional investment or financial support to any of these companies. |
These three equity investment entities had gross equity earnings of $270,000, $379,000 and $520,000 for the years ended December 31, 2013, 2012 and 2011 respectively, and was recorded as “equity in earnings of unconsolidated joint ventures” in the consolidated statements of operations.
Net income recorded from all of the consolidated joint ventures and these equity investment entities was $2.6 million, $4.7 million and $7.6 million for the years ended December 31, 2013, 2012 and 2011, respectively.
We also maintain minority investments indirectly in privately-held companies by our consolidated joint ventures. These minority investments are accounted for under the equity method in the books of our consolidated joint ventures. As of December 31, 2013 and 2012, our consolidated joint ventures included these minority investments in “other assets” in the consolidated balance sheets with a carrying value of $3.4 million and $2.0 million, respectively.
All the minority investment entities that are not consolidated and accounted for under the equity method had the following summarized operating information (in thousands) for the years ended December 31, 2013, 2012 and 2011, respectively.
|
|
Years Ended
December 31, |
Our share for the
Years Ended December 31, |
||||||||||||||||||||||
|
|
2013
|
2012
|
2011
|
2013
|
2012
|
2011
|
||||||||||||||||||
|
Net Revenue
|
$
|
41,257
|
$
|
32,858
|
$
|
21,340
|
$
|
10,240
|
$
|
8,091
|
$
|
5,196
|
||||||||||||
|
Gross profit
|
13,836
|
11,057
|
7,576
|
3,328
|
2,643
|
1,814
|
||||||||||||||||||
|
Operating income
|
8,174
|
6,310
|
3,819
|
1,820
|
1,409
|
863
|
||||||||||||||||||
|
Net income
|
6,315
|
5,665
|
2,900
|
1,377
|
1,281
|
741
|
||||||||||||||||||
All the minority investment entities that are not consolidated and accounted for under the equity method had the following summarized balance sheet information (in thousands) as of December 31, 2013 and 2012, respectively.
|
|
As of December 31,
|
|||||||
|
|
2013
|
2012
|
||||||
|
Current assets
|
$
|
22,139
|
$
|
20,594
|
||||
|
Noncurrent assets
|
38,941
|
37,555
|
||||||
|
Current liabilities
|
15,289
|
20,772
|
||||||
|
Noncurrent liabilities
|
2,296
|
2,873
|
||||||
All the minority investment entities that are not consolidated and accounted for under the equity method had gross equity earnings of $1.4 million, $1.3 million and $741,000 for the years ended December 31, 2013, 2012 and 2011, respectively. Dividends received from these minority investment entities were $396,000, 277,000 and $357,000 for the years ended December 31, 2013, 2012 and 2011, respectively. Undistributed retained earnings relating to our investments in all these minority investment entities were $5.3 million and $4.3 million as of December 31, 2013 and 2012, respectively.
Note 7. Other Investments
As of December 31, 2013, we maintain minority investments in one privately-held company accounted for under the cost method as we do not have the ability to exercise significant influence over its operations. Our investments in this privately-held company is reviewed for other than temporary declines in value on a quarterly basis. We monitor our investments for impairment and record reductions in carrying value when events or changes in circumstances indicate that the carrying value may not be recoverable. Reasons for other than temporary declines in value include whether the related company would have insufficient cash flow to operate for the next twelve months, significant changes in the operating performance and changes in market conditions. We had two companies which are accounted for under the cost method in 2012 and one company in 2013. In 2013, one of the two investments was re-categorized as available for sale short-term investments and written-up to market value after its initial public offering. As of December 31, 2013 and 2012, our cost method investments had a carrying value of $200,000 and 392,000, respectively, and are included in “other assets” in the consolidated balance sheets.
Note 8. Accrued Liabilities
The components of accrued liabilities are summarized below (in thousands):
|
|
As of December 31,
|
|||||||
|
|
2013
|
2012
|
||||||
|
Accrued compensation and related charges
|
$
|
1,762
|
$
|
2,066
|
||||
|
Accrued product warranty
|
1,048
|
588
|
||||||
|
Current portion of royalty payments
|
800
|
800
|
||||||
|
Accrued professional services
|
543
|
609
|
||||||
|
Dividends payable by consolidated joint ventures
|
649
|
—
|
||||||
|
Accrued income taxes
|
125
|
640
|
||||||
|
Other accrued liabilities
|
2,359
|
2,499
|
||||||
|
|
$
|
7,286
|
$
|
7,202
|
||||
Note 9. Debt
We have an unused credit facility with a bank that provides for a line of credit of $10.0 million as of December 31, 2013 and 2012, respectively, which is secured by marketable securities we have with the bank and shown as short-term and long-term investments of $18.6 million on our consolidated balance sheets. The annual interest rate is 1.65% over the current 30-day LIBOR (London InterBank Offered Rate). The annual interest rate was approximately 1.9% as of December 31, 2013. There were no outstanding borrowings under this line of credit as of December 31, 2013 and 2012.
Note 10. Stockholders’ Equity and Stock Repurchase Program
Stockholders’ Equity
The 883,000 shares of $0.001 par value Series A preferred stock issued and outstanding as of December 31, 2013 and 2012, valued at $3,532,000 are non-voting and non-convertible preferred stock with a 5.0% cumulative annual dividend rate payable when declared by the board of directors and $4 per share liquidation preference over common stock, and must be paid before any distribution is made to common stockholders. These preferred shares were issued to Lyte Optronics, Inc. stockholders in connection with the completion of our acquisition of Lyte Optronics, Inc. on May 28, 1999.
There were no reclassification adjustments from accumulated other comprehensive income for the years ended December 31, 2013 and 2012.
Stock Repurchase Program
On February 21, 2013, our Board of Directors approved a stock repurchase program pursuant to which we may repurchase up to $6.0 million of our outstanding common stock through February 27, 2014. These purchases can be made from time to time in the open market and are funded from our existing cash balances and cash generated from operations. During 2013, we repurchased approximately 285,000 shares at an average price of $2.51 per share for a total purchase price of $716,000 under the stock repurchase program.
As of December 31, 2013, approximately $5.3 million remained available for future repurchases under this program. See Item 5, Market for Registrant’s Common Equity, Related Stockholder Matters and Issuer Purchases of Equity Securities in Part II.
Note 11. Employee Benefit Plans and Stock-based Compensation
Stock Option Plans and Equity Incentive Plans
In July 1997, our board of directors approved the 1997 Stock Option Plan (“1997 Plan”), which provides for the grant of incentive and non-qualified stock options to our employees, consultants and directors. Under the 1997 Plan, 5,423,583 shares of common stock have been authorized for issuance. Options granted under the 1997 Plan are generally for periods not to exceed ten years (five years if the option is granted to a 10% stockholder) and are granted at the fair market value of the stock at the date of grant as determined by the board of directors. Options granted under the 1997 Plan generally vest 25% at the end of one year and 2.1% each month thereafter, with full vesting after four years.
In May 2007, our shareholders approved our 2007 Equity Incentive Plan (the “2007 Plan”). The 2007 Plan is a restatement of the 1997 Plan which expired in 2007. The 1,928,994 share reserve of the 1997 Plan became the reserve of the 2007 Plan, together with 1,300,000 additional shares approved for issuance under the 2007 Plan. In May 2013, the shareholders approved an additional 2,000,000 shares to be issued under the 2007 plan. Awards may be made under the 2007 Plan are stock options, stock appreciation rights, restricted stock, restricted stock units, performance shares, performance units, deferred compensation awards and other stock‑based awards. Stock options and stock appreciation rights awarded under the 2007 Plan may not be repriced without stockholder approval. Stock options and stock appreciation rights may not be granted below fair market value. Stock options or stock appreciation rights generally shall not be fully vested over a period of less than three years from the date of grant and cannot be exercised more than 10 years from the date of grant. Restricted stock, restricted stock units, and performance awards generally shall not vest faster than over a three-year period (or a twelve‑month period if vesting is based on a performance measure). In December 2008, the 2007 Plan was amended to comply with the applicable requirements under Section 409A of the Internal Revenue Code. As of December 31, 2013, approximately 1,786,000 shares were available for grant under the 2007 Plan.
Stock Options
The following summarizes our stock option activity under the 2007 Plan, and the related weighted average exercise price within each category for each of the years ended December 31, 2011, 2012, and 2013 (in thousands, except per share data):
|
Stock Options
|
Number of
Options Outstanding |
Weighted‑
average Exercise Price |
Weighted‑
average Remaining Contractual Life |
Aggregate
Intrinsic Value |
||||||||||||
|
|
|
|
(in years)
|
|
||||||||||||
|
Balance as of January 1, 2011
|
2,280
|
$ |
3.10
|
6.40
|
$
|
17,030
|
||||||||||
|
Granted
|
367
|
4.79
|
||||||||||||||
|
Exercised
|
(251
|
)
|
2.54
|
|||||||||||||
|
Canceled and expired
|
(16
|
)
|
27.98
|
|||||||||||||
|
Balance as of December 31, 2011
|
2,380
|
3.25
|
6.25
|
$
|
3,456
|
|||||||||||
|
Granted
|
592
|
3.32
|
||||||||||||||
|
Exercised
|
(136
|
)
|
2.17
|
|||||||||||||
|
Canceled and expired
|
(109
|
)
|
4.25
|
|||||||||||||
|
Balance as of December 31, 2012
|
2,727
|
3.28
|
6.71
|
$
|
1,353
|
|||||||||||
|
Granted
|
488
|
2.38
|
||||||||||||||
|
Exercised
|
(331
|
)
|
1.62
|
|||||||||||||
|
Canceled and expired
|
(213
|
)
|
3.60
|
|||||||||||||
|
Balance as of December 31, 2013
|
2,671
|
$
|
3.29
|
6.71
|
$
|
893
|
||||||||||
|
Options vested and expected to vest as of December 31, 2013
|
2,649
|
$
|
3.30
|
6.68
|
$
|
889
|
||||||||||
|
Options exercisable as of December 31, 2013
|
1,666
|
$
|
3.34
|
5.33
|
$
|
786
|
||||||||||
The options outstanding and exercisable as of December 31, 2013 were in the following exercise price ranges (in thousands, except per share data):
|
|
Options Outstanding as of
December 31, 2013 |
Options Vested and
Exercisable as of December 31, 2013 |
||||||||||||||||||
|
Range of
Exercise Price |
Shares
|
Weighted‑average
Exercise Price |
Weighted‑average
Remaining Contractual Life |
Shares
|
Weighted‑Average
Exercise Price |
|||||||||||||||
|
$1.18 ‑ $1.34
|
216
|
$
|
1.26
|
1.17
|
216
|
$
|
1.26
|
|||||||||||||
|
$1.59 ‑ $1.59
|
296
|
$
|
1.59
|
5.34
|
296
|
$
|
1.59
|
|||||||||||||
|
$1.91 ‑ $1.91
|
4
|
$
|
1.91
|
1.87
|
4
|
$
|
1.91
|
|||||||||||||
|
$2.04 ‑ $2.04
|
333
|
$
|
2.04
|
5.82
|
333
|
$
|
2.04
|
|||||||||||||
|
$2.36 ‑ $2.36
|
428
|
$
|
2.36
|
9.84
|
0
|
$
|
0.00
|
|||||||||||||
|
$2.91 ‑ $2.91
|
444
|
$
|
2.91
|
8.85
|
120
|
$
|
2.91
|
|||||||||||||
|
$3.14 ‑ $4.09
|
42
|
$
|
3.66
|
5.06
|
28
|
$
|
3.53
|
|||||||||||||
|
$4.79 ‑ $4.79
|
341
|
$
|
4.79
|
7.59
|
189
|
$
|
4.79
|
|||||||||||||
|
$4.81 ‑ $5.61
|
142
|
$
|
5.27
|
5.69
|
97
|
$
|
5.11
|
|||||||||||||
|
$5.83 ‑ $7.82
|
425
|
$
|
5.96
|
5.61
|
383
|
$
|
5.96
|
|||||||||||||
|
|
2,671
|
$
|
3.29
|
6.71
|
1,666
|
$
|
3.34
|
|||||||||||||
There were 331,000, 136,000 and 251,000 options exercised in the years ended December 31, 2013, 2012 and 2011, respectively. The total intrinsic value of options exercised for the years ended December 31, 2013, 2012 and 2011 was $331,000, $392,000 and $1.6 million, respectively.
As of December 31, 2013, the total unamortized stock-based compensation cost related to unvested stock options granted to employees under our stock option plans was approximately $1.5 million, net of estimated forfeitures of $88,000. This cost is being amortized on a straight-line basis over a weighted‑average period of approximately 2.7 years and will be adjusted for subsequent changes in estimated forfeitures. We did not capitalize any stock‑based compensation to inventory as of December 31, 2013 and 2012, as the amounts are not significant.
Restricted Stock Awards
A summary of activity related to restricted stock awards for the years ended December 31, 2011, 2012 and 2013 is presented below:
|
Stock Awards
|
Shares
|
Weighted‑Average
Grant Date Fair Value |
||||||
|
Non-vested as of January 1, 2011
|
218,405
|
$
|
3.30
|
|||||
|
Granted
|
97,986
|
$
|
5.21
|
|||||
|
Vested
|
(93,264
|
)
|
$
|
2.51
|
||||
|
Non-vested as of December 31, 2011
|
223,127
|
$
|
4.47
|
|||||
|
Granted
|
113,768
|
$
|
3.18
|
|||||
|
Vested
|
(98,172
|
)
|
$
|
3.42
|
||||
|
Non-vested as of December 31, 2012
|
238,723
|
$
|
4.27
|
|||||
|
Granted
|
103,636
|
$
|
2.52
|
|||||
|
Vested
|
(85,127
|
)
|
$
|
4.56
|
||||
|
Forfeited
|
(16,000
|
)
|
$
|
4.03
|
||||
|
Non-vested as of December 31, 2013
|
241,232
|
$
|
3.44
|
|||||
Total grant date fair value of stock awards vested during the years ended December 31, 2013, 2012 and 2011 was $389,000, $336,000 and $234,000, respectively. As of December 31, 2013, we had $681,000 of unrecognized compensation expense related to restricted stock awards, which will be recognized over the weighted average period of 2.5 years.
Common Stock
The following number of shares of common stock were reserved and available for future issuance at December 31, 2013:
|
|
|
|||
|
Options outstanding
|
2,670,528
|
|||
|
Restricted stock awards outstanding
|
241,232
|
|||
|
Stock available for future grant: 2007 Equity Incentive Plan
|
1,785,504
|
|||
|
Total
|
4,697,264
|
|||
Stock-based Compensation
We recorded $1.3 million, $1.2 million and $896,000 of stock‑based compensation in our consolidated statements of operations for the years ended December 31, 2013, 2012 and 2011, respectively. The following table summarizes compensation costs related to our stock‑based compensation awards (in thousands, except per share data):
|
|
Years Ended December 31,
|
|||||||||||
|
|
2013
|
2012
|
2011
|
|||||||||
|
Stock‑based compensation in the form of employee stock options and restricted stock, included in:
|
|
|
|
|||||||||
|
Cost of revenue
|
$
|
22
|
$
|
78
|
$
|
84
|
||||||
|
Selling, general and administrative
|
1,091
|
1,000
|
766
|
|||||||||
|
Research and development
|
164
|
137
|
46
|
|||||||||
|
Total stock‑based compensation
|
1,277
|
1,215
|
896
|
|||||||||
|
Tax effect on stock‑based compensation
|
—
|
—
|
—
|
|||||||||
|
Net effect on net income
|
$
|
1,277
|
$
|
1,215
|
$
|
896
|
||||||
|
Shares used in computing basic net income per share
|
32,700
|
32,144
|
31,872
|
|||||||||
|
Shares used in computing diluted net income per share
|
32,700
|
32,865
|
33,061
|
|||||||||
|
Effect on basic net income per share
|
$
|
(0.04
|
)
|
$
|
(0.04
|
)
|
$
|
(0.03
|
)
|
|||
|
Effect on diluted net income per share
|
$
|
(0.04
|
)
|
$
|
(0.04
|
)
|
$
|
(0.03
|
)
|
|||
We estimate the fair value of stock options using a Black‑Scholes valuation model. There were 488,000, 592,000 and 367,000 stock options granted with weighted‑average grant date fair value of $1.09, $1.79 and $2.65 per share during 2013, 2012 and 2011, respectively. The fair value of options granted was estimated at the date of grant using the following weighted‑average assumptions:
|
|
Years Ended
December 31, |
|||||||||||
|
|
2013
|
2012
|
2011
|
|||||||||
|
Expected term (in years)
|
4.0
|
4.0
|
4.0
|
|||||||||
|
Volatility
|
59.20
|
%
|
72.87
|
%
|
69.84
|
%
|
||||||
|
Expected dividend
|
0
|
%
|
0
|
%
|
0
|
%
|
||||||
|
Risk-free interest rate
|
0.98
|
%
|
0.57
|
%
|
1.00
|
%
|
||||||
The expected term for stock options is based on the observed historical option exercise behavior and post-vesting forfeitures of options by our employees, and the contractual term, the vesting period and the expected term of the outstanding options. Expected volatility is based on the historical volatility of our Company’s common stock. The dividend yield of zero is based on the fact that we have never paid cash dividends and have no present intention to pay cash dividends. The risk-free interest rates are taken from the Daily Federal Yield Curve Rates as of the grant dates as published by the Federal Reserve and represent the yields on actively traded Treasury securities for terms equal to the expected term of the options.
Retirement Savings Plan
We have a 401(k) Savings Plan (“Savings Plan”) which qualifies as a thrift plan under Section 401(k) of the Internal Revenue Code. All full-time U.S. employees are eligible to participate in the Savings Plan after 90 days from the date of hire. Employees may elect to reduce their current compensation by up to the statutory prescribed annual limit and have the amount of such reduction contributed to the 401(k) Plan. We provide matching to employee contributions up to 4% of the employees’ base pay if employees contribute at least 6% of their base pay. If the contribution rate is less than 6% of the base pay, the matching percentage is prorated. Our contributions to to the 401(k) retirement savings plans were $110,000, $900,000, and $610,000 for the years ended December 31, 2013, 2012 and 2011, respectively.
Note 12. Guarantees
Indemnification Agreements
We enter into standard indemnification arrangements with our customers in the ordinary course of business. Pursuant to these arrangements, we indemnify, hold harmless, and agree to reimburse the indemnified parties for losses suffered or incurred by the indemnified party, generally their business partners or customers, in connection with any U.S. patent, or any copyright or other intellectual property infringement claim by any third party with respect to our products. The term of these indemnification agreements is generally perpetual anytime after the execution of the agreement. The maximum potential amount of future payments we could be required to make under these agreements is unlimited. We have never incurred costs to defend lawsuits or settle claims related to these indemnification agreements. As a result, we believe the estimated fair value of these agreements is minimal.
We have entered into indemnification agreements with our directors and officers that require us to indemnify our directors and officers against liabilities that may arise by reason of their status or service as directors or officers, other than liabilities arising from willful misconduct of a culpable nature; to advance their expenses incurred as a result of any proceeding against them as to which they could be indemnified; and to obtain directors’ and officers’ insurance if available on reasonable terms, which we currently have in place.
Product Warranty
We provide warranties for our products for a specific period of time, generally twelve months, against material defects. We provide for the estimated future costs of warranty obligations in cost of sales when the related revenue is recognized. The accrued warranty costs represent the best estimate at the time of sale of the total costs that we expect to incur to repair or replace product parts that fail while still under warranty. The amount of accrued estimated warranty costs are primarily based on historical experience as to product failures as well as current information on repair costs. On a quarterly basis, we review the accrued balances and update the historical warranty cost trends. The following table reflects the change in our warranty accrual which is included in “accrued liabilities” on the condensed consolidated balance sheets, during 2013 and 2012 (in thousands):
|
|
Years Ended
December 31, |
|||||||
|
|
2013
|
2012
|
||||||
|
Beginning accrued warranty and related costs
|
$
|
588
|
$
|
1,003
|
||||
|
Accruals for warranties issued during the year
|
789
|
362
|
||||||
|
Adjustments related to pre-existing warranties including expirations and changes in estimates
|
412
|
(450
|
)
|
|||||
|
Cost of warranty repair
|
(741
|
)
|
(327
|
)
|
||||
|
Ending accrued warranty and related costs
|
$
|
1,048
|
$
|
588
|
||||
Note 13. Income Taxes
Consolidated income before provision for income taxes includes non-U.S. income of approximately $16.7 million, $16.3 million and $22.0 million for the years ended December 31, 2013, 2012 and 2011, respectively. We recorded a current tax provision of $188,000, $853,000, and $2.8 million for the years ended December 31, 2013, 2012 and 2011, respectively. The components of the provision (benefit) for income taxes are summarized below (in thousands):
|
|
Years Ended December 31,
|
|||||||||||
|
|
2013
|
2012
|
2011
|
|||||||||
|
Current:
|
|
|
|
|||||||||
|
Federal
|
$
|
—
|
$
|
—
|
$
|
—
|
||||||
|
State
|
13
|
(113
|
)
|
259
|
||||||||
|
Foreign
|
175
|
966
|
2,536
|
|||||||||
|
Total current
|
188
|
853
|
2,795
|
|||||||||
|
Deferred:
|
||||||||||||
|
Federal
|
—
|
—
|
—
|
|||||||||
|
State
|
—
|
—
|
—
|
|||||||||
|
Total deferred
|
—
|
—
|
—
|
|||||||||
|
Total net provision for income taxes
|
$
|
188
|
$
|
853
|
$
|
2,795
|
||||||
A reconciliation of the effective income tax rates and the U.S. statutory federal income tax rate is summarized below:
|
|
Years Ended December 31,
|
|||||||||||
|
|
2013
|
2012
|
2011
|
|||||||||
|
Statutory federal income tax rate
|
35.0
|
%
|
35.0
|
%
|
35.0
|
%
|
||||||
|
State income taxes, net of federal tax benefits
|
(0.1
|
)
|
(1.0
|
)
|
0.6
|
|||||||
|
Change in valuation allowance
|
(111.8
|
)
|
23.3
|
(11.5
|
)
|
|||||||
|
Stock compensation
|
(1.4
|
)
|
1.5
|
0.3
|
||||||||
|
Foreign rate differences
|
85.3
|
(72.5
|
)
|
(17.1
|
)
|
|||||||
|
Dividend from PRC investee
|
(19.6
|
)
|
30.1
|
3.2
|
||||||||
|
Net loss from privately-held PRC investments
|
2.5
|
(2.6
|
)
|
(0.7
|
)
|
|||||||
|
Other
|
7.3
|
|
(1.6
|
)
|
—
|
|||||||
|
Effective tax rate
|
(2.8
|
%)
|
12.2
|
%
|
9.8
|
%
|
||||||
Deferred tax assets and liabilities are summarized below (in thousands):
|
|
As of December 31,
|
|||||||
|
|
2013
|
2012
|
||||||
|
Deferred tax assets:
|
|
|
||||||
|
Net operating loss
|
$
|
51,818
|
$
|
44,155
|
||||
|
Accruals and reserves not yet deductible
|
4,985
|
5,389
|
||||||
|
Credits
|
1,488
|
1,488
|
||||||
|
|
58,291
|
51,032
|
||||||
|
Deferred tax liabilities:
|
||||||||
|
Valuation of investment portfolio
|
(288
|
)
|
—
|
|||||
|
|
(288
|
)
|
—
|
|||||
|
Net deferred tax assets
|
58,003
|
51,032
|
||||||
|
Valuation allowance
|
(58,003
|
)
|
(51,032
|
)
|
||||
|
Net deferred tax assets
|
$
|
—
|
$
|
—
|
||||
As of December 31, 2013, we have federal and state net operating loss carryforwards of approximately $153.9 million and $43.5 million, respectively, which will expire beginning in 2022 and 2017, respectively. In addition, we have federal tax credit carryforwards of approximately $1.5 million, which will be expired beginning in 2019.
The deferred tax assets valuation allowance as of December 31, 2013 is attributed to U.S. federal, and state deferred tax assets, which result primarily from future deductible accruals, reserves, net operating loss carryforwards, and tax credit carryforwards. We believe that, based on a number of factors, the available objective evidence creates sufficient uncertainty regarding the realizability of the deferred tax assets such that a full valuation allowance has been recorded. These factors include our history of losses related to domestic operations, and the lack of carryback capacity to realize deferred tax assets. The valuation allowance increased by $7.0 million and increased by $1.5 million for the years ended December 31, 2013 and 2012, respectively.
Our consolidated subsidiaries in China have enjoyed various tax holidays since 2000. Benefits under the tax holidays vary by jurisdiction.
In accordance with Section 382 of the Internal Revenue Code, the amounts of and benefits from net operating loss and tax credit carryforwards may be impaired or limited in certain circumstances. Events which cause limitations in the amount of net operating losses or credits that we may utilize in any one year include, but are not limited to, a cumulative ownership change of more that 50% as defined, over a three year period.
As a result of the implementation of Interpretation 48, we recognized $16.4 million of liability for unrecognized tax benefits. Of this amount, none was accounted for as a reduction to the January 1, 2007 balance of retained earnings. The amount decreased tax loss carryforwards in the U.S., which are fully offset by a valuation allowance.
We recognize interest and penalties related to uncertain tax positions in income tax expense. Income tax expense for the year ended December 31, 2013 includes no interest and penalties. As of December 31, 2013, we have no accrued interest and penalties related to uncertain tax positions.
We file income tax returns in the U.S. federal, various states and foreign jurisdictions. We have substantially concluded all U.S. federal and state income tax matters through December 31, 2012.
Deferred tax liabilities have not been recognized for $57.7 million of undistributed earnings of our foreign subsidiaries at December 31, 2013. We have made no provision for U.S. income taxes on undistributed earnings of certain foreign subsidiaries because it is our intention to permanently reinvest such earnings in its foreign subsidiaries. If such earnings were distributed, we would be subject to additional U.S. income tax expense. Determination of the amount of unrecognized deferred income tax liability related to these earnings is not practicable. As of December 31, 2013, the company and its consolidated joint ventures hold approximately $18.7 million in cash and investments in foreign bank accounts which are not available for use in the United States without paying income taxes.
A reconciliation of the beginning and ending amount of the gross unrecognized tax benefits is as follows (in thousands):
|
Gross unrecognized tax benefits balance as of December 31, 2012
|
$
|
16,403
|
||
|
Add:
|
||||
|
Additions based on tax positions related to the current year
|
—
|
|||
|
Additions for tax positions of prior years
|
—
|
|||
|
Gross unrecognized tax benefits balance as of December 31, 2013
|
$
|
16,403
|
Excluding the effects of recorded valuation allowances for deferred tax assets, $16.4 million of the unrecognized tax benefit would favorably impact the effective tax rate in future periods if recognized.
Note 14. Net Income per Share
A reconciliation of the numerators and denominators of the basic and diluted net income per share calculations is as follows (in thousands, except per share data):
|
|
Years Ended December 31,
|
|||||||||||
|
|
2013
|
2012
|
2011
|
|||||||||
|
Numerator:
|
|
|
|
|||||||||
|
Net income (loss) attributable to AXT, Inc
|
$
|
(7,958
|
)
|
$
|
3,110
|
$
|
20,320
|
|||||
|
Less: Preferred stock dividends
|
(177
|
)
|
(177
|
)
|
(177
|
)
|
||||||
|
Net income (loss) to common stockholders
|
$
|
(8,135
|
)
|
$
|
2,933
|
$
|
20,143
|
|||||
|
Denominator:
|
||||||||||||
|
Weighted average common shares (basic)
|
32,700
|
32,144
|
31,872
|
|||||||||
|
Effect of dilutive securities:
|
||||||||||||
|
Common stock options
|
—
|
689
|
1,093
|
|||||||||
|
Restricted stock awards
|
—
|
32
|
96
|
|||||||||
|
Weighted average common shares (dilutive)
|
32,700
|
32,865
|
33,061
|
|||||||||
|
Basic net income (loss) per share:
|
||||||||||||
|
Net income attributable to AXT, Inc
|
$
|
(0.25
|
)
|
$
|
0.10
|
$
|
0.64
|
|||||
|
Net income to common stockholders
|
$
|
(0.25
|
)
|
$
|
0.09
|
$
|
0.63
|
|||||
|
Diluted net income (loss) per share:
|
||||||||||||
|
Net income attributable to AXT, Inc
|
$
|
(0.25
|
)
|
$
|
0.09
|
$
|
0.61
|
|||||
|
Net income to common stockholders
|
$
|
(0.25
|
)
|
$
|
0.09
|
$
|
0.61
|
|||||
|
Options excluded from diluted net income per share as the impact is anti-dilutive
|
2,671
|
1,056
|
478
|
|||||||||
|
Restricted stock excluded from diluted net income per share as the impact is anti-dilutive
|
241 |
13
|
116
|
|||||||||
Note 15. Segment Information and Foreign Operations
Segment Information
We operate in one segment for the design, development, manufacture and distribution of high-performance compound semiconductor substrates and sale of materials. In accordance with ASC topic 280,
Segment Reporting,
our chief operating decision‑maker has been identified as the Chief Executive Officer, who reviews operating results to make decisions about allocating resources and assessing performance for the Company. Since we operate in one segment, all financial segment and product line information can be found in the consolidated financial statements.
Product Type
The following table represents revenue amounts (in thousands) by product type:
|
|
Years Ended December 31,
|
|||||||||||
|
|
2013
|
2012
|
2011
|
|||||||||
|
Product type:
|
|
|
|
|||||||||
|
GaAs
|
$
|
40,234
|
$
|
51,368
|
$
|
63,697
|
||||||
|
InP
|
7,128
|
6,024
|
5,182
|
|||||||||
|
Ge
|
16,962
|
8,734
|
11,635
|
|||||||||
|
Raw materials and other
|
21,011
|
22,248
|
23,607
|
|||||||||
|
|
$
|
85,335
|
$
|
88,374
|
$
|
104,121
|
||||||
Geographical Information
The following table represents revenue amounts (in thousands) reported for products shipped to customers in the corresponding geographic region:
|
|
Years Ended December 31,
|
|||||||||||
|
|
2013
|
2012
|
2011
|
|||||||||
|
Product revenue:
|
|
|
|
|||||||||
|
China
|
24,946
|
19,815
|
25,181
|
|||||||||
|
Europe (primarily Germany)
|
21,387
|
18,170
|
21,082
|
|||||||||
|
North America (primarily the United States)
|
$
|
10,665
|
$
|
15,391
|
$
|
20,471
|
||||||
|
Taiwan
|
10,131
|
10,985
|
9,813
|
|||||||||
|
Japan
|
9,041
|
9,346
|
13,749
|
|||||||||
|
Asia Pacific (excluding China, Japan and Taiwan)
|
9,165
|
14,667
|
13,825
|
|||||||||
|
|
$
|
85,335
|
$
|
88,374
|
$
|
104,121
|
||||||
Long-lived assets consist primarily of property, plant and equipment, and are attributed to the geographic location in which they are located. Long-lived assets by geographic region were as follows (in thousands):
|
|
As of December 31,
|
|||||||
|
|
2013
|
2012
|
||||||
|
Long-lived assets:
|
|
|
||||||
|
United States of America
|
$
|
204
|
$
|
430
|
||||
|
China
|
37,417
|
36,805
|
||||||
|
|
$
|
37,621
|
$
|
37,235
|
||||
Note 16. Foreign Exchange Contracts and Transaction Gains/Losses
As of December 31, 2013, and 2012, we had no outstanding commitments with respect to foreign exchange contracts.
We incurred foreign currency transaction exchange losses which are included in “other income (expense), net” on the consolidated statements of operations of $1.3 million, $445,000 and $100,000 for the years ended December 31, 2013, 2012, and 2011, respectively.
Note 17. Commitments and Contingencies
Legal Matters
We are subject to legal proceedings and claims, either asserted or unasserted, that arise in the ordinary course of business. While the outcome of these proceedings and claims cannot be predicted with certainty, management does not believe that the outcome of any of these legal matters will have a material adverse effect on our consolidated financial position, results of operations or cash flows.
Leases
We lease certain office space, manufacturing facilities and equipment under long-term operating leases expiring at various dates through February 2016. The majority of our lease obligation relates to our lease agreement for the facility at Fremont, California with approximately 27,760 square feet commenced on December 1, 2008 for a term of seven years, with an option by us to cancel the lease after five years, upon forfeiture of the security deposit and payment of one-half of the fifth year’s rent.
On June 28, 2013, we sent a notice to terminate the lease effective November 30, 2013 with an early termination penalty of $142,000 which was recorded as an expense in the third quarter of 2013. On August 2, 2013, we signed a new lease agreement for the current facility with reduced footage of 20,767 square feet, which commenced on December 1, 2013 for a term of two years. The reduced square footage, the reduced rate per square foot, and the expected reduced operating costs, would save us approximately $382,000 during 2014 and 2015. Total rent expenses under these operating leases were $638,000, $447,000 and $460,000 for the years ended December 31, 2013, 2012 and 2011, respectively. Total minimum lease payments under these leases as of December 31,
201
3 are summarized below (in thousands):
|
|
Lease Payments
|
|||
|
2014
|
$
|
174
|
||
|
2015
|
152
|
|||
|
2016
|
22
|
|||
|
2017
|
21
|
|||
|
Thereafter
|
68
|
|||
|
|
$
|
437
|
||
Royalty Agreement
We entered into a royalty agreement with a vendor effective December 3, 2010 with a term of eight years, terminating December 31, 2018. We and our related companies are granted a worldwide, nonexclusive, royalty bearing, irrevocable license to certain patents for the term on the agreement. We shall pay a total of $7.0 million royalty payment over eight years that began in 2011 based on future royalty bearing sales. This agreement contains a clause that allows us to claim for credit, starting in 2013, in the event that the royalty bearing sales for the year is lower than a pre-determined amount set forth in this agreement. Royalty expense under this agreement
for 2013
was $530,000, which was net of claim for credit of $270,000, and $1.4 million
and $1.3 million
for the years ended December 31,
2012
and
2011
, respectively, and was included in cost of revenue. Total royalty payments under this agreement as of December 31, 2013 are summarized below (in thousands)
:
|
|
Royalty Payments
|
|||
|
2014
|
$
|
800
|
||
|
2015
|
800
|
|||
|
2016
|
575
|
|||
|
2017
|
575
|
|||
|
2018
|
575
|
|||
|
|
$
|
3,325
|
||
Note 18. Unaudited Quarterly Consolidated Financial Data
|
|
Quarter
|
|||||||||||||||
|
|
First
|
Second
|
Third
|
Fourth
|
||||||||||||
|
|
(in thousands, except per share data)
|
|||||||||||||||
|
2013:
|
|
|
|
|
||||||||||||
|
Revenue
|
$
|
22,380
|
$
|
22,831
|
$
|
20,521
|
$
|
18,603
|
||||||||
|
Gross profit
|
3,484
|
3,085
|
2,446
|
2,813
|
||||||||||||
|
Net (loss) attributable to AXT, Inc
|
(2,400
|
)
|
(2,035
|
)
|
(2,295
|
)
|
(1,228
|
)
|
||||||||
|
Net (loss) attributable to AXT, Inc per share, basic
|
$
|
(0.08
|
)
|
$
|
(0.06
|
)
|
$
|
(0.07
|
)
|
$
|
(0.04
|
)
|
||||
|
Net (loss) attributable to AXT, Inc per share, diluted
|
$
|
(0.08
|
)
|
$
|
(0.06
|
)
|
$
|
(0.07
|
)
|
$
|
(0.04
|
)
|
||||
|
2012:
|
||||||||||||||||
|
Revenue
|
$
|
23,486
|
$
|
25,153
|
$
|
20,808
|
$
|
18,927
|
||||||||
|
Gross profit
|
8,194
|
7,508
|
5,466
|
3,684
|
||||||||||||
|
Net income (loss) attributable to AXT, Inc
|
1,635
|
1,299
|
932
|
(756
|
)
|
|||||||||||
|
Net income (loss) attributable to AXT, Inc per share, basic
|
$
|
0.05
|
$
|
0.04
|
$
|
0.03
|
$
|
(0.02
|
)
|
|||||||
|
Net income (loss) attributable to AXT, Inc per share, diluted
|
$
|
0.05
|
$
|
0.04
|
$
|
0.03
|
$
|
(0.02
|
)
|
|||||||
Note 19. Subsequent Events
On February 25, 2014, AXT, Inc. (the “Company”) approved a restructuring plan with respect to its wholly-owned subsidiary, Beijing Tongmei Xtal Technology Co, Ltd. (“Tongmei”) in order to better align demand with manufacturing capacity. Under the restructuring plan, Tongmei will implement certain workforce reductions with respect to its manufacturing facility in China. The Company expects to substantially complete the restructuring plan by March 31, 2014, depending on local legal requirements. In connection with the restructuring plan, the Company expects to incur aggregate pre-tax restructuring charges comprised of severance and other termination benefits of approximately $900,000, but the charges could range from $850,000 to $1.1 million, all of which are currently expected to be recorded in the first fiscal quarter of 2014.
SIGNATURES
Pursuant to the requirements of Section 13 or 15(d) of the Securities Exchange Act of 1934, the registrant has duly caused this report to be signed on its behalf by the undersigned, thereto duly authorized.
|
|
AXT, Inc.
|
|
|
|
|
|
|
|
By:
|
/s/
MORRIS S. YOUNG
|
|
|
|
Morris S. Young
|
|
|
|
Interim Chief Financial Officer and Corporate Secretary
|
| (Interim Principal Financial Officer) | ||
Date: March 14, 2014
POWER OF ATTORNEY
KNOW ALL PERSONS BY THESE PRESENTS, that each person whose signature appears below hereby constitutes and appoints Morris S. Young, his true and lawful attorney-in-fact and agent, with full power of substitution, with power to act alone, to sign and execute on behalf of the undersigned any and all amendments to this Report on Form 10-K, and to perform any acts necessary in order to file the same, with all exhibits thereto and other documents in connection therewith with the Securities and Exchange Commission, granting unto said attorney-in-fact and agent full power and authority to do and perform each and every act and thing requested and necessary to be done in connection therewith, as fully to all intents and purposes as he might or could do in person, hereby ratifying and confirming all that said attorney-in-fact and agent, or their or his or her substitutes, shall do or cause to be done by virtue hereof.
Pursuant to the requirements of the Securities Exchange Act of 1934, this report has been signed below by the following persons on behalf of the registrant and in the capacities and on the dates indicated.
|
Signature
|
Title
|
Date
|
||
|
|
|
|
||
|
/s/
MORRIS S. YOUNG
|
Chief Executive Officer and Director
|
March 14, 2014
|
||
|
Morris S. Young
|
(Principal Executive Officer)
|
|
||
|
/s/
MORRIS S. YOUNG
|
Interim Chief Financial Officer and Corporate Secretary
|
March 14, 2014
|
||
|
Morris S. Young
|
(Interim Principal Financial Officer and
Principal Accounting Officer) |
|
||
|
/s/
JESSE CHEN
|
Chairman of the Board of Directors
|
March 14, 2014
|
||
|
Jesse Chen
|
|
|
||
|
/s/
DAVID C. CHANG
|
Director
|
March 14, 2014
|
||
|
David C. Chang
|
|
|
||
|
/s/
LEONARD LEBLANC
|
Director
|
March 14, 2014
|
||
| Leonard LeBlanc | ||||
|
/s/ NAI-YU PAI
|
Director
|
March 14, 2014
|
||
| Nai-yu Pai |
AXT, Inc.
EXHIBITS
TO
FORM 10-K ANNUAL REPORT
For the Year Ended December 31, 2013
|
Exhibit
Number |
Description
|
|
|
3.1(1)
|
Restated Certificate of Incorporation
|
|
|
3.2(2)
|
Certificate of Amendment of Certificate of Incorporation
|
|
|
3.3(3)
|
Certificate of Amendment to the Restated Certificate of Incorporation
|
|
|
3.4(4)
|
Certificate of Designation, Preferences and Rights of Series A Preferred Stock (which is incorporated herein by reference to Exhibit 2.1 to the registrant’s form 8-K dated May 28, 1999).
|
|
|
3.5(5)
|
Second Amended and Restated By Laws
|
|
| 3.6(6) |
Amended and Restated Section 5.1 of Article V of the Second Amended and Restated Bylaws of AXT, Inc.
|
|
| 3.7(7) |
Certificate of Amendment to By Laws
|
|
|
4.1(8)
|
Rights Agreement dated April 24, 2001 by and between AXT, Inc. and ComputerShare Trust Company, Inc.
|
|
|
10.1(9)*
|
Form of Indemnification Agreement for directors and officers
|
|
|
10.2(10)*
|
1997 Stock Option Plan and forms of agreements thereunder
|
|
|
10.3(11)
|
Purchase and Sale Agreement by and between Limar Realty Corp #23 and AXT, Inc. dated April 1998
|
|
|
10.4(12)
|
Bond Purchase Contract between Dain Rauscher Incorporated and AXT, Inc. dated December 1, 1998
|
|
|
10.5(13)
|
Remarketing Agreement between Dain Rauscher Incorporated and AXT, Inc. dated December 1, 1998
|
|
|
10.6(14)
|
Reimbursement Agreement between Wells Fargo Bank National Association and AXT, Inc. dated April 7, 2003
|
|
|
10.7(15)
|
Asset purchase agreements dated September 4, 2003 by and between Dalian Luming Science and Technology Group, Ltd and AXT, Inc. and by and between Lumei Optoelectronics Corp., AXT, Inc., Lyte Optronics, Inc., Beijing Tongmei Xtal Technology and Xiamen Advanced Semiconductor Co., Ltd.
|
|
|
10.8(16)*
|
Agreement respecting severance payment between the Company and Dr. Morris S. Young.
|
|
|
10.9(17)*
|
Employment agreement between the Company and Mr. Davis Zhang
|
|
|
10.10(18)
|
Purchase and Sale Agreement by and between Car West Auto Body, Inc., a California corporation and AXT, Inc. dated February 19, 2008
|
|
|
10.11(19)
|
Lease agreement dated July 2, 2008 between AXT, Inc. and T. Drive Partners, L.P., a California partnership
|
|
|
10.12(20)**
|
6-inch Supply Agreement dated December 31, 2008 between AXT, Inc. and IQE plc
|
|
|
10.13(21)**
|
4-inch Supply Agreement dated December 31, 2008 between AXT, Inc. and IQE plc
|
|
|
10.14(22)
|
2007 Equity Incentive Plan (amended December 8, 2008)
|
|
|
10.15(23)*
|
Forms of agreements under the 2007 Equity Incentive Plan
|
|
|
10.16(24)*
|
Employment Letter Agreement between the Company and Mr. Raymond Low
|
|
|
10.17(25)*
|
Employment Letter Agreement between the Company and Mr. Davis Zhang
|
|
|
10.18(26)*
|
Employment Letter Agreement between the Company and Mr. Robert G. Ochrym
|
|
|
10.19(27)*
|
2010 Executive Bonus Plan
|
|
|
10.20(28)**
|
Supply Agreement signed January 29, 2010 between AXT, Inc. and AZUR SPACE Solar Power GmbH
|
|
|
10.21(29)*
|
2011 Executive Bonus Plan
|
|
|
10.22(30)*
|
2012 Executive Bonus Plan
|
|
| 10.23* |
2013 Executive Bonus Plan
|
|
|
10.24(31)
|
Credit Line Account Application and Agreement for Organizations and Businesses between AXT, Inc. and UBS Bank USA dated December 15, 2008
|
|
|
10.25(32)
|
Notice of Credit Line Account Increase between AXT, Inc. and UBS Bank USA dated January 17, 2012
|
|
| 10.26(33)* |
Amended and Restated Employment Offer Letter between the Company and Dr. Morris S. Young dated December 4, 2012
|
|
|
Computation of Ratio of Earnings to Fixed Charges
|
||
|
21.1(34)
|
List of Subsidiaries
|
|
|
Consent of Independent Registered Public Accounting Firm, Burr Pilger Mayer, Inc
|
||
|
24.1
|
Power of Attorney (see signature page)
|
|
|
Certification by principal executive officer pursuant to Section 302 of the Sarbanes‑Oxley Act of 2002
|
|
Certification by principal financial officer pursuant to Section 302 of the Sarbanes‑Oxley Act of 2002
|
||
|
Certification by Chief Executive Officer Pursuant to 18 U.S.C. Section 1350, as adopted Pursuant to Section 906 of the Sarbanes‑Oxley Act of 2002
|
||
|
Certification by Chief Financial Officer Pursuant to 18 U.S.C. Section 1350, as adopted Pursuant to Section 906 of the Sarbanes‑Oxley Act of 2002
|
| 101.INS† |
XBRL Instance.
|
|
| 101.SCH† |
XBRL Taxonomy Extension Schema.
|
|
| 101.CAL† |
XBRL Taxonomy Extension Calculation Linkbase.
|
|
| 101.DEF† |
XBRL Taxonomy Extension Definition Linkbase
|
|
| 101.LAB† | XBRL Taxonomy Extension Label Linkbase. | |
| 101.PRE† | XBRL Taxonomy Extension Presentation Linkbase. |
| (1) | Incorporated by reference to exhibit 3.1 to registrant’s Form 10-K filed with the SEC on March 31, 1999. |
| (2) | Incorporated by reference to exhibit 3.1 to registrant’s Form 10-Q filed with the SEC on August 14, 2000. |
| (3) | Incorporated by reference to exhibit 3.4 to registrant’s Form 10-Q filed with SEC on August 5, 2004. |
| (4) | Incorporated by reference to exhibit 3.1 to registrant’s Form 8-K filed with the SEC on June 14, 1999. |
| (5) | Incorporated by reference to exhibit 3.4 to registrant’s Form 8-K filed with the SEC on May 30, 2001. |
| (6) | Incorporated by reference to exhibit 99.2 to registrant’s Form 8-K filed with the SEC on August 1, 2007. |
| (7) | Incorporated by reference to exhibit 3.1 to registrant’s Form 8‑K filed with the SEC on October 26, 2010. |
| (8) | Incorporated by reference to exhibit 4.2 to registrant’s Form 8-K filed with the SEC on May 30, 2001. |
| (9) | Incorporated by reference to exhibit 10.1 to registrant’s Registration Statement on Form S-1 filed with the SEC on March 17, 1998. |
| (10) | Incorporated by reference to exhibit 10.3 to registrant’s Registration Statement on Form S-1 filed with the SEC on March 17, 1998. |
| (11) | Incorporated by reference to exhibit 10.7 to registrant’s Registration Statement on Amendment No. 2 to Form S-1 filed with the SEC on May 11, 1998. |
| (12) | Incorporated by reference to exhibit 10.10 to registrant’s Form 10-K filed with the SEC on March 31, 1999. |
| (13) | Incorporated by reference to exhibit 10.11 to registrant’s Form 10-K filed with the SEC on March 31, 1999. |
| (14) | Incorporated by reference to exhibit 10.15 to registrant’s Form 10-Q filed with the SEC on May 9, 2003. |
| (15) | Incorporated by reference to exhibit 10.16 to registrant’s Form 10-Q filed with the SEC on November 13, 2003. |
| (16) | Incorporated by reference to exhibit 99.1 to registrant’s Form 8-K filed with the SEC on March 30, 2005. |
| (17) | Incorporated by reference to exhibit 99.1 to registrant’s Form 8-K filed with the SEC on January 17, 2006. |
| (18) | Incorporated by reference to exhibit 10.25 to registrant’s Form 8-K filed with the SEC on February 20, 2008. |
| (19) | Incorporated by reference to exhibit 10.28 to registrant’s Form 8‑K filed with the SEC on July 8, 2008. |
| (20) | Incorporated by reference to exhibit 10.29 to registrant’s Form 8‑K filed with the SEC on January 5, 2009. |
| (21) | Incorporated by reference to exhibit 10.30 to registrant’s Form 8‑K filed with the SEC on January 5, 2009. |
| (22) | Incorporated by reference to exhibit 10.31 to registrant’s Form 10‑K filed with the SEC on March 31, 2009. |
| (23) | Incorporated by reference to exhibit 10.20 to registrant’s Form 10‑K filed with the SEC on March 22, 2010. |
| (24) | Incorporated by reference to exhibit 10.22 to registrant’s Form 10‑K filed with the SEC on March 22, 2010. |
| (25) | Incorporated by reference to exhibit 10.23 to registrant’s Form 10‑K filed with the SEC on March 22, 2010. |
| (26) | Incorporated by reference to exhibit 10.24 to registrant’s Form 10‑K filed with the SEC on March 22, 2010. |
| (27) | Incorporated by reference to exhibit 10.25 to registrant’s Form 10‑K filed with the SEC on March 22, 2010. |
| (28) | Incorporated by reference to exhibit 10.31 to registrant’s Form 8-K filed with the SEC on February 2, 2010. |
| (29) | Incorporated by reference to exhibit 10.21 to registrant’s Form 10-K filed with the SEC on March 16, 2011. |
| (30) | Incorporated by reference to exhibit 10.22 to registrant’s Form 10-K filed with the SEC on March 15, 2012. |
| (31) | Incorporated by reference to exhibit 10.23 to registrant’s Form 10-K filed with the SEC on March 15, 2012. |
| (32) | Incorporated by reference to exhibit 10.24 to registrant’s Form 10-K filed with the SEC on March 15, 2012. |
| (33) | Incorporated by reference to exhibit 10.1 to registrant’s Form 8-K filed with the SEC on December 4, 2012. |
| (34) | Incorporated by reference to exhibit 21.1 to registrant’s Registration Statement on Amendment No. 1 to Form S-3 filed with the SEC on July 28, 2006. |
| * | Management contract or compensatory plan. |
| ** | Confidential treatment has been requested of the SEC for portions of the exhibit. |
| † | XBRL (Extensible Business Reporting Language) information is furnished and not filed or a part of a registration statement or prospectus for purposes of sections 11 or 12 of the Securities Act of 1933, is deemed not filed for purposes of section 18 of the Securities Exchange Act of 1934, and is otherwise not subject to liability under these sections. |
TABLE OF CONTENTS
Part IItem 1. BusinessItem 1A. Risk FactorsItem 1B. Unresolved Staff CommentsItem 2. PropertiesItem 3. Legal ProceedingsItem 4. Mine Safety DisclosuresPart IIItem 5. Market For Registrant S Common Equity, Related Stockholder Matters and Issuer Purchases Of Equity SecuritiesItem 6. Selected Consolidated Financial DataItem 7. Management S Discussion and Analysis Of Financial Condition and Results Of OperationsItem 7A. Quantitative and Qualitative Disclosures About Market RiskItem 8. Consolidated Financial Statements and Supplementary DataItem 9. Changes in and Disagreements with Accountants on Accounting and Financial DisclosureItem 9A. Controls and ProceduresItem 9B. Other InformationPart IIIItem 10. Directors, Executive Officers and Corporate GovernanceItem 11. Executive CompensationItem 12. Security Ownership Of Certain Beneficial Owners and Management and Related Stockholder MattersItem 13. Certain Relationships and Related Transactions and Director IndependenceItem 14. Principal Accountant Fees and ServicesPart IVItem 15. Exhibits and Financial Statement SchedulesNote 1. The Company and Summary Of Significant Accounting PoliciesNote 2. Cash, Cash Equivalents and InvestmentsNote 3. InventoriesNote 4. Related Party TransactionsNote 5. Property, Plant and Equipment, NetNote 6. Investments in Privately-held CompaniesNote 7. Other InvestmentsNote 8. Accrued LiabilitiesNote 9. DebtNote 10. Stockholders Equity and Stock Repurchase ProgramNote 11. Employee Benefit Plans and Stock-based CompensationNote 12. GuaranteesNote 13. Income TaxesNote 14. Net Income Per ShareNote 15. Segment Information and Foreign OperationsNote 16. Foreign Exchange Contracts and Transaction Gains/lossesNote 17. Commitments and ContingenciesNote 18. Unaudited Quarterly Consolidated Financial DataNote 19. Subsequent Events