AIRCASTLE LTD
10-Ks and 10-Qs
|
|
|
|
|
|
|
|
|
|
|
|
|
|
|
|
|
|
|
|
|
|
|
|
|
|
|
|
|
UNITED STATES
SECURITIES AND EXCHANGE COMMISSION
Washington, D.C. 20549
FORM
10-K
|
|
Annual report pursuant to Section 13 or 15(d) of the Securities Exchange Act of 1934
|
For the Fiscal Year Ended
December 31, 2019
or
|
|
Transition report pursuant to Section 13 or 15(d) of the Securities Exchange Act of 1934
|
For the transition period from to
Commission file number
001-32959
(Exact name of Registrant as Specified in its Charter)
|
|
|
|
|
(State or other Jurisdiction of
Incorporation or organization)
|
(I.R.S. Employer
Identification No.)
|
|
|
|
|
|
|
|
|
|
|
|
(Address of Principal Executive Offices)
Registrant’s telephone number, including area code:
(
203
)
504-1020
______________________________________
Securities registered pursuant to Section 12(b) of the Act:
|
Title of Each Class
|
Trading Symbol
|
Name of Each Exchange on Which Registered
|
||
|
|
|
|
||
Securities registered pursuant to Section 12(g) of the Act: None
Indicate by check mark if the registrant is a well-known seasoned issuer, as defined in Rule 405 of the Securities Act.
Yes
þ
No
¨
Indicate by check mark if the registrant is not required to file reports pursuant to Section 13 or Section 15(d) of the Act. Yes
¨
No
þ
Indicate by check mark whether the registrant: (1) has filed all reports required to be filed by Section 13 or 15(d) of the Securities Exchange Act of 1934 during the preceding 12 months (or for such shorter period that the registrant was required to file such reports), and (2) has been subject to such filing requirements for the past 90 days.
Yes
þ
No
¨
Indicate by check mark whether the registrant has submitted electronically every Interactive Data File required to be submitted pursuant to Rule 405 of Regulation S-T (§232.405 of this chapter) during the preceding 12 months (or for such shorter period that the registrant was required to submit and post such files).
Yes
þ
No
¨
Indicate by check mark whether the registrant is a large accelerated filer, an accelerated filer, a non-accelerated filer, or a smaller reporting company. See the definitions of “large accelerated filer,” “accelerated filer” and “smaller reporting company” in Rule 12b-2 of the Exchange Act.
|
|
þ
|
Accelerated filer
|
¨
|
|
Non-accelerated filer
|
¨
|
Smaller reporting company
|
|
|
Emerging growth company
|
|
||
If an emerging growth company, indicate by check mark if the registrant has elected not to use the extended transition period for complying with any new or revised financial accounting standards provided pursuant to Section 13(a) of the Exchange Act.
¨
Indicate by check mark whether the registrant is a shell company (as defined in Rule 12b-2 of the Exchange Act). Yes
☐
No
þ
The aggregate market value of the Registrant’s Common Shares based upon the closing price on the New York Stock Exchange on June 30, 2019 (the last business day of registrant’s most recently completed second fiscal quarter), beneficially owned by non-affiliates of the Registrant was approximately
$
1.10
billion
. For purposes of the foregoing calculation, which is required by Form 10-K, the Registrant has included in the shares owned by affiliates those shares owned by directors and executive officers and shareholders owning 10% or more of the outstanding common shares of the Registrant, and such inclusion shall not be construed as an admission that any such person is an affiliate for any purpose.
As of
February 10, 2020
, there were
75,109,023
outstanding shares of the registrant’s common shares, par value $0.01 per share.
DOCUMENTS INCORPORATED BY REFERENCE
|
Documents of Which Portions
Are Incorporated by Reference
|
Parts of Form 10-K into Which Portion
Of Documents Are Incorporated
|
|
|
Portions of the Proxy Statement for Aircastle Limited for its 2020 Annual General Meeting of Shareholders are incorporated by reference into Part III of this Annual Report on Form 10-K, provided that if such Proxy Statement is not filed with the U.S. Securities and Exchange Commission within 120 days after the end of the fiscal year covered by this Form 10-K, an amendment to this Form 10-K shall be filed no later than the end of such 120-day period.
|
Part III
|
|
|
(Items 10, 11, 12, 13 and 14)
|
||
TABLE OF CONTENTS
|
|
|
Page
|
|
PART I
|
||
|
Item 1.
|
||
|
Item 1A.
|
||
|
Item 1B.
|
||
|
Item 2.
|
||
|
Item 3.
|
||
|
Item 4.
|
||
|
PART II
|
||
|
Item 5.
|
||
|
Item 6.
|
||
|
Item 7.
|
||
|
Item 7A.
|
||
|
Item 8.
|
||
|
Item 9.
|
||
|
Item 9A.
|
||
|
Item 9B.
|
||
|
PART III
|
||
|
Item 10.
|
||
|
Item 11.
|
||
|
Item 12.
|
||
|
Item 13.
|
||
|
Item 14.
|
||
|
PART IV
|
||
|
Item 15.
|
||
|
Item 16.
|
||
SAFE HARBOR STATEMENT UNDER THE
PRIVATE SECURITIES LITIGATION REFORM ACT OF 1995
All statements included or incorporated by reference in this Annual Report on Form 10-K (this “Annual Report”), other than characterizations of historical fact, are forward-looking statements within the meaning of the federal securities laws, including the Private Securities Litigation Reform Act of 1995. Examples of forward-looking statements include, but are not necessarily limited to, statements relating to our ability to acquire, sell, lease or finance aircraft, raise capital, pay dividends, and increase revenues, earnings, EBITDA, Adjusted EBITDA and Adjusted Net Income and the global aviation industry and aircraft leasing sector. Words such as “anticipates,” “expects,” “intends,” “plans,” “projects,” “believes,” “may,” “will,” “would,” “could,” “should,” “seeks,” “estimates” and variations on these words and similar expressions are intended to identify such forward-looking statements. These statements are based on our historical performance and that of our subsidiaries and on our current plans, estimates and expectations and are subject to a number of factors that could lead to actual results materially different from those described in the forward-looking statements; Aircastle can give no assurance that its expectations will be attained. Accordingly, you should not place undue reliance on any such forward-looking statements which are subject to certain risks and uncertainties that could cause actual results to differ materially from those anticipated as of the date of this Annual Report. These risks or uncertainties include, but are not limited to, those described from time to time in Aircastle’s filings with the Securities and Exchange Commission (“SEC”), including as described in Item 1A, and elsewhere in this report. In addition, new risks and uncertainties emerge from time to time, and it is not possible for Aircastle to predict or assess the impact of every factor that may cause its actual results to differ from those contained in any forward-looking statements. Such forward-looking statements speak only as of the date of this Annual Report. Aircastle expressly disclaims any obligation to revise or update publicly any forward-looking statement to reflect future events or circumstances.
WEBSITE AND ACCESS TO COMPANY’S REPORTS
The Company’s Internet website can be found at www.aircastle.com. Our annual reports on Form 10-K, quarterly reports on Form 10-Q, current reports on Form 8-K, and amendments to those reports filed or furnished pursuant to Section 13(a) or 15(d) of the Exchange Act are available free of charge through our website under “Investors — SEC Filings” as soon as reasonably practicable after they are electronically filed with, or furnished to, the SEC.
Statements and information concerning our status as a Passive Foreign Investment Company (“PFIC”) for U.S. taxpayers are also available free of charge through our website under “Investors — Financial Information — SEC Filings”.
Our Corporate Governance Guidelines, Code of Business Conduct and Ethics, and Board of Directors committee charters (including the charters of the Audit Committee, Compensation Committee, and Nominating and Corporate Governance Committee) are available free of charge through our website under “Investors — Corporate Governance”. In addition, our Code of Ethics for the Chief Executive and Senior Financial Officers, which applies to our Chief Executive Officer, Chief Financial Officer, Chief Accounting Officer, Treasurer and Controller, is available in print, free of charge, to any shareholder upon request to Investor Relations, Aircastle Limited, c/o Aircastle Advisor LLC, 201 Tresser Boulevard, Suite 400, Stamford, Connecticut 06901.
The information on the Company’s website is not part of, or incorporated by reference, into this Annual Report, or any other report we file with, or furnish to, the SEC.
INTRODUCTION
On November 6, 2019, Aircastle Limited announced that it had entered into a definitive agreement to be acquired by a newly-formed entity controlled by affiliates of Marubeni Corporation (“Marubeni”) and Mizuho Leasing Company, Limited (“Mizuho Leasing”). Unless stated otherwise, all forward-looking information contained in this report does not take into account or give any effect to the impact of the Merger (as defined herein). For additional details regarding the Merger, see “Item 1. Business” in Part I of this report, “Risk Factors” contained in Part I, Item 1A of this report, “Management’s Discussion and Analysis of Financial Condition and Results of Operations” contained in Part II, Item 7 of this report, and Note 1 to the Company’s consolidated financial statements, contained in Part IV of this report.
Unless the context suggests otherwise, references in this Annual Report to “Aircastle,” the “Company,” “we,” “us,” or “our” refer to Aircastle Limited and its subsidiaries. References in this Annual Report to “Aircastle Bermuda” refer to Aircastle Holding Corporation Limited and its subsidiaries. Throughout this Annual Report, when we refer to our aircraft, we include aircraft that we have transferred into grantor trusts or similar entities for purposes of financing such assets through securitizations and term financings. These grantor trusts or similar entities are consolidated for purposes of our financial statements. All amounts in this Annual Report are expressed in U.S. dollars and the financial statements have been prepared in accordance with U.S. generally accepted accounting principles (“U.S. GAAP”).
Aircastle acquires, leases, and sells commercial jet aircraft to airlines throughout the world. As of
December 31, 2019
, we owned and managed on behalf of our joint venture
287
aircraft leased to
85
lessees located in
49
countries. Our aircraft are managed by an experienced team based in the United States, Ireland and Singapore. Our aircraft are subject to net leases whereby the lessee is generally responsible for maintaining the aircraft and paying operational, maintenance and insurance costs. In many cases, however, we are obligated to pay a portion of specified maintenance or modification costs. As of
December 31, 2019
, the net book value of our flight equipment (including flight equipment held for lease and net investment in direct financing and sales-type leases, or “net book value”) was
$7.79 billion
compared to
$7.40 billion
at the end of
2018
. Our revenues and net income for the year ended
December 31, 2019
were
$917.9 million
and
$156.6 million
, respectively, and for the fourth quarter of
2019
were
$243.7 million
and
$47.3 million
, respectively.
Growth in commercial air traffic is broadly correlated with world economic activity. In recent years, commercial air traffic growth has expanded at a rate 1.5 to 2 times that of global GDP growth. The expansion of air travel has driven a rise in the world aircraft fleet. There are currently approximately 22,000 commercial mainline passenger and freighter aircraft in operation worldwide. This fleet is expected to continue expanding at a three to four percent average annual rate over the next twenty years. Aircraft leasing companies own approximately 45% of the world’s commercial jet aircraft.
2019
showed sustained growth in air traffic. According to the International Air Transport Association, during
2019
, global passenger traffic increased
4.2%
compared to the same period in
2018
. Demand for air travel varies by region. Emerging market economies have generally been experiencing greater increases in air traffic, driven by rising levels of per capita income leading to an increased propensity to fly. Mature markets, such as North America and Western Europe, have been growing more slowly in tandem with their economies. Air traffic growth is also being driven by the proliferation of low cost carriers, which have stimulated demand through lower prices. The outlook for airlines operating in areas with political instability or weakening economies is more uncertain. On balance, we believe air travel will increase over time and, as a result, we expect demand for modern aircraft will continue to remain strong over the long-term.
Notwithstanding the sector’s long-term growth, the aviation market is subject to economic variability due to changes in macroeconomic variables, such as interest rates, fuel price levels and foreign exchange rates. The aviation industry is also susceptible to external shocks, such as regional conflicts, epidemics and terrorist events. Mitigating this risk is the portability of the assets, allowing aircraft to be redeployed to locations where there is demand.
Fuel prices and interest rates have had a substantial effect on our industry. After dropping to a low of $36 per barrel in December 2015, the price of fuel averaged $61 per barrel during 2019. The prolonged low interest rate environment and the strong overall performance of the aircraft financing sector attracted significant new capital, increasing competition for new investments and putting pressure on margins and returns. Interest rates have risen in the U.S., though current Federal Reserve guidance suggesting rate hikes in the Federal Funds rate are unlikely in the near term.
1
Capital availability for aircraft has varied over time, and we consider this variability to be a basic characteristic of our industry. If pursued properly, this variability represents an important investment opportunity. Strong U.S. debt capital market conditions benefit borrowers by permitting access to financing at historic lows. Commercial bank debt also continues to play a critical role for aircraft finance. Export credit agency availability, however, has been curtailed in recent years due to political issues, both in the U.S. and in Europe. While financial market conditions remain attractive, geopolitical issues may increase capital costs and limit availability going forward.
We believe capital market developments should generate attractive additional investment and trading opportunities from which we can benefit given our access to different financing sources, our limited capital commitments and our reputation as a reliable trading partner. Our investment grade credit ratings from Moody’s, Standard & Poor’s and Fitch have allowed us to reduce our borrowing costs for our two most recent bond deals and will enable us to more reliably access debt capital throughout the business cycle.
Our business approach is differentiated from those of other large leasing companies. Our investment strategy is to seek out the best risk-adjusted return opportunities across the commercial jet market, so the volume and types of assets we buy will vary over time with market conditions. We plan to grow our business and profits over the long-term while maintaining a conservative, flexible capital structure. We prefer to have capital resources available to capture investment opportunities that arise in the context of changing market circumstances. As such, we limit large, long-term capital commitments and are less reliant on orders for new aircraft from aircraft manufacturers as a source of new investments than many of our competitors.
On November 5, 2019, Aircastle entered into an Agreement and Plan of Merger (the “Merger Agreement”), with MM Air Limited, a Bermuda exempted company (“Parent”), and MM Air Merger Sub Limited, a Bermuda exempted company and wholly owned subsidiary of Parent (“Merger Sub”), pursuant to which, among other things, Merger Sub will merge with and into the Company, with Aircastle surviving as a wholly owned subsidiary of Parent (the “Merger”). Parent and Merger Sub are newly-formed entities controlled by affiliates of Marubeni and Mizuho Leasing.
Pursuant to the Merger Agreement, subject to certain conditions set forth therein, at the effective time of the Merger (the “Effective Time”), each issued and outstanding common share, par value $0.01 per share, of the Company (the “Common Shares”) (other than (i) shares to be canceled or converted into shares of the surviving company pursuant to the Merger Agreement and (ii) restricted shares to be canceled and exchanged pursuant to the Merger Agreement), shall be converted into the right to receive $32.00 in cash, without interest (the “Merger Consideration”).
Consummation of the Merger is subject to the satisfaction of certain remaining customary closing conditions, including, without limitation, (i) approval of the Merger Agreement and the transactions contemplated thereby by the affirmative votes of a majority of the votes cast by holders of outstanding Common Shares at a meeting of the Company’s shareholders; (ii) the receipt of any applicable pre-clearance or similar approval of certain remaining specified jurisdictions (i.e., Chile, Mexico and Morocco), and all required regulatory approvals being in full force and effect; (iii) the absence of any law, judgment or other legal restraint that prevents, makes illegal or prohibits the consummation of the Merger and the other transactions contemplated by the Merger Agreement; (iv) the accuracy of each party’s representations and warranties (subject to certain qualifications); (v) each party’s performance in all material respects of its obligations contained in the Merger Agreement; and (vi) the absence of a material adverse effect on the Company since the date of the Merger Agreement.
The Merger Agreement includes customary representations, warranties and covenants of Aircastle, Parent, and Merger Sub. Among other things, Aircastle has agreed to customary covenants regarding the operation of the business of Aircastle and its subsidiaries prior to the closing. Aircastle is permitted to pay regular quarterly dividends up to $0.32 per common share pursuant to the Merger Agreement. The Company currently anticipates that the Merger will close in the first half of calendar year 2020, subject to the satisfaction of the remaining customary closing conditions.
Competitive Strengths
We believe that the following competitive strengths will allow us to capitalize on future growth opportunities in the global aviation industry:
|
•
|
Diversified portfolio of modern aircraft.
We have a portfolio of modern aircraft that is diversified with respect to lessees, geographic markets, lease maturities and aircraft types. As of
December 31, 2019
, our owned and managed aircraft portfolio consisted of
287
aircraft, comprised of a variety of aircraft types leased to
85
lessees located in
49
countries. Lease expirations for our owned aircraft are well dispersed, with a weighted-average remaining lease term of
4.8
years. This provides the company with a long-dated base of contracted revenues.
|
2
We believe our focus on portfolio diversification reduces the risks associated with individual lessee defaults and adverse geopolitical or economic issues, and results in generally predictable cash flows.
|
•
|
Flexible, disciplined acquisition approach and broad investment sourcing network.
Since our formation, we have acquired 519 aircraft for $17.27 billion.
Our investment strategy is to seek out the best risk-adjusted return opportunities across the commercial jet market, so our acquisition targets vary with market opportunities. We source our acquisitions through well-established relationships with airlines, other aircraft lessors, manufacturers, financial institutions and other aircraft owners. Since our formation in 2004, we built our aircraft portfolio through more than 168 transactions with 94 counterparties.
|
|
•
|
Significant experience in successfully selling aircraft throughout their life cycle.
Our team is adept at managing and executing the sale of aircraft. Since our formation, we have sold 241 aircraft for $5.78 billion. These sales produced net gains of $368.4 million and involved a wide range of aircraft types and buyers. Of these aircraft, 162, or 67%, were over fourteen years old at the time of sale; many of these being sold on a part-out disposition basis, where the airframe and engines may be sold to various buyers. We believe our competence in selling older aircraft is one of the capabilities that sets us apart from many of our competitors.
|
|
•
|
Strong capital raising track record and access to a wide range of financing sources.
Aircastle is a publicly listed company, and our shares have traded on the New York Stock Exchange (“NYSE”) since 2006. Since our inception in late 2004, we raised $1.69 billion in equity capital from private and public investors. Our largest shareholder is Marubeni, with whom we maintain a strong, strategic relationship. We also obtained $16.90 billion in debt capital from a variety of sources including the unsecured bond market, commercial banks, export credit agency-backed debt, and the aircraft securitization market. The diversity and global nature of our financing sources demonstrates our ability to adapt to changing market conditions and seize new opportunities.
|
|
•
|
Our capital structure provides investment flexibility.
We have $950.0 million available from unsecured revolving credit facilities that expire in 2021 and 2022, thereby limiting our near-term financial markets exposure. Given our relatively limited future capital commitments, we have the resources to take advantage of future investment opportunities. Our large unencumbered asset base and our unsecured revolving lines of credit give us access to the unsecured bond market, allowing us to pursue a flexible and opportunistic investment strategy.
|
|
•
|
Experienced management team with significant expertise.
Each member of our management team has more than twenty years of industry experience and we have expertise in the acquisition, leasing, financing, technical management, restructuring/repossession and sale of aviation assets. This experience spans several industry cycles and a wide range of business conditions and is global in nature. We believe our management team is highly qualified to manage and grow our aircraft portfolio and to address our long-term capital needs.
|
|
•
|
Global and scalable business platform.
We operate through offices in the United States, Ireland and Singapore, using a modern asset management system designed specifically for aircraft operating lessors and capable of handling a significantly larger aircraft portfolio. We believe that our current facilities, systems and personnel are capable of supporting an increase in our revenue base and asset base without a proportional increase in overhead costs.
|
Business Strategy
Aircraft owners have benefited from the low interest rate environment in recent years. Particularly strong conditions in the debt capital markets have provided select borrowers, including Aircastle, access to attractively priced, flexible financing. This provides us a competitive advantage over many airlines and lessors. Geopolitical and macroeconomic events may increase the cost of capital and limit its availability in the future. Market dislocations may also, however, provide attractive investment opportunities for Aircastle.
We plan to grow our business and profits over the long-term while limiting long-dated capital commitments and maintaining a conservative and flexible capital structure. Our business strategy entails the following elements:
|
•
|
Pursuing a disciplined and differentiated investment strategy.
In our view, the relative values of different aircraft change over time. We continually evaluate investments across different aircraft models, ages, lessees and acquisition sources and re-evaluate these choices as market conditions and relative investment values change. We believe our team’s experience with a wide range of asset types and the financing flexibility offered through unsecured debt provides us with a competitive advantage. We view orders from equipment manufacturers to be part of our investment opportunity set, but choose to keep our long term capital commitments limited.
|
3
|
•
|
Originating investments from many different sources across the globe.
Our strategy is to seek out worthwhile investments by leveraging our team’s wide range of contacts. We utilize a multi-channel approach to sourcing acquisitions and have purchased aircraft from a large number of airlines, lessors, original equipment manufacturers, lenders and other aircraft owners. Since our formation in 2004, we have acquired aircraft from 94 different sellers.
|
|
•
|
Selling assets when attractive opportunities arise.
We sell assets with the aim of realizing profits and reinvesting proceeds. We also use asset sales for portfolio management purposes, such as reducing lessee specific concentrations and lowering residual value exposures to certain aircraft types. Since our formation, we have sold aircraft to 73 buyers.
|
|
•
|
Maintaining efficient access to capital from a wide set of sources and leveraging our recent investment grade credit rating.
We believe the aircraft investment market is influenced by the business cycle. Our strategy is to increase our purchase activity when prices are low and to emphasize asset sales when prices are high. To implement this approach, we believe it is important to maintain access to a wide variety of financing sources. During 2018, we improved our corporate credit ratings to an investment grade level by maintaining strong portfolio and capital structure metrics while achieving a critical size through accretive growth. We believe our investment grade rating not only reduces our borrowing costs, but also facilitates more reliable access to both unsecured and secured debt capital throughout the business cycle.
|
|
•
|
Leveraging our strategic relationships.
We intend to capture the benefits provided through the extensive global contacts and relationships maintained by Marubeni, which is our largest shareholder and is one of the largest Japanese trading companies. Marubeni has enabled greater access to Japanese-based financing and helped source and develop our joint venture with Mizuho Leasing. See also description of Merger above.
|
|
•
|
Capturing the value of our efficient operating platform and strong operating track record.
We believe our team’s capabilities in the global aircraft leasing market places us in a favorable position to source and manage new income-generating activities. We intend to continue to focus our efforts in areas where we believe we have competitive advantages, including new direct investments as well as ventures with strategic business partners.
|
|
•
|
Intending to pay quarterly dividends to our shareholders based on the Company
’
s sustainable earnings levels.
Aircastle has paid dividends each quarter since our initial public offering in 2006. On
October 28, 2019
, our Board of Directors declared a regular quarterly dividend of
$0.32
per common share, or an aggregate of
$23.9 million
for the three months ended
December 31, 2019
, which was paid on
December 13, 2019
to holders of record on
November 29, 2019
. These dividend amounts may not be indicative of any future dividends. Our ability to pay quarterly dividends will depend upon many factors, including those as described in Item 1A. “Risk Factors” and elsewhere in this Annual Report.
|
|
Declaration Date
|
Dividend per Common Share
|
Aggregate
Dividend
Amount
|
Record Date
|
Payment Date
|
||||||||
|
October 28, 2019
|
$
|
0.32
|
|
$
|
23,884
|
|
November 29, 2019
|
December 13, 2019
|
||||
|
August 2, 2019
|
$
|
0.30
|
|
$
|
22,390
|
|
August 30, 2019
|
September 16, 2019
|
||||
|
April 30, 2019
|
$
|
0.30
|
|
$
|
22,536
|
|
May 31, 2019
|
June 14, 2019
|
||||
|
February 8, 2019
|
$
|
0.30
|
|
$
|
22,518
|
|
February 28, 2019
|
March 15, 2019
|
||||
|
October 30, 2018
|
$
|
0.30
|
|
$
|
22,867
|
|
November 30, 2018
|
December 14, 2018
|
||||
|
August 3, 2018
|
$
|
0.28
|
|
$
|
21,870
|
|
August 31, 2018
|
September 14, 2018
|
||||
|
May 1, 2018
|
$
|
0.28
|
|
$
|
21,908
|
|
May 31, 2018
|
June 15, 2018
|
||||
|
February 2, 2018
|
$
|
0.28
|
|
$
|
22,085
|
|
February 28, 2018
|
March 15, 2018
|
||||
|
October 31, 2017
|
$
|
0.28
|
|
$
|
22,039
|
|
November 30, 2017
|
December 15, 2017
|
||||
|
August 4, 2017
|
$
|
0.26
|
|
$
|
20,464
|
|
August 31, 2017
|
September 15, 2017
|
||||
|
May 2, 2017
|
$
|
0.26
|
|
$
|
20,482
|
|
May 31, 2017
|
June 15, 2017
|
||||
|
February 9, 2017
|
$
|
0.26
|
|
$
|
20,466
|
|
February 28, 2017
|
March 15, 2017
|
||||
We believe our team’s capabilities in the global aircraft leasing market place us in a favorable position to explore new income-generating activities as capital becomes available for such activities. We intend to continue to focus our efforts on investment opportunities in areas where we believe we have competitive advantages and on transactions that offer attractive risk/return profiles. There can be no assurance, however, that we will be able to access capital on a cost-effective basis and a failure to do so could have a material adverse effect on our business, financial condition or results of operations.
4
Acquisitions and Sales
We originate acquisitions and sales through well-established relationships with airlines, other aircraft lessors, financial institutions and brokers, as well as other sources. We believe that sourcing such transactions globally through multiple channels provides for a broad and relatively consistent set of opportunities.
Our objective is to develop and maintain a diverse operating lease portfolio. We review our operating lease portfolio to sell aircraft opportunistically, to manage our portfolio diversification and to exit from aircraft investments when we believe selling will achieve better expected risk-adjusted cash flows than reinvesting in and re-leasing the aircraft. See “Management’s Discussion and Analysis of Financial Condition and Results of Operations — Overview — Acquisitions and Sales.”
We have an experienced acquisition and sales team based in Stamford, Connecticut; Dublin, Ireland; and Singapore that maintains strong relationships with a wide variety of market participants throughout the world. We believe that our seasoned personnel and extensive industry contacts facilitate our access to acquisition and sales opportunities and that our strong operating track record facilitates our access to debt and equity capital markets.
Potential investments and sales are evaluated by teams comprised of marketing, technical, risk management, finance and legal professionals. These teams consider a variety of aspects before we commit to purchase or sell an aircraft, including price, specification/configuration, age, condition and maintenance history, operating efficiency, lease terms, financial condition and liquidity of the lessee, jurisdiction, industry trends and future redeployment potential and values. We believe that utilizing a cross-functional team of experts to consider investment parameters helps us assess more completely the overall risk and return profile of potential acquisitions and helps us move forward expeditiously on letters of intent and acquisition documentation.
Finance
We believe that cash on hand, payments received from lessees and other funds generated from operations, unsecured borrowings, borrowings from our revolving credit facilities, secured borrowings for aircraft, and other borrowings and proceeds from future aircraft sales will be sufficient to satisfy our liquidity and capital resource needs over the next twelve months. We may choose to repay all or a portion of such borrowings from time to time with the net proceeds from subsequent long-term debt financings, additional equity offerings or cash generated from operations and asset sales. Our ability to execute our business strategy, particularly the acquisition of additional commercial jet aircraft or other aviation assets, depends to a significant degree on our ability to obtain additional debt and equity capital on terms we deem attractive.
See “Management’s Discussion and Analysis of Financial Condition and Results of Operations — Liquidity and Capital Resources — Secured Debt Financings” and “ — Unsecured Debt Financings” under Item 7.
Segments
The Company manages, analyzes and reports on its business and results of operations on the basis of one operating segment: leasing, financing, selling and managing commercial flight equipment. Our chief executive officer is the chief operating decision maker.
Aircraft Leases
Our aircraft are net leases whereby we retain the benefit, and bear the risk, of re-leasing and of the residual value of the aircraft at the end of the lease. Leasing can be an attractive alternative to ownership for an airline because leasing increases an airline’s fleet flexibility, requires lower capital commitments, and significantly reduces aircraft residual value risks for the airline. Typically, the lessee agrees to lease an aircraft for a fixed term, although certain of our leases allow the lessee the option to extend the lease for an additional term or, in rare cases, terminate the lease prior to its expiration. As a percentage of lease rental revenue for the year ended
December 31, 2019
, our two largest customers, IndiGo and Lion Air, accounted for 9% and 6%, respectively.
5
The scheduled maturities of our aircraft leases by aircraft type grouping currently are as follows, taking into account sales, sale agreements, lease placements and renewal commitments as of
February 10, 2020
:
|
2020
|
2021
|
2022
|
2023
|
2024
|
2025
|
2026
|
2027
|
2028
|
2029
|
2030
|
2031
|
Off-Lease
(1)
|
Sold or Sale Agreement
|
Total
|
||||||||||||||||||||||||||||||
|
A319/A320/A320neo/A321
|
9
|
|
13
|
|
16
|
|
21
|
|
40
|
|
22
|
|
10
|
|
10
|
|
3
|
|
—
|
|
—
|
|
—
|
|
—
|
|
21
|
|
165
|
|
||||||||||||||
|
A330-200/300
|
2
|
|
1
|
|
—
|
|
—
|
|
2
|
|
3
|
|
1
|
|
4
|
|
1
|
|
1
|
|
3
|
|
1
|
|
—
|
|
—
|
|
19
|
|
||||||||||||||
|
737-700/800/900ER
|
1
|
|
4
|
|
18
|
|
17
|
|
12
|
|
5
|
|
5
|
|
5
|
|
2
|
|
5
|
|
—
|
|
—
|
|
1
|
|
5
|
|
80
|
|
||||||||||||||
|
777-300ER
|
—
|
|
—
|
|
—
|
|
—
|
|
—
|
|
2
|
|
2
|
|
1
|
|
—
|
|
—
|
|
—
|
|
—
|
|
—
|
|
—
|
|
5
|
|
||||||||||||||
|
E195
|
—
|
|
—
|
|
—
|
|
3
|
|
2
|
|
—
|
|
—
|
|
—
|
|
—
|
|
—
|
|
—
|
|
—
|
|
—
|
|
—
|
|
5
|
|
||||||||||||||
|
Freighters
|
—
|
|
—
|
|
—
|
|
1
|
|
2
|
|
—
|
|
—
|
|
—
|
|
1
|
|
—
|
|
—
|
|
—
|
|
—
|
|
—
|
|
4
|
|
||||||||||||||
|
Total
|
12
|
|
18
|
|
34
|
|
42
|
|
58
|
|
32
|
|
18
|
|
20
|
|
7
|
|
6
|
|
3
|
|
1
|
|
1
|
|
26
|
|
278
|
|
||||||||||||||
______________
|
(1)
|
Consisted of one Boeing 737-800 aircraft which we are marketing for lease or sale.
|
2020 Lease Expirations and Lease Placements
We began 2020 with 32 aircraft having scheduled lease expirations in 2020 and three off-lease aircraft. As of
February 10, 2020
, we have agreements to lease or extend thirteen of these aircraft and to sell nine others. Of the remaining thirteen aircraft, which account for 3.9% of our net book value at
December 31, 2019
, we expect that six aircraft will be sold at lease end, with the remaining seven aircraft still to be placed.
2021-2024 Lease Expirations and Lease Placements
Taking into account lease and sale commitments, we currently have the following number of aircraft with lease expirations scheduled in the period 2021-2024, representing the percentage of our net book value at
December 31, 2019
, specified below:
|
•
|
2021: 18 aircraft, representing 5%;
|
|
•
|
2022: 34 aircraft, representing 10%;
|
|
•
|
2023: 42 aircraft, representing 12%; and
|
|
•
|
2024: 58 aircraft, representing 21%.
|
Lease Payments and Security.
Each of our leases requires the lessee to pay periodic rentals during the lease term. As of
December 31, 2019
, rentals on more than 93% of our leases, as a percentage of net book value, are fixed and do not vary according to changes in interest rates. For the remaining leases, rentals are payable on a floating interest-rate basis. Virtually all lease rentals are payable monthly in advance, and all lease rentals are payable in U.S. dollars.
Under our leases, the lessee must pay operating expenses payable or accrued during the term of the lease, which normally include maintenance, overhaul, fuel, crew, landing, airport and navigation charges, certain taxes, licenses, consents and approvals, aircraft registration and insurance premiums. Typically, the lessee is required to make payments for heavy maintenance, overhaul or replacement of certain high-value components of the aircraft. These maintenance payments are based on hours or cycles of utilization or on calendar time, depending upon the component, and are either made monthly in arrears or at the end of the lease term. Our determination of whether to permit a lessee to make a single maintenance payment at the end of the lease term, or to require such payments to be made monthly, depends on a variety of factors, including the creditworthiness of the lessee, the amount of security deposit which may be provided by the lessee and market conditions at the time. If a lessee is making monthly maintenance payments, we would typically be obligated to use the funds paid by the lessee during the lease term to reimburse the lessee for costs they incur for heavy maintenance, overhaul or replacement of certain high-value components, usually following completion of the relevant work. If a lease requires an end of lease maintenance payment, the lessee would typically be required to pay us for its utilization of the aircraft during the lease. In some cases, however, we may owe a net payment to the lessee in the event heavy maintenance is performed and the aircraft is returned to us in better condition than at lease inception.
Many of our leases also contain provisions requiring us to pay a portion of the cost of modifications to the aircraft performed by the lessee at its expense if such modifications are mandated by recognized airworthiness authorities. Typically,
6
these provisions would set a threshold, below which the lessee would not have a right to seek reimbursement and above which we may be required to pay a portion of the cost incurred by the lessee. The lessees are obliged to remove liens on the aircraft other than liens permitted under the leases.
Our leases generally provide that the lessees’ payment obligations are absolute and unconditional under any and all circumstances and require lessees to make payments without withholding payment on account of any amounts the lessor may owe the lessee or any claims the lessee may have against the lessor for any reason, except that under certain of the leases a breach of quiet enjoyment by the lessor may permit a lessee to withhold payment. The leases also generally include an obligation of the lessee to gross up payments under the lease where lease payments are subject to withholding and other taxes, although there may be some limitations to the gross up obligation, including provisions which do not require a lessee to gross up payments if the withholdings arise out of our ownership or tax structure. In addition, changes in law may result in the imposition of withholding and other taxes and charges that are not reimbursable by the lessee under the lease or that cannot be so reimbursed under applicable law. Our leases also generally require the lessee to indemnify the lessor for tax liabilities relating to the leases and the aircraft, including in most cases, value added tax and stamp duties, but excluding income tax or its equivalent imposed on the lessor.
Portfolio Risk Management
Our objective is to build and maintain a lease portfolio which is balanced and diversified and delivers returns commensurate with risk. We have portfolio concentration objectives to assist in portfolio risk management and highlight areas where action to mitigate risk may be appropriate, and take into account the following:
|
•
|
individual lessee exposures;
|
|
•
|
geographic concentrations;
|
|
•
|
aircraft type concentrations;
|
|
•
|
portfolio credit quality distribution; and
|
|
•
|
lease maturity distribution.
|
We have a risk management team which undertakes detailed due diligence on lessees when aircraft are acquired with a lease already in place and for placement of aircraft with new lessees following lease expiration or termination.
Lease Management and Remarketing
Our aircraft re-leasing strategy is to develop opportunities proactively, well in advance of scheduled lease expiration, to enable consideration of a broad set of alternatives, including deployment, sale or part-out, and to allow for reconfiguration or maintenance lead times where needed. We also take a proactive approach to monitoring the credit quality of our customers, and may seek early return and redeployment of aircraft if we feel that a lessee is unlikely to perform its obligations under a lease. We have invested significant resources in developing and implementing what we consider to be state-of-the-art lease management information systems and processes to enable efficient management of aircraft in our portfolio.
Other Aviation Assets and Alternative New Business Approaches
We believe investment opportunities may arise in related areas such as financing secured by commercial jet aircraft as well as jet engine and spare parts leasing, trading and financing. In the future, we may make opportunistic investments in these or other sectors or in other aviation-related assets, and we intend to continue to explore other income-generating activities and investments.
We source and service investments for our joint venture and provide marketing, asset management and administrative services to it. We are paid market based fees for these services, which are recorded in Other revenue in our Consolidated Statements of Income.
We believe we have a world class servicing platform and may also pursue opportunities to capitalize on these capabilities such as providing aircraft management services for third party aircraft owners.
Competition
The aircraft leasing and trading industry is highly competitive with a significant number of active participants. We face competition for the acquisition of aircraft, for the placement of aircraft and for the sale of aircraft which we may wish to divest.
7
Competition for aircraft acquisitions comes from many sources, ranging from large established aircraft leasing companies to smaller players and new entrants. Competition has increased across most asset types and has drawn many new investors to our business.
Larger lessors are generally more focused on acquiring new aircraft via direct orders with the original equipment manufacturers and through purchase and lease-back transactions with airlines. These larger lessors include AerCap Holdings, GE Capital Aviation Services, Air Lease Corporation, SMBC Aviation Capital, BOC Aviation, Avolon Holdings, Aviation Capital Group and Dubai Aerospace Enterprise. In addition, several major Chinese financial institutions’ leasing subsidiaries are aggressively pursuing business, including Industrial and Commercial Bank of China (“ICBC”) and China Development Bank (“CDB”). In October 2019, Accipter and MCAP merged to create AMCK Aviation. In November 2019, DVB sold its aviation finance activities to MUFG Bank Ltd. In December 2019, GE Capital sold its PK AirFinance subsidiary to Apollo Global Management and Athene Holding. Tokyo Century Corporation, part of the Mizuho Group, acquired the remaining 80% interest in Aviation Capital Group it did not own in December 2019.
Competition for mid-aged and older aircraft typically comes from other competitors that, in many cases, rely on private equity or hedge fund capital sources. Such competitors include Carlyle Aviation Partners, Castlelake, Alterna Capital Partners and other players funded by alternative investment funds and companies. These companies are typically fund-based, rather than having permanent capital structures, and have benefited from the substantially improved availability of debt financing for mid-aged aircraft.
Competition for leasing or re-leasing of aircraft, as well as aircraft sales, is based principally upon the availability, type and condition of aircraft, user base, lease rates, prices and other lease terms. Aircraft manufacturers, leasing companies, airlines and other operators, distributors, equipment managers, financial institutions and other parties engaged in leasing, managing, marketing or remarketing aircraft compete with us, although their focus may be on different market segments and aircraft types.
Some of our competitors have, or may obtain, greater financial resources and may have a lower cost of capital. A number also commit to speculative orders of new aircraft to be placed on operating lease upon delivery from the manufacturer, which compete with new and used aircraft offered by other lessors. However, we believe that we are able to compete favorably in aircraft acquisition, leasing and sales activities due to the reputation of our team of experienced professionals, extensive market contacts and expertise in sourcing and acquiring aircraft. We also believe our access to unsecured debt provides us with a competitive advantage in pursuing investments quickly and reliably and in acquiring aircraft in situations where it may be more difficult to finance on a secured, non-recourse basis.
Employees
As of
December 31, 2019
, we had 111 employees. None of our employees are covered by a collective bargaining agreement, and we believe that we maintain excellent employee relations. We provide certain employee benefits, including retirement benefits, and health, life, disability and accident insurance plans.
Insurance
We require our lessees to carry general third-party legal liability insurance, all-risk aircraft hull insurance (both with respect to the aircraft and with respect to each engine when not installed on our aircraft) and war-risk hull and legal liability insurance. We are named as an additional insured on liability insurance policies carried by our lessees, and we or one of our lenders would typically be designated as a loss payee in the event of a total loss of the aircraft. We maintain contingent hull and liability insurance coverage with respect to our aircraft which is intended to provide coverage for certain risks, including the risk of cancellation of the hull or liability insurance maintained by any of our lessees without notice to us, but which excludes coverage for other risks such as the risk of insolvency of the primary insurer or reinsurer.
We maintain insurance policies to cover non-aviation risks related to physical damage to our equipment and property, as well as with respect to third-party liabilities arising through the course of our normal business operations (other than aircraft operations). We also maintain limited business interruption insurance to cover a portion of the costs we would expect to incur in connection with a disruption to our main facilities, and we maintain directors’ and officers’ liability insurance providing coverage for liabilities related to the service of our directors, officers and certain employees. Consistent with industry practice, our insurance policies are generally subject to deductibles or self-retention amounts.
8
We believe the insurance coverage currently carried by our lessees and by Aircastle provides adequate protection against the accident-related and other covered risks involved in the conduct of our business. However, there can be no assurance that we have adequately insured against all risks, that lessees will at all times comply with their obligations to maintain insurance, that our lessees’ insurers and re-insurers will be or will remain solvent and able to satisfy any claims, that any particular claim will ultimately be paid or that we will be able to procure adequate insurance coverage at commercially reasonable rates in the future.
Government Regulation
The air transportation industry is highly regulated. In general, we are not directly subject to most air transportation regulations because we do not operate aircraft. In contrast, our lessees are subject to extensive, direct regulation under the laws of the jurisdictions in which they are registered and where they operate. Such laws govern, among other things, the registration, operation, security, and maintenance of our aircraft, as well as environmental and financial oversight regulation of their operations.
Our customers may also be subject to noise or emissions regulations in the jurisdictions in which they operate our aircraft. European countries, in particular, have strict environmental regulations, and, in 2008 the European Union (“E.U.”) introduced the European Emissions Trading Scheme (“EU ETS”), which was extended to include carbon dioxide (“CO
2
”) emissions from aviation in 2012. As a “cap and trade” mechanism, the legislation imposes the requirements of monitoring, reporting and verifying emissions on airlines, and caps CO
2
emissions for each year at a level determined by the legislation. Under the scheme, an airline is only permitted to release as many CO
2
emissions as the ‘carbon credits’ allocated it, with the total number of credits allocated to all airlines being equal to the cap. An airline may increase its allocation by purchasing credits from another airline. However, in 2014, the E.U. limited the application of the EU ETS to flights within the European Economic Area (“EEA”) and deferred any further application until 2024, pending a review of a new initiative by International Civil Aviation Organization (“ICAO”) put in place in 2016.
In October 2016, ICAO adopted a global market-based measure to control CO
2
emissions from international aviation. This measure is the “Carbon Offsetting and Reduction Scheme” for International Aviation (“CORSIA”) with the aim of achieving carbon-neutral growth from 2020 onwards. The CORSIA pilot phase (2021-2023) and the CORSIA first phase (2024-2026) will apply only to routes between countries that have each volunteered to participate in the scheme. All airlines that operate routes between two volunteering countries will be subject to the offsetting requirements, which means that any such airline must buy an emissions credit that has been verified as having reduced emissions elsewhere to offset the emissions that that airline would otherwise not have caused. The requirement to offset emissions will be divided among airlines in proportion to their total CO
2
emissions (but not the growth of emissions of the company), which is referred to as the “sectoral” approach to emissions. From 2030 onwards, this sectoral approach will transition to an approach instead based on each airline’s individual rate of growth. From 2030-2032, 20% of offsets will be calculated according to this “individual” approach, and the remaining 80% calculated by the “sectoral” approach. In 2033-2035, 70% of the offset requirements will be based on the “individual” approach.
In July 2016, the U.S. Environmental Protection Agency (“EPA”) determined that Greenhouse Gas (“GHG”) emissions from certain aircraft engines contribute to climate change and endangers the public’s health and the environment. The findings are for CO
2
, methane, nitrous oxide, hydrofluorocarbons, perfluorocarbons, and sulfur hexafluoride. At that time, the EPA indicated its intention to promulgate new rules to adopt GHG standards promulgated by the ICAO. However, in June 2017, the United States indicated that it is reviewing whether it will remain fully committed to the ICAO rules, including CORSIA. No firm date for conclusion of this review has been announced.
Other environmental regulations to which our customers may be subject to include those relating to discharges to surface and subsurface waters, management of hazardous substances, oils, and waste materials, and other regulations affecting their aircraft operations.
Subsequent Events
The Company’s management has reviewed and evaluated all events or transactions for potential recognition and/or disclosure since the balance sheet date of
December 31, 2019
through the date of this filing, the date on which the consolidated financial statements included in this Form 10-K were issued.
9
In addition to the other information set forth in this Annual Report, you should carefully consider the following factors, which could materially adversely affect our business, financial condition, results of operations or ability to pay dividends in future periods or to meet our debt obligations. The risks described below are not the only risks facing our Company. Additional risks not currently known to us or that we currently deem to be immaterial also may materially adversely affect our business, financial condition, results of operations or ability to pay dividends in future periods.
Risks Related to Our Business
Risks Related to Our Operations
Risks affecting the airline industry may adversely affect our customers and have a material adverse impact on our financial results.
We operate as a supplier to airlines and are indirectly impacted by all the risks facing airlines today. The ability of each lessee to perform its obligations under the relevant lease will depend primarily on the lessee’s financial condition and cash flow, which may be affected by factors beyond our control, including:
|
•
|
passenger and air cargo demand;
|
|
•
|
competition;
|
|
•
|
passenger fare levels and air cargo rates;
|
|
•
|
availability of financing and other circumstances affecting airline liquidity, including covenants in financings, terms imposed by credit card issuers, collateral posting requirements contained in hedging contracts and the ability of airlines to make or refinance principal payments as they come due;
|
|
•
|
operating costs, including the price and availability of jet fuel, labor costs and insurance costs and coverages;
|
|
•
|
restrictions in labor contracts and labor difficulties, including pilot shortages;
|
|
•
|
economic conditions, including recession, financial system distress and currency fluctuations in the countries and regions in which the lessee operates or from which the lessee obtains financing;
|
|
•
|
aircraft accidents;
|
|
•
|
the continuing availability of government support, whether through subsidies, loans, guarantees, equity investments or otherwise;
|
|
•
|
changing political conditions, including risk of rising protectionism, restrictions on immigration or imposition of new trade barriers;
|
|
•
|
geopolitical and other events, including war, acts or threats of terrorism, outbreaks of epidemic diseases and natural disasters;
|
|
•
|
impact of climate change and emissions on demand for air travel;
|
|
•
|
cyber risk, including information hacking, viruses and malware; and
|
|
•
|
governmental regulation of, or affecting the air transportation business, including noise regulations, emissions regulations, climate change initiatives, and aircraft age limitations.
|
These factors, and others, may lead to defaults by our customers, or may delay or prevent aircraft deliveries or transitions, result in payment restructurings or other lease term restructurings, and may increase our costs from repossessions and reduce our revenues due to downtime or lower re-lease rates.
Volatile financial market conditions may adversely impact our liquidity, our access to capital and our cost of capital and may adversely impact the airline industry and the financial condition of our lessees.
The availability and pricing of capital in the commercial bank market and in the unsecured bond market remain susceptible to global events, including, for example, political changes in the U.S. and abroad, rising interest rates, currency fluctuations, the rate of international economic growth and implications from changes in oil prices. If we need, but cannot obtain, adequate capital on satisfactory terms, or at all, as a result of negative conditions in the capital markets or otherwise, our business, financial condition, results of operations or our ability to pay dividends to our shareholders could be materially
10
adversely affected. Additionally, such inability to obtain capital on satisfactory terms, or at all, could prevent us from pursuing attractive future growth opportunities.
We bear the risk of re-leasing and selling our aircraft.
We bear the risk of re-leasing or selling or otherwise disposing of our aircraft in order to continue to generate income. In certain cases we commit to purchase aircraft that are not subject to lease and therefore are subject to lease placement risk. We are exposed to the risk that the residual value of the aircraft will not be sufficient to permit us to fully recover or realize a gain on our investment in the aircraft and that we may have to record impairment charges as only a portion of an aircraft’s value is covered by contractual cash flows from leases. Further, our ability to re-lease, lease or sell aircraft on favorable terms, or at all, or without significant off-lease time and transition costs is likely to be adversely impacted by risks affecting the airline industry generally.
Other factors that may affect our ability to fully realize our investment in our aircraft and that may increase the likelihood of impairment charges include credit deterioration of a lessee, declines in rental rates, residual value risk, higher fuel prices which may reduce demand for older, less fuel efficient aircraft, additional environmental regulations, age restrictions, customer preferences and other factors that may effectively shorten the useful life of older aircraft.
We own and lease long-lived assets and have written down the value of some of our assets. If market conditions worsen, or in the event of a customer default, we may be required to record further write-downs.
We test our assets for recoverability whenever events or changes in circumstances indicate that the carrying amounts for such assets are not recoverable from their expected, undiscounted cash flows. We also perform a fleet-wide recoverability assessment annually. This recoverability assessment is a comparison of the carrying value of each aircraft to its undiscounted expected future cash flows. We develop the assumptions used in the recoverability assessment, including those relating to current and future demand for each aircraft type, based on management’s experience in the aircraft leasing industry as well as from information received from third party sources.
If anticipated aircraft lease cash flows or sales values worsen due to a decline in market conditions, or if a lessee defaults, we may have to reassess the carrying value of one or more of our aircraft. As aircraft approach the end of their economic lives, their carrying values may be more susceptible to non-recoverable declines in value because such assets will have a shorter opportunity in which to benefit from a market recovery. We monitor our fleet for aircraft that are more susceptible to failing our recoverability assessments within one year due to their sensitivity to changes in contractual cash flows, future cash flow estimates and aircraft residual or scrap values. As of
December 31, 2019
, no aircraft were on our monitoring list.
Our ability to obtain debt financing and our cost of debt financing is, in part, dependent upon our credit ratings and a credit downgrade or being put on negative watch could adversely impact our financial results.
Maintaining our credit ratings depends in part on strong financial results and in part on other factors, including the outlook of the ratings agencies on our sector and on the market generally. A credit rating downgrade or being put on negative watch may make it more difficult or costly for us to raise debt financing in the unsecured bond market, or may result in higher pricing or less favorable terms under other financings. Credit rating downgrades or being put on negative watch may make it more difficult and/or more costly to satisfy our funding requirements. In addition, any future tightening or regulation of financial institutions, including increasing capital reserves, could impact our ability to raise funds in the commercial bank loan market in the future.
An increase in our borrowing costs may adversely affect our earnings and cash available for distribution to our shareholders.
Some of our aircraft are financed under long-term debt financings. As these financings mature, we will be required to either refinance these instruments by entering into new financings, which could result in higher borrowing costs, or repay them by using cash on hand or cash from the sale of our assets.
Departure of key officers could harm our business and financial results.
Our senior management’s reputations and relationships with lessees, sellers, buyers and financiers of aircraft are a critical element of our business. We encounter intense competition for qualified employees from other companies in the aircraft leasing industry, and we believe there are only a limited number of available qualified executives in our industry.
11
The Company seeks to retain a pipeline of senior management personnel with superior talent to provide continuity of succession, including for the Chief Executive Officer position and other senior positions. In addition, our Board of Directors is involved in succession planning, including review of short- and long-term succession plans for the Chief Executive Officer and other senior positions. Our future success depends, to a significant extent, upon the continued service of our senior management personnel, including the Chief Executive Officer and his potential successors, and if we lose one or more of these individuals, our business could be adversely affected.
We may not be able to pay or maintain dividends, or we may choose not to pay dividends, and the failure to pay or maintain dividends may adversely affect our share price.
On
October 28, 2019
, our Board of Directors declared a regular quarterly dividend of
$0.32
per common share, or an aggregate of
$23.9 million
, which was paid on
December 13, 2019
to holders of record on
November 29, 2019
. This dividend may not be indicative of the amount of any future quarterly dividends. Our ability to pay, maintain or increase cash dividends to our shareholders is subject to the discretion of our Board of Directors and will depend on many factors, including: our ability to comply with financial covenants in our financing documents that limit our ability to pay dividends and make certain other restricted payments; the difficulty we may experience in raising, and the cost of, additional capital and our ability to finance our aircraft acquisition commitments; our ability to re-finance our long-term financings; our ability to negotiate and enforce favorable lease rates and other contractual terms; the level of demand for our aircraft in the lease placement or sales markets; the economic condition of the commercial aviation industry generally; the financial condition and liquidity of our lessees; unexpected or increased aircraft maintenance or other expenses; the level and timing of capital expenditures, principal repayments and other capital needs; maintaining our credit ratings, our results of operations, financial condition and liquidity; legal restrictions on the payment of dividends, including a statutory dividend test and other limitations under Bermuda law; and general business conditions and other factors that our Board of Directors deems relevant. Additionally, the Merger Agreement permits the Company to declare and pay a regular quarterly dividend of up to $0.32 per common share. Some of these factors are beyond our control. In the future, we may choose to not pay dividends or may not be able to pay dividends, maintain our current level of dividends, or increase them over time. The failure to maintain or pay dividends may adversely affect our share price.
We are subject to risks related to our indebtedness that may limit our operational flexibility and our ability to compete with our competitors.
As of
December 31, 2019
, our total indebtedness was
$5.06 billion
, representing approximately 71.1% of our total capitalization. Aircastle Limited is either the principal obligor or has guaranteed most of this indebtedness, and we are responsible on a full recourse basis for timely payment when due and compliance with covenants under the related debt documentation. As a result of our substantial amount of indebtedness, we may be unable to generate sufficient cash to pay, when due, the principal of, interest on or other amounts due with respect to our indebtedness, and our substantial amount of indebtedness may increase our vulnerability to adverse economic and industry conditions, reduce our flexibility in planning for or reaction to changes in the business environment or in our business or industry, and adversely affect our cash flow and our ability to operate our business and compete with our competitors.
Our indebtedness subjects us to certain risks, including:
|
•
|
14.7% of our net book value serves as collateral for our secured indebtedness, and the terms of certain of our indebtedness require us to use proceeds from sales of aircraft, in part, to repay amounts outstanding under such indebtedness;
|
|
•
|
our failure to comply with the terms of our indebtedness, including restrictive covenants contained therein, may result in additional interest being due or defaults that could result in the acceleration of the principal, and unpaid interest on, the defaulted debt, as well as the forfeiture of any aircraft pledged as collateral; and
|
|
•
|
non-compliance with covenants prohibiting certain investments and other restricted payments, including limitations on our ability to pay dividends, repurchase our common shares, raise additional capital or refinance our existing debt, may reduce our operational flexibility and limit our ability to refinance or grow the business.
|
The provisions of our long-term financings require us to comply with financial and other covenants. Our compliance with these ratios, tests and covenants depends upon, among other things, the timely receipt of lease payments from our lessees and upon our overall financial performance.
|
•
|
Senior Notes.
Our senior notes indentures impose operating and financial restrictions on our activities. These restrictions limit our ability to, or in certain cases prohibit us from, incurring or guaranteeing additional
|
12
indebtedness, refinancing our existing indebtedness, paying dividends, repurchasing our common shares, making other restricted payments, making certain investments or entering into joint ventures and a cross-default to certain other financings of the Company.
|
•
|
Bank Financings.
Our secured bank financings contain, among other customary provisions, a $500 million minimum net worth covenant, a cross-default to certain other financings of the Company, and for one portfolio financing, a minimum debt service coverage ratio of 1.15.
|
|
•
|
Unsecured Revolving Credit Facilities and Loan.
Our unsecured revolving credit facilities/loan contain $750 million minimum net worth covenants, minimum unencumbered asset ratios, minimum interest coverage ratios and cross-defaults to certain other financings of the Company.
|
|
•
|
ECA Financings.
Our ECA Financings contain a $500 million minimum net worth covenant and also contain, among other customary provisions, a material adverse change default and a cross-default to certain other financings of the Company.
|
The terms of our financings also restrict our ability to incur or guarantee additional indebtedness or engage in mergers, amalgamations or consolidations among our subsidiary companies or between a subsidiary company and a third party or otherwise dispose of all or substantially all of our assets.
We are subject to various risks and requirements associated with transacting business in foreign jurisdictions.
The international nature of our business exposes us to trade and economic sanctions and other restrictions imposed by the U.S. and other governments. The U.S. Departments of Justice, Commerce and Treasury, as well as other agencies and authorities have a broad range of civil and criminal penalties they may seek to impose against companies for violations of export controls, the Foreign Corrupt Practices Act (“FCPA”), and other federal statutes, sanctions and regulations, including those established by the Office of Foreign Assets Control (“OFAC”) and, increasingly, similar or more restrictive foreign laws, rules and regulations, including the U.K. Bribery Act (“UKBA”), which may also apply to us. By virtue of these laws and regulations, and under laws and regulations in other jurisdictions, we may be obliged to limit our business activities, we may incur costs for compliance programs and we may be subject to enforcement actions or penalties for noncompliance. In recent years, U.S. and foreign governments have increased their oversight and enforcement activities with respect to these laws, and we expect the relevant agencies to continue to increase these activities.
We have compliance policies and training programs in place for our employees with respect to FCPA, OFAC Regulations, UKBA and similar laws, but there can be no assurance that our employees, consultants or agents will not engage in conduct for which we may be held responsible. Violations of FCPA, OFAC Regulations, UKBA and other laws, sanctions or regulations may result in severe criminal or civil penalties, and we may be subject to other liabilities.
General Data Protection Regulation (“GDPR”) took effect on May 25, 2018, requiring us to protect the privacy of certain personal data of E.U. citizens. While we have implemented processes and controls to comply with GDPR requirements, the manner in which the E.U. will interpret and enforce certain provisions remains unclear and we could incur significant fines of up to 4% of worldwide revenue, individual damages and reputational risks if the E.U. determines that our controls and processes are ineffective and we have failed to adequately comply with the requirements.
We are dependent upon information technology systems, which are subject to disruption, damage, failure and risks associated with implementation and integration.
We are dependent upon information technology systems to manage, process, store and transmit information associated with our operations, which may include proprietary business information and personally identifiable information of our customers, suppliers and employees. Our information technology systems are subject to disruption, damage or failure from a variety of sources, including, without limitation, computer viruses, security breaches, cyber-attacks, employee error, natural disasters and defects in design. Damage, disruption, or failure of one or more information technology systems may result in interruptions to our operations in the interim or may require a significant investment to fix or replace them or may result in significant damage to our reputation. Although various measures have been implemented to manage our risks related to the information technology systems and network disruptions, our resources and technical sophistication may not be adequate to prevent all types of cyber-attacks that could lead to the payment of fraudulent claims, loss of sensitive information, including our own proprietary information or that of our customers, suppliers and employees, and could harm our reputation and result in lost revenues and additional costs and potential liabilities.
13
Risks Related to Our Aviation Assets
The variability of supply and demand for aircraft could depress lease rates for our aircraft, which would have an adverse effect on our financial results and growth prospects.
The aircraft leasing and sales industry has experienced periods of aircraft oversupply and undersupply. The oversupply of a specific type of aircraft in the market is likely to depress aircraft lease rates for, and the value of, that type of aircraft.
The supply and demand for aircraft is affected by various cyclical and non-cyclical factors that are not under our control, including:
|
•
|
passenger and air cargo demand;
|
|
•
|
operating costs, including fuel costs, and general economic conditions affecting our lessees’ operations;
|
|
•
|
interest rates;
|
|
•
|
foreign exchange rates;
|
|
•
|
the availability of credit;
|
|
•
|
airline restructurings and bankruptcies;
|
|
•
|
changes in control of, or restructurings of, other aircraft leasing companies;
|
|
•
|
manufacturer production levels and technological innovation;
|
|
•
|
discounting by manufacturers on aircraft types nearing end of production;
|
|
•
|
manufacturers merging, exiting the industry or ceasing to produce aircraft types;
|
|
•
|
new-entrant manufacturers producing additional aircraft models, or existing manufacturers producing newly engined aircraft models or new aircraft models, in competition with existing aircraft models;
|
|
•
|
geopolitical events, including war, prolonged armed conflict and acts of terrorism;
|
|
•
|
governmental regulation;
|
|
•
|
climate change initiatives, technological change, aircraft noise and emissions regulations, aircraft age limits and other factors leading to reduced demand for, early retirement or obsolescence of aircraft models;
|
|
•
|
tariffs and other restrictions on trade;
|
|
•
|
outbreaks of communicable diseases and natural disasters;
|
|
•
|
reintroduction into service of aircraft previously in storage; and
|
|
•
|
airport and air traffic control infrastructure constraints.
|
These and other factors may produce sharp decreases or increases in aircraft values and lease rates, which would impact our cost of acquiring aircraft and our ability to grow the business, or which may result in lease defaults and also prevent the aircraft from being re-leased or sold on favorable terms. This could have an adverse effect on our financial results and growth prospects.
Other factors that increase the risk of decline in aircraft value and lease rates could have an adverse effect on our financial results and growth prospects.
In addition to factors linked to the aviation industry generally, other factors that may affect the value and lease rates of our aircraft include:
|
•
|
the age of the aircraft;
|
|
•
|
the particular maintenance and operating history of the airframe and engines;
|
|
•
|
the number of operators using that type of aircraft;
|
|
•
|
whether the aircraft is subject to a lease and, if so, whether the lease terms are favorable to us;
|
|
•
|
the demand for and availability of such aircraft at any given time;
|
|
•
|
applicable airworthiness directives or manufacturer’s service bulletins that have not yet been performed on the aircraft;
|
|
•
|
grounding orders or other regulatory action that could prevent or limit utilization of our aircraft;
|
14
|
•
|
any regulatory and legal requirements that must be satisfied before the aircraft can be purchased, sold or re-leased; and
|
|
•
|
compatibility of our aircraft configurations or specifications with those desired by the operators of other aircraft of that type.
|
Any decrease in the values of and lease rates for commercial aircraft which may result from the above factors or other unanticipated factors may have a material adverse effect on our financial results and growth prospects.
The advent of superior aircraft technology and higher production levels could cause our existing aircraft portfolio to become outdated and therefore less desirable.
As manufacturers introduce technological innovations and new types of aircraft, including the Boeing 787, the Airbus A350, the Airbus A220 (formerly the Bombardier C series) and re-engined and/or replacement types for the Boeing 737, Boeing 777, Airbus A320, Airbus A330 and Embraer E-Jet families of aircraft, certain aircraft in our existing aircraft portfolio may become less desirable to potential lessees or purchasers. This next generation of aircraft is expected to deliver improved fuel consumption and reduced noise and emissions with lower operating costs compared to current-technology aircraft. The Boeing 787 and 737 MAX and the Airbus A350, A320neo and A220 are all currently in production. The Boeing 777X is expected to enter service in 2021. Additionally, Commercial Aircraft Corporation of China Ltd., Mitsubishi and Russia’s United Aircraft Corporation are developing aircraft models that will compete with the Airbus A320 family aircraft, the Boeing 737 and the Embraer E-Jet.
The introduction of these new models and the potential resulting overcapacity in aircraft supply, could adversely affect the residual values and the lease rates for our aircraft, our ability to lease or sell our aircraft on favorable terms, or at all, or result in us recording future impairment charges.
The effects of energy, emissions, and noise regulations and policies may negatively affect the airline industry. This may cause lessees to default on their lease payment obligations to us and may limit the market for certain aircraft in our portfolio.
Governmental regulations regarding aircraft and engine noise and emissions levels apply based on where the relevant aircraft is registered and operated. Jurisdictions throughout the world have adopted noise regulations which require all aircraft to comply with noise level standards. In addition to the current requirements, the United States and ICAO have adopted a new, more stringent set of standards for noise levels which applies to engines manufactured or certified on or after January 1, 2006. Currently, U.S. regulations would not require any phase-out of aircraft that qualify with the older standards applicable to engines manufactured or certified prior to January 1, 2006, but the E.U. has established a framework for the imposition of operating limitations on aircraft that do not comply with the new standards. These regulations could limit the economic life of the aircraft and engines, reduce their value, limit our ability to lease or sell these non-compliant aircraft and engines or, if engine modifications are permitted, require us to make significant additional investments in the aircraft and engines to make them compliant.
In addition to noise restrictions, the U.S. and other jurisdictions have imposed limits on aircraft engine emissions, such as NOx, CO and CO
2
, consistent with current ICAO standards. European countries have relatively strict environmental regulations that can restrict operational flexibility and decrease aircraft productivity. The E.U. has included the aviation sector in its emissions trading scheme (“ETS”), and attempted to apply the ETS to flights outside of European airspace. As a result of opposition from other countries to the E.U. effort, in 2014, the E.U. limited the application of the E.U. ETS to flights within the European Economic Area (“EEA”) and deferred any further application until 2024, pending a review of the results of a new initiative introduced by the promulgated by ICAO. In October 2016, ICAO adopted a global market-based measure to control CO
2
emissions from international aviation. This measure is the “Carbon Offsetting and Reduction Scheme for International Aviation (“CORSIA”) with the aim of achieving carbon-neutral growth from 2020 onwards. The CORSIA pilot phase (2021-2023) and the CORSIA first phase (2024-2026) will apply only to routes between countries that have each volunteered to participate in the scheme. All airlines that operate routes between two volunteering countries will be subject to the offsetting requirements, which means that any such airline must buy an emissions credit that has been verified as having reduced emissions elsewhere to offset the emissions that that airline would otherwise not have caused. The requirement to offset emissions will be divided among airlines in proportion to their total CO
2
emissions (but not the growth of emissions of the company), which is referred to as the “sectoral” approach to emissions. From 2030 onwards, this sectoral approach will transition to a new approach based on each airline’s individual rate of growth. From 2030-2032, 20% of offsets will be calculated according to this “individual” approach, and the remaining 80% calculated by the “sectoral” approach. In 2033-2035, 70% of the offset requirements will be based on the “individual” approach.
15
In 2015, over 190 countries, including the United States, reached an agreement to reduce global GHG emissions at the United Nations Framework Convention on Climate. The agreement does not expressly reference aviation, but if the agreement is implemented in the United States and other countries there could be an adverse direct or indirect effect on the aviation industry as a whole. On June 1, 2017 the United States announced that it intends to withdraw from the 2015 agreement and gave notice officially on November 4, 2019. The withdrawal would be effective November 4, 2020.
Over time, it is possible that governments will adopt additional regulatory requirements and/or market-based policies that are intended to reduce energy usage, emissions, and noise levels from aircraft. Such initiatives may be based on concerns regarding climate change, energy security, public health, local impacts, or other factors, and may also impact the global market for certain aircraft and cause behavioral shifts that result in decreased demand for air travel. These concerns could also result in greater limitations on the operation of our fleet, particularly aircraft equipped with older technology engines.
Compliance with current or future regulations, taxes or duties could cause our lessees to incur higher costs and lead to higher ticket prices, which could mean lower demand for travel and adverse impacts on the financial condition of our lessees. Such compliance may also affect our lessees’ ability to make rental and other lease payments and limit the market for aircraft in our portfolio, which could have other negative effects on our financial position.
The older age, or older technology, of some of our aircraft may expose us to higher than anticipated maintenance related expenses.
In general, the costs of operating an aircraft, including maintenance expenditures, increase with the age of the aircraft. Additionally, older aircraft typically are less fuel-efficient than newer aircraft and may be more difficult to re-lease or sell, particularly if, due to increasing production rates by aircraft manufacturers or airline insolvencies or other distress, older aircraft are competing with newer aircraft in the lease or sale market. Expenses like fuel, carbon charges, aging aircraft inspections, maintenance or modification programs and related airworthiness directives could make the operation of older aircraft less economically viable and may result in increased lessee defaults. We may also incur some of these increased maintenance expenses and regulatory costs upon acquisition or re-leasing of our aircraft. Re-leasing larger wide-body aircraft may result in higher reinvestment and maintenance expenditures than re-leasing narrow-body aircraft.
The concentration of aircraft types in our aircraft portfolio could lead to adverse
effects on our business and financial results should any difficulties specific to
these particular types of aircraft occur.
Our owned aircraft portfolio is concentrated in certain aircraft types. Should any of these aircraft types (or other types we acquire in the future) or aircraft manufacturers encounter technical, financial or other difficulties, it would cause a decrease in value of these aircraft, an inability to lease the aircraft on favorable terms or at all, or a potential grounding of these aircraft, which may adversely impact our financial results, to the extent the affected aircraft types comprise a significant percentage of our aircraft portfolio.
We operate in a highly competitive market for investment opportunities in aviation assets and for the leasing and sale of aircraft
.
We compete with other lessors, airlines, aircraft manufacturers, financial institutions, aircraft brokers and other investors with respect to aircraft acquisitions, leasing and sales. The aircraft leasing industry is highly competitive and may be divided into three basic activities: (i) aircraft acquisition; (ii) leasing or re-leasing of aircraft; and (iii) aircraft sales. Competition varies among these three basic activities.
A number of our competitors are substantially larger and have considerably greater financial, technical and marketing resources than we do. Some competitors may have a lower cost of funds and access to funding sources that are not available to us. In addition, some of our competitors may have higher risk tolerances, lower investment return expectations or different risk or residual value assessments, which could allow them to consider a wider variety of investments, establish more relationships, bid more aggressively on aviation assets available for sale and offer lower lease rates or sales prices than we can. Some of our competitors may provide financial services, maintenance services or other inducements to potential lessees or buyers that we cannot provide. As a result of competitive pressures, we may not be able to take advantage of attractive investment opportunities from time to time, and we may not be able to identify and make investments that are consistent with our investment objectives. We continue to see lessors and airlines starting to manage the transition from current to newer technology and younger aircraft. Additionally, the barriers to entry in the aircraft acquisition and leasing market are comparatively low, and new entrants with private equity, hedge fund, Asian bank or other funding sources appear from time
16
to time. We may not be able to compete effectively against present and future competitors in the aircraft acquisition, leasing or sales market.
Risks Related to our Order of New Embraer E-Jet E2 Aircraft
We have lease commitments for fourteen of the 25 Embraer E-Jet E2 aircraft that we contracted to purchase from Embraer and are scheduled for delivery between the third quarter of 2020 and second quarter of 2024. We do not yet have lease commitments for the remaining deliveries nor have we put financing in place for any of the Embraer E-Jet E2 aircraft deliveries. Our ability to lease these aircraft on favorable terms, if at all, may be adversely affected by desirability of this aircraft type and risks to the commercial airline industry generally. If we are unable to obtain commitments for the remaining deliveries or the necessary financing, if needed, or otherwise satisfy our contractual obligations to Embraer, we will be subject to several potential risks, including:
|
•
|
forfeiting advance deposits and progress payments to Embraer, as well as incurring certain significant costs related to these commitments such as contractual damages and legal, accounting and financial advisory expenses;
|
|
•
|
defaulting on any future lease commitments we may have entered into with respect to these aircraft, which could result in monetary damages and strained relationships with lessees;
|
|
•
|
failing to realize the benefits of purchasing and leasing such aircraft; and
|
|
•
|
risking harm to our business reputation, which would make it more difficult to purchase and lease aircraft in the future on agreeable terms, if at all.
|
The Embraer E-Jet E2 is a new aircraft variant and first entered service in April 2018. The Embraer E-Jet E2 aircraft incorporates a modified version of the Pratt & Whitney geared turbofan engine. Airframe and engine manufacturers have occasionally experienced delays and technical difficulties in bringing new aircraft and engine types to market. If any aircraft for which we have made future lease commitments is delayed or if Embraer is unable to produce the aircraft in compliance with the performance specifications, some or all of our affected lessees might be able to terminate their leases with respect to such aircraft. Our purchase agreement with Embraer and the anticipated future leases for these aircraft contain certain cancellation rights related to delays in delivery. Any such termination could strain our relations with those lessees going forward. Lastly, we will rely on Embraer to return any advance deposits and progress payments if they are unable to meet their obligations to us, and we may not be able to recover such amounts if Embraer defaults or becomes insolvent. In July 2018, Airbus and Bombardier completed a previously announced partnership for the C-series aircraft (now known as the Airbus A220 model), which competes with the E-Jet E2. In December 2018, Boeing and Embraer announced a strategic partnership. As of today, the transaction has received the approval of both the U.S. and Brazil but the European Commission has yet to approve it. No assurance can be given that the Boeing and Embraer strategic partnership will receive European Commission approval, and that even if the transaction is consummated, what the implications could be for our commitments and the E-Jet E2 program. Any of these events could materially and adversely affect our financial results and operations.
Risks Related to Our Leases
If lessees are unable to fund their maintenance obligations on our aircraft, we may incur increased costs at the conclusion of the applicable lease.
The standards of maintenance observed by the various lessees and the condition of the aircraft at the time of lease or sale may affect the future values and rental rates for our aircraft.
Under our leases, the relevant lessee is responsible for maintaining the aircraft and complying with all governmental requirements applicable to the lessee and the aircraft, including, without limitation, operational, maintenance, and registration requirements and airworthiness directives, although in certain cases we may agree to share certain of these costs. Failure of a lessee to perform required aircraft maintenance or required airworthiness directives could result in a decrease in value of such aircraft, an adverse effect on our ability to lease the aircraft at favorable rates or at all, or a potential grounding of such aircraft, and will likely require us to incur increased maintenance and modification costs upon the expiration or earlier termination of the applicable lease, which could be substantial, to restore such aircraft to an acceptable condition. If any of our aircraft are not subject to a lease, we would be required to bear the entire cost of maintaining that aircraft and performing any required airworthiness directives.
17
Certain of our leases provide that the lessee is required to make periodic payments to us during the lease term in order to provide cash reserves for major maintenance. In these leases there is an associated liability for us to reimburse the lessee after such maintenance is performed. A substantial number of our leases do not provide for any periodic maintenance reserve payments to be made to us. Typically, these lessees are required to make payments at the end of the lease term. However, in the event such lessees default, the value of the aircraft could be negatively affected by the maintenance condition and we may be required to fund the entire cost of performing major maintenance on the relevant aircraft without, in either case, having received compensating maintenance payments from these lessees.
Even if we receive maintenance payments, these payments may not cover the entire expense of the scheduled maintenance they are intended to fund. In addition, maintenance payments typically cover only certain scheduled maintenance requirements and do not cover all required maintenance and all scheduled maintenance. As a result, we may incur unanticipated or significant costs at the conclusion of a lease.
Failure to pay certain potential additional operating costs could result in the grounding or arrest of our aircraft and prevent the re-lease, sale or other use of our aircraft.
As in the case of maintenance costs, we may incur other operational costs upon a lessee default or where the terms of the lease require us to pay a portion of those costs. Such costs include:
|
•
|
the costs of casualty, liability and political risk insurance and the liability costs or losses when insurance coverage has not been or cannot be obtained as required, or is insufficient in amount or scope;
|
|
•
|
the costs of licensing, exporting or importing an aircraft, airport charges, customs duties, air navigation charges, landing fees and similar governmental or quasi-governmental impositions, which can be substantial;
|
|
•
|
penalties and costs associated with the failure of lessees to keep aircraft registered under all appropriate local requirements or obtain required governmental licenses, consents and approvals; and
|
|
•
|
carbon taxes or other fees, taxes or costs imposed under emissions limitations, climate change regulations or other initiatives.
|
The failure to pay certain of these costs can result in liens on the aircraft. The failure to register the aircraft can result in a loss of insurance. These matters could result in the grounding or arrest of the aircraft and prevent the re-lease, sale or other use of the aircraft until the problem is cured.
Our lessees may have inadequate insurance coverage or fail to fulfill their respective indemnity obligations, which could result in us not being covered for claims asserted against us.
By virtue of holding title to the aircraft, lessors may be held strictly liable for losses resulting from the operation of aircraft or may be held liable for those losses based on other legal theories. Liability may be placed on an aircraft lessor in certain jurisdictions around the world even under circumstances in which the lessor is not directly controlling the operation of the relevant aircraft.
Lessees are required under our leases to indemnify us for, and insure against, liabilities arising out of the use and operation of the aircraft, including third-party claims for death or injury to persons and damage to property for which we may be deemed liable. Lessees are also required to maintain public liability, property damage and hull all risk and hull war risk insurance on the aircraft at agreed upon levels. However, they are not generally required to maintain political risk insurance. Following the terrorist attacks of September 11, 2001, aviation insurers significantly reduced the amount of insurance coverage available to airlines for liability to persons other than employees or passengers for claims resulting from acts of terrorism, war or similar events. At the same time, they significantly increased the premiums for such third-party war risk and terrorism liability insurance and coverage in general. As a result, the amount of such third-party war risk and terrorism liability insurance that is commercially available at any time may be below the amount stipulated in our leases.
Our lessees’ insurance, including any available governmental supplemental coverage, may not be sufficient to cover all types of claims that may be asserted against us. Any inadequate insurance coverage or default by lessees in fulfilling their indemnification or insurance obligations will reduce the proceeds that would be received by us upon an event of loss under the respective leases or upon a claim under the relevant liability insurance.
18
Failure to obtain certain required licenses and approvals could negatively affect our ability to re-lease or sell aircraft.
A number of our lessees must obtain licenses, consents or approvals in order to import or operate the aircraft or comply with the leases. These include consents from governmental or regulatory authorities for certain payments under the leases and for the import, export or deregistration of the aircraft. Subsequent changes in applicable law or administrative practice may increase such requirements and a governmental consent, once given, might be withdrawn. Furthermore, consents needed in connection with future re-leasing or sale of an aircraft may not be forthcoming. Any of these events could adversely affect our ability to re-lease or sell aircraft.
Due to the fact that many of our lessees operate in emerging markets, we are indirectly subject to many of the economic and political risks associated with competing in such markets.
Emerging markets are countries which may be more vulnerable to economic and political problems, such as significant fluctuations in gross domestic product, interest and currency exchange rates, civil disturbances, government instability, nationalization and expropriation of private assets, unfavorable legal systems, change in law regarding recognition of contracts or ownership rights, changes in governments or government policy and the imposition of taxes or other charges by governments. The occurrence of any of these events in markets served by our lessees and the resulting instability may adversely affect our ownership interest in an aircraft or the ability of lessees which operate in these markets to meet their lease obligations and these lessees may be more likely to default than lessees that operate in developed economies. For the year ended
December 31, 2019
, 59 of our lessees, which operated 163 aircraft and generated 65% of our lease rental revenue, are domiciled or habitually based in emerging markets.
Risks Related to Our Lessees
Lessee defaults could materially adversely affect our business, financial condition and results of operations.
As a general matter, airlines with weak capital structures are more likely than well-capitalized airlines to seek operating leases, and, at any point in time, investors should expect a varying number of lessees and sub-lessees to experience payment difficulties. As a result of their weak financial condition and lack of liquidity, a portion of lessees over time may be significantly in arrears in their rental or maintenance payments. This is likely to continue to be the case in the future, particularly in difficult economic or operating environments. Liquidity issues are more likely to lead to airline failures in the periods of financial system distress, volatile fuel prices, and economic slowdown, with additional liquidity being more difficult and expensive to source. Given the size of our aircraft portfolio, we expect that from time to time some lessees will be slow in making, or will fail to make, their payments in full under their leases.
We may not correctly assess the credit risk of a lessee or may not be in a position to charge risk-adjusted lease rates, and lessees may not be able to continue to perform their financial and other obligations under our leases in the future. A delayed, reduced or missed rental payment from a lessee decreases our revenues and cash flow and may adversely affect our ability to make payments on our indebtedness or to comply with debt service coverage or interest coverage ratios. A default, delay or deferral of payments from a lessee where we have a significant exposure or concentration risk could have a materially adverse impact on our revenue and cash flows. We may experience some level of delinquency under our leases and default levels may increase over time, particularly as our aircraft portfolio ages and if economic conditions deteriorate. A lessee may experience periodic difficulties that are not financial in nature, which could impair its performance of maintenance obligations under the leases. These difficulties may include the failure to perform required aircraft maintenance and labor-management disagreements or disputes.
In the event that a lessee defaults under a lease, any security deposit paid or letter of credit provided by the lessee may not be sufficient to cover the lessee’s outstanding or unpaid lease obligations and required maintenance and transition expenses.
If our lessees encounter financial difficulties and we decide to restructure our leases with those lessees, this could result in less favorable leases and in significant reductions in our cash flow or adversely affect our financial results.
When a lessee is late in making payments, fails to make payments in full or in part under the lease or has otherwise advised us that it will in the future fail to make payments in full or in part under the lease, we may elect to or be required to restructure the lease. Restructuring may involve anything from a simple rescheduling of payments to the termination of a lease without receiving all or any of the past due amounts. If requests for payment restructuring or rescheduling are made and granted, reduced or deferred rental payments may be payable over all or some part of the remaining term of the lease,
19
and the terms of any revised payment schedules may be unfavorable or such payments may not be made. We may be unable to agree upon acceptable terms for any requested restructurings and as a result may be forced to exercise our remedies under those leases and we may be unable to repossess our aircraft on a timely basis. If we, in the exercise of our remedies, repossess the aircraft, we may not be able to re-lease the aircraft promptly at favorable rates, or at all.
The terms and conditions of payment restructurings or reschedulings, particularly involving lessees where we have significant exposure or concentration risk, may result in significant reductions of rental payments, which may adversely affect our cash flows or our financial results.
Significant costs resulting from lease defaults could have a material adverse effect on our business.
While we have the right to repossess the aircraft and to exercise other remedies upon a lessee default, repossession of an aircraft after a lessee default could lead to significantly increased costs for us. Those costs include legal and other expenses of court or other governmental proceedings, particularly if the lessee is contesting the proceedings or is in bankruptcy, and costs to obtain possession and/or de-registration of the aircraft and flight and export permissions. Delays resulting from any of these proceedings would increase the period of time during which the relevant aircraft is not generating revenue. We may also incur substantial maintenance, refurbishment or repair costs that a defaulting lessee has failed to incur or pay and that are necessary to put the aircraft in suitable condition for re-lease or sale. We may be required to pay off liens, claims, taxes and other governmental charges on the aircraft to obtain clear possession and to remarket the aircraft for re-lease or sale. We may also incur maintenance, storage or other costs while we have physical possession of the aircraft.
We may suffer other adverse consequences as a result of a lessee default and the termination of the lease and the repossession of the related aircraft. Our rights upon a lessee default vary significantly depending upon the jurisdiction, including the need to obtain a court order for repossession of the aircraft and/or consents for de-registration or re-export of the aircraft. When a defaulting lessee is in bankruptcy, protective administration, insolvency or similar proceedings, additional limitations may apply. Certain jurisdictions give rights to the trustee in bankruptcy or a similar officer to assume or reject the lease or to assign it to a third party, or entitle the lessee or another third party to retain possession of the aircraft without paying lease rentals or without performing all or some of the obligations under the relevant lease. There can be no assurance that jurisdictions that have adopted the Cape Town Convention, which provides for uniformity and certainty for repossession of aircraft, will enforce it as written. Certain of our lessees are owned in whole or in part by government-related entities, which could complicate our efforts to repossess the relevant aircraft. Accordingly, we may be delayed in, or prevented from, enforcing certain of our rights under a lease and in re-leasing or selling the affected aircraft.
If we repossess an aircraft, we may not necessarily be able to export or de-register and profitably redeploy the aircraft. When a lessee or other operator flies only domestic routes in the jurisdiction in which the aircraft is registered, repossession may be more difficult, especially if the jurisdiction permits the lessee or the other operator to resist de-registration. Significant costs may also be incurred in retrieving or recreating aircraft records required for registration of the aircraft and obtaining a certificate of airworthiness for the aircraft. A default and exercise of remedies involving a lessee where we have a significant exposure or concentration risk could have a materially adverse impact on our future revenue and cash flows.
Adverse currency movements could negatively affect our lessees’ ability to honor the terms of their leases and could materially adversely affect our business, financial condition and results of operations.
Many of our lessees are exposed to currency risk due to the fact that they earn revenues in their local currencies while a significant portion of their liabilities and expenses, including fuel, debt service, and lease payments are denominated in U.S. dollars. In the case of a devaluation of the local currency, our lessees may not be able to increase revenue sufficiently to offset the impact of exchange rates on these expenses. This is particularly true for non-U.S. airlines whose operations are primarily domestic. Currency volatility, particularly in emerging market countries, could impact the ability of some of our customers to meet their contractual obligations in a timely manner. Shifts in foreign exchange rates can be significant, are difficult to predict, and can occur quickly.
Airline reorganizations could have an adverse effect on our financial results.
As a result of economic conditions, significant volatility in oil prices and financial markets distress, airlines may be forced to reorganize. Bankruptcies and reduced demand may lead to the grounding of significant numbers of aircraft and negotiated reductions in aircraft lease rental rates, with the effect of depressing aircraft market values. Additional grounded aircraft and lower market values would adversely affect our ability to sell certain of our aircraft on favorable terms, or at all, or re-lease other aircraft at favorable rates comparable to the then current market conditions, which collectively would
20
have an adverse effect on our financial results. We may not recover any of our claims or damages against an airline under bankruptcy or insolvency protection.
If our lessees fail to appropriately discharge aircraft liens, we might find it necessary to pay such claims.
In the normal course of business, liens that secure the payment of airport fees and taxes, custom duties, air navigation charges (including charges imposed by Eurocontrol), landing charges, crew wages, repairer’s charges, salvage or other liens, are likely, depending on the jurisdiction, to attach to the aircraft. These liens may secure substantial sums that may, in certain jurisdictions or for certain types of liens (particularly “fleet liens”), exceed the value of the relevant aircraft. Although the financial obligations relating to these liens are the responsibility of our lessees, if they fail to fulfill their obligations, these liens may attach to our aircraft and ultimately become our responsibility. Until these liens are discharged, we may be unable to repossess, re-lease or sell the aircraft or unable to avoid detention or forfeiture of the aircraft.
Our lessees may not comply with their obligations under their respective leases to discharge liens arising during the terms of their leases, whether or not due to financial difficulties. If they do not do so, we may, in some cases, find it necessary to pay the claims secured by any liens in order to repossess the aircraft.
Risks associated with the concentration of our lessees in certain geographical regions could harm our business or financial results.
Our business is sensitive to local economic and political conditions that can influence the performance of lessees located in a particular region.
European Concentration
Thirty-four lessees in Europe accounted for
99
aircraft, totaling
26%
of the net book value of our aircraft at
December 31, 2019
. Five lessees, accounting for 42 aircraft, are based in the U.K. The U.K. left the E.U. on January 31, 2020. The final terms of the U.K.’s future relations with the E.U. remain unclear and could potentially negatively impact carriers based in the U.K. and to a lesser extent elsewhere in the E.U.
Asian Concentration
Twenty-five lessees in Asia accounted for
94
aircraft, totaling
38%
of the net book value of our aircraft at
December 31, 2019
. Growth in Asia has been strong, driven in large part by Southeast Asia and India. Eleven lessees accounting for 40 aircraft are based in Southeast Asia and four lessees accounting for 29 aircraft are based in India. There is risk of oversupply in the future driven by large outstanding order books of certain Southeast Asian and Indian carriers as well as infrastructure constraints. Asian airlines continue to face competition from new entrants and the growth of low cost carriers in the region.
North American Concentration
Ten lessees in North America accounted for
40
aircraft, totaling
13%
of the net book value of our aircraft at
December 31, 2019
. Consolidation among major airlines in the U.S. has helped drive capacity discipline and pricing power.
South American Concentration
Seven lessees in South America accounted for
26
aircraft, totaling
15%
of the net book value of our aircraft at
December 31, 2019
. One lessee in Chile accounted for thirteen aircraft, totaling 9% of the net book value of our aircraft at
December 31, 2019
.
Middle East and African Concentration
Eight lessees in the Middle East and Africa accounted for
sixteen
aircraft, totaling
7%
of the net book value of our aircraft at
December 31, 2019
. One lessee in South Africa accounted for four aircraft totaling 3% of net book value.
21
Risks Related to the Aviation Industry
Fuel prices significantly impact the profitability of the airline industry. If fuel prices rise in the future, our lessees might not be able to meet their lease payment obligations, which would have an adverse effect on our financial results and growth prospects.
Fuel costs represent a major expense to airlines. Fuel prices fluctuate widely depending primarily on international market conditions, geopolitical and environmental events and currency/exchange rates. As a result, fuel costs are not within the control of lessees and significant changes would materially affect their operating results.
Due to the competitive nature of the airline industry, airlines may be unable to pass on increases in fuel prices to their customers by increasing fares in a manner that fully compensates for the costs incurred. Higher and more volatile fuel prices may also have an impact on consumer confidence and spending, and thus may adversely impact demand for air transportation. In addition, airlines may not be able to successfully manage their exposure to fuel price fluctuations. If fuel prices increase due to future terrorist attacks, acts of war, armed hostilities, rebellion or political instability, natural disasters or for any other reason, they are likely to cause our lessees to incur higher costs and/or generate lower revenues, resulting in an adverse impact on their financial condition and liquidity. Fuel cost volatility may contribute to the reluctance of airlines to make future commitments to leased aircraft and reduce the demand for lease aircraft. Consequently, these conditions may: (i) affect our lessees’ ability to make rental and other lease payments; (ii) result in lease restructurings and/or aircraft repossessions; (iii) increase our costs of re-leasing or selling our aircraft; or (iv) impair our ability to re-lease or sell our aircraft on a timely basis at favorable rates or terms, or at all.
The effects of terrorist attacks and geopolitical conditions might adversely impact the financial condition of the airlines and our lessees might not be able to meet their lease payment obligations.
War, armed hostilities or terrorist attacks, or the fear of such events, could decrease demand for air travel or increase the operating costs of our customers. Terrorist incidents and other international tensions may lead to regional or broader international instability. Future terrorist attacks, war or armed hostilities, large protests or government instability, or the fear of such events, could further negatively impact the airline industry and may have an adverse effect on the financial condition and liquidity of our lessees, aircraft values and rental rates and may lead to lease restructurings or aircraft repossessions, all of which could adversely affect our financial results.
Terrorist attacks and geopolitical conditions can negatively affected the airline industry, and concerns about geopolitical conditions and further terrorist attacks could continue to negatively affect airlines (including our lessees), resulting in: (i) higher costs due to the increased security measures; (ii) decreased passenger demand and revenue due to safety concerns or the inconvenience of additional security measures; (iii) higher price of jet fuel; (iv) higher financing costs and difficulty in raising the desired amount of proceeds on favorable terms, or at all; (v) significantly higher costs of aircraft insurance coverage for future claims caused by acts of war, terrorism, sabotage, hijacking and other similar perils, and the extent to which such insurance has been or will continue to be available; (vi) limited ability of airlines to reduce their operating costs and conserve financial resources, taking into account the increased costs incurred as a consequence of terrorist attacks and geopolitical conditions, including those referred to above; and (vii) special charges recognized by some airlines, such as those related to the impairment of aircraft and other long lived assets stemming from the above conditions.
Economic conditions and regulatory changes resulting from the United Kingdom’s (“U.K.”) probable exit from the E.U. could have an adverse effect on our business.
In June 2016, voters in the U.K. approved a referendum to exit from the E.U., known as Brexit and the U.K. subsequently left the E.U. on January 31, 2020, though current trade arrangements will remain in place during a transition period, set to end in December 2020. Brexit could result in adverse consequences, including deterioration in economic conditions, volatility in currency exchange rates or adverse impact to air travel and the air freight market. These impacts may negatively impact the airline and finance industries. Future trade arrangements are being negotiated and could have an adverse effect on U.K. carriers, and to a lesser extent other carriers. The effects of Brexit on us will depend on the resulting agreements regarding trade and travel made between the U.K. and the E.U.
22
Epidemic diseases, severe weather conditions, natural disasters or their perceived effects may negatively impact the airline industry and our lessees’ ability to meet their lease payment obligations to us.
Recently, a novel strain of coronavirus first identified in Wuhan, Hubei Province, China has led to travel restrictions and cancellation of flights impacting some of our customers. While it is difficult to predict the extent to which the virus may spread both within and beyond China, the outbreak could lead to further restrictions and negatively impact demand for air travel, which could affect our airline customers and have an adverse effect on our financial performance. In addition, if another outbreak of epidemic diseases were to occur, numerous responses, including travel restrictions, might be necessary to combat the spread of the disease. Even if restrictions are not implemented, passengers may voluntarily choose to reduce travel. Additional outbreaks of epidemic diseases, or the fear of such events, could result in travel bans or could have an adverse effect on our financial results. Similarly, demand for air travel or the inability of airlines to operate to or from certain regions due to severe weather conditions or natural disasters, such as floods, earthquakes or volcanic eruptions, could have an adverse effect on our lessees’ ability to their lease payment obligations to us, which could negatively impact our financial results.
Risks Related to the Boeing 737 MAX Groundings
As a result of two fatal accidents of Boeing 737 MAX aircraft within five months of each other, airlines and regulators grounded the worldwide fleet of Boeing 737 MAX aircraft in March 2019. Boeing continued to produce 737 MAX aircraft until January 2020, and these aircraft remain undelivered. The duration of the Boeing 737 MAX grounding and the timing of its eventual return to service are uncertain, and it is also uncertain when Boeing may resume production and at what rate it may produce these aircraft. We do not own, nor do we have commitments to purchase, any Boeing 737 MAX aircraft. Nevertheless, the uncertainty surrounding the duration of the grounding, the rate of Boeing’s continued production and the timing and implications of any return to service could negatively impact our lessees’ financial condition, lease rates, demand for other aircraft types and the value of the aircraft in our fleet. A similar type of grounding for other aircraft types that we have in our fleet, or have commitments to purchase, could also negatively affect our financial results.
Risks Related to Our Organization and Structure
If the ownership of our common shares continues to be highly concentrated, it may prevent minority shareholders from influencing significant corporate decisions and may result in conflicts of interest.
As of
February 10, 2020
, Marubeni owns
21,605,347
shares, or
28.8%
of our common shares. Although the Shareholder Agreement, dated as of June 6, 2013, among us, Marubeni and a subsidiary of Marubeni (as amended and restated from time to time, the “Shareholder Agreement”), imposes certain restrictions on Marubeni’s and its affiliates’ ability to make additional acquisitions of our common shares, Marubeni, nonetheless, may be able to influence fundamental corporate matters and transactions, including the election of directors; mergers or amalgamations (subject to prior board approval); consolidations or acquisitions; the sale of all or substantially all of our assets; in certain circumstances, the amendment of our bye-laws; and our winding up and dissolution. This concentration of ownership may delay, deter or prevent acts that would be favored by our other shareholders. The interests of Marubeni may not always coincide with our interests or the interests of our other shareholders. This concentration of ownership may also have the effect of delaying, preventing or deterring a change in control of our company. Also, Marubeni may seek to cause us to take courses of action that, in its judgment, could enhance its investment in us, but which might involve risks to our other shareholders or adversely affect us or our other shareholders. In addition, under the Shareholder Agreement, based on the current ownership of our common shares by Marubeni and the current size of our Board of Directors, Marubeni is entitled to designate three directors for election to our Board of Directors. As a result of these or other factors, the market price of our common shares could decline or shareholders might not receive a premium over the then-current market price of our common shares upon a change in control. In addition, this concentration of share ownership may adversely affect the trading price of our common shares because investors may perceive disadvantages in owning shares in a company with a significant shareholder.
We are a holding company with no operations and rely on our operating subsidiaries to provide us with funds necessary to meet our financial obligations.
We are a holding company with no material direct operations. Our principal assets are the equity interests we directly or indirectly hold in our operating subsidiaries. As a result, we are dependent on loans, dividends and other payments from our subsidiaries to generate the funds necessary to meet our financial obligations and to pay dividends to our shareholders. Although there are currently no material legal restrictions on our operating subsidiaries’ ability to distribute assets to us,
23
legal restrictions, including governmental regulations and contractual obligations, could restrict or impair our operating subsidiaries’ ability to pay dividends or make loan or other distributions to us. Our subsidiaries are legally distinct from us and may be prohibited or restricted from paying dividends or otherwise making funds available to us under certain conditions.
We are a Bermuda company, and it may be difficult for securityholders to enforce judgments against us or our directors and executive officers.
We are a Bermuda exempted company and, as such, the rights of holders of our common shares will be governed by Bermuda law and our memorandum of association and bye-laws. The rights of securityholders under Bermuda law may differ from the rights of securityholders of companies incorporated in other jurisdictions. A substantial portion of our assets are located outside the United States. As a result, it may be difficult for investors to effect service of process on those persons in the United States or to enforce in the United States judgments obtained in U.S. courts against us or those persons based on the civil liability provisions of the U.S. securities laws. Uncertainty exists as to whether courts in Bermuda will enforce judgments obtained in other jurisdictions, including the United States, against us or our directors or officers under the securities laws of those jurisdictions or entertain actions in Bermuda against us or our directors or officers under the securities laws of other jurisdictions.
Our bye-laws restrict shareholders from bringing legal action against our officers and directors.
Our bye-laws contain a broad waiver by our shareholders of any claim or right of action, both individually and on our behalf, against any of our officers or directors. The waiver applies to any action taken by an officer or director, or the failure of an officer or director to take any action, in the performance of his or her duties, except with respect to any matter involving any fraud or dishonesty on the part of the officer or director. This waiver limits the right of shareholders to assert claims against our officers and directors unless the act or failure to act involves fraud or dishonesty.
We have anti-takeover provisions in our bye-laws that may discourage a change of control.
Our bye-laws contain provisions that could make it more difficult for a third party to acquire us without the consent of our Board of Directors. These provisions include:
|
•
|
provisions providing for a classified board of directors with staggered three-year terms;
|
|
•
|
provisions regarding the election of directors, classes of directors, the term of office of directors and amalgamations to be rescinded, altered or amended only upon approval by a resolution of the directors and by a resolution of our shareholders, including the affirmative votes of at least 66% of the votes attaching to all shares in issue entitling the holder to vote on such resolution;
|
|
•
|
provisions in our bye-laws dealing with the removal of directors and corporate opportunity to be rescinded, altered or amended only upon approval by a resolution of the directors and by a resolution of our shareholders, including the affirmative votes of at least 80% of the votes attaching to all shares in issue entitling the holder to vote on such resolution;
|
|
•
|
provisions providing for the removal of directors by a resolution, including the affirmative votes of at least 80% of all votes attaching to all shares in issue entitling the holder to vote on such resolution;
|
|
•
|
provisions providing for our Board of Directors to determine the powers, preferences and rights of our preference shares and to issue such preference shares without shareholder approval;
|
|
•
|
provisions providing for advance notice requirements by shareholders for director nominations and actions to be taken at annual meetings; and
|
|
•
|
no provision for cumulative voting in the election of directors; all the directors standing for election may be elected by our shareholders by a plurality of votes cast at a duly convened annual general meeting, the quorum for which is two or more persons present in person or by proxy at the start of the meeting and representing in excess of 50% of all votes attaching to all shares in issue entitling the holder to vote at the meeting.
|
In addition, these provisions may make it difficult and expensive for a third party to pursue a tender offer, change in control or takeover attempt that is opposed by our management and/or our Board of Directors. Public shareholders who might desire to participate in these types of transactions may not have an opportunity to do so. These anti-takeover provisions could substantially impede the ability of public shareholders to benefit from a change in control or change our management and Board of Directors and, as a result, may adversely affect the market price of our common shares and your ability to realize any potential change of control premium.
24
There are provisions in our bye-laws that may require certain of our non-U.S. shareholders to sell their shares to us or to a third party.
Our bye-laws provide that if our Board of Directors determines that we or any of our subsidiaries do not meet, or in the absence of repurchases of shares will fail to meet, the ownership requirements of a limitation on benefits article of any bilateral income tax treaty with the U.S. applicable to us, and that such tax treaty would provide material benefits to us or any of our subsidiaries, we generally have the right, but not the obligation, to repurchase, at fair market value (as determined pursuant to the method set forth in our bye-laws), common shares from any shareholder who beneficially owns more than 5% of our issued and outstanding common shares and who fails to demonstrate to our satisfaction that such shareholder is either a U.S. citizen or a qualified resident of the U.S. or the other contracting state of any applicable tax treaty with the U.S. (as determined for purposes of the relevant provision of the limitation on benefits article of such treaty).
We will have the option, but not the obligation, to purchase all or a part of the shares held by such shareholder (to the extent the Board of Directors, in the reasonable exercise of its discretion, determines it is necessary to avoid or cure adverse consequences), provided that the Board of Directors will use its reasonable efforts to exercise this option equitably among similarly situated shareholders (to the extent feasible under the circumstances).
Instead of exercising the repurchase right described above, we will have the right, but not the obligation, to cause the transfer to, and procure the purchase by, any U.S. citizen or a qualified resident of the U.S. or the other contracting state of the applicable tax treaty (as determined for purposes of the relevant provision of the limitation on benefits article of such treaty) of the number of issued and outstanding common shares beneficially owned by any shareholder that are otherwise subject to repurchase under our bye-laws as described above, at fair market value (as determined in the good faith discretion of our Board of Directors).
Our joint venture may have an adverse effect on our business.
Our joint venture involves significant risks that may not be present with other methods of ownership, including:
|
•
|
we may not realize a satisfactory return on our investment or the joint venture may divert management’s attention from our business;
|
|
•
|
our joint venture partner could have investment goals that are not consistent with our investment objectives, including the timing, terms and strategies for any investments;
|
|
•
|
our joint venture partner might fail to fund its share of required capital contributions or fail to fulfill its obligations as a joint venture partner;
|
|
•
|
decisions of our partner to sell aircraft in our joint venture may have an impact on our financial performance; and
|
|
•
|
our joint venture partner may have competing interests in our markets that could create conflict of interest issues, particularly if aircraft owned by the joint venture are being marketed for lease or sale at a time when the Company also has comparable aircraft available for lease or sale.
|
Risks Related to Our Common Shares
The market price and trading volume of our common shares may be volatile or may decline regardless of our operating performance, which could result in rapid and substantial losses for our shareholders.
If the market price of our common shares declines significantly, shareholders may be unable to resell their shares at or above their purchase price. The market price or trading volume of our common shares could be highly volatile and may decline significantly in the future in response to various factors, many of which are beyond our control, including:
|
•
|
variations in our quarterly or annual operating results;
|
|
•
|
failure to meet any earnings estimates;
|
|
•
|
actual or perceived reduction in our growth or expected future growth;
|
|
•
|
actual or anticipated accounting issues;
|
|
•
|
publication of research reports about us, other aircraft lessors or the aviation industry or the failure of securities analysts to cover our common shares or the decision to suspend or terminate coverage in the future;
|
|
•
|
additions or departures of key management personnel;
|
25
|
•
|
increased volatility in the capital markets and more limited or no access to debt financing, which may result in an increased cost of, or less favorable terms for, debt financing or may result in sales to satisfy collateral calls or other pressure on holders to sell our shares;
|
|
•
|
redemptions, or similar events affecting funds or other investors holding our shares, which may result in large block trades that could significantly impact the price of our common shares;
|
|
•
|
adverse market reaction to any indebtedness we may incur or preference or common shares we may issue in the future;
|
|
•
|
changes in or elimination of our dividend;
|
|
•
|
actions by shareholders;
|
|
•
|
changes in market valuations of similar companies;
|
|
•
|
the inability to complete the Merger due to the failure to satisfy the remaining conditions to the consummation of the Merger, including receipt of the required shareholder approval or the remaining required regulatory approvals;
|
|
•
|
the risk that the Merger Agreement may be terminated in certain limited circumstances that require us to pay Parent a termination fee of $73.5 million;
|
|
•
|
risks that the proposed Merger disrupts our current plans and operations or affects our ability to retain or recruit key employees;
|
|
•
|
the effect of the pending Merger on Aircastle’s business relationships (including, without limitation customers and suppliers), operating results and business generally;
|
|
•
|
the amount of the costs, fees, expenses and charges related to the Merger;
|
|
•
|
risks related to the Merger diverting management’s or employees’ attention from ongoing business operations;
|
|
•
|
the risk that our share price may decline significantly if the Merger is not completed;
|
|
•
|
announcements by us, our competitors or our suppliers of significant contracts, acquisitions, disposals, strategic partnerships, joint ventures or capital commitments;
|
|
•
|
speculation in the press or investment community;
|
|
•
|
changes or proposed changes in laws or regulations affecting the aviation industry or enforcement of these laws and regulations, or announcements relating to these matters; and
|
|
•
|
general market, political and economic conditions and local conditions in the markets in which our lessees are located.
|
In addition, the equity markets in general have frequently experienced substantial price and volume fluctuations that have often been unrelated or disproportionate to the operating performance of companies traded in those markets. Changes in economic conditions in the U.S., Europe or globally could also impact our ability to grow profitably. These broad market and industry factors may materially affect the market price of our common shares, regardless of our business or operating performance. In the past, following periods of volatility in the market price of a company’s securities, securities class-action litigation has often been instituted against that company. Such litigation, if instituted against us, could cause us to incur substantial costs and divert management’s attention and resources, which could have a material adverse effect on our business, financial condition and results of operations.
Future additional debt, which would be senior to our common shares upon liquidation, and additional equity securities, which would dilute the percentage ownership of our then current common shareholders and may be senior to our common shares for the purposes of dividends and liquidation distributions, may adversely affect the market price of our common shares.
In the future, we may attempt to increase our capital resources by incurring debt or issuing additional equity securities, including commercial paper, medium-term notes, senior or subordinated notes or loans and series of preference shares or common shares. Upon liquidation, holders of our debt investments and preference shares and lenders with respect to other borrowings would receive a distribution of our available assets prior to the holders of our common shares. Additional equity offerings would dilute the holdings of our then current common shareholders and could reduce the market price of our common shares, or both. Preference shares, if issued, could have a preference on liquidating distributions or a preference on dividend payments. Restrictive provisions in our debt and/or preference shares could limit our ability to make a distribution to the holders of our common shares. Because our decision to incur more debt or issue additional equity securities in the future will depend on market conditions and other factors beyond our control, we cannot predict or estimate the amount,
26
timing or nature of our future capital raising activities. Thus, holders of our common shares bear the risk of our future debt and equity issuances reducing the market price of our common shares and diluting their percentage ownership.
The market price of our common shares could be negatively affected by sales of
substantial amounts of our common shares in the public markets.
As of
February 10, 2020
, there were
75,109,023
shares issued and outstanding, all of which are freely transferable, except for any shares held by our “affiliates,” as that term is defined in Rule 144 under the Securities Act of 1933, as amended (the “Securities Act”). Approximately
28.8%
of our outstanding common shares are held by our affiliate, Marubeni, and can be resold into the public markets in the future in accordance with the requirements of Rule 144 under the Securities Act.
Beginning in July 2016, pursuant to the occurrence of certain events set forth in the Shareholders Agreement, Marubeni and permitted third-party transferees have the ability to cause us to register the resale of their common shares into the public markets. We cannot assure you if or when any such registration or offering may occur.
The issuance of additional common shares in connection with acquisitions or otherwise will dilute all other shareholdings.
As of
February 10, 2020
, we had an aggregate of 149,608,871 common shares authorized but unissued and not reserved for issuance under our incentive plan. We may issue all of these common shares without any action or approval by our shareholders. We intend to continue to actively pursue acquisitions of aviation assets and may issue common shares in connection with these acquisitions. Any common shares issued in connection with our acquisitions, our incentive plan, and the exercise of outstanding share options or otherwise would dilute the percentage ownership held by existing shareholders.
Risks Related to Taxation
If Aircastle were treated as engaged in a trade or business in the United States, it would be subject to U.S. federal income taxation on a net income basis, which would adversely affect our business and result in decreased cash available for distribution to our shareholders.
If, contrary to expectations, Aircastle were treated as engaged in a trade or business in the United States, the portion of its net income, if any, that was “effectively connected” with such trade or business would be subject to U.S. federal income taxation at a maximum rate of 35% for taxable years ending on or prior to December 31, 2017 and 21% for taxable years beginning after December 31, 2017 (such rate, the “Federal Rate”). Such reduction in the Federal Rate occurred as a result of the passage of The Tax Cuts and Jobs Act on December 22, 2017 (the “Tax Act”). In addition, Aircastle would be subject to the U.S. federal branch profits tax on its effectively connected earnings and profits at a rate of 30%. The imposition of such taxes would adversely affect our business and would result in decreased cash available for distribution to our shareholders.
If there is not sufficient trading in our shares, or if 50% of our shares are held by certain 5% shareholders, we could lose our eligibility for an exemption from U.S. federal income taxation on rental income from our aircraft used in “international traffic” and could be subject to U.S. federal income taxation which would adversely affect our business and result in decreased cash available for distribution to our shareholders.
We expect that we are currently eligible for an exemption under Section 883 of the Internal Revenue Code of 1986, as amended (the “Code”), which provides an exemption from U.S. federal income taxation with respect to rental income derived from aircraft used in international traffic by certain foreign corporations. No assurances can be given that we will continue to be eligible for this exemption as our stock is traded on the market and changes in our ownership or the amount of our shares that are traded could cause us to cease to be eligible for such exemption. To qualify for this exemption in respect of rental income, the lessor of the aircraft must be organized in a country that grants a comparable exemption to U.S. lessors (Bermuda and Ireland each do), and certain other requirements must be satisfied. We can satisfy these requirements in any year if, for more than half the days of such year, our shares are primarily and regularly traded on a recognized exchange and certain shareholders, each of whom owns 5% or more of our shares (applying certain attribution rules), do not collectively own more than 50% of our shares. Our shares will be considered to be primarily and regularly traded on a recognized exchange in any year if: (i) the number of trades in our shares effected on such recognized stock exchanges exceed the number of our shares (or direct interests in our shares) that are traded during the year on all securities markets; (ii) trades in our shares are effected on such stock exchanges in more than de minimis quantities on at least 60 days during every calendar quarter in the year; and (iii) the aggregate number of our shares traded on such stock exchanges during the taxable year is at least 10% of the average number of our shares outstanding in that class during that year. Following the Merger, these stock ownership requirements will be tested at the Marubeni and Mizuho Leasing levels such
27
that Aircastle and its subsidiaries can continue qualify for the Section 883 exemption if the stock of Marubeni is considered to be primarily and regularly traded on a recognized stock exchange and non-qualifying 5% or greater shareholders are not considered to collectively own more than 50% of Marubeni’s shares, as described above. If our (or, following the Merger, Marubeni’s) shares cease to satisfy these requirements, then we may no longer be eligible for the Section 883 exemption with respect to rental income earned by aircraft used in international traffic. If we were not eligible for the exemption under Section 883 of the Code, we expect that the U.S. source rental income of Aircastle Bermuda generally would be subject to U.S. federal taxation, on a gross income basis, at a rate of not in excess of 4% as provided in Section 887 of the Code. If, contrary to expectations, Aircastle Bermuda did not comply with certain administrative guidelines of the Internal Revenue Service, such that 90% or more of Aircastle Bermuda’s U.S. source rental income were attributable to the activities of personnel based in the United States, Aircastle Bermuda’s U.S. source rental income would be treated as income effectively connected with the conduct of a trade or business in the United States. In such case, Aircastle Bermuda’s U.S. source rental income would be subject to U.S. federal income taxation on its net income at the Federal Rate as well as state and local taxation. In addition, Aircastle Bermuda would be subject to the U.S. federal branch profits tax on its effectively connected earnings and profits at a rate of 30%. The imposition of such taxes would adversely affect our business and would result in decreased cash available for distribution to our shareholders.
Bermuda Economic Substance Act 2018
Pursuant to the Economic Substance Act 2018 (as amended) of Bermuda (the “ESA”) that came into force on January 1, 2019, a registered entity other than an entity which is resident for tax purposes in certain jurisdictions outside Bermuda (“non-resident entity”) that carries on as a business any one or more of the “relevant activities” referred to in the ESA must comply with economic substance requirements. The ESA may require in-scope Bermuda entities which are engaged in such “relevant activities” to be directed and managed in Bermuda, have an adequate level of qualified employees in Bermuda, incur an adequate level of annual expenditure in Bermuda, maintain adequate physical presence in Bermuda or perform core income-generating activities in Bermuda. The list of “relevant activities” includes carrying on any one or more of: banking, insurance, fund management, financing and leasing (which excludes operating leases), headquarters, shipping, distribution and service center, intellectual property and holding entities.
Entities subject to the economic substance requirements will be required to evidence their compliance and file an economic substance declaration with the Registrar of Companies in Bermuda on an annual basis.
Any entity that must satisfy economic substance requirements but fails to do so could face financial penalties, a restriction of its business activities, automatic reporting by the Bermuda authorities to the competent authorities in the European Union on an entity’s non-compliance or being struck-of as a registered entity in Bermuda. If any one of the foregoing were to occur it may adversely affect the business operations of the Company or its Bermuda subsidiaries.
The Company and its Bermuda subsidiaries believe they have complied with the ESA requirements and will file an economic substance declaration with the Registrar of Companies in Bermuda. The Registrar of Companies in Bermuda will ultimately assess compliance with the ESA requirements.
One or more of our Irish subsidiaries could fail to qualify for treaty benefits, including as a result of the Merger, which would subject certain of their income to U.S. federal income taxation, which could adversely affect our business and result in decreased cash available for distribution to our shareholders.
Qualification for the benefits of the double tax treaty between the United States and Ireland (the “Irish Treaty”) depends on many factors, including, historically, our ability to establish the identity of the ultimate beneficial owners of our common shares. Following the Merger, we do not expect that our Irish subsidiaries will qualify for benefits under the Irish Treaty solely on the basis of our beneficial ownership, which will change significantly as a result of the Merger. Certain of our Irish subsidiaries may continue to qualify for benefits under the Irish Treaty following the Merger if such subsidiaries are considered to be engaged in an active trade or business in Ireland for purposes of the Irish Treaty. However, the ability to satisfy the Irish Treaty’ s active trade or business standard is subject to significant legal and factual uncertainties, which may prevent our Irish subsidiaries from receiving benefits under the Irish Treaty. Accordingly, for any year, our Irish subsidiaries may not satisfy the requirements of the Irish Treaty or may be deemed to have a permanent establishment in the United States. Moreover, the provisions of the Irish Treaty may change. Failure to so qualify, or to be deemed to have a permanent establishment in the United States, could result in the rental income from aircraft used for flights within the United States being subject to increased U.S. federal income taxation. The imposition of such taxes would adversely affect our business and would result in decreased cash available for distribution to our shareholders.
28
We may become subject to an increased rate of Irish taxation which would adversely affect our business and would result in decreased earnings available for distribution to our shareholders.
Our Irish subsidiaries and affiliates are expected to be subject to corporation tax on their income from leasing, managing and servicing aircraft at the 12.5% tax rate applicable to trading income. This expectation is based on certain assumptions, including that we will maintain at least the current level of our business operations in Ireland. If we are not successful in achieving trading status in Ireland, the non-trading income activities of our Irish subsidiaries and affiliates would be subject to tax at the rate of 25% and capital gains would be taxed at the rate of 35%, which would adversely affect our business and would result in decreased earnings available for distribution to our shareholders.
We may be subject to an increased rate of Singapore taxation which would adversely affect our business and would result in decreased earnings available for distribution to our shareholders.
Our Singapore subsidiaries are subject to Singapore income tax on their income from leasing, managing and servicing aircraft. Our Singapore subsidiaries had obtained a reduced rate of tax from the Singapore authorities through June 30, 2017. Beginning on July 1, 2017 and effective to June 30, 2022, the Singapore authorities renewed the reduced rate of tax to our Singapore subsidiaries, provided we satisfy certain conditions and requirements. If we cannot meet such conditions and requirements, or if the award is not renewed after June 30, 2022, we would be subject to additional Singapore income tax. This would adversely affect our business and would result in decreased earnings available for distribution to our shareholders.
We may become subject to income or other taxes in the non-U.S. jurisdictions in which our aircraft operate, where our lessees are located or where we perform certain services which would adversely affect our business and result in decreased cash available for distributions to shareholders.
Certain Aircastle entities are expected to be subject to the income tax laws of Ireland, Mauritius, Singapore and the United States. In addition, we may be subject to income or other taxes in other jurisdictions by reason of our activities and operations, where our aircraft operate or where the lessees of our aircraft (or others in possession of our aircraft) are located. Although we have adopted operating procedures to reduce the exposure to such taxation, we may be subject to such taxes in the future and such taxes may be substantial. In addition, if we do not follow separate operating guidelines relating to managing a portion of our aircraft portfolio through offices in Ireland and Singapore, income from aircraft not owned in such jurisdictions would be subject to local tax. Changes in tax law could impose withholding taxes on lease payments during the term of a lease. Our leases typically require our lessees to indemnify us in respect of taxes but some leases may not require such indemnification or a lessee may fail to make such indemnification payment. The imposition of such taxes could adversely affect our business and result in decreased earnings available for distribution to our shareholders.
We expect to continue to be a passive foreign investment company (“PFIC”) and may be a controlled foreign corporation (“CFC”) for U.S. federal income tax purposes.
We expect to continue to be treated as a PFIC and may be a CFC for U.S. federal income tax purposes. If you are a U.S. person and do not make a qualified electing fund (“QEF”) election with respect to us and each of our PFIC subsidiaries, unless we are a CFC and you own 10% of our shares (by vote or value), you would be subject to special deferred tax and interest charges with respect to certain distributions on our common shares, any gain realized on a disposition of our common shares and certain other events. The effect of these deferred tax and interest charges could be materially adverse to you. Alternatively, if you are such a shareholder and make a QEF election for us and each of our PFIC subsidiaries, or if we are a CFC and you own 10% or more of our shares (by vote or value), you will not be subject to those charges, but could recognize taxable income in a taxable year with respect to our common shares in excess of any distributions that we make to you in that year, thus giving rise to so-called “phantom income” and to a potential out-of-pocket tax liability.
Distributions made to a U.S. person that is an individual will not be eligible for taxation at reduced tax rates generally applicable to dividends paid by certain United States corporations and “qualified foreign corporations.” The more favorable rates applicable to regular corporate dividends could cause individuals to perceive investment in our shares to be relatively less attractive than investment in the shares of other corporations, which could adversely affect the value of our shares.
29
The introduction of Base Erosion and Profit Shifting by the Organization for Economic Cooperation and Development's may impact our effective tax rate in future periods.
The Organization for Economic Co-operation and Development (the “OECD”) has introduced an action plan with respect to base erosion and profit shifting (“BEPS”). The plan targets among other things tax avoidance measures such as hybrid instruments, excessive interest deductions, treaty shopping, and permanent establishment avoidance.
As part of its BEPS actions, the OECD published the “Multilateral Convention to Implement Tax Treaty Related Measures to Prevent Base Erosion and Profit Shifting” (the “MLI”). Since June 7, 2017, representatives from over 93 jurisdictions have signed up to the MLI. MLI seeks to incorporate agreed tax treaty-related measures combating tax avoidance into bilateral existing tax treaties without the need to negotiate a new treaty. MLI may apply to double tax treaties entered into by other countries in which we have operations (in some cases with effect from as early as January 1, 2019).
MLI entered into force for Ireland on May 1, 2019, and became effective for withholding tax on January 1, 2020. MLI changed Ireland's treaties by including a principal purpose test (“PPT”), which will disallow treaty benefits where it is reasonable to conclude that the main purpose or one of the main purposes of a transaction or arrangement is to obtain directly or indirectly the benefits of the treaty. Given the subjectivity of the PPT, there is a risk that each counterparty jurisdiction will interpret it differently, which creates uncertainty in its application to leasing and other arrangements. Until such time as countries develop guidance on how the test will be applied, it will be difficult to determine its effect on us.
Ireland did not adopt MLI’s “dependent agent” permanent establishment threshold. Some countries could seek a bilateral re-negotiation on the point to change the dependent agent provisions in their tax treaty with Ireland. Any such change could take some time to be agreed and subsequently ratified before it could come into effect.
Further changes to tax law will be required in order to fully implement the BEPS action plans. At this moment, it is difficult to determine what further BEPS actions the governments of lessee jurisdictions will implement. Depending on the nature of the BEPS action plans adopted, it may result in an increase in our effective tax rate and cash taxes liabilities in future periods.
The E.U. Anti-tax Avoidance proposals may impact our effective rate of tax in future periods.
The Council of the E.U. has implemented the E.U. Anti-Tax Avoidance Directives (“EU ATAD”) and the amending Directive (“EU ATAD 2”). These Directives seek to oblige all E.U. member states to introduce a number of anti-tax avoidance measures.
Most of the measures were implemented with effect from January 1, 2019, though certain measures may be deferred to 2024. The EU ATAD contemplates the introduction of a restriction on the deductibility of interest, measures in respect of certain hybrid transactions and instruments, an exit charge, a switch over rule, controlled foreign company rules as well as a general anti-avoidance rule.
Ireland sought to defer the introduction of rules restricting the tax deductibility of interest payments until 2024. However it seems increasingly likely that Ireland may seek to introduce these rules from January 1, 2021. The current proposal would restrict the tax deductibility of interest expense to 30% of EBITDA or possibly a higher threshold if the third-party group interest expense ratio to group EBITDA is higher than 30%. This measure may impact the ability of our Irish tax resident companies to claim a tax deduction for interest payments.
The impact of the other measures in respect of certain hybrid transactions and instruments, an exit charge, a switch over rule, controlled foreign company rules as well as a general anti-avoidance rule will depend on the exact scope of these measures. The impact on the Company’s tax position (if any), will depend on the implementation of these measures in Ireland and other EU jurisdictions where we have operations.
Risks Related to the Proposed Merger
The Merger is subject to closing conditions, including governmental, regulatory and shareholder approvals, as well as other uncertainties and there can be no assurances as to whether and when it may be completed. Failure to complete the Merger could negatively impact our share price, future business and financial results.
There can be no assurance that the proposed Merger will occur. Consummation of the Merger is subject to certain customary conditions, including, without limitation: (i) approval of the Merger Agreement and the transactions contemplated thereby by the affirmative votes of a majority of the votes cast by holders of outstanding Common Shares at a meeting of
30
the Company’s shareholders; (ii) the receipt of any applicable pre-clearance or similar approval of certain remaining specified jurisdictions (i.e., Chile, Mexico and Morocco), and all required regulatory approvals being in full force and effect; (iii) the absence of any law, judgment or other legal restraint that prevents, makes illegal or prohibits the consummation of the Merger and the other transactions contemplated by the Merger Agreement; (iv) the accuracy of each party’s representations and warranties (subject to certain qualifications); (v) each party’s performance in all material respects of its obligations contained in the Merger Agreement; and (vi) the absence of a material adverse effect on the Company since the date of the Merger Agreement.
While we believe we will receive the requisite approvals, there can be no assurance that these and other conditions to closing will be satisfied at all or satisfied on the proposed terms and schedules as contemplated by the parties. Satisfaction of the closing conditions may delay the consummation of the Merger, and if certain closing conditions are not satisfied prior to the end date specified in the Merger Agreement, the parties will not be obligated to complete the Merger.
If the Merger is not completed for any reason, we will have incurred substantial expenses. We have incurred substantial legal, accounting and financial advisory fees that are payable by us whether or not the Merger is completed, and our management has devoted considerable time and effort in connection with the pending Merger. The Merger Agreement contains specified termination rights for each of the parties. Upon termination of the Merger Agreement under specified circumstances, including with respect to the Company’s entry into an agreement with respect to a qualifying “Superior Proposal” (as defined in the Merger Agreement), the Company will be required to pay Parent a termination fee of $73.5 million. For these and other reasons, a failed merger could materially adversely affect our business, operating results or financial condition. In addition, the trading price of our common stock could be adversely affected to the extent that the current price reflects an assumption that the Merger will be completed.
The pendency of the Merger may cause disruptions in our business, which could have an adverse effect on our business, financial condition or results of operations.
The pendency of the Merger could cause disruptions in and create uncertainty regarding our business, which could have an adverse effect on our financial condition and results of operations, regardless of whether the Merger is completed. These risks, which could be exacerbated by a delay in the consummation of the Merger, include the following:
|
•
|
key management and other employees may be difficult to retain or may become distracted from day-to-day operations because matters related to the Merger may require substantial commitments of their time and resources, which could adversely affect our operations and financial results;
|
|
•
|
our ability to pursue alternative business opportunities, including strategic acquisitions, is limited by the terms of the Merger Agreement. If the Merger is not completed for any reason, there can be no assurance that any other transaction acceptable to us will be offered or that our business, prospects or results of operations will not be adversely affected;
|
|
•
|
our ability to make appropriate changes to our business may be restricted by covenants in the Merger Agreement; these restrictions generally require us to conduct our business in the ordinary course and subject us to a variety of specified limitations absent Parent’s prior written consent. We may find that these and other contractual restrictions in the Merger Agreement may delay or prevent us from responding, or limit our ability to respond, effectively to competitive pressures, industry developments and future business opportunities that may arise during such period, even if our management believes they may be advisable; and
|
|
•
|
the costs and potential adverse outcomes of litigation relating to the Merger.
|
None.
31
We lease office space in Stamford, Connecticut, Dublin, Ireland and in Singapore. The lease for our current office in Stamford, Connecticut expires in August 2028. The lease for our Dublin office expires in June 2026 and the lease on our Singapore office expires in July 2022. None of these leases are individually material to the Company’s consolidated financial statements.
We believe our current facilities are adequate for our current needs and that suitable additional space will be available as and when needed.
On December 18, 2019, a purported shareholder of Aircastle filed a lawsuit against Aircastle and its directors and certain of its officers in the United States District Court for the Southern District of New York, captioned
David Younge v. Aircastle Limited, et al
., Case No. 1:19-cv-11574. Also on December 18, 2019, a purported shareholder of Aircastle filed a putative class action lawsuit against Aircastle and its directors in the United States District Court for the District of Delaware, captioned
Jordan Rosenblatt v. Aircastle Limited, et al.
, Case No. 1:19-cv-02295. On January 3, 2020, a purported shareholder of Aircastle filed a lawsuit against Aircastle and its directors in the United States District Court for the District of Connecticut, captioned
Ruda Anderson v. Aircastle Limited, et al.,
Case No. 3:20-cv-00017. On January 21, 2020, a purported shareholder of Aircastle filed a lawsuit against Aircastle and its directors in the United States District Court for the Eastern District of New York, captioned
Sherie Johnson v. Aircastle Limited, et al
., Case No. 1:20-cv-00334. On January 28, 2020, a purported shareholder of Aircastle filed a lawsuit against Aircastle and its directors in the United States District Court for the Southern District of New York, captioned
Howard Shoemaker v. Aircastle Limited, et al.
, Case No. 1:20-cv-00746. These five complaints allege that, among other things, the defendants violated Sections 14(a) and 20(a) of the Exchange Act and SEC Rule 14d 9 by omitting or misrepresenting certain allegedly material information in the proxy statement. These complaints seek, among other things: (i) injunctive relief preventing the consummation of the proposed transaction; (ii) rescissory damages or rescission in the event the proposed transaction is consummated; and (iii) plaintiffs’ attorneys’ and experts’ fees. The defendants believe the claims asserted in these complaints are without merit.
On January 2, 2020, a purported shareholder of Aircastle filed a putative class action lawsuit against Aircastle and its directors in the Superior Court of Connecticut, Judicial District of Stamford-Norwalk, captioned
Daniel Hotop v. Aircastle Limited, et al
., Case No. FST-CV20-6045115 (the “
Hotop
Complaint”). The
Hotop
Complaint alleges that the directors breached their fiduciary duties by: (i) entering into the proposed transaction through a flawed process; (ii) accepting an unfair price; and (iii) filing a materially deficient proxy statement. The
Hotop
Complaint seeks, among other things: (a) injunctive relief preventing the consummation of the proposed transaction; (b) rescissory damages or rescission in the event the proposed transaction is consummated; (c) declaratory relief that the Merger Agreement is unenforceable; (d) a judgment directing Aircastle to commence a new sale process; (e) damages; and (f) plaintiff’s attorneys’ and experts’ fees. The defendants believe the claims asserted in the
Hotop
Complaint are without merit.
Other potential plaintiffs may also file additional lawsuits challenging the Merger. The outcome of the
Younge, Rosenblatt, Hotop, Anderson, Johnson
and
Shoemaker
actions and any additional future litigation is uncertain. Such litigation, if not resolved, could prevent or delay consummation of the Merger and result in substantial costs to the Company, including any costs associated with the indemnification of directors and officers. One of the conditions to the closing of the Merger is the absence of any law, injunction or order by any governmental entity enjoining or otherwise prohibiting the consummation of the Merger. Therefore, if a plaintiff were successful in obtaining an injunction prohibiting the consummation of the Merger on the agreed- upon terms, then such injunction may prevent the Merger from being completed, or from being completed within the expected time frame. The defense or settlement of any lawsuit or claim that remains unresolved at the time the Merger is completed may adversely affect the Company’s business, financial condition, results of operations and cash flows.
Not applicable.
32
Information about our Executive Officers
Executive officers are elected by our Board of Directors, and their terms of office continue until the next annual meeting of the board or until their successors are elected and have been duly qualified. There are no family relationships among our executive officers.
Set forth below is information pertaining to our executive officers who held office as of
February 10, 2020
:
Michael Inglese, 58,
became our Chief Executive Officer and a member of our Board in June 2017, having served as our Acting Chief Executive Officer from January 2017. He was previously our Chief Financial Officer from April 2007. Prior to joining the Company, Mr. Inglese served as an Executive Vice President and Chief Financial Officer of PanAmSat Holding Corporation, where he served as Chief Financial Officer from June 2000 until the closing of PanAmSat’s sale to Intelsat in July 2006. Mr. Inglese joined PanAmSat in May 1998 as Vice President, Finance after serving as Chief Financial Officer for DIRECTV Japan, Inc. He is a Chartered Financial Analyst who holds a BS in Mechanical Engineering from Rutgers University College of Engineering and his MBA from Rutgers Graduate School of Business Management. Mr. Inglese is also a member of the Board of Directors of the Business Council for Fairfield County.
Aaron Dahlke, 51,
became our Chief Financial Officer in June 2017. Prior to that, he was our Chief Accounting Officer from June 2005. Prior to joining the Company, Mr. Dahlke was Vice President and Controller of Boullioun Aviation Services Inc. from January 2003 to May 2005. Prior to Boullioun, Mr. Dahlke was at ImageX.com, Inc. and Ernst & Young LLP. He received a BS in Accounting from California State University, San Bernardino. He is a Certified Public Accountant.
Douglas C. Winter, 56,
became our Chief Commercial Officer in April 2019. Prior to joining Aircastle, Mr. Winter was Vice Chairman of Amedeo, a leading aircraft asset manager, from July 2018 to March 2019, as well as Chief Executive Officer and member of the Board of Managers at Voyager Aviation (“Voyager”) from October 2017 to March 2019. Prior to this, he served as President and Chief Commercial Officer at Voyager from September 2015 to September 2017. Mr. Winter joined Voyager in June 2015 as Chief Commercial Officer. Previously, Mr. Winter was an advisor to GE Capital Aviation Services and Chief Executive Officer of Octagon Aviation from June 2013 to May 2015 and, before this, he served as Head of Global Sales at AWAS in Dublin, Ireland from December 2010 to May 2013. Mr. Winter has over 30 years of experience in commercial aviation, having started his career with McDonnell Douglas in 1985, and he holds a BS in Business from Indiana University.
Christopher L. Beers, 55,
is our Chief Legal Officer & Secretary and became our General Counsel in November 2014. Prior to joining the Company, Mr. Beers held senior positions at GE Capital since 2000, including Senior Vice President and Associate General Counsel at GECAS from 2009 to 2014, and Senior Vice President and General Counsel of GE Transportation Finance from 2006 to 2009. Previously, Mr. Beers was a Senior Associate at the law firm of Milbank Tweed Hadley and McCloy in New York City. Mr. Beers holds a BS in Economics from Arizona State University and a JD from Pace Law School.
Joseph Schreiner, 62,
became our Executive Vice President, Technical in October 2004. Prior to joining the Company, Mr. Schreiner oversaw the technical department at AAR Corp, a provider of products and services to the aviation and defense industries from 1998 to 2004 where he managed aircraft and engine evaluations and inspections, aircraft lease transitions, reconfiguration and heavy maintenance. Prior to AAR, Mr. Schreiner spent nineteen years at Boeing (McDonnell-Douglas) in various technical management positions. Mr. Schreiner received a BS from the University of Illinois and an MBA from Pepperdine University.
Roy Chandran, 56,
became our Executive Vice President, Corporate Finance and Strategy in June 2017. He previously served as Executive Vice President of Capital Markets from May 2008. Prior to joining the Company, Mr. Chandran was a Director at Citi in the Global Structured Solutions Group, having originally joined Salomon Brothers in 1997. Mr. Chandran is responsible for all of the Company’s fund raising activities and strategy and has extensive experience in US and international capital markets. Before 1997, Mr. Chandran spent eight years in Hong Kong focusing on tax-based cross border leasing of transportation equipment for clients in the Asia Pacific region. Mr. Chandran holds a BS in Chemical Engineering from the Royal Melbourne Institute of Technology, Australia and obtained his MBA from the International Institute of Management Development (“IMD”), Switzerland.
James C. Connelly, 47,
became our Chief Accounting Officer in September 2018. Mr. Connelly has been Aircastle’s Controller since January 2013. He joined Aircastle in May 2007 as Assistant Controller, Operational Accounting. Prior to joining Aircastle, Mr. Connelly was with Lehman Brothers as a Controller in their Finance Division, beginning in January 2001. Mr. Connelly received a BS in Accounting from Syracuse University.
33
Our common shares are listed for trading on the NYSE under the symbol “AYR.” As of February 3, 2020, there were 13,003 record holders of our common shares.
Our ability to pay, maintain or increase cash dividends to our shareholders is subject to the discretion of our Board of Directors and will depend on many factors, including the difficulty we may experience in raising capital in a market that has experienced significant volatility in recent years and our ability to finance our aircraft acquisition commitments; our ability to negotiate favorable lease and other contractual terms; the level of demand for our aircraft; the economic condition of the commercial aviation industry generally; the financial condition and liquidity of our lessees; the lease rates we are able to charge and realize; our leasing costs; unexpected or increased expenses; the level and timing of capital expenditures; principal repayments and other capital needs; the value of our aircraft portfolio; our compliance with loan to value, debt service coverage, interest rate coverage and other financial covenants in our financings; our results of operations, financial condition and liquidity; general business conditions; restrictions imposed by our senior notes and other financings; legal restrictions on the payment of dividends, including a statutory dividend test and other limitations under Bermuda law; and other factors that our Board of Directors deems relevant. Additionally, the Merger Agreement permits the Company to declare and pay a regular quarterly dividend of up to $0.32 per common share (please refer to Item 7. for a further discussion of the Merger Agreement). Some of these factors are beyond our control and a change in any such factor could affect our ability to pay dividends on our common shares. In the future we may choose not to pay dividends or may not be able to pay dividends, maintain our current level of dividends, or increase them over time. Increases in demand for our aircraft and operating lease payments may not occur and may not increase our actual cash available for dividends to our common shareholders. The failure to maintain or pay dividends may adversely affect our share price.
Issuer Purchases of Equity Securities
On May 17, 2019, our Board of Directors increased the authorization to repurchase the Company’s common shares to $100.0 million from the $76.0 million that was remaining under the previous authorization. During the fourth quarter of
2019
, we purchased our common shares as follows:
|
Period
|
Total
Number
of Shares
Purchased
|
Average
Price
Paid
per Share
|
Total Number of
Shares Purchased
as Part of Publicly
Announced Plans
or Programs
(1)
|
Maximum
Number (or
Approximate
Dollar Value) of
Shares that May
Yet Be Purchased
Under the Plans or
Programs
(1)
|
|||||||||
|
|
(Dollars in thousands, except per share amounts)
|
||||||||||||
|
October 1 through 31
|
—
|
|
$
|
—
|
|
—
|
|
$
|
90,351
|
|
|||
|
November 1 through 30
|
—
|
|
—
|
|
—
|
|
90,351
|
|
|||||
|
December 1 through 31
|
482,876
|
|
(2)
|
31.98
|
|
—
|
|
90,351
|
|
||||
|
Total
|
482,876
|
|
$
|
31.98
|
|
—
|
|
$
|
90,351
|
|
|||
______________
|
(1)
|
Under our current repurchase program, we have purchased an aggregate of 476,608 common shares at an aggregate cost of $9.6 million, including commissions. The remaining dollar value of common shares that may be repurchased under the program is $90.4 million.
|
|
(2)
|
Repurchased to satisfy tax withholding obligations associated with the vesting of restricted common shares and performance share awards. See Note 8 for information regarding accelerated share vestings.
|
34
Performance Graph
The following stock performance graph shall not be deemed “filed” with the SEC or subject to Section 18 of the Exchange Act, nor shall it be deemed incorporated by reference in any of our filings under the Securities Act of 1933, as amended.
The following graph compares the cumulative five year total return to holders of our common shares relative to the cumulative total returns of the S&P Midcap 400 Index and a customized peer group over the five year period ended
December 31, 2019
. The peer group consists of three companies: AerCap Holdings NV (NYSE: AER), Air Lease Corporation (NYSE: AL) and FLY Leasing Limited (NYSE: FLY). An investment of $100 (with reinvestment of all dividends) is assumed to have been made in our common shares, the S&P Midcap 400 Index and in the peer group on December 31, 2014, and the relative performance of each is tracked through
December 31, 2019
. The stock performance shown on the graph below represents historical stock performance and is not necessarily indicative of future stock price performance. We believe that the S&P Midcap 400 Index is more representative of our peers and as such, we utilize the S&P Midcap 400 Index as one of the metrics for our performance share-based compensation as part of our long-term incentive plan.
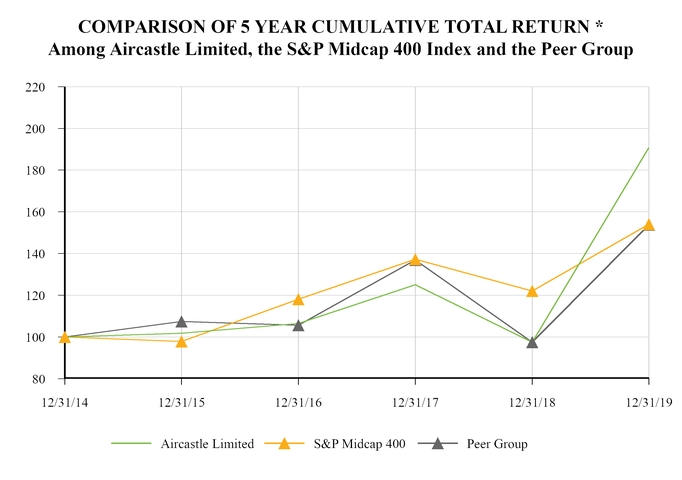
* $100 invested on December 31, 2014 in stock or index, including reinvestment of dividends.
|
12/31/14
|
12/31/15
|
12/31/16
|
12/31/17
|
12/31/18
|
12/31/19
|
||||||||||||||||||
|
Aircastle Limited
|
$
|
100.00
|
|
$
|
101.82
|
|
$
|
106.43
|
|
$
|
124.97
|
|
$
|
97.45
|
|
$
|
190.83
|
|
|||||
|
S&P Midcap 400
|
100.00
|
|
97.82
|
|
118.11
|
|
137.30
|
|
122.08
|
|
154.07
|
|
|||||||||||
|
Peer Group
|
100.00
|
|
107.40
|
|
105.60
|
|
136.90
|
|
97.41
|
|
153.75
|
|
|||||||||||
35
The selected historical consolidated financial, operating and other data as of
December 31, 2019
and
2018
and for each of the three years in the period ended
December 31, 2019
presented in this table are derived from our audited consolidated financial statements and related notes thereto appearing elsewhere in this Annual Report. The selected consolidated financial data as of December 31, 2017, 2016 and 2015, and for each of the two years in the period ended December 31, 2016, presented in this table are derived from our audited consolidated financial statements and related notes thereto, which are not included in this Annual Report. You should read these tables along with Item 7. “Management’s Discussion and Analysis of Financial Condition and Results of Operations” and our Consolidated Financial Statements and the related notes thereto included elsewhere in this Annual Report.
|
|
Year Ended December 31,
|
||||||||||||||||||
|
|
2019
|
2018
|
2017
|
2016
|
2015
|
||||||||||||||
|
|
(Dollars in thousands, except share data)
|
||||||||||||||||||
|
Selected Financial Data:
|
|||||||||||||||||||
|
Consolidated Statements of Income:
|
|||||||||||||||||||
|
Lease rental revenue
|
$
|
777,403
|
|
$
|
722,694
|
|
$
|
721,302
|
|
$
|
725,220
|
|
$
|
733,417
|
|
||||
|
Total revenues
(1)
|
917,938
|
|
890,351
|
|
851,787
|
|
812,084
|
|
877,219
|
|
|||||||||
|
Selling, general and administrative expenses
|
77,034
|
|
76,025
|
|
73,604
|
|
61,872
|
|
56,198
|
|
|||||||||
|
Depreciation
|
356,021
|
|
310,850
|
|
298,664
|
|
305,216
|
|
318,783
|
|
|||||||||
|
Interest, net
|
258,070
|
|
234,504
|
|
241,231
|
|
255,660
|
|
243,577
|
|
|||||||||
|
Net income
|
156,575
|
|
247,919
|
|
147,874
|
|
151,453
|
|
121,729
|
|
|||||||||
|
Earnings per common share — Basic:
|
|||||||||||||||||||
|
Net income per share
|
$
|
2.09
|
|
$
|
3.18
|
|
$
|
1.88
|
|
$
|
1.92
|
|
$
|
1.50
|
|
||||
|
Earnings per common share — Diluted:
|
|||||||||||||||||||
|
Net income per share
|
$
|
2.06
|
|
$
|
3.17
|
|
$
|
1.87
|
|
$
|
1.92
|
|
$
|
1.50
|
|
||||
|
Cash dividends declared per share
|
$
|
1.22
|
|
$
|
1.14
|
|
$
|
1.06
|
|
$
|
0.98
|
|
$
|
0.90
|
|
||||
|
Other Operating Data:
|
|||||||||||||||||||
|
EBITDA
|
$
|
815,969
|
|
$
|
814,184
|
|
$
|
705,525
|
|
$
|
734,989
|
|
$
|
707,524
|
|
||||
|
Adjusted EBITDA
|
862,161
|
|
839,831
|
|
801,584
|
|
767,953
|
|
832,105
|
|
|||||||||
|
Adjusted net income
|
196,547
|
|
257,237
|
|
169,566
|
|
168,527
|
|
142,271
|
|
|||||||||
|
Consolidated Statements of Cash Flows:
|
|||||||||||||||||||
|
Cash flows provided by operations
(1)
|
$
|
536,418
|
|
$
|
522,592
|
|
$
|
490,871
|
|
$
|
468,092
|
|
$
|
526,285
|
|
||||
|
Cash flows used in investing activities
(1)
|
(784,029
|
)
|
(974,687
|
)
|
(517,107
|
)
|
(663,155
|
)
|
(847,662
|
)
|
|||||||||
|
Cash flows provided by (used in) financing activities
|
235,201
|
|
386,091
|
|
(248,724
|
)
|
449,839
|
|
306,878
|
|
|||||||||
|
Consolidated Balance Sheet Data:
|
|||||||||||||||||||
|
Cash and cash equivalents
|
$
|
140,882
|
|
$
|
152,719
|
|
$
|
211,922
|
|
$
|
455,579
|
|
$
|
155,904
|
|
||||
|
Flight equipment held for lease, net of accumulated depreciation
|
7,375,018
|
|
6,935,585
|
|
6,188,469
|
|
6,247,585
|
|
5,867,062
|
|
|||||||||
|
Net investment in direct financing and sales-type leases
|
419,396
|
|
469,180
|
|
545,750
|
|
260,853
|
|
201,211
|
|
|||||||||
|
Total assets
|
8,202,046
|
|
7,871,181
|
|
7,199,083
|
|
7,244,665
|
|
6,569,964
|
|
|||||||||
|
Borrowings from secured and unsecured financings, net of debt issuance costs
|
5,061,836
|
|
4,761,353
|
|
4,313,606
|
|
4,506,245
|
|
4,041,156
|
|
|||||||||
|
Shareholders’ equity
|
2,052,684
|
|
2,008,681
|
|
1,907,564
|
|
1,834,314
|
|
1,779,500
|
|
|||||||||
|
Other Data:
|
|||||||||||||||||||
|
Number of aircraft owned and managed on behalf of our joint ventures (at the end of period)
|
287
|
|
261
|
|
236
|
|
206
|
|
167
|
|
|||||||||
|
Total debt to total capitalization
|
71.1
|
%
|
70.3
|
%
|
69.3
|
%
|
71.1
|
%
|
69.4
|
%
|
|||||||||
|
Total unencumbered assets
|
$
|
5,978,813
|
|
$
|
6,207,411
|
|
$
|
5,558,294
|
|
$
|
5,069,955
|
|
$
|
4,084,134
|
|
||||
|
(1)
|
See Organization and Basis of Presentation in the Notes to Consolidated Financial Statements.
|
36
We define EBITDA as income (loss) from continuing operations before income taxes, interest expense, and depreciation and amortization. We use EBITDA to assess our consolidated financial and operating performance, and we believe this non-U.S. GAAP measure is helpful in identifying trends in our performance. This measure provides an assessment of controllable expenses and affords management the ability to make decisions which are expected to facilitate meeting current financial goals as well as achieving optimal financial performance. It provides an indicator for management to determine if adjustments to current spending decisions are needed. EBITDA provides us with a measure of operating performance because it assists us in comparing our operating performance on a consistent basis as it removes the impact of our capital structure (primarily interest charges on our outstanding debt) and asset base (primarily depreciation and amortization) from our operating results. Accordingly, this metric measures our financial performance based on operational factors that management can impact in the short-term, namely the cost structure, or expenses, of the organization. EBITDA is one of the metrics used by senior management and the Board of Directors to review the consolidated financial performance of our business.
We define Adjusted EBITDA as EBITDA (as defined above) further adjusted to give effect to adjustments required in calculating covenant ratios and compliance as that term is defined in the indenture governing our senior unsecured notes. Adjusted EBITDA is a material component of these covenants.
The table below shows the reconciliation of net income to EBITDA and Adjusted EBITDA for the years ended
December 31, 2019
,
2018
,
2017
,
2016
and
2015
.
|
|
Year Ended December 31,
|
||||||||||||||||||
|
|
2019
|
2018
|
2017
|
2016
|
2015
|
||||||||||||||
|
|
(Dollars in thousands)
|
||||||||||||||||||
|
Net income
|
$
|
156,575
|
|
$
|
247,919
|
|
$
|
147,874
|
|
$
|
151,453
|
|
$
|
121,729
|
|
||||
|
Depreciation
|
356,021
|
|
310,850
|
|
298,664
|
|
305,216
|
|
318,783
|
|
|||||||||
|
Amortization of lease premiums, discounts and incentives
|
22,636
|
|
15,269
|
|
11,714
|
|
10,353
|
|
10,664
|
|
|||||||||
|
Interest, net
|
258,070
|
|
234,504
|
|
241,231
|
|
255,660
|
|
243,577
|
|
|||||||||
|
Income tax provision
|
22,667
|
|
5,642
|
|
6,042
|
|
12,307
|
|
12,771
|
|
|||||||||
|
EBITDA
|
$
|
815,969
|
|
$
|
814,184
|
|
$
|
705,525
|
|
$
|
734,989
|
|
$
|
707,524
|
|
||||
|
Adjustments:
|
|||||||||||||||||||
|
Impairment of aircraft
|
7,404
|
|
—
|
|
80,430
|
|
28,585
|
|
119,835
|
|
|||||||||
|
Equity share of joint venture impairment
|
2,724
|
|
15,791
|
|
—
|
|
—
|
|
—
|
|
|||||||||
|
Loss on extinguishment of debt
|
7,577
|
|
—
|
|
—
|
|
—
|
|
—
|
|
|||||||||
|
Non-cash share-based payment expense
|
15,830
|
|
11,488
|
|
13,148
|
|
7,901
|
|
5,537
|
|
|||||||||
|
Merger related expenses
(1)
|
7,886
|
|
—
|
|
—
|
|
—
|
|
—
|
|
|||||||||
|
Loss (gain) on mark-to-market of interest rate derivative contracts
|
4,771
|
|
(1,632
|
)
|
2,481
|
|
(3,522
|
)
|
(791
|
)
|
|||||||||
|
Adjusted EBITDA
|
$
|
862,161
|
|
$
|
839,831
|
|
$
|
801,584
|
|
$
|
767,953
|
|
$
|
832,105
|
|
||||
_____________
|
(1)
|
Includes $7.4 million in Other income (expense) and $0.5 million in Selling, general and administrative expenses.
|
Management believes that Adjusted Net Income (“ANI”) when viewed in conjunction with the Company’s results under U.S. GAAP and the below reconciliation, provides useful information about operating and period-over-period performance, and provides additional information that is useful for evaluating the underlying operating performance of our business without regard to periodic reporting elements related to interest rate derivative accounting, changes related to refinancing activity, merger related expenses and non-cash share-based payment expense.
For additional information regarding the limitations of these non-GAAP measures, see “Limitations of EBITDA, Adjusted EBITDA and ANI” below.
37
The table below shows the reconciliation of net income to ANI for the years ended
December 31, 2019
,
2018
,
2017
,
2016
and
2015
.
|
|
Year Ended December 31,
|
||||||||||||||||||
|
|
2019
|
2018
|
2017
|
2016
|
2015
|
||||||||||||||
|
|
(Dollars in thousands)
|
||||||||||||||||||
|
Net income
|
$
|
156,575
|
|
$
|
247,919
|
|
$
|
147,874
|
|
$
|
151,453
|
|
$
|
121,729
|
|
||||
|
Loss on extinguishment of debt
(1)
|
7,577
|
|
—
|
|
—
|
|
—
|
|
—
|
|
|||||||||
|
Ineffective portion and termination of cash flow hedges
(2)
|
—
|
|
—
|
|
—
|
|
—
|
|
455
|
|
|||||||||
|
Loss (gain) on mark-to-market of interest rate derivative contracts
(1)
|
4,771
|
|
(1,632
|
)
|
2,481
|
|
(3,522
|
)
|
(791
|
)
|
|||||||||
|
Loan termination (gain) fee
(2)
|
—
|
|
(838
|
)
|
2,058
|
|
4,960
|
|
—
|
|
|||||||||
|
Write-off of deferred financing fees
(2)
|
172
|
|
300
|
|
4,005
|
|
2,880
|
|
—
|
|
|||||||||
|
Non-cash share-based payment expense
(3)
|
15,830
|
|
11,488
|
|
13,148
|
|
7,901
|
|
5,537
|
|
|||||||||
|
Merger related expenses and taxes
(4)
|
11,622
|
|
—
|
|
—
|
|
—
|
|
—
|
|
|||||||||
|
Term Financing No. 1 hedge loss amortization charges
(2)
|
—
|
|
—
|
|
—
|
|
—
|
|
4,401
|
|
|||||||||
|
Securitization No. 1 hedge loss amortization charges
(2)
|
—
|
|
—
|
|
—
|
|
4,855
|
|
10,940
|
|
|||||||||
|
Adjusted net income
|
$
|
196,547
|
|
$
|
257,237
|
|
$
|
169,566
|
|
$
|
168,527
|
|
$
|
142,271
|
|
||||
_____________
|
(1)
|
Included in Other income (expense).
|
|
(2)
|
Included in Interest, net.
|
|
(3)
|
Included in Selling, general and administrative expenses.
|
|
(4)
|
Includes $7.4 million in Other income (expense), $3.7 million in Income tax provision and $0.5 million in Selling, general and administrative expenses.
|
38
This management’s discussion and analysis of financial condition and results of operations contains forward-looking statements that involve risks, uncertainties and assumptions. You should read the following discussion in conjunction with Item 6. “Selected Financial Data” and our historical consolidated financial statements and the notes thereto appearing elsewhere in this Annual Report. The results of operations for the periods reflected herein are not necessarily indicative of results that may be expected for future periods, and our actual results may differ materially from those discussed in the forward-looking statements as a result of various factors, including but not limited to those described under Item 1A. — “Risk Factors” and elsewhere in this Annual Report. Please see “Safe Harbor Statement Under the Private Securities Litigation Reform Act of 1995” for a discussion of the uncertainties, risks and assumptions associated with these statements. Our consolidated financial statements are prepared in accordance with U.S. GAAP and, unless otherwise indicated, the other financial information contained in this Annual Report has also been prepared in accordance with U.S. GAAP. Unless otherwise indicated, all references to “dollars” and “$” in this Annual Report are to, and all monetary amounts in this Annual Report are presented in, U.S. dollars.
OVERVIEW
Aircastle acquires, leases, and sells commercial jet aircraft to airlines throughout the world. As of
December 31, 2019
, we owned and managed on behalf of our joint ventures
287
aircraft that were leased to
85
lessees located in
49
countries. Our aircraft are managed by an experienced team based in the United States, Ireland and Singapore. Our aircraft are subject to net leases whereby the lessee is generally responsible for maintaining the aircraft and paying operational, maintenance and insurance costs, although in certain cases, we are obligated to pay a portion of specified maintenance or modification costs. As of
December 31, 2019
, the net book value of our owned aircraft was
$7.79 billion
compared to
$7.40 billion
at the end of
2018
. Our revenues and net income for the year ended
December 31, 2019
were
$917.9 million
and
$156.6 million
, respectively, and for the fourth quarter of
2019
were
$243.7 million
and
$47.3 million
, respectively.
Pending Merger with MM Air Limited
On November 5, 2019, Aircastle entered into the Merger Agreement with Parent and Merger Sub, pursuant to which, among other things, Merger Sub will merge with and into the Company, with Aircastle surviving as a wholly owned subsidiary of Parent. Parent and Merger Sub are newly-formed entities controlled by affiliates of Marubeni and Mizuho Leasing.
Pursuant to the Merger Agreement, subject to certain conditions set forth therein, at the Effective Time, each issued and outstanding Common Share (other than (i) shares to be canceled or converted into shares of the surviving company pursuant to the Merger Agreement and (ii) restricted shares to be canceled and exchanged pursuant to the Merger Agreement), shall be converted into the right to receive the Merger Consideration.
Consummation of the Merger is subject to the satisfaction of certain remaining customary closing conditions, including, without limitation, (i) approval of the Merger Agreement and the transactions contemplated thereby by the affirmative votes of a majority of the votes cast by holders of outstanding Common Shares at a meeting of the Company’s shareholders; (ii) the receipt of any applicable pre-clearance or similar approval of certain remaining specified jurisdictions (i.e., Chile, Mexico and Morocco), and all required regulatory approvals being in full force and effect; (iii) the absence of any law, judgment or other legal restraint that prevents, makes illegal or prohibits the consummation of the Merger and the other transactions contemplated by the Merger Agreement; (iv) the accuracy of each party’s representations and warranties (subject to certain qualifications); (v) each party’s performance in all material respects of its obligations contained in the Merger Agreement; and (vi) the absence of a material adverse effect on the Company since the date of the Merger Agreement.
The Merger Agreement includes customary representations, warranties and covenants of Aircastle, Parent, and Merger Sub. Among other things, Aircastle has agreed to customary covenants regarding the operation of the business of Aircastle and its subsidiaries prior to the closing. Aircastle is permitted to pay regular quarterly dividends up to $0.32 per common share pursuant to the Merger Agreement. We currently anticipate that the Merger will close in the first half of calendar year 2020, subject to the satisfaction of the remaining customary closing conditions.
39
Revenues
Our revenues are comprised primarily of operating lease rentals on flight equipment held for lease, revenue from maintenance payments related to lease expirations, lease termination payments, interest recognized from direct financing and sales-type leases and gains on the sale of flight equipment.
Typically, our aircraft are subject to net leases whereby the lessee pays lease rentals and is generally responsible for maintaining the aircraft and paying operational, maintenance and insurance costs arising during the term of the lease. Our aircraft lease agreements generally provide for the periodic payment of a fixed amount of rent over the life of the lease and the amount of the contracted rent will depend upon the type, age, specification and condition of the aircraft and market conditions at the time the lease is committed. The amount of rent we receive will depend on a number of factors, including the creditworthiness of our lessees and the occurrence of restructurings and defaults. Our lease rental revenues are also affected by the extent to which aircraft are off-lease and our ability to remarket aircraft that are nearing the end of their leases in order to minimize their off-lease time. Our success in re-leasing aircraft is affected by market conditions relating to our aircraft and by general industry conditions and trends. An increase in the percentage of off-lease aircraft or a reduction in lease rates upon remarketing would negatively impact our revenues.
Under a lease, the lessee is responsible for performing maintenance on the relevant aircraft and will typically be required to make payments to us for heavy maintenance, overhaul or replacement of certain high-value components of the aircraft. These maintenance payments are based on hours or cycles of utilization or on calendar time, depending upon the component, and would be made either monthly in arrears or at the end of the lease term. For maintenance payments made monthly in arrears during a lease term, we will typically be required to reimburse all or a portion of these payments to the lessee upon their completion of the relevant heavy maintenance, overhaul or parts replacement. We record maintenance payments paid by the lessee during a lease as accrued maintenance liabilities in recognition of our obligation in the lease to refund such payments, and therefore we typically do not recognize maintenance revenue during the lease. Maintenance revenue recognition would occur at the end of a lease, when we are able to determine the amount, if any, by which reserve payments received exceed the amount we are required under the lease to reimburse to the lessee for heavy maintenance, overhaul or parts replacement. The amount of maintenance revenue we recognize in any reporting period is inherently volatile and is dependent upon a number of factors, including the timing of lease expiries, including scheduled and unscheduled expiries, the timing of maintenance events and the utilization of the aircraft by the lessee.
Many of our leases contain provisions which may require us to pay a portion of the lessee’s costs for heavy maintenance, overhaul or replacement of certain high-value components. We account for these expected payments as lease incentives, which are amortized as a reduction of revenue over the life of the lease. We estimate the amount of our portion for such costs, typically for the first major maintenance event for the airframe, engines, landing gear and auxiliary power units, expected to be paid to the lessee based on assumed utilization of the related aircraft by the lessee, the anticipated cost of the maintenance event and the estimated amounts the lessee is responsible to pay.
This estimated lease incentive is not recognized as a lease incentive liability at the inception of the lease. We recognize the lease incentive as a reduction of lease revenue on a straight-line basis over the life of the lease, with the offset being recorded as a lease incentive liability which is included in maintenance payments on the balance sheet. The payment to the lessee for the lease incentive liability is first recorded against the lease incentive liability and any excess above the lease incentive liability is recorded as a prepaid lease incentive asset which is included in other assets on the balance sheet and continues to amortize over the remaining life of the lease.
Operating Expenses
Operating expenses are comprised of depreciation of flight equipment held for lease, interest expense, SG&A expenses, aircraft impairment charges and maintenance and other costs. Because our operating lease terms generally require the lessee to pay for operating, maintenance and insurance costs, our portion of maintenance and other costs relating to aircraft reflected in our statement of income primarily relates to expenses for unscheduled lease terminations.
Income Tax Provision
We obtained an assurance from the Minister of Finance of Bermuda under the Exempted Undertakings Tax Protection Act 1966 that, in the event any legislation is enacted in Bermuda imposing any tax computed on profits or income, or computed on any capital asset, gain or appreciation or any tax in the nature of estate duty or inheritance tax, such tax shall
40
not, until March 2035, be applicable to us or to any of our operations or to our shares, debentures or other obligations except insofar as such tax applies to persons ordinarily resident in Bermuda or to any taxes payable by us in respect of real property owned or leased by us in Bermuda. Consequently, the provision for income taxes recorded relates to income earned by certain subsidiaries of the Company which are located in, or earn income in, jurisdictions that impose income taxes, primarily Ireland, Singapore and the United States.
All of our aircraft-owning subsidiaries that are recognized as corporations for U.S. tax purposes are non-U.S. corporations. These non-U.S. subsidiaries generally earn income from sources outside the United States and typically are not subject to U.S. federal, state or local income taxes, unless they operate within the U.S., in which case they may be subject to federal, state and local income taxes. The aircraft owning subsidiaries resident in Ireland, Mauritius and Singapore are subject to tax in those respective jurisdictions.
We have a U.S.-based subsidiary which provides management services to our non-U.S. subsidiaries and is subject to U.S. federal, state and local income taxes. We also have Ireland and Singapore based subsidiaries which provide management services to our non-U.S. subsidiaries and are subject to tax in those respective jurisdictions.
Acquisitions and Sales
During
2019
, we acquired 49 aircraft for $1.28 billion. As of
February 10, 2020
, we have not acquired any additional aircraft. At
December 31, 2019
, we had commitments to acquire
31
aircraft for
$1.11 billion
, including 25 new Embraer E-Jet E2 aircraft from Embraer, with delivery beginning in 2020. These amounts include estimated amounts for pre-delivery deposits, contractual price escalations and other adjustments. As of
February 10, 2020
, we have commitments to acquire
31
aircraft for
$1.11 billion
.
During
2019
, we sold twenty aircraft and other flight equipment for
$361.7 million
, which resulted in a net gain of
$45.5 million
. As of
February 10, 2020
, we have sold five additional aircraft.
41
The following table sets forth certain information with respect to the aircraft owned and managed on behalf of our joint ventures by us as of
December 31, 2019
,
2018
and
2017
:
AIRCASTLE AIRCRAFT INFORMATION (dollars in millions)
|
Owned Aircraft
|
As of
December 31, 2019 (1) |
As of
December 31, 2018 (1) |
As of
December 31, 2017 (1) |
||||||||
|
Net Book Value of Flight Equipment
|
$
|
7,794
|
|
$
|
7,405
|
|
$
|
6,734
|
|
||
|
Net Book Value of Unencumbered Flight Equipment
|
$
|
5,979
|
|
$
|
6,055
|
|
$
|
5,346
|
|
||
|
Number of Aircraft
|
278
|
|
248
|
|
224
|
|
|||||
|
Number of Unencumbered Aircraft
|
237
|
|
217
|
|
195
|
|
|||||
|
Number of Lessees
|
84
|
|
81
|
|
81
|
|
|||||
|
Number of Countries
|
48
|
|
44
|
|
43
|
|
|||||
|
Weighted Average Age (years)
(2)
|
9.9
|
|
9.1
|
|
9.1
|
|
|||||
|
Weighted Average Remaining Lease Term (years)
(2)
|
4.8
|
|
4.5
|
|
5.0
|
|
|||||
|
Weighted Average Fleet Utilization during the Fourth Quarter
(3)
|
99.2
|
%
|
97.0
|
%
|
99.5
|
%
|
|||||
|
Weighted Average Fleet Utilization for the Year Ended
(3)
|
96.4
|
%
|
99.6
|
%
|
99.3
|
%
|
|||||
|
Portfolio Yield for the Fourth Quarter
(4)
|
11.2
|
%
|
11.2
|
%
|
12.0
|
%
|
|||||
|
Portfolio Yield for the Year Ended
(4)
|
10.9
|
%
|
11.5
|
%
|
12.2
|
%
|
|||||
|
Managed Aircraft on behalf of Joint Ventures
|
|||||||||||
|
Flight Equipment
|
$
|
328
|
|
$
|
602
|
|
$
|
641
|
|
||
|
Number of Aircraft
|
9
|
|
13
|
|
12
|
|
|||||
|
(1)
|
Calculated using net book value at period end.
|
|
(2)
|
Weighted by net book value.
|
|
(3)
|
Aircraft on-lease days as a percent of total days in period weighted by net book value. The decrease from our historical utilization rate was due to the early termination of the leases for eleven aircraft from Avianca Brazil and seven aircraft from Jet Airways.
|
|
(4)
|
Lease rental revenue, interest income and cash collections on our net investment in direct financing and sales-type leases for the period as a percent of the average net book value for the period; quarterly information is annualized. The decrease from our historical portfolio yield was due to the early termination of the leases for eleven aircraft from Avianca Brazil and seven aircraft from Jet Airways. The calculation of portfolio yield includes our net investment in direct financing and sales-type leases in the average net book value, and the interest income and cash collections from our net investment in direct financing and sales-type leases in lease rentals.
|
Our owned aircraft portfolio as of
December 31, 2019
is listed in Exhibit 99.1 to this Annual Report.
42
PORTFOLIO DIVERSIFICATION
|
|
Owned Aircraft as of
December 31, 2019
|
Owned Aircraft as of
December 31, 2018 |
|||||||||
|
|
Number of
Aircraft
|
% of Net
Book Value
(1)
|
Number of
Aircraft
|
% of Net
Book Value
(1)
|
|||||||
|
Aircraft Type
|
|||||||||||
|
Passenger:
|
|||||||||||
|
Narrow-body
|
250
|
|
75
|
%
|
218
|
|
72
|
%
|
|||
|
Wide-body
|
24
|
|
21
|
%
|
26
|
|
24
|
%
|
|||
|
Total Passenger
|
274
|
|
96
|
%
|
244
|
|
96
|
%
|
|||
|
Freighter
|
4
|
|
4
|
%
|
4
|
|
4
|
%
|
|||
|
Total
|
278
|
|
100
|
%
|
248
|
|
100
|
%
|
|||
|
Manufacturer
|
|||||||||||
|
Airbus
|
184
|
|
63
|
%
|
153
|
|
59
|
%
|
|||
|
Boeing
|
89
|
|
36
|
%
|
90
|
|
39
|
%
|
|||
|
Embraer
|
5
|
|
1
|
%
|
5
|
|
2
|
%
|
|||
|
Total
|
278
|
|
100
|
%
|
248
|
|
100
|
%
|
|||
|
Regional Diversification
|
|||||||||||
|
Asia and Pacific
|
94
|
|
38
|
%
|
78
|
|
36
|
%
|
|||
|
Europe
|
99
|
|
26
|
%
|
87
|
|
27
|
%
|
|||
|
Middle East and Africa
|
16
|
|
7
|
%
|
17
|
|
8
|
%
|
|||
|
North America
|
40
|
|
13
|
%
|
35
|
|
10
|
%
|
|||
|
South America
|
26
|
|
15
|
%
|
16
|
|
10
|
%
|
|||
|
Off-lease
|
3
|
|
(2)
|
1
|
%
|
15
|
|
(3)
|
9
|
%
|
|
|
Total
|
278
|
|
100
|
%
|
248
|
|
100
|
%
|
|||
|
(1)
|
Calculated using net book value at year end.
|
|
(2)
|
Consisted of
one
Airbus A320-200 aircraft, which was delivered on lease to a customer in Europe during the first quarter of 2020,
one
Airbus A330-200 aircraft, which is subject to a lease commitment, and
one
Boeing 737-800 aircraft, which we are marketing for lease or sale.
|
|
(3)
|
Consisted of
ten
Airbus A320-200 aircraft,
one
Airbus A330-200 aircraft,
one
Boeing 737-800 aircraft and
one
Boeing 777-300ER aircraft, all of which delivered on lease to customers during 2019,
one
Airbus A330-200 aircraft, which is subject to a lease commitment, and
one
Airbus A320-200 aircraft, which was sold during 2019.
|
43
Our largest customer represents approximately 9% of the net book value at
December 31, 2019
. Our top fifteen customers for aircraft we owned at
December 31, 2019
, representing
139
aircraft and 54% of the net book value, are as follows:
|
Percent of Net Book Value
|
Customer
|
Country
|
Number of
Aircraft
|
||||
|
Greater than 6% per customer
|
LATAM
|
Chile
|
13
|
|
|||
|
IndiGo
|
India
|
16
|
|
||||
|
3% to 6% per customer
|
easyJet
|
United Kingdom
|
30
|
|
|||
|
Iberia
|
Spain
|
15
|
|
||||
|
Air Canada
|
Canada
|
6
|
|
||||
|
South African Airways
|
South Africa
|
4
|
|
||||
|
Less than 3% per customer
|
Aerolineas Argentinas
|
Argentina
|
5
|
|
|||
|
Interjet
|
Mexico
|
11
|
|
||||
|
American Airlines
|
United States
|
7
|
|
||||
|
Lion Air
(1)
|
Indonesia
|
7
|
|
||||
|
AirBridge Cargo
(2)
|
Russia
|
2
|
|
||||
|
Jeju Air
|
South Korea
|
7
|
|
||||
|
SpiceJet
|
India
|
8
|
|
||||
|
Asiana Airlines
|
South Korea
|
6
|
|
||||
|
Thai Airways
|
Thailand
|
2
|
|
||||
|
Total top 15 customers
|
139
|
|
|||||
|
All other customers
|
139
|
|
|||||
|
Total all customers
|
278
|
|
|||||
|
(1)
|
If combined with four aircraft on lease to an affiliate, would represent over 4% of net book value.
|
|
(2)
|
Guaranteed by Volga-Dnepr Airlines. We have one additional aircraft on lease with an affiliate.
|
Finance
Aircastle Limited is a publicly-listed company, and our shares have been trading on the NYSE since August 2006. Since our inception in late 2004, we raised $1.69 billion in equity capital from private and public investors. We also obtained $16.90 billion in debt capital from a variety of sources including export credit agency-backed debt, commercial bank debt, the aircraft securitization markets and the unsecured bond market. The diversity and global nature of our financing sources demonstrates our ability to adapt to changing market conditions and seize new growth opportunities.
We intend to fund new investments through cash on hand, funds generated from operations, maintenance payments received from lessees, secured borrowings for aircraft, draws on our revolving credit facilities and proceeds from any future aircraft sales. We may repay all or a portion of such borrowings from time to time with the net proceeds from subsequent long-term debt financings, additional equity offerings or cash generated from operations and asset sales. Therefore, our ability to execute our business strategy, particularly the acquisition of additional commercial jet aircraft or other aviation assets, depends to a significant degree on our ability to obtain additional debt and equity capital on terms we deem attractive.
See “Liquidity and Capital Resources — Secured Debt Financings” and “Liquidity and Capital Resources — Unsecured Debt Financings” below.
44
Comparison of the year ended
December 31, 2019
to the year ended
December 31, 2018
:
|
|
Year Ended December 31,
|
||||||
|
|
2019
|
2018
|
|||||
|
|
(Dollars in thousands)
|
||||||
|
Revenues:
|
|||||||
|
Lease rental revenue
|
$
|
777,403
|
|
$
|
722,694
|
|
|
|
Direct financing and sales-type lease revenue
|
32,295
|
|
35,132
|
|
|||
|
Amortization of lease premiums, discounts and incentives
|
(22,636
|
)
|
(15,269
|
)
|
|||
|
Maintenance revenue
|
74,987
|
|
105,738
|
|
|||
|
Total lease revenue
|
862,049
|
|
848,295
|
|
|||
|
Gain on sale of flight equipment
|
45,532
|
|
36,766
|
|
|||
|
Other revenue
|
10,357
|
|
5,290
|
|
|||
|
Total revenues
|
917,938
|
|
890,351
|
|
|||
|
Operating expenses:
|
|||||||
|
Depreciation
|
356,021
|
|
310,850
|
|
|||
|
Interest, net
|
258,070
|
|
234,504
|
|
|||
|
Selling, general and administrative
|
77,034
|
|
76,025
|
|
|||
|
Impairment of flight equipment
|
7,404
|
|
—
|
|
|||
|
Maintenance and other costs
|
24,828
|
|
8,961
|
|
|||
|
Total operating expenses
|
723,357
|
|
630,340
|
|
|||
|
Other income (expense)
|
|||||||
|
Loss on extinguishment of debt
|
(7,577
|
)
|
—
|
|
|||
|
Other
|
(11,864
|
)
|
1,636
|
|
|||
|
Total other income (expense)
|
(19,441
|
)
|
1,636
|
|
|||
|
Income from continuing operations before income taxes
|
175,140
|
|
261,647
|
|
|||
|
Income tax provision
|
22,667
|
|
5,642
|
|
|||
|
Earnings (loss) of unconsolidated equity method investment, net of tax
|
4,102
|
|
(8,086
|
)
|
|||
|
Net income
|
$
|
156,575
|
|
$
|
247,919
|
|
|
Revenues:
Total revenues increased by
$27.6 million
, for the year ended
December 31, 2019
as compared to the year ended
December 31, 2018
, primarily as a result of the following:
Lease rental revenue
increased by
$54.7 million
for the year ended
December 31, 2019
, primarily as a result of a $163.2 million increase in revenue reflecting the partial year impact of 48 aircraft purchased in
2019
and the full year impact of 37 aircraft purchased in
2018
. This increase was partially offset by:
|
•
|
a $74.2 million decrease due to lease extensions, amendments, transitions and other changes ($38.3 million of which is attributable to aircraft previously on lease to Avianca Brazil and Jet Airways which we have since transitioned to new lessees); and
|
|
•
|
a $34.2 million decrease due to the sale of 25 aircraft during
2019
and
2018
.
|
Direct financing and sales-type lease revenue.
For the year ended
December 31, 2019
,
$32.3 million
of interest income from direct financing and sales-type leases was recognized as compared to
$35.1 million
for the same period in
2018
, primarily attributable to the termination of one lease in
2018
and sales of two aircraft in
2019
, as well as a lower average net investment due to lease payments, partially offset by an increase in interest income related to the reclassification of two aircraft from operating to direct financing and sales-type leases in
2019
.
45
Amortization of lease premiums, discounts and incentives.
|
|
Year Ended December 31,
|
||||||
|
|
2019
|
2018
|
|||||
|
|
(Dollars in thousands)
|
||||||
|
Amortization of lease premiums
|
$
|
(16,719
|
)
|
$
|
(12,064
|
)
|
|
|
Amortization of lease discounts
|
4,406
|
|
7,825
|
|
|||
|
Amortization of lease incentives
|
(10,323
|
)
|
(11,030
|
)
|
|||
|
Amortization of lease premiums, discounts and incentives
|
$
|
(22,636
|
)
|
$
|
(15,269
|
)
|
|
The increase in amortization of lease premiums of $4.7 million for the year ended
December 31, 2019
as compared to the same period in
2018
, was due to a net increase in amortization resulting from net aircraft acquisitions.
The decrease in amortization of lease discounts of $3.4 million for the year ended
December 31, 2019
as compared to the same period in
2018
was primarily due to fully amortized lease discounts for aircraft that transitioned to new lessees or extended.
Maintenance revenue.
For the year ended
December 31, 2019
, we recorded
$75.0 million
of maintenance revenue primarily attributable to sixteen narrow-body and four wide-body aircraft that transitioned due to scheduled lease expirations or early lease terminations, including seven narrow-body aircraft that had early lease terminations with Jet Airways. For the same period in
2018
, we recorded
$105.7 million
of maintenance revenue due to the transition of eighteen narrow-body aircraft, three wide-body aircraft and one freighter aircraft, including ten narrow-body and one wide-body aircraft due to early lease terminations with Avianca Brazil.
Gain on sale of flight equipment
increased by
$8.8 million
, to
$45.5 million
for the year ended
December 31, 2019
, as compared to gains of
$36.8 million
for the same period in
2018
. During
2019
, we sold twenty aircraft as compared to the sale of fourteen aircraft during the same period in
2018
.
Other revenue
was
$10.4 million
during the year ended
December 31, 2019
, due to $5.4 million in fees earned in relation to the sale of all eight aircraft in our Lancaster joint venture, $2.0 million in fees earned from the sale of four aircraft to our IBJ joint venture and $2.0 million in administrative fees from the Lancaster and IBJ Air joint ventures. For the year ended
December 31, 2018
, other revenue was
$5.3 million
, primarily due to $2.6 million in fees earned in connection with the early termination of two leases and $2.1 million in administrative fees from the Lancaster and IBJ Air joint ventures.
Operating Expenses:
Total operating expenses increased by
$93.0 million
, for the year ended
December 31, 2019
as compared to the year ended
December 31, 2018
, primarily as a result of:
Depreciation expense
increased by
$45.2 million
for the year ended
December 31, 2019
over the same period in
2018
, primarily as a result of higher depreciation of $60.7 million due to 85 aircraft acquired during
2019
and
2018
. These increases were partially offset by a decrease of $16.5 million resulting from 26 aircraft sold during
2019
and
2018
.
46
Interest, net
consisted of the following:
|
|
Year Ended December 31,
|
||||||
|
|
2019
|
2018
|
|||||
|
|
(Dollars in thousands)
|
||||||
|
Interest on borrowings, net settlements on interest rate derivatives, and other liabilities
(1)
|
$
|
245,673
|
|
$
|
221,987
|
|
|
|
Amortization of deferred losses related to interest rate derivatives
|
184
|
|
1,166
|
|
|||
|
Amortization of deferred financing fees and debt discount
(2)
|
14,578
|
|
14,627
|
|
|||
|
Interest expense
|
260,435
|
|
237,780
|
|
|||
|
Less: Interest income
|
(2,365
|
)
|
(2,943
|
)
|
|||
|
Less: Capitalized interest
|
—
|
|
(333
|
)
|
|||
|
Interest, net
|
$
|
258,070
|
|
$
|
234,504
|
|
|
______________
|
(1)
|
Included a loan termination gain of
$0.8 million
related to the sale of aircraft during the year ended
December 31, 2018
.
|
|
(2)
|
Included $0.2 million and
$0.3 million
in deferred financing fees written off related to the sale of aircraft during the years ended
December 31, 2019
and
2018
, respectively.
|
Interest, net increased by
$23.6 million
over the year ended
December 31, 2018
. The net increase was primarily a result of a $23.7 million increase in interest on borrowings due to higher weighted average debt outstanding, partially offset by lower weighted average interest rates and lower amortization of deferred losses on terminated interest rate derivatives of $1.0 million.
Impairment of aircraft.
We recorded impairment charges of
$7.4 million
during
2019
.
No impairments were recorded during the year ended
December 31, 2018
. See “Summary of Recoverability Assessment and Other Impairments” below for a detailed discussion of impairment charges related to certain aircraft.
Maintenance and other
costs were
$24.8 million
for the year ended
December 31, 2019
, an increase of
$15.9 million
over the same period in
2018
. The net increase is primarily attributable to eighteen unscheduled transitions due to early lease terminations related to Avianca Brazil and Jet Airways and higher than projected lessor contributions towards the cost of maintenance events for aircraft acquired with attached leases of $3.8 million.
Other Income
:
Total other income (expense)
decreased by
$21.1 million
for the year ended
December 31, 2019
, as compared to the same period in
2018
, due to a loss on extinguishment of debt of $7.6 million related to the early retirement of our 6.25% Senior Notes due 2019, expenses of $7.4 million related to the Merger and unfavorable mark-to-market adjustments on our interest rate caps of $4.8 million.
Income Tax Provision
:
Our provision for income taxes for the years ended
December 31, 2019
and
2018
was
$22.7 million
and
$5.6 million
, respectively. Income taxes have been provided based on the applicable tax laws and rates of those countries in which operations are conducted and income is earned, primarily Ireland and the United States. The increase in our income tax provision of
$17.0 million
for the year ended
December 31, 2019
as compared to the same period in
2018
was primarily attributable to changes in operating income subject to tax in Ireland, the United States and other jurisdictions. The year ended
December 31, 2019
includes tax charges of $4.1 million related to the limitation in deductible compensation and $0.4 million related to the vesting of stock. The year ended
December 31, 2018
included a $3.0 million tax benefit related to the Singapore rate reduction from 10% to 8%.
Earnings (Loss) of Unconsolidated Equity Method Investment, net of Tax:
Earnings from unconsolidated equity method investment, net of tax, was $4.1 million in
2019
compared to a loss of $8.1 million in
2018
. In
2018
, the majority shareholder of one of our joint ventures, Lancaster Aircraft Leasing (“Lancaster”) stated its intention to liquidate all assets in the joint venture. The equity loss for the year ended
December 31, 2018
relates
47
to our share of undistributed losses and anticipated costs recorded by Lancaster for this liquidation. See Note 5 “Unconsolidated Equity Method Investment.”
Other Comprehensive Income
:
|
|
Year Ended December 31,
|
||||||
|
|
2019
|
2018
|
|||||
|
|
(Dollars in thousands)
|
||||||
|
Net income
|
$
|
156,575
|
|
$
|
247,919
|
|
|
|
Derivative loss reclassified into earnings
|
184
|
|
1,166
|
|
|||
|
Total comprehensive income
|
$
|
156,759
|
|
$
|
249,085
|
|
|
Other comprehensive income was
$156.8 million
for the year ended
December 31, 2019
, a decrease of $92.3 million from the
$249.1 million
of other comprehensive income for the year ended
December 31, 2018
. Other comprehensive income for the year ended
December 31, 2019
primarily consisted of
$156.6 million
of net income and $0.2 million of amortization of deferred net losses reclassified into earnings primarily related to terminated interest rate derivatives.
Other comprehensive income for the year ended
December 31, 2018
primarily consisted of
$247.9 million
of net income and $1.2 million of amortization of deferred net losses reclassified into earnings primarily related to terminated interest rate derivatives.
Summary of Recoverability Assessment and Other Impairments
Transactional Impairments
During
2019
, the Company early terminated the leases for seven Boeing 737NG aircraft on lease to Jet Airways (India) Limited (“Jet Airways”) due to lessee default. As a result of these lease terminations, the Company recognized net maintenance revenue of $17.6 million and impairment charges of $7.4 million. We did not record any transactional impairments during
2018
.
Annual Recoverability Assessment
We completed our annual recoverability assessment of our aircraft in the second quarter of
2019
. We also performed aircraft-specific analyses where there were changes in circumstances, such as approaching lease expirations. No impairments were recorded as a result of our annual recoverability assessment.
The recoverability assessment is a comparison of the carrying value of each aircraft to its undiscounted expected future cash flows. We develop the assumptions used in the recoverability assessment, including those relating to current and future demand for each aircraft type, based on management’s experience in the aircraft leasing industry, as well as information received from third-party sources. Estimates of the undiscounted cash flows for each aircraft type are impacted by changes in contracted and future expected lease rates, residual values, expected scrap values, economic conditions and other factors.
Management believes that the net book value of each aircraft is currently supported by the estimated future undiscounted cash flows expected to be generated by that aircraft, and accordingly, no aircraft were impaired as a consequence of our annual recoverability assessment. However, if our estimates or assumptions change, we may revise our cash flow assumptions and record future impairment charges. While we believe that the estimates and related assumptions used in the annual recoverability assessment are appropriate, actual results could differ from those estimates.
Aircraft Monitoring List
At
December 31, 2019
, no aircraft were on our monitoring list. We monitor our fleet for aircraft that are more susceptible to failing our recoverability assessments within one year due to their sensitivity to changes in contractual cash flows, future cash flow estimates and aircraft residual or scrap values.
48
Comparison of the year ended December 31, 2018 to the year ended December 31, 2017:
We have omitted discussion of the earliest of the three years covered by our consolidated financial statements presented in this Annual Report because that disclosure was already included in our Annual Report on Form 10-K for the fiscal year ended December 31, 2018, filed with the SEC on February 12, 2019. You are encouraged to reference Part II, Item 7, within that report, for a discussion of our financial condition and result of operations for the year ended December 31, 2018 to the year ended December 31, 2017.
49
APPLICATION OF CRITICAL ACCOUNTING POLICIES AND ESTIMATES
Management’s discussion and analysis of financial condition and results of operations is based upon our consolidated financial statements, which have been prepared in accordance with U.S. GAAP, which requires us to make estimates and assumptions that affect the amounts reported in the consolidated financial statements and accompanying footnotes. Our estimates and assumptions are based on historical experiences and currently available information. Actual results may differ from such estimates under different conditions, sometimes materially. A summary of our significant accounting policies is presented in the notes to our consolidated financial statements included elsewhere in this Annual Report. Critical accounting policies and estimates are defined as those that are both most important to the portrayal of our financial condition and results and require our most subjective judgments, estimates and assumptions. Our most critical accounting policies and estimates are described below.
Lease Revenue Recognition
Our operating lease rentals are recognized on a straight-line basis over the term of the lease. We will neither recognize revenue nor record a receivable from a customer when collectability is not probable. Estimating whether collectability is probable requires some level of subjectivity and judgment. When collectability is not probable, the customer is placed on non-accrual status and revenue is recognized when cash payments are received. Management determines whether customers should be placed back on accrual status when it becomes probable that payments will be received in a timely manner. The accrual/non-accrual status of a customer is maintained at a level deemed appropriate based on factors such as the customer’s credit rating, payment performance, financial condition and requests for modifications of lease terms and conditions. Events or circumstances outside of historical customer patterns can also result in changes to a customer’s accrual status.
Maintenance Payments and Maintenance Revenue
Under our leases, the lessee must pay operating expenses accrued or payable during the term of the lease, which would normally include maintenance, overhaul, fuel, crew, landing, airport and navigation charges; certain taxes, licenses, consents and approvals; aircraft registration; and insurance premiums. Typically, our aircraft are subject to net operating leases whereby the lessee pays lease rentals and is generally responsible for maintaining the aircraft and paying operational, maintenance and insurance costs, although in a majority of cases, we are obligated to pay a portion of specified maintenance or modification costs. Our aircraft lease agreements generally provide for the periodic payment of a fixed amount of rent over the life of the lease, and the amount of the contracted rent will depend upon the type, age, specification and condition of the aircraft and market conditions at the time the lease is committed. The amount of rent we receive will depend on a number of factors, including the creditworthiness of our lessees and the occurrence of delinquencies, restructurings and defaults. Our lease rental revenues are also affected by the extent to which aircraft are off-lease and our ability to remarket aircraft that are nearing the end of their leases in order to minimize their off-lease time. Our success in re-leasing aircraft is affected by market conditions relating to our aircraft and by general industry conditions and trends. An increase in the percentage of off-lease aircraft or a reduction in lease rates upon remarketing would negatively impact our revenues.
Under an operating lease, the lessee will be responsible for performing maintenance on the relevant aircraft and will typically be required to make payments to us for heavy maintenance, overhaul or replacement of certain high-value components of the aircraft. These maintenance payments are based on hours or cycles of utilization or on calendar time, depending upon the component, and would be made either monthly in arrears or at the end of the lease term. For maintenance payments made monthly in arrears during a lease term, we will typically be required to reimburse all or a portion of these payments to the lessee upon completion of the relevant heavy maintenance, overhaul or parts replacement. We record maintenance payments paid by the lessee during a lease as accrued maintenance liabilities in recognition of our obligation in the lease to refund such payments, and therefore we typically do not recognize maintenance revenue during the lease. Maintenance revenue recognition would occur at the end of a lease, when we are able to determine the amount, if any, by which reserve payments received exceed the amount we are required under the lease to reimburse to the lessee for heavy maintenance, overhaul or parts replacement. If a lease requires end of lease term maintenance payments, typically the lessee would be required to pay us for its utilization of the aircraft during the lease; however, in some cases, we may owe a net payment to the lessee in the event heavy maintenance is performed and paid for by the lessee during the lease term and the aircraft is returned to us in better condition than at lease inception. End of lease term maintenance payments made to us are recognized as maintenance revenue, and end of lease term maintenance payments we make to a lessee are recorded as contra maintenance revenue.
50
The amount of maintenance revenue or contra maintenance revenue we recognize in any reporting period is inherently volatile and is dependent upon a number of factors, including the timing of lease expiries, including scheduled and unscheduled expiries, the timing of maintenance events and the utilization of the aircraft by the lessee.
Lease Incentives and Amortization
Many of our leases contain provisions which may require us to pay a portion of the lessee’s costs for heavy maintenance, overhaul or replacement of certain high-value components. We account for these expected payments as lease incentives, which are amortized as a reduction of revenue over the life of the lease. We estimate the amount of our portion for such costs, typically for the first major maintenance event for the airframe, engines, landing gear and auxiliary power units, expected to be paid to the lessee based on assumed utilization of the related aircraft by the lessee, the anticipated cost of the maintenance event and the estimated amounts the lessee is responsible to pay. The assumptions supporting these estimates are re-evaluated annually.
This estimated lease incentive is not recognized as a lease incentive liability at the inception of the lease. We recognize the lease incentive as a reduction of lease revenue on a straight-line basis over the life of the lease, with the offset being recorded as a lease incentive liability, which is included in maintenance payments on the balance sheet. The payment to the lessee for the lease incentive liability is first recorded against the lease incentive liability, and any excess above the lease incentive liability is recorded as a prepaid lease incentive asset, which is included in other assets on the balance sheet and continues to amortize over the remaining life of the lease.
Flight Equipment Held for Lease and Depreciation
Flight equipment held for lease is stated at cost and depreciated using the straight-line method, typically over a 25-year life from the date of manufacture for passenger aircraft and over a 30 to 35-year life for freighter aircraft, depending on whether the aircraft is a converted or purpose-built freighter, to estimated residual values. Estimated residual values are generally determined to be approximately 15% of the manufacturer’s estimated realized price for passenger aircraft when new and 5% to 10% for freighter aircraft when new. Management may make exceptions to this policy on a case-by-case basis when, in its judgment, the residual value calculated pursuant to this policy does not appear to reflect current expectations of value. Examples of situations where exceptions may arise include but are not limited to:
|
•
|
flight equipment where estimates of the manufacturers’ realized sales prices are not relevant (e.g., freighter conversions);
|
|
•
|
flight equipment where estimates of the manufacturers’ realized sales prices are not readily available; and
|
|
•
|
flight equipment which may have a shorter useful life due to obsolescence.
|
In accounting for flight equipment held for lease, we make estimates about the expected useful lives, the fair value of attached leases, acquired maintenance assets or liabilities and the estimated residual values. In making these estimates, we rely upon actual industry experience with the same or similar aircraft types and our anticipated utilization of the aircraft. As part of our due diligence review of each aircraft we purchase, we prepare an estimate of the expected maintenance payments and any excess costs which may become payable by us, taking into consideration the then-current maintenance status of the aircraft and the relevant provisions of any existing lease.
For planned major maintenance activities for aircraft off-lease, the Company capitalizes the actual maintenance costs by applying the deferral method. Under the deferral method, we capitalize the actual cost of major maintenance events, which are depreciated on a straight-line basis over the period until the next maintenance event is required.
For purchase and lease back transactions, we account for the transaction as a single arrangement. We allocate the consideration paid based on the fair value of the aircraft and lease. The fair value of the lease may include a maintenance premium and a lease premium or discount.
When we acquire an aircraft with a lease, determining the fair value of the attached lease requires us to make assumptions regarding the current fair values of leases for specific aircraft. We estimate a range of current lease rates of like aircraft in order to determine if the attached lease is within a fair value range. If a lease is below or above the range of current lease rates, we present value the estimated amount below or above fair value range over the remaining term of the lease. The resulting lease discount or premium is amortized into lease rental income over the remaining term of the lease.
51
Impairment of Flight Equipment
We perform a recoverability assessment of all aircraft in our fleet, on an aircraft-by-aircraft basis, at least annually. In addition, a recoverability assessment is performed whenever events or changes in circumstances, or indicators, indicate that the carrying amount or net book value of an asset may not be recoverable. Indicators may include, but are not limited to, a significant lease restructuring or early lease termination, significant air traffic decline, the introduction of newer technology aircraft or engines, an aircraft type is no longer in production or a significant airworthiness directive is issued. When we perform a recoverability assessment, we measure whether the estimated future undiscounted net cash flows expected to be generated by the aircraft exceed its net book value. The undiscounted cash flows consist of cash flows from currently contracted leases, future projected lease rates, transition costs, estimated down time and estimated residual or scrap values for an aircraft. In the event that an aircraft does not meet the recoverability test, the aircraft will be adjusted to fair value, resulting in an impairment charge.
Management develops the assumptions used in the recoverability analysis based on current and future expectations of the global demand for a particular aircraft type and historical experience in the aircraft leasing market and aviation industry, as well as information received from third party industry sources. The factors considered in estimating the undiscounted cash flows are impacted by changes in future periods due to changes in contracted lease rates, residual values, economic conditions, technology, airline demand for a particular aircraft type and other risk factors discussed in Item 1A. “Risk Factors.” See further discussion of our aircraft more susceptible to failing our recoverability assessment under “Summary of Recoverability Assessment and Other Impairments” above and “Fair Value Measurements” below.
Net Investment in Direct Financing and Sales-Type Leases
If a lease meets specific criteria at lease commencement or at the effective date of a lease modification, we recognize the lease as a direct financing or sales-type lease. The net investment in direct financing and sales-type leases consists of the lease receivable, estimated unguaranteed residual value of the leased flight equipment at lease-end and, for direct financing leases, deferred selling profit. For sales-type leases, we recognize the difference between the net book value of the aircraft and the net investment in the lease as a gain or loss on sale of fight equipment. Selling profit on a direct financing lease is deferred and amortized over the lease term, and a selling loss is recognized at lease commencement. Interest income on our net investment in leases is recognized as Direct financing and sales-type lease revenue over the lease term in a manner that produces a constant rate of return on the net investment in the lease.
Collectability of direct financing and sales-type leases is evaluated at lease commencement and periodically during the lease term. The evaluation is performed at an individual customer level and, among other things, considers the credit of the lessee and the value of the underlying aircraft. A loss allowance is established if there is evidence that we will be unable to collect all amounts due according to the contractual terms of the lease. At December 31, 2019, we had no allowance for credit losses for our Net investment in direct financing and sales-type leases.
Fair Value Measurements
We measure the fair value of certain assets and liabilities on a non-recurring basis, when U.S. GAAP requires the application of fair value, including events or changes in circumstances that indicate that the carrying amounts of assets may not be recoverable. Assets subject to these measurements include our aircraft and unconsolidated equity investments. We record aircraft at fair value when we determine the carrying value may not be recoverable. Fair value measurements for aircraft in impairment tests are based on an income approach that uses Level 3 inputs, which include our assumptions and appraisal data as to future cash proceeds from leasing and selling aircraft. We account for our investments in unconsolidated joint ventures under the equity method of accounting and record impairment when its fair value value is less than its carrying value and the Company determines that the decline is other-than-temporary.
Income Taxes
The Company records an income tax provision in accordance with the various tax laws for those jurisdictions within which our transactions occur. Aircastle uses an asset and liability based approach in accounting for income taxes. Deferred income tax assets and liabilities are recognized for the future tax consequences attributed to differences between the financial statement and tax basis of existing assets and liabilities using enacted rates applicable to the periods in which the differences are expected to affect taxable income. A valuation allowance is established, when necessary, to reduce deferred tax assets to the amount estimated by us to be realizable. The Company recognizes the tax benefit from an uncertain tax position only
52
if it is more likely than not that the tax position will be sustained upon examination by the taxing authorities. We did not have any unrecognized tax benefits.
RECENTLY ADOPTED ACCOUNTING PRONOUNCEMENTS
See Note 1 - Summary of Significant Accounting Policies - Organization and Basis of Presentation in the Notes to Consolidated Financial Statements below.
RECENTLY PROPOSED ACCOUNTING PRONOUNCEMENTS
See Note 1 - Summary of Significant Accounting Policies - Proposed Accounting Pronouncements in the Notes to Consolidated Financial Statements below.
LIQUIDITY AND CAPITAL RESOURCES
Our business is very capital intensive, requiring significant investments in order to expand our fleet and to maintain and improve our existing portfolio. Our operations generate a significant amount of cash, primarily from lease rentals and maintenance collections. We have also met our liquidity and capital resource needs by utilizing several sources over time, including:
|
•
|
various forms of borrowing secured by our aircraft, including bank term facilities, limited recourse securitization financings, and ECA-backed financings for new aircraft acquisitions;
|
|
•
|
unsecured indebtedness, including our current unsecured revolving credit facilities, term loan and senior notes;
|
|
•
|
asset sales; and
|
|
•
|
sales of common shares.
|
Going forward, we expect to continue to seek liquidity from these sources and other sources, subject to pricing and conditions we consider satisfactory.
During
2019
, we met our liquidity and capital resource needs with
$536.4 million
of cash flow from operations,
$2.12 billion
in gross proceeds from the issuance of our Senior Notes due 2026, bank debt and our revolving credit facilities and
$361.7 million
of cash from aircraft sales.
As of
December 31, 2019
, the weighted average maturity of our secured and unsecured debt financings was 3.4 years and we are in compliance with all applicable covenants in our financings. We have also determined that as of
December 31, 2019
, our consolidated subsidiaries’ restricted net assets, as defined by Rule 4-08(e)(3) of Regulation S-X, are less than 25% of our consolidated net assets.
We believe that cash on hand, payments received from lessees and other funds generated from operations, unsecured bond offerings, secured borrowings for aircraft, borrowings under our revolving credit facilities and other borrowings and proceeds from future aircraft sales will be sufficient to satisfy our liquidity and capital resource needs over the next twelve months. Our liquidity and capital resource needs include payments due under our aircraft purchase obligations, required principal and interest payments under our long-term debt facilities, expected capital expenditures, lessee maintenance payment reimbursements and lease incentive payments over the next twelve months.
53
Cash Flows
|
Year Ended December 31,
|
|||||||
|
2019
|
2018
|
||||||
|
|
(Dollars in thousands)
|
||||||
|
Net cash flow provided by operating activities
|
$
|
536,418
|
|
$
|
522,592
|
|
|
|
Net cash flow used in investing activities
|
(784,029
|
)
|
(974,687
|
)
|
|||
|
Net cash flow provided by (used in) financing activities
|
235,201
|
|
386,091
|
|
|||
Operating Activities:
Cash flow provided by operations was
$536.4 million
and
$522.6 million
for the years ended
December 31, 2019
and
2018
, respectively. The increase in cash flow provided by operations of
$13.8 million
for the year ended
December 31, 2019
versus the same period in
2018
was primarily a result of:
|
•
|
a $39.0 million increase in cash from lease rentals, net of direct financing and sales-type leases,
|
|
•
|
a $25.8 million increase in collections from direct financing and sales-type leases (please refer to Note 1);
|
|
•
|
a $6.9 million decrease in cash paid for taxes; and
|
|
•
|
a $5.1 million increase in cash related to fees from our joint ventures.
|
These inflows were offset by a:
|
•
|
a $31.7 million increase in in cash paid for interest;
|
|
•
|
a $22.2 million decrease in cash from working capital; and
|
|
•
|
a $15.9 million increase in cash paid for maintenance.
|
Investing Activities
:
Cash flow used in investing activities was
$784.0 million
and
$974.7 million
for the years ended
December 31, 2019
and
2018
, respectively. The decrease in cash flow used in investing activities of
$190.7 million
for the year ended
December 31, 2019
was primarily a result of:
|
•
|
a $160.9 million decrease in the acquisition and improvement of flight equipment and net investment in direct financing and sales-type leases;
|
|
•
|
a $32.9 million increase in distribution from our Lancaster joint venture;
|
|
•
|
a $22.9 million increase in proceeds from the sale of flight equipment; and
|
|
•
|
a $16.3 million decrease in a
ircraft purchase deposits and progress payments, net of returned deposits.
|
These decreases were offset by a $30.0 million decrease in collections on direct financing and sales-type leases (please refer to Note 1) and an $11.8 million increase in our investments in our IBJ joint venture for the purchase of aircraft.
Financing Activities
:
Cash flow provided by financing activities was
$235.2 million
and
$386.1 million
for the years ended
December 31, 2019
and
2018
, respectively. The decrease in cash flow provided by financing activities of
$150.9 million
for the year ended
December 31, 2019
was primarily a result:
|
•
|
a $848.4 million increase in repayments of secured and unsecured financings;
|
|
•
|
a $28.2 million increase in maintenance and security deposits returned, net of deposits received; and
|
|
•
|
a $7.2 million increase in debt extinguishment costs.
|
These outflows were offset by a $702.9 million increase in proceeds from secured and unsecured financings and a $34.7 million decrease in shares repurchased.
54
Debt Obligations
For complete information on our debt obligations, please refer to Note 7 - “Borrowings from Secured and Unsecured Debt” Financings in the Notes to Consolidated Financial Statements below.
Contractual Obligations
Our contractual obligations consist of principal and interest payments on variable and fixed rate liabilities, interest payments on interest rate derivatives, aircraft acquisitions and rent payments pursuant to our office leases. Total contractual obligations increased to approximately
$7.03 billion
at
December 31, 2019
from $6.95 billion at
December 31, 2018
due to an increase in borrowings, partially offset by a decrease in aircraft purchase obligations.
The following table presents our actual contractual obligations and their payment due dates as of
December 31, 2019
.
|
|
Payments Due by Period as of December 31, 2019
|
||||||||||||||||||
|
Contractual Obligations
|
Total
|
1 year
or less
|
2-3 years
|
4-5 years
|
More than
5 years
|
||||||||||||||
|
|
(Dollars in thousands)
|
||||||||||||||||||
|
Principal payments:
|
|||||||||||||||||||
|
Senior Notes due 2020-2026
|
$
|
3,600,000
|
|
$
|
300,000
|
|
$
|
1,000,000
|
|
$
|
1,650,000
|
|
$
|
650,000
|
|
||||
|
DBJ Term Loan
|
215,000
|
|
—
|
|
60,000
|
|
155,000
|
|
—
|
|
|||||||||
|
Revolving Credit Facilities
|
150,000
|
|
—
|
|
150,000
|
|
—
|
|
—
|
|
|||||||||
|
ECA Financings
|
147,644
|
|
39,603
|
|
79,280
|
|
28,761
|
|
—
|
|
|||||||||
|
Bank Financings
|
993,593
|
|
89,721
|
|
184,984
|
|
565,962
|
|
152,926
|
|
|||||||||
|
Total principal payments
|
5,106,237
|
|
429,324
|
|
1,474,264
|
|
2,399,723
|
|
802,926
|
|
|||||||||
|
Interest payments on debt obligations
(1)
|
799,664
|
|
234,627
|
|
348,724
|
|
172,643
|
|
43,670
|
|
|||||||||
|
Office leases
(2)
|
15,117
|
|
1,870
|
|
3,712
|
|
3,423
|
|
6,112
|
|
|||||||||
|
Purchase obligations
(3)
|
1,112,825
|
|
218,916
|
|
700,930
|
|
192,979
|
|
—
|
|
|||||||||
|
Total
|
$
|
7,033,843
|
|
$
|
884,737
|
|
$
|
2,527,630
|
|
$
|
2,768,768
|
|
$
|
852,708
|
|
||||
|
(1)
|
Future interest payments on variable rate, LIBOR-based debt obligations are estimated using the interest rate in effect at
December 31, 2019
.
|
|
(2)
|
Represents contractual payment obligations for our office leases in Stamford, Connecticut; Dublin, Ireland and Singapore.
|
|
(3)
|
At
December 31, 2019
, we had commitments to acquire
31
aircraft for
$1.11 billion
, including 25 new E-Jet E2 aircraft from Embraer S.A. These amounts include estimates for pre-delivery deposits, contractual price escalation and other adjustments. As of
February 10, 2020
, we have commitments to acquire
31
aircraft for
$1.11 billion
.
|
Capital Expenditures
From time to time, we make capital expenditures to maintain or improve our aircraft. These expenditures include the cost of major overhauls necessary to place an aircraft in service and modifications made at the request of lessees. For the years ended
December 31, 2019
,
2018
and
2017
, we incurred a total of $31.8 million, $9.3 million and $12.9 million, respectively, of capital expenditures (including lease incentives) related to the acquisition and improvement of aircraft.
As of
December 31, 2019
, the weighted average age (by net book value) of our aircraft was
9.9
years. In general, the costs of operating an aircraft, including maintenance expenditures, increase with the age of the aircraft. Our lease agreements call for the lessee to be primarily responsible for maintaining the aircraft. We may incur additional maintenance and modification costs in the future in the event we are required to remarket an aircraft or a lessee fails to meet its maintenance obligations under the lease agreement. These maintenance reserves are paid by the lessee to provide for future maintenance events. Provided a lessee performs scheduled maintenance of the aircraft, we are required to reimburse the lessee for scheduled maintenance payments. In certain cases, we are also required to make lessor contributions, in excess of amounts a lessee may have paid, towards the costs of maintenance events performed by or on behalf of the lessee.
Actual maintenance payments to us by lessees in the future may be less than projected as a result of a number of factors, including defaults by the lessees. Maintenance reserves may not cover the entire amount of actual maintenance
55
expenses incurred and, where these expenses are not otherwise covered by the lessees, there can be no assurance that our operational cash flow and maintenance reserves will be sufficient to fund maintenance requirements, particularly as our aircraft age. See Item 1A. “Risk Factors — Risks Related to Our Business — Risks related to our leases —
If lessees are unable to fund their maintenance obligations on our aircraft, we may incur increased costs at the conclusion of the applicable lease
.”
Off-Balance Sheet Arrangements
We entered into two joint venture arrangements in order to help expand our base of new business opportunities. Neither of these joint ventures qualifies for consolidated accounting treatment. The assets and liabilities of these entities are not included in our Consolidated Balance Sheets and we record our net investment under the equity method of accounting. See Note 5 - “Unconsolidated Equity Method Investment” in the Notes to Unaudited Consolidated Financial Statements below.
During the third quarter of 2019, the sale of all
eight
aircraft held by the joint venture with Teachers’ to a single buyer was completed. Teachers’, as majority shareholder, chose to liquidate the joint venture. As of December 31, 2019, minimal assets remain in the joint venture as needed to complete its liquidation during 2020.
We hold a
25%
equity interest in our joint venture with Mizuho Leasing, IBJ Air Leasing (“IBJ Air”). At
December 31, 2019
, the net book value of the IBJ Air joint venture’s
nine
aircraft was
$327.8 million
.
Foreign Currency Risk and Foreign Operations
At
December 31, 2019
all of our leases are payable to us in U.S. dollars. However, we incur Euro- and Singapore dollar-denominated expenses in connection with our subsidiaries in Ireland and Singapore. For the year ended
December 31, 2019
, expenses, such as payroll and office costs, denominated in currencies other than the U.S. dollar aggregated $15.7 million in U.S. dollar equivalents and represented 20% of total SG&A expenses. Our international operations are a significant component of our business strategy and permit us to more effectively source new aircraft, service the aircraft we own and maintain contact with our lessees. Therefore, it is likely that our international operations and our exposure to foreign currency risk will increase over time. Although we have not yet entered into foreign currency hedges because our exposure to date has not been significant, if our foreign currency exposure increases we may enter into hedging transactions in the future to mitigate this risk. For the years ended
December 31, 2019
,
2018
and
2017
, we incurred insignificant net gains and losses on foreign currency transactions.
Hedging
For complete information on our derivative instruments, please refer to Note 14 “Other Assets” in the Notes to Consolidated Financial Statements below.
Inflation
Inflation affects our lease rentals, asset values and costs, including SG&A expenses and other expenses. We do not believe that our financial results have been, or will be, adversely affected by inflation in a material way.
Management’s Use of EBITDA and Adjusted EBITDA
We define EBITDA as income (loss) from continuing operations before income taxes, interest expense, and depreciation and amortization. We use EBITDA to assess our consolidated financial and operating performance, and we believe this non-U.S. GAAP measure is helpful in identifying trends in our performance.
This measure provides an assessment of controllable expenses and affords management the ability to make decisions which are expected to facilitate meeting current financial goals, as well as achieving optimal financial performance. It provides an indicator for management to determine if adjustments to current spending decisions are needed.
EBITDA provides us with a measure of operating performance because it assists us in comparing our operating performance on a consistent basis as it removes the impact of our capital structure (primarily interest charges on our
56
outstanding debt) and asset base (primarily depreciation and amortization) from our operating results. Accordingly, this metric measures our financial performance based on operational factors that management can impact in the short-term, namely the cost structure, or expenses, of the organization. EBITDA is one of the metrics used by senior management and the Board of Directors to review the consolidated financial performance of our business.
We define Adjusted EBITDA as EBITDA (as defined above) further adjusted to give effect to adjustments required in calculating covenant ratios and compliance as that term is defined in the indenture governing our senior unsecured notes. Adjusted EBITDA is a material component of these covenants.
The table below shows the reconciliation of net income to EBITDA for the years ended
December 31, 2019
,
2018
and
2017
, respectively.
|
|
Year Ended December 31,
|
||||||||||
|
|
2019
|
2018
|
2017
|
||||||||
|
|
(Dollars in thousands)
|
||||||||||
|
Net income
|
$
|
156,575
|
|
$
|
247,919
|
|
$
|
147,874
|
|
||
|
Depreciation
|
356,021
|
|
310,850
|
|
298,664
|
|
|||||
|
Amortization of lease premiums, discounts and incentives
|
22,636
|
|
15,269
|
|
11,714
|
|
|||||
|
Interest, net
|
258,070
|
|
234,504
|
|
241,231
|
|
|||||
|
Income tax provision
|
22,667
|
|
5,642
|
|
6,042
|
|
|||||
|
EBITDA
|
$
|
815,969
|
|
$
|
814,184
|
|
$
|
705,525
|
|
||
|
Adjustments:
|
|||||||||||
|
Impairment of flight equipment
|
7,404
|
|
—
|
|
80,430
|
|
|||||
|
Equity share of joint venture impairment
|
2,724
|
|
15,791
|
|
—
|
|
|||||
|
Loss on extinguishment of debt
|
7,577
|
|
—
|
|
—
|
|
|||||
|
Non-cash share-based payment expense
|
15,830
|
|
11,488
|
|
13,148
|
|
|||||
|
Merger related expenses
(1)
|
7,886
|
|
—
|
|
—
|
|
|||||
|
Loss (gain) on mark-to-market of interest rate derivative contracts
|
4,771
|
|
(1,632
|
)
|
2,481
|
|
|||||
|
Adjusted EBITDA
|
$
|
862,161
|
|
$
|
839,831
|
|
$
|
801,584
|
|
||
|
(1)
|
Includes $7.4 million in Other income (expense) and $0.5 million in Selling, general and administrative expenses.
|
Management’s Use of Adjusted Net Income (“ANI”)
Management believes that Adjusted Net Income (“ANI”) when viewed in conjunction with the Company’s results under U.S. GAAP and the below reconciliation, provides useful information about operating and period-over-period performance, and provides additional information that is useful for evaluating the underlying operating performance of our business without regard to periodic reporting elements related to interest rate derivative accounting, changes related to refinancing activity, merger related expenses and non-cash share-based payment expense.
57
The table below shows the reconciliation of net income to ANI for the years ended
December 31, 2019
,
2018
and
2017
, respectively.
|
|
Year Ended December 31,
|
||||||||||
|
|
2019
|
2018
|
2017
|
||||||||
|
|
(Dollars in thousands)
|
||||||||||
|
Net income
|
$
|
156,575
|
|
$
|
247,919
|
|
$
|
147,874
|
|
||
|
Loss on extinguishment of debt
(1)
|
7,577
|
|
—
|
|
—
|
|
|||||
|
Loss (gain) on mark-to-market of interest rate derivative contracts
(1)
|
4,771
|
|
(1,632
|
)
|
2,481
|
|
|||||
|
Loan termination (gain) fee
(2)
|
—
|
|
(838
|
)
|
2,058
|
|
|||||
|
Write-off of deferred financing fees
(2)
|
172
|
|
300
|
|
4,005
|
|
|||||
|
Non-cash share-based payment expense
(3)
|
15,830
|
|
11,488
|
|
13,148
|
|
|||||
|
Merger related expenses and taxes
(4)
|
11,622
|
|
—
|
|
—
|
|
|||||
|
Adjusted net income
|
$
|
196,547
|
|
$
|
257,237
|
|
$
|
169,566
|
|
||
______________
|
(1)
|
Included in Other income (expense).
|
|
(2)
|
Included in Interest, net.
|
|
(3)
|
Included in Selling, general and administrative expenses.
|
|
(4)
|
Includes $7.4 million in Other income (expense), $3.7 million in Income tax provision and $0.5 million in Selling, general and administrative expenses.
|
|
|
Year Ended December 31,
|
|||||||
|
Weighted-average shares:
|
2019
|
2018
|
2017
|
|||||
|
Common shares outstanding
|
74,477,865
|
|
77,447,263
|
|
78,219,458
|
|
||
|
Restricted common shares
|
495,192
|
|
476,726
|
|
556,592
|
|
||
|
Total weighted-average shares
|
74,973,057
|
|
77,923,989
|
|
78,776,050
|
|
||
|
|
Year Ended December 31,
|
|||||||
|
Percentage of weighted-average shares:
|
2019
|
2018
|
2017
|
|||||
|
Common shares outstanding
|
99.34
|
%
|
99.39
|
%
|
99.29
|
%
|
||
|
Restricted common shares
(1)
|
0.66
|
%
|
0.61
|
%
|
0.71
|
%
|
||
|
Total
|
100.00
|
%
|
100.00
|
%
|
100.00
|
%
|
||
|
|
Year Ended December 31,
|
|||||||
|
|
2019
|
2018
|
2017
|
|||||
|
Weighted-average common shares outstanding — Basic
|
74,477,865
|
|
77,447,263
|
|
78,219,458
|
|
||
|
Effect of dilutive shares
(2)
|
904,417
|
|
301,356
|
|
153,983
|
|
||
|
Weighted-average common shares outstanding — Diluted
|
75,382,282
|
|
77,748,619
|
|
78,373,441
|
|
||
|
|
Year Ended December 31,
|
||||||||||
|
Adjusted net income allocation:
|
2019
|
2018
|
2017
|
||||||||
|
|
(Dollars in thousands, except per share amounts)
|
||||||||||
|
Adjusted net income
|
$
|
196,547
|
|
$
|
257,237
|
|
$
|
169,566
|
|
||
|
Less: Distributed and undistributed earnings allocated to restricted common shares
(1)
|
(1,298
|
)
|
(1,574
|
)
|
(1,198
|
)
|
|||||
|
Adjusted net income allocable to common shares — Basic and Diluted
|
$
|
195,249
|
|
$
|
255,663
|
|
$
|
168,368
|
|
||
|
Adjusted net income per common share — Basic
|
$
|
2.62
|
|
$
|
3.30
|
|
$
|
2.15
|
|
||
|
Adjusted net income per common share — Diluted
|
$
|
2.59
|
|
$
|
3.29
|
|
$
|
2.15
|
|
||
|
(1)
|
For the years ended
December 31, 2019
,
2018
and
2017
, distributed and undistributed earnings to restricted shares was
0.66%
,
0.61%
and
0.71%
, respectively, of net income. The amount of restricted share forfeitures for all periods presented was immaterial to the allocation of distributed and undistributed earnings.
|
|
(2)
|
For the years ended
December 31, 2019
,
2018
and
2017
, dilutive shares represented contingently issuable shares related to the Company’s Performance Share Units (“PSUs”).
|
58
Limitations of EBITDA, Adjusted EBITDA and ANI
An investor or potential investor may find EBITDA, Adjusted EBITDA and ANI important measures in evaluating our performance, results of operations and financial position. We use these non-U.S. GAAP measures to supplement our U.S. GAAP results in order to provide a more complete understanding of the factors and trends affecting our business.
EBITDA, Adjusted EBITDA and ANI have limitations as analytical tools and should not be viewed in isolation or as substitutes for U.S. GAAP measures of earnings (loss). Material limitations in making the adjustments to our earnings (loss) to calculate EBITDA, Adjusted EBITDA and ANI, and using these non-U.S. GAAP measures as compared to U.S. GAAP net income (loss), income (loss) from continuing operations and cash flows provided by or used in operations, include:
|
•
|
depreciation and amortization, though not directly affecting our current cash position, represent the wear and tear and/or reduction in value of our aircraft, which affects the aircraft’s availability for use and may be indicative of future needs for capital expenditures;
|
|
•
|
the cash portion of income tax (benefit) provision generally represents charges (gains), which may significantly affect our financial results;
|
|
•
|
elements of our interest rate derivative accounting may be used to evaluate the effectiveness of our hedging policy;
|
|
•
|
hedge loss amortization charges related to Term Financing No. 1 and Securitization No. 1; and
|
|
•
|
adjustments required in calculating covenant ratios and compliance as that term is defined in the indenture governing our senior unsecured notes.
|
EBITDA, Adjusted EBITDA and ANI are not alternatives to net income (loss), income (loss) from operations or cash flows provided by or used in operations as calculated and presented in accordance with U.S. GAAP. You should not rely on these non-U.S. GAAP measures as a substitute for any such U.S. GAAP financial measure. We strongly urge you to review the reconciliations to U.S. GAAP net income (loss), along with our consolidated financial statements included elsewhere in this Annual Report. We also strongly urge you to not rely on any single financial measure to evaluate our business. In addition, because EBITDA, Adjusted EBITDA and ANI are not measures of financial performance under U.S. GAAP and are susceptible to varying calculations, EBITDA, Adjusted EBITDA and ANI as presented in this Annual Report, may differ from and may not be comparable to similarly titled measures used by other companies.
Interest rate risk is the exposure to loss resulting from changes in the level of interest rates and the spread between different interest rates. These risks are highly sensitive to many factors, including U.S. monetary and tax policies, U.S. and international economic factors and other factors beyond our control. We are exposed to changes in the level of interest rates and to changes in the relationship or spread between interest rates. Our primary interest rate exposures relate to our lease agreements, floating rate debt obligations and interest rate derivatives. Rent payments under our aircraft lease agreements typically do not vary during the term of the lease according to changes in interest rates. However, our borrowing agreements generally require payments based on a variable interest rate index, such as LIBOR. Therefore, to the extent our borrowing costs are not fixed, increases in interest rates may reduce our net income by increasing the cost of our debt without any corresponding increase in rents or cash flow from our securities.
Changes in interest rates may also impact our net book value as our interest rate derivatives are periodically marked-to-market through shareholders’ equity. Generally, we are exposed to loss on our fixed pay interest rate derivatives to the extent interest rates decrease below their contractual fixed rate.
The relationship between spreads on derivative instruments may vary from time to time, resulting in a net aggregate book value increase or decrease. Changes in the general level of interest rates can also affect our ability to acquire new investments and our ability to realize gains from the settlement of such assets.
Sensitivity Analysis
The following discussion about the potential effects of changes in interest rates is based on a sensitivity analysis, which models the effects of hypothetical interest rate shifts on our financial condition and results of operations. Although we believe a sensitivity analysis provides the most meaningful analysis permitted by the rules and regulations of the SEC, it is constrained by several factors, including the necessity to conduct the analysis based on a single point in time and by the inability to include the extraordinarily complex market reactions that normally would arise from the market shifts modeled.
59
Although the following results of a sensitivity analysis for changes in interest rates may have some limited use as a benchmark, they should not be viewed as a forecast. This forward-looking disclosure also is selective in nature and addresses only the potential interest expense impacts on our financial instruments and, in particular, does not address the mark-to-market impact on our interest rate derivatives. It also does not include a variety of other potential factors that could affect our business as a result of changes in interest rates.
A hypothetical 100-basis point increase/decrease in our variable interest rates would increase/decrease the minimum contracted rentals on our portfolio as of
December 31, 2019
by $4.2 million and $4.2 million, respectively, over the next twelve months. As of
December 31, 2019
, a hypothetical 100-basis point increase/decrease in our variable interest rate on our borrowings would result in an interest expense increase/decrease of $4.6 million and $6.3 million, respectively, net of amounts received from our interest rate derivatives, over the next twelve months. We have an interest rate cap to hedge approximately 70% of our floating rate interest exposure which is set at 2% and has a current notional balance of $245.0 million and reduces over time to $215.0 million. The cap matures in September 2021.
60
Our consolidated financial statements and notes thereto, referred to in Item 15(A)(1) of this Form 10-K, are filed as part of this Annual Report and appear in this Form 10-K beginning on page F-1.
None.
Management’s Evaluation of Disclosure Controls and Procedures
The term “disclosure controls and procedures” is defined in Rules 13a-15(e) and 15d-15(e) of the Securities Exchange Act of 1934 (the “Exchange Act”). This term refers to the controls and procedures of a company that are designed to ensure that information required to be disclosed by a company in the reports that it files under the Exchange Act is recorded, processed, summarized and reported within the time periods specified by the SEC and that such information is accumulated and communicated to the Company’s management, including its Chief Executive Officer (“CEO”) and Chief Financial Officer (“CFO”) as appropriate, to allow timely decisions regarding required disclosure. An evaluation was performed under the supervision and with the participation of the Company’s management, including the CEO and CFO, of the effectiveness of the Company’s disclosure controls and procedures as of
December 31, 2019
. Based on that evaluation, the Company’s management, including the CEO and CFO, concluded that the Company’s disclosure controls and procedures were effective as of
December 31, 2019
.
Management’s Annual Report on Internal Control over Financial Reporting
The Company’s management is responsible for establishing and maintaining adequate internal control over financial reporting, as such term is defined in Exchange Act Rules 13a-15(f) and 15d-15(f). The Company’s internal control over financial reporting is a process designed to provide reasonable assurance regarding the reliability of financial reporting and the preparation of financial statements for external purposes in accordance with generally accepted accounting principles.
Because of its inherent limitations, internal control over financial reporting may not prevent or detect misstatements. Also, projections of any evaluation of effectiveness to future periods are subject to the risk that controls may become inadequate because of changes in conditions or because the degree of compliance with policies or procedures may deteriorate.
Under the supervision and with the participation of our management, including our CEO and CFO, we conducted an assessment of the effectiveness of our internal control over financial reporting as of
December 31, 2019
. The assessment was based on criteria established in the Internal Control — Integrated Framework (2013), issued by the Committee of Sponsoring Organizations (“COSO”) of the Treadway Commission. Based on this assessment, management concluded that our internal control over financial reporting was effective as of
December 31, 2019
.
Ernst & Young LLP, the independent registered public accounting firm that audited our Consolidated Financial Statements included in this Annual Report on Form 10-K, audited the effectiveness of our controls over financial reporting as of
December 31, 2019
. Ernst & Young LLP has issued its report which is included below.
Changes in Internal Control over Financial Reporting
There were no changes in the Company’s internal control over financial reporting that occurred during the quarter ended
December 31, 2019
, that have materially affected, or are reasonably likely to materially affect, the Company’s internal control over financial reporting.
61
Report of Independent Registered Public Accounting Firm
To the Shareholders and the Board of Directors of Aircastle Limited
Opinion on Internal Control over Financial Reporting
We have audited Aircastle Limited and Subsidiaries’ internal control over financial reporting as of
December 31, 2019
, based on criteria established in Internal Control — Integrated Framework issued by the Committee of Sponsoring Organizations of the Treadway Commission (2013 framework) (the COSO criteria). In our opinion, Aircastle Limited and Subsidiaries (the Company) maintained, in all material respects, effective internal control over financial reporting as of
December 31, 2019
, based on
the COSO criteria
.
We also have audited, in accordance with the standards of the Public Company Accounting Oversight Board (United States) (PCAOB), the consolidated balance sheets of the Company
as of
December 31, 2019
and
2018
, and the related consolidated statements of income, comprehensive income, changes in shareholders’ equity and cash flows for each of the three years in the period ended
December 31, 2019
and the related notes (collectively referred to as the “consolidated financial statements”) of the Company and our report dated
February 13, 2020
expressed an unqualified opinion thereon.
Basis for Opinion
The Company’s management is responsible for maintaining effective internal control over financial reporting and for its assessment of the effectiveness of internal control over financial reporting included in the accompanying Management’s Annual Report on Internal Control over Financial Reporting. Our responsibility is to express an opinion on the Company’s internal control over financial reporting based on our audit. We are a public accounting firm registered with the PCAOB and are required to be independent with respect to the Company in accordance with the U.S. federal securities laws and the applicable rules and regulations of the Securities and Exchange Commission and the PCAOB.
We conducted our audit in accordance with the standards of the PCAOB. Those standards require that we plan and perform the audit to obtain reasonable assurance about whether effective internal control over financial reporting was maintained in all material respects.
Our audit included obtaining an understanding of internal control over financial reporting, assessing the risk that a material weakness exists, testing and evaluating the design and operating effectiveness of internal control based on the assessed risk, and performing such other procedures as we considered necessary in the circumstances. We believe that our audit provides a reasonable basis for our opinion.
Definition and Limitations of Internal Control Over Financial Reporting
A company’s internal control over financial reporting is a process designed to provide reasonable assurance regarding the reliability of financial reporting and the preparation of financial statements for external purposes in accordance with generally accepted accounting principles. A company’s internal control over financial reporting includes those policies and procedures that (1) pertain to the maintenance of records that, in reasonable detail, accurately and fairly reflect the transactions and dispositions of the assets of the company; (2) provide reasonable assurance that transactions are recorded as necessary to permit preparation of financial statements in accordance with generally accepted accounting principles, and that receipts and expenditures of the company are being made only in accordance with authorizations of management and directors of the company; and (3) provide reasonable assurance regarding prevention or timely detection of unauthorized acquisition, use, or disposition of the company’s assets that could have a material effect on the financial statements.
Because of its inherent limitations, internal control over financial reporting may not prevent or detect misstatements. Also, projections of any evaluation of effectiveness to future periods are subject to the risk that controls may become inadequate because of changes in conditions, or that the degree of compliance with the policies or procedures may deteriorate.
/s/ Ernst & Young LLP
Stamford, CT
February 13, 2020
62
None.
Pursuant to Item 401(b) of Regulation S-K, the requisite information pertaining to our executive officers is reported immediately following Item 4 of Part I of this Annual Report. The identification of our Audit Committee and our Audit Committee financial experts will be contained under the captions “CORPORATE GOVERNANCE - Committees of the Board of Directors - The Audit Committee” in our 2020 Proxy Statement to be filed in connection with our 2020 Annual Meeting (the “2020 Proxy Statement”) or in an amendment to this Annual Report not later than 120 days after the end of the fiscal year covered by this Annual Report. Information regarding our Code of Business Ethics and Conduct, any material amendments thereto and any related waivers will be contained under the captions “CORPORATE GOVERNANCE - Code of Business Conduct and Ethics” in our 2020 Proxy Statement or in an amendment to this Annual Report not later than 120 days after the end of the fiscal year covered by this Annual Report. Any information required by Item 405 of Regulation S-K will be contained under the caption "OWNERSHIP OF THE COMPANY'S COMMON SHARES - Delinquent Section 16(a) Reports" in our 2020 Proxy Statement or in an amendment to this Annual Report not later than 120 days after the end of the fiscal year covered by this Annual Report. All of the foregoing information is incorporated herein by reference. The Code of Business Conduct and Ethics is posted on our website at www.aircastle.com under Investors - Corporate Governance.
Information on compensation of our directors and certain named executive officers will be contained under the captions “Directors’ Compensation” and “EXECUTIVE COMPENSATION,” respectively, in our 2020 Proxy Statement or in an amendment to this Annual Report not later than 120 days after the end of the fiscal year covered by this Annual Report. All of the foregoing information is incorporated herein by reference.
Information on the number of shares of Aircastle’s common shares beneficially owned by each director, each named executive officer and by all directors and executive officers as a group will be contained under the captions “OWNERSHIP OF THE COMPANY’S COMMON SHARES - Security Ownership by Management” and information on each beneficial owner of more than 5% of Aircastle’s common shares will be contained under the captions “OWNERSHIP OF THE COMPANY’S COMMON SHARES - Security Ownership of Certain Beneficial Owners” in our 2020 Proxy Statement or in an amendment to this Annual Report not later than 120 days after the end of the fiscal year covered by this Annual Report. All of the foregoing information is incorporated herein by reference.
Information regarding our equity compensation will be contained under the caption “COMPENSATION COMMITTEE REPORT - Equity Compensation Plan Information” in our 2020 Proxy Statement or in an amendment to this Annual Report not later than 120 days after the end of the fiscal year covered by this Annual Report. The foregoing information is incorporated herein by reference.
63
Information relating to certain transactions between Aircastle and its affiliates and certain other persons will be contained under the caption “CERTAIN RELATIONSHIPS AND RELATED PARTY TRANSACTIONS” in our 2020 Proxy Statement or in an amendment to this Annual Report not later than 120 days after the end of the fiscal year covered by this Annual Report. All of the foregoing information is incorporated herein by reference.
Information relating to director independence will be contained under the caption “CORPORATE GOVERNANCE - Director Independence” in our 2020 Proxy Statement or in an amendment to this Annual Report not later than 120 days after the end of the fiscal year covered by this Annual Report. The foregoing information is incorporated herein by reference.
Information relating to audit fees, audit-related fees, tax fees and all other fees billed in fiscal 2019 and by Ernst & Young LLP, for services rendered to Aircastle will be contained under the caption “INDEPENDENT AUDITOR FEES” in our 2020 Proxy Statement or in an amendment to this Annual Report not later than 120 days after the end of the fiscal year covered by this Annual Report. The foregoing information is incorporated herein by reference.
Information relating to the pre-approval policies and procedures of the Audit Committee will be contained under the caption “INDEPENDENT AUDITOR FEES - Pre-Approval Policies and Procedures” in our 2020 Proxy Statement or in an amendment to this Annual Report not later than 120 days after the end of the fiscal year covered by this Annual Report. The foregoing information is incorporated herein by reference.
|
(A)
|
1.
|
Consolidated Financial Statements.
|
|
The following is a list of the “Consolidated Financial Statements” of Aircastle Limited and its subsidiaries included in this Annual Report on Form 10-K, which are filed herewith pursuant to Item 8:
|
||
|
Report of Independent Registered Public Accounting Firm.
|
||
|
Consolidated Balance Sheets as of December 31, 2019 and 2018.
|
||
|
Consolidated Statements of Income for the years ended December 31, 2019, 2018 and 2017.
|
||
|
Consolidated Statements of Comprehensive Income for the years ended December 31, 2019, 2018 and 2017.
|
||
|
Consolidated Statements of Cash Flows for the years ended December 31, 2019, 2018 and 2017.
|
||
|
Consolidated Statements of Changes in Shareholders’ Equity for the years ended December 31, 2019, 2018 and 2017.
|
||
|
Notes to Consolidated Financial Statements.
|
||
|
2.
|
Financial Statement Schedules.
|
|
|
There are no Financial Statement Schedules filed as part of this Annual Report, since the required information is included in the Consolidated Financial Statements, including the notes thereto, or the circumstances requiring inclusion of such schedules are not present.
|
||
|
3.
|
Exhibits.
|
|
|
The exhibits filed herewith are listed on the Exhibit Index filed as part of this Annual Report on Form 10-K.
|
||
64
(B) EXHIBIT INDEX
|
Exhibit No.
|
Description of Exhibit
|
|
|
2.1
|
||
|
3.1
|
||
|
3.2
|
||
|
4.1
|
||
|
4.2
|
||
|
4.3
|
||
|
4.4
|
||
|
4.5
|
||
|
4.6
|
||
|
4.7
|
||
|
4.8
|
||
|
4.9
|
||
|
4.10
|
||
|
4.11
|
||
|
4.12
|
||
|
4.13
|
||
E - 1
|
Exhibit No.
|
Description of Exhibit
|
|
|
10.1
|
||
|
10.2
|
||
|
10.3
|
||
|
10.4
|
||
|
10.5
|
||
|
10.6
|
||
|
10.7
|
||
|
10.8
|
||
|
10.9
|
||
|
10.10
|
||
|
10.11
|
||
|
10.12
|
||
|
10.13
|
||
|
10.14
|
||
|
10.15
|
||
|
10.16
|
||
|
10.17
|
||
E - 2
|
Exhibit No.
|
Description of Exhibit
|
|
|
10.18
|
||
|
10.19
|
||
|
10.20
|
||
|
10.21
|
||
|
10.22
|
||
|
10.23
|
||
|
10.24
|
||
|
10.25
|
||
|
10.26
|
||
|
10.27
|
||
|
10.28
|
||
|
10.29
|
||
|
10.30
|
||
|
10.31
|
||
|
10.32
|
||
|
10.33
|
||
|
10.34
|
||
E - 3
|
Exhibit No.
|
Description of Exhibit
|
|
|
10.35
|
||
|
10.36
|
||
|
21.1
|
||
|
23.1
|
||
|
31.1
|
||
|
31.2
|
||
|
32.1
|
||
|
32.2
|
||
|
99.1
|
||
|
101
|
The following materials from the Company’s Annual Report on Form 10-K for the year ended December 31, 2019, formatted in iXBRL (Inline eXtensible Business Reporting Language): (i) Consolidated Balance Sheets as of December 31, 2019 and 2018; (ii) Consolidated Statements of Income for the years ended December 31, 2019, 2018 and 2017; (iii) Consolidated Statements of Comprehensive Income for the years ended December 31, 2019, 2018 and 2017; (iv) Consolidated Statements of Cash Flows for the years ended December 31, 2019, 2018 and 2017; (v) Consolidated Statements of Changes in Shareholders’ Equity and Comprehensive Income for the years ended December 31, 2019, 2018 and 2017; and (vi) Notes to Consolidated Financial Statements*
|
|
|
104
|
Cover Page Interactive Data File - the cover page XBRL tags are embedded within the Inline XBRL document.
|
|
_____________
# Management contract or compensatory plan or arrangement.
* Filed herewith.
Ø Portions of this exhibit have been omitted pursuant to a request for confidential treatment.
|
^
|
Certain schedules have been omitted pursuant to Item 601(b)(2) of Regulation S-K. The Company hereby undertakes to furnish supplemental copies of any of the omitted schedules to the SEC upon request.
|
ØØ Portions of this exhibit have been omitted pursuant to Item 601(b)(10)(iv) of Regulation S-K.
None.
E - 4
Index to Financial Statements
|
|
Page No.
|
|
Consolidated Financial Statements
|
|
|
Consolidated Balance Sheets as of December 31, 2019 and 2018
|
|
F - 1
Report of Independent Registered Public Accounting Firm
To the Shareholders and the Board of Directors of Aircastle Limited
Opinion on the Financial Statements
We have audited the accompanying consolidated balance sheets of Aircastle Limited and Subsidiaries (the Company) as of
December 31, 2019
and
2018
, and the related consolidated statements of income, comprehensive income, changes in shareholders’ equity and cash flows for each of the three years in the period ended
December 31, 2019
, and the related notes (collectively referred to as the “consolidated financial statements”). In our opinion, the consolidated financial statements present fairly, in all material respects, the financial position of the Company at
December 31, 2019
and
2018
, and the results of its operations and its cash flows for each of the three years in the period ended
December 31, 2019
, in conformity with U.S. generally accepted accounting principles.
We also have audited, in accordance with the standards of the Public Company Accounting Oversight Board (United States) (PCAOB), the Company’s internal control over financial reporting as of
December 31, 2019
, based on criteria established in Internal Control — Integrated Framework issued by the Committee of Sponsoring Organizations of the Treadway Commission (2013 framework), and our report dated
February 13, 2020
expressed an unqualified opinion thereon.
Basis for Opinion
These financial statements are the responsibility of the Company’s management. Our responsibility is to express an opinion on the Company’s financial statements based on our audits. We are a public accounting firm registered with the PCAOB and are required to be independent with respect to the Company in accordance with the U.S. federal securities laws and the applicable rules and regulations of the Securities and Exchange Commission and the PCAOB.
We conducted our audits in accordance with the standards of the PCAOB. Those standards require that we plan and perform the audit to obtain reasonable assurance about whether the financial statements are free of material misstatement, whether due to error or fraud. Our audits included performing procedures to assess the risks of material misstatement of the financial statements, whether due to error or fraud, and performing procedures that respond to those risks. Such procedures included examining, on a test basis, evidence regarding the amounts and disclosures in the financial statements. Our audits also included evaluating the accounting principles used and significant estimates made by management, as well as evaluating the overall presentation of the financial statements. We believe that our audits provide a reasonable basis for our opinion.
Critical Audit Matters
The critical audit matters communicated below are matters arising from the current period audit of the financial statements that were communicated or required to be communicated to the audit committee and that: (1) relate to accounts or disclosures that are material to the financial statements and (2) involved our especially challenging, subjective or complex judgments. The communication of critical audit matters does not alter in any way our opinion on the consolidated financial statements, taken as a whole, and we are not, by communicating the critical audit matters below, providing separate opinions on the critical audit matters or on the accounts or disclosures to which they relate.
|
Recoverability assessment of flight equipment held for lease
|
|
|
Description of
the Matter
|
As of December 31, 2019, the Company had $7.4 billion of flight equipment held for lease.
As more fully described in Note 2 to the consolidated financial statements, flight equipment held for lease is assessed for recoverability by management on an aircraft-by-aircraft basis annually and whenever events or changes in circumstances indicate that the carrying amount may not be recoverable.
Auditing the Company’s assessment of recoverability of flight equipment held for lease was complex and highly judgmental due to the higher estimation required in determining the future undiscounted cash flows. In particular, the undiscounted future cash flows were sensitive to changes related to significant assumptions such as the estimation of the future projected lease rates and future maintenance cash flows.
|
|
How We
Addressed the Matter in Our Audit
|
We obtained an understanding, evaluated the design, and tested the operating effectiveness of controls over the Company's processes to determine whether the book value of each aircraft is recoverable. This included controls over management’s review of the significant assumptions described above which are included in the Company’s recoverability analysis.
|
F - 2
|
To test the estimated undiscounted future cash flows attributable to the flight equipment held for lease, we performed audit procedures
on a sample of transactions
that included, among others, evaluating and testing the significant assumptions discussed above and the underlying data used by the Company in its analysis. Our testing of the Company’s significant assumptions included, among others, comparing data to currently contracted lease rental and maintenance cash flows, evaluating future projected lease rates to third party data, evaluating the timing and cost of estimated future maintenance cash flows to manufacturers’ specifications and/or historical data. We also considered current industry and economic trends and changes to the business. We assessed the historical accuracy of certain assumptions by performing a look back analysis. In addition, for the assumptions that most significantly impact recoverability we performed a sensitivity analysis to evaluate the changes to the undiscounted future cash flows from changes in the significant assumptions.
|
|
|
Accounting for Income Tax
|
|
|
Description of
the Matter
|
The Company is incorporated in Bermuda and leases its aircraft within over 40 countries. The Company’s income is subject to U.S. federal, state and local income taxes, as well as foreign income tax in many of the jurisdictions it leases aircraft. As more fully described in Note 11 to the consolidated financial statements, the Company recognized a consolidated provision for income taxes of $22.7 million for the year ended December 31, 2019.
Auditing the Company’s income tax accounting was complex due to the complicated international tax structure maintained by the Company. Specifically, the auditing of the application of changes in tax law and transactions to transfer, buy or sell aircraft in foreign jurisdictions required increased auditor effort, including the use of tax professionals with specialized skills, to evaluate the Company’s application of the tax laws in relevant jurisdictions and the related income tax.
|
|
How We
Addressed the Matter in Our Audit
|
We obtained an understanding, evaluated the design and tested the operating effectiveness of controls over the Company’s process to prepare the consolidated income tax provision. Our procedures also included, among others, an evaluation of management’s review and consideration of the international tax structure, identification of changes to tax laws in the various jurisdictions in which it operates and its treatment of the transactions to transfer, buy and sell aircraft.
To test the income tax related accounts, we performed audit procedures that included, among others, understanding the Company’s tax structure as it relates to current leases through review of its organization chart and various lease documents. We evaluated the Company’s treatment of tax law changes, if any, in the foreign jurisdictions it operates to current tax laws. We also obtained, and assessed the completeness of, a list of transactions to transfer, purchase and sell aircraft during the period and evaluated the tax treatment of a sample of transactions through review of the lease documents and our assessment of the tax law. Our audit procedures were performed with the assistance of our tax professionals with specialized skills and knowledge.
|
/s/ Ernst & Young LLP
We have served as the Company’s auditor since 2004.
Stamford, CT
February 13, 2020
F - 3
Aircastle Limited and Subsidiaries
(Dollars in thousands, except share data)
|
|
December 31,
|
||||||
|
|
2019
|
2018
|
|||||
|
ASSETS
|
|||||||
|
Cash and cash equivalents
|
$
|
|
|
$
|
|
|
|
|
Restricted cash and cash equivalents
|
|
|
|
|
|||
|
Accounts receivable
|
|
|
|
|
|||
|
Flight equipment held for lease, net of accumulated depreciation of $1,501,664 and $1,221,985, respectively
|
|
|
|
|
|||
|
Net investment in direct financing and sales-type leases
|
|
|
|
|
|||
|
Unconsolidated equity method investments
|
|
|
|
|
|||
|
Other assets
|
|
|
|
|
|||
|
Total assets
|
$
|
|
|
$
|
|
|
|
|
LIABILITIES AND SHAREHOLDERS’ EQUITY
|
|||||||
|
LIABILITIES
|
|||||||
|
Borrowings from secured financings, net of debt issuance costs
|
$
|
|
|
$
|
|
|
|
|
Borrowings from unsecured financings, net of debt issuance costs
|
|
|
|
|
|||
|
Accounts payable, accrued expenses and other liabilities
|
|
|
|
|
|||
|
Lease rentals received in advance
|
|
|
|
|
|||
|
Security deposits
|
|
|
|
|
|||
|
Maintenance payments
|
|
|
|
|
|||
|
Total liabilities
|
|
|
|
|
|||
|
Commitments and Contingencies
|
|
|
|||||
|
SHAREHOLDERS’ EQUITY
|
|||||||
|
Preference shares, $0.01 par value, 50,000,000 shares authorized, no shares issued and outstanding
|
|
|
|
|
|||
|
Common shares, $0.01 par value, 250,000,000 shares authorized, 75,122,129 shares issued and outstanding at December 31, 2019; and 75,454,511 shares issued and outstanding at December 31, 2018
|
|
|
|
|
|||
|
Additional paid-in capital
|
|
|
|
|
|||
|
Retained earnings
|
|
|
|
|
|||
|
Accumulated other comprehensive loss
|
|
|
(
|
)
|
|||
|
Total shareholders’ equity
|
|
|
|
|
|||
|
Total liabilities and shareholders’ equity
|
$
|
|
|
$
|
|
|
|
The accompanying notes are an integral part of these consolidated financial statements.
F - 4
Aircastle Limited and Subsidiaries
(Dollars in thousands, except per share amounts)
|
|
Year Ended December 31,
|
||||||||||
|
|
2019
|
2018
|
2017
|
||||||||
|
Revenues:
|
|||||||||||
|
Lease rental revenue
|
$
|
|
|
$
|
|
|
$
|
|
|
||
|
Direct financing and sales-type lease revenue
|
|
|
|
|
|
|
|||||
|
Amortization of lease premiums, discounts and incentives
|
(
|
)
|
(
|
)
|
(
|
)
|
|||||
|
Maintenance revenue
|
|
|
|
|
|
|
|||||
|
Total lease revenue
|
|
|
|
|
|
|
|||||
|
Gain on sale of flight equipment
|
|
|
|
|
|
|
|||||
|
Other revenue
|
|
|
|
|
|
|
|||||
|
Total revenues
|
|
|
|
|
|
|
|||||
|
Operating expenses:
|
|||||||||||
|
Depreciation
|
|
|
|
|
|
|
|||||
|
Interest, net
|
|
|
|
|
|
|
|||||
|
Selling, general and administrative (including non-cash share-based payment expense of $15,830, $11,488 and $13,148, respectively)
|
|
|
|
|
|
|
|||||
|
Impairment of aircraft
|
|
|
|
|
|
|
|||||
|
Maintenance and other costs
|
|
|
|
|
|
|
|||||
|
Total operating expenses
|
|
|
|
|
|
|
|||||
|
Other income (expense):
|
|||||||||||
|
Loss on extinguishment of debt
|
(
|
)
|
|
|
|
|
|||||
|
Other
|
(
|
)
|
|
|
(
|
)
|
|||||
|
Total other income (expense)
|
(
|
)
|
|
|
(
|
)
|
|||||
|
Income from continuing operations before income taxes and earnings (loss) of unconsolidated equity method investment
|
|
|
|
|
|
|
|||||
|
Income tax provision
|
|
|
|
|
|
|
|||||
|
Earnings (loss) of unconsolidated equity method investment, net of tax
|
|
|
(
|
)
|
|
|
|||||
|
Net income
|
$
|
|
|
$
|
|
|
|
$
|
|
|
|
|
Earnings per common share — Basic:
|
|||||||||||
|
Net income per share
|
$
|
|
|
$
|
|
|
$
|
|
|
||
|
Earnings per common share — Diluted:
|
|||||||||||
|
Net income per share
|
$
|
|
|
$
|
|
|
$
|
|
|
||
|
Dividends declared per share
|
$
|
|
|
$
|
|
|
$
|
|
|
||
The accompanying notes are an integral part of these consolidated financial statements.
F - 5
Aircastle Limited and Subsidiaries
Consolidated Statements of Comprehensive Income
(Dollars in thousands)
|
|
Year Ended December 31,
|
||||||||||
|
|
2019
|
2018
|
2017
|
||||||||
|
Net income
|
$
|
|
|
$
|
|
|
$
|
|
|
||
|
Other comprehensive income, net of tax:
|
|||||||||||
|
Net derivative loss reclassified into earnings
|
|
|
|
|
|
|
|||||
|
Other comprehensive income
|
|
|
|
|
|
|
|||||
|
Total comprehensive income
|
$
|
|
|
$
|
|
|
$
|
|
|
||
The accompanying notes are an integral part of these consolidated financial statements.
F - 6
Aircastle Limited and Subsidiaries
(Dollars in thousands)
|
|
Year Ended December 31,
|
||||||||||
|
|
2019
|
2018
|
2017
|
||||||||
|
Cash flows from operating activities:
|
|||||||||||
|
Net income
|
$
|
|
|
$
|
|
|
$
|
|
|
||
|
Adjustments to reconcile net income to net cash provided by operating activities:
|
|||||||||||
|
Depreciation
|
|
|
|
|
|
|
|||||
|
Amortization of deferred financing costs
|
|
|
|
|
|
|
|||||
|
Amortization of lease premiums, discounts and incentives
|
|
|
|
|
|
|
|||||
|
Deferred income taxes
|
|
|
(
|
)
|
(
|
)
|
|||||
|
Non-cash share-based payment expense
|
|
|
|
|
|
|
|||||
|
Cash flow hedges reclassified into earnings
|
|
|
|
|
|
|
|||||
|
Collections on direct financing and sales-type leases
|
|
|
|
|
|
|
|||||
|
Security deposits and maintenance payments included in earnings
|
(
|
)
|
(
|
)
|
(
|
)
|
|||||
|
Gain on the sale of flight equipment
|
(
|
)
|
(
|
)
|
(
|
)
|
|||||
|
Loss on extinguishment of debt
|
|
|
|
|
|
|
|||||
|
Impairment of aircraft
|
|
|
|
|
|
|
|||||
|
Other
|
|
|
|
|
|
|
|||||
|
Changes on certain assets and liabilities:
|
|||||||||||
|
Accounts receivable
|
(
|
)
|
(
|
)
|
(
|
)
|
|||||
|
Other assets
|
|
|
|
|
(
|
)
|
|||||
|
Accounts payable, accrued expenses and other liabilities
|
(
|
)
|
|
|
|
|
|||||
|
Lease rentals received in advance
|
|
|
|
|
(
|
)
|
|||||
|
Net cash and restricted cash provided by operating activities
|
|
|
|
|
|
|
|||||
|
Cash flows from investing activities:
|
|||||||||||
|
Acquisition and improvement of flight equipment
|
(
|
)
|
(
|
)
|
(
|
)
|
|||||
|
Proceeds from sale of flight equipment
|
|
|
|
|
|
|
|||||
|
Net investment in direct financing and sales-type leases
|
|
|
(
|
)
|
(
|
)
|
|||||
|
Collections on direct financing and sales-type leases
|
|
|
|
|
|
|
|||||
|
Aircraft purchase deposits and progress payments, net of returned deposits and aircraft sales deposits
|
|
|
(
|
)
|
(
|
)
|
|||||
|
Unconsolidated equity method investment and associated costs
|
(
|
)
|
(
|
)
|
|
|
|||||
|
Distributions from unconsolidated equity method investment in excess of earnings
|
|
|
|
|
|
|
|||||
|
Other
|
|
|
|
|
(
|
)
|
|||||
|
Net cash and restricted cash used in investing activities
|
(
|
)
|
(
|
)
|
(
|
)
|
|||||
|
Cash flows from financing activities:
|
|||||||||||
|
Repurchase of shares
|
(
|
)
|
(
|
)
|
(
|
)
|
|||||
|
Proceeds from secured and unsecured debt financings
|
|
|
|
|
|
|
|||||
|
Repayments of secured and unsecured debt financings
|
(
|
)
|
(
|
)
|
(
|
)
|
|||||
|
Deferred financing costs
|
(
|
)
|
(
|
)
|
(
|
)
|
|||||
|
Debt extinguishment costs
|
(
|
)
|
|
|
|
|
|||||
|
Security deposits and maintenance payments received
|
|
|
|
|
|
|
|||||
|
Security deposits and maintenance payments returned
|
(
|
)
|
(
|
)
|
(
|
)
|
|||||
|
Dividends paid
|
(
|
)
|
(
|
)
|
(
|
)
|
|||||
|
Net cash and restricted cash provided by (used in) financing activities
|
|
|
|
|
(
|
)
|
|||||
|
Net decrease in cash and restricted cash
|
(
|
)
|
(
|
)
|
(
|
)
|
|||||
|
Cash and restricted cash at beginning of year
|
|
|
|
|
|
|
|||||
|
Cash and restricted cash at end of year
|
$
|
|
|
$
|
|
|
$
|
|
|
||
Aircastle Limited and Subsidiaries
Consolidated Statements of Cash Flows (Continued)
(Dollars in thousands)
|
|
Year Ended December 31,
|
||||||||||
|
|
2019
|
2018
|
2017
|
||||||||
|
Reconciliation to Consolidated Balance Sheets:
|
|||||||||||
|
Cash and cash equivalents
|
$
|
|
|
$
|
|
|
$
|
|
|
||
|
Restricted cash and cash equivalents
|
|
|
|
|
|
|
|||||
|
Unrestricted and restricted cash and cash equivalents
|
$
|
|
|
$
|
|
|
$
|
|
|
||
|
Supplemental disclosures of cash flow information:
|
|||||||||||
|
Cash paid during the year for interest
|
$
|
|
|
$
|
|
|
$
|
|
|
||
|
Cash (received) paid during the year for income taxes
|
$
|
(
|
)
|
$
|
|
|
$
|
|
|
||
|
Supplemental disclosures of non-cash investing activities:
|
|||||||||||
|
Advance lease rentals, security deposits, maintenance payments, other liabilities and other assets settled in sale of flight equipment
|
$
|
|
|
$
|
|
|
$
|
|
|
||
|
Advance lease rentals, security deposits, maintenance payments, other liabilities and other assets assumed in asset acquisitions
|
$
|
|
|
$
|
|
|
$
|
|
|
||
|
Transfers from Flight equipment held for lease to Net investment in direct financing and sales-type leases and Other assets
|
$
|
|
|
$
|
|
|
$
|
|
|
||
The accompanying notes are an integral part of these consolidated financial statements.
F - 7
Aircastle Limited and Subsidiaries
Consolidated Statements of Changes in Shareholders’ Equity
(Dollars in thousands, except share amounts)
|
|
|
Additional
Paid-In
Capital
|
Retained
Earnings
(Deficit)
|
Accumulated
Other
Comprehensive
Income (Loss)
|
Total
Shareholders’
Equity
|
|||||||||||||||||
|
|
Common Shares
|
|||||||||||||||||||||
|
|
Shares
|
Amount
|
||||||||||||||||||||
|
Balance, December 31, 2016
|
|
|
$
|
|
|
$
|
|
|
$
|
|
|
$
|
(
|
)
|
$
|
|
|
|||||
|
Issuance of common shares to directors and employees
|
|
|
|
|
(
|
)
|
—
|
|
—
|
|
|
|
||||||||||
|
Repurchase of common shares from stockholders, directors and employees
|
(
|
)
|
(
|
)
|
(
|
)
|
—
|
|
—
|
|
(
|
)
|
||||||||||
|
Amortization of share-based payments
|
—
|
|
—
|
|
|
|
—
|
|
—
|
|
|
|
||||||||||
|
Dividends declared
|
—
|
|
—
|
|
—
|
|
(
|
)
|
—
|
|
(
|
)
|
||||||||||
|
Net income
|
—
|
|
—
|
|
—
|
|
|
|
—
|
|
|
|
||||||||||
|
Net derivative loss reclassified into earnings
|
—
|
|
—
|
|
—
|
|
—
|
|
|
|
|
|
||||||||||
|
Balance, December 31, 2017
|
|
|
|
|
|
|
|
|
(
|
)
|
|
|
||||||||||
|
Issuance of common shares to stockholders, directors and employees
|
|
|
|
|
(
|
)
|
—
|
|
—
|
|
|
|
||||||||||
|
Repurchase of common shares from stockholders, directors and employees
|
(
|
)
|
(
|
)
|
(
|
)
|
—
|
|
—
|
|
(
|
)
|
||||||||||
|
Amortization of share-based payments
|
—
|
|
—
|
|
|
|
—
|
|
—
|
|
|
|
||||||||||
|
Reclassification of prior year director stock award liability
|
—
|
|
—
|
|
|
|
—
|
|
—
|
|
|
|
||||||||||
|
Dividends declared
|
—
|
|
—
|
|
—
|
|
(
|
)
|
—
|
|
(
|
)
|
||||||||||
|
Net income
|
—
|
|
—
|
|
—
|
|
|
|
—
|
|
|
|
||||||||||
|
Adoption of accounting standard
|
—
|
|
—
|
|
—
|
|
(
|
)
|
—
|
|
(
|
)
|
||||||||||
|
Net derivative loss reclassified into earnings
|
—
|
|
—
|
|
—
|
|
—
|
|
|
|
|
|
||||||||||
|
Balance, December 31, 2018
|
|
|
|
|
|
|
|
|
(
|
)
|
|
|
||||||||||
|
Issuance of common shares to stockholders, directors and employees
|
|
|
|
|
(
|
)
|
—
|
|
—
|
|
|
|
||||||||||
|
Repurchase of common shares from stockholders, directors and employees
|
(
|
)
|
(
|
)
|
(
|
)
|
—
|
|
—
|
|
(
|
)
|
||||||||||
|
Amortization of share-based payments
|
—
|
|
—
|
|
|
|
—
|
|
—
|
|
|
|
||||||||||
|
Reclassification of prior year director stock award liability
|
—
|
|
—
|
|
|
|
—
|
|
—
|
|
|
|
||||||||||
|
Dividends declared
|
—
|
|
—
|
|
—
|
|
(
|
)
|
—
|
|
(
|
)
|
||||||||||
|
Net income
|
—
|
|
—
|
|
—
|
|
|
|
—
|
|
|
|
||||||||||
|
Adoption of accounting standard
|
—
|
|
—
|
|
—
|
|
|
|
—
|
|
|
|
||||||||||
|
Net derivative loss reclassified into earnings
|
—
|
|
—
|
|
—
|
|
—
|
|
|
|
|
|
||||||||||
|
Balance, December 31, 2019
|
|
|
$
|
|
|
$
|
|
|
$
|
|
|
$
|
|
|
$
|
|
|
|||||
The accompanying notes are an integral part of these consolidated financial statements.
F - 8
Aircastle Limited and Subsidiaries
Notes to Consolidated Financial Statements
(Dollars in thousands, except per share amounts)
Organization and Basis of Presentation
Aircastle Limited (“Aircastle,” the “Company,” “we,” “us” or “our”) is a Bermuda exempted company that was incorporated on October 29, 2004 under the provisions of Section 14 of the Companies Act of 1981 of Bermuda. Aircastle’s business is investing in aviation assets, including acquiring, leasing, managing and selling commercial jet aircraft.
Aircastle is a holding company that conducts its business through subsidiaries. Aircastle directly or indirectly owns all of the outstanding common shares of its subsidiaries. The consolidated financial statements presented are prepared in accordance with U.S. generally accepted accounting principles (“U.S. GAAP”). The Company manages, analyzes and reports on its business and results of operations on the basis of
one
operating segment: leasing, financing, selling and managing commercial flight equipment. Our chief executive officer is the chief operating decision maker.
On November 5, 2019, Aircastle entered into an Agreement and Plan of Merger (the “Merger Agreement”), with MM Air Limited, a Bermuda exempted company (“Parent”), and MM Air Merger Sub Limited, a Bermuda exempted company and wholly owned subsidiary of Parent (“Merger Sub”), pursuant to which, among other things, Merger Sub will merge with and into the Company, with Aircastle surviving as a wholly owned subsidiary of Parent (the “Merger”). Parent and Merger Sub are newly-formed entities controlled by affiliates of Marubeni Corporation (“Marubeni”) and Mizuho Leasing Company, Limited (“Mizuho Leasing”). The Marubeni Corporation is a related party and owns
28.8
%
of the Company’s outstanding common shares as of December 31, 2019.
Pursuant to the Merger Agreement, subject to certain conditions set forth therein, at the effective time of the Merger (the “Effective Time”), each issued and outstanding common share, par value
$
0.01
per share, of the Company (the “Common Shares”) (other than (i) shares to be canceled or converted into shares of the surviving company pursuant to the Merger Agreement and (ii) restricted shares to be canceled and exchanged pursuant to the Merger Agreement), shall be converted into the right to receive
$
32.00
in cash, without interest (the “Merger Consideration”).
Consummation of the Merger is subject to the satisfaction of certain remaining customary closing conditions, including, without limitation, (i) approval of the Merger Agreement and the transactions contemplated thereby by the affirmative votes of a majority of the votes cast by holders of outstanding Common Shares at a meeting of the Company’s shareholders; (ii) the receipt of any applicable pre-clearance or similar approval of certain remaining specified jurisdictions (i.e., Chile, Mexico and Morocco), and all required regulatory approvals being in full force and effect; (iii) the absence of any law, judgment or other legal restraint that prevents, makes illegal or prohibits the consummation of the Merger and the other transactions contemplated by the Merger Agreement; (iv) the accuracy of each party’s representations and warranties (subject to certain qualifications); (v) each party’s performance in all material respects of its obligations contained in the Merger Agreement; and (vi) the absence of a material adverse effect on the Company since the date of the Merger Agreement.
The Merger Agreement includes customary representations, warranties and covenants of Aircastle, Parent, and Merger Sub. Among other things, Aircastle has agreed to customary covenants regarding the operation of the business of Aircastle and its subsidiaries prior to the closing. Aircastle is permitted to pay regular quarterly dividends up to
$
0.32
per common share pursuant to the Merger Agreement. The Company currently anticipates that the Merger will close in the first half of calendar year 2020, subject to the satisfaction of the remaining customary closing conditions.
Effective January 1, 2019, the Company adopted Financial Accounting Standards Board (“FASB”) Accounting Standards Codification (“ASC”) 842,
Leases
(“ASC 842”) which, together with all subsequent amendments, replaced the existing guidance in ASC 840,
Leases
(“ASC 840”). The accounting for leases by lessors remained largely unchanged from the concepts that existed in ASC 840. The FASB decided that lessors would be precluded from recognizing selling profit and revenue at lease commencement for any sales-type or direct financing lease that does not transfer control of the underlying asset to the lessee. This requirement aligns the notion of what constitutes a sale in the lessor accounting guidance with that in the revenue recognition standard, which evaluates whether a sale has occurred from the customer’s perspective.
As a result of the Company’s adoption of ASC 842, we recognized right-of-use assets and lease liabilities on our Consolidated Balance Sheet as of
December 31, 2019
, for our office leases classified as operating leases under ASC 842, existing at, or entered into after, January 1, 2019. We adopted the standard using the required “modified retrospective”
F - 9
Aircastle Limited and Subsidiaries
Notes to Consolidated Financial Statements
(Dollars in thousands, except per share amounts)
approach and the available practical expedients. ASC 842 requires collections on direct financing and sales-type leases to be reported within operating activities on our Consolidated Statement of Cash Flows for the year ended December 31, 2019. Our financial statements for comparative periods have not been adjusted and continue to be reported in accordance with ASC 840. The standard did not have a material impact on our consolidated financial statements and related disclosures.
The Company’s management has reviewed and evaluated all events or transactions for potential recognition and/or disclosure since the balance sheet date of
December 31, 2019
through the date on which the consolidated financial statements included in this Form 10-K were issued.
Principles of Consolidation
The consolidated financial statements include the accounts of Aircastle and all of its subsidiaries. Aircastle consolidates
four
Variable Interest Entities (“VIEs”) of which Aircastle is the primary beneficiary. All intercompany transactions and balances have been eliminated in consolidation.
We consolidate VIEs in which we have determined that we are the primary beneficiary. We use judgment when deciding (a) whether an entity is subject to consolidation as a VIE, (b) who the variable interest holders are, (c) the potential expected losses and residual returns of the variable interest holders, and (d) which variable interest holder is the primary beneficiary. When determining which enterprise is the primary beneficiary, we consider (1) the entity’s purpose and design, (2) which variable interest holder has the power to direct the activities that most significantly impact the entity’s economic performance, and (3) the obligation to absorb losses of the entity or the right to receive benefits from the entity that could potentially be significant to the VIE. When certain events occur, we reconsider whether we are the primary beneficiary of VIEs. We do not reconsider whether we are a primary beneficiary solely because of operating losses incurred by an entity.
Risk and Uncertainties
In the normal course of business, Aircastle encounters several significant types of economic risk including credit, market, aviation industry and capital market risks. Credit risk is the risk of a lessee’s inability or unwillingness to make contractually required payments and to fulfill its other contractual obligations. Market risk reflects the change in the value of financings due to changes in interest rate spreads or other market factors, including the value of collateral underlying financings. Aviation industry risk is the risk of a downturn in the commercial aviation industry which could adversely impact a lessee’s ability to make payments, increase the risk of unscheduled lease terminations and depress lease rates and the value of the Company’s aircraft. Capital market risk is the risk that the Company is unable to obtain capital at reasonable rates to fund the growth of our business or to refinance existing debt facilities.
Use of Estimates
The preparation of financial statements in conformity with U.S. GAAP requires management to make estimates and assumptions that affect the amounts reported in the consolidated financial statements and accompanying notes. While Aircastle believes that the estimates and related assumptions used in the preparation of the consolidated financial statements are appropriate, actual results could differ from those estimates.
Cash and Cash Equivalents and Restricted Cash and Cash Equivalents
Aircastle considers all highly liquid investments with maturities of
three months or less
when purchased to be cash equivalents.
Restricted cash and cash equivalents consists primarily of rent collections, maintenance payments and security deposits received from lessees pursuant to the terms of various lease agreements held in lockbox accounts in accordance with our financings.
Virtually all of our cash and cash equivalents and restricted cash and cash equivalents are held or managed by
three
major financial institutions.
F - 10
Aircastle Limited and Subsidiaries
Notes to Consolidated Financial Statements
(Dollars in thousands, except per share amounts)
Flight Equipment Held for Lease and Depreciation
Flight equipment held for lease is stated at cost and depreciated using the straight-line method, typically over a
25
-year life from the date of manufacture for passenger aircraft and over a
30
to
35
-year life for freighter aircraft, depending on whether the aircraft is a converted or purpose-built freighter, to estimated residual values. Estimated residual values are generally determined to be approximately
15
%
of the manufacturer’s estimated realized price for passenger aircraft when new and
5
%
to
10
%
for freighter aircraft when new. Management may make exceptions to this policy on a case-by-case basis when, in its judgment, the residual value calculated pursuant to this policy does not appear to reflect current expectations of value. Examples of situations where exceptions may arise include but are not limited to:
|
•
|
flight equipment where estimates of the manufacturer’s realized sales prices are not relevant (e.g., freighter conversions);
|
|
•
|
flight equipment where estimates of the manufacturer’s realized sales prices are not readily available; and
|
|
•
|
flight equipment which may have a shorter useful life due to obsolescence.
|
Major improvements and modifications incurred in connection with the acquisition of aircraft that are required to get the aircraft ready for initial service are capitalized and depreciated over the remaining life of the flight equipment.
For planned major maintenance activities for aircraft off-lease, the Company capitalizes the actual maintenance costs by applying the deferral method. Under the deferral method, we capitalize the actual cost of major maintenance events, which are depreciated on a straight-line basis over the period until the next maintenance event is required.
In accounting for flight equipment held for lease, we make estimates about the expected useful lives, the fair value of attached leases, acquired maintenance assets or liabilities and the estimated residual values. In making these estimates, we rely upon actual industry experience with the same or similar aircraft types and our anticipated lessee’s utilization of the aircraft.
For purchase and lease back transactions, we account for the transaction as a single arrangement. We allocate the consideration paid based on the fair value of the aircraft and lease. The fair value of the lease may include a maintenance premium and a lease premium or discount.
When we acquire an aircraft with a lease, determining the fair value of attached leases requires us to make assumptions regarding the current fair values of leases for specific aircraft. We estimate a range of current lease rates of like aircraft in order to determine if the attached lease is within a fair value range. If a lease is below or above the range of current lease rates, we present value the estimated amount below or above the fair value range over the remaining term of the lease. The resulting lease discount or premium is amortized into lease rental income over the remaining term of the lease.
Impairment of Flight Equipment
We perform a recoverability assessment of all aircraft in our fleet, on an aircraft-by-aircraft basis annually during the second quarter. In addition, a recoverability assessment is performed whenever events or changes in circumstances, or indicators, suggest that the carrying amount or net book value of an asset may not be recoverable. Indicators may include, but are not limited to, a significant lease restructuring or early lease termination, significant change in aircraft model’s storage levels, the introduction of newer technology aircraft or engines, an aircraft type is no longer in production or a significant airworthiness directive is issued. When we perform a recoverability assessment, we measure whether the estimated future undiscounted net cash flows expected to be generated by the aircraft exceed its net book value. The undiscounted cash flows consist of cash flows from currently contracted lease rental and maintenance payments, future projected lease rates, transition costs, estimated down time, estimated residual or scrap values for an aircraft, economic conditions and other factors. In the event that an aircraft does not meet the recoverability test, the aircraft will be adjusted to fair value, resulting in an impairment charge. See Note 2 — Fair Value Measurements.
Management develops the assumptions used in the recoverability analysis based on current and future expectations of the global demand for a particular aircraft type and historical experience in the aircraft leasing market and aviation industry, as well as information received from third party industry sources. The factors considered in estimating the undiscounted
F - 11
Aircastle Limited and Subsidiaries
Notes to Consolidated Financial Statements
(Dollars in thousands, except per share amounts)
cash flows are impacted by changes in future periods due to changes in projected lease rental and maintenance payments, residual values, economic conditions, technology, airline demand for a particular aircraft type and other factors.
In monitoring the aircraft in our fleet for impairment charges, we identify those aircraft that are most susceptible to failing the recoverability assessment and monitor those aircraft more closely, which may result in more frequent recoverability assessments. The recoverability in the value of these aircraft is more sensitive to changes in contractual cash flows, future cash flow estimates and residual values or scrap values for each aircraft. These are typically older aircraft for which lessee demand is declining.
Net Investment in Direct Financing and Sales-Type Leases
If a lease meets specific criteria at lease commencement or at the effective date of a lease modification, we recognize the lease as a direct financing or sales-type lease. The net investment in direct financing and sales-type leases consists of the lease receivable, estimated unguaranteed residual value of the leased flight equipment at lease-end and, for direct financing leases, deferred selling profit. For sales-type leases, we recognize the difference between the net book value of the aircraft and the net investment in the lease as a gain or loss on sale of fight equipment. Selling profit on a direct financing lease is deferred and amortized over the lease term, and a selling loss is recognized at lease commencement. Interest income on our net investment in leases is recognized as Direct financing and sales-type lease revenue over the lease term in a manner that produces a constant rate of return on the net investment in the lease.
Collectability of direct financing and sales-type leases is evaluated at lease commencement and periodically during the lease term. The evaluation is performed at an individual customer level and, among other things, considers the credit of the lessee and the value of the underlying aircraft. A loss allowance is established if there is evidence that we will be unable to collect all amounts due according to the contractual terms of the lease. At December 31, 2019, we had
no
allowance for credit losses for our Net investment in direct financing and sales-type leases.
Security Deposits
Most of our operating leases require the lessee to pay Aircastle a security deposit or provide a letter of credit. Security deposits represent cash received from the lessee that is held on deposit until lease expiration. Aircastle’s operating leases also obligate the lessees to maintain flight equipment and comply with all governmental requirements applicable to the flight equipment, including without limitation, operational, maintenance, registration requirements and airworthiness directives.
Maintenance Payments
Typically, under an operating lease, the lessee is responsible for performing all maintenance but they may also be required to make payments to us for heavy maintenance, overhaul or replacement of certain high-value components of the aircraft. These maintenance payments are based on hours or cycles of utilization or on calendar time, depending upon the component, and are required to be made monthly in arrears or at the end of the lease term. Whether to permit a lessee to make maintenance payments at the end of the lease term, rather than requiring such payments to be made monthly, depends on a variety of factors, including the creditworthiness of the lessee, the level of security deposit which may be provided by the lessee and market conditions at the time we enter into the lease. If a lease requires monthly maintenance payments, we would typically be obligated to reimburse the lessee for costs they incur for heavy maintenance, overhaul or replacement of certain high-value components to the extent of maintenance payments received in respect of the specific maintenance event, usually shortly following completion of the relevant work. If a lease requires end of lease term maintenance payments, typically the lessee would be required to pay us for its utilization of the aircraft during the lease; however, in some cases, we may owe a net payment to the lessee in the event heavy maintenance is performed and paid for by the lessee during the lease term and the aircraft is returned to us in better condition than at lease inception.
F - 12
Aircastle Limited and Subsidiaries
Notes to Consolidated Financial Statements
(Dollars in thousands, except per share amounts)
We record monthly maintenance payments by the lessee as accrued maintenance payments liabilities in recognition of our contractual commitment to refund such receipts. In these contracts, we typically do not recognize such maintenance payments as maintenance revenue during the lease. Reimbursements to the lessee upon the receipt of evidence of qualifying maintenance work are charged against the existing accrued maintenance payments liability. We currently defer maintenance revenue recognition of most monthly maintenance payments collected until the end of the lease, when we are able to determine the amount, if any, by which the monthly maintenance payments received from a lessee exceed costs to be incurred by that lessee in performing heavy maintenance. End of lease term maintenance payments made to us are recognized as maintenance revenue, and end of lease term maintenance payments we make to a lessee are recorded as contra maintenance revenue.
Lease Incentives and Amortization
Many of our leases contain provisions which may require us to pay a portion of the lessee’s costs for heavy maintenance, overhaul or replacement of certain high-value components. We account for these expected payments as lease incentives, which are amortized as a reduction of revenue over the life of the lease. We estimate the amount of our portion for such costs, typically for the first major maintenance event for the airframe, engines, landing gear and auxiliary power units, expected to be paid to the lessee based on assumed utilization of the related aircraft by the lessee, the anticipated amount of the maintenance event cost and the estimated amounts the lessee is responsible to pay. The assumptions supporting these estimates are re-evaluated annually.
This estimated lease incentive is not recognized as a lease incentive liability at the inception of the lease. We recognize the lease incentive as a reduction of lease revenue on a straight-line basis over the life of the lease, with the offset being recorded as a lease incentive liability which is included in maintenance payments on the balance sheet. The payment to the lessee for the lease incentive liability is first recorded against the lease incentive liability, and any excess above the lease incentive liability is recorded as a prepaid lease incentive asset, which is included in other assets on the balance sheet and continues to amortize over the remaining life of the lease.
Lease acquisition costs related to reconfiguration of the aircraft cabin, other lessee specific modifications and other direct costs are capitalized and amortized into revenue over the initial life of the lease, assuming no lease renewals, and are included in other assets.
Income Taxes
Aircastle uses an asset and liability based approach in accounting for income taxes. Deferred income tax assets and liabilities are recognized for the future tax consequences attributed to differences between the financial statement and tax basis of existing assets and liabilities using enacted rates applicable to the periods in which the differences are expected to affect taxable income. A valuation allowance is established, when necessary, to reduce deferred tax assets to the amount estimated by us to be realizable. The Company recognizes the tax benefit from an uncertain tax position only if it is more likely than not that the tax position will be sustained on examination by the taxing authorities. We did not have any unrecognized tax benefits.
Lease Revenue Recognition
We lease flight equipment under net operating leases with lease terms typically ranging from
three
to
seven
years. We generally do not offer renewal terms or purchase options in our leases, although certain of our operating leases allow the lessee the option to extend the lease for an additional term. Operating leases with fixed rentals and step rentals are recognized on a straight-line basis over the term of the initial lease, assuming no renewals. Operating lease rentals that adjust based on a London Interbank Offered Rate (“LIBOR”) index are recognized on a straight-line basis over the lease term using the prevailing rate at lease commencement. Changes to rate-based lease rentals are recognized in the statements of income in the period of change. Revenue is not recognized when collection is not reasonably assured. When collectability is not probable, the customer is placed on non-accrual status, and revenue is recognized when cash payments are received.
Comprehensive Income
Comprehensive income consists of net income and other gains and losses, net of income taxes, if any, affecting shareholders’ equity that, under U.S. GAAP, are excluded from net income.
F - 13
Aircastle Limited and Subsidiaries
Notes to Consolidated Financial Statements
(Dollars in thousands, except per share amounts)
Share-Based Compensation
Aircastle recognizes compensation cost relating to share-based payment transactions in the financial statements based on the fair value of the equity instruments issued. Aircastle uses the straight-line method of accounting for compensation cost on share-based payment awards that contain pro-rata vesting provisions.
Deferred Financing Costs
Deferred financing costs, which are included in borrowings from secured and unsecured financings, net of debt issuance costs, in the Consolidated Balance Sheets, are amortized using the interest method for amortizing loans over the lives of the relevant related debt.
Recent Accounting Pronouncements
In June 2016, the FASB issued Accounting Standards Update (“ASU”) No. 2016-13,
Financial Instruments - Credit Losses (Topic 326), Measurement of Credit Losses on Financial Instruments
and related updates. The standard affects entities holding financial assets and net investments in leases that are not accounted for at fair value through net income. The amendments affect loans, debt securities, trade receivables, net investments in leases, off-balance-sheet credit exposures, reinsurance receivables, and any other financial assets not excluded from the scope that have the contractual right to receive cash. The standard takes effect for annual periods beginning after December 15, 2019. The Company’s net investments in direct financing and sales-type leases compose the financial assets principally affected by the standard. Operating lease receivables are not within the scope of ASC 326.
Upon the Company’s adoption of ASC 326 in 2020, our net investments in direct financing and sales-type leases will be recorded in the consolidated financial statements net of an allowance for credit losses. This allowance for credit losses will reflect the Company’s estimate of lessee default probabilities and loss given default percentages. This estimate of expected credit losses will consider relevant information about past events, current conditions, and reasonable and supportable forecasts that affect the collectability of reported amounts. Additional consideration will be given for potential non-credit losses to unguaranteed residual values. We will adopt the standard using the “modified retrospective” approach with a January 1, 2020 adjustment to the opening balance of retained earnings. The adoption of the standard will not have a material impact on our consolidated financial statements or related disclosures.
In August 2018, the FASB issued ASU No. 2018-13,
Fair Value Measurement (Topic 820), Disclosure Framework-Changes to the Disclosure Requirements for Fair Value Measurement
. The standard modifies certain disclosure requirements for fair value measurements as part of its disclosure framework project. The standard is effective for annual periods beginning after December 15, 2019, including interim periods within those fiscal years. Early adoption is permitted. The adoption of the standard will not have a material impact on our consolidated financial statements or related disclosures.
In August 2018, the FASB issued ASU No. 2018-15,
Intangibles-Goodwill and Other-Internal-Use Software (Subtopic 350-40), Customer’s Accounting for Implementation Costs Incurred in a Cloud Computing Arrangement that is a Service Contract.
The standard requires a customer in a cloud computing arrangement that is a service contract to follow the internal-use-software guidance in ASC 350-40 to determine which implementation costs to capitalize as assets or expense as incurred. The standard is effective for annual periods beginning after December 15, 2019, including interim periods within those fiscal years. Early adoption is permitted, including adoption in any interim period. The adoption of the standard will not have a material impact on our consolidated financial statements or related disclosures.
In October 2018, the FASB issued ASU No. 2018-17,
Consolidation (Topic 810), Targeted Improvements to Related Party Guidance for Variable Interest Entities
. The standard changes how all entities evaluate decision-making fees under the variable interest entity guidance. The standard is applied retrospectively with a cumulative-effect adjustment to retained earnings at the beginning of the earliest period presented. The standard is effective for annual periods beginning after December 15, 2019, including interim periods within those fiscal years. Early adoption is permitted. The adoption of the standard will not have a material impact on our consolidated financial statements or related disclosures.
F - 14
Aircastle Limited and Subsidiaries
Notes to Consolidated Financial Statements
(Dollars in thousands, except per share amounts)
Fair value measurements and disclosures require the use of valuation techniques to measure fair value that maximize the use of observable inputs and minimize use of unobservable inputs. These inputs are prioritized as follows:
|
•
|
Level 1: Observable inputs such as quoted prices in active markets for identical assets or liabilities.
|
|
•
|
Level 2: Inputs other than quoted prices included within Level 1 that are observable, either directly or indirectly, such as quoted prices for similar assets or liabilities or market corroborated inputs.
|
|
•
|
Level 3: Unobservable inputs for which there is little or no market data and which require us to develop our own assumptions about how market participants price the asset or liability.
|
The valuation techniques that may be used to measure fair value are as follows:
|
•
|
The market approach uses prices and other relevant information generated by market transactions involving identical or comparable assets or liabilities.
|
|
•
|
The income approach uses valuation techniques to convert future amounts to a single present amount based on current market expectation about those future amounts.
|
|
•
|
The cost approach is based on the amount that currently would be required to replace the service capacity of an asset (replacement cost).
|
The following tables set forth our financial assets and liabilities as of
December 31, 2019
and
2018
that we measured at fair value on a recurring basis by level within the fair value hierarchy. Assets and liabilities measured at fair value are classified in their entirety based on the lowest level of input that is significant to their fair value measurement.
|
|
Fair Value
as of
December 31,
2019
|
Fair Value Measurements at December 31, 2019
Using Fair Value Hierarchy
|
|||||||||||||||
|
|
Level 1
|
Level 2
|
Level 3
|
Valuation
Technique
|
|||||||||||||
|
Assets
:
|
|||||||||||||||||
|
Cash and cash equivalents
|
$
|
|
|
$
|
|
|
$
|
|
|
$
|
|
|
Market
|
||||
|
Restricted cash and cash equivalents
|
|
|
|
|
|
|
|
|
Market
|
||||||||
|
Derivative assets
|
|
|
|
|
|
|
|
|
Market
|
||||||||
|
Total
|
$
|
|
|
$
|
|
|
$
|
|
|
$
|
|
|
|||||
|
|
Fair Value
as of December 31, 2018 |
Fair Value Measurements at December 31, 2018
Using Fair Value Hierarchy
|
|||||||||||||||
|
|
Level 1
|
Level 2
|
Level 3
|
Valuation
Technique |
|||||||||||||
|
Assets
:
|
|||||||||||||||||
|
Cash and cash equivalents
|
$
|
|
|
$
|
|
|
$
|
|
|
$
|
|
|
Market
|
||||
|
Restricted cash and cash equivalents
|
|
|
|
|
|
|
|
|
Market
|
||||||||
|
Derivative assets
|
|
|
|
|
|
|
|
|
Market
|
||||||||
|
Total
|
$
|
|
|
$
|
|
|
$
|
|
|
$
|
|
|
|||||
Our cash and cash equivalents, along with our restricted cash and cash equivalents balances, consist largely of money market securities that are considered to be highly liquid and easily tradable. These securities are valued using inputs observable in active markets for identical securities and are therefore classified as Level 1 within our fair value hierarchy. Our interest rate derivative included in Level 2 consists of United States dollar-denominated interest rate cap, and its fair value is based on the market comparisons for similar instruments. We also considered the credit rating and risk of the counterparty providing the interest rate cap based on quantitative and qualitative factors.
For the years ended
December 31, 2019
and
2018
, we had
no
transfers into or out of Level 3.
We measure the fair value of certain assets and liabilities on a non-recurring basis, when U.S. GAAP requires the application of fair value, including events or changes in circumstances that indicate that the carrying amounts of assets may
F - 15
Aircastle Limited and Subsidiaries
Notes to Consolidated Financial Statements
(Dollars in thousands, except per share amounts)
not be recoverable. Assets subject to these measurements include our investment in unconsolidated joint ventures and aircraft. We record aircraft at fair value when we determine the carrying value may not be recoverable. Fair value measurements for aircraft in impairment tests are based on an income approach which uses Level 3 inputs, which include the Company’s assumptions and appraisal data as to future cash proceeds from leasing and selling aircraft.
We account for our investment in unconsolidated joint ventures under the equity method of accounting. Investments are recorded at cost and are adjusted by undistributed earnings and losses and the distributions of dividends and capital. These investments are also reviewed for impairment whenever events or circumstances indicate the fair value is less than its carrying value and the decline is other-than-temporary.
Aircraft Valuation
Transactional Impairments
On April 10, 2019, the Company early terminated the leases for
seven
Boeing 737NG aircraft on lease to Jet Airways (India) Limited (“Jet Airways”) due to lessee default. As a result of these lease terminations, the Company recognized net maintenance revenue of
$
17,554
and impairment charges of
$
7,404
in the second quarter of 2019. We did not record any transactional impairments during
2018
.
Annual Recoverability Assessment
We completed our annual recoverability assessment of our aircraft in the second quarter this year. We also performed aircraft-specific analyses where there were changes in circumstances, such as approaching lease expirations. Other than the transactional impairment discussed above,
no
other impairments were recorded during 2019.
The recoverability assessment is a comparison of the carrying value of each aircraft to its undiscounted expected future cash flows. We develop the assumptions used in the recoverability assessment, including those relating to current and future demand for each aircraft type, based on management’s experience in the aircraft leasing industry, as well as information received from third-party sources. Estimates of the undiscounted cash flows for each aircraft type are impacted by changes in contracted and future expected lease rates, residual values, expected scrap values, economic conditions and other factors.
Management believes that the net book value of each aircraft is currently supported by the estimated future undiscounted cash flows expected to be generated by that aircraft and, accordingly,
no
aircraft were impaired as a consequence of our annual recoverability assessment. However, if our estimates or assumptions change, we may revise our cash flow assumptions and record future impairment charges. While we believe that the estimates and related assumptions used in the annual recoverability assessment are appropriate, actual results could differ from those estimates.
Financial Instruments
Our financial instruments, other than cash, consist principally of cash equivalents, restricted cash and cash equivalents, accounts receivable, accounts payable, amounts borrowed under financings and interest rate derivatives. The fair value of cash, cash equivalents, restricted cash and cash equivalents, accounts receivable and accounts payable approximates the carrying value of these financial instruments because of their short-term nature.
The fair value of our senior notes is estimated using quoted market prices. The fair values of all our other financings are estimated using a discounted cash flow analysis, based on our current incremental borrowing rates for similar types of borrowing arrangements.
The carrying amounts and fair values of our financial instruments at
December 31, 2019
and
2018
are as follows:
F - 16
Aircastle Limited and Subsidiaries
Notes to Consolidated Financial Statements
(Dollars in thousands, except per share amounts)
|
|
December 31, 2019
|
December 31, 2018
|
|||||||||||||
|
|
Carrying Amount
of Liability
|
Fair Value
of Liability
|
Carrying Amount
of Liability
|
Fair Value
of Liability
|
|||||||||||
|
Credit Facilities
|
$
|
|
|
$
|
|
|
$
|
|
|
$
|
|
|
|||
|
Unsecured Term Loan
|
|
|
|
|
|
|
|
|
|||||||
|
ECA Financings
|
|
|
|
|
|
|
|
|
|||||||
|
Bank Financings
|
|
|
|
|
|
|
|
|
|||||||
|
Senior Notes
|
|
|
|
|
|
|
|
|
|||||||
All of our financial instruments are classified as Level 2 with the exception of our senior notes, which are classified as Level 1.
Minimum future annual lease rentals contracted to be received under our existing operating leases of flight equipment at
December 31, 2019
were as follows:
|
Year Ended December 31,
|
Amount
|
||
|
2020
|
$
|
|
|
|
2021
|
|
|
|
|
2022
|
|
|
|
|
2023
|
|
|
|
|
2024
|
|
|
|
|
Thereafter
|
|
|
|
|
Total
|
$
|
|
|
Geographic concentration of lease rental revenue earned from flight equipment held for lease was as follows:
|
Year Ended December 31,
|
||||||||
|
Region
|
2019
|
2018
|
2017
|
|||||
|
Asia and Pacific
|
|
%
|
|
%
|
|
%
|
||
|
Europe
|
|
%
|
|
%
|
|
%
|
||
|
Middle East and Africa
|
|
%
|
|
%
|
|
%
|
||
|
North America
|
|
%
|
|
%
|
|
%
|
||
|
South America
|
|
%
|
|
%
|
|
%
|
||
|
Total
|
|
%
|
|
%
|
|
%
|
||
The classification of regions in the table above and in the tables and discussion below is determined based on the principal location of the lessee of each aircraft.
The following table shows the number of lessees with lease rental revenue of at least
5%
of total lease rental revenue and their combined total percentage of lease rental revenue for the periods indicated:
|
Year Ended December 31,
|
2019
|
2018
|
2017
|
||||||||
|
Number of Lessees
|
Combined % of
Lease Rental Revenue
|
Number of Lessees
|
Combined % of
Lease Rental Revenue
|
Number of Lessees
|
Combined % of
Lease Rental Revenue
|
||||||
|
Largest lessees by lease rental revenue
|
|
|
|
|
|
|
|||||
F - 17
Aircastle Limited and Subsidiaries
Notes to Consolidated Financial Statements
(Dollars in thousands, except per share amounts)
The following table sets forth revenue attributable to individual countries representing at least
10%
of total revenue (including maintenance revenue) based on each lessee’s principal place of business for the periods indicated:
|
Year Ended December 31,
|
2019
|
2018
|
2017
|
||||||||||||||
|
Country
|
Revenue
|
% of
Total
Revenue
|
Revenue
|
% of
Total
Revenue
|
Revenue
|
% of
Total
Revenue
|
|||||||||||
|
Brazil
(1)
|
$
|
|
|
|
$
|
|
|
|
$
|
|
|
|
|||||
|
India
(2)
|
|
|
|
|
|
|
|
|
|
||||||||
______________
|
(1)
|
For the year ended
December 31, 2018
, total revenue included
$
|
|
(2)
|
For the year ended
December 31, 2019
, total revenue attributable to India included maintenance revenue of
$
|
Geographic concentration of net book value of flight equipment (including flight equipment held for lease and net investment in direct financing and sales-type leases, or “net book value”) was as follows:
|
|
December 31, 2019
|
December 31, 2018
|
|||||||||
|
Region
|
Number of
Aircraft
|
Net Book
Value %
|
Number of
Aircraft
|
Net Book
Value %
|
|||||||
|
Asia and Pacific
|
|
|
|
%
|
|
|
|
%
|
|||
|
Europe
|
|
|
|
%
|
|
|
|
%
|
|||
|
Middle East and Africa
|
|
|
|
%
|
|
|
|
%
|
|||
|
North America
|
|
|
|
%
|
|
|
|
%
|
|||
|
South America
|
|
|
|
%
|
|
|
|
%
|
|||
|
Off-lease
|
|
|
(1)
|
|
%
|
|
|
(2)
|
|
%
|
|
|
Total
|
|
|
|
%
|
|
|
|
%
|
|||
|
(1)
|
Consisted of
|
|
(2)
|
Consisted of
|
The following table sets forth net book value of flight equipment (includes net book value of flight equipment held for lease and net investment in direct financing and sales-type leases) attributable to individual countries representing at least
10%
of net book value of flight equipment based on each lessee’s principal place of business as of:
|
|
December 31, 2019
|
December 31, 2018
|
|||||||||
|
Region
|
Net Book
Value
|
Net Book
Value %
|
Number
of
Lessees
|
Net Book
Value
|
Net Book
Value %
|
Number
of
Lessees
|
|||||
|
India
|
$
|
|
|
|
|
$
|
|
|
|
|
|
At
December 31, 2019
and
2018
, the amounts of lease incentive liabilities recorded in maintenance payments on the Consolidated Balance Sheets were
$
9,176
and
$
15,636
, respectively.
F - 18
Aircastle Limited and Subsidiaries
Notes to Consolidated Financial Statements
(Dollars in thousands, except per share amounts)
At
December 31, 2019
, our net investment in direct financing and sales-type leases consisted of
29
aircraft.
The components of our net investment in direct financing and sales-type leases at
December 31, 2019
are as follows:
|
Amount
|
|||
|
Lease receivable
|
$
|
|
|
|
Unguaranteed residual value of flight equipment
|
|
|
|
|
Net investment in direct financing and sales-type leases
|
$
|
|
|
At
December 31, 2019
, future lease payments on direct financing and sales-type leases are as follows:
|
Year Ending December 31,
|
Amount
|
||
|
2020
|
$
|
|
|
|
2021
|
|
|
|
|
2022
|
|
|
|
|
2023
|
|
|
|
|
2024
|
|
|
|
|
Thereafter
|
|
|
|
|
Total undiscounted lease payments
|
|
|
|
|
Present value of lease payments - lease receivable
|
(
|
)
|
|
|
Difference between undiscounted lease payments and lease receivable
|
$
|
|
|
We have joint ventures with an affiliate of Ontario Teachers’ Pension Plan (“Teachers’”) and with Mizuho Leasing.
|
Amount
|
||||
|
Investment in joint ventures at December 31, 2017
|
$
|
|
|
|
|
Investment in joint ventures
|
|
|
||
|
Loss from joint ventures, net of tax
|
(
|
)
|
||
|
Distributions
|
(
|
)
|
||
|
Investment in joint ventures at December 31, 2018
|
$
|
|
|
|
|
Investment in joint ventures
|
|
|
||
|
Earnings from joint ventures, net of tax
|
|
|
||
|
Distributions
|
(
|
)
|
||
|
Guarantee liabilities
|
(
|
)
|
||
|
Investment in joint venture at December 31, 2019
|
$
|
|
|
|
During 2019, the sale of all
eight
aircraft held by the joint venture with Teachers’ to a single buyer was completed. Included in Other revenue is
$
5,431
in fees earned in relation to the sale of all
eight
aircraft in our Lancaster joint venture. Guarantee liabilities in Maintenance payments and Security deposits were offset against the investment in joint venture, as we had no further obligations due to the sale of the joint venture’s aircraft. Teachers’, as majority shareholder, chose to liquidate the joint venture and as a result we received a distribution of
$
36,750
during 2019. As of
December 31, 2019
, minimal assets remain in the joint venture as needed to complete its liquidation during 2020.
In 2019, we sold
four
aircraft to IBJ Air, in which we hold a
25
%
equity interest. Included in Other revenue is
$
1,985
in fees earned in relation to IBJ Air’s acquisition of these
four
aircraft. These transactions were approved by our Audit Committee as arm’s length transactions under our related party policy. At
December 31, 2019
, the net book value of the IBJ Air joint venture’s
nine
aircraft was
$
327,839
.
F - 19
Aircastle Limited and Subsidiaries
Notes to Consolidated Financial Statements
(Dollars in thousands, except per share amounts)
Aircastle consolidates
four
VIEs of which it is the primary beneficiary. The operating activities of these VIEs are limited to acquiring, owning, leasing, maintaining, operating and, under certain circumstances, selling the
six
aircraft discussed below.
ECA Financings
Aircastle, through various subsidiaries, each of which is owned by a charitable trust (such entities, collectively the “Air Knight VIEs”), has entered into
six
different
twelve
-year term loans, which are supported by guarantees from Compagnie Francaise d’ Assurance pour le Commerce Extérieur (“COFACE”), the French government sponsored export credit agency (“ECA”). We refer to these COFACE-supported financings as “ECA Financings.”
Aircastle is the primary beneficiary of the Air Knight VIEs, as we have the power to direct the activities of the VIEs that most significantly impact the economic performance of such VIEs and we bear the significant risk of loss and participate in gains through a finance lease. The activity that most significantly impacts the economic performance is the leasing of aircraft of which our wholly owned subsidiary is the servicer and is responsible for managing the relevant aircraft. There is a cross collateralization guarantee between the Air Knight VIEs. In addition, Aircastle guarantees the debt of the Air Knight VIEs.
The only assets that the Air Knight VIEs have on their books are net investments in direct financing and sales-type leases that are eliminated in the consolidated financial statements. The related aircraft, with a net book value as of
December 31, 2019
of
$
376,630
, were included in our flight equipment held for lease. The consolidated debt outstanding, net of debt issuance costs, of the Air Knight VIEs as of
December 31, 2019
is
$
145,443
.
F - 20
Aircastle Limited and Subsidiaries
Notes to Consolidated Financial Statements
(Dollars in thousands, except per share amounts)
The outstanding amounts of our secured and unsecured term debt financings were as follows:
|
|
At December 31, 2019
|
At
December 31, 2018
|
||||||||||||
|
Debt Obligation
|
Outstanding
Borrowings
|
Number of Aircraft
|
Interest Rate
|
Final Stated
Maturity
|
Outstanding
Borrowings
|
|||||||||
|
Secured Debt Financings:
|
||||||||||||||
|
ECA Financings
(1)
|
$
|
|
|
|
|
3.02% to 3.96%
|
12/03/21 to 11/30/24
|
$
|
|
|
||||
|
Bank Financings
(2)
|
|
|
|
|
3.13% to 4.63%
|
06/17/23 to 01/19/26
|
|
|
||||||
|
Less: Debt Issuance Costs
|
(
|
)
|
(
|
)
|
||||||||||
|
Total secured debt financings, net of debt issuance costs and discounts
|
|
|
|
|
|
|
||||||||
|
Unsecured Debt Financings:
|
||||||||||||||
|
Senior Notes due 2019
(3)
|
|
|
|
|
||||||||||
|
Senior Notes due 2020
|
|
|
|
04/15/20
|
|
|
||||||||
|
Senior Notes due 2021
|
|
|
|
03/15/21
|
|
|
||||||||
|
Senior Notes due 2022
|
|
|
|
02/15/22
|
|
|
||||||||
|
Senior 5.00% Notes due 2023
|
|
|
|
04/01/23
|
|
|
||||||||
|
Senior 4.40% Notes due 2023
|
|
|
|
09/25/23
|
|
|
||||||||
|
Senior Notes due 2024
|
|
|
|
05/01/24
|
|
|
||||||||
|
Senior Notes due 2026
|
|
|
|
06/15/26
|
|
|
||||||||
|
Unsecured Term Loan
|
|
|
|
03/07/22 to 03/07/24
|
|
|
||||||||
|
Revolving Credit Facilities
|
|
|
3.21% to 3.41%
|
12/27/21 to 06/27/22
|
|
|
||||||||
|
Less: Debt issuance costs and discounts
|
(
|
)
|
(
|
)
|
||||||||||
|
Total unsecured debt financings, net of debt issuance costs and discounts
|
|
|
|
|
||||||||||
|
Total secured and unsecured debt financings, net of debt issuance costs and discounts
|
$
|
|
|
$
|
|
|
||||||||
|
(1)
|
The borrowings under these financings at
December 31, 2019
have a weighted-average rate of interest of
|
|
(2)
|
The borrowings under these financings at
December 31, 2019
have a weighted-average fixed rate of interest of
|
|
(3)
|
Repaid on July 15, 2019.
|
Secured Debt Financing:
Bank Financings
On May 1, 2019, we entered into a full recourse
$
320,000
secured bank financing with BNP Paribas and Société Générale in relation to
eight
Airbus A320-200neo aircraft on lease with a customer in Asia. This financing bears interest at a fixed rate of
3.61
%
and matures in September 2024. In addition, on May 1, 2019, we entered into a full recourse
$
120,000
secured bank financing with Crédit Agricole in relation to
three
Airbus A320-200neo aircraft on lease with a customer in Asia. This financing bears interest at a fixed rate of
3.13
%
and matures in March 2025.
On June 26, 2019, we amended and restated the original loan agreement, dated October 11, 2018, with National Bank of Australia to include an additional
$
40,000
in financing for
two
Boeing 737-800 aircraft on lease with a customer in North America. This financing bears interest at a fixed rate of
3.14
%
and matures in December 2024.
F - 21
Aircastle Limited and Subsidiaries
Notes to Consolidated Financial Statements
(Dollars in thousands, except per share amounts)
Unsecured Debt Financings:
Senior Notes due 2026
On June 13, 2019, Aircastle issued
$
650,000
aggregate principal amount of Senior Notes due 2026 (the “Senior Notes due 2026”) at an issue price of
99.515
%
. The Senior Notes due 2026 will mature on June 15, 2026 and bear interest at the rate of
4.250
%
per annum, payable semi-annually on June 15 and December 15 of each year, commencing on December 15, 2019. Interest accrues on the Senior Notes due 2026 from June 13, 2019.
Prior to April 15, 2026, we may redeem all or part of the aggregate principal amount of the Senior Notes due 2026 at any time at a redemption price equal to the greater of (a)
100
%
of the principal amount of the notes redeemed, plus accrued and unpaid interest thereon to, but not including, the redemption date and (b) the sum of the present values of
100
%
of the principal amount of the notes redeemed and the remaining scheduled payments of interest on the notes from the redemption date through April 15, 2026 (computed using a discount rate equal to the Treasury Rate (as defined in the indenture governing the Senior Notes due 2026) as of such redemption date plus
0.35
%
, plus accrued and unpaid interest thereon to, but not including, the redemption date). In addition, on or after April 15, 2026, we may redeem all or part of the aggregate principal amount of the Senior Notes due 2026 at a redemption price equal to
100
%
, plus accrued and unpaid interest thereon to, but not including, the redemption date. If the Company undergoes a change of control (as defined in the indenture governing the Senior Notes due 2026) and, as a result of the change of control, the rating of the Senior Notes due 2026 is downgraded to below an investment grade rating by certain rating agencies in the manner specified in the indenture governing the Senior Notes due 2026, it must offer to repurchase the Senior Notes due 2026 at a price of
101
%
of the principal amount thereof, plus accrued and unpaid interest to, but not including, the purchase date. The Senior Notes due 2026 are not guaranteed by any of the Company's subsidiaries or any third-party.
The net proceeds from the issuance were used to repay amounts drawn under our existing revolving credit facility and to redeem the balance of our
6.25
%
Senior Notes due 2019, including accrued interest of
$
3,733
and call premium of
$
7,183
, on July 15, 2019.
Unsecured Term Loan
On February 27, 2019, we entered into an aggregate
$
215,000
floating rate loan commitment with Development Bank of Japan Inc. and certain other banks (the “Unsecured Term Loan”). This loan is split into
two
tranches: Tranche A for
$
60,000
with a
three
-year term; and Tranche B for
$
155,000
with a
five
-year term. The loan contains a
$
750,000
minimum net worth covenant, along with other customary provisions similar to our revolving credit facilities. This loan was funded in March 2019.
The new Unsecured Term Loan replaced our existing term loan of
$
120,000
that matured on April 28, 2019.
Revolving Credit Facility
On December 27, 2018, we entered into a
$
250,000
three
-year, unsecured revolving credit facility with a group of banks based in Asia. This new facility can be increased to a maximum of
$
350,000
. On January 25, 2019, we increased the facility by
$
30,000
to
$
280,000
. On June 20, 2019, we further increased the facility by
$
20,000
to
$
300,000
. The facility bears interest at a rate of LIBOR plus
1.50
%
and matures in December 2021. The facility contains provisions similar to our existing credit facility, including a
$
750,000
minimum net worth covenant.
As a condition to this new facility, on January 9, 2019, we terminated our existing
$
135,000
revolving credit facility with a group of banks based in Asia.
At
December 31, 2019
, we had
$
150,000
outstanding under our revolving credit facilities and had
$
950,000
available.
F - 22
Aircastle Limited and Subsidiaries
Notes to Consolidated Financial Statements
(Dollars in thousands, except per share amounts)
Maturities of the secured and unsecured debt financings over the next five years and thereafter are as follows:
|
Year Ending December 31,
|
Amount
|
||
|
2020
|
$
|
|
|
|
2021
|
|
|
|
|
2022
|
|
|
|
|
2023
|
|
|
|
|
2024
|
|
|
|
|
Thereafter
|
|
|
|
|
Total
|
$
|
|
|
On March 21, 2017, the Board of Directors adopted the Aircastle Limited Amended and Restated 2014 Omnibus Incentive Plan (the “Amended and Restated 2014 Plan”). The Amended and Restated 2014 Plan was approved by shareholders at the Company’s 2017 Annual General Meeting of Shareholders on May 19, 2017.
The maximum number of Common Shares reserved for issuance under the Amended and Restated 2014 Plan is
6,750,000
Common Shares. Restricted common shares outstanding under prior plans in the amount of
333,974
shares will continue to vest subject to the terms and conditions of the prior plans and the applicable awards agreements which are included in the below table.
The purpose of the Amended and Restated 2014 Plan is to provide an incentive to selected officers, employees, non-employee directors, independent contractors, and consultants of the Company or its affiliates whose contributions are essential to the growth and success of the business of the Company and its affiliates, to strengthen the commitment of such persons to the Company and its affiliates, motivate such persons to faithfully and diligently perform their responsibilities and attract and retain competent and dedicated persons whose efforts will result in the long-term growth and profitability of the Company and its affiliates. To accomplish such purposes, the Company may grant options, share appreciation rights, restricted shares, restricted share units, share bonuses, other share-based awards, cash awards or any combination of the foregoing. The Amended and Restated 2014 Plan provides that grantees of restricted common shares will have all of the rights of shareholders, including the right to receive dividends, other than the right to sell, transfer, assign or otherwise dispose of the shares until the lapse of the restricted period. Generally, the restricted common shares vest over
three
to
five
-year periods based on continued service and are being expensed on a straight-line basis over the requisite service period of the awards. The terms of the grants provide for accelerated vesting under certain circumstances, including termination without cause following a change of control.
F - 23
Aircastle Limited and Subsidiaries
Notes to Consolidated Financial Statements
(Dollars in thousands, except per share amounts)
A summary of the fair value of non-vested restricted common shares for the years ended
December 31, 2019
,
2018
and
2017
is as follows:
|
Non-vested Shares
|
Shares
(in thousands)
|
Weighted
Average
Grant Date
Fair Value ($)
|
||||
|
Non-vested at December 31, 2016
|
|
|
$
|
|
|
|
|
Granted
|
|
|
|
|
||
|
Canceled
|
(
|
)
|
|
|
||
|
Vested
|
(
|
)
|
|
|
||
|
Non-vested at December 31, 2017
|
|
|
$
|
|
|
|
|
Granted
|
|
|
|
|
||
|
Canceled
|
(
|
)
|
|
|
||
|
Vested
|
(
|
)
|
|
|
||
|
Non-vested at December 31, 2018
|
|
|
$
|
|
|
|
|
Granted
|
|
|
|
|
||
|
Canceled
|
(
|
)
|
|
|
||
|
Vested
|
(
|
)
|
|
|
||
|
Vesting-accelerated
(1)
|
(
|
)
|
|
|
||
|
Non-vested at December 31, 2019
|
|
|
$
|
|
|
|
_______________
(1) See “
Share-based Compensation Related to Proposed Merger
” below
.
The fair value of the restricted common shares granted in
2019
,
2018
and
2017
were determined based upon the market price of the shares at the grant date.
Performance Share Units
During
2019
, the Company issued performance share units (“PSUs”) to certain employees. These awards were made under the Amended and Restated 2014 Plan. The PSUs are denominated in share units without dividend rights, each of which is equivalent to one common share, and are subject to market and performance conditions and time vesting.
The PSUs granted in
2019
vest at the end of a
three
-year performance period which ends on December 31, 2021. Half of the PSUs vest on achieving relative total stockholder return goals (the “TSR PSUs”) while the other half vest on attaining annual Adjusted Return on Equity goals (the “AROE PSUs”).
The table below shows the PSU awards issued during
2019
, including the number of common shares underlying the awards at the time of issuance:
|
Minimum
|
Target
|
Maximum
|
||||||
|
TSR PSUs
|
|
|
|
|
|
|
||
|
AROE PSUs
|
|
|
|
|
|
|
||
|
Total
|
|
|
|
|
|
|
||
The fair value of the time-based TSR PSUs was determined at the grant date using a Monte Carlo simulation model. Included in the Monte Carlo simulation model were certain assumptions regarding a number of highly complex and subjective variables, such as expected volatility, risk-free interest rate and dividend yield. To appropriately value the award, the risk-free interest rate is estimated for the time period from the valuation date until the vesting date and the historical volatilities were estimated based on a historical time frame equal to the time from the valuation date until the end date of the performance period. The number of TSR PSUs that will ultimately vest is based on the percentile ranking of the Company’s TSR among the S&P Midcap 400 Index. The number of shares that will ultimately vest will range from
0
%
to
200
%
of the target TSR PSUs.
F - 24
Aircastle Limited and Subsidiaries
Notes to Consolidated Financial Statements
(Dollars in thousands, except per share amounts)
The following table summarizes the assumption ranges used in calculating the fair value of TSR PSUs during the following periods:
|
Year Ended December 31,
|
|||||
|
2019
|
2018
|
2017
|
|||
|
Volatility
|
24.8% to 32.6%
|
24.8% to 32.6%
|
29.4% to 32.6%
|
||
|
Dividend yield
|
4.3% to 5.5%
|
4.3% to 4.9%
|
4.3%
|
||
|
Risk-free interest rate
|
1.4% to 2.6%
|
0.8% to 2.6%
|
0.8% to 1.5%
|
||
The number of shares vesting from the AROE PSUs at the end of the
three
-year performance period will depend on the Company’s Adjusted Return on Equity as measured against the targets set by the Compensation Committee annually during the performance period, consistent with the business plan approved by the Board. The fair value of the
2019
AROE PSUs was determined based on the closing market price of the Company’s common shares on the date of grant reduced by the present value of expected dividends to be paid. The number of shares that will ultimately vest will range from
0
%
to
200
%
of the target AROE PSUs.
During
2019
, the Company granted a target of
225,044
PSUs of which,
168,784
are TSR PSUs and
56,260
are AROE PSUs. As of
December 31, 2019
, the remaining target AROE PSUs will be considered granted upon the Compensation Committee’s setting the target AROE for the respective periods:
|
Remaining AROE
Target PSUs
|
|||||
|
2020
|
2021
|
||||
|
2018 PSUs
|
|
|
|
|
|
|
2019 PSUs
|
|
|
|
|
|
The following table summarizes the activities for our unvested PSUs for the years ended
December 31, 2019
,
2018
and
2017
:
|
Unvested Performance Stock Units
|
|||||||||||||
|
Number of Units of TSR PSUs
|
Number of Units of AROE PSUs
|
TSR PSUs Weighted Fair Value on Date of Grant ($)
|
AROE PSUs
Weighted Fair
Value on Date
of Grant ($)
|
||||||||||
|
Unvested at December 31, 2016
|
|
|
|
|
$
|
|
|
$
|
|
|
|||
|
Granted
(1)
|
|
|
|
|
|
|
|
|
|||||
|
Vested
|
(
|
)
|
(
|
)
|
|
|
|
|
|||||
|
Canceled/Forfeited
(2)
|
|
|
(
|
)
|
|
|
|
|
|||||
|
Unvested at December 31, 2017
|
|
|
|
|
$
|
|
|
$
|
|
|
|||
|
Granted
(1)
|
|
|
|
|
|
|
|
|
|||||
|
Vested
|
|
|
(
|
)
|
|
|
|
|
|||||
|
Canceled/Forfeited
(2)
|
(
|
)
|
(
|
)
|
|
|
|
|
|||||
|
Unvested as of December 31, 2018
|
|
|
|
|
$
|
|
|
$
|
|
|
|||
|
Granted
(1)
|
|
|
|
|
|
|
|
|
|||||
|
Vested
|
(
|
)
|
(
|
)
|
|
|
|
|
|||||
|
Canceled/Forfeited
(2)
|
(
|
)
|
(
|
)
|
|
|
|
|
|||||
|
Vesting-accelerated
(3)
|
(
|
)
|
(
|
)
|
|
|
|
|
|||||
|
Unvested as of December 31, 2019
|
|
|
|
|
$
|
|
|
$
|
|
|
|||
|
Expected to vest after December 31, 2019
|
|
|
|
|
$
|
|
|
$
|
|
|
|||
______________
|
(1)
|
Also includes shares above target.
|
|
(2)
|
Represents performance share units that were below target and as a result were forfeited.
|
|
(3)
|
See “
Share-based Compensation Related to Proposed Merger”
below.
|
F - 25
Aircastle Limited and Subsidiaries
Notes to Consolidated Financial Statements
(Dollars in thousands, except per share amounts)
During
2019
, the Company incurred share-based compensation expense of
$
6,602
related to restricted common shares and
$
9,228
related to PSUs.
As of
December 31, 2019
, the Company has unrecognized compensation cost, adjusted for actual forfeitures, of
$
2,965
related to non-vested restricted common shares and
$
3,367
related to PSUs, which is expected to be recognized over a weighted average period of
1.96
years. In addition, there is
$
15,149
of unrecognized expense due to the acceleration of RSAs and PSUs related to the Merger Agreement, which will be amortized through the estimated closing date.
Share-based Compensation Related to Proposed Merger
In connection with the Merger, the Company reserved the right to take certain actions, following reasonable consultation with Parent, to reduce the amount of any potential “parachute payments” subject to the excise tax imposed under Section 4999 of the Internal Revenue Code (including amounts payable to the Company’s executive officers), including accelerating the vesting and payment of certain equity and restricted cash awards and the payment of certain incentive compensation payments into 2019.
Effective as of December 24, 2019, the Company accelerated the vesting and payment of certain PSUs and the vesting of certain restricted share awards held by the Company’s executive officers provided that, as set forth in the employment agreement amendments, if the executive officer is terminated for cause or resigns without “good reason” (as defined in the executive officer’s employment agreement) prior to the earlier of the consummation of the Merger or the termination of the Merger Agreement, the executive officer must repay to the Company the gross amount of the accelerated awards. In addition, the Merger Agreement contains additional repayment provisions as such if the Merger Agreement terminates.
Cash bonuses were accelerated and paid based on the target level of performance. Any difference between the amounts accelerated for PSUs or bonuses paid in 2019 and the amounts earned based on actual performance for 2019 will be trued-up and paid to the executive officer (or repaid by the executive officer, if applicable) on the normal payment dates for such compensation in 2020.
On May 17, 2019, our Board of Directors increased the authorization to repurchase the Company’s common shares to
$
100,000
from the
$
76,019
that was remaining under the previous authorization. During
2019
, we repurchased
973,528
common shares at an aggregate cost of
$
18,382
, including commissions. At
December 31, 2019
, the remaining dollar value of common shares that may be purchased under the repurchase program is
$
90,351
. We also repurchased
640,452
shares totaling
$
18,357
from our employees and directors to settle tax obligations related to share vesting.
F - 26
Aircastle Limited and Subsidiaries
Notes to Consolidated Financial Statements
(Dollars in thousands, except per share amounts)
The following table sets forth the quarterly dividends declared by our Board of Directors for the three years ended
December 31, 2019
:
|
Declaration Date
|
Dividend per
Common Share
|
Aggregate
Dividend
Amount
|
Record Date
|
Payment Date
|
|||||||
|
October 28, 2019
|
$
|
|
|
$
|
|
|
November 29, 2019
|
December 13, 2019
|
|||
|
August 2, 2019
|
$
|
|
|
$
|
|
|
August 30, 2019
|
September 16, 2019
|
|||
|
April 30, 2019
|
$
|
|
|
$
|
|
|
May 31, 2019
|
June 14, 2019
|
|||
|
February 8, 2019
|
$
|
|
|
$
|
|
|
February 28, 2019
|
March 15, 2019
|
|||
|
October 30, 2018
|
$
|
|
|
$
|
|
|
November 30, 2018
|
December 14, 2018
|
|||
|
August 3, 2018
|
$
|
|
|
$
|
|
|
August 31, 2018
|
September 14, 2018
|
|||
|
May 1, 2018
|
$
|
|
|
$
|
|
|
May 31, 2018
|
June 15, 2018
|
|||
|
February 2, 2018
|
$
|
|
|
$
|
|
|
February 28, 2018
|
March 15, 2018
|
|||
|
October 31, 2017
|
$
|
|
|
$
|
|
|
November 30, 2017
|
December 15, 2017
|
|||
|
August 4, 2017
|
$
|
|
|
$
|
|
|
August 31, 2017
|
September 15, 2017
|
|||
|
May 2, 2017
|
$
|
|
|
$
|
|
|
May 31, 2017
|
June 15, 2017
|
|||
|
February 9, 2017
|
$
|
|
|
$
|
|
|
February 28, 2017
|
March 15, 2017
|
|||
We include all common shares granted under our incentive compensation plan which remain unvested (“restricted common shares”) and contain non-forfeitable rights to dividends or dividend equivalents, whether paid or unpaid (“participating securities”), in the number of shares outstanding in our basic and diluted EPS calculations using the two-class method. All of our restricted common shares are currently participating securities. Our unvested PSUs are contingently issuable shares which are included in our diluted earnings per share calculations which do not include voting or dividend rights. The PSUs that vested as of
December 31, 2019
are included in basic and diluted EPS as issued shares.
Under the two-class method, earnings per common share are computed by dividing the sum of distributed earnings allocated to common shareholders and undistributed earnings allocated to common shareholders by the weighted average number of common shares outstanding for the period.
In applying the two-class method, distributed and undistributed earnings are allocated to both common shares and restricted common shares based on the total weighted average shares outstanding during the period as follows:
|
|
Year Ended December 31,
|
|||||||
|
|
2019
|
2018
|
2017
|
|||||
|
Weighted-average shares:
|
||||||||
|
Common shares outstanding
|
|
|
|
|
|
|
||
|
Restricted common shares
|
|
|
|
|
|
|
||
|
Total weighted-average shares
|
|
|
|
|
|
|
||
|
Percentage of weighted-average shares:
|
||||||||
|
Common shares outstanding
|
|
%
|
|
%
|
|
%
|
||
|
Restricted common shares
|
|
%
|
|
%
|
|
%
|
||
|
Total
|
|
%
|
|
%
|
|
%
|
||
F - 27
Aircastle Limited and Subsidiaries
Notes to Consolidated Financial Statements
(Dollars in thousands, except per share amounts)
The calculations of both basic and diluted earnings per share for the years ended
December 31, 2019
,
2018
and
2017
are as follows:
|
|
Year Ended December 31,
|
||||||||||
|
|
2019
|
2018
|
2017
|
||||||||
|
Earnings per common share — Basic:
|
|||||||||||
|
Income from continuing operations
|
$
|
|
|
$
|
|
|
$
|
|
|
||
|
Less: Distributed and undistributed earnings allocated to restricted common shares
(1)
|
(
|
)
|
(
|
)
|
(
|
)
|
|||||
|
Income from continuing operations available to common shareholders — Basic
|
$
|
|
|
$
|
|
|
$
|
|
|
||
|
Weighted-average common shares outstanding — Basic
|
|
|
|
|
|
|
|||||
|
Net income per common share — Basic
|
$
|
|
|
$
|
|
|
$
|
|
|
||
|
Earnings per common share — Diluted:
|
|||||||||||
|
Income from continuing operations
|
$
|
|
|
$
|
|
|
$
|
|
|
||
|
Less: Distributed and undistributed earnings allocated to restricted common shares
(1)
|
(
|
)
|
(
|
)
|
(
|
)
|
|||||
|
Income from continuing operations available to common shareholders — Diluted
|
$
|
|
|
$
|
|
|
$
|
|
|
||
|
Weighted-average common shares outstanding — Basic
|
|
|
|
|
|
|
|||||
|
Effect of diluted shares
(2)
|
|
|
|
|
|
|
|||||
|
Weighted-average common shares outstanding — Diluted
|
|
|
|
|
|
|
|||||
|
Net income per common share — Diluted
|
$
|
|
|
$
|
|
|
$
|
|
|
||
|
(1)
|
For the years ended
December 31, 2019
,
2018
and
2017
, distributed and undistributed earnings to restricted shares was
|
|
(2)
|
|
Income taxes have been provided for based upon the tax laws and rates in countries in which our operations are conducted and income is earned. The Company received an assurance from the Bermuda Minister of Finance that it would be exempted from local income, withholding and capital gains taxes until March 2035. Consequently, the provision for income taxes relates to income earned by certain subsidiaries of the Company which are located in, or earn income in, jurisdictions that impose income taxes, primarily the United States and Ireland.
The sources of income from continuing operations before income taxes and earnings of unconsolidated equity method investment for the years ended
December 31, 2019
,
2018
and
2017
were as follows:
|
|
Year Ended December 31,
|
||||||||||
|
|
2019
|
2018
|
2017
|
||||||||
|
U.S. operations
|
$
|
|
|
$
|
|
|
$
|
|
|
||
|
Non-U.S. operations
|
|
|
|
|
|
|
|||||
|
Income from continuing operations before income taxes and earnings of unconsolidated equity method investment
|
$
|
|
|
$
|
|
|
$
|
|
|
||
F - 28
Aircastle Limited and Subsidiaries
Notes to Consolidated Financial Statements
(Dollars in thousands, except per share amounts)
The components of the income tax provision from continuing operations for the years ended
December 31, 2019
,
2018
and
2017
consisted of the following:
|
|
Year Ended December 31,
|
||||||||||
|
|
2019
|
2018
|
2017
|
||||||||
|
Current:
|
|||||||||||
|
United States:
|
|||||||||||
|
Federal
|
$
|
|
|
$
|
|
|
$
|
|
|
||
|
State
|
|
|
(
|
)
|
|
|
|||||
|
Non-U.S.
|
|
|
|
|
|
|
|||||
|
Current income tax provision
|
|
|
|
|
|
|
|||||
|
Deferred:
|
|||||||||||
|
United States:
|
|||||||||||
|
Federal
|
|
|
|
|
(
|
)
|
|||||
|
State
|
|
|
|
|
(
|
)
|
|||||
|
Non-U.S.
|
|
|
(
|
)
|
(
|
)
|
|||||
|
Deferred income tax provision (benefit)
|
|
|
(
|
)
|
(
|
)
|
|||||
|
Total
|
$
|
|
|
$
|
|
|
$
|
|
|
||
Significant components of the Company’s deferred tax assets and liabilities at
December 31, 2019
,
2018
and
2017
consisted of the following:
|
|
Year Ended December 31,
|
||||||||||
|
|
2019
|
2018
|
2017
|
||||||||
|
Deferred tax assets:
|
|||||||||||
|
Non-cash share-based payments
|
$
|
|
|
$
|
|
|
$
|
|
|
||
|
Net operating loss carry forwards
|
|
|
|
|
|
|
|||||
|
Other
|
|
|
|
|
|
|
|||||
|
Total deferred tax assets
|
|
|
|
|
|
|
|||||
|
Deferred tax liabilities:
|
|||||||||||
|
Accelerated depreciation
|
(
|
)
|
(
|
)
|
(
|
)
|
|||||
|
Other
|
(
|
)
|
(
|
)
|
|
|
|||||
|
Total deferred tax liabilities
|
(
|
)
|
(
|
)
|
(
|
)
|
|||||
|
Net deferred tax liabilities
|
$
|
(
|
)
|
$
|
(
|
)
|
$
|
(
|
)
|
||
The Company had
$
69,332
of net operating loss (“NOL”) carry forwards available at
December 31, 2019
to offset future taxable income subject to U.S. graduated tax rates. If not utilized,
$
47,850
of these carry forwards will expire by 2039, with
$
21,482
of these carry forwards having no expiration date. The Company also had NOL carry forwards of
$
488,600
with no expiration date to offset future Irish and Mauritius taxable income. Deferred tax assets and liabilities are included in Other assets and Accounts payable and accrued liabilities, respectively, in the accompanying Consolidated Balance Sheets.
We do not expect to incur income taxes on future distributions of undistributed earnings of non-U.S. subsidiaries and accordingly, no deferred income taxes have been provided for the distributions of such earnings. As of
December 31, 2019
we have elected to permanently reinvest our accumulated undistributed U.S. earnings of
$
27,970
. Accordingly, no U.S. withholding taxes have been provided. Withholding tax of
$
1,398
would be due if such earnings were remitted.
Our aircraft-owning subsidiaries that are recognized as corporations for U.S. tax purposes are primarily non-U.S. corporations. These subsidiaries generally earn income from sources outside the United States and typically are not subject to U.S. federal, state or local income taxes. The aircraft owning subsidiaries resident in Ireland, Mauritius and the U.S. are subject to tax in those respective jurisdictions.
F - 29
Aircastle Limited and Subsidiaries
Notes to Consolidated Financial Statements
(Dollars in thousands, except per share amounts)
We have a U.S.-based subsidiary which provides management services to our subsidiaries and is subject to U.S. federal, state and local income taxes. We also have Ireland and Singapore based subsidiaries which provide management services to our non-U.S. subsidiaries and are subject to tax in those respective jurisdictions.
Differences between statutory income tax rates and our effective income tax rates applied to pre-tax income from continuing operations at
December 31, 2019
,
2018
and
2017
consisted of the following:
|
|
Year Ended December 31,
|
||||||||||
|
|
2019
|
2018
|
2017
|
||||||||
|
Notional U.S. federal income tax expense at the statutory rate:
|
$
|
|
|
$
|
|
|
$
|
|
|
||
|
U.S. state and local income tax, net
|
|
|
|
|
|
|
|||||
|
Non-U.S. operations:
|
|||||||||||
|
Bermuda
|
(
|
)
|
(
|
)
|
(
|
)
|
|||||
|
Ireland
|
(
|
)
|
(
|
)
|
(
|
)
|
|||||
|
Singapore
|
(
|
)
|
(
|
)
|
(
|
)
|
|||||
|
Other low tax jurisdictions
|
(
|
)
|
(
|
)
|
(
|
)
|
|||||
|
Non-deductible expenses in the U.S.
|
|
|
|
|
(
|
)
|
|||||
|
Other
|
|
|
|
|
|
|
|||||
|
Provision for income taxes
|
$
|
|
|
$
|
|
|
$
|
|
|
||
The Company recognizes the tax benefit from an uncertain tax position only if it is more likely than not that the tax position will be sustained on examination by the taxing authorities. We did not have any unrecognized tax benefits.
We conduct business globally and, as a result, the Company and its subsidiaries or branches are subject to foreign, U.S. federal and various state and local income taxes, as well as withholding taxes. In the normal course of business the Company is subject to examination by taxing authorities throughout the world, including such major jurisdictions as Ireland and the United States.
Our policy is that we will recognize interest and penalties accrued on any unrecognized tax benefits as a component of income tax expense. We did not accrue interest or penalties associated with any unrecognized tax benefits, nor was any interest expense or penalty recognized during the year.
The following table shows the components of interest, net for the years ended
December 31, 2019
,
2018
and
2017
:
|
|
Year Ended December 31,
|
||||||||||
|
|
2019
|
2018
|
2017
|
||||||||
|
Interest on borrowings, net settlements on interest rate derivatives, and other liabilities
(1)
|
$
|
|
|
$
|
|
|
$
|
|
|
||
|
Amortization of deferred losses related to interest rate derivatives
|
|
|
|
|
|
|
|||||
|
Amortization of deferred financing fees and debt discount
(2)
|
|
|
|
|
|
|
|||||
|
Interest expense
|
|
|
|
|
|
|
|||||
|
Less: Interest income
|
(
|
)
|
(
|
)
|
(
|
)
|
|||||
|
Less: Capitalized interest
|
|
|
(
|
)
|
(
|
)
|
|||||
|
Interest, net
|
$
|
|
|
$
|
|
|
$
|
|
|
||
|
(1)
|
Included a loan termination gain of
$
|
|
(2)
|
Included
$
|
F - 30
Aircastle Limited and Subsidiaries
Notes to Consolidated Financial Statements
(Dollars in thousands, except per share amounts)
Rent expense, primarily for the corporate office and sales and marketing facilities, was
$
1,601
,
$
2,865
and
$
2,143
for the years ended
December 31, 2019
,
2018
and
2017
, respectively.
As of
December 31, 2019
, Aircastle is obligated under non-cancelable operating leases relating principally to office facilities in Stamford, Connecticut; Dublin, Ireland; and Singapore for future minimum lease payments as follows:
|
Year Ending December 31,
|
Amount
|
||
|
2020
|
$
|
|
|
|
2021
|
|
|
|
|
2022
|
|
|
|
|
2023
|
|
|
|
|
2024
|
|
|
|
|
Thereafter
|
|
|
|
|
Total
|
$
|
|
|
At
December 31, 2019
, we had commitments to acquire
31
aircraft for
$
1,112,825
, including
25
Embraer E2 aircraft.
Remaining commitments, including
$
120,887
of progress payments, contractual price escalations and other adjustments for these aircraft at
December 31, 2019
, net of amounts already paid, are as follows:
|
Year Ending December 31,
|
Amount
|
||
|
2020
|
$
|
|
|
|
2021
|
|
|
|
|
2022
|
|
|
|
|
2023
|
|
|
|
|
2024
|
|
|
|
|
Thereafter
|
|
|
|
|
Total
|
$
|
|
|
As of
February 10, 2020
, we have commitments to acquire
31
aircraft for
$
1,112,825
.
As of December 31, 2019, two lawsuits related to the Merger Agreement were filed against the Company by purported shareholders. The Company has not recognized a contingent liability as a result of these lawsuits as it believes the claims asserted are without merit.
The following table describes the principal components of Other assets on our Consolidated Balance Sheets as of:
|
|
December 31,
|
||||||
|
|
2019
|
2018
|
|||||
|
Deferred income tax asset
|
$
|
|
|
$
|
|
|
|
|
Lease incentives and premiums, net of amortization of $71,851 and $47,304, respectively
|
|
|
|
|
|||
|
Flight equipment held for sale
|
|
|
|
|
|||
|
Aircraft purchase deposits and progress payments
(1)
|
|
|
|
|
|||
|
Fair value of interest rate cap
|
|
|
|
|
|||
|
Note receivable
(2)
|
|
|
|
|
|||
|
Right-of-use asset
(3)
|
|
|
|
|
|||
|
Other assets
|
|
|
|
|
|||
|
Total other assets
|
$
|
|
|
$
|
|
|
|
F - 31
Aircastle Limited and Subsidiaries
Notes to Consolidated Financial Statements
(Dollars in thousands, except per share amounts)
______________
|
(1)
|
Includes progress payments for Embraer E2 aircraft order.
|
|
(2)
|
Related to the sale of aircraft during the year ended December 31, 2017.
|
|
(3)
|
Net of lease incentives and tenant allowances.
|
The following table describes the principal components of Accounts payable, accrued expenses and other liabilities recorded on our Consolidated Balance Sheets as of:
|
|
December 31,
|
||||||
|
|
2019
|
2018
|
|||||
|
Accounts payable and accrued expenses
|
$
|
|
|
$
|
|
|
|
|
Deferred income tax liability
|
|
|
|
|
|||
|
Accrued interest payable
|
|
|
|
|
|||
|
Lease liability
|
|
|
|
|
|||
|
Lease discounts, net of amortization of $44,696 and $43,935, respectively
|
|
|
|
|
|||
|
Total accounts payable, accrued expenses and other liabilities
|
$
|
|
|
$
|
|
|
|
Quarterly results of our operations for the years ended
December 31, 2019
and
2018
are summarized below:
|
Fourth
Quarter |
Third
Quarter |
Second
Quarter |
First
Quarter |
||||||||||||
|
2019
|
|||||||||||||||
|
Revenues
|
$
|
|
|
$
|
|
|
$
|
|
|
$
|
|
|
|||
|
Net income
|
$
|
|
|
$
|
|
|
$
|
|
|
$
|
|
|
|||
|
Basic earnings per share:
|
|||||||||||||||
|
Net income
|
$
|
|
|
$
|
|
|
$
|
|
|
$
|
|
|
|||
|
Diluted earnings per share:
|
|||||||||||||||
|
Net income
|
$
|
|
|
$
|
|
|
$
|
|
|
$
|
|
|
|||
|
2018
|
|||||||||||||||
|
Revenues
|
$
|
|
|
$
|
|
|
$
|
|
|
$
|
|
|
|||
|
Net income
|
$
|
|
|
$
|
|
|
$
|
|
|
$
|
|
|
|||
|
Basic earnings per share:
|
|||||||||||||||
|
Net income
|
$
|
|
|
$
|
|
|
$
|
|
|
$
|
|
|
|||
|
Diluted earnings per share:
|
|||||||||||||||
|
Net income
|
$
|
|
|
$
|
|
|
$
|
|
|
$
|
|
|
|||
The sum of the quarterly earnings per share amounts may not equal the annual amount reported since per share amounts are computed independently for each period presented.
F - 32
SIGNATURES
Pursuant to the requirements of Section 13 of the Securities Exchange Act of 1934, Aircastle Limited has duly caused this report to be signed on its behalf by the undersigned, thereunto duly authorized.
Dated:
February 13, 2020
|
Aircastle Limited
|
|||
|
By:
|
|
/s/ Michael Inglese
|
|
|
|
Michael Inglese
|
||
|
Chief Executive Officer and Director
|
|||
Pursuant to the requirements of the Securities Exchange Act of 1934, this report has been signed below by the following persons on behalf of Aircastle Limited and in the capacities and on the date indicated.
|
SIGNATURE
|
TITLE
|
DATE
|
||
|
/s/ Michael Inglese
|
|
Chief Executive Officer and Director
|
|
February 13, 2020
|
|
Michael Inglese
|
||||
|
/s/ Aaron Dahlke
|
Chief Financial Officer
|
February 13, 2020
|
||
|
Aaron Dahlke
|
||||
|
/s/ James C. Connelly
|
|
Chief Accounting Officer
|
|
February 13, 2020
|
|
James C. Connelly
|
||||
|
/s/ Peter V. Ueberroth
|
|
Chairman of the Board
|
|
February 13, 2020
|
|
Peter V. Ueberroth
|
||||
|
/s/ Ronald W. Allen
|
|
Director
|
|
February 13, 2020
|
|
Ronald W. Allen
|
||||
|
/s/ Giovanni Bisignani
|
|
Director
|
|
February 13, 2020
|
|
Giovanni Bisignani
|
||||
|
/s/ Michael J. Cave
|
Director
|
February 13, 2020
|
||
|
Michael J. Cave
|
||||
|
/s/ Douglas A. Hacker
|
|
Director
|
|
February 13, 2020
|
|
Douglas A. Hacker
|
||||
|
/s/ Jun Horie
|
Director
|
February 13, 2020
|
||
|
Jun Horie
|
||||
|
/s/ Takashi Kurihara
|
|
Director
|
|
February 13, 2020
|
|
Takashi Kurihara
|
||||
|
/s/ Ronald L. Merriman
|
Director
|
February 13, 2020
|
||
|
Ronald L. Merriman
|
||||
|
/s/ Agnes Mura
|
|
Director
|
|
February 13, 2020
|
|
Agnes Mura
|
||||
|
/s/ Charles W. Pollard
|
Director
|
February 13, 2020
|
||
|
Charles W. Pollard
|
||||
|
/s/ Takayuki Sakakida
|
|
Director
|
|
February 13, 2020
|
|
Takayuki Sakakida
|
||||
S - 1
TABLE OF CONTENTS
Part IItem 1. BusinessItem 1A. Risk FactorsItem 1B. Unresolved Staff CommentsItem 2. PropertiesItem 3. Legal ProceedingsItem 4. Mine Safety DisclosuresPart IIItem 5. Market For Registrant S Common Equity, Related Stockholder Matter and Issuer Purchases Of Equity SecuritiesItem 6. Selected Financial DataItem 7. Management S Discussion and Analysis Of Financial Condition and Results Of OperationsItem 7A. Quantitative and Qualitative Disclosures About Market RiskItem 8. Financial Statements and Supplementary DataItem 9. Changes in and Disagreements with Accountants on Accounting and Financial DisclosureItem 9A. Controls and ProceduresItem 9B. Other InformationPart IIIItem 10. Directors, Executive Officers and Corporate GovernanceItem 11. Executive CompensationItem 12. Security Ownership Of Certain Beneficial Owners and Management and Related Stockholder MattersItem 13. Certain Relationships and Related Transactions, and Director IndependenceItem 14. Principal Accountant Fees and ServicesPart IVItem 15. Exhibits and Financial Statement SchedulesItem 16. Form 10-k SummaryNote 1. Summary Of Significant Accounting PoliciesNote 2. Fair Value MeasurementsNote 3. Lease Rental Revenues and Flight Equipment Held For LeaseNote 4. Net Investment in Direct Financing and Sales-type LeasesNote 5. Unconsolidated Equity Method InvestmentNote 6. Variable Interest EntitiesNote 7. Borrowings From Secured and Unsecured Debt FinancingsNote 8. Shareholders Equity and Share-based PaymentNote 9. DividendsNote 10. Earnings Per ShareNote 11. Income TaxesNote 12. Interest, NetNote 13. Commitments and ContingenciesNote 14. Other AssetsNote 15. Accounts Payable, Accrued Expenses and Other LiabilitiesNote 16. Quarterly Financial Data (unaudited)