AZZ INC
10-Ks and 10-Qs
|
|
|
|
|
|
|
|
|
|
|
|
|
|
|
|
|
|
|
|
|
|
|
|
|
|
|
|
|
|
|
|
|
|
|
|
|
|
|
|
|
|
|
|
|
|
|
|
|
|
|
|
|
|
|
|
|
|
|
UNITED STATES
SECURITIES AND EXCHANGE COMMISSION
WASHINGTON, D.C. 20549
FORM 10-K
ý
ANNUAL REPORT PURSUANT TO SECTION 13 OR 15(d) OF THE SECURITIES EXCHANGE ACT OF 1934
For the fiscal year ended
February 28, 2019
OR
¨
TRANSITION REPORT PURSUANT TO SECTION 13 OR 15(d) OF THE SECURITIES EXCHANGE ACT OF 1934
Commission file number:
1-12777

AZZ Inc.
(Exact name of registrant as specified in its charter)
|
TEXAS
|
|
75-0948250
|
|
(State or other jurisdiction of incorporation or organization)
|
|
(I.R.S. Employer Identification No.)
|
|
One Museum Place, Suite 500
3100 West 7th Street
Fort Worth, Texas 76107
(817) 810-0095
|
||
|
(Address, including zip code, and telephone number, including area code, of principal executive offices)
|
||
Securities registered pursuant to Section 12(b) of the Act:
|
Title of each class
|
|
Name of each exchange on which registered
|
|
Common Stock, $1.00 par value per share
|
|
New York Stock Exchange
|
Securities registered pursuant to Section 12(g) of the Act:
None
Indicate by check mark if the registrant is a well-known seasoned issuer, as defined in Rule 405 of the Securities Act. Yes
¨
No
ý
Indicate by check mark if the registrant is not required to file reports pursuant to Section 13 or Section 15(d) of the Exchange Act.Yes
¨
No
ý
Indicate by check mark whether the registrant (1) has filed all reports required to be filed by Section 13 or 15(d) of the Securities Exchange Act of 1934 during the preceding 12 months (or for such shorter period that the registrant was required to file such reports), and (2) has been subject to such filing requirements for the past 90 days. Yes
ý
No
¨
Indicate by check mark whether the registrant has submitted electronically every Interactive Data File required to be submitted pursuant to Rule 405 of Regulation S-T (§232.405 of this chapter) during the preceding 12 months (or for such shorter period that the registrant was required to submit such files). Yes
ý
No
¨
Indicate by check mark if disclosure of delinquent filers pursuant to Item 405 of Regulation S-K (§229.405) is not contained herein, and will not be contained, to the best of registrant’s knowledge, in definitive proxy or information statements incorporated by reference in Part III of this Form 10-K or any amendment to this Form 10-K.
¨
Indicate by check mark whether the registrant is a large accelerated filer, an accelerated filer, a non-accelerated filer, a smaller reporting company, or an emerging growth company. See definitions of “large accelerated filer,” “accelerated filer,” “smaller reporting company,” and “emerging growth company” in Rule 12b-2 of the Exchange Act
.
|
Large accelerated filer
x
|
Accelerated filer
o
|
Non-accelerated filer
o
|
Smaller Reporting
company
o
|
Emerging growth
company
¨ |
If an emerging growth company, indicate by check mark if the registrant has elected not to use the extended transition period for complying with any new or revised financial accounting standards provided pursuant to Section 13(a) of the Exchange Act.
¨
Indicate by check mark whether the registrant is a shell company (as defined in Rule 12b-2 of the Exchange Act). Yes
¨
No
ý
As of
August 31, 2018
, the aggregate market value of the registrant’s common stock held by non-affiliates of the registrant was
$1,381,529,854
based on the closing sale price as reported on the New York Stock Exchange. As of April 30, 2019, there were
26,115,389
shares of the registrant’s common stock ($1.00 par value) outstanding.
DOCUMENTS INCORPORATED BY REFERENCE
Portions of the registrant's Proxy Statement for its 2019 Annual Meeting of Shareholders to be filed with the Securities and Exchange Commission pursuant to Regulation 14A not later than 120 days after the end of the fiscal year covered by this Annual Report on Form 10-K are incorporated by reference into Part III, Items 10-14 of this Annual Report on Form 10-K.
AZZ INC.
FORM 10-K
For the Fiscal Year Ended
February 28, 2019
INDEX
|
Item 1.
|
||
|
Item 1A.
|
||
|
Item 1B.
|
||
|
Item 2.
|
||
|
Item 3.
|
||
|
Item 4.
|
||
|
Item 5.
|
||
|
Item 6.
|
||
|
Item 7.
|
||
|
Item 7A.
|
||
|
Item 8.
|
||
|
Item 9.
|
||
|
Item 9A.
|
||
|
Item 9B.
|
||
|
Item 10.
|
||
|
Item 11.
|
||
|
Item 12.
|
||
|
Item 13.
|
||
|
Item 14.
|
||
|
Item 15.
|
||
|
Item 16.
|
||
Forward Looking Statements
Certain statements herein about our expectations of future events or results constitute forward-looking statements for purposes of the safe harbor provisions of The Private Securities Litigation Reform Act of 1995. You can identify forward-looking statements by terminology such as “may,” “should,” “expects,” “plans,” “anticipates,” “believes,” “estimates,” “predicts,” “potential,” “continue,” or the negative of these terms or other comparable terminology. Such forward-looking statements are based on currently available competitive, financial and economic data and management’s views and assumptions regarding future events. Such forward-looking statements are inherently uncertain, and investors must recognize that actual results may differ from those expressed or implied in the forward-looking statements. In addition, certain factors could affect the outcome of the matters described herein. This Annual Report on Form 10-K may contain forward-looking statements that involve risks and uncertainties including, but not limited to, changes in customer demand and response to products and services offered by AZZ, including demand by the power generation markets, electrical transmission and distribution markets, the industrial markets, and the hot dip galvanizing markets; prices and raw material cost, including zinc and natural gas which are used in the hot dip galvanizing process; changes in the political stability and economic conditions of the various markets that AZZ serves, foreign and domestic; customer requested delays of shipments; additional acquisition opportunities; currency exchange rates; adequacy of financing; availability of experienced management and employees to implement AZZ’s growth strategy; a downturn in market conditions in any industry relating to the products we inventory or sell or the services that we provide; the continuing economic volatility in the U.S. and other markets in which we operate; acts of war or terrorism inside the United States or abroad; and other changes in economic and financial conditions. You are urged to consider these factors carefully in evaluating the forward-looking statements herein and are cautioned not to place undue reliance on such forward-looking statements, which are qualified in their entirety by this cautionary statement. These statements are based on information as of the date hereof and AZZ assumes no obligation to update any forward-looking statements, whether as a result of new information, future events, or otherwise.
PART I
Item 1. Business
AZZ Inc. (“AZZ”, the “Company”, “our” or “we”) was established in 1956 and incorporated under the laws of the state of Texas. We are a global provider of galvanizing and metal coating services, welding solutions, specialty electrical equipment and highly engineered services to the power generation, transmission, distribution, refining and industrial markets. We have two distinct operating segments: the Energy segment and the Metal Coatings segment. AZZ Energy is dedicated to delivering safe and reliable transmission of power from generation sources to end customers, and automated weld overlay solutions for corrosion and erosion mitigation to critical infrastructure in the energy markets worldwide. AZZ Metal Coatings is a leading provider of metal finishing solutions for corrosion protection, including hot dip galvanizing to the North American steel fabrication industry.
Energy Segment
AZZ's Energy segment is a leading provider of specialized products and services designed to support industrial, nuclear and electrical applications. Our product offerings include custom switchgear, electrical enclosures, medium and high voltage bus ducts, explosion proof and hazardous duty lighting, nuclear safety-related equipment and tubular products. In addition to our product offerings, AZZ's Energy segment focuses on extension of life cycle for the power generation, refining and industrial infrastructure, through automated weld overlay solutions for corrosion and erosion mitigation. The markets for our Energy segment are highly competitive and consist of large multi-national companies, along with numerous small independent companies. Competition is based primarily on product quality, range of product line, price and service. While some of our competitors are much larger than us, our Energy segment offers some of the most technologically advanced solutions and engineering resources developed from a legacy of proven, reliable product options, allowing AZZ Energy to be ideally positioned to meet the most challenging application-specific demands.
Copper, aluminum, steel and nickel based alloys are the primary raw materials used by this segment. We do not foresee any availability issues for these materials. We do not contractually commit to minimum volumes and increases in price for these items are normally managed through escalation clauses to the customer’s contracts, which the customers may not accept. In addition, we seek to get firm pricing contracts from our vendors on these materials at the time we receive orders from our customers in order to minimize risk.
We sell Energy segment products through manufacturers’ representatives, distributors, agents and our internal sales force. We are not dependent on any single customer for this segment, and the loss of any single customer would not have a material adverse effect on our consolidated revenues or net income.
3
On March 22, 2018, we purchased certain assets through a bankruptcy sales process from Lectrus Corporation, a privately-held corporation based in Chattanooga, Tennessee. Lectrus designs and manufactures custom metal enclosures and provides electrical and mechanical integration. The acquisition will complement our current metal enclosure and switchgear businesses.
On September 6, 2017, we completed the acquisition of all the assets and outstanding shares of Powergrid Solutions, Inc. ("PSI"), a privately held company, based in Oshkosh, Wisconsin. PSI designs, engineers and manufactures customized low and medium-voltage power quality, power generation and distribution equipment. PSI’s product portfolio includes metal-enclosed, metal-clad and padmount switchgear, serving the utility, commercial, industrial and renewable energy markets since 1982. The acquisition of PSI is a key addition to the Company's electrical switchgear portfolio. The addition of PSI’s low-voltage and padmount switchgear allows AZZ to offer a comprehensive portfolio of customized switchgear solutions to both existing and new customers in a diverse set of industries.
On March 1, 2016, we completed an acquisition of the equity securities of Power Electronics, Inc. (“PEI”), a Millington, Maryland-based manufacturer and integrator of electrical enclosure systems. The acquisition of PEI will enhance our capacity to serve existing and new customers in a diverse set of industries along the Eastern seaboard of the United States.
For additional information regarding the Energy Segment's backlog and operating results, see Results of Operations within Item 7. For additional financial information by segment, see Note 12 to the Consolidated Financial Statements.
Metal Coatings Segment
The Metal Coatings segment provides hot dip galvanizing and other metal coating applications to the steel fabrication industry through facilities located throughout the United States and Canada. Hot dip galvanizing is a metallurgical process in which molten zinc is applied to steel. The zinc alloying renders corrosion protection to fabricated steel for extended periods of up to 50 years. As of
February 28, 2019
, we operated forty-two metal coating plants, which are located in various locations throughout the United States and Canada.
Metal coating is a highly competitive business, and we compete with other galvanizing companies, captive galvanizing facilities operated by manufacturers, and alternate forms of corrosion protection such as material selection (stainless steel or aluminum) or barrier protections such as powder coating, paint, and weathering steel. Our galvanizing markets are generally limited to areas within relatively close proximity to our metal coating plants due to freight cost.
Zinc, the principal raw material used in the galvanizing process, is currently readily available, but is subject to volatile pricing. We manage our exposure to commodity pricing of zinc by utilizing agreements with zinc suppliers that include fixed costs contracts to guard against escalating commodity prices. We also secure firm pricing for natural gas supplies with individual utilities when possible. We may or may not continue to use these or other strategies to manage risk in the future.
We typically serve fabricators or manufacturers that provide solutions to the electrical and telecommunications, bridge and highway, petrochemical and general industrial markets, and numerous original equipment manufacturers. We do not depend on any single customer for a significant amount of our sales, and the loss of any single customer would not have a material adverse effect on our consolidated revenues or net income.
On February 1, 2018, we completed the acquisition of all the assets and outstanding shares of Rogers Brothers Company ("Rogers Brothers"), a privately held company, based in Rockford, Illinois. Rogers Brothers provides galvanizing solutions to a multi-state area within the Midwest. The acquisition supports our goal of continued geographic expansion as well as portfolio expansion of our metal coatings solutions.
On June 30, 2017, we completed the acquisition of the assets of Enhanced Powder Coating Ltd., (“EPC”), a privately held, high specification, National Aerospace and Defense Contractors Accreditation Program, ("NADCAP"), certified provider of powder coating, plating and anodizing services based in Gainesville, Texas. EPC, founded in 2003, offers a full spectrum of finish technology including powder coating, abrasive blasting and plating for heavy industrial, transportation, aerospace and light commercial industries. The acquisition of EPC is consistent with our strategic initiative to grow our Metal Coatings segment with products and services that complement our industry-leading galvanizing business.
For additional information on the Metal Coatings segment's operating results, see Results of Operations within Item 7. For additional financial information by segment, see Note 12 to the Consolidated Financial Statements.
Employees
As of
February 28, 2019
, the Company employed approximately 3,884 persons consisting of approximately 3,427 in the United States, approximately 200 in Canada, 216 in Europe, and 41 in other countries.
4
Executive Officers of the Registrant
|
Name
|
Age
|
Business Experience of Executive Officers for Past Five Years
Position or Office with Registrant or Prior Employer
|
Held Since
|
||||
|
Thomas E. Ferguson
|
62
|
|
President and Chief Executive Officer
Chief Executive Officer, FlexSteel Pipeline Technologies, Inc.
President, Flow Solutions Group, Flowserve Corporation
President, Pump Division, Flowserve Corporation
|
2013
2013-2013
2009-2012
2003-2009
|
|||
|
Paul W. Fehlman
|
55
|
|
Senior Vice President of Finance, Chief Financial Officer
Vice President, Finance, Engineered Products Division, Flowserve Corp.
Vice President, Investor Relations and FP&A, Flowserve Corporation
Vice President, Treasurer, Flowserve Corporation
|
2014
2011-2013
2009-2011
2004-2009
|
|||
|
Tara D. Mackey
|
49
|
|
Chief Legal Officer and Secretary
Chief Legal Counsel and Corporate Secretary, First Parts, Inc. General Counsel and Corporate Secretary, Silverleaf Resorts Inc. VP, Assistant General Counsel and Corporate Secretary, SuperMedia LLC |
2014
2013-2014 2011-2013 2008-2011 |
|||
|
Matt Emery
|
52
|
|
Chief Information and Human Resource Officer
Senior Director of Information Technologies, Hewlett-Packard
|
2013 2004-2013
|
|||
|
James Drew Byelick
|
61
|
|
Vice President and Chief Accounting Officer
Director of Finance - Electrical
Controller - Nuclear Logistics LLC
Independent Consultant
|
2017
2016-2017
2015-2016
2000-2015
|
|||
|
Chris Bacius
|
58
|
|
Vice President, Corporate Development
Vice President Mergers & Acquisition, Flowserve Corporation
Vice President Business Development, Flowserve Corporation
|
2014
2012-2014
2009-2012
|
|||
|
Ken Lavelle
|
62
|
|
President and General Manager - Electrical Platform
President, Lavelle Management Consultant
President, Global Seals & Systems Operation - Flowserve Corporation
Vice President, General Manager, FSG North America - Flowserve Corporation
|
2017
2016-2017
2012-2016
2009-2012
|
|||
|
Michael Doucet
|
46
|
|
Senior Vice President - Alternative Coatings
Vice President and General Manager - Galvabar
President & Chief Operating Officer - L & M Steel Co., Inc.
Director of Sales, Central Region Mills & Rebar Fabrication - Commercial Metals Company
Vice President & General Manager, PC Wholesale
|
2018
2017-2018
2013-2018
2002-2013
1998-2001
|
|||
|
Bryan Stovall
|
54
|
|
Senior Vice President - Metal Coatings
Vice President, Galvanizing - Central Operations
Vice President, Galvanizing - Southern Operations
|
2018
2013-2018
2009-2012
|
|||
Each executive officer was elected by the Board of Directors to hold office until the next Annual Meeting or until their successor is elected. No executive officer has any family relationships with any other executive officer of the Company.
5
Available Information
Our annual reports on Form 10-K, quarterly reports on Form 10-Q, current reports on Form 8-K and, if applicable, amendments to those reports filed or furnished pursuant to Section 13(a) of the Securities Exchange Act of 1934, as amended, are available free of charge on or through our web site, http://www.azz.com/investor-relations, as soon as reasonably practicable after we electronically file such material with, or furnish it to, the Securities and Exchange Commission, or the SEC. The SEC’s website, http://www.sec.gov, contains reports, proxy and information statements, and other information regarding issuers that file electronically with the SEC. Our web site and the information on it or connected to it are not a part of this Annual Report on Form 10-K.
Corporate Governance
Our Company’s Board of Directors (the “Board”), with the assistance of its Nominating and Corporate Governance Committee, has adopted Corporate Governance Guidelines that set forth the Board’s policies regarding corporate governance. In connection with the Board’s responsibility to oversee our legal compliance and conduct, the Board has adopted a Code of Conduct, which applies to the Company’s officers, directors and employees.
The Board has adopted charters for each of its Audit Committee, Compensation Committee and Nominating and Corporate Governance Committee. You may review the Corporate Governance Guidelines, our Code of Conduct and our Committee charters under the Heading “Investor Relations,” subheading “Corporate Governance,” on our website at:
http://www.azz.com
You may also obtain a copy of these documents by mailing a request to:
AZZ Inc.
Investor Relations
One Museum Place, Suite 500
3100 West 7th Street
Fort Worth, TX 76107
6
Item 1A. Risk Factors
Our business is subject to a variety of risks, including but not limited to the risks described below, which we believe are the most significant risks and uncertainties facing our business. Additional risks and uncertainties not known to us or not described below may also impair our business operations in the future. If any of the following risks actually occur, our business, financial condition and results of operations and future growth could be negatively impacted.
Our business segments operate in highly competitive markets.
Many of our competitors, primarily in our Energy Segment, are significantly larger and have substantially more resources than AZZ. Competition is based on a number of factors, including price. Certain of our competitors may have lower cost structures and may, therefore, be able to provide their products and services at lower prices than we are able to provide. We cannot be certain that our competitors will not develop the expertise, experience and resources to provide services that are superior in both price and quality in the future. Similarly, we cannot be certain that we will be able to maintain or enhance our competitive position within our industries, maintain our customer base at current levels or increase our customer base.
Climate change could impact our business.
Climate changes could result in an adverse impact on AZZ's operations, particularly in hurricane prone or low lying areas near the ocean. At this time, the Company is not able to speculate as to the potential timing or impact from potential global warming and other natural disasters, however the Company believes that it currently has adequate insurance coverage and disaster recovery plans related to any potential natural disasters that might occur at any of the Company’s sites.
Changes in greenhouse gas regulations could impact our operating results.
International agreements and national or regional legislation and regulatory measures to limit greenhouse emissions are currently in various stages of discussion or implementation. These and other greenhouse gas emissions-related laws, policies and regulations may result in substantial capital, compliance, operating and maintenance costs. The level of expenditure required to comply with these laws and regulations is uncertain and is expected to vary depending on the laws enacted in each jurisdiction, our activities in the particular jurisdiction, and market conditions.
The effect of regulation on our financial performance will depend on a number of factors including, not limited to, the sectors covered, the greenhouse gas emissions reductions required by law, the extent to which we would be entitled to receive emission allowance allocations or would need to purchase compliance instruments on the open market or through auctions, the price and availability of emission allowances and credits and the impact of legislation or other regulation on our ability to recover the costs incurred through the pricing of our products and services.
Our business segments are sensitive to economic downturns.
If the general level of economic activity deteriorates from current levels, our customers may delay or cancel new projects. If there is a reduction in demand for our products or services, as a result of a downturn in the general economy, there could be a material adverse effect on price levels and the quantity of goods and services purchased, therefore adversely impacting revenues and results from operations. A number of factors, including financing conditions and potential bankruptcies in the industries we serve, could adversely affect our customers and their ability or willingness to fund capital expenditures in the future and pay for past services. Certain economic conditions may also impact the financial condition of one or more of our key suppliers, which could affect our ability to secure raw materials and components to meet our customers’ demand for our products in the future. Other various factors drive demand for our products and services, including the price of oil, economic forecasts and financial markets. Uncertainty in the global economy and financial markets could continue to impact our customers and could in turn severely impact the demand for spending projects that would result in a reduction in orders for our products and services. All of these factors combined together could materially impact our business, financial condition, cash flows and results of operations and potentially impact the trading price of our common stock.
International and political events may adversely affect our Energy and Metal Coatings Segments.
A portion of the revenues from our Energy and Metal Coatings Segments are from international markets. The occurrence of any of the risks described below could have an adverse effect on our consolidated results of operations, cash flows and financial condition:
|
•
|
political and economic instability, such as is occurring in Northern Africa, Europe and the Middle East;
|
|
•
|
social unrest, acts of terrorism, force majeure, war or other armed conflict;
|
|
•
|
inflation;
|
|
•
|
currency fluctuation, devaluations and conversion restrictions;
|
7
|
•
|
governmental activities that limit or disrupt markets, restrict payments or limit the movement of funds; and
|
|
•
|
trade restrictions and economic embargoes by the United States or other countries.
|
Fluctuations in the price and supply of raw materials and natural gas for our business segments may adversely affect our operations.
We purchase a wide variety of raw materials for our Energy Segment to manufacture our products, including copper, aluminum, steel and nickel. Unanticipated increases in raw material requirements or price increases could increase production costs and adversely affect profitability. In our Metal Coatings Segment, zinc and natural gas represent a large portion of our cost of sales. The prices of zinc and natural gas are subject to volatility. The following factors, which are beyond our control, affect the price of raw materials and natural gas for our business segments: supply and demand; freight costs and transportation availability; trade duties and taxes; and labor disputes. We seek to maintain operating margins by attempting to increase the price of our products and services in response to increased costs, but may not be successful in passing these price increases through to our customers.
Our volume of fixed-price contracts for our Energy Segment could adversely affect our business.
We currently generate, and expect to continue to generate, a significant portion of our revenues under fixed price contracts. We must estimate the costs of completing a particular project to bid for fixed-price contracts. The actual cost of labor and materials, however, may vary from the costs we originally estimated. Depending on the size of a particular project, variations from estimated cost could have a significant impact on our operating results for any fiscal year.
Our operations could be adversely impacted by the continuing effects from government regulations.
Various regulations have been implemented related to new safety and certification requirements applicable to oil and gas drilling and production activities. While certain new drilling plans and drilling permits have been approved, we cannot predict whether operators will be able to satisfy these requirements. Further, we cannot predict what the continuing effects of government regulations on offshore deepwater drilling projects may have on offshore oil and gas exploration and development activity, or what actions may be taken by our customers or other industry participants in response to these regulations. Changes in laws or regulations regarding offshore oil and gas exploration and development activities and decisions by customers and other industry participants could reduce demand for our services, which would have a negative impact on our operations. Similarly, we cannot accurately predict future regulations by the government in any country in which we operate and how those regulations may affect our ability to perform projects in those regions.
Federal, state and local governments have a major impact on the framework and economics of the US nuclear power industry. Changes in laws or regulations regarding the operations of current nuclear facilities could have an impact on the demand for our products and services, which would have a negative impact on our operations. These same risks are also associated with foreign nuclear power industries.
New regulations related to conflict minerals could adversely impact our business.
On August 22, 2012, the SEC adopted a rule pursuant to the Dodd-Frank Wall Street Reform and Consumer Protection Act which established annual disclosure and reporting requirements for publicly-traded companies that use tin, tantalum, tungsten or gold (collectively, “conflict minerals”) mined from the Democratic Republic of Congo and adjoining countries in their products. There are costs associated with complying with these disclosure requirements, including costs for due diligence to determine the source of any conflict minerals used in our products and other potential changes to products, processes, or sources of supply. Despite our due diligence efforts, we may be unable to verify the origin of all conflict minerals used in our component products. As a result, we may face reputational and other challenges with customers that require that all of the components incorporated in our products be certified as conflict-free.
Our acquisition strategy involves a number of risks.
We intend to pursue continued growth through opportunities to acquire companies or assets that will enable us to expand our product and service offerings and to increase our geographic footprint. We routinely review potential acquisitions. However, we may be unable to implement this growth strategy if we cannot reach agreement on potential strategic acquisitions on acceptable terms or for other reasons. Moreover, our acquisition strategy involves certain risks, including:
|
•
|
difficulties in the post acquisition integration of operations and systems;
|
|
•
|
the termination of relationships with key personnel and customers of the acquired company;
|
|
•
|
a failure to add additional employees to manage the increased volume of business;
|
|
•
|
additional post acquisition challenges and complexities in areas such as tax planning, treasury management, financial reporting and legal compliance;
|
8
|
•
|
risks and liabilities from our acquisitions, some of which may not be discovered during the preacquisition due diligence process;
|
|
•
|
a disruption of our ongoing business or an inability of our ongoing business to receive sufficient management attention; and
|
|
•
|
a failure to realize the cost savings or other financial benefits we anticipated prior to acquisition.
|
Future acquisitions may require us to obtain additional equity or debt financing, which may not be available on current attractive market terms.
Our use of over time revenue accounting in the Energy Segment could result in a reduction or elimination of previously reported profits.
As discussed in “Management’s Discussion and Analysis of Financial Condition and Results of Operations-Critical Accounting Policies and Estimates” and in the notes to our consolidated financial statements, a portion of our revenues is recognized over time. Over time revenue recognition causes us to recognize contract revenues and earnings ratably over the contract term in proportion to our incurrence of contract costs. The earnings or losses recognized on individual contracts are based on estimates of contract revenues, costs and profitability. Contract losses are recognized in full when determined, and contract profit estimates are adjusted based on ongoing reviews of contract profitability. Actual collection of contract amounts or change orders could differ from original estimated amounts and could result in a reduction or elimination of previously recognized earnings. In certain circumstances, it is possible that such adjustments could be significant.
We may not be able to fully realize the revenue value reported in our backlog for our Energy Segment.
We have a backlog of work in our Energy Segment. Orders included in our backlog are represented by customer purchase orders and contracts, which we believe to be firm. Backlog develops as a result of new business secured, which represents the revenue value of new project commitments received by us during a given period. Backlog consists of projects which have either (1) not been started or (2) are in progress and are not yet complete. In the latter case, the revenue value reported in backlog is the remaining value associated with work that has not yet been completed. From time to time, projects that were recorded as new business are cancelled. In the event of a project cancellation, we may be reimbursed for certain costs but typically have no contractual right to the total revenue reflected in our backlog. In addition to being unable to recover certain direct costs, we may also incur additional costs resulting from underutilized assets if projects are cancelled.
Our operating results may vary significantly from quarter to quarter.
Our quarterly results may be materially and adversely affected by:
|
•
|
the timing and volume of work under new agreements;
|
|
•
|
general economic conditions;
|
|
•
|
the budgetary spending patterns of customers;
|
|
•
|
variations in the margins of projects performed during any particular quarter;
|
|
•
|
losses experienced in our operations not otherwise covered by insurance;
|
|
•
|
a change in the demand or production of our products and our services caused by severe weather conditions;
|
|
•
|
a change in the mix of our customers, contracts and business;
|
|
•
|
a change in customer delivery schedule;
|
|
•
|
increases in design and manufacturing costs; and
|
|
•
|
abilities of customers to pay their invoices owed to us.
|
Accordingly, our operating results in any particular quarter may not be indicative of the results expected for any other quarter or for the entire year.
We may be unsuccessful at generating internal growth.
Our ability to generate internal growth will be affected by, among other factors, our ability to:
|
•
|
attract new customers, internationally and domestically;
|
|
•
|
integrate regulatory changes;
|
|
•
|
increase the number or size of projects performed for existing customers;
|
|
•
|
hire and retain employees; and
|
|
•
|
increase volume utilizing our existing facilities.
|
9
Many of the factors affecting our ability to generate internal growth may be beyond our control, and we cannot be certain that our strategies will be successful or that we will be able to generate cash flow sufficient to fund our operations and to support internal growth. If we are unsuccessful, we may not be able to achieve internal growth, expand our operations or grow our business.
The departure of key personnel could disrupt our business.
We depend on the continued efforts of our executive officers and senior management. We cannot be certain that any individual will continue in such capacity for any particular period of time. The loss of key personnel, or the inability to hire and retain qualified employees, could negatively impact our ability to manage our business.
Our business requires skilled labor, and we may be unable to attract and retain qualified employees.
Our ability to maintain our productivity and profitability could be limited by an inability to employ, train and retain skilled personnel necessary to meet our requirements. We may experience shortages of qualified personnel. We cannot be certain that we will be able to maintain an adequately skilled labor force necessary to operate efficiently and to support our growth strategy or that our labor expense will not increase as a result of shortage in the supply of skilled personnel. Labor shortages or increased labor costs could impair our ability to maintain our business or grow our revenues.
Actual and potential claims, lawsuits, and proceedings could ultimately reduce our profitability and liquidity and weaken our financial condition.
In the future, the Company could be named as a defendant in legal proceedings claiming damages from us in connection with the operation of our business. Most of the actions against us arise out of the normal course of our performing services or with respect to the equipment we manufacture. We could potentially be a plaintiff in legal proceedings against customers, in which we seek to recover payments of contractual amounts due to us, and claims for increased costs incurred by us. When appropriate, we establish provisions against certain legal exposures, and we adjust such provisions from time to time according to ongoing developments related to each exposure. If in the future our assumptions and estimates related to such exposures prove to be inadequate or incorrect, our consolidated results of operations, cash flows and financial condition could be adversely affected. In addition, claims, lawsuits and proceedings may harm our reputation and possibly divert management resources away from operating our business.
Technological innovations by competitors may make existing products and production methods obsolete.
All of the products manufactured and sold by the Company depend upon the best available technology for success in the marketplace. The competitive environment is highly sensitive to technological innovation in both segments of our business. It is possible for our competitors, both foreign and domestic, to develop new products or production methods, which will make current products or methods obsolete or at least hasten their obsolescence.
Catastrophic events could disrupt our business.
The occurrence of catastrophic events ranging from natural disasters such as earthquakes, tsunamis or hurricanes to epidemics such as health epidemics to acts of war and terrorism could disrupt or delay our ability to complete projects and could potentially expose the Company to third-party liability claims. Such events may or may not be fully covered by our various insurance policies or may be subject to deductibles. In addition, such events could impact our customers and suppliers, resulting in temporary or long-term delays and/or cancellations of orders or raw materials used in normal business operations. These situations are outside the Company’s control and could have a significant adverse impact on the results of operations.
Adoption of new or revised employment and labor laws and regulations could make it easier for our employees to obtain union representation and our business could be adversely impacted.
Other than a nominal number of employees at four of our wholly-owned subsidiaries, none of our employees are currently represented by unions. However, our U.S. based employees have the right at any time under the National Labor Relations Act to form or affiliate with a union. If some or our entire workforce were to become unionized and the terms of the collective bargaining agreement were significantly different from our current compensation arrangements, it could increase our costs and adversely impact our profitability. Any changes in regulations, the imposition of new regulations, or the enactment of new legislation could have an adverse impact on our business; to the extent it becomes easier for workers to obtain union representation.
10
AZZ’s flexibility to operate its business could be impacted by provisions in its debt obligations.
AZZ’s debt instruments contain covenants which restrict or prohibit certain actions (“negative covenants”), including, but not limited to, AZZ’s ability to incur debt, create or suffer to exist liens, capital spending limits, engage in certain merger, acquisition, or divestiture actions, or increase dividends beyond a specific level. AZZ’s debt instruments also contain covenants requiring AZZ to, among other things, maintain specified financial ratios (“affirmative covenants”). Failure to comply with these negative covenants and affirmative covenants could result in an event of default that, if not cured or waived, could restrict the Company’s access to liquidity and have a material adverse effect on the Company’s business or prospects. If the Company does not have enough cash to service its debt or fund other liquidity needs, AZZ may be required to take actions such as requesting a waiver from lenders, reducing or delaying capital expenditures, selling assets, restructuring or refinancing all or part of the existing debt, or seeking additional equity capital. AZZ cannot assure that any of these remedies can be effected on commercially reasonable terms or at all.
A failure in our operational systems or cyber security attacks on any of our facilities, or those of third parties, may
affect adversely our financial results.
Our business is dependent upon our operational systems to process a large amount of data and complex transactions. If any of our financial, operational, or other data processing systems fail or have other significant shortcomings, our financial results could be adversely affected. Our financial results could also be adversely affected if an employee causes our operational systems to fail, either as a result of inadvertent error or by deliberately tampering with or manipulating our operational systems. Due to increased technology advances, we have become more reliant on technology to help increase efficiency in our business. We use computer programs to help run our financial and operations sectors, and this may subject our business to increased risks. Any future cyber security attacks that affect our facilities, our customers and any financial data could have a material adverse effect on our business. In addition, cyber attacks on our customer and employee data may result in a financial loss, including potential fines for failure to safeguard data, and may negatively impact our reputation. Third-party systems on which we rely could also suffer operational system failure. Any of these occurrences could disrupt our business, result in potential liability or reputational damage or otherwise have an adverse effect on our financial results.
We could face significant liabilities for withdrawal from Multiemployer Pension Plans.
We are a participating employer in a number of trustee-managed multiemployer defined benefit pension plans for employees who are covered by collective bargaining agreements. In the event of our withdrawal from a multiemployer pension plan, we may incur expenses associated with our obligations for unfunded vested benefits at the time of the withdrawal. Depending on various factors, a future withdrawal could have a material adverse effect on results of operations or cash flows for a particular reporting period.
Uncertainties in the interpretation and application of the 2017 Tax Cuts and Jobs Act could materially affect our tax obligations and effective tax rate.
The U.S. Tax Cuts and Jobs Act of 2017 (the “U.S. Tax Act”) requires complex computations to be performed that were not previously required by U.S. tax law, significant judgments to be made in interpretation of the provisions of the U.S. Tax Act, significant estimates in calculations, and the preparation and analysis of information not previously relevant. The U.S. Treasury Department, the IRS, and other standard-setting bodies will continue to interpret or issue guidance on how provisions of the U.S. Tax Act will be applied or otherwise administered. As future guidance is issued, we may make adjustments to amounts that we have previously recorded that may materially impact our financial statements in the period in which the adjustments are made.
We have identified a material weakness in our internal control over financial reporting which could, if not remediated, adversely affect investor confidence in our company, the value of our common stock and our ability to report our financial condition and results of operations in a timely and accurate manner.
Pursuant to the Sarbanes-Oxley Act of 2002, we are required to document and test our internal controls over financial reporting and to provide a report of management’s assessment of the effectiveness of such controls. The Company had a material weakness in its internal control over financial reporting as of February 28, 2019 related to revenue accounting reconciliations. Although we are working to fully remediate this material weakness identified as of February 28, 2019, there can be no assurance as to when the remediation plan will be fully implemented and executed. Any material weakness in our internal control over financial reporting that has not been remediated or that may occur in the future could result in misstatements of our consolidated financial statements, restatements of those financial statements, a decline in our stock price, or otherwise materially adversely affect our business, reputation, results of operations, financial condition, or liquidity.
11
Item 1B. Unresolved Staff Comments
None.
Item 2. Properties
The Company's global headquarters are located in leased office space in Fort Worth, Texas. The Company's manufacturing facilities, classified by reporting segment, are located in the following countries as of
February 28, 2019
:
|
Square Footage
|
||||||||||||||
|
Segment
|
Location
|
Facilities
|
Total
|
Owned
|
Leased
|
|||||||||
|
Energy
|
United States
|
18
|
|
1,308,567
|
|
379,178
|
|
929,389
|
|
|||||
|
Canada
|
2
|
|
94,456
|
|
—
|
|
94,456
|
|
||||||
|
Europe
|
2
|
|
86,785
|
|
—
|
|
86,785
|
|
||||||
|
Brazil
|
1
|
|
11,814
|
|
—
|
|
11,814
|
|
||||||
|
China
|
2
|
|
13,393
|
|
—
|
|
13,393
|
|
||||||
|
Metal Coatings
|
United States
|
41
|
|
2,166,969
|
|
2,059,554
|
|
107,415
|
|
|||||
|
Canada
|
3
|
|
175,102
|
|
175,102
|
|
—
|
|
||||||
|
Total
|
69
|
|
3,857,086
|
|
2,613,834
|
|
1,243,252
|
|
||||||
The Company believes its manufacturing and corporate facilities are adequate to carry on its business operations for the next twelve months.
Item 3. Legal Proceedings
On January 11, 2018, Logan Mullins, acting on behalf of himself and a putative class of persons who purchased or otherwise acquired the Company's securities between April 22, 2015 and January 8, 2018, filed a class action complaint in the U.S. District Court for the Northern District of Texas (the "Court") against the Company and two of its executive officers, Thomas E. Ferguson and Paul W. Fehlman. Logan Mullins v. AZZ, Inc., et al., Case No. 4:18-cv-00025-Y. The complaint alleged, among other things, that the Company's SEC filings contained statements that were rendered materially false and misleading by the Company's alleged failure to properly recognize revenue related to certain contracts in its Energy Segment in purported violation of (1) Section 10(b) of the Exchange Act and Rule 10b-5 and (2) Section 20(a) of the Exchange Act. After the Court appointed a Lead Plaintiff in the case, but before the Company was required to respond to the lawsuit, the Plaintiff voluntarily sought dismissal of the complaint without prejudice. On January 16, 2019, the Court dismissed the case without prejudice. No other parties have sought to reopen the case; therefore, the legal matter is no longer pending.
In addition, the Company and its subsidiaries are named defendants in various routine lawsuits incidental to our business. These proceedings include labor and employment claims, use of the Company’s intellectual property, worker’s compensation and various environmental matters, all arising in the normal course of business. Although the outcome of these lawsuits or other proceedings cannot be predicted with certainty, and the amount of any potential liability that could arise with respect to such lawsuits or other matters cannot be predicted at this time, management, after consultation with legal counsel, does not expect liabilities, if any, from these claims or proceedings, either individually or in the aggregate, to have a material effect on the Company’s financial position, results of operations or cash flows.
Item 4. Mine Safety Disclosures
Not applicable.
12
PART II
Item 5. Market for Registrant’s Common Equity, Related Stockholder Matters and Issuer Purchases of Equity Securities
General
Our common stock, $1.00 par value (“Common Stock”), is traded on the New York Stock Exchange under the symbol “AZZ”. As of
February 28, 2019
, we had approximately 393 holders of record of our Common Stock, not including those shares held in street or nominee name. Item 12 of this Annual Report on Form 10-K contains certain information related to our equity compensation plans.
Dividend Policy
The payment of dividends is within the discretion of our Board and is dependent on our earnings, capital requirements, operating and financial condition and other factors. AZZ has paid dividends quarterly over the last three fiscal years. Dividends paid totaled
$17.7 million
, $17.7 million, and $16.6 million during fiscal
2019
,
2018
, and
2017
, respectively. Dividend payments may be restricted to total payments of $20.0 million per fiscal year based on covenants with the Company's lenders in the event that the Company's leverage ratio (defined as net debt to EBITDA) exceeds 3.0 to 1.0. Currently there are no restrictions on dividend payments. AZZ fully expects to continue to pay dividends. However, the decision is within the discretion of our Board and we expect any future payments will be made on a quarterly basis.
Purchases of Equity Securities
In January 2012, our Board authorized the repurchase of up to ten percent of the outstanding shares of our Common Stock. The share repurchase authorization does not have an expiration date, and the amount and prices paid for any future share purchases under the authorization will be based on market conditions and other factors at the time of the purchase. Repurchases under this share repurchase authorization would be made through open market purchases or private transactions in accordance with applicable federal securities laws, including Rule 10b-18 under the Exchange Act. Share repurchases may be restricted to total repurchases of $50.0 million per fiscal year based on covenants with the Company's lenders in the event that the Company's leverage ratio exceeds 3.0 to 1.0. Currently there are no restrictions on share repurchases. The Company did not make any repurchases of its Common Stock during the three months ended
February 28, 2019
.
Stock Performance Graph
The following graph illustrates the five-year cumulative total return on investments in our Common Stock, the Index for NYSE Stock Market (U.S. Companies) and the Index for NYSE Stocks (SIC 5000-5099 US Companies). These indices are prepared by Zacks Investment Research, Inc. AZZ’s Common Stock is listed on The New York Stock Exchange and AZZ is engaged in two industry segments. The shareholder return shown below is not necessarily indicative of future performance. Total return, as shown, assumes $100 invested on February 28, 2014, in shares of AZZ Common Stock and each index, all with cash dividends reinvested. The calculations exclude trading commissions and taxes.
13
Comparison of Five Year-Cumulative Total Returns
Value of $100 Invested on February 28, 2014
For Fiscal Year Ended on the Last Day of February
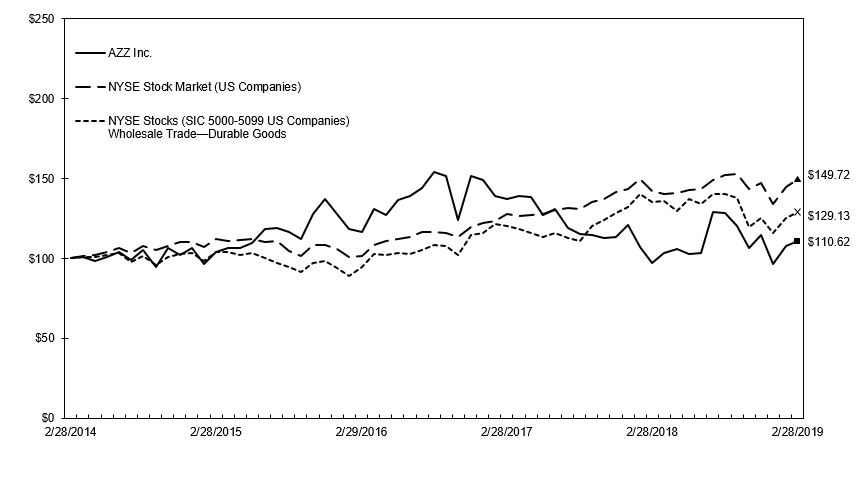
Legend
|
Symbol
|
CRSP Total Returns Index for:
|
2/14
|
2/15
|
2/16
|
2/17
|
2/18
|
2/19
|
|||||||||||||
|
|
AZZ Inc.
|
100.00
|
|
103.72
|
|
116.72
|
|
137.06
|
|
96.79
|
|
110.62
|
|
|||||||
|
|
Index for NYSE Stock Market (US Companies)
|
100.00
|
|
112.24
|
|
101.24
|
|
127.49
|
|
142.45
|
|
149.72
|
|
|||||||
|
|
Index for NYSE Stocks (SIC 5000-5099 US
|
100.00
|
|
103.87
|
|
94.28
|
|
120.51
|
|
135.40
|
|
129.13
|
|
|||||||
|
Companies) Wholesale Trade - Durable Goods
|
||||||||||||||||||||
Notes:
|
A.
|
The lines represent monthly index levels derived from compounded daily returns that include all dividends.
|
|
B.
|
The indexes are reweighted daily, using the market capitalization on the previous trading day.
|
|
C.
|
If the monthly interval, based on the fiscal year-end, is not a trading day, the preceding trading day is used.
|
|
D.
|
The index level for all series was set to $100 on 02/28/2014.
|
14
Item 6. Selected Financial Data
|
|
Fiscal Year
|
|||||||||||||||||||
|
|
2019
(a)
|
2018
(b)
|
2017
(c)
|
2016
(d)
|
2015
(e)
|
|||||||||||||||
|
|
(In thousands, except per share amounts)
|
|||||||||||||||||||
|
Summary of operations:
|
||||||||||||||||||||
|
Net sales
|
$
|
927,087
|
|
$
|
810,430
|
|
$
|
863,538
|
|
$
|
889,400
|
|
$
|
819,692
|
|
|||||
|
Net income
|
51,208
|
|
45,169
|
|
61,264
|
|
75,544
|
|
65,616
|
|
||||||||||
|
Earnings per share:
|
||||||||||||||||||||
|
Basic earnings per common share
|
1.97
|
|
1.74
|
|
2.36
|
|
2.93
|
|
2.56
|
|
||||||||||
|
Diluted earnings per common share
|
1.96
|
|
1.73
|
|
2.35
|
|
2.91
|
|
2.55
|
|
||||||||||
|
Total assets
|
1,088,570
|
|
1,028,209
|
|
978,354
|
|
988,201
|
|
929,727
|
|
||||||||||
|
Total debt
|
241,000
|
|
301,286
|
|
272,290
|
|
326,982
|
|
337,848
|
|
||||||||||
|
Total liabilities
|
484,842
|
|
463,006
|
|
445,218
|
|
503,831
|
|
505,275
|
|
||||||||||
|
Shareholders’ equity
|
603,728
|
|
565,203
|
|
533,136
|
|
484,370
|
|
424,452
|
|
||||||||||
|
Working capital
|
213,774
|
|
197,415
|
|
160,282
|
|
165,976
|
|
156,532
|
|
||||||||||
|
Cash provided by operating activities
|
114,668
|
|
78,909
|
|
111,176
|
|
143,589
|
|
118,157
|
|
||||||||||
|
Capital expenditures
|
25,616
|
|
29,612
|
|
41,434
|
|
39,861
|
|
29,377
|
|
||||||||||
|
Depreciation & amortization
|
50,245
|
|
50,526
|
|
50,357
|
|
47,417
|
|
46,089
|
|
||||||||||
|
Cash dividend per common share
|
0.68
|
|
0.68
|
|
0.64
|
|
0.60
|
|
0.58
|
|
||||||||||
|
Weighted average shares outstanding - basic
|
26,038
|
|
25,970
|
|
25,965
|
|
25,800
|
|
25,676
|
|
||||||||||
|
Weighted average shares outstanding - diluted
|
26,107
|
|
26,036
|
|
26,097
|
|
25,937
|
|
25,778
|
|
||||||||||
|
(a)
|
Includes the acquisition of Lectrus Corporation on March 22, 2018. Also includes the adoption of ASU 2016-02, Leases (Topic 842) and ASU 2014-09, Revenue from Contracts with Customers (Topic 606) on March 1, 2018.
|
|
(b)
|
Includes the acquisitions of Enhanced Powder Coating, Ltd. on June 30, 2017, Powergrid Solutions, Inc. on September 6, 2017, and Rogers Brothers Company on February 1, 2018
|
|
(c)
|
Includes the acquisition of Power Electronics, Inc. on March 1, 2016.
|
|
(d)
|
Includes the acquisitions of US Galvanizing, LLC on June 5, 2015 and Alpha Galvanizing Inc. on February 1, 2016.
|
|
(e)
|
Includes the acquisition of Zalk Steel & Supply Co. on June 20, 2014.
|
Item 7. Management’s Discussion and Analysis of Financial Condition and Results of Operations
You should read the following discussion together with our consolidated financial statements and the related notes included elsewhere in this Annual Report on Form 10-K. This discussion contains forward-looking statements regarding our business and operations. Our actual results may differ materially from those we currently anticipate as a result of the factors we describe under “Risk Factors” and elsewhere in this Annual Report on Form 10-K.
Overview
As mentioned in Item 1, AZZ operates two distinct business segments, the Energy segment and the Metal Coatings segment. Our discussion and analysis of financial condition and results of operations is divided by each of our segments along with corporate costs and other costs not specifically identifiable to a segment. For a reconciliation of segment operating income to consolidated operating income, see Note 12 to the Consolidated Financial Statements. References herein to fiscal years are to the twelve-month periods that end in February of the relevant calendar year. For example, the twelve-month period ended February 28, 2019 is referred to as “fiscal 2019” or “fiscal year 2019.”
Recently Adopted Accounting Standards
On March 1, 2018, we adopted Accounting Standards Update ("ASU") No. 2014-09,
Revenue from Contracts with Customers (Topic 606)
and the related amendments ("ASC 606") using the modified retrospective method applied to those contracts which were not completed as of February 28, 2018. Results for operating periods beginning on or after March 1, 2018 are presented under ASC 606, while prior period amounts have not been adjusted and continue to be reported in accordance with the accounting standards in effect for those periods. See Note 1 to the Consolidated Financial Statements for more information on the impact of our adoption of ASC 606.
15
During the fourth quarter of fiscal 2019, effective March 1, 2018, we adopted ASU 2016-02,
Leases (Topic 842)
using a modified retrospective approach as of the period of adoption. Periods prior to the adoption continue to be presented under legacy guidance and there was no cumulative effect adjustment to beginning retained earnings on the March 1, 2018 adoption date. On the date of adoption, we recorded operating lease right of use assets of $42.1 million and lease liabilities of $42.8 million to reflect our portfolio of operating leases, which were previously unrecorded under legacy accounting guidance. However, the adoption did not have any impact on our consolidated statements of income or cash flows. We have elected the package of practical expedients permitted under the transition guidance within the new standard, which among several other items, allows the Company to carry-forward the historical lease classification from legacy guidance for leases that existed on the date of adoption.
Results of Operations
For the fiscal year ended
February 28, 2019
, we recorded net sales of
$927.1 million
compared to the prior year’s net sales of
$810.4 million
. Of the total net sales for fiscal
2019
, approximately
52.5%
of our net sales were generated from the Energy Segment and approximately
47.5%
were generated from the Metal Coatings Segment. Net income for fiscal
2019
was
$51.2 million
compared to
$45.2 million
for fiscal
2018
. Net income as a percentage of net sales was
5.5%
for fiscal
2019
as compared to
5.6%
for fiscal
2018
. Earnings per share increased by
13.3%
to
$1.96
per share for fiscal
2019
compared to
$1.73
per share for fiscal
2018
, on a diluted basis.
Year ended
February 28, 2019
compared with year ended
February 28, 2018
Backlog
We ended fiscal
2019
with a backlog of
$332.9 million
, an increase of
$67.5 million
or
25.4%
compared to fiscal
2018
. The Company's backlog as of year end pertains solely to the Energy segment's operations. The book to revenue ratio increased in fiscal
2019
as compared to fiscal
2018
. The book to revenue ratio was
1.07
to 1 for fiscal
2019
and
0.92
to 1 for fiscal
2018
.
The following table reflects bookings and revenues for fiscal
2019
and
2018
.
Backlog Table
(In thousands)
|
Period Ended
|
Period Ended
|
|||||||||||
|
Backlog
|
2/28/2018
|
$
|
265,417
|
|
2/28/2017
|
$
|
317,922
|
|
||||
|
Net bookings
|
988,558
|
|
746,508
|
|
||||||||
|
Acquired backlog
|
6,006
|
|
11,417
|
|
||||||||
|
Revenues recognized
|
(927,087
|
)
|
(810,430
|
)
|
||||||||
|
Backlog
|
2/28/2019
|
$
|
332,894
|
|
2/28/2018
|
$
|
265,417
|
|
||||
|
Book to revenue ratio
|
1.07
|
|
0.92
|
|
||||||||
Net Sales
Our total net sales for fiscal
2019
increased by
$116.7 million
, or
14.4%
, as compared to fiscal
2018
.
The following table reflects the breakdown of revenue by segment (in thousands):
|
Year Ended
|
||||||||
|
February 28, 2019
|
February 28, 2018
|
|||||||
|
Net sales:
|
||||||||
|
Energy
|
$
|
486,823
|
|
$
|
421,033
|
|
||
|
Metal Coatings
|
440,264
|
|
389,397
|
|
||||
|
Total net sales
|
$
|
927,087
|
|
$
|
810,430
|
|
||
Our Energy segment recorded net sales for fiscal
2019
of
$486.8 million
, an increase of
15.6%
compared to fiscal
2018
net sales of
$421.0 million
. The increase in net sales for fiscal
2019
was caused by several positive factors including improved turnarounds in the U.S. refinery market, increased international projects and an uptick in our electrical business. The increase was also attributable to incremental revenues from our fiscal 2019 and fiscal 2018 business acquisitions and was partially offset by continued softness in the nuclear market, which is due in part to the Westinghouse Bankruptcy discussed below.
16
Our Metal Coatings segment, which consisted of forty-two metal coating facilities as of February 28, 2019, generated net sales of
$440.3 million
, a
13.1%
increase from the prior year’s net sales of
$389.4 million
. The increase was a result of higher selling prices and higher volumes of steel processed during the periods driven primarily by improvements in various markets. The increase was also attributable to incremental revenues from our fiscal 2018 acquisitions.
Operating Income
The following table reflects the breakdown of operating income (loss) by segment (in thousands):
|
Year Ended
|
||||||||
|
February 28, 2019
|
February 28, 2018
|
|||||||
|
Operating income (loss):
|
||||||||
|
Energy
|
$
|
31,332
|
|
$
|
(1,766
|
)
|
||
|
Metal Coatings
|
83,591
|
|
84,332
|
|
||||
|
Corporate
|
(37,967
|
)
|
(34,318
|
)
|
||||
|
Total operating income
|
$
|
76,956
|
|
$
|
48,248
|
|
||
Operating income for the Energy segment increased
$33.1 million
for fiscal
2019
, to
$31.3 million
as compared to an operating loss of
$1.8 million
for fiscal
2018
. Operating margins for this segment were
6.4%
for fiscal
2019
as compared to
(0.4)%
for fiscal
2018
. These increases were primarily attributable to the positive factors noted above and improvements in project margins. In addition, for fiscal 2018, the Company recognized an impairment charge of $10.5 million, classified within cost of sales, related to property, plant and equipment that was retired and a provision for doubtful accounts of $2.9 million, classified within selling, general and administrative, resulting from an adverse court decision related to certain outstanding accounts receivables. No such charges were recorded in fiscal 2019.
Operating income for the Metal Coatings segment decreased
$0.7 million
, or
0.9%
, for fiscal
2019
to
$83.6 million
as compared to
$84.3 million
for the prior year. Operating margins were
19.0%
for fiscal
2019
as compared to
21.7%
for fiscal
2018
. These decreases were primarily attributable to higher zinc and labor costs, which were not fully offset by increased selling prices, and a charge of $1.3 million incurred during fiscal 2019 for asset impairments, employee severance and other disposal costs related to the consolidation of two galvanizing facilities in the Gulf Coast region of the United States.
Corporate expenses were
$38.0 million
for fiscal
2019
and
$34.3 million
for fiscal
2018
. This increase is attributable to higher spend on outside services and higher employee costs in fiscal
2019
, partially offset by lower stock based compensation expense related to certain employee performance share unit grants that were forfeited when various vesting conditions were not satisfied during fiscal 2019.
Interest
Interest expense for fiscal
2019
increased
8.0%
to
$15.0 million
as compared to
$13.9 million
in fiscal
2018
. This increase is primarily attributable to higher interest rates on variable rate debt, partially offset by slightly lower average outstanding debt balances during fiscal 2019. For additional information on outstanding debt, see Note 11 to the Consolidated Financial Statements. As of
February 28, 2019
, we had gross outstanding debt of
$241.0 million
compared to
$301.3 million
at the end of fiscal
2018
. AZZ's debt to equity ratio was
0.40
to 1 at the end of fiscal
2019
compared to
0.53
to 1 at the end of fiscal
2018
.
Other (Income) Expense, Net
For fiscal
2019
, we recorded other income, net of
$1.0 million
as compared to other expense, net of
$3.5 million
in fiscal
2018
. The increase resulted primarily from a downward revision to estimated losses on the impairment of a non-trade note receivable, which was initially recognized in fiscal 2018 upon the bankruptcy declaration of the note debtor. The bankruptcy proceedings progressed better than anticipated and the Company received amounts in excess of its initial loss estimates for the outstanding note, which originated from a non-compete litigation settlement with a competitor in a prior fiscal year. This increase in other income, net was partially offset by higher foreign exchange losses that were realized during fiscal 2019 as a result of unfavorable movements in exchange rates.
17
Provision For (Benefit From) Income Taxes
The provision for (benefit from) income taxes reflected an effective tax rate of
18.7%
for fiscal
2019
and
(46.2)%
for fiscal
2018
. The increase in the effective rate was due primarily to the Tax Cuts and Jobs Act of 2017 (the “U.S. Tax Act”), which resulted in a provisional benefit for fiscal
2018
related to the remeasurement of deferred taxes at a lower corporate rate that was offset by a one-time mandatory transition tax on undistributed earnings of foreign affiliates
The U.S. Tax Act requires complex computations to be performed that were not previously required by U.S. tax law, significant judgments to be made in interpretation of the provisions of the U.S. Tax Act, significant estimates in calculations, and the preparation and analysis of information not previously relevant. The U.S. Treasury Department, the IRS, and other standard-setting bodies will continue to interpret or issue guidance on how provisions of the U.S. Tax Act will be applied or otherwise administered. As future guidance is issued, we may make adjustments to amounts that we have previously recorded that may materially impact our financial statements in the period in which the adjustments are made.
During the fourth quarter of fiscal 2019, the Company completed its assessment of the Tax Act under SAB 118, resulting in additional benefit of $1.1 million resulting from revised estimates of the mandatory deemed repatriation of foreign earnings, foreign tax credits, and bonus depreciation elections based on the finalization of our 2017 US federal income tax return. The change in bonus depreciation elections and other temporary return to provisions items resulted in $0.8 million benefit related to the finalization of the remeasurement of deferred tax assets and liabilities. The finalization of foreign earnings and profits and foreign tax credits resulted in a $0.3 million benefit.
Westinghouse Electric Company Bankruptcy Case
We had existing contracts with subsidiaries of Westinghouse Electric Company (“WEC”). WEC and the relevant subsidiaries (the "Debtors") filed relief under Chapter 11 of the Bankruptcy Code on March 29, 2017 in the United States Bankruptcy Court for the Southern District of New York, jointly administered as In re Westinghouse Electric Company, et al., Case No. 17-10751 (the "Bankruptcy Case"). The Company has been collecting on post-petition amounts due and owed. On February 22, 2018, the United States Bankruptcy Court for the Southern District of New York approved the Debtors’ Modified First Amended Disclosure Statement for the Joint Chapter 11 Plan of Reorganization. In the Disclosure Statement, the Debtors estimated a 98.9% to 100% distribution on Allowed General Unsecured Claims. We have approximately $12 million of such claims filed with the court, which includes 100% of our pre-petition claims. The total claims filed exceed the book value of our exposure and we expect to receive all amounts due. In April 2019, for one of our plants, the Company entered into a settlement agreement with the third party bankruptcy administrator related to outstanding claims. The agreement amount of approximately $8.1 million represented 100% of those outstanding claims for such plant. The balance of the $12 million claims noted above are still outstanding.
At time of the Bankruptcy Case, we were subcontractors on various WEC engagements, including one in Georgia ("V.C. Summer") and one in South Carolina ("Plant Vogtle"). The ownership of V.C. Summer halted work earlier in the year and, during the third quarter of fiscal 2018, we de-booked $11.0 million from backlog related to this project. Also during the third quarter of fiscal 2018, we received a notice of cancellation from WEC for the Plant Vogtle project, which negatively impacted our sales and margin for the second half of fiscal year 2018 by approximately $6.1 million and $1.2 million, respectively.
18
Year ended
February 28, 2018
compared with year ended
February 28, 2017
Backlog
We ended fiscal
2018
with a backlog of
$265.4 million
, a decrease of
$52.5 million
or
16.5%
as compared to fiscal
2017
. The Company's backlog as of year end pertains to the Energy segment's operations. The book to revenue ratio declined in fiscal
2018
as compared to fiscal
2017
. The book to revenue ratio was
0.92
to 1 for fiscal
2018
and
0.99
to 1 for fiscal
2017
.
The following table reflects bookings and shipments for fiscal
2018
and
2017
.
Backlog Table
(In thousands)
|
Period Ended
|
Period Ended
|
|||||||||||
|
Backlog
|
2/28/2017
|
$
|
317,922
|
|
2/28/2016
|
$
|
310,623
|
|
||||
|
Net bookings
|
746,508
|
|
858,934
|
|
||||||||
|
Acquired backlog
|
11,417
|
|
11,903
|
|
||||||||
|
Revenues recognized
|
(810,430
|
)
|
(863,538
|
)
|
||||||||
|
Backlog
|
2/28/2018
|
$
|
265,417
|
|
2/28/2017
|
$
|
317,922
|
|
||||
|
Book to revenue ratio
|
0.92
|
|
0.99
|
|
||||||||
Net Sales
Our total net sales for fiscal
2018
decreased by
$53.1 million
, or
6.2%
, as compared to fiscal
2017
.
The following table reflects the breakdown of revenue by segment (in thousands):
|
Year Ended
|
||||||||
|
February 28, 2018
|
February 28, 2017
|
|||||||
|
Net sales:
|
||||||||
|
Energy
|
$
|
421,033
|
|
$
|
488,002
|
|
||
|
Metal Coatings
|
389,397
|
|
375,536
|
|
||||
|
Total net sales
|
$
|
810,430
|
|
$
|
863,538
|
|
||
Our Energy Segment recorded net sales for fiscal
2018
of
$421.0 million
, a decrease of
13.7%
compared to fiscal
2017
net sales of
$488.0 million
. The decrease in net sales for fiscal 2018 was caused by several factors including reduced turnarounds in the U.S. refinery market, continued softness in the petrochemical market, negative impacts from the Atlantic hurricane activity, cancellations and delays in the release of several large projects in the U.S. and overseas. In addition, net sales were negatively impacted by the effects on the nuclear market from the Westinghouse Electric Company bankruptcy filed on March 29, 2017.
Our Metal Coatings Segment, which consisted of forty-five metal coating facilities as of
February 28, 2018
, generated net sales of
$389.4 million
, a
3.7%
increase from the prior year’s net sales of
$375.5 million
. The increase was attributable to incremental revenues from our acquisitions during the year and increased prices. These increases were partially offset by decreased volumes in steel processed as a result of softness in the solar, petrochemical, and the oil and gas markets.
19
Operating Income
The following table reflects the breakdown of operating income (loss) by segment (in thousands):
|
Year Ended
|
||||||||
|
February 28, 2018
|
February 28, 2017
|
|||||||
|
Operating income (loss):
|
||||||||
|
Energy
|
$
|
(1,766
|
)
|
$
|
52,577
|
|
||
|
Metal Coatings
|
84,332
|
|
79,033
|
|
||||
|
Corporate
|
(34,318
|
)
|
(32,702
|
)
|
||||
|
Total operating income
|
$
|
48,248
|
|
$
|
98,908
|
|
||
Operating income (loss) for the Energy segment decreased
$54.3 million
, or
103.4%
, for fiscal
2018
, to a loss of
$(1.8) million
as compared to income of
$52.6 million
for fiscal
2017
. Operating margins for this segment were
(0.4)%
for fiscal
2018
as compared to
10.8%
for fiscal
2017
. This decrease was attributable to the reduction in refinery turnarounds described above, which typically carry a higher margin, cancellations, margin degradations on certain large projects in the U.S. and overseas and the Westinghouse bankruptcy. In addition, for fiscal 2018, the Company recognized an impairment charge of $10.5 million related to property, plant and equipment that was retired and a provision for doubtful accounts of $2.9 million resulting from an adverse court decision related to certain outstanding accounts receivables. No such charges were recorded in the prior year comparable period.
Operating income for the Metal Coatings segment increased
$5.3 million
, or
6.7%
, for fiscal
2018
to
$84.3 million
as compared to
$79.0 million
for the prior year. Operating margins were
21.7%
for fiscal
2018
as compared to
21.0%
for fiscal
2017
. Excluding the impact of realignment charges of $7.3 million incurred in fiscal
2017
, overall margins decreased in fiscal
2018
as a result of lower volumes and increased costs for zinc, partially offset by incremental margin earned from our acquisitions completed during the year.
Corporate expenses were
$34.3 million
for fiscal
2018
and
$32.7 million
for fiscal
2017
. This increase is attributable to higher spend on professional services and higher employee costs in fiscal
2018
.
Interest
Interest expense for fiscal
2018
decreased
5.9%
to
$13.9 million
as compared to
$14.7 million
in fiscal
2017
. This decrease is primarily attributable to more favorable interest rates during fiscal 2018 as a result of our partial or full repayment of certain outstanding debt obligations that were replaced with borrowings that carried lower interest rates. For additional information on outstanding debt, see Note 11 to the Consolidated Financial Statements. As of
February 28, 2018
, we had gross outstanding debt of $301.3 million compared to $272.3 million at the end of fiscal 2017. AZZ's debt to equity ratio was 0.53 to 1 at the end of fiscal 2018 compared to 0.51 to 1 at the end of fiscal
2017
.
Other (Income) Expense, Net
For fiscal 2018, a total of
$3.5 million
in expense was recorded to other (income) expense, net, which was primarily attributable to the impairment of the non-trade note receivable described above upon the bankruptcy declaration of the note debtor. For fiscal 2017, we recorded
$1.1 million
of income to other (income) expense, net, which was primarily attributable to a reimbursement of legal fees of $0.6 million from a lawsuit in fiscal 2016 and net foreign exchange gains.
Provision For (Benefit From) Income Taxes
The provision for (benefit from) income taxes reflected an effective tax rate of (46.2)% for fiscal 2018 and 28.2% for fiscal 2017. The decrease in the effective rate was due primarily to the U.S. Tax Cuts and Jobs Act of 2017, which resulted in a provisional benefit related to the remeasurement of deferred taxes at a lower corporate rate that was offset by a one-time mandatory transition tax on undistributed earnings of foreign affiliates.
20
Liquidity and Capital Resources
We have historically met our cash needs through a combination of cash flows from operating activities along with bank and bond market debt. Our cash requirements are generally for operating activities, cash dividend payments, capital improvements, debt repayment and acquisitions. We believe that our cash position, cash flows from operating activities and our expectation of continuing availability to draw upon our credit facilities are sufficient to meet our cash flow needs for the foreseeable future.
Cash Flows
The following table summarizes our cash flows by category for the periods presented (in thousands):
|
Twelve Months Ended
|
||||||||
|
February 28, 2019
|
February 28, 2018
|
|||||||
|
Net cash provided by operating activities
|
$
|
114,668
|
|
$
|
78,909
|
|
||
|
Net cash used in investing activities
|
(32,073
|
)
|
(73,939
|
)
|
||||
|
Net cash (used in) provided by financing activities
|
(78,004
|
)
|
3,800
|
|
||||
Net cash provided by operating activities for fiscal
2019
was
$114.7 million
compared to
$78.9 million
for fiscal
2018
. The increase in cash provided by operating activities for fiscal
2019
as compared to fiscal
2018
is primarily attributable to the increase in net income and positive impacts from changes in working capital. The increase was also attributable to a decline in non-cash tax benefit accruals which were recorded in fiscal 2018 resulting from the remeasurement of deferred tax liabilities due to the decrease of U.S. corporate tax rates as part of the Tax Cuts and Jobs Act of 2017. This decline in non-cash tax benefit accruals was partially offset by lower non-cash impairment charges in fiscal 2019 as compared to fiscal 2018.
Net cash used in investing activities for fiscal
2019
was
$32.1 million
as compared to
$73.9 million
for fiscal
2018
. The decline in cash used during fiscal
2019
was primarily attributable to decreased acquisition activity and lower capital expenditures. The breakdown of capital spending by segment for fiscal
2019
,
2018
and
2017
can be found in Note 12 to the Consolidated Financial Statements.
Net cash used in financing activities for fiscal
2019
was
$78.0 million
compared to net cash provided by financing activities of
$3.8 million
for fiscal
2018
. The increase in cash used for financing activities during fiscal
2019
was primarily attributable to significantly increased net repayments of borrowings under our revolving credit facility, partially offset by lower principal payments under our other long-term debt agreements.
Financing and Capital
2017 Revolving Credit Facility
On March 27, 2013, the Company entered into a credit agreement (the “Credit Agreement”) with Bank of America and other lenders. The Credit Agreement provided for a $75.0 million term facility and a $225.0 million revolving credit facility that included a $75.0 million “accordion” feature. The Credit Agreement is used to provide for working capital needs, capital improvements, dividends, future acquisitions and letter of credit needs.
On March 21, 2017, the Company executed the Amended and Restated Credit Agreement (the “2017 Credit Agreement”) with Bank of America and other lenders. The 2017 Credit Agreement amended the Credit Agreement by the following: (i) extending the maturity date until March 21, 2022, (ii) providing for a senior revolving credit facility in a principal amount of up to $450 million, with an additional $150 million accordion, (iii) including a $75 million sublimit for the issuance of standby and commercial letters of credit, (iv) including a $30 million sublimit for swing line loans, (v) restricting indebtedness incurred in respect of capital leases, synthetic lease obligations and purchase money obligations not to exceed $20 million, (vi) restricting investments in any foreign subsidiaries not to exceed $50 million in the aggregate, and (vii) including various financial covenants and certain restricted payments relating to dividends and share repurchases as specifically set forth in the 2017 Credit Agreement. The balance due on the $75.0 million term facility under the previous Credit Agreement was paid in full as a result of the execution of the 2017 Credit Agreement.
The financial covenants, as defined in the 2017 Credit Agreement, require the Company to maintain on a consolidated basis a Leverage Ratio not to exceed 3.25:1.0 and an Interest Coverage Ratio of at least 3.00:1.0. The 2017 Credit Agreement will be used to finance working capital needs, capital improvements, dividends, future acquisitions, letter of credit needs and share repurchases.
21
Interest rates for borrowings under the 2017 Credit Agreement are based on either a Eurodollar Rate or a Base Rate plus a margin ranging from 0.875% to 1.875% depending on our Leverage Ratio (as defined in the 2017 Credit Agreement). The Eurodollar Rate is defined as LIBOR for a term equivalent to the borrowing term (or other similar interbank rates if LIBOR is unavailable). The Base Rate is defined as the highest of the applicable Fed Funds rate plus 0.50%, the Prime rate, or the Eurodollar Rate plus 1.0% at the time of borrowing. The 2017 Credit Agreement also carries a Commitment Fee for the unfunded portion ranging from 0.175% to 0.30% per annum, depending on our Leverage Ratio. The effective interest rate was 4.06% as of
February 28, 2019
.
As of
February 28, 2019
, we had $116.0 million of outstanding debt against the revolving credit facility and letters of credit outstanding in the amount of $18.7 million, which left approximately $315.3 million of additional credit available under the 2017 Credit Agreement.
2011 Senior Notes
On January 21, 2011, the Company entered into a Note Purchase Agreement (the “2011 Agreement”), pursuant to which the Company issued $125.0 million aggregate principal amount of its 5.42% unsecured Senior Notes (the “2011 Notes”), through a private placement (the “2011 Note Offering”). Amounts under the agreement are due in a balloon payment on the January 2021 maturity date. Pursuant to the 2011 Agreement, the Company's payment obligations with respect to the 2011 Notes may be accelerated under certain circumstances.
The 2011 Notes contain various financial covenants requiring the Company, among other things, to a) maintain on a consolidated basis net worth equal to at least the sum of $116.9 million plus 50.0% of future net income; b) maintain a ratio of indebtedness to EBITDA (as defined in Note Purchase Agreement) not to exceed 3.25:1.00; c) maintain on a consolidated basis a Fixed Charge Coverage Ratio (as defined in the Note Purchase Agreement) of at least 2.0:1.0; d) not at any time permit the aggregate amount of all Priority Indebtedness (as defined in the Note Purchase Agreement) to exceed 10.0% of Consolidated Net Worth (as defined in the Note Purchase Agreement).
2008 Senior Notes
On March 31, 2008, the Company entered into a Note Purchase Agreement (the “Note Purchase Agreement”) pursuant to which the Company issued $100.0 million aggregate principal amount of its 6.24% unsecured Senior Notes (the “2008 Notes”) through a private placement (the “2008 Note Offering”). Amounts were due under the Agreement in
seven
annual installments of
$14.3 million
commencing in March of 2012 through the March 2018 maturity date. On March 31, 2018, the Company made the final principal payment of $14.3 million to fully settle the 2008 Senior Notes on the scheduled maturity date.
As of
February 28, 2019
, the Company was in compliance with all of its debt covenants.
Share Repurchase Program
In January of 2012, our Board authorized the repurchase of up to ten percent of the outstanding shares of our Common Stock. The share repurchase authorization does not have an expiration date, and the amount and prices paid for any future share purchases under the authorization will be based on market conditions and other factors at the time of the purchase. Repurchases under this share repurchase authorization would be made through open market purchases or private transactions in accordance with applicable federal securities laws, including Rule 10b-18 under the Exchange Act. The Company did not make any repurchases of its common shares during the
twelve months ended
February 28, 2019
.
Other Exposures
We have exposure to commodity price increases in both segments of our business, primarily copper, aluminum, steel and nickel based alloys in the Energy segment and zinc and natural gas in the Metal Coatings segment. We attempt to minimize these increases through escalation clauses in customer contracts for copper, aluminum, steel and nickel based alloys, when market conditions allow and through fixed cost contract purchases on zinc. In addition to these measures, we attempt to recover other cost increases through improvements to our manufacturing process, supply chain management, and through increases in prices where competitively feasible.
22
Off Balance Sheet Arrangements and Contractual Commitments
As of
February 28, 2019
, the Company did not have any off-balance sheet arrangements as defined under SEC rules. Specifically, there were no off-balance sheet transactions, arrangements, obligations (including contingent obligations), or other relationships with unconsolidated entities or other persons that have, or may have, a material effect on the financial condition, changes in financial condition, revenues or expenses, results of operations, liquidity, capital expenditures or capital resources of the Company.
The following summarizes our lease obligations, debt principal payments, and interest payments (based on current interest rates for variable rate debt) for the remainder of the next five years and beyond (in thousands):
|
Operating Leases
|
Debt |
Interest
|
Total
|
|||||||||||||
|
Fiscal year:
|
|
|||||||||||||||
|
2020
|
$
|
7,882
|
|
$
|
—
|
|
$
|
11,843
|
|
$
|
19,725
|
|
||||
|
2021
|
7,185
|
|
125,000
|
|
11,803
|
|
143,988
|
|
||||||||
|
2022
|
6,803
|
|
—
|
|
5,029
|
|
11,832
|
|
||||||||
|
2023
|
6,454
|
|
116,000
|
|
550
|
|
123,004
|
|
||||||||
|
2024
|
5,771
|
|
—
|
|
—
|
|
5,771
|
|
||||||||
|
Thereafter
|
24,718
|
|
—
|
|
—
|
|
24,718
|
|
||||||||
|
Total
|
$
|
58,813
|
|
$
|
241,000
|
|
$
|
29,225
|
|
$
|
329,038
|
|
||||
In addition, as of
February 28, 2019
,
w
e had outstanding letters of credit in the amount of $44.3 million. These letters of credit are issued for a number of reasons, but are most commonly issued in lieu of customer retention withholding payments covering warranty or performance periods.
Critical Accounting Policies and Estimates
The preparation of the consolidated financial statements requires us to make estimates that affect the reported value of assets, liabilities, revenues and expenses. Our estimates are based on historical experience and various other factors that we believe are reasonable under the circumstances and form the basis for our conclusions. We continually evaluate the information used to make these estimates as business and economic conditions change. Accounting policies and estimates considered most critical are allowances for doubtful accounts, accruals for contingent liabilities, revenue recognition, impairment of long-lived assets, identifiable intangible assets and goodwill, accounting for income taxes and stock-based compensation expense. Actual results may differ from these estimates under different assumptions or conditions. The development and selection of the critical accounting policies and the related disclosures below have been reviewed with the Audit Committee of the Board of Directors. More information regarding significant accounting policies can be found in Note 1 to the Consolidated Financial Statements.
Allowance for Doubtful Accounts
The carrying value of our accounts receivable is continually evaluated based on the likelihood of collection. An allowance is maintained for estimated losses resulting from our customers’ inability to make required payments. The allowance is determined by historical experience of uncollected accounts, the level of past due accounts, overall level of outstanding accounts receivable, information about specific customers with respect to their inability to make payments and future expectations of conditions that might impact the collectibility of accounts receivable. If the financial condition of our customers were to deteriorate, resulting in an impairment of their ability to make payments, additional allowances could be required.
Accruals for Contingent Liabilities
The amounts we record for estimated claims, such as self-insurance programs, warranty, environmental and other contingent liabilities, requires us to make judgments regarding the amount of expenses that will ultimately be incurred. We use past history and experience and other specific circumstances surrounding these claims in evaluating the amount of liability that should be recorded. Actual results may be different than what we estimate.
23
Revenue recognition
We determine revenue recognition through the following steps:
1)
Identification of the contract with a customer,
2)
Identification of the performance obligations in the contract,
3)
Determination of the transaction price,
4)
Allocation of the transaction price to performance obligations in the contract, and
5)
Recognition of revenue when, or as, the Company satisfies a performance obligation
Revenue is recognized when control of the promised goods or services is transferred to our customers, in an amount that reflects the consideration that we expect to be entitled to in exchange for those goods or services.
The amount and timing of revenue recognition varies by segment based on the nature of the goods or services provided and the terms and conditions of the customer contract.
Energy Segment
Our Energy segment is a provider of specialized products and services designed to support industrial, nuclear and electrical applications. Within this segment, the contract is governed by a customer purchase order and an executed product or services agreement. The contract generally specifies the delivery of what constitutes a single performance obligation consisting of either custom built products, custom services, or off-the-shelf products. When we enter into an arrangement with multiple performance obligations, the transaction price is allocated to each performance obligation based on the relative standalone selling prices of the goods or services being provided to the customer and revenue is recognized upon the satisfaction of each performance obligation. We combine contracts for revenue recognition purposes that are executed with the same customer within a short timeframe from each other and that purport to be for a single commercial objective.
For custom built products, we recognize revenues over time provided that the goods do not have an alternative use to the Company and we have an unconditional right to payment for work completed to date plus a reasonable margin. For custom services, which consist of specialized welding and other professional services, we recognize revenues over time as the services are rendered due to the fact that the services enhance a customer owned asset. For off-the-shelf products, which consist of tubing and lighting products, we recognize revenue at a point-in-time upon the transfer of the goods to the customer.
For revenues recognized over time, we generally use the cost-to-cost method of revenue recognition. Under this approach, the extent of progress towards completion is measured based on the ratio of costs incurred to date versus the total estimated costs upon completion of the project. This requires that we estimate the total contract revenues, project costs and margin, which can involve significant management judgment. As a significant change in one or more of these estimates could affect the profitability of our contracts, management reviews and updates its contract related estimates regularly. We recognize adjustments in estimated margin on contracts under a cumulative catch-up basis and subsequent revenues are recognized using the adjusted estimate. If the estimate of contract margin indicates an anticipated loss on the contract, we recognize the total estimated loss in the period it is identified.
Due to the custom nature of the goods and services provided, contracts within the Energy segment are often modified to account for changes in contract specifications and requirements. A contract modification exists when the modification either creates new, or changes the existing, enforceable rights and obligations in the contract. For us, most contract modifications are related to goods or services that are not distinct from those in the original contract due to the significant interrelationship or interdependencies between the deliverables. Such modifications are accounted for as if they were part of the original contract. As a result, the transaction price and the measure of progress for the performance obligation to which it relates, is recognized as an adjustment to revenue on a cumulative catch-up basis.
In addition to fixed consideration, the contracts within our Energy segment can include variable consideration, including claims, incentive fees, liquidated damages or other penalties. We recognizes revenue for variable consideration when it is probable that a significant reversal in the amount of cumulative revenue recognized will not occur. We estimate the amount of revenue to be recognized on variable consideration using the expected value or the most likely amount method, whichever is expected to better predict the amount.
Metal Coatings Segment
Our Metal Coatings segment is a provider of hot dip galvanizing, powder coating and other metal coating applications to the steel fabrication industry. Within this segment, the contract is governed by a customer purchase order or work order. The contract generally specifies the delivery of what constitutes a single performance obligation consisting of metal coating services.
24
We combine contracts for revenue recognition purposes that are executed with the same customer within a short timeframe from each other and that purport to be for a single commercial objective.
We recognize revenue over time as the metal coating is applied to the customer provided material as the process enhances a customer controlled asset. Contract modifications are rare within this segment and most contracts are on a fixed price basis with no variable consideration.
Contract Assets and Liabilities
The timing of revenue recognition, billings and cash collections results in accounts receivable, contract assets (unbilled receivables), and contract liabilities (customer advances and deposits) on the consolidated balance sheets, primarily related to our Energy segment. Amounts are billed as work progresses in accordance with agreed upon contractual terms, either at periodic intervals (e.g., weekly or monthly) or upon achievement of contractual milestones. Billing can occur subsequent to revenue recognition, resulting in contract assets. In addition, we can receive advances or deposits from its customers, before revenue is recognized, resulting in contract liabilities. These assets and liabilities are reported on the consolidated balance sheets on a contract-by-contract basis at the end of each reporting period.
Other
No general rights of return exist for customers and we establish provisions for estimated warranties. We generally do not sell extended warranties. Revenue is recognized net of applicable sales and other taxes. We do not adjust the contract price for the effects of a significant financing component if we expect, at contract inception, that the period between when we transfer a good or service to a customer and when the customer pays for that good or service will be one year or less, which is generally the case. Sales commissions are deferred and recognized over the same period as the related revenues. Shipping and handling is treated as a fulfillment obligation instead of a separate performance obligation and such costs are expensed as incurred.
Impairment of Long-Lived Assets, Identifiable Intangible Assets and Goodwill
We record impairment losses on long-lived assets, including identifiable intangible assets, when events and circumstances indicate that the assets might be impaired and the undiscounted projected cash flows associated with those assets are less than the carrying amounts of those assets. In those situations, impairment losses on long-lived assets are measured based on the excess of the carrying amount over the asset’s fair value, generally determined based upon discounted estimates of future cash flows. A significant change in events, circumstances or projected cash flows could result in an impairment of long-lived assets, including identifiable intangible assets. An annual impairment test of goodwill is performed in the fourth quarter of each fiscal year. The test is calculated using the anticipated future cash flows after tax from our operating segments. Based on the present value of the future cash flows, we will determine whether an impairment may exist. A significant change in projected cash flows or cost of capital for future years could result in an impairment of goodwill in future years. Variables impacting future cash flows include, but are not limited to, the level of customer demand for and response to products and services we offer to the power generation market, the electrical transmission and distribution markets, the general industrial market and the hot dip galvanizing market, changes in economic conditions of these various markets, raw material and natural gas costs and availability of experienced labor and management to implement our growth strategies. Our testing concluded that none of our goodwill was impaired.
Accounting for Income Taxes
Our income tax expense, deferred tax assets and liabilities, and liabilities for unrecognized tax benefits reflect management’s best assessment of estimated current and future taxes to be paid. We are subject to income taxes in both the United States and numerous foreign jurisdictions. Significant judgments and estimates are required in determining the consolidated income tax expense. Deferred income taxes arise from temporary differences between the tax basis of assets and liabilities and their reported amounts in the financial statements, which will result in taxable or deductible amounts in the future.
In evaluating our ability to recover our deferred tax assets within the jurisdiction from which they arise, we consider all available positive and negative evidence, including scheduled reversals of deferred tax liabilities, projected future taxable income, tax-planning strategies, and results of recent operations. In projecting future taxable income, we begin with historical results adjusted for the results of discontinued operations and incorporate assumptions about the amount of future state, federal, and foreign pretax operating income adjusted for items that do not have tax consequences. The assumptions about future taxable income require significant judgment and are consistent with the plans and estimates we are using to manage the underlying businesses. Deferred tax assets are reduced by a valuation allowance if it is more likely than not that some portion or all of the deferred tax asset will not be realized.
25
The calculation of our tax liabilities involves dealing with uncertainties in the application of complex tax laws and regulations in a multitude of jurisdictions across our global operations. Generally accepted accounting principles in the United States of America ("GAAP") states that a tax benefit from an uncertain tax position may be recognized when it is more likely than not that the position will be sustained upon examination, including resolutions of any related appeals or litigation processes, on the basis of the technical merits. We may (1) record unrecognized tax benefits as liabilities in accordance with GAAP and (2) adjust these liabilities when our judgment changes as a result of the evaluation of new information not previously available. Because of the complexity of some of these uncertainties, the ultimate resolution may result in a payment that is materially different from our current estimate of the unrecognized tax benefit liabilities. These differences will be reflected as increases or decreases to income tax expense in the period in which new information is available.
We currently do not record unrecognized tax benefits related to U.S. federal, state or, foreign tax exposure. We continue to review our tax exposure for any significant need to record unrecognized tax benefits in the future.
The U.S. Tax Cuts and Jobs Act of 2017 (the “U.S. Tax Act”) requires complex computations to be performed that were not previously required by U.S. tax law, significant judgments to be made in interpretation of the provisions of the U.S. Tax Act, significant estimates in calculations, and the preparation and analysis of information not previously relevant. The U.S. Treasury Department, the IRS, and other standard-setting bodies will continue to interpret or issue guidance on how provisions of the U.S. Tax Act will be applied or otherwise administered. As future guidance is issued, we may make adjustments to amounts that we have previously recorded that may materially impact our financial statements in the period in which the adjustments are made.
Stock-based Compensation Expense
Stock-based compensation expense consists of the expense for restricted stock units ("RSUs"), performance share units ("PSUs"), stock appreciation rights ("SARs") and employee stock purchase plan ("ESPP") shares granted to our employees and directors. The compensation cost is measured based on the grant-date fair value of those awards and is recognized over the respective vesting periods of the awards.
For SARs and ESPP awards, we estimate the grant date fair value using a Black-Scholes pricing model. For PSUs, which generally have performance-based and market-based vesting conditions, we estimate the grant date fair value using a Monte Carlo simulation. The inputs required for these valuation models are subjective and require significant management judgment. For RSUs we estimate the grant date fair value based on the close price of our common stock on the date of grant.
Recent Accounting Pronouncements
See Part II, Item 8. Consolidated Financial Statements and Supplementary Data, Note 1, Summary of Significant Account Policies, of the Notes to the Consolidated Financial Statements of this Annual Report on Form 10-K, for a full description of recent accounting pronouncements, including the actual and expected dates of adoption and estimated effects on our consolidated results of operations and financial condition, which is incorporated herein by reference.
26
Item 7A. Quantitative and Qualitative Disclosures About Market Risk
We are exposed to market risk from changes in commodity prices, interest rates and foreign currency exchange rates. As of
February 28, 2019
, we did not hold any derivative financial instruments.
Commodity Prices
In our Energy segment, we have exposure to commodity price changes for copper, aluminum, steel and nickel based alloys. Increases in price for these items are normally managed through escalation clauses in our customers' contracts, although during difficult market conditions customers' may resist these escalation clauses. In addition, we attempt to enter into firm pricing contracts with our vendors on material at the time we receive orders from our customers to minimize risk.
In our Metal Coatings segment, we have exposure to commodity price changes for zinc and natural gas, which are the primary inputs in the metal coatings process. We manage our exposure to changes in the price of zinc by entering into agreements with our zinc suppliers and such agreements generally include protective caps or other fixed prices. We also secure firm pricing for natural gas supplies with individual utilities when possible. We believe these agreements ensure adequate supplies and partially offset exposure to commodity price escalation.
Interest Rates
We had
$116.0 million
in gross debt outstanding at
February 28, 2019
related to our revolving credit facility. Because 100% of this debt has variable interest rates, we are subject to future interest rate fluctuations in relation to these borrowings which could potentially have a negative impact on our results of operations, financial position or cash flows.
Foreign Exchange Rates
The company’s foreign exchange exposures result primarily from inter-company balances, sale of products in foreign currencies, foreign currency denominated purchases, employee-related and other costs of running operations in foreign countries. As of
February 28, 2019
, the Company had exposure to foreign currency exchange rates related to our operations in Canada, China, Brazil, Poland, and the Netherlands.
Sensitivity Analysis
We do not believe that a hypothetical change of 10% of the interest rate or currency exchange rate that are currently in effect or a change of 10% of commodity prices would have a significant adverse effect on our results of operations, financial position, or cash flows as long as we are able to pass along the increases in commodity prices to our customers. However, there can be no assurance that either interest rates, exchange rates or commodity prices will not change in excess of the 10% hypothetical amount or that we would be able to pass along rising costs of commodity prices to our customers, and such hypothetical change could have an adverse effect on our results of operations, financial position, and cash flows.
27
Item 8. Financial Statements and Supplementary Data
Index to Consolidated Financial Statements and Schedules
|
|
|
Page
|
|
1.
|
Consolidated Financial Statements
|
|
|
2.
|
Consolidated Financial Statement Schedule
|
|
28
Report of Independent Registered Public Accounting Firm
Board of Directors and Shareholders
AZZ Inc.
Fort Worth, Texas
Opinion on the Consolidated Financial Statements
We have audited the accompanying consolidated balance sheets of AZZ Inc. (the “Company”) and subsidiaries as of February 28, 2019 and 2018, the related consolidated statements of income, comprehensive income, shareholders’ equity, and cash flows for each of the three fiscal years in the period ended February 28, 2019, and the related notes and financial statement schedule (collectively referred to as the “consolidated financial statements”). In our opinion, the consolidated financial statements present fairly, in all material respects, the financial position of the Company and subsidiaries at February 28, 2019 and 2018, and the results of their operations and their cash flows for each of the three fiscal years in the period ended February 28, 2019
,
in conformity with accounting principles generally accepted in the United States of America.
We also have audited, in accordance with the standards of the Public Company Accounting Oversight Board (United States) (“PCAOB”), the Company's internal control over financial reporting as of February 28, 2019, based on criteria established in
Internal Control - Integrated Framework (2013)
issued by the Committee of Sponsoring Organizations of the Treadway Commission (“COSO”) and our report dated
May 17, 2019
expressed an adverse opinion thereon.
Basis for Opinion
These consolidated financial statements are the responsibility of the Company’s management. Our responsibility is to express an opinion on the Company’s consolidated financial statements based on our audits. We are a public accounting firm registered with the PCAOB and are required to be independent with respect to the Company in accordance with the U.S. federal securities laws and the applicable rules and regulations of the Securities and Exchange Commission and the PCAOB.
We conducted our audits in accordance with the standards of the PCAOB. Those standards require that we plan and perform the audit to obtain reasonable assurance about whether the consolidated financial statements are free of material misstatement, whether due to error or fraud.
Our audits included performing procedures to assess the risks of material misstatement of the consolidated financial statements, whether due to error or fraud, and performing procedures that respond to those risks. Such procedures included examining, on a test basis, evidence regarding the amounts and disclosures in the consolidated financial statements. Our audits also included evaluating the accounting principles used and significant estimates made by management, as well as evaluating the overall presentation of the consolidated financial statements. We believe that our audits provide a reasonable basis for our opinion.
/s/ BDO USA, LLP
We have served as the Company's auditor since 2006.
Dallas, Texas
May 17, 2019
29
Report of Independent Registered Public Accounting Firm
Board of Directors and Shareholders
AZZ Inc.
Fort Worth, Texas
Opinion on Internal Control over Financial Reporting
We have audited AZZ Inc.’s (the “Company’s”) internal control over financial reporting as of February 28, 2019, based on criteria established in
Internal Control - Integrated Framework (2013)
issued by the Committee of Sponsoring Organizations of the Treadway Commission (the “COSO criteria”). In our opinion, the Company did not maintain, in all material respects, effective internal control over financial reporting as of February 28, 2019, based on the COSO criteria
.
We do not express an opinion or any other form of assurance on management’s statements referring to any corrective actions taken by the Company after the date of management’s assessment.
We also have audited, in accordance with the standards of the Public Company Accounting Oversight Board (United States) (“PCAOB”), the consolidated balance sheets of the Company as of February 28, 2019 and 2018, the related consolidated statements of income, comprehensive income, shareholders’ equity, and cash flows for each of the three fiscal years in the period ended February 28, 2019, and the related notes and financial statement schedule (collectively referred to as “the consolidated financial statements”) and our report dated
May 17, 2019
expressed an unqualified opinion thereon.
Basis for Opinion
The Company’s management is responsible for maintaining effective internal control over financial reporting and for its assessment of the effectiveness of internal control over financial reporting, included in the accompanying “Item 9A, Management’s Report on Internal Control over Financial Reporting”. Our responsibility is to express an opinion on the Company’s internal control over financial reporting based on our audit. We are a public accounting firm registered with the PCAOB and are required to be independent with respect to the Company in accordance with U.S. federal securities laws and the applicable rules and regulations of the Securities and Exchange Commission and the PCAOB.
We conducted our audit of internal control over financial reporting in accordance with the standards of the PCAOB. Those standards require that we plan and perform the audit to obtain reasonable assurance about whether effective internal control over financial reporting was maintained in all material respects. Our audit included obtaining an understanding of internal control over financial reporting, assessing the risk that a material weakness exists, and testing and evaluating the design and operating effectiveness of internal control based on the assessed risk. Our audit also included performing such other procedures as we considered necessary in the circumstances. We believe that our audit provides a reasonable basis for our opinion.
A material weakness is a deficiency, or a combination of deficiencies, in internal control over financial reporting, such that there is a reasonable possibility that a material misstatement of the company’s annual or interim financial statements will not be prevented or detected on a timely basis. A material weakness was identified regarding management’s failure to maintain effective controls pertaining to the Company’s preparation and review of its revenue reconciliations. This material weakness was considered in determining the nature, timing, and extent of audit tests applied in our audit of the consolidated financial statements for the year ended February 28, 2019, and this report does not affect our report dated
May 17, 2019
on those consolidated financial statements.
As indicated in the accompanying “Item 9A Management’s Report on Internal Control over Financial Reporting,” management’s assessment of and conclusion on the effectiveness of internal control over financial reporting did not include the internal controls of Lectrus Corporation, which was acquired on March 22, 2018, and which is included in the consolidated balance sheet of the Company as of February 28, 2019, and the related statements of income, comprehensive income, shareholders’ equity, and cash flows for each of the year then ended. Lectrus Corporation constituted approximately 2.0% of total assets as of February 28, 2019, and 2.6% and 2.2% of revenues and net income, respectively, for the year then ended. Management did not assess the effectiveness of internal control over financial reporting of the acquired entity because of the timing of the acquisition. Our audit of internal control over financial reporting of the Company also did not include an evaluation of the internal control over financial reporting of Lectrus Corporation.
30
Definition and Limitations of Internal Control over Financial Reporting
A company’s internal control over financial reporting is a process designed to provide reasonable assurance regarding the reliability of financial reporting and the preparation of financial statements for external purposes in accordance with generally accepted accounting principles. A company’s internal control over financial reporting includes those policies and procedures that (1) pertain to the maintenance of records that, in reasonable detail, accurately and fairly reflect the transactions and dispositions of the assets of the company; (2) provide reasonable assurance that transactions are recorded as necessary to permit preparation of financial statements in accordance with generally accepted accounting principles, and that receipts and expenditures of the company are being made only in accordance with authorizations of management and directors of the company; and (3) provide reasonable assurance regarding prevention or timely detection of unauthorized acquisition, use, or disposition of the company’s assets that could have a material effect on the financial statements.
Because of its inherent limitations, internal control over financial reporting may not prevent or detect misstatements. Also, projections of any evaluation of effectiveness to future periods are subject to the risk that controls may become inadequate because of changes in conditions, or that the degree of compliance with the policies or procedures may deteriorate.
/s/ BDO USA, LLP
Dallas, Texas
May 17, 2019
31
AZZ INC.
CONSOLIDATED STATEMENTS OF INCOME
(in thousands, except per share amounts)
|
|
Year Ended
|
|||||||||||
|
|
February 28, 2019
|
February 28, 2018
|
February 28, 2017
|
|||||||||
|
Net sales
|
$
|
927,087
|
|
$
|
810,430
|
|
$
|
863,538
|
|
|||
|
Cost of sales
|
728,466
|
|
650,121
|
|
658,206
|
|
||||||
|
Gross profit
|
198,621
|
|
160,309
|
|
205,332
|
|
||||||
|
Selling, general and administrative
|
121,665
|
|
112,061
|
|
106,424
|
|
||||||
|
Operating income
|
76,956
|
|
48,248
|
|
98,908
|
|
||||||
|
Interest expense
|
14,971
|
|
13,860
|
|
14,732
|
|
||||||
|
Other expense (income), net
|
(1,020
|
)
|
3,489
|
|
(1,121
|
)
|
||||||
|
Income before income taxes
|
63,005
|
|
30,899
|
|
85,297
|
|
||||||
|
Income tax (benefit) expense
|
11,797
|
|
(14,270
|
)
|
24,033
|
|
||||||
|
Net income
|
$
|
51,208
|
|
$
|
45,169
|
|
$
|
61,264
|
|
|||
|
Earnings per common share
|
||||||||||||
|
Basic earnings per share
|
$
|
1.97
|
|
$
|
1.74
|
|
$
|
2.36
|
|
|||
|
Diluted earnings per share
|
$
|
1.96
|
|
$
|
1.73
|
|
$
|
2.35
|
|
|||
|
Weighted average shares outstanding
|
||||||||||||
|
Basic
|
26,038
|
|
25,970
|
|
25,965
|
|
||||||
|
Diluted
|
26,107
|
|
26,036
|
|
26,097
|
|
||||||
|
Cash dividends declared per common share
|
$
|
0.68
|
|
$
|
0.68
|
|
$
|
0.64
|
|
|||
The accompanying notes are an integral part of the consolidated financial statements.
32
AZZ INC.
CONSOLIDATED STATEMENTS OF COMPREHENSIVE INCOME
(in thousands)
|
|
Year Ended
|
|||||||||||
|
|
February 28, 2019
|
February 28, 2018
|
February 28, 2017
|
|||||||||
|
Net income
|
$
|
51,208
|
|
$
|
45,169
|
|
$
|
61,264
|
|
|||
|
Other comprehensive income (loss):
|
||||||||||||
|
Change in foreign currency translation (net of tax of $0, $0 and $0)
|
(3,478
|
)
|
3,928
|
|
1,520
|
|
||||||
|
Interest rate swap (net of tax of $29, $29 and $29)
|
(54
|
)
|
(54
|
)
|
(54
|
)
|
||||||
|
Other comprehensive income (loss)
|
(3,532
|
)
|
3,874
|
|
1,466
|
|
||||||
|
Comprehensive income
|
$
|
47,676
|
|
$
|
49,043
|
|
$
|
62,730
|
|
|||
The accompanying notes are an integral part of the consolidated financial statements.
33
AZZ INC.
CONSOLIDATED BALANCE SHEETS
(in thousands, except par value)
|
February 28, 2019
|
February 28, 2018
|
|||||||
|
Assets
|
||||||||
|
Current assets:
|
||||||||
|
Cash and cash equivalents
|
$
|
24,005
|
|
$
|
20,853
|
|
||
|
Accounts receivable, net of allowance for doubtful accounts of $2,267 and $569 at February 28, 2019 and 2018, respectively
|
144,887
|
|
141,488
|
|
||||
|
Inventories, net
|
124,847
|
|
110,761
|
|
||||
|
Contract assets
|
75,561
|
|
51,787
|
|
||||
|
Prepaid expenses and other
|
9,245
|
|
4,265
|
|
||||
|
Total current assets
|
378,545
|
|
329,154
|
|
||||
|
Property, plant, and equipment, net
|
210,227
|
|
216,855
|
|
||||
|
Operating lease right-of-use assets
|
45,870
|
|
—
|
|
||||
|
Goodwill
|
323,756
|
|
321,307
|
|
||||
|
Intangibles and other assets
|
130,172
|
|
160,893
|
|
||||
|
Total assets
|
$
|
1,088,570
|
|
$
|
1,028,209
|
|
||
|
Liabilities and Shareholders’ Equity
|
||||||||
|
Current liabilities:
|
||||||||
|
Accounts payable
|
$
|
53,047
|
|
$
|
54,162
|
|
||
|
Income tax payable
|
632
|
|
144
|
|
||||
|
Accrued salaries and wages
|
30,395
|
|
19,011
|
|
||||
|
Other accrued liabilities
|
17,631
|
|
19,622
|
|
||||
|
Customer deposits
|
481
|
|
1,816
|
|
||||
|
Contract liabilities
|
56,928
|
|
22,698
|
|
||||
|
Lease liability, short-term
|
5,657
|
|
—
|
|
||||
|
Debt due within one year
|
—
|
|
14,286
|
|
||||
|
Total current liabilities
|
164,771
|
|
131,739
|
|
||||
|
Other long-term liabilities
|
1,513
|
|
11,696
|
|
||||
|
Lease liability, long-term
|
41,190
|
|
—
|
|
||||
|
Debt due after one year, net
|
240,745
|
|
286,609
|
|
||||
|
Deferred income tax liabilities
|
36,623
|
|
32,962
|
|
||||
|
Total liabilities
|
484,842
|
|
463,006
|
|
||||
|
Commitments and contingencies (Note 14)
|
||||||||
|
Shareholders’ equity:
|
||||||||
|
Common Stock, $1.00 par value; 100,000 shares authorized; 26,115 and 25,959 shares issued and outstanding at February 28, 2019 and 2018, respectively
|
26,115
|
|
25,959
|
|
||||
|
Capital in excess of par value
|
46,141
|
|
38,446
|
|
||||
|
Retained earnings
|
560,224
|
|
526,018
|
|
||||
|
Accumulated other comprehensive loss
|
(28,752
|
)
|
(25,220
|
)
|
||||
|
Total shareholders’ equity
|
603,728
|
|
565,203
|
|
||||
|
Total liabilities and shareholders' equity
|
$
|
1,088,570
|
|
$
|
1,028,209
|
|
||
The accompanying notes are an integral part of the consolidated financial statements.
34
AZZ INC.
CONSOLIDATED STATEMENTS OF CASH FLOWS
(in thousands)
|
|
Year Ended
|
|||||||||||
|
|
February 28, 2019
|
February 28, 2018
|
February 28, 2017
|
|||||||||
|
Cash flows from operating activities:
|
||||||||||||
|
Net income
|
$
|
51,208
|
|
$
|
45,169
|
|
$
|
61,264
|
|
|||
|
Adjustments to reconcile net income to net cash provided by operating activities:
|
||||||||||||
|
Depreciation and amortization
|
50,245
|
|
50,526
|
|
50,357
|
|
||||||
|
Deferred income taxes
|
3,731
|
|
(20,637
|
)
|
1,714
|
|
||||||
|
Net loss on disposition of property, plant & equipment due to impairment
|
810
|
|
10,834
|
|
6,602
|
|
||||||
|
Net loss on sale of property, plant & equipment and insurance proceeds
|
9
|
|
765
|
|
76
|
|
||||||
|
Share-based compensation expense
|
4,659
|
|
6,121
|
|
5,870
|
|
||||||
|
Amortization of deferred debt issuance costs
|
541
|
|
595
|
|
1,262
|
|
||||||
|
Provision for doubtful accounts
|
2,153
|
|
3,007
|
|
48
|
|
||||||
|
Effects of changes in operating assets and liabilities, net of acquisitions:
|
||||||||||||
|
Accounts receivable
|
(8,131
|
)
|
3,492
|
|
(4,912
|
)
|
||||||
|
Inventories
|
(595
|
)
|
(9,927
|
)
|
(13,754
|
)
|
||||||
|
Prepaid expenses and other assets
|
(4,883
|
)
|
(2,376
|
)
|
(1,977
|
)
|
||||||
|
Net change in contract assets and liabilities
|
3,091
|
|
984
|
|
13,592
|
|
||||||
|
Accounts payable
|
(171
|
)
|
1,540
|
|
1,245
|
|
||||||
|
Other accrued liabilities and income taxes payable
|
12,001
|
|
(11,184
|
)
|
(10,211
|
)
|
||||||
|
Net cash provided by operating activities:
|
114,668
|
|
78,909
|
|
111,176
|
|
||||||
|
Cash flows from investing activities:
|
||||||||||||
|
Proceeds from the sale or insurance settlement of property, plant, and equipment
|
1,543
|
|
458
|
|
769
|
|
||||||
|
Acquisition of subsidiaries, net of cash acquired
|
(8,000
|
)
|
(44,785
|
)
|
(22,679
|
)
|
||||||
|
Purchases of property, plant and equipment
|
(25,616
|
)
|
(29,612
|
)
|
(41,434
|
)
|
||||||
|
Net cash used in investing activities:
|
(32,073
|
)
|
(73,939
|
)
|
(63,344
|
)
|
||||||
|
Cash flows from financing activities:
|
||||||||||||
|
Proceeds from revolving loan
|
264,000
|
|
349,000
|
|
179,500
|
|
||||||
|
Payments on revolving loan
|
(310,000
|
)
|
(256,500
|
)
|
(211,000
|
)
|
||||||
|
Payments on long-term debt
|
(14,286
|
)
|
(63,504
|
)
|
(23,192
|
)
|
||||||
|
Purchases of treasury shares
|
—
|
|
(7,518
|
)
|
(5,282
|
)
|
||||||
|
Payment of dividends
|
(17,718
|
)
|
(17,678
|
)
|
(16,645
|
)
|
||||||
|
Net cash provided by (used in) financing activities:
|
(78,004
|
)
|
3,800
|
|
(76,619
|
)
|
||||||
|
Effect of exchange rate changes on cash and cash equivalents
|
(1,439
|
)
|
781
|
|
(102
|
)
|
||||||
|
Net change in cash and cash equivalents
|
3,152
|
|
9,551
|
|
(28,889
|
)
|
||||||
|
Cash and cash equivalents, beginning of year
|
20,853
|
|
11,302
|
|
40,191
|
|
||||||
|
Cash and cash equivalents, end of year
|
$
|
24,005
|
|
$
|
20,853
|
|
$
|
11,302
|
|
|||
|
Supplemental disclosures of cash flow information:
|
||||||||||||
|
Cash paid for interest
|
$
|
14,880
|
|
$
|
13,593
|
|
$
|
13,780
|
|
|||
|
Cash paid for income taxes
|
$
|
3,291
|
|
$
|
8,701
|
|
$
|
19,857
|
|
|||
The accompanying notes are an integral part of the consolidated financial statements.
35
AZZ INC.
CONSOLIDATED STATEMENTS OF SHAREHOLDERS’ EQUITY
(in thousands)
|
|
Common Stock
|
Capital In
Excess Of Par
Value
|
Retained
Earnings
|
Accumulated
Other
Comprehensive
Income (Loss)
|
Total
|
||||||||||||||||||
|
|
Shares
|
Amount
|
|||||||||||||||||||||
|
Balance at February 29, 2016
|
25,874
|
|
$
|
25,874
|
|
$
|
35,148
|
|
$
|
453,908
|
|
$
|
(30,560
|
)
|
$
|
484,370
|
|
||||||
|
Share-based compensation
|
13
|
|
13
|
|
5,857
|
|
—
|
|
—
|
|
5,870
|
|
|||||||||||
|
Restricted stock units
|
25
|
|
25
|
|
(605
|
)
|
—
|
|
—
|
|
(580
|
)
|
|||||||||||
|
Stock issued for SARs
|
81
|
|
81
|
|
(322
|
)
|
—
|
|
—
|
|
(241
|
)
|
|||||||||||
|
Employee stock purchase plan
|
71
|
|
71
|
|
2,843
|
|
—
|
|
—
|
|
2,914
|
|
|||||||||||
|
Retirement of treasury shares
|
(100
|
)
|
(100
|
)
|
(5,182
|
)
|
—
|
|
—
|
|
(5,282
|
)
|
|||||||||||
|
Cash dividend paid
|
—
|
|
—
|
|
—
|
|
(16,645
|
)
|
—
|
|
(16,645
|
)
|
|||||||||||
|
Net income
|
—
|
|
—
|
|
—
|
|
61,264
|
|
—
|
|
61,264
|
|
|||||||||||
|
Foreign currency translation
|
—
|
|
—
|
|
—
|
|
—
|
|
1,520
|
|
1,520
|
|
|||||||||||
|
Interest rate swap
|
—
|
|
—
|
|
—
|
|
—
|
|
(54
|
)
|
(54
|
)
|
|||||||||||
|
Balance at February 28, 2017
|
25,964
|
|
$
|
25,964
|
|
$
|
37,739
|
|
$
|
498,527
|
|
$
|
(29,094
|
)
|
$
|
533,136
|
|
||||||
|
Share-based compensation
|
16
|
|
16
|
|
6,105
|
|
—
|
|
—
|
|
6,121
|
|
|||||||||||
|
Restricted stock units
|
43
|
|
43
|
|
(1,256
|
)
|
—
|
|
—
|
|
(1,213
|
)
|
|||||||||||
|
Stock issued for SARs
|
6
|
|
6
|
|
(11
|
)
|
—
|
|
—
|
|
(5
|
)
|
|||||||||||
|
Employee stock purchase plan
|
77
|
|
77
|
|
3,240
|
|
—
|
|
—
|
|
3,317
|
|
|||||||||||
|
Retirement of treasury shares
|
(147
|
)
|
(147
|
)
|
(7,371
|
)
|
—
|
|
—
|
|
(7,518
|
)
|
|||||||||||
|
Cash dividend paid
|
—
|
|
—
|
|
—
|
|
(17,678
|
)
|
—
|
|
(17,678
|
)
|
|||||||||||
|
Net income
|
—
|
|
—
|
|
—
|
|
45,169
|
|
—
|
|
45,169
|
|
|||||||||||
|
Foreign currency translation
|
—
|
|
—
|
|
—
|
|
—
|
|
3,928
|
|
3,928
|
|
|||||||||||
|
Interest rate swap
|
—
|
|
—
|
|
—
|
|
—
|
|
(54
|
)
|
(54
|
)
|
|||||||||||
|
Balance at February 28, 2018
|
25,959
|
|
$
|
25,959
|
|
$
|
38,446
|
|
$
|
526,018
|
|
$
|
(25,220
|
)
|
$
|
565,203
|
|
||||||
|
Impact of ASC 606 Adoption
|
—
|
|
—
|
|
—
|
|
716
|
|
—
|
|
716
|
|
|||||||||||
|
Share-based compensation
|
15
|
|
15
|
|
4,644
|
|
—
|
|
—
|
|
4,659
|
|
|||||||||||
|
Restricted stock units
|
31
|
|
31
|
|
(583
|
)
|
—
|
|
—
|
|
(552
|
)
|
|||||||||||
|
Stock issued for SARs
|
9
|
|
9
|
|
(30
|
)
|
—
|
|
—
|
|
(21
|
)
|
|||||||||||
|
Employee stock purchase plan
|
101
|
|
101
|
|
3,664
|
|
—
|
|
—
|
|
3,765
|
|
|||||||||||
|
Cash dividend paid
|
—
|
|
—
|
|
—
|
|
(17,718
|
)
|
—
|
|
(17,718
|
)
|
|||||||||||
|
Net income
|
—
|
|
—
|
|
—
|
|
51,208
|
|
—
|
|
51,208
|
|
|||||||||||
|
Foreign currency translation
|
—
|
|
—
|
|
—
|
|
—
|
|
(3,478
|
)
|
(3,478
|
)
|
|||||||||||
|
Interest rate swap
|
—
|
|
—
|
|
—
|
|
—
|
|
(54
|
)
|
(54
|
)
|
|||||||||||
|
Balance at February 28, 2019
|
26,115
|
|
$
|
26,115
|
|
$
|
46,141
|
|
$
|
560,224
|
|
$
|
(28,752
|
)
|
$
|
603,728
|
|
||||||
The accompanying notes are an integral part of the consolidated financial statements.
36
Note 1 – Summary of Significant Accounting Policies
Organization
AZZ Inc. (the “Company” “AZZ” or “We”) operates primarily in the United States of America and Canada and also has operations in China, Brazil, Poland and the Netherlands. Information about the Company's operations by segment is included in Note 12 to the consolidated financial statements.
Basis of consolidation
The consolidated financial statements were prepared in accordance with the accounting principles generally accepted in the United States of America and include the accounts of the Company and its wholly owned subsidiaries. All significant inter-company accounts and transactions have been eliminated in consolidation.
Use of estimates
The preparation of the financial statements in conformity with generally accepted accounting principles in the United States of America ("GAAP") requires management to make estimates and assumptions that affect the amounts of assets and liabilities and disclosure of contingent assets and liabilities at the date of the financial statements and the reported amounts of revenues and expenses during the reporting period. Actual results could differ from those estimates.
Concentrations of credit risk
Financial instruments that potentially subject the Company to significant concentrations of credit risk consist principally of cash and cash equivalents and trade accounts receivable.
The Company maintains cash and cash equivalents with various financial institutions. These financial institutions are located throughout the United States and Canada, as well as Europe, China and Brazil. The Company's policy is designed to limit exposure to any one institution. The Company performs periodic evaluations of the relative credit standing of those financial institutions that are considered in the Company's banking relationships and has not experienced any losses in such accounts. We believe we are not exposed to any significant credit risk related to cash and cash equivalents.
Concentrations of credit risk with respect to trade accounts receivable are limited due to the Company’s diversity by virtue of its
two
operating segments, the number of customers, and the absence of a concentration of trade accounts receivable in a small number of customers. The Company performs continuous evaluations of the collectibility of trade accounts receivable and allowance for doubtful accounts based upon historical losses, economic conditions and customer specific events. After all collection efforts are exhausted and an account is deemed uncollectible, it is written off against the allowance for doubtful accounts. Collateral is usually not required from customers as a condition of sale.
Revenue recognition
The Company determines revenue recognition through the following steps:
1)
Identification of the contract with a customer,
2)
Identification of the performance obligations in the contract,
3)
Determination of the transaction price,
4)
Allocation of the transaction price to performance obligations in the contract, and
5)
Recognition of revenue when, or as, the Company satisfies a performance obligation
Revenue is recognized when control of the promised goods or services is transferred to the Company’s customers, in an amount that reflects the consideration that it expects to be entitled to in exchange for those goods or services.
The amount and timing of revenue recognition varies by segment based on the nature of the goods or services provided and the terms and conditions of the customer contract.
37
Energy Segment
AZZ's Energy segment is a provider of specialized products and services designed to support industrial, nuclear and electrical applications. Within this segment, the contract is governed by a customer purchase order and an executed product or services agreement. The contract generally specifies the delivery of what constitutes a single performance obligation consisting of either custom built products, custom services, or off-the-shelf products. When the Company does enter into an arrangement with multiple performance obligations, the transaction price is allocated to each performance obligation based on the relative standalone selling prices of the goods or services being provided to the customer and revenue is recognized upon the satisfaction of each performance obligation. The Company combines contracts for revenue recognition purposes that are executed with the same customer within a short timeframe from each other and that purport to be for a single commercial objective.
For custom built products, the Company recognizes revenues over time provided that the goods do not have an alternative use to the Company and the Company has an unconditional right to payment for work completed to date plus a reasonable margin. For custom services, which consist of specialized welding and other professional services, the Company recognizes revenues over time as the services are rendered due to the fact that the services enhance a customer owned asset. For off-the-shelf products, which consist of tubing and lighting products, the Company recognizes revenue at a point-in-time upon the transfer of the goods to the customer.
For revenues recognized over time, the Company generally uses the cost-to-cost method of revenue recognition. Under this approach, the extent of progress towards completion is measured based on the ratio of costs incurred to date versus the total estimated costs upon completion of the project. This requires the Company to estimate the total contract revenues, project costs and margin, which can involve significant management judgment. As a significant change in one or more of these estimates could affect the profitability of the Company’s contracts, management reviews and updates its contract related estimates regularly. The Company recognizes adjustments in estimated margin on contracts under a cumulative catch-up basis and subsequent revenues are recognized using the adjusted estimate. If the estimate of contract margin indicates an anticipated loss on the contract, the Company recognizes the total estimated loss in the period it is identified.
Due to the custom nature of the goods and services provided, contracts within the Energy segment are often modified to account for changes in contract specifications and requirements. A contract modification exists when the modification either creates new, or changes the existing, enforceable rights and obligations in the contract. For the Company, most contract modifications are related to goods or services that are not distinct from those in the original contract due to the significant interrelationship or interdependencies between the deliverables. Such modifications are accounted for as if they were part of the original contract. As a result, the transaction price and the measure of progress for the performance obligation to which it relates, is recognized as an adjustment to revenue on a cumulative catch-up basis.
In addition to fixed consideration, the Company’s contracts within its Energy segment can include variable consideration, including claims, incentive fees, liquidated damages or other penalties. The Company recognizes revenue for variable consideration when it is probable that a significant reversal in the amount of cumulative revenue recognized will not occur. The Company estimates the amount of revenue to be recognized on variable consideration using the expected value or the most likely amount method, whichever is expected to better predict the amount.
Metal Coatings Segment
AZZ’s Metal Coatings segment is a provider of hot dip galvanizing, powder coating and other metal coating applications to the steel fabrication industry. Within this segment, the contract is governed by a customer purchase order or work order. The contract generally specifies the delivery of what constitutes a single performance obligation consisting of metal coating services. The Company combines contracts for revenue recognition purposes that are executed with the same customer within a short timeframe from each other and that purport to be for a single commercial objective.
The Company recognizes revenue over time as the metal coating is applied to the customer provided material as the process enhances a customer controlled asset. Contract modifications are rare within this segment and most contracts are on a fixed price basis with no variable consideration.
38
Contract Assets and Liabilities
The timing of revenue recognition, billings and cash collections results in accounts receivable, contract assets (unbilled receivables), and contract liabilities (customer advances and deposits) on the consolidated balance sheets, primarily related to the Company’s Energy segment. Amounts are billed as work progresses in accordance with agreed upon contractual terms, either at periodic intervals (e.g., weekly or monthly) or upon achievement of contractual milestones. Billing can occur subsequent to revenue recognition, resulting in contract assets. In addition, the Company can receive advances or deposits from its customers, before revenue is recognized, resulting in contract liabilities. These assets and liabilities are reported on the consolidated balance sheets on a contract-by-contract basis at the end of each reporting period.
For the year ended February 28, 2019, the Company recognized
$20.1 million
of revenues from amounts that were included in contract liabilities at February 28, 2018. The Company did not record any revenues in fiscal 2019 related to performance obligations satisfied in prior periods. The Company expects to recognize revenues of approximately
$52.8 million
,
$1.8 million
, and
$2.3 million
in fiscal 2020, 2021 and 2022, respectively, related to the
$56.9 million
balance of contract liabilities as of February 28, 2019.
The increases or decreases in accounts receivable, contract assets and contract liabilities during fiscal year 2019 were due primarily to normal timing differences between the Company’s performance and customer payments. The Lectrus acquisition described in Note 15 had no impact on contract assets or liabilities as of the date of acquisition.
Other
No general rights of return exist for customers and the Company establishes provisions for estimated warranties. The Company generally does not sell extended warranties. Revenue is recognized net of applicable sales and other taxes. The Company does not adjust the contract price for the effects of a significant financing component if the Company expects, at contract inception, that the period between when the Company transfers a good or service to a customer and when the customer pays for that good or service will be one year or less, which is generally the case. Sales commissions are deferred and recognized over the same period as the related revenues. Shipping and handling is treated as a fulfillment obligation instead of a separate performance obligation and such costs are expensed as incurred.
Disaggregated Revenue
Revenue by segment and geography is disclosed in Note 12. In addition, the following table presents disaggregated revenue by customer industry (in thousands):
|
|
Year Ended
|
|||||||||||
|
|
February 28, 2019
|
February 28, 2018
|
February 28, 2017
|
|||||||||
|
Net sales:
|
||||||||||||
|
Industrial - oil and gas, construction, and general
|
$
|
526,465
|
|
$
|
461,945
|
|
$
|
518,123
|
|
|||
|
Transmission and distribution
|
212,433
|
|
194,503
|
|
164,072
|
|
||||||
|
Power generation
|
188,189
|
|
153,982
|
|
181,343
|
|
||||||
|
Total net sales
|
$
|
927,087
|
|
$
|
810,430
|
|
$
|
863,538
|
|
|||
Cash and cash equivalents
The Company considers cash and cash equivalents to include cash on hand, deposits with banks and all highly liquid investments with an original maturity of three months or less.
Inventories
Inventory is stated at the lower of cost or net realizable value. Cost is determined principally using a weighted-average method for the Energy Segment and the first-in-first-out (FIFO) method for the Metal Coatings Segment. The Company evaluates its ending inventories for excess quantities and obsolescence based on forecasted demand within specific time horizons, technological obsolescence, and an assessment of any inventory that is not in sellable condition.
39
Property, plant and equipment
Property and equipment are stated at cost less accumulated depreciation. Depreciation is computed using the straight-line method over the estimated useful lives of the related assets as follows:
|
Buildings and structures
|
10-25 years
|
|
Machinery and equipment
|
3-15 years
|
|
Furniture and fixtures
|
3-15 years
|
|
Automotive equipment
|
3 years
|
|
Computers and software
|
3 years
|
Repairs and maintenance are charged to expense as incurred; renewals and betterments that significantly extend the useful life of the asset are capitalized.
Amortizable Intangible and Long-lived assets
Purchased intangible assets on the consolidated balance sheets are comprised of customer lists, backlogs, engineering drawings and non-compete agreements. Such intangible assets (excluding indefinite-lived intangible assets) are being amortized on a straight-line basis over the estimated useful lives of the assets ranging from
two
to
nineteen
years. The Company records impairment losses on long-lived assets, including identifiable intangible assets, when events and circumstances indicate that the assets might be impaired and the undiscounted projected cash flows associated with those assets are less than their carrying amount. In those situations, impairment loss on a long-lived asset is measured based on the excess of the carrying amount of the asset over the asset’s fair value, which is determined using Level 3 fair value inputs. For fiscal year
2019
,
2018
and
2017
, the Company recorded impairment losses of
$0.8 million
,
$10.8 million
and
$6.6 million
respectively, related to the disposition of certain property, plant and equipment. Such losses were recorded within costs of sales and selling, general and administrative in the consolidated statements of income.
Goodwill and Other Indefinite-Lived Intangible Assets
Goodwill represents the excess of the purchase price over the fair value of the net tangible and identifiable intangible assets acquired in a business combination. Goodwill is not subject to amortization but is subject to an annual impairment test during the fourth quarter of each fiscal year, or earlier if indicators of potential impairment exist. The test is calculated using an income approach and market approach, which are Level 3 fair value inputs. Based on the results of its analysis, the Company determines whether an impairment may exist. A significant change in projected cash flows or cost of capital for future years could result in an impairment of goodwill in future years. Variables impacting future cash flows include, but are not limited to, the level of customer demand for and response to products and services we offer to the power generation market, the electrical transmission and distribution markets, the general industrial market and the hot dip galvanizing market; changes in economic conditions of these various markets; raw material and natural gas costs and availability of experienced labor and management to implement our growth strategies. For fiscal years 2019, 2018 and 2017 no goodwill impairment loss was recorded.
Other indefinite-lived intangible assets consist of certain tradenames acquired as part of the Powergrid Solutions and Enhanced Powder Coating acquisitions during fiscal year 2018. The Company tests the carrying value of these tradenames during the fourth quarter of each fiscal year, or more frequently when an event occurs or circumstances change that indicates the carrying value may not be recoverable by comparing the asset's fair value to its carrying value. Fair value, using Level 3 inputs, is measured using a relief-from-royalty approach, which assumes the fair value of the tradename is the discounted cash flows of the amount that would be paid had the Company not owned the tradename and instead licensed the tradename from another company. For fiscal 2019 and 2018, no impairment losses related to these indefinite-lived intangible assets were recorded.
Debt issuance costs
Debt issue costs related to the revolver are deferred within other assets and are amortized using the effective interest rate method over the term of the debt. Debt issue costs related to debt other than the revolver are deferred within total debt due after one year and are amortized using the effective interest rate method over the term of the debt.
40
Income taxes
The Company accounts for income taxes under the asset and liability method, which requires the recognition of deferred tax assets and liabilities for the expected future tax consequences of events that have been included in the financial statements. Under this method, deferred tax assets and liabilities are determined on the basis of the differences between the financial statement and tax bases of assets and liabilities using enacted tax rates in effect for the year in which the differences are expected to reverse. The effect of a change in tax rates on deferred tax assets and liabilities is recognized in income in the period that includes the enactment date.
The Company recognizes a valuation allowance against net deferred tax assets to the extent that the Company believes these net assets are not more likely than not to be realized. In making such a determination, the Company considers all available positive and negative evidence, including future reversals of existing taxable temporary differences, projected future taxable income, tax-planning strategies, and results of recent operations. If the Company determines that it would be able to realize its deferred tax assets in the future in excess of their net recorded amount, the Company would make an adjustment to the deferred tax asset valuation allowance, which would reduce the provision for income taxes.
As applicable, the Company records uncertain tax positions on the basis of a two-step process whereby (1) the Company determines whether it is more likely than not that the tax positions will be sustained on the basis of the technical merits of the position and (2) for those tax positions that meet the more-likely-than-not recognition threshold, the Company recognizes the largest amount of tax benefit that is more than 50 percent likely to be realized upon ultimate settlement with the related tax authority. The Company currently does not have any unrecognized tax benefits to record related to U.S. federal, state or, foreign tax exposure.
The Company is subject to taxation in the U.S. and various state, provincial and local and foreign jurisdictions. With few exceptions, as of
February 28, 2019
, the Company is no longer subject to U.S. federal or state examinations by tax authorities for years before fiscal 2016.
Financial instruments
Fair value is an exit price that would be received to sell an asset or paid to transfer a liability in an orderly transaction between market participants. Hierarchy Levels 1, 2, or 3 are terms for the priority of inputs to valuation techniques used to measure fair value. Hierarchy Level 1 inputs are quoted prices in active markets for identical assets or liabilities. Hierarchy Level 2 inputs are inputs other than quoted prices included with Level 1 that are directly or indirectly observable for the asset or liability. Hierarchy Level 3 inputs are inputs that are not observable in the market.
The carrying amount of the Company's financial instruments (cash equivalents, accounts receivable, accounts payable, accrued liabilities and debt), excluding the Senior Notes, approximates the fair value of these instruments based upon either their short-term nature or their variable market rate of interest. As of February 28,
2019
and
2018
the fair value of the outstanding Senior Notes, as described in Note 11, was approximately
$127.4 million
and
$133.7 million
, respectively. These fair values were determined using the discounted cash flow at the market rate as well as the applicable market interest rates classified as Level 2 inputs.
Derivative financial instruments
From time to time, the Company uses derivatives to manage interest rate risk. The Company’s policy is to use derivatives for risk management purposes only, which includes maintaining the ratio between the Company’s fixed and floating rate debt obligations that management deems appropriate, and prohibits entering into such contracts for trading purposes. The Company enters into derivatives only with counterparties (primarily financial institutions) which have substantial financial wherewithal to minimize credit risk. The amount of gains or losses from the use of derivative financial instruments has not been and is not expected to be material to the Company’s consolidated financial statements. As of
February 28, 2019
, the Company had no derivative financial instruments.
41
Warranty reserves
Within other accrued liabilities, a reserve has been established to provide for the estimated future cost of warranties on a portion of the Company’s delivered products. Management periodically reviews the reserves, and adjustments are made accordingly. A provision for warranty on products is made on the basis of the Company’s historical experience and identified warranty issues. Warranties cover such factors as non-conformance to specifications and defects in material and workmanship.
The following is a roll-forward of amounts accrued for warranties (in thousands):
|
Balance at February 29, 2016
|
$
|
2,915
|
|
|
Warranty costs incurred
|
(1,947
|
)
|
|
|
Additions charged to income
|
1,130
|
|
|
|
Balance at February 28, 2017
|
$
|
2,098
|
|
|
Warranty costs incurred
|
(2,225
|
)
|
|
|
Additions charged to income
|
2,140
|
|
|
|
Balance at February 28, 2018
|
$
|
2,013
|
|
|
Warranty costs incurred
|
(2,195
|
)
|
|
|
Additions charged to income
|
1,933
|
|
|
|
Balance at February 28, 2019
|
$
|
1,751
|
|
Foreign Currency Translation
The local currency is the functional currency for the Company’s foreign operations. Related assets and liabilities are translated into United States dollars at exchange rates existing at the balance sheet date, and revenues and expenses are translated at weighted-average exchange rates. The foreign currency translation adjustment is recorded as a separate component of shareholders’ equity and is included in accumulated other comprehensive income (loss).
Accruals for Contingent Liabilities
The Company is subject to the possibility of various loss contingencies arising in the normal course of business. The amounts the Company may record for estimated claims, such as self-insurance programs, warranty, environmental and other contingent liabilities, requires the Company to make judgments regarding the amount of expenses that will ultimately be incurred. The Company uses past history and experience and other specific circumstances surrounding these claims in evaluating the amount of liability that should be recorded. Due to the inherent limitations in estimating future events, actual amounts paid or transferred may differ from those estimates.
Leases
The Company is a lessee under various operating leases for facilities and equipment. For such leases, the Company recognizes a right-of-use ("ROU") asset and lease liability on the consolidated balance sheet as of the lease commencement date based on the present value of the future minimum lease payments. An ROU asset represents the Company's right to use an underlying asset during the lease term and a lease liability represents the Company's obligation to make lease payments. However, for short-term leases with an initial term of twelve months or less that do not contain an option to purchase that is likely to be exercised, the Company does not record ROU assets or lease liabilities on the consolidated balance sheet.
The Company's uses its incremental borrowing rate to determine the present value of future payments unless the implicit rate in the lease is readily determinable. In determining the future minimum lease payments, the Company incorporates options to extend or terminate the lease when it is reasonably certain that such options will be exercised. The ROU asset includes any initial direct costs incurred and is recorded net of any lease incentives received.
Lease expense for minimum lease payments is recognized on a straight-line basis over the lease term as the ROU asset is amortized and the lease liability is accreted. For facilities leases, the Company accounts for lease and non-lease components on a combined basis, while for equipment leases, the lease and non-lease components are accounted for separately.
Some of the Company's lease agreements may include rental payments that adjust periodically for inflation or are based on an index rate which are included as variable lease payments. The Company's lease agreements do not contain any material residual value guarantees or material restrictive covenants.
42
Accounting Standards Recently Adopted
During the fourth quarter of fiscal 2019, effective March 1, 2018, the Company adopted ASU 2016-02,
Leases (Topic 842)
using a modified retrospective approach as of the period of adoption. Periods prior to the adoption continue to be presented under legacy guidance and there was no cumulative effect adjustment to beginning retained earnings on the March 1, 2018 adoption date. On the date of adoption, the Company recorded operating lease right of use assets of
$42.1 million
and lease liabilities of
$42.8 million
to reflect the Company's portfolio of operating leases, which were previously unrecorded under legacy accounting guidance. However, the adoption did not have any impact on the Company's consolidated statements of income or cash flows. The Company has elected the package of practical expedients permitted under the transition guidance within the new standard, which among several other items, allows the Company to carry-forward the historical lease classification from legacy guidance for leases that existed on the date of adoption.
On March 1, 2018, the Company adopted Accounting Standards Update ("ASU") No. 2014-09,
Revenue from Contracts with Customers (Topic 606)
and the related amendments ("ASC 606") using the modified retrospective method applied to those contracts which were not completed as of February 28, 2018. Results for operating periods beginning on or after March 1, 2018 are presented under ASC 606, while prior period amounts have not been adjusted and continue to be reported in accordance with the accounting standards in effect for those periods.
The cumulative effect of initially applying ASC 606 was recorded as an adjustment to the opening balance of retained earnings, which impacted the consolidated balance sheet as follows:
|
Balance Sheet
|
February 28,
2018
|
ASC 606
Adjustments
|
March 1,
2018
|
|||||||||
|
Assets
|
||||||||||||
|
Inventories
|
$
|
110,761
|
|
$
|
7,664
|
|
$
|
118,425
|
|
|||
|
Liabilities and shareholders' equity
|
|
|||||||||||
|
Contract liabilities
|
22,698
|
|
6,948
|
|
29,646
|
|
||||||
|
Retained Earnings
|
526,018
|
|
716
|
|
526,734
|
|
||||||
During the preparation of the consolidated financial statements for the year ended February 28, 2019, the Company identified an error related to the adoption of ASC 606. This impact was recorded as an out-of-period adjustment during the fourth quarter of fiscal year 2019, which increased net sales by $3.5 million, cost of good sold by $2.4 million and net income by $1.0 million. The disclosures above show the impact of this adjustment as of the adoption date on March 1, 2018. Management considered the impact on the previously issued financial statements and concluded that the adjustments were not material.
The adoption of ASC 606 had the following impact on the consolidated balance sheets and consolidated statements of income as of and for the fiscal year ended February 28, 2019:
|
Balance Sheet
|
As Reported
|
Balance
Excluding
ASC 606 Effects
|
Change
|
|||||||||
|
Assets
|
||||||||||||
|
Inventories
|
$
|
124,847
|
|
$
|
119,627
|
|
$
|
5,220
|
|
|||
|
Liabilities and shareholders' equity
|
|
|||||||||||
|
Contract liabilities
|
56,928
|
|
53,444
|
|
3,484
|
|
||||||
|
Consolidated Statements of Income
|
As Reported
|
Balance
Excluding
ASC 606 Effects
|
Change
|
|||||||||
|
Net sales
|
$
|
927,087
|
|
$
|
923,623
|
|
$
|
3,464
|
|
|||
|
Cost of goods sold
|
728,466
|
|
726,022
|
|
2,444
|
|
||||||
|
Gross profit
|
198,621
|
|
197,601
|
|
1,020
|
|
||||||
|
Operating income
|
76,956
|
|
75,936
|
|
1,020
|
|
||||||
43
Recently Issued Accounting Pronouncements
There are no recently issued accounting pronouncements outstanding that are likely to have a material impact on the Company's consolidated financial statements.
Note 2 – Inventories
Inventories, net consisted of the following (in thousands):
|
February 28, 2019
|
February 28, 2018
|
|||||||
|
Raw materials
|
$
|
94,410
|
|
$
|
98,475
|
|
||
|
Work-in-process
|
19,067
|
|
2,544
|
|
||||
|
Finished goods
|
11,370
|
|
9,742
|
|
||||
|
$
|
124,847
|
|
$
|
110,761
|
|
|||
Note 3 – Property, Plant and Equipment
Property, plant and equipment consisted of the following (in thousands):
|
February 28, 2019
|
February 28, 2018
|
|||||||
|
Land
|
$
|
21,677
|
|
$
|
22,445
|
|
||
|
Building and structures
|
156,447
|
|
152,191
|
|
||||
|
Machinery and equipment
|
245,588
|
|
234,071
|
|
||||
|
Furniture, fixtures, software and computers
|
27,075
|
|
25,316
|
|
||||
|
Automotive equipment
|
3,766
|
|
3,432
|
|
||||
|
Construction in progress
|
13,065
|
|
13,977
|
|
||||
|
467,618
|
|
451,432
|
|
|||||
|
Less accumulated depreciation
|
(257,391
|
)
|
(234,577
|
)
|
||||
|
Net property, plant, and equipment
|
$
|
210,227
|
|
$
|
216,855
|
|
||
Depreciation expense was
$33.2 million
,
$33.4 million
, and
$33.4 million
for fiscal
2019
,
2018
, and
2017
, respectively.
Note 4 – Other Accrued Liabilities
Other accrued liabilities consisted of the following (in thousands):
|
February 28, 2019
|
February 28, 2018
|
|||||||
|
Accrued interest
|
$
|
1,196
|
|
$
|
1,649
|
|
||
|
Accrued warranty
|
1,751
|
|
2,013
|
|
||||
|
Commissions
|
3,370
|
|
2,801
|
|
||||
|
Personnel expenses
|
6,282
|
|
6,493
|
|
||||
|
Group medical insurance
|
2,024
|
|
1,905
|
|
||||
|
Other
|
3,008
|
|
4,761
|
|
||||
|
Total
|
$
|
17,631
|
|
$
|
19,622
|
|
||
44
Note 5 – Restructuring and Other Related Costs
During fiscal year 2019, as part of the Company's ongoing efforts to eliminate redundancies in its Metal Coatings segment, the Company consolidated two galvanizing facilities located in the Gulf Coast region of the United States. As a result of the consolidation, the Company recognized restructuring and other related costs of
$1.3 million
in fiscal 2019, comprised of
$0.8 million
for fixed asset impairments and
$0.5 million
for employee severance and other disposal costs. All costs were recognized within cost of sales in the consolidated statement of income.
During fiscal year 2017, the Company undertook a review of its operations to optimize the financial performance of its operating assets. As a result, the Company recognized
$7.9 million
of restructuring and other related charges in fiscal 2017. Fixed asset impairment and other charges of
$6.6 million
were recorded to cost of sales in the consolidated statement of income related to the disposition of certain fixed assets within the Metal Coatings segment as part of the closing and conversion of various plants. The Company also recorded restructuring charges of
$1.3 million
within selling, general and administrative expense for costs related to employee severance associated with changes to improve management efficiency in the Energy and Metal Coatings segments.
The following table provides a summary of the restructuring activities and related liabilities recorded within accrued liabilities (in thousands):
|
Balance at February 29, 2016
|
$
|
61
|
|
|
Restructuring and other related costs
|
7,862
|
|
|
|
Non-cash adjustments
|
(6,602
|
)
|
|
|
Cash payments
|
(1,014
|
)
|
|
|
Balance at February 28, 2017
|
$
|
307
|
|
|
Restructuring and other related costs
|
—
|
|
|
|
Cash payments
|
(307
|
)
|
|
|
Balance at February 28, 2018
|
$
|
—
|
|
|
Restructuring and other related costs
|
1,301
|
|
|
|
Non-cash adjustments
|
(810
|
)
|
|
|
Cash payments
|
(491
|
)
|
|
|
Balance at February 28, 2019
|
$
|
—
|
|
45
Note 6 – Employee Benefit Plans
401(k) Retirement Plan
The Company has a 401(k) retirement plan covering substantially all of its employees. Company contributions to the 401(k) retirement plan were
$5.0
million,
$4.8
million, and
$4.5
million for fiscal
2019
,
2018
, and
2017
, respectively.
Multiemployer Pension Plans
In addition to the Company's 401(k) retirement plan, the Company participates in a number of multiemployer defined benefit pension plans for employees who are covered by collective bargaining agreements. The Company is not aware of any significant future obligations or funding requirements related to these plans other than the ongoing contributions that are paid as hours are worked by plan participants.
However, the risks of participating in multiemployer pension plans are different from those in single-employer plans in that (i) assets contributed to the plan by one employer may be used to provide benefits to employees or former employees of other participating employers; (ii) if a participating employer stops contributing to the plan, the unfunded obligations of the plan may be required to be assumed by the remaining participating employers and (iii) if the Company chooses to stop participating in a multiemployer pension plan, it may be required to pay the plan a withdrawal amount based on the underfunded status of the plan.
The following table outlines the Company's participation in multiemployer pension plans considered to be individually significant (dollar amounts in thousands):
|
EIN/Pension Plan Number
|
Pension Protection Act Reported Status (1)
|
FIP/RP
Status (3)
|
Company Contributions (4)
|
Surcharge Imposed (5)
|
Expiration Date of Collective Bargaining Agreements
|
|||||||||||||||||||
|
Year Ended
|
||||||||||||||||||||||||
|
Pension Fund
|
2019 (2)
|
2018
|
February 28,
2019
|
February 28,
2018
|
February 28,
2017
|
|||||||||||||||||||
|
Boilermaker-Blacksmith National Pension Trust
|
EIN:48-6168020
Plan: 001 |
Endangered
|
Endangered
|
Implemented
|
$
|
5,651
|
|
$
|
4,070
|
|
$
|
7,359
|
|
No
|
Various through 12/31/2019
|
|||||||||
|
Contributions to other multiemployer pension plans
|
627
|
|
470
|
|
736
|
|
||||||||||||||||||
|
Total contributions
|
$
|
6,278
|
|
$
|
4,540
|
|
$
|
8,095
|
|
|||||||||||||||
|
(1)
|
The most recent Pension Protection Act zone status available for fiscal 2019 and 2018 is for the plan’s year-end as of December 31, 2017 and 2016, respectively. The zone status is based on information that the Company received from the plan and is certified by the plan’s actuary. A plan is generally classified in critical status if a funding deficiency is projected within four years or five years, depending on other criteria. A plan in critical status is classified in critical and declining status if it is projected to become insolvent in the next 15 or 20 years, depending on other criteria. A plan is classified in endangered status if its funded percentage is less than 80% or a funding deficiency is projected within seven years. If the plan satisfies both of these triggers, it is classified in seriously endangered status. A plan not classified in any other status is classified in the green zone. As of the date the financial statements were issued, Form 5500, which is filed by employee benefit plans to satisfy annual reporting requirements under the Employee Retirement Income Security Act and under the Internal Revenue Code, was not available for the plan year ended in 2018.
|
|
(2)
|
In April 2019, the Boilermaker-Blacksmith National Pension Trust disclosed that the plan will be classified in critical status commencing for the plan year beginning January 1, 2019 because there is a projected funding deficiency in the plan year ending December 31, 2028.
|
|
(3)
|
The “FIP/RP Status” column indicates plans for which a Funding Improvement Plan (“FIP”) or a Rehabilitation Plan (“RP”) has been implemented.
|
|
(4)
|
For the multiemployer pension plan considered to be individually significant, the Company was not listed in the Form 5500 as providing more than 5% of the total contributions for plan years ending December 31, 2017 and 2016.
|
|
(5)
|
A multiemployer pension plan that has been certified as endangered, seriously endangered or critical may begin to levy a statutory surcharge on contribution rates. Once authorized, the surcharge is at the rate of 5% for the first 12 months and 10% for any periods thereafter. Contributing employers, however, may eliminate the surcharge by entering into a collective bargaining agreement that meets the requirements of the applicable FIP or RP.
|
46
Note 7 – Income Taxes
The provision for income taxes consists of (in thousands):
|
Year Ended
|
||||||||||||
|
February 28, 2019
|
February 28, 2018
|
February 28, 2017
|
||||||||||
|
Income before income taxes:
|
||||||||||||
|
Domestic
|
$
|
48,261
|
|
$
|
24,282
|
|
$
|
74,972
|
|
|||
|
Foreign
|
14,744
|
|
6,617
|
|
10,325
|
|
||||||
|
Income before income taxes
|
$
|
63,005
|
|
$
|
30,899
|
|
$
|
85,297
|
|
|||
|
Current provision (benefit):
|
||||||||||||
|
Federal
|
$
|
4,251
|
|
$
|
3,445
|
|
$
|
18,688
|
|
|||
|
Foreign
|
2,829
|
|
1,958
|
|
2,751
|
|
||||||
|
State and local
|
986
|
|
964
|
|
1,290
|
|
||||||
|
Total current provision for income taxes
|
$
|
8,066
|
|
$
|
6,367
|
|
$
|
22,729
|
|
|||
|
Deferred provision (benefit):
|
||||||||||||
|
Federal
|
$
|
2,970
|
|
$
|
(20,220
|
)
|
$
|
2,486
|
|
|||
|
Foreign
|
539
|
|
100
|
|
(189
|
)
|
||||||
|
State and local
|
222
|
|
(517
|
)
|
(993
|
)
|
||||||
|
Total deferred provision for (benefit from) income taxes
|
$
|
3,731
|
|
$
|
(20,637
|
)
|
$
|
1,304
|
|
|||
|
Total provision for (benefit from) income taxes
|
$
|
11,797
|
|
$
|
(14,270
|
)
|
$
|
24,033
|
|
|||
In general, it is the Company's practice and intention to reinvest the earnings of its non-U.S. subsidiaries in those operations. Generally, such amounts become subject to foreign withholding tax upon the remittance of dividends and under certain other circumstances.
The expense recognized in fiscal year 2018 related to the one-time tax on the mandatory deemed repatriation of foreign earnings was $1.4 million of which the Company has elected to pay the one-time tax evenly over a period of eight years with seven years remaining. We continue to reinvest cash in foreign jurisdictions and have not recorded the effects of any applicable foreign withholding tax.
The U.S. Tax Cuts and Jobs Act of 2017 (the “U.S. Tax Act”) requires complex computations to be performed that were not previously required by U.S. tax law, significant judgments to be made in interpretation of the provisions of the U.S. Tax Act, significant estimates in calculations, and the preparation and analysis of information not previously relevant. The U.S. Treasury Department, the IRS, and other standard-setting bodies will continue to interpret or issue guidance on how provisions of the U.S. Tax Act will be applied or otherwise administered. As future guidance is issued, we may make adjustments to amounts that we have previously recorded that may materially impact our financial statements in the period in which the adjustments are made.
During the fourth quarter of fiscal 2019, the Company completed its assessment of the Tax Act under SAB 118, resulting in additional benefit of $1.1 million resulting from revised estimates of the mandatory deemed repatriation of foreign earnings, foreign tax credits, and bonus depreciation elections based on the finalization of our 2017 US federal income tax return. The change in bonus depreciation elections and other temporary return to provisions items resulted in $0.8 million benefit related to the finalization of the remeasurement of deferred tax assets and liabilities. The finalization of foreign earnings and profits and foreign tax credits resulted in a $0.3 million benefit.
47
A reconciliation from the federal statutory income tax rate to the effective income tax rate is as follows:
|
Year Ended
|
|||||||||
|
February 28, 2019
|
February 28, 2018
|
February 28, 2017
|
|||||||
|
Statutory federal income tax rate
|
21.0
|
%
|
32.7
|
%
|
35.0
|
%
|
|||
|
Permanent differences
|
0.5
|
|
1.6
|
|
0.7
|
|
|||
|
State income taxes, net of federal income tax benefit
|
0.4
|
|
0.4
|
|
0.4
|
|
|||
|
Benefit of Section 199 of the Code, manufacturing deduction
|
—
|
|
(2.2
|
)
|
(2.3
|
)
|
|||
|
Valuation allowance
|
(0.7
|
)
|
—
|
|
—
|
|
|||
|
Stock compensation
|
0.5
|
|
(0.5
|
)
|
(1.8
|
)
|
|||
|
Tax credits
|
(4.1
|
)
|
(7.7
|
)
|
(3.1
|
)
|
|||
|
Foreign tax rate differential
|
1.1
|
|
(0.4
|
)
|
(0.8
|
)
|
|||
|
Deferred tax remeasurements
|
—
|
|
(78.9
|
)
|
—
|
|
|||
|
Transition tax
|
—
|
|
8.6
|
|
—
|
|
|||
|
Other
|
—
|
|
0.2
|
|
0.1
|
|
|||
|
Effective income tax rate
|
18.7
|
%
|
(46.2
|
)%
|
28.2
|
%
|
|||
Deferred federal and state income taxes reflect the net tax effects of temporary differences between the carrying amounts of assets and liabilities for financial accounting purposes and the amounts used for income tax purposes. Significant components of the Company’s net deferred income tax liability are as follows (in thousands):
|
February 28, 2019
|
February 28, 2018
|
|||||||
|
Deferred income tax assets:
|
||||||||
|
Employee related items
|
$
|
4,177
|
|
$
|
4,532
|
|
||
|
Inventories
|
758
|
|
816
|
|
||||
|
Accrued warranty
|
369
|
|
432
|
|
||||
|
Accounts receivable
|
(2,092
|
)
|
299
|
|
||||
|
Net operating loss carry forward
|
7,173
|
|
5,067
|
|
||||
|
10,385
|
|
11,146
|
|
|||||
|
Less: valuation allowance
|
(3,015
|
)
|
(1,558
|
)
|
||||
|
Total deferred income tax assets
|
7,370
|
|
9,588
|
|
||||
|
Deferred income tax liabilities:
|
||||||||
|
Depreciation methods and property basis differences
|
(19,066
|
)
|
(17,955
|
)
|
||||
|
Other assets and tax-deductible goodwill
|
(24,927
|
)
|
(24,537
|
)
|
||||
|
Total deferred income tax liabilities
|
(43,993
|
)
|
(42,492
|
)
|
||||
|
Net deferred income tax liabilities
|
$
|
(36,623
|
)
|
$
|
(32,904
|
)
|
||
48
The following table summarizes the Net operating loss (NOL) carryforward (in thousands):
|
February 28, 2019
|
February 28, 2018
|
|||||||
|
Federal
|
$
|
—
|
|
$
|
—
|
|
||
|
State
|
$
|
6,352
|
|
$
|
5,067
|
|
||
|
Foreign
|
$
|
821
|
|
$
|
—
|
|
||
As of
February 28, 2019
, the Company had pretax state NOL carry-forwards of
$97.7 million
which, if unused, will begin to expire in 2025.
As of fiscal year end
2019
and
2018
, a portion of the Company's deferred tax assets were the result of state and foreign jurisdiction NOL carry-forwards. The Company believes that it is more likely than not that the benefit from certain state NOL carry forwards will not be realized. In recognition of this risk, the Company has provided a valuation allowance of
$3.0 million
and
$1.6 million
as of fiscal year end
2019
and
2018
, respectively.
Note 8 – Goodwill and Intangible Assets
Goodwill and indefinite-lived intangible assets are not amortized but are subject to annual impairment tests. Other intangible assets are amortized over their estimated useful lives.
Changes in goodwill by segment for fiscal year
2019
and
2018
are as follows (in thousands):
|
Segment
|
February 28, 2018
|
Acquisitions
|
Foreign
Exchange Translation |
February 28, 2019
|
||||||||||||
|
Metal Coatings
|
$
|
117,232
|
|
$
|
73
|
|
$
|
(614
|
)
|
$
|
116,691
|
|
||||
|
Energy
|
204,075
|
|
2,990
|
|
—
|
|
207,065
|
|
||||||||
|
Total
|
$
|
321,307
|
|
$
|
3,063
|
|
$
|
(614
|
)
|
$
|
323,756
|
|
||||
|
Segment
|
February 28, 2017
|
Acquisitions
|
Foreign
Exchange Translation |
February 28, 2018
|
||||||||||||
|
Metal Coatings
|
$
|
109,980
|
|
$
|
6,590
|
|
$
|
662
|
|
$
|
117,232
|
|
||||
|
Energy
|
196,599
|
|
7,476
|
|
—
|
|
204,075
|
|
||||||||
|
Total
|
$
|
306,579
|
|
$
|
14,066
|
|
$
|
662
|
|
$
|
321,307
|
|
||||
The Company completes its annual impairment analysis of goodwill on December 31st of each year. As a result, the Company determined that there was no impairment of goodwill.
Amortizable intangible assets consisted of the following (in thousands):
|
February 28, 2019
|
February 28, 2018
|
|||||||
|
Customer related intangibles
|
$
|
191,460
|
|
$
|
194,712
|
|
||
|
Non-compete agreements
|
8,546
|
|
7,952
|
|
||||
|
Trademarks
|
4,569
|
|
4,569
|
|
||||
|
Technology
|
7,400
|
|
7,400
|
|
||||
|
Engineering drawings
|
24,600
|
|
24,600
|
|
||||
|
Backlog
|
7,600
|
|
7,600
|
|
||||
|
Gross intangible assets
|
244,175
|
|
246,833
|
|
||||
|
Less accumulated amortization
|
(122,199
|
)
|
(105,642
|
)
|
||||
|
Total, net
|
$
|
121,976
|
|
$
|
141,191
|
|
||
49
The Company recorded amortization expense of
$17.0
million,
$17.1
million and
$16.9
million for fiscal
2019
,
2018
and
2017
, respectively, related to the amortizable intangible assets listed above. In addition to its amortizable intangible assets, the Company has recorded indefinite-lived intangible assets of
$3.4 million
and
$2.7 million
on the consolidated balance sheets at February 28, 2019 and 2018, respectively, related to certain tradenames acquired as part of business acquisitions in fiscal 2018 and fiscal 2019. These indefinite-lived intangible assets are not amortized, but are assessed for impairment annually or whenever an impairment may be indicated. During fiscal 2019, the Company performed an annual review of its indefinite-lived intangibles and no impairment was indicated.
The estimated amortization expense for the five succeeding fiscal years and thereafter is as follows (in thousands):
|
Fiscal year:
|
Amortization Expense
|
|||
|
2020
|
$
|
16,393
|
|
|
|
2021
|
16,227
|
|
||
|
2022
|
14,142
|
|
||
|
2023
|
13,058
|
|
||
|
2024
|
11,121
|
|
||
|
Thereafter
|
51,035
|
|
||
|
Total
|
$
|
121,976
|
|
|
Note 9 – Earnings Per Share
Basic earnings per share is based on the weighted average number of shares outstanding during each year. Diluted earnings per share were similarly computed but have been adjusted for the dilutive effect of the weighted average number of restricted stock units, performance share units and stock appreciation rights outstanding.
The following table sets forth the computation of basic and diluted earnings per share (in thousands, except per share data):
|
Year Ended
|
||||||||||||
|
February 28, 2019
|
February 28, 2018
|
February 28, 2017
|
||||||||||
|
Numerator:
|
||||||||||||
|
Net income for basic and diluted earnings per common share
|
$
|
51,208
|
|
$
|
45,169
|
|
$
|
61,264
|
|
|||
|
Denominator:
|
||||||||||||
|
Denominator for basic earnings per common share–weighted average shares
|
26,038
|
|
25,970
|
|
25,965
|
|
||||||
|
Effect of dilutive securities:
|
||||||||||||
|
Employee and director stock awards
|
69
|
|
66
|
|
132
|
|
||||||
|
Denominator for diluted earnings per common share
|
26,107
|
|
26,036
|
|
26,097
|
|
||||||
|
Earnings per share basic and diluted:
|
||||||||||||
|
Basic earnings per common share
|
$
|
1.97
|
|
$
|
1.74
|
|
$
|
2.36
|
|
|||
|
Diluted earnings per common share
|
$
|
1.96
|
|
$
|
1.73
|
|
$
|
2.35
|
|
|||
For fiscal
2019
, approximately
0.1 million
stock appreciation rights were excluded from the computation of diluted earnings per share as their effect would have been anti-dilutive. For fiscal
2018
and
2017
, the Company had no stock appreciation rights that were excluded from the computation of diluted earnings per share.
50
Note 10 – Share-based Compensation
The Company has
two
share-based compensation plans, the 2014 Long Term Incentive Plan (the "2014 Plan") and the Amended and Restated 2005 Long Term Incentive Plan (the “2005 Plan”).
The 2014 Plan provides for broad-based equity grants to employees, including executive officers, and members of the board of directors and permits the granting of restricted shares, restricted stock units, performance awards, stock appreciation rights and other stock-based awards. The maximum number of shares that may be issued under the 2014 Plan is
1.5 million
shares and, as of
February 28, 2019
, the Company had approximately
1.2 million
shares reserved for future issuance under this plan.
The 2005 Plan permitted the granting of stock appreciation rights and other equity-based awards to certain employees. This plan was terminated upon the effective date of the 2014 Plan and no future grants may be made under the 2005 Plan. However, there were stock appreciation rights that were granted under the 2005 Plan prior to its termination that remain outstanding, and if exercised, such awards will be settled from the balance of shares available for issuance under the 2005 Plan. As of
February 28, 2019
, there were
0.1 million
shares available for issuance under the 2005 Plan. The 2005 Plan will be formally retired when all remaining outstanding stock appreciation rights are exercised, forfeited or expire. All outstanding stock appreciation rights will expire on or before March 1, 2021.
Restricted Stock Unit Awards
Restricted stock unit awards are valued at the market price of the Company's common stock on the grant date. Awards issued prior to fiscal 2015 generally have a three year cliff vesting schedule and awards issued subsequent to fiscal 2015 generally vest ratably over a period of
three
years but these awards may vest early in accordance with the Plan’s accelerated vesting provisions.
The activity for non-vested restricted stock unit awards for the year ended
February 28, 2019
is as follows:
|
Restricted
Stock Units |
Weighted
Average Grant Date Fair Value |
||||||
|
Non-Vested Balance as of February 28, 2018
|
109,777
|
|
$
|
56.62
|
|
||
|
Granted
|
84,895
|
|
42.05
|
|
|||
|
Vested
|
(38,733
|
)
|
54.53
|
|
|||
|
Forfeited
|
(9,407
|
)
|
53.46
|
|
|||
|
Non-Vested Balance as of February 28, 2019
|
146,532
|
|
$
|
48.93
|
|
||
The total fair value of restricted stock units vested during fiscal years
2019
,
2018
, and
2017
was
$2.1
million,
$3.0
million and
$1.6
million, respectively. For fiscal years
2019
,
2018
and
2017
, there were
146,532
,
109,777
and
134,547
, respectively, of non-vested restricted stock units outstanding with weighted average grant date fair values of
$48.93
,
$56.62
and
$51.10
, respectively.
51
Performance Share Unit Awards
The Company also grants performance share unit awards to certain employees. These awards have a three year performance vesting cycle and may vest in varying amounts contingent on whether various performance and market conditions are satisfied. Specifically, the vesting of these awards is subject to the Company’s degree of achievement of a target annual average adjusted return on assets and total shareholder return, both of which may be relative to the performance of a defined industry peer group. The Company estimates the grant date fair value of these awards using a Monte Carlo simulation.
The activity in our non-vested performance stock unit awards for the year ended
February 28, 2019
is as follows:
|
Performance
Stock Units
|
Weighted
Average Grant
Date Fair Value
|
||||||
|
Non-Vested Balance as of February 28, 2018
|
70,030
|
|
$
|
54.59
|
|
||
|
Granted
|
46,183
|
|
42.00
|
|
|||
|
Vested
|
(3,378
|
)
|
46.65
|
|
|||
|
Forfeited
|
(29,710
|
)
|
49.51
|
|
|||
|
Non-Vested Balance as of February 28, 2019
|
83,125
|
|
$
|
49.74
|
|
||
Stock Appreciation Rights
Stock appreciation rights awards ("SARs") are granted with an exercise price equal to the market value of the Company's common stock on the date of grant. These awards generally have a contractual term of
7
years and vest ratably over a period of
3
years although some may vest immediately on issuance. These awards are valued using the Black-Scholes option pricing model. The Company did not grant any SARs in fiscal year
2019
,
2018
or
2017
.
A summary of the Company’s stock appreciation rights awards activity is as follows:
|
Year Ended
|
|||||||||||||||||||||
|
|
February 28,
2019
|
February 28,
2018
|
February 28,
2017
|
||||||||||||||||||
|
|
SARs
|
Weighted
Average
Exercise
Price
|
SARs
|
Weighted
Average
Exercise
Price
|
SARs
|
Weighted
Average
Exercise
Price
|
|||||||||||||||
|
Outstanding at beginning of year
|
148,513
|
|
$
|
43.29
|
|
170,139
|
|
$
|
42.02
|
|
312,748
|
|
$
|
34.23
|
|
||||||
|
Granted
|
—
|
|
—
|
|
—
|
|
—
|
|
—
|
|
—
|
|
|||||||||
|
Exercised
|
(47,484
|
)
|
40.84
|
|
(19,481
|
)
|
31.94
|
|
(141,983
|
)
|
24.85
|
|
|||||||||
|
Forfeited
|
(2,845
|
)
|
43.92
|
|
(2,145
|
)
|
45.36
|
|
(626
|
)
|
43.92
|
|
|||||||||
|
Outstanding at end of year
|
98,184
|
|
$
|
44.46
|
|
148,513
|
|
$
|
43.29
|
|
170,139
|
|
$
|
42.02
|
|
||||||
|
Exercisable at end of year
|
98,184
|
|
$
|
44.46
|
|
148,513
|
|
$
|
43.29
|
|
126,975
|
|
$
|
41.27
|
|
||||||
The average remaining contractual term for both outstanding and exercisable stock appreciation rights as of
February 28, 2019
was
1.84
years, with an aggregate intrinsic value of
$0.2 million
.
52
The following table summarizes additional information about stock appreciation rights outstanding at
February 28, 2019
.
|
Range of
Exercise Prices |
Total
SARs |
Average
Remaining Life |
Weighted
Average Exercise Price |
SARs
Currently Exercisable |
Weighted
Average Exercise Price |
|||||||||||
|
$39.65
|
950
|
|
1.52
|
$
|
39.65
|
|
950
|
|
$
|
39.65
|
|
|||||
|
$43.92
|
54,510
|
|
2.01
|
$
|
43.92
|
|
54,510
|
|
$
|
43.92
|
|
|||||
|
$45.26
|
40,000
|
|
1.68
|
$
|
45.26
|
|
40,000
|
|
$
|
45.26
|
|
|||||
|
$45.36
|
2,724
|
|
1.00
|
$
|
45.36
|
|
2,724
|
|
$
|
45.36
|
|
|||||
|
$39.65 - $45.36
|
98,184
|
|
1.84
|
$
|
44.46
|
|
98,184
|
|
$
|
44.46
|
|
|||||
Directors Grants
The Company granted each of its independent directors a total of
1,823
,
2,040
and
1,641
shares of its common stock during fiscal years
2019
,
2018
and
2017
, respectively. These common stock grants were valued at
$54.85
,
$49.00
and
$60.94
per share for fiscal years
2019
,
2018
and
2017
, respectively, which was the market price of the Company's common stock on the respective grant dates.
Employee Stock Purchase Plan
The Company also has an employee stock purchase plan, which allows employees of the Company to purchase common stock of the Company through accumulated payroll deductions. Offerings under this plan have a duration of
24 months
(the "offering period"). On the first day of an offering period (the “enrollment date”) the participant is granted the option to purchase shares on each exercise date at the lower of
85%
of the market value of a share of our common stock on the enrollment date or the exercise date. The participant’s right to purchase common stock under the plan is restricted to no more than
$25,000
per calendar year and the participant may not purchase more than
5,000
shares during any offering period. Participants may terminate their interest in a given offering or a given exercise period by withdrawing all of their accumulated payroll deductions at any time prior to the end of the offering period.
Share-based compensation expense and related income tax benefits related to all the plans listed above were as follows (in thousands):
|
Year Ended
|
||||||||||||
|
February 28, 2019
|
February 28, 2018
|
February 28, 2017
|
||||||||||
|
Compensation expense
|
$
|
4,659
|
|
$
|
6,121
|
|
$
|
5,870
|
|
|||
|
Income tax benefits
|
$
|
978
|
|
$
|
2,122
|
|
$
|
2,055
|
|
|||
Unrecognized compensation cost related to all the above at
February 28, 2019
totaled
$6.1
million. These costs are expected to be recognized over a weighted period of
1.71
years.
The actual tax benefit realized for tax deductions from share-based compensation during each of these fiscal years totaled
$(0.3) million
,
$0.2 million
and
$1.5 million
, respectively.
The Company’s policy is to issue shares required under these plans from the Company’s authorized but unissued shares. The Company has no formal or informal plan to repurchase shares on the open market to satisfy these requirements.
53
Note 11 – Debt
Following is a summary of debt (in thousands):
|
|
February 28, 2019
|
February 28, 2018
|
||||||
|
2017 Revolving Line of Credit
|
$
|
116,000
|
|
$
|
162,000
|
|
||
|
2011 Senior Notes
|
125,000
|
|
125,000
|
|
||||
|
2008 Senior Notes
|
—
|
|
14,286
|
|
||||
|
Total debt
|
241,000
|
|
301,286
|
|
||||
|
Unamortized debt issuance costs
|
(255
|
)
|
(391
|
)
|
||||
|
Total debt, net
|
240,745
|
|
300,895
|
|
||||
|
Less amount due within one year
|
—
|
|
(14,286
|
)
|
||||
|
Debt due after one year, net
|
$
|
240,745
|
|
$
|
286,609
|
|
||
2017 Revolving Credit Facility
On March 27, 2013, the Company entered into a credit agreement (the “Credit Agreement”) with Bank of America and other lenders. The Credit Agreement provided for a
$75.0 million
term facility and a
$225.0 million
revolving credit facility that included a
$75.0 million
“accordion” feature. The Credit Agreement is used to provide for working capital needs, capital improvements, dividends, future acquisitions and letter of credit needs.
On March 21, 2017, the Company executed the Amended and Restated Credit Agreement (the “2017 Credit Agreement”) with Bank of America and other lenders. The 2017 Credit Agreement amended the Credit Agreement by the following: (i) extending the maturity date until March 21, 2022, (ii) providing for a senior revolving credit facility in a principal amount of up to
$450 million
, with an additional
$150 million
accordion, (iii) including a
$75 million
sublimit for the issuance of standby and commercial letters of credit, (iv) including a
$30 million
sublimit for swing line loans, (v) restricting indebtedness incurred in respect of capital leases, synthetic lease obligations and purchase money obligations not to exceed
$20 million
, (vi) restricting investments in any foreign subsidiaries not to exceed
$50 million
in the aggregate, and (vii) including various financial covenants and certain restricted payments relating to dividends and share repurchases as specifically set forth in the 2017 Credit Agreement. The balance due on the
$75.0 million
term facility under the previous Credit Agreement was paid in full as a result of the execution of the 2017 Credit Agreement.
The financial covenants, as defined in the 2017 Credit Agreement, require the Company to maintain on a consolidated basis a Leverage Ratio not to exceed
3.25
:1.0 and an Interest Coverage Ratio of at least
3.00
:1.0. The 2017 Credit Agreement will be used to finance working capital needs, capital improvements, dividends, future acquisitions, letter of credit needs and share repurchases.
Interest rates for borrowings under the 2017 Credit Agreement are based on either a Eurodollar Rate or a Base Rate plus a margin ranging from
0.875%
to
1.875%
depending on our Leverage Ratio (as defined in the 2017 Credit Agreement). The
Eurodollar
Rate is defined as LIBOR for a term equivalent to the borrowing term (or other similar interbank rates if LIBOR is unavailable). The Base Rate is defined as the highest of the applicable Fed Funds rate plus
0.50%
, the Prime rate, or the Eurodollar Rate plus
1.0%
at the time of borrowing. The 2017 Credit Agreement also carries a Commitment Fee for the unfunded portion ranging from 0
.175%
to 0
.30%
per annum, depending on our Leverage Ratio. The effective interest rate was 4.06% as of
February 28, 2019
.
As of
February 28, 2019
, we had
$116.0 million
of outstanding debt against the revolving credit facility and letters of credit outstanding in the amount of
$18.7 million
, which left approximately
$315.3 million
of additional credit available under the 2017 Credit Agreement.
2011 Senior Notes
On January 21, 2011, the Company entered into a Note Purchase Agreement (the “2011 Agreement”), pursuant to which the Company issued
$125.0 million
aggregate principal amount of its
5.42%
unsecured Senior Notes (the “2011 Notes”), through a private placement (the “2011 Note Offering”). Amounts under the agreement are due in a balloon payment on the January 2021 maturity date. Pursuant to the 2011 Agreement, the Company's payment obligations with respect to the 2011 Notes may be accelerated under certain circumstances.
The 2011 Notes contain various financial covenants requiring the Company, among other things, to a) maintain on a consolidated basis net worth equal to at least the sum of
$116.9 million
plus
50.0%
of future net income; b) maintain a ratio of indebtedness to EBITDA (as defined in Note Purchase Agreement) not to exceed
3.25
:1.00; c) maintain on a consolidated basis a Fixed Charge
54
Coverage Ratio (as defined in the Note Purchase Agreement) of at least
2.0
:1.0; d) not at any time permit the aggregate amount of all Priority Indebtedness (as defined in the Note Purchase Agreement) to exceed
10.0%
of Consolidated Net Worth (as defined in the Note Purchase Agreement).
2008 Senior Notes
On March 31, 2008, the Company entered into a Note Purchase Agreement (the “Note Purchase Agreement”) pursuant to which the Company issued
$100.0 million
aggregate principal amount of its
6.24%
unsecured Senior Notes (the “2008 Notes”) through a private placement (the “2008 Note Offering”). Amounts were due under the Agreement in
seven
annual installments of
$14.3 million
commencing in March of 2012 through the March 2018 maturity date. On March 31, 2018, the Company made the final principal payment of $14.3 million to fully settle the 2008 Senior Notes on the scheduled maturity date.
As of
February 28, 2019
, the Company was in compliance with all of its debt covenants.
Maturities of debt are as follows (in thousands):
|
Fiscal year:
|
Future Debt Maturities
|
|||
|
2020
|
$
|
—
|
|
|
|
2021
|
125,000
|
|
||
|
2022
|
—
|
|
||
|
2023
|
116,000
|
|
||
|
2024
|
—
|
|
||
|
Thereafter
|
—
|
|
||
|
Total
|
$
|
241,000
|
|
|
55
Note 12 – Operating Segments
Segment Information
Information about segments during the periods presented were as follows (in thousands):
|
Year Ended
|
||||||||||||
|
February 28, 2019
|
February 28, 2018
|
February 28, 2017
|
||||||||||
|
Net sales:
|
|
|||||||||||
|
Energy
|
$
|
486,823
|
|
$
|
421,033
|
|
$
|
488,002
|
|
|||
|
Metal Coatings
|
440,264
|
|
389,397
|
|
375,536
|
|
||||||
|
Total net sales
|
$
|
927,087
|
|
$
|
810,430
|
|
$
|
863,538
|
|
|||
|
Operating income (loss):
|
||||||||||||
|
Energy
|
$
|
31,332
|
|
$
|
(1,766
|
)
|
$
|
52,577
|
|
|||
|
Metal Coatings
|
83,591
|
|
84,332
|
|
79,033
|
|
||||||
|
Corporate
|
(37,967
|
)
|
(34,318
|
)
|
(32,702
|
)
|
||||||
|
Total operating income
|
$
|
76,956
|
|
$
|
48,248
|
|
$
|
98,908
|
|
|||
|
Year Ended
|
||||||||||||
|
February 28, 2019
|
February 28, 2018
|
February 28, 2017
|
||||||||||
|
Depreciation and amortization:
|
||||||||||||
|
Energy
|
$
|
19,405
|
|
$
|
19,996
|
|
$
|
19,624
|
|
|||
|
Metal Coatings
|
29,124
|
|
28,617
|
|
28,650
|
|
||||||
|
Corporate
|
1,716
|
|
1,913
|
|
2,083
|
|
||||||
|
Total
|
$
|
50,245
|
|
$
|
50,526
|
|
$
|
50,357
|
|
|||
|
Year Ended
|
||||||||||||
|
February 28, 2019
|
February 28, 2018
|
February 28, 2017
|
||||||||||
|
Expenditures for acquisitions, net of cash, and property, plant and equipment:
|
||||||||||||
|
Energy
|
$
|
14,608
|
|
$
|
32,903
|
|
$
|
31,474
|
|
|||
|
Metal Coatings
|
16,046
|
|
39,474
|
|
32,099
|
|
||||||
|
Corporate
|
2,962
|
|
2,020
|
|
540
|
|
||||||
|
Total
|
$
|
33,616
|
|
$
|
74,397
|
|
$
|
64,113
|
|
|||
|
February 28, 2019
|
February 28, 2018
|
|||||||
|
Assets:
|
||||||||
|
Energy
|
$
|
630,134
|
|
$
|
554,866
|
|
||
|
Metal Coatings
|
440,090
|
|
460,575
|
|
||||
|
Corporate
|
18,346
|
|
12,768
|
|
||||
|
Total assets
|
$
|
1,088,570
|
|
$
|
1,028,209
|
|
||
56
Financial Information About Geographical Areas
Financial information about geographical areas for the periods presented was as follows (in thousands):
|
Year Ended
|
||||||||||||
|
February 28, 2019
|
February 28, 2018
|
February 28, 2017
|
||||||||||
|
Geographic net sales:
|
||||||||||||
|
United States
|
$
|
785,194
|
|
$
|
653,150
|
|
$
|
705,820
|
|
|||
|
Other countries
|
141,893
|
|
157,280
|
|
157,718
|
|
||||||
|
Total
|
$
|
927,087
|
|
$
|
810,430
|
|
$
|
863,538
|
|
|||
|
February 28, 2019
|
February 28, 2018
|
|||||||
|
Property, plant and equipment, net:
|
||||||||
|
United States
|
$
|
189,281
|
|
$
|
194,418
|
|
||
|
Canada
|
16,961
|
|
18,254
|
|
||||
|
Other Countries
|
3,985
|
|
4,183
|
|
||||
|
Total
|
$
|
210,227
|
|
$
|
216,855
|
|
||
Note 13 – Leases
The Company is a lessee under various operating leases for facilities and equipment. The Company recognized operating lease costs of
$15.6 million
,
$13.9 million
and
$17.0 million
for fiscal years
2019
,
2018
and
2017
, respectively.
As of
February 28, 2019
, maturities of the Company's lease liabilities under ASC 842 were as follows (in thousands):
|
Fiscal year:
|
Operating Leases
|
||
|
2020
|
$
|
7,882
|
|
|
2021
|
7,185
|
|
|
|
2022
|
6,803
|
|
|
|
2023
|
6,454
|
|
|
|
2024
|
5,771
|
|
|
|
Thereafter
|
24,718
|
|
|
|
Total lease payments
|
58,813
|
|
|
|
Less imputed interest
|
(11,966
|
)
|
|
|
Total
|
$
|
46,847
|
|
As of February 28, 2018, maturities of the Company's lease liabilities under ASC 840 were as follows (in thousands):
|
Fiscal year:
|
Operating Leases
|
||
|
2019
|
$
|
7,336
|
|
|
2020
|
6,053
|
|
|
|
2021
|
5,057
|
|
|
|
2022
|
4,924
|
|
|
|
2023
|
4,781
|
|
|
|
Thereafter
|
25,017
|
|
|
|
Total
|
$
|
53,168
|
|
57
Supplemental information related to the Company's portfolio of operating leases was as follows (in thousands, except years and percentages):
|
Year Ended
|
||||
|
February 28, 2019
|
||||
|
Operating cash flows from operating leases included in lease liabilities
|
$
|
8,454
|
|
|
|
ROU assets obtained in exchange for new operating lease liabilities
|
$
|
10,948
|
|
|
|
Weighted-average remaining lease term - operating leases
|
9.23 years
|
|
||
|
Weighted-average discount rate - operating leases
|
5.13
|
%
|
||
Note 14 – Commitments and Contingencies
Legal
On January 11, 2018, Logan Mullins, acting on behalf of himself and a putative class of persons who purchased or otherwise acquired the Company's securities between April 22, 2015 and January 8, 2018, filed a class action complaint in the U.S. District Court for the Northern District of Texas (the "Court") against the Company and two of its executive officers, Thomas E. Ferguson and Paul W. Fehlman. Logan Mullins v. AZZ, Inc., et al., Case No. 4:18-cv-00025-Y. The complaint alleged, among other things, that the Company's SEC filings contained statements that were rendered materially false and misleading by the Company's alleged failure to properly recognize revenue related to certain contracts in its Energy Segment in purported violation of (1) Section 10(b) of the Exchange Act and Rule 10b-5 and (2) Section 20(a) of the Exchange Act. After the Court appointed a Lead Plaintiff in the case, but before the Company was required to respond to the lawsuit, the Plaintiff voluntarily sought dismissal of the complaint without prejudice. On January 16, 2019, the Court dismissed the case without prejudice. No other parties have sought to reopen the case; therefore, the legal matter is no longer pending.
In addition, the Company and its subsidiaries are named defendants in various routine lawsuits incidental to our business. These proceedings include labor and employment claims, use of the Company’s intellectual property, worker’s compensation and various environmental matters, all arising in the normal course of business. Although the outcome of these lawsuits or other proceedings cannot be predicted with certainty, and the amount of any potential liability that could arise with respect to such lawsuits or other matters cannot be predicted at this time, management, after consultation with legal counsel, does not expect liabilities, if any, from these claims or proceedings, either individually or in the aggregate, to have a material effect on the Company’s financial position, results of operations or cash flows.
Commodity pricing
We have no contracted commitments for any commodities including steel, aluminum, natural gas, cooper, zinc, nickel based alloys, except for those entered into under the normal course of business.
Other
At
February 28, 2019
, the Company had outstanding letters of credit in the amount of
$44.3 million
. These letters of credit are issued for a number of reasons, but are most commonly issued in lieu of customer retention withholding payments covering warranty or performance periods. In addition, as of
February 28, 2019
, a warranty reserve in the amount of
$1.8 million
was established to offset any future warranty claims.
58
Note 15 – Acquisitions
On March 22, 2018, the Company purchased certain assets through a bankruptcy sales process from Lectrus Corporation, a privately-held corporation based in Chattanooga, Tennessee. Lectrus designs and manufactures custom metal enclosures and provides electrical and mechanical integration. The acquisition will complement AZZ's current metal enclosure and switchgear businesses in the Energy segment.
On February 1, 2018, the Company completed the acquisition of all the assets and outstanding shares of Rogers Brothers Company ("Rogers Brothers"), a privately held company, based in Rockford, Illinois. Rogers Brothers provides galvanizing solutions to a multi-state area within the Midwest. The acquisition supports AZZ's goal of continued geographic expansion as well as portfolio expansion of its metal coatings solutions. The goodwill arising from this acquisition was allocated to the Metal Coatings segment and is not deductible for income tax purposes.
On September 6, 2017, the Company completed the acquisition of all the assets and outstanding shares of Powergrid Solutions, Inc. ("PSI"), a privately held company, based in Oshkosh, Wisconsin. PSI designs, engineers and manufactures customized low and medium-voltage power quality, power generation and distribution equipment. PSI’s product portfolio includes metal-enclosed, metal-clad and padmount switchgear, serving the utility, commercial, industrial and renewable energy markets since 1982. The acquisition of PSI is a key addition to the Company's electrical switchgear portfolio. The addition of PSI’s low-voltage and padmount switchgear allows AZZ to offer a comprehensive portfolio of customized switchgear solutions to both existing and new customers in a diverse set of industries. The goodwill arising from this acquisition was allocated to the Energy Segment and is deductible for income tax purposes.
On June 30, 2017, the Company completed the acquisition of the assets of Enhanced Powder Coating Ltd., (“EPC”), a privately held, high specification, National Aerospace and Defense Contractors Accreditation Program, ("NADCAP"), certified provider of powder coating, plating and anodizing services based in Gainesville, Texas. EPC, founded in 2003, offers a full spectrum of finish technology including powder coating, abrasive blasting and plating for heavy industrial, transportation, aerospace and light commercial industries. The acquisition of EPC is consistent with the Company's strategic initiative to grow its Metal Coatings segment with products and services that complement its industry-leading galvanizing business. The goodwill arising from this acquisition was allocated to the Metal Coatings Segment and is deductible for income tax purposes.
On March 1, 2016, the Company completed an acquisition of the equity securities of Power Electronics, Inc. ("PEI"), a Millington, Maryland-based manufacturer and integrator of electrical enclosure systems. The acquisition of PEI will enhance our capacity to serve existing and new customers in a diverse set of industries along the Eastern seaboard of the United States. The goodwill arising from this acquisition was allocated to the Energy Segment and is deductible for income tax purposes.
The Company paid
$8.0 million
,
$44.8 million
and
$22.7 million
, for these acquisitions, net of cash acquired, during fiscal
2019
,
2018
and
2017
, respectively.
These acquisitions were not significant individually or in the aggregate for any fiscal year.
Accordingly, disclosures of the purchase price allocations and unaudited pro forma results of operations have not been provided.
Note 16 – Subsequent Events
In April 2019, the Company completed the acquisition of all the assets and outstanding shares of K2 Partners, Inc. (“K2”) and Tennessee Galvanizing, Inc. ("Tennessee Galvanizing"), two privately held companies. K2 provides powder coating and electroplating solutions to customers in the Midwest and Southeast from locations in Texas and Florida. Tennessee Galvanizing provides galvanizing solutions to customers in Southeast Tennessee. These acquisitions expand the Company's geographical reach in metal coating solutions and broadens its offerings in strategic markets. These acquisitions will be included in the Metal Coatings segment.
59
Note 17 – Selected Quarterly Financial Data (Unaudited)
|
|
Quarter ended
|
|||||||||||||||
|
|
May 31,
2018 |
August 31,
2018 |
November 30,
2018 |
February 28,
2019 |
||||||||||||
|
(in thousands, except per share data)
|
||||||||||||||||
|
Net sales
|
$
|
262,236
|
|
$
|
222,787
|
|
$
|
239,516
|
|
$
|
202,548
|
|
||||
|
Gross profit
|
58,705
|
|
46,904
|
|
49,755
|
|
43,257
|
|
||||||||
|
Net income
|
15,718
|
|
11,244
|
|
15,395
|
|
8,851
|
|
||||||||
|
Basic earnings per share
|
0.60
|
|
0.43
|
|
0.59
|
|
0.34
|
|
||||||||
|
Diluted earnings per share
|
0.60
|
|
0.43
|
|
0.59
|
|
0.34
|
|
||||||||
|
|
Quarter ended
|
|||||||||||||||
|
|
May 31,
2017 |
August 31,
2017 |
November 30,
2017 |
February 28,
2018 |
||||||||||||
|
(in thousands, except per share data)
|
||||||||||||||||
|
Net sales
|
$
|
205,283
|
|
$
|
196,329
|
|
$
|
208,158
|
|
$
|
200,660
|
|
||||
|
Gross profit
|
47,382
|
|
43,800
|
|
31,117
|
|
38,010
|
|
||||||||
|
Net income
|
12,062
|
|
9,786
|
|
(166
|
)
|
23,487
|
|
||||||||
|
Basic earnings (loss) per share
|
0.46
|
|
0.38
|
|
(0.01
|
)
|
0.91
|
|
||||||||
|
Diluted earnings per (loss) share
|
0.46
|
|
0.38
|
|
(0.01
|
)
|
0.90
|
|
||||||||
As discussed in Note 1, an error was identified in connection with adoption of ASC 606, and this error has been corrected in the fourth quarter of fiscal 2019 as an out of period adjustment. This adjustment did not have a material impact to net sales, gross profit or net income for any period presented herein.
Schedule II
AZZ Inc.
Valuation and Qualifying Accounts and Reserves
(In thousands)
|
|
Year Ended
|
|||||||||||
|
|
February 28, 2019
|
February 28, 2018
|
February 28, 2017
|
|||||||||
|
Allowance for Doubtful Accounts
|
||||||||||||
|
Balance at beginning of year
|
$
|
569
|
|
$
|
347
|
|
$
|
264
|
|
|||
|
Additions (reductions) charged or credited to income
|
2,153
|
|
3,290
|
|
48
|
|
||||||
|
(Write offs) recoveries, net
|
(451
|
)
|
(3,084
|
)
|
20
|
|
||||||
|
Other
|
—
|
|
16
|
|
11
|
|
||||||
|
Effect of exchange rate
|
(4
|
)
|
—
|
|
4
|
|
||||||
|
Balance at end of year
|
$
|
2,267
|
|
$
|
569
|
|
$
|
347
|
|
|||
60
Item 9. Changes In and Disagreements with Accountants on Accounting and Financial Disclosure
None.
Item 9A. Controls and Procedures
Disclosure Controls and Procedures
The Company's management, with the participation of its principal executive officer and principal financial officer, have evaluated, as required by Rule 13a-15(e) under the Securities Exchange Act of 1934 ("the Exchange Act"), the effectiveness of the Company's disclosure controls and procedures. Based on that evaluation, the principal executive officer and principal financial officer concluded that, due to the material weakness described below, the Company's disclosure controls and procedures were not effective as of the end of the period covered by this Form 10-K to provide reasonable assurance that information required to be disclosed by the Company in the reports that it files or submits under the Exchange Act is recorded, processed, summarized and reported within the time periods specified in the SEC's rules and forms, and were not effective as of the end of the period covered by this Form 10-K to provide reasonable assurance that such information is accumulated and communicated to the Company's management, including the principal executive officer and principal financial officer, to allow timely decisions regarding required disclosure.
Management’s Report on Internal Controls Over Financial Reporting
The Company's management is responsible for establishing and maintaining adequate internal control over financial reporting, as defined in Rule 13a-15(f) of the Exchange Act. Management, with the participation of its principal executive officer and principal financial officer assessed the effectiveness of the Company's internal control over financial reporting based on the criteria for effective internal control over financial reporting established in "Internal Control - Integrated Framework (2013)," issued by the Committee of Sponsoring Organizations of the Treadway Commission. Based upon its assessment, management concluded that the Company did not maintain effective internal control over financial reporting as of February 28, 2019 due to the following:
As of February 28, 2018, management concluded the Company’s internal control over financial reporting was ineffective due to the inadequate design of controls pertaining to the Company’s review and ongoing monitoring of its revenue recognition policies. On March 1, 2018, the Company adopted the new revenue recognition standard, ASC 606. The Company identified errors in its revenue reconciliations that were primarily related to the adoption of ASC 606 and were deemed inappropriate. These errors, which were not detected timely by management, were the result of inadequate operating effectiveness of controls pertaining to the Company’s preparation and review of its revenue reconciliations. The errors were corrected in the Company's fiscal year 2019 consolidated financial statements; however, the deficiency represents a material weakness in the Company’s internal control over financial reporting.
Management is actively engaged in the planning for, and implementation of, remediation efforts to address the material weakness identified above. The remediation plan includes i) new controls over recording revenue transactions and reviewing revenue reconciliations, and ii) additional training.
Management believes the measures described above and others that may be implemented will remediate the material weaknesses that we have identified. As management continues to evaluate and improve internal control over financial reporting, we may decide to take additional measures to address control deficiencies or determine to modify, or in appropriate circumstances not to complete, certain of the remediation measures identified.
Because of its inherent limitations, internal control over financial reporting may not prevent or detect all misstatements or fraud. Any control system, no matter how well designed and operated, is based upon certain assumptions and can provide only reasonable, not absolute, assurance that its objectives will be met.
Management's assessment and conclusion on the effectiveness of internal control over financial reporting did not include an assessment of the internal controls of Lectrus Corporation whose acquisition was completed during fiscal year 2019. This entity constituted approximately 2.0% of the Company’s total assets as of February 28, 2019 and 2.6% and 2.2% of revenues and net income, respectively, for the year then ended. Management did not assess the effectiveness of internal control over financial reporting for this entity because of the timing of the acquisition during the fiscal year.
The Company’s independent registered public accounting firm, BDO USA, LLP has issued an audit report on the Company’s internal control over financial reporting, which is included in Item 8 in this Form 10-K.
61
Changes in Internal Controls Over Financial Reporting
With the exception of the remediation efforts noted above, there have been no changes in the Company's internal control over financial reporting during the three months ended
February 28, 2019
, that have materially affected, or are reasonably likely to materially affect, the Company's internal control over financial reporting.
Item 9B. Other Information
None.
62
PART III
Item 10. Directors, Executive Officers and Corporate Governance
The information required by this item with regard to executive officers is included in Part I, Item 1 of this Annual Report on Form 10-K under the heading “Executive Officers of the Registrant.”
Information regarding directors of AZZ required by this Item is incorporated by reference to the section entitled “Election of Directors” set forth in the Proxy Statement for our
2019
Annual Meeting of Shareholders.
The information regarding compliance with Section 16(a) of the Exchange Act required by this Item is incorporated by reference to the section entitled “Section 16(a) Beneficial Ownership Reporting Compliance” set forth in the Proxy Statement for our
2019
Annual Meeting of Shareholders.
Information regarding our audit committee financial experts and code of ethics and business conduct required by this Item is incorporated by reference to the section entitled “Matters Relating to Corporate Governance, Board Structure, Director Compensation and Stock Ownership” set forth in the Proxy Statement for our
2019
Annual Meeting of Shareholders.
No director or nominee for director has any family relationship with any other director or nominee or with any executive officer of our company.
Item 11. Executive Compensation
The information required by this Item is incorporated herein by reference to the section entitled “Executive Compensation” and the section entitled “Matters Relating to Corporate Governance, Board Structure, Director Compensation and Stock Ownership – Fees Paid to Directors” set forth in our Proxy Statement for our
2019
Annual Meeting of Shareholders.
Item 12. Security Ownership of Certain Beneficial Owners and Management and Related Stockholder Matters
The information required by this Item is incorporated herein by reference to the section entitled “Executive Compensation” and the section entitled “Matters Relating to Corporate Governance, Board Structure, Director Compensation and Stock Ownership – Security Ownership of Management” set forth in the Proxy Statement for our
2019
Annual Meeting of Shareholders.
Equity Compensation Plan
The following table provides a summary of information as of
February 28, 2019
, relating to our equity compensation plans in which our Common Stock is authorized for issuance.
Equity Compensation Plan Information:
|
(a)
Number of securities
to be issued upon
exercise of
outstanding options,
warrants and rights
|
(b)
Weighted average
exercise price of
outstanding
options, warrants
and rights
|
(c)
Number of securities
remaining available for
future issuance under
equity compensation
plans (excluding shares
reflected in column (a))
|
||||
|
Equity compensation plans approved by shareholders
(1)
|
327,841
(2)
|
$44.46
(3)
|
2,819,098
(4)
|
|||
|
(1)
|
Consists of the Amended and Restated 2005 Long-Term Incentive Plan ("2005 Plan"), the 2014 Long-Term Incentive Plan ("2014 Plan") and the 2018 Employee Stock Purchase Plan ("2018 ESPP"). See Note 10, “Stock Compensation” to our “Notes to Consolidated Financial Statements” for further information.
|
|
(2)
|
Consists of outstanding awards, including 146,532 RSUs and 83,125 PSUs granted under the 2014 Plan and 98,184 SARs granted under the 2005 Plan.
|
|
(3)
|
The weighted-average exercise price is calculated based solely on the exercise prices of the outstanding SARs and does not reflect the shares that will be issued upon the vesting of outstanding awards of RSUs or PSUs, which have no exercise price.
|
|
(4)
|
Consists of (i)1,247,712 shares remaining available for future issuance under the 2014 Plan, (ii) 98,184 shares remaining available for issuance under the 2005 Plan and (iii) 1,473,202 shares remaining available for issuance under the 2018 ESPP.
|
63
Description of Other Plans for the Grant of Equity Compensation
Long Term Incentive Plans
The description of the 2005 Plan, 2014 Plan and 2018 ESPP provided in Note 10 to the consolidated financial statements included in this Annual Report on Form 10-K are incorporated by reference under this Item.
Item 13. Certain Relationships and Related transactions, and Director Independence
The information required by this Item is incorporated by reference to the sections entitled “Certain Relationships and Related Party Transactions” and “Director Independence” set forth in the Proxy Statement for our
2019
Annual Meeting of Shareholders.
Item 14. Principal Accounting Fees and Services
Information required by this Item is incorporated by reference to the sections entitled “Other Business – Independent Auditor Fees” and “Other Business – Pre-approval of Non-audit Fees” set forth in our Proxy Statement for our
2019
Annual Meeting of Shareholders.
64
PART IV
Item 15. Exhibits and Financial Statement Schedules
(a) Documents filed as part of this report
|
1.
|
Consolidated Financial Statements
|
2. Financial Statement Schedules
All other schedules have been omitted because they are not required, not applicable, or the required information is otherwise included.
3. Exhibits
|
Incorporated by Reference
|
||||||||
|
Exhibit Number
|
Description
|
Form
|
Exhibit
|
Filing Date
|
||||
|
3.1
|
8-K
|
3.1
|
7/14/15
|
|||||
|
3.2
|
8-K
|
3.2
|
7/14/15
|
|||||
|
4.1
|
10-Q
|
4.1
|
10/13/00
|
|||||
|
10.1
|
8-K
|
10.1
|
3/24/17
|
|||||
|
10.2
|
8-K
|
10.1
|
1/21/11
|
|||||
|
10.3
|
*
|
DEF 14A
|
Appendix A
|
6/4/08
|
||||
|
10.4
|
*
|
10-Q
|
10.53
|
9/28/04
|
||||
|
10.5
|
*
|
10-Q
|
10.54
|
9/28/04
|
||||
|
10.6
|
*
|
DEF 14A
|
Appendix A
|
5/29/14
|
||||
|
10.7
|
*
|
8-K
|
10.2
|
1/21/16
|
||||
|
10.8
|
*
|
8-K
|
10.4
|
1/21/16
|
||||
|
10.9
|
*
|
8-K
|
10.5
|
1/21/16
|
||||
|
10.10
|
*
|
8-K
|
10.6
|
1/21/16
|
||||
|
10.11
|
*
|
DEF 14A
|
Appendix B
|
5/28/15
|
||||
|
10.12
|
*
|
8-K
|
10.3
|
1/21/16
|
||||
|
10.13
|
*
|
DEF 14A
|
Appendix A
|
5/25/18
|
||||
65
|
Incorporated by Reference
|
||||||||
|
Exhibit Number
|
Description
|
Form
|
Exhibit
|
Filing Date
|
||||
|
10.14
|
*
|
8-K
|
10.1
|
9/29/16
|
||||
|
10.15
|
*
|
8-K
|
10.2
|
11/7/13
|
||||
|
10.16
|
*
|
8-K
|
10.1
|
2/27/14
|
||||
|
10.17
|
*
|
8-K
|
10.2
|
2/27/14
|
||||
|
10.18
|
*
|
10-K
|
10.18
|
5/24/02
|
||||
|
10.19
|
*
|
8-K
|
10.1
|
1/21/16
|
||||
|
10.20
|
*
|
8-K
|
10.1
|
10/3/17
|
||||
|
10.21
|
*
|
8-K
|
10.1
|
1/18/19
|
||||
|
14.1
|
Code of Conduct. AZZ Inc. Code of Conduct may be accessed via the Company’s Website at www.azz.com.
|
|||||||
|
21.1
|
+
|
|||||||
|
23.1
|
+
|
|||||||
|
31.1
|
+
|
|||||||
|
31.2
|
+
|
|||||||
|
32.1
|
+
|
|||||||
|
32.2
|
+
|
|||||||
|
101.INS
|
+
|
XBRL Instance Document
|
||||||
|
101.SCH
|
+
|
XBRL Taxonomy Extension Schema Document
|
||||||
|
101.CAL
|
+
|
XBRL Taxonomy Extension Calculation Linkbase Document
|
||||||
|
101.DEF
|
+
|
XBRL Taxonomy Extension Definition Linkbase Document
|
||||||
|
101.LAB
|
+
|
XBRL Taxonomy Extension Label Linkbase Document
|
||||||
|
101.PRE
|
+
|
XBRL Taxonomy Extension Presentation Linkbase Document
|
||||||
* Indicates management contract, compensatory plan or arrangement
+ Indicates filed herewith
Item 16. Form 10-K Summary
None.
66
SIGNATURES
Pursuant to the requirements of Section 13 or 15(d) of the Securities Exchange Act of 1934, the registrant has duly caused this report to be signed on its behalf by the undersigned thereunto duly authorized.
|
|
AZZ Inc.
|
|
|
|
(Registrant)
|
|
|
May 17, 2019
|
|
By:
/s/ Thomas E. Ferguson
|
|
|
Thomas E. Ferguson,
President and Chief Executive Officer
|
|
Pursuant to the requirements of the Securities Exchange Act of 1934, this report has been signed below by the following persons on behalf of AZZ and in the capacities and on the dates indicated.
|
May 17, 2019
|
/s/ Kevern R. Joyce
|
|
|
Kevern R. Joyce
Chairman of the Board of Directors |
||
|
May 17, 2019
|
/s/ Thomas E. Ferguson
|
|
|
Thomas E. Ferguson
President, Chief Executive Officer and Director (Principal Executive Officer)
|
||
|
May 17, 2019
|
|
/s/ Paul W. Fehlman
|
|
|
Paul W. Fehlman,
Senior Vice President and Chief Financial Officer (Principal Financial Officer)
|
|
|
May 17, 2019
|
|
/s/ James Drew Byelick
|
|
|
James Drew Byelick
Vice President and Chief Accounting Officer
|
|
|
May 17, 2019
|
/s/ Daniel R. Feehan
|
|
|
Daniel R. Feehan
Director
|
||
|
May 17, 2019
|
|
/s/ Daniel E. Berce
|
|
|
Daniel E. Berce
Director |
|
|
May 17, 2019
|
/s/ Paul Eisman
|
|
|
Paul Eisman
Director |
||
|
May 17, 2019
|
/s/ Venita McCellon-Allen
|
|
|
Venita McCellon-Allen
Director |
||
|
May 17, 2019
|
/s/ Ed McGough
|
|
|
Ed McGough
Director |
||
|
May 17, 2019
|
/s/ Steven R. Purvis
|
|
|
Steven R. Purvis
Director
|
||
|
May 17, 2019
|
/s/ Stephen E. Pirnat
|
|
|
Stephen E. Pirnat
Director
|
||
67
TABLE OF CONTENTS
Part IItem 1. BusinessItem 1A. Risk FactorsItem 1B. Unresolved Staff CommentsItem 2. PropertiesItem 3. Legal ProceedingsItem 4. Mine Safety DisclosuresPart IIItem 5. Market For Registrant S Common Equity, Related Stockholder Matters and Issuer Purchases Of Equity SecuritiesItem 6. Selected Financial DataItem 7. Management S Discussion and Analysis Of Financial Condition and Results Of OperationsItem 7A. Quantitative and Qualitative Disclosures About Market RiskItem 8. Financial Statements and Supplementary DataNote 1 Summary Of Significant Accounting PoliciesNote 2 InventoriesNote 3 Property, Plant and EquipmentNote 4 Other Accrued LiabilitiesNote 5 Restructuring and Other Related CostsNote 6 Employee Benefit PlansNote 7 Income TaxesNote 8 Goodwill and Intangible AssetsNote 9 Earnings Per ShareNote 10 Share-based CompensationNote 11 DebtNote 12 Operating SegmentsNote 13 LeasesNote 14 Commitments and ContingenciesNote 15 AcquisitionsNote 16 Subsequent EventsNote 17 Selected Quarterly Financial Data (unaudited)Item 9. Changes in and Disagreements with Accountants on Accounting and Financial DisclosureItem 9A. Controls and ProceduresItem 9B. Other InformationPart IIIItem 10. Directors, Executive Officers and Corporate GovernanceItem 11. Executive CompensationItem 12. Security Ownership Of Certain Beneficial Owners and Management and Related Stockholder MattersItem 13. Certain Relationships and Related Transactions, and Director IndependenceItem 14. Principal Accounting Fees and ServicesPart IVItem 15. Exhibits and Financial Statement SchedulesItem 16. Form 10-k Summary