BARNES GROUP INC
10-Ks and 10-Qs
|
|
|
|
|
|
|
|
|
|
|
|
|
|
|
|
|
|
|
|
|
|
|
|
|
|
|
|
|
|
|
|
|
|
|
|
|
|
|
|
|
|
|
|
UNITED STATES
SECURITIES AND EXCHANGE COMMISSION
Washington, D.C. 20549
FORM 10-K
|
x
|
ANNUAL REPORT PURSUANT TO SECTION 13 OR 15(d) OF THE SECURITIES EXCHANGE ACT OF 1934
|
For the fiscal year ended
December 31, 2018
|
¨
|
TRANSITION REPORT PURSUANT TO SECTION 13 OR 15(d) OF THE SECURITIES EXCHANGE ACT OF 1934
|
For the transition period from to
Commission file number 1-4801
BARNES GROUP INC.
(Exact name of registrant as specified in its charter)
|
Delaware
|
|

|
|
06-0247840
|
|
(State of incorporation)
|
|
|
(I.R.S. Employer Identification No.)
|
|
|
123 Main Street, Bristol, Connecticut
|
|
|
06010
|
|
|
(Address of Principal Executive Office)
|
|
|
(Zip Code)
|
|
(860) 583-7070
Registrant’s telephone number, including area code
Securities registered pursuant to Section 12(b) of the Act:
|
Title of each class
|
|
Name of each exchange on which registered
|
|
Common Stock, $0.01 Par Value
|
|
New York Stock Exchange
|
Securities registered pursuant to Section 12(g) of the Act:
None
Indicate by check mark if the registrant is a well-known seasoned issuer, as defined in Rule 405 of the Securities Act. Yes
x
No
¨
Indicate by check mark if the registrant is not required to file reports pursuant to Section 13 or Section 15(d) of the Act. Yes
¨
No
x
Indicate by check mark whether the registrant: (1) has filed all reports required to be filed by Section 13 or 15(d) of the Securities Exchange Act of 1934 during the preceding 12 months (or for such shorter period that the registrant was required to file such reports); and (2) has been subject to such filing requirements for the past 90 days. Yes
x
No
¨
Indicate by check mark whether the registrant has submitted electronically and posted on its corporate Web site, if any, every Interactive Data File required to be submitted and posted pursuant to Rule 405 of Regulation S-T (§ 232.405 of this chapter) during the preceding 12 months (or for such shorter period that the registrant was required to submit and post such files). Yes
x
No
¨
Indicate by check mark if disclosure of delinquent filers pursuant to Item 405 of Regulation S-K is not contained herein, and will not be contained, to the best of registrant’s knowledge, in definitive proxy or information statements incorporated by reference in Part III of this Form 10-K or any amendment to this Form 10-K.
¨
Indicate by check mark whether the registrant is a large accelerated filer, an accelerated filer, a non-accelerated filer, smaller reporting company, or an emerging growth company. See the definitions of “large accelerated filer,” “accelerated filer,” “smaller reporting company,” and "emerging growth company" in Rule 12b-2 of the Exchange Act. (Check one):
|
Large accelerated filer
x
|
|
Accelerated filer
o
|
|
Non-accelerated filer
o
|
|
Smaller reporting company
o
|
|
Emerging growth company
¨
|
||
If an emerging growth company, indicate by check mark if the registrant has elected not to use the extended transition period for complying with any new or revised financial accounting standards provided pursuant to Section 13(a) of the Exchange Act.
¨
Indicate by check mark whether the registrant is a shell company (as defined in Rule 12b-2 of the Act). Yes
¨
No
x
The aggregate market value of the voting stock (Common Stock) held by non-affiliates of the registrant as of the close of business on
June 29, 2018
was approximately $
2,798,420,456
based on the closing price of the Common Stock on the New York Stock Exchange on that date. The registrant does not have any non-voting common equity.
The registrant had outstanding
51,354,856
shares of common stock as of
February 20, 2019
.
Documents Incorporated by Reference
Portions of the registrant’s definitive proxy statement to be delivered to stockholders in connection with the Annual Meeting of Stockholders to be held May 3, 2019 are incorporated by reference into Part III.
Barnes Group Inc.
Index to Form 10-K
Year Ended
December 31, 2018
|
|
|
Page
|
|
Part I
|
||
|
Item 1.
|
||
|
Item 1A.
|
||
|
Item 1B.
|
||
|
Item 2.
|
||
|
Item 3.
|
||
|
Item 4.
|
||
|
Part II
|
||
|
Item 5.
|
||
|
Item 6.
|
||
|
Item 7.
|
||
|
Item 7A.
|
||
|
Item 8.
|
||
|
Item 9.
|
||
|
Item 9A.
|
||
|
Item 9B.
|
||
|
Part III
|
||
|
Item 10.
|
||
|
Items 11-14.
|
||
|
Part IV
|
||
|
Item 15.
|
||
|
Item 16.
|
|
|
FORWARD-LOOKING STATEMENTS
This Annual Report may contain forward-looking statements as defined in the Private Securities Litigation Reform Act of 1995. Forward-looking statements often address our expected future operating and financial performance and financial condition, and often contain words such as "anticipate," "believe," "expect," "plan," "estimate," "project," and similar terms. These forward-looking statements do not constitute guarantees of future performance and are subject to a variety of risks and uncertainties that may cause actual results to differ materially from those expressed in the forward-looking statements. These include, among others: difficulty maintaining relationships with employees, including unionized employees, customers, distributors, suppliers, business partners or governmental entities; failure to successfully negotiate collective bargaining agreements or potential strikes, work stoppages or other similar events; difficulties leveraging market opportunities; changes in market demand for our products and services; rapid technological and market change; the ability to protect and avoid infringing upon intellectual property rights; introduction or development of new products or transfer of work; higher risks in global operations and markets; the impact of intense competition; acts of terrorism, cybersecurity attacks or intrusions that could adversely impact our businesses; uncertainties relating to conditions in financial markets; currency fluctuations and foreign currency exposure; future financial performance of the industries or customers that we serve; our dependence upon revenues and earnings from a small number of significant customers; a major loss of customers; inability to realize expected sales or profits from existing backlog due to a range of factors, including changes in customer sourcing decisions, material changes, production schedules and volumes of specific programs; the impact of government budget and funding decisions, including any potential adverse effects associated with a U.S. government shutdown; the impact of new or revised tax laws and regulations;
changes in raw material or product prices and availability; integration of acquired businesses; restructuring costs or savings; the continuing impact of prior acquisitions and divestitures, including the ongoing impact of the acquisition of Gimatic S.r.l., including integration efforts; and any other future strategic actions, including acquisitions, divestitures, restructurings, or strategic business realignments, and our ability to achieve the financial and operational targets set in connection with any such actions; the outcome of pending and future legal, governmental, or regulatory proceedings and contingencies and uninsured claims; product liabilities; future repurchases of common stock; future levels of indebtedness; and numerous other matters of a global, regional or national scale, including those of a political, economic, business, competitive, environmental, regulatory and public health nature; government tariffs, trade agreements and trade policies; and other risks and uncertainties described in this Annual Report. The Company assumes no obligation to update its forward-looking statements.
PART I
Item 1. Business
BARNES GROUP INC.
(1)
Barnes Group Inc. (the “Company”) is a global provider of highly engineered products, differentiated industrial technologies, and innovative solutions, serving a wide range of end markets and customers. Its specialized products and services are used in far-reaching applications including aerospace, transportation, manufacturing, automation, healthcare, and packaging. The Company’s skilled and dedicated employees around the globe are committed to the highest performance standards and achieving consistent, sustainable profitable growth.
Our Strategy
The Company’s strategy outlines the actions that we are executing to achieve our vision. Our strategy is comprised of four pillars:
|
1.
|
Build a World-class Company Focused on High Margin, High Growth Businesses
- We pro-actively manage our business portfolio with a focus on multiple platforms and market channels, in end-markets where projected long-term growth and favorable macro-economic trends are present. By doing so, we expect to create superior value for our key stakeholders - our shareholders, customers, employees and the communities in which we operate.
|
|
2.
|
Leverage the Barnes Enterprise System (“BES”) as a Significant Competitive Advantage
- BES is our integrated operating system that promotes a culture of employee engagement and empowerment and drives alignment across the organization around a common vision. BES standardizes our business processes to allow us to achieve commercial, operational and financial excellence in everything we do.
|
|
3.
|
Expand and Protect Our Core Intellectual Property to Deliver Differentiated Solutions
- Driven by a passion for innovation, we embrace intellectual property as a core differentiator to create proprietary products, processes and systems. Through our Global Innovation Forum, we foster an environment that generates great ideas and shares best practices across the enterprise to maximize our collective strengths and create economies of scale in the development and commercialization of new and innovative products and services.
|
|
4.
|
Effectively Allocate Capital to Drive Top Quartile Total Shareholder Return
- We strive to be good custodians of our shareholders’ capital and to drive maximum shareholder value. We do so by investing in our core businesses to fund profitable, organic growth and by employing a disciplined capital allocation process in the strategic acquisitions we undertake.
|
Structure
The Company operates under two global business segments: Industrial and Aerospace. The Industrial Segment includes the Molding Solutions, Force & Motion Control, Automation and Engineered Components business units. The Aerospace segment includes the original equipment manufacturing (“OEM”) business and the aftermarket business, which includes maintenance repair and overhaul (“MRO”) services and the manufacture and delivery of aerospace aftermarket spare parts.
In the fourth quarter of 2018, the Company completed its acquisition of Gimatic S.r.l. ("Gimatic"). Gimatic designs and develops robotic grippers, advanced end-of-arm tooling systems, sensors and other automation components. Gimatic operates in end markets that include automotive, packaging, healthcare and food and beverage. Headquartered in Brescia, Italy, Gimatic has a sales network extending across Europe, North America and Asia. Gimatic results have been included within the Industrial segment's operating profit. See Note 2 of the Consolidated Financial Statements.
__________
|
(1)
|
As used in this annual report, “Company,” “Barnes Group,” “we” and “ours” refer to the registrant and its consolidated subsidiaries except where the context requires otherwise, and “Industrial” and “Aerospace” refer to the registrant’s segments, not to separate corporate entities.
|
1
In the third quarter of 2018, the Company completed its acquisition of the customized gas spring business of Industrial Gas Springs ("IGS"), a recognized designer, manufacturer and supplier of customized gas springs. IGS is headquartered in the United Kingdom, with distribution and assembly capabilities in the United States. Its diversified end markets include general industrial, transportation, aerospace, and medical, among others. IGS results have been included within the Industrial segment's operating profit. See Note 2 of the Consolidated Financial Statements.
In the second quarter of 2017, the Company completed its acquisition of the assets of the Gammaflux L.P. business ("Gammaflux"), a leading supplier of hot runner temperature and sequential valve gate control systems to the plastics industry. Gammaflux, which is headquartered in Sterling, Virginia and has offices in Illinois and Germany, provides temperature control solutions for injection molding, extrusion, blow molding, thermoforming, and other applications. Its end markets include packaging, electronics, automotive, household products, medical, and tool building. Gammaflux results have been included within the Industrial segment's operating profit. See Note 2 of the Consolidated Financial Statements.
In the third quarter of 2016, the Company, through three of its subsidiaries, completed its acquisition of the molds business of Adval Tech Holding AG and Adval Tech Holdings (Asia) Pte. Ltd. ("FOBOHA"). FOBOHA is headquartered in Haslach, Germany and operates out of manufacturing facilities located in Germany and China. FOBOHA specializes in the development and manufacture of complex plastic injection molds for packaging, medical, consumer and automotive applications. FOBOHA results have been included within the Industrial segment's operating profit. See Note 2 of the Consolidated Financial Statements.
INDUSTRIAL
The Industrial segment is a global provider of highly-engineered, high-quality precision components, products and systems for critical applications serving a diverse customer base in end-markets such as transportation, industrial equipment, automation, personal care, packaging, electronics, and medical devices. Focused on innovative custom solutions, Industrial participates in the design phase of components and assemblies whereby customers receive the benefits of application and systems engineering, new product development, testing and evaluation, and the manufacturing of final products. Products are sold primarily through its direct sales force and global distribution channels. Industrial's Molding Solutions business designs and manufactures customized hot runner systems, advanced mold cavity sensors and process control systems, and precision high cavitation mold assemblies - collectively, the enabling technologies for many complex injection molding applications. The Force & Motion Control business provides innovative cost effective force and motion control solutions for a wide range of metal forming and other industrial markets. The Automation business designs and develops robotic grippers, advanced end-of-arm tooling systems, sensors and other automation components for intelligent robotic handling solutions and industrial automation applications. See “Part II - Item 7 - Management's Discussion and Analysis of Financial Condition and Results of Operations - Business Transformation” for additional information related to Company's branding of the Force & Motion Control and Automation businesses. Industrial's Engineered Components business manufactures and supplies precision mechanical products used in transportation and industrial applications, including mechanical springs, high-precision punched and fine-blanked components and retention rings.
Industrial competes with a broad base of large and small companies engaged in the manufacture and sale of engineered products, precision molds, hot runner systems, robotic handling solutions and precision components. Industrial competes on the basis of quality, service, reliability of supply, engineering and technical capability, geographic reach, product breadth, innovation, design and price. Industrial has a global presence in multiple countries, with manufacturing, distribution and assembly operations in the United States, China, Germany, Italy, Sweden and Switzerland, among others. Industrial also has sales and service operations in the United States, China/Hong Kong, Germany, Italy and Switzerland, among others. For additional information regarding net sales by geographic area, refer to Note 20 of the Consolidated Financial Statements. Sales by Industrial to its
three
largest customers accounted for approximately
10%
of its sales in
2018
.
AEROSPACE
Aerospace is a global manufacturer of complex fabricated and precision machined components and assemblies for turbine engines, nacelles and structures for both commercial and military aircraft. The Aerospace aftermarket business provides aircraft engine component MRO services, including services performed under our Component Repair Programs (“CRPs”), for many of the world’s major turbine engine manufacturers, commercial airlines and the military. The Aerospace aftermarket activities also include the manufacture and delivery of aerospace aftermarket spare parts, including revenue sharing programs (“RSPs”) under which the Company receives an exclusive right to supply designated aftermarket parts over the life of specific aircraft engine programs.
2
Aerospace’s OEM business supplements the leading aircraft engine OEM, nacelles, and structure capabilities and competes with a large number of fabrication and machining companies. Competition is based mainly on value derived from intellectual property and trade secrets, quality, concurrent engineering and technical capability, product breadth, solutions providing new product introduction, timeliness, service and price. Aerospace’s fabrication and machining operations, with facilities in Arizona, Connecticut, Mexico, Michigan, Ohio, Utah and Singapore, produce critical engine, nacelle and airframe components through technologically advanced manufacturing processes.
The Aerospace aftermarket business supplements jet engine OEMs’ maintenance, repair and overhaul capabilities, and competes with the service centers of major commercial airlines and other independent service companies for the repair and overhaul of turbine engine components. The manufacture and supply of aerospace aftermarket spare parts, including those related to the RSPs, are dependent upon the reliable and timely delivery of high-quality components. Aerospace’s aftermarket facilities, located in Connecticut, Ohio, Singapore and Malaysia, specialize in the repair and refurbishment of highly engineered components and assemblies such as cases, rotating life limited parts, rotating air seals, turbine shrouds, vanes and honeycomb air seals. Sales by Aerospace to its three largest customers, General Electric, Rolls-Royce and United Technologies Corporation, accounted for approximately
54%
,
15%
and
9%
of its sales in
2018
, respectively. Sales to its next
three
largest customers in
2018
collectively accounted for approximately
7%
of its total sales.
FINANCIAL INFORMATION
The backlog of the Company’s orders believed to be firm at the end of
2018
was $
1,169 million
as compared with $
1,039 million
at the end of
2017
. Of the
2018
year-end backlog, $
858 million
was attributable to Aerospace and $
311 million
was attributable to Industrial. Approximately
59%
of the Company's consolidated year-end backlog is scheduled to be shipped during
2019
. The remainder of the Company’s backlog is scheduled to be shipped after
2019
.
We have a global manufacturing footprint and a technical service network to service our worldwide customer base. The global economies have a significant impact on the financial results of the business as we have significant operations outside of the United States. For a summary of net sales, operating profit and long-lived assets by reportable business segment, as well as net sales by product and services, geographic area and end markets, see Notes 3 and 20 of the Consolidated Financial Statements. For a discussion of risks attendant to the global nature of our operations and assets, see Item 1A. Risk Factors.
RAW MATERIALS
The principal raw materials used to manufacture our products are various grades and forms of steel, from rolled steel bars, plates and sheets, to high-grade valve steel wires and sheets, various grades and forms (bars, sheets, forgings, castings and powders) of stainless steels, aluminum alloys, titanium alloys, copper alloys, graphite, and iron-based, nickel-based (Inconels) and cobalt-based (Hastelloys) superalloys for complex aerospace applications. Prices for steel, titanium, Inconel, Hastelloys, as well as other specialty materials, have periodically increased due to higher demand and, in some cases, reduction of the availability of materials. If this occurs, the availability of certain raw materials used by us or in products sold by us may be negatively impacted.
RESEARCH AND DEVELOPMENT
We conduct research and development activities in our effort to provide a continuous flow of innovative new products, processes and services to our customers. We also focus on continuing efforts aimed at discovering and implementing new knowledge that significantly improves existing products and services, and developing new applications for existing products and services. Our product development strategy is driven by product design teams and collaboration with our customers, particularly within Industrial’s Molding Solutions and Automation businesses, as well as within our Aerospace and our other Industrial businesses. Many of the products manufactured by us are custom parts made to customers’ specifications. Investments in research and development are important to our long-term growth, enabling us to stay ahead of changing customer and marketplace needs. We spent approximately $
16
million, $
15
million and $
13
million in
2018
,
2017
and
2016
, respectively, on research and development activities.
PATENTS AND TRADEMARKS
Patents and other proprietary rights, including trade secrets and unpatented know-how, are critical to certain of our business units. We are party to certain licenses of intellectual property and hold numerous patents, trademarks, and trade names that enhance our competitive position. The Company does not believe, however, that any of these licenses, patents, trademarks or trade names is individually significant to the Company or either of our segments. We maintain procedures to protect our
3
intellectual property (including trade secrets, patents and trademarks). Risk factors associated with our intellectual property are discussed in Item 1A. Risk Factors.
EXECUTIVE OFFICERS OF THE COMPANY
For information regarding the Executive Officers of the Company, see Part III, Item 10 of this Annual Report.
ENVIRONMENTAL
Compliance with federal, state, and local laws, as well as those of other countries, which have been enacted or adopted regulating the discharge of materials into the environment or otherwise relating to the protection of the environment has not had a material effect, and is not expected to have a material effect, upon our capital expenditures, earnings, or competitive position.
Our past and present business operations and past and present ownership and operations of real property and the use, sale, storage and handling of chemicals and hazardous products subject us to extensive and changing U.S. federal, state and local environmental laws and regulations, as well as those of other countries, pertaining to the discharge of materials into the environment, enforcement, disposition of wastes (including hazardous wastes), the use, shipping, labeling, and storage of chemicals and hazardous materials, building requirements or otherwise relating to protection of the environment. We have experienced, and expect to continue to experience, costs to comply with environmental laws and regulations. In addition, new laws and regulations, stricter enforcement of existing laws and regulations, the discovery of previously unknown contamination or the imposition of new clean-up requirements could require us to incur costs or become subject to new or increased liabilities that could have a material adverse effect on our business, financial condition, results of operations and cash flows.
We use and generate hazardous substances and wastes in our operations. In addition, many of our current and former properties are or have been used for industrial purposes. Accordingly, we monitor hazardous waste management and applicable environmental permitting and reporting for compliance with applicable laws at our locations in the ordinary course of our business. We may be subject to potential material liabilities relating to any investigation and clean-up of our locations or properties where we delivered hazardous waste for handling or disposal that may be contaminated or which may have been contaminated prior to our purchase, and to claims alleging personal injury.
AVAILABLE INFORMATION
Our Internet address is
www.BGInc.com
. Our annual report on Form 10-K, quarterly reports on Form 10-Q, current reports on Form 8-K, and amendments to those reports are available without charge on our website as soon as reasonably practicable after they are filed with, or furnished to, the U.S. Securities and Exchange Commission ("SEC"). In addition, we have posted on our website, and will make available in print to any stockholder who makes a request, our Corporate Governance Guidelines, our Code of Business Ethics and Conduct, and the charters of the Audit Committee, Compensation and Management Development Committee and Corporate Governance Committee (the responsibilities of which include serving as the nominating committee) of the Company’s Board of Directors. References to our website addressed in this Annual Report are provided as a convenience and do not constitute, and should not be viewed as, an incorporation by reference of the information contained on, or available through, the website. Therefore, such information should not be considered part of this Annual Report.
Item 1A. Risk Factors
Our business, financial condition or results of operations could be materially adversely affected by any of the following risks. Please note that additional risks not presently known to us may also materially impact our business and operations.
RISKS RELATED TO OUR BUSINESS
We depend on revenues and earnings from a small number of significant customers. Any bankruptcy of or loss of or, cancellation, reduction or delay in purchases by these customers could harm our business.
In
2018
, our net sales to General Electric and its subsidiaries accounted for
18%
of our total sales and approximately
54%
of Aerospace's net sales. Aerospace's second and third largest customers, Rolls-Royce and United Technologies Corporation and their respective subsidiaries, accounted for
15%
and
9%
, respectively, of Aerospace's net sales in
2018
. Approximately
7%
of Aerospace's net sales in
2018
were to its next
three
largest customers. Approximately
10%
of Industrial's sales in
2018
were to its
three
largest customers. Some of our success will depend on the business strength and viability of those customers. We cannot assure you that we will be able to retain our largest customers. Some of our customers may in the future reduce their purchases due to
4
economic conditions or shift their purchases from us to our competitors, in-house or to other sources. Some of our long-term sales agreements provide that until a firm order is placed by a customer for a particular product, the customer may unilaterally reduce or discontinue its projected purchases without penalty, or terminate for convenience. The loss of one or more of our largest customers, any reduction, cancellation or delay in sales to these customers (including a reduction in aftermarket volume in our RSPs), our inability to successfully develop relationships with new customers, or future price concessions we make to retain customers could significantly reduce our sales and profitability.
The global nature of our business exposes us to foreign currency fluctuations that may affect our future revenues, debt levels and profitability.
We have manufacturing facilities and technical service centers, and sales and distribution centers around the world, and the majority of our foreign operations use the local currency as their functional currency. These include, among others, the Brazilian real, British pound sterling, Canadian dollar, Czech koruna, Chinese renminbi, Euro, Japanese yen, Korean won, Malaysian ringgit, Mexican peso, Singaporean dollar, Swedish krona, Swiss franc and Thai baht. Since our financial statements are denominated in U.S. dollars, changes in currency exchange rates between the U.S. dollar and other currencies expose us to translation risk when the local currency financial statements are translated to U.S. dollars. Changes in currency exchange rates may also expose us to transaction risk. We may buy hedges in certain currencies to reduce or offset our exposure to currency exchange rate fluctuations; however, these transactions may not be adequate or effective to protect us against unfavorable exchange rate fluctuations. We have not engaged in any speculative hedging activities. Currency fluctuations may adversely impact our revenues and profitability in the future.
Our operations depend on our manufacturing, sales, and service facilities and information systems in various parts of the world which are subject to physical, financial, regulatory, environmental, operational and other risks that could disrupt our operations.
We have a significant number of manufacturing facilities, technical service centers, and sales and distribution centers both within and outside the U.S. The global scope of our business subjects us to increased risks and uncertainties such as threats of war, terrorism and instability of governments; and economic, regulatory and legal systems in countries in which we or our customers conduct business.
Our customers' and suppliers' facilities, as well as our own facilities, are located in areas that may be affected by natural disasters, including earthquakes, windstorms and floods, which could cause significant damage and disruption to the operations of those facilities and, in turn, could have a material adverse effect on our business, financial condition, results of operations and cash flows. Additionally, some of our manufacturing equipment and tooling is custom-made and is not readily replaceable. Loss of such equipment or tooling could have a negative impact on our manufacturing business, financial condition, results of operations and cash flows.
Although we have obtained property damage and business interruption insurance, a major catastrophe such as an earthquake, windstorm, flood or other natural disaster at any of our sites, or significant labor strikes, work stoppages, political unrest, or any of the events described above, in any of the areas where we conduct operations could result in a prolonged interruption of our business. Any disruption resulting from these events could cause significant delays in the manufacture or shipment of products or the provision of repair and other services that may result in our loss of sales and customers. Our insurance will not cover all potential risks, and we cannot assure you that we will have adequate insurance to compensate us for all losses that result from any insured risks. Any material loss not covered by insurance could have a material adverse effect on our financial condition, results of operations and cash flows. We cannot assure you that insurance will be available in the future at a cost acceptable to us or at a cost that will not have a material adverse effect on our profitability, net income and cash flows.
The global nature of our operations and assets subjects us to financial and regulatory risks in the countries in which we and our customers, suppliers and other business counterparties operate.
We have operations and assets in various parts of the world. In addition, we sell or may in the future sell our products and services to the U.S. and foreign governments and in foreign countries. As a global business, we are subject to complex laws, regulations and other conditions in the U.S. and other countries in which we operate, and associated risks, including: U.S. imposed embargoes of sales to specific countries; foreign import controls (which may be arbitrarily imposed or enforced); import regulations and duties; export regulations (which require us to comply with stringent licensing regimes); reporting requirements regarding the use of "conflict" minerals mined from certain countries; anti-dumping regulations; price and currency controls; exchange rate fluctuations; dividend remittance restrictions; expropriation of assets; war, civil uprisings and riots; government instability; government-imposed economic uncertainties, such as a prolonged U.S. federal government shutdown; government contracting requirements including cost accounting standards, including various procurement, security, and audit requirements, as well as requirements to certify to the government compliance with these requirements; the necessity of obtaining governmental approval for new and continuing products and operations; and legal systems or decrees, laws, taxes, regulations, interpretations and court decisions that are not always fully developed and that may be retroactively or arbitrarily applied. We have experienced inadvertent violations of some of these regulations, including export regulations, safety and environmental regulations, and regulations prohibiting sales of certain products, in the past, none of which has had or, we believe, will have a
5
material adverse effect on our business. However, any significant violations of these or other regulations in the future could result in civil or criminal sanctions, and the loss of export or other licenses which could have a material adverse effect on our business. We are subject to state unclaimed property laws in the ordinary course of business, and are currently undergoing a multi-state unclaimed property audit, the timing and outcome of which cannot be specifically predicted, and we may incur significant professional fees in conjunction with the audit. We may also be subject to unanticipated income taxes, excise duties, import taxes, export taxes, value added taxes, or other governmental assessments, and taxes may be impacted by changes in legislation in the tax jurisdictions in which we operate. In addition, our organizational and capital structure may limit our ability to transfer funds between countries without incurring adverse tax consequences. Any of these events could result in a loss of business or other unexpected costs that could reduce sales or profits and have a material adverse effect on our financial condition, results of operations and cash flows.
Our results could be impacted by changes in tariffs, trade agreements or other trade restrictions imposed or
agreed to by the U.S. or foreign governments
. Under the current presidential administration, the U.S. government has
indicated its intent to alter its approach to international trade policy and in some cases to renegotiate, or potentially
terminate, certain existing bilateral or multi-lateral trade agreements and treaties with foreign countries, including the North
American Free Trade Agreement (“NAFTA”). For example, on September 30, 2018, the U.S., Mexico, and Canada
reached a preliminary U.S.-Mexico-Canada Agreement (“USMCA”) which, if finalized and approved by relevant
governmental bodies in each participating country, would replace NAFTA. In addition, the U.S. government has recently
imposed certain tariffs and is considering imposing further tariffs on certain foreign goods, including steel. Meanwhile,
certain foreign governments, including the government of the People’s Republic of China, have imposed or are considering
imposing tariffs on certain U.S. goods. It remains unclear what the U.S. federal government or foreign governments will or
will not do in the future with respect to tariffs, NAFTA or other international trade agreements and policies. An escalating
trade war or other governmental action related to tariffs or international trade agreements or policies has the potential to
adversely impact demand for our products, our costs, customers, suppliers and/or the U.S. or foreign economies or certain
sectors thereof in which we compete and, thus, to adversely impact our businesses, financial condition, results of operations
and cash flows.
Any disruption or failure in the operation of our information systems, including from conversions or integrations of information technology or reporting systems, could have a material adverse effect on our business, financial condition, results of operations and cash flows.
Our information technology ("IT") systems are an integral part of our business. We depend upon our IT systems to help communicate internally and externally, process orders, manage inventory, make payments and collect accounts receivable. Our IT systems also allow us to purchase, sell and ship products efficiently and on a timely basis, to maintain cost-effective operations, and to help provide superior service to our customers. We are currently in the process of implementing enterprise resource planning ("ERP") platforms across certain of our businesses, and we expect that we will need to continue to improve and further integrate our IT systems, on an ongoing basis in order to effectively run our business. If we fail to successfully manage and integrate our IT systems, including these ERP platforms, it could adversely affect our business or operating results.
Increased cybersecurity requirements, vulnerabilities, threats and more sophisticated and targeted computer crime could pose a risk to our systems, networks, products, data and services and have a material adverse effect on our business, financial condition, results of operations and cash flows.
In the ordinary course of our business, we store sensitive data, including intellectual property, our proprietary business information and that of our customers, suppliers and business partners, and personally identifiable information of our employees, in our data centers and on our networks. The secure maintenance and transmission of this information is critical to our business operations. Despite our security measures, our information technology and infrastructure may be vulnerable to attacks by hackers or breached due to employee error, malfeasance or other disruptions. Any such breach could compromise our networks and the information stored there could be accessed, publicly disclosed, lost or stolen. Any such access, disclosure or other loss of information could result in legal claims or proceedings, liability under laws that protect the privacy of personal information, and regulatory penalties, disrupt our operations, and damage our reputation, which could adversely affect our business, revenues and competitive position. For instance, the European Union General Data Protection Regulation (the “GDPR”), which took effect in May 2018, among other things, mandates new requirements regarding the handling of personal data of employees and customers, including its use, protection and the ability of persons whose data is stored to correct or delete such data about themselves. If we fail to comply with these laws or regulations, we could be subject to significant litigation, monetary damages, regulatory enforcement actions or fines in one or more jurisdictions. A failure to comply with the GDPR could potentially result in fines up to the greater of €20 million or 4% of annual global revenues.
We have significant indebtedness that could affect our operations and financial condition, and our failure to meet certain financial covenants required by our debt agreements may materially and adversely affect our assets, financial position and cash flows.
At
December 31, 2018
, we had consolidated debt obligations of
$944.0
million, representing
6
approximately
44%
of our total capital (indebtedness plus stockholders’ equity) as of that date. Our level of indebtedness, proportion of variable rate debt obligations and the significant debt servicing costs associated with that indebtedness may adversely affect our operations and financial condition. For example, our indebtedness could require us to dedicate a substantial portion of our cash flows from operations to payments on our debt, thereby reducing the amount of our cash flows available for working capital, capital expenditures, investments in technology and research and development, acquisitions, dividends and other general corporate purposes; limit our flexibility in planning for, or reacting to, changes in the industries in which we compete; place us at a competitive disadvantage compared to our competitors, some of whom have lower debt service obligations and greater financial resources than we do; limit our ability to borrow additional funds; or increase our vulnerability to general adverse economic and industry conditions. In addition, a majority of our debt arrangements require us to maintain certain debt and interest coverage ratios and limit our ability to incur debt, make investments or undertake certain other business activities. These requirements could limit our ability to obtain future financing and may prevent us from taking advantage of attractive business opportunities. Our ability to meet the financial covenants or requirements in our debt arrangements may be affected by events beyond our control, and we cannot assure you that we will satisfy such covenants and requirements. A breach of these covenants or our inability to comply with the restrictions could result in an event of default under our debt arrangements which, in turn, could result in an event of default under the terms of our other indebtedness. Upon the occurrence of an event of default under our debt arrangements, after the expiration of any grace periods, our lenders could elect to declare all amounts outstanding under our debt arrangements, together with accrued interest, to be immediately due and payable. If this were to happen, we cannot assure you that our assets would be sufficient to repay in full the payments due under those arrangements or our other indebtedness or that we could find alternative financing to replace that indebtedness.
Conditions in the worldwide credit markets may limit our ability to expand our credit lines beyond current bank commitments. In addition, our profitability may be adversely affected as a result of increases in interest rates. At
December 31, 2018
, we and our subsidiaries had
$944.0
million aggregate principal amount of consolidated debt obligations outstanding, of which approximately
78%
had interest rates that float with the market (not hedged against interest rate fluctuations). A 100 basis point increase in the interest rate on the floating rate debt in effect at
December 31, 2018
would result in an approximate
$7.3 million
annualized increase in interest expense.
Changes in the availability or price of materials, products and energy resources could adversely affect our costs and profitability.
We may be adversely affected by the availability or price of raw materials, products and energy resources, particularly related to certain manufacturing operations that utilize steel, stainless steel, titanium, Inconel, Hastelloys and other specialty materials. The availability and price of raw materials and energy resources may be subject to curtailment or change due to, among other things, new laws or regulations, global economic or political events including strikes, terrorist attacks and war, suppliers’ allocations to other purchasers, interruptions in production by suppliers, changes in exchange rates and prevailing price levels. In some instances there are limited sources for raw materials and a limited number of primary suppliers for some of our products for resale. Although we are not dependent upon any single source for any of our principal raw materials or products for resale, and such materials and products have, historically, been readily available, we cannot assure you that such raw materials and products will continue to be readily available. Disruption in the supply of raw materials, products or energy resources or our inability to come to favorable agreements with our suppliers could impair our ability to manufacture, sell and deliver our products and require us to pay higher prices. Any increase in prices for such raw materials, products or energy resources could materially adversely affect our costs and our profitability.
We maintain pension and other postretirement benefit plans in the U.S. and certain international locations.
Our costs of providing defined benefit plans are dependent upon a number of factors, such as the rates of return on the plans’ assets, interest rates, exchange rate fluctuations, future governmental regulation, global fixed income and equity prices, and our required and/or voluntary contributions to the plans. Declines in the stock market, prevailing interest rates, declines in discount rates, improvements in mortality rates and rising medical costs may cause an increase in our pension and other postretirement benefit expenses in the future and result in reductions in our pension fund asset values and increases in our pension and other postretirement benefit obligations. These changes have caused and may continue to cause a significant reduction in our net worth and without sustained growth in the pension investments over time to increase the value of the plans’ assets, and depending upon the other factors listed above, we could be required to increase funding for some or all of these pension and postretirement plans.
We carry significant inventories and a loss in net realizable value could cause a decline in our net worth.
At
December 31, 2018
, our inventories totaled $
266.0 million
. Inventories are valued at the lower of cost or net realizable value based on management's judgments and estimates concerning future sales levels, quantities and prices at which such inventories will be sold in the normal course of business. Accelerating the disposal process or changes in estimates of future sales potential may necessitate future reduction to inventory values. See “Part II - Item 7 - Management's Discussion and Analysis of Financial Condition and Results of Operations - Critical Accounting Policies”.
7
We have significant goodwill and an impairment of our goodwill could cause a decline in our net worth.
Our total assets include substantial goodwill. At
December 31, 2018
, our goodwill totaled
$955.5
million. The goodwill results from our prior acquisitions, representing the excess of the purchase price we paid over the net assets of the companies acquired. We assess whether there has been an impairment in the value of our goodwill during each calendar year or sooner if triggering events warrant. If future operating performance at one or more of our reporting units does not meet expectations or fair values fall due to significant stock market declines, we may be required to reflect a non-cash charge to operating results for goodwill impairment. The recognition of an impairment of a significant portion of goodwill would negatively affect our results of operations and total capitalization, the effect of which could be material. See “Part II - Item 7 - Management's Discussion and Analysis of Financial Condition and Results of Operations - Critical Accounting Policies”.
We may not realize all of the sales expected from our existing backlog or anticipated orders
. At
December 31, 2018
, we had $
1,169.2 million
of order backlog, the majority of which related to aerospace OEM customers. There can be no assurances that the revenues projected in our backlog will be realized or, if realized, will result in profits. We consider backlog to be firm customer orders for future delivery. OEM customers may provide projections of components and assemblies that they anticipate purchasing in the future under existing programs. These projections may represent orders that are beyond lead time and are included in backlog when supported by a long term agreement. Our customers may have the right under certain circumstances or with certain penalties or consequences to terminate, reduce or defer firm orders that we have in backlog. If our customers terminate, reduce or defer firm orders, we may be protected from certain costs and losses, but our sales will nevertheless be adversely affected. Although we strive to maintain ongoing relationships with our customers, there is an ongoing risk that orders may be canceled or rescheduled due to fluctuations in our customers’ business needs or purchasing budgets.
Also, our realization of sales from new and existing programs is inherently subject to a number of important risks and uncertainties, including whether our customers execute the launch of product programs on time, or at all, the number of units that our customers actually produce, the timing of production and manufacturing insourcing decisions made by our customers. In addition, until firm orders are placed, our customers may have the right to discontinue a program or replace us with another supplier at any time without penalty. Our failure to realize sales from new and existing programs could have a material adverse effect on our net sales, results of operations and cash flows.
We may not recover all of our up-front costs related to new or existing programs.
New programs may require significant up-front investments for capital equipment, engineering, inventory, design and tooling. As OEMs in the transportation and aerospace industries have looked to suppliers to bear increasing responsibility for the design, engineering and manufacture of systems and components, they have increasingly shifted the financial risk associated with those responsibilities to the suppliers as well. This trend may continue and is most evident in the area of engineering cost reimbursement. We cannot assure you that we will have adequate funds to make such up-front investments or to recover such costs from our customers as part of our product pricing. In the event that we are unable to make such investments, or to recover them through sales or direct reimbursement from our customers, our profitability, liquidity and cash flows may be adversely affected. In addition, we incur costs and make capital expenditures for new program awards based upon certain estimates of production volumes and production complexity. While we attempt to recover such costs and capital expenditures by appropriately pricing our products, the prices of our products are based in part upon planned production volumes. If the actual production is significantly less than planned or significantly more complex than anticipated, we may be unable to recover such costs. In addition, because a significant portion of our overall costs is fixed, declines in our customers’ production levels can adversely affect the level of our reported profits even if our up-front investments are recovered.
We may not realize all of the intangible assets related to the Aerospace aftermarket businesses.
We participate in aftermarket Revenue Sharing Programs ("RSPs") under which we receive an exclusive right to supply designated aftermarket parts over the life of the related aircraft engine program to our customer, General Electric ("GE"). As consideration, we pay participation fees, which are recorded as intangible assets and are recognized as a reduction of sales over the estimated life of the related engine programs. Our total investments in participation fees under our RSPs as of
December 31, 2018
equaled
$299.5
million, all of which have been paid. At
December 31, 2018
, the remaining unamortized balance of these participation fees was
$177.5
million.
We entered into Component Repair Programs ("CRPs"), also with GE, during 2015, 2014 and 2013. The CRPs provide for, among other items, the right to sell certain aftermarket component repair services for CFM56, CF6, CF34 and LM engines directly to other customers over the life of the aircraft engine program as one of a few GE licensed suppliers. In addition, the CRPs extended certain contracts under which the Company currently provides these services directly to GE. Our total investments in CRPs as of
December 31, 2018
equaled
$111.8
million, all of which have been paid. At
December 31, 2018
, the remaining unamortized balance the CRPs was
$89.9
million. We recorded the CRP payments as intangible assets which are recognized as a reduction of sales over the remaining useful life of these engine programs.
8
The realizability of each asset is dependent upon future revenues related to the programs' aftermarket parts and services and is subject to impairment testing if circumstances indicate that its carrying amount may not be recoverable. The potential exists that actual revenues will not meet expectations due to a change in market conditions, including, for example, the replacement of older engines with new, more fuel-efficient engines or our ability to maintain market share within the aftermarket business. A shortfall in future revenues may result in the failure to realize the net amount of the investments, which could adversely affect our financial condition and results of operations. In addition, profitability could be impacted by the amortization of the participation fees and licenses, and the expiration of the international tax incentives on these programs. See “Part II - Item 7 - Management's Discussion and Analysis of Financial Condition and Results of Operations - Critical Accounting Policies”.
We face risks of cost overruns and losses on fixed-price contracts.
We sell certain of our products under firm, fixed-price contracts providing for a fixed price for the products regardless of the production or purchase costs incurred by us. The cost of producing products may be adversely affected by increases in the cost of labor, materials, fuel, outside processing, overhead and other factors, including manufacturing inefficiencies. Increased production costs may result in cost overruns and losses on contracts.
The departure of existing management and key personnel, a shortage of skilled employees or a lack of qualified sales professionals could materially affect our business, operations and prospects.
Our executive officers are important to the management and direction of our business. Our future success depends, in large part, on our ability to retain or replace these officers and other key management personnel. Although we believe we will be able to attract and retain talented personnel and replace key personnel should the need arise, our inability to do so could have a material adverse effect on our business, financial condition, results of operations or cash flows. Because of the complex nature of many of our products and services, we are generally dependent on an educated and highly skilled workforce, including, for example, our engineering talent. In addition, there are significant costs associated with the hiring and training of sales professionals. We could be adversely affected by a shortage of available skilled employees or the loss of a significant number of our sales professionals.
If we are unable to protect our intellectual property rights effectively or if we are accused of infringing the
intellectual parties rights of third parties, our financial condition and results of operations could be adversely affected.
We own or are licensed under various intellectual property rights, including patents, trademarks and trade secrets. Our intellectual property rights may not be sufficiently broad or otherwise may not provide us a significant competitive advantage, and patents may not be issued for pending or future patent applications owned by or licensed to us. In addition, the steps that we have taken to maintain and protect our intellectual property may not prevent it from being improperly disclosed, challenged, invalidated, circumvented or designed-around, particularly in countries where intellectual property rights are not highly developed or protected. In some circumstances, enforcement may not be available to us because an infringer has a dominant intellectual property position or for other business reasons, or countries may require compulsory licensing of our intellectual property. We also rely on nondisclosure and noncompetition agreements with employees, consultants and other parties to protect, in part, confidential information, trade secrets and other proprietary rights. There can be no assurance that these agreements will adequately protect these intangible assets and will not be breached, that we will have adequate remedies for any breach, or that others will not independently develop substantially equivalent proprietary information. Our failure to obtain or maintain intellectual property rights that convey competitive advantage, adequately protect our intellectual property or detect or prevent circumvention or unauthorized use of such property and the cost of enforcing our intellectual property rights could adversely impact our competitive position, financial condition and results of operations. In addition, we may be the target of enforcement actions by third parties, including aggressive and opportunistic patent enforcement claims by non-practicing entities (so-called “patent trolls”). Regardless of the merit of such claims, responding to and defending against infringement claims can be expensive and time-consuming. If the Company is found to infringe any third-party rights, we could be required to pay substantial damages or we could be enjoined from offering some of our products and services.
Any product liability, warranty, contractual or other claims in excess of insurance may adversely affect our financial condition.
Our operations expose us to potential product liability risks that are inherent in the design, manufacture and sale of our products and the products we buy from third parties and sell to our customers, or to potential warranty, contractual or other claims. For example, we may be exposed to potential liability for personal injury, property damage or death as a result of the failure of an aircraft component designed, manufactured or sold by us, or the failure of an aircraft component that has been serviced by us or of the components themselves. While we have liability insurance for certain risks, our insurance may not cover all liabilities, including potential reputational impacts. Additionally, insurance coverage may not be available in the future at a cost acceptable to us. Any material liability not covered by insurance or for which third-party indemnification is not available for the full amount of the loss could have a material adverse effect on our financial condition, results of operations and cash flows.
9
From time to time, we receive product warranty claims, under which we may be required to bear costs of inspection, repair or replacement of certain of our products. Warranty claims may range from individual customer claims to full recalls of all products in the field. We vigorously defend ourselves in connection with these matters. We cannot, however, assure you that the costs, charges and liabilities associated with these matters will not be material, or that those costs, charges and liabilities will not exceed any amounts reserved for them in our Consolidated Financial Statements.
Our business, financial condition, results of operations and cash flows could be adversely impacted by strikes or work stoppages.
Approximately
17%
of our U.S. employees are covered by collective bargaining agreements and more than
46%
of our non-U.S. employees are covered by collective bargaining agreements, trade union agreements, or national industry agreements. The Company has a national collective bargaining agreement (“CBA”) with certain unionized employees at the Bristol, Connecticut and Corry, Pennsylvania facilities of the Associated Spring business unit, covering approximately
300
employees. The current CBA will expire in August 2020, at which time we expect to negotiate a successor agreement. The local CBA for the Corry, Pennsylvania facility of the Associated Spring business unit will expire on May 31, 2019, at which time we expect to negotiate a successor agreement. We also have annual negotiations in Brazil and Mexico and, collectively, these negotiations cover approximately
300
employees in those two countries. We also completed negotiations resulting in wage adjustments at eight locations in our Industrial Segment, collectively, covering a total of approximately
1,400
employees.
Although we believe that our relations with our employees are good, we cannot assure you that we will be successful in negotiating new CBAs or that such negotiations will not result in significant increases in the cost of labor, including healthcare, pensions or other benefits. Any potential strikes or work stoppages, and the resulting adverse impact on our relationships with customers, could have a material adverse effect on our business, financial condition, results of operations or cash flows. Similarly, a protracted strike or work stoppage at any of our major customers, suppliers or other vendors could materially adversely affect our business.
Changes in taxation requirements could affect our financial results.
Our products are subject to import and excise duties and/or sales or value-added taxes in many jurisdictions in which we operate. Increases in indirect taxes could affect our products’ affordability and therefore reduce our sales. We are also subject to income tax in numerous jurisdictions in which we generate revenues. Changes in tax laws, tax rates or tax rulings may have a significant adverse impact on our effective tax rate. Among other things, our tax liabilities are affected by the mix of pretax income or loss among the tax jurisdictions in which we operate and the potential repatriation of foreign earnings to the U.S. Further, during the ordinary course of business, we are subject to examination by the various tax authorities of the jurisdictions in which we operate which could result in an unanticipated increase in taxes. On December 22, 2017, the U.S. government enacted comprehensive tax legislation commonly referred to as the Tax Cuts and Jobs Act (the “Act”). The Act made broad and complex changes to the U.S. Tax Code that affected 2017, 2018 and future years, including a reduction of the corporate income tax rate, changes to the taxation of foreign unrepatriated earnings, limitations on deduction of interest and compensation expense and the introduction of the global intangible low-taxed income taxes. The changes may impact current and deferred income tax expense and deferred tax balances for U.S operations as well as the potential future repatriation of foreign income. The Company has made final entries for income tax expense in the Consolidated Financial Statements as of December 31, 2018. The impact of any proposed regulations related to the Act may adversely affect our financial condition, results of operations and cash flow. See “Part II- Management’s Discussion and Analysis of Financial Condition and Results of Operations- U.S. Tax Reform”.
Changes in accounting guidance could affect our financial results.
New accounting guidance that may become applicable to us from time to time, or changes in the interpretations of existing guidance, could have a significant effect on our reported results for the affected periods. Adoption of new accounting guidance could have a material impact on our financial statements and may retroactively affect the accounting treatment of transactions completed before adoption. See Note 1 of the Consolidated Financial Statements.
RISKS RELATED TO THE INDUSTRIES IN WHICH WE OPERATE
We operate in highly competitive markets. We may not be able to compete effectively with our competitors, and competitive pressures could adversely affect our business, financial condition and results of operations.
Our two global business segments compete with a number of larger and smaller companies in the markets we serve. Some of our competitors have greater financial, production, research and development, or other resources than we do. Within Aerospace, certain of our OEM customers compete with our repair and overhaul business. Some of our OEM customers in the aerospace industry also compete with us where they have the ability to manufacture the components and assemblies that we supply to them but have chosen, for capacity limitations, cost considerations or other reasons, to outsource the manufacturing to us. Our customers award business based on, among other things, price, quality, reliability of supply, service, technology and design. Our competitors’ efforts to grow market share could exert downward pressure on our product pricing and margins. Our competitors may also develop products or services, or methods of delivering those products or services that are superior to our products,
10
services or methods. Our competitors may adapt more quickly than us to new technologies or evolving customer requirements. We cannot assure you that we will be able to compete successfully with our existing or future competitors. Our ability to compete successfully will depend, in part, on our ability to continue make investments to innovate and manufacture the types of products demanded by our customers, and to reduce costs by such means as reducing excess capacity, leveraging global purchasing, improving productivity, eliminating redundancies and increasing production in low-cost countries. We have invested, and expect to continue to invest, in increasing our manufacturing footprint in low-cost countries. We cannot assure you that we will have sufficient resources to continue to make such investments or that we will be successful in maintaining our competitive position. If we are unable to differentiate our products or maintain a low-cost footprint, we may lose market share or be forced to reduce prices, thereby lowering our margins. Any such occurrences could adversely affect our financial condition, results of operations and cash flows.
The industries in which we operate have been experiencing consolidation, both in our suppliers and the customers we serve. Supplier consolidation is in part attributable to OEMs more frequently awarding long-term sole source or preferred supplier contracts to the most capable suppliers in an effort to reduce the total number of suppliers from whom components and systems are purchased. If consolidation of our existing competitors occurs, we would expect the competitive pressures we face to increase, and we cannot assure you that our business, financial condition, results of operations or cash flows will not be adversely impacted as a result of consolidation by our competitors or customers.
Original equipment manufacturers in the aerospace and transportation industries have significant pricing leverage over suppliers and may be able to achieve price reductions over time. Additionally, we may not be successful in our efforts to raise prices on our customers.
There is substantial and continuing pressure from OEMs in the transportation industries, including automotive and aerospace, to reduce the prices they pay to suppliers. We attempt to manage such downward pricing pressure, while trying to preserve our business relationships with our customers, by seeking to reduce our production costs through various measures, including purchasing raw materials and components at lower prices and implementing cost-effective process improvements. Our suppliers have periodically resisted, and in the future may resist, pressure to lower their prices and may seek to impose price increases. If we are unable to offset OEM price reductions, our profitability and cash flows could be adversely affected. In addition, OEMs have substantial leverage in setting purchasing and payment terms, including the terms of accelerated payment programs under which payments are made prior to the account due date in return for an early payment discount. OEMs can unexpectedly change their purchasing policies or payment practices, which could have a negative impact on our short-term working capital.
Demand for our defense-related products depends on government spending.
A portion of Aerospace's sales is derived from the military market, including single-sourced and dual-sourced sales. The military market is largely dependent upon government budgets and is subject to governmental appropriations. Although multi-year contracts may be authorized in connection with major procurements, funds are generally appropriated on a fiscal year basis even though a program may be expected to continue for several years. Consequently, programs are often only partially funded and additional funds are committed only as further appropriations are made. We cannot assure you that maintenance of or increases in defense spending will be allocated to programs that would benefit our business. Moreover, we cannot assure you that new military aircraft programs in which we participate will enter full-scale production as expected. A decrease in levels of defense spending or the government’s termination of, or failure to fully fund, one or more of the contracts for the programs in which we participate could have a material adverse effect on our financial position and results of operations.
The aerospace industry is highly regulated. Complications related to aerospace regulations may adversely affect the Company.
A substantial portion of our income is derived from our aerospace businesses. The aerospace industry is highly regulated in the U.S. by the Federal Aviation Administration, or FAA, and in other countries by similar regulatory agencies. We must be certified by these agencies and, in some cases, by individual OEMs in order to engineer and service systems and components used in specific aircraft models. If material authorizations or approvals were delayed, revoked or suspended, our business could be adversely affected. New or more stringent governmental regulations may be adopted, or industry oversight heightened, in the future, and we may incur significant expenses to comply with any new regulations or any heightened industry oversight.
Fluctuations in jet fuel and other energy prices may impact our operating results.
Fuel costs constitute a significant portion of operating expenses for companies in the aerospace industry. Fluctuations in fuel costs could impact levels and frequency of aircraft maintenance and overhaul activities, and airlines' decisions on maintaining, deferring or canceling new aircraft purchases, in part based on the value associated with new fuel efficient technologies. Widespread disruption to oil production, refinery operations and pipeline capacity in certain areas of the U.S. can impact the price of jet fuel significantly. Conflicts in the Middle East, an important source of oil for the U.S. and other countries where we do business, cause prices for fuel to be volatile. Because we and many of our customers are in the aerospace industry, these fluctuations could have a material adverse effect on our financial condition or results of operations.
11
Our products and services may be rendered obsolete by new products, technologies and processes.
Our manufacturing operations focus on highly engineered components which require extensive engineering and research and development time. Our competitive advantage may be adversely impacted if we cannot continue to introduce new products ahead of our competition, or if our products are rendered obsolete by other products or by new, different technologies and processes. The success of our new products will depend on a number of factors, including innovation, customer acceptance, the efficiency of our suppliers in providing materials and component parts, and the performance and quality of our products relative to those of our competitors. We cannot predict the level of market acceptance or the amount of market share our new products will achieve. Additionally, we may face increased or unexpected costs associated with new product introduction, including the use of additional resources such as personnel and capital. We cannot assure that we will not experience new product introduction delays in the future.
RISKS RELATED TO RESTRUCTURING, ACQUISITIONS, JOINT VENTURES AND DIVESTITURES
Our restructuring actions could have long-term adverse effects on our business.
From time to time, we have implemented restructuring activities across our businesses to adjust our cost structure, and we may engage in similar restructuring activities in the future. We may not achieve expected cost savings from workforce reductions or restructuring activities and actual charges, costs and adjustments due to these actions may vary materially from our estimates. Our ability to realize anticipated cost savings, synergies and revenue enhancements may be affected by a number of factors, including the following: our ability to effectively eliminate duplicative back office overhead and overlapping sales personnel, rationalize manufacturing capacity, synchronize information technology systems, consolidate warehousing and other facilities and shift production to more economical facilities; significant cash and non-cash integration and implementation costs or charges in order to achieve those cost savings, which could offset any such savings and other synergies resulting from our acquisitions or divestitures; and our ability to avoid labor disruption in connection with these activities. In addition, delays in implementing planned restructuring activities or other productivity improvements may diminish the expected operational or financial benefits. See Note 9 of the Consolidated Financial Statements.
Our acquisition and other strategic initiatives may not be successful.
We have made a number of acquisitions in the past, including most recently the acquisitions of the Gimatic and IGS businesses, and we anticipate that we may, from time to time, acquire additional businesses, assets or securities of companies, and enter into joint ventures and other strategic relationships that we believe would provide a strategic fit with our businesses. These activities expose the Company to a number of risks and uncertainties, the occurrence of any of which could materially adversely affect our business, cash flows, financial condition and results of operations. A portion of the industries that we serve are mature industries. As a result, our future growth may depend in part on the successful acquisition and integration of acquired businesses into our existing operations. We may not be able to identify and successfully negotiate suitable acquisitions, obtain financing for future acquisitions on satisfactory terms, obtain regulatory approvals or otherwise complete acquisitions in the future.
We could have difficulties integrating acquired businesses with our existing operations. Difficulties of integration can include coordinating and consolidating separate systems, integrating the management of the acquired business, retaining market acceptance of acquired products and services, maintaining employee morale and retaining key employees, and implementing our enterprise resource planning systems and operational procedures and disciplines. Any such difficulties may make it more difficult to maintain relationships with employees, customers, business partners and suppliers. In addition, even if integration is successful, the financial performance of acquired business may not be as expected and there can be no assurance we will realize anticipated benefits from our acquisitions. We cannot assure you that we will effectively assimilate the business or product offerings of acquired companies into our business or product offerings or realize anticipated operational synergies. In connection with the integration of acquired operations or the conduct of our overall business strategies, we may periodically restructure our businesses and/or sell assets or portions of our business. Integrating the operations and personnel of acquired companies into our existing operations may result in difficulties, significant expense and accounting charges, disrupt our business or divert management’s time and attention.
Acquisitions involve numerous other risks, including potential exposure to unknown liabilities of acquired companies and the possible loss of key employees and customers of the acquired business. Certain of the acquisition agreements by which we have acquired businesses require the former owners to indemnify us against certain liabilities related to the business operations before we acquired it. However, the liability of the former owners is limited and certain former owners may be unable to meet their indemnification responsibilities. We cannot assure you that these indemnification provisions will protect us fully or at all, and as a result we may face unexpected liabilities that adversely affect our financial condition. In connection with acquisitions or joint venture investments outside the U.S., we may enter into derivative contracts to purchase foreign currency in order to hedge against the risk of foreign currency fluctuations in connection with such acquisitions or joint venture investments, which subjects us to the risk of foreign currency fluctuations associated with such derivative contracts. Additionally, our final
12
determinations and appraisals of the fair value of assets acquired and liabilities assumed in our acquisitions may vary materially from earlier estimates. We cannot assure you that the fair value of acquired businesses will remain constant.
We continually assess the strategic fit of our existing businesses and may divest or otherwise dispose of businesses that are deemed not to fit with our strategic plan or are not achieving the desired return on investment, and we cannot be certain that our business, operating results and financial condition will not be materially and adversely affected.
A successful divestiture depends on various factors, including our ability to effectively transfer liabilities, contracts, facilities and employees to any purchaser, identify and separate the intellectual property to be divested from the intellectual property that we wish to retain, reduce fixed costs previously associated with the divested assets or business, and collect the proceeds from any divestitures. In addition, if customers of the divested business do not receive the same level of service from the new owners, this may adversely affect our other businesses to the extent that these customers also purchase other products offered by us. All of these efforts require varying levels of management resources, which may divert our attention from other business operations. If we do not realize the expected benefits or synergies of any divestiture transaction, our consolidated financial position, results of operations and cash flows could be negatively impacted. In addition, divestitures of businesses involve a number of risks, including significant costs and expenses, the loss of customer relationships, and a decrease in revenues and earnings associated with the divested business. Furthermore, divestitures potentially involve significant post-closing separation activities, which could involve the expenditure of material financial resources and significant employee resources. Any divestiture may result in a dilutive impact to our future earnings if we are unable to offset the dilutive impact from the loss of revenue associated with the divestiture, as well as significant write-offs, including those related to goodwill and other intangible assets, which could have a material adverse effect on our results of operations and financial condition.
Item 1B. Unresolved Staff Comments
None.
Item 2. Properties
|
Number of Facilities - Owned
|
||||||||
|
Location
|
Industrial
|
Aerospace
|
Other
|
Total
|
||||
|
Manufacturing:
|
||||||||
|
North America
|
5
|
5
|
0
|
10
|
||||
|
Europe
|
10
|
0
|
0
|
10
|
||||
|
Asia
|
1
|
0
|
0
|
1
|
||||
|
Central and Latin America
|
2
|
0
|
0
|
2
|
||||
|
18
|
5
|
0
|
23
|
|||||
|
Non-Manufacturing:
|
||||||||
|
North America
|
0
|
0
|
1*
|
1
|
||||
|
Europe
|
2
|
0
|
0
|
2
|
||||
|
2
|
0
|
1
|
3
|
|||||
*
The Company's Corporate office
13
|
Number of Facilities - Leased
|
||||||||
|
Location
|
Industrial
|
Aerospace
|
Other
|
Total
|
||||
|
Manufacturing:
|
||||||||
|
North America
|
4
|
6
|
0
|
10
|
||||
|
Europe
|
4
|
0
|
0
|
4
|
||||
|
Asia
|
4
|
5
|
0
|
9
|
||||
|
12
|
11
|
0
|
23
|
|||||
|
Non-Manufacturing:
|
||||||||
|
North America
|
8
|
1
|
1**
|
10
|
||||
|
Europe
|
26
|
1
|
0
|
27
|
||||
|
Asia
|
24
|
0
|
0
|
24
|
||||
|
Central and Latin America
|
3
|
0
|
0
|
3
|
||||
|
61
|
2
|
1
|
64
|
|||||
**
Industrial Segment headquarters and certain Shared Services groups.
14
Item 3. Legal Proceedings
We are subject to litigation from time to time in the ordinary course of business and various other suits, proceedings and claims are pending involving us and our subsidiaries. While it is not possible to determine the ultimate disposition of each of these proceedings and whether they will be resolved consistent with our beliefs, we expect that the outcome of such proceedings, individually or in the aggregate, will not have a material adverse effect on our financial condition or results of operations.
Item 4. Mine Safety Disclosures
Not applicable.
15
PART II
Item 5. Market for Registrant’s Common Equity, Related Stockholder Matters and Issuer Purchases of Equity Securities
|
(a)
|
Market Information
|
The Company’s common stock is traded on the New York Stock Exchange under the symbol “B”. The following table sets forth, for the periods indicated, the low and high sales intra-day trading price per share, as reported by the New York Stock Exchange, and dividends declared and paid.
|
|
2018
|
|||||||||||
|
|
Low
|
High
|
Dividends
|
|||||||||
|
Quarter ended March 31
|
$
|
57.93
|
|
$
|
69.41
|
|
$
|
0.14
|
|
|||
|
Quarter ended June 30
|
52.42
|
|
63.79
|
|
0.16
|
|
||||||
|
Quarter ended September 30
|
58.09
|
|
72.70
|
|
0.16
|
|
||||||
|
Quarter ended December 31
|
49.06
|
|
71.84
|
|
0.16
|
|
||||||
|
|
2017
|
|||||||||||
|
|
Low
|
High
|
Dividends
|
|||||||||
|
Quarter ended March 31
|
$
|
45.47
|
|
$
|
51.97
|
|
$
|
0.13
|
|
|||
|
Quarter ended June 30
|
49.31
|
|
60.74
|
|
0.14
|
|
||||||
|
Quarter ended September 30
|
57.70
|
|
70.84
|
|
0.14
|
|
||||||
|
Quarter ended December 31
|
61.06
|
|
72.87
|
|
0.14
|
|
||||||
Stockholders
As of
February 19, 2019
, there were approximately
2,916
holders of record of the Company’s common stock.
Dividends
Payment of future dividends will depend upon the Company’s financial condition, results of operations and other factors deemed relevant by the Company’s Board of Directors, as well as any limitations resulting from financial covenants under the Company’s credit facilities or debt indentures. See the table above for dividend information for
2018
and
2017
.
Securities Authorized for Issuance Under Equity Compensation Plans
For information regarding Securities Authorized for Issuance Under Equity Compensation Plans, see Part III, Item 12 of this Annual Report.
16
Performance Graph
A stock performance graph based on cumulative total returns (price change plus reinvested dividends) for $100 invested the Company on December 31, 2013 is set forth below.
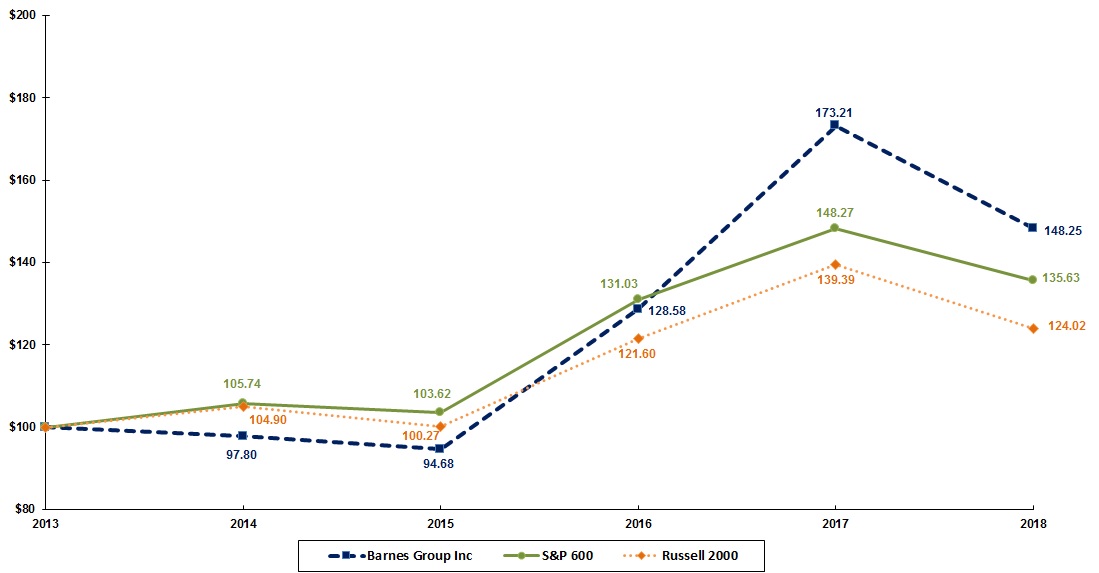
|
2013
|
2014
|
2015
|
2016
|
2017
|
2018
|
|||||||
|
BGI
|
$100.00
|
$97.80
|
$94.68
|
$128.58
|
$173.21
|
$148.25
|
||||||
|
S&P 600
|
$100.00
|
$105.74
|
$103.62
|
$131.03
|
$148.27
|
$135.63
|
||||||
|
Russell 2000
|
$100.00
|
$104.90
|
$100.27
|
$121.60
|
$139.39
|
$124.02
|
||||||
The performance graph includes the S&P 600 Small Cap Index and the Russell 2000 Index, both of which include the Company.
|
(c)
|
Issuer Purchases of Equity Securities
|
|
Period
|
Total Number
of Shares (or Units)
Purchased
|
|
Average Price
Paid Per Share
(or Unit)
|
Total Number of
Shares (or Units)
Purchased as Part of
Publicly Announced
Plans or Programs
|
Maximum Number of Shares (or Units) that May Yet Be Purchased Under the Plans or Programs
(2)
|
||||||||
|
October 1-31, 2018
|
1,992
|
|
$
|
69.55
|
|
—
|
|
1,479,806
|
|
||||
|
November 1-30, 2018
|
308
|
|
$
|
58.41
|
|
—
|
|
1,479,806
|
|
||||
|
December 1-31, 2018
|
1,656
|
|
$
|
53.69
|
|
—
|
|
1,479,806
|
|
||||
|
Total
|
3,956
|
|
(1)
|
$
|
62.05
|
|
—
|
|
|||||
|
(1)
|
All acquisitions of equity securities during the fourth quarter of
2018
were the result of the operation of the terms of the Company's stockholder-approved equity compensation plans and the terms of the equity rights granted pursuant to those plans to pay for the related income tax upon issuance of shares. The purchase price of a share of stock used for tax withholding is the market price on the date of issuance.
|
|
(2)
|
The program was publicly announced on October 20, 2011 (the "2011 Program") authorizing repurchase of up to 5.0 million shares of common stock. At December 31, 2015, 1.1 million shares of common stock had not been purchased under the 2011 Program. On February 10, 2016, the Board of Directors of the Company increased the number of shares authorized for repurchase under the 2011 Program by 3.9 million shares of common stock (5.0 million authorized, in total). The 2011 Program permits open market purchases, purchases under a Rule 10b5-1 trading plan and privately negotiated transactions.
|
17
Item 6. Selected Financial Data
|
2018
(5)(6)
|
2017
(7)(8)(9)
|
2016
(7)(10)
|
2015
(7)(11)
|
2014
(7)
|
|||||||||||||||
|
Per common share
(1)
|
|||||||||||||||||||
|
Income from continuing operations
|
|||||||||||||||||||
|
Basic
|
$
|
3.18
|
|
$
|
1.10
|
|
$
|
2.50
|
|
$
|
2.21
|
|
$
|
2.20
|
|
||||
|
Diluted
|
3.15
|
|
1.09
|
|
2.48
|
|
2.19
|
|
2.16
|
|
|||||||||
|
Net income
|
|||||||||||||||||||
|
Basic
|
3.18
|
|
1.10
|
|
2.50
|
|
2.21
|
|
2.16
|
|
|||||||||
|
Diluted
|
3.15
|
|
1.09
|
|
2.48
|
|
2.19
|
|
2.12
|
|
|||||||||
|
Dividends declared and paid
|
0.62
|
|
0.55
|
|
0.51
|
|
0.48
|
|
0.45
|
|
|||||||||
|
Stockholders’ equity (at year-end)
|
23.44
|
|
23.61
|
|
21.72
|
|
20.94
|
|
20.40
|
|
|||||||||
|
Stock price (at year-end)
|
53.62
|
|
63.27
|
|
47.42
|
|
35.39
|
|
37.01
|
|
|||||||||
|
For the year
(in thousands)
|
|||||||||||||||||||
|
Net sales
|
$
|
1,495,889
|
|
$
|
1,436,499
|
|
$
|
1,230,754
|
|
$
|
1,193,975
|
|
$
|
1,262,006
|
|
||||
|
Operating income
|
231,764
|
|
206,451
|
|
194,296
|
|
183,542
|
|
181,167
|
|
|||||||||
|
As a percent of net sales
|
15.5
|
%
|
14.4
|
%
|
15.8
|
%
|
15.4
|
%
|
14.4
|
%
|
|||||||||
|
Income from continuing operations
|
$
|
166,186
|
|
$
|
59,415
|
|
$
|
135,601
|
|
$
|
121,380
|
|
$
|
120,541
|
|
||||
|
As a percent of net sales
|
11.1
|
%
|
4.1
|
%
|
11.0
|
%
|
10.2
|
%
|
9.6
|
%
|
|||||||||
|
Net income
|
$
|
166,186
|
|
$
|
59,415
|
|
$
|
135,601
|
|
$
|
121,380
|
|
$
|
118,370
|
|
||||
|
As a percent of net sales
|
11.1
|
%
|
4.1
|
%
|
11.0
|
%
|
10.2
|
%
|
9.4
|
%
|
|||||||||
|
As a percent of average stockholders’ equity
(2)
|
13.5
|
%
|
4.7
|
%
|
11.6
|
%
|
10.7
|
%
|
10.3
|
%
|
|||||||||
|
Depreciation and amortization
|
$
|
94,238
|
|
$
|
90,150
|
|
$
|
80,154
|
|
$
|
78,242
|
|
$
|
81,395
|
|
||||
|
Capital expenditures
|
57,273
|
|
58,712
|
|
47,577
|
|
45,982
|
|
57,365
|
|
|||||||||
|
Weighted average common shares outstanding – basic
|
52,304
|
|
54,073
|
|
54,191
|
|
55,028
|
|
54,791
|
|
|||||||||
|
Weighted average common shares outstanding – diluted
|
52,832
|
|
54,605
|
|
54,631
|
|
55,513
|
|
55,723
|
|
|||||||||
|
Year-end financial position
(in thousands)
|
|||||||||||||||||||
|
Working capital
|
$
|
448,286
|
|
$
|
452,960
|
|
$
|
306,609
|
|
$
|
359,038
|
|
$
|
323,306
|
|
||||
|
Goodwill
|
955,524
|
|
690,223
|
|
633,436
|
|
587,992
|
|
594,949
|
|
|||||||||
|
Other intangible assets, net
|
636,538
|
|
507,042
|
|
522,258
|
|
528,322
|
|
554,694
|
|
|||||||||
|
Property, plant and equipment, net
|
370,531
|
|
359,298
|
|
334,489
|
|
308,856
|
|
299,435
|
|
|||||||||
|
Total assets
|
2,808,970
|
|
2,365,716
|
|
2,137,539
|
|
2,061,866
|
|
2,073,885
|
|
|||||||||
|
Long-term debt and notes payable
|
944,016
|
|
532,596
|
|
500,954
|
|
509,906
|
|
504,734
|
|
|||||||||
|
Stockholders’ equity
|
1,203,056
|
|
1,260,321
|
|
1,168,358
|
|
1,127,753
|
|
1,111,793
|
|
|||||||||
|
Debt as a percent of total capitalization
(3)
|
44.0
|
%
|
29.7
|
%
|
30.0
|
%
|
31.1
|
%
|
31.2
|
%
|
|||||||||
|
Statistics
|
|||||||||||||||||||
|
Employees at year-end
(4)
|
5,908
|
|
5,375
|
|
5,036
|
|
4,735
|
|
4,515
|
|
|||||||||
|
(1)
|
Income from continuing operations and net income per common share are based on the weighted average common shares outstanding during each year. Stockholders’ equity per common share is calculated based on actual common shares outstanding at the end of each year.
|
|
(2)
|
Average stockholders' equity is calculated based on the month-end stockholders equity balances between
December 31, 2017
and
December 31, 2018
(13-month average).
|
|
(3)
|
Debt includes all interest-bearing debt and total capitalization includes interest-bearing debt and stockholders’ equity.
|
|
(4)
|
The number of employees at each year-end includes employees of continuing operations and excludes prior employees of discontinued operations.
|
|
(5)
|
During 2018, the Company completed the acquisitions of IGS and Gimatic. The results of IGS and Gimatic, from their acquisitions on July 23, 2018 and October 31, 2018, respectively, have been included within the Company's Consolidated Financial Statements for the period ended December 31, 2018.
|
|
(6)
|
Effective January 1, 2018, the Company adopted amended guidance related to revenue recognition. See Notes 1 and 3 of the Consolidated Financial Statements.
|
|
(7)
|
During 2018, the Company adopted amended guidance relating to the presentation of pension and other postretirement benefit costs, requiring that other components of expense (other than service expense) be reported separately outside of operating income. The amended guidance was applied retrospectively for the presentation of the service cost component and the other components of net periodic benefit cost in the Consolidated Statements of Income during 2017, 2016, 2015 and 2014. See Note 1 of the Consolidated Financial Statements.
|
|
(8)
|
During 2017, the Company completed the acquisition of the assets of the Gammaflux business. The results of Gammaflux, from the acquisition on April 3, 2017, have been included within the Company's Consolidated Financial Statements for the period ended December 31, 2017.
|
|
(9)
|
During 2017, the Company recorded the effects of the U.S. Tax Reform, resulting in tax expense of $96.7 million, or $1.79 per basic share ($1.77 per diluted share). See Note 14 of the Consolidated Financial Statements.
|
|
(10)
|
During 2016, the Company completed the acquisition of FOBOHA. The results of FOBOHA, from the acquisition on August 31, 2016, have been included within the Company's Consolidated Financial Statements for the period ended December 31, 2016.
|
|
(11)
|
During 2015, the Company completed the acquisitions of Thermoplay and Priamus. The results of Thermoplay and Priamus, from their acquisitions on August 7, 2015 and October 1, 2015, respectively, have been included within the Company's Consolidated Financial Statements for the period ended December 31, 2015.
|
18
Item 7. Management’s Discussion and Analysis of Financial Condition and Results of Operations
The following discussion should be read in conjunction with our consolidated financial statements and related notes in this Annual Report on Form 10-K. In addition to historical information, this discussion contains forward-looking statements that involve risks, uncertainties, and assumptions that could cause actual results to differ materially from our expectations. Factors that could cause such differences include those described in the section titled “Risk Factors” and elsewhere in this report. We undertake no obligation to update any of the forward-looking statements.
OVERVIEW
Barnes Group Inc. (the "Company") achieved sales of
$1,495.9
million in
2018
, an increase of $
59.4
million, or
4.1%
, from
2017
. Organic sales (net sales excluding both foreign currency and acquisition impacts) increased by
$27.0 million
, or
1.9%
, including an increase of
$38.6 million
, or
8.3%
, at Aerospace, partially offset by a decrease of
$11.6 million
,
1.2%
, at Industrial. Sales in the Industrial segment were impacted by changes in foreign currency which increased sales by approximately $
14.2
million as the U.S. dollar weakened against foreign currencies. Within Industrial, acquisitions provided incremental sales of $
18.2
million during the 2018 period.
Operating income increased
12.3%
from
$206.5
million in
2017
to
$231.8
million in
2018
and operating margin increased from
14.4%
in
2017
to
15.5%
in
2018
. Operating income was impacted by increased leverage of organic sales growth within Aerospace, cost productivity improvements and the absence of 2017 restructuring costs, partially offset by scheduled price deflation at Aerospace. Acquisitions made during 2018 resulted in increased due diligence and acquisition transaction costs, in addition to short-term purchase accounting adjustments, impacting operating profit accordingly.
The Company focused on profitable sales growth both organically and through acquisition, in addition to productivity improvements, as key strategic objectives in
2018
. Management continued its focus on cash flow and working capital management in
2018
and generated
$237.2
million in cash flow from operations.
Business Transformation
Acquisitions and strategic relationships with our customers have been a key growth driver for the Company, and we continue to seek alliances which foster long-term business relationships. These acquisitions have allowed us to extend into new or adjacent markets, expand our geographic reach, and commercialize new products, processes and services. The Company continually evaluates its business portfolio to optimize product offerings and maximize value. We have significantly transformed our business with our entrance into the injection molding and automation markets.
The Company has completed a number of acquisitions in the past few years. In the fourth quarter of 2018, the Company completed its acquisition of Gimatic S.r.l. (“Gimatic”). Gimatic designs and develops robotic grippers, advanced end-of-arm tooling systems, sensors and other automation components. Headquartered in Brescia, Italy, Gimatic has a sales network extending across Europe, North America and Asia. Its diversified end markets include automotive, packaging, health care, and food and beverage, among others. The Company acquired Gimatic for an aggregate purchase price of
362.4 million
Euro (
$409.9 million
) which was financed using cash on hand and borrowings under the Company's revolving credit facility, including the utilization of funds made available through the accordion feature provided by the facility. See "Item 7 - Liquidity and Capital Resources" for additional information related to the financing of Gimatic. The purchase price includes preliminary adjustments under the terms of the Gimatic Sale and Purchase Agreement, including approximately
7.8 million
Euro (
$8.8 million
) related to cash acquired. In connection with the acquisition, the Company recorded
$158.8 million
of intangible assets and $
271.3 million
of goodwill. See Notes 2 and 6 to the Consolidated Financial Statements. The acquisition of Gimatic resulted in the Company's establishment of the Automation business unit, which will operate within the Industrial segment. The Automation business designs and develops robotic grippers, advanced end-of-arm tooling systems, sensors and other automation components for intelligent robotic handling solutions and industrial automation applications.
In the third quarter of 2018, the Company completed its acquisition of Industrial Gas Springs ("IGS"), a recognized designer, manufacturer and supplier of customized gas springs. IGS is headquartered in the United Kingdom, with distribution and assembly capabilities in the United States. Its diversified end markets include general industrial, transportation, aerospace, and medical, among others. The Company acquired IGS for an aggregate purchase price of 29.1 million British pound sterling ($38.0 million) which includes post closing adjustments under the terms of the Share Purchase Agreement, including 2.8 million British pound sterling ($3.7 million) related to cash acquired. The acquisition was financed using cash on hand and borrowings under the Company's revolving credit facility. In connection with the acquisition, the Company recorded
$14.1 million
of goodwill and
$15.3 million
of intangible assets. See Notes 2 and 6 to the Consolidated Financial Statements.
19
IGS was integrated with the Nitrogen Gas Products business ("NGP"), where its complementary and diversified end markets and strong customized product application engineering allow the Company to scale and broaden NGP’s technology portfolio and customer base. In a related move, the Company transferred its Associated Spring Raymond ("ASR") operations from Engineered Components to NGP. ASR provides expertise in engineering and customized solutions for motion control, pressure & vibration, and other applications. With these changes, and given the broader solutions focus of the combined business, the Company has renamed NGP the Force & Motion Control business (“FMC”). As such, FMC is a leader in the development of nitrogen gas springs, gas-hydraulic suspensions, customized gas springs, spring elements and precision custom struts, providing innovative force and motion control solutions to customers in a wide range of metal forming and other industrial markets.
In the second quarter of 2017, the Company completed its acquisition of the assets of the privately held Gammaflux L.P. business ("Gammaflux"), a leading supplier of hot runner temperature and sequential valve gate control systems to the plastics industry. Gammaflux, which is headquartered in Sterling, Virginia and has offices in Illinois and Germany, provides temperature control solutions for injection molding, extrusion, blow molding, thermoforming, and other applications. Its end markets include packaging, electronics, automotive, household products, medical, and tool building. The Company acquired the assets of Gammaflux for an aggregate purchase price of
$8.9
million, which was financed using cash on hand and borrowings under the Company's revolving credit facility. The purchase price includes adjustments under the terms of the Asset Purchase Agreement. In connection with the acquisition, the Company recorded
$1.5
million of goodwill and
$3.7
million of intangible assets. See Notes 2 and 6 to the Consolidated Financial Statements.
In the third quarter of 2016, the Company, through
three
of its subsidiaries (collectively, the “Purchaser”), completed its acquisition of the molds business of Adval Tech Holding AG and Adval Tech Holdings (Asia) Pte. Ltd. ("FOBOHA"). FOBOHA is headquartered in Haslach, Germany and currently operates out of two manufacturing facilities located in Germany and China. At the time of acquisition, FOBOHA also operated out of a manufacturing facility located in Switzerland; however, this location was consolidated and closed during 2017. See Note 9 to the Consolidated Financial Statements. FOBOHA specializes in the development and manufacture of complex plastic injection molds for packaging, medical, consumer and automotive applications. The Company acquired FOBOHA for an aggregate cash purchase price of CHF
137.9
million (
$140.2
million) which was financed using cash on hand and borrowings under the Company's revolving credit facility. The purchase price includes adjustments under the terms of the FOBOHA Share Purchase Agreement, including approximately CHF
11.3
million (
$11.5
million) related to cash acquired. In connection with the acquisition, the Company recorded
$39.8
million of intangible assets and
$75.6
million of goodwill. See Notes 2 and 6 to the Consolidated Financial Statements.
Management Objectives
Management is focused on continuing the Company's transformation by executing on its profitable growth strategy comprised of the following elements:
|
•
|
Build a world-class Company focused on high margin, high growth businesses
|
|
•
|
Leverage the Barnes Enterprise System ("BES") as a significant competitive advantage
|
|
•
|
Expand and protect our core intellectual property to deliver differentiated solutions
|
|
•
|
Effectively allocate capital to drive top quartile total shareholder returns.
|
The successful execution of this strategy requires making value enhancing investments in organic growth (new products, processes, systems, services, markets and customers) and strategic acquisitions. Management remains focused on a deeper deployment of BES across the Company to advance Commercial Excellence, Operational Excellence and Financial Excellence. In addition, we remain focused on optimizing two key strategic enablers that will strengthen our competitive position:
|
•
|
Cultivate a culture of innovation and build upon intellectual property to drive growth
|
|
•
|
Enhance our talent management system to recruit, develop and retain an engaged and empowered workforce.
|
The combined benefits from growth investment and execution of the strategic enablers is expected to generate long-term value for the Company's shareholders, customers and employees.
Our Business
The Company consists of two operating segments: Industrial and Aerospace.
20
Key Performance Indicators
Management evaluates the performance of its reportable segments based on the sales, operating profit, operating margins and cash generation of the respective businesses, which includes net sales, cost of sales, selling and administrative expenses and certain components of other income and other expenses, as well as the allocation of corporate overhead expenses. Each segment has standard key performance indicators (“KPIs”), a number of which are focused on employee safety-related metrics (total recordable incident rate and lost time incident rate), customer metrics (on-time-delivery and quality), internal effectiveness and productivity/efficiency metrics (sales effectiveness, global sourcing, operational excellence, functional excellence, cost of quality, and days working capital) and specific KPIs on profitable growth.
Key Industry Data
In both segments, management tracks a variety of economic and industry data as indicators of the health and outlook of a particular sector.
At Industrial, key data for the manufacturing operations include the Institute for Supply Management’s manufacturing
PMI Composite Index (and similar indices for European and Asian-based businesses); the Federal Reserve’s Industrial
Production Index ("the IPI"); IHS-Markit worldwide forecasts for light vehicle production, as well as new model introductions and existing model refreshes; North American medium and heavy duty vehicle production; IC Interconnection Consulting Hotrunners Worldwide Report for Auto, Medical, Personal Care and Packaging industries; and global GDP growth forecasts.
At Aerospace, management of the aftermarket business monitors the number of aircraft in the active fleet, the number of planes temporarily or permanently taken out of service, aircraft utilization rates for the major airlines, engine shop visits, airline profitability, aircraft fuel costs and traffic growth. The Aerospace OEM business regularly tracks orders, backlog and deliveries for each of the major aircraft manufacturers, as well as engine purchases made for new aircraft. Management also monitors annual appropriations for the U.S. military related to purchases of new or used aircraft and engine components.
RESULTS OF OPERATIONS
Sales
|
($ in millions)
|
2018
|
2017
|
$ Change
|
% Change
|
2016
|
||||||||||||||
|
Industrial
|
$
|
994.7
|
|
$
|
973.9
|
|
$
|
20.8
|
|
2.1
|
%
|
$
|
824.2
|
|
|||||
|
Aerospace
|
501.2
|
|
462.6
|
|
38.5
|
|
8.3
|
%
|
406.5
|
|
|||||||||
|
Total
|
$
|
1,495.9
|
|
$
|
1,436.5
|
|
$
|
59.4
|
|
4.1
|
%
|
$
|
1,230.8
|
|
|||||
2018
vs.
2017
:
The Company reported net sales of $
1,495.9
million in
2018
, an increase of
$59.4
million, or
4.1%
, from
2017
. Organic sales increased by
$27.0 million
, including an increase of
$38.6 million
at Aerospace, partially offset by a decrease of
$11.6 million
at Industrial. The increase at Aerospace was driven by sales growth across both the original equipment manufacturing ("OEM") business and the aftermarket businesses. Within the OEM business, increased sales were driven by continued growth on newer, more technologically advanced engine platforms. Sales within the aftermarket businesses also increased during the period. Within Industrial, decreased organic sales were primarily driven by a decrease within the Force & Motion Control and Engineered Components businesses, partially offset by increased sales volumes within the Molding Solutions business. Acquired businesses contributed incremental sales of $
18.2 million
during the
2018
period. The impact of foreign currency translation increased sales within Industrial by approximately $
14.2 million
as the U.S. dollar weakened against foreign currencies. Sales within Aerospace were not impacted by changes in foreign currency as these are largely denominated in U.S. dollars. The Company’s international sales increased
10.1%
year-over-year, while domestic sales decreased
3.7%
. Excluding the impact of foreign currency translation on sales, however, the Company's international sales in
2018
increased
8.4%
, inclusive of sales through acquisition, from
2017
.
2017
vs.
2016
:
The Company reported net sales of
$1,436.5 million
in 2017, an increase of $205.7 million, or 16.7%, from 2016. Acquired businesses contributed incremental sales of $56.3 million during the
2017
period. Organic sales within Industrial increased by $81.0 million, or 9.8% during 2017, driven primarily by continued strength in our Force & Motion Control and
21
Molding Solutions business units. Aerospace recorded sales of
$462.6 million
in
2017
, a $56.1 million, or 13.8% increase from 2016 as newer, more technologically advanced engine platforms increased volumes at the original equipment manufacturing business within Aerospace. Sales within the aftermarket businesses also improved throughout
2017
. The impact of foreign currency translation increased sales within Industrial by approximately $12.4 million as the U.S. dollar weakened against foreign currencies. Sales within Aerospace were not impacted by changes in foreign currency as these are largely denominated in U.S. dollars. The Company’s international sales increased 19.8% year-over-year, while domestic sales increased 13.0%, largely a result of Aerospace sales being primarily U.S. based. Excluding the impact of foreign currency translation on sales, however, the Company's international sales in
2017
increased 18.0%, inclusive of sales through acquisition, from
2016
.
Expenses and Operating Income
|
($ in millions)
|
2018
|
2017
|
$ Change
|
% Change
|
2016
|
||||||||||||||
|
Cost of sales
|
$
|
963.5
|
|
$
|
943.8
|
|
$
|
19.7
|
|
2.1
|
%
|
$
|
788.7
|
|
|||||
|
% sales
|
64.4
|
%
|
65.7
|
%
|
64.1
|
%
|
|||||||||||||
|
Gross profit
(1)
|
$
|
532.4
|
|
$
|
492.7
|
|
$
|
39.6
|
|
8.0
|
%
|
$
|
442.0
|
|
|||||
|
% sales
|
35.6
|
%
|
34.3
|
%
|
35.9
|
%
|
|||||||||||||
|
Selling and administrative expenses
|
$
|
300.6
|
|
$
|
286.3
|
|
$
|
14.3
|
|
5.0
|
%
|
$
|
247.7
|
|
|||||
|
% sales
|
20.1
|
%
|
19.9
|
%
|
20.1
|
%
|
|||||||||||||
|
Operating income
|
$
|
231.8
|
|
$
|
206.5
|
|
$
|
25.3
|
|
12.3
|
%
|
$
|
194.3
|
|
|||||
|
% sales
|
15.5
|
%
|
14.4
|
%
|
15.8
|
%
|
|||||||||||||
|
(1)
|
Sales less cost of sales
|
2018
vs.
2017
:
Cost of sales in
2018
increased
2.1%
from
2017
, while gross profit margin increased from
34.3%
in
2017
to
35.6%
in
2018
. Gross profit and gross margins improved at both Industrial and Aerospace. At Industrial, gross margin in
2018
benefited from improving cost productivity, driven by the absence of both the 2017 pre-tax restructuring charges of $7.5 million and the additional costs incurred on certain programs within Engineered Components. Incremental costs during the prior period included expedited freight, increased scrap and costs related to the transfer of work to other facilities. The 2018 period includes $5.6 million of short-term purchase accounting adjustments related to the acquisitions of Gimatic and IGS, whereas the 2017 period includes $2.3 million of short-term purchase accounting adjustments related to the acquisition of FOBOHA. Gross profit at Industrial also increased as a result of the items discussed above, partially offset, however, by the profit impact of lower sales volumes within certain business units. Within Aerospace, improvement in gross profit relates primarily to organic growth within each of the businesses and increased productivity, driven by improvements within production of the newer engine programs. These benefits to gross profit were partially offset by scheduled price deflation as certain newer engine programs transition into the early production stages. Increased volumes in the maintenance repair and overhaul and spare parts businesses, in particular, again contributed to the gross margin improvement during 2018. Selling and administrative expenses in
2018
increased
5.0%
from the
2017
period, due primarily to corresponding increases in sales volumes, Gimatic and IGS acquisition transaction costs of $2.4 million, the amortization of intangible assets related to the Gimatic and IGS, and increased due diligence costs related to the acquisition of Gimatic. The 2017 period also included integration costs related to the acquisition of FOBOHA. As a percentage of sales, selling and administrative costs increased slightly from
19.9%
in the
2017
period to
20.1%
in the
2018
period. Operating income in 2018 increased
12.3%
to
$231.8 million
from
2017
and operating income margin increased from
14.4%
to
15.5%
, driven primarily by the items noted above.
2017
vs.
2016
:
Cost of sales in 2017 increased 19.7% from 2016, while gross profit margin decreased from
35.9%
in 2016 to
34.3%
in 2017. Gross margins improved at Aerospace and declined at Industrial. Gross profit improved within both segments, driven primarily by organic growth within each of the business units. At Industrial, gross margins decreased during 2017 as a result of pre-tax restructuring charges of $7.5 million and lower productivity, primarily a result of additional costs incurred on certain programs at Engineered Components. Incremental costs include expedited freight, increased scrap and costs related to the transfer of work to other facilities. A lower margin contribution on acquisition sales also had an impact on the overall lower gross margins at Industrial. Gross profit at Industrial increased, however, driven by the profit impact of organic growth within our Molding Solutions and Force & Motion Control business units, partially offset by the additional costs at Engineered Components discussed above. Gross profits during both the 2017 and 2016 periods were negatively impacted by $2.3 million of short-term purchase accounting adjustments related to the acquisition of FOBOHA. Within Aerospace, improvement in gross profit relates primarily to organic growth within each of the businesses, combined with favorable productivity, partially offset
22
by scheduled price deflation and the absence of the $1.4 million gain related to the contract termination arbitration award in 2016. Increased volumes in the maintenance repair and overhaul and spare parts businesses, in particular, contributed to the gross margin improvement during 2017. Selling and administrative expenses in 2017 increased 15.6% from the 2016 period, due primarily to corresponding increases in sales volumes, incentive compensation and the amortization of intangible assets related to the acquisition of FOBOHA, partially offset by the absence of $3.0 million of costs related to a customer termination dispute and a $1.2 million reduction in transaction costs related to the acquisition of FOBOHA in 2016. As a percentage of sales, selling and administrative costs slightly decreased from
20.1%
in the 2016 period to
19.9%
in the 2017 period. Operating income in 2017 increased to
$206.5 million
from the 2016 period and operating income margin decreased from
15.8%
to
14.4%
.
Interest expense
2018
vs.
2017
:
Interest expense in
2018
increased
$2.3 million
to
$16.8 million
from
2017
, primarily as a result of increased borrowings during the period, partially offset by the impact of lower average interest rates.
2017
vs.
2016
:
Interest expense in
2017
increased $
2.7 million
to $
14.6 million
from
2016
, primarily as a result of higher average interest rates.
Other expense (income), net
2018
vs.
2017
:
Other expense (income), net in
2018
was $
7.4
million compared to $
(3.8)
million in
2017
. Other expense (income) in 2018 and 2017 included other components of pension expense (income) of $1.6 million and $
(3.8)
million, respectively. The $
(3.8)
million impact in the 2017 period was largely attributed to pension curtailment and settlement gains resulting from the June 2017 closure of the FOBOHA facility located in Muri, Switzerland. See Note 12 for details related to the other components of net periodic benefit cost and Note 9 for details related to the Closure. Note 1 provides discussion of the amended guidance related to the presentation of pension and other postretirement benefit costs. Foreign currency losses of $
3.9 million
in the
2018
period compared with gains of $
0.8 million
in the
2017
period.
2017
vs.
2016
:
Other expense (income), net in
2017
was $
(3.8) million
compared to $
(0.2) million
in
2016
. Other expense (income) in 2017 and 2016 included other components of pension expense (income) of $
(3.8)
million and $2.1 million, respectively. The $
(3.8)
million impact in the 2017 period was largely attributed to pension curtailment and settlement gains resulting from the June 2017 closure of the FOBOHA facility located in Muri, Switzerland. Foreign currency gains of $
0.8 million
in the
2017
period compared with gains of $
1.9 million
in the
2016
period. Interest income of $0.8 million in
2017
compared with interest income of $2.3 million during
2016
, with the decrease being primarily attributed to the $1.4 million of interest income that resulted from the Triumph arbitration in 2016.
Income Taxes
U.S. Tax Reform
On December 22, 2017 the U.S. government enacted comprehensive tax legislation commonly referred to as the Tax Cuts and Jobs Act (the “Act”). The Act made broad and complex changes to the U.S. Tax Code that affected 2017 and included, but were not limited to, requiring a one-time Transition Tax on certain unrepatriated earnings of foreign subsidiaries of the Company, which is payable over eight years, and exempted foreign dividends paid to the U.S. during the year from taxation if such earnings was included within the Transition Tax.
The Act also establishes new law that affects 2018 and beyond and included, but was not limited to, (1) a reduction of the U.S. Corporate income tax rate from 35% to 21%; (2) general elimination of U.S. federal income taxes on dividends from foreign subsidiaries; (3) a new limitation on the deduction of interest expense; (4) repeal of the domestic production activity deduction; (5) additional limitations on deduction of compensation for certain executives; (6) a new provision designed to tax global intangible low-taxed income (“GILTI”) which allows for the possibility of utilizing foreign tax credits (“FTCs”) and a
23
deduction up to 50% to offset the income tax liability (subject to certain limitations); (7) the introduction of the base erosion anti-abuse tax which represents a new minimum tax; (8) limitations on utilization of FTCs to reduce U.S. income tax liability; and (9) limitations on net operating losses (“NOLS”) generated after December 31, 2017 to 80% of taxable income.
The SEC issued Staff Accounting Bulletin 118 ("SAB 118") in December 2017, which provided guidance on accounting for the tax effects of the Act. SAB 118 provided a measurement period in which to finalize the accounting under Accounting Standards Codification 740,
Income Taxes
("ASC 740"). This measurement period was not permitted to extend beyond one year from the Act enactment date. In accordance with SAB 118, we were required to reflect the income tax effects of those aspects of the Act for which the accounting under ASC 740 was complete. To the extent that our accounting for certain income tax effects of the Act was incomplete but we were capable of reasonably estimating the effects, we were permitted to record a provisional amount in the Consolidated Financial Statements based on this estimate. All provisional adjustments relating to the Act were required to be made final as of December 22, 2018, one year following the enactment date of the Act.
The U.S Department of Treasury ("U.S. Treasury") issued certain Notices and proposed regulations ("interpretative guidance") in 2018 addressing the Transition Tax component of the Act. During the year, various states also issued guidance related to calculating state tax as a result of the Act as well as clarification and guidance as to state tax treatment of the Transition Tax. The Company has applied the impact of the interpretative guidance in computing its income tax expense for 2018. On January 15, 2019, the U.S. Treasury issued final regulations for Section 965 providing final guidance on the Transition Tax. The Company has analyzed the final regulations and has determined that they do not impact the computation of the Transition Tax completed and reported final by the Company as of December 31, 2018.
As part of our analysis of the impact of the Act, we recorded a one-time discrete tax expense of $99.2 million as of December 31, 2017. This amount primarily consisted of net expense related to the deemed repatriation Transition Tax of $86.7 million, combined with the impacts of reduced corporate income tax rates on our deferred tax assets of $4.2 million, state taxation on the earnings reported under the Transition Tax of $1.4 million and foreign income and withholding taxes of $6.9 million related to the repatriation of certain foreign earnings. Various adjustments were made throughout 2018 as the Company applied interpretive guidance issued by the U.S. Treasury, as discussed above. A reduction in tax expense of $2.6 million was recorded during 2018, for a final tax expense resulting from the Act of $96.6 million. As required pursuant to SAB 118, the tax effect of the Act is final as of December 22, 2018 (one year after Enactment), and was recorded as such as of December 31, 2018. Details of each component of the Tax is as follows:
|
•
|
Deemed Repatriation Transition Tax:
The Act taxes certain unrepatriated earnings and profits (“E&P”) of our foreign subsidiaries. In order to calculate the Transition Tax we determined, along with other information, the amount of our accumulated post 1986 E&P for our foreign subsidiaries, as well as the non-U.S. income tax paid by those subsidiaries on such E&P. We were capable of reasonably estimating the Transition Tax and recorded a provisional Transition Tax liability of $86.7 million as of December 31, 2017. The U.S. Treasury issued the interpretive guidance in 2018, which provided additional guidance to assist companies in calculating the one-time Transition Tax. The Company has completed the accounting and recorded a final Transition Tax of $86.9 million. The U.S. Treasury issued Final Regulations in January 2019, applicable prospectively, and the Company determined that the Regulations do not impact the final Transition Tax expense recorded.
|
|
•
|
Reduction of U.S. Federal Corporate tax rate:
The Act reduced the U.S. Corporate income tax rate from 35% to 21%, effective January 1, 2018. Our U.S. companies remained in a net deferred tax asset position as of December 31, 2017, and, as a result of the Corporate rate reduction, we originally reduced our deferred tax assets by $4.2 million, with a corresponding adjustment to net deferred tax expense for the year ended December 31, 2017. The Company filed the 2017 Federal Corporate Tax Return in October 2018 and claimed additional tax deductions subject to the 35% tax rate, which reduced the related tax expense from $4.2 million to $3.4 million.
|
|
•
|
State Taxation of unrepatriated earnings and profits
: As a result of the Transition Tax, the Company originally recorded income as if the earnings had been repatriated, also recognizing that income may be subject to additional taxation at the state level. We were able to reasonably estimate the state taxation of these earnings and recorded a provisional expense of $1.4 million as of December 31, 2017. Throughout 2018, various states issued guidance related to calculating the tax impacts of the Act, as well as clarifications describing how States would tax income arising from the application of provisions within the Act. As a result of the recent guidance, the Company reduced the tax expense related to the impact of the Act from $1.4 million to $0.6 million.
|
|
•
|
Indefinite Reinvestment Assertion:
Under accounting standards (ASC 740) a deferred tax liability is not recorded for the excess of the tax basis over the financial reporting (book) basis of an investment in a foreign subsidiary if the
|
24
indefinite reinvestment criteria is met. On December 31, 2018, the Company’s unremitted foreign earnings were approximately $1,397.1 million. Pursuant to SAB 118, if an entity had completed all or portions of its assessment and had made a decision to repatriate and had the ability to reasonably estimate the effects of that assessment, that entity should have recorded a provisional expense and disclose the status of its efforts. The Company recorded a provisional expense of $6.9 million in 2017 related to estimated tax to be incurred on future repatriation from foreign earnings. In 2018, the Company repatriated $62.4 million between certain foreign entities, thereby reducing the previously recorded deferred tax liability by $5.2 million, which was withholding tax expense incurred on the repatriation. In addition, the Company released $1.2 million as it no longer expects to incur tax expense given it no longer intends to repatriate those earnings upon which the tax would be due.
|
•
|
Valuation Allowances:
The Company was required to assess whether its valuation allowance analysis was affected by various components of the Act, including the deemed mandatory repatriation of foreign income for the Transition Tax, future GILTI inclusions and changes to the NOL and FTC rules. The Company determined that there was no requirement to adjust or create additional valuation allowances nor release existing valuation allowances as a result of the Act.
|
The Act created a new requirement, effective for 2018, that certain income (i.e. GILTI) earned by Controlled Foreign Corporations (“CFCs”) be included currently in the gross income of the Company. GILTI represents the excess of the shareholders “net CFC tested income” over the net deemed tangible income return, which is defined in the Act as the excess of (1) 10 percent of the aggregate of the U.S. shareholders' pro rata share of the qualified business assets of each CFC over (2) the amount of certain interest expense taken into account in the determination of the net CFC tested income. In September 2018, the U.S. Treasury issued Proposed Regulations addressing GILTI. The Company has applied the Proposed Regulations and has calculated a GILTI inclusion within 2018 taxable income in the U.S., which results in $2.5 million of tax expense during the period. The Company has made an accounting election to treat taxes due on U.S. inclusions in taxable income related to GILTI as a current period expense when incurred (the “period cost method”).
2018
vs.
2017
:
The Company's effective tax rate was
19.9%
in
2018
, compared with
69.6%
in 2017. The effective tax rate in 2017 was impacted by the Act. Excluding the impact of a one-time charge of $99.2 million of discrete tax expense related to the Act, partially offset by a benefit of $2.5 million on the prior year repatriation, the effective tax rate would have been 20.2% for the full year 2017. The slight decrease in the 2018 effective tax rate from the full year 2017 adjusted rate is primarily due to the final adjustments resulting from the impact of U.S. Tax Reform (see discussion above), an adjustment to certain international valuation reserves, the award of overseas tax holiday and an increase in the projected change in the mix of earnings attributable to lower-taxing jurisdictions. The decrease is partially offset due to new provisions within the Act that are designed to tax global intangible low-taxed income ("GILTI"), the absence of the adjustment of the Swiss valuation reserves, the absence of the settlement of tax audits and closure of tax years for various tax jurisdictions. During 2018, the Company repatriated $228.8 million, compared to $7.3 million in 2017. Pursuant to the Act, neither dividend was taxable in the U.S.
In 2019 the Company expects the effective tax rate to be between 23.5% and 24.5%, an increase from the 20% rate in 2018, primarily due to the absence of current year excess tax benefit on stock awards and the absence of the release of certain valuation allowances.
2017
vs.
2016
:
The Company’s effective tax rate was
69.6%
in
2017
compared with
25.7%
in
2016
. The increase in the
2017
effective tax rate is primarily due to taxes recorded as a result of U.S. Tax Reform. Excluding the impact of $99.2 million of discrete tax expense related to the Act, partially offset by a benefit of $2.5 million on the current year repatriation, the effective tax rate would have been 20.2% in 2017. The comparable decrease in the effective tax rate, excluding the impacts of the Act, are primarily due to the adjustment of the Swiss valuation reserves, the settlement of tax audits and closure of tax years for various tax jurisdictions and the change in the mix of earnings attributable to higher-taxing jurisdictions, partially offset by the expiration of certain tax holidays. During 2017, the Company repatriated a dividend from a portion of the current year foreign earnings to the U.S. in the amount of $7.3 million, compared to $8.3 million in 2016. Pursuant to the Act, this current year dividend is not taxable in the U.S.
See Note 14 of the Consolidated Financial Statements for a reconciliation of the U.S. federal statutory income tax rate to the consolidated effective income tax rate.
25
Income and Income Per Share
|
(in millions, except per share)
|
2018
|
2017
|
Change
|
% Change
|
2016
|
||||||||||||||
|
Net income
|
$
|
166.2
|
|
$
|
59.4
|
|
$
|
106.8
|
|
NM
|
|
$
|
135.6
|
|
|||||
|
Net income per common share:
|
|||||||||||||||||||
|
Basic
|
$
|
3.18
|
|
$
|
1.10
|
|
$
|
2.08
|
|
NM
|
|
$
|
2.50
|
|
|||||
|
Diluted
|
$
|
3.15
|
|
$
|
1.09
|
|
$
|
2.06
|
|
NM
|
|
$
|
2.48
|
|
|||||
|
Weighted average common shares outstanding:
|
|||||||||||||||||||
|
Basic
|
52.3
|
|
54.1
|
|
(1.8
|
)
|
(3.3
|
)%
|
54.2
|
|
|||||||||
|
Diluted
|
52.8
|
|
54.6
|
|
(1.8
|
)
|
(3.2
|
)%
|
54.6
|
|
|||||||||
Basic and diluted net income per common share increased for
2018
as compared to
2017
. The increases were driven by increases in net income year over year combined with reductions in both basic and diluted weighted average common shares outstanding which decreased due to the repurchase of
677,100
and
2,292,100
shares during
2017
and
2018
, respectively, as part of the Company's repurchase program. The impact of the repurchased shares was partially offset by the issuance of additional shares for employee stock plans.
Financial Performance by Business Segment
Industrial
|
($ in millions)
|
2018
|
2017
|
$ Change
|
% Change
|
2016
|
||||||||||||||
|
Sales
|
$
|
994.7
|
|
$
|
973.9
|
|
$
|
20.8
|
|
2.1
|
%
|
$
|
824.2
|
|
|||||
|
Operating profit
|
130.4
|
|
122.8
|
|
7.6
|
|
6.1
|
%
|
131.8
|
|
|||||||||
|
Operating margin
|
13.1
|
%
|
12.6
|
%
|
16.0
|
%
|
|||||||||||||
2018
vs.
2017
:
Sales at Industrial were $
994.7 million
in
2018
, an increase of
$20.8 million
, or
2.1%
, from
2017
. Acquired businesses contributed incremental sales of $
18.2
million during the
2018
period. Organic sales decreased by
$11.6 million
, or
1.2%
, during
2018
, primarily a result of lower volumes within the Force & Motion Control and Engineered Components businesses, partially offset by strength in the Molding Solutions business. Softness in automotive end markets decreased volumes within each of these businesses, largely due to lower global auto production rates and delays in auto model change releases, resulting primarily from the uncertainty related to current and proposed tariffs recently announced by the United States and China governments. Increased volumes within the medical and personal care end markets, however, more than offset the automotive related declines within Molding Solutions. The impact of foreign currency translation increased sales by approximately $
14.2
million as the U.S. dollar weakened against foreign currencies.
Operating profit in
2018
at Industrial was $
130.4 million
, an increase of
6.1%
from
2017
, primarily driven by the absence of the 2017 pre-tax restructuring charges of $7.5 million. See Note 9 of the Consolidated Financial Statements. Operating profit also benefited from improving cost productivity, primarily driven by the absence of additional costs incurred on certain programs within Engineered Components during the 2017 period. Incremental costs during the prior period included expedited freight, increased scrap and costs related to the transfer of work to other facilities. Operating profit benefits during the 2018 period were partially offset by the profit impact of lower organic sales and increased due diligence costs related to the acquisition of Gimatic. Operating profit in 2018 includes $5.6 million of short-term purchase accounting adjustments and $2.4 million of acquisition transaction costs, both related to Gimatic and IGS, whereas 2017 includes $2.3 million of short-term purchase accounting adjustments related to the acquisition of FOBOHA. Operating margin increased from
12.6%
in the 2017 period to
13.1%
in the 2018 period primarily as a result of these items.
Outlook:
In Industrial, management is focused on generating organic sales growth through the introduction of new products and services and by leveraging the benefits of its diversified products and global industrial end-markets. Our ability to generate sales growth is subject to economic conditions in the global markets served by all of our businesses. For overall industrial end-
26
markets, manufacturing Purchasing Managers' Indices ("PMIs") remain above 50 in North America and Europe, however the indices in both regions have continued to weaken in the latter part of 2018. PMI in China has also moderated throughout 2018, declining to below 50 during the fourth quarter, indicative of a slowing economy. Global forecasted production for light vehicles continued to dampen throughout 2018 and is expected to grow only nominally during 2019, with production expected to decline slightly within the North American market. Within our Molding Solutions businesses, global medical and personal care hot runner and mold markets remain healthy, while the automotive hot runner market has softened. Overall industrial end-markets may be impacted by uncertainty related to current and proposed tariffs recently announced by the United States and the China governments. As noted above, our sales were positively impacted by $
14.2
million from fluctuations in foreign currencies. To the extent that the U.S. dollar fluctuates relative to other foreign currencies, our sales may continue to be impacted by foreign currency relative to the prior year periods. The relative impact on operating profit is not expected to be as significant as the impact on sales as most of our businesses have expenses primarily denominated in local currencies, where their revenues reside, however operating margins may be impacted. The Company also remains focused on sales growth through acquisition and expanding geographic reach. See Note 2 of the Consolidated Financial Statements for additional discussion regarding the Company's acquisition of Gimatic. Strategic investments in new technologies, manufacturing processes and product development are expected to provide incremental benefits over the long term.
Operating profit is largely dependent on sales volumes and mix of the businesses in the segment. Management continues to focus on improving profitability and expanding margins through leveraging organic sales growth, acquisitions, pricing initiatives, global sourcing, productivity and the evaluation of customer programs. Operating profit may also be impacted by enactment of or changes in tariffs, trade agreements and trade policies that may affect the cost and/or availability of goods, including aluminum and steel. In particular, current and proposed tariffs recently announced by the United States government could further increase prices of raw materials or other supplies which we will attempt to offset through mitigation actions. We continue to evaluate market conditions and remain proactive in managing costs. Costs associated with new product and process introductions, restructuring and other cost initiatives, strategic investments and the integration of acquisitions may negatively impact operating profit.
2017
vs.
2016
:
Sales at Industrial were $
973.9 million
in
2017
, an increase of $149.7 million, or
18.2%
, from
2016
. Acquired businesses contributed incremental sales of $56.3 million during the
2017
period. Organic sales increased by $81.0 million, or $9.8%, during
2017
, driven primarily by continued strength in our Force & Motion Control and Molding Solutions business units. A continuation of favorable demand trends in our tool and die, transportation and other industrial end-markets have largely contributed to the organic growth within these business units. The impact of foreign currency translation increased sales by approximately $12.4 million as the U.S. dollar weakened against foreign currencies.
Operating profit in
2017
at Industrial was $
122.8 million
, a decrease of
6.8%
from
2016
. The decrease was driven by pre-tax restructuring charges of $7.5 million and lower productivity, primarily driven by the increased costs incurred on certain programs within Engineered Components. Incremental costs include expedited freight, increased scrap and costs related to the transfer of work to other facilities. Employee related costs also increased during the 2017 period, primarily due to incentive compensation at certain Industrial businesses. Industrial's ability to leverage increased sales volumes partially offset this decrease in operating profit. The 2016 period included $3.5 million of short-term purchase accounting adjustments and transaction costs related to business acquisitions, whereas the 2017 period included $2.3 million of short-term purchase accounting adjustments. Operating margins decreased from 16.0% in the 2016 period to
12.6%
in the 2017 period primarily as a result of these items. Lower margins at FOBOHA also impacted the 2017 period.
Aerospace
|
($ in millions)
|
2018
|
2017
|
$ Change
|
% Change
|
2016
|
||||||||||||||
|
Sales
|
$
|
501.2
|
|
$
|
462.6
|
|
$
|
38.5
|
|
8.3
|
%
|
$
|
406.5
|
|
|||||
|
Operating profit
|
101.4
|
|
83.6
|
|
17.8
|
|
21.2
|
%
|
62.5
|
|
|||||||||
|
Operating margin
|
20.2
|
%
|
18.1
|
%
|
15.4
|
%
|
|||||||||||||
2018
vs.
2017
:
Aerospace recorded sales of $
501.2 million
in
2018
, a
8.3%
increase from
2017
. Sales increased within all of the Aerospace businesses. The original equipment manufacturing ("OEM") business continued to benefit from the ramp of newer, more technologically advanced engine programs. The sales increase reflects increased volume generated by these newer
27
platforms, partially offset by scheduled price deflation as certain engine programs transition into the early production stages. Sales within the aftermarket repair and overhaul ("MRO") and spare parts businesses increased as airline traffic and aircraft utilization remained strong, with additional volumes being obtained largely from existing customers. Sales within the segment are largely denominated in U.S. dollars and therefore were not impacted by changes in foreign currency.
Operating profit at Aerospace increased
21.2%
from
2017
to $
101.4 million
. The operating profit increase resulted from the profit impact of the increased volumes at both the OEM and the aftermarket businesses, as discussed above, and increased productivity, driven by improvements within production of the newer engine programs. These benefits were partially offset by scheduled price deflation as certain newer engine programs transition into the early production stages. Operating margin increased from
18.1%
in the
2017
period to
20.2%
in the
2018
period, primarily as a result of these items.
Outlook:
Sales in the Aerospace OEM business are based on the general state of the aerospace market driven by the worldwide economy and are supported by its order backlog through participation in certain strategic commercial and military engine and airframe programs. Over the next several years, the Company expects sustained strength in demand for new engines, driven by a forecasted increase in commercial aircraft production levels. The Company anticipates further shifts in the production mix from legacy engine programs to the continual ramping of several new engine programs. Backlog at OEM was
$845.1 million
at
December 31, 2018
, an increase of 18.4% since
December 31, 2017
(backlog of
$713.8 million
), primarily attributed to an increase in orders related to newer engine platforms. Approximately 45% of OEM backlog is expected to ship in the next 12 months. The Aerospace OEM business may be impacted by changes in the content levels on certain platforms, changes in customer sourcing decisions, adjustments to customer inventory levels, commodity availability and pricing and the use of alternate materials. Additional impacts may include changes in production schedules of specific engine and airframe programs, redesign of parts, quantity of parts per engine, cost schedules agreed to under contract with the engine manufacturers, as well as the pursuit and duration of new programs. Sales in the Aerospace aftermarket business may be impacted by fluctuations in end-market demand, early aircraft retirements, inventory management and changes in customer sourcing, deferred or limited maintenance activity during engine shop visits and the use of surplus (used) material during the engine repair and overhaul process. End markets are expected to grow based on the long term underlying fundamentals of the aerospace industry. Management continues to believe its Aerospace aftermarket business is competitively positioned based on well-established long-term customer relationships, including maintenance and repair contracts in the MRO business and long-term Revenue Sharing Programs ("RSPs") and Component Repair Programs ("CRPs"), expanded capabilities and current capacity levels. The MRO business may be potentially impacted by airlines that closely manage their aftermarket costs as engine performance and quality improves. Fluctuations in fuel costs and their impact on airline profitability and behaviors within the aerospace industry could also impact levels and frequency of aircraft maintenance and overhaul activities, and airlines' decisions on maintaining, deferring or canceling new aircraft purchases, in part based on the economics associated with new fuel efficient technologies.
Management is focused on growing operating profit at Aerospace primarily through leveraging organic sales growth, strategic investments, new product and process introductions, and productivity. Operating profit is expected to be affected by the impact of changes in sales volume, mix and pricing, particularly as they relate to the highly profitable aftermarket RSP spare parts business, and investments made in each of its businesses. Operating profits may also be impacted by potential changes in tariffs, trade agreements and trade policies that may affect the cost and/or availability of goods. Costs associated with new product and process introductions, the physical transfer of work to other global regions, additional productivity initiatives and restructuring activities may also negatively impact operating profit.
2017
vs.
2016
:
Aerospace recorded sales of $
462.6 million
in
2017
, a 13.8% increase from
2016
. Sales increased within all of the Aerospace businesses. The original equipment manufacturing ("OEM") business continued to transition from the manufacture of components on legacy engine platforms to newer, more technologically advanced platforms. Increased volume generated by ramping programs was partially offset by lower volumes and scheduled price deflation on more mature engine platforms. Sales within the aftermarket maintenance repair and overhaul ("MRO") business also increased during the 2017 period as the Company continued to obtain additional sales volume from new and existing customers, a trend that began during the second half of 2016. Volumes within the spare parts business also increased during the 2017 period. Sales were not impacted by changes in foreign currency as sales within the segment are largely denominated in U.S. dollars.
Operating profit at Aerospace increased 33.8% from 2016 to
$83.6 million
. The operating profit increase resulted from the increased volumes discussed above, coupled with favorable productivity, resulting from our ability to leverage production volumes, partially offset by scheduled price deflation and an increase in incentive compensation. Operating profit during the
28
2016 period included a $3.0 million charge related to the contract termination dispute and a $1.4 million benefit from the contract termination arbitration award.
LIQUIDITY AND CAPITAL RESOURCES
Management assesses the Company's liquidity in terms of its overall ability to generate cash to fund its operating and investing activities. Of particular importance in the management of liquidity are cash flows generated from operating activities, capital expenditure levels, dividends, capital stock transactions, effective utilization of surplus cash positions overseas and adequate lines of credit.
The Company believes that its ability to generate cash from operations in excess of its internal operating needs is one of its financial strengths. Management continues to focus on cash flow and working capital management, and anticipates that operating activities in
2019
will generate sufficient cash to fund operations. The Company closely monitors its cash generation, usage and preservation including the management of working capital to generate cash.
In February 2017, the Company and certain of its subsidiaries entered into the fourth amendment of its fifth amended and restated revolving credit agreement (the “Amended Credit Agreement”) and retained Bank of America, N.A. as the Administrative Agent for the lenders. The Amended Credit Agreement increases the facility from
$750.0 million
to
$850.0 million
and extends the maturity date from September 2018 to February 2022. The Amended Credit Agreement also increases the existing accordion feature from
$250.0 million
, allowing the Company to now request additional borrowings of up to
$350.0 million
. The Company may exercise the accordion feature upon request to the Administrative Agent as long as an event of default has not occurred or is not continuing. The borrowing availability of
$850.0 million
, pursuant to the terms of the Amended Credit Agreement, allows for multi-currency borrowing which includes euro, British pound sterling or Swiss franc borrowing, up to
$600.0 million
. In September 2018, the Company and one of its wholly owned subsidiaries entered into a Sale and Purchase Agreement to acquire Gimatic S.r.l. See Note 2 of the Consolidated Financial Statements. In conjunction with the Acquisition, the Company requested additional borrowings of
$150.0 million
that was provided for under the existing accordion feature. The Administrative Agent for the lenders has approved the Company's access to the accordion feature and on October 19, 2018 the lenders formally committed the capital to fund such feature, resulting in the execution of the fifth amendment to the Amended Credit Agreement (the "Fifth Amendment"). The Fifth Amendment, effective October 19, 2018, thereby increased the borrowing availability of the existing facility to
$1,000.0 million
. The Company may also request access to the residual
$200.0 million
of the accordion feature. Depending on the Company’s consolidated leverage ratio, and at the election of the Company, borrowings under the Amended Credit Agreement will bear interest at either LIBOR plus a margin of between
1.10%
and
1.70%
or the base rate, as defined in the Amended Credit Agreement, plus a margin of
0.10%
to
0.70%
. Multi-currency borrowings, pursuant to the Amended Credit Agreement, bear interest at their respective interbank offered rate (i.e. Euribor) or 0.00% (higher of the two rates) plus a margin of between
1.10%
and
1.70%
.
In October 2014, the Company entered into a Note Purchase Agreement (“Note Purchase Agreement”), among the Company and New York Life Insurance Company, New York Life Insurance and Annuity Corporation and New York Life Insurance and Annuity Corporation Institutionally Owned Life Insurance Separate Account, as purchasers, for the issuance of $100.0 million aggregate principal amount of 3.97% senior notes due October 17, 2024 (the “3.97% Senior Notes”). The Company completed funding of the transaction and issued the 3.97% Senior Notes on October 17, 2014. The 3.97% Senior Notes are senior unsecured obligations of the Company and pay interest semi-annually on April 17 and October 17 of each year at an annual rate of 3.97%. The 3.97% Senior Notes will mature on October 17, 2024 unless earlier prepaid in accordance with their terms. Subject to certain conditions, the Company may, at its option, prepay all or any part of the 3.97% Senior Notes in an amount equal to 100% of the principal amount of the 3.97% Senior Notes so prepaid, plus any accrued and unpaid interest to the date of prepayment, plus the Make-Whole Amount, as defined in the Note Purchase Agreement, with respect to such principal amount being prepaid. The Note Purchase Agreement contains customary affirmative and negative covenants that are similar to the covenants required under the Amended Credit Agreement, as discussed below. At December 31, 2018, the Company was in compliance with all covenants under the Note Purchase Agreement.
The Company's borrowing capacity remains limited by various debt covenants in the Amended Credit Agreement and the Note Purchase Agreement (the "Agreements"). The Agreements require the Company to maintain a ratio of Consolidated Senior Debt, as defined, to Consolidated EBITDA, as defined, of not more than 3.25 times ("Senior Debt Ratio"), a ratio of Consolidated Total Debt, as defined, to Consolidated EBITDA of not more than 3.75 times ("Total Debt Ratio") and a ratio of Consolidated EBITDA to Consolidated Cash Interest Expense, as defined, of not less than
4.25
, in each case at the end of each fiscal quarter; provided that the debt to EBITDA ratios are permitted to increase for a period of four fiscal quarters after the closing of certain permitted acquisitions. A permitted acquisition is defined as an acquisition exceeding $150.0 million, for which the acquisition of Gimatic qualifies. With the completion of a permitted acquisition, the Senior Debt Ratio cannot exceed 3.50 times and the Total Debt Ratio cannot exceed 4.25 times. The increased ratios are allowed for a period of four fiscal quarters subsequent to the close of the permitted acquisition. At
December 31, 2018
, the Company was in compliance with all covenants under the Agreements. The Company's most restrictive financial covenant is the Senior Debt Ratio, which, with a
29
permitted acquisition, requires the Company to maintain a ratio of Consolidated Senior Debt to Consolidated EBITDA of not more than 3.50 times at
December 31, 2018
. The actual ratio at
December 31, 2018
was
2.59
times, as defined.
In
2018
,
2017
and
2016
, the Company acquired 2.3 million shares, 0.7 million shares and 0.6 million shares of the Company's common stock, respectively, at a cost of $138.3 million, $40.8 million and $20.5 million, respectively.
Operating cash flow may be supplemented with external borrowings to meet near-term business expansion needs and the Company's current financial commitments. The Company has assessed its credit facilities in conjunction with the Amended Credit Facility and currently expects that its bank syndicate, comprised of 14 banks, will continue to support its Amended Credit Agreement which matures in February 2022. At
December 31, 2018
, the Company had
$169.0 million
unused and available for borrowings under its
$1,000.0 million
Amended Credit Facility, subject to covenants in the Company's revolving debt agreements. At
December 31, 2018
, additional borrowings of
$607.6
million of Total Debt including
$333.8
million of Senior Debt would have been allowed under the financial covenants. The Company intends to use borrowings under its Amended Credit Facility to support the Company's ongoing growth initiatives. The Company believes its credit facilities and access to capital markets, coupled with cash generated from operations, are adequate for its anticipated future requirements.
The Company had
$2.0 million
in borrowings under short-term bank credit lines at
December 31, 2018
.
In 2012, the Company entered into five-year interest rate swap agreements (the "Swaps") transacted with three banks which together converted the interest on the first $100.0 million of the Company's one-month LIBOR-based borrowings from a variable rate plus the borrowing spread to a fixed rate of 1.03% plus the borrowing spread, for the purpose of mitigating its exposure to variable interest rates. The Swaps expired on April 28, 2017. The Company entered into a new interest rate swap agreement (the "Swap") that commenced on April 28, 2017, with one bank, and converts the interest on the first $100.0 million of the Company's one-month LIBOR-based borrowings from a variable rate plus the borrowing spread to a fixed rate of 1.92% plus the borrowing spread. The Swap expires on January 31, 2022. At
December 31, 2018
, the Company's total borrowings were comprised of approximately
22%
fixed rate debt and
78%
variable rate debt. At
December 31, 2017
, the Company's total borrowings were comprised of approximately 39% fixed rate debt and 61% variable rate debt.
The funded status of the Company's pension plans is dependent upon many factors, including actual rates of return that impact the fair value of pension assets and changes in discount rates that impact projected benefit obligations. The unfunded status of the pension plans increased from $43.7 million at
December 31, 2017
to $71.4 million at
December 31, 2018
as the decrease in the fair value of the pension plan assets exceeded the decrease in the projected benefit obligations ("PBOs"), following an update of certain actuarial assumptions. The Company recorded $15.4 million of non-cash after-tax decreases in stockholders equity (through other non-owner changes to equity) when recording the current year adjustments for changes in the funded status of its pension and postretirement benefit plans as required under accounting for defined benefit and other postretirement plans. This decrease in stockholders equity resulted primarily from unfavorable variances between expected and actual returns on pension plan assets, partially offset by changes in actuarial assumptions, primarily the increase in the discount rate and the amortization of actuarial losses recorded earlier. In 2018, the Company made no discretionary contributions to the U.S. qualified pension plans. The Company expects to contribute approximately $
4.7 million
to its various defined benefit pension plans in
2019
. No discretionary contributions to the U.S. Qualified pension plans are currently planned in
2019
. See Note 12 of the Consolidated Financial Statements.
As noted above, the U.S. government enacted the Act on December 22, 2017. The Company completed its computation of the Transition Tax as required pursuant to SAB 118 in 2018, resulting in a final net Transition Tax expense of $86.9 million. The Company elected to pay the Transition Tax over the allowed eight year period. The installment payments for the Transition Tax are not expected to have a material impact on the liquidity or capital resources of the Company. The Company expects to make the payments through the use of available cash or borrowings under the Amended Credit Facility.
At
December 31, 2018
, the Company held
$100.7
million in cash and cash equivalents, the majority of which was held by foreign subsidiaries. These amounts have no material regulatory or contractual restrictions. The Act changed the impact of U.S taxation on foreign distributions. The Company is continuously evaluating its position regarding the potential repatriation of overseas cash. As noted above, during 2017, the Company recorded a provisional tax expense of $6.9 million to account for estimated withholding and income taxes on expected future cash repatriations. During 2018, the Company repatriated $62.4 million between certain foreign entities, incurring $5.2 million in tax. In 2018, as part of its ongoing evaluation, the Company determined that it would not be repatriating income from certain foreign entities, thereby resulting in a $1.2 million reduction from the previously recorded deferred tax liability. The evaluation of potential repatriation is dependent upon several variables, including foreign taxation of dividends and the impact of withholding tax. The Company repatriated $228.8 million to the U.S. during
2018
.
30
Any future acquisitions are expected to be financed through internal cash, borrowings and equity, or a combination thereof. Additionally, we may from time to time seek to retire or repurchase our outstanding debt through cash purchases and/or exchanges for equity securities, in open market purchases, under a Rule 10b5-1 trading plan, privately negotiated transactions or otherwise. Such repurchases or exchanges, if any, will depend on prevailing market conditions, our liquidity requirements, contractual restrictions and other factors.
Cash Flow
|
($ in millions)
|
2018
|
2017
|
$ Change
|
% Change
|
2016
|
||||||||||||||
|
Operating activities
|
$
|
237.2
|
|
$
|
203.9
|
|
$
|
33.3
|
|
16.3
|
%
|
$
|
217.6
|
|
|||||
|
Investing activities
|
(493.2
|
)
|
(68.0
|
)
|
(425.1
|
)
|
NM
|
|
(179.5
|
)
|
|||||||||
|
Financing activities
|
215.6
|
|
(63.8
|
)
|
279.3
|
|
NM
|
|
(53.3
|
)
|
|||||||||
|
Exchange rate effect
|
(4.1
|
)
|
6.7
|
|
(10.9
|
)
|
NM
|
|
(2.3
|
)
|
|||||||||
|
(Decrease) increase in cash
|
$
|
(44.6
|
)
|
$
|
78.8
|
|
$
|
(123.4
|
)
|
NM
|
|
$
|
(17.5
|
)
|
|||||
________________________
NM – Not meaningful
Operating activities provided
$237.2
million in
2018
compared to
$203.9
million in
2017
. Operating cash flows in the
2018
period were positively impacted by improved operating results which were partially offset by higher outflows for accrued liabilities, primarily related to incentive compensation, in the 2018 period. Net income during the 2017 period was impacted by $96.7 million of tax expense related to the enactment of the Act, having no impact to cash outflows during the 2017 period. Cash from operating activities during the 2018 period includes the use of $6.9 million for the required installment payments related to the Transition Tax. See Note 14 of the Consolidated Financial Statements. Operating cash flows in the 2018 period were also positively impacted by a reduction in cash used for working capital compared to 2017 driven by accounts receivable. Cash flows in the 2017 period were negatively impacted by outflows of $10.0 million related to discretionary contributions to the U.S. Qualified pension plans.
Investing activities used
$493.2
million in
2018
and
$68.0
million in
2017
. In
2018
, investing activities included capital expenditures of
$57.3
million compared to
$58.7
million in
2017
. The Company expects capital spending in
2019
to be between $60 million and $65 million. Capital expenditures relate to both maintenance needs and support of growth initiatives, which include the purchase of equipment to support new products and services, and are expected to be funded primarily through cash flows from operations. Investing activities in 2018 and 2017 also included outflows of $
430.5 million
and
$8.9 million
, respectively, to fund the acquisitions of IGS and Gimatic in 2018 and Gammaflux in 2017. Investing activities also included a
$5.8 million
participation fee payment related to the aftermarket Revenue Sharing Programs in 2018 and payments of
$1.0 million
and
$3.0 million
in 2018 and 2017, respectively, related to an Aerospace agreement,which are reflected in Other Investing activities.
Cash provided by financing activities in
2018
included a net increase in borrowings of
$402.0
million compared to a net increase of
$30.7
million in
2017
. In 2018, the Company borrowed 179.0 million Euros ($208.6 million) under the Amended Credit Facility through an international subsidiary. The proceeds were distributed to the Parent Company and subsequently used to pay down U.S. borrowings under the Amended Credit Agreement. Proceeds from the issuance of common stock were
$1.1
million and
$2.4
million in
2018
and
2017
, respectively. In
2018
, the Company repurchased
2.3 million
shares of the Company's stock at a cost of
$138.3
million, compared with the purchase of
0.7 million
shares at a cost of
$40.8
million in
2017
. Total cash used to pay dividends increased slightly to
$32.2
million in
2018
compared to
$29.6
million in
2017
, reflecting an increase in dividends paid per share. Withholding taxes paid on stock issuances were
$5.4 million
in both the
2018
and
2017
periods. Other financing cash flows during
2018
and 2017 include $10.8 million and $18.2 million, respectively, of net cash payments related to the settlement of foreign currency hedges related to intercompany financings and $0.5 million and $2.5 million, respectively, of fees paid in connection with the Amended Credit Agreement.
Debt Covenants
As noted above, borrowing capacity is limited by various debt covenants in the Company's debt agreements. Following is a reconciliation of Consolidated EBITDA, a key metric in the debt covenants, to the Company's net income (in millions):
31
|
|
2018
|
||
|
Net income
|
$
|
166.2
|
|
|
Add back:
|
|||
|
Interest expense
|
16.8
|
|
|
|
Income taxes
|
41.3
|
|
|
|
Depreciation and amortization
|
94.2
|
|
|
|
Adjustment for non-cash stock based compensation
|
12.3
|
|
|
|
Adjustment for acquired businesses
|
20.0
|
|
|
|
Amortization of Gimatic and IGS acquisition inventory step-ups
|
5.6
|
|
|
|
Due diligence and transaction expenses
|
5.4
|
|
|
|
Other adjustments
|
3.2
|
|
|
|
Consolidated EBITDA, as defined within the Amended Credit Agreement
|
$
|
365.1
|
|
|
Consolidated Senior Debt, as defined, as of December 31, 2018
|
$
|
944.0
|
|
|
Ratio of Consolidated Senior Debt to Consolidated EBITDA
|
2.59
|
|
|
|
Maximum
|
3.50
|
|
|
|
Consolidated Total Debt, as defined, as of December 31, 2018
|
$
|
944.0
|
|
|
Ratio of Consolidated Total Debt to Consolidated EBITDA
|
2.59
|
|
|
|
Maximum
|
4.25
|
|
|
|
Consolidated Cash Interest Expense, as defined, as of December 31, 2018
|
$
|
27.1
|
|
|
Ratio of Consolidated EBITDA to Consolidated Cash Interest Expense
|
13.45
|
|
|
|
Minimum
|
4.25
|
|
|
The Amended Credit Agreement allows for certain adjustments within the calculation of the financial covenants. The adjustment for acquired businesses reflects the unaudited pre-acquisition operations of IGS and Gimatic for the periods from January 1, 2018 through July 23, 2018 and October 31, 2018, respectively. Other adjustments consist of net losses on the sale of assets, changes in accounting and restructuring charges as permitted under the Amended Credit Agreement. The Company's financial covenants are measured as of the end of each fiscal quarter. At
December 31, 2018
, additional borrowings of
$607.6
million of Total Debt including
$333.8
million of Senior Debt would have been allowed under the covenants. Senior Debt includes primarily the borrowings under the Amended Credit Facility, the 3.97% Senior Notes and the borrowings under the lines of credit. The Company's unused committed credit facilities at
December 31, 2018
were
$169.0
million.
Contractual Obligations and Commitments
At
December 31, 2018
, the Company had the following contractual obligations and commitments:
|
($ in millions)
|
Total
|
Less than
1 Year
|
1-3
Years
|
3-5
Years
|
More than
5 Years
|
||||||||||||||||
|
Long-term debt obligations
(1)
|
$
|
941.9
|
|
$
|
5.8
|
|
$
|
2.8
|
|
$
|
832.3
|
|
$
|
101.0
|
|
||||||
|
Estimated interest payments under long-term obligations
(2)
|
99.9
|
|
20.6
|
|
40.9
|
|
—
|
|
27.2
|
|
11.1
|
|
|||||||||
|
Operating lease obligations
|
38.8
|
|
11.9
|
|
14.2
|
|
5.0
|
|
7.7
|
|
|||||||||||
|
Purchase obligations
(3)
|
223.5
|
|
189.8
|
|
30.6
|
|
3.1
|
|
—
|
|
|||||||||||
|
Expected pension contributions
(4)
|
4.7
|
|
4.7
|
|
—
|
|
—
|
|
—
|
|
|||||||||||
|
Expected benefit payments – other postretirement benefit plans
(5)
|
26.6
|
|
3.5
|
|
6.4
|
|
5.6
|
|
11.1
|
|
|||||||||||
|
Long-term U.S. Tax Reform obligations
(6)
|
73.0
|
|
—
|
|
13.9
|
|
20.0
|
|
39.1
|
|
|||||||||||
|
Total
|
$
|
1,408.3
|
|
$
|
236.4
|
|
$
|
108.8
|
|
$
|
893.1
|
|
$
|
170.0
|
|
||||||
|
(1)
|
Long-term debt obligations represent the required principal payments under such agreements.
|
|
(2)
|
Interest payments under long-term debt obligations have been estimated based on the borrowings outstanding and market interest rates as of December 31, 2018.
|
|
(3)
|
The amounts do not include purchase obligations reflected as current liabilities on the consolidated balance sheet. The purchase obligation amount includes all outstanding purchase orders as of the balance sheet date as well as the minimum contractual obligation or termination penalty under other contracts.
|
32
|
(4)
|
The amount included in “Less Than 1 Year” reflects anticipated contributions to the Company’s various pension plans. Anticipated contributions beyond one year are not determinable.
|
|
(5)
|
Amounts reflect anticipated benefit payments under the Company’s various other postretirement benefit plans based on current actuarial assumptions. Expected benefit payments do not extend beyond 2028. See Note 12 of the Consolidated Financial Statements.
|
|
(6)
|
Amounts reflect anticipated long-term payments related to the Tax Cuts and Jobs Act that was enacted on December 22, 2017. Payments are allowed over an eight-year period. See Note 14 of the Consolidated Financial Statements. The amount payable in 2019 is included within accrued liabilities on the Consolidated Balance Sheets.
|
The above table does not reflect unrecognized tax benefits as the timing of the potential payments of these amounts cannot be determined. See Note 14 of the Consolidated Financial Statements.
OTHER MATTERS
Inflation
Inflation generally affects the Company through its costs of labor, equipment and raw materials. Increases in the costs of these items have historically been offset by price increases, commodity price escalator provisions, operating improvements, and other cost-saving initiatives.
Critical Accounting Estimates
The preparation of financial statements requires management to make estimates and assumptions that affect the reported amounts of assets and liabilities at the date of the financial statements and the reported amounts of revenues and expenses during the reporting period. Significant accounting policies are disclosed in Note 1 of the Consolidated Financial Statements. The most significant areas involving management judgments and estimates are described below. Actual results could differ from such estimates.
Inventory Valuation:
Inventories are valued at the lower of cost, determined on a first-in, first-out basis, or net realizable value. The primary components of cost included in inventories are raw material, labor and overhead. Provisions are made to reduce excess or obsolete inventories to their estimated net realizable value. The process for evaluating the value of excess and obsolete inventory often requires the Company to make subjective judgments and estimates concerning future sales levels, quantities and prices at which such inventory will be sold in the normal course of business and estimated costs. Accelerating the disposal process or changes in estimates based on future sales potential or estimated costs may necessitate future adjustments to these provisions.
Revenue recognition
: The Company accounts for revenue in accordance with Accounting Standard Codification 606, Revenue from Contracts with Customers, which it adopted on January 1, 2018. Revenue is recognized by the Company when control of the product or solution is transferred to the customer. Control is generally transferred when products are shipped or delivered to customers, title is transferred, the significant risks and rewards of ownership have transferred, the Company has rights to payment and rewards of ownership pass to the customer. Customer acceptance may also be a factor in determining whether control of the product has transferred. Although revenue is generally transferred at a point in time, a certain portion of businesses with customized products or contracts in which the Company performs work on customer-owned assets requires the use of an over time recognition model as certain contracts meet one or more of the established criteria pursuant to the accounting standards governing revenue recognition. Also, service revenue is recognized as control transfers, which is concurrent with the services being performed. See Note 3 of the Consolidated Financial Statements.
Business Acquisitions, Intangible Assets and Goodwill:
Assets and liabilities acquired in a business combination are recorded under the acquisition method of accounting at their estimated fair values at the dates of acquisition. At
December 31, 2018
, the Company had
$955.5
million and
$365.3
million of goodwill and identifiable intangible assets related to acquisitions, respectively. Goodwill represents the cost of acquisitions in excess of fair values assigned to the underlying identifiable net assets of acquired businesses. Identifiable intangible assets acquired in business acquisitions include customer relationships, patents and technology and trademarks/trade names. The fair value of acquired customer relationship intangibles was determined as of the acquisition dates based on estimates and judgments regarding expectations for the future after-tax cash flows arising from customer relationships that existed on the acquisition date over their estimated lives, less a contributory assets charge, all of which is discounted to present value using an appropriate discount rate. The fair value of the patents and technology and trademark/trade name intangible assets were determined utilizing the relief from royalty method which is a form of the income approach. Under this method, an after-tax royalty rate based on market royalty rates is applied to projected revenue associated with the patents/technology and trademark/trade name and discounted to present value using an appropriate discount rate. See Notes 6 of the Consolidated Financial Statements.
33
Goodwill and indefinite-lived intangible assets are subject to impairment testing annually or earlier if an event or change in circumstances indicates that the fair value of a reporting unit has been reduced below its carrying value. Management completes their annual impairment assessments during the second quarter of each year as of April 1. The Company elected to early adopt the amended guidance related to goodwill impairment testing during the second quarter of 2018, in conjunction with its annual assessment. See Note 1 of the Consolidated Financial Statements. The Company utilizes the option to first assess qualitative factors to determine whether it is necessary to perform the Step 1 quantitative goodwill impairment test in accordance with the applicable accounting standards.
Under the qualitative assessment, management considers relevant events and circumstances including but not limited to macroeconomic conditions, industry and market considerations, overall unit performance and events directly affecting a unit. If the Company determines that the Step 1 quantitative impairment test is required, management estimates the fair value of the reporting unit primarily using the income approach, which reflects management’s cash flow projections, and also evaluates the fair value using the market approach. Inherent in management’s development of cash flow projections are assumptions and estimates, including those related to future earnings and growth and the weighted average cost of capital. The Company compares the fair value of the reporting unit with the carrying value of the reporting unit. If the fair values were to fall below the carrying values, the Company would recognize a non-cash impairment charge to income from operations for the amount by which the carrying amount of any reporting unit exceeds the reporting unit’s fair value, assuming the loss recognized does not exceed the total amount of goodwill for the reporting unit. Based on our second quarter assessment, the estimated fair value of all reporting units significantly exceeded their carrying values and there was no goodwill impairment at any reporting units. Many of the factors used in assessing fair value are outside the control of management, and these assumptions and estimates can change in future periods as a result of both Company-specific and overall economic conditions. Management’s quantitative assessment includes a review of the potential impacts of current and projected market conditions from a market participant’s perspective on reporting units’ projected cash flows, growth rates and cost of capital to assess the likelihood of whether the fair value would be less than the carrying value. The Company also completed its annual impairment testing of its trade names, indefinite-lived intangible assets, in the second quarter of 2018 and determined that there were no impairments.
The Company assesses the impairment of the identifiable finite-lived intangible assets subject to amortization whenever significant events or significant changes in circumstances indicate their carrying value may not be recoverable. The Company did not identify any impairments related to such intangible assets during 2018.
Aerospace Aftermarket Programs:
The Company participates in aftermarket RSPs under which the Company receives an exclusive right to supply designated aftermarket parts over the life of the related aircraft engine program to our customer, General Electric ("GE"). As consideration, the Company has paid participation fees, which are recorded as intangible assets. The carrying value of these intangible assets was
$177.5
million at
December 31, 2018
. The Company records amortization of the related asset as sales dollars are being earned based on a proportional sales dollar method. Specifically, this method amortizes each asset as a reduction to revenue based on the proportion of sales under a program in a given period to the estimated aggregate sales dollars over the life of that program which reflects the pattern in which economic benefits are realized.
The Company entered into Component Repair Programs ("CRPs") with GE during 2015, 2014 and 2013. The CRPs provide for, among other items, the right to sell certain aftermarket component repair services for CFM56, CF6, CF34 and LM engines directly to other customers over the life of the aircraft engine program as one of a few GE licensed suppliers. In addition, the CRPs extended certain existing contracts under which the Company provides these services directly to GE. Our total investments in CRPs as of
December 31, 2018
equaled
$111.8
million, all of which have been paid. At
December 31, 2018
, the carrying value of the CRPs was
$89.9
million. The Company recorded the CRP payments as an intangible asset which is recognized as a reduction of sales over the remaining life of these engine programs based on the estimated sales over the life of such programs. This method reflects the pattern in which the economic benefits of the CRPs are realized.
The recoverability of each asset is subject to significant estimates about future revenues related to the programs' aftermarket parts and services. The Company evaluates these intangible assets for recoverability and updates amortization rates on an agreement by agreement basis for the RSPs and on an individual asset basis for the CRPs. The assets are reviewed for recoverability periodically including whenever events or changes in circumstances indicate that their carrying amount may not be recoverable. Annually, the Company evaluates the remaining life of these assets to determine whether events and circumstances warrant a revision to the remaining periods of amortization. Management updates revenue projections, which includes comparing actual experience against projected revenue and industry projections. The potential exists that actual revenues will not meet expectations due to a change in market conditions, including, for example, the replacement of older engines with new, more fuel-efficient engines or the Company's ability to capture additional market share within the aftermarket business. A shortfall in future revenues may indicate a triggering event requiring a write down or further evaluation of the recoverability of the assets or require the Company to accelerate amortization expense prospectively dependent on the
34
level of the shortfall. The Company has not identified any impairment of these assets. See Note 6 of the Consolidated Financial Statements.
Pension and Other Postretirement Benefits:
Accounting policies and significant assumptions related to pension and other postretirement benefits are disclosed in Note 12 of the Consolidated Financial Statements. As discussed further below, the significant assumptions that impact pension and other postretirement benefits include discount rates, mortality rates and expected long-term rates of return on invested pension assets.
The Company selected the expected long-term rate of return of its U.S. defined benefit plans based on consideration of historical and projected rates of return on the weighted target asset mix of our pension investments. The target mix reflects a 65% equity investment target and a 35% target for fixed income and cash investments (in aggregate). The equity investment of 65% is more heavily weighted on global equity investment targets, rather than U.S. targets. The historical rates of return for the Company's defined benefit plans were calculated based upon compounded average rates of return of published indices. Management selected a long-term expected rate of return on its U.S. pension assets of 7.75%. The long-term rates of return for non-U.S. plans were selected based on actual historical rates of return of published indices that reflect the plans’ target asset allocations.
The discount rate used for the Company’s U.S. pension plans reflects the rate at which the pension benefits could be effectively settled. At
December 31, 2018
, the Company selected a discount rate of
4.40%
based on a bond matching model for its U.S. pension plans. Market interest rates have increased in
2018
as compared with
2017
and, as a result, the discount rate used to measure pension liabilities increased from
3.90%
at
December 31, 2017
. The discount rates for non-U.S. plans were selected based on highly rated long-term bond indices and yield curves that match the duration of the plan’s benefit obligations.
A one-quarter percentage point change in the assumed long-term rate of return on the Company’s U.S. pension plans as of
December 31, 2018
would impact the Company’s
2019
pre-tax income by approximately $0.9 million. A one-quarter percentage point decrease in the discount rate on the Company's U.S. pension plans as of
December 31, 2018
would decrease the Company’s
2019
pre-tax income by approximately $1.0 million. The Company reviews these and other assumptions at least annually.
The Company recorded $15.4 million of non-cash after-tax decreases in stockholders equity (through other non-owner changes to equity) when recording the current year adjustments for changes in the funded status of its pension and postretirement benefit plans as required under accounting for defined benefit and other postretirement plans. This decrease in stockholders equity resulted primarily from unfavorable variances between expected and actual returns on pension plan assets, partially offset by changes in actuarial assumptions, primarily the increase in the discount rate, and the amortization of actuarial losses recorded earlier. During
2018
, the fair value of the Company’s pension plan assets decreased by $58.2 million and the projected benefit obligation decreased by $30.5 million. The decrease in the projected benefit obligation included a $24.4 million (pre-tax) decrease due to actuarial gains resulting primarily from a change in the discount rates used to measure pension liabilities, $31.6 million in benefits paid and $3.1 million of foreign exchange impacts. These increases were partially offset by annual service and interest costs of $6.0 million and $17.4 million, respectively, and $3.5 million of transfers in, resulting from employees that were hired during the period. Changes to other actuarial assumptions in 2018 did not have a material impact on our stockholders equity or projected benefit obligation. Actual pre-tax losses on total pension plan assets were $32.6 million compared with an expected pre-tax return on pension assets of $29.9 million. Pension expense for
2019
is expected to decrease from $5.6 million in 2018 to $4.6 million.
Income Taxes:
Recognition of the impacts of the U.S. Tax Reform required significant estimates and judgments. As noted within “Results of Operations - U.S. Tax Reform”, the SEC issued SAB 118 in December 2017. The Company completed its computation of the Transition Tax as required pursuant to SAB 118 in 2018, resulting in a final net Transition Tax expense of $86.9 million that was recorded within the Consolidated Financial Statements. See further discussion therein.
As of
December 31, 2018
, the Company had recognized
$20.5
million of deferred tax assets, net of valuation reserves. The realization of these benefits is dependent, in part, on the amount and timing of future taxable income in jurisdictions where the deferred tax assets reside. For those jurisdictions where the expirations date of tax loss carryforwards or the proposed operating results indicate that realization is unlikely, a valuation allowance is provided. Management currently believes that sufficient taxable income should be earned in the future to realize the deferred tax assets, net of valuation allowances recorded.
The valuation of deferred tax assets requires significant judgment. Management’s assessment that the deferred tax assets will be realized represents its estimate of future results; however, there can be no assurance that such expectations will be met. Changes in management’s assessment of achieving sufficient future taxable income could materially increase the Company’s tax expense and could have a material adverse impact of the Company’s financial condition and the results of operations.
35
Additionally, the Company is exposed to certain tax contingencies in the ordinary course of business and records those tax liabilities in accordance with the guidance for accounting for uncertain tax positions. For tax positions where the Company believes it is more likely than not that a tax benefit will be sustained, the Company has recorded the largest amount of tax benefit with a greater than 50% likelihood of being realized. For those income tax positions where it is more likely than not that a tax benefit will not be sustained, no tax benefit is recognized in the financial statements. See Note 14 of the Consolidated Financial Statements.
A significant portion of revenue is generated by foreign locations. Current guidance requires the recognition of a tax liability under the assumption that foreign earnings will be repatriated in the future, unless the Company can assert that the earnings are indefinitely reinvested. Management’s annual assessment in determining whether the earnings are indefinitely reinvested is based on an analysis of U.S. cash requirements and working capital requirements of the foreign operations, including capital expenditures, combined with any limitations, such as dividend restrictions or local law limits, which would limit possible repatriation. The Company has recognized a deferred tax liability for U.S. taxes of $0.5 million on $10.2 million of undistributed earnings of its international subsidiaries, earned before 2017 and the application of the Transition Tax implemented by the Act. All remaining earnings are considered indefinitely reinvested as defined per the indefinite reversal criterion within the accounting guidance for income taxes.
Stock-Based Compensation:
The Company accounts for its stock-based employee compensation plans at fair value on the grant date and recognizes the related cost in its consolidated statement of income in accordance with accounting standards related to share-based payments. The fair values of stock options are estimated using the Black-Scholes option-pricing model based on certain assumptions. The fair values of service and performance based share awards are estimated based on the fair market value of the Company’s stock price on the grant date. The fair values of market based performance share awards are estimated using the Monte Carlo valuation method. See Note 13 of the Consolidated Financial Statements.
EBITDA
Earnings before interest expense, income taxes, and depreciation and amortization (“EBITDA”) for
2018
was
$318.6 million
compared to
$300.4 million
in
2017
. EBITDA is a measurement not in accordance with generally accepted accounting principles (“GAAP”). The Company defines EBITDA as net income plus interest expense, income taxes, and depreciation and amortization which the Company incurs in the normal course of business. The Company does not intend EBITDA to represent cash flows from operations as defined by GAAP, and the reader should not consider it as an alternative to net income, net cash provided by operating activities or any other items calculated in accordance with GAAP, or as an indicator of the Company’s operating performance. The Company’s definition of EBITDA may not be comparable with EBITDA as defined by other companies. The Company believes EBITDA is commonly used by financial analysts and others in the industries in which the Company operates and, thus, provides useful information to investors. Accordingly, the calculation has limitations depending on its use.
Following is a reconciliation of EBITDA to the Company’s net income (in millions):
|
2018
|
2017
|
|||||||
|
Net income
|
$
|
166.2
|
|
$
|
59.4
|
|
||
|
Add back:
|
||||||||
|
Interest expense
|
16.8
|
|
14.6
|
|
||||
|
Income taxes
|
41.3
|
|
136.3
|
|
||||
|
Depreciation and amortization
|
94.2
|
|
90.2
|
|
||||
|
EBITDA
|
$
|
318.6
|
|
$
|
300.4
|
|
||
36
Item 7A. Quantitative and Qualitative Disclosures About Market Risk
Market risk is the potential economic loss that may result from adverse changes in the fair value of financial instruments. The Company’s financial results could be impacted by changes in interest rates and foreign currency exchange rates, and commodity price changes. The Company uses financial instruments to hedge its exposure to fluctuations in interest rates and foreign currency exchange rates. The Company does not use derivatives for speculative or trading purposes.
The Company’s long-term debt portfolio consists of fixed-rate and variable-rate instruments and is managed to reduce the overall cost of borrowing while also minimizing the effect of changes in interest rates on near-term earnings. The Company’s primary interest rate risk is derived from its outstanding variable-rate debt obligations. Financial instruments have been used by the Company to hedge its exposures to fluctuations in interest rates.
In April 2012, the Company entered into five-year interest rate swap agreements (the "Swaps") transacted with three banks which together converted the interest on the first $100.0 million of borrowings under the Company’s Amended Credit Agreement from a variable rate plus the borrowing spread to a fixed rate of 1.03% plus the borrowing spread for the purpose of mitigating its exposure to variable interest rates. The Swaps expired on April 28, 2017. The Company entered into a new interest rate swap agreement (the "Swap") that commenced on April 28, 2017, with one bank, and converts the interest on the first $100.0 million of borrowings from a variable rate plus the borrowing spread to a fixed rate of
1.92%
plus the borrowing spread. The Swap expires on January 31, 2022. The result of a hypothetical 100 basis point increase in the interest rate on the average bank borrowings of the Company’s variable-rate debt during
2018
would have reduced annual pretax profit by
$4.1
million.
At
December 31, 2018
, the fair value of the Company’s fixed-rate debt was
$111.3
million, compared with its carrying amount of
$110.9
million. The Company estimates that a 100 basis point decrease in market interest rates at
December 31, 2018
would have increased the fair value of the Company's fixed rate debt to
$116.8
million.
The Company has manufacturing, sales and distribution facilities around the world and thus makes investments and conducts business transactions denominated in various currencies. The Company is exposed primarily to financial instruments denominated in currencies other than the functional currency at its international locations. A 10% adverse change in foreign currencies relative to the U.S dollar at
December 31, 2018
would have resulted in a $2.4 million loss in the fair value of those financial instruments. At
December 31, 2018
, the Company held $
100.7 million
of cash and cash equivalents, the majority of which is held by foreign subsidiaries.
Foreign currency commitments and transaction exposures are managed at the operating units as an integral part of their businesses in accordance with a corporate policy that addresses acceptable levels of foreign currency exposures.
Additionally, to reduce foreign currency exposure, management generally maintains the majority of foreign cash and short-term investments in functional currency and uses forward currency contracts for non-functional currency denominated monetary assets and liabilities and anticipated transactions in an effort to reduce the effect of the volatility of changes in foreign exchange rates on the income statement. Management assesses the strength of currencies in certain countries such as Brazil and Mexico, relative to the U.S. dollar, and may elect during periods of local currency weakness to invest excess cash in U.S. dollar-denominated instruments.
The Company’s exposure to commodity price changes relates to certain manufacturing operations that utilize high-grade steel spring wire, stainless steel, titanium, Inconel, Hastelloys and other specialty metals. The Company attempts to manage its exposure to price increases through its procurement and sales practices.
The results of the Company could be impacted by changes in tariffs, trade agreements or other trade restrictions imposed or agreed to by the U.S. or foreign governments. See “Part I - Item 1A - Risk Factors” for additional disclosure related to this market risk.
37
Item 8. Financial Statements and Supplementary Data
BARNES GROUP INC.
CONSOLIDATED STATEMENTS OF INCOME
(Dollars in thousands, except per share data)
|
|
Years Ended December 31,
|
|||||||||||
|
|
2018
|
2017
|
2016
|
|||||||||
|
Net sales
|
$
|
1,495,889
|
|
$
|
1,436,499
|
|
$
|
1,230,754
|
|
|||
|
Cost of sales
|
963,524
|
|
943,779
|
|
788,727
|
|
||||||
|
Selling and administrative expenses
|
300,601
|
|
286,269
|
|
247,731
|
|
||||||
|
1,264,125
|
|
1,230,048
|
|
1,036,458
|
|
|||||||
|
Operating income
|
231,764
|
|
206,451
|
|
194,296
|
|
||||||
|
Interest expense
|
16,841
|
|
14,571
|
|
11,883
|
|
||||||
|
Other expense (income), net
|
7,428
|
|
(3,819
|
)
|
(208
|
)
|
||||||
|
Income before income taxes
|
207,495
|
|
195,699
|
|
182,621
|
|
||||||
|
Income taxes
|
41,309
|
|
136,284
|
|
47,020
|
|
||||||
|
Net income
|
$
|
166,186
|
|
$
|
59,415
|
|
$
|
135,601
|
|
|||
|
Per common share:
|
||||||||||||
|
Basic
|
$
|
3.18
|
|
$
|
1.10
|
|
$
|
2.50
|
|
|||
|
Diluted
|
$
|
3.15
|
|
$
|
1.09
|
|
$
|
2.48
|
|
|||
|
Dividends
|
$
|
0.62
|
|
$
|
0.55
|
|
$
|
0.51
|
|
|||
|
Weighted average common shares outstanding:
|
||||||||||||
|
Basic
|
52,304,190
|
|
54,073,407
|
|
54,191,013
|
|
||||||
|
Diluted
|
52,831,606
|
|
54,605,298
|
|
54,631,313
|
|
||||||
See accompanying notes.
38
BARNES GROUP INC.
CONSOLIDATED STATEMENTS OF COMPREHENSIVE INCOME
(Dollars in thousands)
|
Years Ended December 31,
|
|||||||||||
|
2018
|
2017
|
2016
|
|||||||||
|
Net income
|
$
|
166,186
|
|
$
|
59,415
|
|
$
|
135,601
|
|
||
|
Other comprehensive (loss) income, net of tax
|
|||||||||||
|
Unrealized gain (loss) hedging activities, net of tax (1)
|
673
|
|
299
|
|
(342
|
)
|
|||||
|
Foreign currency translation adjustments, net of tax (2)
|
(50,017
|
)
|
83,404
|
|
(48,367
|
)
|
|||||
|
Defined benefit pension and other postretirement benefits, net
of tax (3)
|
(15,426
|
)
|
10,726
|
|
(8,867
|
)
|
|||||
|
Total other comprehensive (loss) income, net of tax
|
(64,770
|
)
|
94,429
|
|
(57,576
|
)
|
|||||
|
Total comprehensive income
|
$
|
101,416
|
|
$
|
153,844
|
|
$
|
78,025
|
|
||
(1) Net of tax of
$207
,
$232
and
$(42)
for the years ended December 31,
2018
,
2017
and
2016
, respectively.
(2) Net of tax of
$(210)
,
$610
and
$(833)
for the years ended December 31,
2018
,
2017
and
2016
, respectively.
(3) Net of tax of
$(4,606)
,
$4,469
and
$(4,687)
for the years ended December 31,
2018
,
2017
and
2016
, respectively.
See accompanying notes.
39
BARNES GROUP INC.
CONSOLIDATED BALANCE SHEETS
(Dollars in thousands)
|
|
December 31,
|
|||||||
|
|
2018
|
2017
|
||||||
|
Assets
|
||||||||
|
Current assets
|
||||||||
|
Cash and cash equivalents
|
$
|
100,719
|
|
$
|
145,290
|
|
||
|
Accounts receivable, less allowances (2018 – $5,010; 2017 – $5,143)
|
382,253
|
|
348,943
|
|
||||
|
Inventories
|
265,990
|
|
241,962
|
|
||||
|
Prepaid expenses and other current assets
|
57,184
|
|
32,526
|
|
||||
|
Total current assets
|
806,146
|
|
768,721
|
|
||||
|
Deferred income taxes
|
20,474
|
|
12,161
|
|
||||
|
Property, plant and equipment, net
|
370,531
|
|
359,298
|
|
||||
|
Goodwill
|
955,524
|
|
690,223
|
|
||||
|
Other intangible assets, net
|
636,538
|
|
507,042
|
|
||||
|
Other assets
|
19,757
|
|
28,271
|
|
||||
|
Total assets
|
$
|
2,808,970
|
|
$
|
2,365,716
|
|
||
|
Liabilities and Stockholders’ Equity
|
||||||||
|
Current liabilities
|
||||||||
|
Notes and overdrafts payable
|
$
|
2,137
|
|
$
|
5,669
|
|
||
|
Accounts payable
|
143,419
|
|
127,521
|
|
||||
|
Accrued liabilities
|
206,782
|
|
181,241
|
|
||||
|
Long-term debt – current
|
5,522
|
|
1,330
|
|
||||
|
Total current liabilities
|
357,860
|
|
315,761
|
|
||||
|
Long-term debt
|
936,357
|
|
525,597
|
|
||||
|
Accrued retirement benefits
|
104,302
|
|
89,000
|
|
||||
|
Deferred income taxes
|
106,559
|
|
73,505
|
|
||||
|
Long-term tax liability
|
72,961
|
|
79,770
|
|
||||
|
Other liabilities
|
27,875
|
|
21,762
|
|
||||
|
Commitments and contingencies (Note 21)
|
|
|
||||||
|
Stockholders’ equity
|
||||||||
|
Common stock – par value $0.01 per share
|
||||||||
|
Authorized: 150,000,000 shares
|
||||||||
|
Issued: at par value (2018 – 63,367,133 shares; 2017 – 63,034,240 shares)
|
634
|
|
630
|
|
||||
|
Additional paid-in capital
|
470,818
|
|
457,365
|
|
||||
|
Treasury stock, at cost (2018 – 12,033,580 shares; 2017 – 9,656,369 shares)
|
(441,668
|
)
|
(297,998
|
)
|
||||
|
Retained earnings
|
1,363,772
|
|
1,206,723
|
|
||||
|
Accumulated other non-owner changes to equity
|
(190,500
|
)
|
(106,399
|
)
|
||||
|
Total stockholders’ equity
|
1,203,056
|
|
1,260,321
|
|
||||
|
Total liabilities and stockholders’ equity
|
$
|
2,808,970
|
|
$
|
2,365,716
|
|
||
See accompanying notes.
40
BARNES GROUP INC.
CONSOLIDATED STATEMENTS OF CASH FLOWS
(Dollars in thousands)
|
|
Years Ended December 31,
|
|||||||||||
|
|
2018
|
2017
|
2016
|
|||||||||
|
Operating activities:
|
||||||||||||
|
Net income
|
$
|
166,186
|
|
$
|
59,415
|
|
$
|
135,601
|
|
|||
|
Adjustments to reconcile net income to net cash provided by operating activities:
|
||||||||||||
|
Depreciation and amortization
|
94,238
|
|
90,150
|
|
80,154
|
|
||||||
|
Loss (gain) on disposition of property, plant and equipment
|
71
|
|
(246
|
)
|
(349
|
)
|
||||||
|
Stock compensation expense
|
12,158
|
|
12,279
|
|
11,493
|
|
||||||
|
Effect of U.S. Tax Reform on deferred tax assets
|
—
|
|
4,152
|
|
—
|
|
||||||
|
Changes in assets and liabilities, net of the effects of acquisitions:
|
||||||||||||
|
Accounts receivable
|
(10,960
|
)
|
(50,082
|
)
|
(23,057
|
)
|
||||||
|
Inventories
|
(12,369
|
)
|
(173
|
)
|
1,989
|
|
||||||
|
Prepaid expenses and other current assets
|
(2,890
|
)
|
(4,241
|
)
|
569
|
|
||||||
|
Accounts payable
|
12,489
|
|
12,018
|
|
11,778
|
|
||||||
|
Accrued liabilities
|
(580
|
)
|
14,439
|
|
15,825
|
|
||||||
|
Deferred income taxes
|
(18,876
|
)
|
3,589
|
|
(2,210
|
)
|
||||||
|
Long-term retirement benefits
|
1,632
|
|
(16,349
|
)
|
(15,492
|
)
|
||||||
|
Long-term tax liability
|
(6,809
|
)
|
79,770
|
|
—
|
|
||||||
|
Other
|
2,909
|
|
(801
|
)
|
1,345
|
|
||||||
|
Net cash provided by operating activities
|
237,199
|
|
203,920
|
|
217,646
|
|
||||||
|
Investing activities:
|
||||||||||||
|
Proceeds from disposition of property, plant and equipment
|
1,374
|
|
2,594
|
|
780
|
|
||||||
|
Capital expenditures
|
(57,273
|
)
|
(58,712
|
)
|
(47,577
|
)
|
||||||
|
Business acquisitions, net of cash acquired
|
(430,487
|
)
|
(8,922
|
)
|
(128,613
|
)
|
||||||
|
Component Repair Program payments
|
—
|
|
—
|
|
(4,100
|
)
|
||||||
|
Revenue Sharing Program payments
|
(5,800
|
)
|
—
|
|
—
|
|
||||||
|
Other
|
(1,000
|
)
|
(3,000
|
)
|
—
|
|
||||||
|
Net cash used in investing activities
|
(493,186
|
)
|
(68,040
|
)
|
(179,510
|
)
|
||||||
|
Financing activities:
|
||||||||||||
|
Net change in other borrowings
|
(5,145
|
)
|
(25,304
|
)
|
8,375
|
|
||||||
|
Payments on long-term debt
|
(433,904
|
)
|
(73,161
|
)
|
(321,506
|
)
|
||||||
|
Proceeds from the issuance of long-term debt
|
841,036
|
|
129,118
|
|
303,277
|
|
||||||
|
Proceeds from the issuance of common stock
|
1,131
|
|
2,408
|
|
4,611
|
|
||||||
|
Common stock repurchases
|
(138,275
|
)
|
(40,791
|
)
|
(20,520
|
)
|
||||||
|
Dividends paid
|
(32,206
|
)
|
(29,551
|
)
|
(27,435
|
)
|
||||||
|
Withholding taxes paid on stock issuances
|
(5,395
|
)
|
(5,380
|
)
|
(4,885
|
)
|
||||||
|
Other
|
(11,678
|
)
|
(21,090
|
)
|
4,771
|
|
||||||
|
Net cash provided (used) by financing activities
|
215,564
|
|
(63,751
|
)
|
(53,312
|
)
|
||||||
|
Effect of exchange rate changes on cash flows
|
(4,148
|
)
|
6,714
|
|
(2,303
|
)
|
||||||
|
(Decrease) increase in cash and cash equivalents
|
(44,571
|
)
|
78,843
|
|
(17,479
|
)
|
||||||
|
Cash and cash equivalents at beginning of year
|
145,290
|
|
66,447
|
|
83,926
|
|
||||||
|
Cash and cash equivalents at end of year
|
$
|
100,719
|
|
$
|
145,290
|
|
$
|
66,447
|
|
|||
See accompanying notes.
41
BARNES GROUP INC.
CONSOLIDATED STATEMENTS OF CHANGES IN STOCKHOLDERS’ EQUITY
(Dollars and shares in thousands)
|
Common
Stock
(Number of
Shares)
|
Common
Stock
(Amount)
|
Additional
Paid-In
Capital
|
Treasury
Stock
(Number of
Shares)
|
Treasury
Stock
|
Retained
Earnings
|
Accumulated
Other
Non-Owner
Changes to
Equity
|
Total
Stockholders’
Equity
|
|||||||||||||||||||||||
|
January 1, 2016
|
62,071
|
|
$
|
621
|
|
$
|
427,558
|
|
8,207
|
|
$
|
(226,421
|
)
|
$
|
1,069,247
|
|
$
|
(143,252
|
)
|
$
|
1,127,753
|
|
||||||||
|
Comprehensive income
|
135,601
|
|
(57,576
|
)
|
78,025
|
|
||||||||||||||||||||||||
|
Dividends paid
|
(27,435
|
)
|
(27,435
|
)
|
||||||||||||||||||||||||||
|
Common stock repurchases
|
551
|
|
(20,520
|
)
|
(20,520
|
)
|
||||||||||||||||||||||||
|
Cumulative effect of change in accounting guidance (Note 13)
|
|
|
|
|
|
|
198
|
|
198
|
|
||||||||||||||||||||
|
Employee stock plans
|
621
|
|
6
|
|
15,677
|
|
132
|
|
(4,886
|
)
|
(460
|
)
|
10,337
|
|
||||||||||||||||
|
December 31, 2016
|
62,692
|
|
627
|
|
443,235
|
|
8,890
|
|
(251,827
|
)
|
1,177,151
|
|
(200,828
|
)
|
1,168,358
|
|
||||||||||||||
|
Comprehensive income
|
59,415
|
|
94,429
|
|
153,844
|
|
||||||||||||||||||||||||
|
Dividends paid
|
(29,551
|
)
|
(29,551
|
)
|
||||||||||||||||||||||||||
|
Common stock repurchases
|
677
|
|
(40,791
|
)
|
(40,791
|
)
|
||||||||||||||||||||||||
|
Employee stock plans
|
342
|
|
3
|
|
14,130
|
|
89
|
|
(5,380
|
)
|
(292
|
)
|
8,461
|
|
||||||||||||||||
|
December 31, 2017
|
63,034
|
|
630
|
|
457,365
|
|
9,656
|
|
(297,998
|
)
|
1,206,723
|
|
(106,399
|
)
|
1,260,321
|
|
||||||||||||||
|
Comprehensive income
|
166,186
|
|
(64,770
|
)
|
101,416
|
|
||||||||||||||||||||||||
|
Dividends paid
|
(32,206
|
)
|
(32,206
|
)
|
||||||||||||||||||||||||||
|
Common stock repurchases
|
2,292
|
|
(138,275
|
)
|
(138,275
|
)
|
||||||||||||||||||||||||
|
Reclassification pursuant to accounting guidance related to U.S. Tax Reform (Note 1)
|
19,331
|
|
(19,331
|
)
|
—
|
|
||||||||||||||||||||||||
|
Cumulative effect of change in accounting guidance (Note 1)
|
4,295
|
|
4,295
|
|
||||||||||||||||||||||||||
|
Employee stock plans
|
333
|
|
4
|
|
13,453
|
|
86
|
|
(5,395
|
)
|
(557
|
)
|
7,505
|
|
||||||||||||||||
|
December 31, 2018
|
63,367
|
|
$
|
634
|
|
$
|
470,818
|
|
12,034
|
|
$
|
(441,668
|
)
|
$
|
1,363,772
|
|
$
|
(190,500
|
)
|
$
|
1,203,056
|
|
||||||||
See accompanying notes.
42
BARNES GROUP INC.
NOTES TO CONSOLIDATED FINANCIAL STATEMENTS
(All dollar amounts included in the notes are stated in thousands except per share data
and the tables in Note 20)
1. Summary of Significant Accounting Policies
General:
The preparation of consolidated financial statements requires management to make estimates and assumptions that affect the reported amounts of assets and liabilities at the date of the financial statements and the reported amounts of revenues and expenses during the reporting period. Actual results could differ from those estimates. Certain reclassifications have been made to prior year amounts to conform to current year presentation. See "Recently Adopted Accounting Standards" below, which discusses the Company's application of the amended guidance related to the classification of pension and other postretirement benefit costs.
Consolidation:
The accompanying consolidated financial statements include the accounts of the Company and all of its subsidiaries. Intercompany transactions and account balances have been eliminated.
Revenue recognition
: The Company accounts for revenue in accordance with Accounting Standard Codification 606, Revenue from Contracts with Customers, which it adopted on January 1, 2018. Revenue is recognized by the Company when control of the product or solution is transferred to the customer. Control is generally transferred when products are shipped or delivered to customers, title is transferred, the significant risks and rewards of ownership have transferred, the Company has rights to payment and rewards of ownership pass to the customer. Customer acceptance may also be a factor in determining whether control of the product has transferred. Although revenue is generally transferred at a point in time, a certain portion of businesses with customized products or contracts in which the Company performs work on customer-owned assets requires the use of an over time recognition model as certain contracts meet one or more of the established criteria pursuant to the accounting standards governing revenue recognition. Also, service revenue is recognized as control transfers, which is concurrent with the services being performed. See Note 3. Management fees related to the Aerospace Aftermarket Revenue Sharing Programs ("RSPs") are satisfied through an agreed upon reduction from the sales price of each of the related spare parts. These fees recognize our customer's necessary performance of engine program support activities, such as spare parts administration, warehousing and inventory management, and customer support, and are not separable from our sale of products, and accordingly, they are reflected as a reduction to sales, rather than as costs incurred, when revenues are recognized.
Cash and cash equivalents:
Cash in excess of operating requirements is invested in short-term, highly liquid, income-producing investments. All highly liquid investments purchased with an original maturity of
three
months or less are considered cash equivalents. Cash equivalents are carried at cost which approximates fair value.
Inventories:
Inventories are valued at the lower of cost, determined on a first-in, first-out basis, or net realizable value. The primary components of cost included in inventories are raw material, labor and overhead. Provisions are made to reduce excess or obsolete inventories to their estimated net realizable value. The process for evaluating the value of excess and obsolete inventory often requires the Company to make subjective judgments and estimates concerning future sales levels, quantities and prices at which such inventory will be sold in the normal course of business and estimated costs. Accelerating the disposal process or changes in estimates based on future sales potential or estimated costs may necessitate future adjustments to these provisions.
Property, plant and equipment:
Property, plant and equipment is stated at cost. Depreciation is recorded over estimated useful lives, generally ranging from
20
to
50
years for buildings and
four
to
12
years for machinery and equipment. The straight-line method of depreciation was adopted for all property, plant and equipment placed in service after March 31, 1999. For property, plant and equipment placed into service prior to April 1, 1999, depreciation is calculated using accelerated methods. The Company assesses the impairment of property, plant and equipment subject to depreciation whenever events or changes in circumstances indicate the carrying value may not be recoverable.
Goodwill:
Goodwill represents the excess purchase cost over the fair value of net assets of companies acquired in business combinations. Goodwill is considered an indefinite-lived asset. Goodwill is subject to impairment testing in accordance with accounting standards governing such on an annual basis, in the second quarter, or more frequently if an event or change in circumstances indicates that the fair value of a reporting unit has been reduced below its carrying value. Based on the assessments performed during 2018, there was
no
goodwill impairment.
43
Aerospace Aftermarket Programs:
The Company participates in aftermarket RSPs under which the Company receives an exclusive right to supply designated aftermarket parts over the life of the related aircraft engine program. As consideration, the Company has paid participation fees, which are recorded as long-lived intangible assets. The Company records amortization of the related intangible asset as sales dollars are being earned based on a proportional sales dollar method. Specifically, this method amortizes each asset as a reduction to revenue based on the proportion of sales under a program in a given period to the estimated aggregate sales dollars over the life of that program. This method reflects the pattern in which the economic benefits of the RSPs are realized.
The Company also entered into Component Repair Programs ("CRPs") that provide for, among other items, the right to sell certain aftermarket component repair services for CFM56, CF6, CF34 and LM engines directly to other customers as one of a few GE licensed suppliers. In addition, the CRPs extended certain existing contracts under which the Company currently provides these services directly to GE. The Company recorded the consideration for these rights as an intangible asset that is amortized as a reduction to sales over the remaining life of these engine programs based on the estimated sales over the life of such programs. This method reflects the pattern in which the economic benefits of the CRPs are realized.
The recoverability of each asset is subject to significant estimates about future revenues related to the program’s aftermarket parts and services. The Company evaluates these intangible assets for recoverability and updates amortization rates on an agreement by agreement basis for the RSPs and on an individual asset program basis for the CRPs. The assets are reviewed for recoverability periodically including whenever events or changes in circumstances indicate that their carrying amount may not be recoverable. Annually, the Company evaluates the remaining useful life of these assets to determine whether events and circumstances warrant a revision to the remaining periods of amortization. Management updates revenue projections, which includes comparing actual experience against projected revenue and industry projections. The potential exists that actual revenues will not meet expectations due to a change in market conditions including, for example, the replacement of older engines with new, more fuel-efficient engines or the Company's ability to maintain market share within the Aftermarket business. A shortfall in future revenues may indicate a triggering event requiring a write down or further evaluation of the recoverability of the assets or require the Company to accelerate amortization expense prospectively dependent on the level of the shortfall. The Company has not identified any impairment of these assets.
Other Intangible Assets:
Other intangible assets consist primarily of the Aerospace Aftermarket Programs, as discussed above, customer relationships, tradenames, patents and proprietary technology. These intangible assets, with the exception of certain tradenames, have finite lives and are amortized over the periods in which they provide benefit. The Company assesses the impairment of long-lived assets, including identifiable intangible assets subject to amortization, whenever significant events or significant changes in circumstances indicate the carrying value may not be recoverable. Tradenames with indefinite lives are subject to impairment testing in accordance with accounting standards governing such on an annual basis, in the second quarter, or more frequently if an event or change in circumstances indicates that the fair value of the asset has been reduced below its carrying value. Based on the assessments performed during 2018, there were
no
impairments of other intangible assets. See Note 6 of the Consolidated Financial Statements.
Derivatives:
Accounting standards related to the accounting for derivative instruments and hedging activities require that all derivative instruments be recorded on the balance sheet at fair value. Foreign currency contracts may qualify as fair value hedges of unrecognized firm commitments, cash flow hedges of recognized assets and liabilities or anticipated transactions, or a hedge of a net investment. Changes in the fair market value of derivatives that qualify as fair value hedges or cash flow hedges are recorded directly to earnings or accumulated other non-owner changes to equity, depending on the designation. Amounts recorded to accumulated other non-owner changes to equity are reclassified to earnings in a manner that matches the earnings impact of the hedged transaction. Any ineffective portion, or amounts related to contracts that are not designated as hedges, are recorded directly to earnings. The Company’s policy for classifying cash flows from derivatives is to report the cash flows consistent with the underlying hedged item.
Foreign currency:
Assets and liabilities are translated at year-end rates of exchange; revenues and expenses are translated at average rates of exchange. The resulting translation gains or losses are reflected in accumulated other non-owner changes to equity within stockholders’ equity. A net foreign currency transaction loss of
$3,879
in 2018, and net foreign currency transaction gains of
$756
and
$1,873
in
2017
and
2016
, respectively, were included in other expense (income), net in the Consolidated Statements of Income.
Research and Development:
Costs are incurred in connection with efforts aimed at discovering and implementing new knowledge that is critical to developing new products, processes or services, significantly improving existing products or services, and developing new applications for existing products and services. Research and development expenses for the
44
creation of new and improved products and services were
$16,193
,
$14,765
and
$12,913
, for the years
2018
,
2017
and
2016
, respectively, and are included in selling and administrative expense.
Pension and Other Postretirement Benefits:
The Company accounts for its defined benefit pension plans and other postretirement plans by recognizing the overfunded or underfunded status of the plans, calculated as the difference between
plan assets and the projected benefit obligation related to each plan, as an asset or liability on the Consolidated Balance Sheets. Benefit costs associated with the plans primarily include current service costs, interest costs and the amortization of actuarial losses, partially offset by expected returns on plan assets, which are determined based upon actuarial valuations. Settlement and curtailment losses (gains) may also impact benefit costs. The Company regularly reviews actuarial assumptions, including discount rates and the expected return on plan assets, which are updated at the measurement date, December 31st. The impact of differences between actual results and the assumptions are generally accumulated within Other Comprehensive Income and amortized over future periods, which will affect benefit costs recognized in such periods. See Note 12 to the Consolidated Financial Statements.
Stock-Based Compensation:
Stock-based employee compensation plans are accounted for based on their fair value on the grant date and the related cost is recognized in the Consolidated Statements of Income in accordance with accounting standards related to share-based payments. The fair values of stock options are estimated using the Black-Scholes option-pricing model based on certain assumptions. The fair values of service and performance based share awards are estimated based on the fair market value of the Company’s stock price on the grant date. The fair values of market based performance share awards are estimated using the Monte Carlo valuation method. See Note 13 of the Consolidated Financial Statements.
Income Taxes:
Deferred tax assets and liabilities are recognized for future tax effects attributable to temporary differences, operating loss carryforwards and tax credits. The measurement of deferred tax assets and liabilities is determined using tax rates from enacted tax law of the period in which the temporary differences, operating loss carryforwards and tax credits are expected to be realized. The effect of the change in income tax rates is recognized in the period of the enactment date. The guidance related to accounting for income taxes requires that deferred tax assets be reduced by a valuation allowance if, based on all available evidence, it is more likely than not that the deferred tax asset will not be realized. The Company is exposed to certain tax contingencies in the ordinary course of business and records those tax liabilities in accordance with the guidance for accounting for uncertain tax positions. See Note 14 of the Consolidated Financial Statements.
Recent Accounting Standards
The Financial Accounting Standards Board ("FASB") establishes changes to accounting principles under U.S. GAAP through the use of Accounting Standards Updates ("ASUs") to the FASB's Accounting Standards Codification. The Company evaluates the applicability and potential impacts of recent ASUs on its Consolidated Financial Statements and related disclosures.
Recently Adopted Accounting Standards
In May 2014, the FASB amended its guidance related to revenue recognition. The amended guidance establishes a single comprehensive model for companies to use in accounting for revenue arising from contracts with customers and supersedes most of the existing revenue recognition guidance, including industry-specific guidance. The amended guidance clarifies that an entity recognizes revenue to depict the transfer of promised goods or services to customers in an amount that reflects the consideration to which the entity expects to be entitled in exchange for those goods or services. In applying the amended guidance, an entity (1) identifies the contract(s) with a customer; (2) identifies the performance obligations in the contract; (3) determines the transaction price; (4) allocates the transaction price to the contract’s performance obligations; and (5) recognizes revenue when (or as) the entity satisfies a performance obligation. The amended guidance applies to all contracts with customers except those that are within the scope of other topics in the FASB Accounting Standards Codification. Entities had the option of using either a full retrospective or modified retrospective approach to the amended guidance.
The Company adopted the amended guidance, Accounting Standard Codification 606, Revenue from Contracts with Customers (“ASC 606”), and related amendments, using the modified retrospective approach on January 1, 2018, at which time it became effective for the Company. The Company recognized the cumulative effect of initially applying the new revenue standard to all contracts that were not completed on the date of adoption as an adjustment to the opening balance of retained earnings. The comparative information has not been restated and continues to be reported under the accounting standards in effect during those periods.
45
A majority of revenue continues to be recognized when products are shipped. Under the amended guidance, however, a certain portion of our businesses with customized products or contracts in which we perform work on customer-owned assets require the use of an "over time" recognition model as certain of these contracts meet one or more of the criteria established in the amended guidance. Revenue recognition on contracts requiring over time accounting recognition created unbilled receivables (contract assets) and reduced inventory on the Company’s Consolidated Balance Sheet. Adoption of the amended guidance also resulted in the recognition of customer advances for which the Company has received an unconditional right to payment. Since the related performance obligations have not been satisfied, however, the Company will recognize these customer advances as trade receivables, with a corresponding contract liability of equal amount. Under the previous guidance, the Company recognized customer advances when payment was received.
The cumulative effect of the changes made to the Consolidated Balance Sheet as of January 1, 2018 for the adoption of ASC 606 were as follows:
|
Balance at December 31, 2017
|
Adjustments Due to ASC 606
|
Balance at January 1, 2018
|
|||||||||
|
Assets
|
|||||||||||
|
Accounts receivable, less allowances
|
$
|
348,943
|
|
$
|
13,536
|
|
$
|
362,479
|
|
||
|
Inventories
|
241,962
|
|
(8,908
|
)
|
233,054
|
|
|||||
|
Prepaid expenses and other current assets
|
32,526
|
|
14,579
|
|
47,105
|
|
|||||
|
Deferred income taxes
|
12,161
|
|
(990
|
)
|
11,171
|
|
|||||
|
Liabilities
|
|||||||||||
|
Accrued liabilities
|
181,241
|
|
13,536
|
|
194,777
|
|
|||||
|
Deferred income taxes
|
73,505
|
|
386
|
|
73,891
|
|
|||||
|
Stockholders' equity
|
|||||||||||
|
Retained earnings
|
1,206,723
|
|
4,295
|
|
1,211,018
|
|
|||||
The impact of adoption on the Consolidated Statements of Income and Balance Sheets was as follows:
|
Twelve Months Ended
December 31, 2018 |
||||||||||||
|
As Reported
|
Balances Without Adoption of ASC 606
|
Effect of Change
Higher/(Lower)
|
||||||||||
|
Consolidated Statement of Income
|
||||||||||||
|
Net sales
|
$
|
1,495,889
|
|
$
|
1,498,662
|
|
$
|
(2,773
|
)
|
|||
|
Cost of sales
|
963,524
|
|
964,657
|
|
(1,133
|
)
|
||||||
|
Operating income
|
231,764
|
|
233,404
|
|
(1,640
|
)
|
||||||
|
Income before income taxes
|
207,495
|
|
209,135
|
|
(1,640
|
)
|
||||||
|
Income taxes
|
41,309
|
|
41,699
|
|
(390
|
)
|
||||||
|
Net income
|
166,186
|
|
167,436
|
|
(1,250
|
)
|
||||||
46
|
December 31, 2018
|
|||||||||||
|
As Reported
|
Balances Without Adoption of ASC 606
|
Effect of Change Higher/(Lower)
|
|||||||||
|
Consolidated Balance Sheet
|
|||||||||||
|
Assets
|
|||||||||||
|
Accounts receivable, less allowances
|
$
|
382,253
|
|
$
|
366,870
|
|
$
|
15,383
|
|
||
|
Inventories
|
265,990
|
|
273,712
|
|
(7,722
|
)
|
|||||
|
Prepaid expenses and other current assets
|
57,184
|
|
45,340
|
|
11,844
|
|
|||||
|
Deferred income taxes
|
20,474
|
|
21,056
|
|
(582
|
)
|
|||||
|
—
|
|
||||||||||
|
Liabilities
|
—
|
|
|||||||||
|
Accrued liabilities
|
206,782
|
|
191,292
|
|
15,490
|
|
|||||
|
Deferred income taxes
|
106,559
|
|
106,163
|
|
396
|
|
|||||
|
—
|
|
||||||||||
|
Stockholders' equity
|
—
|
|
|||||||||
|
Retained earnings
|
1,363,772
|
|
1,360,727
|
|
3,045
|
|
|||||
|
Accumulated other changes to equity
|
(190,500
|
)
|
(190,161
|
)
|
(339
|
)
|
|||||
In July 2015, the FASB amended its guidance related to the measurement of inventory. The amended guidance requires inventory to be measured at the lower of cost and net realizable value and thereby simplifies the prior guidance of measuring inventory at the lower of cost or market. The amended guidance is effective prospectively for fiscal years, and interim periods within those fiscal years, beginning after December 15, 2016. The Company adopted the guidance during the first quarter of 2017 and it did not have a material impact on its Consolidated Financial Statements.
In August 2016, the FASB amended its guidance related to the Statement of Cash Flows. The amended guidance clarifies how certain cash receipts and cash payments should be presented on the statement of cash flows. The guidance is effective for annual periods beginning after December 15, 2017 and interim periods within those fiscal years. The Company adopted the guidance during the first quarter of 2018 and the adoption did not have an impact on its Statement of Cash Flows.
In January 2017, the FASB amended its guidance related to goodwill impairment testing. The amended guidance simplifies the subsequent measurement of goodwill, eliminating Step 2 from the goodwill impairment test. Under the amended guidance, companies should perform their annual goodwill impairment test by comparing the fair value of a reporting unit with its carrying amount. Companies would recognize an impairment charge for the amount by which the carrying amount exceeds the reporting unit's fair value, assuming the loss recognized does not exceed the total amount of goodwill for the reporting unit. The amended guidance is effective for fiscal years beginning after December 15, 2019. Early adoption is permitted. The Company elected to early adopt this amended guidance during the second quarter of 2018 in connection with its annual goodwill impairment testing and it did not have an impact on the Company's Consolidated Financial Statements.
In March 2017, the FASB amended its guidance related to the presentation of pension and other postretirement benefit costs. The amended guidance requires the bifurcation of net periodic benefit cost for pension and other postretirement plans. The service cost component of expense will be presented with other employee compensation costs in operating income, consistent with the current guidance. The other components of expense, however, will be reported separately outside of operating income. The amended guidance also allows only the service cost component of net benefit cost to be eligible for capitalization. The guidance is effective for annual periods beginning after December 15, 2017 and interim periods within that reporting period. The Company adopted the amended guidance during the first quarter of 2018. The amended guidance was applied retrospectively for the presentation of the service cost component and the other components of net periodic benefit cost in the Statements of Income. Additionally, the amended guidance was applied prospectively for the capitalization of the service cost component of net periodic benefit cost. The amended guidance allows for a practical expedient that permits the use of amounts previously disclosed in the pension and other postretirement benefit plan Note within the prior comparative periods as the estimation basis for applying the retrospective presentation requirements. The Company elected this practical expedient for prior period presentation. During the twelve month period ended December 31, 2017, the adoption of this amended guidance
47
resulted in the reclassification of
$(3,827)
of net periodic benefit cost from compensation costs (included in Cost of Sales and Selling and Administrative expenses) to other expense (income), net on the Statements of Income. This reclassification included all components of net periodic benefit cost other than the service cost component, with the primary drivers relating to the pension curtailment and settlement gains of
($7,217)
and
($230)
, respectively, resulting from the June 2017 closure of the FOBOHA facility located in Muri, Switzerland. See Note 12 of the Consolidated Financial Statements for additional detail related to the curtailment and settlements gains and Note 9 for additional details related to the restructure of the Muri, Switzerland facility.
In February 2018, the FASB issued guidance related to the impacts of the tax legislation commonly referred to as the Tax Cuts and Jobs Act (the “Act”). The guidance permits the reclassification of certain income tax effects of the Act from Accumulated Other Comprehensive Income to Retained Earnings (stranded tax effects). The stranded tax effects resulted from the December 31, 2017 remeasurement of deferred income taxes that was recorded through the Consolidated Statements of Income, with no corresponding adjustment to Accumulated Other Comprehensive Income having been initially recognized. The guidance is effective for annual periods beginning after December 15, 2018, and interim periods within that reporting period. Early adoption is permitted. The Company elected to early adopt this amended guidance during the first quarter of 2018 using specific identification and as a result reclassified
$19,331
from Accumulated Other Comprehensive Income to Retained Earnings on the Consolidated Balance Sheets. This reclassification relates only to the change in the U.S. Corporate income tax rate.
In August 2018, the FASB issued new guidance related to a customer's accounting for implementation, set-up, and other upfront costs incurred in a cloud computing arrangement that is hosted by a vendor (for example, a service contract). Pursuant to the new guidance, customers will apply the same criteria for capitalizing implementation costs in a hosting arrangement as they would for an arrangement that has a software license. The new guidance is effective for fiscal years beginning after December 15, 2019, and interim periods within those fiscal years. Early adoption is permitted, including adoption in any interim period for which financial statements have not been issued. The FASB provided the option of applying the guidance retrospectively or prospectively to all implementation costs incurred after the date of adoption. The Company elected to early adopt this guidance, prospectively, during the third quarter of 2018, and it did not have a material impact on the Consolidated Financial Statements.
Recently Issued Accounting Standards
In February 2016, the FASB amended its guidance related to lease accounting. The amended guidance requires lessees to
recognize a majority of their leases on the balance sheet as a right-of-use ("ROU") asset and a lease liability. Lessees are permitted to make an accounting policy election to not recognize an asset and liability for leases with a term of twelve months or less. Lease expense will be recorded in a manner similar to current accounting, with leases being classified as either finance or operating in nature. The guidance is effective for fiscal years, and interim periods within those fiscal years, beginning after December 15, 2018. Early adoption is permitted.
The Company will adopt the new standard using the modified retrospective approach on January 1, 2019 at which time it becomes effective for the Company. The Company will elect an available transition method that uses the effective date of the amended guidance as the date of initial application. The Company has completed its review of its lease agreements and processed the data required to measure the Company's ROU assets and lease liabilities. The Company implemented a lease accounting software to support its assessment and analysis of leases. The Company has also implemented changes to existing process, policies and systems to accommodate financial and disclosure requirements. The Company is continuing to implement design changes to such business processes, controls and systems to ensure that changes are effective.
The FASB has made available several practical expedients in adopting the amended lease accounting guidance. The Company will elect the package of practical expedients permitted under the transition guidance within the amended guidance, which among other things, allows registrants to carry forward historical lease classification. The Company will elect the practical expedient that allows the combination of both lease and non-lease components as a single component and account for it as a lease for all classes of underlying assets. The Company will elect to not apply the amended guidance to short term leases with an initial term of 12 months or less. The Company will recognize those lease payments in the Consolidated Statements of Income on a straight-line basis over the lease term. The Company will elect to use a single discount rate for a portfolio of leases with reasonably similar characteristics. Lastly, the Company will elect the practical expedient related to land easements, allowing the carry forward of accounting treatment for land easements on existing agreements.
48
The Company estimates that adoption of the standard will result in the recognition of ROU assets and related lease liabilities on the Consolidated Balance Sheet of approximately
$30,000
related to operating lease commitments, as of January 1, 2019, with no impact to retained earnings. The Company does not expect the amended guidance to have a material impact on its cash flows or results of operations.
In August 2017, the FASB amended its guidance related to hedge accounting. The amended guidance makes more financial and nonfinancial hedging strategies eligible for hedge accounting, amends presentation and disclosure requirements and changes the assessment of effectiveness. The guidance also more closely aligns hedge accounting with management strategies, simplifies application and increases the transparency of hedging. The amended guidance is effective January 1, 2019, with early adoption permitted in any interim period. The Company will adopt the amended guidance on January 1, 2019 and does not expect the impact on its Consolidated Financial Statements to be material.
In August 2018, the FASB amended its guidance related to disclosure requirements for employers that sponsor defined benefit pension or other postretirement plans. The amended requirements serve to remove, add and otherwise clarify certain existing disclosures. The amended guidance is effective for fiscal years ending after December 15, 2020. The guidance requires application on a retrospective basis to all periods presented. The Company is currently evaluating the impact that the guidance may have on the disclosures within its Consolidated Financial Statements.
2. Acquisitions
The Company has acquired a number of businesses during the past
three years
. The results of operations of these acquired businesses have been included in the consolidated results from the respective acquisition dates. The purchase prices for these acquisitions have been allocated to tangible and intangible assets and liabilities of the businesses based upon estimates of their respective fair values.
In the third quarter of 2018, the Company acquired Industrial Gas Springs Group Holdings Limited (“IGS”), a recognized designer, manufacturer and supplier of customized gas springs. IGS is headquartered in the United Kingdom, with distribution and assembly capabilities in the United States. Its diversified end markets include general industrial, transportation, aerospace, and medical, among others. The Company acquired IGS for an aggregate purchase price of
29,138
British pound sterling (
$38,016
) which includes post closing adjustments under the terms of the Share Purchase Agreement, including
2,820
British pound sterling (
$3,679
) related to cash acquired. The acquisition was financed using cash on hand and borrowings under the Company's revolving credit facility. In connection with the acquisition, the Company recorded
$14,098
of goodwill and
$15,300
of intangible assets. See Note 6 to the Consolidated Financial Statements.
In the fourth quarter of 2018, the Company completed its acquisition of Gimatic S.r.l. (“Gimatic”). Gimatic designs and develops robotic grippers, advanced end-of-arm tooling systems, sensors and other automation components. Headquartered in Brescia, Italy, Gimatic has a sales network extending across Europe, North America and Asia. Its diversified end markets include automotive, packaging, health care, and food and beverage, among others. The Company acquired Gimatic for an aggregate purchase price of
362,352
Euro (
$409,893
), which includes preliminary adjustments under the terms of the Sale and Purchase Agreement, including approximately
7,790
Euro (
$8,812
) related to cash acquired, and is subject to post closing adjustments under the terms of the Sale and Purchase Agreement. The Company paid
357,994
Euro (
$404,962
) in cash, using cash on hand and additional borrowings under the Company's existing revolving credit facility, including the utilization of funds made available through the accordion feature provided by the facility, and recorded liabilities of
4,358
Euro (
$4,931
) for estimated payments to the seller under the terms of the Sale and Purchase Agreement. These liabilities are recorded within accrued liabilities within the Consolidated Balance Sheet as of December 31, 2018. In connection with the acquisition, the Company recorded
$271,257
of goodwill and
$158,800
of intangible assets. See Note 6 to the Consolidated Financial Statements.
The Company incurred
$5,420
of acquisition-related costs during the year ended December 31, 2018 related to the IGS and Gimatic acquisitions. These costs include due diligence costs and transaction costs to complete the acquisition and have been recognized in the Consolidated Statements of Income as selling and administrative expenses.
The operating results of IGS and Gimatic have been included in the Consolidated Statements of Income since the dates of acquisition. For the year ended December 31, 2018, the Company reported
$6,360
in net sales and an operating loss of
$1,726
at IGS, inclusive of
$2,887
of short-term purchase accounting adjustments, and
$8,793
in net sales and an operating loss of
$2,109
at Gimatic, inclusive of
$2,707
of short-term purchase accounting adjustments. IGS and Gimatic results have been included within the Industrial segment's operating profit.
49
The following table summarizes the fair values of the assets acquired, net of cash acquired, and liabilities assumed at the October 31, 2018 date of acquisition for Gimatic and the July 23, 2018 acquisition date for IGS. Fair values are inclusive of purchase price adjustments that were made subsequent to the respective acquisition dates:
|
IGS
|
Gimatic
|
|||||||
|
Accounts receivable
|
$
|
3,300
|
|
$
|
11,552
|
|
||
|
Inventories
|
5,706
|
|
21,112
|
|
||||
|
Prepaid expenses and other current assets
|
198
|
|
7,743
|
|
||||
|
Deferred income taxes
|
—
|
|
917
|
|
||||
|
Property, plant and equipment, net
|
1,557
|
|
7,167
|
|
||||
|
Goodwill (Note 6)
|
14,098
|
|
271,257
|
|
||||
|
Other intangible assets, net (Note 6)
|
15,300
|
|
158,800
|
|
||||
|
Other assets
|
—
|
|
144
|
|
||||
|
Total assets acquired
|
40,159
|
|
478,692
|
|
||||
|
Accounts payable
|
(927
|
)
|
(3,825
|
)
|
||||
|
Accrued liabilities
|
(603
|
)
|
(14,096
|
)
|
||||
|
Debt assumed
|
—
|
|
(5,990
|
)
|
||||
|
Other liabilities
|
(678
|
)
|
(7,126
|
)
|
||||
|
Deferred income taxes
|
(3,614
|
)
|
(46,574
|
)
|
||||
|
Total liabilities assumed
|
(5,822
|
)
|
(77,611
|
)
|
||||
|
Net assets acquired
|
$
|
34,337
|
|
$
|
401,081
|
|
||
The final purchase price allocation related to IGS reflects post-closing adjustments pursuant to the terms of the Share Purchase Agreement. The final purchase price allocation related to Gimatic remains subject to post-closing adjustments pursuant to the terms of the Sale and Purchase Agreement.
The following table reflects the unaudited pro forma operating results of the Company for the years ended December 31, 2018 and 2017, which give effect to the acquisitions of Gimatic and IGS as if they had occurred on January 1, 2017. The pro forma results are based on assumptions that the Company believes are reasonable under the circumstances. The pro forma results are not necessarily indicative of the operating results that would have occurred had the acquisitions been effective January 1, 2017, nor are they intended to be indicative of results that may occur in the future. The underlying pro forma information includes the historical financial results of the Company, Gimatic and IGS adjusted for certain items including amortization expense associated with the assets acquired and the Company’s expense related to financing arrangements, with the related tax effects. The pro forma information does not include the effects of any synergies or cost reduction initiatives related to the acquisitions.
|
(Unaudited Pro Forma)
|
|||||||
|
2018
|
2017
|
||||||
|
Net Sales
|
$
|
1,555,481
|
|
$
|
1,501,515
|
|
|
|
Net Income
|
171,422
|
|
44,029
|
|
|||
|
Per common share:
|
|||||||
|
Basic:
|
|||||||
|
Net Income
|
$
|
3.28
|
|
$
|
0.81
|
|
|
|
Diluted:
|
|||||||
|
Net Income
|
$
|
3.24
|
|
$
|
0.81
|
|
|
50
Pro forma earnings during the year ended December 31, 2018 were adjusted to exclude non-recurring items including acquisition-related costs and amortization related to the fair value adjustment to inventory. Pro forma earnings in 2017 were adjusted to include acquisition-related costs of
$5,420
and amortization of
$10,905
related to the fair value adjustments to inventory.
In the second quarter of 2017, the Company completed its acquisition of the assets of the privately held Gammaflux L.P. business ("Gammaflux"), a leading supplier of hot runner temperature and sequential valve gate control systems to the plastics industry. Gammaflux, which is headquartered in Sterling, Virginia and has offices in Illinois and Germany, provides temperature control solutions for injection molding, extrusion, blow molding, thermoforming, and other applications. Its end markets include packaging, electronics, automotive, household products, medical, and tool building. The Company acquired the assets of Gammaflux for an aggregate purchase price of
$8,866
, which was financed using cash on hand and borrowings under the Company's revolving credit facility. The purchase price includes adjustments under the terms of the Asset Purchase Agreement, including
$2
related to cash acquired. In connection with the acquisition, the Company recorded
$1,535
of goodwill and
$3,700
of intangible assets. See Note 6 to the Consolidated Financial Statements.
The Company incurred
$210
of acquisition-related costs during the year ended December 31, 2017 related to the Gammaflux acquisition. These costs include due diligence costs and transaction costs to complete the acquisition and have been recognized in the Consolidated Statements of Income as selling and administrative expenses.
The operating results of Gammaflux since the date of acquisition have been included in the Consolidated Statements of Income for the period ended December 31, 2017. The Company reported
$9,081
in net sales for Gammaflux for the year ended December 31, 2017. Gammaflux results have been included within the Industrial segment's operating profit.
In the third quarter of 2016, the Company, through
three
of its subsidiaries (collectively, the “Purchaser”), completed its acquisition of the molds business of Adval Tech Holding AG and Adval Tech Holdings (Asia) Pte. Ltd. ("FOBOHA"). FOBOHA is headquartered in Haslach, Germany and currently operates out of manufacturing facilities located in Germany and China. When acquired, FOBOHA also operated out of a third manufacturing facility located in Switzerland; however, this operation was consolidated and closed during 2017. See Note 9 to the Consolidated Financial Statements. The Company completed its purchase of the Germany and Switzerland businesses on August 31, 2016. The purchase of the China business required government approval which was granted on September 30, 2016. On October 7, 2016, shares of the China operations were subsequently transferred to the Company upon payment, per the terms of the Share Purchase Agreement for these respective operations ("China SPA"). The Company, pursuant to the terms and conditions within the Share Purchase Agreement ("FOBOHA SPA"), assumed economic control of the China business effective August 31, 2016. Having both economic control and the benefits and risks of ownership during the period from August 31, 2016 through September 30, 2016, the Company included the results of the China business within the consolidated results of operations of the Company during this period.
FOBOHA specializes in the development and manufacture of complex plastic injection molds for packaging, medical, consumer and automotive applications. The Company acquired FOBOHA for an aggregate cash purchase price of CHF
137,918
(
$140,203
) which was financed using cash on hand and borrowings under the Company's revolving credit facility. The purchase price includes adjustments under the terms of the FOBOHA SPA, including approximately CHF
11,342
(
$11,530
) related to cash acquired. In connection with the acquisition, the Company recorded
$39,800
of intangible assets and
$75,574
of goodwill. See Note 6 to the Consolidated Financial Statements.
The Company incurred
$2,193
of acquisition-related costs during the year ended December 31, 2016 related to the FOBOHA acquisition. These costs include due diligence costs and transaction costs to complete the acquisition and have been recognized in the Company's Consolidated Statements of Income as selling and administrative expenses.
The operating results of FOBOHA since the date of acquisition have been included in the Consolidated Statements of Income for the period ended December 31, 2016. The Company reported
$18,348
in net sales for FOBOHA for the year ended December 31, 2016. FOBOHA results have been included within the Industrial segment's operating profit.
3. Revenue
The Company is a global provider of highly engineered products, differentiated industrial technologies, and innovative solutions, serving a wide range of end markets and customers. Its specialized products and services are used in far-reaching applications including aerospace, transportation, manufacturing, automation, healthcare, and packaging. The Company accounts
51
for revenue in accordance with ASC 606, which it adopted on January 1, 2018, using the modified retrospective approach. Note 1 of the Consolidated Financial Statements further discusses this adoption.
Revenue is recognized by the Company when control of product or solution is transferred to the customer. Control is generally transferred when products are shipped or delivered to customers, title is transferred, the significant risks and rewards of ownership have transferred, the Company has rights to payment and rewards of ownership pass to the customer. Customer acceptance may also be a factor in determining whether control of the product has transferred. Although revenue is generally transferred at a point in time, a certain portion of businesses with customized products or contracts in which the Company performs work on customer-owned assets requires the use of an over time recognition model as certain contracts meet one or more of the established criteria pursuant to ASC 606. Also, service revenue is recognized as control transfers, which is concurrent with the services being performed.
The following table presents the Company's revenue disaggregated by products and services, geographic regions and end markets, by segment.
|
2018
|
|||||||||||
|
Industrial
|
Aerospace
|
Total Company
|
|||||||||
|
Product and Services
|
|||||||||||
|
Engineered Components Products
|
$
|
285,929
|
|
|
$
|
—
|
|
|
$
|
285,929
|
|
|
Molding Solutions Products
|
503,793
|
|
|
—
|
|
|
503,793
|
|
|||
|
Force & Motion Control Products
|
196,212
|
|
|
—
|
|
|
196,212
|
|
|||
|
Automation Products
|
8,793
|
|
—
|
|
8,793
|
|
|||||
|
Aerospace Original Equipment Manufacturer Products
|
—
|
|
|
336,987
|
|
|
336,987
|
|
|||
|
Aerospace Aftermarket Product and Services
|
—
|
|
|
164,175
|
|
|
164,175
|
|
|||
|
$
|
994,727
|
|
|
$
|
501,162
|
|
|
$
|
1,495,889
|
|
|
|
Geographic Regions
(A)
|
|||||||||||
|
Americas
|
$
|
394,361
|
|
|
$
|
358,183
|
|
|
$
|
752,544
|
|
|
Europe
|
368,159
|
|
|
94,561
|
|
|
462,720
|
|
|||
|
Asia
|
228,663
|
|
|
44,298
|
|
|
272,961
|
|
|||
|
Other
|
3,544
|
|
|
4,120
|
|
|
7,664
|
|
|||
|
$
|
994,727
|
|
|
$
|
501,162
|
|
|
$
|
1,495,889
|
|
|
|
End Markets
|
|||||||||||
|
Aerospace OEM
|
$
|
10,191
|
|
$
|
336,987
|
|
$
|
347,178
|
|
||
|
Aerospace Aftermarket
|
—
|
|
164,175
|
|
164,175
|
|
|||||
|
Medical, Personal Care & Packaging
|
220,269
|
|
—
|
|
220,269
|
|
|||||
|
Tool and Die
|
115,635
|
|
—
|
|
115,635
|
|
|||||
|
General Industrial
|
244,007
|
|
—
|
|
244,007
|
|
|||||
|
Auto Molding Solutions
|
208,767
|
|
—
|
|
208,767
|
|
|||||
|
Auto Production
|
187,065
|
|
—
|
|
187,065
|
|
|||||
|
Automation
|
8,793
|
|
—
|
|
8,793
|
|
|||||
|
$
|
994,727
|
|
$
|
501,162
|
|
$
|
1,495,889
|
|
|||
(A) Sales by geographic market are based on the location to which the product is shipped.
Revenue from goods and services transferred to customers at a point in time accounted for approximately
90 percent
of revenue for year ended December 31, 2018. A majority of revenue within the Industrial segment and Aerospace OEM business,
52
along with a portion of revenue within the Aerospace Aftermarket business, is recognized at a point in time, primarily when the product or solution is shipped to the customer.
Revenue from products and services transferred to customers over time accounted for approximately
10 percent
of revenue for year ended December 31, 2018. The Company recognizes revenue over time in instances where a contract supports a continual transfer of control to the customer. Substantially all of our revenue in the Aerospace maintenance repair and overhaul business and a portion of the Engineered Components products, Molding Solutions products and Aerospace OEM products is recognized over time. Within the Molding Solution businesses and Aerospace Aftermarket business, this continual transfer of control to the customer results from repair and refurbishment work performed on customer controlled assets. With other contracts, this continual transfer of control to the customer is supported by clauses in the contract where we deliver products that do not have an alternative use and requires an enforceable right to payment of costs incurred (plus a reasonable profit) or the Company has a contractual right to complete any work in process and receive full contract price.
Performance Obligations.
A performance obligation represents a promise within a contract to provide a distinct good or service to the customer and is the unit of accounting pursuant to ASC 606. The Company accounts for a contract when it has approval and commitment from both parties, the rights of the parties are identified, payment terms are identified, the contract has commercial substance and collectibility of consideration is probable. Transaction price reflects the amount of consideration which the Company expects to be entitled in exchange for transferred goods or services. A contract’s transaction price is allocated to each distinct performance obligation and revenue is recognized as the performance obligation is satisfied. For many of our contracts, the Company may provide distinct products or services in which case we separate the contract into more than one performance obligation (i.e. a product or service is individually listed in a contract or sold individually to a customer). In certain contracts, a product or service may be part of a fully integrated solution, in which case it is bundled into a single performance obligation. If a contract is separated into more than one performance obligation, the Company allocates the total transaction price to each performance obligation in an amount based on the estimated relative standalone selling prices of the promised goods or services underlying each performance obligation. The Company generally sells both standard and customized products with observable standalone selling prices.
The majority of our revenues are from contracts, as defined by ASC 606, that are less than one year, however certain Aerospace OEM and Industrial Molding Solutions business contracts extend beyond one year. In the Industrial segment, customers are typically OEMs or suppliers to OEMs and in some businesses, with distributors. In the Aerospace segment, customers include commercial airlines, OEMs and other aircraft and military parts providers.
To determine the proper revenue recognition method for contracts, the Company uses judgment to evaluate whether two or more contracts with the same customer should be combined and accounted for as one single contract and whether the combined or single contract should be accounted for as more than one performance obligation. Contracts within the Aerospace OEM and Engineered Components businesses typically have contracts that are combined as the customer may issue multiple purchase orders at or near the same point in time under the terms of a long term agreement. The decision to combine a group of contracts or separate the combined or single contract into multiple performance obligations involves judgment but does not typically impact the amount of revenue and profit recorded in a given period since our contract prices generally represent standalone selling prices. For many of our contracts, particularly within our Molding Solutions and Force & Motion Control businesses, the Company may incorporate a set of tasks and components into a fully integrated system or solution.
Contracts may be modified to account for changes in specifications and requirements. The Company considers contractual modifications to exist when the modification either creates new rights or changes the existing enforceable rights and obligations. Contract modifications within certain businesses typically relate to goods or services that are distinct from the existing contract and are accounted for as a new contract. Pricing changes, if included within a contract modification, are generally prospective. Contract modifications within the Molding Solutions businesses and a portion of the Force & Motion Control business may impact the existing contract. Contract revenue at these businesses is generally recorded on a point in time basis, however, and therefore no cumulative sales adjustment is typically required.
Revenue is recognized in an over time model based on the extent of progress towards completion of the performance obligation. The selection of the method to measure progress towards completion requires judgment and is based on the nature of the products or services to be provided. The Company utilizes the cost-to-cost measure of progress for over time contracts as we believe this measure best depicts the transfer of control to the customer, which occurs as we incur costs on contracts. Under
the cost-to-cost measure of progress, the extent of progress towards completion is measured based on the ratio of costs incurred to date to the total estimated costs at completion of the performance obligation. Revenues, including profits, are recorded
53
proportionally as costs are incurred. Costs to fulfill include labor, materials, subcontractors’ costs, and other direct and indirect costs.
Contract Estimates.
Due to the nature of the work performed in completing certain performance obligations, the estimation of both total revenue and cost at completion (the process described above) includes a number of variables and requires significant judgment.
Estimating total contract revenue may require judgment as certain contracts contain pricing discount structures, rebates, early payment discounts, or other provisions that can impact transaction price. The Company generally estimates variable consideration utilizing the expected value methodology as multiple inputs are considered and weighed, such as customer history, customer forecast communications, economic outlooks, and industry data. In certain circumstances where a particular outcome is probable, we utilize the most likely amount to which we expect to be entitled. The Company includes estimated amounts in the transaction price to the extent it is probable that a significant reversal of cumulative revenue recognized will not occur when the uncertainty associated with the variable consideration is resolved. The Company has opted not to adjust the promised amount of consideration for the effects of a financing component when the period between when we transfer a promised product or service to a customer and when the customer pays for that product or service is one year or less.
Certain customers are eligible to earn rebates from product purchases. For certain of these rebates, the customer can earn prospectively higher rebates upon reaching predetermined sales volumes and in other cases, the customer can receive product by achieving predetermined sales volumes. These rebates are considered to be material rights as the customer, as part of their current contract, are purchasing an option that they would not have received without the contract to either purchase future product at a lower price or receive free product. When a contract contains a material right, a portion of the transaction price is allocated to the material right for which revenue recognition is deferred until the customer exercises its option. The standalone selling price for a material right used to allocate the transaction price is determined at contract inception by calculating the portion of the option purchased relative to the estimated total amount of incremental value the customer will likely earn, based on historical data, customer forecast communications, current economic information, and industry trends. The standalone selling price of a material right is not adjusted prior to customer exercise or option expiration.
Estimating the total expected costs related to contracts also requires significant judgment. The Aerospace OEM business has an Estimate at Completion (EAC) process in which management reviews the progress and execution of our performance obligations for significant contracts with revenue recognized under an over time model. As part of this process, management reviews information including, but not limited to, performance under the contract, progress towards completion, identified risks and opportunities, sourcing determinations and related changes in estimates of costs to be incurred. These considerations include management's judgment about the ability and cost to achieve technical requirements and other contract requirements. Management makes assumptions and estimates using the best information available regarding labor efficiency, the complexity of the work to be performed, the availability of materials, the length of time to complete the performance obligation (e.g., to estimate increases in wages and prices for materials and related support cost allocations), execution by our subcontractors and overhead cost rates, among other variables.
The Company generally utilizes the portfolio approach, a practical expedient, to estimate the amount of revenue to recognize for certain other contracts which require over time revenue recognition. Such contracts are grouped together either by revenue stream, customer or product. Each portfolio of contracts is grouped together based on having similar characteristics. The portfolio approach is utilized only when the result of the accounting is not expected to be materially different than if applied to individual contracts. For each portfolio of contracts, the respective work in process and/or finished goods inventory balances are identified and the portfolio-specific margin is applied to estimate the pro-rata portion of revenue earned in relation to the costs incurred.
Adjustments to net sales, cost of sales and the related impact to operating income are recognized as necessary in the period they become known. The resultant impacts from these changes in estimates are recognized on a cumulative catch-up basis, which recognizes in the current period the cumulative effect of the changes on both current and prior periods. Revenue recognized from performance obligations satisfied in previous periods was not material in 2018.
Contract Balances
. The timing of revenue recognition, invoicing and cash collections affect accounts receivable, unbilled receivables (contract assets) and customer advances and deposits (contract liabilities) on the Consolidated Balance Sheets.
54
Unbilled Receivables (Contract Assets)
- Pursuant to the over time revenue recognition model, revenue may be recognized prior to the customer being invoiced. An unbilled receivable is recorded to reflect revenue that is recognized when 1) the cost-to-cost method is applied and 2) such revenue exceeds the amount invoiced to the customer. Unbilled receivables are included within prepaid expenses and other current assets on the Consolidated Balance Sheet as of December 31, 2018.
Customer Advances and Deposits (Contract Liabilities)
- The Company may receive a customer advance or deposit, or have an unconditional right to receive a customer advance, prior to revenue being recognized. Certain contracts within the Molding Solutions businesses, for example, may require such advances. Since the performance obligations related to such advances may not have been satisfied, a contract liability is established. An offsetting asset of equal amount is recorded as an account receivable until the advance is collected. Advances and deposits are included within accrued liabilities on the Consolidated Balance Sheets until the respective revenue is recognized. Advance payments are not considered a significant financing component as they are generally received less than one year before the customer solution is completed.
These assets and liabilities are reported on the Consolidated Balance Sheet on an individual contract basis at the end of each reporting period.
Net contract assets (liabilities) consisted of the following:
|
December 31, 2018
|
January 1, 2018
|
$ Change
|
% Change
|
|||||||||||
|
Unbilled receivables (contract assets)
|
$
|
11,844
|
|
$
|
14,579
|
|
$
|
(2,735
|
)
|
(19
|
)%
|
|||
|
Contract liabilities
|
(57,522
|
)
|
(54,007
|
)
|
(3,515
|
)
|
7
|
%
|
||||||
|
Net contract liabilities
|
$
|
(45,678
|
)
|
$
|
(39,428
|
)
|
$
|
(6,250
|
)
|
16
|
%
|
|||
Contract liabilities balances at December 31, 2018 and January 1, 2018 include
$15,438
and
$13,536
, respectively, of customer advances for which the Company has an unconditional right to collect payment. Accounts receivable, as presented on the Consolidated Balance Sheet and within Note 1, includes corresponding balances at December 31, 2018 and January 1, 2018, respectively.
Changes in the net contract asset (liability) balance during the year ended December 31, 2018 were impacted by a
$3,515
increase in contract liabilities, driven primarily by new customer advances and deposits, partially offset by revenue recognized in the current period. Adding to this contract liability increase was a
$2,735
decrease in contract assets, driven primarily by earlier contract progress being invoiced to the customer, partially offset by contract progress (i.e.unbilled receivable).
The Company recognized approximately
90%
of the revenue related to the contract liability balance as of January 1, 2018 during the year ended December 31, 2018, primarily representing revenue from the sale of molds and hot runners within the Molding Solutions business.
Contract Costs.
The Company may incur costs to fulfill a contract. Costs are incurred to develop, design and manufacture tooling to produce a customer’s customized product in conjunction with certain of its contracts, primarily in the Aerospace OEM business. For certain contracts, control related to this tooling remains with the Company. The tooling may be deemed recoverable over the life of the related customer contract (oftentimes a long-term agreement). The Company therefore capitalizes these tooling costs and amortizes them over the shorter of the tooling life or the duration of the long-term agreement. The Company may also incur costs related to the development of product designs (molds or hot runner systems) within its Molding Solutions businesses. Control of the design may be retained by the Company and deemed recoverable over the contract to build the systems or mold, therefore this design work cost is capitalized and amortized to cost of sales when the related revenue is recognized. Amortization related to these capitalized costs to fulfill a contract were
$14,988
in the year ended December 31, 2018.
Capitalized costs, net of amortization, to fulfill contract balances were as follows:
55
|
December 31, 2018
|
|||
|
Tooling
|
$
|
6,155
|
|
|
Design costs
|
2,285
|
|
|
|
Other
|
5
|
|
|
|
$
|
8,445
|
|
|
In certain contracts, the Company facilitates shipping and handling activities after control has transferred to the customer. The Company has elected to record all shipping and handling activities as costs to fulfill a contract. In situations where the shipping and handling costs have not been incurred at the time revenue is recognized, the respective estimated shipping and handling costs are accrued.
Remaining Performance Obligations
. The Company has elected the practical expedient which allows disclosure of remaining performance obligations only for contracts with an original duration of greater than one year. Such remaining performance obligations represent the transaction price of firm orders for which work has not been performed and, for Aerospace, excludes projections of components and assemblies that Aerospace OEM customers anticipate purchasing in the future under existing programs, which represent orders that are beyond lead time and do not represent performance obligations pursuant to ASC 606. As of December 31, 2018, the aggregate amount of the transaction price allocated to remaining performance obligations was
$219,269
. The Company expects to recognize revenue on approximately
80%
of the remaining performance obligations over the next 12 months, with the remainder being recognized within 24 months.
4. Inventories
Inventories at December 31 consisted of:
|
2018
|
2017
|
|||||||
|
Finished goods
|
$
|
87,779
|
|
$
|
79,649
|
|
||
|
Work-in-process
|
98,426
|
|
97,276
|
|
||||
|
Raw materials and supplies
|
79,785
|
|
65,037
|
|
||||
|
$
|
265,990
|
|
$
|
241,962
|
|
|||
5. Property, Plant and Equipment
Property, plant and equipment at December 31 consisted of:
|
2018
|
2017
|
|||||||
|
Land
|
$
|
23,239
|
|
$
|
21,723
|
|
||
|
Buildings
|
183,544
|
|
182,226
|
|
||||
|
Machinery and equipment
|
646,714
|
|
631,392
|
|
||||
|
853,497
|
|
835,341
|
|
|||||
|
Less accumulated depreciation
|
(482,966
|
)
|
(476,043
|
)
|
||||
|
$
|
370,531
|
|
$
|
359,298
|
|
|||
Depreciation expense was
$48,914
,
$48,693
and
$43,165
during
2018
,
2017
and
2016
, respectively.
6. Goodwill and Other Intangible Assets
Goodwill:
The following table sets forth the change in the carrying amount of goodwill for each reportable segment and the Company:
56
|
Industrial
|
Aerospace
|
Total
Company
|
|||||||||
|
January 1, 2017
|
$
|
602,650
|
|
$
|
30,786
|
|
$
|
633,436
|
|
||
|
Acquisition-related
|
3,330
|
|
—
|
|
3,330
|
|
|||||
|
Foreign currency translation
|
53,457
|
|
—
|
|
53,457
|
|
|||||
|
December 31, 2017
|
659,437
|
|
30,786
|
|
690,223
|
|
|||||
|
Acquisition-related
|
285,355
|
|
—
|
|
|
285,355
|
|
||||
|
Foreign currency translation
|
(20,054
|
)
|
—
|
|
(20,054
|
)
|
|||||
|
December 31, 2018
|
$
|
924,738
|
|
$
|
30,786
|
|
$
|
955,524
|
|
||
Of the
$955,524
of goodwill at
December 31, 2018
,
$43,860
represents the original tax deductible basis.
The changes recorded at Industrial include
$285,355
of goodwill in 2018 resulting from the acquisitions of Gimatic and IGS in October and July 2018, respectively, both of which are included in the Industrial segment. See Note 2 to the Consolidated Financial Statements. The amounts allocated to goodwill reflect the benefits that the Company expects to realize from future enhancements to technology, an increase in global market access and Gimatic's and IGS's assembled workforce. The Company is permitted to make an election with Italian tax authorities that allows for an income tax deduction on a portion of Gimatic goodwill. The Company plans to complete its analysis that determines this deduction in 2019.
None
of the recognized goodwill recognized at IGS is expected to be deductible for income tax purposes. The purchase price for the Gimatic acquisition is subject to post-closing adjustments, therefore goodwill may require adjustment accordingly.
Other Intangible Assets:
Other intangible assets at December 31 consisted of:
|
|
|
2018
|
2017
|
|||||||||||||||
|
|
Range of
Life-Years
|
Gross
Amount
|
Accumulated
Amortization
|
Gross
Amount
|
Accumulated
Amortization
|
|||||||||||||
|
Amortized intangible assets:
|
||||||||||||||||||
|
Revenue Sharing Programs
|
Up to 30
|
$
|
299,500
|
|
$
|
(121,957
|
)
|
$
|
293,700
|
|
$
|
(108,075
|
)
|
|||||
|
Component Repair Programs
|
Up to 30
|
111,839
|
|
(21,895
|
)
|
111,839
|
|
(16,508
|
)
|
|||||||||
|
Customer relationships
|
10-16
|
338,366
|
|
(79,439
|
)
|
215,966
|
|
(65,385
|
)
|
|||||||||
|
Patents and technology
|
4-14
|
125,852
|
|
(59,205
|
)
|
87,052
|
|
(48,083
|
)
|
|||||||||
|
Trademarks/trade names
|
10-30
|
11,950
|
|
(10,731
|
)
|
11,950
|
|
(10,349
|
)
|
|||||||||
|
Other
|
Up to 15
|
7,296
|
|
(3,551
|
)
|
7,296
|
|
(3,159
|
)
|
|||||||||
|
894,803
|
|
(296,778
|
)
|
727,803
|
|
(251,559
|
)
|
|||||||||||
|
Unamortized intangible asset:
|
||||||||||||||||||
|
Trade names
|
55,670
|
|
—
|
|
42,770
|
|
—
|
|
||||||||||
|
Foreign currency translation
|
(17,157
|
)
|
—
|
|
(11,972
|
)
|
—
|
|
||||||||||
|
Other intangible assets
|
$
|
933,316
|
|
$
|
(296,778
|
)
|
$
|
758,601
|
|
$
|
(251,559
|
)
|
||||||
The Company has entered into a number of aftermarket RSP and CRP agreements each of which is with our customer, General Electric ("GE"). See Note 1 of the Consolidated Financial Statements for a further discussion of these Revenue Sharing and Component Repair Programs. As of
December 31, 2018
, the Company has made all required payments under the aftermarket RSP and CRP agreements. In the second quarter of 2018, management executed an aftermarket agreement with GE. This agreement involved a participation fee related to extending the scope of the existing Revenue Sharing Programs (“RSPs”) between the Company and GE and entitling the Company to manufacture and supply existing RSP parts on a sole source basis that have a dual end-use, meaning usage in engines that have both a civil and military end use. The Company paid
$5,800
as consideration for such rights and recorded a long-lived intangible asset, which will be amortized as a reduction to sales over the life of the programs, consistent with the treatment of similar arrangements that were executed in the past.
57
In connection with the acquisition of Gimatic in October 2018, the Company recorded intangible assets of
$158,800
, which includes
$107,900
of customer relationships,
$38,800
of patents and technology and
$12,100
of an indefinite-life trade name. The weighted-average useful lives of the customer relationships and the patents and technology were
16
and
11
years, respectively.
In connection with the acquisition of IGS in July 2018, the Company recorded intangible assets of
$15,300
, which includes
$14,500
of customer relationships and
$800
of an indefinite-life trade name. The weighted-average useful life of the customer relationship is
16
years.
Amortization of intangible assets for the years ended
December 31, 2018
,
2017
and
2016
was
$45,220
,
$41,216
and
$36,753
, respectively. Estimated amortization of intangible assets for future periods is as follows: 2019 -
$53,000
; 2020-
$50,000
; 2021 -
$49,000
; 2022 -
$49,000
and 2023 -
$48,000
.
7. Accrued Liabilities
Accrued liabilities at December 31 consisted of:
|
2018
|
2017
|
|||||||
|
Payroll and other compensation
|
$
|
46,850
|
|
$
|
53,857
|
|
||
|
Contract liabilities
|
57,522
|
|
44,600
|
|
||||
|
Pension and other postretirement benefits
|
8,618
|
|
8,294
|
|
||||
|
Accrued income taxes
|
30,391
|
|
26,340
|
|
||||
|
Other
|
63,401
|
|
48,150
|
|
||||
|
$
|
206,782
|
|
$
|
181,241
|
|
|||
8. Debt and Commitments
Long-term debt and notes and overdrafts payable at December 31 consisted of:
|
|
2018
|
2017
|
||||||||||||||
|
|
Carrying
Amount
|
Fair
Value
|
Carrying
Amount
|
Fair
Value
|
||||||||||||
|
Revolving credit agreement
|
$
|
831,016
|
|
$
|
828,800
|
|
$
|
421,500
|
|
$
|
424,818
|
|
||||
|
3.97% Senior Notes
|
100,000
|
|
100,185
|
|
100,000
|
|
101,348
|
|
||||||||
|
Borrowings under lines of credit and overdrafts
|
2,137
|
|
2,137
|
|
5,669
|
|
5,669
|
|
||||||||
|
Capital leases
|
10,216
|
|
10,503
|
|
4,541
|
|
4,964
|
|
||||||||
|
Other foreign bank borrowings
|
647
|
|
651
|
|
886
|
|
897
|
|
||||||||
|
944,016
|
|
942,276
|
|
532,596
|
|
537,696
|
|
|||||||||
|
Less current maturities
|
(7,659
|
)
|
(6,999
|
)
|
||||||||||||
|
Long-term debt
|
$
|
936,357
|
|
$
|
525,597
|
|
||||||||||
The Company’s long-term debt portfolio consists of fixed-rate and variable-rate instruments and is managed to reduce the overall cost of borrowing and to mitigate fluctuations in interest rates. Among other things, interest rate fluctuations impact the market value of the Company’s fixed-rate debt.
In February 2017, the Company and certain of its subsidiaries entered into the fourth amendment of its fifth amended and restated revolving credit agreement (the “Amended Credit Agreement”) and retained Bank of America, N.A as the Administrative Agent for the lenders. The Amended Credit Agreement increases the facility from
$750,000
to
$850,000
and extends the maturity date from
September 2018
to
February 2022
. The Amended Credit Agreement also increases the existing accordion feature from
$250,000
, allowing the Company to now request additional borrowings of up to
$350,000
. The Company may exercise the accordion feature upon request to the Administrative Agent as long as an event of default has not occurred or is not continuing. The borrowing availability of
$850,000
, pursuant to the terms of the Amended Credit Agreement, allows for multi-currency borrowing which includes euro, British pound sterling or Swiss franc borrowing, up to
$600,000
. In September 2018, the Company and one of its wholly owned subsidiaries entered into a Sale and Purchase Agreement to acquire
58
Gimatic S.r.l. See Note 2 of the Consolidated Financial Statements. In conjunction with the Acquisition, the Company requested additional borrowings of
$150,000
that was provided for under the existing accordion feature. The Administrative Agent for the lenders approved the Company's access to the accordion feature and on October 19, 2018 the lenders formally committed the capital to fund such feature, resulting in the execution of the fifth amendment to the Amended Credit Agreement (the "Fifth Amendment"). The Fifth Amendment, effective October 19, 2018, thereby increased the borrowing availability of the existing facility to
$1,000,000
. The Company may also request access to the residual
$200,000
of the accordion feature. Depending on the Company’s consolidated leverage ratio, and at the election of the Company, borrowings under the Amended Credit Agreement will bear interest at either LIBOR plus a margin of between
1.10%
and
1.70%
or the base rate, as defined in the Amended Credit Agreement, plus a margin of
0.10%
to
0.70%
. Multi-currency borrowings, pursuant to the Amended Credit Agreement, bear interest at their respective interbank offered rate (i.e. Euribor) or
0.00%
(higher of the two rates) plus a margin of between
1.10%
and
1.70%
. The Company paid fees and expenses of
$529
and
$2,542
in 2018 and 2017, respectively, in conjunction with executing amendments to the Amended Credit Agreement; such fees have been deferred within Other Assets on the accompanying Consolidated Balance Sheets and are being amortized into interest expense on the accompanying Consolidated Statements of Income through its maturity. Cash used to pay these fees has been recorded through other financing activities on the Consolidated Statements of Cash Flows.
Borrowings and availability under the Amended Credit Agreement were $
831,016
and $
168,984
, respectively, at
December 31, 2018
and
$421,500
and
$428,500
, respectively, at
December 31, 2017
. The average interest rate on these borrowings was
1.99%
and
2.65%
on
December 31, 2018
and
2017
, respectively. Borrowings included Euro-denominated borrowings of
470,350
(
$538,316
) at December 31, 2018. There were
no
Euro-denominated borrowings at December 31, 2017. The fair value of the borrowings is based on observable Level 2 inputs. The borrowings were valued using discounted cash flows based upon the Company's estimated interest costs for similar types of borrowings. In 2018, the Company borrowed
179,000
Euros (
$208,589
) under the Amended Credit Facility through an international subsidiary. The proceeds were distributed to the Parent Company and subsequently used to pay down U.S. borrowings under the Amended Credit Agreement.
In
October 2014
, the Company entered into a Note Purchase Agreement (“Note Purchase Agreement”), among the Company and New York Life Insurance Company, New York Life Insurance and Annuity Corporation and New York Life Insurance and Annuity Corporation Institutionally Owned Life Insurance Separate Account, as purchasers, for the issuance of
$100,000
aggregate principal amount of
3.97%
Senior Notes due
October 17, 2024
(the “
3.97%
Senior Notes”).
The
3.97%
Senior Notes are senior unsecured obligations of the Company and pay interest semi-annually on April 17 and October 17 of each year at an annual rate of
3.97%
. The
3.97%
Senior Notes will mature on
October 17, 2024
unless earlier prepaid in accordance with their terms. Subject to certain conditions, the Company may, at its option, prepay all or any part of the
3.97%
Senior Notes in an amount equal to
100%
of the principal amount of the
3.97%
Senior Notes so prepaid, plus any accrued and unpaid interest to the date of prepayment, plus the Make-Whole Amount, as defined in the Note Purchase Agreement, with respect to such principal amount being prepaid. The fair value of the
3.97%
Senior Notes was determined using the US Treasury yield and a long-term credit spread for similar types of borrowings, which represent Level 2 observable inputs.
The Company's borrowing capacity remains limited by various debt covenants in the Amended Credit Agreement and the Note Purchase Agreement (the "Agreements"). The Agreements require the Company to maintain a ratio of Consolidated Senior Debt, as defined, to Consolidated EBITDA, as defined, of not more than
3.25
times ("Senior Debt Ratio"), a ratio of Consolidated Total Debt, as defined, to Consolidated EBITDA of not more than
3.75
times ("Total Debt Ratio") and a ratio of Consolidated EBITDA to Consolidated Cash Interest Expense, as defined, of not less than
4.25
, in each case at the end of each fiscal quarter; provided that the debt to EBITDA ratios are permitted to increase for a period of four fiscal quarters after the closing of certain permitted acquisitions. A permitted acquisition is defined as an acquisition exceeding
$150,000
, for which the acquisition of Gimatic qualifies. With the completion of a permitted acquisition, the Senior Debt Ratio cannot exceed
3.50
times and the Total Debt Ratio cannot exceed
4.25
times. The increased ratios are allowed for a period of four fiscal quarters subsequent to the close of the permitted acquisition. At
December 31, 2018
, the Company was in compliance with all covenants under the Agreements and continues to monitor its future compliance based on current and future economic conditions.
In addition, the Company has approximately
$87,000
in uncommitted short-term bank credit lines ("Credit Lines") and overdraft facilities. The Credit Lines are accessed locally and are available primarily within the U.S., Europe and Asia. The Credit Lines are subject to the applicable borrowing rates within each respective country and vary between jurisdictions (i.e. LIBOR, Euribor, etc.). Under the Credit Lines,
$2,041
was borrowed at
December 31, 2018
at an average interest rate of
0.17%
and
$5,300
was borrowed at
December 31, 2017
at an average interest rate of
2.33%
. The Company had also borrowed
$96
and
59
$369
under the overdraft facilities at
December 31, 2018
and
2017
, respectively. Repayments under the Credit Lines are due within
three
months after being borrowed. Repayments of the overdrafts are generally due within
two
days after being borrowed. The carrying amounts of the Credit Lines and overdrafts approximate fair value due to the short maturities of these financial instruments.
The Company also has several capital leases under which
$10,216
and
$4,541
was outstanding at
December 31, 2018
and
December 31, 2017
, respectively. The fair value of the capital leases are based on observable Level 2 inputs. These instruments were valued using discounted cash flows based upon the Company's estimated interest costs for similar types of borrowings.
At
December 31, 2018
and
2017
, the Company also had other foreign bank borrowings of
$647
and
$886
, respectively. The fair value of the foreign bank borrowings was based on observable Level 2 inputs. These instruments were valued using discounted cash flows based upon the Company's estimated interest costs for similar types of borrowings.
Long-term debt and notes payable as of
December 31, 2018
are payable as follows:
$7,659
in
2019
,
$1,862
in
2020
,
$1,160
in
2021
,
$831,854
in
2022
,
$492
in
2023
and
$100,989
thereafter. The
3.97%
Senior Notes are due in 2024 according to their maturity date.
In addition, the Company had outstanding letters of credit totaling
$9,129
at
December 31, 2018
.
Interest paid was
$16,678
,
$13,962
and
$11,471
in
2018
,
2017
and
2016
, respectively. Interest capitalized was
$544
,
$415
and
$324
in
2018
,
2017
and
2016
, respectively, and is being depreciated over the lives of the related fixed assets.
9. Business Reorganizations
In 2017, the Company authorized the closure and consolidation of
two
production facilities (the "Closures") including a FOBOHA facility located in Muri, Switzerland and an Associated Spring facility into other facilities included within the Industrial segment to leverage capacity, infrastructure and critical resources. During 2017, the Closures resulted in employee severance charges of
$3,796
, other Closure costs of
$3,664
, primarily related to asset write-downs, and pension curtailment and settlement gains of
$7,217
and
$230
, respectively. The employee severance charges and other Closure costs were recorded primarily within Cost of Sales and the pension curtailment and settlement gains were recorded within Other Expense (Income) in the accompanying Consolidated Statements of Income. All charges are reflected in the results of the Industrial segment. The Muri Closure was completed as of December 31, 2017, whereas the Closure at the Associated Spring facility was completed as of June 30, 2018.
10. Derivatives
The Company has manufacturing and sales facilities around the world and thus makes investments and conducts business transactions denominated in various currencies. The Company is also exposed to fluctuations in interest rates and commodity price changes. These financial exposures are monitored and managed by the Company as an integral part of its risk management program.
Financial instruments have been used by the Company to hedge its exposures to fluctuations in interest rates. In 2012, the Company entered into
five
-year interest rate swap agreements (the "Swaps") transacted with
three
banks which together converted the interest on the first
$100,000
of the Company's
one-month LIBOR
-based borrowings from a variable rate plus the borrowing spread to a fixed rate of
1.03%
plus the borrowing spread. The Swaps expired on April 28, 2017. The Company entered into a new interest rate swap agreement (the "Swap") that commenced on April 28, 2017, with
one
bank, and converts the interest on the first
$100,000
of the Company's
one-month LIBOR
-based borrowings from a variable rate plus the borrowing spread to a fixed rate of
1.92%
plus the borrowing spread. The Swap expires on January 31, 2022. These interest rate swap agreements were accounted for as cash flow hedges. The Swap remained in place at
December 31, 2018
.
The Company also uses financial instruments to hedge its exposures to fluctuations in foreign currency exchange rates. The Company has various contracts outstanding which primarily hedge recognized assets or liabilities and anticipated transactions in various currencies including the Euro, British pound sterling, U.S. dollar, Canadian dollar, Japanese yen, Singapore dollar, Korean won, Swedish kroner, Chinese renminbi, Mexican peso, Hong Kong dollar and Swiss franc. Certain
60
foreign currency derivative instruments are treated as cash flow hedges of forecasted transactions. All foreign exchange contracts are due within
two years
.
The Company does not use derivatives for speculative or trading purposes or to manage commodity exposures. Changes in the fair market value of derivatives that qualify as fair value hedges or cash flow hedges are recorded directly to earnings or accumulated other non-owner changes to equity, depending on the designation. Amounts recorded to accumulated other non-owner changes to equity are reclassified to earnings in a manner that matches the earnings impact of the hedged transaction. Any ineffective portion, or amounts related to contracts that are not designated as hedges, are recorded directly to earnings.
The Company's policy for classifying cash flows from derivatives is to report the cash flows consistent with the underlying hedged item. Other financing cash flows during the years ended
December 31, 2018
and
2017
, as presented on the consolidated statements of cash flows, include
$10,813
and
$18,256
of net cash payments, respectively, related to the settlement of foreign currency hedges related to intercompany financing.
The following table sets forth the fair value amounts of derivative instruments held by the Company as of December 31.
|
|
2018
|
2017
|
||||||||||||||
|
|
Asset
Derivatives
|
Liability
Derivatives
|
Asset
Derivatives
|
Liability
Derivatives
|
||||||||||||
|
Derivatives designated as hedging
instruments:
|
||||||||||||||||
|
Interest rate contracts
|
$
|
1,412
|
|
$
|
—
|
|
$
|
654
|
|
$
|
—
|
|
||||
|
Foreign exchange contracts
|
—
|
|
(258
|
)
|
—
|
|
(379
|
)
|
||||||||
|
1,412
|
|
(258
|
)
|
654
|
|
(379
|
)
|
|||||||||
|
Derivatives not designated as
hedging instruments:
|
||||||||||||||||
|
Foreign exchange contracts
|
1,105
|
|
(90
|
)
|
58
|
|
(29
|
)
|
||||||||
|
Total derivatives
|
$
|
2,517
|
|
$
|
(348
|
)
|
$
|
712
|
|
$
|
(408
|
)
|
||||
Asset derivatives related to interest rate contracts and foreign exchange contracts are recorded in other assets and prepaid expenses and other current assets, respectively, in the accompanying consolidated balance sheets. Liability derivatives related to interest rate contracts and foreign exchange contracts are recorded in other liabilities and accrued liabilities, respectively, in the accompanying consolidated balance sheets.
The following table sets forth the gain recorded in accumulated other comprehensive income (loss), net of tax, for the years ended
December 31, 2018
and
2017
for derivatives held by the Company and designated as hedging instruments.
|
2018
|
2017
|
|||||||
|
Cash flow hedges:
|
||||||||
|
Interest rate contracts
|
$
|
578
|
|
$
|
460
|
|
||
|
Foreign exchange contracts
|
95
|
|
(161
|
)
|
||||
|
$
|
673
|
|
$
|
299
|
|
|||
Amounts related to the interest rate swaps included within accumulated other comprehensive income (loss) that were reclassified to expense during the years ended
December 31, 2018
and
2017
resulted in a fixed rate of interest plus the borrowing spread for the first
$100,000
of one-month LIBOR borrowings. The fixed rate of interest was
1.92%
for the period covered by the Swap, which matures in January 2022, and
1.03%
for the Swaps, which matured in April 2017. Additionally, there were
no
amounts recognized in income for hedge ineffectiveness during the years ended
December 31, 2018
and
2017
.
The following table sets forth the net (loss) recorded in other expense (income), net in the consolidated statements of income for the years ended
December 31, 2018
and
2017
for non-designated derivatives held by the Company. Such amounts were substantially offset by the net (gain) loss recorded on the underlying hedged asset or liability, also recorded in other expense (income), net.
|
2018
|
2017
|
|||||||
|
Foreign exchange contracts
|
$
|
(12,162
|
)
|
$
|
(16,813
|
)
|
||
61
11. Fair Value Measurements
The provisions of the accounting standard for fair value define fair value as the price that would be received to sell an asset or paid to transfer a liability in an orderly transaction between market participants at the measurement date. This standard classifies the inputs used to measure fair value into the following hierarchy:
|
|
Level 1
|
Unadjusted quoted prices in active markets for identical assets or liabilities.
|
|
|
Level 2
|
Unadjusted quoted prices in active markets for similar assets or liabilities, or unadjusted quoted prices for identical or similar assets or liabilities in markets that are not active, or inputs other than quoted prices that are observable for the asset or liability.
|
|
|
Level 3
|
Unobservable inputs for the asset or liability.
|
The following table provides the assets and liabilities reported at fair value and measured on a recurring basis as of
December 31, 2018
and
2017
:
|
|
|
Fair Value Measurements Using
|
||||||||||||||
|
|
Total
|
Quoted Prices in
Active Markets for
Identical Assets
(Level 1)
|
Significant Other
Observable Inputs
(Level 2)
|
Significant
Unobservable
Inputs
(Level 3)
|
||||||||||||
|
December 31, 2018
|
||||||||||||||||
|
Asset derivatives
|
$
|
2,517
|
|
$
|
—
|
|
$
|
2,517
|
|
$
|
—
|
|
||||
|
Liability derivatives
|
(348
|
)
|
—
|
|
(348
|
)
|
—
|
|
||||||||
|
Bank acceptances
|
17,698
|
|
—
|
|
17,698
|
|
—
|
|
||||||||
|
Rabbi trust assets
|
2,457
|
|
2,457
|
|
—
|
|
—
|
|
||||||||
|
$
|
22,324
|
|
$
|
2,457
|
|
$
|
19,867
|
|
$
|
—
|
|
|||||
|
December 31, 2017
|
||||||||||||||||
|
Asset derivatives
|
$
|
712
|
|
$
|
—
|
|
$
|
712
|
|
$
|
—
|
|
||||
|
Liability derivatives
|
(408
|
)
|
—
|
|
(408
|
)
|
—
|
|
||||||||
|
Bank acceptances
|
16,092
|
|
—
|
|
16,092
|
|
—
|
|
||||||||
|
Rabbi trust assets
|
2,554
|
|
2,554
|
|
—
|
|
—
|
|
||||||||
|
$
|
18,950
|
|
$
|
2,554
|
|
$
|
16,396
|
|
$
|
—
|
|
|||||
The derivative contracts are valued using observable current market information as of the reporting date such as the prevailing LIBOR-based interest rates and foreign currency spot and forward rates. Bank acceptances represent financial instruments accepted from certain Chinese customers in lieu of cash paid on receivables, generally range from
3
to
6
months in maturity and are guaranteed by banks. The carrying amounts of the bank acceptances, which are included within prepaid expenses and other current assets, approximate fair value due to their short maturities. The fair values of rabbi trust assets are based on quoted market prices from various financial exchanges. For disclosures of the fair values of the Company’s pension plan assets, see Note 12 of the Consolidated Financial Statements.
12. Pension and Other Postretirement Benefits
The accounting standards related to employers’ accounting for defined benefit pension and other postretirement plans requires the Company to recognize the funded status of its defined benefit postretirement plans as assets or liabilities in the accompanying consolidated balance sheets and to recognize changes in the funded status of the plans in comprehensive income.
The Company has various defined contribution plans, the largest of which is its Retirement Savings Plan. Most U.S. salaried and non-union hourly employees are eligible to participate in this plan. See Note 17 for further discussion of the Retirement Savings Plan. The Company also maintains various other defined contribution plans which cover certain other employees. Company contributions under these plans are based primarily on the performance of the business units and
62
employee compensation. Contribution expense under these other defined contribution plans was
$6,921
,
$6,644
and
$5,907
in
2018
,
2017
and
2016
, respectively.
Defined benefit pension plans in the U.S. cover a majority of the Company’s U.S. employees at the Associated Spring and Force & Motion Control (formerly "Nitrogen Gas Products") businesses of Industrial, the Company’s Corporate Office and certain former U.S. employees, including retirees. Plan benefits for salaried and non-union hourly employees are based on years of service and average salary. Plans covering union hourly employees provide benefits based on years of service. In 2012, the Company closed the U.S. salaried defined benefit pension plan (the "U.S. Salaried Plan") to employees hired on or after January 1, 2013, with no impact to the benefits of existing participants. Effective January 1, 2013, the Retirement Savings Plan was amended to provide certain salaried employees hired on or after January 1, 2013 with an additional annual retirement contribution of
4%
of eligible earnings, in place of pensionable benefits under the closed U.S. Salaried Plan. The Company funds U.S. pension costs in accordance with the Employee Retirement Income Security Act of 1974, as amended (“ERISA”). Non-U.S. defined benefit pension plans cover certain employees of certain international locations in Europe and Canada.
The Company provides other medical, dental and life insurance postretirement benefits for certain of its retired employees in the U.S. and Canada. It is the Company’s practice to fund these benefits as incurred.
The accompanying balance sheets reflect the funded status of the Company’s defined benefit pension plans at
December 31, 2018
and
2017
, respectively. Reconciliations of the obligations and funded status of the plans follow:
|
|
2018
|
2017
|
||||||||||||||||||||||
|
|
U.S.
|
Non-U.S.
|
Total
|
U.S.
|
Non-U.S.
|
Total
|
||||||||||||||||||
|
Benefit obligation, January 1
|
$
|
415,369
|
|
$
|
82,741
|
|
$
|
498,110
|
|
$
|
389,613
|
|
$
|
104,339
|
|
$
|
493,952
|
|
||||||
|
Service cost
|
4,290
|
|
1,671
|
|
5,961
|
|
3,931
|
|
2,124
|
|
6,055
|
|
||||||||||||
|
Interest cost
|
15,875
|
|
1,508
|
|
17,383
|
|
17,151
|
|
1,668
|
|
18,819
|
|
||||||||||||
|
Amendments
|
—
|
|
826
|
|
826
|
|
1,233
|
|
27
|
|
1,260
|
|
||||||||||||
|
Actuarial (gain) loss
|
(22,193
|
)
|
(2,256
|
)
|
(24,449
|
)
|
28,350
|
|
(4,397
|
)
|
23,953
|
|
||||||||||||
|
Benefits paid
|
(25,007
|
)
|
(6,607
|
)
|
(31,614
|
)
|
(24,909
|
)
|
(4,240
|
)
|
(29,149
|
)
|
||||||||||||
|
Transfers in
|
—
|
|
3,462
|
|
3,462
|
|
—
|
|
2,743
|
|
2,743
|
|
||||||||||||
|
Plan curtailments
|
—
|
|
—
|
|
—
|
|
—
|
|
(7,030
|
)
|
(7,030
|
)
|
||||||||||||
|
Plan settlements
|
—
|
|
—
|
|
—
|
|
—
|
|
(21,074
|
)
|
(21,074
|
)
|
||||||||||||
|
Participant contributions
|
—
|
|
1,120
|
|
1,120
|
|
—
|
|
1,355
|
|
1,355
|
|
||||||||||||
|
Foreign exchange rate changes
|
—
|
|
(3,158
|
)
|
(3,158
|
)
|
—
|
|
7,226
|
|
7,226
|
|
||||||||||||
|
Benefit obligation, December 31
|
388,334
|
|
79,307
|
|
467,641
|
|
415,369
|
|
82,741
|
|
498,110
|
|
||||||||||||
|
Fair value of plan assets, January 1
|
375,378
|
|
79,060
|
|
454,438
|
|
331,260
|
|
85,652
|
|
416,912
|
|
||||||||||||
|
Actual return on plan assets
|
(30,681
|
)
|
(1,928
|
)
|
(32,609
|
)
|
56,131
|
|
6,150
|
|
62,281
|
|
||||||||||||
|
Company contributions
|
2,925
|
|
1,807
|
|
4,732
|
|
12,896
|
|
2,027
|
|
14,923
|
|
||||||||||||
|
Participant contributions
|
—
|
|
1,120
|
|
1,120
|
|
—
|
|
1,355
|
|
1,355
|
|
||||||||||||
|
Benefits paid
|
(25,007
|
)
|
(6,607
|
)
|
(31,614
|
)
|
(24,909
|
)
|
(4,240
|
)
|
(29,149
|
)
|
||||||||||||
|
Plan settlements
|
—
|
|
—
|
|
—
|
|
—
|
|
(20,857
|
)
|
(20,857
|
)
|
||||||||||||
|
Transfers in
|
—
|
|
3,462
|
|
3,462
|
|
—
|
|
2,743
|
|
2,743
|
|
||||||||||||
|
Foreign exchange rate changes
|
—
|
|
(3,307
|
)
|
(3,307
|
)
|
—
|
|
6,230
|
|
6,230
|
|
||||||||||||
|
Fair value of plan assets, December 31
|
322,615
|
|
73,607
|
|
396,222
|
|
375,378
|
|
79,060
|
|
454,438
|
|
||||||||||||
|
Underfunded status, December 31
|
$
|
(65,719
|
)
|
$
|
(5,700
|
)
|
$
|
(71,419
|
)
|
$
|
(39,991
|
)
|
$
|
(3,681
|
)
|
$
|
(43,672
|
)
|
||||||
In 2017, the Company authorized the closure of it's FOBOHA facility located in Muri, Switzerland, resulting in the pension curtailments and settlements noted above. See Note 9 of the Consolidated Financial Statements for additional information related to this Closure.
Projected benefit obligations related to pension plans with benefit obligations in excess of plan assets follow:
|
|
2018
|
2017
|
||||||||||||||||||||||
|
|
U.S.
|
Non-U.S.
|
Total
|
U.S.
|
Non-U.S.
|
Total
|
||||||||||||||||||
|
Projected benefit obligation
|
$
|
388,334
|
|
$
|
42,000
|
|
$
|
430,334
|
|
$
|
311,320
|
|
$
|
40,931
|
|
$
|
352,251
|
|
||||||
|
Fair value of plan assets
|
322,615
|
|
28,595
|
|
351,210
|
|
267,087
|
|
26,205
|
|
293,292
|
|
||||||||||||
63
Information related to pension plans with accumulated benefit obligations in excess of plan assets follows:
|
|
2018
|
2017
|
||||||||||||||||||||||
|
|
U.S.
|
Non-U.S.
|
Total
|
U.S.
|
Non-U.S.
|
Total
|
||||||||||||||||||
|
Projected benefit obligation
|
$
|
388,334
|
|
$
|
42,000
|
|
$
|
430,334
|
|
$
|
40,572
|
|
$
|
40,931
|
|
$
|
81,503
|
|
||||||
|
Accumulated benefit obligation
|
378,285
|
|
41,946
|
|
420,231
|
|
40,090
|
|
40,877
|
|
80,967
|
|
||||||||||||
|
Fair value of plan assets
|
322,615
|
|
28,595
|
|
351,210
|
|
4,797
|
|
26,205
|
|
31,002
|
|
||||||||||||
The accumulated benefit obligation for all defined benefit pension plans was
$457,539
and
$485,777
at
December 31, 2018
and
2017
, respectively.
Amounts related to pensions recognized in the accompanying balance sheets consist of:
|
|
2018
|
2017
|
||||||||||||||||||||||
|
|
U.S.
|
Non-U.S.
|
Total
|
U.S.
|
Non-U.S.
|
Total
|
||||||||||||||||||
|
Other assets
|
$
|
—
|
|
$
|
7,705
|
|
$
|
7,705
|
|
$
|
4,242
|
|
$
|
11,045
|
|
$
|
15,287
|
|
||||||
|
Accrued liabilities
|
2,826
|
|
378
|
|
3,204
|
|
2,823
|
|
407
|
|
3,230
|
|
||||||||||||
|
Accrued retirement benefits
|
62,893
|
|
13,027
|
|
75,920
|
|
41,410
|
|
14,319
|
|
55,729
|
|
||||||||||||
|
Accumulated other non-owner changes to equity, net
|
(121,927
|
)
|
(14,047
|
)
|
(135,974
|
)
|
(84,990
|
)
|
(13,016
|
)
|
(98,006
|
)
|
||||||||||||
Amounts related to pensions recognized in accumulated other non-owner changes to equity, net of tax, at
December 31, 2018
and
2017
, respectively, consist of:
|
|
2018
|
2017
|
||||||||||||||||||||||
|
|
U.S.
|
Non-U.S.
|
Total
|
U.S.
|
Non-U.S.
|
Total
|
||||||||||||||||||
|
Net actuarial loss
|
$
|
(119,601
|
)
|
$
|
(13,637
|
)
|
$
|
(133,238
|
)
|
$
|
(82,736
|
)
|
$
|
(13,237
|
)
|
$
|
(95,973
|
)
|
||||||
|
Prior service costs
|
(2,326
|
)
|
(410
|
)
|
(2,736
|
)
|
(2,254
|
)
|
221
|
|
(2,033
|
)
|
||||||||||||
|
$
|
(121,927
|
)
|
$
|
(14,047
|
)
|
$
|
(135,974
|
)
|
$
|
(84,990
|
)
|
$
|
(13,016
|
)
|
$
|
(98,006
|
)
|
|||||||
The accompanying balance sheets reflect the underfunded status of the Company’s other postretirement benefit plans at
December 31, 2018
and
2017
. Reconciliations of the obligations and underfunded status of the plans follow:
|
2018
|
2017
|
|||||||
|
Benefit obligation, January 1
|
$
|
37,570
|
|
$
|
36,853
|
|
||
|
Service cost
|
85
|
|
83
|
|
||||
|
Interest cost
|
1,358
|
|
1,561
|
|
||||
|
Actuarial (gain) loss
|
(3,791
|
)
|
3,806
|
|
||||
|
Benefits paid
|
(3,435
|
)
|
(7,251
|
)
|
||||
|
Participant contributions
|
1,280
|
|
2,209
|
|
||||
|
Foreign exchange rate changes
|
9
|
|
309
|
|
||||
|
Benefit obligation, December 31
|
33,076
|
|
37,570
|
|
||||
|
Fair value of plan assets, January 1
|
—
|
|
—
|
|
||||
|
Company contributions
|
2,155
|
|
5,042
|
|
||||
|
Participant contributions
|
1,280
|
|
2,209
|
|
||||
|
Benefits paid
|
(3,435
|
)
|
(7,251
|
)
|
||||
|
Fair value of plan assets, December 31
|
—
|
|
—
|
|
||||
|
Underfunded status, December 31
|
$
|
33,076
|
|
$
|
37,570
|
|
||
Amounts related to other postretirement benefits recognized in the accompanying balance sheets consist of:
64
|
2018
|
2017
|
|||||||
|
Accrued liabilities
|
$
|
5,414
|
|
$
|
5,064
|
|
||
|
Accrued retirement benefits
|
27,662
|
|
32,506
|
|
||||
|
Accumulated other non-owner changes to equity, net
|
(2,716
|
)
|
(5,838
|
)
|
||||
Amounts related to other postretirement benefits recognized in accumulated other non-owner changes to equity, net of tax, at
December 31, 2018
and
2017
consist of:
|
2018
|
2017
|
|||||||
|
Net actuarial loss
|
$
|
(2,618
|
)
|
$
|
(5,746
|
)
|
||
|
Prior service loss
|
(98
|
)
|
(92
|
)
|
||||
|
$
|
(2,716
|
)
|
$
|
(5,838
|
)
|
|||
The sources of changes in accumulated other non-owner changes to equity, net, during
2018
were:
|
Pension
|
Other
Postretirement
Benefits
|
|||||||
|
Prior service cost
|
$
|
(669
|
)
|
$
|
—
|
|
||
|
Net (loss) gain
|
(29,108
|
)
|
3,800
|
|
||||
|
Amortization of prior service costs
|
423
|
|
15
|
|
||||
|
Amortization of actuarial loss
|
8,878
|
|
428
|
|
||||
|
Foreign exchange rate changes
|
821
|
|
(14
|
)
|
||||
|
Amounts reclassified from accumulated other comprehensive income to retained earnings
(A)
|
(18,313
|
)
|
(1,107
|
)
|
||||
|
$
|
(37,968
|
)
|
$
|
3,122
|
|
|||
(A) This amount represents the reclassification of stranded tax effects resulting from the Act, as permitted by amended guidance issued by the FASB in February 2018. See Note 1.
Weighted-average assumptions used to determine benefit obligations as of December 31, are:
|
2018
|
2017
|
|||||
|
U.S. plans:
|
||||||
|
Discount rate
|
4.40
|
%
|
3.90
|
%
|
||
|
Increase in compensation
|
2.56
|
%
|
2.56
|
%
|
||
|
Non-U.S. plans:
|
||||||
|
Discount rate
|
2.07
|
%
|
1.90
|
%
|
||
|
Increase in compensation
|
2.72
|
%
|
2.17
|
%
|
||
The investment strategy of the plans is to generate a consistent total investment return sufficient to pay present and future plan benefits to retirees, while minimizing the long-term cost to the Company. Target allocations for asset categories are used to earn a reasonable rate of return, provide required liquidity and minimize the risk of large losses. Targets may be adjusted, as necessary, to reflect trends and developments within the overall investment environment. The weighted-average target investment allocations by asset category were as follows during
2018
:
65%
in equity securities and
35%
in fixed income securities, including cash.
The fair values of the Company’s pension plan assets at
December 31, 2018
and
2017
, by asset category are as follows:
65
|
|
|
Fair Value Measurements Using
|
||||||||||||||
|
Asset Category
|
Total
|
Quoted Prices in
Active Markets for
Identical Assets
(Level 1)
|
Significant Other
Observable Inputs
(Level 2)
|
Significant
Unobservable
Inputs
(Level 3)
|
||||||||||||
|
December 31, 2018
|
||||||||||||||||
|
Cash and short-term investments
|
$
|
3,750
|
|
$
|
3,750
|
|
$
|
—
|
|
$
|
—
|
|
||||
|
Equity securities:
|
||||||||||||||||
|
U.S. large-cap
|
36,821
|
|
—
|
|
36,821
|
|
—
|
|
||||||||
|
U.S. mid-cap
|
13,337
|
|
13,337
|
|
—
|
|
—
|
|
||||||||
|
U.S. small-cap
|
13,244
|
|
13,244
|
|
—
|
|
—
|
|
||||||||
|
International equities
|
123,084
|
|
—
|
|
123,084
|
|
—
|
|
||||||||
|
Global equity
|
43,337
|
|
43,337
|
|
—
|
|
—
|
|
||||||||
|
Fixed income securities:
|
||||||||||||||||
|
U.S. bond funds
|
117,249
|
|
—
|
|
117,249
|
|
—
|
|
||||||||
|
International bonds
|
42,920
|
|
—
|
|
42,920
|
|
—
|
|
||||||||
|
Other
|
2,480
|
|
—
|
|
—
|
|
2,480
|
|
||||||||
|
$
|
396,222
|
|
$
|
73,668
|
|
$
|
320,074
|
|
$
|
2,480
|
|
|||||
|
December 31, 2017
|
||||||||||||||||
|
Cash and short-term investments
|
10,731
|
|
10,731
|
|
—
|
|
—
|
|
||||||||
|
Equity securities:
|
||||||||||||||||
|
U.S. large-cap
|
46,786
|
|
—
|
|
46,786
|
|
—
|
|
||||||||
|
U.S. mid-cap
|
15,576
|
|
15,576
|
|
—
|
|
—
|
|
||||||||
|
U.S. small-cap
|
16,157
|
|
16,157
|
|
—
|
|
—
|
|
||||||||
|
International equities
|
159,803
|
|
—
|
|
159,803
|
|
—
|
|
||||||||
|
Global equity
|
51,945
|
|
51,945
|
|
—
|
|
—
|
|
||||||||
|
Fixed income securities:
|
||||||||||||||||
|
U.S. bond funds
|
109,033
|
|
—
|
|
109,033
|
|
—
|
|
||||||||
|
International bonds
|
41,742
|
|
—
|
|
41,742
|
|
—
|
|
||||||||
|
Other
|
2,665
|
|
—
|
|
—
|
|
2,665
|
|
||||||||
|
$
|
454,438
|
|
$
|
94,409
|
|
$
|
357,364
|
|
$
|
2,665
|
|
|||||
The fair values of the Level 1 assets are based on quoted market prices from various financial exchanges. The fair values of the Level 2 assets are based primarily on quoted prices in active markets for similar assets or liabilities. The Level 2 assets are comprised primarily of commingled funds and fixed income securities. Commingled equity funds are valued at their net asset values based on quoted market prices of the underlying assets. Fixed income securities are valued using a market approach which considers observable market data for the underlying asset or securities. The Level 3 assets relate to the defined benefit pension plan at the Synventive business. These pension assets are fully insured and have been estimated based on accrued pension rights and actuarial rates. These pension assets are limited to fulfilling the Company's pension obligations.
The Company expects to contribute approximately
$4,706
to the pension plans in
2019
. No contributions to the U.S. Qualified pension plans, specifically, are required, and the Company does not currently plan to make any discretionary contributions to such plans in 2019.
The following are the estimated future net benefit payments, which include future service, over the next 10 years:
66
|
Pensions
|
Other
Postretirement
Benefits
|
|||||||
|
2019
|
$
|
29,550
|
|
$
|
3,515
|
|
||
|
2020
|
29,414
|
|
3,332
|
|
||||
|
2021
|
29,573
|
|
3,065
|
|
||||
|
2022
|
29,224
|
|
2,892
|
|
||||
|
2023
|
29,042
|
|
2,688
|
|
||||
|
Years 2024-2028
|
144,754
|
|
11,093
|
|
||||
|
Total
|
$
|
291,557
|
|
$
|
26,585
|
|
||
Pension and other postretirement benefit costs consist of the following:
|
|
Pensions
|
Other
Postretirement Benefits
|
||||||||||||||||||||||
|
|
2018
|
2017
|
2016
|
2018
|
2017
|
2016
|
||||||||||||||||||
|
Service cost
|
$
|
5,961
|
|
$
|
6,055
|
|
$
|
5,395
|
|
$
|
85
|
|
$
|
83
|
|
$
|
122
|
|
||||||
|
Interest cost
|
17,383
|
|
18,819
|
|
19,494
|
|
1,358
|
|
1,561
|
|
1,766
|
|
||||||||||||
|
Expected return on plan assets
|
(29,900
|
)
|
(28,082
|
)
|
(30,302
|
)
|
—
|
|
—
|
|
—
|
|
||||||||||||
|
Amortization of prior service cost (credit)
|
560
|
|
446
|
|
210
|
|
20
|
|
(68
|
)
|
(373
|
)
|
||||||||||||
|
Recognized losses
|
11,628
|
|
10,557
|
|
10,791
|
|
561
|
|
276
|
|
535
|
|
||||||||||||
|
Curtailment gain
|
—
|
|
(7,217
|
)
|
—
|
|
—
|
|
—
|
|
—
|
|
||||||||||||
|
Settlement gain
|
—
|
|
(119
|
)
|
—
|
|
—
|
|
—
|
|
—
|
|
||||||||||||
|
Net periodic benefit cost
|
$
|
5,632
|
|
$
|
459
|
|
$
|
5,588
|
|
$
|
2,024
|
|
$
|
1,852
|
|
$
|
2,050
|
|
||||||
The Closure of the Company's FOBOHA facility located in Muri, Switzerland, as discussed above, resulted in a pre-tax curtailment gain of
$7,217
during the 2017 period. See Note 9 of the Consolidated Financial Statements.
The components of net periodic benefit cost other than the service cost component are included in Other Expense (Income) on the Consolidated Statements of Income. The amended guidance related to the presentation of net periodic pension and other postretirement benefit cost (see Note 1) provides for a practical expedient that allows use of amounts disclosed in prior year filings for the prior year comparable periods as an estimation basis for applying the retrospective presentation requirements. The Company has elected to use this practical expedient.
The estimated net actuarial loss and prior service cost for the defined benefit pension plans that will be amortized from accumulated other non-owner changes to equity into net periodic benefit cost in
2019
are
$8,618
and
$404
, respectively. The estimated net actuarial loss and prior service cost for other defined benefit postretirement plans that will be amortized from accumulated other non-owner changes to equity into net periodic benefit cost in
2019
are
$40
and
$25
, respectively.
Weighted-average assumptions used to determine net periodic benefit cost for years ended December 31, are:
|
2018
|
2017
|
2016
|
|||||||
|
U.S. plans:
|
|||||||||
|
Discount rate
|
3.90
|
%
|
4.50
|
%
|
4.65
|
%
|
|||
|
Long-term rate of return
|
7.75
|
%
|
7.75
|
%
|
8.25
|
%
|
|||
|
Increase in compensation
|
2.56
|
%
|
2.56
|
%
|
3.71
|
%
|
|||
|
Non-U.S. plans:
|
|||||||||
|
Discount rate
|
1.90
|
%
|
1.60
|
%
|
2.80
|
%
|
|||
|
Long-term rate of return
|
4.09
|
%
|
3.59
|
%
|
4.73
|
%
|
|||
|
Increase in compensation
|
2.17
|
%
|
2.29
|
%
|
2.71
|
%
|
|||
67
The expected long-term rate of return is based on consideration of projected rates of return and the historical rates of return of published indices that reflect the plans’ target asset allocation.
The Company’s accumulated postretirement benefit obligations, exclusive of pensions, take into account certain cost-sharing provisions. The annual rate of increase in the cost of covered benefits (i.e., health care cost trend rate) is assumed to be
7.30%
and
6.86%
at
December 31, 2018
and
2017
, respectively, decreasing gradually to a rate of
4.50%
by December 31,
2038
. A one percentage point change in the assumed health care cost trend rate would have the following effects:
|
One Percentage
Point Increase
|
One Percentage
Point Decrease
|
|||||||
|
Effect on postretirement benefit obligation
|
$
|
215
|
|
$
|
(200
|
)
|
||
|
Effect on postretirement benefit cost
|
9
|
|
(8
|
)
|
||||
The Company actively contributes to a Swedish pension plan that supplements the Swedish social insurance system. The pension plan guarantees employees a pension based on a percentage of their salary and represents a multi-employer pension plan, however the pension plan was not significant in any year presented. This pension plan is not underfunded.
Contributions related to the individually insignificant multi-employer plans, as disclosure is required pursuant to the applicable accounting standards, are as follows:
|
Contributions by the Company
|
|||||||||||
|
Pension Fund:
|
2018
|
2017
|
2016
|
||||||||
|
Swedish Pension Plan
|
792
|
|
$
|
739
|
|
$
|
673
|
|
|||
|
Total Contributions
|
$
|
792
|
|
$
|
739
|
|
$
|
673
|
|
||
13. Stock-Based Compensation
The Company accounts for the cost of all share-based payments, including stock options, by measuring the payments at fair value on the grant date and recognizing the cost in the results of operations. The fair values of stock options are estimated using the Black-Scholes option-pricing model based on certain assumptions. The fair values of service and performance based stock awards are estimated based on the fair market value of the Company’s stock price on the grant date. The fair value of market based performance share awards are estimated using the Monte Carlo valuation method. Estimated forfeiture rates are applied to outstanding awards.
Refer to Note
17
for a description of the Company’s stock-based compensation plans and their general terms. As of
December 31, 2018
, incentives have been awarded in the form of performance share awards and restricted stock unit awards (collectively, “Rights”) and stock options. The Company has elected to use the straight-line method to recognize compensation costs. Stock options and awards typically vest over a period ranging from
six months
to
five years
. The maximum term of stock option awards is
10
years. Upon exercise of a stock option or upon vesting of Rights, shares may be issued from treasury shares held by the Company or from authorized shares.
In March 2016, the FASB amended its guidance related to the accounting for certain aspects of share-based payments to employees. The amended guidance requires that all tax effects related to share-based payments are recorded at settlement (or expiration) through the income statement, rather than through equity. Cash flows related to excess tax benefits will no longer be separately classified as a financing activity apart from other income tax cash flows. The amended guidance also allows for an employer to repurchase additional employee shares for tax withholding purposes without requiring liability accounting and clarifies that all cash payments made to tax authorities on an employee’s behalf for withheld shares should be presented as a financing activity on the Consolidated Statements of Cash Flows. The guidance also allows for a policy election to account for forfeitures as they occur, rather than accounting for them on an estimated basis. The guidance is effective for fiscal years, and interim periods within those fiscal years, beginning after December 15, 2016. Early adoption is permitted.
The Company elected to early adopt this guidance in the third quarter of 2016. This adoption requires the Company to reflect any adjustments as of January 1, 2016, the beginning of the annual period that includes the interim period of adoption. The most significant impact of adoption was the recognition of excess tax benefits in the provision for income taxes rather than
68
through equity for all periods in fiscal year 2016. This resulted in the recognition of excess tax benefits in the provision for income taxes of
$2,229
for the year ended December 31, 2016. In connection with the additional amendments within the amended guidance, the Company recognized state tax loss carryforwards in the amount of
$198
, which impacted retained earnings as of January 1, 2016. The cumulative effect of this change is required to be recorded in retained earnings. The Company elected to continue to estimate forfeitures expected to occur to determine the amount of compensation cost to be recognized in each period.
The presentation requirements for cash flows related to excess tax benefits and employee taxes paid for withheld shares were applied retrospectively to all periods presented. This resulted in an increase in both net cash provided by operating activities and net cash used by financing activities of
$413
and
$524
for the three and six month periods ended March 31 and June 30, 2016, respectively.
During
2018
,
2017
and
2016
, the Company recognized
$12,175
,
$12,285
, and
$11,493
respectively, of stock-based compensation cost and
$2,613
,
$4,579
, and
$4,284
respectively, of related tax benefits in the accompanying consolidated statements of income. Additionally, the Company recognized excess tax benefits in the tax provision of
$1,687
,
$2,463
and
$2,229
in
2018
,
2017
and 2016, respectively. The Company has realized all available tax benefits related to deductions from excess stock awards exercised or restricted stock unit awards and performance share awards vested. At
December 31, 2018
, the Company had
$15,084
of unrecognized compensation costs related to unvested awards which are expected to be recognized over a weighted average period of
2.20
years.
The following table summarizes information about the Company’s stock option awards during
2018
:
|
Number of
Shares
|
Weighted-Average
Exercise
Price
|
||||||
|
Outstanding, January 1, 2018
|
618,780
|
|
$
|
33.15
|
|
||
|
Granted
|
102,400
|
|
59.28
|
|
|||
|
Exercised
|
(37,031
|
)
|
18.18
|
|
|||
|
Forfeited
|
—
|
|
—
|
|
|||
|
Outstanding, December 31, 2018
|
684,149
|
|
37.87
|
|
|||
The following table summarizes information about stock options outstanding at
December 31, 2018
:
|
|
Options Outstanding
|
Options Exercisable
|
||||||||||||||
|
Range of
Exercise
Prices
|
Number
of Shares
|
Average
Remaining
Life (Years)
|
Average
Exercise
Price
|
Number
of Shares
|
Average
Exercise
Price
|
|||||||||||
|
$11.45 to $15.83
|
44,760
|
|
0.76
|
$
|
14.19
|
|
44,760
|
|
$
|
14.19
|
|
|||||
|
$20.69 to $26.32
|
73,460
|
|
3.39
|
23.73
|
|
73,460
|
|
23.73
|
|
|||||||
|
$26.59 to $34.92
|
164,117
|
|
6.88
|
31.11
|
|
111,425
|
|
30.98
|
|
|||||||
|
$36.31 to $38.93
|
171,247
|
|
5.75
|
36.64
|
|
169,900
|
|
36.62
|
|
|||||||
|
$38.93 to $63.38
|
230,565
|
|
8.50
|
52.71
|
|
43,861
|
|
45.98
|
|
|||||||
The Company received cash proceeds from the exercise of stock options of
$673
,
$1,964
and
$4,184
in
2018
,
2017
and
2016
, respectively. The total intrinsic value (the amount by which the stock price exceeds the exercise price of the option on the date of exercise) of the stock options exercised during
2018
,
2017
and
2016
was
$1,589
,
$2,887
and
$4,464
, respectively.
The weighted-average grant date fair value of stock options granted in
2018
,
2017
and
2016
was
$12.80
,
$10.31
and
$7.01
, respectively. The fair value of each stock option grant on the date of grant was estimated using the Black-Scholes option-pricing model based on the following weighted average assumptions:
69
|
2018
|
2017
|
2016
|
|||||||
|
Risk-free interest rate
|
2.60
|
%
|
1.90
|
%
|
1.20
|
%
|
|||
|
Expected life (years)
|
5.3
|
|
5.3
|
|
5.3
|
|
|||
|
Expected volatility
|
24.1
|
%
|
26.1
|
%
|
29.1
|
%
|
|||
|
Expected dividend yield
|
1.74
|
%
|
1.82
|
%
|
1.94
|
%
|
|||
The risk-free interest rate is based on the term structure of interest rates at the time of the option grant. The expected life represents an estimate of the period of time that options are expected to remain outstanding. Assumptions of expected volatility of the Company’s common stock and expected dividend yield are estimates of future volatility and dividend yields based on historical trends.
The following table summarizes information about stock options outstanding that are expected to vest and stock options outstanding that are exercisable at
December 31, 2018
:
|
Options Outstanding, Expected to Vest
|
Options Outstanding, Exercisable
|
||||||||||||||||||||||
|
Shares
|
Weighted-
Average
Exercise
Price
|
Aggregate
Intrinsic
Value
|
Weighted-
Average
Remaining
Term (Years)
|
Shares
|
Weighted-
Average
Exercise
Price
|
Aggregate
Intrinsic
Value
|
Weighted-
Average
Remaining
Term (Years)
|
||||||||||||||||
|
666,162
|
$
|
37.87
|
|
$
|
11,113
|
|
6.37
|
443,406
|
|
$
|
31.73
|
|
$
|
9,707
|
|
5.31
|
|||||||
The following table summarizes information about the Company’s Rights during
2018
:
|
Service Based Rights
|
Service and Performance Based Rights
|
Service and Market Based Rights
|
|||||||||||||||||||
|
Number of Units
|
Weighted-Average Grant Date Fair Value
|
Number of Units
|
Weighted-Average Grant Date Fair Value
|
Number of Units
|
Weighted-Average Grant Date Fair Value
|
||||||||||||||||
|
Outstanding, January 1, 2018
|
310,524
|
|
$
|
36.90
|
|
155,894
|
|
$
|
37.41
|
|
128,392
|
|
$
|
58.19
|
|
||||||
|
Granted
|
128,295
|
|
59.06
|
|
46,670
|
|
59.28
|
|
23,335
|
|
88.98
|
|
|||||||||
|
Forfeited
|
(15,653
|
)
|
46.28
|
|
(492
|
)
|
68.08
|
|
(408
|
)
|
68.10
|
|
|||||||||
|
Additional Earned
|
—
|
|
—
|
|
15,826
|
|
36.28
|
|
30,614
|
|
54.53
|
|
|||||||||
|
Issued
|
(159,185
|
)
|
65.85
|
|
(70,847
|
)
|
36.28
|
|
(57,995
|
)
|
54.53
|
|
|||||||||
|
Outstanding, December 31, 2018
|
263,981
|
|
|
|
147,051
|
|
|
|
123,938
|
|
|
|
|||||||||
The Company granted
128,295
restricted stock unit awards and
70,005
performance share awards in
2018
. All of the restricted stock unit awards vest upon meeting certain service conditions. "Additional Earned" reflects performance share awards earned above target that have been issued. The performance share awards are part of the long-term Performance Share Award Program (the "Awards Program"), which is designed to assess the long-term Company performance relative to the performance of companies included in the Russell 2000 Index or to pre-established goals. The performance goals are independent of each other and based on equally weighted metrics. For awards granted in 2018, the metrics included the Company's total shareholder return ("TSR"), operating income before depreciation and amortization growth ("EBITDA growth") and return on invested capital ("ROIC"). For awards granted in 2017 and 2016, the metrics included TSR and ROIC. The TSR and EBITDA growth metrics are designed to assess the long-term Company performance relative to the performance of companies included in the Russell 2000 Index over a
three
year period. ROIC is designed to assess the Company’s performance compared to pre-established goals over a
three
year performance period. The participants can earn from
zero
to
250%
of the target award and the award includes a forfeitable right to dividend equivalents, which are not included in the aggregate target award numbers. Compensation expense for the awards is recognized over the
three
year service period based upon the value determined under the intrinsic value method for EBITDA growth and ROIC portions of the award and the Monte Carlo simulation valuation model for the TSR portion of the award since it contains a market condition. The assumptions used to determine the weighted-average fair values of the market based portion of the
2018
awards include a
2.29%
risk-free interest rate and a
23.96%
expected volatility rate.
70
Compensation expense for the TSR portion of the awards is fixed at the date of grant and will not be adjusted in future periods based upon the achievement of the TSR performance goal. Compensation expense for the EBITDA growth and the ROIC portions of the awards is recorded each period based upon a probability assessment of achieving the goals with a final adjustment at the end of the service period based upon the actual achievement of those performance goals.
14. Income Taxes
The components of Income from continuing operations before income taxes and Income taxes follow:
|
2018
|
2017
|
2016
|
||||||||||
|
Income from continuing operations before income taxes:
|
||||||||||||
|
U.S.
|
$
|
(10,719
|
)
|
$
|
3,082
|
|
$
|
34,129
|
|
|||
|
International
|
218,214
|
|
192,617
|
|
148,492
|
|
||||||
|
Income from continuing operations before income taxes
|
$
|
207,495
|
|
$
|
195,699
|
|
$
|
182,621
|
|
|||
|
Income tax provision:
|
||||||||||||
|
Current:
|
||||||||||||
|
U.S. – federal
|
$
|
3,110
|
|
$
|
77,799
|
|
$
|
7,215
|
|
|||
|
U.S. – state
|
(623
|
)
|
1,762
|
|
755
|
|
||||||
|
International
|
57,871
|
|
48,032
|
|
41,516
|
|
||||||
|
60,358
|
|
127,593
|
|
49,486
|
|
|||||||
|
Deferred:
|
||||||||||||
|
U.S. – federal
|
$
|
(2,206
|
)
|
$
|
9,596
|
|
$
|
6,091
|
|
|||
|
U.S. – state
|
(826
|
)
|
819
|
|
1,060
|
|
||||||
|
International
|
(16,017
|
)
|
(1,724
|
)
|
(9,617
|
)
|
||||||
|
(19,049
|
)
|
8,691
|
|
(2,466
|
)
|
|||||||
|
Income taxes
|
$
|
41,309
|
|
$
|
136,284
|
|
$
|
47,020
|
|
|||
On December 22, 2017 the U.S. government enacted comprehensive tax legislation commonly referred to as the Tax Cuts and Jobs Act (the “Act”). The Act reduced the U.S. Corporate income tax rate from 35% to 21%, effective January 1, 2018. As required, the Company re-measured its U.S. deferred tax assets and liabilities as of December 31, 2017, applying the reduced U.S. Corporate income tax rate. As a result, the Company recorded a provisional adjustment of
$4,152
to net expense, with a corresponding reduction to the U.S. net deferred asset. The Company filed the 2017 Federal Corporate Tax Return in October 2018 and claimed additional tax deductions subject to the 35% tax rate, which reduced the related tax expense to
$3,399
.
The Act taxed certain unrepatriated earnings and profits (“E&P”) of our foreign subsidiaries. In order to determine the Transition Tax we were required to determine, along with other information, the amount of our accumulated post 1986 E&P for our foreign subsidiaries, as well as the non U.S. income tax paid by those subsidiaries on such E&P. We were capable of reasonably estimating the Transition Tax and recorded a provisional Transition Tax expense of
$86,707
in 2017. The U.S. Treasury issued certain Notices and proposed regulations ("interpretative guidance") in 2018. The interpretative guidance provided additional guidance to assist companies in calculating the one-time Transition Tax. The Company has completed the accounting and recorded a final Transition Tax of
$86,858
. The U.S. Treasury issued Final Regulations addressing the Transition Tax in January 2019. The Final Regulations did not impact the computation of final income tax expense. The Company was able to make a reasonable estimate of the state taxation of these earnings and recorded a provisional expense of
$1,423
in 2017. In 2018, various states issued guidance related to calculating the tax impacts of the Act, as well as clarifications describing how States would tax income arising from the application of provisions within the Act. As a result of the recent guidance, the Company has reduced the tax expense related to the impact of the Act to
$597
in 2018.
U.S. Tax Reform required the mandatory deemed repatriation of the undistributed earnings of the Company’s international subsidiaries as of December 31, 2017. If the earnings were distributed in the form of cash dividends, the Company would not be subject to additional U.S. income taxes but could be subject to foreign income and withholding taxes. Under accounting standards (ASC 740) a deferred tax liability is not recorded for the excess of the tax basis over the financial reporting (book) basis of an investment in a foreign subsidiary if the indefinite reinvestment criteria is met. On December 31,
71
2018, the Company's unremitted foreign earnings were approximately
$1,397,056
. For amounts currently expected to be repatriated, the Company recorded a provisional expense of
$6,932
during 2017. In 2018 the Company repatriated
$62,383
between certain foreign entities, thereby reducing the previously recorded deferred tax liability by
$5,245
and repatriated
$228,750
to the U.S. In 2018, the Company revised its estimates and no longer expects to repatriate foreign earnings relating to
$1,185
of taxes for which a deferred tax liability was previously recorded and as such, a benefit resulted.
The Company has recognized a deferred tax liability for U.S. taxes of
$502
on
$10,166
of undistributed earnings of its international subsidiaries, earned before 2017 and the application of the Transition Tax implemented by the Act. All remaining earnings are considered indefinitely reinvested as defined per the indefinite reversal criterion within the accounting guidance for income taxes. If the earnings were distributed in the form of dividends, the Company would not be subject to U.S. Tax but could be subject to foreign income and withholding taxes. Determination of the amount of this unrecognized deferred income tax liability is not practicable. The Company repatriated dividends of
$228,750
, as noted above, and
$7,250
to the U.S. from accumulated foreign earnings in 2018 and 2017, respectively. Pursuant to the Act, neither dividend was subject to tax.
Deferred income tax assets and liabilities at December 31 consist of the tax effects of temporary differences related to the following:
|
|
2018
|
2017
|
||||||
|
Deferred tax assets:
|
||||||||
|
Pension
|
$
|
19,025
|
|
$
|
13,255
|
|
||
|
Tax loss carryforwards
|
11,516
|
|
16,078
|
|
||||
|
Inventory valuation
|
11,576
|
|
10,568
|
|
||||
|
Other postretirement/postemployment costs
|
8,372
|
|
9,440
|
|
||||
|
Accrued Compensation
|
9,384
|
|
5,743
|
|
||||
|
Other
|
3,349
|
|
4,018
|
|
||||
|
Valuation allowance
|
(4,366
|
)
|
(10,223
|
)
|
||||
|
Total deferred tax assets
|
58,856
|
|
|
48,879
|
|
|||
|
Deferred tax liabilities:
|
|
|
|
|
|
|||
|
Depreciation and amortization
|
(122,636
|
)
|
(82,422
|
)
|
||||
|
Goodwill
|
(9,597
|
)
|
(9,440
|
)
|
||||
|
Other
|
(12,708
|
)
|
(18,361
|
)
|
||||
|
Total deferred tax liabilities
|
(144,941
|
)
|
(110,223
|
)
|
||||
|
Net deferred tax liabilities
|
$
|
(86,085
|
)
|
$
|
(61,344
|
)
|
||
In the first quarter of 2016, the Company prospectively adopted the amended guidance related to the balance sheet classification of deferred income taxes. The amended guidance removed the requirement to separate and classify deferred income tax liabilities and assets into current and non-current amounts and required an entity to now classify all deferred tax liabilities and assets as non-current. The provisions of the amended guidance were adopted on a prospective basis during the first quarter of 2016. Amounts related to deferred taxes in the balance sheets as of December 31, 2018 and 2017 are presented as follows:
|
2018
|
2017
|
|||||||
|
Non-current deferred tax assets
|
$
|
20,474
|
|
$
|
12,161
|
|
||
|
Non-current deferred tax liabilities
|
(106,559
|
)
|
(73,505
|
)
|
||||
|
Net deferred tax liabilities
|
$
|
(86,085
|
)
|
$
|
(61,344
|
)
|
||
The standards related to accounting for income taxes require that deferred tax assets be reduced by a valuation allowance if, based on all available evidence, it is more likely than not that the deferred tax asset will not be realized. Available evidence includes the reversal of existing taxable temporary differences, future taxable income exclusive of temporary differences, taxable income in carryback years and tax planning strategies.
72
Management believes that sufficient taxable income should be earned in the future to realize the net deferred tax assets principally in the United States. The realization of these assets is dependent in part on the amount and timing of future taxable income in the jurisdictions where deferred tax assets reside. The Company has tax loss carryforwards of
$42,175
;
$3,294
which relates to U.S tax loss carryforwards which have carryforward periods up to
20
years for federal purposes and ranging from
one
to
20
years for state purposes;
$28,458
of which relates to international tax loss carryforwards with carryforward periods ranging from
one
to
20
years; and
$10,963
of which relates to international tax loss carryforwards with unlimited carryforward periods. In addition, the Company has tax credit carryforwards of
$228
with remaining carryforward periods ranging from
one
year to
5
years. As the ultimate realization of the remaining net deferred tax assets is dependent upon future taxable income, if such future taxable income is not earned and it becomes necessary to recognize a valuation allowance, it could result in a material increase in the Company’s tax expense which could have a material adverse effect on the Company’s financial condition and results of operations.
Management is required to assess whether its valuation allowance analysis is affected by various components of the Act including the deemed mandatory repatriation of foreign income for the Transition Tax, future GILTI inclusions, changes to the deductibility of executive compensation and interest expense and changes to the NOL and FTC rules. The Company has determined that a valuation allowance of
$206
is appropriate relating to deferred taxes recognized for stock compensation granted to executives which the Company believes will not be deductible in future years.
A reconciliation of the U.S. federal statutory income tax rate to the consolidated effective income tax rate from continuing operations follows:
|
2018
|
2017
|
2016
|
|||||||
|
U.S. federal statutory income tax rate
|
21.0
|
%
|
35.0
|
%
|
35.0
|
%
|
|||
|
State taxes (net of federal benefit)
|
—
|
|
0.1
|
|
0.4
|
|
|||
|
Transition Tax
|
(0.3
|
)
|
45.0
|
|
—
|
|
|||
|
U.S. Corporate Tax Rate change
|
(0.4
|
)
|
2.1
|
|
—
|
|
|||
|
Indefinite Reinvestment Assertion
|
(0.6
|
)
|
3.5
|
|
—
|
|
|||
|
Foreign operations taxed at different rates
|
1.3
|
|
(11.5
|
)
|
(10.9
|
)
|
|||
|
Foreign losses without tax benefit
|
1.5
|
|
1.5
|
|
0.7
|
|
|||
|
Repatriation from current year foreign earnings
|
—
|
|
—
|
|
1.6
|
|
|||
|
GILTI
|
1.2
|
|
—
|
|
—
|
|
|||
|
Tax Holidays
|
(1.7
|
)
|
(0.8
|
)
|
(1.2
|
)
|
|||
|
Stock awards excess tax benefit
|
(0.8
|
)
|
(1.2
|
)
|
(1.2
|
)
|
|||
|
Swiss Legal Entity Reduction
|
—
|
|
(3.4
|
)
|
—
|
|
|||
|
Reduction of Valuation Allowances
|
(2.5
|
)
|
—
|
|
—
|
|
|||
|
Audit Settlements
|
—
|
|
(2.7
|
)
|
—
|
|
|||
|
Other
|
1.2
|
|
2.0
|
|
1.3
|
|
|||
|
Consolidated effective income tax rate
|
19.9
|
%
|
69.6
|
%
|
25.7
|
%
|
|||
Payment of the Transition Tax assessed is required over an eight-year period. The short-term portion of the Transition Tax payable,
$416
, has been included within Accrued Liabilities on the Consolidated Balance Sheet as of December 31, 2018. The long-term portion of the assessment,
$72,961
, is included as a Long-term tax liability on the Consolidated Balance Sheet and is payable as follows:
$6,949
annually in 2020 through 2022;
$13,029
in 2023;
$17,371
in 2024 and
$21,714
in 2025.
The Aerospace and Industrial Segments were previously awarded a number of multi-year tax holidays in both Singapore and China. Tax benefits of
$3,627
(
$0.07
per diluted share),
$1,540
(
$0.03
per diluted share) and
$2,245
(
$0.04
per diluted share) were realized in
2018
,
2017
and
2016
, respectively. These holidays are subject to the Company meeting certain commitments in the respective jurisdictions. Most tax holidays expired in 2017.
Income taxes paid globally, net of refunds, were
$60,576
,
$51,548
and
$40,842
in
2018
,
2017
and
2016
, respectively.
As of
December 31, 2018
,
2017
and
2016
, the total amount of unrecognized tax benefits recorded in the consolidated balance sheet was
$11,594
,
$9,209
and
$13,320
, respectively, which, if recognized, would have reduced the effective tax rate in
73
prior years, with the exception of amounts related to acquisitions. A reconciliation of the unrecognized tax benefits for
2018
,
2017
and
2016
follows:
|
2018
|
2017
|
2016
|
||||||||||
|
Balance at January 1
|
$
|
9,209
|
|
$
|
13,320
|
|
$
|
10,634
|
|
|||
|
Increase (decrease) in unrecognized tax benefits due to:
|
||||||||||||
|
Tax positions taken during prior periods
|
649
|
|
1,141
|
|
—
|
|
||||||
|
Tax positions taken during the current period
|
367
|
|
778
|
|
117
|
|
||||||
|
Acquisition
|
2,516
|
|
—
|
|
2,569
|
|
||||||
|
Settlements
|
—
|
|
(4,162
|
)
|
—
|
|
||||||
|
Lapse of the applicable statute of limitations
|
(1,290
|
)
|
(1,868
|
)
|
—
|
|
||||||
|
Foreign Currency Translation
|
143
|
|
—
|
|
—
|
|
||||||
|
Balance at December 31
|
$
|
11,594
|
|
$
|
9,209
|
|
$
|
13,320
|
|
|||
The Company recognizes interest and penalties, if any, related to unrecognized tax benefits in income tax expense. The Company recognized interest and penalties as a component of income taxes of
$370
,
$(257)
, and
$(337)
in the years
2018
,
2017
and
2016
respectively. The liability for unrecognized tax benefits includes gross accrued interest and penalties of
$4,169
,
$1,576
and
$1,838
at
December 31, 2018
,
2017
and
2016
, respectively.
The Company or its subsidiaries file income tax returns in the U.S. federal jurisdiction, and various state and foreign jurisdictions. In the normal course of business, the Company is subject to examination by various taxing authorities, including the IRS in the U.S. and the taxing authorities in other major jurisdictions including China, Germany, Singapore, Sweden and Switzerland. With a few exceptions, tax years remaining open to examination in significant foreign jurisdictions include tax years 2011 and forward and for the U.S. include tax years 2015 and forward. The Company was notified that the IRS will be auditing the 2016 tax year. The Company has received the final assessment in Germany for tax years 2011 through 2015 and remains under audit for certain subsidiaries in 2015 and 2016.
15. Common Stock
There were
no
shares of common stock issued from treasury in
2018
,
2017
or
2016
.
In
2018
,
2017
and
2016
, the Company acquired
2,292,100
shares,
677,100
shares and
550,994
shares, respectively, of the Company’s common stock at a cost of
$138,275
,
$40,791
and
$20,520
, respectively. These amounts exclude shares reacquired to pay for the related income tax upon issuance of shares in accordance with the terms of the Company’s stockholder-approved equity compensation plans and the equity rights granted under those plans ("Reacquired Shares"). These Reacquired Shares were placed in treasury.
In
2018
,
2017
and
2016
,
332,893
shares,
341,837
shares and
621,259
shares of common stock, respectively, were issued from authorized shares for the exercise of stock options, various other incentive awards and purchases by the Company's Employee Stock Purchase Plan.
16. Preferred Stock
At
December 31, 2018
and
2017
, the Company had
3,000,000
shares of preferred stock authorized,
none
of which were outstanding.
17. Stock Plans
Most U.S. salaried and non-union hourly employees are eligible to participate in the Company’s 401(k) plan (the "Retirement Savings Plan"). The Retirement Savings Plan provides for the investment of employer and employee contributions in various investment alternatives including the Company’s common stock, at the employee’s direction. The Company contributes an amount equal to
50%
of employee contributions up to
6%
of eligible compensation. The Company expenses all contributions made to the Retirement Savings Plan. Effective January 1, 2013, the Retirement Savings Plan was amended to provide certain salaried employees hired on or after January 1, 2013 with an additional annual retirement contribution of
4%
of
74
eligible earnings. The Company recognized expense of
$4,333
,
$4,088
and
$3,660
in
2018
,
2017
and
2016
, respectively. As of
December 31, 2018
, the Retirement Savings Plan held
1,075,692
shares of the Company’s common stock.
The Company has an Employee Stock Purchase Plan (“ESPP”) under which eligible employees may elect to have up to the lesser of
$25
or
10%
of base compensation deducted from their payroll checks for the purchase of the Company’s common stock at
95%
of the average market value on the date of purchase. The maximum number of shares which may be purchased under the ESPP is
4,550,000
. The number of shares purchased under the ESPP was
8,006
,
7,734
and
11,804
in
2018
,
2017
and
2016
, respectively. The Company received cash proceeds from the purchase of these shares of
$457
,
$444
and
$427
in
2018
,
2017
and
2016
, respectively. As of
December 31, 2018
,
269,665
additional shares may be purchased.
The 1991 Barnes Group Stock Incentive Plan (the “1991 Plan”) authorized the granting of incentives to executive officers, directors and key employees in the form of stock options, stock appreciation rights, incentive stock rights and performance unit awards. On May 9, 2014, the 1991 Plan was merged into the 2014 Plan (defined below).
The Barnes Group Inc. Employee Stock and Ownership Program (the “2000 Plan”) was approved on April 12, 2000, and subsequently amended on April 10, 2002 by the Company’s stockholders. The 2000 Plan permitted the granting of incentive stock options, nonqualified stock options, restricted stock awards, performance share or cash unit awards and stock appreciation rights, or any combination of the foregoing, to eligible employees to purchase up to
6,900,000
shares of the Company’s common stock. Such shares were authorized and reserved. On May 9, 2014, the 2000 Plan was merged into the 2014 Plan (defined below).
The Barnes Group Stock and Incentive Award Plan (the “2004 Plan”) was approved on April 14, 2004, and subsequently amended on April 20, 2006 and May 7, 2010 by the Company’s stockholders. The 2004 Plan permits the issuance of incentive awards, stock option grants and stock appreciation rights to eligible participants to purchase up to
5,700,000
shares of common stock. On May 9, 2014, the 2004 Plan was merged into the 2014 Plan (defined below), and the remaining shares available for future grants under the 2004 Plan, as of the merger date, were made available under the 2014 Plan.
The 2014 Barnes Group Stock and Incentive Award Plan (the “2014 Plan”) was approved on May 9, 2014 by the Company's stockholders. The 2014 Plan permits the issuance of incentive awards, stock option grants and stock appreciation rights to eligible participants to purchase up to
6,913,978
shares of common stock. The amount includes shares available for purchase under the 1991, 2000, and 2004 Plans which were merged into the 2014 Plan. The 2014 Plan allows for stock options and stock appreciation rights to be issued at a ratio of
1
:1 and other types of incentive awards at a ratio of
2.84
:1 from the shares available for future grants. As of
December 31, 2018
, there were
4,600,596
shares available for future grants under the 2014 Plan, inclusive of Shares Reacquired and shares made available through
2018
forfeitures. As of
December 31, 2018
, there were
1,281,844
shares of common stock outstanding to be issued upon the exercise of stock options and the vesting of Rights.
Rights under the 2014 Plan entitle the holder to receive, without payment, one share of the Company’s common stock after the expiration of the vesting period. Certain of these Rights are also subject to the satisfaction of established performance goals. Additionally, holders of certain Rights are credited with dividend equivalents, which are converted into additional Rights, and holders of certain restricted stock units are paid dividend equivalents in cash when dividends are paid to other stockholders. All Rights have a vesting period of up to
five years
.
Under the Non-Employee Director Deferred Stock Plan, as amended, each non-employee director who joined the Board of Directors prior to December 15, 2005 was granted the right to receive
12,000
shares of the Company’s common stock upon retirement. In
2018
,
2017
and
2016
,
$22
,
$20
and
$21
, respectively, of dividend equivalents were paid in cash related to these shares. Compensation cost related to this plan was
$8
,
$9
and
$28
in
2018
,
2017
and
2016
, respectively. There are
36,000
shares reserved for issuance under this plan. Each non-employee director who joined the Board of Directors subsequent to December 15, 2005 received restricted stock units under the respective 2004 or 2014 Plans.
Total maximum shares reserved for issuance under all stock plans aggregated
6,188,105
at
December 31, 2018
.
18. Weighted Average Shares Outstanding
Net income per common share is computed in accordance with accounting standards related to earnings per share. Basic earnings per share is calculated using the weighted-average number of common shares outstanding during the year. Share-based payment awards that entitle their holders to receive nonforfeitable dividends before vesting should be considered participating securities and, as such, should be included in the calculation of basic earnings per share. The Company’s restricted stock unit
75
awards which contain nonforfeitable rights to dividends are considered participating securities. Diluted earnings per share reflects the assumed exercise and conversion of all dilutive securities. Shares held by the Retirement Savings Plan are considered outstanding for both basic and diluted earnings per share. There are no adjustments to net income for purposes of computing income available to common stockholders for the years ended
December 31, 2018
,
2017
and
2016
. A reconciliation of the weighted-average number of common shares outstanding used in the calculation of basic and diluted earnings per share follows:
|
|
Weighted-Average Common Shares Outstanding
|
||||||||
|
|
2018
|
2017
|
2016
|
||||||
|
Basic
|
52,304,190
|
|
54,073,407
|
|
54,191,013
|
|
|||
|
Dilutive effect of:
|
|||||||||
|
Stock options
|
260,240
|
|
258,052
|
|
166,986
|
|
|||
|
Performance share awards
|
267,176
|
|
273,839
|
|
273,314
|
|
|||
|
Diluted
|
52,831,606
|
|
54,605,298
|
|
54,631,313
|
|
|||
The calculation of weighted-average diluted shares outstanding excludes all anti-dilutive shares. During
2018
,
2017
and
2016
, the Company excluded
127,562
,
46,450
and
262,336
stock awards, respectively, from the calculation of diluted weighted-average shares outstanding as the stock awards were considered anti-dilutive.
19. Changes in Accumulated Other Comprehensive Income by Component
The following tables set forth the changes in accumulated other comprehensive income by component for the years ended
December 31, 2018
and
December 31, 2017
:
76
|
Gains and Losses on Cash Flow Hedges
|
Pension and Other Postretirement Benefit Items
|
Foreign Currency Items
|
Total
|
||||||||||||
|
January 1, 2018
|
$
|
72
|
|
$
|
(103,844
|
)
|
$
|
(2,627
|
)
|
$
|
(106,399
|
)
|
|||
|
Other comprehensive (loss) income before reclassifications to consolidated statements of income
|
(410
|
)
|
(25,170
|
)
|
(50,017
|
)
|
(75,597
|
)
|
|||||||
|
Amounts reclassified from accumulated other comprehensive income to the consolidated statements of income
|
1,083
|
|
9,744
|
|
—
|
|
10,827
|
|
|||||||
|
Net current-period other comprehensive income (loss)
|
673
|
|
(15,426
|
)
|
(50,017
|
)
|
(64,770
|
)
|
|||||||
|
Amounts reclassified from accumulated other comprehensive income to retained earnings
(A)
|
89
|
|
(19,420
|
)
|
—
|
|
(19,331
|
)
|
|||||||
|
December 31, 2018
|
$
|
834
|
|
$
|
(138,690
|
)
|
$
|
(52,644
|
)
|
$
|
(190,500
|
)
|
|||
|
(A) This amount represents the reclassification of stranded tax effects resulting from the Act, as permitted by amended guidance issued by the FASB in February 2018. See Note 1.
|
|||||||||||||||
|
Gains and Losses on Cash Flow Hedges
|
Pension and Other Postretirement Benefit Items
|
Foreign Currency Items
|
Total
|
||||||||||||
|
January 1, 2017
|
$
|
(227
|
)
|
$
|
(114,570
|
)
|
$
|
(86,031
|
)
|
$
|
(200,828
|
)
|
|||
|
Other comprehensive (loss) income before reclassifications to consolidated statements of income
|
(231
|
)
|
3,342
|
|
83,404
|
|
86,515
|
|
|||||||
|
Amounts reclassified from accumulated other comprehensive income to the consolidated statements of income
|
530
|
|
7,384
|
|
—
|
|
7,914
|
|
|||||||
|
Net current-period other comprehensive income
|
299
|
|
10,726
|
|
83,404
|
|
94,429
|
|
|||||||
|
December 31, 2017
|
$
|
72
|
|
$
|
(103,844
|
)
|
$
|
(2,627
|
)
|
$
|
(106,399
|
)
|
|||
The following table sets forth the reclassifications out of accumulated other comprehensive income by component for the years ended
December 31, 2018
and
December 31, 2017
:
77
|
Details about Accumulated Other Comprehensive Income Components
|
Amount Reclassified from Accumulated Other Comprehensive Income
|
Affected Line Item in the Consolidated Statements of Income
|
||||||||
|
2018
|
2017
|
|||||||||
|
Gains and losses on cash flow hedges
|
||||||||||
|
Interest rate contracts
|
$
|
(277
|
)
|
$
|
(545
|
)
|
Interest expense
|
|||
|
Foreign exchange contracts
|
(1,116
|
)
|
(242
|
)
|
Net sales
|
|||||
|
(1,393
|
)
|
(787
|
)
|
Total before tax
|
||||||
|
310
|
|
257
|
|
Tax benefit
|
||||||
|
(1,083
|
)
|
(530
|
)
|
Net of tax
|
||||||
|
Pension and other postretirement benefit items
|
||||||||||
|
Amortization of prior-service costs, net
|
$
|
(580
|
)
|
$
|
(378
|
)
|
(A)
|
|||
|
Amortization of actuarial losses
|
(12,189
|
)
|
(10,833
|
)
|
(A)
|
|||||
|
Curtailment gain
|
—
|
|
187
|
|
(A)
|
|||||
|
Settlement loss
|
—
|
|
(142
|
)
|
(A)
|
|||||
|
(12,769
|
)
|
(11,166
|
)
|
Total before tax
|
||||||
|
3,025
|
|
3,782
|
|
Tax benefit
|
||||||
|
(9,744
|
)
|
(7,384
|
)
|
Net of tax
|
||||||
|
Total reclassifications in the period
|
$
|
(10,827
|
)
|
$
|
(7,914
|
)
|
||||
20. Information on Business Segments
The Company is organized based upon the nature of its products and services and reports under
two
global business segments: Industrial and Aerospace. Segment information is consistent with how management reviews the businesses, makes investing and resource allocation decisions and assesses operating performance. The Company has not aggregated operating segments for purposes of identifying these
two
reportable segments.
Industrial
is a global provider of highly-engineered, high-quality precision components, products and systems for critical applications serving a diverse customer base in end-markets such as transportation, industrial equipment, automation, personal care, packaging, electronics, and medical devices. Focused on innovative custom solutions, Industrial participates in the design phase of components and assemblies whereby customers receive the benefits of application and systems engineering, new product development, testing and evaluation, and the manufacturing of final products. Products are sold primarily through its direct sales force and global distribution channels. Industrial's Molding Solutions business designs and manufactures customized hot runner systems, advanced mold cavity sensors and process control systems, and precision high cavitation mold assemblies - collectively, the enabling technologies for many complex injection molding applications. The Force & Motion Control business provides innovative cost effective force and motion control solutions for a wide range of metal forming and other industrial markets. The Automation business designs and develops robotic grippers, advanced end-of-arm tooling systems, sensors and other automation components for intelligent robotic handling solutions and industrial automation applications. Industrial's Engineered Components business manufactures and supplies precision mechanical products used in transportation and industrial applications, including mechanical springs, high-precision punched and fine-blanked components and retention rings.
Industrial competes with a broad base of large and small companies engaged in the manufacture and sale of engineered products, precision molds, hot runner systems, robotic handling solutions and precision components. Industrial competes on the basis of quality, service, reliability of supply, engineering and technical capability, geographic reach, product breadth, innovation, design and price. Industrial has a global presence in multiple countries, with manufacturing, distribution and assembly operations in the United States, China, Germany, Italy, Sweden and Switzerland, among others. Industrial also has sales and service operations in the United States, China/Hong Kong, Germany, Italy and Switzerland, among others.
78
Aerospace
is a global manufacturer of complex fabricated and precision machined components and assemblies for turbine engines, nacelles and structures for both commercial and military aircraft. The Aerospace aftermarket business provides aircraft engine component MRO services, including services performed under our Component Repair Programs (“CRPs”), for many of the world’s major turbine engine manufacturers, commercial airlines and the military. The Aerospace aftermarket activities also include the manufacture and delivery of aerospace aftermarket spare parts, including revenue sharing programs (“RSPs”) under which the Company receives an exclusive right to supply designated aftermarket parts over the life of specific aircraft engine programs.
Aerospace’s OEM business supplements the leading aircraft engine OEM, nacelles, and structure capabilities and competes with a large number of fabrication and machining companies. Competition is based mainly on value derived from intellectual property and trade secrets, quality, concurrent engineering and technical capability, product breadth, solutions providing new product introduction, timeliness, service and price. Aerospace’s fabrication and machining operations, with facilities in Arizona, Connecticut, Mexico, Michigan, Ohio, Utah and Singapore, produce critical engine, nacelle and airframe components through technologically advanced manufacturing processes.
The Aerospace aftermarket business supplements jet engine OEMs’ maintenance, repair and overhaul capabilities, and competes with the service centers of major commercial airlines and other independent service companies for the repair and overhaul of turbine engine components. The manufacture and supply of aerospace aftermarket spare parts, including those related to the RSPs, are dependent upon the reliable and timely delivery of high-quality components. Aerospace’s aftermarket facilities, located in Connecticut, Ohio, Singapore and Malaysia, specialize in the repair and refurbishment of highly engineered components and assemblies such as cases, rotating life limited parts, rotating air seals, turbine shrouds, vanes and honeycomb air seals.
The Company evaluates the performance of its reportable segments based on the operating profit of the respective businesses, which includes net sales, cost of sales, selling and administrative expenses and certain components of other expense (income), net, as well as the allocation of corporate overhead expenses.
Sales between the business segments and between the geographic areas in which the businesses operate are accounted for on the same basis as sales to unaffiliated customers. Additionally, revenues are attributed to countries based on the location of facilities.
79
The following table (in millions) sets forth summarized financial information by reportable business segment
|
Industrial
|
Aerospace
|
Other
|
Total Company
|
|||||||||||||
|
Sales
|
||||||||||||||||
|
2018
|
$
|
994.7
|
|
$
|
501.2
|
|
$
|
—
|
|
$
|
1,495.9
|
|
||||
|
2017
|
973.9
|
|
462.6
|
|
—
|
|
1,436.5
|
|
||||||||
|
2016
|
824.2
|
|
406.5
|
|
—
|
|
1,230.8
|
|
||||||||
|
Operating profit
|
||||||||||||||||
|
2018
|
$
|
130.4
|
|
$
|
101.4
|
|
$
|
—
|
|
$
|
231.8
|
|
||||
|
2017
|
122.8
|
|
83.6
|
|
—
|
|
206.5
|
|
||||||||
|
2016
|
131.8
|
|
62.5
|
|
—
|
|
194.3
|
|
||||||||
|
Assets
|
||||||||||||||||
|
2018
|
$
|
1,962.4
|
|
$
|
692.6
|
|
$
|
154.0
|
|
$
|
2,809.0
|
|
||||
|
2017
|
1,505.4
|
|
667.1
|
|
193.3
|
|
2,365.7
|
|
||||||||
|
2016
|
1,356.1
|
|
647.8
|
|
133.7
|
|
2,137.5
|
|
||||||||
|
Depreciation and amortization
|
||||||||||||||||
|
2018
|
$
|
57.6
|
|
$
|
35.9
|
|
$
|
0.8
|
|
$
|
94.2
|
|
||||
|
2017
|
54.8
|
|
33.6
|
|
1.7
|
|
90.2
|
|
||||||||
|
2016
|
49.5
|
|
30.0
|
|
0.7
|
|
80.2
|
|
||||||||
|
Capital expenditures
|
||||||||||||||||
|
2018
|
$
|
33.4
|
|
$
|
23.6
|
|
$
|
0.3
|
|
$
|
57.3
|
|
||||
|
2017
|
31.0
|
|
27.5
|
|
0.2
|
|
58.7
|
|
||||||||
|
2016
|
25.9
|
|
21.1
|
|
0.5
|
|
47.6
|
|
||||||||
Notes:
One customer, General Electric, accounted for
18%
,
18%
and
17%
of the Company’s total revenues in
2018
,
2017
and
2016
, respectively.
“Other” assets include corporate-controlled assets, the majority of which are cash and cash equivalents.
A reconciliation of the total reportable segments’ operating profit to income before income taxes follows (in millions):
|
2018
|
2017
|
2016
|
||||||||||
|
Operating profit
|
$
|
231.8
|
|
$
|
206.5
|
|
$
|
194.3
|
|
|||
|
Interest expense
|
16.8
|
|
14.6
|
|
11.9
|
|
||||||
|
Other expense (income), net
|
7.4
|
|
(3.8
|
)
|
(0.2
|
)
|
||||||
|
Income before income taxes
|
$
|
207.5
|
|
$
|
195.7
|
|
$
|
182.6
|
|
|||
The following table (in millions) summarizes total net sales of the Company by products and services:
|
2018
|
2017
|
2016
|
||||||||||
|
Engineered Components Products
|
$
|
285.9
|
|
$
|
292.2
|
|
$
|
283.4
|
|
|||
|
Molding Solutions Products
|
503.8
|
|
487.3
|
|
376.6
|
|
||||||
|
Force & Motion Control Products
|
196.2
|
|
194.4
|
|
164.2
|
|
||||||
|
Automation Products
|
8.8
|
|
—
|
|
—
|
|
||||||
|
Aerospace Original Equipment Manufacturer Products
|
337.0
|
|
323.4
|
|
288.4
|
|
||||||
|
Aerospace Aftermarket Products and Services
|
164.2
|
|
139.2
|
|
118.2
|
|
||||||
|
Total net sales
|
$
|
1,495.9
|
|
$
|
1,436.5
|
|
$
|
1,230.8
|
|
|||
80
The following table (in millions) summarizes total net sales and long-lived assets of the Company by geographic area:
|
Domestic
|
International
|
Other
|
Total
Company
|
||||||||||||||
|
Sales
|
|||||||||||||||||
|
2018
|
|
$
|
624.3
|
|
$
|
958.7
|
|
$
|
(87.1
|
)
|
$
|
1,495.9
|
|
||||
|
2017
|
|
638.6
|
|
868.3
|
|
(70.4
|
)
|
1,436.5
|
|
||||||||
|
2016
|
|
562.6
|
|
727.4
|
|
(59.2
|
)
|
1,230.8
|
|
||||||||
|
Long-lived assets
|
|||||||||||||||||
|
2018
|
|
$
|
366.1
|
|
$
|
1,616.2
|
|
$
|
—
|
|
$
|
1,982.4
|
|
||||
|
2017
|
|
366.7
|
|
1,218.1
|
|
—
|
|
1,584.8
|
|
||||||||
|
2016
|
|
368.2
|
|
1,135.5
|
|
—
|
|
1,503.6
|
|
||||||||
_________________________
Notes:
Germany, with sales of
$331.4 million
million,
$301.7 million
and
$238.3 million
in
2018
,
2017
and
2016
, respectively, and Singapore, with sales of
$193.6 million
in
2018
represent the only international countries with revenues in excess of
10%
of the Company's total revenues in those years.
“Other” revenues represent the elimination of intercompany sales between geographic locations, of which approximately
72%
,
78%
and
82%
were sales from international locations to domestic locations in
2018
,
2017
and
2016
, respectively.
Germany, with long-lived assets of
$494.0 million
,
$514.0 million
and
$449.9 million
as of December 31,
2018
,
2017
and
2016
, respectively, Singapore, with long-lived assets of
$233.3 million
,
$237.6 million
and
$238.3 million
as of December 31,
2018
,
2017
and
2016
, respectively, Italy, with long-lived assets of
$412.0 million
as of December 31, 2018, and Switzerland, with long-lived assets of
$160.0 million
and
$169.3 million
as of December 31,
2017
and
2016
, respectively, represent the international countries with long-lived assets that exceeded
10%
of the Company's total long-lived assets in those years.
21. Commitments and Contingencies
Leases
The Company has various noncancellable operating leases for buildings, office space and equipment. Rent expense was
$15,839
,
$15,325
and
$12,939
for
2018
,
2017
and
2016
, respectively. Minimum rental commitments under noncancellable leases in years
2019
through
2023
are
$11,931
,
$8,322
,
$5,888
,
$2,898
and
$2,064
, respectively, and
$7,659
thereafter. The rental expense and minimum rental commitments of leases with step rent provisions are recognized on a straight-line basis over the lease term.
Product Warranties
The Company provides product warranties in connection with the sale of certain products. From time to time, the Company is subject to customer claims with respect to product warranties. The Company accrues its estimated exposure for warranty claims at the time of sale based upon the length of the warranty period, historical experience and other related information known to the Company. Liabilities related to product warranties and extended warranties were not material as of
December 31, 2018
or
2017
.
Litigation
The Company is subject to litigation from time to time in the ordinary course of business and various other suits, proceedings and claims are pending involving the Company and its subsidiaries. The Company records a loss contingency liability when a loss is considered probable and the amount can be reasonably estimated. While it is not possible to determine the ultimate disposition of each of these proceedings and whether they will be resolved consistent with the Company's beliefs, the Company expects that the outcome of such proceedings, individually or in the aggregate, will not have a material adverse effect on financial condition or results of operations.
81
Report of Independent Registered Public Accounting Firm
To the
Board of Directors and Stockholders of Barnes Group Inc.:
Opinions on the Financial Statements and Internal Control over Financial Reporting
We have audited the accompanying consolidated balance sheets of Barnes Group Inc.
and its subsidiaries
(the “Company”) as of December 31, 2018
and 2017,
and the related consolidated statements of income, of comprehensive income, of changes in stockholders’ equity and of cash flows
for each of the three years in the period ended December 31, 2018, including the related notes and schedule of valuation and qualifying accounts for each of the three years in the period ended December 31, 2018 appearing under Item 15(a)(2)
(collectively referred to as the “consolidated financial statements”).
We also have audited the Company's internal control over financial reporting as of December 31, 2018, based on criteria established in
Internal Control - Integrated Framework
(2013)
issued by the Committee of Sponsoring Organizations of the Treadway Commission (COSO).
In our opinion, the consolidated
financial statements referred to above present fairly, in all material respects, the financial position of the Company as of December 31, 2018
and 2017
,
and the results of its
operations and its
cash flows for each of the three years in the period ended December 31, 2018
in conformity with accounting principles generally accepted in the United States of America. Also in our opinion, the Company maintained, in all material respects, effective internal control over financial reporting as of December 31, 2018, based on criteria established in
Internal Control - Integrated Framework
(2013)
issued by the COSO.
Change in Accounting Principle
As discussed in Note 3 to the consolidated financial statements, the Company changed the manner in which it recognizes revenue.
Basis for Opinions
The Company's management is responsible for these consolidated financial statements, for maintaining effective internal control over financial reporting, and for its assessment of the effectiveness of internal control over financial reporting, included in the accompanying
Management's Report on Internal Control over Financial Reporting. Our responsibility is to express opinions on the Company’s consolidated
financial statements and on the Company's internal control over financial reporting based on our audits. We are a public accounting firm registered with the Public Company Accounting Oversight Board (United States) (PCAOB) and are required to be independent with respect to the Company in accordance with the U.S. federal securities laws and the applicable rules and regulations of the Securities and Exchange Commission and the PCAOB.
We conducted our audits in accordance with the standards of the PCAOB. Those standards require that we plan and perform the audits to obtain reasonable assurance about whether the consolidated
financial statements are free of material misstatement, whether due to error or fraud, and whether effective internal control over financial reporting was maintained in all material respects.
Our audits of the consolidated
financial statements included performing procedures to assess the risks of material misstatement of the consolidated
financial statements, whether due to error or fraud, and performing procedures that respond to those risks. Such procedures included examining, on a test basis, evidence regarding the amounts and disclosures in the consolidated
financial statements. Our audits also included evaluating the accounting principles used and significant estimates made by management, as well as evaluating the overall presentation of the consolidated
financial statements. Our audit of internal control over financial reporting included obtaining an understanding of internal control over financial reporting, assessing the risk that a material weakness exists, and testing and evaluating the design and operating effectiveness of internal control based on the assessed risk. Our audits also included performing such other procedures as we considered necessary in the circumstances. We believe that our audits provide a reasonable basis for our opinions.
As described in Management’s Report on Internal Control over Financial Reporting, management has excluded Gimatic from its assessment of internal control over financial reporting as of December 31, 2018 because it was acquired by the Company in a purchase business combination during 2018. We have also excluded Gimatic from our audit of internal control over financial reporting. Gimatic is a wholly-owned subsidiary whose total assets and total net sales excluded from
82
management’s assessment and our audit of internal control over financial reporting represent 2% and 1%, respectively, of the related consolidated financial statement amounts as of and for the year ended December 31, 2018.
Definition and Limitations of Internal Control over Financial Reporting
A company’s internal control over financial reporting is a process designed to provide reasonable assurance regarding the reliability of financial reporting and the preparation of financial statements for external purposes in accordance with generally accepted accounting principles. A company’s internal control over financial reporting includes those policies and procedures that (i) pertain to the maintenance of records that, in reasonable detail, accurately and fairly reflect the transactions and dispositions of the assets of the company; (ii) provide reasonable assurance that transactions are recorded as necessary to permit preparation of financial statements in accordance with generally accepted accounting principles, and that receipts and expenditures of the company are being made only in accordance with authorizations of management and directors of the company; and (iii) provide reasonable assurance regarding prevention or timely detection of unauthorized acquisition, use, or disposition of the company’s assets that could have a material effect on the financial statements.
Because of its inherent limitations, internal control over financial reporting may not prevent or detect misstatements. Also, projections of any evaluation of effectiveness to future periods are subject to the risk that controls may become inadequate because of changes in conditions, or that the degree of compliance with the policies or procedures may deteriorate.
|
/s/ P
RICEWATERHOUSE
C
OOPERS
LLP
Hartford, Connecticut
|
|
February 25, 2019
|
We have served as the Company’s auditor since 1994.
83
QUARTERLY DATA (UNAUDITED)
(Dollars in millions, except per share data)
|
First
Quarter
(3)
|
Second
Quarter
(3)
|
Third
Quarter
(3)
|
Fourth
Quarter
(2)(3)
|
Full
Year
(2)(3)
|
||||||||||||||||
|
2018
|
||||||||||||||||||||
|
Net sales
|
$
|
366.7
|
|
$
|
375.3
|
|
$
|
369.8
|
|
$
|
384.1
|
|
$
|
1,495.9
|
|
|||||
|
Gross profit
(1)
|
129.5
|
|
|
137.7
|
|
|
132.9
|
|
|
132.2
|
|
532.4
|
|
|||||||
|
Operating income
|
56.6
|
|
|
63.9
|
|
|
59.1
|
|
|
52.2
|
|
231.8
|
|
|||||||
|
Net income
|
38.8
|
|
|
49.4
|
|
|
39.1
|
|
|
38.8
|
|
166.2
|
|
|||||||
|
Per common share:
|
|
|
|
|
|
|
|
|||||||||||||
|
Basic
|
0.73
|
|
|
0.94
|
|
|
0.76
|
|
|
0.75
|
|
3.18
|
|
|||||||
|
Diluted
|
0.72
|
|
|
0.93
|
|
|
0.75
|
|
|
0.75
|
|
3.15
|
|
|||||||
|
Dividends
|
0.14
|
|
|
0.16
|
|
|
0.16
|
|
|
0.16
|
|
0.62
|
|
|||||||
|
Market prices (high - low)
|
$69.41-57.93
|
|
|
$63.79-52.42
|
|
|
$72.70-58.09
|
|
|
$71.84-49.06
|
|
$72.70-$49.06
|
|
|||||||
|
2017
|
||||||||||||||||||||
|
Net sales
|
$
|
341.8
|
|
$
|
364.5
|
|
$
|
357.2
|
|
$
|
373.0
|
|
$
|
1,436.5
|
|
|||||
|
Gross profit
(1)
|
122.3
|
|
122.0
|
|
121.8
|
|
126.8
|
|
492.7
|
|
||||||||||
|
Operating income
|
56.3
|
|
50.8
|
|
48.9
|
|
50.5
|
|
206.5
|
|
||||||||||
|
Net income
|
38.3
|
|
45.0
|
|
35.3
|
|
(59.2
|
)
|
59.4
|
|
||||||||||
|
Per common share:
|
||||||||||||||||||||
|
Basic
|
0.71
|
|
0.83
|
|
0.65
|
|
(1.10
|
)
|
1.10
|
|
||||||||||
|
Diluted
|
0.70
|
|
0.82
|
|
0.65
|
|
(1.10
|
)
|
1.09
|
|
||||||||||
|
Dividends
|
0.13
|
|
0.14
|
|
0.14
|
|
0.14
|
|
0.55
|
|
||||||||||
|
Market prices (high - low)
|
$51.97-45.47
|
|
$60.74-49.31
|
|
$70.84-57.70
|
|
$72.87-61.06
|
|
$72.87-45.47
|
|
||||||||||
________________________
|
(1)
|
Sales less cost of sales.
|
|
(2)
|
During the fourth quarter of 2017, the Company recorded the effects of the U.S. Tax Reform, resulting in tax expense of $96.7 million, or $1.79 per basic share ($1.79 per diluted share). During the full-year 2017 period, the effects of the U.S. Tax Reform were $1.79 and $1.77 per basic and per diluted share, respectively. See Note 14 of the Consolidated Financial Statements.
|
|
(3)
|
During 2018, the Company adopted amended guidance relating to the presentation of pension and other postretirement benefit costs, requiring that other components of expense (other than service expense) be reported separately outside of operating income. The amended guidance was applied retrospectively for the presentation of the service cost component and the other components of net periodic benefit cost in the Consolidated Statements of Income during the 2017 Quarters. See Note 1 of the Consolidated Financial Statements.
|
Item 9. Changes in and Disagreements with Accountants on Accounting and Financial Disclosure
None.
Item 9A. Controls and Procedures
Disclosure Controls and Procedures
Management, including the Company’s President and Chief Executive Officer and Chief Financial Officer, has evaluated the effectiveness of the design and operation of the Company’s disclosure controls and procedures as of the end of the period covered by this report. We completed the acquisition of Gimatic on October 31, 2018. Gimatic total assets and total net sales excluded from the scope of our report represent approximately 2% and 1%, respectively, of the related consolidated financial statement amounts as of and for the year ended December 31, 2018. In accordance with applicable SEC guidance, the scope of our assessment of the effectiveness of disclosure controls and procedures do not include Gimatic as it was not practical to do so given the date of acquisition. Based upon, and as of the date of, that evaluation, the President and Chief Executive Officer and Chief Financial Officer concluded that the disclosure controls and procedures were effective, in all material respects, and designed to provide reasonable assurance that the information required to be disclosed in the reports the Company files and submits under the Securities Exchange Act of 1934 (the “Exchange Act”), as amended, is (i) recorded, processed, summarized and reported as and when required and (ii) is accumulated and communicated to the Company’s management,
84
including our President and Chief Executive Officer and Chief Financial Officer, as appropriate to allow timely decisions regarding required disclosure.
Management’s Report on Internal Control Over Financial Reporting
Management is responsible for establishing and maintaining adequate internal control over financial reporting, as such term is defined in Exchange Act Rule 13a-15(f). We completed the acquisition of Gimatic on October 31, 2018. Gimatic total assets and total net sales excluded from the scope of our report represent approximately 2% and 1%, respectively, of the related consolidated financial statement amounts as of and for the year ended December 31, 2018. In accordance with applicable SEC guidance, the scope of our assessment of the effectiveness of disclosure controls and procedures do not include Gimatic as it was not practical to do so given the date of acquisition. Under the supervision and with the participation of management, including the principal executive officer and principal financial officer, the Company conducted an assessment of the effectiveness of its internal control over financial reporting based on the framework in the “Internal Control - Integrated Framework 2013” issued by the Committee of Sponsoring Organizations of the Treadway Commission. Based on the assessment under this framework, management concluded that the Company’s internal control over financial reporting was effective as of
December 31, 2018
.
PricewaterhouseCoopers LLP, the independent registered public accounting firm that audited the financial statements included in this Annual Report, has issued an attestation report on the Company’s internal control over financial reporting as of
December 31, 2018
, which appears on page 82 of this Annual Report on Form 10-K.
Changes in Internal Control Over Financial Reporting
There has been no change to our internal control over financial reporting during the Company’s fourth fiscal quarter that has materially affected, or is reasonably likely to materially affect, our internal control over financial reporting.
Item 9B. Other Information
None.
85
PART III
Item 10. Directors, Executive Officers and Corporate Governance
Information with respect to our directors and corporate governance may be found in the “Governance” and "Stock Ownership" sections of our definitive proxy statement to be delivered to stockholders in connection with the Annual Meeting of Stockholders to be held on May 3, 2019 (the “Proxy Statement”). Such information is incorporated herein by reference.
EXECUTIVE OFFICERS
The Company’s executive officers as of the date of this Annual Report are as follows:
|
Executive Officer
|
Position
|
Age as of
December 31, 2018
|
|
Patrick J. Dempsey
|
President and Chief Executive Officer
|
54
|
|
Michael A. Beck
|
Senior Vice President, Barnes Group Inc., and President, Barnes Aerospace
|
58
|
|
Dawn N. Edwards
|
Senior Vice President, Human Resources
|
50
|
|
Peter A. Gutermann
|
Senior Vice President, General Counsel and Secretary
|
59
|
|
Patrick Hurley
|
Senior Vice President & Chief Technology Officer
|
46
|
|
Christopher J. Stephens, Jr.
|
Senior Vice President, Finance and Chief Financial Officer & Interim President, Barnes Industrial
|
54
|
Each officer holds office until his or her successor is appointed and qualified or otherwise as provided in the Company’s Amended and Restated By-Laws. No family relationships exist among the executive officers of the Company. Except for Messrs. Beck, Gutermann and Hurley, each of the Company’s executive officers has been employed by the Company or its subsidiaries in an executive or managerial capacity for at least the past five years.
Mr. Dempsey was appointed President and Chief Executive Officer effective March 1, 2013. From February 2012 until such appointment, he served as Senior Vice President and Chief Operating Officer. From October 2008 until February 2012, he served as Vice President, Barnes Group Inc. and President, Logistics and Manufacturing Services. Prior to that, he held a series of roles of increasing responsibility since joining the Company in October 2000. In October 2007, he was appointed Vice President, Barnes Group Inc. and President, Barnes Distribution. In November 2004, he was promoted to Vice President, Barnes Group Inc. and President, Barnes Aerospace. Mr. Dempsey is currently a director of Nucor Corporation, having been appointed as of December 1, 2016.
Mr. Beck was appointed Senior Vice President, Barnes Group Inc. and President, Barnes Aerospace effective March 1, 2016. Mr. Beck came to Barnes Group with over 27 years of global aerospace experience. Prior to joining Barnes Group, Mr. Beck was the Senior Vice President & General Manager, Fuel and Motion Control, a $1B division of Eaton’s Aerospace Group. Prior to this, he was the Chief Executive Officer of GKN’s Aerospace Engine Systems business, where he led the due diligence, business synergies and integration of a significant acquisition. Prior to that, he was the President and Chief Executive Officer of GKN’s global Propulsion Systems and Special Products business. Earlier in his career, Mr. Beck was the Chief Operating Officer and Site Executive for GKN’s St. Louis, Missouri business.
Ms. Edwards was appointed Senior Vice President, Human Resources effective August 2009. From December 2008 until August 2009, she served as Vice President of Human Resources - Global Operations. From September 1998 until December 2008, Ms. Edwards served as Group Director, Human Resources for Barnes Aerospace, Associated Spring and Barnes Industrial. Ms. Edwards joined the Company in September 1998.
Mr. Gutermann was appointed Senior Vice President, General Counsel and Secretary effective December 11, 2017. Before joining the Company, Mr. Gutermann served as Corporate Vice President, Chief Ethics & Compliance Officer for United Technologies Corporation. Prior to that, Mr. Gutermann held a variety of positions with increasing responsibility
within United Technologies Corporation including Vice President & General Counsel, UTC Propulsion/Aerospace Systems; Vice President & General Counsel, Pratt & Whitney; Associate General Counsel, UTC Corporate; Deputy General Counsel, Otis Elevator Company; and Executive Assistant to the UTC Chairman and Chief Executive Officer. Mr. Gutermann began his career as a Litigation Associate with the law firm of Robinson & Cole.
Mr. Hurley was appointed Senior Vice President & Chief Technology Officer effective February 7, 2019. From 2014 until joining the Company, Mr. Hurley was General Manager, Asia Pacific & Chief R&D Officer with A123 Systems, LLC. From 2011 to 2014, he held a series of roles with increasing responsibility with Johnson Controls, including Director, Global Core Components; Director, R&D; and Senior Manager, Strategic Technology Planning. From 2006 to 2011, Mr. Hurley held roles with Air Products, including the positions of Senior Principal Research Scientist / Technology Lead and Senior Research Scientist.
Mr. Stephens was appointed Senior Vice President, Finance and Chief Financial Officer, Barnes Group Inc. effective January 2009. Prior to joining the Company, Mr. Stephens held key leadership roles at Honeywell International, serving as President of the Consumer Products Group from 2007 to 2008, and Vice President and Chief Financial Officer of Honeywell Transportation Systems from 2003 to 2007. Prior to Honeywell, he held roles with increasing responsibility at The Boeing Company, serving as Vice President and General Manager, Boeing Electron Dynamic Devices; Vice President, Business Operations, Boeing Space and Communications; and Vice President and Chief Financial Officer, Boeing Satellite Systems.
Items 11-14.
The information called for by Items 11-14 is incorporated by reference to the "Governance," "Stock Ownership," "Executive Compensation," "Director Compensation in 2018," "Securities Authorized for Issuance Under Equity Compensation Plans," "Related Person Transactions," and "Principal Accountant Fees and Services" sections in our Proxy Statement.
PART IV
Item 15. Exhibits, Financial Statement Schedule
|
(a)(1)
|
|
The following Financial Statements and Supplementary Data of the Company are set forth herein under Item 8 of this Annual Report:
|
|
|
||
|
|
||
|
|
||
|
|
||
|
|
||
|
|
||
|
(a)(2)
|
|
See Financial Statement Schedule under Item 15(c).
|
|
(a)(3)
|
|
See Item 15(b) below.
|
|
(b)
|
|
The Exhibits required by Item 601 of Regulation S-K are filed as Exhibits to this Annual Report and indexed at pages 94 through 99 of this Annual Report, which index is incorporated herein by reference.
|
|
(c)
|
|
Financial Statement Schedule.
|
86
Item 16. Form 10-K Summary
None.
87
Schedule II—Valuation and Qualifying Accounts
Years Ended
December 31, 2018
,
2017
and
2016
(In thousands)
|
Allowances for Doubtful Accounts:
|
|||
|
Balance January 1, 2016
|
$
|
4,085
|
|
|
Provision charged to income
|
863
|
|
|
|
Doubtful accounts written off
|
(910
|
)
|
|
|
Other adjustments
(1)
|
(46
|
)
|
|
|
Balance December 31, 2016
|
3,992
|
|
|
|
Provision charged to income
|
1,512
|
|
|
|
Doubtful accounts written off
|
(297
|
)
|
|
|
Other adjustments
(1)
|
(64
|
)
|
|
|
Balance December 31, 2017
|
5,143
|
|
|
|
Provision charged to income
|
363
|
|
|
|
Doubtful accounts written off
|
(416
|
)
|
|
|
Other adjustments
(1)
|
(80
|
)
|
|
|
Balance December 31, 2018
|
$
|
5,010
|
|
________________
|
(1)
|
These amounts are comprised primarily of foreign currency translation and other reclassifications.
|
88
Schedule II—Valuation and Qualifying Accounts
Years Ended
December 31, 2018
,
2017
and
2016
(In thousands)
|
Valuation Allowance on Deferred Tax Assets:
|
|||
|
Balance January 1, 2016
|
$
|
14,401
|
|
|
Additions charged to income tax expense
|
759
|
|
|
|
Reductions charged to other comprehensive income
|
(17
|
)
|
|
|
Reductions credited to income tax expense
(1)
|
(5,638
|
)
|
|
|
Changes due to foreign currency translation
|
(133
|
)
|
|
|
Acquisitions
(2)
|
5,585
|
|
|
|
Balance December 31, 2016
|
14,957
|
|
|
|
Additions charged to income tax expense
|
1,161
|
|
|
|
Reductions charged to other comprehensive income
|
(123
|
)
|
|
|
Reductions credited to income tax expense
(3)
|
(6,773
|
)
|
|
|
Changes due to foreign currency translation
|
1,001
|
|
|
|
Balance December 31, 2017
|
10,223
|
|
|
|
Additions charged to income tax expense
|
546
|
|
|
|
Reductions charged to other comprehensive income
|
(15
|
)
|
|
|
Reductions credited to income tax expense
(4)
|
(6,064
|
)
|
|
|
Changes due to foreign currency translation
|
(324
|
)
|
|
|
Balance December 31, 2018
|
$
|
4,366
|
|
________________
|
(1)
|
The reductions in 2016 relate primarily to net operating losses that were fully valued. These net operating losses have subsequently expired during 2016 (lapse of applicable carry forward periods) and the corresponding valuation allowance was reduced accordingly.
|
|
(2)
|
The increase in 2016 reflects the valuation allowance recorded at the FOBOHA business, which was acquired in the third quarter of 2016.
|
|
(3)
|
The reductions in 2017 relate to the release of valuation allowances associated with net operating losses as a result of the Swiss legal entity reduction.
|
|
(4)
|
The reductions in 2018 relate primarily to the release of valuation allowances associated with net operating losses in certain foreign subsidiaries.
|
89
SIGNATURES
Pursuant to the requirements of Section 13 or 15(d) of the Securities Exchange Act of 1934, the Company has duly caused this report to be signed on its behalf by the undersigned, thereunto duly authorized.
|
Date:
|
February 25, 2019
|
||||
|
BARNES GROUP INC.
|
|||||
|
By
|
|
/S/ PATRICK J. DEMPSEY
|
|||
|
|
Patrick J. Dempsey
|
||||
|
|
President and Chief Executive Officer
|
||||
Pursuant to the requirements of the Securities Exchange Act of 1934, this report has been signed below as of the above date by the following persons on behalf of the Company in the capacities indicated.
90
|
/S/ PATRICK J. DEMPSEY
|
|
Patrick J. Dempsey
|
|
President and Chief Executive Officer
|
|
(Principal Executive Officer), and Director
|
|
/S/ CHRISTOPHER J. STEPHENS, JR.
|
|
Christopher J. Stephens, Jr.
|
|
Senior Vice President, Finance
|
|
Chief Financial Officer
|
|
(Principal Financial Officer)
|
|
/S/ MARIAN ACKER
|
|
Marian Acker
|
|
Vice President, Controller
|
|
(Principal Accounting Officer)
|
|
/S/ THOMAS O. BARNES
|
|
Thomas O. Barnes
|
|
Director
|
|
/S/ ELIJAH K. BARNES
|
|
Elijah K. Barnes
|
|
Director
|
|
/S/ GARY G. BENANAV
|
|
Gary G. Benanav
|
|
Director
|
|
/S/ RICHARD J/ HIPPLE
|
|
Richard J. Hipple
|
|
Director
|
|
/S/ THOMAS J. HOOK
|
|
Thomas J. Hook
|
|
Director
|
|
/S/ MYLLE H. MANGUM
|
|
Mylle H. Mangum
|
|
Director
|
91
|
/S/ HANS-PETER MÄNNER
|
|
Hans-Peter Männer
|
|
Director
|
|
/S/ HASSELL H. MCCLELLAN
|
|
Hassell H. McClellan
|
|
Director
|
|
/S/ WILLIAM J. MORGAN
|
|
William J. Morgan
|
|
Director
|
|
/S/ ANTHONY V. NICOLOSI
|
|
Anthony V. Nicolosi
|
|
Director
|
|
/S/ JOANNA L. SOHOVICH
|
|
Joanna L. Sohovich
|
|
Director
|
92
EXHIBIT INDEX
Barnes Group Inc.
Annual Report on Form 10-K
for the Year ended
December 31, 2018
|
Exhibit No.
|
Description
|
Reference
|
|
2.1
*
|
Asset Purchase Agreement dated February 22, 2013 between the Company and MSC Industrial Direct Co., Inc.
|
|
|
2.2
*
|
Share Purchase and Assignment Agreement dated September 30, 2013 among the Company, two of its subsidiaries, Otto Männer Holding AG (the "Seller"), and the three shareholders of Seller.
|
|
|
2.3
*
|
Sale and Purchase Agreement dated September 19, 2018.
|
|
|
3.1
|
Restated Certificate of Incorporation; Certificate of Designation, Preferences and Rights of Series A Junior Participating Preferred Stock; Certificate of Change of Location of registered office and of registered agent, dated December 13, 2002; Certificate of Merger of domestic limited liability company into a domestic company, dated May 19, 2004; Certificate of Amendment of Restated Certificate of Incorporation, dated April 20, 2006; and Certificate of Amendment of Restated Certificate of Incorporation, dated as of May 3, 2013.
|
|
|
3.2
|
Amended and Restated By-Laws as of July 28, 2016.
|
|
|
10.1
|
(i) Fifth Amended and Restated Senior Unsecured Revolving Credit Agreement, dated September 27, 2011.
|
|
|
(ii) Amendment No. 2 and Joinder to Credit Agreement dated as of September 27, 2013 (amending Fifth Amended and Restated Senior Unsecured Revolving Credit Agreement, dated as of September 27, 2011).
|
||
|
(iii) Amendment No. 3 to Credit Agreement dated as of October 15, 2014.
|
||
|
(iv) Amendment No. 4 to Credit Agreement dated as of February 2, 2017.
|
|
|
|
(v) Amendment No. 5 to Credit Agreement dated as of October 19, 2018.
|
||
|
10.2
|
Note Purchase Agreement, dated as of October 15, 2014, among the Company and New York Life Insurance Company, New York Life Insurance and Annuity Corporation and New York Life Insurance and Annuity Corporation Institutionally Owned Life Insurance Separate Account (BOLI 30C).
|
|
93
|
Exhibit No.
|
Description
|
Reference
|
|
10.3
**
|
(i) Barnes Group Inc. Management Incentive Compensation Plan, amended December 27, 2017.
|
|
|
Filed with this report.
|
||
|
10.4
**
|
(i) Offer Letter between the Company and Patrick Dempsey, dated February 22, 2013.
|
|
|
(ii) Amendment to Offer Letter to Patrick Dempsey, dated January 6, 2015.
|
||
|
(iii) Employee Non-Disclosure, Non-Competition, Non-Solicitation and Non-Disparagement Agreement between the Company and Patrick J. Dempsey, dated February 27, 2013.
|
||
|
10.5
**
|
(i) Amendment to Offer Letter to Christopher J. Stephens, Jr., dated June 7, 2013.
|
|
|
(ii) Amendment to Amended Offer Letter to Christopher J. Stephens, Jr., dated February 12, 2014.
|
||
|
10.6
**
|
Offer Letter to Scott A. Mayo, dated January 28, 2014.
|
|
|
10.7
**
|
(i) Barnes Group Inc. Retirement Benefit Equalization Plan, as amended and restated effective January 1, 2013.
|
|
|
(ii) First Amendment to the Barnes Group Inc. Retirement Benefit Equalization Plan dated December 12, 2014.
|
||
|
10.8
**
|
(i) Barnes Group Inc. Supplemental Senior Officer Retirement Plan, as amended and restated effective January 1, 2009.
|
|
|
(ii) Amendment to the Barnes Group Inc. Supplemental Senior Officer Retirement Plan dated December 30, 2009.
|
|
|
|
(iii) Second Amendment to the Barnes Group Inc. Supplemental Senior Officer Retirement Plan dated December 12, 2014.
|
||
|
10.9
**
|
(i) Amended and Restated Supplemental Executive Retirement Plan effective April 1, 2012.
|
|
|
(ii) Amendment 2013-1 to the Barnes Group Inc. Supplemental Executive Retirement Plan dated July 23, 2013.
|
||
94
|
Exhibit No.
|
Description
|
Reference
|
|
(iii) Amendment 2014-1 to the Barnes Group Inc. Supplemental Executive Retirement Plan dated December 12, 2014.
|
||
|
10.10
**
|
Barnes Group Inc. Senior Executive Enhanced Life Insurance Program, as amended and restated effective April 1, 2011.
|
|
|
10.11
**
|
Barnes Group Inc. Enhanced Life Insurance Program, as amended and restated effective April 1, 2011.
|
|
|
10.12
**
|
Barnes Group Inc. Executive Group Term Life Insurance Program effective April 1, 2011.
|
|
|
10.13
**
|
Form of Barnes Group Inc. Executive Officer Severance Agreement, as amended March 31, 2010.
|
|
|
10.14
**
|
Form of Barnes Group Inc. Executive Officer Severance Agreement, effective February 19, 2014.
|
|
|
10.15
**
|
Barnes Group Inc. Executive Separation Pay Plan, as amended and restated effective January 1, 2012.
|
|
|
10.16
**
|
(i) Trust Agreement between the Company and Fidelity Management Trust Company (Barnes Group 2009 Deferred Compensation Plan) dated September 1, 2009.
|
|
|
(ii) Amended and Restated Barnes Group 2009 Deferred Compensation Plan effective as of April 1, 2012.
|
|
|
|
(iii) First Amendment to the Barnes Group 2009 Deferred Compensation Plan dated December 12, 2014.
|
||
|
10.17
**
|
Barnes Group Inc. Non-Employee Director Deferred Stock Plan, as amended and restated December 31, 2008.
|
|
|
10.18
**
|
Barnes Group Inc. Directors’ Deferred Compensation Plan, as amended and restated December 31, 2008.
|
|
|
10.19
**
|
Barnes Group Inc. Trust Agreement for Specified Plans.
|
|
|
10.20
**
|
Form of Incentive Compensation Reimbursement Agreement between the Company and certain Officers.
|
|
|
10.21
**
|
Form of Indemnification Agreement between the Company and its Officers and Directors.
|
|
95
|
Exhibit No.
|
Description
|
Reference
|
|
10.22
**
|
(i) Barnes Group Inc. Stock and Incentive Award Plan, as amended December 31, 2008.
|
|
|
(ii) Barnes Group Inc. Stock and Incentive Award Plan, as amended March 15, 2010.
|
|
|
|
(iii) Exercise of Authority Relating to the Stock and Incentive Award Plan, dated March 3, 2009.
|
|
|
|
(iv) Amendment 2010-1 approved on December 9, 2010 to the Barnes Group Inc. Stock and Incentive Award Plan as amended March 15, 2010.
|
|
|
|
10.23
**
|
2014 Barnes Group Inc. Stock and Incentive Award Plan.
|
|
|
10.24
**
|
Form of Barnes Group Inc. Stock and Incentive Award Plan Restricted Stock Unit Summary of Grant and Restricted Stock Unit Agreement for US Directors dated February 9, 2016 (for non-management directors).
|
|
|
10.25
**
|
Filed with this report.
|
|
|
10.26
**
|
Form of Non-Qualified Stock Option Agreement for Employees in Grade 21 and up, as amended effective December 31, 2008.
|
|
|
10.27
**
|
Form of Barnes Group Inc. Stock and Incentive Award Plan Stock Option Summary of Grant and Stock Option Agreement for Employees in Grade 21 and up dated as of February 8, 2011.
|
|
|
10.28
**
|
Form of Barnes Group Inc. Stock and Incentive Award Plan Stock Option Summary of Grant and Stock Option Agreement for Employees in Grade 21 and up dated May 9, 2014.
|
|
|
10.29
**
|
Form of Barnes Group Inc. Stock and Incentive Award Plan Stock Option Summary of Grant and Stock Option Agreement for Employees in Grade 21 and up dated February 9, 2016.
|
|
|
10.30
**
|
Form of Barnes Group Inc. Stock and Incentive Award Plan Restricted Stock Unit Summary of Grant for Employees and Restricted Stock Unit Agreement dated February 8, 2012.
|
|
|
10.31
**
|
Form of Barnes Group Inc. Stock and Incentive Award Plan Restricted Stock Unit Summary of Grant for Employees and Restricted Stock Unit Agreement dated January 10, 2016.
|
|
|
10.32
**
|
Filed with this report.
|
|
96
|
Exhibit No.
|
Description
|
Reference
|
|
10.33
**
|
Form of Barnes Group Inc. Stock and Incentive Award Plan Performance Share Award Summary of Grant and Performance Share Award Agreement for Officers and Other Individuals as Designated by the Compensation and Management Development Committee dated as of February 9, 2016.
|
|
|
10.34
**
|
Form of Barnes Group Inc. Stock and Incentive Award Plan Performance Share Award Summary of Grant and Performance Share Award Agreement for Officers and Other Individuals as Designated by the Compensation and Management Development Committee dated as of February 8, 2018.
|
|
|
10.35
**
|
Filed with this report.
|
|
|
10.36
**
|
Performance-Linked Bonus Plan for Selected Executive Officers approved by Shareholders on May 6, 2016.
|
|
|
10.37
**
|
Offer Letter to Michael A. Beck, dated January 28, 2016.
|
|
|
10.38
**
|
Offer Letter to Peter Gutermann, dated November 29, 2017.
|
|
|
10.39
**
|
Filed with this report.
|
|
|
21
|
Filed with this report.
|
|
|
23
|
Filed with this report.
|
|
|
31.1
|
Filed with this report.
|
|
|
31.2
|
Filed with this report.
|
|
|
32
|
Furnished with this report.
|
|
|
101.INS
|
XBRL Instance Document.
|
Filed with this report.
|
|
101.SCH
|
XBRL Taxonomy Extension Schema Document.
|
Filed with this report.
|
|
101.CAL
|
XBRL Taxonomy Extension Calculation Linkbase Document.
|
Filed with this report.
|
|
101.DEF
|
XBRL Taxonomy Extension Definition Linkbase Document.
|
Filed with this report.
|
|
101.LAB
|
XBRL Taxonomy Extension Label Linkbase Document.
|
Filed with this report.
|
|
101.PRE
|
XBRL Taxonomy Extension Presentation Linkbase Document.
|
Filed with this report.
|
_________________________
*
The Company hereby agrees to provide the Commission upon request copies of any omitted exhibits or schedules to this exhibit required by Item 601(b)(2) of Regulation S-K.
**
Management contract or compensatory plan or arrangement.
97
The Company agrees to furnish to the Commission, upon request, a copy of each instrument with respect to which there are outstanding issues of unregistered long-term debt of the Company and its subsidiaries, the authorized principal amount of which does not exceed 10% of the total assets of the Company and its subsidiaries on a consolidated basis.
98
TABLE OF CONTENTS
Part IItem 1. BusinessItem 1A. Risk FactorsItem 1B. Unresolved Staff CommentsItem 2. PropertiesItem 3. Legal ProceedingsItem 4. Mine Safety DisclosuresPart IIItem 5. Market For Registrant S Common Equity, Related Stockholder Matters and Issuer Purchases Of Equity SecuritiesItem 6. Selected Financial DataItem 7. Management S Discussion and Analysis Of Financial Condition and Results Of OperationsItem 7A. Quantitative and Qualitative Disclosures About Market RiskItem 8. Financial Statements and Supplementary DataItem 9. Changes in and Disagreements with Accountants on Accounting and Financial DisclosureItem 9A. Controls and ProceduresItem 9B. Other InformationPart IIIItem 10. Directors, Executive Officers and Corporate GovernancePart IVItem 15. Exhibits, Financial Statement ScheduleItem 16. Form 10-k Summary