BANK OF AMERICA CORP /DE/
10-Ks and 10-Qs
|
|
|
|
|
|
|
|
|
|
|
|
|
|
|
|
|
|
|
|
|
|
|
|
|
|
|
|
|
|
|
|
|
|
|
|
|
|
|
|
|
|
|
|
|
|
|
|
|
|
|
|
|
|
|
|
|
|
|
UNITED STATES
SECURITIES AND EXCHANGE COMMISSION
Washington, D.C. 20549
FORM
10-Q
(Mark One)
EXCHANGE ACT OF 1934
For the Quarterly Period Ended
September 30, 2020
or
EXCHANGE ACT OF 1934
For the transition period from to
Commission file number:
Exact name of registrant as specified in its charter:
State or other jurisdiction of incorporation or organization:
IRS Employer Identification No.:
Address of principal executive offices:
Bank of America Corporate Center
Registrant’s telephone number, including area code:
(
704
)
386-5681
Former name, former address and former fiscal year, if changed since last report:
Securities registered pursuant to Section 12(b) of the Act:
| Title of each class | Trading Symbol(s) | Name of each exchange on which registered | ||||||
|
|
|
|
||||||
|
|
|
|
||||||
| of Floating Rate Non-Cumulative Preferred Stock, Series E | ||||||||
|
|
|
|
||||||
| of 6.200% Non-Cumulative Preferred Stock, Series CC | ||||||||
|
|
|
|
||||||
| of 6.000% Non-Cumulative Preferred Stock, Series EE | ||||||||
|
|
|
|
||||||
| of 6.000% Non-Cumulative Preferred Stock, Series GG | ||||||||
|
|
|
|
||||||
| of 5.875% Non-Cumulative Preferred Stock, Series HH | ||||||||
|
|
|
|
||||||
|
|
|
|
||||||
| of Bank of America Corporation Floating Rate | ||||||||
| Non-Cumulative Preferred Stock, Series 1 | ||||||||
|
1
Bank of America
|
||||||||
| Title of each class | Trading Symbol(s) | Name of each exchange on which registered | ||||||
|
|
|
|
||||||
| of Bank of America Corporation Floating Rate | ||||||||
| Non-Cumulative Preferred Stock, Series 2 | ||||||||
|
|
|
|
||||||
| of Bank of America Corporation Floating Rate | ||||||||
| Non-Cumulative Preferred Stock, Series 4 | ||||||||
|
|
|
|
||||||
| of Bank of America Corporation Floating Rate | ||||||||
| Non-Cumulative Preferred Stock, Series 5 | ||||||||
|
|
|
|
||||||
| Trust XIII (and the guarantee related thereto) | ||||||||
|
|
|
|
||||||
| of BAC Capital Trust XIV (and the guarantee related thereto) | ||||||||
|
|
|
|
||||||
| Bank of America Corporation | ||||||||
|
|
|
|
||||||
| November 28, 2031 of BofA Finance LLC (and the guarantee | ||||||||
| of the Registrant with respect thereto) | ||||||||
|
|
|
|
||||||
| 5.375% Non-Cumulative Preferred Stock, Series KK | ||||||||
|
|
|
|
||||||
| of 5.000% Non-Cumulative Preferred Stock, Series LL | ||||||||
|
|
|
|
||||||
| 4.375% Non-Cumulative Preferred Stock, Series NN | ||||||||
Indicate by check mark whether the registrant (1) has filed all reports required to be filed by Section 13 or 15(d) of the Securities Exchange Act of 1934 during the preceding 12 months (or for such shorter period that the registrant was required to file such reports), and (2) has been subject to such filing requirements for the past 90 days.
Indicate by check mark whether the registrant has submitted electronically every Interactive Data File required to be submitted pursuant to Rule 405 of Regulation S-T (§ 232.405 of this chapter) during the preceding 12 months (or for such shorter period that the registrant was required to submit such files).
Indicate by check mark whether the registrant is a large accelerated filer, an accelerated filer, a non-accelerated filer, a smaller reporting company, or an emerging growth company. See the definitions of “large accelerated filer,” “accelerated filer,” “smaller reporting company,” and “emerging growth company” in Rule 12b-2 of the Exchange Act.
|
|
☑ | Accelerated filer | ☐ | Non-accelerated filer | ☐ | Smaller reporting company |
|
|||||||||||||||||||||||||
Emerging growth company
☐
If an emerging growth company, indicate by check mark if the registrant has elected not to use the extended transition period for complying with any new or revised financial accounting standards provided pursuant to Section 13(a) of the Exchange Act.
☐
Indicate by check mark whether the registrant is a shell company (as defined in Exchange Act Rule 12b-2).
Yes
☐
No
☑
On October 29, 2020, there were
8,650,789,694
shares of Bank of America Corporation Common Stock outstanding.
|
Bank of America
2
|
||||||||
Bank of America Corporation and Subsidiaries
September 30, 2020
Form 10-Q
INDEX
Part I. Financial Information
| Item 1. Financial Statements | Page | |||||||
|
Note 5 – Outstanding Loans and Leases
and Allowance for Credit Losses
|
||||||||
|
Item 2. Management’s Discussion and Analysis of Financial Condition and Results of Operations
|
||||||||
| 8 | ||||||||
|
1
Bank of America
|
||||||||
Part II. Other Information
Item 2. Management’s Discussion and Analysis of Financial Condition and Results of Operations
Bank of America Corporation (the “Corporation”) and its management may make certain statements that constitute “forward-looking statements” within the meaning of the Private Securities Litigation Reform Act of 1995. These statements can be identified by the fact that they do not relate strictly to historical or current facts. Forward-looking statements often use words such as “anticipates,” “targets,” “expects,” “hopes,” “estimates,” “intends,” “plans,” “goals,” “believes,” “continue” and other similar expressions or future or conditional verbs such as “will,” “may,” “might,” “should,” “would” and “could.” Forward-looking statements represent the Corporation’s current expectations, plans or forecasts of its future results, revenues, provision for credit losses, expenses, efficiency ratio, capital measures, strategy, and future business and economic conditions more generally, and other future matters. These statements are not guarantees of future results or performance and involve certain known and unknown risks, uncertainties and assumptions that are difficult to predict and are often beyond the Corporation’s control. Actual outcomes and results may differ materially from those expressed in, or implied by, any of these forward-looking statements.
You should not place undue reliance on any forward-looking statement and should consider the following uncertainties and risks, as well as the risks and uncertainties more fully discussed under Item 1A. Risk Factors of our 2019 Annual Report on Form 10-K and in any of the Corporation’s subsequent Securities and Exchange Commission filings: the Corporation’s potential judgments, claims, damages, penalties, fines and reputational damage resulting from pending or future litigation and regulatory and government actions, including as a result of our participation in and execution of government programs related to the Coronavirus Disease 2019 (COVID-19) pandemic; the possibility that the Corporation’s future liabilities may be in excess of its recorded liability and estimated range of possible loss for litigation, regulatory, and representations and warranties exposures; the possibility that the Corporation could face increased servicing, fraud, indemnity, contribution or other claims from one or more counterparties, including trustees, purchasers of loans, underwriters, issuers, monolines, private-label and other investors, or other parties involved in securitizations; the Corporation’s ability to resolve representations and warranties repurchase and related claims, including claims brought by investors or trustees seeking to avoid the statute of limitations for repurchase claims; the risks related to the discontinuation of the London Interbank Offered Rate and other reference rates, including increased expenses and litigation and the effectiveness of hedging strategies; uncertainties about the financial stability and growth rates of non-U.S. jurisdictions, the risk that those jurisdictions may face difficulties servicing their sovereign debt, and related stresses on financial markets, currencies and trade, and the Corporation’s exposures to such risks, including direct, indirect and operational; the impact of U.S. and global interest rates, inflation, currency exchange rates, economic conditions, trade policies and tensions, including tariffs, and potential geopolitical instability; the impact of the interest rate environment
on the Corporation’s business, financial condition and results of operations; the possibility that future credit losses may be higher than currently expected due to changes in economic assumptions, customer behavior, adverse developments with respect to U.S. or global economic conditions and other uncertainties; the Corporation’s ability to achieve its expense targets and expectations regarding revenue, net interest income, provision for credit losses, net charge-offs, effective tax rate, loan growth or other projections; adverse changes to the Corporation’s credit ratings from the major credit rating agencies; an inability to access capital markets or maintain deposits or borrowing costs; estimates of the fair value and other accounting values, subject to impairment assessments, of certain of the Corporation’s assets and liabilities; the estimated or actual impact of changes in accounting standards or assumptions in applying those standards; uncertainty regarding the content, timing and impact of regulatory capital and liquidity requirements; the impact of adverse changes to total loss-absorbing capacity requirements, stress capital buffer requirements and/or global systemically important bank surcharges; the potential impact of actions of the Board of Governors of the Federal Reserve System on the Corporation’s capital plans; the effect of regulations, other guidance or additional information on the impact from the Tax Cuts and Jobs Act; the impact of implementation and compliance with U.S. and international laws, regulations and regulatory interpretations, including, but not limited to, recovery and resolution planning requirements, Federal Deposit Insurance Corporation assessments, the Volcker Rule, fiduciary standards, derivatives regulations and the Coronavirus Aid, Relief, and Economic Security Act and any similar or related rules and regulations; a failure or disruption in or breach of the Corporation’s operational or security systems or infrastructure, or those of third parties, including as a result of cyber attacks or campaigns; the impact on the Corporation’s business, financial condition and results of operations from the United Kingdom's exit from the European Union; the impact of any future federal government shutdown and uncertainty regarding the federal government’s debt limit or changes to the U.S. presidential administration and Congress;
the emergence of widespread health emergencies or pandemics, including the magnitude and duration of the COVID-19 pandemic and its impact on the U.S. and/or global economy, financial market conditions and our business, results of operations and financial condition; the impact of natural disasters, military conflict, terrorism or other geopolitical events;
and other matters.
Forward-looking statements speak only as of the date they are made, and the Corporation undertakes no obligation to update any forward-looking statement to reflect the impact of circumstances or events that arise after the date the forward-looking statement was made.
Notes to the Consolidated Financial Statements referred to in Management’s Discussion and Analysis of Financial Condition and Results of Operations (MD&A) are incorporated by reference into the MD&A. Certain prior-period amounts have been reclassified to conform to current-period presentation.
|
Bank of America
2
|
||||||||
Throughout the MD&A, the Corporation uses certain acronyms and abbreviations which are defined in the Glossary.
Executive Summary
Business Overview
The Corporation is a Delaware corporation, a bank holding company (BHC) and a financial holding company. When used in this report, “the Corporation,” “we,” “us” and “our” may refer to Bank of America Corporation individually, Bank of America Corporation and its subsidiaries, or certain of Bank of America Corporation’s subsidiaries or affiliates. Our principal executive offices are located in Charlotte, North Carolina. Through our banking and various nonbank subsidiaries throughout the U.S. and in international markets, we provide a diversified range of banking and nonbank financial services and products through four business segments:
Consumer Banking
,
Global Wealth & Investment Management (GWIM)
,
Global Banking
and
Global Markets
, with the remaining operations recorded in
All Other
. We operate our banking activities primarily under the Bank of America, National Association (Bank of America, N.A. or BANA) charter. At September 30, 2020, the Corporation had $2.7 trillion in assets and a headcount of approximately 211,000 employees.
As of September 30, 2020, we served clients through operations across the U.S., its territories and approximately 35 countries. Our retail banking footprint covers all major markets in the U.S., and we serve approximately 66 million consumer and small business clients with approximately 4,300 retail financial centers, approximately 17,000 ATMs, and leading digital banking platforms (www.bankofamerica.com) with more than 39 million active users, including approximately 31 million active mobile users. We offer industry-leading support to approximately three million small business households. Our wealth management businesses, with client balances of $3.1 trillion, provide tailored solutions to meet client needs through a full set of investment management, brokerage, banking, trust and retirement products. We are a global leader in corporate and investment banking and trading across a broad range of asset classes serving corporations, governments, institutions and individuals around the world.
Recent Developments
Capital Management
In June 2020, the Board of Governors of the Federal Reserve System (Federal Reserve) notified BHCs of their 2020 Comprehensive Capital Analysis and Review (CCAR) supervisory stress test results, which included a preliminary stress capital buffer (SCB) that was finalized in August 2020. Based on our results, we are subject to a 2.5 percent SCB for the period beginning October 1, 2020 and ending on September 30, 2021.
Due to economic uncertainty resulting from the Coronavirus Disease 2019 (COVID-19) pandemic, the Federal Reserve required all large banks to suspend share repurchase programs in the third quarter of 2020, except for repurchases to offset shares awarded under equity-based compensation plans, and to limit dividends to existing rates that do not exceed the average of the last four quarters’ net income. In September 2020, the Federal Reserve announced that these measures would remain in place for the fourth quarter of 2020. Large banks will also be required to resubmit and update their capital plans in November
2020 based on the Federal Reserve’s updated supervisory stress test scenarios. The Federal Reserve announced that they will publish the results of the additional supervisory stress tests by December 31, 2020.
On October 21, 2020, the Board of Directors (the Board) declared a quarterly common stock dividend at the current rate of $0.18 per share. We intend to maintain the quarterly common stock dividend at this rate until further notice, subject to approval by the Board. For more information on our capital resources, see Capital Management on page 23.
COVID-19 Pandemic
As previously disclosed, in the first quarter of 2020, the World Health Organization declared the outbreak of COVID-19 a pandemic. In an attempt to contain the spread and impact of the COVID-19 pandemic, travel bans and restrictions, quarantines, shelter-in-place orders and limitations on business activity have been implemented. Additionally, there has been a decline in global economic activity, reduced U.S. and global economic output and a deterioration in macroeconomic conditions in the U.S. and globally. This has resulted in, among other things, high rates of unemployment and underemployment and caused volatility and disruptions in the global financial markets, including the energy and commodity markets. Although some restrictive measures have been eased in certain areas, businesses, market participants, our counterparties and clients, and the U.S. and global economies have been negatively impacted and are likely to be so for an extended period of time, as there remains significant uncertainty about the timing and strength of an economic recovery.
In response to the pandemic, the Corporation has implemented protocols and processes to execute its business continuity plans and help protect its employees and support its clients. The Corporation is managing its response to the COVID-19 pandemic according to its Enterprise Response Framework, which invokes centralized management of the crisis event and the integration of its response. The CEO and key members of the Corporation’s management team meet regularly with co-leaders of the Executive Response Team, which is composed of senior executives across the Corporation, to help drive decisions, communications and consistency of response across all businesses and functions. We are also coordinating with global, regional and local authorities and health experts, including the U.S. Centers for Disease Control and Prevention (CDC) and the World Health Organization.
Additionally, we have implemented a number of measures to assist our employees, clients and the communities we serve as discussed below.
Employees
We are providing support to our teammates to help promote the health and safety of our employees by monitoring guidance from the CDC, medical boards and health authorities and sharing such guidance with our employees. We are also operating our businesses from remote locations and leveraging our business continuity plans and capabilities.
The Corporation has globally implemented a work-from-home posture, which has resulted in the substantial majority of our employees working from home, and pre-planned contingency strategies for site-based operations for our remaining employees. We continue to evaluate our continuity plans and work-from-home strategy in an effort to best protect the health and safety of our employees.
|
3
Bank of America
|
||||||||
Clients
We continue to leverage our business continuity plans and capabilities to service our clients and meet our clients’ financial needs by offering assistance to clients affected by the COVID-19 pandemic and providing access to credit and the important financial services on which our clients rely. We are also participating in the programs created by the Coronavirus Aid, Relief and Economic Security (CARES Act) and Federal Reserve lending programs for businesses, such as the Paycheck Protection Program (PPP) and Main Street Lending Program, as well as other measures. While most of our deferral programs expired in the third quarter of 2020, we continue to offer assistance on a case-by-case basis when requested by clients affected by the COVID-19 pandemic.
As of September 30 2020, we had approximately 343,000 PPP loans outstanding with balances totaling $24.7 billion, which were recorded in the
Consumer
,
GWIM
and
Global Banking
segments. In addition, we have begun to process applications for forgiveness. For more information on PPP loans, see Credit Risk Management on page 31, and for more information on accounting for PPP loans and loan modifications under the CARES Act, see
Note 1 – Summary of Significant Accounting Principles
to the Consolidated Financial Statements.
Community Partners
We continue to support the communities where we live and work by engaging in various initiatives to help those affected by COVID-19. These initiatives include committing resources to provide medical supplies, food and other necessities for those in need. We are also supporting racial equality, economic opportunity and environmental sustainability through direct equity investments in minority-owned depository institutions, equity investments in minority entrepreneurs, businesses and funds, as well as other initiatives.
Risk Management
We continue to manage the increased operational risk related to the execution of our business continuity plans in accordance with our Enterprise Response Framework, Risk Framework and Operational Risk Management Program. For more information, see Managing Risk on page 23.
Loan Modifications
The Corporation has implemented various consumer and commercial loan modification programs to provide its borrowers relief from the economic impacts of COVID-19. Based on guidance in the CARES Act that the Corporation adopted, COVID-19 related modifications to consumer and commercial loans that were current as of December 31, 2019 are exempt from troubled debt restructuring (TDR) classification under accounting principles generally accepted in the United States of America (GAAP). In addition, the bank regulatory agencies issued interagency guidance stating that COVID-19 related short-term modifications (i.e., six months or less) granted to consumer or commercial loans that were current as of the loan modification program implementation date are not TDRs. For more information, see
Note 1 – Summary of Significant Accounting Principles
and
Note 5 – Outstanding Loans and Leases and Allowance for Credit Losses
to the Consolidated Financial Statements
.
We have provided borrowers with relief from the economic impacts of COVID-19 through payment deferral and forbearance programs. A significant portion of deferrals expired in the third quarter of 2020, reflecting a decline in customer requests for assistance.
As of October 21, 2020, deferred consumer and small business loans recorded on the Consolidated Balance Sheet totaled $9.8 billion, consisting of $9.0 billion of residential mortgage and home equity loans, including loans serviced by others, that are well-collateralized, $298 million of consumer credit card loans and $582 million of small business and consumer vehicle loans. For deferred residential mortgage and home equity loans, the weighted average loan-to-value (LTV) and combined LTV (CLTV) ratios were 61 percent and 57 percent, respectively. Of the consumer credit card loans for which payment deferral programs have expired, 91 percent of cardholders have made at least one payment since exiting deferral.
As of October 21, 2020, excluding small business, deferred commercial balances totaled $1.4 billion, or 0.29 percent of total commercial loans.
Other Related Matters
Although the macroeconomic outlook improved modestly in the three months ended September 30, 2020, the future direct and indirect impact of COVID-19 on our businesses, results of operations and financial condition of the Corporation remain highly uncertain. Should current economic conditions persist or deteriorate, this macroeconomic environment will have a continued adverse effect on our businesses and results of operations and could have an adverse effect on our financial condition. For more information on how the risks related to the COVID-19 pandemic may adversely affect our businesses, results of operations and financial condition, see Part II, Item 1A. Risk Factors on page 105.
LIBOR and Other Benchmark Rates
As previously disclosed, to facilitate an orderly transition from Interbank Offered Rates (IBORs) and other benchmark rates to alternative reference rates (ARRs), the Corporation has established an enterprise-wide program to identify, assess and monitor risks associated with the expected discontinuation or unavailability of benchmarks, including the London Interbank Offered Rate (LIBOR). As part of this program, the Corporation continues to identify, assess and monitor risks associated with the expected discontinuation or unavailability of LIBOR and other benchmarks. Additionally, the Corporation continues to evaluate and address documentation and contractual mechanics of outstanding IBOR-based products and contracts that may mature after LIBOR is no longer deemed a representative benchmark, as well as new and potential future ARR-based products and contracts to achieve operational readiness.
This program, which is led by the Corporation's Chief Operating Officer, includes active involvement of senior management and regular reports to the Enterprise Risk Committee. The program is structured to address the Corporation's industry and regulatory engagement, client and financial contract changes, internal and external communications, technology and operations modifications, introduction of new products, migration of existing clients, and program strategy and governance.
As the markets for ARRs continue to grow, the Corporation continues to monitor and participate in the development and usage of ARRs, including the Secured Overnight Financing Rate (SOFR) and the Sterling Overnight Index Average (SONIA). The Corporation issued debt and deposits linked to SOFR and SONIA, facilitated debt issuances by clients linked to SOFR and SONIA, and executed SOFR- and SONIA-based derivative contracts to make markets and facilitate client activities.
|
Bank of America
4
|
||||||||
In accordance with the industry-wide transition from IBORs to ARRs, central clearing counterparties (CCPs) in Europe and the U.S., which act as intermediaries and require collateral deposits for the clearing and settlement of interest rate swap products and other derivatives, changed the interest rate used to calculate amounts due to counterparties for collateral deposits posted with them from the European Overnight Index Average (EONIA) to the Euro Short-Term Rate (ESTR) and the Effective Fed Funds Rate (EFFR) to SOFR in July and October 2020, respectively. In connection with this transition, the Corporation updated its operational models, systems, procedures and internal infrastructure. The earnings impact from the changes in net valuations of these derivatives was not significant at the point of conversion, as the Corporation either provided or received compensation to/from the CCPs. Additionally, in October 2020, the Corporation and certain of its subsidiaries adhered to the International Swaps and Derivatives Association, Inc. 2020 IBOR Fallbacks Protocol, effective January 25, 2021, which provides a mechanism to enable market participants to incorporate fallbacks for certain legacy non-cleared derivatives linked to certain IBORs.
The Corporation continues to monitor the impact of COVID-19 on the market and industry transition to ARRs, including the readiness of impacted clients and their operational readiness to transition to ARRs. For more information on the expected replacement of LIBOR and other benchmark rates, see
Executive Summary - Recent Developments - LIBOR and Other Benchmark Rates in the MD&A and Item 1A. Risk Factors - Other of the Corporation’s 2019 Annual Report on Form 10-K. For more information about the Corporation's risks related to the COVID-19 pandemic, see Part II, Item 1A. Risk Factors on page 105.
Merchant Services Joint Venture
Prior to July 1, 2020, a significant portion of our merchant processing activity was performed by a joint venture in which we held a 49 percent ownership interest. Effective July 1, 2020, the Corporation received its share of the joint venture's merchant contracts and began performing merchant processing services for these merchants. The Corporation records merchant revenue in card income with the related costs in noninterest expense in the Consolidated Statement of Income. For more information, see
Note 10 – Commitments and Contingencies
to the Consolidated Financial Statements.
Financial Highlights
Effective January 1, 2020, we adopted the new accounting standard on current expected credit losses (CECL), under which the allowance is measured based on management’s best estimate of lifetime expected credit losses (ECL). Prior-year periods presented reflect measurement of the allowance based on management’s estimate of probable incurred credit losses. For more information, see
Note 1 – Summary of Significant Accounting Principles
to the Consolidated Financial Statements.
| Table 1 | Summary Income Statement and Selected Financial Data | |||||||||||||||||||||||||
|
Three Months Ended
September 30 |
Nine Months Ended
September 30 |
|||||||||||||||||||||||||
| (Dollars in millions, except per share information) | 2020 | 2019 | 2020 | 2019 | ||||||||||||||||||||||
| Income statement | ||||||||||||||||||||||||||
| Net interest income | $ | 10,129 | $ | 12,187 | $ | 33,107 | $ | 36,751 | ||||||||||||||||||
| Noninterest income | 10,207 | 10,620 | 32,322 | 32,144 | ||||||||||||||||||||||
| Total revenue, net of interest expense | 20,336 | 22,807 | 65,429 | 68,895 | ||||||||||||||||||||||
| Provision for credit losses | 1,389 | 779 | 11,267 | 2,649 | ||||||||||||||||||||||
| Noninterest expense | 14,401 | 15,169 | 41,286 | 41,661 | ||||||||||||||||||||||
| Income before income taxes | 4,546 | 6,859 | 12,876 | 24,585 | ||||||||||||||||||||||
| Income tax expense | (335) | 1,082 | 452 | 4,149 | ||||||||||||||||||||||
| Net income | 4,881 | 5,777 | 12,424 | 20,436 | ||||||||||||||||||||||
| Preferred stock dividends | 441 | 505 | 1,159 | 1,186 | ||||||||||||||||||||||
|
Net income applicable to common shareholders
|
$ | 4,440 | $ | 5,272 | $ | 11,265 | $ | 19,250 | ||||||||||||||||||
| Per common share information | ||||||||||||||||||||||||||
| Earnings | $ | 0.51 | $ | 0.57 | $ | 1.29 | $ | 2.02 | ||||||||||||||||||
| Diluted earnings | 0.51 | 0.56 | 1.28 | 2.01 | ||||||||||||||||||||||
| Dividends paid | 0.18 | 0.18 | 0.54 | 0.48 | ||||||||||||||||||||||
| Performance ratios | ||||||||||||||||||||||||||
|
Return on average assets
(1)
|
0.71 | % | 0.95 | % | 0.63 | % | 1.14 | % | ||||||||||||||||||
|
Return on average common shareholders’ equity
(1)
|
7.24 | 8.48 | 6.20 | 10.49 | ||||||||||||||||||||||
|
Return on average tangible common shareholders’ equity
(2)
|
10.16 | 11.84 | 8.71 | 14.67 | ||||||||||||||||||||||
|
Efficiency ratio
(1)
|
70.81 | 66.51 | 63.10 | 60.47 | ||||||||||||||||||||||
|
September 30
2020 |
December 31
2019 |
|||||||||||||||||||||||||
| Balance sheet | ||||||||||||||||||||||||||
| Total loans and leases | $ | 955,172 | $ | 983,426 | ||||||||||||||||||||||
| Total assets | 2,738,452 | 2,434,079 | ||||||||||||||||||||||||
| Total deposits | 1,702,880 | 1,434,803 | ||||||||||||||||||||||||
| Total liabilities | 2,469,602 | 2,169,269 | ||||||||||||||||||||||||
| Total common shareholders’ equity | 245,423 | 241,409 | ||||||||||||||||||||||||
| Total shareholders’ equity | 268,850 | 264,810 | ||||||||||||||||||||||||
(1)
For definitions, see Key Metrics on page 104.
(2)
Return on average tangible common shareholders’ equity is a non-GAAP financial measure. For more information and a corresponding reconciliation to the most closely related financial measures defined by accounting principles generally accepted in the United States of America, see Non-GAAP Reconciliations on page 51.
|
5
Bank of America
|
||||||||
Net income was $4.9 billion and $12.4 billion, or $0.51 and $1.28 per diluted share, for the three and nine months ended September 30, 2020 compared to $5.8 billion and $20.4 billion, or $0.56 and $2.01 per diluted share, for the same periods in 2019. The decline in net income was primarily due to higher provision for credit losses driven by the weaker economic outlook related to COVID-19 and lower net interest income, partially offset by a $2.1 billion pretax impairment charge related to the notice of the termination of the merchant services joint venture in the prior year.
Total assets increased $304.4 billion from December 31, 2019 to $2.7 trillion primarily driven by an increase in cash and cash equivalents, debt securities and federal funds sold and securities borrowed or purchased under agreements to resell primarily due to cash deployed from higher deposit balances. The increase in assets was partially offset by lower loans and leases primarily driven by a decline in credit card originations and promotional balances, mortgage paydowns and lower origination volumes.
Total liabilities increased $300.3 billion from December 31, 2019 to $2.5 trillion primarily driven by higher deposit inflows resulting from government stimulus actions and client responses to market volatility as clients improved their liquidity positions. The increase in liabilities was also due to higher federal funds purchased and securities loaned or sold under agreements to repurchase primarily due to higher inventory in Fixed Income, Currencies and Commodities (FICC) within
Global Markets.
Long-term debt also increased primarily driven by
valuations due to lower interest rates, as well as debt issuances.
Shareholders’ equity increased $4.0 billion from December 31, 2019 primarily due to net income and market value increases on debt securities, partially offset by returns of capital to shareholders through common stock repurchases and common and preferred stock dividends as well as the impact of the adoption of the new credit loss accounting standard.
Net Interest Income
Net interest income decreased $2.1 billion to $10.1 billion, and $3.6 billion to $33.1 billion for the three and nine months ended September 30, 2020 compared to the same periods in 2019. Net interest yield on a fully taxable-equivalent (FTE) basis decreased 69 basis points (bps) to 1.72 percent, and 49 bps to 1.96 percent for the same periods. The decrease in net interest income was primarily driven by lower interest rates, partially offset by reduced deposit and funding costs, the deployment of excess deposits into securities and an additional day of interest accrual. We expect net interest income to remain relatively flat or to modestly increase in the fourth quarter of 2020 as compared to the third quarter of 2020 assuming economic conditions do not deteriorate and interest rates remain stable as compared to September 30, 2020. For more information on net interest yield and the FTE basis, see Supplemental Financial Data on page 8, and for more information on interest rate risk management, see Interest Rate Risk Management for the Banking Book on page 48.
Noninterest Income
| Table 2 | Noninterest Income | |||||||||||||||||||||||||
| Three Months Ended September 30 |
Nine Months Ended
September 30 |
|||||||||||||||||||||||||
| (Dollars in millions) | 2020 | 2019 | 2020 | 2019 | ||||||||||||||||||||||
| Fees and commissions: | ||||||||||||||||||||||||||
| Card income | $ | 1,568 | $ | 1,465 | $ | 4,089 | $ | 4,286 | ||||||||||||||||||
| Service charges | 1,817 | 1,975 | 5,282 | 5,717 | ||||||||||||||||||||||
| Investment and brokerage services | 3,623 | 3,494 | 10,803 | 10,324 | ||||||||||||||||||||||
| Investment banking fees | 1,769 | 1,533 | 5,316 | 4,168 | ||||||||||||||||||||||
| Total fees and commissions | 8,777 | 8,467 | 25,490 | 24,495 | ||||||||||||||||||||||
| Market making and similar activities | 1,689 | 2,118 | 6,983 | 7,267 | ||||||||||||||||||||||
| Other income | (259) | 35 | (151) | 382 | ||||||||||||||||||||||
| Total noninterest income | $ | 10,207 | $ | 10,620 | $ | 32,322 | $ | 32,144 | ||||||||||||||||||
Noninterest income decreased
$413 million to $10.2 billion
and
increased
$178 million to $32.3 billion for the three and nine months ended September 30, 2020 compared to the same periods in 2019. The following highlights the significant changes.
●
Card income increased $103 million for the three-month period and decreased $197 million for the nine-month period. The increase in the three-month period was primarily driven by higher income related to the processing of unemployment insurance and higher merchant processing, partially offset by lower client activity related to the impact of COVID-19. The decrease in the nine-month period was primarily due to lower levels of consumer spending driven by the impact of COVID-19.
●
Service charges decreased $158 million and $435 million primarily due to higher deposit balances and lower client activity due to the impact of COVID-19.
●
Investment and brokerage services income increased $129 million and $479 million primarily due to higher client transactional activity, higher market valuations and assets
under management (AUM) flows, partially offset by declines in AUM pricing.
●
Investment banking fees increased $236 million and $1.1 billion primarily due to higher equity underwriting fees and for the nine-month period, higher debt underwriting fees, as well.
●
Market making and similar activities decreased $429 million and $284 million. The decrease in both periods was primarily due to the impact of lower U.S. interest rates on certain risk management derivatives. The decrease in the nine-month period was also partially offset by increased client activity and strong trading performance in FICC.
●
Other income decreased $294 million and $533 million. The decrease in the three-month period was primarily due to higher partnership losses on tax credit investments, primarily affordable housing and renewable energy, as well as loan sales in the prior period. The decrease in the nine-month period was primarily due to lower equity investment income and higher partnership losses on tax credit investments.
|
Bank of America
6
|
||||||||
Provision for Credit Losses
The provision for credit losses increased $610 million to $1.4 billion, and $8.6 billion to $11.3 billion for the three and nine months ended September 30, 2020 compared to the same periods in 2019 primarily driven by higher ECL due to a weaker economic outlook related to COVID-19. For more information on the provision for credit losses, see Allowance for Credit Losses on page 44.
Noninterest Expense
| Table 3 | Noninterest Expense | |||||||||||||||||||||||||
| Three Months Ended September 30 |
Nine Months Ended
September 30 |
|||||||||||||||||||||||||
| (Dollars in millions) | 2020 | 2019 | 2020 | 2019 | ||||||||||||||||||||||
| Compensation and benefits | $ | 8,200 | $ | 7,779 | $ | 24,535 | $ | 24,000 | ||||||||||||||||||
| Occupancy and equipment | 1,798 | 1,663 | 5,302 | 4,908 | ||||||||||||||||||||||
| Information processing and communications | 1,333 | 1,163 | 3,807 | 3,484 | ||||||||||||||||||||||
| Product delivery and transaction related | 930 | 696 | 2,518 | 2,067 | ||||||||||||||||||||||
| Marketing | 308 | 440 | 1,238 | 1,410 | ||||||||||||||||||||||
| Professional fees | 450 | 386 | 1,206 | 1,155 | ||||||||||||||||||||||
| Other general operating | 1,382 | 3,042 | 2,680 | 4,637 | ||||||||||||||||||||||
| Total noninterest expense | $ | 14,401 | $ | 15,169 | $ | 41,286 | $ | 41,661 | ||||||||||||||||||
Noninterest expense decreased $768 million to $14.4 billion, and $375 million to $41.3 billion for the three and nine months ended September 30, 2020 compared to the same periods in 2019. The decrease was primarily due to a $2.1 billion pretax impairment charge related to the notice of termination of the merchant services joint venture recorded in the prior-year
periods, partially offset by the impact of COVID-19 related expense, as well as higher litigation expense. Absent unexpected changes, we expect noninterest expense will be approximately $13.7 billion in the fourth quarter of 2020 assuming both lower COVID-19 related costs and litigation expense.
Income Tax Expense
| Table 4 | Income Tax Expense | |||||||||||||||||||||||||
| Three Months Ended September 30 |
Nine Months Ended
September 30 |
|||||||||||||||||||||||||
| (Dollars in millions) | 2020 | 2019 | 2020 | 2019 | ||||||||||||||||||||||
| Income before income taxes | $ | 4,546 | $ | 6,859 | $ | 12,876 | $ | 24,585 | ||||||||||||||||||
| Income tax expense | (335) | 1,082 | 452 | 4,149 | ||||||||||||||||||||||
| Effective tax rate | (7.4) | % | 15.8 | % | 3.5 | % | 16.9 | % | ||||||||||||||||||
The changes in the effective tax rates for the three and nine months ended September 30, 2020 compared to the same periods a year ago were driven by the impact of our recurring tax preference benefits on the lower levels of pretax income and the impact of the U.K. tax law change discussed below. Our recurring tax preference benefits primarily consist of tax credits from investments in affordable housing and renewable energy, aligning with our responsible growth strategy to address global sustainability challenges. We expect the effective tax rate for the fourth quarter of 2020 to be approximately 10 percent, excluding unusual items. Absent these tax credits, the effective tax rate would be approximately 26 percent.
On July 22, 2020, the U.K. enacted a reversal of the final two percent of scheduled decreases in the U.K. corporation tax rate, which had been previously enacted. This change will unfavorably affect income tax expense on future U.K. earnings, and requires a reversal of the adjustment to the U.K. net deferred tax assets recognized at the time the related tax rate decrease was originally enacted. Accordingly, during the third quarter of 2020, the Corporation recorded a positive income tax adjustment of approximately $700 million along with a corresponding increase to the U.K. net deferred tax assets.
|
7
Bank of America
|
||||||||
Supplemental Financial Data
Non-GAAP Financial Measures
In this Form 10-Q, we present certain non-GAAP financial measures. Non-GAAP financial measures exclude certain items or otherwise include components that differ from the most directly comparable measures calculated in accordance with GAAP. Non-GAAP financial measures are provided as additional useful information to assess our financial condition, results of operations (including period-to-period operating performance) or compliance with prospective regulatory requirements. These non-GAAP financial measures are not intended as a substitute for GAAP financial measures and may not be defined or calculated the same way as non-GAAP financial measures used by other companies.
We view net interest income and related ratios and analyses on an FTE basis, which when presented on a consolidated basis are non-GAAP financial measures. To derive the FTE basis, net interest income is adjusted to reflect tax-exempt income on an equivalent before-tax basis with a corresponding increase in income tax expense. For purposes of this calculation, we use the federal statutory tax rate of 21 percent and a representative state tax rate. Net interest yield, which measures the basis points we earn over the cost of funds, utilizes net interest income on an FTE basis. We believe that presentation of these items on an FTE basis allows for comparison of amounts from both taxable and tax-exempt sources and is consistent with industry practices.
We may present certain key performance indicators and ratios excluding certain items (e.g., debit valuation adjustment (DVA) gains (losses)) which result in non-GAAP financial measures. We believe that the presentation of measures that exclude these items is useful because such measures provide additional information to assess the underlying operational performance and trends of our businesses and to allow better comparison of period-to-period operating performance.
We also evaluate our business based on certain ratios that utilize tangible equity, a non-GAAP financial measure. Tangible equity represents shareholders’ equity or common shareholders’ equity reduced by goodwill and intangible assets (excluding mortgage servicing rights (MSRs)), net of related deferred tax liabilities ("adjusted" shareholders' equity or common shareholders' equity). These measures are used to evaluate our use of equity. In addition, profitability, relationship and investment models use both return on average tangible
common shareholders’ equity and return on average tangible shareholders’ equity as key measures to support our overall growth objectives. These ratios are as follows:
●
Return on average tangible common shareholders’ equity measures our net income applicable to common shareholders as a percentage of adjusted average common shareholders’ equity. The tangible common equity ratio represents adjusted ending common shareholders’ equity divided by total tangible assets.
●
Return on average tangible shareholders' equity measures our net income as a percentage of adjusted average total shareholders’ equity. The tangible equity ratio represents adjusted ending shareholders’ equity divided by total tangible assets.
●
Tangible book value per common share represents adjusted ending common shareholders’ equity divided by ending common shares outstanding.
We believe ratios utilizing tangible equity provide additional useful information because they present measures of those assets that can generate income. Tangible book value per common share provides additional useful information about the level of tangible assets in relation to outstanding shares of common stock.
The aforementioned supplemental data and performance measures are presented in Tables 5 and 6.
For more information on the reconciliation of these non-GAAP financial measures to the corresponding GAAP financial measures, see Non-GAAP Reconciliations on page 51.
Key Performance Indicators
We present certain key financial and nonfinancial performance indicators (key performance indicators) that management uses when assessing our consolidated and/or segment results. We believe they are useful to investors because they provide additional information about our underlying operational performance and trends. These key performance indicators (KPIs) may not be defined or calculated in the same way as similar KPIs used by other companies. For information on how these metrics are defined, see Key Metrics on page 104.
Our consolidated key performance indicators, which include various equity and credit metrics, are presented in Table 1 on page 5 and/or Table 5 on page 9.
For information on key segment performance metrics, see Business Segment Operations on page 12.
|
Bank of America
8
|
||||||||
| Table 5 | Selected Financial Data | |||||||||||||||||||||||||||||||||||||||||||
| 2020 Quarters | 2019 Quarters |
Nine Months Ended
September 30 |
||||||||||||||||||||||||||||||||||||||||||
| (In millions, except per share information) | Third | Second | First | Fourth | Third | 2020 | 2019 | |||||||||||||||||||||||||||||||||||||
| Income statement | ||||||||||||||||||||||||||||||||||||||||||||
| Net interest income | $ | 10,129 | $ | 10,848 | $ | 12,130 | $ | 12,140 | $ | 12,187 | $ | 33,107 | $ | 36,751 | ||||||||||||||||||||||||||||||
| Noninterest income | 10,207 | 11,478 | 10,637 | 10,209 | 10,620 | 32,322 | 32,144 | |||||||||||||||||||||||||||||||||||||
| Total revenue, net of interest expense | 20,336 | 22,326 | 22,767 | 22,349 | 22,807 | 65,429 | 68,895 | |||||||||||||||||||||||||||||||||||||
| Provision for credit losses | 1,389 | 5,117 | 4,761 | 941 | 779 | 11,267 | 2,649 | |||||||||||||||||||||||||||||||||||||
| Noninterest expense | 14,401 | 13,410 | 13,475 | 13,239 | 15,169 | 41,286 | 41,661 | |||||||||||||||||||||||||||||||||||||
| Income before income taxes | 4,546 | 3,799 | 4,531 | 8,169 | 6,859 | 12,876 | 24,585 | |||||||||||||||||||||||||||||||||||||
| Income tax expense | (335) | 266 | 521 | 1,175 | 1,082 | 452 | 4,149 | |||||||||||||||||||||||||||||||||||||
| Net income | 4,881 | 3,533 | 4,010 | 6,994 | 5,777 | 12,424 | 20,436 | |||||||||||||||||||||||||||||||||||||
| Net income applicable to common shareholders | 4,440 | 3,284 | 3,541 | 6,748 | 5,272 | 11,265 | 19,250 | |||||||||||||||||||||||||||||||||||||
|
Average common shares issued and outstanding
|
8,732.9 | 8,739.9 | 8,815.6 | 9,017.1 | 9,303.6 | 8,762.6 | 9,516.2 | |||||||||||||||||||||||||||||||||||||
|
Average diluted common shares issued and outstanding
|
8,777.5 | 8,768.1 | 8,862.7 | 9,079.5 | 9,353.0 | 8,800.5 | 9,565.7 | |||||||||||||||||||||||||||||||||||||
| Performance ratios | ||||||||||||||||||||||||||||||||||||||||||||
|
Return on average assets
(1)
|
0.71 | % | 0.53 | % | 0.65 | % | 1.13 | % | 0.95 | % | 0.63 | % | 1.14 | % | ||||||||||||||||||||||||||||||
|
Four-quarter trailing return on average assets
(2)
|
0.75 | 0.81 | 0.99 | 1.14 | 1.17 | n/a | n/a | |||||||||||||||||||||||||||||||||||||
|
Return on average common shareholders’ equity
(1)
|
7.24 | 5.44 | 5.91 | 11.00 | 8.48 | 6.20 | 10.49 | |||||||||||||||||||||||||||||||||||||
|
Return on average tangible common shareholders’ equity
(1)
|
10.16 | 7.63 | 8.32 | 15.43 | 11.84 | 8.71 | 14.67 | |||||||||||||||||||||||||||||||||||||
|
Return on average shareholders’ equity
(1)
|
7.26 | 5.34 | 6.10 | 10.40 | 8.48 | 6.24 | 10.19 | |||||||||||||||||||||||||||||||||||||
|
Return on average tangible shareholders’ equity
(3)
|
9.84 | 7.23 | 8.29 | 14.09 | 11.43 | 8.46 | 13.78 | |||||||||||||||||||||||||||||||||||||
| Total ending equity to total ending assets | 9.82 | 9.69 | 10.11 | 10.88 | 11.06 | 9.82 | 11.06 | |||||||||||||||||||||||||||||||||||||
| Total average equity to total average assets | 9.76 | 9.85 | 10.60 | 10.89 | 11.21 | 10.05 | 11.22 | |||||||||||||||||||||||||||||||||||||
| Dividend payout | 35.36 | 47.87 | 44.57 | 23.90 | 31.48 | 41.90 | 23.56 | |||||||||||||||||||||||||||||||||||||
| Per common share data | ||||||||||||||||||||||||||||||||||||||||||||
| Earnings | $ | 0.51 | $ | 0.38 | $ | 0.40 | $ | 0.75 | $ | 0.57 | $ | 1.29 | $ | 2.02 | ||||||||||||||||||||||||||||||
| Diluted earnings | 0.51 | 0.37 | 0.40 | 0.74 | 0.56 | 1.28 | 2.01 | |||||||||||||||||||||||||||||||||||||
| Dividends paid | 0.18 | 0.18 | 0.18 | 0.18 | 0.18 | 0.54 | 0.48 | |||||||||||||||||||||||||||||||||||||
|
Book value
(1)
|
28.33 | 27.96 | 27.84 | 27.32 | 26.96 | 28.33 | 26.96 | |||||||||||||||||||||||||||||||||||||
|
Tangible book value
(3)
|
20.23 | 19.90 | 19.79 | 19.41 | 19.26 | 20.23 | 19.26 | |||||||||||||||||||||||||||||||||||||
| Market capitalization | $ | 208,656 | $ | 205,772 | $ | 184,181 | $ | 311,209 | $ | 264,842 | $ | 208,656 | $ | 264,842 | ||||||||||||||||||||||||||||||
| Average balance sheet | ||||||||||||||||||||||||||||||||||||||||||||
| Total loans and leases | $ | 974,018 | $ | 1,031,387 | $ | 990,283 | $ | 973,986 | $ | 964,733 | ||||||||||||||||||||||||||||||||||
| Total assets | 2,739,684 | 2,704,186 | 2,494,928 | 2,450,005 | 2,412,223 | |||||||||||||||||||||||||||||||||||||||
| Total deposits | 1,695,488 | 1,658,197 | 1,439,336 | 1,410,439 | 1,375,052 | |||||||||||||||||||||||||||||||||||||||
| Long-term debt | 224,254 | 221,167 | 210,816 | 206,026 | 202,620 | |||||||||||||||||||||||||||||||||||||||
| Common shareholders’ equity | 243,896 | 242,889 | 241,078 | 243,439 | 246,630 | |||||||||||||||||||||||||||||||||||||||
| Total shareholders’ equity | 267,323 | 266,316 | 264,534 | 266,900 | 270,430 | |||||||||||||||||||||||||||||||||||||||
| Asset quality | ||||||||||||||||||||||||||||||||||||||||||||
|
Allowance for credit losses
(4)
|
$ | 21,506 | $ | 21,091 | $ | 17,126 | $ | 10,229 | $ | 10,242 | ||||||||||||||||||||||||||||||||||
|
Nonperforming loans, leases and foreclosed properties
(5)
|
4,730 | 4,611 | 4,331 | 3,837 | 3,723 | |||||||||||||||||||||||||||||||||||||||
|
Allowance for loan and lease losses as a percentage of total loans and leases outstanding
(5)
|
2.07 | % | 1.96 | % | 1.51 | % | 0.97 | % | 0.98 | % | ||||||||||||||||||||||||||||||||||
|
Allowance for loan and lease losses as a percentage of total nonperforming loans and leases
(5)
|
431 | 441 | 389 | 265 | 271 | |||||||||||||||||||||||||||||||||||||||
| Net charge-offs | $ | 972 | $ | 1,146 | $ | 1,122 | $ | 959 | $ | 811 | ||||||||||||||||||||||||||||||||||
|
Annualized net charge-offs as a percentage of average loans and leases outstanding
(5)
|
0.40 | % | 0.45 | % | 0.46 | % | 0.39 | % | 0.34 | % | ||||||||||||||||||||||||||||||||||
|
Capital ratios at period end
(6)
|
||||||||||||||||||||||||||||||||||||||||||||
|
Common equity tier 1 capital
|
11.9 | % | 11.4 | % | 10.8 | % | 11.2 | % | 11.4 | % | ||||||||||||||||||||||||||||||||||
|
Tier 1 capital
|
13.5 | 12.9 | 12.3 | 12.6 | 12.9 | |||||||||||||||||||||||||||||||||||||||
|
Total capital
|
16.1 | 14.8 | 14.6 | 14.7 | 15.1 | |||||||||||||||||||||||||||||||||||||||
|
Tier 1 leverage
|
7.4 | 7.4 | 7.9 | 7.9 | 8.2 | |||||||||||||||||||||||||||||||||||||||
|
Supplementary leverage ratio
|
6.9 | 7.1 | 6.4 | 6.4 | 6.6 | |||||||||||||||||||||||||||||||||||||||
|
Tangible equity
(3)
|
7.4 | 7.3 | 7.7 | 8.2 | 8.4 | |||||||||||||||||||||||||||||||||||||||
|
Tangible common equity
(3)
|
6.6 | 6.5 | 6.7 | 7.3 | 7.4 | |||||||||||||||||||||||||||||||||||||||
| Total loss-absorbing capacity and long-term debt metrics | ||||||||||||||||||||||||||||||||||||||||||||
|
Total loss-absorbing capacity to risk-weighted assets
|
26.9 | % | 26.0 | % | 24.6 | % | 24.6 | % | 24.8 | % | ||||||||||||||||||||||||||||||||||
|
Total loss-absorbing capacity to supplementary leverage exposure
|
13.7 | 14.2 | 12.8 | 12.5 | 12.7 | |||||||||||||||||||||||||||||||||||||||
|
Eligible long-term debt to risk-weighted assets
|
12.9 | 12.4 | 11.6 | 11.5 | 11.4 | |||||||||||||||||||||||||||||||||||||||
|
Eligible long-term debt to supplementary leverage exposure
|
6.6 | 6.7 | 6.1 | 5.8 | 5.8 | |||||||||||||||||||||||||||||||||||||||
(1)
For definitions, see Key Metrics on page 104.
(2)
Calculated as total net income for four consecutive quarters divided by annualized average assets for four consecutive quarters.
(3)
Tangible equity ratios and tangible book value per share of common stock are non-GAAP financial measures. For more information on these ratios and corresponding reconciliations to GAAP financial measures, see Supplemental Financial Data on page 8 and Non-GAAP Reconciliations on page 51.
(4)
Includes the allowance for loan and lease losses and the reserve for unfunded lending commitments.
(5)
Balances and ratios do not include loans accounted for under the fair value option. For additional exclusions from nonperforming loans, leases and foreclosed properties, see Consumer Portfolio Credit Risk Management – Nonperforming Consumer Loans, Leases and Foreclosed Properties Activity on page 36 and corresponding Table 26 and Commercial Portfolio Credit Risk Management – Nonperforming Commercial Loans, Leases and Foreclosed Properties Activity on page 41 and corresponding Table 33.
(6)
For more information, including which approach is used to assess capital adequacy, see Capital Management on page 23.
n/a = not applicable
|
9
Bank of America
|
||||||||
| Table 6 | Quarterly Average Balances and Interest Rates - FTE Basis | |||||||||||||||||||||||||||||||||||||
|
Average
Balance |
Interest
Income/
Expense
(1)
|
Yield/
Rate |
Average
Balance |
Interest
Income/
Expense
(1)
|
Yield/
Rate |
|||||||||||||||||||||||||||||||||
| (Dollars in millions) | Third Quarter 2020 | Third Quarter 2019 | ||||||||||||||||||||||||||||||||||||
| Earning assets | ||||||||||||||||||||||||||||||||||||||
|
Interest-bearing deposits with the Federal Reserve, non-U.S. central
banks and other banks
|
$ | 245,682 | $ | 10 | 0.02 | % | $ | 122,033 | $ | 453 | 1.47 | % | ||||||||||||||||||||||||||
| Time deposits placed and other short-term investments | 7,686 | (4) | (0.25) | 9,863 | 47 | 1.87 | ||||||||||||||||||||||||||||||||
|
Federal funds sold and securities borrowed or purchased under
agreements to resell
|
384,221 | 55 | 0.06 | 269,129 | 1,242 | 1.83 | ||||||||||||||||||||||||||||||||
| Trading account assets | 146,972 | 960 | 2.60 | 157,818 | 1,338 | 3.37 | ||||||||||||||||||||||||||||||||
| Debt securities | 533,261 | 2,147 | 1.63 | 447,126 | 2,856 | 2.56 | ||||||||||||||||||||||||||||||||
|
Loans and leases
(2)
:
|
||||||||||||||||||||||||||||||||||||||
| Residential mortgage | 237,414 | 1,811 | 3.05 | 224,084 | 1,937 | 3.46 | ||||||||||||||||||||||||||||||||
| Home equity | 37,897 | 284 | 2.99 | 43,616 | 552 | 5.03 | ||||||||||||||||||||||||||||||||
| Credit card | 81,309 | 2,086 | 10.20 | 94,370 | 2,581 | 10.85 | ||||||||||||||||||||||||||||||||
|
Direct/Indirect and other consumer
(3)
|
89,559 | 593 | 2.63 | 90,813 | 824 | 3.59 | ||||||||||||||||||||||||||||||||
| Total consumer | 446,179 | 4,774 | 4.26 | 452,883 | 5,894 | 5.18 | ||||||||||||||||||||||||||||||||
| U.S. commercial | 343,533 | 2,099 | 2.43 | 324,436 | 3,279 | 4.01 | ||||||||||||||||||||||||||||||||
| Non-U.S. commercial | 102,938 | 531 | 2.05 | 105,003 | 905 | 3.42 | ||||||||||||||||||||||||||||||||
|
Commercial real estate
(4)
|
63,262 | 393 | 2.47 | 62,185 | 687 | 4.38 | ||||||||||||||||||||||||||||||||
| Commercial lease financing | 18,106 | 138 | 3.04 | 20,226 | 182 | 3.58 | ||||||||||||||||||||||||||||||||
| Total commercial | 527,839 | 3,161 | 2.38 | 511,850 | 5,053 | 3.92 | ||||||||||||||||||||||||||||||||
| Total loans and leases | 974,018 | 7,935 | 3.25 | 964,733 | 10,947 | 4.51 | ||||||||||||||||||||||||||||||||
| Other earning assets | 83,086 | 497 | 2.39 | 68,018 | 1,181 | 6.90 | ||||||||||||||||||||||||||||||||
| Total earning assets | 2,374,926 | 11,600 | 1.95 | 2,038,720 | 18,064 | 3.52 | ||||||||||||||||||||||||||||||||
| Cash and due from banks | 32,714 | 25,588 | ||||||||||||||||||||||||||||||||||||
| Other assets, less allowance for loan and lease losses | 332,044 | 347,915 | ||||||||||||||||||||||||||||||||||||
| Total assets | $ | 2,739,684 | $ | 2,412,223 | ||||||||||||||||||||||||||||||||||
| Interest-bearing liabilities | ||||||||||||||||||||||||||||||||||||||
| U.S. interest-bearing deposits: | ||||||||||||||||||||||||||||||||||||||
| Savings | $ | 61,228 | $ | 1 | 0.01 | % | $ | 51,277 | $ | 1 | 0.01 | % | ||||||||||||||||||||||||||
| Demand and money market deposit accounts | 842,987 | 93 | 0.04 | 741,602 | 1,172 | 0.63 | ||||||||||||||||||||||||||||||||
| Consumer CDs and IRAs | 45,921 | 84 | 0.73 | 49,811 | 136 | 1.08 | ||||||||||||||||||||||||||||||||
| Negotiable CDs, public funds and other deposits | 57,499 | 31 | 0.21 | 63,936 | 354 | 2.19 | ||||||||||||||||||||||||||||||||
| Total U.S. interest-bearing deposits | 1,007,635 | 209 | 0.08 | 906,626 | 1,663 | 0.73 | ||||||||||||||||||||||||||||||||
| Non-U.S. interest-bearing deposits: | ||||||||||||||||||||||||||||||||||||||
| Banks located in non-U.S. countries | 1,108 | — | 0.08 | 1,721 | 5 | 1.13 | ||||||||||||||||||||||||||||||||
| Governments and official institutions | 177 | — | — | 188 | — | 0.02 | ||||||||||||||||||||||||||||||||
| Time, savings and other | 74,200 | 18 | 0.10 | 70,234 | 212 | 1.20 | ||||||||||||||||||||||||||||||||
| Total non-U.S. interest-bearing deposits | 75,485 | 18 | 0.09 | 72,143 | 217 | 1.19 | ||||||||||||||||||||||||||||||||
| Total interest-bearing deposits | 1,083,120 | 227 | 0.08 | 978,769 | 1,880 | 0.76 | ||||||||||||||||||||||||||||||||
|
Federal funds purchased, securities loaned or sold under agreements to repurchase, short-term borrowings and other interest-bearing liabilities
|
286,582 | (24) | (0.03) | 280,123 | 1,876 | 2.66 | ||||||||||||||||||||||||||||||||
| Trading account liabilities | 39,689 | 212 | 2.13 | 45,750 | 303 | 2.63 | ||||||||||||||||||||||||||||||||
| Long-term debt | 224,254 | 942 | 1.67 | 202,620 | 1,670 | 3.28 | ||||||||||||||||||||||||||||||||
| Total interest-bearing liabilities | 1,633,645 | 1,357 | 0.33 | 1,507,262 | 5,729 | 1.51 | ||||||||||||||||||||||||||||||||
| Noninterest-bearing sources: | ||||||||||||||||||||||||||||||||||||||
| Noninterest-bearing deposits | 612,368 | 396,283 | ||||||||||||||||||||||||||||||||||||
|
Other liabilities
(5)
|
226,348 | 238,248 | ||||||||||||||||||||||||||||||||||||
| Shareholders’ equity | 267,323 | 270,430 | ||||||||||||||||||||||||||||||||||||
| Total liabilities and shareholders’ equity | $ | 2,739,684 | $ | 2,412,223 | ||||||||||||||||||||||||||||||||||
| Net interest spread | 1.62 | % | 2.01 | % | ||||||||||||||||||||||||||||||||||
| Impact of noninterest-bearing sources | 0.10 | 0.40 | ||||||||||||||||||||||||||||||||||||
|
Net interest income/yield on earning assets
(6)
|
$ | 10,243 | 1.72 | % | $ | 12,335 | 2.41 | % | ||||||||||||||||||||||||||||||
(1)
Includes the impact of interest rate risk management contracts. For more information, see Interest Rate Risk Management for the Banking Book on page 48.
(2)
Nonperforming loans are included in the respective average loan balances. Income on these nonperforming loans is generally recognized on a cost recovery basis.
(3)
Includes non-U.S. consumer loans of $2.9 billion for both the third quarter of 2020 and 2019.
(4)
Includes U.S. commercial real estate loans of $59.6 billion and $57.6 billion, and non-U.S. commercial real estate loans of $3.7 billion and $4.5 billion for the third quarter of 2020 and 2019.
(5)
Includes $34.2 billion and $38.1 billion of structured notes and liabilities for the third quarter of 2020 and 2019.
(6)
Net interest income includes FTE adjustments of $114 million and $148 million for the third quarter of 2020 and 2019.
|
Bank of America
10
|
||||||||
| Table 7 | Year-to-Date Average Balances and Interest Rates - FTE Basis | |||||||||||||||||||||||||||||||||||||
|
Average
Balance |
Interest
Income/ Expense (1) |
Yield/
Rate |
Average
Balance |
Interest
Income/ Expense (1) |
Yield/
Rate |
|||||||||||||||||||||||||||||||||
| Nine Months Ended September 30 | ||||||||||||||||||||||||||||||||||||||
| (Dollars in millions) | 2020 | 2019 | ||||||||||||||||||||||||||||||||||||
| Earning assets | ||||||||||||||||||||||||||||||||||||||
|
Interest-bearing deposits with the Federal Reserve, non-U.S. central
banks and other banks
|
$ | 230,265 | $ | 311 | 0.18 | % | $ | 126,416 | $ | 1,454 | 1.54 | % | ||||||||||||||||||||||||||
| Time deposits placed and other short-term investments | 9,070 | 31 | 0.45 | 9,377 | 167 | 2.38 | ||||||||||||||||||||||||||||||||
|
Federal funds sold and securities borrowed or purchased under
agreements to resell
|
325,356 | 900 | 0.37 | 274,822 | 3,746 | 1.82 | ||||||||||||||||||||||||||||||||
| Trading account assets | 149,002 | 3,247 | 2.91 | 148,368 | 4,016 | 3.62 | ||||||||||||||||||||||||||||||||
| Debt securities | 491,664 | 7,477 | 2.05 | 445,104 | 9,051 | 2.71 | ||||||||||||||||||||||||||||||||
|
Loans and leases
(2)
:
|
||||||||||||||||||||||||||||||||||||||
| Residential mortgage | 239,623 | 5,678 | 3.16 | 216,744 | 5,698 | 3.51 | ||||||||||||||||||||||||||||||||
| Home equity | 39,078 | 1,013 | 3.46 | 45,735 | 1,732 | 5.06 | ||||||||||||||||||||||||||||||||
| Credit card | 87,302 | 6,690 | 10.24 | 94,333 | 7,622 | 10.80 | ||||||||||||||||||||||||||||||||
|
Direct/Indirect and other consumer
(3)
|
89,824 | 1,962 | 2.92 | 90,567 | 2,475 | 3.65 | ||||||||||||||||||||||||||||||||
| Total consumer | 455,827 | 15,343 | 4.49 | 447,379 | 17,527 | 5.23 | ||||||||||||||||||||||||||||||||
| U.S. commercial | 349,616 | 7,407 | 2.83 | 319,621 | 10,010 | 4.19 | ||||||||||||||||||||||||||||||||
| Non-U.S. commercial | 110,096 | 1,975 | 2.40 | 103,625 | 2,685 | 3.46 | ||||||||||||||||||||||||||||||||
|
Commercial real estate
(4)
|
64,062 | 1,406 | 2.93 | 61,612 | 2,109 | 4.58 | ||||||||||||||||||||||||||||||||
| Commercial lease financing | 18,872 | 427 | 3.02 | 20,932 | 550 | 3.50 | ||||||||||||||||||||||||||||||||
| Total commercial | 542,646 | 11,215 | 2.76 | 505,790 | 15,354 | 4.06 | ||||||||||||||||||||||||||||||||
| Total loans and leases | 998,473 | 26,558 | 3.55 | 953,169 | 32,881 | 4.61 | ||||||||||||||||||||||||||||||||
| Other earning assets | 81,079 | 1,986 | 3.27 | 67,431 | 3,445 | 6.83 | ||||||||||||||||||||||||||||||||
| Total earning assets | 2,284,909 | 40,510 | 2.37 | 2,024,687 | 54,760 | 3.61 | ||||||||||||||||||||||||||||||||
| Cash and due from banks | 30,663 | 25,787 | ||||||||||||||||||||||||||||||||||||
| Other assets, less allowance for loan and lease losses | 331,035 | 340,469 | ||||||||||||||||||||||||||||||||||||
| Total assets | $ | 2,646,607 | $ | 2,390,943 | ||||||||||||||||||||||||||||||||||
| Interest-bearing liabilities | ||||||||||||||||||||||||||||||||||||||
| U.S. interest-bearing deposits: | ||||||||||||||||||||||||||||||||||||||
| Savings | $ | 56,271 | $ | 4 | 0.01 | % | $ | 52,604 | $ | 4 | 0.01 | % | ||||||||||||||||||||||||||
| Demand and money market deposit accounts | 821,324 | 898 | 0.15 | 736,613 | 3,557 | 0.65 | ||||||||||||||||||||||||||||||||
| Consumer CDs and IRAs | 50,040 | 358 | 0.96 | 45,688 | 315 | 0.92 | ||||||||||||||||||||||||||||||||
| Negotiable CDs, public funds and other deposits | 68,964 | 296 | 0.57 | 66,618 | 1,129 | 2.27 | ||||||||||||||||||||||||||||||||
| Total U.S. interest-bearing deposits | 996,599 | 1,556 | 0.21 | 901,523 | 5,005 | 0.74 | ||||||||||||||||||||||||||||||||
| Non-U.S. interest-bearing deposits: | ||||||||||||||||||||||||||||||||||||||
| Banks located in non-U.S. countries | 1,604 | 3 | 0.27 | 2,044 | 16 | 1.03 | ||||||||||||||||||||||||||||||||
| Governments and official institutions | 174 | — | 0.02 | 182 | — | 0.06 | ||||||||||||||||||||||||||||||||
| Time, savings and other | 74,660 | 225 | 0.40 | 67,740 | 619 | 1.22 | ||||||||||||||||||||||||||||||||
| Total non-U.S. interest-bearing deposits | 76,438 | 228 | 0.40 | 69,966 | 635 | 1.21 | ||||||||||||||||||||||||||||||||
| Total interest-bearing deposits | 1,073,037 | 1,784 | 0.22 | 971,489 | 5,640 | 0.78 | ||||||||||||||||||||||||||||||||
|
Federal funds purchased, securities loaned or sold under agreements to repurchase, short-term borrowings and other interest-bearing liabilities
|
295,483 | 1,024 | 0.46 | 274,550 | 5,725 | 2.79 | ||||||||||||||||||||||||||||||||
| Trading account liabilities | 42,838 | 764 | 2.38 | 46,122 | 967 | 2.80 | ||||||||||||||||||||||||||||||||
| Long-term debt | 218,766 | 3,445 | 2.10 | 200,139 | 5,227 | 3.49 | ||||||||||||||||||||||||||||||||
| Total interest-bearing liabilities | 1,630,124 | 7,017 | 0.58 | 1,492,300 | 17,559 | 1.57 | ||||||||||||||||||||||||||||||||
| Noninterest-bearing sources: | ||||||||||||||||||||||||||||||||||||||
| Noninterest-bearing deposits | 524,994 | 398,689 | ||||||||||||||||||||||||||||||||||||
|
Other liabilities
(5)
|
225,427 | 231,731 | ||||||||||||||||||||||||||||||||||||
| Shareholders’ equity | 266,062 | 268,223 | ||||||||||||||||||||||||||||||||||||
| Total liabilities and shareholders’ equity | $ | 2,646,607 | $ | 2,390,943 | ||||||||||||||||||||||||||||||||||
| Net interest spread | 1.79 | % | 2.04 | % | ||||||||||||||||||||||||||||||||||
| Impact of noninterest-bearing sources | 0.17 | 0.41 | ||||||||||||||||||||||||||||||||||||
|
Net interest income/yield on earning assets
(6)
|
$ | 33,493 | 1.96 | % | $ | 37,201 | 2.45 | % | ||||||||||||||||||||||||||||||
(1)
Includes the impact of interest rate risk management contracts. For more information, see Interest Rate Risk Management for the Banking Book on page 48.
(2)
Nonperforming loans are included in the respective average loan balances. Income on these nonperforming loans is generally recognized on a cost recovery basis.
(3)
Includes non-U.S. consumer loans of $2.9 billion for both the nine months ended September 30, 2020 and 2019.
(4)
Includes U.S. commercial real estate loans of $60.4 billion and $57.0 billion, and non-U.S. commercial real estate loans of $3.7 billion and $4.6 billion for the nine months ended September 30, 2020 and 2019.
(5)
Includes $35.1 billion and $34.9 billion of structured notes and liabilities for the nine months ended September 30, 2020 and 2019.
(6)
Net interest income includes FTE adjustments of $386 million and $450 million for the nine months ended September 30, 2020 and 2019.
|
11
Bank of America
|
||||||||
Business Segment Operations
Segment Description and Basis of Presentation
We report our results of operations through four business segments:
Consumer Banking, GWIM, Global Banking
and
Global Markets
, with the remaining operations recorded in
All Other
. We manage our segments and report their results on an FTE basis. For more information, see Business Segment Operations in the MD&A of the Corporation’s 2019 Annual Report on Form 10-K.
We periodically review capital allocated to our businesses and allocate capital annually during the strategic and capital planning processes. We utilize a methodology that considers the effect of regulatory capital requirements in addition to internal risk-based capital models. Our internal risk-based capital models use a risk-adjusted methodology incorporating each segment’s credit, market, interest rate, business and operational risk components. For more information on the nature of these risks, see Managing Risk on page 23. The
capital allocated to the business segments is referred to as allocated capital. Allocated equity in the reporting units is comprised of allocated capital plus capital for the portion of goodwill and intangibles specifically assigned to the reporting unit. For more information, see
Note 7 – Goodwill and Intangible Assets
to the Consolidated Financial Statements.
For more information on our presentation of financial information on an FTE basis, see Supplemental Financial Data on page 8, and for reconciliations to consolidated total revenue, net income and period-end total assets, see
Note 17 – Business Segment Information
to the Consolidated Financial Statements.
Key Performance Indicators
We present certain key financial and nonfinancial performance indicators that management uses when evaluating segment results. We believe they are useful to investors because they provide additional information about our segments’ operational performance, customer trends and business growth.
Consumer Banking
| Deposits | Consumer Lending | Total Consumer Banking | |||||||||||||||||||||||||||||||||
| Three Months Ended September 30 | |||||||||||||||||||||||||||||||||||
| (Dollars in millions) | 2020 | 2019 | 2020 | 2019 | 2020 | 2019 | % Change | ||||||||||||||||||||||||||||
| Net interest income | $ | 3,244 | $ | 4,196 | $ | 2,646 | $ | 2,835 | $ | 5,890 | $ | 7,031 | (16) | % | |||||||||||||||||||||
| Noninterest income: | |||||||||||||||||||||||||||||||||||
| Card income | (3) | (11) | 1,224 | 1,300 | 1,221 | 1,289 | (5) | ||||||||||||||||||||||||||||
| Service charges | 836 | 1,098 | 1 | — | 837 | 1,098 | (24) | ||||||||||||||||||||||||||||
| All other income | 85 | 232 | 6 | 74 | 91 | 306 | (70) | ||||||||||||||||||||||||||||
| Total noninterest income | 918 | 1,319 | 1,231 | 1,374 | 2,149 | 2,693 | (20) | ||||||||||||||||||||||||||||
|
Total revenue, net of interest expense
|
4,162 | 5,515 | 3,877 | 4,209 | 8,039 | 9,724 | (17) | ||||||||||||||||||||||||||||
| Provision for credit losses | 59 | 84 | 420 | 833 | 479 | 917 | (48) | ||||||||||||||||||||||||||||
| Noninterest expense | 2,938 | 2,664 | 1,904 | 1,735 | 4,842 | 4,399 | 10 | ||||||||||||||||||||||||||||
| Income before income taxes | 1,165 | 2,767 | 1,553 | 1,641 | 2,718 | 4,408 | (38) | ||||||||||||||||||||||||||||
| Income tax expense | 285 | 678 | 381 | 402 | 666 | 1,080 | (38) | ||||||||||||||||||||||||||||
| Net income | $ | 880 | $ | 2,089 | $ | 1,172 | $ | 1,239 | $ | 2,052 | $ | 3,328 | (38) | ||||||||||||||||||||||
|
Effective tax rate
(1)
|
24.5 | % | 24.5 | % | |||||||||||||||||||||||||||||||
| Net interest yield | 1.52 | % | 2.37 | % | 3.35 | % | 3.76 | % | 2.61 | 3.77 | |||||||||||||||||||||||||
| Return on average allocated capital | 29 | 69 | 18 | 20 | 21 | 36 | |||||||||||||||||||||||||||||
| Efficiency ratio | 70.60 | 48.29 | 49.10 | 41.23 | 60.23 | 45.23 | |||||||||||||||||||||||||||||
| Balance Sheet | |||||||||||||||||||||||||||||||||||
| Three Months Ended September 30 | |||||||||||||||||||||||||||||||||||
| Average | 2020 | 2019 | 2020 | 2019 | 2020 | 2019 | % Change | ||||||||||||||||||||||||||||
| Total loans and leases | $ | 5,046 | $ | 5,404 | $ | 313,705 | $ | 298,428 | $ | 318,751 | $ | 303,832 | 5 | % | |||||||||||||||||||||
|
Total earning assets
(2)
|
849,189 | 703,926 | 314,079 | 299,041 | 896,867 | 739,802 | 21 | ||||||||||||||||||||||||||||
|
Total assets
(2)
|
886,406 | 735,913 | 316,107 | 308,991 | 936,112 | 781,739 | 20 | ||||||||||||||||||||||||||||
| Total deposits | 853,452 | 703,628 | 7,547 | 5,711 | 860,999 | 709,339 | 21 | ||||||||||||||||||||||||||||
| Allocated capital | 12,000 | 12,000 | 26,500 | 25,000 | 38,500 | 37,000 | 4 | ||||||||||||||||||||||||||||
(1)
Estimated at the segment level only.
(2)
In segments and businesses where the total of liabilities and equity exceeds assets, we allocate assets from
All Other
to match the segments’ and businesses’ liabilities and allocated shareholders’ equity. As a result, total earning assets and total assets of the businesses may not equal total
Consumer Banking
.
|
Bank of America
12
|
||||||||
| Deposits | Consumer Lending | Total Consumer Banking | |||||||||||||||||||||||||||||||||
| Nine Months Ended September 30 | |||||||||||||||||||||||||||||||||||
| (Dollars in millions) | 2020 | 2019 | 2020 | 2019 | 2020 | 2019 | % Change | ||||||||||||||||||||||||||||
| Net interest income | $ | 10,491 | $ | 12,867 | $ | 8,252 | $ | 8,386 | $ | 18,743 | $ | 21,253 | (12) | % | |||||||||||||||||||||
| Noninterest income: | |||||||||||||||||||||||||||||||||||
| Card income | (15) | (24) | 3,399 | 3,778 | 3,384 | 3,754 | (10) | ||||||||||||||||||||||||||||
| Service charges | 2,537 | 3,162 | 1 | 1 | 2,538 | 3,163 | (20) | ||||||||||||||||||||||||||||
| All other income | 244 | 673 | 111 | 230 | 355 | 903 | (61) | ||||||||||||||||||||||||||||
| Total noninterest income | 2,766 | 3,811 | 3,511 | 4,009 | 6,277 | 7,820 | (20) | ||||||||||||||||||||||||||||
|
Total revenue, net of interest expense
|
13,257 | 16,678 | 11,763 | 12,395 | 25,020 | 29,073 | (14) | ||||||||||||||||||||||||||||
| Provision for credit losses | 328 | 173 | 5,433 | 2,665 | 5,761 | 2,838 | 103 | ||||||||||||||||||||||||||||
| Noninterest expense | 8,532 | 7,993 | 5,539 | 5,185 | 14,071 | 13,178 | 7 | ||||||||||||||||||||||||||||
| Income before income taxes | 4,397 | 8,512 | 791 | 4,545 | 5,188 | 13,057 | (60) | ||||||||||||||||||||||||||||
| Income tax expense | 1,077 | 2,086 | 194 | 1,113 | 1,271 | 3,199 | (60) | ||||||||||||||||||||||||||||
| Net income | $ | 3,320 | $ | 6,426 | $ | 597 | $ | 3,432 | $ | 3,917 | $ | 9,858 | (60) | ||||||||||||||||||||||
|
Effective tax rate
(1)
|
24.5 | % | 24.5 | % | |||||||||||||||||||||||||||||||
| Net interest yield | 1.76 | % | 2.46 | % | 3.51 | % | 3.83 | % | 2.98 | 3.87 | |||||||||||||||||||||||||
| Return on average allocated capital | 37 | 72 | 3 | 18 | 14 | 36 | |||||||||||||||||||||||||||||
| Efficiency ratio | 64.36 | 47.92 | 47.09 | 41.84 | 56.24 | 45.33 | |||||||||||||||||||||||||||||
| Balance Sheet | |||||||||||||||||||||||||||||||||||
| Nine Months Ended September 30 | |||||||||||||||||||||||||||||||||||
| Average | 2020 | 2019 | 2020 | 2019 | 2020 | 2019 | % Change | ||||||||||||||||||||||||||||
| Total loans and leases | $ | 5,264 | $ | 5,350 | $ | 313,820 | $ | 292,188 | $ | 319,084 | $ | 297,538 | 7 | % | |||||||||||||||||||||
|
Total earning assets
(2)
|
794,370 | 699,944 | 314,275 | 292,641 | 838,792 | 735,014 | 14 | ||||||||||||||||||||||||||||
|
Total assets
(2)
|
829,505 | 731,593 | 318,214 | 302,862 | 877,866 | 776,884 | 13 | ||||||||||||||||||||||||||||
| Total deposits | 796,591 | 699,280 | 6,411 | 5,242 | 803,002 | 704,522 | 14 | ||||||||||||||||||||||||||||
| Allocated capital | 12,000 | 12,000 | 26,500 | 25,000 | 38,500 | 37,000 | 4 | ||||||||||||||||||||||||||||
| Period end |
September 30
2020 |
December 31
2019 |
September 30
2020 |
December 31
2019 |
September 30
2020 |
December 31
2019 |
% Change | ||||||||||||||||||||||||||||
| Total loans and leases | $ | 4,909 | $ | 5,467 | $ | 307,538 | $ | 311,942 | $ | 312,447 | $ | 317,409 | (2) | % | |||||||||||||||||||||
|
Total earning assets
(2)
|
859,659 | 724,573 | 307,985 | 312,684 | 906,994 | 760,174 | 19 | ||||||||||||||||||||||||||||
|
Total assets
(2)
|
897,182 | 758,459 | 310,981 | 322,717 | 947,513 | 804,093 | 18 | ||||||||||||||||||||||||||||
| Total deposits | 864,100 | 725,665 | 7,922 | 5,080 | 872,022 | 730,745 | 19 | ||||||||||||||||||||||||||||
See page 12 for footnotes.
Consumer Banking,
which is comprised of Deposits and Consumer Lending, offers a diversified range of credit, banking and investment products and services to consumers and small businesses. For more information about
Consumer Banking,
including our Deposits and Consumer Lending businesses, see Business Segment Operations in the MD&A of the Corporation’s 2019 Annual Report on Form 10-K
.
Consumer Banking Results
Three-Month Comparison
Net income for
Consumer Banking
decreased $1.3 billion to $2.1 billion primarily due to lower revenue and higher noninterest expense, partially offset by lower provision for credit losses.
Net interest income decreased $1.1 billion to $5.9 billion primarily due to lower interest rates, partially offset by the benefit of higher deposit and loan balances. Noninterest income decreased $544 million to $2.1 billion driven by a decline in service charges primarily due to higher deposit balances and lower card income due to decreased client activity, as well as lower other income due to the allocation of asset and liability management (ALM) results.
The provision for credit losses decreased $438 million to $479 million primarily driven by a release in reserves due to an improved macroeconomic outlook and lower credit card balances.
Noninterest expense increased $443 million to $4.8 billion primarily driven by incremental expense to support customers and employees during COVID-19, as well as the cost of increased client activity and continued investments for business growth, including the merchant services platform.
The return on average allocated capital was 21 percent, down from 36 percent, driven by lower net income, and to a lesser extent, an increase in allocated capital. For information on capital allocated to the business segments, see Business Segment Operations on page 12.
Nine-Month Comparison
Net income for
Consumer Banking
decreased $5.9 billion to $3.9 billion primarily due to lower revenue and a higher provision for credit losses.
Net interest income decreased $2.5 billion to $18.7 billion and noninterest income decreased $1.5 billion to $6.3 billion. The declines were primarily driven by the same factors as described in the three-month discussion.
The provision for credit losses increased $2.9 billion to $5.8 billion primarily due to the weaker economic outlook related to COVID-19. Noninterest expense increased $893 million to $14.1 billion primarily driven by the same factors as described in the three-month discussion.
The return on average allocated capital was 14 percent, down from 36 percent, driven by lower net income and, to a lesser extent, an increase in allocated capital.
|
13
Bank of America
|
||||||||
Deposits
Three-Month Comparison
Net income for Deposits decreased $1.2 billion to $880 million primarily driven by lower revenue. Net interest income declined $952 million to $3.2 billion primarily due to lower interest rates, partially offset by the benefit of growth in deposits. Noninterest income decreased $401 million to $918 million. The decline in noninterest income was primarily driven by lower service charges due to higher deposit balances and lower client activity related to the impact of COVID-19, as well as lower other income due to the allocation of ALM results.
The provision for credit losses decreased $25 million to $59 million. Noninterest expense increased $274 million to $2.9 billion driven by continued investments in the business and incremental expense to support customers and employees during the COVID-19 pandemic.
Average deposits increased $149.8 billion to $853.5 billion. The increase was driven by strong organic growth of $101.7 billion in checking and time deposits and $47.7 billion in traditional savings and money market savings.
Nine-Month Comparison
Net income for Deposits decreased $3.1 billion to $3.3 billion primarily driven by lower revenue. Net interest income declined $2.4 billion to $10.5 billion primarily due to the same factors as described in the three-month discussion. Noninterest income decreased $1.0 billion to $2.8 billion primarily due to the same factors as described in the three-month discussion.
The provision for credit losses increased $155 million to $328 million due to the weaker economic outlook related to COVID-19. Noninterest expense increased $539 million to $8.5 billion due to the same factors as described in the three-month discussion.
Average deposits increased $97.3 billion to $796.6 billion. The increase was driven by strong organic growth of $71.5 billion in checking and time deposits and $25.7 billion in traditional savings and money market savings.
The following table provides key performance indicators for Deposits. Management uses these metrics, and we believe they are useful to investors because they provide additional information to evaluate our deposit profitability and digital/mobile trends.
| Key Statistics – Deposits | |||||||||||||||||||||||
| Three Months Ended September 30 | Nine Months Ended September 30 | ||||||||||||||||||||||
| 2020 | 2019 | 2020 | 2019 | ||||||||||||||||||||
|
Total deposit spreads (excludes noninterest costs)
(1)
|
1.87 | % | 2.35 | % | 1.98 | % | 2.38 | % | |||||||||||||||
| Period End | |||||||||||||||||||||||
|
Consumer investment assets (in millions)
(2)
|
$ | 266,733 | $ | 223,199 | |||||||||||||||||||
|
Active digital banking users (units in thousands)
(3)
|
39,267 | 37,981 | |||||||||||||||||||||
|
Active mobile banking users (units in thousands)
(4)
|
30,601 | 28,703 | |||||||||||||||||||||
| Financial centers | 4,309 | 4,302 | |||||||||||||||||||||
|
ATMs
|
16,962 | 16,626 | |||||||||||||||||||||
(1)
Includes deposits held in Consumer Lending.
(2)
Includes client brokerage assets, deposit sweep balances and AUM in
Consumer Banking
.
(3)
Active digital banking users represents mobile and/or online users over the last three months.
(4)
Active mobile banking users represents mobile users over the last three months.
Consumer investment assets increased $43.5 billion driven by client flows and market performance. Active mobile banking users increased 1.9 million reflecting continuing changes in our customers’ banking preferences. We had a net increase of seven financial centers as we continued to optimize our consumer banking network.
Consumer Lending
Three-Month Comparison
Net income for Consumer Lending was $1.2 billion, a decrease of $67 million primarily due to lower revenue and higher noninterest expense, partially offset by a decline in provision for credit losses. Net interest income decreased $189 million to $2.6 billion primarily due to lower interest rates, partially offset by loan growth. Noninterest income decreased $143 million to $1.2 billion primarily driven by lower card income due to lower client activity as well as lower other income due to the allocation of ALM results.
The provision for credit losses decreased $413 million to $420 million primarily driven by a release in reserves due to an improved macroeconomic outlook and lower credit card
balances. Noninterest expense increased $169 million to $1.9 billion primarily driven by investments in the business and incremental expense to support customers and employees during the COVID-19 pandemic.
Average loans increased $15.3 billion to $313.7 billion primarily driven by an increase in residential mortgages and PPP loans, partially offset by a decline in credit cards.
Nine-Month Comparison
Net income for Consumer Lending was $597 million, a decrease of $2.8 billion primarily due to higher provision for credit losses. Net interest income declined $134 million to $8.3 billion and noninterest income decreased $498 million to $3.5 billion primarily driven by the same factors as described in the three-month discussion.
The provision for credit losses increased $2.8 billion to $5.4 billion primarily due to the weaker economic outlook related to COVID-19. Noninterest expense increased $354 million to $5.5 billion primarily driven by the same factors as described in the three-month discussion.
Average loans increased $21.6 billion to $313.8 billion primarily driven by the same factors as described in the three-month discussion.
|
Bank of America
14
|
||||||||
The following table provides key performance indicators for Consumer Lending. Management uses these metrics, and we believe they are useful to investors because they provide additional information about loan growth and profitability.
| Key Statistics – Consumer Lending | |||||||||||||||||||||||
| Three Months Ended September 30 | Nine Months Ended September 30 | ||||||||||||||||||||||
| (Dollars in millions) | 2020 | 2019 | 2020 | 2019 | |||||||||||||||||||
|
Total credit card
(1)
|
|||||||||||||||||||||||
|
Gross interest yield
(2)
|
10.16 | % | 10.85 | % | 10.21 | % | 10.80 | % | |||||||||||||||
|
Risk-adjusted margin
(3)
|
9.66 | 8.45 | 8.66 | 8.14 | |||||||||||||||||||
| New accounts (in thousands) | 487 | 1,172 | 1,991 | 3,274 | |||||||||||||||||||
| Purchase volumes | $ | 64,060 | $ | 71,096 | $ | 182,133 | $ | 204,135 | |||||||||||||||
|
Debit card purchase volumes
|
$ | 102,004 | $ | 90,942 | $ | 280,222 | $ | 267,204 | |||||||||||||||
(1)
Includes
GWIM's
credit card portfolio.
(2)
Calculated as the effective annual percentage rate divided by average loans.
(3)
Calculated as the difference between total revenue, net of interest expense, and net credit losses divided by average loans.
During the three and nine months ended September 30, 2020, total risk-adjusted margin increased 121 bps and 52 bps compared to the same periods in 2019 primarily due to a decrease in the proportion of customers who pay their balances in full each month. During the three and nine months ended September 30, 2020, total credit card purchase volumes declined $7.0 billion to $64.1 billion, and $22.0 billion to $182.1 billion compared to the same periods in 2019. The declines in credit card purchase volumes were driven by the
impact of COVID-19. While overall spending improved during the third quarter of 2020, spending for travel and entertainment remained lower compared to the same periods a year ago. During the three and nine months ended September 30, 2020, debit card purchase volumes increased $11.1 billion to $102.0 billion and $13.0 billion to $280.2 billion compared to the same periods in 2019. Debit card purchase volumes improved late in the second quarter of 2020 and continued throughout the third quarter of 2020 as businesses reopened.
|
Key Statistics – Residential Mortgage Loan Production
(1)
|
|||||||||||||||||||||||
| Three Months Ended September 30 | Nine Months Ended September 30 | ||||||||||||||||||||||
| (Dollars in millions) | 2020 | 2019 | 2020 | 2019 | |||||||||||||||||||
| Consumer Banking: | |||||||||||||||||||||||
| First mortgage | $ | 7,298 | $ | 13,622 | $ | 35,228 | $ | 34,534 | |||||||||||||||
| Home equity | 738 | 2,219 | 6,555 | 7,109 | |||||||||||||||||||
|
Total
(2)
:
|
|||||||||||||||||||||||
| First mortgage | $ | 13,360 | $ | 20,664 | $ | 55,422 | $ | 50,353 | |||||||||||||||
| Home equity | 984 | 2,539 | 7,691 | 8,132 | |||||||||||||||||||
(1)
The loan production amounts represent the unpaid principal balance of loans and, in the case of home equity, the principal amount of the total line of credit.
(2)
In addition to loan production in
Consumer Banking
, there is also first mortgage and home equity loan production in
GWIM.
First mortgage loan originations in
Consumer Banking
and for the total Corporation decreased $6.3 billion and $7.3 billion for the three months ended September 30, 2020 compared to the same period in 2019 due to a decline in applications. First mortgage loan originations in
Consumer Banking
and for the total Corporation increased $694 million and $5.1 billion for the nine months ended September 30, 2020 compared to the same period in 2019 primarily driven by an increase in applications
during the first quarter of 2020 due to a lower interest rate environment.
Home equity production in
Consumer Banking
and for the total Corporation decreased $1.5 billion and $1.6 billion for the three months ended September 30, 2020 and $554 million and $441 million for the nine months ended September 30, 2020 primarily driven by a decline in applications.
|
15
Bank of America
|
||||||||
Global Wealth & Investment Management
| Three Months Ended September 30 | Nine Months Ended September 30 | |||||||||||||||||||||||||||||||||||||
| (Dollars in millions) | 2020 | 2019 | % Change | 2020 | 2019 | % Change | ||||||||||||||||||||||||||||||||
| Net interest income | $ | 1,237 | $ | 1,609 | (23 | %) | $ | 4,186 | $ | 4,917 | (15) | % | ||||||||||||||||||||||||||
| Noninterest income: | ||||||||||||||||||||||||||||||||||||||
| Investment and brokerage services | 3,105 | 3,001 | 3 | 9,081 | 8,805 | 3 | ||||||||||||||||||||||||||||||||
| All other income | 204 | 294 | (31) | 640 | 903 | (29) | ||||||||||||||||||||||||||||||||
| Total noninterest income | 3,309 | 3,295 | — | 9,721 | 9,708 | — | ||||||||||||||||||||||||||||||||
| Total revenue, net of interest expense | 4,546 | 4,904 | (7) | 13,907 | 14,625 | (5) | ||||||||||||||||||||||||||||||||
| Provision for credit losses | 24 | 37 | (35) | 349 | 63 | n/m | ||||||||||||||||||||||||||||||||
| Noninterest expense | 3,530 | 3,414 | 3 | 10,593 | 10,302 | 3 | ||||||||||||||||||||||||||||||||
| Income before income taxes | 992 | 1,453 | (32) | 2,965 | 4,260 | (30) | ||||||||||||||||||||||||||||||||
| Income tax expense | 243 | 356 | (32) | 726 | 1,044 | (30) | ||||||||||||||||||||||||||||||||
| Net income | $ | 749 | $ | 1,097 | (32) | $ | 2,239 | $ | 3,216 | (30) | ||||||||||||||||||||||||||||
| Effective tax rate | 24.5 | % | 24.5 | % | 24.5 | % | 24.5 | % | ||||||||||||||||||||||||||||||
| Net interest yield | 1.53 | 2.30 | 1.81 | 2.35 | ||||||||||||||||||||||||||||||||||
| Return on average allocated capital | 20 | 30 | 20 | 30 | ||||||||||||||||||||||||||||||||||
| Efficiency ratio | 77.63 | 69.61 | 76.17 | 70.44 | ||||||||||||||||||||||||||||||||||
| Balance Sheet | ||||||||||||||||||||||||||||||||||||||
| Three Months Ended September 30 | Nine Months Ended September 30 | |||||||||||||||||||||||||||||||||||||
| Average | 2020 | 2019 | % Change | 2020 | 2019 | % Change | ||||||||||||||||||||||||||||||||
| Total loans and leases | $ | 185,587 | $ | 170,414 | 9 | % | $ | 182,138 | $ | 167,069 | 9 | % | ||||||||||||||||||||||||||
| Total earning assets | 321,410 | 277,343 | 16 | 309,240 | 279,784 | 11 | ||||||||||||||||||||||||||||||||
| Total assets | 333,794 | 289,460 | 15 | 321,565 | 292,114 | 10 | ||||||||||||||||||||||||||||||||
| Total deposits | 291,845 | 254,460 | 15 | 280,828 | 256,720 | 9 | ||||||||||||||||||||||||||||||||
| Allocated capital | 15,000 | 14,500 | 3 | 15,000 | 14,500 | 3 | ||||||||||||||||||||||||||||||||
| Period end |
September 30
2020 |
December 31
2019 |
% Change | |||||||||||||||||||||||||||||||||||
| Total loans and leases | $ | 187,211 | $ | 176,600 | 6 | % | ||||||||||||||||||||||||||||||||
| Total earning assets | 324,889 | 287,201 | 13 | |||||||||||||||||||||||||||||||||||
| Total assets | 337,576 | 299,770 | 13 | |||||||||||||||||||||||||||||||||||
| Total deposits | 295,893 | 263,113 | 12 | |||||||||||||||||||||||||||||||||||
n/m = not meaningful
GWIM
consists of two primary businesses: Merrill Lynch Global Wealth Management (MLGWM) and
Bank of America Private Bank. For more information about
GWIM
, see Business Segment Operations in the MD&A of the Corporation’s 2019 Annual Report on Form 10-K.
Three-Month Comparison
Net income for
GWIM
decreased $348 million to $749 million primarily due to lower revenue and higher noninterest expense. The operating margin was 22 percent compared to 30 percent a year ago.
Net interest income decreased $372 million to $1.2 billion due to the impact of lower interest rates, partially offset by the benefit of strong deposit and loan growth.
Noninterest income, which primarily includes investment and brokerage services income, remained relatively unchanged at $3.3 billion, as the benefits of higher market valuations and positive AUM flows were offset by declines in AUM pricing as well as lower other income due to the allocation of ALM results.
The provision for credit losses decreased $13 million to $24 million. Noninterest expense increased $116 million to $3.5 billion primarily driven by higher revenue-related incentives and investments in primary sales professionals.
The return on average allocated capital was 20 percent, down from 30 percent, due to lower net income and, to a lesser extent, a small increase in allocated capital.
Average loans increased $15.2 billion to $185.6 billion primarily driven by residential mortgage and custom lending. Average deposits increased $37.4 billion to $291.8 billion primarily driven by inflows resulting from client responses to market volatility and lower spending.
MLGWM revenue of $3.7 billion decreased eight percent primarily driven by the impact of lower interest rates, partially offset by the benefits of higher market valuations and positive AUM flows.
Bank of America Private Bank revenue of $798 million decreased six percent primarily driven by the impact of lower interest rates.
Nine-Month Comparison
Net income for
GWIM
decreased $977 million to $2.2 billion primarily due to lower revenue, higher noninterest expense and higher provision for credit losses. The operating margin was 21 percent compared to 29 percent a year ago.
Net interest income decreased $731 million to $4.2 billion due to the same factors as described in the three-month discussion.
Noninterest income, which primarily includes investment and brokerage services income, remained relatively unchanged at $9.7 billion due to the same factors as described in the three-month discussion.
|
Bank of America
16
|
||||||||
The provision for credit losses increased $286 million to $349 million primarily due to the weaker economic outlook related to COVID-19. Noninterest expense increased $291 million to $10.6 billion, primarily due to investments for business growth along with higher revenue-related incentives.
The return on average allocated capital was 20 percent, down from 30 percent, due to lower net income and, to a lesser extent, a small increase in allocated capital.
Average loans increased $15.1 billion to $182.1 billion, and
average deposits increased $24.1 billion to $280.8 billion due to the same factors as described in the three-month discussion.
MLGWM revenue of $11.4 billion decreased five percent primarily driven by the impact of lower interest rates and AUM pricing, partially offset by higher market valuations and positive AUM flows.
Bank of America Private Bank revenue of $2.5 billion decreased four percent primarily driven by the impact of lower interest rates.
|
Key Indicators and Metrics
|
|||||||||||||||||||||||
| Three Months Ended September 30 | Nine Months Ended September 30 | ||||||||||||||||||||||
| (Dollars in millions, except as noted) | 2020 | 2019 | 2020 | 2019 | |||||||||||||||||||
| Revenue by Business | |||||||||||||||||||||||
| Merrill Lynch Global Wealth Management | $ | 3,748 | $ | 4,053 | $ | 11,446 | $ | 12,065 | |||||||||||||||
|
Bank of America Private Bank
|
798 | 851 | 2,461 | 2,559 | |||||||||||||||||||
| Total revenue, net of interest expense | $ | 4,546 | $ | 4,904 | $ | 13,907 | $ | 14,624 | |||||||||||||||
| Client Balances by Business, at period end | |||||||||||||||||||||||
| Merrill Lynch Global Wealth Management | $ | 2,570,252 | $ | 2,443,614 | |||||||||||||||||||
|
Bank of America Private Bank
|
496,369 | 462,347 | |||||||||||||||||||||
| Total client balances | $ | 3,066,621 | $ | 2,905,961 | |||||||||||||||||||
| Client Balances by Type, at period end | |||||||||||||||||||||||
| Assets under management | $ | 1,286,145 | $ | 1,212,120 | |||||||||||||||||||
| Brokerage and other assets | 1,344,538 | 1,305,926 | |||||||||||||||||||||
| Deposits | 295,893 | 252,466 | |||||||||||||||||||||
|
Loans and leases
(1)
|
189,952 | 175,579 | |||||||||||||||||||||
| Less: Managed deposits in assets under management | (49,907) | (40,130) | |||||||||||||||||||||
| Total client balances | $ | 3,066,621 | $ | 2,905,961 | |||||||||||||||||||
| Assets Under Management Rollforward | |||||||||||||||||||||||
| Assets under management, beginning of period | $ | 1,219,748 | $ | 1,203,783 | $ | 1,275,555 | $ | 1,072,234 | |||||||||||||||
| Net client flows | 1,385 | 5,529 | 11,993 | 16,721 | |||||||||||||||||||
|
Market valuation/other
|
65,012 | 2,808 | (1,403) | 123,165 | |||||||||||||||||||
| Total assets under management, end of period | $ | 1,286,145 | $ | 1,212,120 | $ | 1,286,145 | $ | 1,212,120 | |||||||||||||||
| Associates, at period end | |||||||||||||||||||||||
| Number of financial advisors | 17,760 | 17,657 | |||||||||||||||||||||
| Total wealth advisors, including financial advisors | 19,673 | 19,672 | |||||||||||||||||||||
| Total primary sales professionals, including financial advisors and wealth advisors | 21,271 | 20,775 | |||||||||||||||||||||
| Merrill Lynch Global Wealth Management Metric | |||||||||||||||||||||||
|
Financial advisor productivity
(2)
(in thousands)
|
$ | 1,125 | $ | 1,096 | $ | 1,111 | $ | 1,073 | |||||||||||||||
| Bank of America Private Bank Metric, at period end | |||||||||||||||||||||||
| Primary sales professionals | 1,770 | 1,811 | |||||||||||||||||||||
(1)
Includes margin receivables which are classified in customer and other receivables on the Consolidated Balance Sheet.
(2)
For a definition, see Key Metrics on page 104.
Client Balances
Client balances increased $160.7 billion, or six percent, to $3.1 trillion at September 30, 2020 compared to September 30, 2019. The increase in client balances was primarily due to higher market valuations and positive client flows.
|
17
Bank of America
|
||||||||
Global Banking
| Three Months Ended September 30 | Nine Months Ended September 30 | |||||||||||||||||||||||||||||||||||||
| (Dollars in millions) | 2020 | 2019 | % Change | 2020 | 2019 | % Change | ||||||||||||||||||||||||||||||||
| Net interest income | $ | 2,028 | $ | 2,617 | (23 | %) | $ | 7,003 | $ | 8,116 | (14) | % | ||||||||||||||||||||||||||
| Noninterest income: | ||||||||||||||||||||||||||||||||||||||
| Service charges | 845 | 763 | 11 | 2,379 | 2,225 | 7 | ||||||||||||||||||||||||||||||||
| Investment banking fees | 970 | 902 | 8 | 2,912 | 2,328 | 25 | ||||||||||||||||||||||||||||||||
| All other income | 674 | 930 | (28) | 1,914 | 2,673 | (28) | ||||||||||||||||||||||||||||||||
| Total noninterest income | 2,489 | 2,595 | (4) | 7,205 | 7,226 | — | ||||||||||||||||||||||||||||||||
| Total revenue, net of interest expense | 4,517 | 5,212 | (13) | 14,208 | 15,342 | (7) | ||||||||||||||||||||||||||||||||
| Provision for credit losses | 883 | 120 | n/m | 4,849 | 356 | n/m | ||||||||||||||||||||||||||||||||
| Noninterest expense | 2,365 | 2,219 | 7 | 6,910 | 6,697 | 3 | ||||||||||||||||||||||||||||||||
| Income before income taxes | 1,269 | 2,873 | (56) | 2,449 | 8,289 | (70) | ||||||||||||||||||||||||||||||||
| Income tax expense | 343 | 776 | (56) | 661 | 2,238 | (70) | ||||||||||||||||||||||||||||||||
| Net income | $ | 926 | $ | 2,097 | (56) | $ | 1,788 | $ | 6,051 | (70) | ||||||||||||||||||||||||||||
| Effective tax rate | 27.0 | % | 27.0 | % | 27.0 | % | 27.0 | % | ||||||||||||||||||||||||||||||
| Net interest yield | 1.61 | 2.69 | 1.96 | 2.84 | ||||||||||||||||||||||||||||||||||
| Return on average allocated capital | 9 | 20 | 6 | 20 | ||||||||||||||||||||||||||||||||||
| Efficiency ratio | 52.36 | 42.58 | 48.63 | 43.65 | ||||||||||||||||||||||||||||||||||
| Balance Sheet | ||||||||||||||||||||||||||||||||||||||
| Three Months Ended September 30 | Nine Months Ended September 30 | |||||||||||||||||||||||||||||||||||||
| Average | 2020 | 2019 | % Change | 2020 | 2019 | % Change | ||||||||||||||||||||||||||||||||
|
Total loans and leases
|
$ | 373,118 | $ | 377,109 | (1 | %) | $ | 394,331 | $ | 373,275 | 6 | % | ||||||||||||||||||||||||||
| Total earning assets | 501,572 | 385,999 | 30 | 477,606 | 382,711 | 25 | ||||||||||||||||||||||||||||||||
| Total assets | 557,889 | 441,186 | 26 | 534,061 | 437,570 | 22 | ||||||||||||||||||||||||||||||||
| Total deposits | 471,288 | 360,457 | 31 | 449,273 | 357,413 | 26 | ||||||||||||||||||||||||||||||||
| Allocated capital | 42,500 | 41,000 | 4 | 42,500 | 41,000 | 4 | ||||||||||||||||||||||||||||||||
| Period end |
September 30
2020 |
December 31
2019 |
% Change | |||||||||||||||||||||||||||||||||||
| Total loans and leases | $ | 356,919 | $ | 379,268 | (6) | % | ||||||||||||||||||||||||||||||||
| Total earning assets | 496,825 | 407,180 | 22 | |||||||||||||||||||||||||||||||||||
| Total assets | 553,776 | 464,032 | 19 | |||||||||||||||||||||||||||||||||||
| Total deposits | 465,399 | 383,180 | 21 | |||||||||||||||||||||||||||||||||||
n/m = not meaningful
Global Banking
, which includes Global Corporate Banking, Global Commercial Banking, Business Banking and Global Investment Banking, provides a wide range of lending-related products and services, integrated working capital management and treasury solutions, and underwriting and advisory services through our network of offices and client relationship teams. For more information about
Global Banking, s
ee Business Segment Operations in the MD&A of the Corporation’s 2019 Annual Report on Form 10-K.
Three-Month Comparison
Net income for
Global Banking
decreased $1.2 billion to $926 million primarily driven by higher provision for credit losses and lower revenue.
Revenue decreased $695 million to $4.5 billion driven by lower net interest income and lower noninterest income. Net interest income decreased $589 million to $2.0 billion primarily due to lower interest rates, partially offset by deposit growth and higher credit spreads.
Noninterest income decreased $106 million to $2.5 billion primarily due to lower leasing-related revenue and the allocation of ALM results, partially offset by higher investment banking fees and service charges.
The provision for credit losses increased $763 million to $883 million primarily due to a reserve build for industries that are more heavily impacted by COVID-19, such as travel and entertainment. Noninterest expense increased $146 million to $2.4 billion due to continued investments in the business, including the merchant services platform.
The return on average allocated capital was nine percent in 2020 compared to 20 percent in 2019, due to lower net income, and to a lesser extent, an increase in allocated capital. For information on capital allocated to the business segments, see Business Segment Operations on page 12.
Nine-Month Comparison
Net income for
Global Banking
decreased $4.3 billion to $1.8 billion primarily driven by higher provision for credit losses as well as lower revenue.
Revenue decreased $1.1 billion to $14.2 billion driven by lower net interest income. Net interest income decreased $1.1 billion to $7.0 billion primarily driven by lower interest rates, partially offset by higher loan and deposit balances.
Noninterest income of $7.2 billion remained relatively unchanged as lower valuation adjustments on the fair value option loan portfolio and the allocation of ALM results were largely offset by higher investment banking fees.
|
Bank of America
18
|
||||||||
The provision for credit losses increased $4.5 billion to $4.8 billion primarily due to the weaker economic outlook related to COVID-19. Noninterest expense increased $213 million primarily due to continued investments in the business, partially offset by lower revenue-related incentives and COVID-19 related costs.
The return on average allocated capital was six percent in 2020 compared to 20 percent in 2019, due to lower net income and, to a lesser extent, an increase in allocated capital. For
information on capital allocated to the business segments, see Business Segment Operations on page 12.
Global Corporate, Global Commercial and Business Banking
The table below and following discussion present a summary of the results, which exclude certain investment banking, merchant services and PPP activities in
Global Banking
.
| Global Corporate, Global Commercial and Business Banking | ||||||||||||||||||||||||||||||||||||||||||||||||||
| Global Corporate Banking | Global Commercial Banking | Business Banking | Total | |||||||||||||||||||||||||||||||||||||||||||||||
| Three Months Ended September 30 | ||||||||||||||||||||||||||||||||||||||||||||||||||
| (Dollars in millions) | 2020 | 2019 | 2020 | 2019 | 2020 | 2019 | 2020 | 2019 | ||||||||||||||||||||||||||||||||||||||||||
| Revenue | ||||||||||||||||||||||||||||||||||||||||||||||||||
| Business Lending | $ | 791 | $ | 1,024 | $ | 953 | $ | 1,020 | $ | 59 | $ | 91 | $ | 1,803 | $ | 2,135 | ||||||||||||||||||||||||||||||||||
| Global Transaction Services | 658 | 967 | 745 | 862 | 209 | 267 | 1,612 | 2,096 | ||||||||||||||||||||||||||||||||||||||||||
|
Total revenue, net of interest expense
|
$ | 1,449 | $ | 1,991 | $ | 1,698 | $ | 1,882 | $ | 268 | $ | 358 | $ | 3,415 | $ | 4,231 | ||||||||||||||||||||||||||||||||||
| Balance Sheet | ||||||||||||||||||||||||||||||||||||||||||||||||||
| Average | ||||||||||||||||||||||||||||||||||||||||||||||||||
| Total loans and leases | $ | 174,235 | $ | 179,191 | $ | 175,536 | $ | 183,031 | $ | 13,972 | $ | 14,868 | $ | 363,743 | $ | 377,090 | ||||||||||||||||||||||||||||||||||
| Total deposits | 218,593 | 175,914 | 201,523 | 143,835 | 50,946 | 40,707 | 471,062 | 360,456 | ||||||||||||||||||||||||||||||||||||||||||
| Global Corporate Banking | Global Commercial Banking | Business Banking | Total | |||||||||||||||||||||||||||||||||||||||||||||||
| Nine Months Ended September 30 | ||||||||||||||||||||||||||||||||||||||||||||||||||
| (Dollars in millions) | 2020 | 2019 | 2020 | 2019 | 2020 | 2019 | 2020 | 2019 | ||||||||||||||||||||||||||||||||||||||||||
| Revenue | ||||||||||||||||||||||||||||||||||||||||||||||||||
| Business Lending | $ | 2,658 | $ | 2,992 | $ | 2,815 | $ | 3,100 | $ | 207 | $ | 275 | $ | 5,680 | $ | 6,367 | ||||||||||||||||||||||||||||||||||
| Global Transaction Services | 2,314 | 2,979 | 2,432 | 2,642 | 682 | 800 | 5,428 | 6,421 | ||||||||||||||||||||||||||||||||||||||||||
|
Total revenue, net of interest expense
|
$ | 4,972 | $ | 5,971 | $ | 5,247 | $ | 5,742 | $ | 889 | $ | 1,075 | $ | 11,108 | $ | 12,788 | ||||||||||||||||||||||||||||||||||
| Balance Sheet | ||||||||||||||||||||||||||||||||||||||||||||||||||
| Average | ||||||||||||||||||||||||||||||||||||||||||||||||||
|
Total loans and leases
|
$ | 186,220 | $ | 177,071 | $ | 188,147 | $ | 181,091 | $ | 14,721 | $ | 15,108 | $ | 389,088 | $ | 373,270 | ||||||||||||||||||||||||||||||||||
| Total deposits | 214,327 | 175,239 | 188,271 | 142,665 | 46,599 | 39,522 | 449,197 | 357,426 | ||||||||||||||||||||||||||||||||||||||||||
| Period end | ||||||||||||||||||||||||||||||||||||||||||||||||||
| Total loans and leases | $ | 165,498 | $ | 179,291 | $ | 168,385 | $ | 183,314 | $ | 13,665 | $ | 14,919 | $ | 347,548 | $ | 377,524 | ||||||||||||||||||||||||||||||||||
| Total deposits | 212,564 | 183,678 | 200,591 | 147,119 | 51,889 | 41,089 | 465,044 | 371,886 | ||||||||||||||||||||||||||||||||||||||||||
Business Lending revenue decreased $332 million and $687 million for the three and nine months ended September 30, 2020 compared to the same periods in 2019. The decrease was primarily driven by lower interest rates.
Global Transaction Services revenue decreased $484 million and $993 million for the three and nine months ended September 30, 2020 driven by the allocation of ALM results, partially offset by the impact of higher deposit balances.
Average loans and leases decreased four percent for the three months ended September 30, 2020 compared to the same period in 2019 driven by client paydowns. Average loans and leases increased four percent for the nine months ended September 30, 2020 driven by growth in the commercial and industrial loan portfolio. Average deposits increased 31 percent and 26 percent for the three and nine months ended September 30, 2020 primarily due to client responses to market volatility, government stimulus and placement of credit draws.
Global Investment Banking
Client teams and product specialists underwrite and distribute debt, equity and loan products, and provide advisory services and tailored risk management solutions. The economics of certain investment banking and underwriting activities are shared primarily between
Global Banking
and
Global Markets
under an internal revenue-sharing arrangement.
Global Banking
originates certain deal-related transactions with our corporate and commercial clients that are executed and distributed by
Global Markets
. To provide a complete discussion of our consolidated investment banking fees, the following table presents total Corporation investment banking fees and the portion attributable to
Global Banking.
|
19
Bank of America
|
||||||||
| Investment Banking Fees | |||||||||||||||||||||||||||||||||||||||||||||||
| Global Banking | Total Corporation | Global Banking | Total Corporation | ||||||||||||||||||||||||||||||||||||||||||||
| Three Months Ended September 30 | Nine Months Ended September 30 | ||||||||||||||||||||||||||||||||||||||||||||||
| (Dollars in millions) | 2020 | 2019 | 2020 | 2019 | 2020 | 2019 | 2020 | 2019 | |||||||||||||||||||||||||||||||||||||||
| Products | |||||||||||||||||||||||||||||||||||||||||||||||
| Advisory | $ | 356 | $ | 427 | $ | 397 | $ | 452 | $ | 948 | $ | 984 | $ | 1,072 | $ | 1,083 | |||||||||||||||||||||||||||||||
| Debt issuance | 320 | 356 | 740 | 816 | 1,247 | 1,007 | 2,725 | 2,310 | |||||||||||||||||||||||||||||||||||||||
| Equity issuance | 294 | 119 | 664 | 308 | 717 | 337 | 1,687 | 937 | |||||||||||||||||||||||||||||||||||||||
|
Gross investment banking fees
|
970 | 902 | 1,801 | 1,576 | 2,912 | 2,328 | 5,484 | 4,330 | |||||||||||||||||||||||||||||||||||||||
| Self-led deals | (13) | (11) | (32) | (43) | (73) | (54) | (168) | (162) | |||||||||||||||||||||||||||||||||||||||
|
Total investment banking fees
|
$ | 957 | $ | 891 | $ | 1,769 | $ | 1,533 | $ | 2,839 | $ | 2,274 | $ | 5,316 | $ | 4,168 | |||||||||||||||||||||||||||||||
Total Corporation investment banking fees, excluding self-led deals, of $1.8 billion and $5.3 billion, which are primarily included within
Global Banking
and
Global Markets
, increased 15 percent and 28 percent for the three and nine months ended September 30, 2020 compared to the same periods in 2019 primarily driven by higher equity issuance fees.
Global Markets
| Three Months Ended September 30 | Nine Months Ended September 30 | |||||||||||||||||||||||||||||||||||||
| (Dollars in millions) | 2020 | 2019 | % Change | 2020 | 2019 | % Change | ||||||||||||||||||||||||||||||||
| Net interest income | $ | 1,108 | $ | 1,016 | 9 | % | $ | 3,558 | $ | 2,780 | 28 | % | ||||||||||||||||||||||||||
| Noninterest income: | ||||||||||||||||||||||||||||||||||||||
| Investment and brokerage services | 440 | 419 | 5 | 1,487 | 1,296 | 15 | ||||||||||||||||||||||||||||||||
| Investment banking fees | 739 | 585 | 26 | 2,280 | 1,707 | 34 | ||||||||||||||||||||||||||||||||
| Market making and similar activities | 1,726 | 1,580 | 9 | 7,059 | 5,623 | 26 | ||||||||||||||||||||||||||||||||
| All other income | 270 | 263 | 3 | 475 | 783 | (39) | ||||||||||||||||||||||||||||||||
| Total noninterest income | 3,175 | 2,847 | 12 | 11,301 | 9,409 | 20 | ||||||||||||||||||||||||||||||||
| Total revenue, net of interest expense | 4,283 | 3,863 | 11 | 14,859 | 12,189 | 22 | ||||||||||||||||||||||||||||||||
| Provision for credit losses | 21 | — | n/m | 233 | (18) | n/m | ||||||||||||||||||||||||||||||||
| Noninterest expense | 3,104 | 2,677 | 16 | 8,598 | 8,109 | 6 | ||||||||||||||||||||||||||||||||
| Income before income taxes | 1,158 | 1,186 | (2) | 6,028 | 4,098 | 47 | ||||||||||||||||||||||||||||||||
| Income tax expense | 301 | 338 | (11) | 1,567 | 1,168 | 34 | ||||||||||||||||||||||||||||||||
| Net income | $ | 857 | $ | 848 | 1 | $ | 4,461 | $ | 2,930 | 52 | ||||||||||||||||||||||||||||
| Effective tax rate | 26.0 | % | 28.5 | % | 26.0 | % | 28.5 | % | ||||||||||||||||||||||||||||||
| Return on average allocated capital | 9 | 10 | 17 | 11 | ||||||||||||||||||||||||||||||||||
| Efficiency ratio | 72.42 | 69.31 | 57.86 | 66.53 | ||||||||||||||||||||||||||||||||||
| Balance Sheet | ||||||||||||||||||||||||||||||||||||||
| Three Months Ended September 30 | Nine Months Ended September 30 | |||||||||||||||||||||||||||||||||||||
| Average | 2020 | 2019 | % Change | 2020 | 2019 | % Change | ||||||||||||||||||||||||||||||||
| Trading-related assets: | ||||||||||||||||||||||||||||||||||||||
| Trading account securities | $ | 251,735 | $ | 261,182 | (4) | % | $ | 241,753 | $ | 246,077 | (2) | % | ||||||||||||||||||||||||||
| Reverse repurchases | 100,395 | 110,907 | (9) | 106,968 | 117,087 | (9) | ||||||||||||||||||||||||||||||||
| Securities borrowed | 86,508 | 80,641 | 7 | 88,734 | 82,772 | 7 | ||||||||||||||||||||||||||||||||
| Derivative assets | 46,676 | 46,066 | 1 | 47,687 | 43,922 | 9 | ||||||||||||||||||||||||||||||||
| Total trading-related assets | 485,314 | 498,796 | (3) | 485,142 | 489,858 | (1) | ||||||||||||||||||||||||||||||||
| Total loans and leases | 72,319 | 71,589 | 1 | 72,702 | 70,757 | 3 | ||||||||||||||||||||||||||||||||
| Total earning assets | 476,182 | 476,919 | — | 485,448 | 474,481 | 2 | ||||||||||||||||||||||||||||||||
| Total assets | 680,983 | 687,398 | (1) | 685,685 | 679,040 | 1 | ||||||||||||||||||||||||||||||||
| Total deposits | 56,475 | 30,155 | 87 | 45,002 | 30,878 | 46 | ||||||||||||||||||||||||||||||||
| Allocated capital | 36,000 | 35,000 | 3 | 36,000 | 35,000 | 3 | ||||||||||||||||||||||||||||||||
| Period end |
September 30
2020 |
December 31
2019 |
% Change | |||||||||||||||||||||||||||||||||||
| Total trading-related assets | $ | 477,552 | $ | 452,499 | 6 | % | ||||||||||||||||||||||||||||||||
| Total loans and leases | 75,475 | 72,993 | 3 | |||||||||||||||||||||||||||||||||||
| Total earning assets | 461,855 | 471,701 | (2) | |||||||||||||||||||||||||||||||||||
| Total assets | 676,242 | 641,809 | 5 | |||||||||||||||||||||||||||||||||||
| Total deposits | 56,727 | 34,676 | 64 | |||||||||||||||||||||||||||||||||||
n/m = not meaningful
Global Markets
offers sales and trading services and research services to institutional clients across fixed-income, credit, currency, commodity and equity businesses.
Global Markets
product coverage includes securities and derivative products in both the primary and secondary markets. For more information
about
Global Markets,
see Business Segment Operations in the MD&A of the Corporation’s 2019 Annual Report on Form 10-K.
The following explanations for current period-over-period changes for
Global Markets
, including those disclosed under Sales and Trading Revenue, are the same for amounts including
|
Bank of America
20
|
||||||||
and excluding net DVA. Amounts excluding net DVA are a non-GAAP financial measure. For more information on net DVA, see Supplemental Financial Data on page 8.
Three-Month Comparison
Net income for
Global Markets
remained relatively unchanged at $857 million. Net DVA losses were $116 million compared to losses of $15 million in the prior-year period. Excluding net DVA, net income increased $86 million to $945 million. These increases were primarily driven by higher revenue, partially offset by higher noninterest expense.
Revenue increased $420 million to $4.3 billion primarily driven by higher sales and trading revenue, investment banking fees and card income. Sales and trading revenue increased $16 million, and excluding net DVA, increased $117 million driven by increased client activity in Asian equities and stronger performance in mortgage and foreign exchange products.
Noninterest expense increased $427 million to $3.1 billion driven by higher activity-based expenses for both card and trading.
Average total assets decreased $6.4 billion to $681.0 billion driven by increased balance sheet efficiency in securities financing matched-book activity and lower levels of inventory in FICC, partially offset by higher client balances in Global Equities.
The return on average allocated capital was nine percent, down from 10 percent, primarily due to an increase in allocated capital. For more information on capital allocated to the business segments, see Business Segment Operations on page 12.
Nine-Month Comparison
Net income for
Global Markets
increased $1.5 billion to $4.5 billion. Net DVA losses were $77 million compared to losses of $136 million in the prior-year period. Excluding net DVA, net income increased $1.5 billion to $4.5 billion. These increases
were primarily driven by an increase in revenue, partially offset by higher noninterest expense and provision for credit losses.
Revenue increased $2.7 billion to $14.9 billion primarily driven by higher sales and trading revenue and investment banking fees. Sales and trading revenue increased $2.1 billion, and excluding net DVA, increased $2.0 billion. These increases were driven by higher revenue across FICC and Equities.
The provision for credit losses increased $251 million primarily due to the weaker economic outlook related to COVID-19. Noninterest expense increased $489 million to $8.6 billion due to the same factors as described in the three-month discussion.
Average total assets increased $6.6 billion to $685.7 billion primarily due to increased levels of inventory in FICC to facilitate expected client demand. Period-end total assets increased $34.4 billion since December 31, 2019 to $676.2 billion primarily driven by Equities due to increased hedging of client activity with stock positions relative to derivative transactions at year end.
The return on average allocated capital was 17 percent, up from 11 percent, reflecting higher net income, partially offset by an increase in allocated capital.
Sales and Trading Revenue
For a description of sales and trading revenue, see Business Segment Operations in the MD&A of the Corporation’s 2019 Annual Report on Form 10-K. The following table and related discussion present sales and trading revenue, substantially all of which is in
Global Markets,
with the remainder in
Global Banking
. In addition, the following table and related discussion present sales and trading revenue, excluding net DVA, which is a non-GAAP financial measure. For more information on net DVA, see Supplemental Financial Data on page 8.
|
Sales and Trading Revenue
(1, 2, 3)
|
|||||||||||||||||||||||
| Three Months Ended September 30 | Nine Months Ended September 30 | ||||||||||||||||||||||
| (Dollars in millions) | 2020 | 2019 | 2020 | 2019 | |||||||||||||||||||
|
Sales and trading revenue
(2)
|
|||||||||||||||||||||||
|
Fixed income, currencies and commodities
|
$ | 2,019 | $ | 2,056 | $ | 7,905 | $ | 6,435 | |||||||||||||||
| Equities | 1,205 | 1,152 | 4,105 | 3,478 | |||||||||||||||||||
| Total sales and trading revenue | $ | 3,224 | $ | 3,208 | $ | 12,010 | $ | 9,913 | |||||||||||||||
|
Sales and trading revenue, excluding net DVA
(4)
|
|||||||||||||||||||||||
|
Fixed income, currencies and commodities
|
$ | 2,126 | $ | 2,074 | $ | 7,983 | $ | 6,562 | |||||||||||||||
| Equities | 1,214 | 1,149 | 4,104 | 3,487 | |||||||||||||||||||
|
Total sales and trading revenue, excluding net DVA
|
$ | 3,340 | $ | 3,223 | $ | 12,087 | $ | 10,049 | |||||||||||||||
(1)
For more information on sales and trading revenue, see
Note 3 – Derivatives
to the Consolidated Financial Statements.
(2)
Includes FTE adjustments of $38 million and $138 million for the three and nine months ended September 30, 2020 compared to $52 million and $131 million for the same periods in 2019.
(3)
Includes
Global Banking
sales and trading revenue of $86 million and $378 million for the three and nine months ended September 30, 2020 compared to $152 million and $399 million for the same periods in 2019.
(4)
FICC and Equities sales and trading revenue, excluding net DVA, is a non-GAAP financial measure. FICC net DVA losses were $107 million and $78 million for the three and nine months ended September 30, 2020 compared to losses of $18 million and $127 million for the same periods in 2019. Equities net DVA losses were $9 million and gains of $1 million for the three and nine months ended September 30, 2020 compared to gains of $3 million and losses of $9 million for the same periods in 2019.
Three-Month Comparison
FICC revenue increased $52 million due to stronger performance in mortgages and foreign exchange products. Equities revenue increased $65 million driven by increased client activity in Asia.
Nine-Month Comparison
FICC revenue increased $1.4 billion driven by increased client activity and improved market-making conditions across macro products, partially offset by weaker performances in credit-sensitive businesses. Equities revenue increased $617 million driven by increased client activity and a strong trading performance in a more volatile market environment.
|
21
Bank of America
|
||||||||
All Other
| Three Months Ended September 30 | Nine Months Ended September 30 | |||||||||||||||||||||||||||||||||||||
| (Dollars in millions) | 2020 | 2019 | % Change | 2020 | 2019 | % Change | ||||||||||||||||||||||||||||||||
| Net interest income | $ | (20) | $ | 62 | (132) | % | $ | 3 | $ | 135 | (98) | % | ||||||||||||||||||||||||||
| Noninterest income (loss) | (915) | (810) | 13 | (2,182) | (2,019) | 8 | ||||||||||||||||||||||||||||||||
| Total revenue, net of interest expense | (935) | (748) | 25 | (2,179) | (1,884) | 16 | ||||||||||||||||||||||||||||||||
| Provision for credit losses | (18) | (295) | (94) | 75 | (590) | (113) | ||||||||||||||||||||||||||||||||
| Noninterest expense | 560 | 2,460 | (77) | 1,114 | 3,375 | (67) | ||||||||||||||||||||||||||||||||
| Loss before income taxes | (1,477) | (2,913) | (49) | (3,368) | (4,669) | (28) | ||||||||||||||||||||||||||||||||
| Income tax benefit | (1,774) | (1,320) | 34 | (3,387) | (3,050) | 11 | ||||||||||||||||||||||||||||||||
| Net income (loss) | $ | 297 | $ | (1,593) | (119) | $ | 19 | $ | (1,619) | (101) | ||||||||||||||||||||||||||||
| Balance Sheet | ||||||||||||||||||||||||||||||||||||||
| Three Months Ended September 30 | Nine Months Ended September 30 | |||||||||||||||||||||||||||||||||||||
| Average | 2020 | 2019 | % Change | 2020 | 2019 | % Change | ||||||||||||||||||||||||||||||||
| Total loans and leases | $ | 24,243 | $ | 41,789 | (42) | % | $ | 30,218 | $ | 44,530 | (32) | % | ||||||||||||||||||||||||||
|
Total assets
(1)
|
230,906 | 212,440 | 9 | 227,430 | 205,335 | 11 | ||||||||||||||||||||||||||||||||
| Total deposits | 14,881 | 20,641 | (28) | 19,926 | 20,645 | (3) | ||||||||||||||||||||||||||||||||
| Period end |
September 30
2020 |
December 31
2019 |
% Change | |||||||||||||||||||||||||||||||||||
| Total loans and leases | $ | 23,120 | $ | 37,156 | (38) | % | ||||||||||||||||||||||||||||||||
|
Total assets
(1)
|
223,345 | 224,375 | — | |||||||||||||||||||||||||||||||||||
| Total deposits | 12,839 | 23,089 | (44) | |||||||||||||||||||||||||||||||||||
(1)
In segments where the total of liabilities and equity exceeds assets, which are generally deposit-taking segments, we allocate assets from
All Other
to those segments to match liabilities (i.e., deposits) and allocated shareholders’ equity. Average allocated assets were $828.3 billion and $714.2 billion for the three and nine months ended September 30, 2020 compared to $536.8 billion and $540.9 billion for the same periods in 2019, and period-end allocated assets were $857.8 billion and $565.4 billion at September 30, 2020 and December 31, 2019.
All Other
consists of ALM activities, equity investments, non-core mortgage loans and servicing activities, liquidating businesses and certain expenses not otherwise allocated to a business segment. ALM activities encompass certain residential mortgages, debt securities, and interest rate and foreign currency risk management activities. Substantially all of the results of ALM activities are allocated to our business segments. For more information on our ALM activities, see
Note 17 – Business Segment Information
to the Consolidated Financial Statements. For more information about
All Other,
see Business Segment Operations in the MD&A of the Corporation’s 2019 Annual Report on Form 10-K.
Residential mortgage loans that are held for ALM purposes, including interest rate or liquidity risk management, are classified as core and are presented on the balance sheet of
All Other
. During the nine months ended September 30, 2020, residential mortgage loans held for ALM activities decreased $11.7 billion to $10.0 billion due primarily to loan sales. Non-core residential mortgage and home equity loans, which are principally runoff portfolios, are also held in
All Other
. During the nine months ended September 30, 2020, total non-core loans decreased $2.4 billion to $13.3 billion due primarily to payoffs and paydowns, as well as Federal Housing Administration (FHA) loan conveyances and sales, partially offset by repurchases. For more information on the composition of the core and non-core portfolios, see Consumer Portfolio Credit Risk Management on page 30.
Three-Month Comparison
Results for
All Other
improved $1.9 billion to net income of $297 million from a net loss of $1.6 billion in the prior-year period primarily due to a $2.1 billion pretax impairment charge related to the notice of termination of the merchant services joint venture in the prior year, partially offset by lower revenue and a decrease in the benefit in provision for credit losses.
Revenue decreased $187 million due to lower noninterest income driven by the results of certain treasury activities and lower net interest income.
Noninterest expense decreased $1.9 billion to $560 million due to the $2.1 billion pretax impairment charge in the prior-year period, partially offset by higher litigation expense.
The benefit in the provision for credit losses decreased $277 million to $18 million primarily due to recoveries from sales of previously charged-off non-core consumer real estate loans in the prior-year period.
The income tax benefit increased $454 million reflecting the impact of the U.K. tax law change, partially offset by the impact of decreased pretax losses and lower discrete tax benefits. For more information on the U.K. tax law change, see Financial Highlights on page 7. Both periods included income tax benefit adjustments to eliminate the FTE treatment of certain tax credits recorded in
Global Bankin
g.
Nine-Month Comparison
Results for
All Other
improved $1.6 billion to net income of $19 million from a net loss of $1.6 billion in the prior-year period primarily due to the same factors as described in the three-month discussion.
Revenue decreased $295 million primarily due to the results of certain treasury activities, valuation adjustments on securities and derivatives and extinguishment losses on certain structured liabilities, partially offset by a gain on sales of mortgage loans.
The provision for credit losses increased $665 million
to
$75 million due to the same factor as described in the three-month discussion as well as the weaker economic outlook related to COVID-19.
Noninterest expense decreased $2.3 billion to $1.1 billion due to the same factors as described in the three-month discussion.
The income tax benefit increased $337 million due to the same factors as described in the three-month discussion. Both periods included income tax benefit adjustments to eliminate the FTE treatment of certain tax credits recorded in
Global Banking
.
|
Bank of America
22
|
||||||||
Off-Balance Sheet Arrangements and Contractual Obligations
We have contractual obligations to make future payments on debt and lease agreements. Additionally, in the normal course of business, we enter into contractual arrangements whereby we commit to future purchases of products or services from unaffiliated parties. For more information on obligations and commitments, see
Note 10 – Commitments and Contingencies
to the Consolidated Financial Statements herein, as well as Off-Balance Sheet Arrangements and Contractual Obligations in the MD&A of the Corporation’s 2019 Annual Report on Form 10-K, and
Note 12 – Long-term Debt
and
Note 13 – Commitments and Contingencies
to the Consolidated Financial Statements of the Corporation’s 2019 Annual Report on Form 10-K.
Representations and Warranties Obligations
For more information on representations and warranties obligations in connection with the sale of mortgage loans, see
Note 13 – Commitments and Contingencies
to the Consolidated Financial Statements of the Corporation’s 2019 Annual Report on Form 10-K.
Managing Risk
Risk is inherent in all our business activities. The seven key types of risk faced by the Corporation are strategic, credit, market, liquidity, compliance, operational and reputational. Sound risk management enables us to serve our customers and deliver for our shareholders. If not managed well, risks can result in financial loss, regulatory sanctions and penalties, and damage to our reputation, each of which may adversely impact our ability to execute our business strategies. We take a comprehensive approach to risk management with a defined Risk Framework and an articulated Risk Appetite Statement which are approved annually by the Enterprise Risk Committee and the Board.
Our Risk Framework serves as the foundation for the consistent and effective management of risks facing the Corporation. The Risk Framework sets forth clear roles, responsibilities and accountability for the management of risk and provides a blueprint for how the Board, through delegation of authority to committees and executive officers, establishes risk appetite and associated limits for our activities.
Our Risk Appetite Statement is intended to ensure that the Corporation maintains an acceptable risk profile by providing a common framework and a comparable set of measures for senior management and the Board to clearly indicate the level of risk the Corporation is willing to accept. Risk appetite is set at least annually and is aligned with the Corporation’s strategic, capital and financial operating plans. Our line-of-business strategies and risk appetite are also similarly aligned.
For more information about the Corporation's risks related to the COVID-19 pandemic, see Part II, Item 1A. Risk Factors on page 105. These COVID-19 related risks are being managed within our Risk Framework and supporting risk management programs.
For more information on our Risk Framework, our risk management activities and the key types of risk faced by the Corporation, see the Managing Risk through Reputational Risk sections in the MD&A of the Corporation’s 2019 Annual Report on Form 10-K.
Capital Management
The Corporation manages its capital position so that its capital is more than adequate to support its business activities and aligns with risk, risk appetite and strategic planning. For more information on capital management, including related regulatory requirements, see Capital Management in the MD&A of the Corporation’s 2019 Annual Report on Form 10-K.
CCAR and Capital Planning
The Federal Reserve requires BHCs to submit a capital plan and planned capital actions on an annual basis, consistent with the rules governing the CCAR capital plan. In June 2020, the Federal Reserve notified BHCs of their 2020 CCAR supervisory stress test results, which included a preliminary stress capital buffer (SCB) that was finalized in August 2020. Based on our results, we are subject to a 2.5 percent SCB for the period beginning October 1, 2020 and ending on September 30, 2021. Our Common equity tier 1 (CET1) capital ratio under the Standardized approach must remain above 9.5 percent during this period (the sum of our CET1 capital ratio minimum of 4.5 percent, global systemically important bank (G-SIB) surcharge of 2.5 percent and our SCB of 2.5 percent) in order to avoid restrictions on capital distributions and discretionary bonus payments.
Due to economic uncertainty resulting from the COVID-19 pandemic, the Federal Reserve required all large banks to suspend share repurchase programs in the third quarter of 2020, except for repurchases to offset shares awarded under equity-based compensation plans, and to limit dividends to existing rates that do not exceed the average of the last four quarters’ net income. In September 2020, the Federal Reserve announced that these measures would remain in place for the fourth quarter of 2020. Large banks will also be required to update and resubmit their capital plans in November 2020 based on the Federal Reserve’s updated supervisory stress test scenarios. The Federal Reserve announced that it will publish the results of the additional supervisory stress tests by December 31, 2020.
As previously disclosed, the Federal Reserve’s directives regarding share repurchases aligned with our decision to voluntarily suspend our general common stock repurchase program during the first half of 2020. The suspension of our repurchases did not include repurchases to offset shares awarded under our equity-based compensation plans, for which we repurchased $114 million of common stock during the third quarter of 2020 pursuant to the Board’s repurchase authorization.
We intend to maintain the quarterly common stock dividend at the current rate of $0.18 per share until further notice, subject to approval by the Board. We will also continue our current suspension of common stock repurchases in the fourth quarter of 2020, except for repurchases to offset shares awarded under our equity-based compensation plans, which have previously been authorized by the Board.
Our general common stock repurchase program is subject to the Board’s approval, and at such time that we reinstate our stock repurchase program, our stock repurchases will be subject to various factors, including the Corporation’s capital position, liquidity, financial performance and alternative uses of capital, stock trading price and general market conditions, and may be suspended at any time. Such repurchases may be effected through open market purchases or privately negotiated transactions, including repurchase plans that satisfy the conditions of Rule 10b5-1 of the Securities Exchange Act of 1934, as amended (Exchange Act).
|
23
Bank of America
|
||||||||
Regulatory Capital
As a financial services holding company, we are subject to regulatory capital rules, including Basel 3, issued by U.S. banking regulators. The Corporation's depository institution subsidiaries are also subject to the Prompt Corrective Action (PCA) framework. The Corporation and its primary affiliated banking entity, BANA, are Advanced approaches institutions under Basel 3 and are required to report regulatory risk-based capital ratios and risk-weighted assets (RWA) under both the Standardized and Advanced approaches. The approach that yields the lower ratio is used to assess capital adequacy including under the PCA framework. As of September 30, 2020, the CET1, Tier 1 capital and Total capital ratios for the Corporation were lower under the Standardized approach.
Minimum Capital Requirements
In order to avoid restrictions on capital distributions and discretionary bonus payments, the Corporation must meet risk-based capital ratio requirements that include a capital conservation buffer greater than 2.5 percent, plus any
applicable countercyclical capital buffer and a G-SIB surcharge. On October 1, 2020, the capital conservation buffer was replaced by the SCB for the Corporation’s Standardized approach ratio requirements. The buffers and surcharge must be comprised solely of CET1 capital.
The Corporation is also required to maintain a minimum supplementary leverage ratio (SLR) of 3.0 percent plus a leverage buffer of 2.0 percent in order to avoid certain restrictions on capital distributions and discretionary bonus payments. Our insured depository institution subsidiaries are required to maintain a minimum 6.0 percent SLR to be considered well capitalized under the PCA framework.
Capital Composition and Ratios
Table 8 presents Bank of America Corporation’s capital ratios and related information in accordance with Basel 3 Standardized and Advanced approaches as measured at September 30, 2020 and December 31, 2019. For the periods presented herein, the Corporation met the definition of well capitalized under current regulatory requirements.
| Table 8 | Bank of America Corporation Regulatory Capital under Basel 3 | |||||||||||||||||||
|
Standardized
Approach (1, 2) |
Advanced
Approaches (1) |
Regulatory
Minimum (3) |
||||||||||||||||||
| (Dollars in millions, except as noted) | September 30, 2020 | |||||||||||||||||||
| Risk-based capital metrics: | ||||||||||||||||||||
| Common equity tier 1 capital | $ | 173,213 | $ | 173,213 | ||||||||||||||||
| Tier 1 capital | 196,637 | 196,637 | ||||||||||||||||||
|
Total capital
(4)
|
235,446 | 224,541 | ||||||||||||||||||
| Risk-weighted assets (in billions) | 1,460 | 1,364 | ||||||||||||||||||
| Common equity tier 1 capital ratio | 11.9 | % | 12.7 | % | 9.5 | % | ||||||||||||||
| Tier 1 capital ratio | 13.5 | 14.4 | 11.0 | |||||||||||||||||
| Total capital ratio | 16.1 | 16.5 | 13.0 | |||||||||||||||||
| Leverage-based metrics: | ||||||||||||||||||||
|
Adjusted quarterly average assets (in billions)
(5)
|
$ | 2,667 | $ | 2,667 | ||||||||||||||||
| Tier 1 leverage ratio | 7.4 | % | 7.4 | % | 4.0 | |||||||||||||||
|
Supplementary leverage exposure (in billions)
(6)
|
$ | 2,867 | ||||||||||||||||||
| Supplementary leverage ratio | 6.9 | % | 5.0 | |||||||||||||||||
| December 31, 2019 | ||||||||||||||||||||
| Risk-based capital metrics: | ||||||||||||||||||||
| Common equity tier 1 capital | $ | 166,760 | $ | 166,760 | ||||||||||||||||
| Tier 1 capital | 188,492 | 188,492 | ||||||||||||||||||
|
Total capital
(4)
|
221,230 | 213,098 | ||||||||||||||||||
| Risk-weighted assets (in billions) | 1,493 | 1,447 | ||||||||||||||||||
| Common equity tier 1 capital ratio | 11.2 | % | 11.5 | % | 9.5 | % | ||||||||||||||
| Tier 1 capital ratio | 12.6 | 13.0 | 11.0 | |||||||||||||||||
| Total capital ratio | 14.8 | 14.7 | 13.0 | |||||||||||||||||
| Leverage-based metrics: | ||||||||||||||||||||
|
Adjusted quarterly average assets (in billions)
(5)
|
$ | 2,374 | $ | 2,374 | ||||||||||||||||
| Tier 1 leverage ratio | 7.9 | % | 7.9 | % | 4.0 | |||||||||||||||
| Supplementary leverage exposure (in billions) | $ | 2,946 | ||||||||||||||||||
| Supplementary leverage ratio | 6.4 | % | 5.0 | |||||||||||||||||
(1)
As of September 30, 2020, capital ratios are calculated using the regulatory capital rule that allows a five-year transition period related to the adoption of CECL.
(2)
Derivative exposure amounts are calculated using the standardized approach for measuring counterparty credit risk at September 30, 2020 and the current exposure method at December 31, 2019.
(3)
The capital conservation buffer and G-SIB surcharge were 2.5 percent at both September 30, 2020 and December 31, 2019. The countercyclical capital buffer for both periods was zero. The SLR minimum includes a leverage buffer of 2.0 percent.
(4)
Total capital under the Advanced approaches differs from the Standardized approach due to differences in the amount permitted in Tier 2 capital related to the qualifying allowance for credit losse
s.
(5)
Reflects total average assets adjusted for certain Tier 1 capital deductions.
(6)
Supplementary leverage exposure at September 30, 2020 reflects the temporary exclusion of U.S. Treasury Securities and deposits at Federal Reserve Banks.
At September 30, 2020, CET1 capital was $173.2 billion, an increase of $6.5 billion from December 31, 2019, driven by earnings and net unrealized gains on available-for-sale (AFS) debt securities included in accumulated other comprehensive income (OCI), partially offset by common stock repurchases and
dividends. Total capital under the Standardized approach increased $14.2 billion primarily driven by the same factors as CET1 capital, an increase in the adjusted allowance for credit losses included in Tier 2 capital and the issuance of preferred stock. RWA under the Standardized approach, which yielded the
|
Bank of America
24
|
||||||||
lower CET1 capital ratio at September 30, 2020, decreased $33.5 billion during the nine months ended September 30, 2020 to $1,460 billion primarily due to lower exposures in
Global Banking
and
Consumer Banking
, partially offset by
increases in counterparty credit risk and market risk RWA. Table 9 shows the capital composition at September 30, 2020 and December 31, 2019.
| Table 9 | Capital Composition under Basel 3 | |||||||||||||
| (Dollars in millions) |
September 30
2020 |
December 31
2019 |
||||||||||||
| Total common shareholders’ equity | $ | 245,423 | $ | 241,409 | ||||||||||
|
CECL transitional amount
(1)
|
4,411 | — | ||||||||||||
| Goodwill, net of related deferred tax liabilities | (68,569) | (68,570) | ||||||||||||
| Deferred tax assets arising from net operating loss and tax credit carryforwards | (5,853) | (5,193) | ||||||||||||
| Intangibles, other than mortgage servicing rights and goodwill, net of related deferred tax liabilities | (1,656) | (1,328) | ||||||||||||
| Defined benefit pension plan net assets | (1,056) | (1,003) | ||||||||||||
|
Cumulative unrealized net (gain) loss related to changes in fair value of financial liabilities attributable to own creditworthiness,
net-of-tax |
1,245 | 1,278 | ||||||||||||
| Other | (732) | 167 | ||||||||||||
| Common equity tier 1 capital | 173,213 | 166,760 | ||||||||||||
| Qualifying preferred stock, net of issuance cost | 23,426 | 22,329 | ||||||||||||
| Other | (2) | (597) | ||||||||||||
| Tier 1 capital | 196,637 | 188,492 | ||||||||||||
| Tier 2 capital instruments | 22,571 | 22,538 | ||||||||||||
|
Qualifying allowance for credit losses
(2)
|
16,243 | 10,229 | ||||||||||||
| Other | (5) | (29) | ||||||||||||
| Total capital under the Standardized approach | 235,446 | 221,230 | ||||||||||||
|
Adjustment in qualifying allowance for credit losses under the Advanced approaches
(2)
|
(10,905) | (8,132) | ||||||||||||
| Total capital under the Advanced approaches | $ | 224,541 | $ | 213,098 | ||||||||||
(1)
The CECL transitional amount includes the impact of the Corporation's adoption of the new CECL accounting standard on January 1, 2020 plus 25 percent of the increase in the adjusted allowance for credit losses from January 1, 2020 through September 30, 2020.
(2)
The balance at September 30, 2020 includes the impact of transition provisions related to the new CECL accounting standard.
Table 10 shows the components of RWA as measured under Basel 3 at September 30, 2020 and December 31, 2019.
| Table 10 | Risk-weighted Assets under Basel 3 | |||||||||||||||||||||||||
|
Standardized Approach
(1)
|
Advanced Approaches |
Standardized Approach
(1)
|
Advanced Approaches | |||||||||||||||||||||||
| (Dollars in billions) | September 30, 2020 | December 31, 2019 | ||||||||||||||||||||||||
| Credit risk | $ | 1,396 | $ | 884 | $ | 1,437 | $ | 858 | ||||||||||||||||||
| Market risk | 64 | 63 | 56 | 55 | ||||||||||||||||||||||
|
Operational risk
(2)
|
n/a | 372 | n/a | 500 | ||||||||||||||||||||||
| Risks related to credit valuation adjustments | n/a | 45 | n/a | 34 | ||||||||||||||||||||||
| Total risk-weighted assets | $ | 1,460 | $ | 1,364 | $ | 1,493 | $ | 1,447 | ||||||||||||||||||
(1)
Derivative exposure amounts are calculated using the standardized approach for measuring counterparty credit risk at September 30, 2020 and the current exposure method at December 31, 2019.
(2)
September 30, 2020 includes the effects of an update made to our operational risk RWA model during the third quarter of 2020.
n/a = not applicable
|
25
Bank of America
|
||||||||
Bank of America, N.A. Regulatory Capital
Table 11 presents regulatory capital information for BANA in accordance with Basel 3 Standardized and Advanced approaches as measured at September 30, 2020 and December 31, 2019. BANA met the definition of well capitalized under the PCA framework for both periods.
| Table 11 | Bank of America, N.A. Regulatory Capital under Basel 3 | |||||||||||||||||||
|
Standardized
Approach (1, 2) |
Advanced
Approaches (1) |
Regulatory
Minimum (3) |
||||||||||||||||||
| (Dollars in millions, except as noted) | September 30, 2020 | |||||||||||||||||||
| Risk-based capital metrics: | ||||||||||||||||||||
|
Common equity tier 1 capital
|
$ | 160,013 | $ | 160,013 | ||||||||||||||||
| Tier 1 capital | 160,013 | 160,013 | ||||||||||||||||||
|
Total capital
(4)
|
176,754 | 166,426 | ||||||||||||||||||
| Risk-weighted assets (in billions) | 1,212 | 1,019 | ||||||||||||||||||
| Common equity tier 1 capital ratio | 13.2 | % | 15.7 | % | 7.0 | % | ||||||||||||||
| Tier 1 capital ratio | 13.2 | 15.7 | 8.5 | |||||||||||||||||
| Total capital ratio | 14.6 | 16.3 | 10.5 | |||||||||||||||||
| Leverage-based metrics: | ||||||||||||||||||||
|
Adjusted quarterly average assets (in billions)
(5)
|
$ | 2,091 | $ | 2,091 | ||||||||||||||||
| Tier 1 leverage ratio | 7.7 | % | 7.7 | % | 5.0 | |||||||||||||||
| Supplementary leverage exposure (in billions) | $ | 2,465 | ||||||||||||||||||
| Supplementary leverage ratio | 6.5 | % | 6.0 | |||||||||||||||||
|
|
|
|||||||||||||||||||
|
|
|
December 31, 2019 | ||||||||||||||||||
| Risk-based capital metrics: | ||||||||||||||||||||
|
Common equity tier 1 capital
|
$ | 154,626 | $ | 154,626 | ||||||||||||||||
| Tier 1 capital | 154,626 | 154,626 | ||||||||||||||||||
|
Total capital
(4)
|
166,567 | 158,665 | ||||||||||||||||||
| Risk-weighted assets (in billions) | 1,241 | 991 | ||||||||||||||||||
| Common equity tier 1 capital ratio | 12.5 | % | 15.6 | % | 7.0 | % | ||||||||||||||
| Tier 1 capital ratio | 12.5 | 15.6 | 8.5 | |||||||||||||||||
| Total capital ratio | 13.4 | 16.0 | 10.5 | |||||||||||||||||
| Leverage-based metrics: | ||||||||||||||||||||
|
Adjusted quarterly average assets (in billions)
(5)
|
$ | 1,780 | $ | 1,780 | ||||||||||||||||
| Tier 1 leverage ratio | 8.7 | % | 8.7 | % | 5.0 | |||||||||||||||
| Supplementary leverage exposure (in billions) | $ | 2,177 | ||||||||||||||||||
| Supplementary leverage ratio | 7.1 | % | 6.0 | |||||||||||||||||
(1)
As of September 30, 2020, capital ratios are calculated using the regulatory capital rule that allows a five-year transition period related to the adoption of CECL.
(2)
Derivative exposure amounts are calculated using the standardized approach for measuring counterparty credit risk at September 30, 2020 and the current exposure method at December 31, 2019.
(3)
Risk-based capital regulatory minimums at September 30, 2020 and December 31, 2019 are the minimum ratios under Basel 3 including a capital conservation buffer of 2.5 percent. The regulatory minimums for the leverage ratios as of both period ends are the percent required to be considered well capitalized under the PCA framework.
(4)
Total capital under the Advanced approaches differs from the Standardized approach due to differences in the amount permitted in Tier 2 capital related to the qualifying allowance for credit losses.
(5)
Reflects total average assets adjusted for certain Tier 1 capital deductions.
Total Loss-Absorbing Capacity Requirements
Total loss-absorbing capacity (TLAC) consists of the Corporation’s Tier 1 capital and eligible long-term debt issued directly by the Corporation. Eligible long-term debt for TLAC ratios is comprised of unsecured debt that has a remaining maturity of at least one year and satisfies additional requirements as prescribed in the TLAC final rule. As with the
risk-based capital ratios and SLR, the Corporation is required to maintain TLAC ratios in excess of minimum requirements plus applicable buffers to avoid restrictions on capital distributions and discretionary bonus payments. Table 12 presents the Corporation's TLAC and long-term debt ratios and related information as of September 30, 2020 and December 31, 2019.
|
Bank of America
26
|
||||||||
| Table 12 | Bank of America Corporation Total Loss-Absorbing Capacity and Long-Term Debt | |||||||||||||||||||||||||
|
TLAC
(1)
|
Regulatory Minimum
(2)
|
Long-term
Debt |
Regulatory Minimum
(3)
|
|||||||||||||||||||||||
| (Dollars in millions) | September 30, 2020 | |||||||||||||||||||||||||
| Total eligible balance | $ | 392,767 | $ | 188,022 | ||||||||||||||||||||||
|
Percentage of risk-weighted assets
(4)
|
26.9 | % | 22.0 | % | 12.9 | % | 8.5 | % | ||||||||||||||||||
|
Percentage of supplementary leverage exposure
(5, 6)
|
13.7 | 9.5 | 6.6 | 4.5 | ||||||||||||||||||||||
| December 31, 2019 | ||||||||||||||||||||||||||
| Total eligible balance | $ | 367,449 | $ | 171,349 | ||||||||||||||||||||||
|
Percentage of risk-weighted assets
(4)
|
24.6 | % | 22.0 | % | 11.5 | % | 8.5 | % | ||||||||||||||||||
|
Percentage of supplementary leverage exposure
(6)
|
12.5 | 9.5 | 5.8 | 4.5 | ||||||||||||||||||||||
(1)
As of September 30, 2020, TLAC ratios are calculated using the regulatory capital rule that allows a five-year transition period related to the adoption of CECL.
(2)
The TLAC RWA regulatory minimum consists of 18.0 percent plus a TLAC RWA buffer comprised of 2.5 percent plus the method 1 G-SIB surcharge of 1.5 percent. The countercyclical buffer is zero for both periods. The TLAC supplementary leverage exposure regulatory minimum consists of 7.5 percent plus a 2.0 percent TLAC leverage buffer. The TLAC RWA and leverage buffers must be comprised solely of CET1 capital and Tier 1 capital, respectively.
(3)
The long-term debt RWA regulatory minimum is comprised of 6.0 percent plus an additional 2.5 percent requirement based on the Corporation’s method 2 G-SIB surcharge. The long-term debt leverage exposure regulatory minimum is 4.5 percent.
(4)
The approach that yields the higher RWA is used to calculate TLAC and long-term debt ratios, which was the Standardized approach as of September 30, 2020 and December 31, 2019.
(5)
Supplementary leverage exposure at September 30, 2020 reflects the temporary exclusion of U.S. Treasury Securities and deposits at Federal Reserve Banks.
(6)
Derivative exposure amounts are calculated using the standardized approach for measuring counterparty credit risk at September 30, 2020 and the current exposure method at December 31, 2019.
Regulatory Developments
The following supplements the disclosure in Capital Management – Regulatory Developments in the MD&A of the Corporation’s 2019 Annual Report on Form 10-K and in the Corporation's Quarterly Report on Form 10-Q for the quarter ended June 30, 2020.
Deduction of Unsecured Debt of G-SIBs
On October 20, 2020, the Federal Reserve, Federal Deposit Insurance Corporation and the Office of the Comptroller of the Currency (U.S. Agencies) finalized a rule requiring Advanced approaches institutions to deduct from regulatory capital certain investments in TLAC-eligible long-term debt and other pari passu or subordinated debt instruments issued by G-SIBs above a specified threshold. The final rule is intended to limit the interconnectedness between G-SIBs and is complementary to existing regulatory capital requirements that generally require banks to deduct investments in the regulatory capital of financial institutions. The final rule is effective April 1, 2021. The impact to the Corporation is not expected to be significant.
Regulatory Capital and Securities Regulation
The Corporation’s principal U.S. broker-dealer subsidiaries are BofA Securities, Inc. (BofAS), Merrill Lynch Professional Clearing Corp. (MLPCC) and Merrill Lynch, Pierce, Fenner & Smith Incorporated (MLPF&S). The Corporation's principal European broker-dealer subsidiaries are Merrill Lynch International (MLI) and BofA Securities Europe SA (BofASE).
The U.S. broker-dealer subsidiaries are subject to the net capital requirements of Rule 15c3-1 under the Exchange Act. BofAS computes its minimum capital requirements as an alternative net capital broker-dealer under Rule 15c3-1e, and MLPCC and MLPF&S compute their minimum capital requirements in accordance with the alternative standard under Rule 15c3-1. BofAS and MLPCC are also registered as futures commission merchants and are subject to Commodity Futures Trading Commission (CFTC) Regulation 1.17. The U.S. broker-dealer subsidiaries are also registered with the Financial Industry Regulatory Authority, Inc. (FINRA). Pursuant to FINRA Rule 4110, FINRA may impose higher net capital requirements than Rule 15c3-1 under the Exchange Act with respect to each of the broker-dealers.
BofAS provides institutional services, and in accordance with the alternative net capital requirements, is required to maintain tentative net capital in excess of $1.0 billion and net capital in excess of the greater of $500 million or a certain percentage of
its reserve requirement. BofAS must also notify the Securities and Exchange Commission (SEC) in the event its tentative net capital is less than $5.0 billion. BofAS is also required to hold a certain percentage of its customers' and affiliates' risk-based margin in order to meet its CFTC minimum net capital requirement. At September 30, 2020, BofAS had tentative net capital of $20.3 billion. BofAS also had regulatory net capital of $17.9 billion, which exceeded the minimum requirement of $3.0 billion.
MLPCC is a fully-guaranteed subsidiary of BofAS and provides clearing and settlement services as well as prime brokerage and arranged financing services for institutional clients. At September 30, 2020, MLPCC’s regulatory net capital of $7.2 billion exceeded the minimum requirement of $1.2 billion.
MLPF&S provides retail services. At September 30, 2020, MLPF&S' regulatory net capital was $3.4 billion, which exceeded the minimum requirement of $147 million.
Our European broker-dealers are regulated by non-U.S. regulators. MLI, a U.K. investment firm, is regulated by the Prudential Regulation Authority and the Financial Conduct Authority and is subject to certain regulatory capital requirements. At September 30, 2020, MLI’s capital resources were $35.1 billion, which exceeded the minimum Pillar 1 requirement of $13.8 billion. BofASE, a French investment firm, is regulated by the Autorité de Contrôle Prudentiel et de Résolution and the Autorité des Marchés Financiers, and is subject to certain regulatory capital requirements. At September 30, 2020, BofASE's capital resources were $6.0 billion which exceeded the minimum Pillar 1 requirement of $1.9 billion.
Liquidity Risk
Funding and Liquidity Risk Management
Our primary liquidity risk management objective is to meet expected or unexpected cash flow and collateral needs while continuing to support our businesses and customers under a range of economic conditions. To achieve that objective, we analyze and monitor our liquidity risk under expected and stressed conditions, maintain liquidity and access to diverse funding sources, including our stable deposit base, and seek to align liquidity-related incentives and risks. These liquidity risk management practices have allowed us to effectively manage the market stress that began in the first quarter of 2020 from the COVID-19 pandemic. For more information on the effects of
|
27
Bank of America
|
||||||||
the pandemic, see Executive Summary - Recent Developments – COVID-19 Pandemic on page 3.
We define liquidity as readily available assets, limited to cash and high-quality, liquid, unencumbered securities that we can use to meet our contractual and contingent financial obligations as those obligations arise. We manage our liquidity position through line-of-business and ALM activities, as well as through our legal entity funding strategy, on both a forward and current (including intraday) basis under both expected and stressed conditions. We believe that a centralized approach to funding and liquidity management enhances our ability to monitor liquidity requirements, maximizes access to funding sources, minimizes borrowing costs and facilitates timely responses to liquidity events. For more information regarding global funding and liquidity risk management, as well as liquidity sources, liquidity arrangements, contingency planning and credit ratings discussed below, see Liquidity Risk in the MD&A of the Corporation’s 2019 Annual Report on Form 10-K.
NB Holdings Corporation
We have intercompany arrangements with certain key subsidiaries under which we transferred certain assets of Bank of America Corporation, as the parent company, which is a separate and distinct legal entity from our banking and nonbank subsidiaries, and agreed to transfer certain additional parent company assets not needed to satisfy anticipated near term expenditures, to NB Holdings Corporation, a wholly-owned holding company subsidiary (NB Holdings). The parent company is expected to continue to have access to the same flow of dividends, interest and other amounts of cash necessary to service its debt, pay dividends and perform other obligations as it would have had if it had not entered into these arrangements and transferred any assets. These arrangements support our preferred single point of entry resolution strategy, under which only the parent company would be resolved under the U.S. Bankruptcy Code.
Global Liquidity Sources and Other Unencumbered Assets
Table 13 presents average Global Liquidity Sources (GLS) for the three months ended September 30, 2020 and December 31, 2019.
| Table 13 | Average Global Liquidity Sources | |||||||||||||
| Three Months Ended | ||||||||||||||
| (Dollars in billions) |
September 30
2020 |
December 31
2019 |
||||||||||||
| Bank entities | $ | 690 | $ | 454 | ||||||||||
|
Nonbank and other entities
(1)
|
169 | 122 | ||||||||||||
|
Total Average Global Liquidity Sources
|
$ | 859 | $ | 576 | ||||||||||
(1)
Nonbank includes Parent, NB Holdings and other regulated entities.
We maintain liquidity available to the Corporation, including the parent company and selected subsidiaries, in the form of cash and high-quality, liquid, unencumbered securities. Typically, parent company and NB Holdings liquidity is in the form of cash deposited with BANA.
Our bank subsidiaries’ liquidity is primarily driven by deposit and lending activity, as well as securities valuation and net debt activity. Liquidity at bank subsidiaries excludes the cash deposited by the parent company and NB Holdings. Our bank subsidiaries can also generate incremental liquidity by pledging a range of unencumbered loans and securities to certain Federal Home Loan Banks (FHLBs) and the Federal Reserve
Discount Window. The cash we could have obtained by borrowing against this pool of specifically-identified eligible assets was $320 billion and $372 billion at September 30, 2020 and December 31, 2019. We have established operational procedures to enable us to borrow against these assets, including regularly monitoring our total pool of eligible loans and securities collateral. Eligibility is defined in guidelines from the FHLBs and the Federal Reserve and is subject to change at their discretion. Due to regulatory restrictions, liquidity generated by the bank subsidiaries can generally be used only to fund obligations within the bank subsidiaries, and transfers to the parent company or nonbank subsidiaries may be subject to prior regulatory approval.
Liquidity held in other regulated entities, comprised primarily of broker-dealer subsidiaries, is primarily available to meet the obligations of that entity, and transfers to the parent company or to any other subsidiary may be subject to prior regulatory approval due to regulatory restrictions and minimum requirements. Our other regulated entities also hold unencumbered investment-grade securities and equities that we believe could be used to generate additional liquidity.
Table 14 presents the composition of average GLS for the three months ended September 30, 2020 and December 31, 2019.
| Table 14 | Average Global Liquidity Sources Composition | |||||||||||||
| Three Months Ended | ||||||||||||||
| (Dollars in billions) |
September 30
2020 |
December 31
2019 |
||||||||||||
| Cash on deposit | $ | 244 | $ | 103 | ||||||||||
| U.S. Treasury securities | 166 | 98 | ||||||||||||
|
U.S. agency securities, mortgage-backed securities, and other investment-grade securities
|
426 | 358 | ||||||||||||
|
Non-U.S. government securities
|
23 | 17 | ||||||||||||
| Total Average Global Liquidity Sources | $ | 859 | $ | 576 | ||||||||||
Our GLS are substantially the same in composition to what qualifies as High Quality Liquid Assets (HQLA) under the final U.S. Liquidity Coverage Ratio (LCR) rules. However, HQLA for purposes of calculating LCR is not reported at market value, but at a lower value that incorporates regulatory deductions and the exclusion of excess liquidity held at certain subsidiaries. The LCR is calculated as the amount of a financial institution’s unencumbered HQLA relative to the estimated net cash outflows the institution could encounter over a 30-day period of significant liquidity stress, expressed as a percentage. Our average consolidated HQLA, on a net basis, was $562 billion and $464 billion for the three months ended September 30, 2020 and December 31, 2019. For the same periods, the average consolidated LCR was 122 percent and 116 percent. Our LCR fluctuates due to normal business flows from customer activity.
Liquidity Stress Analysis
We utilize liquidity stress analysis to assist us in determining the appropriate amounts of liquidity to maintain at the parent company and our subsidiaries to meet contractual and contingent cash outflows under a range of scenarios. For more information on our liquidity stress analysis, see Liquidity Risk – Liquidity Stress Analysis in the MD&A of the Corporation’s 2019 Annual Report on Form 10-K.
|
Bank of America
28
|
||||||||
Net Stable Funding Ratio Final Rule
On October 20, 2020, the U.S. Agencies finalized the Net Stable Funding Ratio, a rule requiring large banks to maintain a minimum level of stable funding over a one-year period. The final rule is intended to support the ability of banks to lend to households and businesses in both normal and adverse economic conditions and is complementary to the LCR rule, which focuses on short-term liquidity risks. The final rule is effective July 1, 2021. The impact to the Corporation is not expected to be significant.
Diversified Funding Sources
We fund our assets primarily with a mix of deposits, and secured and unsecured liabilities through a centralized, globally coordinated funding approach diversified across products, programs, markets, currencies and investor groups. We fund a substantial portion of our lending activities through our deposits, which were $1.70 trillion and $1.43 trillion at September 30, 2020 and December 31, 2019.
Our trading activities in other regulated entities are primarily funded on a secured basis through securities lending and repurchase agreements, and these amounts will vary based on customer activity and market conditions.
Long-term Debt
During the nine months ended September 30, 2020, we issued $40.7 billion of long-term debt consisting of $32.9 billion of notes issued by Bank of America Corporation, substantially all of which was TLAC compliant, $1.9 billion of notes issued by Bank of America, N.A. and $5.9 billion of other debt.
During the nine months ended September 30, 2020, we had total long-term debt maturities and redemptions in the aggregate of $36.4 billion consisting of $16.4 billion for Bank of America Corporation, $10.1 billion for Bank of America, N.A. and $9.9 billion of other debt. Table 15 presents the carrying value of aggregate annual contractual maturities of long-term debt at September 30, 2020.
| Table 15 | Long-term Debt by Maturity | |||||||||||||||||||||||||||||||||||||||||||
| (Dollars in millions) | Remainder of 2020 | 2021 | 2022 | 2023 | 2024 | Thereafter | Total | |||||||||||||||||||||||||||||||||||||
| Bank of America Corporation | ||||||||||||||||||||||||||||||||||||||||||||
|
Senior notes
(1)
|
$ | 2,352 | $ | 11,457 | $ | 15,109 | $ | 23,752 | $ | 18,777 | $ | 114,846 | $ | 186,293 | ||||||||||||||||||||||||||||||
| Senior structured notes | 191 | 457 | 1,956 | 264 | 269 | 13,636 | 16,773 | |||||||||||||||||||||||||||||||||||||
| Subordinated notes | — | 352 | 375 | — | 3,368 | 20,191 | 24,286 | |||||||||||||||||||||||||||||||||||||
| Junior subordinated notes | — | — | — | — | — | 739 | 739 | |||||||||||||||||||||||||||||||||||||
| Total Bank of America Corporation | 2,543 | 12,266 | 17,440 | 24,016 | 22,414 | 149,412 | 228,091 | |||||||||||||||||||||||||||||||||||||
| Bank of America, N.A. | ||||||||||||||||||||||||||||||||||||||||||||
| Senior notes | 1,342 | 1,340 | — | 516 | — | 8 | 3,206 | |||||||||||||||||||||||||||||||||||||
| Subordinated notes | — | — | — | — | — | 1,937 | 1,937 | |||||||||||||||||||||||||||||||||||||
| Advances from Federal Home Loan Banks | 7 | 2 | 3 | 1 | — | 94 | 107 | |||||||||||||||||||||||||||||||||||||
|
Securitizations and other Bank VIEs
(2)
|
— | 4,024 | 1,249 | — | — | 18 | 5,291 | |||||||||||||||||||||||||||||||||||||
| Other | 5 | 95 | — | 152 | 1 | 110 | 363 | |||||||||||||||||||||||||||||||||||||
| Total Bank of America, N.A. | 1,354 | 5,461 | 1,252 | 669 | 1 | 2,167 | 10,904 | |||||||||||||||||||||||||||||||||||||
| Other debt | ||||||||||||||||||||||||||||||||||||||||||||
| Structured liabilities | 1,565 | 3,937 | 2,093 | 1,841 | 624 | 6,215 | 16,275 | |||||||||||||||||||||||||||||||||||||
|
Nonbank VIEs
(2)
|
— | 1 | — | — | — | 452 | 453 | |||||||||||||||||||||||||||||||||||||
| Total other debt | 1,565 | 3,938 | 2,093 | 1,841 | 624 | 6,667 | 16,728 | |||||||||||||||||||||||||||||||||||||
| Total long-term debt | $ | 5,462 | $ | 21,665 | $ | 20,785 | $ | 26,526 | $ | 23,039 | $ | 158,246 | $ | 255,723 | ||||||||||||||||||||||||||||||
(1)
Total includes $139.8 billion of outstanding notes that are both TLAC eligible and callable one year before their stated maturities, including $2.8 billion during the remainder of 2020, and $11.8 billion, $15.2 billion, $12.0 billion and $11.6 billion during each year of 2021 through 2024, respectively, and $86.4 billion thereafter. The call features provide the flexibility to retire long-term notes before their final year outstanding, when they are no longer eligible to count toward TLAC requirements, and replace them with new TLAC-eligible debt, should we choose to do so.
(2)
Represents liabilities of consolidated VIEs included in total long-term debt on the Consolidated Balance Sheet.
Total long-term debt increased $14.9 billion during the nine months ended September 30, 2020 primarily due to debt issuances and valuation adjustments, partially offset by maturities and redemptions. We may, from time to time, purchase outstanding debt instruments in various transactions, depending on market conditions, liquidity and other factors. Our other regulated entities may also make markets in our debt instruments to provide liquidity for investors.
We use derivative transactions to manage the duration, interest rate and currency risks of our borrowings, considering the characteristics of the assets they are funding. For more information on our ALM activities, see Interest Rate Risk Management for the Banking Book on page 48.
We may issue unsecured debt in the form of structured notes for client purposes, certain of which qualify as TLAC-eligible debt. During the nine months ended September 30, 2020, we issued $6.1 billion of structured notes, which are unsecured debt obligations that pay investors returns linked to other debt or equity securities, indices, currencies or commodities. We typically hedge the returns we are obligated to
pay on these liabilities with derivatives and/or investments in the underlying instruments, so that from a funding perspective, the cost is similar to our other unsecured long-term debt. We could be required to settle certain structured note obligations for cash or other securities prior to maturity under certain circumstances, which we consider for liquidity planning purposes. We believe, however, that a portion of such borrowings will remain outstanding beyond the earliest put or redemption date.
Substantially all of our senior and subordinated debt obligations contain no provisions that could trigger a requirement for an early repayment, require additional collateral support, result in changes to terms, accelerate maturity or create additional financial obligations upon an adverse change in our credit ratings, financial ratios, earnings, cash flows or stock price. For more information on long-term debt funding, including issuances and maturities and redemptions, see
Note 12 – Long-term Debt
to the Consolidated Financial Statements
of the Corporation’s 2019 Annual Report on Form 10-K
.
|
29
Bank of America
|
||||||||
Credit Ratings
Credit ratings and outlooks are opinions expressed by rating agencies on our creditworthiness and that of our obligations or securities, including long-term debt, short-term borrowings, preferred stock and other securities, including asset securitizations. Table 16 presents the Corporation’s current long-term/short-term senior debt ratings and outlooks expressed by the rating agencies.
The ratings and outlooks from Fitch Ratings for the Corporation and its subsidiaries have not changed from those disclosed in the Corporation’s Quarterly Report on Form 10-Q for the quarter ended June 30, 2020. The ratings and outlooks
from Moody’s Investors Service (Moody’s) and Standard & Poor’s Global Ratings for the Corporation and its subsidiaries did not change from those disclosed in the Corporation's 2019 Annual Report on Form 10-K.
For more information on additional collateral and termination payments that could be required in connection with certain over-the-counter derivative contracts and other trading agreements in the event of a credit rating downgrade, see
Note 3 – Derivatives
to the Consolidated Financial Statements herein and Item 1A. Risk Factors of the Corporation’s 2019 Annual Report on Form 10-K.
| Table 16 | Senior Debt Ratings | |||||||||||||||||||||||||||||||||||||||||||||||||||||||
| Moody’s Investors Service | Standard & Poor’s Global Ratings | Fitch Ratings | ||||||||||||||||||||||||||||||||||||||||||||||||||||||
| Long-term | Short-term | Outlook | Long-term | Short-term | Outlook | Long-term | Short-term | Outlook | ||||||||||||||||||||||||||||||||||||||||||||||||
| Bank of America Corporation | A2 | P-1 | Stable | A- | A-2 | Stable | A+ | F1 | Stable | |||||||||||||||||||||||||||||||||||||||||||||||
| Bank of America, N.A. | Aa2 | P-1 | Stable | A+ | A-1 | Stable | AA- | F1+ | Stable | |||||||||||||||||||||||||||||||||||||||||||||||
|
Bank of America Merrill Lynch International Designated Activity Company
|
NR | NR | NR | A+ | A-1 | Stable | AA- | F1+ | Stable | |||||||||||||||||||||||||||||||||||||||||||||||
|
Merrill Lynch, Pierce, Fenner & Smith Incorporated
|
NR | NR | NR | A+ | A-1 | Stable | AA- | F1+ | Stable | |||||||||||||||||||||||||||||||||||||||||||||||
| BofA Securities, Inc. | NR | NR | NR | A+ | A-1 | Stable | AA- | F1+ | Stable | |||||||||||||||||||||||||||||||||||||||||||||||
| Merrill Lynch International | NR | NR | NR | A+ | A-1 | Stable | AA- | F1+ | Stable | |||||||||||||||||||||||||||||||||||||||||||||||
| BofA Securities Europe SA | NR | NR | NR | A+ | A-1 | Stable | AA- | F1+ | Stable | |||||||||||||||||||||||||||||||||||||||||||||||
NR = not rated
Credit Risk Management
For information on our credit risk management activities, see Consumer Portfolio Credit Risk Management below, Commercial Portfolio Credit Risk Management on page 37, Non-U.S. Portfolio on page 43, Allowance for Credit Losses on page 44, and
Note 5 – Outstanding Loans and Leases and Allowance for Credit Losses
to the Consolidated Financial Statements.
During the nine months ended September 30, 2020, the COVID-19 pandemic negatively impacted economic activity in the U.S. and around the world. However, there were also positive signs during this period as parts of the economy began to reopen, and unemployment dropped from double-digit highs in the second quarter of 2020. To provide relief to individuals and businesses in the U.S., the President signed into law four economic stimulus packages in March and April 2020, including the CARES Act, and also signed an executive order in August 2020 to establish the Lost Wage Assistance Program. In addition, U.S. bank regulatory agencies also issued interagency guidance to financial institutions that are working with borrowers affected by COVID-19.
Consumer charge-offs remained low during the nine months ended September 30, 2020 due to payment deferrals and government stimulus benefits. However, we experienced increases in nonperforming loans and commercial reservable criticized utilized exposures as a result of weaker economic conditions arising from COVID-19, particularly in certain sectors of the economy that have been more significantly impacted during the pandemic (e.g., travel and entertainment).
To support our customers, we implemented various loan modification programs and other forms of support beginning in March 2020, including offering loan payment deferrals, refunding certain fees, and pausing foreclosure sales, evictions and repossessions. During the three months ended September 30, 2020, we experienced a decline in the need for customer assistance as the number of customer accounts and balances on deferral decreased significantly. For information on the accounting for loan modifications related to the COVID-19
pandemic, see
Note 1 – Summary of Significant Accounting Principles
to the Consolidated Financial Statements.
Consumer Portfolio Credit Risk Management
Credit risk management for the consumer portfolio begins with initial underwriting and continues throughout a borrower’s credit cycle. Statistical techniques in conjunction with experiential judgment are used in all aspects of portfolio management including underwriting, product pricing, risk appetite, setting credit limits, and establishing operating processes and metrics to quantify and balance risks and returns. Statistical models are built using detailed behavioral information from external sources such as credit bureaus and/or internal historical experience and are a component of our consumer credit risk management process. These models are used in part to assist in making both new and ongoing credit decisions, as well as portfolio management strategies, including authorizations and line management, collection practices and strategies, and determination of the allowance for loan and lease losses and allocated capital for credit risk.
Consumer Credit Portfolio
While COVID-19 is severely impacting economic activity, and is contributing to increasing delinquencies and nonperforming loans within certain consumer portfolios, it did not have a significant impact on consumer portfolio charge-offs during the three and nine months ended September 30, 2020 due to payment deferrals and government stimulus benefits. However, COVID-19 could lead to adverse impacts to credit quality metrics in future periods if negative economic conditions continue or worsen. Net charge-offs decreased $58 million to $564 million for the three months ended September 30, 2020 due to lower credit card losses and remained relatively flat at $2.2 billion for the nine months ended September 30, 2020.
The consumer allowance for loan and lease losses increased $6.1 billion during the nine months ended September 30, 2020 to $10.7 billion due to the adoption of the new CECL accounting standard and deterioration in the economic outlook resulting
|
Bank of America
30
|
||||||||
from the impact of COVID-19. For more information, see Allowance for Credit Losses on page 44.
For more information on our accounting policies regarding delinquencies, nonperforming status, charge-offs and TDRs for the consumer portfolio, see
Note 1 – Summary of Significant Accounting Principles
and
Note 5 – Outstanding Loans and Leases
to the Consolidated Financial Statements of the Corporation’s 2019 Annual Report on Form 10-K. For
information on our interest accrual policies and delinquency status for loan modifications related to the COVID-19 pandemic, see
Note 1 – Summary of Significant Accounting Principles
to the Consolidated Financial Statements.
Table 17 presents our outstanding consumer loans and leases, consumer nonperforming loans and accruing consumer loans past due 90 days or more.
| Table 17 | Consumer Credit Quality | |||||||||||||||||||||||||||||||||||||
| Outstandings | Nonperforming |
Accruing Past Due
90 Days or More |
||||||||||||||||||||||||||||||||||||
| (Dollars in millions) |
September 30
2020 |
December 31
2019 |
September 30
2020 |
December 31
2019 |
September 30
2020 |
December 31
2019 |
||||||||||||||||||||||||||||||||
|
Residential mortgage
(1)
|
$ | 232,718 | $ | 236,169 | $ | 1,675 | $ | 1,470 | $ | 837 | $ | 1,088 | ||||||||||||||||||||||||||
| Home equity | 36,530 | 40,208 | 640 | 536 | — | — | ||||||||||||||||||||||||||||||||
| Credit card | 79,834 | 97,608 | n/a | n/a | 546 | 1,042 | ||||||||||||||||||||||||||||||||
|
Direct/Indirect consumer
(2)
|
89,914 | 90,998 | 42 | 47 | 27 | 33 | ||||||||||||||||||||||||||||||||
| Other consumer | 140 | 192 | — | — | — | — | ||||||||||||||||||||||||||||||||
|
Consumer loans excluding loans accounted for under the fair value option
|
$ | 439,136 | $ | 465,175 | $ | 2,357 | $ | 2,053 | $ | 1,410 | $ | 2,163 | ||||||||||||||||||||||||||
|
Loans accounted for under the fair value option
(3)
|
657 | 594 | ||||||||||||||||||||||||||||||||||||
| Total consumer loans and leases | $ | 439,793 | $ | 465,769 | ||||||||||||||||||||||||||||||||||
|
Percentage of outstanding consumer loans and leases
(4)
|
0.54 | % | 0.44 | % | 0.32 | % | 0.47 | % | ||||||||||||||||||||||||||||||
|
Percentage of outstanding consumer loans and leases, excluding fully-insured loan portfolios
(4)
|
0.55 | 0.46 | 0.13 | 0.24 | ||||||||||||||||||||||||||||||||||
(1)
Residential mortgage loans accruing past due 90 days or more are fully-insured loans. At September 30, 2020 and December 31, 2019, residential mortgage includes $561 million and $740 million of loans on which interest had been curtailed by the FHA, and therefore were no longer accruing interest, although principal was still insured, and $276 million and $348 million of loans on which interest was still accruing.
(2)
Outstandings primarily include auto and specialty lending loans and leases of $47.1 billion and $50.4 billion, U.S. securities-based lending loans of $39.0 billion and $36.7 billion and non-U.S. consumer loans of $2.9 billion and $2.8 billion at September 30, 2020 and December 31, 2019.
(3)
Consumer loans accounted for under the fair value option include residential mortgage loans of $314 million and $257 million and home equity loans of $343 million and $337 million at September 30, 2020 and December 31, 2019. For more information on the fair value option, see
Note 15 – Fair Value Option
to the Consolidated Financial Statements.
(4)
Excludes consumer loans accounted for under the fair value option. At September 30, 2020 and December 31, 2019, $9 million and $6 million of loans accounted for under the fair value option were past due 90 days or more and not accruing interest.
n/a = not applicable
Table 18 presents net charge-offs and related ratios for consumer loans and leases.
| Table 18 | Consumer Net Charge-offs and Related Ratios | |||||||||||||||||||||||||||||||||||||||||||||||||
| Net Charge-offs |
Net Charge-off Ratios
(1)
|
|||||||||||||||||||||||||||||||||||||||||||||||||
|
Three Months Ended
September 30 |
Nine Months Ended
September 30 |
Three Months Ended
September 30 |
Nine Months Ended
September 30 |
|||||||||||||||||||||||||||||||||||||||||||||||
| (Dollars in millions) | 2020 | 2019 | 2020 | 2019 | 2020 | 2019 | 2020 | 2019 | ||||||||||||||||||||||||||||||||||||||||||
| Residential mortgage | $ | (6) | $ | (38) | $ | (27) | $ | (51) | (0.01) | % | (0.07) | % | (0.02) | % | (0.03) | % | ||||||||||||||||||||||||||||||||||
| Home equity | (20) | (202) | (45) | (346) | (0.21) | (1.85) | (0.16) | (1.02) | ||||||||||||||||||||||||||||||||||||||||||
| Credit card | 509 | 717 | 1,944 | 2,224 | 2.49 | 3.01 | 2.97 | 3.15 | ||||||||||||||||||||||||||||||||||||||||||
| Direct/Indirect consumer | 18 | 76 | 84 | 170 | 0.08 | 0.33 | 0.13 | 0.25 | ||||||||||||||||||||||||||||||||||||||||||
| Other consumer | 63 | 69 | 214 | 151 | n/m | n/m | n/m | n/m | ||||||||||||||||||||||||||||||||||||||||||
| Total | $ | 564 | $ | 622 | $ | 2,170 | $ | 2,148 | 0.50 | 0.55 | 0.64 | 0.64 | ||||||||||||||||||||||||||||||||||||||
(1)
Net charge-off ratios are calculated as annualized net charge-offs divided by average outstanding loans and leases excluding loans accounted for under the fair value option.
n/m = not meaningful
Table 19 presents outstandings, nonperforming balances, net charge-offs, allowance for credit losses and provision for credit losses for the core and non-core portfolios within the consumer real estate portfolio. We categorize consumer real estate loans as core and non-core based on loan and customer characteristics such as origination date, product type, LTV, Fair Isaac Corporation (FICO) score and delinquency status consistent with our current consumer and mortgage servicing strategy. Generally, loans that were originated after January 1, 2010, qualified under government-sponsored enterprise underwriting guidelines, or otherwise met our underwriting
guidelines in place in 2015 are characterized as core loans. All other loans are generally characterized as non-core loans and represent runoff portfolios. Core loans as reported in Table 19 include loans held in the
Consumer Banking
and
GWIM
segments, as well as loans held for ALM activities in
All Other
.
As shown in Table 19, outstanding core consumer real estate loans decreased $4.8 billion during the nine months ended September 30, 2020 driven by a decrease of $1.9 billion in residential mortgage and a $2.9 billion decrease in home equity.
|
31
Bank of America
|
||||||||
| Table 19 |
Consumer Real Estate Portfolio
(1)
|
|||||||||||||||||||||||||||||||||||||||||||||||||
| Outstandings | Nonperforming | Net Charge-offs | ||||||||||||||||||||||||||||||||||||||||||||||||
|
September 30
2020 |
December 31
2019 |
September 30
2020 |
December 31
2019 |
Three Months Ended
September 30 |
Nine Months Ended
September 30 |
|||||||||||||||||||||||||||||||||||||||||||||
| (Dollars in millions) | 2020 | 2019 | 2020 | 2019 | ||||||||||||||||||||||||||||||||||||||||||||||
| Core portfolio | ||||||||||||||||||||||||||||||||||||||||||||||||||
| Residential mortgage | $ | 223,895 | $ | 225,770 | $ | 1,057 | $ | 883 | $ | (3) | $ | (6) | $ | (23) | $ | (2) | ||||||||||||||||||||||||||||||||||
| Home equity | 32,338 | 35,226 | 451 | 363 | (4) | 8 | (1) | 39 | ||||||||||||||||||||||||||||||||||||||||||
| Total core portfolio | 256,233 | 260,996 | 1,508 | 1,246 | (7) | 2 | (24) | 37 | ||||||||||||||||||||||||||||||||||||||||||
| Non-core portfolio | ||||||||||||||||||||||||||||||||||||||||||||||||||
| Residential mortgage | 8,823 | 10,399 | 618 | 587 | (3) | (32) | (4) | (49) | ||||||||||||||||||||||||||||||||||||||||||
| Home equity | 4,192 | 4,982 | 189 | 173 | (16) | (210) | (44) | (385) | ||||||||||||||||||||||||||||||||||||||||||
| Total non-core portfolio | 13,015 | 15,381 | 807 | 760 | (19) | (242) | (48) | (434) | ||||||||||||||||||||||||||||||||||||||||||
|
Consumer real estate portfolio
|
||||||||||||||||||||||||||||||||||||||||||||||||||
| Residential mortgage | 232,718 | 236,169 | 1,675 | 1,470 | (6) | (38) | (27) | (51) | ||||||||||||||||||||||||||||||||||||||||||
| Home equity | 36,530 | 40,208 | 640 | 536 | (20) | (202) | (45) | (346) | ||||||||||||||||||||||||||||||||||||||||||
|
Total consumer real estate portfolio
|
$ | 269,248 | $ | 276,377 | $ | 2,315 | $ | 2,006 | $ | (26) | $ | (240) | $ | (72) | $ | (397) | ||||||||||||||||||||||||||||||||||
| Allowance for Credit Losses | Provision for Credit Losses | |||||||||||||||||||||||||||||||||||||||||||||||||
|
September 30
2020 |
December 31
2019 |
Three Months Ended
September 30 |
Nine Months Ended
September 30 |
|||||||||||||||||||||||||||||||||||||||||||||||
| 2020 | 2019 | 2020 | 2019 | |||||||||||||||||||||||||||||||||||||||||||||||
| Core portfolio | ||||||||||||||||||||||||||||||||||||||||||||||||||
| Residential mortgage | $ | 371 | $ | 229 | $ | 8 | $ | (4) | $ | 135 | $ | 3 | ||||||||||||||||||||||||||||||||||||||
| Home equity | 603 | 120 | (4) | (19) | 144 | (52) | ||||||||||||||||||||||||||||||||||||||||||||
| Total core portfolio | 974 | 349 | 4 | (23) | 279 | (49) | ||||||||||||||||||||||||||||||||||||||||||||
| Non-core portfolio | ||||||||||||||||||||||||||||||||||||||||||||||||||
| Residential mortgage | 86 | 96 | 2 | (39) | 78 | (91) | ||||||||||||||||||||||||||||||||||||||||||||
|
Home equity
(2)
|
(67) | 101 | (15) | (250) | (2) | (481) | ||||||||||||||||||||||||||||||||||||||||||||
| Total non-core portfolio | 19 | 197 | (13) | (289) | 76 | (572) | ||||||||||||||||||||||||||||||||||||||||||||
|
Consumer real estate portfolio
|
||||||||||||||||||||||||||||||||||||||||||||||||||
| Residential mortgage | 457 | 325 | 10 | (43) | 213 | (88) | ||||||||||||||||||||||||||||||||||||||||||||
|
Home equity
(3)
|
536 | 221 | (19) | (269) | 142 | (533) | ||||||||||||||||||||||||||||||||||||||||||||
|
Total consumer real estate portfolio
|
$ | 993 | $ | 546 | $ | (9) | $ | (312) | $ | 355 | $ | (621) | ||||||||||||||||||||||||||||||||||||||
(1)
Outstandings and nonperforming loans exclude loans accounted for under the fair value option. Consumer loans accounted for under the fair value option include residential mortgage loans of $314 million and $257 million and home equity loans of $343 million and $337 million at September 30, 2020 and December 31, 2019. For more information, see
Note 15 – Fair Value Option
to the Consolidated Financial Statements.
(2)
The home equity non-core allowance is in a negative position at September 30, 2020 as it includes expected recoveries of amounts previously charged off.
(3)
Home equity allowance includes a reserve for unfunded lending commitments of $138 million at September 30, 2020.
We believe that the presentation of information adjusted to exclude the impact of the fully-insured loan portfolio and loans accounted for under the fair value option is more representative of the ongoing operations and credit quality of the business. As a result, in the following tables and discussions of the residential mortgage and home equity portfolios, we exclude loans accounted for under the fair value option and provide information that excludes the impact of the fully-insured loan portfolio in certain credit quality statistics.
Residential Mortgage
The residential mortgage portfolio made up the largest percentage of our consumer loan portfolio at 53 percent of consumer loans and leases at September 30, 2020. Approximately 53 percent of the residential mortgage portfolio was in
Consumer Banking
and 39 percent was in
GWIM.
The remaining portion was in
All Other
and was comprised of loans used in our overall ALM activities, delinquent FHA loans repurchased pursuant to our servicing agreements with the
Government National Mortgage Association as well as loans repurchased related to our representations and warranties.
Outstanding balances in the residential mortgage portfolio decreased $3.5 billion during the nine months ended September 30, 2020 as both loan sales and runoff were partially offset by originations.
At September 30, 2020 and December 31, 2019, the residential mortgage portfolio included $11.7 billion and $18.7 billion of outstanding fully-insured loans, of which $3.0 billion and $11.2 billion had FHA insurance with the remainder protected by Fannie Mae long-term standby agreements. The decline was primarily driven by sales of loans with FHA insurance during the nine months ended September 30, 2020.
Table 20 presents certain residential mortgage key credit statistics on both a reported basis and excluding the fully-insured loan portfolio. The following discussion presents the residential mortgage portfolio excluding the fully-insured loan portfolio.
|
Bank of America
32
|
||||||||
| Table 20 | Residential Mortgage – Key Credit Statistics | |||||||||||||||||||||||||||||||||||||||||||
|
Reported Basis
(1)
|
Excluding Fully-insured Loans
(1)
|
|||||||||||||||||||||||||||||||||||||||||||
| (Dollars in millions) |
September 30
2020 |
December 31
2019 |
September 30
2020 |
December 31
2019 |
||||||||||||||||||||||||||||||||||||||||
| Outstandings | $ | 232,718 | $ | 236,169 | $ | 220,996 | $ | 217,479 | ||||||||||||||||||||||||||||||||||||
| Accruing past due 30 days or more | 2,607 | 3,108 | 1,394 | 1,296 | ||||||||||||||||||||||||||||||||||||||||
| Accruing past due 90 days or more | 837 | 1,088 | — | — | ||||||||||||||||||||||||||||||||||||||||
|
Nonperforming loans
(2)
|
1,675 | 1,470 | 1,675 | 1,470 | ||||||||||||||||||||||||||||||||||||||||
| Percent of portfolio | ||||||||||||||||||||||||||||||||||||||||||||
| Refreshed LTV greater than 90 but less than or equal to 100 | 2 | % | 2 | % | 2 | % | 2 | % | ||||||||||||||||||||||||||||||||||||
| Refreshed LTV greater than 100 | 1 | 1 | 1 | 1 | ||||||||||||||||||||||||||||||||||||||||
| Refreshed FICO below 620 | 2 | 3 | 1 | 2 | ||||||||||||||||||||||||||||||||||||||||
|
2006 and 2007 vintages
(3)
|
3 | 4 | 3 | 4 | ||||||||||||||||||||||||||||||||||||||||
(1)
Outstandings, accruing past due, nonperforming loans and percentages of portfolio exclude loans accounted for under the fair value option. For information on our interest accrual policies and delinquency status for loan modifications related to the COVID-19 pandemic, see
Note 1 – Summary of Significant Accounting Principles
to the Consolidated Financial Statements.
(2)
Includes loans that are contractually current which primarily consist of collateral-dependent TDRs, including those that have been discharged in Chapter 7 bankruptcy and loans that have not yet demonstrated a sustained period of payment performance following a TDR.
(3)
These vintages of loans accounted for $481 million, or 29 percent, and $365 million, or 25 percent, of nonperforming residential mortgage loans at September 30, 2020 and December 31, 2019.
Nonperforming outstanding balances in the residential mortgage portfolio increased $205 million during the nine months ended September 30, 2020 primarily driven by loans with deferrals that expired and have subsequently become nonperforming, and the inclusion of certain loans that, upon adoption of the new credit loss standard, became accounted for on an individual basis, which previously had been accounted for under a pool basis. Of the nonperforming residential mortgage loans at September 30, 2020, $531 million, or 32 percent, were current on contractual payments. Loans accruing past due 30 days or more increased $98 million driven primarily by borrowers whose deferrals expired throughout the year and have subsequently become delinquent.
Net charge-offs increased $32 million and $24 million to a net recovery of $6 million and $27 million for the three and nine months ended September 30, 2020 compared to the same periods in 2019. This increase is due largely to lower recoveries from the sales of previously charged-off loans.
Of the $221.0 billion in total residential mortgage loans outstanding at September 30, 2020, as shown in Table 20, 27 percent were originated as interest-only loans. The outstanding balance of interest-only residential mortgage loans that have entered the amortization period was $6.3 billion, or 11 percent, at September 30, 2020. Residential mortgage loans that have entered the amortization period generally have experienced a higher rate of early stage delinquencies and nonperforming status compared to the residential mortgage portfolio as a
whole. At September 30, 2020, $101 million, or two percent of outstanding interest-only residential mortgages that had entered the amortization period were accruing past due 30 days or more compared to $1.4 billion, or less than one percent, for the entire residential mortgage portfolio. In addition, at September 30, 2020, $329 million, or five percent, of outstanding interest-only residential mortgage loans that had entered the amortization period were nonperforming, of which $71 million were contractually current, compared to $1.7 billion, or one percent, for the entire residential mortgage portfolio. Loans that have yet to enter the amortization period in our interest-only residential mortgage portfolio are primarily well-collateralized loans to our wealth management clients and have an interest-only period of three to ten years. Approximately 97 percent of these loans that have yet to enter the amortization period will not be required to make a fully-amortizing payment until 2022 or later.
Table 21 presents outstandings, nonperforming loans and net charge-offs by certain state concentrations for the residential mortgage portfolio. The Los Angeles-Long Beach-Santa Ana Metropolitan Statistical Area (MSA) within California represented 16 percent of outstandings at both September 30, 2020 and December 31, 2019. In the New York area, the New York-Northern New Jersey-Long Island MSA made up 14 percent and 13 percent of outstandings at September 30, 2020 and December 31, 2019.
| Table 21 | Residential Mortgage State Concentrations | |||||||||||||||||||||||||||||||||||||||||||||||||
|
Outstandings
(1)
|
Nonperforming
(1)
|
Net Charge-offs | ||||||||||||||||||||||||||||||||||||||||||||||||
|
September 30
2020 |
December 31
2019 |
September 30
2020 |
December 31
2019 |
Three Months Ended
September 30 |
Nine Months Ended
September 30 |
|||||||||||||||||||||||||||||||||||||||||||||
| (Dollars in millions) | 2020 | 2019 | 2020 | 2019 | ||||||||||||||||||||||||||||||||||||||||||||||
| California | $ | 89,467 | $ | 88,998 | $ | 390 | $ | 274 | $ | (5) | $ | (12) | $ | (16) | $ | (22) | ||||||||||||||||||||||||||||||||||
| New York | 23,935 | 22,385 | 238 | 196 | 1 | 1 | 2 | 2 | ||||||||||||||||||||||||||||||||||||||||||
| Florida | 13,155 | 12,833 | 161 | 143 | (1) | (8) | (4) | (12) | ||||||||||||||||||||||||||||||||||||||||||
| Texas | 9,121 | 8,943 | 73 | 65 | — | — | — | (1) | ||||||||||||||||||||||||||||||||||||||||||
| New Jersey | 9,081 | 8,734 | 84 | 77 | (1) | (2) | (1) | (4) | ||||||||||||||||||||||||||||||||||||||||||
| Other | 76,237 | 75,586 | 729 | 715 | — | (17) | (8) | (14) | ||||||||||||||||||||||||||||||||||||||||||
| Residential mortgage loans | $ | 220,996 | $ | 217,479 | $ | 1,675 | $ | 1,470 | $ | (6) | $ | (38) | $ | (27) | $ | (51) | ||||||||||||||||||||||||||||||||||
| Fully-insured loan portfolio | 11,722 | 18,690 | ||||||||||||||||||||||||||||||||||||||||||||||||
|
Total residential mortgage loan portfolio
|
$ | 232,718 | $ | 236,169 | ||||||||||||||||||||||||||||||||||||||||||||||
(1)
Outstandings and nonperforming loans exclude loans accounted for under the fair value option.
|
33
Bank of America
|
||||||||
Home Equity
At September 30, 2020, the home equity portfolio made up eight percent of the consumer portfolio and was comprised of home equity lines of credit (HELOCs), home equity loans and reverse mortgages. We no longer originate home equity loans or reverse mortgages.
At September 30, 2020, our HELOC portfolio had an outstanding balance of $34.2 billion, or 94 percent of the total home equity portfolio, compared to $37.5 billion, or 93 percent, at December 31, 2019. HELOCs generally have an initial draw period of 10 years, and after the initial draw period ends, the loans generally convert to 15- or 20-year amortizing loans.
At September 30, 2020 and December 31, 2019, our home equity loan portfolio had an outstanding balance of $974 million and $1.2 billion, or three percent, of the total home equity portfolio. At September 30, 2020, our reverse mortgage portfolio had an outstanding balance of $1.3 billion, or three percent of the total home equity portfolio, compared to $1.5 billion, or four percent, at December 31, 2019.
At September 30, 2020, 80 percent of the home equity portfolio was in
Consumer Banking
, 12 percent was in
All Other
and the remainder of the portfolio was primarily in
GWIM
. Outstanding balances in the home equity portfolio decreased $3.7 billion during the nine months ended September 30, 2020 primarily due to paydowns outpacing new originations and draws on existing lines. Of the total home equity portfolio at September 30, 2020 and December 31, 2019, $14.3 billion, or 39 percent, and $15.0 billion, or 37 percent, were in first-lien positions. At September 30, 2020, outstanding balances in the home equity portfolio that were in a second-lien or more junior-lien position and where we also held the first-lien loan totaled $6.3 billion, or 17 percent, of our total home equity portfolio.
Unused HELOCs totaled $43.5 billion and $43.6 billion at September 30, 2020 and December 31, 2019. The HELOC utilization rate was 44 percent and 46 percent at September 30, 2020 and December 31, 2019.
Table 22 presents certain home equity portfolio key credit statistics.
| Table 22 |
Home Equity – Key Credit Statistics
(1)
|
||||||||||||||||
| (Dollars in millions) |
September 30
2020 |
December 31
2019 |
|||||||||||||||
| Outstandings | $ | 36,530 | $ | 40,208 | |||||||||||||
|
Accruing past due 30 days or more
(2)
|
215 | 218 | |||||||||||||||
|
Nonperforming loans
(2, 3)
|
640 | 536 | |||||||||||||||
| Percent of portfolio | |||||||||||||||||
| Refreshed CLTV greater than 90 but less than or equal to 100 | 1 | % | 1 | % | |||||||||||||
| Refreshed CLTV greater than 100 | 2 | 2 | |||||||||||||||
| Refreshed FICO below 620 | 3 | 3 | |||||||||||||||
|
2006 and 2007 vintages
(4)
|
16 | 18 | |||||||||||||||
(1)
Outstandings, accruing past due, nonperforming loans and percentages of the portfolio exclude loans accounted for under the fair value option. For information on our interest accrual policies and delinquency status for loan modifications related to the COVID-19 pandemic, see
Note 1 – Summary of Significant Accounting Principles
to the Consolidated Financial Statements.
(2)
Accruing past due 30 days or more include $30 million at both September 30, 2020 and December 31, 2019, and nonperforming loans include $84 million and $57 million of loans where we serviced the underlying first lien at September 30, 2020 and December 31, 2019.
(3)
Includes loans that are contractually current which primarily consist of collateral-dependent TDRs, including those that have been discharged in Chapter 7 bankruptcy, junior-lien loans where the underlying first lien is 90 days or more past due, as well as loans that have not yet demonstrated a sustained period of payment performance following a TDR.
(4)
These vintages of loans accounted for 36 percent and 34 percent of nonperforming home equity loans at September 30, 2020 and December 31, 2019.
Nonperforming outstanding balances in the home equity portfolio increased $104 million during the nine months ended September 30, 2020 primarily driven by loans with deferrals that expired and have subsequently become nonperforming
.
Of the nonperforming home equity loans at September 30, 2020, $262 million, or 41 percent, were current on contractual payments. In addition, $223 million, or 35 percent, of nonperforming home equity loans were 180 days or more past due and had been written down to the estimated fair value of the collateral, less costs to sell. Accruing loans that were 30 days or more past due decreased $3 million during the nine months ended September 30, 2020.
Net charge-offs increased $182 million to a net recovery of $20 million, and $301 million to a net recovery of $45 million for the three and nine months ended September 30, 2020 compared to the same periods in 2019 as the prior-year period included recoveries from non-core home equity loan sales.
Of the $36.5 billion in total home equity portfolio outstandings at September 30, 2020, as shown in Table 22, 15 percent require interest-only payments. The outstanding balance of HELOCs that have reached the end of their draw period and have entered the amortization period was $9.9 billion at September 30, 2020. The HELOCs that have entered the
amortization period have experienced a higher percentage of early stage delinquencies and nonperforming status when compared to the HELOC portfolio as a whole. At September 30, 2020, $145 million, or one percent of outstanding HELOCs that had entered the amortization period were accruing past due 30 days or more. In addition, at September 30, 2020, $473 million, or five percent, were nonperforming. Loans that have yet to enter the amortization period in our interest-only portfolio are primarily post-2008 vintages and generally have better credit quality than the previous vintages that had entered the amortization period. We communicate to contractually current customers more than a year prior to the end of their draw period to inform them of the potential change to the payment structure before entering the amortization period, and provide payment options to customers prior to the end of the draw period.
Although we do not actively track how many of our home equity customers pay only the minimum amount due on their home equity loans and lines, we can infer some of this information through a review of our HELOC portfolio that we service and that is still in its revolving period. During the three months ended September 30, 2020, 17 percent of these customers with an outstanding balance did not pay any principal on their HELOCs.
|
Bank of America
34
|
||||||||
Table 23 presents outstandings, nonperforming balances and net charge-offs by certain state concentrations for the home equity portfolio. In the New York area, the New York-Northern New Jersey-Long Island MSA made up 13 percent of the outstanding home equity portfolio at both September 30, 2020
and December 31, 2019. The Los Angeles-Long Beach-Santa Ana MSA within California made up 11 percent of the outstanding home equity portfolio at both September 30, 2020 and December 31, 2019.
| Table 23 | Home Equity State Concentrations | |||||||||||||||||||||||||||||||||||||||||||||||||
|
Outstandings
(1)
|
Nonperforming
(1)
|
Net Charge-offs | ||||||||||||||||||||||||||||||||||||||||||||||||
|
September 30
2020 |
December 31
2019 |
September 30
2020 |
December 31
2019 |
Three Months Ended
September 30 |
Nine Months Ended
September 30 |
|||||||||||||||||||||||||||||||||||||||||||||
| (Dollars in millions) | 2020 | 2019 | 2020 | 2019 | ||||||||||||||||||||||||||||||||||||||||||||||
| California | $ | 10,171 | $ | 11,232 | $ | 136 | $ | 101 | $ | (8) | $ | (54) | $ | (17) | $ | (109) | ||||||||||||||||||||||||||||||||||
| Florida | 3,916 | 4,327 | 82 | 71 | (2) | (30) | (7) | (72) | ||||||||||||||||||||||||||||||||||||||||||
| New Jersey | 2,925 | 3,216 | 67 | 56 | — | (13) | (1) | (11) | ||||||||||||||||||||||||||||||||||||||||||
| New York | 2,636 | 2,899 | 100 | 85 | (1) | (10) | — | (4) | ||||||||||||||||||||||||||||||||||||||||||
| Massachusetts | 1,826 | 2,023 | 34 | 29 | — | (6) | 1 | (6) | ||||||||||||||||||||||||||||||||||||||||||
| Other | 15,056 | 16,511 | 221 | 194 | (9) | (89) | (21) | (144) | ||||||||||||||||||||||||||||||||||||||||||
|
Total home equity loan
portfolio
|
$ | 36,530 | $ | 40,208 | $ | 640 | $ | 536 | $ | (20) | $ | (202) | $ | (45) | $ | (346) | ||||||||||||||||||||||||||||||||||
(1)
Outstandings and nonperforming loans exclude loans accounted for under the fair value option.
Credit Card
At September 30, 2020, 97 percent of the credit card portfolio was managed in
Consumer Banking
with the remainder in
GWIM
. Outstandings in the credit card portfolio decreased $17.8 billion during the nine months ended September 30, 2020 to $79.8 billion due to lower retail spending. Net charge-offs decreased $208 million to $509 million and $280 million to $1.9 billion during the three and nine months ended September 30, 2020 compared to the same periods in 2019 due to government stimulus benefits and payment deferrals associated with COVID-19. Credit card loans 30 days or more past due and still
accruing interest decreased $765 million and loans 90 days or more past due and still accruing interest decreased $496 million primarily due to government stimulus benefits and payment deferrals along with declines in loan balances associated with COVID-19.
Unused lines of credit for credit card increased to $344.6 billion at September 30, 2020 from $336.9 billion at December 31, 2019 driven by decreased consumer spending.
Table 24 presents certain state concentrations for the credit card portfolio.
| Table 24 | Credit Card State Concentrations | |||||||||||||||||||||||||||||||||||||||||||||||||
| Outstandings |
Accruing Past Due
90 Days or More
(1)
|
Net Charge-offs | ||||||||||||||||||||||||||||||||||||||||||||||||
|
September 30
2020 |
December 31
2019 |
September 30
2020 |
December 31
2019 |
Three Months Ended
September 30 |
Nine Months Ended
September 30 |
|||||||||||||||||||||||||||||||||||||||||||||
| (Dollars in millions) | 2020 | 2019 | 2020 | 2019 | ||||||||||||||||||||||||||||||||||||||||||||||
| California | $ | 12,820 | $ | 16,135 | $ | 96 | $ | 178 | $ | 92 | $ | 132 | $ | 347 | $ | 398 | ||||||||||||||||||||||||||||||||||
| Florida | 7,634 | 9,075 | 73 | 135 | 66 | 90 | 252 | 272 | ||||||||||||||||||||||||||||||||||||||||||
| Texas | 6,578 | 7,815 | 51 | 93 | 45 | 58 | 166 | 180 | ||||||||||||||||||||||||||||||||||||||||||
| New York | 4,799 | 5,975 | 44 | 80 | 43 | 63 | 154 | 183 | ||||||||||||||||||||||||||||||||||||||||||
| Washington | 3,696 | 4,639 | 13 | 26 | 12 | 17 | 47 | 53 | ||||||||||||||||||||||||||||||||||||||||||
| Other | 44,307 | 53,969 | 269 | 530 | 251 | 357 | 978 | 1,138 | ||||||||||||||||||||||||||||||||||||||||||
| Total credit card portfolio | $ | 79,834 | $ | 97,608 | $ | 546 | $ | 1,042 | $ | 509 | $ | 717 | $ | 1,944 | $ | 2,224 | ||||||||||||||||||||||||||||||||||
(1)
For information on our interest accrual policies and delinquency status for loan modifications related to the COVID-19 pandemic, see
Note 1 – Summary of Significant Accounting Principles
to the Consolidated Financial Statements.
Direct/Indirect Consumer
At September 30, 2020, 53 percent of the direct/indirect portfolio was included in
Consumer Banking
(consumer auto and specialty lending – automotive, recreational vehicle, marine, aircraft and consumer personal loans) and 47 percent was
included in
GWIM
(principally securities-based lending loans). Outstandings in the direct/indirect portfolio decreased $1.1 billion during the nine months ended September 30, 2020 to $89.9 billion primarily due to lower originations in Auto.
|
35
Bank of America
|
||||||||
Table 25 presents certain state concentrations for the direct/indirect consumer loan portfolio.
| Table 25 | Direct/Indirect State Concentrations | |||||||||||||||||||||||||||||||||||||||||||||||||
| Outstandings |
Accruing Past Due
90 Days or More (1) |
Net Charge-offs | ||||||||||||||||||||||||||||||||||||||||||||||||
|
September 30
2020 |
December 31
2019 |
September 30
2020 |
December 31
2019 |
Three Months Ended
September 30 |
Nine Months Ended
September 30 |
|||||||||||||||||||||||||||||||||||||||||||||
| (Dollars in millions) | 2020 | 2019 | 2020 | 2019 | ||||||||||||||||||||||||||||||||||||||||||||||
| California | $ | 11,950 | $ | 11,912 | $ | 3 | $ | 4 | $ | 2 | $ | 32 | $ | 13 | $ | 44 | ||||||||||||||||||||||||||||||||||
| Florida | 10,581 | 10,154 | 4 | 4 | 3 | 5 | 14 | 21 | ||||||||||||||||||||||||||||||||||||||||||
| Texas | 8,915 | 9,516 | 3 | 5 | 4 | 8 | 13 | 23 | ||||||||||||||||||||||||||||||||||||||||||
| New York | 6,542 | 6,394 | 2 | 1 | 2 | 3 | 6 | 9 | ||||||||||||||||||||||||||||||||||||||||||
| New Jersey | 3,472 | 3,468 | — | 1 | — | 1 | 1 | 3 | ||||||||||||||||||||||||||||||||||||||||||
| Other | 48,454 | 49,554 | 15 | 18 | 7 | 27 | 37 | 70 | ||||||||||||||||||||||||||||||||||||||||||
|
Total direct/indirect loan
portfolio |
$ | 89,914 | $ | 90,998 | $ | 27 | $ | 33 | $ | 18 | $ | 76 | $ | 84 | $ | 170 | ||||||||||||||||||||||||||||||||||
(1)
For information on our interest accrual policies and delinquency status for loan modifications related to the COVID-19 pandemic, see
Note 1 – Summary of Significant Accounting Principles
to the Consolidated Financial Statements.
Nonperforming Consumer Loans, Leases and Foreclosed Properties Activity
Table 26 presents nonperforming consumer loans, leases and foreclosed properties activity for the three and nine months ended September 30, 2020 and 2019. During the nine months ended September 30, 2020, nonperforming consumer loans increased $304 million to $2.4 billion primarily driven by loans with deferrals that expired and have subsequently become nonperforming, as well as the inclusion of $137 million of certain loans that were previously classified as purchased credit-impaired loans and accounted for under a pool basis.
At September 30, 2020, $791 million, or 34 percent of nonperforming loans were 180 days or more past due and had been written down to their estimated property value less costs to sell. In addition, at September 30, 2020, $831 million, or 35 percent of nonperforming consumer loans were modified and
are now current after successful trial periods, or are current loans classified as nonperforming loans in accordance with applicable policies.
Foreclosed properties decreased $94 million during the nine months ended September 30, 2020 to $135 million as liquidations outpaced additions.
Nonperforming loans also include certain loans that have been modified in TDRs where economic concessions have been granted to borrowers experiencing financial difficulties. Nonperforming TDRs are included in Table 26. For more information on our loan modification programs offered in response to the COVID-19 pandemic, which are not TDRs, see Executive Summary - Recent Developments – COVID-19 Pandemic on page 3 and
Note 1 – Summary of Significant Accounting Principles
to the Consolidated Financial Statements.
| Table 26 | Nonperforming Consumer Loans, Leases and Foreclosed Properties Activity | |||||||||||||||||||||||||
|
Three Months Ended
September 30 |
Nine Months Ended
September 30 |
|||||||||||||||||||||||||
| (Dollars in millions) | 2020 | 2019 | 2020 | 2019 | ||||||||||||||||||||||
| Nonperforming loans and leases, beginning of period | $ | 2,191 | $ | 3,027 | $ | 2,053 | $ | 3,842 | ||||||||||||||||||
| Additions | 587 | 335 | 1,418 | 1,116 | ||||||||||||||||||||||
| Reductions: | ||||||||||||||||||||||||||
| Paydowns and payoffs | (113) | (197) | (303) | (580) | ||||||||||||||||||||||
| Sales | — | (748) | (31) | (1,414) | ||||||||||||||||||||||
|
Returns to performing status
(1)
|
(291) | (185) | (689) | (623) | ||||||||||||||||||||||
| Charge-offs | (13) | (23) | (62) | (80) | ||||||||||||||||||||||
| Transfers to foreclosed properties | (4) | (20) | (29) | (72) | ||||||||||||||||||||||
| Total net additions/(reductions) to nonperforming loans and leases | 166 | (838) | 304 | (1,653) | ||||||||||||||||||||||
| Total nonperforming loans and leases, September 30 | 2,357 | 2,189 | 2,357 | 2,189 | ||||||||||||||||||||||
|
Foreclosed properties, September 30
(2)
|
135 | 188 | 135 | 188 | ||||||||||||||||||||||
| Nonperforming consumer loans, leases and foreclosed properties, September 30 | $ | 2,492 | $ | 2,377 | $ | 2,492 | $ | 2,377 | ||||||||||||||||||
|
Nonperforming consumer loans and leases as a percentage of outstanding consumer loans and leases
(3)
|
0.54 | % | 0.48 | % | ||||||||||||||||||||||
|
Nonperforming consumer loans, leases and foreclosed properties as a percentage of outstanding consumer loans, leases and foreclosed properties
(3)
|
0.57 | 0.52 | ||||||||||||||||||||||||
(1)
Consumer loans may be returned to performing status when all principal and interest is current and full repayment of the remaining contractual principal and interest is expected, or when the loan otherwise becomes well-secured and is in the process of collection.
(2)
Foreclosed property balances do not include properties insured by certain government-guaranteed loans, principally FHA-insured, of $131 million and $275 million at September 30, 2020 and 2019.
(3)
Outstanding consumer loans and leases exclude loans accounted for under the fair value option.
|
Bank of America
36
|
||||||||
Table 27 presents TDRs for the consumer real estate portfolio. Performing TDR balances are excluded from nonperforming loans and leases in Table 26. For more information on our loan modification programs offered in response to the COVID-19 pandemic, which are not TDRs, see Executive Summary - Recent Developments – COVID-19 Pandemic on page 3.
| Table 27 | Consumer Real Estate Troubled Debt Restructurings | |||||||||||||||||||||||||||||||||||||
| September 30, 2020 | December 31, 2019 | |||||||||||||||||||||||||||||||||||||
| (Dollars in millions) | Nonperforming | Performing | Total | Nonperforming | Performing | Total | ||||||||||||||||||||||||||||||||
|
Residential mortgage
(1, 2)
|
$ | 852 | $ | 3,079 | $ | 3,931 | $ | 921 | $ | 3,832 | $ | 4,753 | ||||||||||||||||||||||||||
|
Home equity
(3)
|
241 | 876 | 1,117 | 252 | 977 | 1,229 | ||||||||||||||||||||||||||||||||
| Total consumer real estate troubled debt restructurings | $ | 1,093 | $ | 3,955 | $ | 5,048 | $ | 1,173 | $ | 4,809 | $ | 5,982 | ||||||||||||||||||||||||||
(1)
At September 30, 2020 and December 31, 2019, residential mortgage TDRs deemed collateral dependent totaled $1.1 billion and $1.2 billion, and included $709 million and $748 million of loans classified as nonperforming and $386 million and $468 million of loans classified as performing.
(2)
At September 30, 2020 and December 31, 2019, residential mortgage performing TDRs include $1.6 billion and $2.1 billion of loans that were fully-insured.
(3)
At September 30, 2020 and December 31, 2019, home equity TDRs deemed collateral dependent totaled $408 million and $442 million, and include $206 million and $209 million of loans classified as nonperforming and $202 million and $233 million of loans classified as performing.
In addition to modifying consumer real estate loans, we work with customers who are experiencing financial difficulty by modifying credit card and other consumer loans. Credit card and other consumer loan modifications generally involve a reduction in the customer’s interest rate on the account and placing the customer on a fixed payment plan not exceeding 60 months.
Modifications of credit card and other consumer loans are made through programs utilizing direct customer contact, but may also utilize external programs. At September 30, 2020 and December 31, 2019, our credit card and other consumer TDR portfolio was $699 million and $679 million, of which $624 million and $570 million were current or less than 30 days past due under the modified terms.
Commercial Portfolio Credit Risk Management
Commercial credit risk is evaluated and managed with the goal that concentrations of credit exposure continue to be aligned with our risk appetite. We review, measure and manage concentrations of credit exposure by industry, product, geography, customer relationship and loan size. We also review, measure and manage commercial real estate loans by geographic location and property type. In addition, within our non-U.S. portfolio, we evaluate exposures by region and by country. Tables 32, 35 and 38 summarize our concentrations. We also utilize syndications of exposure to third parties, loan sales, hedging and other risk mitigation techniques to manage the size and risk profile of the commercial credit portfolio. For more information on our industry concentrations, see Commercial Portfolio Credit Risk Management – Industry Concentrations on page 41 and Table 35.
For more information on our accounting policies regarding delinquencies, nonperforming status, net charge-offs and TDRs for the commercial portfolio, see
Note 1 – Summary of Significant Accounting Principles
to the Consolidated Financial Statements of the Corporation’s 2019 Annual Report on Form 10-K.
For information on the accounting for loan modifications related to the COVID-19 pandemic, see
Note 1 – Summary of Significant Accounting Principles
to the Consolidated Financial Statements.
Commercial Credit Portfolio
During the nine months ended September 30, 2020, commercial asset quality weakened as a result of the economic impact from COVID-19. However, there were also positive signs during this period. The draws by large corporate and commercial clients contributing to the $67.2 billion loan growth in the first quarter of 2020 have largely been repaid over the past six months as emergency or contingent funding was no longer needed or clients were able to access capital markets. Additionally, as part of the CARES Act, we had $24.7 billion of PPP loans outstanding with our small business clients at September 30, 2020, which are included in U.S. small business commercial in the tables in this section. For more information on PPP loans, see
Note 1 – Summary of Significant Accounting Principles
to the Consolidated Financial Statements.
Credit quality of commercial real estate borrowers has begun to stabilize in many sectors as certain economies have reopened. Certain sectors, including hospitality and retail, continue to be negatively impacted as a result of COVID-19. Moreover, many real estate markets, while improving, are still experiencing some disruptions in demand, supply chain challenges and tenant difficulties.
The commercial allowance for loan and lease losses increased $4.0 billion during the nine months ended September 30, 2020 to $8.9 billion due to the deterioration in the economic outlook resulting from the impact of COVID-19. For more information, see Allowance for Credit Losses on page 44.
Total commercial utilized credit exposure decreased $4.1 billion during the nine months ended September 30, 2020 to $631.2 billion driven by lower loans held-for-sale (LHFS) and lower loans and leases. The utilization rate for loans and leases, standby letters of credit (SBLCs) and financial guarantees, and commercial letters of credit, in the aggregate, was 58 percent at both September 30, 2020 and December 31, 2019.
|
37
Bank of America
|
||||||||
Table 28 presents commercial credit exposure by type for utilized, unfunded and total binding committed credit exposure. Commercial utilized credit exposure includes SBLCs and financial guarantees and commercial letters of credit that have been issued and for which we are legally bound to advance
funds under prescribed conditions during a specified time period, and excludes exposure related to trading account assets. Although funds have not yet been advanced, these exposure types are considered utilized for credit risk management purposes.
| Table 28 | Commercial Credit Exposure by Type | |||||||||||||||||||||||||||||||||||||
|
Commercial Utilized
(1)
|
Commercial Unfunded
(2, 3, 4)
|
Total Commercial Committed | ||||||||||||||||||||||||||||||||||||
| (Dollars in millions) |
September 30
2020 |
December 31
2019 |
September 30
2020 |
December 31
2019 |
September 30
2020 |
December 31
2019 |
||||||||||||||||||||||||||||||||
| Loans and leases | $ | 515,379 | $ | 517,657 | $ | 396,920 | $ | 405,834 | $ | 912,299 | $ | 923,491 | ||||||||||||||||||||||||||
|
Derivative assets
(5)
|
44,297 | 40,485 | — | — | 44,297 | 40,485 | ||||||||||||||||||||||||||||||||
| Standby letters of credit and financial guarantees | 35,406 | 36,062 | 531 | 468 | 35,937 | 36,530 | ||||||||||||||||||||||||||||||||
| Debt securities and other investments | 24,049 | 25,546 | 5,066 | 5,101 | 29,115 | 30,647 | ||||||||||||||||||||||||||||||||
| Loans held-for-sale | 3,732 | 7,047 | 6,553 | 15,135 | 10,285 | 22,182 | ||||||||||||||||||||||||||||||||
| Operating leases | 6,482 | 6,660 | — | — | 6,482 | 6,660 | ||||||||||||||||||||||||||||||||
| Commercial letters of credit | 817 | 1,049 | 296 | 451 | 1,113 | 1,500 | ||||||||||||||||||||||||||||||||
| Other | 1,033 | 800 | — | — | 1,033 | 800 | ||||||||||||||||||||||||||||||||
| Total | $ | 631,195 | $ | 635,306 | $ | 409,366 | $ | 426,989 | $ | 1,040,561 | $ | 1,062,295 | ||||||||||||||||||||||||||
(1)
Commercial utilized exposure includes loans of $6.6 billion and $7.7 billion and issued letters of credit with a notional amount of $121 million and $170 million accounted for under the fair value option at September 30, 2020 and December 31, 2019.
(2)
Commercial unfunded exposure includes commitments accounted for under the fair value option with a notional amount of $3.2 billion and $4.2 billion at September 30, 2020 and December 31, 2019.
(3)
Excludes unused business card lines, which are not legally binding.
(4)
Includes the notional amount of unfunded legally binding lending commitments net of amounts distributed (i.e., syndicated or participated) to other financial institutions. The distributed amounts were $10.3 billion and $10.6 billion at September 30, 2020 and December 31, 2019.
(5)
Derivative assets are carried at fair value, reflect the effects of legally enforceable master netting agreements and have been reduced by cash collateral of $41.3 billion and $33.9 billion at September 30, 2020 and December 31, 2019. Not reflected in utilized and committed exposure is additional non-cash derivative collateral held of $35.0 billion and $35.2 billion at September 30, 2020 and December 31, 2019, which consists primarily of other marketable securities.
Outstanding commercial loans and leases decreased $2.3 billion during the nine months ended September 30, 2020 primarily due to repayments, partially offset by $24.7 billion of PPP loans outstanding at September 30, 2020. Nonperforming commercial loans increased $694 million across industries, and commercial reservable criticized utilized exposure increased
$24.3 billion spread across several industries, including travel and entertainment, as a result of weaker economic conditions arising from COVID-19. Table 29 presents our commercial loans and leases portfolio and related credit quality information at September 30, 2020 and December 31, 2019.
| Table 29 | Commercial Credit Quality | |||||||||||||||||||||||||||||||||||||
| Outstandings | Nonperforming |
Accruing Past Due
90 Days or More
(3)
|
||||||||||||||||||||||||||||||||||||
| (Dollars in millions) |
September 30
2020 |
December 31
2019 |
September 30
2020 |
December 31
2019 |
September 30
2020 |
December 31
2019 |
||||||||||||||||||||||||||||||||
| Commercial and industrial: | ||||||||||||||||||||||||||||||||||||||
| U.S. commercial | $ | 293,934 | $ | 307,048 | $ | 1,351 | $ | 1,094 | $ | 199 | $ | 106 | ||||||||||||||||||||||||||
| Non-U.S. commercial | 96,151 | 104,966 | 338 | 43 | 28 | 8 | ||||||||||||||||||||||||||||||||
| Total commercial and industrial | 390,085 | 412,014 | 1,689 | 1,137 | 227 | 114 | ||||||||||||||||||||||||||||||||
| Commercial real estate | 62,454 | 62,689 | 414 | 280 | 2 | 19 | ||||||||||||||||||||||||||||||||
| Commercial lease financing | 17,413 | 19,880 | 14 | 32 | 32 | 20 | ||||||||||||||||||||||||||||||||
| 469,952 | 494,583 | 2,117 | 1,449 | 261 | 153 | |||||||||||||||||||||||||||||||||
|
U.S. small business commercial
(1)
|
38,850 | 15,333 | 76 | 50 | 77 | 97 | ||||||||||||||||||||||||||||||||
| Commercial loans excluding loans accounted for under the fair value option | 508,802 | 509,916 | 2,193 | 1,499 | 338 | 250 | ||||||||||||||||||||||||||||||||
|
Loans accounted for under the fair value option
(2)
|
6,577 | 7,741 | ||||||||||||||||||||||||||||||||||||
| Total commercial loans and leases | $ | 515,379 | $ | 517,657 | ||||||||||||||||||||||||||||||||||
(1)
Includes card-related products.
(2)
Commercial loans accounted for under the fair value option include U.S. commercial of $3.4 billion and $4.7 billion and non-U.S. commercial of $3.2 billion and $3.1 billion at September 30, 2020 and December 31, 2019. For more information on the fair value option, see
Note 15 – Fair Value Option
to the Consolidated Financial Statements.
(3)
For information on our interest accrual policies and delinquency status for loan modifications related to the COVID-19 pandemic, see
Note 1 – Summary of Significant Accounting Principles
to the Consolidated Financial Statements.
|
Bank of America
38
|
||||||||
Table 30 presents net charge-offs and related ratios for our commercial loans and leases for the three and nine months ended September 30, 2020 and 2019.
| Table 30 | Commercial Net Charge-offs and Related Ratios | |||||||||||||||||||||||||||||||||||||||||||||||||
| Net Charge-offs |
Net Charge-off Ratios
(1)
|
|||||||||||||||||||||||||||||||||||||||||||||||||
|
Three Months Ended
September 30 |
Nine Months Ended
September 30 |
Three Months Ended
September 30 |
Nine Months Ended
September 30 |
|||||||||||||||||||||||||||||||||||||||||||||||
| (Dollars in millions) | 2020 | 2019 | 2020 | 2019 | 2020 | 2019 | 2020 | 2019 | ||||||||||||||||||||||||||||||||||||||||||
| Commercial and industrial: | ||||||||||||||||||||||||||||||||||||||||||||||||||
| U.S. commercial | $ | 154 | $ | 53 | $ | 536 | $ | 202 | 0.20 | % | 0.07 | % | 0.23 | % | 0.09 | % | ||||||||||||||||||||||||||||||||||
| Non-U.S. commercial | 57 | 67 | 90 | 115 | 0.23 | 0.26 | 0.11 | 0.15 | ||||||||||||||||||||||||||||||||||||||||||
| Total commercial and industrial | 211 | 120 | 626 | 317 | 0.21 | 0.12 | 0.20 | 0.11 | ||||||||||||||||||||||||||||||||||||||||||
| Commercial real estate | 106 | (1) | 169 | 8 | 0.66 | — | 0.35 | 0.02 | ||||||||||||||||||||||||||||||||||||||||||
| Commercial lease financing | 24 | 1 | 60 | 14 | 0.53 | 0.02 | 0.43 | 0.09 | ||||||||||||||||||||||||||||||||||||||||||
| 341 | 120 | 855 | 339 | 0.28 | 0.10 | 0.23 | 0.09 | |||||||||||||||||||||||||||||||||||||||||||
| U.S. small business commercial | 67 | 69 | 215 | 202 | 0.69 | 1.83 | 1.01 | 1.83 | ||||||||||||||||||||||||||||||||||||||||||
| Total commercial | $ | 408 | $ | 189 | $ | 1,070 | $ | 541 | 0.31 | 0.15 | 0.27 | 0.15 | ||||||||||||||||||||||||||||||||||||||
(1)
Net charge-off ratios are calculated as net charge-offs divided by average outstanding loans and leases excluding loans accounted for under the fair value option.
Table 31 presents commercial reservable criticized utilized exposure by loan type. Criticized exposure corresponds to the Special Mention, Substandard and Doubtful asset categories as defined by regulatory authorities. Total commercial reservable criticized utilized exposure increased $24.3 billion during the nine months ended September 30, 2020, which was spread across several industries, including travel and entertainment, as a result of weaker economic conditions arising from COVID-19. At September 30, 2020 and December 31, 2019, 84 percent and 90 percent of commercial reservable criticized utilized exposure was secured.
| Table 31 |
Commercial Reservable Criticized Utilized Exposure
(1, 2)
|
|||||||||||||||||||||||||
| (Dollars in millions) | September 30, 2020 | December 31, 2019 | ||||||||||||||||||||||||
| Commercial and industrial: | ||||||||||||||||||||||||||
| U.S. commercial | $ | 22,223 | 6.88 | % | $ | 8,272 | 2.46 | % | ||||||||||||||||||
| Non-U.S. commercial | 4,381 | 4.30 | 989 | 0.89 | ||||||||||||||||||||||
| Total commercial and industrial | 26,604 | 6.26 | 9,261 | 2.07 | ||||||||||||||||||||||
| Commercial real estate | 7,001 | 10.89 | 1,129 | 1.75 | ||||||||||||||||||||||
| Commercial lease financing | 657 | 3.77 | 329 | 1.66 | ||||||||||||||||||||||
| 34,262 | 6.76 | 10,719 | 2.01 | |||||||||||||||||||||||
| U.S. small business commercial | 1,448 | 3.73 | 733 | 4.78 | ||||||||||||||||||||||
|
Total commercial reservable criticized utilized exposure
(1)
|
$ | 35,710 | 6.55 | $ | 11,452 | 2.09 | ||||||||||||||||||||
(1)
Total commercial reservable criticized utilized exposure includes loans and leases of $33.9 billion and $10.7 billion and commercial letters of credit of $1.8 billion and $715 million at September 30, 2020 and December 31, 2019.
(2)
Percentages are calculated as commercial reservable criticized utilized exposure divided by total commercial reservable utilized exposure for each exposure category.
Commercial and Industrial
Commercial and industrial loans include U.S. commercial and non-U.S. commercial portfolios.
U.S. Commercial
At September 30, 2020, 66 percent of the U.S. commercial loan portfolio, excluding small business, was managed in
Global Banking,
17 percent in
Global Markets
, 15 percent in
GWIM
(generally business-purpose loans for high net worth clients) and the remainder primarily in
Consumer Banking
. U.S. commercial loans decreased $13.1 billion during the nine months ended September 30, 2020 primarily in
Global Banking
. Reservable criticized utilized exposure increased $14.0 billion, which was spread across several industries, including travel and entertainment, as a result of weaker economic conditions arising from COVID-19.
Non-U.S. Commercial
At September 30, 2020, 81 percent of the non-U.S. commercial loan portfolio was managed in
Global Banking
and 19 percent in
Global Markets
. Non-U.S. commercial loans decreased $8.8 billion during the nine months ended September 30, 2020, primarily in
Global Banking
. For information on the non-U.S. commercial portfolio, see Non-U.S. Portfolio on page 43.
Commercial Real Estate
Commercial real estate primarily includes commercial loans secured by non-owner-occupied real estate and is dependent on the sale or lease of the real estate as the primary source of repayment. Outstanding loans remained relatively flat at $62.5 billion at September 30, 2020 as paydowns were offset by new originations and increased utilizations under existing credit facilities. Reservable criticized utilized exposure increased $5.9 billion due to downgrades driven by the impact of COVID-19 across industries, led by hotels. Although we have observed property-level improvements in a number of the most impacted sectors, the length of time for recovery has been slower than originally anticipated, which has prompted these downgrades. The portfolio remains diversified across property types and geographic regions. California represented the largest state concentration at 23 percent and 24 percent of the commercial real estate portfolio at September 30, 2020 and December 31, 2019. The commercial real estate portfolio is predominantly managed in
Global Banking
and consists of loans made primarily to public and private developers, and commercial real estate firms.
For the three and nine months ended September 30, 2020, we continued to see low default rates and varying degrees of improvement in the non-residential portfolio. We use a number of proactive risk mitigation initiatives to reduce adversely rated exposure in the commercial real estate portfolio, including
|
39
Bank of America
|
||||||||
transfers of deteriorating exposures to management by independent special asset officers and the pursuit of loan restructurings or asset sales to achieve the best results for our customers and the Corporation.
Table 32 presents outstanding commercial real estate loans by geographic region, based on the geographic location of the collateral, and by property type.
| Table 32 | Outstanding Commercial Real Estate Loans | |||||||||||||
| (Dollars in millions) |
September 30
2020 |
December 31
2019 |
||||||||||||
| By Geographic Region | ||||||||||||||
| California | $ | 14,364 | $ | 14,910 | ||||||||||
| Northeast | 12,030 | 12,408 | ||||||||||||
| Southwest | 9,070 | 8,408 | ||||||||||||
| Southeast | 6,637 | 5,937 | ||||||||||||
| Florida | 4,262 | 3,984 | ||||||||||||
| Midwest | 3,226 | 3,203 | ||||||||||||
| Illinois | 3,028 | 3,349 | ||||||||||||
| Midsouth | 2,496 | 2,468 | ||||||||||||
| Northwest | 1,598 | 1,638 | ||||||||||||
| Non-U.S. | 3,707 | 3,724 | ||||||||||||
|
Other
(1)
|
2,036 | 2,660 | ||||||||||||
|
Total outstanding commercial real estate loans
|
$ | 62,454 | $ | 62,689 | ||||||||||
| By Property Type | ||||||||||||||
| Non-residential | ||||||||||||||
| Office | $ | 17,650 | $ | 17,902 | ||||||||||
| Industrial / Warehouse | 9,289 | 8,677 | ||||||||||||
| Shopping centers / Retail | 7,850 | 8,183 | ||||||||||||
| Multi-family rental | 7,524 | 7,250 | ||||||||||||
| Hotels / Motels | 7,418 | 6,982 | ||||||||||||
| Unsecured | 2,598 | 3,438 | ||||||||||||
| Multi-use | 1,709 | 1,788 | ||||||||||||
| Other | 7,420 | 6,958 | ||||||||||||
| Total non-residential | 61,458 | 61,178 | ||||||||||||
| Residential | 996 | 1,511 | ||||||||||||
|
Total outstanding commercial real estate loans
|
$ | 62,454 | $ | 62,689 | ||||||||||
(1)
Includes unsecured loans to real estate investment trusts and national home builders whose portfolios of properties span multiple geographic regions and properties in the states of Colorado, Utah, Hawaii, Wyoming and Montana.
U.S. Small Business Commercial
The U.S. small business commercial loan portfolio is comprised of small business card loans and small business loans primarily managed in
Consumer Banking,
and includes $24.7 billion of PPP loans outstanding at September 30, 2020. Excluding PPP, credit card-related products were 51 percent and 52 percent of the U.S. small business commercial portfolio at September 30, 2020 and December 31, 2019. Of the U.S. small business commercial net charge-offs, 93 percent were credit card-related products for the three and nine months ended September 30, 2020 compared to 92 percent and 95 percent for the same periods in 2019.
Nonperforming Commercial Loans, Leases and Foreclosed Properties Activity
Table 33 presents the nonperforming commercial loans, leases and foreclosed properties activity during the three and nine months ended September 30, 2020 and 2019. Nonperforming loans do not include loans accounted for under the fair value option. During the nine months ended September 30, 2020, nonperforming commercial loans and leases increased $694 million to $2.2 billion, primarily driven by the impact of COVID-19. At September 30, 2020, 85 percent of commercial nonperforming loans, leases and foreclosed properties were secured and 63 percent were contractually current. Commercial nonperforming loans were carried at 78 percent of their unpaid principal balance before consideration of the allowance for loan and lease losses, as the carrying value of these loans has been reduced to the estimated collateral value less costs to sell.
|
Bank of America
40
|
||||||||
| Table 33 |
Nonperforming Commercial Loans, Leases and Foreclosed Properties Activity
(1, 2)
|
||||||||||||||||||||||
|
Three Months Ended
September 30 |
Nine Months Ended
September 30 |
||||||||||||||||||||||
| (Dollars in millions) | 2020 | 2019 | 2020 | 2019 | |||||||||||||||||||
| Nonperforming loans and leases, beginning of period | $ | 2,202 | $ | 1,160 | $ | 1,499 | $ | 1,102 | |||||||||||||||
| Additions | 656 | 492 | 2,326 | 1,521 | |||||||||||||||||||
| Reductions: | |||||||||||||||||||||||
| Paydowns | (216) | (161) | (605) | (479) | |||||||||||||||||||
| Sales | (50) | (33) | (76) | (193) | |||||||||||||||||||
|
Returns to performing status
(3)
|
(21) | (48) | (45) | (105) | |||||||||||||||||||
| Charge-offs | (367) | (123) | (895) | (371) | |||||||||||||||||||
| Transfers to foreclosed properties | — | — | — | (7) | |||||||||||||||||||
| Transfers to loans held-for-sale | (11) | — | (11) | (181) | |||||||||||||||||||
| Total net additions/(reductions) to nonperforming loans and leases | (9) | 127 | 694 | 185 | |||||||||||||||||||
| Total nonperforming loans and leases, September 30 | 2,193 | 1,287 | 2,193 | 1,287 | |||||||||||||||||||
| Foreclosed properties, September 30 | 45 | 59 | 45 | 59 | |||||||||||||||||||
| Nonperforming commercial loans, leases and foreclosed properties, September 30 | $ | 2,238 | $ | 1,346 | $ | 2,238 | $ | 1,346 | |||||||||||||||
|
Nonperforming commercial loans and leases as a percentage of outstanding commercial loans and leases
(4)
|
0.43 | % | 0.25 | % | |||||||||||||||||||
|
Nonperforming commercial loans, leases and foreclosed properties as a percentage of outstanding commercial loans, leases and foreclosed properties
(4)
|
0.44 | 0.26 | |||||||||||||||||||||
(1)
Balances do not include nonperforming loans held-for-sale of $184 million and $237 million at September 30, 2020 and 2019.
(2)
Includes U.S. small business commercial activity. Small business card loans are excluded as they are not classified as nonperforming.
(3)
Commercial loans and leases may be returned to performing status when all principal and interest is current and full repayment of the remaining contractual principal and interest is expected, or when the loan otherwise becomes well-secured and is in the process of collection. TDRs are generally classified as performing after a sustained period of demonstrated payment performance.
(4)
Outstanding commercial loans exclude loans accounted for under the fair value option.
Table 34 presents our commercial TDRs by product type and performing status. U.S. small business commercial TDRs are comprised of renegotiated small business card loans and small business loans. The renegotiated small business card loans are not classified as nonperforming as they are charged off no later than the end of the month in which the loan becomes 180 days
past due. For more information on our loan modification programs offered in response to the COVID-19 pandemic, which are not TDRs, see Executive Summary - Recent Developments – COVID-19 Pandemic on page 3 and
Note 1 – Summary of Significant Accounting Principles
to the Consolidated Financial Statements.
| Table 34 | Commercial Troubled Debt Restructurings | |||||||||||||||||||||||||||||||||||||
| September 30, 2020 | December 31, 2019 | |||||||||||||||||||||||||||||||||||||
| (Dollars in millions) | Nonperforming | Performing | Total | Nonperforming | Performing | Total | ||||||||||||||||||||||||||||||||
| Commercial and industrial: | ||||||||||||||||||||||||||||||||||||||
| U.S. commercial | $ | 743 | $ | 996 | $ | 1,739 | $ | 617 | $ | 999 | $ | 1,616 | ||||||||||||||||||||||||||
| Non-U.S. commercial | 82 | 128 | 210 | 41 | 193 | 234 | ||||||||||||||||||||||||||||||||
| Total commercial and industrial | 825 | 1,124 | 1,949 | 658 | 1,192 | 1,850 | ||||||||||||||||||||||||||||||||
| Commercial real estate | 260 | 34 | 294 | 212 | 14 | 226 | ||||||||||||||||||||||||||||||||
| Commercial lease financing | 2 | 28 | 30 | 18 | 31 | 49 | ||||||||||||||||||||||||||||||||
| 1,087 | 1,186 | 2,273 | 888 | 1,237 | 2,125 | |||||||||||||||||||||||||||||||||
| U.S. small business commercial | — | 28 | 28 | — | 27 | 27 | ||||||||||||||||||||||||||||||||
|
Total commercial troubled debt restructurings
|
$ | 1,087 | $ | 1,214 | $ | 2,301 | $ | 888 | $ | 1,264 | $ | 2,152 | ||||||||||||||||||||||||||
Industry Concentrations
Table 35 presents commercial committed and utilized credit exposure by industry and the total net credit default protection purchased to cover the funded and unfunded portions of certain credit exposures. Our commercial credit exposure is diversified across a broad range of industries. Total commercial committed exposure decreased $21.7 billion, or two percent, during the nine months ended September 30, 2020 to $1.0 trillion. The decrease in commercial committed exposure was concentrated in the Asset managers and funds, Global commercial banks, Utilities, and Pharmaceuticals and biotechnology industry sectors. Decreases were partially offset by increased exposure to the Automobiles and components and the Healthcare equipment and services industry sectors.
For information on industry limits, see Commercial Portfolio Credit Risk Management - Industry Concentrations in the MD&A of the Corporation’s 2019 Annual Report on Form 10-K.
Asset managers and funds, our largest industry concentration with committed exposure of $97.5 billion, decreased $12.6
billion, or 11 percent, during the nine months ended September 30, 2020.
Real estate, our second largest industry concentration with committed exposure of $95.3 billion, decreased $1.1 billion, or one percent, during the nine months ended September 30, 2020. For more information on the commercial real estate and related portfolios, see Commercial Portfolio Credit Risk Management – Commercial Real Estate on page 39.
Capital goods, our third largest industry concentration with committed exposure of $83.2 billion, increased $2.3 billion, or three percent, during the nine months ended September 30, 2020 with the increase largely occurring in the machinery, aerospace and defense, and building products categories, partially offset by a decrease in trading companies and distributors, construction and engineering, and industrial conglomerates.
Given the widespread impact the COVID-19 pandemic is having on the U.S. and global economy, a number of industries have been and continue to be adversely impacted. We continue to monitor all industries, particularly higher risk industries which
|
41
Bank of America
|
||||||||
are experiencing or could experience a more significant impact to their financial condition. The impact of the COVID-19 pandemic has also placed significant stress on global demand for oil, resulting in a steep decline in prices. Our energy-related committed exposure decreased $1.8 billion, or five percent, during the nine months ended September 30, 2020 to $34.5
billion, driven by declines in exploration and production, energy equipment and services and refining and marketing exposure offset, in part, by an increase in our integrated client exposure. For more information on COVID-19, see Executive Summary - Recent Developments – COVID-19 Pandemic on page 3.
| Table 35 |
Commercial Credit Exposure by Industry
(1)
|
|||||||||||||||||||||||||
|
Commercial
Utilized |
Total Commercial
Committed
(2)
|
|||||||||||||||||||||||||
| (Dollars in millions) |
September 30
2020 |
December 31
2019 |
September 30
2020 |
December 31
2019 |
||||||||||||||||||||||
| Asset managers and funds | $ | 63,360 | $ | 71,386 | $ | 97,518 | $ | 110,069 | ||||||||||||||||||
|
Real estate
(3)
|
72,105 | 70,361 | 95,251 | 96,370 | ||||||||||||||||||||||
| Capital goods | 42,899 | 41,082 | 83,159 | 80,892 | ||||||||||||||||||||||
| Finance companies | 43,396 | 40,173 | 66,964 | 63,942 | ||||||||||||||||||||||
| Healthcare equipment and services | 36,554 | 34,353 | 61,094 | 55,918 | ||||||||||||||||||||||
| Government and public education | 43,699 | 41,889 | 56,785 | 53,566 | ||||||||||||||||||||||
| Materials | 25,478 | 26,663 | 51,316 | 52,129 | ||||||||||||||||||||||
| Retailing | 27,085 | 25,868 | 49,602 | 48,317 | ||||||||||||||||||||||
| Consumer services | 32,016 | 28,434 | 48,631 | 49,071 | ||||||||||||||||||||||
| Food, beverage and tobacco | 22,706 | 24,163 | 45,019 | 45,956 | ||||||||||||||||||||||
| Commercial services and supplies | 22,274 | 23,103 | 39,219 | 38,944 | ||||||||||||||||||||||
| Transportation | 25,157 | 23,449 | 34,668 | 33,028 | ||||||||||||||||||||||
| Energy | 15,432 | 16,406 | 34,514 | 36,326 | ||||||||||||||||||||||
| Utilities | 12,488 | 12,383 | 29,501 | 36,060 | ||||||||||||||||||||||
| Individuals and trusts | 21,171 | 18,927 | 27,954 | 27,817 | ||||||||||||||||||||||
| Media | 13,616 | 12,445 | 25,802 | 23,645 | ||||||||||||||||||||||
| Global commercial banks | 21,295 | 30,171 | 23,444 | 32,345 | ||||||||||||||||||||||
| Technology hardware and equipment | 9,875 | 10,646 | 22,563 | 24,072 | ||||||||||||||||||||||
| Software and services | 10,767 | 10,432 | 21,104 | 20,556 | ||||||||||||||||||||||
| Consumer durables and apparel | 10,053 | 10,193 | 20,972 | 21,245 | ||||||||||||||||||||||
| Automobiles and components | 11,916 | 7,345 | 19,391 | 14,910 | ||||||||||||||||||||||
| Vehicle dealers | 14,598 | 18,013 | 18,457 | 21,435 | ||||||||||||||||||||||
| Pharmaceuticals and biotechnology | 5,142 | 5,964 | 15,634 | 20,206 | ||||||||||||||||||||||
| Insurance | 6,310 | 6,673 | 13,962 | 15,218 | ||||||||||||||||||||||
| Telecommunication services | 7,063 | 9,154 | 13,441 | 16,113 | ||||||||||||||||||||||
| Food and staples retailing | 5,166 | 6,290 | 10,470 | 10,392 | ||||||||||||||||||||||
| Financial markets infrastructure (clearinghouses) | 4,587 | 5,496 | 7,216 | 7,997 | ||||||||||||||||||||||
| Religious and social organizations | 4,987 | 3,844 | 6,910 | 5,756 | ||||||||||||||||||||||
| Total commercial credit exposure by industry | $ | 631,195 | $ | 635,306 | $ | 1,040,561 | $ | 1,062,295 | ||||||||||||||||||
|
Net credit default protection purchased on total commitments
(4)
|
$ | (5,206) | $ | (3,349) | ||||||||||||||||||||||
(1)
Includes U.S. small business commercial exposure.
(2)
Includes the notional amount of unfunded legally binding lending commitments net of amounts distributed (i.e., syndicated or participated) to other financial institutions. The distributed amounts were $10.3 billion and $10.6 billion at September 30, 2020 and December 31, 2019.
(3)
Industries are viewed from a variety of perspectives to best isolate the perceived risks. For purposes of this table, the real estate industry is defined based on the primary business activity of the borrowers or counterparties using operating cash flows and primary source of repayment as key factors.
(4)
Represents net notional credit protection purchased to hedge funded and unfunded exposures for which we elected the fair value option, as well as certain other credit exposures. For more information, see Commercial Portfolio Credit Risk Management – Risk Mitigation.
Risk Mitigation
We purchase credit protection to cover the funded portion as well as the unfunded portion of certain credit exposures. To lower the cost of obtaining our desired credit protection levels, we may add credit exposure within an industry, borrower or counterparty group by selling protection.
At September 30, 2020 and December 31, 2019, net notional credit default protection purchased in our credit derivatives portfolio to hedge our funded and unfunded exposures for which we elected the fair value option, as well as certain other credit exposures, was $5.2 billion and $3.3 billion. We recorded net losses on these positions of $104 million and $106 million for the three and nine months ended September 30, 2020 compared to net losses of $15 million and $93 million for the same periods in 2019. The gains and losses on these instruments were offset by gains and losses on the related exposures. The Value-at-Risk (VaR) results for these
exposures are included in the fair value option portfolio information in Table 41. For more information, see Trading Risk Management on page 46.
Tables 36 and 37 present the maturity profiles and the credit exposure debt ratings of the net credit default protection portfolio at September 30, 2020 and December 31, 2019.
| Table 36 | Net Credit Default Protection by Maturity | |||||||||||||
|
September 30
2020 |
December 31
2019 |
|||||||||||||
| Less than or equal to one year | 50 | % | 54 | % | ||||||||||
|
Greater than one year and less than or equal to five years
|
48 | 45 | ||||||||||||
| Greater than five years | 2 | 1 | ||||||||||||
| Total net credit default protection | 100 | % | 100 | % | ||||||||||
|
Bank of America
42
|
||||||||
| Table 37 | Net Credit Default Protection by Credit Exposure Debt Rating | |||||||||||||||||||||||||
|
Net
Notional (1) |
Percent of
Total |
Net
Notional (1) |
Percent of
Total |
|||||||||||||||||||||||
| (Dollars in millions) | September 30, 2020 | December 31, 2019 | ||||||||||||||||||||||||
|
Ratings
(2, 3)
|
||||||||||||||||||||||||||
| A | $ | (310) | 6.0 | % | $ | (697) | 20.8 | % | ||||||||||||||||||
| BBB | (2,699) | 51.8 | (1,089) | 32.5 | ||||||||||||||||||||||
| BB | (1,388) | 26.7 | (766) | 22.9 | ||||||||||||||||||||||
| B | (519) | 10.0 | (373) | 11.1 | ||||||||||||||||||||||
| CCC and below | (237) | 4.6 | (119) | 3.6 | ||||||||||||||||||||||
|
NR
(4)
|
(53) | 0.9 | (305) | 9.1 | ||||||||||||||||||||||
|
Total net credit
default protection
|
$ | (5,206) | 100.0 | % | $ | (3,349) | 100.0 | % | ||||||||||||||||||
(1)
Represents net credit default protection purchased.
(2)
Ratings are refreshed on a quarterly basis.
(3)
Ratings of BBB- or higher are considered to meet the definition of investment grade.
(4)
NR is comprised of index positions held and any names that have not been rated.
For more information on credit derivatives and counterparty credit risk valuation adjustments, see
Note 3 – Derivatives
to the Consolidated Financial Statements of the Corporation’s 2019 Annual Report on Form 10-K.
Non-U.S. Portfolio
Our non-U.S. credit and trading portfolios are subject to country risk. We define country risk as the risk of loss from unfavorable economic and political conditions, currency fluctuations, social instability and changes in government policies. A risk management framework is in place to measure, monitor and manage non-U.S. risk and exposures. In addition to the direct risk of doing business in a country, we also are exposed to indirect country risks (e.g., related to the collateral received on secured financing transactions or related to client clearing activities). These indirect exposures are managed in the normal course of business through credit, market and operational risk governance, rather than through country risk governance.
Table 38 presents our 20 largest non-U.S. country exposures at September 30, 2020. These exposures accounted for 91 percent and 88 percent of our total non-U.S. exposure at September 30, 2020 and December 31, 2019. Net country exposure for these 20 countries increased $37.9 billion in the nine months ended September 30, 2020. The majority of the increase was due to higher deposits with central banks in Germany and Japan.
| Table 38 | Top 20 Non-U.S. Countries Exposure | |||||||||||||||||||||||||||||||||||||||||||||||||
| (Dollars in millions) | Funded Loans and Loan Equivalents | Unfunded Loan Commitments | Net Counterparty Exposure |
Securities/
Other Investments |
Country Exposure at September 30
2020 |
Hedges and Credit Default Protection |
Net Country Exposure at September 30
2020 |
Increase (Decrease) from December 31
2019 |
||||||||||||||||||||||||||||||||||||||||||
| United Kingdom | $ | 31,825 | $ | 16,188 | $ | 6,197 | $ | 2,836 | $ | 57,046 | $ | (2,015) | $ | 55,031 | $ | (813) | ||||||||||||||||||||||||||||||||||
| Germany | 35,523 | 9,366 | 2,389 | 5,353 | 52,631 | (2,564) | 50,067 | 19,239 | ||||||||||||||||||||||||||||||||||||||||||
| Japan | 20,481 | 1,004 | 1,560 | 2,558 | 25,603 | (983) | 24,620 | 14,088 | ||||||||||||||||||||||||||||||||||||||||||
| France | 11,340 | 8,436 | 1,308 | 4,942 | 26,026 | (1,740) | 24,286 | 8,031 | ||||||||||||||||||||||||||||||||||||||||||
| Canada | 8,148 | 9,043 | 1,323 | 2,082 | 20,596 | (720) | 19,876 | (246) | ||||||||||||||||||||||||||||||||||||||||||
| Australia | 6,610 | 3,660 | 454 | 2,893 | 13,617 | (367) | 13,250 | 2,148 | ||||||||||||||||||||||||||||||||||||||||||
| China | 9,182 | 41 | 1,126 | 2,343 | 12,692 | (203) | 12,489 | (3,098) | ||||||||||||||||||||||||||||||||||||||||||
| Brazil | 6,478 | 730 | 272 | 3,907 | 11,387 | (320) | 11,067 | (705) | ||||||||||||||||||||||||||||||||||||||||||
| Netherlands | 6,579 | 3,081 | 590 | 1,592 | 11,842 | (810) | 11,032 | 705 | ||||||||||||||||||||||||||||||||||||||||||
| India | 5,597 | 151 | 448 | 3,897 | 10,093 | (224) | 9,869 | (2,148) | ||||||||||||||||||||||||||||||||||||||||||
| Switzerland | 5,752 | 2,921 | 156 | 230 | 9,059 | (395) | 8,664 | 1,279 | ||||||||||||||||||||||||||||||||||||||||||
| South Korea | 5,486 | 854 | 459 | 1,824 | 8,623 | (127) | 8,496 | (209) | ||||||||||||||||||||||||||||||||||||||||||
| Singapore | 3,997 | 230 | 354 | 3,809 | 8,390 | (57) | 8,333 | 507 | ||||||||||||||||||||||||||||||||||||||||||
| Mexico | 3,920 | 1,225 | 201 | 1,663 | 7,009 | (139) | 6,870 | (941) | ||||||||||||||||||||||||||||||||||||||||||
| Belgium | 4,271 | 1,310 | 534 | 901 | 7,016 | (250) | 6,766 | 259 | ||||||||||||||||||||||||||||||||||||||||||
| Hong Kong | 4,723 | 220 | 512 | 1,167 | 6,622 | (26) | 6,596 | (460) | ||||||||||||||||||||||||||||||||||||||||||
| Spain | 2,926 | 1,343 | 306 | 789 | 5,364 | (303) | 5,061 | 339 | ||||||||||||||||||||||||||||||||||||||||||
| Ireland | 3,272 | 930 | 103 | 389 | 4,694 | (11) | 4,683 | 1,316 | ||||||||||||||||||||||||||||||||||||||||||
| Italy | 2,610 | 1,222 | 562 | 1,310 | 5,704 | (1,065) | 4,639 | (738) | ||||||||||||||||||||||||||||||||||||||||||
| United Arab Emirates | 2,545 | 139 | 217 | 52 | 2,953 | (41) | 2,912 | (675) | ||||||||||||||||||||||||||||||||||||||||||
|
Total top 20 non-U.S. countries exposure
|
$ | 181,265 | $ | 62,094 | $ | 19,071 | $ | 44,537 | $ | 306,967 | $ | (12,360) | $ | 294,607 | $ | 37,878 | ||||||||||||||||||||||||||||||||||
Our largest non-U.S. country exposure at September 30, 2020 was the U.K. with net exposure of $55.0 billion, which represents an $813 million decrease from December 31, 2019. Our second largest non-U.S. country exposure was Germany with net exposure of $50.1 billion at September 30, 2020, a $19.2 billion increase from December 31, 2019. The increase in Germany was primarily driven by an increase in deposits with the central bank.
In light of the global COVID-19 pandemic, we are monitoring our non-U.S. exposure closely, particularly in countries where restrictions on certain activities, in an attempt to contain the spread and impact of the virus, have affected and will likely
continue to adversely affect economic activity. We are managing the impact to our international business operations as part of our overall response framework and are taking actions to manage exposure carefully in impacted regions while supporting the needs of our clients. The magnitude and duration of the COVID-19 pandemic and its full impact on the global economy continue to be highly uncertain. The impact of COVID-19 could have an adverse impact on the global economy for a prolonged period of time. For more information on how the COVID-19 pandemic may affect our operations, see Executive Summary - Recent Developments – COVID-19 Pandemic on page 3 and Part II, Item 1A. Risk Factors on page 105.
|
43
Bank of America
|
||||||||
Allowance for Credit Losses
On January 1, 2020, the Corporation adopted the new accounting standard that requires the measurement of the allowance for credit losses to be based on management’s best estimate of lifetime ECL inherent in the Corporation’s relevant financial assets. Upon adoption of the new accounting standard, the Corporation recorded a net increase of $3.3 billion in the allowance for credit losses which was comprised of a net increase of $2.9 billion in the allowance for loan and lease losses and an increase of $310 million in the reserve for unfunded lending commitments. The net increase was primarily driven by a $3.1 billion increase related to the credit card portfolio.
The allowance for credit losses further increased by $8.0 billion from January 1, 2020 to $21.5 billion at September 30, 2020, which included a $5.2 billion increase in the commercial portfolio and a $2.8 billion increase in the consumer portfolio. The increases were driven by deterioration in the economic outlook resulting from the impact of COVID-19. Assuming the macroeconomic outlook does not deteriorate further, we do not expect to increase the level of the allowance for credit losses in the fourth quarter of 2020. The following table presents an allocation of the allowance for credit losses by product type for September 30, 2020, January 1, 2020 and December 31, 2019 (prior to the adoption of the CECL accounting standard).
| Table 39 | Allocation of the Allowance for Credit Losses by Product Type | |||||||||||||||||||||||||||||||||||||||||||||||||||||||
| Amount |
Percent of
Total |
Percent of
Loans and Leases
Outstanding
(1)
|
Amount |
Percent of
Total |
Percent of
Loans and Leases Outstanding (1) |
Amount |
Percent of
Total |
Percent of
Loans and Leases
Outstanding
(1)
|
||||||||||||||||||||||||||||||||||||||||||||||||
| (Dollars in millions) | September 30, 2020 | January 1, 2020 | December 31, 2019 | |||||||||||||||||||||||||||||||||||||||||||||||||||||
| Allowance for loan and lease losses | ||||||||||||||||||||||||||||||||||||||||||||||||||||||||
| Residential mortgage | $ | 457 | 2.33 | % | 0.20 | % | $ | 212 | 1.72 | % | 0.09 | % | $ | 325 | 3.45 | % | 0.14 | % | ||||||||||||||||||||||||||||||||||||||
| Home equity | 398 | 2.03 | 1.09 | 228 | 1.84 | 0.57 | 221 | 2.35 | 0.55 | |||||||||||||||||||||||||||||||||||||||||||||||
| Credit card | 8,972 | 45.78 | 11.24 | 6,809 | 55.10 | 6.98 | 3,710 | 39.39 | 3.80 | |||||||||||||||||||||||||||||||||||||||||||||||
| Direct/Indirect consumer | 800 | 4.08 | 0.89 | 566 | 4.58 | 0.62 | 234 | 2.49 | 0.26 | |||||||||||||||||||||||||||||||||||||||||||||||
| Other consumer | 64 | 0.34 | n/m | 55 | 0.45 | n/m | 52 | 0.55 | n/m | |||||||||||||||||||||||||||||||||||||||||||||||
| Total consumer | 10,691 | 54.56 | 2.43 | 7,870 | 63.69 | 1.69 | 4,542 | 48.23 | 0.98 | |||||||||||||||||||||||||||||||||||||||||||||||
|
U.S. commercial
(2)
|
5,163 | 26.35 | 1.55 | 2,723 | 22.03 | 0.84 | 3,015 | 32.02 | 0.94 | |||||||||||||||||||||||||||||||||||||||||||||||
| Non-U.S. commercial | 1,353 | 6.90 | 1.41 | 668 | 5.41 | 0.64 | 658 | 6.99 | 0.63 | |||||||||||||||||||||||||||||||||||||||||||||||
| Commercial real estate | 2,283 | 11.65 | 3.66 | 1,036 | 8.38 | 1.65 | 1,042 | 11.07 | 1.66 | |||||||||||||||||||||||||||||||||||||||||||||||
| Commercial lease financing | 106 | 0.54 | 0.60 | 61 | 0.49 | 0.31 | 159 | 1.69 | 0.80 | |||||||||||||||||||||||||||||||||||||||||||||||
| Total commercial | 8,905 | 45.44 | 1.75 | 4,488 | 36.31 | 0.88 | 4,874 | 51.77 | 0.96 | |||||||||||||||||||||||||||||||||||||||||||||||
| Allowance for loan and lease losses | 19,596 | 100.00 | % | 2.07 | 12,358 | 100.00 | % | 1.27 | 9,416 | 100.00 | % | 0.97 | ||||||||||||||||||||||||||||||||||||||||||||
| Reserve for unfunded lending commitments | 1,910 | 1,123 | 813 | |||||||||||||||||||||||||||||||||||||||||||||||||||||
| Allowance for credit losses | $ | 21,506 | $ | 13,481 | $ | 10,229 | ||||||||||||||||||||||||||||||||||||||||||||||||||
(1)
Ratios are calculated as allowance for loan and lease losses as a percentage of loans and leases outstanding excluding loans accounted for under the fair value option. Consumer loans accounted for under the fair value option include residential mortgage loans of $314 million at September 30, 2020 and $257 million at January 1, 2020 and December 31, 2019 and home equity loans of $343 million at September 30, 2020 and $337 million at January 1, 2020 and December 31, 2019. Commercial loans accounted for under the fair value option include U.S. commercial loans of $3.4 billion, $5.1 billion and $4.7 billion at September 30, 2020, January 1, 2020 and December 31, 2019, respectively and non-U.S. commercial loans of $3.2 billion, $3.2 billion and $3.1 billion at September 30, 2020, January 1, 2020 and December 31, 2019, respectively.
(2)
Includes allowance for loan and lease losses for U.S. small business commercial loans of $1.5 billion, $831 million and $523 million at September 30, 2020, January 1, 2020 and December 31, 2019, respectively.
n/m = not meaningful
Net charge-offs for the three and nine months ended September 30, 2020 were $972 million and $3.2 billion compared to $811 million and $2.7 billion for the same periods in 2019 driven by increases in commercial losses. The provision for credit losses increased $610 million to $1.4 billion, and $8.6 billion to $11.3 billion for the three and nine months ended September 30, 2020 compared to the same periods in 2019. The allowance for credit losses included a reserve build of $417 million for the three months ended September 30, 2020, driven by COVID-19 impacted industries, such as travel and entertainment, and a reserve build of $8.0 billion for the nine months ended September 30, 2020 primarily due to the deterioration in the economic outlook resulting from the impact of COVID-19 on both the consumer and commercial portfolios. The provision for credit losses for the consumer portfolio, including unfunded lending commitments, decreased $269 million to $295 million and increased $3.0 billion to $5.0 billion
for the three and nine months ended September 30, 2020 compared to the same periods in 2019. The provision for credit losses for the commercial portfolio, including unfunded lending commitments, increased $879 million to $1.1 billion and $5.6 billion to $6.3 billion for the three and nine months ended September 30, 2020 compared to the same periods in 2019.
The following table presents a rollforward of the allowance for credit losses, including certain loan and allowance ratios for the nine months ended September 30, 2020 and 2019, noting that measurement of the allowance for credit losses for 2019 was based on management’s estimate of probable incurred losses. For more information on the Corporation’s credit loss accounting policies and activity related to the allowance for credit losses, see
Note 1 – Summary of Significant Accounting Principles
and
Note 5 – Outstanding Loans and Leases and Allowance for Credit Losses
to the Consolidated Financial Statements.
|
Bank of America
44
|
||||||||
| Table 40 | Allowance for Credit Losses | |||||||||||||||||||||||||
| Three Months Ended September 30 | Nine Months Ended September 30 | |||||||||||||||||||||||||
| (Dollars in millions) | 2020 | 2019 | 2020 | 2019 | ||||||||||||||||||||||
| Allowance for loan and lease losses, beginning of period | $ | 19,389 | $ | 9,527 | $ | 12,358 | $ | 9,601 | ||||||||||||||||||
| Loans and leases charged off | ||||||||||||||||||||||||||
| Residential mortgage | (5) | (28) | (28) | (69) | ||||||||||||||||||||||
| Home equity | (8) | (171) | (47) | (386) | ||||||||||||||||||||||
| Credit card | (665) | (865) | (2,407) | (2,659) | ||||||||||||||||||||||
| Direct/Indirect consumer | (75) | (157) | (277) | (403) | ||||||||||||||||||||||
| Other consumer | (70) | (71) | (232) | (163) | ||||||||||||||||||||||
| Total consumer charge-offs | (823) | (1,292) | (2,991) | (3,680) | ||||||||||||||||||||||
|
U.S. commercial
(1)
|
(279) | (151) | (870) | (486) | ||||||||||||||||||||||
| Non-U.S. commercial | (57) | (66) | (91) | (115) | ||||||||||||||||||||||
| Commercial real estate | (106) | — | (170) | (10) | ||||||||||||||||||||||
| Commercial lease financing | (28) | (3) | (68) | (19) | ||||||||||||||||||||||
| Total commercial charge-offs | (470) | (220) | (1,199) | (630) | ||||||||||||||||||||||
| Total loans and leases charged off | (1,293) | (1,512) | (4,190) | (4,310) | ||||||||||||||||||||||
| Recoveries of loans and leases previously charged off | ||||||||||||||||||||||||||
| Residential mortgage | 11 | 66 | 55 | 120 | ||||||||||||||||||||||
| Home equity | 28 | 373 | 92 | 732 | ||||||||||||||||||||||
| Credit card | 156 | 148 | 463 | 435 | ||||||||||||||||||||||
| Direct/Indirect consumer | 57 | 81 | 193 | 233 | ||||||||||||||||||||||
| Other consumer | 7 | 2 | 18 | 12 | ||||||||||||||||||||||
| Total consumer recoveries | 259 | 670 | 821 | 1,532 | ||||||||||||||||||||||
|
U.S. commercial
(2)
|
58 | 29 | 119 | 82 | ||||||||||||||||||||||
| Non-U.S. commercial | — | (1) | 1 | — | ||||||||||||||||||||||
| Commercial real estate | — | 1 | 1 | 2 | ||||||||||||||||||||||
| Commercial lease financing | 4 | 2 | 8 | 5 | ||||||||||||||||||||||
| Total commercial recoveries | 62 | 31 | 129 | 89 | ||||||||||||||||||||||
| Total recoveries of loans and leases previously charged off | 321 | 701 | 950 | 1,621 | ||||||||||||||||||||||
| Net charge-offs | (972) | (811) | (3,240) | (2,689) | ||||||||||||||||||||||
| Provision for loan and lease losses | 1,180 | 776 | 10,480 | 2,637 | ||||||||||||||||||||||
|
Other
(3)
|
(1) | (59) | (2) | (116) | ||||||||||||||||||||||
|
Allowance for loan and lease losses, September 30
|
19,596 | 9,433 | 19,596 | 9,433 | ||||||||||||||||||||||
| Reserve for unfunded lending commitments, beginning of period | 1,702 | 806 | 1,123 | 797 | ||||||||||||||||||||||
| Provision for unfunded lending commitments | 209 | 3 | 787 | 12 | ||||||||||||||||||||||
|
Other
(3)
|
(1) | — | — | — | ||||||||||||||||||||||
|
Reserve for unfunded lending commitments, September 30
|
1,910 | 809 | 1,910 | 809 | ||||||||||||||||||||||
|
Allowance for credit losses, September 30
|
$ | 21,506 | $ | 10,242 | $ | 21,506 | $ | 10,242 | ||||||||||||||||||
| Loan and allowance ratios: | ||||||||||||||||||||||||||
|
Loans and leases outstanding at September 30
(4)
|
$ | 947,938 | $ | 965,236 | $ | 947,938 | $ | 965,236 | ||||||||||||||||||
|
Allowance for loan and lease losses as a percentage of total loans and leases outstanding at September 30
(4)
|
2.07 | % | 0.98 | % | 2.07 | % | 0.98 | % | ||||||||||||||||||
|
Consumer allowance for loan and lease losses as a percentage of total consumer loans and leases outstanding at September 30
(5)
|
2.43 | 1.01 | 2.43 | 1.01 | ||||||||||||||||||||||
|
Commercial allowance for loan and lease losses as a percentage of total commercial loans and leases outstanding at September 30
(6)
|
1.75 | 0.95 | 1.75 | 0.95 | ||||||||||||||||||||||
|
Average loans and leases outstanding
(4)
|
$ | 965,836 | $ | 956,850 | $ | 989,839 | $ | 946,546 | ||||||||||||||||||
|
Annualized net charge-offs as a percentage of average loans and leases outstanding
(4)
|
0.40 | % | 0.34 | % | 0.44 | % | 0.38 | % | ||||||||||||||||||
|
Allowance for loan and lease losses as a percentage of total nonperforming loans and leases at September 30
|
431 | 271 | 431 | 271 | ||||||||||||||||||||||
|
Ratio of the allowance for loan and lease losses at September 30 to net charge-offs
|
5.07 | 2.93 | 4.53 | 2.62 | ||||||||||||||||||||||
|
Amounts included in allowance for loan and lease losses for loans and leases that are excluded from nonperforming loans and leases at September 30
(7)
|
$ | 10,331 | $ | 4,144 | $ | 10,331 | $ | 4,144 | ||||||||||||||||||
|
Allowance for loan and lease losses as a percentage of total nonperforming loans and leases, excluding the allowance for loan and lease losses for loans and leases that are excluded from nonperforming loans and leases at September 30
(7)
|
204 | % | 152 | % | 204 | % | 152 | % | ||||||||||||||||||
(1)
Includes U.S. small business commercial charge-offs of $77 million and $247 million for the three and nine months ended September 30, 2020 compared to $79 million and $239 million for the same periods in 2019.
(2)
Includes U.S. small business commercial recoveries of $10 million and $32 million for the three and nine months ended September 30, 2020 compared to $10 million and $37 million for the same periods in 2019.
(3)
Primarily represents write-offs of purchased credit-impaired (PCI) loans in 2019, and the net impact of portfolio sales, transfers to held for sale and transfers to foreclosed properties.
(4)
Outstanding loan and lease balances and ratios do not include loans accounted for under the fair value option of $7.2 billion and $7.7 billion at September 30, 2020 and 2019. Average loans accounted for under the fair value option were $8.2 billion and $8.6 billion for the three and nine months ended September 30, 2020 compared to $7.9 billion and $6.6 billion for the same periods in 2019.
(5)
Excludes consumer loans accounted for under the fair value option of $657 million and $640 million at September 30, 2020 and 2019.
(6)
Excludes commercial loans accounted for under the fair value option of $6.6 billion and $7.0 billion at September 30, 2020 and 2019.
(7)
Primarily includes amounts allocated to credit card and unsecured consumer lending portfolios in
Consumer Banking
.
|
45
Bank of America
|
||||||||
Market Risk Management
For more information on our market risk management process, see Market Risk Management in the MD&A of the Corporation’s 2019 Annual Report on Form 10-K.
Market risk is the risk that changes in market conditions may adversely impact the value of assets or liabilities, or otherwise negatively impact earnings. This risk is inherent in the financial instruments associated with our operations, primarily within our
Global Markets
segment. We are also exposed to these risks in other areas of the Corporation (e.g., our ALM activities). In the event of market stress, these risks could have a material impact on our results.
We have been affected, and expect to continue to be affected, by market stress resulting from the COVID-19 pandemic that began in the first quarter of 2020. For more information on the effects of the pandemic, see Executive Summary - Recent Developments – COVID-19 Pandemic on page 3.
Trading Risk Management
To evaluate risks in our trading activities, we focus on the actual and potential volatility of revenues generated by individual positions as well as portfolios of positions. VaR is a common statistic used to measure market risk. Our primary VaR statistic is equivalent to a 99 percent confidence level, which means that for a VaR with a one-day holding period, there should not be losses in excess of VaR, on average, 99 out of 100 trading days.
Table 41 presents the total market-based portfolio VaR which is the combination of the total covered positions (and less liquid trading positions) portfolio and the fair value option portfolio. For more information on the market risk VaR for trading activities, see Trading Risk Management in the MD&A of the Corporation’s 2019 Annual Report on Form 10-K.
The total market-based portfolio VaR results in Table 41 include market risk to which we are exposed from all business segments, excluding credit valuation adjustment (CVA), DVA and related hedges. The majority of this portfolio is within the
Global Markets
segment.
Table 41 presents period-end, average, high and low daily trading VaR for the three months ended September 30, 2020, June 30, 2020 and September 30, 2019 using a 99 percent confidence level, as well as average daily trading VaR for the nine months ended September 30, 2020 and 2019. The amounts disclosed in Table 41 and Table 42 align to the view of covered positions used in the Basel 3 capital calculations. Foreign exchange and commodity positions are always considered covered positions, regardless of trading or banking treatment for the trade, except for structural foreign currency positions that are excluded with prior regulatory approval.
The average of total covered positions and less liquid trading positions portfolio VaR increased for the three months ended September 30, 2020 compared to the prior quarter primarily due to a decrease in portfolio diversification.
| Table 41 | Market Risk VaR for Trading Activities | |||||||||||||||||||||||||||||||||||||||||||||||||||||||||||||||||||||||||||||||||||||
| Three Months Ended | Nine Months Ended September 30 | |||||||||||||||||||||||||||||||||||||||||||||||||||||||||||||||||||||||||||||||||||||
| September 30, 2020 | June 30, 2020 | September 30, 2019 | ||||||||||||||||||||||||||||||||||||||||||||||||||||||||||||||||||||||||||||||||||||
| (Dollars in millions) | Period End | Average |
High
(1)
|
Low
(1)
|
Period End | Average |
High
(1)
|
Low
(1)
|
Period End | Average |
High
(1)
|
Low
(1)
|
2020 Average | 2019 Average | ||||||||||||||||||||||||||||||||||||||||||||||||||||||||||||||||||||||||
| Foreign exchange | $ | 7 | $ | 7 | $ | 25 | $ | 5 | $ | 5 | $ | 7 | $ | 11 | $ | 4 | $ | 3 | $ | 6 | $ | 11 | $ | 3 | $ | 7 | $ | 6 | ||||||||||||||||||||||||||||||||||||||||||||||||||||||||||
| Interest rate | 14 | 18 | 27 | 13 | 17 | 15 | 23 | 7 | 22 | 20 | 26 | 14 | 18 | 25 | ||||||||||||||||||||||||||||||||||||||||||||||||||||||||||||||||||||||||
| Credit | 61 | 62 | 68 | 54 | 64 | 65 | 91 | 48 | 26 | 24 | 27 | 20 | 54 | 22 | ||||||||||||||||||||||||||||||||||||||||||||||||||||||||||||||||||||||||
| Equity | 16 | 17 | 22 | 12 | 16 | 24 | 43 | 15 | 24 | 23 | 29 | 17 | 26 | 21 | ||||||||||||||||||||||||||||||||||||||||||||||||||||||||||||||||||||||||
| Commodities | 4 | 6 | 10 | 4 | 7 | 7 | 12 | 5 | 4 | 6 | 31 | 4 | 6 | 6 | ||||||||||||||||||||||||||||||||||||||||||||||||||||||||||||||||||||||||
| Portfolio diversification | (71) | (56) | — | — | (39) | (60) | — | — | (50) | (48) | — | — | (58) | (48) | ||||||||||||||||||||||||||||||||||||||||||||||||||||||||||||||||||||||||
| Total covered positions portfolio | 31 | 54 | 96 | 31 | 70 | 58 | 85 | 28 | 29 | 31 | 36 | 24 | 53 | 32 | ||||||||||||||||||||||||||||||||||||||||||||||||||||||||||||||||||||||||
| Impact from less liquid exposures | 50 | 55 | — | — | 30 | 23 | — | — | 2 | 3 | — | — | 26 | 3 | ||||||||||||||||||||||||||||||||||||||||||||||||||||||||||||||||||||||||
|
Total covered positions and less liquid trading positions portfolio
|
81 | 109 | 149 | 55 | 100 | 81 | 111 | 47 | 31 | 34 | 38 | 27 | 79 | 35 | ||||||||||||||||||||||||||||||||||||||||||||||||||||||||||||||||||||||||
| Fair value option loans | 71 | 62 | 72 | 54 | 56 | 67 | 84 | 55 | 11 | 11 | 13 | 9 | 48 | 9 | ||||||||||||||||||||||||||||||||||||||||||||||||||||||||||||||||||||||||
| Fair value option hedges | 11 | 13 | 15 | 11 | 15 | 15 | 17 | 12 | 10 | 11 | 13 | 9 | 13 | 9 | ||||||||||||||||||||||||||||||||||||||||||||||||||||||||||||||||||||||||
| Fair value option portfolio diversification | (27) | (32) | — | — | (36) | (31) | — | — | (6) | (10) | — | — | (24) | (9) | ||||||||||||||||||||||||||||||||||||||||||||||||||||||||||||||||||||||||
| Total fair value option portfolio | 55 | 43 | 58 | 34 | 35 | 51 | 86 | 34 | 15 | 12 | 16 | 9 | 37 | 9 | ||||||||||||||||||||||||||||||||||||||||||||||||||||||||||||||||||||||||
| Portfolio diversification | (10) | (18) | — | — | (16) | (12) | — | — | (12) | (9) | — | — | (14) | (6) | ||||||||||||||||||||||||||||||||||||||||||||||||||||||||||||||||||||||||
| Total market-based portfolio | $ | 126 | $ | 134 | 160 | 99 | $ | 119 | $ | 120 | 159 | 76 | $ | 34 | $ | 37 | 44 | 28 | $ | 102 | $ | 38 | ||||||||||||||||||||||||||||||||||||||||||||||||||||||||||||||||
(1)
The high and low for each portfolio may have occurred on different trading days than the high and low for the components. Therefore the impact from less liquid exposures and the amount of portfolio diversification, which is the difference between the total portfolio and the sum of the individual components, is not relevant.
|
Bank of America
46
|
||||||||
The graph below presents the daily covered positions and less liquid trading positions portfolio VaR for the previous five quarters, corresponding to the data in Table 41. Peak VaR in mid-March 2020 was driven by increased market realized volatility and higher implied volatilities.
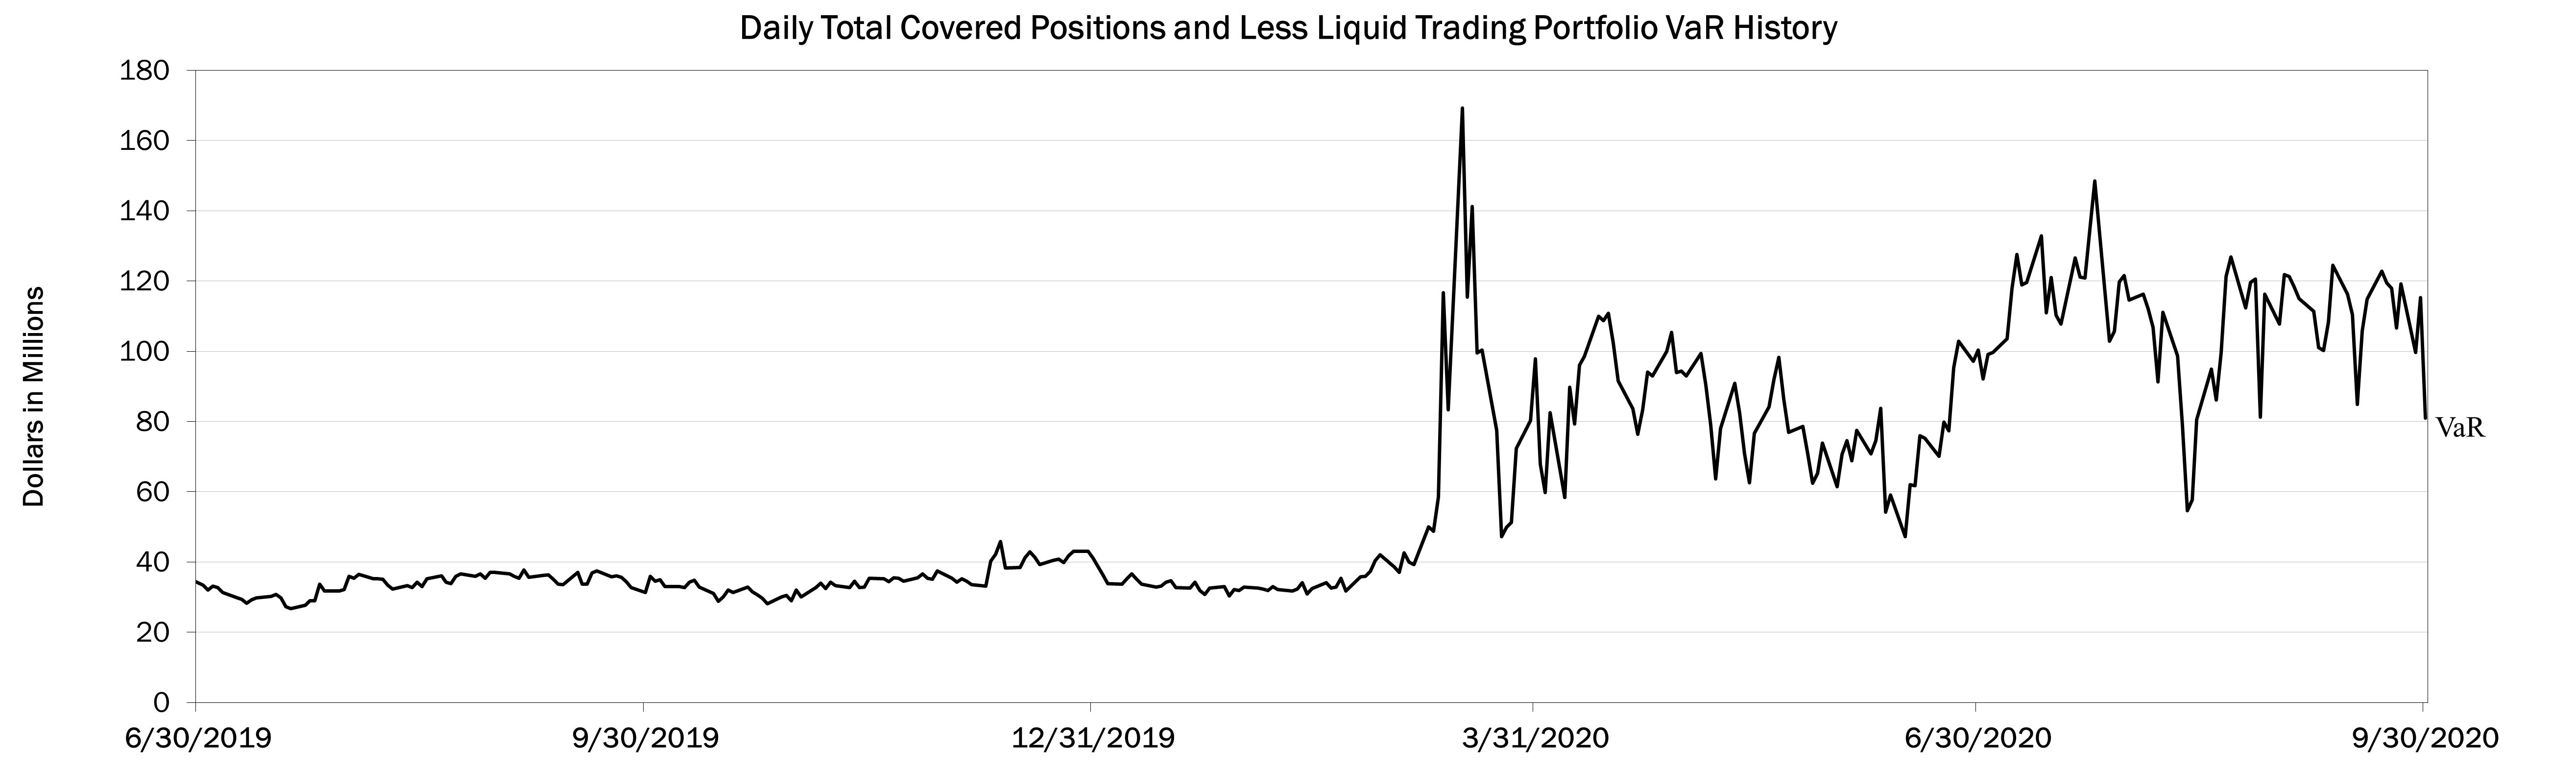
Additional VaR statistics produced within our single VaR model are provided in Table 42 at the same level of detail as in Table 41. Evaluating VaR with additional statistics allows for an increased understanding of the risks in the portfolio as the historical market data used in the VaR calculation does not necessarily follow a predefined statistical distribution. Table 42 presents average trading VaR statistics at 99 percent and 95
percent confidence levels for the three months ended September 30, 2020, June 30, 2020 and September 30, 2019. The increase in VaR for the 99 percent confidence level for the three months ended September 30, 2020 was primarily due to COVID-19 related market volatility, which impacted the 99 percent VaR average more severely than the 95 percent VaR average.
| Table 42 | Average Market Risk VaR for Trading Activities – 99 percent and 95 percent VaR Statistics | |||||||||||||||||||||||||||||||||||||
| Three Months Ended | ||||||||||||||||||||||||||||||||||||||
| September 30, 2020 | June 30, 2020 | September 30, 2019 | ||||||||||||||||||||||||||||||||||||
| (Dollars in millions) | 99 percent | 95 percent | 99 percent | 95 percent | 99 percent | 95 percent | ||||||||||||||||||||||||||||||||
| Foreign exchange | $ | 7 | $ | 4 | $ | 7 | $ | 4 | $ | 6 | $ | 4 | ||||||||||||||||||||||||||
| Interest rate | 18 | 8 | 15 | 6 | 20 | 13 | ||||||||||||||||||||||||||||||||
| Credit | 62 | 18 | 65 | 18 | 24 | 16 | ||||||||||||||||||||||||||||||||
| Equity | 17 | 9 | 24 | 12 | 23 | 12 | ||||||||||||||||||||||||||||||||
| Commodities | 6 | 3 | 7 | 4 | 6 | 3 | ||||||||||||||||||||||||||||||||
| Portfolio diversification | (56) | (25) | (60) | (25) | (48) | (31) | ||||||||||||||||||||||||||||||||
| Total covered positions portfolio | 54 | 17 | 58 | 19 | 31 | 17 | ||||||||||||||||||||||||||||||||
| Impact from less liquid exposures | 55 | 5 | 23 | 2 | 3 | 2 | ||||||||||||||||||||||||||||||||
|
Total covered positions and less liquid trading positions portfolio
|
109 | 22 | 81 | 21 | 34 | 19 | ||||||||||||||||||||||||||||||||
| Fair value option loans | 62 | 14 | 67 | 15 | 11 | 6 | ||||||||||||||||||||||||||||||||
| Fair value option hedges | 13 | 6 | 15 | 8 | 11 | 7 | ||||||||||||||||||||||||||||||||
| Fair value option portfolio diversification | (32) | (7) | (31) | (12) | (10) | (7) | ||||||||||||||||||||||||||||||||
| Total fair value option portfolio | 43 | 13 | 51 | 11 | 12 | 6 | ||||||||||||||||||||||||||||||||
| Portfolio diversification | (18) | (7) | (12) | (7) | (9) | (4) | ||||||||||||||||||||||||||||||||
| Total market-based portfolio | $ | 134 | $ | 28 | $ | 120 | $ | 25 | $ | 37 | $ | 21 | ||||||||||||||||||||||||||
Backtesting
The accuracy of the VaR methodology is evaluated by backtesting, which compares the daily VaR results, utilizing a one-day holding period, against a comparable subset of trading revenue. For more information on our backtesting process, see Trading Risk Management – Backtesting in the MD&A of the Corporation’s 2019 Annual Report on Form 10-K.
During the three months ended September 30, 2020, there were no days where this subset of trading revenue had losses that exceeded our total covered portfolio VaR, utilizing a one-day holding period. During the nine months ended September 30, 2020, seven days with losses exceeded total covered portfolio VaR.
Total Trading-related Revenue
Total trading-related revenue, excluding brokerage fees, and CVA, DVA and funding valuation adjustment gains (losses), represents the total amount earned from trading positions,
including market-based net interest income, which are taken in a diverse range of financial instruments and markets. For more information, see Trading Risk Management – Total Trading-related Revenue in the MD&A of the Corporation’s 2019 Annual Report on Form 10-K.
The following histogram is a graphic depiction of trading volatility and illustrates the daily level of trading-related revenue for the three months ended September 30, 2020 compared to the three months ended June 30, 2020 and March 31, 2020. During the three months ended September 30, 2020, positive trading-related revenue was recorded for 100 percent of the trading days, of which 88 percent were daily trading gains of over $25 million. This compares to the three months ended June 30, 2020 where positive trading-related revenue was recorded for 100 percent of the trading days, of which 95 percent were daily trading gains of over $25 million. During the three months ended March 31, 2020, positive trading-related
|
47
Bank of America
|
||||||||
revenue was recorded for 94 percent of the trading days, of which 89 percent were daily trading gains of over $25 million.
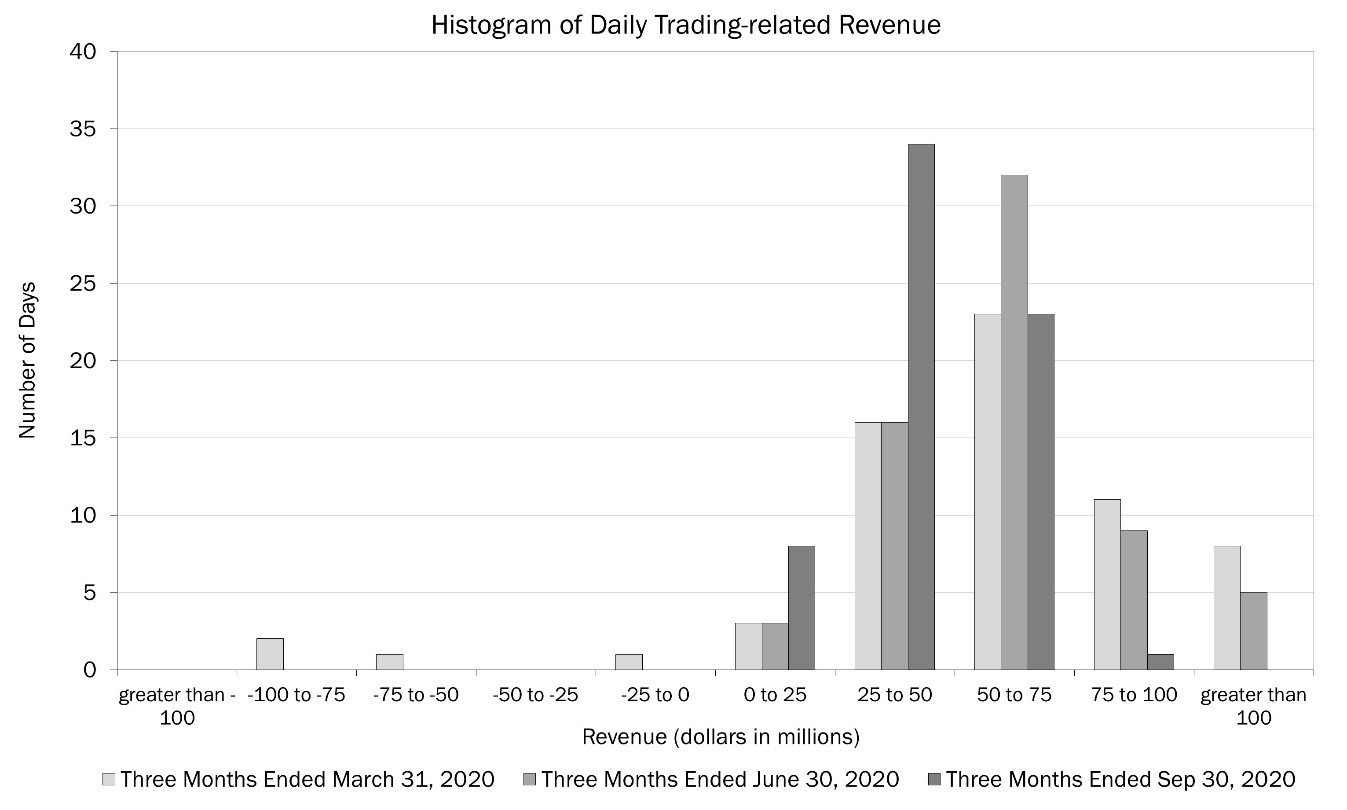
Trading Portfolio Stress Testing
Because the very nature of a VaR model suggests results can exceed our estimates and it is dependent on a limited historical window, we also stress test our portfolio using scenario analysis. This analysis estimates the change in the value of our trading portfolio that may result from abnormal market movements. For more information, see Trading Risk Management – Trading Portfolio Stress Testing in the MD&A of the Corporation’s 2019 Annual Report on Form 10-K.
Interest Rate Risk Management for the Banking Book
The following discussion presents net interest income for banking book activities. For more information, see Interest Rate Risk Management for the Banking Book in the MD&A of the Corporation’s 2019 Annual Report on Form 10-K.
Table 43 presents the spot and 12-month forward rates used in our baseline forecasts at September 30, 2020 and December 31, 2019.
| Table 43 | Forward Rates | |||||||||||||||||||
| September 30, 2020 | ||||||||||||||||||||
|
Federal
Funds |
Three-month
LIBOR |
10-Year
Swap |
||||||||||||||||||
| Spot rates | 0.25 | % | 0.23 | % | 0.71 | % | ||||||||||||||
| 12-month forward rates | 0.25 | 0.19 | 0.81 | |||||||||||||||||
| December 31, 2019 | ||||||||||||||||||||
| Spot rates | 1.75 | % | 1.91 | % | 1.90 | % | ||||||||||||||
| 12-month forward rates | 1.50 | 1.62 | 1.92 | |||||||||||||||||
Table 44 shows the pretax impact to forecasted net interest income over the next 12 months from September 30, 2020 and December 31, 2019 resulting from instantaneous parallel and non-parallel shocks to the market-based forward curve. Periodically we evaluate the scenarios presented so that they are meaningful in the context of the current rate environment. The interest rate scenarios also assume U.S. dollar rates are floored at zero.
In the nine months ended September 30, 2020, the asset sensitivity of our balance sheet increased in both up-rate and down-rate scenarios primarily due to higher deposit balances. We continue to be asset sensitive to a parallel upward move in interest rates with the majority of that impact coming from the short end of the yield curve. Additionally, higher interest rates impact the fair value of debt securities and, accordingly, for debt
securities classified as AFS, may adversely affect OCI and thus capital levels under the Basel 3 capital rules. Under instantaneous upward parallel shifts, the near-term adverse impact to Basel 3 capital is reduced over time by offsetting positive impacts to net interest income. For more information on Basel 3, see Capital Management – Regulatory Capital on page 24.
| Table 44 | Estimated Banking Book Net Interest Income Sensitivity to Curve Changes | |||||||||||||||||||||||||
|
Short
Rate (bps) |
Long
Rate (bps) |
|||||||||||||||||||||||||
| (Dollars in millions) | September 30, 2020 |
December 31
2019 |
||||||||||||||||||||||||
| Parallel Shifts | ||||||||||||||||||||||||||
|
+100 bps
instantaneous shift
|
+100 | +100 | $ | 9,600 | $ | 4,190 | ||||||||||||||||||||
|
-25 bps
instantaneous shift
|
-25 | -25 | (2,516) | (1,500) | ||||||||||||||||||||||
| Flatteners | ||||||||||||||||||||||||||
|
Short-end
instantaneous change
|
+100 | — | 6,357 | 2,641 | ||||||||||||||||||||||
|
Long-end
instantaneous change
|
— | -25 | (1,322) | (653) | ||||||||||||||||||||||
| Steepeners | ||||||||||||||||||||||||||
|
Short-end
instantaneous change
|
-25 | — | (1,198) | (844) | ||||||||||||||||||||||
|
Long-end
instantaneous change
|
— | +100 | 3,341 | 1,561 | ||||||||||||||||||||||
The sensitivity analysis in Table 44 assumes that we take no action in response to these rate shocks and does not assume any change in other macroeconomic variables normally correlated with changes in interest rates. As part of our ALM activities, we use securities, certain residential mortgages, and interest rate and foreign exchange derivatives in managing interest rate sensitivity.
The behavior of our deposits portfolio in the baseline forecast and in alternate interest rate scenarios is a key assumption in our projected estimates of net interest income. The sensitivity analysis in Table 44 assumes no change in deposit portfolio size or mix from the baseline forecast in alternate rate environments. In higher rate scenarios, any customer activity resulting in the replacement of low-cost or noninterest-bearing deposits with higher yielding deposits or market-based funding would reduce our benefit in those scenarios.
Interest Rate and Foreign Exchange Derivative Contracts
Interest rate and foreign exchange derivative contracts are utilized in our ALM activities and serve as an efficient tool to manage our interest rate and foreign exchange risk. We use derivatives to hedge the variability in cash flows or changes in fair value on our balance sheet due to interest rate and foreign exchange components. For more information on our hedging activities, see
Note 3 – Derivatives
to the Consolidated Financial Statements. For more information on interest rate contracts and risk management, see Interest Rate Risk Management for the Banking Book in the MD&A of the Corporation’s 2019 Annual Report on Form 10-K.
We use interest rate derivative instruments to hedge the variability in the cash flows of our assets and liabilities and other forecasted transactions (collectively referred to as cash flow hedges). The net results on both open and terminated cash flow hedge derivative instruments recorded in accumulated OCI
|
Bank of America
48
|
||||||||
were a gain of $557 million and a loss of $496 million, on a pretax basis, at September 30, 2020 and December 31, 2019. These gains and losses are expected to be reclassified into earnings in the same period as the hedged cash flows affect earnings and will decrease income or increase expense on the respective hedged cash flows. Assuming no change in open cash flow derivative hedge positions and no changes in prices or interest rates beyond what is implied in forward yield curves at September 30, 2020, the after-tax net gains are expected to be reclassified into earnings as follows: a gain of $191 million within the next year, a gain of $352 million in years two through five, a loss of $79 million in years six through ten, with the remaining loss of $56 million thereafter. For more information on derivatives designated as cash flow hedges, see
Note 3 – Derivatives
to the Consolidated Financial Statements.
We hedge our net investment in non-U.S. operations determined to have functional currencies other than the U.S.
dollar using forward foreign exchange contracts that typically settle in less than 180 days, cross-currency basis swaps and foreign exchange options. We recorded net after-tax losses on derivatives in accumulated OCI associated with net investment hedges which were offset by gains on our net investments in consolidated non-U.S. entities at September 30, 2020.
Table 45 presents derivatives utilized in our ALM activities and shows the notional amount, fair value, weighted-average receive-fixed and pay-fixed rates, expected maturity and average estimated durations of our open ALM derivatives at September 30, 2020 and December 31, 2019. These amounts do not include derivative hedges on our MSRs. During the nine months ended September 30, 2020, the fair value of receive-fixed interest rate swaps increased while pay-fixed interest swaps decreased, primarily driven by lower swap rates on hedges of U.S. dollar long-term debt.
| Table 45 | Asset and Liability Management Interest Rate and Foreign Exchange Contracts | |||||||||||||||||||||||||||||||||||||||||||||||||||||||
| September 30, 2020 | ||||||||||||||||||||||||||||||||||||||||||||||||||||||||
| Expected Maturity | ||||||||||||||||||||||||||||||||||||||||||||||||||||||||
|
(Dollars in millions, average estimated duration in years)
|
Fair
Value |
Total | Remainder of 2020 | 2021 | 2022 | 2023 | 2024 | Thereafter |
Average
Estimated Duration |
|||||||||||||||||||||||||||||||||||||||||||||||
|
Receive-fixed interest rate swaps
(1)
|
$ | 24,685 | 7.78 | |||||||||||||||||||||||||||||||||||||||||||||||||||||
| Notional amount | $ | 282,994 | $ | 4,650 | $ | 14,644 | $ | 27,058 | $ | 46,960 | $ | 31,747 | $ | 157,935 | ||||||||||||||||||||||||||||||||||||||||||
| Weighted-average fixed-rate | 1.90 | % | 2.79 | % | 3.17 | % | 2.01 | % | 1.82 | % | 1.42 | % | 1.85 | % | ||||||||||||||||||||||||||||||||||||||||||
|
Pay-fixed interest rate swaps
(1)
|
(11,446) | 6.66 | ||||||||||||||||||||||||||||||||||||||||||||||||||||||
| Notional amount | $ | 271,616 | $ | 4,344 | $ | 12,269 | $ | 15,258 | $ | 36,919 | $ | 30,411 | $ | 172,415 | ||||||||||||||||||||||||||||||||||||||||||
| Weighted-average fixed-rate | 1.05 | % | 2.16 | % | 0.62 | % | 0.34 | % | 1.21 | % | 1.04 | % | 1.09 | % | ||||||||||||||||||||||||||||||||||||||||||
|
Same-currency basis swaps
(2)
|
(199) | |||||||||||||||||||||||||||||||||||||||||||||||||||||||
| Notional amount | $ | 209,569 | $ | 3,381 | $ | 18,537 | $ | 6,796 | $ | 3,518 | $ | 22,737 | $ | 154,600 | ||||||||||||||||||||||||||||||||||||||||||
|
Foreign exchange basis swaps
(1, 3, 4)
|
(1,251) | |||||||||||||||||||||||||||||||||||||||||||||||||||||||
| Notional amount | 108,512 | 1,485 | 26,538 | 15,637 | 7,890 | 3,555 | 53,407 | |||||||||||||||||||||||||||||||||||||||||||||||||
|
Foreign exchange contracts
(1, 4, 5)
|
1,841 | |||||||||||||||||||||||||||||||||||||||||||||||||||||||
|
Notional amount
(6)
|
(102,072) | (128,059) | 1,989 | 2,721 | 2,402 | 4,546 | 14,329 | |||||||||||||||||||||||||||||||||||||||||||||||||
| Futures and forward rate contracts | 115 | |||||||||||||||||||||||||||||||||||||||||||||||||||||||
| Notional amount | 48,375 | 48,375 | ||||||||||||||||||||||||||||||||||||||||||||||||||||||
| Option products | — | |||||||||||||||||||||||||||||||||||||||||||||||||||||||
| Notional amount | 16 | — | — | — | 16 | — | — | |||||||||||||||||||||||||||||||||||||||||||||||||
| Net ALM contracts | $ | 13,745 | ||||||||||||||||||||||||||||||||||||||||||||||||||||||
| December 31, 2019 | ||||||||||||||||||||||||||||||||||||||||||||||||||||||||
| Expected Maturity | ||||||||||||||||||||||||||||||||||||||||||||||||||||||||
|
(Dollars in millions, average estimated duration in years)
|
Fair
Value |
Total | 2020 | 2021 | 2022 | 2023 | 2024 | Thereafter |
Average
Estimated Duration |
|||||||||||||||||||||||||||||||||||||||||||||||
|
Receive-fixed interest rate swaps
(1)
|
$ | 12,370 | 6.47 | |||||||||||||||||||||||||||||||||||||||||||||||||||||
| Notional amount | $ | 215,123 | $ | 16,347 | $ | 14,642 | $ | 21,616 | $ | 36,356 | $ | 21,257 | $ | 104,905 | ||||||||||||||||||||||||||||||||||||||||||
| Weighted-average fixed-rate | 2.68 | % | 2.68 | % | 3.17 | % | 2.48 | % | 2.36 | % | 2.55 | % | 2.79 | % | ||||||||||||||||||||||||||||||||||||||||||
|
Pay-fixed interest rate swaps
(1)
|
(2,669) | 6.99 | ||||||||||||||||||||||||||||||||||||||||||||||||||||||
| Notional amount | $ | 69,586 | $ | 4,344 | $ | 2,117 | $ | — | $ | 13,993 | $ | 8,194 | $ | 40,938 | ||||||||||||||||||||||||||||||||||||||||||
| Weighted-average fixed-rate | 2.36 | % | 2.16 | % | 2.15 | % | — | % | 2.52 | % | 2.26 | % | 2.35 | % | ||||||||||||||||||||||||||||||||||||||||||
|
Same-currency basis swaps
(2)
|
(290) | |||||||||||||||||||||||||||||||||||||||||||||||||||||||
| Notional amount | $ | 152,160 | $ | 18,857 | $ | 18,590 | $ | 4,306 | $ | 2,017 | $ | 14,567 | $ | 93,823 | ||||||||||||||||||||||||||||||||||||||||||
|
Foreign exchange basis swaps
(1, 3, 4)
|
(1,258) | |||||||||||||||||||||||||||||||||||||||||||||||||||||||
| Notional amount | 113,529 | 23,639 | 24,215 | 14,611 | 7,111 | 3,521 | 40,432 | |||||||||||||||||||||||||||||||||||||||||||||||||
|
Foreign exchange contracts
(1, 4, 5)
|
414 | |||||||||||||||||||||||||||||||||||||||||||||||||||||||
|
Notional amount
(6)
|
(53,106) | (79,315) | 4,539 | 2,674 | 2,340 | 4,432 | 12,224 | |||||||||||||||||||||||||||||||||||||||||||||||||
| Option products | — | |||||||||||||||||||||||||||||||||||||||||||||||||||||||
| Notional amount | 15 | — | — | — | 15 | — | — | |||||||||||||||||||||||||||||||||||||||||||||||||
| Net ALM contracts | $ | 8,567 | ||||||||||||||||||||||||||||||||||||||||||||||||||||||
(1)
Does not include basis adjustments on either fixed-rate debt issued by the Corporation or AFS debt securities, which are hedged using derivatives designated as fair value hedging instruments, that substantially offset the fair values of these derivatives.
(2)
At September 30, 2020 and December 31, 2019, the notional amount of same-currency basis swaps included $209.6 billion and $152.2 billion in both foreign currency and U.S. dollar-denominated basis swaps in which both sides of the swap are in the same currency.
(3)
Foreign exchange basis swaps consisted of cross-currency variable interest rate swaps used separately or in conjunction with receive-fixed interest rate swaps.
(4)
Does not include foreign currency translation adjustments on certain non-U.S. debt issued by the Corporation that substantially offset the fair values of these derivatives.
(5)
The notional amount of foreign exchange contracts of $(102.1) billion at September 30, 2020 was comprised of $33.7 billion in foreign currency-denominated and cross-currency receive-fixed swaps, $(131.9) billion in net foreign currency forward rate contracts, $(4.3) billion in foreign currency-denominated interest rate swaps and $462 million in net foreign currency futures contracts. Foreign exchange contracts of $(53.1) billion at December 31, 2019 were comprised of $29.0 billion in foreign currency-denominated and cross-currency receive-fixed swaps, $(82.4) billion in net foreign currency forward rate contracts, $(313) million in foreign currency-denominated interest rate swaps and $644 million in foreign currency futures contracts.
(6)
Reflects the net of long and short positions. Amounts shown as negative reflect a net short position.
|
49
Bank of America
|
||||||||
Mortgage Banking Risk Management
We originate, fund and service mortgage loans, which subject us to credit, liquidity and interest rate risks, among others. We determine whether loans will be held for investment or held for sale at the time of commitment and manage credit and liquidity risks by selling or securitizing a portion of the loans we originate.
Changes in interest rates impact the value of interest rate lock commitments (IRLCs) and the related residential first mortgage LHFS, as well as the value of the MSRs. Because the interest rate risks of these hedged items offset, we combine them into one overall hedged item with one combined economic hedge portfolio consisting of derivative contracts and securities. For more information on IRLCs and the related residential mortgage LHFS, see Mortgage Banking Risk Management in the MD&A of the Corporation’s 2019 Annual Report on Form 10-K.
During the three and nine months ended September 30, 2020 and 2019, we recorded gains of $85 million and $313 million related to the change in fair value of the MSRs, IRLCs and LHFS, net of gains and losses on the hedge portfolio, compared to gains of $78 million and $217 million for the same periods in 2019.
Complex Accounting Estimates
Our significant accounting principles are essential in understanding the MD&A. Many of our significant accounting principles require complex judgments to estimate the values of assets and liabilities. We have procedures and processes in place to facilitate making these judgments. For more information, see Complex Accounting Estimates in the MD&A of the Corporation’s 2019 Annual Report on Form 10-K and
Note 1 – Summary of Significant Accounting Principles
to the Consolidated Financial Statements of the Corporation’s 2019 Annual Report on Form 10-K. Except as noted below under Allowance for Credit Losses, there have not been any material updates to our complex accounting estimates as disclosed in the MD&A of the Corporation's Annual Report on Form 10-K.
Allowance for Credit Losses
On January 1, 2020, the Corporation adopted the new accounting standard that requires the measurement of the allowance for credit losses, which includes the allowance for loan and lease losses and the reserve for unfunded lending commitments, to be based on management’s best estimate of lifetime ECL inherent in the Corporation's relevant financial assets.
The Corporation's estimate of lifetime ECL includes the use of quantitative models that incorporate forward-looking
macroeconomic scenarios that are applied over the contractual life of the loan portfolios, adjusted for expected prepayments and borrower-controlled extension options. These macroeconomic scenarios include variables that have historically been key drivers of increases and decreases in credit losses. These variables include, but are not limited to, unemployment rates, real estate prices, gross domestic product levels, corporate bond spreads and long-term interest rate forecasts. As any one economic outlook is inherently uncertain, the Corporation leverages multiple scenarios. The scenarios that are chosen each quarter and the amount of weighting given to each scenario depend on a variety of factors including recent economic events, leading economic indicators, views of internal and third-party economists and industry trends.
The Corporation also includes qualitative reserves to cover losses that are expected but, in the Corporation's assessment, may not be adequately represented in the economic assumptions described above. For example, factors that the Corporation considers include changes in lending policies and procedures, business conditions, the nature and size of the portfolio, portfolio concentrations, the volume and severity of past due loans and nonaccrual loans, the effect of external factors such as competition and legal and regulatory requirements, among others. Further, the Corporation considers the inherent uncertainty in quantitative models that are built on historical data.
The allowance for credit losses can also be impacted by unanticipated changes in asset quality of the portfolio, such as increases in risk rating downgrades in our commercial portfolio, deterioration in borrower delinquencies or credit scores in our credit card portfolio or increases in LTVs in our consumer real estate portfolio. In addition, while we have incorporated our estimated impact of COVID-19 into our allowance for credit losses, the ultimate impact of the pandemic is still unknown, including how long economic activities will be impacted and what effect the unprecedented levels of government fiscal and monetary actions will have on the economy and our credit losses.
As described above, the process to determine the allowance for credit losses requires numerous estimates and assumptions, some of which require a high degree of judgment and are often interrelated. Changes in the estimates and assumptions can result in significant changes in the allowance for credit losses. Our process for determining the allowance for credit losses is further discussed in
Note 1 – Summary of Significant Accounting Principles
and
Note 5 – Outstanding Loans and Leases and Allowance for Credit Losses
to the Consolidated Financial Statements.
|
Bank of America
50
|
||||||||
Non-GAAP Reconciliations
Table 46 provides reconciliations of certain non-GAAP financial measures to the most closely related GAAP financial measures.
| Table 46 |
Period-end and Average Supplemental Financial Data and Reconciliations to GAAP Financial Measures
(1)
|
|||||||||||||||||||||||||||||||||||||
| Period-end | Average | |||||||||||||||||||||||||||||||||||||
|
September 30
2020 |
December 31
2019 |
Three Months Ended September 30 | Nine Months Ended September 30 | |||||||||||||||||||||||||||||||||||
| (Dollars in millions) | 2020 | 2019 | 2020 | 2019 | ||||||||||||||||||||||||||||||||||
| Shareholders’ equity | $ | 268,850 | $ | 264,810 | $ | 267,323 | $ | 270,430 | $ | 266,062 | $ | 268,223 | ||||||||||||||||||||||||||
| Goodwill | (68,951) | (68,951) | (68,951) | (68,951) | (68,951) | (68,951) | ||||||||||||||||||||||||||||||||
| Intangible assets (excluding MSRs) | (2,185) | (1,661) | (1,976) | (1,707) | (1,758) | (1,735) | ||||||||||||||||||||||||||||||||
| Related deferred tax liabilities | 910 | 713 | 855 | 752 | 791 | 787 | ||||||||||||||||||||||||||||||||
| Tangible shareholders’ equity | $ | 198,624 | $ | 194,911 | $ | 197,251 | $ | 200,524 | $ | 196,144 | $ | 198,324 | ||||||||||||||||||||||||||
| Preferred stock | (23,427) | (23,401) | (23,427) | (23,800) | (23,437) | (22,894) | ||||||||||||||||||||||||||||||||
| Tangible common shareholders’ equity | $ | 175,197 | $ | 171,510 | $ | 173,824 | $ | 176,724 | $ | 172,707 | $ | 175,430 | ||||||||||||||||||||||||||
| Total assets | $ | 2,738,452 | $ | 2,434,079 | ||||||||||||||||||||||||||||||||||
| Goodwill | (68,951) | (68,951) | ||||||||||||||||||||||||||||||||||||
| Intangible assets (excluding MSRs) | (2,185) | (1,661) | ||||||||||||||||||||||||||||||||||||
| Related deferred tax liabilities | 910 | 713 | ||||||||||||||||||||||||||||||||||||
| Tangible assets | $ | 2,668,226 | $ | 2,364,180 | ||||||||||||||||||||||||||||||||||
(1)
Presents reconciliations of non-GAAP financial measures to the most closely related GAAP financial measures. For more information on non-GAAP financial measures and ratios we use in assessing the results of the Corporation, see Supplemental Financial Data on page 8.
Item 3. Quantitative and Qualitative Disclosures about Market Risk
See Market Risk Management on page 46 in the MD&A and the sections referenced therein for Quantitative and Qualitative Disclosures about Market Risk.
Item 4. Controls and Procedures
Disclosure Controls and Procedures
As of the end of the period covered by this report, the Corporation’s management, including the Chief Executive Officer and Chief Financial Officer, conducted an evaluation of the effectiveness and design of the Corporation’s disclosure controls and procedures (as that term is defined in Rule 13a-15(e) of the Exchange Act). Based upon that evaluation, the Corporation’s Chief Executive Officer and Chief Financial Officer concluded that the Corporation’s disclosure controls and procedures were effective, as of the end of the period covered by this report.
Changes in Internal Control Over Financial Reporting
There have been no changes in the Corporation’s internal control over financial reporting (as defined in Rule 13a-15(f) of the Exchange Act) during the three months ended September 30, 2020, that have materially affected, or are reasonably likely to materially affect, the Corporation’s internal control over financial reporting.
|
51
Bank of America
|
||||||||
Part I. Financial Information
Item 1. Financial Statements
Bank of America Corporation and Subsidiaries
|
Consolidated Statement of Income
|
|||||||||||||||||||||||
| Three Months Ended September 30 | Nine Months Ended September 30 | ||||||||||||||||||||||
| (In millions, except per share information) | 2020 | 2019 | 2020 | 2019 | |||||||||||||||||||
| Net interest income | |||||||||||||||||||||||
| Interest income | $ |
|
$ |
|
$ |
|
$ |
|
|||||||||||||||
| Interest expense |
|
|
|
|
|||||||||||||||||||
| Net interest income |
|
|
|
|
|||||||||||||||||||
| Noninterest income | |||||||||||||||||||||||
| Fees and commissions |
|
|
|
|
|||||||||||||||||||
| Market making and similar activities |
|
|
|
|
|||||||||||||||||||
| Other income |
(
|
|
(
|
|
|||||||||||||||||||
| Total noninterest income |
|
|
|
|
|||||||||||||||||||
| Total revenue, net of interest expense |
|
|
|
|
|||||||||||||||||||
| Provision for credit losses |
|
|
|
|
|||||||||||||||||||
| Noninterest expense | |||||||||||||||||||||||
| Compensation and benefits |
|
|
|
|
|||||||||||||||||||
| Occupancy and equipment |
|
|
|
|
|||||||||||||||||||
| Information processing and communications |
|
|
|
|
|||||||||||||||||||
| Product delivery and transaction related |
|
|
|
|
|||||||||||||||||||
| Marketing |
|
|
|
|
|||||||||||||||||||
| Professional fees |
|
|
|
|
|||||||||||||||||||
| Other general operating |
|
|
|
|
|||||||||||||||||||
| Total noninterest expense |
|
|
|
|
|||||||||||||||||||
| Income before income taxes |
|
|
|
|
|||||||||||||||||||
| Income tax expense |
(
|
|
|
|
|||||||||||||||||||
| Net income | $ |
|
$ |
|
$ |
|
$ |
|
|||||||||||||||
| Preferred stock dividends |
|
|
|
|
|||||||||||||||||||
| Net income applicable to common shareholders | $ |
|
$ |
|
$ |
|
$ |
|
|||||||||||||||
| Per common share information | |||||||||||||||||||||||
| Earnings | $ |
|
$ |
|
$ |
|
$ |
|
|||||||||||||||
| Diluted earnings |
|
|
|
|
|||||||||||||||||||
| Average common shares issued and outstanding |
|
|
|
|
|||||||||||||||||||
| Average diluted common shares issued and outstanding |
|
|
|
|
|||||||||||||||||||
|
Consolidated Statement of Comprehensive Income
|
|||||||||||||||||||||||
| Three Months Ended September 30 | Nine Months Ended September 30 | ||||||||||||||||||||||
| (Dollars in millions) | 2020 | 2019 | 2020 | 2019 | |||||||||||||||||||
| Net income | $ |
|
$ |
|
$ |
|
$ |
|
|||||||||||||||
| Other comprehensive income (loss), net-of-tax: | |||||||||||||||||||||||
| Net change in debt securities |
|
|
|
|
|||||||||||||||||||
| Net change in debit valuation adjustments |
(
|
|
(
|
(
|
|||||||||||||||||||
| Net change in derivatives |
|
|
|
|
|||||||||||||||||||
| Employee benefit plan adjustments |
|
|
|
|
|||||||||||||||||||
| Net change in foreign currency translation adjustments |
|
(
|
(
|
(
|
|||||||||||||||||||
| Other comprehensive income (loss) |
|
|
|
|
|||||||||||||||||||
| Comprehensive income | $ |
|
$ |
|
$ |
|
$ |
|
|||||||||||||||
See accompanying Notes to Consolidated Financial Statements.
|
Bank of America
52
|
||||||||
Bank of America Corporation and Subsidiaries
|
Consolidated Balance Sheet
|
||||||||||||||
| September 30 | December 31 | |||||||||||||
| (Dollars in millions) | 2020 | 2019 | ||||||||||||
| Assets | ||||||||||||||
| Cash and due from banks | $ |
|
$ |
|
||||||||||
| Interest-bearing deposits with the Federal Reserve, non-U.S. central banks and other banks |
|
|
||||||||||||
| Cash and cash equivalents |
|
|
||||||||||||
| Time deposits placed and other short-term investments |
|
|
||||||||||||
|
Federal funds sold and securities borrowed or purchased under agreements to resell
(includes
$
|
|
|
||||||||||||
|
Trading account assets (includes
$
|
|
|
||||||||||||
| Derivative assets |
|
|
||||||||||||
| Debt securities: | ||||||||||||||
| Carried at fair value |
|
|
||||||||||||
|
Held-to-maturity, at cost (fair value –
$
|
|
|
||||||||||||
| Total debt securities |
|
|
||||||||||||
|
Loans and leases (includes
$
|
|
|
||||||||||||
| Allowance for loan and lease losses |
(
|
(
|
||||||||||||
| Loans and leases, net of allowance |
|
|
||||||||||||
| Premises and equipment, net |
|
|
||||||||||||
| Goodwill |
|
|
||||||||||||
|
Loans held-for-sale (includes
$
|
|
|
||||||||||||
| Customer and other receivables |
|
|
||||||||||||
|
Other assets (includes
$
|
|
|
||||||||||||
| Total assets | $ |
|
$ |
|
||||||||||
| Liabilities | ||||||||||||||
| Deposits in U.S. offices: | ||||||||||||||
| Noninterest-bearing | $ |
|
$ |
|
||||||||||
|
Interest-bearing (includes
$
|
|
|
||||||||||||
| Deposits in non-U.S. offices: | ||||||||||||||
| Noninterest-bearing |
|
|
||||||||||||
| Interest-bearing |
|
|
||||||||||||
| Total deposits |
|
|
||||||||||||
|
Federal funds purchased and securities loaned or sold under agreements to repurchase
(includes
$
|
|
|
||||||||||||
| Trading account liabilities |
|
|
||||||||||||
| Derivative liabilities |
|
|
||||||||||||
|
Short-term borrowings (includes
$
|
|
|
||||||||||||
|
Accrued expenses and other liabilities (includes
$
and
$
|
|
|
||||||||||||
|
Long-term debt (includes
$
|
|
|
||||||||||||
| Total liabilities |
|
|
||||||||||||
|
Commitments and contingencies
(Note 6 – Securitizations and Other Variable Interest Entities
and
Note 10 – Commitments and Contingencies)
|
|
|
||||||||||||
| Shareholders’ equity | ||||||||||||||
|
Preferred stock, $
|
|
|
||||||||||||
|
Common stock and additional paid-in capital,
$
issued and outstanding –
|
|
|
||||||||||||
| Retained earnings |
|
|
||||||||||||
| Accumulated other comprehensive income (loss) |
(
|
(
|
||||||||||||
| Total shareholders’ equity |
|
|
||||||||||||
| Total liabilities and shareholders’ equity | $ |
|
$ |
|
||||||||||
| Assets of consolidated variable interest entities included in total assets above (isolated to settle the liabilities of the variable interest entities) | ||||||||||||||
| Trading account assets | $ |
|
$ |
|
||||||||||
| Loans and leases |
|
|
||||||||||||
| Allowance for loan and lease losses |
(
|
(
|
||||||||||||
| Loans and leases, net of allowance |
|
|
||||||||||||
| All other assets |
|
|
||||||||||||
| Total assets of consolidated variable interest entities | $ |
|
$ |
|
||||||||||
| Liabilities of consolidated variable interest entities included in total liabilities above | ||||||||||||||
|
Short-term borrowings (includes
$
|
$ |
|
$ |
|
||||||||||
|
Long-term debt (includes
$
|
|
|
||||||||||||
|
All other liabilities (includes
$
|
|
|
||||||||||||
| Total liabilities of consolidated variable interest entities | $ |
|
$ |
|
||||||||||
See accompanying Notes to Consolidated Financial Statements.
|
53
Bank of America
|
||||||||
Bank of America Corporation and Subsidiaries
| Consolidated Statement of Changes in Shareholders’ Equity | |||||||||||||||||||||||||||||||||||
|
Preferred
Stock |
Common Stock and
Additional Paid-in Capital |
Retained
Earnings |
Accumulated
Other Comprehensive Income (Loss) |
Total
Shareholders’ Equity |
|||||||||||||||||||||||||||||||
| (In millions) | Shares | Amount | |||||||||||||||||||||||||||||||||
| Balance, June 30, 2020 | $ |
|
|
$ |
|
$ |
|
$ |
(
|
$ |
|
||||||||||||||||||||||||
|
Net income
|
|
|
|||||||||||||||||||||||||||||||||
|
Net change in debt securities
|
|
|
|||||||||||||||||||||||||||||||||
| Net change in debit valuation adjustments |
(
|
(
|
|||||||||||||||||||||||||||||||||
| Net change in derivatives |
|
|
|||||||||||||||||||||||||||||||||
| Employee benefit plan adjustments |
|
|
|||||||||||||||||||||||||||||||||
| Net change in foreign currency translation adjustments |
|
|
|||||||||||||||||||||||||||||||||
| Dividends declared: | |||||||||||||||||||||||||||||||||||
| Common |
(
|
(
|
|||||||||||||||||||||||||||||||||
| Preferred |
(
|
(
|
|||||||||||||||||||||||||||||||||
|
Common stock issued under employee plans, net, and other
|
|
|
|
||||||||||||||||||||||||||||||||
|
Common stock repurchased
|
(
|
(
|
(
|
||||||||||||||||||||||||||||||||
| Balance, September 30, 2020 | $ |
|
|
$ |
|
$ |
|
$ |
(
|
$ |
|
||||||||||||||||||||||||
| Balance, December 31, 2019 | $ |
|
|
$ |
|
$ |
|
$ |
(
|
$ |
|
||||||||||||||||||||||||
| Cumulative adjustment for adoption of credit loss accounting standard |
(
|
(
|
|||||||||||||||||||||||||||||||||
| Net income |
|
|
|||||||||||||||||||||||||||||||||
|
Net change in debt securities
|
|
|
|||||||||||||||||||||||||||||||||
| Net change in debit valuation adjustments |
(
|
(
|
|||||||||||||||||||||||||||||||||
| Net change in derivatives |
|
|
|||||||||||||||||||||||||||||||||
| Employee benefit plan adjustments |
|
|
|||||||||||||||||||||||||||||||||
|
Net change in foreign currency translation adjustments
|
(
|
(
|
|||||||||||||||||||||||||||||||||
| Dividends declared: | |||||||||||||||||||||||||||||||||||
| Common |
(
|
(
|
|||||||||||||||||||||||||||||||||
| Preferred |
(
|
(
|
|||||||||||||||||||||||||||||||||
| Issuance of preferred stock |
|
|
|||||||||||||||||||||||||||||||||
|
Redemption of preferred stock
|
(
|
(
|
|||||||||||||||||||||||||||||||||
|
Common stock issued under employee plans, net, and other
|
|
|
(
|
|
|||||||||||||||||||||||||||||||
| Common stock repurchased |
(
|
(
|
(
|
||||||||||||||||||||||||||||||||
| Balance, September 30, 2020 | $ |
|
|
$ |
|
$ |
|
$ |
(
|
$ |
|
||||||||||||||||||||||||
| Balance, June 30, 2019 | $ |
|
|
$ |
|
$ |
|
$ |
(
|
$ |
|
||||||||||||||||||||||||
| Net income |
|
|
|||||||||||||||||||||||||||||||||
|
Net change in debt securities
|
|
|
|||||||||||||||||||||||||||||||||
| Net change in debit valuation adjustments |
|
|
|||||||||||||||||||||||||||||||||
| Net change in derivatives |
|
|
|||||||||||||||||||||||||||||||||
| Employee benefit plan adjustments |
|
|
|||||||||||||||||||||||||||||||||
|
Net change in foreign currency translation adjustments
|
(
|
(
|
|||||||||||||||||||||||||||||||||
| Dividends declared: | |||||||||||||||||||||||||||||||||||
| Common |
(
|
(
|
|||||||||||||||||||||||||||||||||
| Preferred |
(
|
(
|
|||||||||||||||||||||||||||||||||
| Issuance of preferred stock |
|
|
|||||||||||||||||||||||||||||||||
| Redemption of preferred stock |
(
|
(
|
|||||||||||||||||||||||||||||||||
|
Common stock issued under employee plans, net, and other
|
|
|
(
|
|
|||||||||||||||||||||||||||||||
|
Common stock repurchased
|
(
|
(
|
(
|
||||||||||||||||||||||||||||||||
| Balance, September 30, 2019 | $ |
|
|
$ |
|
$ |
|
$ |
(
|
$ |
|
||||||||||||||||||||||||
| Balance, December 31, 2018 | $ |
|
|
$ |
|
$ |
|
$ |
(
|
$ |
|
||||||||||||||||||||||||
| Cumulative adjustment for adoption of lease accounting standard |
|
|
|||||||||||||||||||||||||||||||||
| Net income |
|
|
|||||||||||||||||||||||||||||||||
| Net change in debt securities |
|
|
|||||||||||||||||||||||||||||||||
| Net change in debit valuation adjustments |
(
|
(
|
|||||||||||||||||||||||||||||||||
| Net change in derivatives |
|
|
|||||||||||||||||||||||||||||||||
| Employee benefit plan adjustments |
|
|
|||||||||||||||||||||||||||||||||
| Net change in foreign currency translation adjustments |
(
|
(
|
|||||||||||||||||||||||||||||||||
| Dividends declared: | |||||||||||||||||||||||||||||||||||
| Common |
(
|
(
|
|||||||||||||||||||||||||||||||||
| Preferred |
(
|
(
|
|||||||||||||||||||||||||||||||||
| Issuance of preferred stock |
|
|
|||||||||||||||||||||||||||||||||
| Redemption of preferred stock |
(
|
(
|
|||||||||||||||||||||||||||||||||
| Common stock issued under employee plans, net, and other |
|
|
(
|
|
|||||||||||||||||||||||||||||||
| Common stock repurchased |
(
|
(
|
(
|
||||||||||||||||||||||||||||||||
| Balance, September 30, 2019 | $ |
|
|
$ |
|
$ |
|
$ |
(
|
$ |
|
||||||||||||||||||||||||
See accompanying Notes to Consolidated Financial Statements.
|
Bank of America
54
|
||||||||
Bank of America Corporation and Subsidiaries
|
Consolidated Statement of Cash Flows
|
|||||||||||
| Nine Months Ended September 30 | |||||||||||
| (Dollars in millions) | 2020 | 2019 | |||||||||
| Operating activities | |||||||||||
| Net income | $ |
|
$ |
|
|||||||
| Adjustments to reconcile net income to net cash provided by operating activities: | |||||||||||
| Provision for credit losses |
|
|
|||||||||
| Gains on sales of debt securities |
(
|
(
|
|||||||||
| Depreciation and amortization |
|
|
|||||||||
| Net amortization of premium/discount on debt securities |
|
|
|||||||||
| Deferred income taxes |
(
|
|
|||||||||
| Stock-based compensation |
|
|
|||||||||
| Impairment of equity method investment |
|
|
|||||||||
| Loans held-for-sale: | |||||||||||
| Originations and purchases |
(
|
(
|
|||||||||
|
Proceeds from sales and paydowns of loans originally classified as held for sale and instruments
from related securitization activities
|
|
|
|||||||||
| Net change in: | |||||||||||
| Trading and derivative assets/liabilities |
(
|
(
|
|||||||||
| Other assets |
(
|
|
|||||||||
| Accrued expenses and other liabilities |
(
|
(
|
|||||||||
| Other operating activities, net |
|
|
|||||||||
| Net cash provided by (used in) operating activities |
(
|
|
|||||||||
| Investing activities | |||||||||||
| Net change in: | |||||||||||
| Time deposits placed and other short-term investments |
|
(
|
|||||||||
| Federal funds sold and securities borrowed or purchased under agreements to resell |
(
|
(
|
|||||||||
| Debt securities carried at fair value: | |||||||||||
| Proceeds from sales |
|
|
|||||||||
| Proceeds from paydowns and maturities |
|
|
|||||||||
| Purchases |
(
|
(
|
|||||||||
| Held-to-maturity debt securities: | |||||||||||
| Proceeds from paydowns and maturities |
|
|
|||||||||
| Purchases |
(
|
(
|
|||||||||
| Loans and leases: | |||||||||||
|
Proceeds from sales of loans originally classified as held for investment and instruments
from related securitization activities
|
|
|
|||||||||
| Purchases |
(
|
(
|
|||||||||
| Other changes in loans and leases, net |
|
(
|
|||||||||
| Other investing activities, net |
(
|
(
|
|||||||||
| Net cash used in investing activities |
(
|
(
|
|||||||||
| Financing activities | |||||||||||
| Net change in: | |||||||||||
| Deposits |
|
|
|||||||||
| Federal funds purchased and securities loaned or sold under agreements to repurchase |
|
|
|||||||||
| Short-term borrowings |
(
|
|
|||||||||
| Long-term debt: | |||||||||||
| Proceeds from issuance |
|
|
|||||||||
| Retirement |
(
|
(
|
|||||||||
| Preferred stock: | |||||||||||
| Proceeds from issuance |
|
|
|||||||||
| Redemption |
(
|
(
|
|||||||||
| Common stock repurchased |
(
|
(
|
|||||||||
| Cash dividends paid |
(
|
(
|
|||||||||
| Other financing activities, net |
(
|
(
|
|||||||||
| Net cash provided by financing activities |
|
|
|||||||||
| Effect of exchange rate changes on cash and cash equivalents |
|
(
|
|||||||||
| Net increase (decrease) in cash and cash equivalents |
|
(
|
|||||||||
| Cash and cash equivalents at January 1 |
|
|
|||||||||
| Cash and cash equivalents at September 30 | $ |
|
$ |
|
|||||||
See accompanying Notes to Consolidated Financial Statements.
|
55
Bank of America
|
||||||||
Bank of America Corporation and Subsidiaries
Notes to Consolidated Financial Statements
NOTE 1
Summary of Significant Accounting Principles
Bank of America Corporation, a bank holding company and a financial holding company, provides a diverse range of financial services and products throughout the U.S. and in certain international markets. The term “the Corporation” as used herein may refer to Bank of America Corporation, individually, Bank of America Corporation and its subsidiaries, or certain of Bank of America Corporation’s subsidiaries or affiliates.
Principles of Consolidation and Basis of Presentation
The Consolidated Financial Statements include the accounts of the Corporation and its majority-owned subsidiaries and those variable interest entities (VIEs) where the Corporation is the primary beneficiary. Intercompany accounts and transactions have been eliminated. Results of operations of acquired companies are included from the dates of acquisition, and for VIEs, from the dates that the Corporation became the primary beneficiary. Assets held in an agency or fiduciary capacity are not included in the Consolidated Financial Statements. The Corporation accounts for investments in companies for which it owns a voting interest and for which it has the ability to exercise significant influence over operating and financing decisions using the equity method of accounting. These investments are included in other assets. Equity method investments are subject to impairment testing, and the Corporation’s proportionate share of income or loss is included in other income.
These unaudited Consolidated Financial Statements should be read in conjunction with the audited Consolidated Financial Statements of the Corporation’s 2019 Annual Report on Form 10-K.
The nature of the Corporation’s business is such that the results of any interim period are not necessarily indicative of results for a full year. In the opinion of management, all adjustments, which consist of normal recurring adjustments necessary for a fair statement of the interim period results, have been made. The Corporation evaluates subsequent events through the date of filing with the Securities and Exchange Commission. Certain prior-period amounts have been reclassified to conform to current period presentation.
New Accounting Standards
Reference Rate Reform
In March 2020, the FASB issued a new accounting standard related to contracts or hedging relationships that reference LIBOR or other reference rates that are expected to be discontinued due to reference rate reform. The new standard provides for optional expedients and other guidance regarding the accounting related to modifications of contracts, hedging relationships and other transactions affected by reference rate reform. The Corporation has elected to retrospectively adopt the new standard as of January 1, 2020 which resulted in
no
immediate impact. While reference rate reform is not expected to have a material accounting impact on the Corporation’s
consolidated financial position or results of operations, the standard will ease the administrative burden in accounting for the future effects of reference rate reform.
Accounting for Financial Instruments -- Credit Losses
On January 1, 2020, the Corporation adopted the new accounting standard that requires the measurement of the allowance for credit losses to be based on management’s best estimate of lifetime expected credit losses (ECL) inherent in the Corporation’s relevant financial assets. Upon adoption of the standard on January 1, 2020, the Corporation recorded a $
3.3
billion, or
32
percent, increase to the allowance for credit losses. After adjusting for deferred taxes and other adoption effects, a $
2.4
billion decrease was recorded in retained earnings through a cumulative-effect adjustment.
Accounting Principles for Credit Losses
The following summarizes the Corporation’s accounting policies for certain credit loss activities.
Allowance for Credit Losses
The allowance for credit losses includes both the allowance for loan and lease losses and the reserve for unfunded lending commitments and represents management’s estimate of the ECL in the Corporation’s loan and lease portfolio, excluding loans and unfunded lending commitments accounted for under the fair value option. The ECL on funded consumer and commercial loans and leases is referred to as the allowance for loan and lease losses and is reported separately as a contra-asset to loans and leases on the Consolidated Balance Sheet. The ECL for unfunded lending commitments, including home equity lines of credit (HELOCs), standby letters of credit (SBLCs) and binding unfunded loan commitments is reported on the Consolidated Balance Sheet in accrued expenses and other liabilities. The provision for credit losses related to the loan and lease portfolio and unfunded lending commitments is reported in the Consolidated Statement of Income.
For loans and leases, the ECL is typically estimated using quantitative methods that consider a variety of factors such as historical loss experience, the current credit quality of the portfolio as well as an economic outlook over the life of the loan. The life of the loan for closed-ended products is based on the contractual maturity of the loan adjusted for any expected prepayments. The contractual maturity includes any extension options that are at the sole discretion of the borrower. For open-ended products (e.g., lines of credit), the ECL is determined based on the maximum repayment term associated with future draws from credit lines unless those lines of credit are unconditionally cancellable (e.g., credit cards) in which case the Corporation does not record any allowance.
In its loss forecasting framework, the Corporation incorporates forward-looking information through the use of macroeconomic scenarios applied over the forecasted life of the assets. These macroeconomic scenarios include variables that have historically been key drivers of increases and decreases in credit losses. These variables include, but are not limited to, unemployment rates, real estate prices, gross domestic product levels, corporate bond spreads and long-term interest rate forecasts. As any one economic outlook is inherently uncertain, the Corporation leverages multiple scenarios. The scenarios that are chosen each quarter and the amount of weighting given to each scenario depend on a variety of factors including recent economic events, leading economic indicators, views of internal as well as third-party economists and industry trends.
|
Bank of America
56
|
||||||||
The estimate of credit losses includes expected recoveries of amounts previously charged off (i.e., negative allowance). If a loan has been charged off, the expected cash flows on the loan are not limited by the current amortized cost balance. Instead, expected cash flows can be assumed up to the unpaid principal balance immediately prior to the charge-off.
The allowance for loan and lease losses for troubled debt restructurings (TDR) is measured based on the present value of projected future lifetime principal and interest cash flows discounted at the loan’s original effective interest rate, or in cases where foreclosure is probable or the loan is collateral dependent, at the loan’s collateral value or its observable market price, if available. The measurement of ECL for the renegotiated consumer credit card TDR portfolio is based on the present value of projected cash flows discounted using the average TDR portfolio contractual interest rate, excluding promotionally priced loans, in effect prior to restructuring. Projected cash flows for TDRs use the same economic outlook as discussed above. For purposes of computing this specific loss component of the allowance, larger impaired loans are evaluated individually and smaller impaired loans are evaluated as a pool.
Also included in the allowance for loan and lease losses are qualitative reserves to cover losses that are expected but, in the Corporation's assessment, may not be adequately represented in the quantitative methods or the economic assumptions described above. For example, factors that the Corporation considers include changes in lending policies and procedures, business conditions, the nature and size of the portfolio, portfolio concentrations, the volume and severity of past due loans and nonaccrual loans, the effect of external factors such as competition, and legal and regulatory requirements, among others. Further, the Corporation considers the inherent uncertainty in quantitative models that are built on historical data.
With the exception of the Corporation's credit card portfolio, the Corporation does not include reserves for interest receivable in the measurement of the allowance for credit losses as the Corporation generally classifies consumer loans as nonperforming at 90 days past due and reverses interest income for these loans at that time. For credit card loans, the Corporation reserves for interest and fees as part of the allowance for loan and lease losses. Upon charge-off of a credit card loan, the Corporation reverses the interest and fee income against the income statement line item where it was originally recorded.
The Corporation has identified the following
three
portfolio segments and measures the allowance for credit losses using the following methods.
Consumer Real Estate
To estimate ECL for consumer loans secured by residential real estate, the Corporation estimates the number of loans that will default over the life of the existing portfolio, after factoring in estimated prepayments, using quantitative modeling methodologies. The attributes that are most significant in estimating the Corporation’s ECL include refreshed loan-to-value (LTV) or, in the case of a subordinated lien, refreshed combined LTV (CLTV), borrower credit score, months since origination and geography, all of which are further broken down by present collection status (whether the loan is current, delinquent, in default, or in bankruptcy). The estimates are based on the Corporation’s historical experience with the loan portfolio,
adjusted to reflect the economic outlook. The outlook on the unemployment rate and consumer real estate prices are key factors that impact the frequency and severity of loss estimates. The Corporation does not reserve for credit losses on the unpaid principal balance of loans insured by the Federal Housing Administration (FHA) and long-term standby loans, as these loans are fully insured. The Corporation records a reserve for unfunded lending commitments for the ECL associated with the undrawn portion of the Corporation’s HELOCs, which can only be canceled by the Corporation if certain criteria are met. The ECL associated with these unfunded lending commitments is calculated using the same models and methodologies noted above and incorporate utilization assumptions at time of default.
For loans that are more than 180 days past due and collateral-dependent TDRs, the Corporation bases the allowance on the estimated fair value of the underlying collateral as of the reporting date less costs to sell. The fair value of the collateral securing these loans is generally determined using an automated valuation model (AVM) that estimates the value of a property by reference to market data including sales of comparable properties and price trends specific to the Metropolitan Statistical Area in which the property being valued is located. In the event that an AVM value is not available, the Corporation utilizes publicized indices or if these methods provide less reliable valuations, the Corporation uses appraisals or broker price opinions to estimate the fair value of the collateral. While there is inherent imprecision in these valuations, the Corporation believes that they are representative of this portfolio in the aggregate.
For loans that are more than 180 days past due and collateral-dependent TDRs, with the exception of the Corporation’s fully insured portfolio, the outstanding balance of loans that is in excess of the estimated property value after adjusting for costs to sell is charged off. If the estimated property value decreases in periods subsequent to the initial charge-off, the Corporation will record an additional charge-off; however, if the value increases in periods subsequent to the charge-off, the Corporation will adjust the allowance to account for the increase but not to a level above the cumulative charge-off amount.
Credit Cards and Other Consumer
Credit cards are revolving lines of credit without a defined maturity date. The estimated life of a credit card receivable is determined by estimating the amount and timing of expected future payments (e.g., borrowers making full payments, minimum payments or somewhere in between) that it will take for a receivable balance to pay off. The ECL on the future payments incorporates the spending behavior of a borrower through time using key borrower-specific factors and the economic outlook described above. The Corporation applies all expected payments in accordance with the Credit Card Accountability Responsibility and Disclosure Act of 2009 (i.e., paying down the highest interest rate bucket first). Then forecasted future payments are prioritized to pay off the oldest balance until it is brought to zero or an expected charge-off amount. Unemployment rate outlook, borrower credit score, delinquency status and historical payment behavior are all key inputs into the credit card receivable loss forecasting model. Future draws on the credit card lines are excluded from the ECL as they are unconditionally cancellable.
|
57
Bank of America
|
||||||||
The ECL for the consumer vehicle lending portfolio is also determined using quantitative methods supplemented with qualitative analysis. The quantitative model estimates ECL giving consideration to key borrower and loan characteristics such as delinquency status, borrower credit score, LTV ratio, underlying collateral type and collateral value.
Commercial
The ECL on commercial loans is forecasted using models that estimate credit losses over the loan’s contractual life at an individual loan level. The models use the contractual terms to forecast future principal cash flows while also considering expected prepayments. For open-ended commitments such as revolving lines of credit, changes in funded balance are captured by forecasting a borrower’s draw and payment behavior over the remaining life of the commitment. For loans collateralized with commercial real estate and for which the underlying asset is the primary source of repayment, the loss forecasting models consider key loan and customer attributes such as LTV ratio, net operating income and debt service coverage, and captures variations in behavior according to property type and region. The commercial real estate model also utilizes key economic variables to forecast market indicators such as rent levels and vacancy rates, which impact the ECL estimate. For all other commercial loans and leases, the loss forecasting model determines the probabilities of transition to different credit risk ratings or default at each point over the life of the asset based on the borrower’s current credit risk rating, industry sector, size of the exposure and the geographic market. The severity of loss is determined based on the type of collateral securing the exposure, the size of the exposure, the borrower’s industry sector, any guarantors and the geographic market. Assumptions of expected loss are conditioned to the economic outlook and the model considers key economic variables such as unemployment rate, gross domestic product, credit risk spreads, asset prices and equity market returns.
In addition to the allowance for loan and lease losses, the Corporation also estimates ECL related to unfunded lending commitments such as letters of credit, financial guarantees, unfunded bankers acceptances and binding loan commitments, excluding commitments accounted for under the fair value option. Reserves are estimated for the unfunded exposure using the same models and methodologies as the funded exposure and are reported as reserves for unfunded lending commitments.
Securities
The Corporation evaluates each available-for-sale (AFS) security where the value has declined below amortized cost. If the Corporation intends to sell or believes it is more likely than not that it will be required to sell the debt security, it is written down to fair value through earnings. For AFS debt securities the Corporation intends to hold, the Corporation evaluates the debt securities for ECL except for debt securities that are guaranteed by the U.S. Treasury, U.S. government agencies or sovereign entities of high credit quality where the Corporation applies a zero credit loss assumption. For the remaining AFS debt securities, the Corporation considers qualitative parameters such as internal and external credit ratings and the value of underlying collateral. If an AFS debt security fails any of the qualitative parameters, a discounted cash flow analysis is used by the Corporation to determine if a portion of the unrealized loss is a result of a credit loss. Any credit losses determined are recognized as an increase to the allowance for credit losses through provision expense recorded in other income. Cash flows
expected to be collected are estimated using all relevant information available such as, remaining payment terms, prepayment speeds, the financial condition of the issuer, expected defaults and the value of the underlying collateral. If any of the decline in fair value is related to market factors, that amount is recognized in accumulated other comprehensive income (OCI). In certain instances, the credit loss may exceed the total decline in fair value, in which case, the allowance recorded is limited to the difference between the amortized cost and the fair value of the asset.
The Corporation separately evaluates its held-to-maturity (HTM) debt securities for any credit losses, of which substantially all qualify for the zero loss assumption. For the remaining securities, the Corporation performs a discounted cash flow analysis to estimate any credit losses which are then recognized as part of the allowance for credit losses.
Other Assets
For the Corporation’s financial assets that are measured at amortized cost and are not included in debt securities or loans and leases on the Consolidated Balance Sheet, the Corporation evaluates these assets for ECL using various techniques. For assets that are subject to collateral maintenance provisions, including federal funds sold and securities borrowed or purchased under agreements to resell, where the collateral consists of daily margining of liquid and marketable assets where the margining is expected to be maintained into the foreseeable future, the expected losses are assumed to be
zero
. For all other assets, the Corporation performs qualitative analyses, including consideration of historical losses and current economic conditions, to estimate any ECL which are then included in a valuation account that is recorded as a contra-asset against the amortized cost basis of the financial asset.
Troubled Debt Restructurings
The Corporation has implemented various consumer and commercial loan modification programs to provide its borrowers relief from the economic impacts of the COVID-19 pandemic. In accordance with the Coronavirus Aid, Relief, and Economic Security Act (CARES Act), the Corporation has elected to not apply TDR classification to any COVID-19 related loan modifications that were performed after March 1, 2020 to borrowers who were current as of December 31, 2019. Accordingly, these restructurings are not classified as TDRs. In addition, for loans modified in response to the COVID-19 pandemic that do not meet the above criteria (e.g., current payment status at December 31, 2019), the Corporation is applying the guidance included in an interagency statement issued by the bank regulatory agencies. This guidance states that loan modifications performed in light of the COVID-19 pandemic, including loan payment deferrals that are up to six months in duration, that were granted to borrowers who were current as of the implementation date of a loan modification program or modifications granted under government mandated modification programs, are not TDRs. For loan modifications that include a payment deferral and are not TDRs, the borrowers' past due and nonaccrual status have not been impacted during the deferral period. The Corporation has continued to accrue interest during the deferral period using a constant effective yield method. For most mortgage, HELOC and commercial loan modifications, the contractual interest that accrued during the deferral period is payable at the maturity of the loan. The Corporation includes these amounts with the unpaid principal balance when computing its allowance for credit losses. Amounts that are subsequently deemed uncollectible
|
Bank of America
58
|
||||||||
Paycheck Protection Program
The Corporation is participating in the Paycheck Protection Program (PPP), which is a loan program that originated from the CARES Act and was subsequently expanded by the Paycheck Protection Program and Health Care Enhancement Act. The PPP is designed to provide U.S. small businesses with cash-flow assistance through loans fully guaranteed by the Small Business Administration (SBA). If the borrower meets certain criteria and uses the proceeds towards certain eligible expenses, the borrower’s obligation to repay the loan can be forgiven up to the full principal amount of the loan and any accrued interest. Upon borrower forgiveness, the SBA pays the Corporation for the principal and accrued interest owed on the loan. If the full principal of the loan is not forgiven, the loan will operate according to the original loan terms with the 100 percent SBA guaranty remaining. As of September 30, 2020,
NOTE 2
Net Interest Income and Noninterest Income
| Three Months Ended September 30 | Nine Months Ended September 30 | ||||||||||||||||||||||
| (Dollars in millions) | 2020 | 2019 | 2020 | 2019 | |||||||||||||||||||
| Net interest income | |||||||||||||||||||||||
| Interest income | |||||||||||||||||||||||
| Loans and leases | $ |
|
$ |
|
$ |
|
$ |
|
|||||||||||||||
| Debt securities |
|
|
|
|
|||||||||||||||||||
| Federal funds sold and securities borrowed or purchased under agreements to resell |
|
|
|
|
|||||||||||||||||||
| Trading account assets |
|
|
|
|
|||||||||||||||||||
| Other interest income |
|
|
|
|
|||||||||||||||||||
| Total interest income |
|
|
|
|
|||||||||||||||||||
| Interest expense | |||||||||||||||||||||||
| Deposits |
|
|
|
|
|||||||||||||||||||
| Short-term borrowings |
(
|
|
|
|
|||||||||||||||||||
| Trading account liabilities |
|
|
|
|
|||||||||||||||||||
| Long-term debt |
|
|
|
|
|||||||||||||||||||
| Total interest expense |
|
|
|
|
|||||||||||||||||||
| Net interest income | $ |
|
$ |
|
$ |
|
$ |
|
|||||||||||||||
| Noninterest income | |||||||||||||||||||||||
| Fees and commissions | |||||||||||||||||||||||
| Card income | |||||||||||||||||||||||
|
Interchange fees
(1)
|
$ |
|
$ |
|
$ |
|
$ |
|
|||||||||||||||
| Other card income |
|
|
|
|
|||||||||||||||||||
| Total card income |
|
|
|
|
|||||||||||||||||||
| Service charges | |||||||||||||||||||||||
| Deposit-related fees |
|
|
|
|
|||||||||||||||||||
| Lending-related fees |
|
|
|
|
|||||||||||||||||||
| Total service charges |
|
|
|
|
|||||||||||||||||||
| Investment and brokerage services | |||||||||||||||||||||||
| Asset management fees |
|
|
|
|
|||||||||||||||||||
| Brokerage fees |
|
|
|
|
|||||||||||||||||||
| Total investment and brokerage services |
|
|
|
|
|||||||||||||||||||
| Investment banking fees | |||||||||||||||||||||||
| Underwriting income |
|
|
|
|
|||||||||||||||||||
| Syndication fees |
|
|
|
|
|||||||||||||||||||
| Financial advisory services |
|
|
|
|
|||||||||||||||||||
| Total investment banking fees |
|
|
|
|
|||||||||||||||||||
| Total fees and commissions |
|
|
|
|
|||||||||||||||||||
| Market making and similar activities |
|
|
|
|
|||||||||||||||||||
| Other income |
(
|
|
(
|
|
|||||||||||||||||||
| Total noninterest income | $ |
|
$ |
|
$ |
|
$ |
|
|||||||||||||||
(1)
Gross interchange fees were $
2.4
billion and $
2.6
billion for the three months ended September 30, 2020 and 2019 and are presented net of $
1.4
billion and $
1.6
billion of expenses for rewards and partner payments as well as certain other card costs. Gross interchange fees were $
6.7
billion and $
7.4
billion for the nine months ended September 30, 2020 and 2019 and are presented net of $
4.1
billion and $
4.6
billion of expenses for rewards and partner payments as well as certain other card costs for the same periods.
|
59
Bank of America
|
||||||||
NOTE 3
Derivatives
Derivative Balances
Derivatives are entered into on behalf of customers, for trading or to support risk management activities. Derivatives used in risk management activities include derivatives that may or may not be designated in qualifying hedge accounting relationships. Derivatives that are not designated in qualifying hedge accounting relationships are referred to as other risk management derivatives. For more information on the Corporation’s derivatives and hedging activities, see
Note 1 –
| September 30, 2020 | |||||||||||||||||||||||||||||||||||||||||
| Gross Derivative Assets | Gross Derivative Liabilities | ||||||||||||||||||||||||||||||||||||||||
| (Dollars in billions) |
Contract/
Notional
(1)
|
Trading and Other Risk Management Derivatives |
Qualifying
Accounting Hedges |
Total | Trading and Other Risk Management Derivatives |
Qualifying
Accounting Hedges |
Total | ||||||||||||||||||||||||||||||||||
| Interest rate contracts | |||||||||||||||||||||||||||||||||||||||||
| Swaps | $ |
|
$ |
|
$ |
|
$ |
|
$ |
|
$ |
|
$ |
|
|||||||||||||||||||||||||||
| Futures and forwards |
|
|
|
|
|
|
|
||||||||||||||||||||||||||||||||||
| Written options |
|
|
|
|
|
|
|
||||||||||||||||||||||||||||||||||
| Purchased options |
|
|
|
|
|
|
|
||||||||||||||||||||||||||||||||||
| Foreign exchange contracts | |||||||||||||||||||||||||||||||||||||||||
| Swaps |
|
|
|
|
|
|
|
||||||||||||||||||||||||||||||||||
| Spot, futures and forwards |
|
|
|
|
|
|
|
||||||||||||||||||||||||||||||||||
| Written options |
|
|
|
|
|
|
|
||||||||||||||||||||||||||||||||||
| Purchased options |
|
|
|
|
|
|
|
||||||||||||||||||||||||||||||||||
| Equity contracts | |||||||||||||||||||||||||||||||||||||||||
| Swaps |
|
|
|
|
|
|
|
||||||||||||||||||||||||||||||||||
| Futures and forwards |
|
|
|
|
|
|
|
||||||||||||||||||||||||||||||||||
| Written options |
|
|
|
|
|
|
|
||||||||||||||||||||||||||||||||||
| Purchased options |
|
|
|
|
|
|
|
||||||||||||||||||||||||||||||||||
| Commodity contracts | |||||||||||||||||||||||||||||||||||||||||
| Swaps |
|
|
|
|
|
|
|
||||||||||||||||||||||||||||||||||
| Futures and forwards |
|
|
|
|
|
|
|
||||||||||||||||||||||||||||||||||
| Written options |
|
|
|
|
|
|
|
||||||||||||||||||||||||||||||||||
| Purchased options |
|
|
|
|
|
|
|
||||||||||||||||||||||||||||||||||
|
Credit derivatives
(2)
|
|||||||||||||||||||||||||||||||||||||||||
| Purchased credit derivatives: | |||||||||||||||||||||||||||||||||||||||||
| Credit default swaps |
|
|
|
|
|
|
|
||||||||||||||||||||||||||||||||||
| Total return swaps/options |
|
|
|
|
|
|
|
||||||||||||||||||||||||||||||||||
| Written credit derivatives: | |||||||||||||||||||||||||||||||||||||||||
| Credit default swaps |
|
|
|
|
|
|
|
||||||||||||||||||||||||||||||||||
| Total return swaps/options |
|
|
|
|
|
|
|
||||||||||||||||||||||||||||||||||
| Gross derivative assets/liabilities | $ |
|
$ |
|
$ |
|
$ |
|
$ |
|
$ |
|
|||||||||||||||||||||||||||||
| Less: Legally enforceable master netting agreements |
(
|
(
|
|||||||||||||||||||||||||||||||||||||||
| Less: Cash collateral received/paid |
(
|
(
|
|||||||||||||||||||||||||||||||||||||||
| Total derivative assets/liabilities | $ |
|
$ |
|
|||||||||||||||||||||||||||||||||||||
(1)
Represents the total contract/notional amount of derivative assets and liabilities outstanding.
(2)
The net derivative asset (liability) and notional amount of written credit derivatives for which the Corporation held purchased credit derivatives with identical underlying referenced names were $
217
million and $
332.6
billion at September 30, 2020.
|
Bank of America
60
|
||||||||
| December 31, 2019 | |||||||||||||||||||||||||||||||||||||||||
| Gross Derivative Assets | Gross Derivative Liabilities | ||||||||||||||||||||||||||||||||||||||||
| (Dollars in billions) |
Contract/
Notional
(1)
|
Trading and Other Risk Management Derivatives |
Qualifying
Accounting Hedges |
Total | Trading and Other Risk Management Derivatives |
Qualifying
Accounting Hedges |
Total | ||||||||||||||||||||||||||||||||||
| Interest rate contracts | |||||||||||||||||||||||||||||||||||||||||
| Swaps | $ |
|
$ |
|
$ |
|
$ |
|
$ |
|
$ |
|
$ |
|
|||||||||||||||||||||||||||
| Futures and forwards |
|
|
|
|
|
|
|
||||||||||||||||||||||||||||||||||
| Written options |
|
|
|
|
|
|
|
||||||||||||||||||||||||||||||||||
| Purchased options |
|
|
|
|
|
|
|
||||||||||||||||||||||||||||||||||
| Foreign exchange contracts | |||||||||||||||||||||||||||||||||||||||||
| Swaps |
|
|
|
|
|
|
|
||||||||||||||||||||||||||||||||||
| Spot, futures and forwards |
|
|
|
|
|
|
|
||||||||||||||||||||||||||||||||||
| Written options |
|
|
|
|
|
|
|
||||||||||||||||||||||||||||||||||
| Purchased options |
|
|
|
|
|
|
|
||||||||||||||||||||||||||||||||||
| Equity contracts | |||||||||||||||||||||||||||||||||||||||||
| Swaps |
|
|
|
|
|
|
|
||||||||||||||||||||||||||||||||||
| Futures and forwards |
|
|
|
|
|
|
|
||||||||||||||||||||||||||||||||||
| Written options |
|
|
|
|
|
|
|
||||||||||||||||||||||||||||||||||
| Purchased options |
|
|
|
|
|
|
|
||||||||||||||||||||||||||||||||||
| Commodity contracts | |||||||||||||||||||||||||||||||||||||||||
| Swaps |
|
|
|
|
|
|
|
||||||||||||||||||||||||||||||||||
| Futures and forwards |
|
|
|
|
|
|
|
||||||||||||||||||||||||||||||||||
| Written options |
|
|
|
|
|
|
|
||||||||||||||||||||||||||||||||||
| Purchased options |
|
|
|
|
|
|
|
||||||||||||||||||||||||||||||||||
|
Credit derivatives
(2)
|
|||||||||||||||||||||||||||||||||||||||||
| Purchased credit derivatives: | |||||||||||||||||||||||||||||||||||||||||
| Credit default swaps |
|
|
|
|
|
|
|
||||||||||||||||||||||||||||||||||
| Total return swaps/options |
|
|
|
|
|
|
|
||||||||||||||||||||||||||||||||||
| Written credit derivatives: | |||||||||||||||||||||||||||||||||||||||||
| Credit default swaps |
|
|
|
|
|
|
|
||||||||||||||||||||||||||||||||||
| Total return swaps/options |
|
|
|
|
|
|
|
||||||||||||||||||||||||||||||||||
| Gross derivative assets/liabilities | $ |
|
$ |
|
$ |
|
$ |
|
$ |
|
$ |
|
|||||||||||||||||||||||||||||
| Less: Legally enforceable master netting agreements |
(
|
(
|
|||||||||||||||||||||||||||||||||||||||
| Less: Cash collateral received/paid |
(
|
(
|
|||||||||||||||||||||||||||||||||||||||
| Total derivative assets/liabilities | $ |
|
$ |
|
|||||||||||||||||||||||||||||||||||||
(1)
Represents the total contract/notional amount of derivative assets and liabilities outstanding.
(2)
The net derivative asset (liability) and notional amount of written credit derivatives for which the Corporation held purchased credit derivatives with identical underlying referenced names were $
2.8
billion and $
309.7
billion at December 31, 2019.
Offsetting of Derivatives
The Corporation enters into International Swaps and Derivatives Association, Inc. (ISDA) master netting agreements or similar agreements with substantially all of the Corporation’s derivative counterparties. For more information, see
Note 3 – Derivatives
to the Consolidated Financial Statements
of the Corporation’s 2019 Annual Report on Form 10-K
.
applicable, on which these derivatives are transacted. Balances are presented on a gross basis, prior to the application of counterparty and cash collateral netting. Total gross derivative assets and liabilities are adjusted on an aggregate basis to take into consideration the effects of legally enforceable master netting agreements which include reducing the balance for counterparty netting and cash collateral received or paid.
For more information on offsetting of securities financing agreements, see
Note 9 – Federal Funds Sold or Purchased, Securities Financing Agreements, Short-term Borrowings and Restricted Cash
.
|
61
Bank of America
|
||||||||
|
Offsetting of Derivatives
(1)
|
|||||||||||||||||||||||
|
Derivative
Assets |
Derivative Liabilities |
Derivative
Assets |
Derivative Liabilities | ||||||||||||||||||||
| (Dollars in billions) | September 30, 2020 | December 31, 2019 | |||||||||||||||||||||
| Interest rate contracts | |||||||||||||||||||||||
| Over-the-counter | $ |
|
$ |
|
$ |
|
$ |
|
|||||||||||||||
| Exchange-traded |
|
|
|
|
|||||||||||||||||||
| Over-the-counter cleared |
|
|
|
|
|||||||||||||||||||
| Foreign exchange contracts | |||||||||||||||||||||||
| Over-the-counter |
|
|
|
|
|||||||||||||||||||
| Over-the-counter cleared |
|
|
|
|
|||||||||||||||||||
| Equity contracts | |||||||||||||||||||||||
| Over-the-counter |
|
|
|
|
|||||||||||||||||||
| Exchange-traded |
|
|
|
|
|||||||||||||||||||
| Commodity contracts | |||||||||||||||||||||||
| Over-the-counter |
|
|
|
|
|||||||||||||||||||
| Exchange-traded |
|
|
|
|
|||||||||||||||||||
| Over-the-counter cleared |
|
|
|
|
|||||||||||||||||||
| Credit derivatives | |||||||||||||||||||||||
| Over-the-counter |
|
|
|
|
|||||||||||||||||||
| Over-the-counter cleared |
|
|
|
|
|||||||||||||||||||
| Total gross derivative assets/liabilities, before netting | |||||||||||||||||||||||
| Over-the-counter |
|
|
|
|
|||||||||||||||||||
| Exchange-traded |
|
|
|
|
|||||||||||||||||||
| Over-the-counter cleared |
|
|
|
|
|||||||||||||||||||
| Less: Legally enforceable master netting agreements and cash collateral received/paid | |||||||||||||||||||||||
| Over-the-counter |
(
|
(
|
(
|
(
|
|||||||||||||||||||
| Exchange-traded |
(
|
(
|
(
|
(
|
|||||||||||||||||||
| Over-the-counter cleared |
(
|
(
|
(
|
(
|
|||||||||||||||||||
| Derivative assets/liabilities, after netting |
|
|
|
|
|||||||||||||||||||
|
Other gross derivative assets/liabilities
(2)
|
|
|
|
|
|||||||||||||||||||
| Total derivative assets/liabilities |
|
|
|
|
|||||||||||||||||||
|
Less: Financial instruments collateral
(3)
|
(
|
(
|
(
|
(
|
|||||||||||||||||||
| Total net derivative assets/liabilities | $ |
|
$ |
|
$ |
|
$ |
|
|||||||||||||||
(1)
Over-the-counter derivatives include bilateral transactions between the Corporation and a particular counterparty. Over-the-counter-cleared derivatives include bilateral transactions between the Corporation and a counterparty where the transaction is cleared through a clearinghouse. Exchange-traded derivatives include listed options transacted on an exchange.
(2)
Consists of derivatives entered into under master netting agreements where the enforceability of these agreements is uncertain under bankruptcy laws in some countries or industries.
(3)
Amounts are limited to the derivative asset/liability balance and, accordingly, do not include excess collateral received/pledged. Financial instruments collateral includes securities collateral received or pledged and cash securities held and posted at third-party custodians that are not offset on the Consolidated Balance Sheet but shown as a reduction to derive net derivative assets and liabilities.
ALM and Risk Management Derivatives
The Corporation’s asset and liability management (ALM) and risk management activities include the use of derivatives to mitigate risk to the Corporation including derivatives designated in qualifying hedge accounting relationships and derivatives used in other risk management activities. For more information on ALM and risk management derivatives, see
Note 3 – Derivatives
to the Consolidated Financial Statements of the Corporation’s 2019 Annual Report on Form 10-K.
Derivatives Designated as Accounting Hedges
The Corporation uses various types of interest rate and foreign exchange derivative contracts to protect against changes in the fair value of its assets and liabilities due to fluctuations in
interest rates and exchange rates (fair value hedges). The Corporation also uses these types of contracts to protect against changes in the cash flows of its assets and liabilities, and other forecasted transactions (cash flow hedges). The Corporation hedges its net investment in consolidated non-U.S. operations determined to have functional currencies other than the U.S. dollar using forward exchange contracts and cross-currency basis swaps, and by issuing foreign currency-denominated debt (net investment hedges).
Fair Value Hedges
|
Bank of America
62
|
||||||||
| Gains and Losses on Derivatives Designated as Fair Value Hedges | |||||||||||||||||||||||
| Three Months Ended September 30, 2020 | Three Months Ended September 30, 2019 | ||||||||||||||||||||||
| (Dollars in millions) | Derivative | Hedged Item | Derivative | Hedged Item | |||||||||||||||||||
|
Interest rate risk on long-term debt
(1)
|
$ |
(
|
$ |
|
$ |
|
$ |
(
|
|||||||||||||||
|
Interest rate and foreign currency risk on long-term debt
(2)
|
|
(
|
(
|
|
|||||||||||||||||||
|
Interest rate risk on available-for-sale securities
(3)
|
|
(
|
(
|
|
|||||||||||||||||||
| Total | $ |
(
|
$ |
|
$ |
|
$ |
(
|
|||||||||||||||
| Nine Months Ended September 30, 2020 | Nine Months Ended September 30, 2019 | ||||||||||||||||||||||
| Derivative | Hedged Item | Derivative | Hedged Item | ||||||||||||||||||||
|
Interest rate risk on long-term debt
(1)
|
$ |
|
$ |
(
|
$ |
|
$ |
(
|
|||||||||||||||
|
Interest rate and foreign currency risk on long-term debt
(2)
|
|
(
|
(
|
|
|||||||||||||||||||
|
Interest rate risk on available-for-sale securities
(3)
|
(
|
|
(
|
|
|||||||||||||||||||
| Total | $ |
|
$ |
(
|
$ |
|
$ |
(
|
|||||||||||||||
(1)
Amounts are recorded in interest expense in the Consolidated Statement of Income.
(2)
For the three and nine months ended September 30, 2020, the derivative amount includes gains (losses) of $(
13
) million and $
718
million in interest expense, $
95
million and $(
83
) million in market making and similar activities, and $(
3
) million and $
9
million in accumulated OCI. For the same periods in 2019, the derivative amount includes gains (losses) of $(
59
) million and $
108
million in interest expense, $(
53
) million and $(
142
) million in market making and similar activities, and $
2
million and $
22
million in accumulated OCI. Line item totals are in the Consolidated Statement of Income and on the Consolidated Balance Sheet.
(3)
Amounts are recorded in interest income in the Consolidated Statement of Income.
The table below summarizes the carrying value of hedged assets and liabilities that are designated and qualifying in fair value hedging relationships along with the cumulative amount of fair value hedging adjustments included in the carrying value that have been recorded in the current hedging relationships. These fair value hedging adjustments are open basis adjustments that are not subject to amortization as long as the hedging relationship remains designated.
| Designated Fair Value Hedged Assets (Liabilities) | |||||||||||||||||||||||
| September 30, 2020 | December 31, 2019 | ||||||||||||||||||||||
| (Dollars in millions) | Carrying Value |
Cumulative
Fair Value Adjustments
(1)
|
Carrying Value |
Cumulative
Fair Value Adjustments
(1)
|
|||||||||||||||||||
|
Long-term debt
(2)
|
$ |
(
|
$ |
(
|
$ |
(
|
$ |
(
|
|||||||||||||||
|
Available-for-sale debt securities
(2, 3, 4)
|
|
|
|
|
|||||||||||||||||||
(1)
For assets, increase (decrease) to carrying value and for liabilities, (increase) decrease to carrying value.
(2)
At September 30, 2020, the cumulative fair value adjustments remaining on long-term debt and AFS debt securities from discontinued hedging relationships resulted in an increase in the related liability of $
1.3
billion and a decrease in the related asset of $
6
million compared to a decrease in the related liability of $
1.3
billion and an increase in the related asset of $
8
million at December 31, 2019, which are being amortized over the remaining contractual life of the de-designated hedged items.
(3)
These amounts include the amortized cost basis of the prepayable financial assets used to designate hedging relationships in which the hedged item is the last layer expected to be remaining at the end of the hedging relationship. At September 30, 2020, the amortized cost of the closed portfolios used in these hedging relationships was $
40.2
billion, of which $
8.4
billion was designated in the hedging relationship. The cumulative basis adjustments associated with these hedging relationships totaled $
33
million.
Cash Flow and Net Investment Hedges
| Gains and Losses on Derivatives Designated as Cash Flow and Net Investment Hedges | |||||||||||||||||||||||
|
Gains (Losses) Recognized in
Accumulated OCI on Derivatives |
Gains (Losses)
in Income Reclassified from Accumulated OCI |
Gains (Losses) Recognized in
Accumulated OCI on Derivatives |
Gains (Losses)
in Income Reclassified from Accumulated OCI |
||||||||||||||||||||
| (Dollars in millions, amounts pretax) | Three Months Ended September 30, 2020 | Nine Months Ended September 30, 2020 | |||||||||||||||||||||
| Cash flow hedges | |||||||||||||||||||||||
|
Interest rate risk on variable-rate assets
(1)
|
$ |
(
|
$ |
|
$ |
|
$ |
(
|
|||||||||||||||
|
Price risk on forecasted MBS purchases
(1)
|
|
|
|
|
|||||||||||||||||||
|
Price risk on certain compensation plans
(2)
|
|
|
|
|
|||||||||||||||||||
| Total | $ |
|
$ |
|
$ |
|
$ |
(
|
|||||||||||||||
| Net investment hedges | |||||||||||||||||||||||
|
Foreign exchange risk
(3)
|
$ |
(
|
$ |
|
$ |
|
$ |
|
|||||||||||||||
| Three Months Ended September 30, 2019 | Nine Months Ended September 30, 2019 | ||||||||||||||||||||||
| Cash flow hedges | |||||||||||||||||||||||
|
Interest rate risk on variable-rate assets
(1)
|
$ |
|
$ |
(
|
$ |
|
$ |
(
|
|||||||||||||||
| Net investment hedges | |||||||||||||||||||||||
|
Foreign exchange risk
(3)
|
$ |
|
$ |
|
$ |
|
$ |
|
|||||||||||||||
(1)
Amounts reclassified from accumulated OCI are recorded in interest income in the Consolidated Statement of Income.
(2)
Amounts reclassified from accumulated OCI are recorded in compensation and benefits expense in the Consolidated Statement of Income.
|
63
Bank of America
|
||||||||
Other Risk Management Derivatives
Other risk management derivatives are used by the Corporation to reduce certain risk exposures by economically hedging various assets and liabilities.
The following table presents gains (losses) on these derivatives for the three and nine months ended September 30, 2020 and 2019. These gains (losses) are largely offset by the income or expense recorded on the hedged item.
| Gains and Losses on Other Risk Management Derivatives | |||||||||||||||||||||||
| Three Months Ended September 30 | Nine Months Ended September 30 | ||||||||||||||||||||||
| (Dollars in millions) | 2020 | 2019 | 2020 | 2019 | |||||||||||||||||||
|
Interest rate risk on mortgage activities
(1, 2)
|
$ |
|
$ |
|
$ |
|
$ |
|
|||||||||||||||
|
Credit risk on loans
(2)
|
(
|
(
|
(
|
(
|
|||||||||||||||||||
|
Interest rate and foreign currency risk on ALM activities
(3)
|
(
|
|
(
|
|
|||||||||||||||||||
|
Price risk on certain compensation plans
(4)
|
|
(
|
|
|
|||||||||||||||||||
(1)
Primarily related to hedges of interest rate risk on mortgage servicing rights and interest rate lock commitments to originate mortgage loans that will be held for sale. The net gains on interest rate lock commitments which are not included in the table but are considered derivative instruments, were $
41
million and $
128
million for the three and nine months ended September 30, 2020 compared to $
20
million and $
56
million for the same periods in 2019
.
(2)
Gains (losses) on these derivatives are recorded in other income.
(3)
Gains (losses) on these derivatives are recorded in market making and similar activities.
(4)
Gains (losses) on these derivatives are recorded in compensation and benefits expense.
Transfers of Financial Assets with Risk Retained through Derivatives
The Corporation enters into certain transactions involving the transfer of financial assets that are accounted for as sales where substantially all of the economic exposure to the transferred financial assets is retained through derivatives (e.g., interest rate and/or credit), but the Corporation does not retain control over the assets transferred. At September 30, 2020 and December 31, 2019, the Corporation had transferred $
5.1
billion and $
5.2
billion of non-U.S. government-guaranteed mortgage-backed securities (MBS) to a third-party trust and retained economic exposure to the transferred assets through derivative contracts. In connection with these transfers, the Corporation received gross cash proceeds of $
5.1
billion and $
5.2
billion at the transfer dates. At September 30, 2020 and December 31, 2019, the fair value of the transferred securities was $
5.2
billion and $
5.3
billion.
Sales and Trading Revenue
The Corporation enters into trading derivatives to facilitate client transactions and to manage risk exposures arising from trading
account assets and liabilities. It is the Corporation’s policy to include these derivative instruments in its trading activities, which include derivatives and non-derivative cash instruments. The resulting risk from these derivatives is managed on a portfolio basis as part of the Corporation’s
Global Markets
business segment. For more information on sales and trading revenue, see
Note 3 – Derivatives
to the Consolidated Financial Statements of the Corporation’s 2019 Annual Report on Form 10-K.
The following table, which includes both derivatives and non-derivative cash instruments, identifies the amounts in the respective income statement line items attributable to the Corporation’s sales and trading revenue in
Global Markets
, categorized by primary risk, for the three and nine months ended September 30, 2020 and 2019.
This table includes debit valuation adjustment (DVA) and funding valuation adjustment (FVA) gains (losses).
Global Markets
results in
Note 17 – Business Segment Information
are presented on a fully taxable-equivalent (FTE) basis. The table below is not presented on an FTE basis.
| Sales and Trading Revenue | |||||||||||||||||||||||||||||||||||||||||||||||
| Market making and similar activities |
Net Interest
Income |
Other
(1)
|
Total | Market making and similar activities |
Net Interest
Income |
Other
(1)
|
Total | ||||||||||||||||||||||||||||||||||||||||
| (Dollars in millions) | Three Months Ended September 30, 2020 | Nine Months Ended September 30, 2020 | |||||||||||||||||||||||||||||||||||||||||||||
| Interest rate risk | $ |
|
$ |
|
$ |
|
$ |
|
$ |
|
$ |
|
$ |
|
$ |
|
|||||||||||||||||||||||||||||||
| Foreign exchange risk |
|
(
|
|
|
|
(
|
(
|
|
|||||||||||||||||||||||||||||||||||||||
| Equity risk |
|
(
|
|
|
|
(
|
|
|
|||||||||||||||||||||||||||||||||||||||
| Credit risk |
|
|
|
|
|
|
|
|
|||||||||||||||||||||||||||||||||||||||
| Other risk |
|
(
|
|
|
|
|
|
|
|||||||||||||||||||||||||||||||||||||||
|
Total sales and trading revenue
|
$ |
|
$ |
|
$ |
|
$ |
|
$ |
|
$ |
|
$ |
|
$ |
|
|||||||||||||||||||||||||||||||
| Three Months Ended September 30, 2019 | Nine Months Ended September 30, 2019 | ||||||||||||||||||||||||||||||||||||||||||||||
| Interest rate risk | $ |
|
$ |
|
$ |
|
$ |
|
$ |
|
$ |
|
$ |
|
$ |
|
|||||||||||||||||||||||||||||||
| Foreign exchange risk |
|
|
|
|
|
|
|
|
|||||||||||||||||||||||||||||||||||||||
| Equity risk |
|
(
|
|
|
|
(
|
|
|
|||||||||||||||||||||||||||||||||||||||
| Credit risk |
|
|
|
|
|
|
|
|
|||||||||||||||||||||||||||||||||||||||
| Other risk |
|
|
|
|
|
|
|
|
|||||||||||||||||||||||||||||||||||||||
|
Total sales and trading revenue
|
$ |
|
$ |
|
$ |
|
$ |
|
$ |
|
$ |
|
$ |
|
$ |
|
|||||||||||||||||||||||||||||||
(1)
Represents amounts in investment and brokerage services and other income that are recorded in
Global Markets
and included in the definition of sales and trading revenue. Includes investment and brokerage services revenue of $
430
million and $
1.5
billion for the three and nine months ended September 30, 2020 compared to $
410
million and $
1.3
billion for the same periods in 2019.
|
Bank of America
64
|
||||||||
Credit Derivatives
The Corporation enters into credit derivatives primarily to facilitate client transactions and to manage credit risk exposures. Credit derivatives are classified as investment and non-investment grade based on the credit quality of the underlying referenced obligation. The Corporation considers ratings of BBB- or higher as investment grade. Non-investment grade includes non-rated credit derivative instruments. The Corporation discloses internal categorizations of investment
grade and non-investment grade consistent with how risk is managed for these instruments. For more information on credit derivatives, see
Note 3 – Derivatives
to the Consolidated Financial Statements of the Corporation’s 2019 Annual Report on Form 10-K.
| Credit Derivative Instruments | |||||||||||||||||||||||||||||
|
Less than
One Year |
One to
Three Years |
Three to
Five Years |
Over Five
Years |
Total | |||||||||||||||||||||||||
| September 30, 2020 | |||||||||||||||||||||||||||||
| (Dollars in millions) | Carrying Value | ||||||||||||||||||||||||||||
| Credit default swaps: | |||||||||||||||||||||||||||||
| Investment grade | $ |
|
$ |
|
$ |
|
$ |
|
$ |
|
|||||||||||||||||||
| Non-investment grade |
|
|
|
|
|
||||||||||||||||||||||||
| Total |
|
|
|
|
|
||||||||||||||||||||||||
| Total return swaps/options: | |||||||||||||||||||||||||||||
| Investment grade |
|
|
|
|
|
||||||||||||||||||||||||
| Non-investment grade |
|
|
|
|
|
||||||||||||||||||||||||
| Total |
|
|
|
|
|
||||||||||||||||||||||||
| Total credit derivatives | $ |
|
$ |
|
$ |
|
$ |
|
$ |
|
|||||||||||||||||||
| Credit-related notes: | |||||||||||||||||||||||||||||
| Investment grade | $ |
|
$ |
|
$ |
|
$ |
|
$ |
|
|||||||||||||||||||
| Non-investment grade |
|
|
|
|
|
||||||||||||||||||||||||
| Total credit-related notes | $ |
|
$ |
|
$ |
|
$ |
|
$ |
|
|||||||||||||||||||
| Maximum Payout/Notional | |||||||||||||||||||||||||||||
| Credit default swaps: | |||||||||||||||||||||||||||||
| Investment grade | $ |
|
$ |
|
$ |
|
$ |
|
$ |
|
|||||||||||||||||||
| Non-investment grade |
|
|
|
|
|
||||||||||||||||||||||||
| Total |
|
|
|
|
|
||||||||||||||||||||||||
| Total return swaps/options: | |||||||||||||||||||||||||||||
| Investment grade |
|
|
|
|
|
||||||||||||||||||||||||
| Non-investment grade |
|
|
|
|
|
||||||||||||||||||||||||
| Total |
|
|
|
|
|
||||||||||||||||||||||||
| Total credit derivatives | $ |
|
$ |
|
$ |
|
$ |
|
$ |
|
|||||||||||||||||||
| December 31, 2019 | |||||||||||||||||||||||||||||
| Carrying Value | |||||||||||||||||||||||||||||
| Credit default swaps: | |||||||||||||||||||||||||||||
| Investment grade | $ |
|
$ |
|
$ |
|
$ |
|
$ |
|
|||||||||||||||||||
| Non-investment grade |
|
|
|
|
|
||||||||||||||||||||||||
| Total |
|
|
|
|
|
||||||||||||||||||||||||
| Total return swaps/options: | |||||||||||||||||||||||||||||
| Investment grade |
|
|
|
|
|
||||||||||||||||||||||||
| Non-investment grade |
|
|
|
|
|
||||||||||||||||||||||||
| Total |
|
|
|
|
|
||||||||||||||||||||||||
| Total credit derivatives | $ |
|
$ |
|
$ |
|
$ |
|
$ |
|
|||||||||||||||||||
| Credit-related notes: | |||||||||||||||||||||||||||||
| Investment grade | $ |
|
$ |
|
$ |
|
$ |
|
$ |
|
|||||||||||||||||||
| Non-investment grade |
|
|
|
|
|
||||||||||||||||||||||||
| Total credit-related notes | $ |
|
$ |
|
$ |
|
$ |
|
$ |
|
|||||||||||||||||||
| Maximum Payout/Notional | |||||||||||||||||||||||||||||
| Credit default swaps: | |||||||||||||||||||||||||||||
| Investment grade | $ |
|
$ |
|
$ |
|
$ |
|
$ |
|
|||||||||||||||||||
| Non-investment grade |
|
|
|
|
|
||||||||||||||||||||||||
| Total |
|
|
|
|
|
||||||||||||||||||||||||
| Total return swaps/options: | |||||||||||||||||||||||||||||
| Investment grade |
|
|
|
|
|
||||||||||||||||||||||||
| Non-investment grade |
|
|
|
|
|
||||||||||||||||||||||||
| Total |
|
|
|
|
|
||||||||||||||||||||||||
| Total credit derivatives | $ |
|
$ |
|
$ |
|
$ |
|
$ |
|
|||||||||||||||||||
The notional amount represents the maximum amount payable by the Corporation for most credit derivatives. However, the Corporation does not monitor its exposure to credit derivatives based solely on the notional amount because this measure does not take into consideration the probability of occurrence. As such, the notional amount is not a reliable indicator of the Corporation’s exposure to these contracts.
Instead, a risk framework is used to define risk tolerances and establish limits so that certain credit risk-related losses occur within acceptable, predefined limits.
Credit-related notes in the table above include investments in securities issued by collateralized debt obligation (CDO), collateralized loan obligation and credit-linked note vehicles. These instruments are primarily classified as trading securities.
|
65
Bank of America
|
||||||||
The carrying value of these instruments equals the Corporation’s maximum exposure to loss. The Corporation is not obligated to make any payments to the entities under the terms of the securities owned.
Credit-related Contingent Features and Collateral
Certain of the Corporation’s derivative contracts contain credit risk-related contingent features, primarily in the form of ISDA master netting agreements and credit support documentation that enhance the creditworthiness of these instruments compared to other obligations of the respective counterparty with whom the Corporation has transacted. These contingent features may be for the benefit of the Corporation as well as its counterparties with respect to changes in the Corporation’s creditworthiness and the mark-to-market exposure under the derivative transactions. At September 30, 2020 and December 31, 2019, the Corporation held cash and securities collateral of $
91.7
billion and $
84.3
billion and posted cash and securities collateral of $
79.9
billion and $
69.1
billion in the normal course of business under derivative agreements, excluding cross-product margining agreements where clients are permitted to margin on a net basis for both derivative and secured financing arrangements.
In connection with certain over-the-counter derivative contracts and other trading agreements, the Corporation can be required to provide additional collateral or to terminate transactions with certain counterparties in the event of a downgrade of the senior debt ratings of the Corporation or certain subsidiaries. The amount of additional collateral required depends on the contract and is usually a fixed incremental amount and/or the market value of the exposure. For more information on credit-related contingent features and collateral, see
Note 3 – Derivatives
to the Consolidated Financial Statements of the Corporation’s 2019 Annual Report on Form 10-K.
At September 30, 2020, the amount of collateral, calculated based on the terms of the contracts, that the Corporation and certain subsidiaries could be required to post to counterparties but had not yet posted to counterparties was $
1.9
billion, including $
945
million for Bank of America, National Association.
Some counterparties are currently able to unilaterally terminate certain contracts, or the Corporation or certain subsidiaries may be required to take other action such as find a suitable replacement or obtain a guarantee. At September 30, 2020 and December 31, 2019, the liability recorded for these derivative contracts was not significant.
| Additional Collateral Required to be Posted Upon Downgrade at September 30, 2020 | |||||||||||
| (Dollars in millions) |
One
incremental notch |
Second
incremental notch |
|||||||||
| Bank of America Corporation | $ |
|
$ |
|
|||||||
|
Bank of America, N.A. and subsidiaries
(1)
|
|
|
|||||||||
(1)
Included in Bank of America Corporation collateral requirements in this table.
The following table presents the derivative liabilities that would be subject to unilateral termination by counterparties and the amounts of collateral that would have been contractually required at September 30, 2020 if the long-term senior debt ratings for the Corporation or certain subsidiaries had been lower by one incremental notch and by an additional second incremental notch.
| Derivative Liabilities Subject to Unilateral Termination Upon Downgrade at September 30, 2020 | |||||||||||
| (Dollars in millions) |
One
incremental notch |
Second
incremental notch |
|||||||||
| Derivative liabilities | $ |
|
$ |
|
|||||||
| Collateral posted |
|
|
|||||||||
Valuation Adjustments on Derivatives
The table below presents credit valuation adjustment (CVA), DVA and FVA gains (losses) on derivatives (excluding the effect of any related hedge activities), which are recorded in market making and similar activities, for the three and nine months ended September 30, 2020 and 2019. For more information on the valuation adjustments on derivatives, see
Note 3 – Derivatives
to the Consolidated Financial Statements of the Corporation’s 2019 Annual Report on Form 10-K.
|
Valuation Adjustments Gains (Losses) on Derivatives
(1)
|
|||||||||||
| Three Months Ended September 30 | |||||||||||
| (Dollars in millions) | 2020 | 2019 | |||||||||
| Derivative assets (CVA) | $ |
|
$ |
(
|
|||||||
|
Derivative assets/liabilities (FVA)
|
|
(
|
|||||||||
| Derivative liabilities (DVA) |
(
|
|
|||||||||
| Nine Months Ended September 30 | |||||||||||
| (Dollars in millions) | 2020 | 2019 | |||||||||
| Derivative assets (CVA) | $ |
(
|
$ |
(
|
|||||||
|
Derivative assets/liabilities (FVA)
|
(
|
(
|
|||||||||
| Derivative liabilities (DVA) |
|
(
|
|||||||||
(1)
At September 30, 2020 and December 31, 2019, cumulative CVA reduced the derivative assets balance by $
862
million and $
528
million, cumulative FVA reduced the net derivatives balance by $
213
million and $
153
million, and cumulative DVA reduced the derivative liabilities balance by $
338
million and $
285
million, respectively.
|
Bank of America
66
|
||||||||
NOTE 4
Securities
The table below presents the amortized cost, gross unrealized gains and losses, and fair value of AFS debt securities, other debt securities carried at fair value and HTM debt securities at September 30, 2020 and December 31, 2019.
| Debt Securities | |||||||||||||||||||||||
|
Amortized
Cost |
Gross
Unrealized Gains |
Gross
Unrealized Losses |
Fair
Value |
||||||||||||||||||||
| (Dollars in millions) | September 30, 2020 | ||||||||||||||||||||||
| Available-for-sale debt securities | |||||||||||||||||||||||
| Mortgage-backed securities: | |||||||||||||||||||||||
| Agency | $ |
|
$ |
|
$ |
(
|
$ |
|
|||||||||||||||
| Agency-collateralized mortgage obligations |
|
|
(
|
|
|||||||||||||||||||
| Commercial |
|
|
(
|
|
|||||||||||||||||||
|
Non-agency residential
(1)
|
|
|
(
|
|
|||||||||||||||||||
| Total mortgage-backed securities |
|
|
(
|
|
|||||||||||||||||||
| U.S. Treasury and agency securities |
|
|
(
|
|
|||||||||||||||||||
| Non-U.S. securities |
|
|
(
|
|
|||||||||||||||||||
| Other taxable securities, substantially all asset-backed securities |
|
|
(
|
|
|||||||||||||||||||
| Total taxable securities |
|
|
(
|
|
|||||||||||||||||||
| Tax-exempt securities |
|
|
(
|
|
|||||||||||||||||||
| Total available-for-sale debt securities |
|
|
(
|
|
|||||||||||||||||||
|
Other debt securities carried at fair value
(2)
|
|
|
(
|
|
|||||||||||||||||||
| Total debt securities carried at fair value |
|
|
(
|
|
|||||||||||||||||||
| Held-to-maturity debt securities, substantially all U.S. agency mortgage-backed securities |
|
|
(
|
|
|||||||||||||||||||
|
Total debt securities
(3,4)
|
$ |
|
$ |
|
$ |
(
|
$ |
|
|||||||||||||||
| December 31, 2019 | |||||||||||||||||||||||
| Available-for-sale debt securities | |||||||||||||||||||||||
| Mortgage-backed securities: | |||||||||||||||||||||||
| Agency | $ |
|
$ |
|
$ |
(
|
$ |
|
|||||||||||||||
| Agency-collateralized mortgage obligations |
|
|
(
|
|
|||||||||||||||||||
| Commercial |
|
|
(
|
|
|||||||||||||||||||
|
Non-agency residential
(1)
|
|
|
(
|
|
|||||||||||||||||||
| Total mortgage-backed securities |
|
|
(
|
|
|||||||||||||||||||
| U.S. Treasury and agency securities |
|
|
(
|
|
|||||||||||||||||||
| Non-U.S. securities |
|
|
(
|
|
|||||||||||||||||||
| Other taxable securities, substantially all asset-backed securities |
|
|
|
|
|||||||||||||||||||
| Total taxable securities |
|
|
(
|
|
|||||||||||||||||||
| Tax-exempt securities |
|
|
(
|
|
|||||||||||||||||||
| Total available-for-sale debt securities |
|
|
(
|
|
|||||||||||||||||||
|
Other debt securities carried at fair value
(2)
|
|
|
(
|
|
|||||||||||||||||||
| Total debt securities carried at fair value |
|
|
(
|
|
|||||||||||||||||||
| Held-to-maturity debt securities, substantially all U.S. agency mortgage-backed securities |
|
|
(
|
|
|||||||||||||||||||
|
Total debt securities
(3, 4)
|
$ |
|
$ |
|
$ |
(
|
$ |
|
|||||||||||||||
(1)
At September 30, 2020 and December 31, 2019, the underlying collateral type included approximately
35
percent and
49
percent prime,
four
percent and
six
percent Alt-A and
61
percent and
45
percent subprime.
(2)
Primarily includes non-U.S. securities used to satisfy certain international regulatory requirements. Any changes in value are reported in market making and similar activities. For detail on the components, see
Note 14 – Fair Value Measurements
.
(3)
Includes securities pledged as collateral of $
55.7
billion and $
67.0
billion at September 30, 2020 and December 31, 2019.
(4)
The Corporation held debt securities from Fannie Mae and Freddie Mac that each exceeded 10 percent of shareholders’ equity, with an amortized cost of $
193.8
billion and $
76.9
billion, and a fair value of $
201.0
billion and $
79.3
billion at September 30, 2020, and an amortized cost of $
157.2
billion and $
54.1
billion, and a fair value of $
160.6
billion and $
55.1
billion at December 31, 2019.
At September 30, 2020, the accumulated net unrealized gain on AFS debt securities, excluding the amount related to debt securities previously transferred to held to maturity, included in accumulated OCI was $
4.8
billion, net of the related income tax expense of $
1.6
billion. The Corporation had nonperforming AFS debt securities of $
25
million and $
9
million at September 30, 2020 and December 31, 2019.
Effective January 1, 2020, the Corporation adopted the new accounting standard for credit losses that requires evaluation of AFS and HTM debt securities for any expected losses with recognition of an allowance for credit losses, when applicable. For more information, see
Note 1 – Summary of Significant Accounting Principles
. At September 30, 2020, the Corporation had $
194.8
billion in AFS debt securities, which were primarily
U.S. agency and U.S. Treasury securities that have a zero credit loss assumption. For the remaining $
38.9
billion in AFS debt securities, the amount of ECL was insignificant. Substantially all of the Corporation's HTM debt securities are U.S. agency and U.S. Treasury securities and have a zero credit loss assumption.
At September 30, 2020, the Corporation held equity securities at an aggregate fair value of $
809
million and other equity securities, as valued under the measurement alternative, at a carrying value of $
261
million, both of which are included in other assets. At September 30, 2020, the Corporation also held money market investments at a fair value of $
385
million, which are included in time deposits placed and other short-term investments.
|
67
Bank of America
|
||||||||
In the three and nine months ended September 30, 2020, the Corporation recorded gross realized gains on sales of AFS debt securities of $
4
million and $
383
million and gross realized losses of $
2
million and $
4
million, resulting in net gains of $
2
million and $
379
million, with $
1
million and $
95
million of income taxes attributable to the realized net gain on sales of these AFS debt securities. Sales of AFS debt securities during the three months ended September 30, 2019 were not significant. In the nine months ended September 30, 2019, the Corporation recorded gross realized gains on sales of AFS debt
securities of $
228
million and gross realized losses of $
112
million, resulting in net gains of $
116
million with $
28
million of income taxes attributable to the realized net gains on sales of these AFS debt securities.
| Total AFS Debt Securities in a Continuous Unrealized Loss Position | |||||||||||||||||||||||||||||||||||
| Less than Twelve Months | Twelve Months or Longer | Total | |||||||||||||||||||||||||||||||||
|
Fair
Value |
Gross Unrealized Losses |
Fair
Value |
Gross Unrealized Losses |
Fair
Value |
Gross Unrealized Losses | ||||||||||||||||||||||||||||||
| (Dollars in millions) | September 30, 2020 | ||||||||||||||||||||||||||||||||||
| Continuously unrealized loss-positioned AFS debt securities | |||||||||||||||||||||||||||||||||||
| Mortgage-backed securities: | |||||||||||||||||||||||||||||||||||
| Agency | $ |
|
$ |
(
|
$ |
|
$ |
|
$ |
|
$ |
(
|
|||||||||||||||||||||||
| Agency-collateralized mortgage obligations |
|
(
|
|
(
|
|
(
|
|||||||||||||||||||||||||||||
| Commercial |
|
(
|
|
|
|
(
|
|||||||||||||||||||||||||||||
| Non-agency residential |
|
(
|
|
(
|
|
(
|
|||||||||||||||||||||||||||||
| Total mortgage-backed securities |
|
(
|
|
(
|
|
(
|
|||||||||||||||||||||||||||||
| U.S. Treasury and agency securities |
|
(
|
|
(
|
|
(
|
|||||||||||||||||||||||||||||
| Non-U.S. securities |
|
(
|
|
(
|
|
(
|
|||||||||||||||||||||||||||||
| Other taxable securities, substantially all asset-backed securities |
|
(
|
|
(
|
|
(
|
|||||||||||||||||||||||||||||
| Total taxable securities |
|
(
|
|
(
|
|
(
|
|||||||||||||||||||||||||||||
| Tax-exempt securities |
|
(
|
|
(
|
|
(
|
|||||||||||||||||||||||||||||
|
Total AFS debt securities in a continuous
unrealized loss position |
$ |
|
$ |
(
|
$ |
|
$ |
(
|
$ |
|
$ |
(
|
|||||||||||||||||||||||
| December 31, 2019 | |||||||||||||||||||||||||||||||||||
| Continuously unrealized loss-positioned AFS debt securities | |||||||||||||||||||||||||||||||||||
| Mortgage-backed securities: | |||||||||||||||||||||||||||||||||||
| Agency | $ |
|
$ |
(
|
$ |
|
$ |
(
|
$ |
|
$ |
(
|
|||||||||||||||||||||||
| Agency-collateralized mortgage obligations |
|
(
|
|
(
|
|
(
|
|||||||||||||||||||||||||||||
| Commercial |
|
(
|
|
(
|
|
(
|
|||||||||||||||||||||||||||||
| Non-agency residential |
|
(
|
|
(
|
|
(
|
|||||||||||||||||||||||||||||
| Total mortgage-backed securities |
|
(
|
|
(
|
|
(
|
|||||||||||||||||||||||||||||
| U.S. Treasury and agency securities |
|
(
|
|
(
|
|
(
|
|||||||||||||||||||||||||||||
| Non-U.S. securities |
|
|
|
(
|
|
(
|
|||||||||||||||||||||||||||||
| Other taxable securities, substantially all asset-backed securities |
|
|
|
|
|
|
|||||||||||||||||||||||||||||
| Total taxable securities |
|
(
|
|
(
|
|
(
|
|||||||||||||||||||||||||||||
| Tax-exempt securities |
|
(
|
|
(
|
|
(
|
|||||||||||||||||||||||||||||
|
Total AFS debt securities in a continuous
unrealized loss position |
$ |
|
$ |
(
|
$ |
|
$ |
(
|
$ |
|
$ |
(
|
|||||||||||||||||||||||
|
Bank of America
68
|
||||||||
The remaining contractual maturity distribution and yields of the Corporation’s debt securities carried at fair value and HTM debt securities at September 30, 2020 are summarized in the table below. Actual duration and yields may differ as prepayments on the loans underlying the mortgages or other asset-backed securities (ABS) are passed through to the Corporation.
| Maturities of Debt Securities Carried at Fair Value and Held-to-maturity Debt Securities | |||||||||||||||||||||||||||||||||||||||||||||||||||||||||||
|
Due in One
Year or Less |
Due after One Year
through Five Years |
Due after Five Years
through Ten Years |
Due after
Ten Years |
Total | |||||||||||||||||||||||||||||||||||||||||||||||||||||||
| (Dollars in millions) | Amount |
Yield
(1)
|
Amount |
Yield
(1)
|
Amount |
Yield
(1)
|
Amount |
Yield
(1)
|
Amount |
Yield
(1)
|
|||||||||||||||||||||||||||||||||||||||||||||||||
| Amortized cost of debt securities carried at fair value | |||||||||||||||||||||||||||||||||||||||||||||||||||||||||||
| Mortgage-backed securities: | |||||||||||||||||||||||||||||||||||||||||||||||||||||||||||
| Agency | $ |
|
|
% | $ |
|
|
% | $ |
|
|
% | $ |
|
|
% | $ |
|
|
% | |||||||||||||||||||||||||||||||||||||||
| Agency-collateralized mortgage obligations |
|
|
|
|
|
|
|
|
|
|
|||||||||||||||||||||||||||||||||||||||||||||||||
| Commercial |
|
|
|
|
|
|
|
|
|
|
|||||||||||||||||||||||||||||||||||||||||||||||||
| Non-agency residential |
|
|
|
|
|
|
|
|
|
|
|||||||||||||||||||||||||||||||||||||||||||||||||
| Total mortgage-backed securities |
|
|
|
|
|
|
|
|
|
|
|||||||||||||||||||||||||||||||||||||||||||||||||
| U.S. Treasury and agency securities |
|
|
|
|
|
|
|
|
|
|
|||||||||||||||||||||||||||||||||||||||||||||||||
| Non-U.S. securities |
|
|
|
|
|
|
|
|
|
|
|||||||||||||||||||||||||||||||||||||||||||||||||
|
Other taxable securities, substantially all asset-backed securities
|
|
|
|
|
|
|
|
|
|
|
|||||||||||||||||||||||||||||||||||||||||||||||||
| Total taxable securities |
|
|
|
|
|
|
|
|
|
|
|||||||||||||||||||||||||||||||||||||||||||||||||
| Tax-exempt securities |
|
|
|
|
|
|
|
|
|
|
|||||||||||||||||||||||||||||||||||||||||||||||||
|
Total amortized cost of debt securities carried at fair value
|
$ |
|
|
$ |
|
|
$ |
|
|
$ |
|
|
$ |
|
|
||||||||||||||||||||||||||||||||||||||||||||
|
Amortized cost of HTM debt securities
(2)
|
$ |
|
|
$ |
|
|
$ |
|
|
$ |
|
|
$ |
|
|
||||||||||||||||||||||||||||||||||||||||||||
| Debt securities carried at fair value | |||||||||||||||||||||||||||||||||||||||||||||||||||||||||||
| Mortgage-backed securities: | |||||||||||||||||||||||||||||||||||||||||||||||||||||||||||
| Agency | $ |
|
$ |
|
$ |
|
$ |
|
$ |
|
|||||||||||||||||||||||||||||||||||||||||||||||||
| Agency-collateralized mortgage obligations |
|
|
|
|
|
||||||||||||||||||||||||||||||||||||||||||||||||||||||
| Commercial |
|
|
|
|
|
||||||||||||||||||||||||||||||||||||||||||||||||||||||
| Non-agency residential |
|
|
|
|
|
||||||||||||||||||||||||||||||||||||||||||||||||||||||
| Total mortgage-backed securities |
|
|
|
|
|
||||||||||||||||||||||||||||||||||||||||||||||||||||||
| U.S. Treasury and agency securities |
|
|
|
|
|
||||||||||||||||||||||||||||||||||||||||||||||||||||||
| Non-U.S. securities |
|
|
|
|
|
||||||||||||||||||||||||||||||||||||||||||||||||||||||
|
Other taxable securities, substantially all asset-backed securities
|
|
|
|
|
|
||||||||||||||||||||||||||||||||||||||||||||||||||||||
| Total taxable securities |
|
|
|
|
|
||||||||||||||||||||||||||||||||||||||||||||||||||||||
| Tax-exempt securities |
|
|
|
|
|
||||||||||||||||||||||||||||||||||||||||||||||||||||||
| Total debt securities carried at fair value | $ |
|
$ |
|
$ |
|
$ |
|
$ |
|
|||||||||||||||||||||||||||||||||||||||||||||||||
|
Fair value of HTM debt securities
(2)
|
$ |
|
$ |
|
$ |
|
$ |
|
$ |
|
|||||||||||||||||||||||||||||||||||||||||||||||||
(1)
The weighted-average yield is computed based on a constant effective interest rate over the contractual life of each security. The average yield considers the contractual coupon and the amortization of premiums and accretion of discounts, excluding the effect of related hedging derivatives.
(2)
Substantially all U.S. agency MBS.
|
69
Bank of America
|
||||||||
NOTE 5
Outstanding Loans and Leases and Allowance for Credit Losses
The following tables present total outstanding loans and leases and an aging analysis for the Consumer Real Estate, Credit Card and Other Consumer, and Commercial portfolio segments, by class of financing receivables, at September 30, 2020 and December 31, 2019.
|
30-59 Days Past Due
(1)
|
60-89 Days Past Due
(1)
|
90 Days or
More
Past Due
(1)
|
Total Past
Due 30 Days or More |
Total Current or Less Than 30 Days Past Due
(1)
|
Loans Accounted for Under the Fair Value Option |
Total
Outstandings |
|||||||||||||||||||||||||||||||||||
| (Dollars in millions) | September 30, 2020 | ||||||||||||||||||||||||||||||||||||||||
| Consumer real estate | |||||||||||||||||||||||||||||||||||||||||
| Core portfolio | |||||||||||||||||||||||||||||||||||||||||
|
Residential mortgage
|
$ |
|
$ |
|
$ |
|
$ |
|
$ |
|
$ |
|
|||||||||||||||||||||||||||||
| Home equity |
|
|
|
|
|
|
|||||||||||||||||||||||||||||||||||
|
Non-core portfolio
|
|||||||||||||||||||||||||||||||||||||||||
| Residential mortgage |
|
|
|
|
|
|
|||||||||||||||||||||||||||||||||||
| Home equity |
|
|
|
|
|
|
|||||||||||||||||||||||||||||||||||
| Credit card and other consumer | |||||||||||||||||||||||||||||||||||||||||
| Credit card |
|
|
|
|
|
|
|||||||||||||||||||||||||||||||||||
|
Direct/Indirect consumer
(2)
|
|
|
|
|
|
|
|||||||||||||||||||||||||||||||||||
| Other consumer |
|
|
|
|
|
|
|||||||||||||||||||||||||||||||||||
| Total consumer |
|
|
|
|
|
|
|||||||||||||||||||||||||||||||||||
|
Consumer loans accounted for under the fair value option
(3)
|
$ |
|
|
||||||||||||||||||||||||||||||||||||||
| Total consumer loans and leases |
|
|
|
|
|
|
|
||||||||||||||||||||||||||||||||||
| Commercial | |||||||||||||||||||||||||||||||||||||||||
| U.S. commercial |
|
|
|
|
|
|
|||||||||||||||||||||||||||||||||||
| Non-U.S. commercial |
|
|
|
|
|
|
|||||||||||||||||||||||||||||||||||
|
Commercial real estate
(4)
|
|
|
|
|
|
|
|||||||||||||||||||||||||||||||||||
| Commercial lease financing |
|
|
|
|
|
|
|||||||||||||||||||||||||||||||||||
|
U.S. small business commercial
(5)
|
|
|
|
|
|
|
|||||||||||||||||||||||||||||||||||
| Total commercial |
|
|
|
|
|
|
|||||||||||||||||||||||||||||||||||
|
Commercial loans accounted for under the fair value option
(3)
|
|
|
|||||||||||||||||||||||||||||||||||||||
| Total commercial loans and leases |
|
|
|
|
|
|
|
||||||||||||||||||||||||||||||||||
|
Total loans and leases
(6)
|
$ |
|
$ |
|
$ |
|
$ |
|
$ |
|
$ |
|
$ |
|
|||||||||||||||||||||||||||
| Percentage of outstandings |
|
% |
|
% |
|
% |
|
% |
|
% |
|
% |
|
% | |||||||||||||||||||||||||||
(1)
Consumer real estate loans 30-59 days past due includes fully-insured loans of $
258
million and nonperforming loans of $
132
million. Consumer real estate loans 60-89 days past due includes fully-insured loans of $
118
million and nonperforming loans of $
96
million. Consumer real estate loans 90 days or more past due includes fully-insured loans of $
1.0
billion. Consumer real estate loans current or less than 30 days past due includes $
793
million and direct/indirect consumer includes $
38
million of nonperforming loans. For information on the Corporation's interest accrual policies and delinquency status for loan modifications related to the COVID-19 pandemic, see
Note 1 – Summary of Significant Accounting Principles
.
(2)
Total outstandings primarily includes auto and specialty lending loans and leases of $
47.1
billion, U.S. securities-based lending loans of $
39.0
billion and non-U.S. consumer loans of $
2.9
billion.
(3)
Consumer loans accounted for under the fair value option includes residential mortgage loans of $
314
million and home equity loans of $
343
million. Commercial loans accounted for under the fair value option includes U.S. commercial loans of $
3.4
billion and non-U.S. commercial loans of $
3.2
billion. For more information, see
Note 14 – Fair Value Measurements
and
Note 15 – Fair Value Option
.
(4)
Total outstandings includes U.S. commercial real estate loans of $
58.7
billion and non-U.S. commercial real estate loans of $
3.7
billion.
(5)
Includes PPP loans.
(6)
Total outstandings includes loans and leases pledged as collateral of $
15.9
billion. The Corporation also pledged $
158.4
billion of loans with no related outstanding borrowings to secure potential borrowing capacity with the Federal Reserve Bank and Federal Home Loan Bank.
|
Bank of America
70
|
||||||||
|
30-59 Days
Past Due (1) |
60-89 Days Past Due
(1)
|
90 Days or
More Past Due (1) |
Total Past
Due 30 Days or More |
Total
Current or
Less Than
30 Days
Past Due
(1)
|
Loans
Accounted for Under the Fair Value Option |
Total Outstandings | |||||||||||||||||||||||||||||||||||
| (Dollars in millions) | December 31, 2019 | ||||||||||||||||||||||||||||||||||||||||
| Consumer real estate | |||||||||||||||||||||||||||||||||||||||||
| Core portfolio | |||||||||||||||||||||||||||||||||||||||||
| Residential mortgage | $ |
|
$ |
|
$ |
|
$ |
|
$ |
|
$ |
|
|||||||||||||||||||||||||||||
| Home equity |
|
|
|
|
|
|
|||||||||||||||||||||||||||||||||||
| Non-core portfolio | |||||||||||||||||||||||||||||||||||||||||
| Residential mortgage |
|
|
|
|
|
|
|||||||||||||||||||||||||||||||||||
| Home equity |
|
|
|
|
|
|
|||||||||||||||||||||||||||||||||||
| Credit card and other consumer | |||||||||||||||||||||||||||||||||||||||||
| Credit card |
|
|
|
|
|
|
|||||||||||||||||||||||||||||||||||
|
Direct/Indirect consumer
(2)
|
|
|
|
|
|
|
|||||||||||||||||||||||||||||||||||
| Other consumer |
|
|
|
|
|
|
|||||||||||||||||||||||||||||||||||
| Total consumer |
|
|
|
|
|
|
|||||||||||||||||||||||||||||||||||
|
Consumer loans accounted for under the fair value option
(3)
|
$ |
|
|
||||||||||||||||||||||||||||||||||||||
| Total consumer loans and leases |
|
|
|
|
|
|
|
||||||||||||||||||||||||||||||||||
| Commercial | |||||||||||||||||||||||||||||||||||||||||
| U.S. commercial |
|
|
|
|
|
|
|||||||||||||||||||||||||||||||||||
| Non-U.S. commercial |
|
|
|
|
|
|
|||||||||||||||||||||||||||||||||||
|
Commercial real estate
(4)
|
|
|
|
|
|
|
|||||||||||||||||||||||||||||||||||
| Commercial lease financing |
|
|
|
|
|
|
|||||||||||||||||||||||||||||||||||
| U.S. small business commercial |
|
|
|
|
|
|
|||||||||||||||||||||||||||||||||||
| Total commercial |
|
|
|
|
|
|
|||||||||||||||||||||||||||||||||||
|
Commercial loans accounted for under the fair value option
(3)
|
|
|
|||||||||||||||||||||||||||||||||||||||
|
Total commercial loans and leases
|
|
|
|
|
|
|
|
||||||||||||||||||||||||||||||||||
|
Total loans and leases
(5)
|
$ |
|
$ |
|
$ |
|
$ |
|
$ |
|
$ |
|
$ |
|
|||||||||||||||||||||||||||
| Percentage of outstandings |
|
% |
|
% |
|
% |
|
% |
|
% |
|
% |
|
% | |||||||||||||||||||||||||||
(1)
Consumer real estate loans 30-59 days past due includes fully-insured loans of $
517
million and nonperforming loans of $
139
million. Consumer real estate loans 60-89 days past due includes fully-insured loans of $
206
million and nonperforming loans of $
114
million. Consumer real estate loans 90 days or more past due includes fully-insured loans of $
1.1
billion. Consumer real estate loans current or less than 30 days past due includes $
856
million and direct/indirect consumer includes $
45
million of nonperforming loans.
(2)
Total outstandings primarily includes auto and specialty lending loans and leases of $
50.4
billion, U.S. securities-based lending loans of $
36.7
billion and non-U.S. consumer loans of $
2.8
billion.
(3)
Consumer loans accounted for under the fair value option includes residential mortgage loans of $
257
million and home equity loans of $
337
million. Commercial loans accounted for under the fair value option includes U.S. commercial loans of $
4.7
billion and non-U.S. commercial loans of $
3.1
billion. For more information, see
Note 14 – Fair Value Measurements
and
Note 15 – Fair Value Option
.
(4)
Total outstandings includes U.S. commercial real estate loans of $
59.0
billion and non-U.S. commercial real estate loans of $
3.7
billion.
(5)
Total outstandings includes loans and leases pledged as collateral of $
25.9
billion. The Corporation also pledged $
168.2
billion of loans with no related outstanding borrowings to secure potential borrowing capacity with the Federal Reserve Bank and Federal Home Loan Bank.
The Corporation categorizes consumer real estate loans as core and non-core based on loan and customer characteristics such as origination date, product type, LTV, Fair Isaac Corporation (FICO) score and delinquency status consistent with its current consumer and mortgage servicing strategy. Generally, loans that were originated after January 1, 2010, qualified under government-sponsored enterprise (GSE) underwriting guidelines, or otherwise met the Corporation’s underwriting guidelines in place in 2015 are characterized as core loans. All other loans are generally characterized as non-core loans and represent runoff portfolios.
The Corporation has entered into long-term credit protection agreements with Fannie Mae and Freddie Mac on loans totaling $
8.8
billion and $
7.5
billion at September 30, 2020 and December 31, 2019, providing full credit protection on residential mortgage loans that become severely delinquent. All of these loans are individually insured, and therefore the Corporation does not record an allowance for credit losses related to these loans.
Nonperforming Loans and Leases
Commercial nonperforming loans increased to $
2.2
billion at September 30, 2020 from $
1.5
billion at December 31, 2019 with broad-based increases across multiple industries. Consumer nonperforming loans increased to $
2.4
billion at September 30, 2020 from $
2.1
billion at December 31, 2019 driven by loans with deferrals that expired and have subsequently become nonperforming, as well as the inclusion of $
137
million of certain loans that were previously classified as purchased credit-impaired loans and accounted for under a pool basis.
|
71
Bank of America
|
||||||||
| Credit Quality | |||||||||||||||||||||||
|
Nonperforming Loans
and Leases |
Accruing Past Due
90 Days or More
(1)
|
||||||||||||||||||||||
| (Dollars in millions) |
September 30
2020 |
December 31
2019 |
September 30
2020 |
December 31
2019 |
|||||||||||||||||||
|
Residential mortgage
(2)
|
$ |
|
$ |
|
$ |
|
$ |
|
|||||||||||||||
|
With negative allowance
(3)
|
|
|
|||||||||||||||||||||
|
Home equity
(2)
|
|
|
|
|
|||||||||||||||||||
|
With negative allowance
(3)
|
|
|
|||||||||||||||||||||
| Credit Card | n/a | n/a |
|
|
|||||||||||||||||||
| Direct/indirect consumer |
|
|
|
|
|||||||||||||||||||
| Total consumer |
|
|
|
|
|||||||||||||||||||
| U.S. commercial |
|
|
|
|
|||||||||||||||||||
| Non-U.S. commercial |
|
|
|
|
|||||||||||||||||||
| Commercial real estate |
|
|
|
|
|||||||||||||||||||
| Commercial lease financing |
|
|
|
|
|||||||||||||||||||
| U.S. small business commercial |
|
|
|
|
|||||||||||||||||||
| Total commercial |
|
|
|
|
|||||||||||||||||||
| Total nonperforming loans | $ |
|
$ |
|
$ |
|
$ |
|
|||||||||||||||
|
Percentage of outstanding loans and leases
|
|
% |
|
% |
|
% |
|
% | |||||||||||||||
(1)
For information on the Corporation's interest accrual policies and delinquency status for loan modifications related to the COVID-19 pandemic, see
Note 1 – Summary of Significant Accounting Principles
.
(2)
Residential mortgage loans accruing past due 90 days or more are fully-insured loans. At September 30, 2020 and December 31, 2019 residential mortgage includes $
561
million and $
740
million of loans on which interest had been curtailed by the FHA, and therefore were no longer accruing interest, although principal was still insured, and $
276
million and $
348
million of loans on which interest was still accruing.
(3)
At September 30, 2020, Residential Mortgage and Home Equity include negative allowance on nonperforming loans of $
170
million and $
106
million.
n/a = not applicable
Credit Quality Indicators
The Corporation monitors credit quality within its Consumer Real Estate, Credit Card and Other Consumer, and Commercial portfolio segments based on primary credit quality indicators. For more information on the portfolio segments, see
Note 1 – Summary of Significant Accounting Principles
. Within the Consumer Real Estate portfolio segment, the primary credit quality indicators are refreshed LTV and refreshed FICO score. Refreshed LTV measures the carrying value of the loan as a percentage of the value of the property securing the loan, refreshed quarterly. Home equity loans are evaluated using CLTV, which measures the carrying value of the Corporation’s loan and available line of credit combined with any outstanding senior liens against the property as a percentage of the value of the property securing the loan, refreshed quarterly. FICO score measures the creditworthiness of the borrower based on the financial obligations of the borrower and the borrower’s credit history. FICO scores are typically refreshed quarterly or more
frequently. Certain borrowers (e.g., borrowers that have had debts discharged in a bankruptcy proceeding) may not have their FICO scores updated. FICO scores are also a primary credit quality indicator for the Credit Card and Other Consumer portfolio segment and the business card portfolio within U.S. small business commercial. Within the Commercial portfolio segment, loans are evaluated using the internal classifications of pass rated or reservable criticized as the primary credit quality indicators. The term reservable criticized refers to those commercial loans that are internally classified or listed by the Corporation as Special Mention, Substandard or Doubtful, which are asset quality categories defined by regulatory authorities. These assets have an elevated level of risk and may have a high probability of default or total loss. Pass rated refers to all loans not considered reservable criticized. In addition to these primary credit quality indicators, the Corporation uses other credit quality indicators for certain types of loans.
|
Bank of America
72
|
||||||||
|
Residential Mortgage – Credit Quality Indicators By Vintage
|
|||||||||||||||||||||||||||||||||||||||||
| (Dollars in millions) | Total as of September 30, 2020 | 2020 | 2019 | 2018 | 2017 | 2016 | Prior | ||||||||||||||||||||||||||||||||||
| Total Residential Mortgage | |||||||||||||||||||||||||||||||||||||||||
|
Refreshed LTV
|
|||||||||||||||||||||||||||||||||||||||||
| Less than or equal to 90 percent | $ |
|
$ |
|
$ |
|
$ |
|
$ |
|
$ |
|
$ |
|
|||||||||||||||||||||||||||
|
Greater than 90 percent but less than or equal to 100 percent
|
|
|
|
|
|
|
|
||||||||||||||||||||||||||||||||||
|
Greater than 100 percent
|
|
|
|
|
|
|
|
||||||||||||||||||||||||||||||||||
|
Fully-insured loans
|
|
|
|
|
|
|
|
||||||||||||||||||||||||||||||||||
| Total Residential Mortgage | $ |
|
$ |
|
$ |
|
$ |
|
$ |
|
$ |
|
$ |
|
|||||||||||||||||||||||||||
| Total Residential Mortgage | |||||||||||||||||||||||||||||||||||||||||
| Refreshed FICO score | |||||||||||||||||||||||||||||||||||||||||
| Less than 620 | $ |
|
$ |
|
$ |
|
$ |
|
$ |
|
$ |
|
$ |
|
|||||||||||||||||||||||||||
|
Greater than or equal to 620 and less than 680
|
|
|
|
|
|
|
|
||||||||||||||||||||||||||||||||||
|
Greater than or equal to 680 and less than 740
|
|
|
|
|
|
|
|
||||||||||||||||||||||||||||||||||
|
Greater than or equal to 740
|
|
|
|
|
|
|
|
||||||||||||||||||||||||||||||||||
|
Fully-insured loans
|
|
|
|
|
|
|
|
||||||||||||||||||||||||||||||||||
| Total Residential Mortgage | $ |
|
$ |
|
$ |
|
$ |
|
$ |
|
$ |
|
$ |
|
|||||||||||||||||||||||||||
| Home Equity - Credit Quality Indicators | |||||||||||||||||||||||
| Total |
Home Equity Loans and Reverse Mortgages
(1)
|
Revolving Loans | Revolving Loans Converted to Term Loans | ||||||||||||||||||||
| (Dollars in millions) | September 30, 2020 | ||||||||||||||||||||||
| Total Home Equity | |||||||||||||||||||||||
|
Refreshed LTV
|
|||||||||||||||||||||||
| Less than or equal to 90 percent | $ |
|
$ |
|
$ |
|
$ |
|
|||||||||||||||
|
Greater than 90 percent but less than or equal to 100 percent
|
|
|
|
|
|||||||||||||||||||
|
Greater than 100 percent
|
|
|
|
|
|||||||||||||||||||
| Total Home Equity | $ |
|
$ |
|
$ |
|
$ |
|
|||||||||||||||
| Total Home Equity | |||||||||||||||||||||||
| Refreshed FICO score | |||||||||||||||||||||||
| Less than 620 | $ |
|
$ |
|
$ |
|
$ |
|
|||||||||||||||
|
Greater than or equal to 620 and less than 680
|
|
|
|
|
|||||||||||||||||||
|
Greater than or equal to 680 and less than 740
|
|
|
|
|
|||||||||||||||||||
|
Greater than or equal to 740
|
|
|
|
|
|||||||||||||||||||
| Total Home Equity | $ |
|
$ |
|
$ |
|
$ |
|
|||||||||||||||
(1)
Includes reverse mortgages of $
1.3
billion and home equity loans of $
974
million which are no longer originated.
| Credit Card and Direct/Indirect Consumer – Credit Quality Indicators By Vintage | |||||||||||||||||||||||||||||||||||||||||||||||||||||||||||||||||
| Direct/Indirect | |||||||||||||||||||||||||||||||||||||||||||||||||||||||||||||||||
| Term Loans by Origination Year | Credit Card | ||||||||||||||||||||||||||||||||||||||||||||||||||||||||||||||||
| (Dollars in millions) | Total Direct/Indirect as of September 30, 2020 | Revolving Loans | 2020 | 2019 | 2018 | 2017 | 2016 | Prior | Total Credit Card as of September 30, 2020 | Revolving Loans |
Revolving Loans Converted to Term Loans
(3)
|
||||||||||||||||||||||||||||||||||||||||||||||||||||||
| Refreshed FICO score | |||||||||||||||||||||||||||||||||||||||||||||||||||||||||||||||||
| Less than 620 | $ |
|
$ |
|
$ |
|
$ |
|
$ |
|
$ |
|
$ |
|
$ |
|
$ |
|
$ |
|
$ |
|
|||||||||||||||||||||||||||||||||||||||||||
|
Greater than or equal to 620 and less than 680
|
|
|
|
|
|
|
|
|
|
|
|
||||||||||||||||||||||||||||||||||||||||||||||||||||||
|
Greater than or equal to 680 and less than 740
|
|
|
|
|
|
|
|
|
|
|
|
||||||||||||||||||||||||||||||||||||||||||||||||||||||
| Greater than or equal to 740 |
|
|
|
|
|
|
|
|
|
|
|
||||||||||||||||||||||||||||||||||||||||||||||||||||||
|
Other internal credit
metrics
(1, 2)
|
|
|
|
|
|
|
|
|
|
|
|
||||||||||||||||||||||||||||||||||||||||||||||||||||||
|
Total credit card and other
consumer |
$ |
|
$ |
|
$ |
|
$ |
|
$ |
|
$ |
|
$ |
|
$ |
|
$ |
|
$ |
|
$ |
|
|||||||||||||||||||||||||||||||||||||||||||
(1)
Other internal credit metrics may include delinquency status, geography or other factors.
(2)
Direct/indirect consumer includes $
41.9
billion of securities-based lending which is typically supported by highly liquid collateral with market value greater than or equal to the outstanding loan balance and therefore has minimal credit risk at September 30, 2020.
(3)
Represents troubled debt restructurings that were modified into term loans.
|
73
Bank of America
|
||||||||
|
Commercial – Credit Quality Indicators By Vintage
(1, 2)
|
|||||||||||||||||||||||||||||||||||||||||||||||
| Term Loans | |||||||||||||||||||||||||||||||||||||||||||||||
| Amortized Cost Basis by Origination Year | |||||||||||||||||||||||||||||||||||||||||||||||
| (Dollars in millions) | Total as of September 30, 2020 | 2020 | 2019 | 2018 | 2017 | 2016 | Prior | Revolving Loans | |||||||||||||||||||||||||||||||||||||||
| U.S. Commercial | |||||||||||||||||||||||||||||||||||||||||||||||
| Risk ratings | |||||||||||||||||||||||||||||||||||||||||||||||
| Pass rated | $ |
|
$ |
|
$ |
|
$ |
|
$ |
|
$ |
|
$ |
|
$ |
|
|||||||||||||||||||||||||||||||
| Reservable criticized |
|
|
|
|
|
|
|
|
|||||||||||||||||||||||||||||||||||||||
|
Total U.S. Commercial
|
$ |
|
$ |
|
$ |
|
$ |
|
$ |
|
$ |
|
$ |
|
$ |
|
|||||||||||||||||||||||||||||||
| Non-U.S. Commercial | |||||||||||||||||||||||||||||||||||||||||||||||
| Risk ratings | |||||||||||||||||||||||||||||||||||||||||||||||
| Pass rated | $ |
|
$ |
|
$ |
|
$ |
|
$ |
|
$ |
|
$ |
|
$ |
|
|||||||||||||||||||||||||||||||
| Reservable criticized |
|
|
|
|
|
|
|
|
|||||||||||||||||||||||||||||||||||||||
|
Total Non-U.S. Commercial
|
$ |
|
$ |
|
$ |
|
$ |
|
$ |
|
$ |
|
$ |
|
$ |
|
|||||||||||||||||||||||||||||||
| Commercial Real Estate | |||||||||||||||||||||||||||||||||||||||||||||||
| Risk ratings | |||||||||||||||||||||||||||||||||||||||||||||||
| Pass rated | $ |
|
$ |
|
$ |
|
$ |
|
$ |
|
$ |
|
$ |
|
$ |
|
|||||||||||||||||||||||||||||||
| Reservable criticized |
|
|
|
|
|
|
|
|
|||||||||||||||||||||||||||||||||||||||
|
Total Commercial Real Estate
|
$ |
|
$ |
|
$ |
|
$ |
|
$ |
|
$ |
|
$ |
|
$ |
|
|||||||||||||||||||||||||||||||
| Commercial Lease Financing | |||||||||||||||||||||||||||||||||||||||||||||||
| Risk ratings | |||||||||||||||||||||||||||||||||||||||||||||||
| Pass rated | $ |
|
$ |
|
$ |
|
$ |
|
$ |
|
$ |
|
$ |
|
$ |
|
|||||||||||||||||||||||||||||||
| Reservable criticized |
|
|
|
|
|
|
|
|
|||||||||||||||||||||||||||||||||||||||
|
Total Commercial Lease Financing
|
$ |
|
$ |
|
$ |
|
$ |
|
$ |
|
$ |
|
$ |
|
$ |
|
|||||||||||||||||||||||||||||||
|
U.S. Small Business Commercial
(3)
|
|||||||||||||||||||||||||||||||||||||||||||||||
| Risk ratings | |||||||||||||||||||||||||||||||||||||||||||||||
| Pass rated | $ |
|
$ |
|
$ |
|
$ |
|
$ |
|
$ |
|
$ |
|
$ |
|
|||||||||||||||||||||||||||||||
| Reservable criticized |
|
|
|
|
|
|
|
|
|||||||||||||||||||||||||||||||||||||||
|
Total U.S. Small Business Commercial
|
$ |
|
$ |
|
$ |
|
$ |
|
$ |
|
$ |
|
$ |
|
$ |
|
|||||||||||||||||||||||||||||||
|
Total
(1, 2)
|
$ |
|
$ |
|
$ |
|
$ |
|
$ |
|
$ |
|
$ |
|
$ |
|
|||||||||||||||||||||||||||||||
(1)
Excludes $
6.6
billion of loans accounted for under the fair value option at September 30, 2020.
(2)
Includes $
54
million of loans that converted from revolving to term loans.
(3)
Excludes U.S. Small Business Card loans of $
6.7
billion. Refreshed FICO scores for this portfolio are $
266
million for less than 620; $
599
million for greater than or equal to 620 and less than 680; $
1.8
billion for greater than or equal to 680 and less than 740; and $
4.1
billion greater than or equal to 740.
Troubled Debt Restructurings
The Corporation began entering into loan modifications with borrowers in response to the COVID-19 pandemic, which have not been classified as TDRs, and therefore are not included in the discussion below. For more information on the criteria for classifying loans as TDRs, see
Note 1 – Summary of Significant Accounting Principles
.
Consumer Real Estate
Modifications of consumer real estate loans are classified as TDRs when the borrower is experiencing financial difficulties and a concession has been granted. Concessions may include reductions in interest rates, capitalization of past due amounts, principal and/or interest forbearance, payment extensions, principal and/or interest forgiveness, or combinations thereof. Prior to permanently modifying a loan, the Corporation may enter into trial modifications with certain borrowers under both government and proprietary programs. Trial modifications generally represent a three- to four-month period during which
the borrower makes monthly payments under the anticipated modified payment terms. Upon successful completion of the trial period, the Corporation and the borrower enter into a permanent modification. Binding trial modifications are classified as TDRs when the trial offer is made and continue to be classified as TDRs regardless of whether the borrower enters into a permanent modification.
Consumer real estate loans of $
385
million that have been discharged in Chapter 7 bankruptcy with no change in repayment terms and not reaffirmed by the borrower were included in TDRs at September 30, 2020, of which $
101
million were classified as nonperforming and $
71
million were loans fully insured.
Consumer real estate TDRs are measured primarily based on the net present value of the estimated cash flows discounted at the loan’s original effective interest rate. If the carrying value of a TDR exceeds this amount, a specific allowance is recorded as a component of the allowance for loan and lease losses. Alternatively, consumer real estate TDRs that are considered to be dependent solely on the collateral for repayment (e.g., due to the lack of income verification) are measured based on the estimated fair value of the collateral, and a charge-off is recorded if the carrying value exceeds the fair value of the collateral. Consumer real estate loans that reach 180 days past due prior to modification are charged off to their net realizable value, less costs to sell, before they are modified as TDRs in accordance with established policy. Subsequent declines in the fair value of the collateral after a loan has reached 180 days
|
Bank of America
74
|
||||||||
past due are recorded as charge-offs. Fully-insured loans are protected against principal loss, and therefore, the Corporation does not record an allowance for loan and lease losses on the outstanding principal balance, even after they have been modified in a TDR.
At September 30, 2020 and December 31, 2019, remaining commitments to lend additional funds to debtors whose terms have been modified in a consumer real estate TDR were not significant. Consumer real estate foreclosed properties totaled $
135
million and $
229
million at September 30, 2020 and December 31, 2019. The carrying value of consumer real estate loans, including fully-insured loans, for which formal foreclosure proceedings were in process at September 30, 2020 was $
1.3
billion. Although the Corporation has paused formal loan foreclosure proceedings and foreclosure sales for occupied properties, during the nine months ended September 30, 2020, the Corporation reclassified $
169
million of consumer real
estate loans completed or which were in process prior to the pause in foreclosures, to foreclosed properties or, for properties acquired upon foreclosure of certain government-guaranteed loans (principally FHA-insured loans), to other assets. The reclassifications represent non-cash investing activities and, accordingly, are not reflected in the Consolidated Statement of Cash Flows.
|
Consumer Real Estate – TDRs Entered into During The Three and Nine Months Ended September 30, 2020
and 2019
(1)
|
|||||||||||||||||||||||||||||||||||||||||||||||
| Unpaid Principal Balance |
Carrying
Value |
Pre-Modification Interest Rate |
Post-Modification Interest Rate
(2)
|
Unpaid Principal Balance |
Carrying
Value |
Pre-Modification Interest Rate |
Post-Modification Interest Rate
(2)
|
||||||||||||||||||||||||||||||||||||||||
| (Dollars in millions) | Three Months Ended September 30, 2020 | Nine Months Ended September 30, 2020 | |||||||||||||||||||||||||||||||||||||||||||||
| Residential mortgage | $ |
|
$ |
|
|
% |
|
% | $ |
|
$ |
|
|
% |
|
% | |||||||||||||||||||||||||||||||
| Home equity |
|
|
|
|
|
|
|
|
|||||||||||||||||||||||||||||||||||||||
| Total | $ |
|
$ |
|
|
|
$ |
|
$ |
|
|
|
|||||||||||||||||||||||||||||||||||
| Three Months Ended September 30, 2019 | Nine Months Ended September 30, 2019 | ||||||||||||||||||||||||||||||||||||||||||||||
| Residential mortgage | $ |
|
$ |
|
|
% |
|
% | $ |
|
$ |
|
|
% |
|
% | |||||||||||||||||||||||||||||||
| Home equity |
|
|
|
|
|
|
|
|
|||||||||||||||||||||||||||||||||||||||
| Total | $ |
|
$ |
|
|
|
$ |
|
$ |
|
|
|
|||||||||||||||||||||||||||||||||||
(1)
For more information on the Corporation's loan modification programs offered in response to the COVID-19 pandemic, which are not TDRs, see
Note 1 – Summary of Significant Accounting Principles.
(2)
The post-modification interest rate reflects the interest rate applicable only to permanently completed modifications, which exclude loans that are in a trial modification period.
The table below presents the September 30, 2020 and 2019 carrying value for consumer real estate loans that were modified in a TDR during the three and nine months ended September 30, 2020 and 2019, by type of modification.
|
Consumer Real Estate – Modification Programs
(1)
|
|||||||||||||||||||||||
| TDRs Entered into During the | |||||||||||||||||||||||
| Three Months Ended September 30 | Nine Months Ended September 30 | ||||||||||||||||||||||
| (Dollars in millions) | 2020 | 2019 | 2020 | 2019 | |||||||||||||||||||
| Modifications under government programs | $ |
|
$ |
|
$ |
|
$ |
|
|||||||||||||||
| Modifications under proprietary programs |
|
|
|
|
|||||||||||||||||||
|
Loans discharged in Chapter 7 bankruptcy
(2)
|
|
|
|
|
|||||||||||||||||||
| Trial modifications |
|
|
|
|
|||||||||||||||||||
| Total modifications | $ |
|
$ |
|
$ |
|
$ |
|
|||||||||||||||
(1)
For more information on the Corporation's loan modification programs offered in response to the COVID-19 pandemic, which are not TDRs, see
Note 1 – Summary of Significant Accounting Principles
.
(2)
Includes loans discharged in Chapter 7 bankruptcy with no change in repayment terms that are classified as TDRs.
The table below presents the carrying value of consumer real estate loans that entered into payment default during the three and nine months ended September 30, 2020 and 2019 that were modified in a TDR during the 12 months preceding payment default. A payment default for consumer real estate TDRs is recognized when a borrower has missed
three
monthly payments (not necessarily consecutively) since modification.
|
Consumer Real Estate – TDRs Entering Payment Default that were Modified During the Preceding 12 Months
(1)
|
|||||||||||||||||||||||
| Three Months Ended September 30 | Nine Months Ended September 30 | ||||||||||||||||||||||
| (Dollars in millions) | 2020 | 2019 | 2020 | 2019 | |||||||||||||||||||
| Modifications under government programs | $ |
|
$ |
|
$ |
|
$ |
|
|||||||||||||||
| Modifications under proprietary programs |
|
|
|
|
|||||||||||||||||||
|
Loans discharged in Chapter 7 bankruptcy
(2)
|
|
|
|
|
|||||||||||||||||||
|
Trial modifications
(3)
|
|
|
|
|
|||||||||||||||||||
| Total modifications | $ |
|
$ |
|
$ |
|
$ |
|
|||||||||||||||
(1)
For more information on the Corporation's loan modification programs offered in response to the COVID-19 pandemic, which are not TDRs, see
Note 1 – Summary of Significant Accounting Principles
.
(2)
Includes loans discharged in Chapter 7 bankruptcy with no change in repayment terms that are classified as TDRs.
(3)
Includes trial modification offers to which the customer did not respond.
|
75
Bank of America
|
||||||||
Credit Card and Other Consumer
The Corporation seeks to assist customers that are experiencing financial difficulty by modifying loans while ensuring compliance with federal and local laws and guidelines. Credit card and other consumer loan modifications generally involve reducing the interest rate on the account, placing the customer on a fixed payment plan not exceeding 60 months and canceling the customer’s available line of credit, all of which are considered TDRs. The Corporation makes loan modifications directly with borrowers for debt held only by the Corporation (internal programs). Additionally, the Corporation makes loan modifications for borrowers working with third-party renegotiation
agencies that provide solutions to customers’ entire unsecured debt structures (external programs). The Corporation classifies other secured consumer loans that have been discharged in Chapter 7 bankruptcy as TDRs which are written down to collateral value and placed on nonaccrual status no later than the time of discharge.
|
Credit Card and Other Consumer – TDRs Entered into During the Three and Nine Months Ended September 30, 2020
and 2019
(1)
|
|||||||||||||||||||||||||||||||||||||||||||||||
| Unpaid Principal Balance |
Carrying
Value (2) |
Pre-Modification Interest Rate | Post-Modification Interest Rate | Unpaid Principal Balance |
Carrying
Value (2) |
Pre-Modification Interest Rate | Post-Modification Interest Rate | ||||||||||||||||||||||||||||||||||||||||
| (Dollars in millions) | Three Months Ended September 30, 2020 | Nine Months Ended September 30, 2020 | |||||||||||||||||||||||||||||||||||||||||||||
| Credit card | $ |
|
$ |
|
|
% |
|
% | $ |
|
$ |
|
|
|
|||||||||||||||||||||||||||||||||
| Direct/Indirect consumer |
|
|
|
|
|
|
|
|
|||||||||||||||||||||||||||||||||||||||
| Total | $ |
|
$ |
|
|
|
$ |
|
$ |
|
|
|
|||||||||||||||||||||||||||||||||||
| Three Months Ended September 30, 2019 | Nine Months Ended September 30, 2019 | ||||||||||||||||||||||||||||||||||||||||||||||
| Credit card | $ |
|
$ |
|
|
% |
|
% | $ |
|
$ |
|
|
% |
|
% | |||||||||||||||||||||||||||||||
| Direct/Indirect consumer |
|
|
|
|
|
|
|
|
|||||||||||||||||||||||||||||||||||||||
| Total | $ |
|
$ |
|
|
|
$ |
|
$ |
|
|
|
|||||||||||||||||||||||||||||||||||
(1)
For more information on the Corporation's loan modification programs offered in response to the COVID-19 pandemic, which are not TDRs, see
Note 1 – Summary of Significant Accounting Principles.
(2)
Includes accrued interest and fees.
The table below presents the September 30, 2020 and 2019 carrying value for Credit Card and Other Consumer loans that were modified in a TDR during the three and nine months ended September 30, 2020 and 2019, by program type.
|
Credit Card and Other Consumer – TDRs by Program Type
(1)
|
|||||||||||||||||||||||
| TDRs Entered into During the Three Months Ended September 30 | TDRs Entered into During the Nine Months Ended September 30 | ||||||||||||||||||||||
|
(Dollars in millions)
|
2020 | 2019 | 2020 | 2019 | |||||||||||||||||||
| Internal programs | $ |
|
$ |
|
$ |
|
$ |
|
|||||||||||||||
|
External programs
|
|
|
|
|
|||||||||||||||||||
|
Other
|
|
|
|
|
|||||||||||||||||||
| Total | $ |
|
$ |
|
$ |
|
$ |
|
|||||||||||||||
(1)
Includes accrued interest and fees. For more information on the Corporation's loan modification programs offered in response to the COVID-19 pandemic, which are not TDRs, see
Note 1 – Summary of Significant Accounting Principles.
Commercial Loans
Modifications of loans to commercial borrowers that are experiencing financial difficulty are designed to reduce the Corporation’s loss exposure while providing the borrower with an opportunity to work through financial difficulties, often to avoid foreclosure or bankruptcy. Each modification is unique and reflects the individual circumstances of the borrower. Modifications that result in a TDR may include extensions of maturity at a concessionary (below market) rate of interest, payment forbearances or other actions designed to benefit the borrower while mitigating the Corporation’s risk exposure.
Reductions in interest rates are rare. Instead, the interest rates are typically increased, although the increased rate may not represent a market rate of interest. Infrequently, concessions may also include principal forgiveness in connection with foreclosure, short sale or other settlement agreements leading to termination or sale of the loan.
At the time of restructuring, the loans are remeasured to reflect the impact, if any, on projected cash flows resulting from the modified terms. If a portion of the loan is deemed to be uncollectible, a charge-off may be recorded at the time of restructuring. Alternatively, a charge-off may have already been recorded in a previous period such that no charge-off is required at the time of modification. For more information on modifications for the U.S. small business commercial portfolio, see Credit Card and Other Consumer in this Note.
At September 30, 2020 and December 31, 2019, remaining commitments to lend additional funds to debtors whose terms have been modified in a commercial loan TDR were $
471
million and $
445
million. The balance of commercial TDRs in payment default was $
391
million at September 30, 2020 and $
207
million at December 31, 2019.
|
Bank of America
76
|
||||||||
Loans Held-for-sale
The Corporation had LHFS of $
4.4
billion and $
9.2
billion at September 30, 2020 and December 31, 2019. Cash and non-cash proceeds from sales and paydowns of loans originally classified as LHFS were $
16.1
billion and $
19.6
billion for the nine months ended September 30, 2020 and 2019. Cash used for originations and purchases of LHFS totaled approximately $
11.1
billion and $
18.7
billion for the nine months ended September 30, 2020 and 2019.
Accrued Interest Receivable
Accrued interest receivable for loans and leases and loans held-for-sale at September 30, 2020 and December 31, 2019 was $
2.5
billion and $
2.6
billion and is reported in customer and other receivables on the Consolidated Balance Sheet.
Outstanding credit card loan balances include unpaid principal, interest and fees. Credit card loans are not classified as nonperforming but are charged off no later than the end of the month in which the account becomes 180 days past due, within 60 days after receipt of notification of death or bankruptcy, or upon confirmation of fraud
.
During the three and nine months ended September 30, 2020, the Corporation reversed $
111
million and $
417
million of interest and fee income against the income statement line item in which it was originally recorded upon charge-off of the principal balance of the loan
.
For the outstanding residential mortgage, home equity, direct/indirect consumer and commercial loan balances classified as nonperforming during the three and nine months ended September 30, 2020, the Corporation reversed $
11
million and $
29
million of interest and fee income at the time the loans were classified as nonperforming against the income statement line item in which it was originally recorded. For more information on the Corporation's nonperforming loan policies, see
Note 1 – Summary of Significant Accounting Principles
to the Consolidated Financial Statements of the Corporation’s 2019 Annual Report on Form 10-K.
Allowance for Credit Losses
On January 1, 2020, the Corporation adopted the new accounting standard that requires the measurement of the allowance for credit losses to be based on management’s best estimate of lifetime ECL inherent in the Corporation’s relevant financial assets. Upon adoption of the new accounting standard, the Corporation recorded a $
3.3
billion, or
32
percent, increase in the allowance for credit losses on January 1, 2020, which was comprised of a net increase of $
2.9
billion in the allowance for loan and lease losses and a $
310
million increase in the reserve for unfunded lending commitments. The net increase in the allowance for loan and lease losses was primarily driven by a $
3.1
billion increase in credit card as the Corporation now reserves for the life of these receivables. The increase in the reserve for unfunded lending commitments included $
119
million in the consumer portfolio for the undrawn portion of HELOCs and $
191
million in the commercial portfolio. For more information on the Corporation's credit loss accounting policies including the allowance for credit losses see
Note 1 – Summary of Significant Accounting Principles
.
The allowance for credit losses is estimated using quantitative and qualitative methods that consider a variety of factors such as historical loss experience, the current credit quality of the portfolio as well as an economic outlook over the life of the loan. Qualitative reserves cover losses that are expected but, in the Corporation's assessment, may not be adequately represented in the quantitative methods or the economic assumptions. The Corporation incorporates forward-looking information through the use of several macroeconomic scenarios in determining the weighted economic outlook over the forecasted life of the assets. These scenarios include key macroeconomic variables such as gross domestic product, unemployment rate and home price index. The scenarios that are chosen each quarter and the weighting given to each scenario depend on a variety of factors including recent economic events, leading economic indicators, internal and third-party economist views, and industry trends.
As of January 1, 2020, to determine the allowance for credit losses, the Corporation used a series of economic outlooks that resulted in an economic outlook that was weighted towards the potential of a recession with some expectation of tail risk similar to the severely adverse scenario used in stress testing. Various economic outlooks were also used in the September 30, 2020 estimate for allowance for credit losses that included consensus estimates, multiple downside scenarios which assumed a significantly longer period until economic recovery, a tail risk scenario similar to the severely adverse scenario used in stress testing and an upside scenario to reflect the potential for continued improvement in the consensus outlooks. The unemployment rate under this weighted economic outlook is nearly
nine
percent as of the fourth quarter of 2020 and continues to gradually decline to
seven
percent in late 2021. Additionally, in this economic outlook, gross domestic product returns to pre-pandemic levels in late 2022.
The Corporation also factored into its allowance for credit losses an estimated impact from higher-risk segments that included leveraged loans and industries such as travel and entertainment, which have been adversely impacted from the effects of COVID-19, as well as the energy sector. The Corporation also holds additional reserves for borrowers who requested deferrals that take into account their credit characteristics and payment behavior subsequent to deferral.
The allowance for credit losses at September 30, 2020 was $
21.5
billion, an increase of $
8.0
billion compared to January 1, 2020. The increase in the allowance for credit losses was driven by the deterioration in the economic outlook resulting from the impact of COVID-19. The increase in the allowance for credit losses was comprised of a net increase of $
7.2
billion in the allowance for loan and lease losses and a $
787
million increase in the reserve for unfunded lending commitments. The increase in the allowance for loan and lease losses was attributed to $
415
million in the consumer real estate portfolio, $
2.4
billion in the credit card and other consumer portfolio, and $
4.4
billion in the commercial portfolio.
Outstanding loans and leases excluding loans accounted for under the fair value option decreased $
27.2
billion in the nine months ended September 30, 2020, driven by consumer loans, which decreased $
26.0
billion primarily due to a decline in credit card loans from reduced consumer spending.
|
77
Bank of America
|
||||||||
The changes in the allowance for credit losses, including net charge-offs and provision for loan and lease losses, are detailed in the table below.
|
Consumer
Real Estate |
Credit Card and Other Consumer | Commercial | Total | ||||||||||||||||||||
| (Dollars in millions) | Three Months Ended September 30, 2020 | ||||||||||||||||||||||
| Allowance for loan and lease losses, July 1 | $ |
|
$ |
|
$ |
|
$ |
|
|||||||||||||||
| Loans and leases charged off |
(
|
(
|
(
|
(
|
|||||||||||||||||||
| Recoveries of loans and leases previously charged off |
|
|
|
|
|||||||||||||||||||
| Net charge-offs |
|
(
|
(
|
(
|
|||||||||||||||||||
| Provision for loan and lease losses |
(
|
|
|
|
|||||||||||||||||||
|
Other
(1)
|
|
|
(
|
(
|
|||||||||||||||||||
|
Allowance for loan and lease losses, September 30
|
|
|
|
|
|||||||||||||||||||
| Reserve for unfunded lending commitments, July 1 |
|
|
|
|
|||||||||||||||||||
| Provision for unfunded lending commitments |
(
|
|
|
|
|||||||||||||||||||
|
Other
(1)
|
|
|
(
|
(
|
|||||||||||||||||||
|
Reserve for unfunded lending commitments, September 30
|
|
|
|
|
|||||||||||||||||||
|
Allowance for credit losses, September 30
|
$ |
|
$ |
|
$ |
|
$ |
|
|||||||||||||||
| Three Months Ended September 30, 2019 | |||||||||||||||||||||||
| Allowance for loan and lease losses, July 1 | $ |
|
$ |
|
$ |
|
$ |
|
|||||||||||||||
| Loans and leases charged off |
(
|
(
|
(
|
(
|
|||||||||||||||||||
| Recoveries of loans and leases previously charged off |
|
|
|
|
|||||||||||||||||||
| Net charge-offs |
|
(
|
(
|
(
|
|||||||||||||||||||
| Provision for loan and lease losses |
(
|
|
|
|
|||||||||||||||||||
|
Other
(1)
|
(
|
|
(
|
(
|
|||||||||||||||||||
|
Allowance for loan and lease losses, September 30
|
|
|
|
|
|||||||||||||||||||
| Reserve for unfunded lending commitments, July 1 |
|
|
|
|
|||||||||||||||||||
| Provision for unfunded lending commitments |
|
|
|
|
|||||||||||||||||||
|
Reserve for unfunded lending commitments, September 30
|
|
|
|
|
|||||||||||||||||||
|
Allowance for credit losses, September 30
|
$ |
|
$ |
|
$ |
|
$ |
|
|||||||||||||||
| (Dollars in millions) | Nine Months Ended September 30, 2020 | ||||||||||||||||||||||
| Allowance for loan and lease losses, January 1 | $ |
|
$ |
|
$ |
|
$ |
|
|||||||||||||||
| Loans and leases charged off |
(
|
(
|
(
|
(
|
|||||||||||||||||||
| Recoveries of loans and leases previously charged off |
|
|
|
|
|||||||||||||||||||
| Net charge-offs |
|
(
|
(
|
(
|
|||||||||||||||||||
| Provision for loan and lease losses |
|
|
|
|
|||||||||||||||||||
|
Other
(1)
|
|
|
(
|
(
|
|||||||||||||||||||
|
Allowance for loan and lease losses, September 30
|
|
|
|
|
|||||||||||||||||||
| Reserve for unfunded lending commitments, January 1 |
|
|
|
|
|||||||||||||||||||
| Provision for unfunded lending commitments |
|
|
|
|
|||||||||||||||||||
|
Reserve for unfunded lending commitments, September 30
|
|
|
|
|
|||||||||||||||||||
|
Allowance for credit losses, September 30
|
$ |
|
$ |
|
$ |
|
$ |
|
|||||||||||||||
| Nine Months Ended September 30, 2019 | |||||||||||||||||||||||
| Allowance for loan and lease losses, January 1 | $ |
|
$ |
|
$ |
|
$ |
|
|||||||||||||||
| Loans and leases charged off |
(
|
(
|
(
|
(
|
|||||||||||||||||||
| Recoveries of loans and leases previously charged off |
|
|
|
|
|||||||||||||||||||
| Net charge-offs |
|
(
|
(
|
(
|
|||||||||||||||||||
| Provision for loan and lease losses |
(
|
|
|
|
|||||||||||||||||||
|
Other
(1)
|
(
|
|
(
|
(
|
|||||||||||||||||||
|
Allowance for loan and lease losses, September 30
|
|
|
|
|
|||||||||||||||||||
| Reserve for unfunded lending commitments, January 1 |
|
|
|
|
|||||||||||||||||||
| Provision for unfunded lending commitments |
|
|
|
|
|||||||||||||||||||
|
Reserve for unfunded lending commitments, September 30
|
|
|
|
|
|||||||||||||||||||
|
Allowance for credit losses, September 30
|
$ |
|
$ |
|
$ |
|
$ |
|
|||||||||||||||
(1)
Primarily represents write-offs of purchased credit-impaired loans in 2019, and the net impact of portfolio sales, transfers to held-for-sale and transfers to foreclosed properties.
|
Bank of America
78
|
||||||||
NOTE 6
Securitizations and Other Variable Interest Entities
The Corporation invests in ABS issued by third-party VIEs with which it has no other form of involvement and enters into certain commercial lending arrangements that may also incorporate the use of VIEs, for example to hold collateral. These securities and loans are included in
Note 4 – Securities
or
Note 5 – Outstanding Loans and Leases and Allowance for Credit Losses.
The Corporation did not provide financial support to consolidated or unconsolidated VIEs during the nine months ended September 30, 2020 or the year ended December 31, 2019 that it was not previously contractually required to provide, nor does it intend to do so.
The Corporation had liquidity commitments, including written put options and collateral value guarantees, with certain unconsolidated VIEs of $
918
million and $
1.1
billion at September 30, 2020 and December 31, 2019.
First-lien Mortgage Securitizations
As part of its mortgage banking activities, the Corporation securitizes a portion of the first-lien residential mortgage loans it originates or purchases from third parties. Except as described in
Note 10 – Commitments and Contingencies
, the Corporation does not provide guarantees or recourse to the securitization trusts other than standard representations and warranties.
| First-lien Mortgage Securitizations | |||||||||||||||||||||||||||||||||||||||||||||||
| Residential Mortgage - Agency | Commercial Mortgage | ||||||||||||||||||||||||||||||||||||||||||||||
| Three Months Ended September 30 | Nine Months Ended September 30 | Three Months Ended September 30 | Nine Months Ended September 30 | ||||||||||||||||||||||||||||||||||||||||||||
| (Dollars in millions) | 2020 | 2019 | 2020 | 2019 | 2020 | 2019 | 2020 | 2019 | |||||||||||||||||||||||||||||||||||||||
|
Proceeds from loan sales
(1)
|
$ |
|
$ |
|
$ |
|
$ |
|
$ |
|
$ |
|
$ |
|
$ |
|
|||||||||||||||||||||||||||||||
|
Gains (losses) on securitizations
(2)
|
|
|
|
|
|
|
|
|
|||||||||||||||||||||||||||||||||||||||
|
Repurchases from securitization trusts
(3)
|
|
|
|
|
|
|
|
|
|||||||||||||||||||||||||||||||||||||||
(1)
The Corporation transfers residential mortgage loans to securitizations sponsored primarily by the GSEs or Government National Mortgage Association (GNMA) in the normal course of business and primarily receives residential mortgage-backed securities in exchange. Substantially all of these securities are classified as Level 2 within the fair value hierarchy and are typically sold shortly after receipt.
(2)
A majority of the first-lien residential mortgage loans securitized are initially classified as LHFS and accounted for under the fair value option. Gains recognized on these LHFS prior to securitization, which totaled $
44
million and $
105
million, net of hedges, during the three and nine months ended September 30, 2020 compared to $
19
million and $
38
million for the same periods in 2019, are not included in the table above.
(3)
The Corporation may have the option to repurchase delinquent loans out of securitization trusts, which reduces the amount of servicing advances it is required to make. The Corporation may also repurchase loans from securitization trusts to perform modifications. Repurchased loans include FHA-insured mortgages collateralizing GNMA securities.
The Corporation recognizes consumer mortgage servicing rights (MSRs) from the sale or securitization of consumer real estate loans. The unpaid principal balance of loans serviced for investors, including residential mortgage and home equity loans, totaled $
172.5
billion and $
201.3
billion at September 30, 2020 and 2019. Servicing fee and ancillary fee income on serviced loans was $
101
million and $
353
million during the three and nine months ended September 30, 2020 compared to $
144
million and $
436
million for the same periods in 2019. Servicing advances on serviced loans, including loans serviced for others and loans held for investment, were $
2.1
billion and $
2.4
billion at September 30, 2020 and December 31, 2019. For more information on MSRs, see
Note 14 – Fair Value Measurements
.
During the three and nine months ended September 30, 2019, the Corporation deconsolidated agency residential mortgage securitization trusts with total assets of $
65
million and $
1.2
billion. During the nine months ended September 30, 2020, the Corporation completed the sale of $
9.3
billion of consumer real estate loans through GNMA loan securitizations. As part of the securitizations, the Corporation retained $
8.4
billion of MBS, which are classified as debt securities carried at fair value on the Consolidated Balance Sheet. Total gains on loan sales of $
704
million were recorded in other income in the Consolidated Statement of Income.
|
79
Bank of America
|
||||||||
| First-lien Mortgage VIEs | ||||||||||||||||||||||||||||||||||||||||||||
| Residential Mortgage | ||||||||||||||||||||||||||||||||||||||||||||
| Non-agency | ||||||||||||||||||||||||||||||||||||||||||||
| Agency | Prime | Subprime | Alt-A | Commercial Mortgage | ||||||||||||||||||||||||||||||||||||||||
| (Dollars in millions) |
Sep 30
2020 |
December 31
2019 |
Sep 30
2020 |
December 31
2019 |
Sep 30
2020 |
December 31
2019 |
Sep 30
2020 |
December 31
2019 |
Sep 30
2020 |
December 31
2019 |
||||||||||||||||||||||||||||||||||
| Unconsolidated VIEs | ||||||||||||||||||||||||||||||||||||||||||||
|
Maximum loss exposure
(1)
|
$ |
|
$ |
|
$ |
|
$ |
|
$ |
|
$ |
|
$ |
|
$ |
|
$ |
|
$ |
|
||||||||||||||||||||||||
|
On-balance sheet assets
|
||||||||||||||||||||||||||||||||||||||||||||
|
Senior securities:
|
||||||||||||||||||||||||||||||||||||||||||||
|
Trading account assets
|
$ |
|
$ |
|
$ |
|
$ |
|
$ |
|
$ |
|
$ |
|
$ |
|
$ |
|
$ |
|
||||||||||||||||||||||||
|
Debt securities carried at fair value
|
|
|
|
|
|
|
|
|
|
|
||||||||||||||||||||||||||||||||||
|
Held-to-maturity securities
|
|
|
|
|
|
|
|
|
|
|
||||||||||||||||||||||||||||||||||
| All other assets |
|
|
|
|
|
|
|
|
|
|
||||||||||||||||||||||||||||||||||
|
Total retained positions
|
$ |
|
$ |
|
$ |
|
$ |
|
$ |
|
$ |
|
$ |
|
$ |
|
$ |
|
$ |
|
||||||||||||||||||||||||
|
Principal balance outstanding
(2)
|
$ |
|
$ |
|
$ |
|
$ |
|
$ |
|
$ |
|
$ |
|
$ |
|
$ |
|
$ |
|
||||||||||||||||||||||||
| Consolidated VIEs | ||||||||||||||||||||||||||||||||||||||||||||
|
Maximum loss exposure
(1)
|
$ |
|
$ |
|
$ |
|
$ |
|
$ |
|
$ |
|
$ |
|
$ |
|
$ |
|
$ |
|
||||||||||||||||||||||||
|
On-balance sheet assets
|
||||||||||||||||||||||||||||||||||||||||||||
|
Trading account assets
|
$ |
|
$ |
|
$ |
|
$ |
|
$ |
|
$ |
|
$ |
|
$ |
|
$ |
|
$ |
|
||||||||||||||||||||||||
| Loans and leases, net |
|
|
|
|
|
|
|
|
|
|
||||||||||||||||||||||||||||||||||
| All other assets |
|
|
|
|
|
|
|
|
|
|
||||||||||||||||||||||||||||||||||
| Total assets | $ |
|
$ |
|
$ |
|
$ |
|
$ |
|
$ |
|
$ |
|
$ |
|
$ |
|
$ |
|
||||||||||||||||||||||||
| Total liabilities | $ |
|
$ |
|
$ |
|
$ |
|
$ |
|
$ |
|
$ |
|
$ |
|
$ |
|
$ |
|
||||||||||||||||||||||||
(1)
Maximum loss exposure includes obligations under loss-sharing reinsurance and other arrangements for non-agency residential mortgage and commercial mortgage securitizations, but excludes the reserve for representations and warranties obligations and corporate guarantees and also excludes servicing advances and other servicing rights and obligations. For more information, see
Note 10 – Commitments and Contingencies
and
Note 14 – Fair Value Measurements
.
(2)
Principal balance outstanding includes loans where the Corporation was the transferor to securitization VIEs with which it has continuing involvement, which may include servicing the loans.
Other Asset-backed Securitizations
The following table summarizes select information related to home equity, credit card and other asset-backed VIEs in which the Corporation held a variable interest at September 30, 2020 and December 31, 2019.
| Home Equity Loan, Credit Card and Other Asset-backed VIEs | |||||||||||||||||||||||||||||||||||
|
Home Equity
(1)
|
Credit Card
(2)
|
Resecuritization Trusts | Municipal Bond Trusts | ||||||||||||||||||||||||||||||||
| (Dollars in millions) |
Sep 30
2020 |
December 31
2019 |
Sep 30
2020 |
December 31
2019 |
Sep 30
2020 |
December 31
2019 |
Sep 30
2020 |
December 31
2019 |
|||||||||||||||||||||||||||
| Unconsolidated VIEs | |||||||||||||||||||||||||||||||||||
| Maximum loss exposure | $ |
|
$ |
|
$ |
|
$ |
|
$ |
|
$ |
|
$ |
|
$ |
|
|||||||||||||||||||
| On-balance sheet assets | |||||||||||||||||||||||||||||||||||
|
Securities
(3)
:
|
|||||||||||||||||||||||||||||||||||
| Trading account assets | $ |
|
$ |
|
$ |
|
$ |
|
$ |
|
$ |
|
$ |
|
$ |
|
|||||||||||||||||||
|
Debt securities carried at fair value
|
|
|
|
|
|
|
|
|
|||||||||||||||||||||||||||
| Held-to-maturity securities |
|
|
|
|
|
|
|
|
|||||||||||||||||||||||||||
| Total retained positions | $ |
|
$ |
|
$ |
|
$ |
|
$ |
|
$ |
|
$ |
|
$ |
|
|||||||||||||||||||
| Total assets of VIEs | $ |
|
$ |
|
$ |
|
$ |
|
$ |
|
$ |
|
$ |
|
$ |
|
|||||||||||||||||||
| Consolidated VIEs | |||||||||||||||||||||||||||||||||||
| Maximum loss exposure | $ |
|
$ |
|
$ |
|
$ |
|
$ |
|
$ |
|
$ |
|
$ |
|
|||||||||||||||||||
| On-balance sheet assets | |||||||||||||||||||||||||||||||||||
| Trading account assets | $ |
|
$ |
|
$ |
|
$ |
|
$ |
|
$ |
|
$ |
|
$ |
|
|||||||||||||||||||
| Loans and leases |
|
|
|
|
|
|
|
|
|||||||||||||||||||||||||||
|
Allowance for loan and lease losses
|
|
(
|
(
|
(
|
|
|
|
|
|||||||||||||||||||||||||||
| All other assets |
|
|
|
|
|
|
|
|
|||||||||||||||||||||||||||
| Total assets | $ |
|
$ |
|
$ |
|
$ |
|
$ |
|
$ |
|
$ |
|
$ |
|
|||||||||||||||||||
| On-balance sheet liabilities | |||||||||||||||||||||||||||||||||||
|
Short-term borrowings
|
$ |
|
$ |
|
$ |
|
$ |
|
$ |
|
$ |
|
$ |
|
$ |
|
|||||||||||||||||||
| Long-term debt |
|
|
|
|
|
|
|
|
|||||||||||||||||||||||||||
| All other liabilities |
|
|
|
|
|
|
|
|
|||||||||||||||||||||||||||
| Total liabilities | $ |
|
$ |
|
$ |
|
$ |
|
$ |
|
$ |
|
$ |
|
$ |
|
|||||||||||||||||||
(1)
For unconsolidated home equity loan VIEs, the maximum loss exposure includes outstanding trust certificates issued by trusts in rapid amortization, net of recorded reserves. For both consolidated and unconsolidated home equity loan VIEs, the maximum loss exposure excludes the reserve for representations and warranties obligations and corporate guarantees. For more information, see
Note 10 – Commitments and Contingencies
.
(2)
At September 30, 2020 and December 31, 2019, loans and leases in the consolidated credit card trust included $
9.0
billion and $
10.5
billion of seller’s interest.
Home Equity Loans
The Corporation retains interests, primarily senior securities, in home equity securitization trusts to which it transferred home equity loans. In addition, the Corporation may be obligated to
provide subordinate funding to the trusts during a rapid amortization event. This obligation is included in the maximum loss exposure in the table above. The charges that will ultimately be recorded as a result of the rapid amortization
|
Bank of America
80
|
||||||||
events depend on the undrawn portion of the HELOCs, performance of the loans, the amount of subsequent draws and the timing of related cash flows.
Credit Card Securitizations
The Corporation securitizes originated and purchased credit card loans. The Corporation’s continuing involvement with the securitization trust includes servicing the receivables, retaining an undivided interest (seller’s interest) in the receivables, and holding certain retained interests including subordinate interests in accrued interest and fees on the securitized receivables and cash reserve accounts.
During the nine months ended September 30, 2019, there were $
1.3
billion of new senior debt securities issued to third-party investors from the credit card securitization trust. There were
no
new senior debt securities issued to third-party investors from the credit card securitization trust during the nine months ended September 30, 2020.
At September 30, 2020 and December 31, 2019, the Corporation held subordinate securities issued by the credit card securitization trust with a notional principal amount of $
6.9
billion and $
7.4
billion. These securities serve as a form of credit enhancement to the senior debt securities and have a stated interest rate of
zero
percent. There were $
202
million of these subordinate securities issued by the credit card securitization trust during the nine months ended September 30, 2019. There were
no
subordinate securities issued by the credit card securitization trust during the nine months ended September 30, 2020.
Resecuritization Trusts
The Corporation transfers securities, typically MBS, into resecuritization VIEs generally at the request of customers seeking securities with specific characteristics. Generally, there are no significant ongoing activities performed in a resecuritization trust, and no single investor has the unilateral ability to liquidate the trust.
The Corporation resecuritized $
8.3
billion and $
26.4
billion of securities during the three and nine months ended September 30, 2020 compared to $
5.2
billion and $
13.7
billion for the same periods in 2019. Securities transferred into
resecuritization VIEs were measured at fair value with changes in fair value recorded in market making and similar activities prior to the resecuritization and, accordingly, no gain or loss on sale was recorded. Securities received from the resecuritization VIEs were recognized at their fair value of $
598
million and $
5.5
billion during the three and nine months ended September 30, 2020 compared to $
750
million and $
3.5
billion for the same periods in 2019, of which substantially all of the securities in the prior-year period were classified as trading account assets. All of the securities received as resecuritization proceeds during the three months ended September 30, 2020 were classified as trading account assets. Of the securities received as resecuritizations proceeds during the nine months ended September 30, 2020, $
1.8
billion, $
2.1
billion and $
1.7
billion were classified as trading account assets, debt securities carried at fair value and HTM securities, respectively. Substantially all of the trading account securities and debt securities carried at fair value were categorized as Level 2 within the fair value hierarchy.
Municipal Bond Trusts
The Corporation administers municipal bond trusts that hold highly-rated, long-term, fixed-rate municipal bonds. The trusts obtain financing by issuing floating-rate trust certificates that reprice on a weekly or other short-term basis to third-party investors.
The Corporation’s liquidity commitments to unconsolidated municipal bond trusts, including those for which the Corporation was transferor, totaled $
3.3
billion and $
3.7
billion at September 30, 2020 and December 31, 2019. The weighted-average remaining life of bonds held in the trusts at September 30, 2020 was
6.9
years. There were no significant write-downs or downgrades of assets or issuers during the nine months ended September 30, 2020 and 2019.
Other Variable Interest Entities
| Other VIEs | |||||||||||||||||||||||||||||||||||
| Consolidated | Unconsolidated | Total | Consolidated | Unconsolidated | Total | ||||||||||||||||||||||||||||||
| (Dollars in millions) | September 30, 2020 | December 31, 2019 | |||||||||||||||||||||||||||||||||
| Maximum loss exposure | $ |
|
$ |
|
$ |
|
$ |
|
$ |
|
$ |
|
|||||||||||||||||||||||
| On-balance sheet assets | |||||||||||||||||||||||||||||||||||
| Trading account assets | $ |
|
$ |
|
$ |
|
$ |
|
$ |
|
$ |
|
|||||||||||||||||||||||
| Debt securities carried at fair value |
|
|
|
|
|
|
|||||||||||||||||||||||||||||
| Loans and leases |
|
|
|
|
|
|
|||||||||||||||||||||||||||||
| Allowance for loan and lease losses |
(
|
(
|
(
|
(
|
(
|
(
|
|||||||||||||||||||||||||||||
| All other assets |
|
|
|
|
|
|
|||||||||||||||||||||||||||||
| Total | $ |
|
$ |
|
$ |
|
$ |
|
$ |
|
$ |
|
|||||||||||||||||||||||
| On-balance sheet liabilities | |||||||||||||||||||||||||||||||||||
| Short-term borrowings | $ |
|
$ |
|
$ |
|
$ |
|
$ |
|
$ |
|
|||||||||||||||||||||||
| Long-term debt |
|
|
|
|
|
|
|||||||||||||||||||||||||||||
| All other liabilities |
|
|
|
|
|
|
|||||||||||||||||||||||||||||
| Total | $ |
|
$ |
|
$ |
|
$ |
|
$ |
|
$ |
|
|||||||||||||||||||||||
| Total assets of VIEs | $ |
|
$ |
|
$ |
|
$ |
|
$ |
|
$ |
|
|||||||||||||||||||||||
Customer VIEs
Customer VIEs include credit-linked, equity-linked and commodity-linked note VIEs, repackaging VIEs and asset acquisition VIEs, which are typically created on behalf of customers who wish to obtain market or credit exposure to a specific company, index, commodity or financial instrument.
The Corporation’s maximum loss exposure to consolidated and unconsolidated customer VIEs totaled $
2.4
billion and $
2.2
billion at September 30, 2020 and December 31, 2019, including the notional amount of derivatives to which the Corporation is a counterparty, net of losses previously recorded, and the Corporation’s investment, if any, in securities issued by the VIEs.
|
81
Bank of America
|
||||||||
Collateralized Debt Obligation VIEs
The Corporation receives fees for structuring CDO VIEs, which hold diversified pools of fixed-income securities, typically corporate debt or ABS, which the CDO VIEs fund by issuing multiple tranches of debt and equity securities. CDOs are generally managed by third-party portfolio managers. The Corporation typically transfers assets to these CDOs, holds securities issued by the CDOs and may be a derivative counterparty to the CDOs. The Corporation’s maximum loss exposure to consolidated and unconsolidated CDOs totaled $
252
million and $
304
million at September 30, 2020 and December 31, 2019.
Investment VIEs
The Corporation sponsors, invests in or provides financing, which may be in connection with the sale of assets, to a variety of investment VIEs that hold loans, real estate, debt securities or other financial instruments and are designed to provide the desired investment profile to investors or the Corporation. At September 30, 2020 and December 31, 2019, the Corporation’s consolidated investment VIEs had total assets of $
552
million and $
104
million. The Corporation also held investments in unconsolidated VIEs with total assets of $
37.3
billion and $
32.4
billion at September 30, 2020 and December 31, 2019. The Corporation’s maximum loss exposure associated with both consolidated and unconsolidated investment VIEs totaled $
5.9
billion and $
6.4
billion at September 30, 2020 and December 31, 2019 comprised primarily of on-balance sheet assets less non-recourse liabilities.
Leveraged Lease Trusts
The Corporation’s net investment in consolidated leveraged lease trusts totaled $
1.7
billion at both September 30, 2020 and December 31, 2019. The trusts hold long-lived equipment such as rail cars, power generation and distribution equipment, and commercial aircraft. The Corporation structures the trusts and holds a significant residual interest. The net investment represents the Corporation’s maximum loss exposure to the trusts in the unlikely event that the leveraged lease investments become worthless. Debt issued by the leveraged lease trusts is non-recourse to the Corporation.
Tax Credit VIEs
The Corporation holds investments in unconsolidated limited partnerships and similar entities that construct, own and operate affordable housing, wind and solar projects. An unrelated third party is typically the general partner or managing member and has control over the significant activities of the VIE. The Corporation earns a return primarily through the receipt of tax credits allocated to the projects. The maximum loss exposure included in the Other VIEs table was $
20.0
billion and $
18.9
billion at September 30, 2020 and December 31, 2019. The Corporation’s risk of loss is generally mitigated by policies requiring that the project qualify for the expected tax credits prior to making its investment.
The Corporation’s investments in affordable housing partnerships, which are reported in other assets on the Consolidated Balance Sheet, totaled $
10.6
billion and $
10.0
billion, including unfunded commitments to provide capital contributions of $
4.8
billion and $
4.3
billion at September 30, 2020 and December 31, 2019. The unfunded commitments are expected to be paid over the next
five years
. The Corporation
NOTE 7
Goodwill and Intangible Assets
Goodwill
The table below presents goodwill balances by business segment and
All Other
at September 30, 2020 and December 31, 2019. The reporting units utilized for goodwill impairment testing are the operating segments or one level below.
| Goodwill | |||||||||||
| (Dollars in millions) |
September 30
2020 |
December 31
2019 |
|||||||||
| Consumer Banking | $ |
|
$ |
|
|||||||
| Global Wealth & Investment Management |
|
|
|||||||||
| Global Banking |
|
|
|||||||||
| Global Markets |
|
|
|||||||||
| All Other |
|
|
|||||||||
| Total goodwill | $ |
|
$ |
|
|||||||
Intangible Assets
At September 30, 2020 and December 31, 2019, the net carrying value of intangible assets was $
2.2
billion and $
1.7
billion. During the three months ended September 30, 2020, the Corporation recognized a $
585
million intangible asset, which is being amortized over a
10
-year life, related to the merchant contracts that were distributed to the Corporation from its merchant servicing joint venture. For more information, see
Note 10 – Commitments and Contingencies
.
At September 30, 2020 and December 31, 2019, intangible assets included $
1.6
billion of intangible assets associated with trade names, substantially all of which had an indefinite life and, accordingly, are not being amortized. Amortization of intangibles expense was $
30
million and $
62
million for the three and nine months ended September 30, 2020 compared to $
29
million and $
84
million for the same periods in 2019.
NOTE 8
Leases
|
Bank of America
82
|
||||||||
Lessor Arrangements
The Corporation’s lessor arrangements primarily consist of operating, sales-type and direct financing leases for equipment. Lease agreements may include options to renew and for the lessee to purchase the leased equipment at the end of the lease term.
At September 30, 2020 and December 31, 2019, the total net investment in sales-type and direct financing leases was $
19.9
billion and $
21.9
billion, comprised of $
17.6
billion and $
19.3
billion in lease receivables and $
2.3
billion and $
2.6
billion in unguaranteed residuals. In certain cases, the Corporation obtains third-party residual value insurance to reduce its residual asset risk. The carrying value of residual assets with third-party residual value insurance for at least a portion of the asset value was $
6.6
billion and $
5.8
billion at September 30, 2020 and December 31, 2019.
| Lease Income | |||||||||||||||||||||||
|
Three Months Ended
September 30 |
Nine Months Ended
September 30 |
||||||||||||||||||||||
| (Dollars in millions) | 2020 | 2019 | 2020 | 2019 | |||||||||||||||||||
|
Sales-type and direct
financing leases |
$ |
|
$ |
|
$ |
|
$ |
|
|||||||||||||||
| Operating leases |
|
|
|
|
|||||||||||||||||||
| Total lease income | $ |
|
$ |
|
$ |
|
$ |
|
|||||||||||||||
Lessee Arrangements
The Corporation’s lessee arrangements predominantly consist of operating leases for premises and equipment; the Corporation’s financing leases are not significant. Right-of-use assets were $
9.9
billion and $
9.7
billion and lease liabilities were $
10.3
billion and $
10.1
billion at September 30, 2020 and December 31, 2019.
NOTE 9
Federal Funds Sold or Purchased, Securities Financing Agreements, Short-term Borrowings and Restricted Cash
The table below presents federal funds sold or purchased, securities financing agreements (which include securities borrowed or purchased under agreements to resell and securities loaned or sold under agreements to repurchase) and short-term borrowings. The Corporation elects to account for certain securities financing agreements and short-term borrowings under the fair value option. For more information on the fair value option, see
Note 15 – Fair Value Option
.
| Amount | Rate | Amount | Rate | Amount | Rate | Amount | Rate | ||||||||||||||||||||||||||||||||||||||||
| Three Months Ended September 30 | Nine Months Ended September 30 | ||||||||||||||||||||||||||||||||||||||||||||||
| (Dollars in millions) | 2020 | 2019 | 2020 | 2019 | |||||||||||||||||||||||||||||||||||||||||||
|
Federal funds sold and securities borrowed or purchased under agreements to resell
|
|||||||||||||||||||||||||||||||||||||||||||||||
| Average during period | $ |
|
|
% | $ |
|
|
% | $ |
|
|
% | $ |
|
|
% | |||||||||||||||||||||||||||||||
| Maximum month-end balance during period |
|
n/a |
|
n/a |
|
n/a |
|
n/a | |||||||||||||||||||||||||||||||||||||||
|
Federal funds purchased and securities loaned or sold under agreements to repurchase
|
|||||||||||||||||||||||||||||||||||||||||||||||
| Average during period | $ |
|
|
% | $ |
|
|
% | $ |
|
|
% | $ |
|
|
% | |||||||||||||||||||||||||||||||
| Maximum month-end balance during period |
|
n/a |
|
n/a |
|
n/a |
|
n/a | |||||||||||||||||||||||||||||||||||||||
| Short-term borrowings | |||||||||||||||||||||||||||||||||||||||||||||||
| Average during period |
|
|
|
|
|
|
|
|
|||||||||||||||||||||||||||||||||||||||
| Maximum month-end balance during period |
|
n/a |
|
n/a |
|
n/a |
|
n/a | |||||||||||||||||||||||||||||||||||||||
n/a = not applicable
Offsetting of Securities Financing Agreements
The Corporation enters into securities financing agreements to accommodate customers (also referred to as “matched-book transactions”), obtain securities to cover short positions and finance inventory positions. For more information on the securities financing agreements and the offsetting of securities financing transactions, see
Note 11 – Federal Funds Sold or Purchased, Securities Financing Agreements, Short-term Borrowings and Restricted Cash
to the Consolidated Financial Statements of the Corporation’s 2019 Annual Report on Form 10-K.
|
83
Bank of America
|
||||||||
| Securities Financing Agreements | |||||||||||||||||||||||||||||
|
Gross Assets/Liabilities
(1)
|
Amounts Offset | Net Balance Sheet Amount |
Financial Instruments
(2)
|
Net Assets/Liabilities | |||||||||||||||||||||||||
| (Dollars in millions) | September 30, 2020 | ||||||||||||||||||||||||||||
|
Securities borrowed or purchased under agreements to resell
(3)
|
$ |
|
$ |
(
|
$ |
|
$ |
(
|
$ |
|
|||||||||||||||||||
| Securities loaned or sold under agreements to repurchase | $ |
|
$ |
(
|
$ |
|
$ |
(
|
$ |
|
|||||||||||||||||||
|
Other
(4)
|
|
|
|
(
|
|
||||||||||||||||||||||||
| Total | $ |
|
$ |
(
|
$ |
|
$ |
(
|
$ |
|
|||||||||||||||||||
| December 31, 2019 | |||||||||||||||||||||||||||||
|
Securities borrowed or purchased under agreements to resell
(3)
|
$ |
|
$ |
(
|
$ |
|
$ |
(
|
$ |
|
|||||||||||||||||||
| Securities loaned or sold under agreements to repurchase | $ |
|
$ |
(
|
$ |
|
$ |
(
|
$ |
|
|||||||||||||||||||
|
Other
(4)
|
|
|
|
(
|
|
||||||||||||||||||||||||
| Total | $ |
|
$ |
(
|
$ |
|
$ |
(
|
$ |
|
|||||||||||||||||||
(1)
Includes activity where uncertainty exists as to the enforceability of certain master netting agreements under bankruptcy laws in some countries or industries.
(2)
Includes securities collateral received or pledged under repurchase or securities lending agreements where there is a legally enforceable master netting agreement. These amounts are not offset on the Consolidated Balance Sheet, but are shown as a reduction to derive a net asset or liability. Securities collateral received or pledged where the legal enforceability of the master netting agreements is uncertain is excluded from the table.
(3)
Excludes repurchase activity of $
15.2
billion and $
12.9
billion reported in loans and leases on the Consolidated Balance Sheet at September 30, 2020 and December 31, 2019.
(4)
Balance is reported in accrued expenses and other liabilities on the Consolidated Balance Sheet and relates to transactions where the Corporation acts as the lender in a securities lending agreement and receives securities that can be pledged as collateral or sold. In these transactions, the Corporation recognizes an asset at fair value, representing the securities received, and a liability, representing the obligation to return those securities.
Repurchase Agreements and Securities Loaned Transactions Accounted for as Secured Borrowings
| Remaining Contractual Maturity | |||||||||||||||||||||||||||||
| Overnight and Continuous | 30 Days or Less | After 30 Days Through 90 Days |
Greater than
90 Days
(1)
|
Total | |||||||||||||||||||||||||
| (Dollars in millions) | September 30, 2020 | ||||||||||||||||||||||||||||
| Securities sold under agreements to repurchase | $ |
|
$ |
|
$ |
|
$ |
|
$ |
|
|||||||||||||||||||
| Securities loaned |
|
|
|
|
|
||||||||||||||||||||||||
| Other |
|
|
|
|
|
||||||||||||||||||||||||
| Total | $ |
|
$ |
|
$ |
|
$ |
|
$ |
|
|||||||||||||||||||
| December 31, 2019 | |||||||||||||||||||||||||||||
| Securities sold under agreements to repurchase | $ |
|
$ |
|
$ |
|
$ |
|
$ |
|
|||||||||||||||||||
| Securities loaned |
|
|
|
|
|
||||||||||||||||||||||||
| Other |
|
|
|
|
|
||||||||||||||||||||||||
| Total | $ |
|
$ |
|
$ |
|
$ |
|
$ |
|
|||||||||||||||||||
(1)
No
agreements have maturities greater than
three years
.
| Class of Collateral Pledged | |||||||||||||||||||||||
| Securities Sold Under Agreements to Repurchase |
Securities
Loaned |
Other | Total | ||||||||||||||||||||
| (Dollars in millions) | September 30, 2020 | ||||||||||||||||||||||
| U.S. government and agency securities | $ |
|
$ |
|
$ |
|
$ |
|
|||||||||||||||
| Corporate securities, trading loans and other |
|
|
|
|
|||||||||||||||||||
| Equity securities |
|
|
|
|
|||||||||||||||||||
| Non-U.S. sovereign debt |
|
|
|
|
|||||||||||||||||||
| Mortgage trading loans and ABS |
|
|
|
|
|||||||||||||||||||
| Total | $ |
|
$ |
|
$ |
|
$ |
|
|||||||||||||||
| December 31, 2019 | |||||||||||||||||||||||
| U.S. government and agency securities | $ |
|
$ |
|
$ |
|
$ |
|
|||||||||||||||
| Corporate securities, trading loans and other |
|
|
|
|
|||||||||||||||||||
| Equity securities |
|
|
|
|
|||||||||||||||||||
| Non-U.S. sovereign debt |
|
|
|
|
|||||||||||||||||||
| Mortgage trading loans and ABS |
|
|
|
|
|||||||||||||||||||
| Total | $ |
|
$ |
|
$ |
|
$ |
|
|||||||||||||||
|
Bank of America
84
|
||||||||
Restricted Cash
At September 30, 2020 and December 31, 2019, the Corporation held restricted cash included within cash and cash equivalents on the Consolidated Balance Sheet of $
6.5
billion and $
24.4
billion, predominantly related to cash held on deposit with the Federal Reserve Bank and non-U.S. central banks to meet reserve requirements and cash segregated in compliance with securities regulations.
NOTE 10
Commitments and Contingencies
In the normal course of business, the Corporation enters into a number of off-balance sheet commitments. These commitments expose the Corporation to varying degrees of credit and market risk and are subject to the same credit and market risk limitation reviews as those instruments recorded on the Consolidated Balance Sheet. For more information on commitments and contingencies, see
Note 13 – Commitments and Contingencies
to the Consolidated Financial Statements of the Corporation’s 2019 Annual Report on Form 10-K.
Credit Extension Commitments
The Corporation enters into commitments to extend credit such as loan commitments, SBLCs and commercial letters of credit to meet the financing needs of its customers. The following table includes the notional amount of unfunded legally binding lending commitments net of amounts distributed (i.e.,
syndicated or participated) to other financial institutions. The distributed amounts were $
10.3
billion and $
10.6
billion at September 30, 2020 and December 31, 2019. At September 30, 2020, the carrying value of these commitments, excluding commitments accounted for under the fair value option, was $
1.9
billion, including deferred revenue of $
17
million and a reserve for unfunded lending commitments of $
1.9
billion. At December 31, 2019, the comparable amounts were $
829
million, $
16
million and $
813
million, respectively. The carrying value of these commitments is classified in accrued expenses and other liabilities on the Consolidated Balance Sheet.
Legally binding commitments to extend credit generally have specified rates and maturities. Certain of these commitments have adverse change clauses that help to protect the Corporation against deterioration in the borrower’s ability to pay.
| Credit Extension Commitments | |||||||||||||||||||||||||||||
|
Expire in One
Year or Less |
Expire After One
Year Through Three Years |
Expire After Three Years Through
Five Years |
Expire After
Five Years |
Total | |||||||||||||||||||||||||
| (Dollars in millions) | September 30, 2020 | ||||||||||||||||||||||||||||
| Notional amount of credit extension commitments | |||||||||||||||||||||||||||||
|
Loan commitments
(1)
|
$ |
|
$ |
|
$ |
|
$ |
|
$ |
|
|||||||||||||||||||
| Home equity lines of credit |
|
|
|
|
|
||||||||||||||||||||||||
|
Standby letters of credit and financial guarantees
(2)
|
|
|
|
|
|
||||||||||||||||||||||||
|
Letters of credit
(3)
|
|
|
|
|
|
||||||||||||||||||||||||
| Legally binding commitments |
|
|
|
|
|
||||||||||||||||||||||||
|
Credit card lines
(4)
|
|
|
|
|
|
||||||||||||||||||||||||
| Total credit extension commitments | $ |
|
$ |
|
$ |
|
$ |
|
$ |
|
|||||||||||||||||||
| December 31, 2019 | |||||||||||||||||||||||||||||
| Notional amount of credit extension commitments | |||||||||||||||||||||||||||||
|
Loan commitments
(1)
|
$ |
|
$ |
|
$ |
|
$ |
|
$ |
|
|||||||||||||||||||
| Home equity lines of credit |
|
|
|
|
|
||||||||||||||||||||||||
|
Standby letters of credit and financial guarantees
(2)
|
|
|
|
|
|
||||||||||||||||||||||||
|
Letters of credit
(3)
|
|
|
|
|
|
||||||||||||||||||||||||
| Legally binding commitments |
|
|
|
|
|
||||||||||||||||||||||||
|
Credit card lines
(4)
|
|
|
|
|
|
||||||||||||||||||||||||
| Total credit extension commitments | $ |
|
$ |
|
$ |
|
$ |
|
$ |
|
|||||||||||||||||||
(1)
At both September 30, 2020 and December 31, 2019, $
5.1
billion of these loan commitments were held in the form of a security.
(2)
The notional amounts of SBLCs and financial guarantees classified as investment grade and non-investment grade based on the credit quality of the underlying reference name within the instrument were $
25.4
billion and $
10.5
billion at September 30, 2020, and $
27.9
billion and $
8.6
billion at December 31, 2019. Amounts in the table include consumer SBLCs of $
521
million and $
413
million at September 30, 2020 and December 31, 2019.
(3)
At September 30, 2020 and December 31, 2019, included are letters of credit of $
1.7
billion and $
1.4
billion related to certain liquidity commitments of VIEs. For more information, see
Note 6 – Securitizations and Other Variable Interest Entities
.
Other Commitments
At September 30, 2020 and December 31, 2019, the Corporation had commitments to purchase loans (e.g., residential mortgage and commercial real estate) of $
169
million and $
86
million, which upon settlement will be included in trading account assets, loans or LHFS, and commitments to purchase commercial loans of $
365
million and $
1.1
billion, which upon settlement will be included in trading account assets.
At September 30, 2020 and December 31, 2019, the Corporation had commitments to purchase commodities, primarily liquefied natural gas, of $
539
million and $
830
million, which upon settlement will be included in trading account assets.
At September 30, 2020 and December 31, 2019, the Corporation had commitments to enter into resale and forward-dated resale and securities borrowing agreements of $
127.7
billion and $
97.2
billion, and commitments to enter into forward-dated repurchase and securities lending agreements of $
68.7
|
85
Bank of America
|
||||||||
billion and $
24.9
billion. These commitments generally expire within the next 12 months.
At September 30, 2020 and December 31, 2019, the Corporation had a commitment to originate or purchase up to $
3.8
billion and $
3.3
billion on a rolling 12-month basis, of auto loans and leases from a strategic partner. This commitment extends through November 2022 and can be terminated with
12
months prior notice.
Other Guarantees
Bank-owned Life Insurance Book Value Protection
The Corporation sells products that offer book value protection to insurance carriers who offer group life insurance policies to corporations, primarily banks. At September 30, 2020 and December 31, 2019, the notional amount of these guarantees totaled $
7.1
billion and $
7.3
billion. At both September 30, 2020 and December 31, 2019, the Corporation’s maximum exposure related to these guarantees totaled $
1.1
billion, with estimated maturity dates between 2033 and 2039.
Merchant Services
Prior to July 1, 2020, a significant portion of the Corporation's merchant processing activity was performed by a joint venture in which it held a
49
percent ownership interest. On July 29, 2019, the Corporation gave notice to the joint venture partner of the termination of the joint venture upon the conclusion of its current term on June 30, 2020. Effective July 1, 2020, the Corporation received its share of the joint venture's merchant contracts and began performing merchant processing services for these merchants. While merchants bear responsibility for any credit or debit card charges properly reversed by the cardholder, the Corporation, in its role as merchant acquirer, may be held liable for any reversed charges that cannot be collected from the merchants due to, among other things, merchant fraud or insolvency.
The Corporation, as a card network member bank, also sponsors other merchant acquirers, principally its former joint venture partner with respect to merchants distributed to that partner upon the termination of the joint venture. If reversed charges applicable to these merchants cannot be collected from either the merchants or merchant acquirers, the Corporation may be held liable for these reversed charges. The Corporation’s risk in this area primarily relates to circumstances where a cardholder has purchased goods or services for future delivery. The Corporation mitigates this risk by requiring cash deposits, guarantees, letters of credit or other types of collateral from certain merchants. The total amount of transactions processed for the preceding six-month period, which was $
311.7
billion, is an estimate of the Corporation’s maximum potential exposure as of September 30, 2020. However, for the reasons described above, the Corporation does not believe the maximum potential exposure is representative of the actual potential loss exposure. At September 30, 2020 and 2019, the Corporation’s reserves for contingent losses and the losses incurred related to the merchant processing activity were not significant. The Corporation will continue to monitor its exposure in this area due to the potential economic impacts of COVID-19.
Representations and Warranties Obligations and Corporate Guarantees
For more information on representations and warranties obligations and corporate guarantees, see
Note 13 – Commitments and Contingencies
to the Consolidated Financial Statements of the Corporation’s 2019 Annual Report on Form 10-K.
The reserve for representations and warranties obligations and corporate guarantees was $
1.4
billion and $
1.8
billion at September 30, 2020 and December 31, 2019 and is included in accrued expenses and other liabilities on the Consolidated Balance Sheet and the related provision is included in other income in the Consolidated Statement of Income. The representations and warranties reserve represents the Corporation’s best estimate of probable incurred losses, is based on our experience in previous negotiations, and is subject to judgment, a variety of assumptions, and known or unknown uncertainties. Future representations and warranties losses may occur in excess of the amounts recorded for these exposures; however, the Corporation does not expect such amounts to be material to the Corporation's financial condition and liquidity. See Litigation and Regulatory Matters below for the Corporation's combined range of possible loss in excess of the reserve for representations and warranties and the accrued liability for litigation.
Fixed Income Clearing Corporation Sponsored Member Repo Program
The Corporation acts as a sponsoring member in a repo program whereby the Corporation clears certain eligible resale and repurchase agreements through the Government Securities Division of the Fixed Income Clearing Corporation on behalf of clients that are sponsored members in accordance with the Fixed Income Clearing Corporation’s rules. As part of this program, the Corporation guarantees the payment and performance of its sponsored members to the Fixed Income Clearing Corporation. The Corporation’s guarantee obligation is secured by a security interest in cash or high-quality securities collateral placed by clients with the clearinghouse and therefore, the potential for the Corporation to incur significant losses under this arrangement is remote. The Corporation’s maximum potential exposure, without taking into consideration the related collateral, was $
8.0
billion and $
9.3
billion at September 30, 2020 and December 31, 2019.
Other Guarantees
The Corporation has entered into additional guarantee agreements and commitments, including sold risk participation swaps, liquidity facilities, lease-end obligation agreements, partial credit guarantees on certain leases, real estate joint venture guarantees, divested business commitments and sold put options that require gross settlement. The maximum potential future payments under these agreements are approximately $
9.0
billion and $
8.7
billion at September 30, 2020 and December 31, 2019. The estimated maturity dates of these obligations extend up to 2049. The Corporation has made no material payments under these guarantees. For more information on maximum potential future payments under VIE-related liquidity commitments, see
Note 6 – Securitizations and Other Variable Interest Entities
.
|
Bank of America
86
|
||||||||
In the normal course of business, the Corporation periodically guarantees the obligations of its affiliates in a variety of transactions including ISDA-related transactions and non-ISDA related transactions such as commodities trading, repurchase agreements, prime brokerage agreements and other transactions.
Guarantees of Certain Long-term Debt
The Corporation, as the parent company, fully and unconditionally guarantees the securities issued by BofA Finance LLC, a
100
percent owned finance subsidiary of the Corporation, and effectively provides for the full and unconditional guarantee of trust securities issued by certain statutory trust companies that are
100
percent owned finance subsidiaries of the Corporation.
Litigation and Regulatory Matters
The following disclosure supplements the disclosure in
Note 13 – Commitments and Contingencies
to the Consolidated Financial Statements of the Corporation’s 2019 Annual Report on Form 10-K (the prior commitments and contingencies disclosure).
In the ordinary course of business, the Corporation and its subsidiaries are routinely defendants in or parties to many pending and threatened legal, regulatory and governmental actions and proceedings. In view of the inherent difficulty of predicting the outcome of such matters, particularly where the claimants seek very large or indeterminate damages or where the matters present novel legal theories or involve a large number of parties, the Corporation generally cannot predict the eventual outcome of the pending matters, the timing of the ultimate resolution of these matters, or any eventual loss, fines or penalties related to each pending matter.
In accordance with applicable accounting guidance, the Corporation establishes an accrued liability when those matters present loss contingencies that are both probable and estimable. In such cases, there may be an exposure to loss in excess of any amounts accrued. As a matter develops, the Corporation, in conjunction with any outside counsel handling the matter, evaluates on an ongoing basis whether such matter presents a loss contingency that is probable and estimable. Once the loss contingency is deemed to be both probable and estimable, the Corporation will establish an accrued liability and record a corresponding amount of litigation-related expense. The Corporation continues to monitor the matter for further developments that could affect the amount of the accrued liability that has been previously established. Excluding expenses of internal and external legal service providers, litigation-related expense of $
636
million and $
717
million was recognized for the three and nine months ended September 30, 2020 compared to $
352
million and $
539
million for the same periods in 2019.
For a limited number of the matters disclosed in the prior commitments and contingencies disclosure, for which a loss, whether in excess of a related accrued liability or where there is no accrued liability, is reasonably possible in future periods, the Corporation is able to estimate a range of possible loss. In determining whether it is possible to estimate a range of possible loss, the Corporation reviews and evaluates these matters on an ongoing basis, in conjunction with any outside counsel handling the matter, in light of potentially relevant factual and legal developments. With respect to such matters, in cases in which the Corporation possesses sufficient appropriate information to estimate a range of possible loss, that estimate is aggregated and disclosed below. There may be other disclosed matters for which a loss is probable or
reasonably possible but such an estimate of the range of possible loss may not be possible. For those disclosed matters where an estimate of the range of possible loss is possible, as well as for representations and warranties exposures, management currently estimates the aggregate range of reasonably possible loss for these exposures is $
0
to $
1.3
billion in excess of the accrued liability, if any.
The estimated range of possible loss, as well as the Corporation's accrued liability, is based upon currently available information and is subject to significant judgment, a variety of assumptions and known and unknown uncertainties. The matters underlying the estimated range of possible loss and liability accrual are unpredictable and will change from time to time, and actual losses may vary significantly from the current estimate or accrual. Therefore, this estimated range of possible loss represents what the Corporation believes to be an estimate of possible loss only for certain matters meeting these criteria. It does not represent the Corporation’s maximum loss exposure.
Information is provided in the prior commitments and contingencies disclosure regarding the nature of the litigation and, where specified, associated claimed damages. Based on current knowledge, and taking into account accrued liabilities, management does not believe that loss contingencies arising from pending matters in the prior commitments and contingencies disclosure will have a material adverse effect on the consolidated financial condition or liquidity of the Corporation. However, in light of the significant judgment, variety of assumptions and uncertainties involved in these matters, some of which are beyond the Corporation’s control, and the very large or indeterminate damages sought in some of these matters, an adverse outcome in one or more of these matters could be material to the Corporation’s businesses or results of operations for any particular reporting period, or cause significant reputational harm.
NOTE 11
Shareholders’ Equity
Common Stock
|
Declared Quarterly Cash Dividends on Common Stock
(1)
|
||||||||||||||||||||
| Declaration Date | Record Date | Payment Date | Dividend Per Share | |||||||||||||||||
| October 21, 2020 | December 4, 2020 | December 24, 2020 | $ |
|
||||||||||||||||
| July 22, 2020 | September 4, 2020 | September 25, 2020 |
|
|||||||||||||||||
| April 22, 2020 | June 5, 2020 | June 26, 2020 |
|
|||||||||||||||||
| January 29, 2020 | March 6, 2020 | March 27, 2020 |
|
|||||||||||||||||
(1)
In 2020, and through October 30, 2020.
In June 2020, the Board of Governors of the Federal Reserve System (Federal Reserve) announced that due to economic uncertainty resulting from COVID-19, all large banks would be required to suspend share repurchase programs in the third quarter of 2020, except for repurchases to offset shares awarded under equity-based compensation plans, and to limit dividends to existing rates that do not exceed the average of the last four quarters’ net income.
The Federal Reserve’s directives regarding share repurchases aligned with the Corporation's decision to voluntarily suspend repurchases during the first half of 2020. The suspension of the Corporation's repurchases did not include repurchases to offset shares awarded under its equity-based compensation plans.
|
87
Bank of America
|
||||||||
During the three and nine months ended September 30, 2020, the Corporation repurchased and retired
4
million and
216
million shares of common stock, which reduced shareholders’ equity by $
114
million and $
6.8
billion.
During the nine months ended September 30, 2020, in connection with employee stock plans, the Corporation issued
66
million shares of its common stock and, to satisfy tax withholding obligations, repurchased
26
million shares of its common stock.
At September 30, 2020, the Corporation had reserved
513
million unissued shares of common stock for future issuances under employee stock plans, convertible notes and preferred stock.
On October 21, 2020 the Board declared a quarterly common stock dividend at the current rate of $
0.18
per share.
Preferred Stock
During the three months ended March 31, 2020, June 30, 2020 and September 30, 2020, the Corporation declared $
469
million, $
249
million and $
441
million of cash dividends on preferred stock, or a total of $
1.2
billion for the nine months ended September 30, 2020. On October 29, 2020, the
NOTE 12
Earnings Per Common Share
| Three Months Ended September 30 | Nine Months Ended September 30 | ||||||||||||||||||||||
| (In millions, except per share information) | 2020 | 2019 | 2020 | 2019 | |||||||||||||||||||
| Earnings per common share | |||||||||||||||||||||||
| Net income | $ |
|
$ |
|
$ |
|
$ |
|
|||||||||||||||
| Preferred stock dividends |
(
|
(
|
(
|
(
|
|||||||||||||||||||
| Net income applicable to common shareholders | $ |
|
$ |
|
$ |
|
$ |
|
|||||||||||||||
| Average common shares issued and outstanding |
|
|
|
|
|||||||||||||||||||
| Earnings per common share | $ |
|
$ |
|
$ |
|
$ |
|
|||||||||||||||
| Diluted earnings per common share | |||||||||||||||||||||||
| Net income applicable to common shareholders | $ |
|
$ |
|
$ |
|
$ |
|
|||||||||||||||
| Average common shares issued and outstanding |
|
|
|
|
|||||||||||||||||||
|
Dilutive potential common shares
(1)
|
|
|
|
|
|||||||||||||||||||
| Total diluted average common shares issued and outstanding |
|
|
|
|
|||||||||||||||||||
| Diluted earnings per common share | $ |
|
$ |
|
$ |
|
$ |
|
|||||||||||||||
(1)
Includes incremental dilutive shares from restricted stock units, restricted stock and warrants.
For both the three and nine months ended September 30, 2020 and 2019,
62
million average dilutive potential common shares associated with the Series L preferred stock were not included in the diluted share count because the result would have been antidilutive under the “if-converted” method.
NOTE 13
Accumulated Other Comprehensive Income (Loss)
The table below presents the changes in accumulated OCI after-tax for the nine months ended September 30, 2020 and 2019.
| (Dollars in millions) | Debt Securities | Debit Valuation Adjustments | Derivatives |
Employee
Benefit Plans |
Foreign
Currency |
Total | |||||||||||||||||||||||||||||
| Balance, December 31, 2019 | $ |
|
$ |
(
|
$ |
(
|
$ |
(
|
$ |
(
|
$ |
(
|
|||||||||||||||||||||||
| Net change |
|
(
|
|
|
(
|
|
|||||||||||||||||||||||||||||
| Balance, September 30, 2020 | $ |
|
$ |
(
|
$ |
|
$ |
(
|
$ |
(
|
$ |
(
|
|||||||||||||||||||||||
| Balance, December 31, 2018 | $ |
(
|
$ |
(
|
$ |
(
|
$ |
(
|
$ |
(
|
$ |
(
|
|||||||||||||||||||||||
| Net change |
|
(
|
|
|
(
|
|
|||||||||||||||||||||||||||||
| Balance, September 30, 2019 | $ |
|
$ |
(
|
$ |
(
|
$ |
(
|
$ |
(
|
$ |
(
|
|||||||||||||||||||||||
|
Bank of America
88
|
||||||||
The table below presents the net change in fair value recorded in accumulated OCI, net realized gains and losses reclassified into earnings and other changes for each component of OCI pre- and after-tax for the nine months ended September 30, 2020 and 2019.
| Pretax |
Tax
effect |
After-
tax |
Pretax |
Tax
effect |
After-
tax |
||||||||||||||||||||||||||||||
| Nine Months Ended September 30 | |||||||||||||||||||||||||||||||||||
| (Dollars in millions) | 2020 | 2019 | |||||||||||||||||||||||||||||||||
| Debt securities: | |||||||||||||||||||||||||||||||||||
|
Net increase in fair value
|
$ |
|
$ |
(
|
$ |
|
$ |
|
$ |
(
|
$ |
|
|||||||||||||||||||||||
|
Net realized (gains) reclassified into earnings
(1)
|
(
|
|
(
|
(
|
|
(
|
|||||||||||||||||||||||||||||
| Net change |
|
(
|
|
|
(
|
|
|||||||||||||||||||||||||||||
| Debit valuation adjustments: | |||||||||||||||||||||||||||||||||||
| Net (decrease) in fair value |
(
|
|
(
|
(
|
|
(
|
|||||||||||||||||||||||||||||
|
Net realized losses reclassified into earnings
(1)
|
|
(
|
|
|
(
|
|
|||||||||||||||||||||||||||||
| Net change |
(
|
|
(
|
(
|
|
(
|
|||||||||||||||||||||||||||||
| Derivatives: | |||||||||||||||||||||||||||||||||||
| Net increase in fair value |
|
(
|
|
|
(
|
|
|||||||||||||||||||||||||||||
|
Reclassifications into earnings:
|
|||||||||||||||||||||||||||||||||||
| Net interest income |
|
(
|
|
|
(
|
|
|||||||||||||||||||||||||||||
| Compensation and benefits expense |
(
|
|
(
|
|
|
|
|||||||||||||||||||||||||||||
| Net realized losses reclassified into earnings |
|
(
|
|
|
(
|
|
|||||||||||||||||||||||||||||
| Net change |
|
(
|
|
|
(
|
|
|||||||||||||||||||||||||||||
| Employee benefit plans: | |||||||||||||||||||||||||||||||||||
|
Net actuarial losses and other reclassified into earnings
(2)
|
|
(
|
|
|
(
|
|
|||||||||||||||||||||||||||||
| Net change |
|
(
|
|
|
(
|
|
|||||||||||||||||||||||||||||
| Foreign currency: | |||||||||||||||||||||||||||||||||||
| Net (decrease) in fair value |
(
|
(
|
(
|
|
(
|
(
|
|||||||||||||||||||||||||||||
|
Net realized (gains) reclassified into earnings
(1)
|
|
— |
|
(
|
|
(
|
|||||||||||||||||||||||||||||
| Net change |
(
|
(
|
(
|
(
|
(
|
(
|
|||||||||||||||||||||||||||||
| Total other comprehensive income (loss) | $ |
|
$ |
(
|
$ |
|
$ |
|
$ |
(
|
$ |
|
|||||||||||||||||||||||
(1)
Reclassifications of pretax debt securities, DVA and foreign currency (gains) losses are recorded in other income in the Consolidated Statement of Income.
(2)
Reclassifications of pretax employee benefit plan costs are recorded in other general operating expense in the Consolidated Statement of Income.
NOTE 14
Fair Value Measurements
marketplace. During the nine months ended September 30, 2020, there were no changes to valuation approaches or techniques that had, or are expected to have, a material impact on the Corporation’s consolidated financial position or results of operations.
For more information regarding the fair value hierarchy, how the Corporation measures fair value and valuation techniques, see
Note 1 – Summary of Significant Accounting Principles
and
Note 21 – Fair Value Measurements
to the Consolidated Financial Statements of the Corporation’s 2019 Annual Report on Form 10-K. The Corporation accounts for certain financial instruments under the fair value option. For more information, see
Note 15 – Fair Value Option
.
|
89
Bank of America
|
||||||||
Recurring Fair Value
Assets and liabilities carried at fair value on a recurring basis at September 30, 2020 and December 31, 2019, including financial instruments that the Corporation accounts for under the fair value option, are summarized in the following tables.
| September 30, 2020 | |||||||||||||||||||||||||||||
| Fair Value Measurements | |||||||||||||||||||||||||||||
| (Dollars in millions) | Level 1 | Level 2 | Level 3 |
Netting Adjustments
(1)
|
Assets/Liabilities at Fair Value | ||||||||||||||||||||||||
| Assets | |||||||||||||||||||||||||||||
|
Time deposits placed and other short-term investments
|
$ |
|
$ |
|
$ |
|
$ | — | $ |
|
|||||||||||||||||||
|
Federal funds sold and securities borrowed or purchased under agreements to resell
|
|
|
|
— |
|
||||||||||||||||||||||||
| Trading account assets: | |||||||||||||||||||||||||||||
| U.S. Treasury and agency securities |
|
|
|
— |
|
||||||||||||||||||||||||
| Corporate securities, trading loans and other |
|
|
|
— |
|
||||||||||||||||||||||||
| Equity securities |
|
|
|
— |
|
||||||||||||||||||||||||
| Non-U.S. sovereign debt |
|
|
|
— |
|
||||||||||||||||||||||||
| Mortgage trading loans, MBS and ABS: | |||||||||||||||||||||||||||||
|
U.S. government-sponsored agency guaranteed
(2)
|
|
|
|
— |
|
||||||||||||||||||||||||
| Mortgage trading loans, ABS and other MBS |
|
|
|
— |
|
||||||||||||||||||||||||
|
Total trading account assets
(3)
|
|
|
|
— |
|
||||||||||||||||||||||||
| Derivative assets |
|
|
|
(
|
|
||||||||||||||||||||||||
| AFS debt securities: | |||||||||||||||||||||||||||||
| U.S. Treasury and agency securities |
|
|
|
— |
|
||||||||||||||||||||||||
| Mortgage-backed securities: | |||||||||||||||||||||||||||||
| Agency |
|
|
|
— |
|
||||||||||||||||||||||||
| Agency-collateralized mortgage obligations |
|
|
|
— |
|
||||||||||||||||||||||||
| Non-agency residential |
|
|
|
— |
|
||||||||||||||||||||||||
| Commercial |
|
|
|
— |
|
||||||||||||||||||||||||
| Non-U.S. securities |
|
|
|
— |
|
||||||||||||||||||||||||
| Other taxable securities |
|
|
|
— |
|
||||||||||||||||||||||||
| Tax-exempt securities |
|
|
|
— |
|
||||||||||||||||||||||||
| Total AFS debt securities |
|
|
|
— |
|
||||||||||||||||||||||||
| Other debt securities carried at fair value: | |||||||||||||||||||||||||||||
| U.S. Treasury and agency securities |
|
|
|
— |
|
||||||||||||||||||||||||
| Non-agency residential MBS |
|
|
|
— |
|
||||||||||||||||||||||||
|
Non-U.S. and other securities
|
|
|
|
— |
|
||||||||||||||||||||||||
| Total other debt securities carried at fair value |
|
|
|
— |
|
||||||||||||||||||||||||
| Loans and leases |
|
|
|
— |
|
||||||||||||||||||||||||
| Loans held-for-sale |
|
|
|
— |
|
||||||||||||||||||||||||
|
Other assets
(4)
|
|
|
|
— |
|
||||||||||||||||||||||||
|
Total assets
(5)
|
$ |
|
$ |
|
$ |
|
$ |
(
|
$ |
|
|||||||||||||||||||
| Liabilities | |||||||||||||||||||||||||||||
| Interest-bearing deposits in U.S. offices | $ |
|
$ |
|
$ |
|
$ | — | $ |
|
|||||||||||||||||||
|
Federal funds purchased and securities loaned or sold under agreements to repurchase
|
|
|
|
— |
|
||||||||||||||||||||||||
| Trading account liabilities: | |||||||||||||||||||||||||||||
| U.S. Treasury and agency securities |
|
|
|
— |
|
||||||||||||||||||||||||
| Equity securities |
|
|
|
— |
|
||||||||||||||||||||||||
| Non-U.S. sovereign debt |
|
|
|
— |
|
||||||||||||||||||||||||
| Corporate securities and other |
|
|
|
— |
|
||||||||||||||||||||||||
| Total trading account liabilities |
|
|
|
— |
|
||||||||||||||||||||||||
| Derivative liabilities |
|
|
|
(
|
|
||||||||||||||||||||||||
| Short-term borrowings |
|
|
|
— |
|
||||||||||||||||||||||||
| Accrued expenses and other liabilities |
|
|
|
— |
|
||||||||||||||||||||||||
| Long-term debt |
|
|
|
— |
|
||||||||||||||||||||||||
|
Total liabilities
(5)
|
$ |
|
$ |
|
$ |
|
$ |
(
|
$ |
|
|||||||||||||||||||
(1)
Amounts represent the impact of legally enforceable master netting agreements and also cash collateral held or placed with the same counterparties.
(2)
Includes $
21.5
billion of GSE obligations.
(3)
Includes securities with a fair value of $
13.6
billion that were segregated in compliance with securities regulations or deposited with clearing organizations. This amount is included in the parenthetical disclosure on the Consolidated Balance Sheet.
(4)
Includes MSRs of $
1.1
billion
which are classified as Level 3 assets.
(5)
Total recurring Level 3 assets were
0.40
percent of total consolidated assets, and total recurring Level 3 liabilities were
0.28
percent of total consolidated liabilities.
|
Bank of America
90
|
||||||||
| December 31, 2019 | |||||||||||||||||||||||||||||
| Fair Value Measurements | |||||||||||||||||||||||||||||
| (Dollars in millions) | Level 1 | Level 2 | Level 3 |
Netting Adjustments
(1)
|
Assets/Liabilities at Fair Value | ||||||||||||||||||||||||
| Assets | |||||||||||||||||||||||||||||
|
Time deposits placed and other short-term investments
|
$ |
|
$ |
|
$ |
|
$ | — | $ |
|
|||||||||||||||||||
|
Federal funds sold and securities borrowed or purchased under agreements to resell
|
|
|
|
— |
|
||||||||||||||||||||||||
| Trading account assets: | |||||||||||||||||||||||||||||
| U.S. Treasury and agency securities |
|
|
|
— |
|
||||||||||||||||||||||||
| Corporate securities, trading loans and other |
|
|
|
— |
|
||||||||||||||||||||||||
| Equity securities |
|
|
|
— |
|
||||||||||||||||||||||||
| Non-U.S. sovereign debt |
|
|
|
— |
|
||||||||||||||||||||||||
| Mortgage trading loans, MBS and ABS: | |||||||||||||||||||||||||||||
|
U.S. government-sponsored agency guaranteed
(2)
|
|
|
|
— |
|
||||||||||||||||||||||||
| Mortgage trading loans, ABS and other MBS |
|
|
|
— |
|
||||||||||||||||||||||||
|
Total trading account assets
(3)
|
|
|
|
— |
|
||||||||||||||||||||||||
| Derivative assets |
|
|
|
(
|
|
||||||||||||||||||||||||
| AFS debt securities: | |||||||||||||||||||||||||||||
| U.S. Treasury and agency securities |
|
|
|
— |
|
||||||||||||||||||||||||
| Mortgage-backed securities: | |||||||||||||||||||||||||||||
| Agency |
|
|
|
— |
|
||||||||||||||||||||||||
| Agency-collateralized mortgage obligations |
|
|
|
— |
|
||||||||||||||||||||||||
| Non-agency residential |
|
|
|
— |
|
||||||||||||||||||||||||
| Commercial |
|
|
|
— |
|
||||||||||||||||||||||||
| Non-U.S. securities |
|
|
|
— |
|
||||||||||||||||||||||||
| Other taxable securities |
|
|
|
— |
|
||||||||||||||||||||||||
| Tax-exempt securities |
|
|
|
— |
|
||||||||||||||||||||||||
| Total AFS debt securities |
|
|
|
— |
|
||||||||||||||||||||||||
| Other debt securities carried at fair value: | |||||||||||||||||||||||||||||
| U.S. Treasury and agency securities |
|
|
|
— |
|
||||||||||||||||||||||||
| Agency MBS |
|
|
|
— |
|
||||||||||||||||||||||||
| Non-agency residential MBS |
|
|
|
— |
|
||||||||||||||||||||||||
| Non-U.S. and other securities |
|
|
|
— |
|
||||||||||||||||||||||||
| Total other debt securities carried at fair value |
|
|
|
— |
|
||||||||||||||||||||||||
| Loans and leases |
|
|
|
— |
|
||||||||||||||||||||||||
| Loans held-for-sale |
|
|
|
— |
|
||||||||||||||||||||||||
|
Other assets
(4)
|
|
|
|
— |
|
||||||||||||||||||||||||
|
Total assets
(5)
|
$ |
|
$ |
|
$ |
|
$ |
(
|
$ |
|
|||||||||||||||||||
| Liabilities | |||||||||||||||||||||||||||||
| Interest-bearing deposits in U.S. offices | $ |
|
$ |
|
$ |
|
$ | — | $ |
|
|||||||||||||||||||
|
Federal funds purchased and securities loaned or sold under agreements to repurchase
|
|
|
|
— |
|
||||||||||||||||||||||||
| Trading account liabilities: | |||||||||||||||||||||||||||||
| U.S. Treasury and agency securities |
|
|
|
— |
|
||||||||||||||||||||||||
| Equity securities |
|
|
|
— |
|
||||||||||||||||||||||||
| Non-U.S. sovereign debt |
|
|
|
— |
|
||||||||||||||||||||||||
| Corporate securities and other |
|
|
|
— |
|
||||||||||||||||||||||||
| Total trading account liabilities |
|
|
|
— |
|
||||||||||||||||||||||||
| Derivative liabilities |
|
|
|
(
|
|
||||||||||||||||||||||||
| Short-term borrowings |
|
|
|
— |
|
||||||||||||||||||||||||
| Accrued expenses and other liabilities |
|
|
|
— |
|
||||||||||||||||||||||||
| Long-term debt |
|
|
|
— |
|
||||||||||||||||||||||||
|
Total liabilities
(5)
|
$ |
|
$ |
|
$ |
|
$ |
(
|
$ |
|
|||||||||||||||||||
(1)
Amounts represent the impact of legally enforceable master netting agreements and also cash collateral held or placed with the same counterparties.
(2)
Includes $
26.7
billion of GSE obligations.
(3)
Includes securities with a fair value of $
14.7
billion that were segregated in compliance with securities regulations or deposited with clearing organizations. This amount is included in the parenthetical disclosure on the Consolidated Balance Sheet.
(4)
Includes MSRs of $
1.5
billion which are classified as Level 3 assets.
(5)
Total recurring Level 3 assets were
0.42
percent of total consolidated assets, and total recurring Level 3 liabilities were
0.27
percent of total consolidated liabilities.
|
91
Bank of America
|
||||||||
The following tables present a reconciliation of all assets and liabilities measured at fair value on a recurring basis using significant unobservable inputs (Level 3) during the three and nine months ended September 30, 2020 and 2019, including net realized and unrealized gains (losses) included in earnings and accumulated OCI. Transfers into Level 3 occur primarily due
to decreased price observability, and transfers out of Level 3 occur primarily due to increased price observability. Transfers occur on a regular basis for long-term debt instruments due to changes in the impact of unobservable inputs on the value of the embedded derivative in relation to the instrument as a whole.
|
Level 3 – Fair Value Measurements
(1)
|
|||||||||||||||||||||||||||||||||||
|
Balance
July 1 |
Total
Realized/Unrealized Gains
(Losses) in Net
Income
(2)
|
Gains
(Losses) in OCI (3) |
Gross |
Gross
Transfers into Level 3 |
Gross
Transfers out of Level 3 |
Balance
September 30 |
Change in Unrealized Gains (Losses) in Net Income Related to Financial Instruments Still Held
(2)
|
||||||||||||||||||||||||||||
| (Dollars in millions) | Purchases | Sales | Issuances | Settlements | |||||||||||||||||||||||||||||||
| Three Months Ended September 30, 2020 | |||||||||||||||||||||||||||||||||||
| Trading account assets: | |||||||||||||||||||||||||||||||||||
|
Corporate securities, trading loans and other
|
$ |
|
$ |
(
|
$ |
|
$ |
|
$ |
(
|
$ |
|
$ |
(
|
$ |
|
$ |
(
|
$ |
|
$ |
(
|
|||||||||||||
| Equity securities |
|
|
|
|
(
|
|
|
|
(
|
|
|
||||||||||||||||||||||||
| Non-U.S. sovereign debt |
|
|
(
|
|
(
|
|
(
|
|
(
|
|
|
||||||||||||||||||||||||
|
Mortgage trading loans, ABS and other MBS
|
|
|
|
|
(
|
|
(
|
|
(
|
|
|
||||||||||||||||||||||||
| Total trading account assets |
|
(
|
(
|
|
(
|
|
(
|
|
(
|
|
(
|
||||||||||||||||||||||||
|
Net derivative assets (liabilities)
(4)
|
(
|
|
|
|
(
|
|
(
|
|
(
|
(
|
|
||||||||||||||||||||||||
| AFS debt securities: | |||||||||||||||||||||||||||||||||||
| Non-agency residential MBS |
|
|
|
|
|
|
(
|
|
(
|
|
|
||||||||||||||||||||||||
| Non-U.S. securities |
|
|
|
|
|
|
(
|
|
|
|
|
||||||||||||||||||||||||
| Other taxable securities |
|
|
|
|
|
|
|
|
|
|
|
||||||||||||||||||||||||
| Tax-exempt securities |
|
|
|
|
|
|
(
|
|
(
|
|
|
||||||||||||||||||||||||
| Total AFS debt securities |
|
|
|
|
|
|
(
|
|
(
|
|
|
||||||||||||||||||||||||
|
Other debt securities carried at fair value – Non-agency residential MBS
|
|
|
|
|
|
|
(
|
|
|
|
|
||||||||||||||||||||||||
|
Loans and leases
(5,6)
|
|
(
|
|
|
(
|
|
(
|
|
|
|
(
|
||||||||||||||||||||||||
|
Loans held-for-sale
(5,6)
|
|
(
|
(
|
|
(
|
|
(
|
|
|
|
(
|
||||||||||||||||||||||||
|
Other assets
(6,7)
|
|
|
|
|
|
|
(
|
|
|
|
|
||||||||||||||||||||||||
|
Trading account liabilities – Equity securities
|
(
|
|
|
|
|
|
|
|
|
(
|
|
||||||||||||||||||||||||
|
Trading account liabilities – Corporate securities
and other
|
(
|
|
|
|
(
|
|
|
|
|
(
|
|
||||||||||||||||||||||||
|
Long-term debt
(5)
|
(
|
(
|
(
|
|
|
|
|
|
|
(
|
(
|
||||||||||||||||||||||||
| Three Months Ended September 30, 2019 | |||||||||||||||||||||||||||||||||||
| Trading account assets: | |||||||||||||||||||||||||||||||||||
|
Corporate securities, trading loans and other
|
$ |
|
$ |
|
$ |
|
$ |
|
$ |
(
|
$ |
|
$ |
(
|
$ |
|
$ |
(
|
$ |
|
$ |
|
|||||||||||||
| Equity securities |
|
(
|
|
|
(
|
|
(
|
|
(
|
|
(
|
||||||||||||||||||||||||
| Non-U.S. sovereign debt |
|
|
(
|
|
|
|
(
|
|
|
|
|
||||||||||||||||||||||||
|
Mortgage trading loans, ABS and other MBS
|
|
(
|
|
|
(
|
|
(
|
|
(
|
|
(
|
||||||||||||||||||||||||
| Total trading account assets |
|
|
(
|
|
(
|
|
(
|
|
(
|
|
(
|
||||||||||||||||||||||||
|
Net derivative assets (liabilities)
(4)
|
(
|
|
|
|
(
|
|
(
|
|
|
(
|
|
||||||||||||||||||||||||
| AFS debt securities: | |||||||||||||||||||||||||||||||||||
| Non-agency residential MBS |
|
|
(
|
|
|
|
(
|
|
(
|
|
|
||||||||||||||||||||||||
| Non-U.S. securities |
|
|
|
|
|
|
|
|
|
|
|
||||||||||||||||||||||||
| Other taxable securities |
|
|
|
|
|
|
|
|
|
|
|
||||||||||||||||||||||||
| Total AFS debt securities |
|
|
(
|
|
|
|
(
|
|
(
|
|
|
||||||||||||||||||||||||
|
Other debt securities carried at fair value – Non-agency residential MBS
|
|
(
|
|
|
|
|
(
|
|
|
|
(
|
||||||||||||||||||||||||
|
Loans and leases
(5,6)
|
|
|
|
|
(
|
|
(
|
|
|
|
|
||||||||||||||||||||||||
|
Loans held-for-sale
(5,6)
|
|
|
(
|
|
|
|
(
|
|
|
|
(
|
||||||||||||||||||||||||
|
Other assets
(6,7)
|
|
(
|
(
|
|
|
|
(
|
|
|
|
(
|
||||||||||||||||||||||||
|
Trading account liabilities – Equity securities
|
(
|
|
|
|
|
|
|
|
|
(
|
|
||||||||||||||||||||||||
|
Trading account liabilities – Corporate securities
and other
|
(
|
|
|
(
|
|
|
|
|
|
(
|
(
|
||||||||||||||||||||||||
|
Long-term debt
(5)
|
(
|
|
|
(
|
|
|
|
(
|
|
(
|
|
||||||||||||||||||||||||
(1)
Assets (liabilities). For assets, increase (decrease) to Level 3 and for liabilities, (increase) decrease to Level 3.
(2)
Includes gains (losses) reported in earnings in the following income statement line items: Trading account assets/liabilities - predominantly market making and similar activities; Net derivative assets (liabilities) - market making and similar activities and other income; AFS debt securities - other income; Other debt securities carried at fair value - other income; Loans and leases - primarily other income; Loans held-for-sale - other income; Other assets - primarily other income related to MSRs; Long-term debt - market making and similar activities.
(3)
Includes unrealized gains (losses) in OCI on AFS debt securities, foreign currency translation adjustments and the impact of changes in the Corporation’s credit spreads on long-term debt accounted for under the fair value option. Amounts include net unrealized gains (losses) of $(
8
) million and $
53
million related to financial instruments still held at September 30, 2020 and 2019.
(4)
Net derivative assets (liabilities) include derivative assets of $
2.5
billion and $
3.4
billion and derivative liabilities of $
6.0
billion and $
4.6
billion at September 30, 2020 and 2019.
(5)
Amounts represent instruments that are accounted for under the fair value option.
(6)
Issuances represent loan originations and MSRs recognized following securitizations or whole-loan sales.
(7)
Settlements primarily represent the net change in fair value of the MSR asset due to the recognition of modeled cash flows and the passage of time.
|
Bank of America
92
|
||||||||
|
Level 3 – Fair Value Measurements
(1)
|
|||||||||||||||||||||||||||||||||||
|
Balance
January 1 |
Total Realized/Unrealized Gains (Losses) in Net
Income
(2)
|
Gains
(Losses) in OCI (3) |
Gross |
Gross
Transfers into Level 3 |
Gross
Transfers out of Level 3 |
Balance
September 30 |
Change in Unrealized Gains (Losses) in Net Income Related to Financial Instruments Still Held
(2)
|
||||||||||||||||||||||||||||
|
(Dollars in millions)
|
Purchases | Sales | Issuances | Settlements | |||||||||||||||||||||||||||||||
| Nine Months Ended September 30, 2020 | |||||||||||||||||||||||||||||||||||
| Trading account assets: | |||||||||||||||||||||||||||||||||||
|
Corporate securities, trading loans and other
|
$ |
|
$ |
(
|
$ |
(
|
$ |
|
$ |
(
|
$ |
|
$ |
(
|
$ |
|
$ |
(
|
$ |
|
$ |
(
|
|||||||||||||
|
Equity securities
|
|
(
|
|
|
(
|
|
|
|
(
|
|
(
|
||||||||||||||||||||||||
|
Non-U.S. sovereign debt
|
|
|
(
|
|
(
|
|
(
|
|
(
|
|
|
||||||||||||||||||||||||
|
Mortgage trading loans, ABS and other MBS
|
|
(
|
(
|
|
(
|
|
(
|
|
(
|
|
(
|
||||||||||||||||||||||||
| Total trading account assets |
|
(
|
(
|
|
(
|
|
(
|
|
(
|
|
(
|
||||||||||||||||||||||||
|
Net derivative assets (liabilities)
(4)
|
(
|
|
|
|
(
|
|
(
|
(
|
(
|
(
|
(
|
||||||||||||||||||||||||
| AFS debt securities: | |||||||||||||||||||||||||||||||||||
| Non-agency residential MBS |
|
(
|
(
|
|
|
|
(
|
|
(
|
|
(
|
||||||||||||||||||||||||
|
Non-U.S. securities
|
|
|
|
|
(
|
|
(
|
|
|
|
|
||||||||||||||||||||||||
|
Other taxable securities
|
|
|
|
|
(
|
|
|
|
|
|
|
||||||||||||||||||||||||
| Tax-exempt securities |
|
(
|
|
|
|
|
(
|
|
(
|
|
(
|
||||||||||||||||||||||||
| Total AFS debt securities |
|
(
|
(
|
|
(
|
|
(
|
|
(
|
|
(
|
||||||||||||||||||||||||
|
Other debt securities carried at fair value – Non-agency residential MBS
|
|
|
|
|
|
|
(
|
|
(
|
|
(
|
||||||||||||||||||||||||
|
Loans and leases
(5,6)
|
|
(
|
|
|
(
|
|
(
|
|
|
|
(
|
||||||||||||||||||||||||
|
Loans held-for-sale
(5,6)
|
|
(
|
(
|
|
(
|
|
(
|
|
|
|
(
|
||||||||||||||||||||||||
|
Other assets
(6,7)
|
|
(
|
(
|
|
|
|
(
|
|
(
|
|
(
|
||||||||||||||||||||||||
|
Trading account liabilities – Equity securities
|
(
|
|
|
|
|
|
|
|
|
(
|
|
||||||||||||||||||||||||
|
Trading account liabilities – Corporate securities
and other
|
(
|
|
|
(
|
(
|
|
|
|
|
(
|
|
||||||||||||||||||||||||
|
Long-term debt
(5)
|
(
|
|
|
|
|
(
|
|
(
|
|
(
|
(
|
||||||||||||||||||||||||
| Nine Months Ended September 30, 2019 | |||||||||||||||||||||||||||||||||||
| Trading account assets: | |||||||||||||||||||||||||||||||||||
|
Corporate securities, trading loans and other
|
$ |
|
$ |
|
$ |
|
$ |
|
$ |
(
|
$ |
|
$ |
(
|
$ |
|
$ |
(
|
$ |
|
$ |
|
|||||||||||||
| Equity securities |
|
|
|
|
(
|
|
(
|
|
(
|
|
(
|
||||||||||||||||||||||||
| Non-U.S. sovereign debt |
|
|
(
|
|
|
|
(
|
|
(
|
|
|
||||||||||||||||||||||||
|
Mortgage trading loans, ABS and other MBS
|
|
|
(
|
|
(
|
|
(
|
|
(
|
|
|
||||||||||||||||||||||||
| Total trading account assets |
|
|
(
|
|
(
|
|
(
|
|
(
|
|
|
||||||||||||||||||||||||
|
Net derivative assets (liabilities)
(4)
|
(
|
(
|
|
|
(
|
|
(
|
|
|
(
|
(
|
||||||||||||||||||||||||
| AFS debt securities: | |||||||||||||||||||||||||||||||||||
| Non-agency residential MBS |
|
|
|
|
|
|
(
|
|
(
|
|
|
||||||||||||||||||||||||
| Non-U.S. securities |
|
|
|
|
|
|
|
|
|
|
|
||||||||||||||||||||||||
| Other taxable securities |
|
|
|
|
|
|
(
|
|
|
|
|
||||||||||||||||||||||||
| Total AFS debt securities |
|
|
|
|
|
|
(
|
|
(
|
|
|
||||||||||||||||||||||||
|
Other debt securities carried at fair value – Non-agency residential MBS
|
|
|
|
|
|
|
(
|
|
(
|
|
|
||||||||||||||||||||||||
|
Loans and leases
(5,6)
|
|
|
|
|
(
|
|
(
|
|
|
|
|
||||||||||||||||||||||||
|
Loans held-for-sale
(5,6)
|
|
|
(
|
|
(
|
|
(
|
|
|
|
|
||||||||||||||||||||||||
|
Other assets
(6,7)
|
|
(
|
|
|
(
|
|
(
|
|
|
|
(
|
||||||||||||||||||||||||
|
Trading account liabilities – Equity securities
|
|
(
|
|
|
|
|
|
|
|
(
|
(
|
||||||||||||||||||||||||
|
Trading account liabilities – Corporate securities
and other
|
(
|
|
|
|
(
|
|
|
|
|
(
|
(
|
||||||||||||||||||||||||
|
Long-term debt
(5)
|
(
|
(
|
|
(
|
|
(
|
|
(
|
|
(
|
(
|
||||||||||||||||||||||||
(1)
Assets (liabilities). For assets, increase (decrease) to Level 3 and for liabilities, (increase) decrease to Level 3.
(2)
Includes gains (losses) reported in earnings in the following income statement line items: Trading account assets/liabilities - predominantly market making and similar activities; Net derivative assets (liabilities) - market making and similar activities and other income; AFS debt securities - other income; Other debt securities carried at fair value - other income; Loans and leases - primarily other income; Loans held-for-sale - other income; Other assets - primarily other income related to MSRs; Long-term debt - market making and similar activities.
(3)
Includes unrealized gains (losses) in OCI on AFS debt securities, foreign currency translation adjustments and the impact of changes in the Corporation’s credit spreads on long-term debt accounted for under the fair value option. Amounts include net unrealized gains (losses) of $(
47
) million and $
47
million related to financial instruments still held at September 30, 2020 and 2019.
(4)
Net derivative assets (liabilities) include derivative assets of $
2.5
billion and $
3.4
billion and derivative liabilities of $
6.0
billion and $
4.6
billion at September 30, 2020 and 2019.
(5)
Amounts represent instruments that are accounted for under the fair value option.
(6)
Issuances represent loan originations and MSRs recognized following securitizations or whole-loan sales.
(7)
Settlements primarily represent the net change in fair value of the MSR asset due to the recognition of modeled cash flows and the passage of time.
|
93
Bank of America
|
||||||||
The following tables present information about significant unobservable inputs related to the Corporation’s material categories of Level 3 financial assets and liabilities at September 30, 2020 and December 31, 2019.
| Quantitative Information about Level 3 Fair Value Measurements at September 30, 2020 | |||||||||||||||||
| (Dollars in millions) | Inputs | ||||||||||||||||
| Financial Instrument |
Fair
Value |
Valuation
Technique |
Significant Unobservable
Inputs |
Ranges of
Inputs |
Weighted Average
(1)
|
||||||||||||
|
Loans and Securities
(2)
|
|||||||||||||||||
| Instruments backed by residential real estate assets | $ |
|
Discounted cash flow, Market comparables | Yield |
|
|
% | ||||||||||
|
Trading account assets – Mortgage trading loans, ABS and other MBS
|
|
Prepayment speed |
|
|
|||||||||||||
| Loans and leases |
|
Default rate |
|
|
|||||||||||||
| Loans held-for-sale |
|
Loss severity |
|
|
% | ||||||||||||
| AFS debt securities, primarily non-agency residential |
|
Price |
$
|
$
|
|||||||||||||
| AFS debt securities – Other taxable securities |
|
||||||||||||||||
| Other debt securities carried at fair value - Non-agency residential |
|
||||||||||||||||
| Instruments backed by commercial real estate assets | $ |
|
Discounted cash
flow |
Yield |
|
|
% | ||||||||||
| Trading account assets – Corporate securities, trading loans and other |
|
Price |
$
|
$
|
|||||||||||||
| Trading account assets – Mortgage trading loans, ABS and other MBS |
|
||||||||||||||||
| Loans held-for-sale |
|
||||||||||||||||
| Commercial loans, debt securities and other | $ |
|
Discounted cash flow, Market comparables | Yield |
|
|
% | ||||||||||
|
Trading account assets – Corporate securities, trading loans and other
|
|
Prepayment speed |
|
|
% | ||||||||||||
| Trading account assets – Non-U.S. sovereign debt |
|
Default rate |
|
|
% | ||||||||||||
| Trading account assets – Mortgage trading loans, ABS and other MBS |
|
Loss severity |
|
|
% | ||||||||||||
| AFS debt securities – Tax-exempt securities |
|
Price |
$
|
$
|
|||||||||||||
| Loans and leases |
|
Long-dated equity volatilities |
|
n/a | |||||||||||||
| Loans held-for-sale |
|
||||||||||||||||
| Other assets, primarily auction rate securities | $ |
|
Discounted cash flow, Market comparables | Price |
$
|
$
|
|||||||||||
|
|
|||||||||||||||||
| MSRs | $ |
|
Discounted cash
flow |
Weighted-average life, fixed rate
(5)
|
|
|
|||||||||||
|
Weighted-average life, variable rate
(5)
|
|
|
|||||||||||||||
| Option-adjusted spread, fixed rate |
|
|
% | ||||||||||||||
| Option-adjusted spread, variable rate |
|
|
% | ||||||||||||||
| Structured liabilities | |||||||||||||||||
| Long-term debt | $ |
(
|
Discounted cash flow, Market comparables, Industry standard derivative pricing
(3)
|
Yield |
|
|
% | ||||||||||
| Equity correlation |
|
|
% | ||||||||||||||
| Long-dated equity volatilities |
|
|
% | ||||||||||||||
| Price |
$
|
$
|
|||||||||||||||
| Natural gas forward price |
$
|
$
|
|||||||||||||||
| Net derivative assets (liabilities) | |||||||||||||||||
| Credit derivatives | $ |
(
|
Discounted cash flow, Stochastic recovery correlation model | Yield |
|
n/a | |||||||||||
| Upfront points |
|
|
|||||||||||||||
| Prepayment speed |
|
|
|||||||||||||||
| Default rate |
|
n/a | |||||||||||||||
| Credit correlation |
|
|
% | ||||||||||||||
| Price |
$
|
$
|
|||||||||||||||
| Equity derivatives | $ |
(
|
Industry standard derivative pricing
(3)
|
Equity correlation |
|
|
% | ||||||||||
| Long-dated equity volatilities |
|
|
% | ||||||||||||||
| Commodity derivatives | $ |
(
|
Discounted cash flow, Industry standard derivative pricing
(3)
|
Natural gas forward price |
$
|
$
|
|||||||||||
| Correlation |
|
|
% | ||||||||||||||
| Volatilities |
|
|
% | ||||||||||||||
| Interest rate derivatives | $ |
(
|
Industry standard derivative pricing
(4)
|
Correlation (IR/IR) |
|
|
% | ||||||||||
| Correlation (FX/IR) |
|
|
% | ||||||||||||||
| Long-dated inflation rates |
-
|
|
% | ||||||||||||||
| Long-dated inflation volatilities |
|
|
% | ||||||||||||||
| Total net derivative assets (liabilities) | $ |
(
|
|||||||||||||||
(1)
For loans and securities, structured liabilities and net derivative assets (liabilities), the weighted average is calculated based upon the absolute fair value of the instruments.
(2)
The categories are aggregated based upon product type which differs from financial statement classification. The following is a reconciliation to the line items in the table on page 90: Trading account assets – Corporate securities, trading loans and other of $
1.5
billion, Trading account assets – Non-U.S. sovereign debt of $
290
million, Trading account assets – Mortgage trading loans, ABS and other MBS of $
1.6
billion, AFS debt securities of $
702
million, Other debt securities carried at fair value - Non-agency residential of $
458
million, Other assets, including MSRs, of $
1.9
billion, Loans and leases of $
625
million and LHFS of $
922
million.
(3)
Includes models such as Monte Carlo simulation and Black-Scholes.
(4)
Includes models such as Monte Carlo simulation, Black-Scholes and other methods that model the joint dynamics of interest, inflation and foreign exchange rates.
(5)
The weighted-average life is a product of changes in market rates of interest, prepayment rates and other model and cash flow assumptions.
CPR = Constant Prepayment Rate
CDR = Constant Default Rate
MMBtu = Million British thermal units
IR = Interest Rate
FX = Foreign Exchange
n/a = not applicable
|
Bank of America
94
|
||||||||
| Quantitative Information about Level 3 Fair Value Measurements at December 31, 2019 | |||||||||||||||||
| (Dollars in millions) | Inputs | ||||||||||||||||
| Financial Instrument |
Fair
Value |
Valuation
Technique |
Significant Unobservable
Inputs |
Ranges of
Inputs |
Weighted Average
(1)
|
||||||||||||
|
Loans and Securities
(2)
|
|||||||||||||||||
| Instruments backed by residential real estate assets | $ |
|
Discounted cash flow, Market comparables | Yield |
|
|
% | ||||||||||
|
Trading account assets – Mortgage trading loans, ABS and other MBS
|
|
Prepayment speed
|
|
|
|||||||||||||
| Loans and leases |
|
Default rate |
|
|
|||||||||||||
| Loans held-for-sale |
|
Loss severity |
|
|
% | ||||||||||||
| AFS debt securities, primarily non-agency residential |
|
Price |
$
|
$
|
|||||||||||||
| Other debt securities carried at fair value - Non-agency residential |
|
||||||||||||||||
| Instruments backed by commercial real estate assets | $ |
|
Discounted cash flow | Yield |
|
|
% | ||||||||||
| Trading account assets – Corporate securities, trading loans and other |
|
Price |
$
|
$
|
|||||||||||||
| Trading account assets – Mortgage trading loans, ABS and other MBS |
|
||||||||||||||||
| Loans held-for-sale |
|
||||||||||||||||
| Commercial loans, debt securities and other | $ |
|
Discounted cash flow, Market comparables | Yield |
|
|
% | ||||||||||
|
Trading account assets – Corporate securities, trading loans and other
|
|
Prepayment speed
|
|
|
% | ||||||||||||
| Trading account assets – Non-U.S. sovereign debt |
|
Default rate |
|
|
% | ||||||||||||
| Trading account assets – Mortgage trading loans, ABS and other MBS |
|
Loss severity |
|
|
% | ||||||||||||
| AFS debt securities – Tax-exempt securities |
|
Price |
$
|
$
|
|||||||||||||
| Loans and leases |
|
Long-dated equity volatilities |
|
n/a | |||||||||||||
| Loans held-for-sale |
|
||||||||||||||||
| Other assets, primarily auction rate securities | $ |
|
Discounted cash flow, Market comparables |
Price
|
$
|
$
|
|||||||||||
|
|
|||||||||||||||||
| MSRs | $ |
|
Discounted cash flow |
Weighted-average life, fixed rate
(5)
|
|
|
|||||||||||
|
Weighted-average life, variable rate
(5)
|
|
|
|||||||||||||||
| Option-adjusted spread, fixed rate |
|
|
% | ||||||||||||||
| Option-adjusted spread, variable rate |
|
|
% | ||||||||||||||
| Structured liabilities | |||||||||||||||||
| Long-term debt | $ |
(
|
Discounted cash flow, Market comparables, Industry standard derivative pricing
(3)
|
Yield |
|
|
% | ||||||||||
| Equity correlation |
|
|
% | ||||||||||||||
| Long-dated equity volatilities |
|
|
% | ||||||||||||||
| Price |
$
|
$
|
|||||||||||||||
| Natural gas forward price |
$
|
$
|
|||||||||||||||
| Net derivative assets (liabilities) | |||||||||||||||||
|
Credit derivatives
|
$ |
|
Discounted cash flow, Stochastic recovery correlation model |
Yield
|
|
n/a | |||||||||||
|
Upfront points
|
|
|
|||||||||||||||
|
Prepayment speed
|
|
|
|||||||||||||||
|
Default rate
|
|
|
|||||||||||||||
|
Loss severity
|
|
n/a | |||||||||||||||
|
Price
|
$
|
$
|
|||||||||||||||
|
Equity derivatives
|
$ |
(
|
Industry standard derivative pricing
(3)
|
Equity correlation
|
|
|
% | ||||||||||
|
Long-dated equity volatilities
|
|
|
% | ||||||||||||||
|
Commodity derivatives
|
$ |
(
|
Discounted cash flow, Industry standard derivative pricing
(3)
|
Natural gas forward price
|
$
|
$
|
|||||||||||
|
Correlation
|
|
|
% | ||||||||||||||
|
Volatilities
|
|
|
% | ||||||||||||||
|
Interest rate derivatives
|
$ |
(
|
Industry standard derivative pricing
(4)
|
Correlation (IR/IR)
|
|
|
% | ||||||||||
|
Correlation (FX/IR)
|
|
|
% | ||||||||||||||
|
Long-dated inflation rates
|
G
-
|
|
% | ||||||||||||||
|
Long-dated inflation volatilities
|
|
|
% | ||||||||||||||
| Total net derivative assets (liabilities) | $ |
(
|
|||||||||||||||
(1)
For loans and securities, structured liabilities and net derivative assets (liabilities), the weighted average is calculated based upon the absolute fair value of the instruments.
(2)
The categories are aggregated based upon product type which differs from financial statement classification. The following is a reconciliation to the line items in the table on page 91: Trading account assets – Corporate securities, trading loans and other of $
1.5
billion, Trading account assets – Non-U.S. sovereign debt of $
482
million, Trading account assets – Mortgage trading loans, ABS and other MBS of $
1.6
billion, AFS debt securities of $
599
million, Other debt securities carried at fair value - Non-agency residential of $
299
million, Other assets, including MSRs, of $
2.4
billion, Loans and leases of $
693
million and LHFS of $
375
million.
(3)
Includes models such as Monte Carlo simulation and Black-Scholes.
(4)
Includes models such as Monte Carlo simulation, Black-Scholes and other methods that model the joint dynamics of interest, inflation and foreign exchange rates.
(5)
The weighted-average life is a product of changes in market rates of interest, prepayment rates and other model and cash flow assumptions.
CPR = Constant Prepayment Rate
CDR = Constant Default Rate
MMBtu = Million British thermal units
IR = Interest Rate
FX = Foreign Exchange
n/a = not applicable
Uncertainty of Fair Value Measurements from Unobservable Inputs
|
95
Bank of America
|
||||||||
Nonrecurring Fair Value
The Corporation holds certain assets that are measured at fair value only in certain situations (e.g., the impairment of an asset), and these measurements are referred to herein as nonrecurring.
The amounts below represent assets still held as of the reporting date for which a nonrecurring fair value adjustment was recorded during the three and nine months ended September 30, 2020 and 2019.
|
Assets Measured at Fair Value on a Nonrecurring Basis
|
|||||||||||||||||||||||
| September 30, 2020 | Three Months Ended September 30, 2020 | Nine Months Ended September 30, 2020 | |||||||||||||||||||||
| (Dollars in millions) | Level 2 | Level 3 | Gains (Losses) | ||||||||||||||||||||
| Assets | |||||||||||||||||||||||
| Loans held-for-sale | $ |
|
$ |
|
$ |
(
|
$ |
(
|
|||||||||||||||
|
Loans and leases
(1)
|
|
|
(
|
(
|
|||||||||||||||||||
|
Foreclosed properties
(2, 3)
|
|
|
(
|
(
|
|||||||||||||||||||
| Other assets |
|
|
(
|
(
|
|||||||||||||||||||
| September 30, 2019 | Three Months Ended September 30, 2019 | Nine Months Ended September 30, 2019 | |||||||||||||||||||||
| Assets | |||||||||||||||||||||||
| Loans held-for-sale | $ |
|
$ |
|
$ |
(
|
$ |
(
|
|||||||||||||||
|
Loans and leases
(1)
|
|
|
(
|
(
|
|||||||||||||||||||
|
Foreclosed properties
(2, 3)
|
|
|
(
|
(
|
|||||||||||||||||||
| Other assets |
|
|
(
|
(
|
|||||||||||||||||||
(1)
Includes $
9
million and $
26
million of losses on loans that were written down to a collateral value of zero during the three and nine months ended September 30, 2020 compared to losses of $
8
million and $
25
million for the same periods in 2019.
(2)
Amounts are included in other assets on the Consolidated Balance Sheet and represent the carrying value of foreclosed properties that were written down subsequent to their initial classification as foreclosed properties. Losses on foreclosed properties include losses recorded during the first 90 days after transfer of a loan to foreclosed properties.
(3)
Excludes $
131
million and $
275
million of properties acquired upon foreclosure of certain government-guaranteed loans (principally FHA-insured loans) at September 30, 2020 and 2019.
The table below presents information about significant unobservable inputs at September 30, 2020 and December 31, 2019.
|
Quantitative Information about Nonrecurring Level 3 Fair Value Measurements
|
|||||||||||||||||
| Inputs | |||||||||||||||||
| Financial Instrument | Fair Value |
Valuation
Technique |
Significant Unobservable
Inputs |
Ranges of
Inputs |
Weighted
Average
(1)
|
||||||||||||
| (Dollars in millions) | September 30, 2020 | ||||||||||||||||
| Loans held-for-sale | $ |
|
Discounted cash flow | Price |
$
|
$
|
|||||||||||
|
Loans and leases
(2)
|
|
Market comparables | OREO discount |
|
|
% | |||||||||||
| Costs to sell |
|
|
% | ||||||||||||||
|
Other assets
(3)
|
|
Discounted cash flow | Revenue attrition |
|
|
% | |||||||||||
| Discount rate |
|
|
% | ||||||||||||||
| December 31, 2019 | |||||||||||||||||
| Loans held-for-sale | $ |
|
Discounted cash flow | Price |
$
|
$
|
|||||||||||
|
Loans and leases
(2)
|
|
Market comparables | OREO discount |
|
|
% | |||||||||||
| Costs to sell |
|
|
% | ||||||||||||||
|
Other assets
(4)
|
|
Discounted cash flow | Customer attrition |
|
|
% | |||||||||||
| Cost to service |
|
|
% | ||||||||||||||
(1)
The weighted average is calculated based upon the fair value of the loans.
(2)
Represents residential mortgages where the loan has been written down to the fair value of the underlying collateral.
(3)
The fair value of the intangible asset related to the merchant contracts received from the merchant services joint venture was measured using a discounted cash flow method for which the two key assumptions were the revenue attrition rate and the discount rate. For more information, see
Note 7 – Goodwill and Intangible Assets.
NOTE 15
Fair Value Option
|
Bank of America
96
|
||||||||
|
Fair Value Option Elections
|
|||||||||||||||||||||||||||||||||||
| September 30, 2020 | December 31, 2019 | ||||||||||||||||||||||||||||||||||
|
(Dollars in millions)
|
Fair Value Carrying Amount | Contractual Principal Outstanding | Fair Value Carrying Amount Less Unpaid Principal |
Fair Value
Carrying Amount |
Contractual Principal Outstanding |
Fair Value Carrying
Amount Less Unpaid Principal |
|||||||||||||||||||||||||||||
|
Federal funds sold and securities borrowed or purchased under agreements to resell
|
$ |
|
$ |
|
$ |
|
$ |
|
$ |
|
$ |
|
|||||||||||||||||||||||
|
Loans reported as trading account assets
(1)
|
|
|
(
|
|
|
(
|
|||||||||||||||||||||||||||||
| Trading inventory – other |
|
n/a | n/a |
|
n/a | n/a | |||||||||||||||||||||||||||||
| Consumer and commercial loans |
|
|
(
|
|
|
(
|
|||||||||||||||||||||||||||||
|
Loans held-for-sale
(1)
|
|
|
(
|
|
|
(
|
|||||||||||||||||||||||||||||
| Other assets |
|
n/a | n/a |
|
n/a | n/a | |||||||||||||||||||||||||||||
| Long-term deposits |
|
|
|
|
|
|
|||||||||||||||||||||||||||||
|
Federal funds purchased and securities loaned or sold under agreements to repurchase
|
|
|
(
|
|
|
(
|
|||||||||||||||||||||||||||||
| Short-term borrowings |
|
|
|
|
|
|
|||||||||||||||||||||||||||||
| Unfunded loan commitments |
|
n/a | n/a |
|
n/a | n/a | |||||||||||||||||||||||||||||
| Long-term debt |
|
|
(
|
|
|
(
|
|||||||||||||||||||||||||||||
(1)
A significant portion of the loans reported as trading account assets and LHFS are distressed loans that were purchased at a deep discount to par, and the remainder are loans with a fair value near contractual principal outstanding.
n/a = not applicable
| Gains (Losses) Relating to Assets and Liabilities Accounted for Under the Fair Value Option | |||||||||||||||||||||||||||||||||||
| Three Months Ended September 30 | |||||||||||||||||||||||||||||||||||
| 2020 | 2019 | ||||||||||||||||||||||||||||||||||
| (Dollars in millions) | Market making and similar activities |
Other
Income |
Total | Market making and similar activities |
Other
Income |
Total | |||||||||||||||||||||||||||||
| Loans reported as trading account assets | $ |
|
$ |
|
$ |
|
$ |
|
$ |
|
$ |
|
|||||||||||||||||||||||
|
Trading inventory – other
(1)
|
|
|
|
(
|
|
(
|
|||||||||||||||||||||||||||||
| Consumer and commercial loans |
(
|
|
|
|
(
|
|
|||||||||||||||||||||||||||||
|
Loans held-for-sale
(2)
|
|
|
|
|
|
|
|||||||||||||||||||||||||||||
| Short-term borrowings |
(
|
|
(
|
|
|
|
|||||||||||||||||||||||||||||
| Unfunded loan commitments |
|
(
|
(
|
|
|
|
|||||||||||||||||||||||||||||
|
Long-term debt
(3)
|
(
|
(
|
(
|
(
|
(
|
(
|
|||||||||||||||||||||||||||||
|
Other
(4)
|
|
|
|
(
|
(
|
(
|
|||||||||||||||||||||||||||||
| Total | $ |
|
$ |
|
$ |
|
$ |
(
|
$ |
|
$ |
(
|
|||||||||||||||||||||||
| Nine Months Ended September 30 | |||||||||||||||||||||||||||||||||||
| 2020 | 2019 | ||||||||||||||||||||||||||||||||||
| Loans reported as trading account assets | $ |
(
|
$ |
|
$ |
(
|
$ |
|
$ |
|
$ |
|
|||||||||||||||||||||||
|
Trading inventory – other
(1)
|
|
|
|
|
|
|
|||||||||||||||||||||||||||||
| Consumer and commercial loans |
(
|
(
|
(
|
|
|
|
|||||||||||||||||||||||||||||
|
Loans held-for-sale
(2)
|
|
|
|
|
|
|
|||||||||||||||||||||||||||||
| Short-term borrowings |
|
|
|
|
|
|
|||||||||||||||||||||||||||||
| Unfunded loan commitments |
|
(
|
(
|
|
|
|
|||||||||||||||||||||||||||||
|
Long-term debt
(3)
|
(
|
(
|
(
|
(
|
(
|
(
|
|||||||||||||||||||||||||||||
|
Other
(4)
|
|
(
|
(
|
|
(
|
(
|
|||||||||||||||||||||||||||||
| Total | $ |
|
$ |
(
|
$ |
(
|
$ |
|
$ |
|
$ |
|
|||||||||||||||||||||||
(1)
The gains (losses) in market making and similar activities are primarily offset by (losses) gains on trading liabilities that hedge these assets.
(2)
Includes the value of interest rate lock commitments on funded loans, including those sold during the period.
(3)
The net losses in market making and similar activities relate to the embedded derivatives in structured liabilities and are typically offset by gains on derivatives and securities that hedge these liabilities. For the cumulative impact of changes in the Corporation’s own credit spreads and the amount recognized in accumulated OCI, see
Note 13 – Accumulated Other Comprehensive Income (Loss)
. For more information on how the Corporation’s own credit spread is determined, see
Note 21 – Fair Value Measurements
to the Consolidated Financial Statements
of the Corporation’s 2019 Annual Report on Form 10-K
.
(4)
Includes gains (losses) on federal funds sold and securities borrowed or purchased under agreements to resell, long-term deposits and federal funds purchased and securities loaned or sold under agreements to repurchase.
|
Gains (Losses) Related to Borrower-specific Credit Risk for Assets and Liabilities Accounted for Under the Fair Value Option
|
|||||||||||||||||||||||
| Three Months Ended September 30 | Nine Months Ended September 30 | ||||||||||||||||||||||
| (Dollars in millions) | 2020 | 2019 | 2020 | 2019 | |||||||||||||||||||
| Loans reported as trading account assets | $ |
|
$ |
|
$ |
(
|
$ |
|
|||||||||||||||
| Consumer and commercial loans |
|
(
|
(
|
|
|||||||||||||||||||
| Loans held-for-sale |
(
|
|
(
|
|
|||||||||||||||||||
| Unfunded loan commitments |
(
|
|
(
|
|
|||||||||||||||||||
|
97
Bank of America
|
||||||||
NOTE 16
Fair Value of Financial Instruments
The following disclosures include financial instruments that are not carried at fair value or only a portion of the ending balance is carried at fair value on the Consolidated Balance Sheet. Certain loans, deposits, long-term debt and unfunded lending commitments are accounted for under the fair value option. For more information, see
Note 22 – Fair Value Option
to the Consolidated Financial Statements
of the Corporation’s 2019 Annual Report on Form 10-K
.
Fair Value of Financial Instruments
The carrying values and fair values by fair value hierarchy of certain financial instruments where only a portion of the ending balance was carried at fair value at September 30, 2020 and December 31, 2019 are presented in the following table.
|
Fair Value of Financial Instruments
|
|||||||||||||||||||||||
| Fair Value | |||||||||||||||||||||||
| Carrying Value | Level 2 | Level 3 | Total | ||||||||||||||||||||
| (Dollars in millions) | September 30, 2020 | ||||||||||||||||||||||
| Financial assets | |||||||||||||||||||||||
|
Loans
|
$ |
|
$ |
|
$ |
|
$ |
|
|||||||||||||||
| Loans held-for-sale |
|
|
|
|
|||||||||||||||||||
| Financial liabilities | |||||||||||||||||||||||
|
Deposits
(1)
|
|
|
|
|
|||||||||||||||||||
| Long-term debt |
|
|
|
|
|||||||||||||||||||
|
Commercial unfunded lending commitments
(2)
|
|
|
|
|
|||||||||||||||||||
| December 31, 2019 | |||||||||||||||||||||||
| Financial assets | |||||||||||||||||||||||
|
Loans
|
$ |
|
$ |
|
$ |
|
$ |
|
|||||||||||||||
| Loans held-for-sale |
|
|
|
|
|||||||||||||||||||
| Financial liabilities | |||||||||||||||||||||||
|
Deposits
(1)
|
|
|
|
|
|||||||||||||||||||
| Long-term debt |
|
|
|
|
|||||||||||||||||||
|
Commercial unfunded lending commitments
(2)
|
|
|
|
|
|||||||||||||||||||
(1)
Includes demand deposits of $
751.0
billion and $
545.5
billion with no stated maturities at September 30, 2020 and December 31, 2019.
(2)
The carrying value of commercial unfunded lending commitments is included in accrued expenses and other liabilities on the Consolidated Balance Sheet. The Corporation does not estimate the fair value of consumer unfunded lending commitments because, in many instances, the Corporation can reduce or cancel these commitments by providing notice to the borrower. For more information on commitments, see
Note 10 – Commitments and Contingencies
.
NOTE 17
Business Segment Information
The Corporation reports its results of operations through the following
four
business segments:
Consumer Banking
,
Global Wealth & Investment Management
,
Global Banking
and
Global Markets
, with the remaining operations recorded in
All Other
. For more information, see
Note 24 – Business Segment Information
to the Consolidated Financial Statements of the Corporation’s 2019 Annual Report on Form 10-K.
The following tables present net income (loss) and the associated components (with net
|
Bank of America
98
|
||||||||
| Results of Business Segments and All Other | ||||||||||||||||||||||||||||||||||||||
| At and for the three months ended September 30 |
Total Corporation
(1)
|
Consumer Banking | Global Wealth & Investment Management | |||||||||||||||||||||||||||||||||||
| (Dollars in millions) | 2020 | 2019 | 2020 | 2019 | 2020 | 2019 | ||||||||||||||||||||||||||||||||
| Net interest income | $ |
|
$ |
|
$ |
|
$ |
|
$ |
|
$ |
|
||||||||||||||||||||||||||
| Noninterest income |
|
|
|
|
|
|
||||||||||||||||||||||||||||||||
| Total revenue, net of interest expense |
|
|
|
|
|
|
||||||||||||||||||||||||||||||||
| Provision for credit losses |
|
|
|
|
|
|
||||||||||||||||||||||||||||||||
| Noninterest expense |
|
|
|
|
|
|
||||||||||||||||||||||||||||||||
| Income before income taxes |
|
|
|
|
|
|
||||||||||||||||||||||||||||||||
| Income tax expense |
(
|
|
|
|
|
|
||||||||||||||||||||||||||||||||
| Net income | $ |
|
$ |
|
$ |
|
$ |
|
$ |
|
$ |
|
||||||||||||||||||||||||||
| Period-end total assets | $ |
|
$ |
|
$ |
|
$ |
|
$ |
|
$ |
|
||||||||||||||||||||||||||
| Global Banking | Global Markets | All Other | ||||||||||||||||||||||||||||||||||||
| 2020 | 2019 | 2020 | 2019 | 2020 | 2019 | |||||||||||||||||||||||||||||||||
| Net interest income | $ |
|
$ |
|
$ |
|
$ |
|
$ |
(
|
$ |
|
||||||||||||||||||||||||||
| Noninterest income |
|
|
|
|
(
|
(
|
||||||||||||||||||||||||||||||||
| Total revenue, net of interest expense |
|
|
|
|
(
|
(
|
||||||||||||||||||||||||||||||||
| Provision for credit losses |
|
|
|
|
(
|
(
|
||||||||||||||||||||||||||||||||
| Noninterest expense |
|
|
|
|
|
|
||||||||||||||||||||||||||||||||
| Income before income taxes |
|
|
|
|
(
|
(
|
||||||||||||||||||||||||||||||||
| Income tax expense |
|
|
|
|
(
|
(
|
||||||||||||||||||||||||||||||||
| Net income | $ |
|
$ |
|
$ |
|
$ |
|
$ |
|
$ |
(
|
||||||||||||||||||||||||||
| Period-end total assets | $ |
|
$ |
|
$ |
|
$ |
|
$ |
|
$ |
|
||||||||||||||||||||||||||
(1)
There were no material intersegment revenues.
| Results of Business Segments and All Other | ||||||||||||||||||||||||||||||||||||||
| At and for the nine months ended September 30 |
Total Corporation
(1)
|
Consumer Banking | Global Wealth & Investment Management | |||||||||||||||||||||||||||||||||||
| (Dollars in millions) | 2020 | 2019 | 2020 | 2019 | 2020 | 2019 | ||||||||||||||||||||||||||||||||
| Net interest income | $ |
|
$ |
|
$ |
|
$ |
|
$ |
|
$ |
|
||||||||||||||||||||||||||
| Noninterest income |
|
|
|
|
|
|
||||||||||||||||||||||||||||||||
| Total revenue, net of interest expense |
|
|
|
|
|
|
||||||||||||||||||||||||||||||||
| Provision for credit losses |
|
|
|
|
|
|
||||||||||||||||||||||||||||||||
| Noninterest expense |
|
|
|
|
|
|
||||||||||||||||||||||||||||||||
| Income before income taxes |
|
|
|
|
|
|
||||||||||||||||||||||||||||||||
| Income tax expense |
|
|
|
|
|
|
||||||||||||||||||||||||||||||||
| Net income | $ |
|
$ |
|
$ |
|
$ |
|
$ |
|
$ |
|
||||||||||||||||||||||||||
| Period-end total assets | $ |
|
$ |
|
$ |
|
$ |
|
$ |
|
$ |
|
||||||||||||||||||||||||||
| Global Banking | Global Markets | All Other | ||||||||||||||||||||||||||||||||||||
| 2020 | 2019 | 2020 | 2019 | 2020 | 2019 | |||||||||||||||||||||||||||||||||
| Net interest income | $ |
|
$ |
|
$ |
|
$ |
|
$ |
|
$ |
|
||||||||||||||||||||||||||
| Noninterest income |
|
|
|
|
(
|
(
|
||||||||||||||||||||||||||||||||
| Total revenue, net of interest expense |
|
|
|
|
(
|
(
|
||||||||||||||||||||||||||||||||
| Provision for credit losses |
|
|
|
(
|
|
(
|
||||||||||||||||||||||||||||||||
| Noninterest expense |
|
|
|
|
|
|
||||||||||||||||||||||||||||||||
| Income before income taxes |
|
|
|
|
(
|
(
|
||||||||||||||||||||||||||||||||
| Income tax expense |
|
|
|
|
(
|
(
|
||||||||||||||||||||||||||||||||
| Net income | $ |
|
$ |
|
$ |
|
$ |
|
$ |
|
$ |
(
|
||||||||||||||||||||||||||
| Period-end total assets | $ |
|
$ |
|
$ |
|
$ |
|
$ |
|
$ |
|
||||||||||||||||||||||||||
(1)
There were no material intersegment revenues.
|
99
Bank of America
|
||||||||
The tables below present noninterest income and the associated components for the three and nine months ended September 30, 2020 and 2019 for each business segment,
All Other
and the total Corporation. For more information, see
Note 2 – Net Interest Income and Noninterest Income.
| Noninterest Income by Business Segment and All Other | |||||||||||||||||||||||||||||||||||
| Total Corporation | Consumer Banking |
Global Wealth &
Investment Management |
|||||||||||||||||||||||||||||||||
| Three Months Ended September 30 | |||||||||||||||||||||||||||||||||||
| (Dollars in millions) | 2020 | 2019 | 2020 | 2019 | 2020 | 2019 | |||||||||||||||||||||||||||||
| Fees and commissions: | |||||||||||||||||||||||||||||||||||
| Card income | |||||||||||||||||||||||||||||||||||
| Interchange fees | $ |
|
$ |
|
$ |
|
$ |
|
$ |
|
$ |
|
|||||||||||||||||||||||
| Other card income |
|
|
|
|
|
|
|||||||||||||||||||||||||||||
| Total card income |
|
|
|
|
|
|
|||||||||||||||||||||||||||||
| Service charges | |||||||||||||||||||||||||||||||||||
| Deposit-related fees |
|
|
|
|
|
|
|||||||||||||||||||||||||||||
| Lending-related fees |
|
|
|
|
|
|
|||||||||||||||||||||||||||||
| Total service charges |
|
|
|
|
|
|
|||||||||||||||||||||||||||||
| Investment and brokerage services | |||||||||||||||||||||||||||||||||||
| Asset management fees |
|
|
|
|
|
|
|||||||||||||||||||||||||||||
| Brokerage fees |
|
|
|
|
|
|
|||||||||||||||||||||||||||||
|
Total investment and brokerage services
|
|
|
|
|
|
|
|||||||||||||||||||||||||||||
| Investment banking fees | |||||||||||||||||||||||||||||||||||
| Underwriting income |
|
|
|
|
|
|
|||||||||||||||||||||||||||||
| Syndication fees |
|
|
|
|
|
|
|||||||||||||||||||||||||||||
| Financial advisory services |
|
|
|
|
|
|
|||||||||||||||||||||||||||||
| Total investment banking fees |
|
|
|
|
|
|
|||||||||||||||||||||||||||||
| Total fees and commissions |
|
|
|
|
|
|
|||||||||||||||||||||||||||||
| Market making and similar activities |
|
|
|
|
|
|
|||||||||||||||||||||||||||||
| Other income (loss) |
(
|
|
|
|
|
|
|||||||||||||||||||||||||||||
| Total noninterest income | $ |
|
$ |
|
$ |
|
$ |
|
$ |
|
$ |
|
|||||||||||||||||||||||
| Global Banking | Global Markets |
All Other
(1)
|
|||||||||||||||||||||||||||||||||
| Three Months Ended September 30 | |||||||||||||||||||||||||||||||||||
| 2020 | 2019 | 2020 | 2019 | 2020 | 2019 | ||||||||||||||||||||||||||||||
| Fees and commissions: | |||||||||||||||||||||||||||||||||||
| Card income | |||||||||||||||||||||||||||||||||||
| Interchange fees | $ |
|
$ |
|
$ |
|
$ |
|
$ |
|
$ |
|
|||||||||||||||||||||||
| Other card income |
|
|
|
|
|
|
|||||||||||||||||||||||||||||
| Total card income |
|
|
|
|
|
|
|||||||||||||||||||||||||||||
| Service charges | |||||||||||||||||||||||||||||||||||
| Deposit-related fees |
|
|
|
|
|
|
|||||||||||||||||||||||||||||
| Lending-related fees |
|
|
|
|
(
|
|
|||||||||||||||||||||||||||||
| Total service charges |
|
|
|
|
|
|
|||||||||||||||||||||||||||||
| Investment and brokerage services | |||||||||||||||||||||||||||||||||||
| Asset management fees |
|
|
|
|
(
|
(
|
|||||||||||||||||||||||||||||
| Brokerage fees |
|
|
|
|
(
|
|
|||||||||||||||||||||||||||||
|
Total investment and brokerage services
|
|
|
|
|
(
|
(
|
|||||||||||||||||||||||||||||
| Investment banking fees | |||||||||||||||||||||||||||||||||||
| Underwriting income |
|
|
|
|
(
|
(
|
|||||||||||||||||||||||||||||
| Syndication fees |
|
|
|
|
|
|
|||||||||||||||||||||||||||||
| Financial advisory services |
|
|
|
|
|
|
|||||||||||||||||||||||||||||
| Total investment banking fees |
|
|
|
|
(
|
(
|
|||||||||||||||||||||||||||||
| Total fees and commissions |
|
|
|
|
(
|
(
|
|||||||||||||||||||||||||||||
| Market making and similar activities |
|
|
|
|
(
|
|
|||||||||||||||||||||||||||||
| Other income (loss) |
|
|
(
|
|
(
|
(
|
|||||||||||||||||||||||||||||
| Total noninterest income | $ |
|
$ |
|
$ |
|
$ |
|
$ |
(
|
$ |
(
|
|||||||||||||||||||||||
(1)
All Other
includes eliminations of intercompany transactions.
|
Bank of America
100
|
||||||||
| Noninterest Income by Business Segment and All Other | |||||||||||||||||||||||||||||||||||
| Total Corporation | Consumer Banking |
Global Wealth &
Investment Management |
|||||||||||||||||||||||||||||||||
| Nine Months Ended September 30 | |||||||||||||||||||||||||||||||||||
| (Dollars in millions) | 2020 | 2019 | 2020 | 2019 | 2020 | 2019 | |||||||||||||||||||||||||||||
| Fees and commissions: | |||||||||||||||||||||||||||||||||||
| Card income | |||||||||||||||||||||||||||||||||||
| Interchange fees | $ |
|
$ |
|
$ |
|
$ |
|
$ |
|
$ |
|
|||||||||||||||||||||||
| Other card income |
|
|
|
|
|
|
|||||||||||||||||||||||||||||
| Total card income |
|
|
|
|
|
|
|||||||||||||||||||||||||||||
| Service charges | |||||||||||||||||||||||||||||||||||
| Deposit-related fees |
|
|
|
|
|
|
|||||||||||||||||||||||||||||
| Lending-related fees |
|
|
|
|
|
|
|||||||||||||||||||||||||||||
| Total service charges |
|
|
|
|
|
|
|||||||||||||||||||||||||||||
| Investment and brokerage services | |||||||||||||||||||||||||||||||||||
| Asset management fees |
|
|
|
|
|
|
|||||||||||||||||||||||||||||
| Brokerage fees |
|
|
|
|
|
|
|||||||||||||||||||||||||||||
|
Total investment and brokerage services
|
|
|
|
|
|
|
|||||||||||||||||||||||||||||
| Investment banking fees | |||||||||||||||||||||||||||||||||||
| Underwriting income |
|
|
|
|
|
|
|||||||||||||||||||||||||||||
| Syndication fees |
|
|
|
|
|
|
|||||||||||||||||||||||||||||
| Financial advisory services |
|
|
|
|
|
|
|||||||||||||||||||||||||||||
| Total investment banking fees |
|
|
|
|
|
|
|||||||||||||||||||||||||||||
| Total fees and commissions |
|
|
|
|
|
|
|||||||||||||||||||||||||||||
| Market making and similar activities |
|
|
|
|
|
|
|||||||||||||||||||||||||||||
| Other income (loss) |
(
|
|
|
|
|
|
|||||||||||||||||||||||||||||
| Total noninterest income | $ |
|
$ |
|
$ |
|
$ |
|
$ |
|
$ |
|
|||||||||||||||||||||||
| Global Banking | Global Markets |
All Other
(1)
|
|||||||||||||||||||||||||||||||||
| Nine Months Ended September 30 | |||||||||||||||||||||||||||||||||||
| 2020 | 2019 | 2020 | 2019 | 2020 | 2019 | ||||||||||||||||||||||||||||||
| Fees and commissions: | |||||||||||||||||||||||||||||||||||
| Card income | |||||||||||||||||||||||||||||||||||
| Interchange fees | $ |
|
$ |
|
$ |
|
$ |
|
$ |
|
$ |
|
|||||||||||||||||||||||
| Other card income |
|
|
|
|
|
|
|||||||||||||||||||||||||||||
| Total card income |
|
|
|
|
|
|
|||||||||||||||||||||||||||||
| Service charges | |||||||||||||||||||||||||||||||||||
| Deposit-related fees |
|
|
|
|
|
|
|||||||||||||||||||||||||||||
| Lending-related fees |
|
|
|
|
|
|
|||||||||||||||||||||||||||||
| Total service charges |
|
|
|
|
|
|
|||||||||||||||||||||||||||||
| Investment and brokerage services | |||||||||||||||||||||||||||||||||||
| Asset management fees |
|
|
|
|
(
|
(
|
|||||||||||||||||||||||||||||
| Brokerage fees |
|
|
|
|
|
|
|||||||||||||||||||||||||||||
|
Total investment and brokerage services
|
|
|
|
|
(
|
(
|
|||||||||||||||||||||||||||||
| Investment banking fees | |||||||||||||||||||||||||||||||||||
| Underwriting income |
|
|
|
|
(
|
(
|
|||||||||||||||||||||||||||||
| Syndication fees |
|
|
|
|
|
(
|
|||||||||||||||||||||||||||||
| Financial advisory services |
|
|
|
|
|
|
|||||||||||||||||||||||||||||
| Total investment banking fees |
|
|
|
|
(
|
(
|
|||||||||||||||||||||||||||||
| Total fees and commissions |
|
|
|
|
(
|
(
|
|||||||||||||||||||||||||||||
| Market making and similar activities |
|
|
|
|
(
|
|
|||||||||||||||||||||||||||||
| Other income (loss) |
|
|
(
|
|
(
|
(
|
|||||||||||||||||||||||||||||
| Total noninterest income | $ |
|
$ |
|
$ |
|
$ |
|
$ |
(
|
$ |
(
|
|||||||||||||||||||||||
(1)
All Other
includes eliminations of intercompany transactions.
|
101
Bank of America
|
||||||||
| Business Segment Reconciliations | |||||||||||||||||||||||
| Three Months Ended September 30 | Nine Months Ended September 30 | ||||||||||||||||||||||
| (Dollars in millions) | 2020 | 2019 | 2020 | 2019 | |||||||||||||||||||
| Segments’ total revenue, net of interest expense | $ |
|
$ |
|
$ |
|
$ |
|
|||||||||||||||
|
Adjustments
(1)
:
|
|||||||||||||||||||||||
| ALM activities |
(
|
(
|
|
(
|
|||||||||||||||||||
| Liquidating businesses, eliminations and other |
(
|
(
|
(
|
(
|
|||||||||||||||||||
| FTE basis adjustment |
(
|
(
|
(
|
(
|
|||||||||||||||||||
| Consolidated revenue, net of interest expense | $ |
|
$ |
|
$ |
|
$ |
|
|||||||||||||||
| Segments’ total net income |
|
|
|
|
|||||||||||||||||||
|
Adjustments, net-of-tax
(1)
:
|
|||||||||||||||||||||||
| ALM activities |
(
|
(
|
|
(
|
|||||||||||||||||||
| Liquidating businesses, eliminations and other |
|
(
|
(
|
(
|
|||||||||||||||||||
| Consolidated net income | $ |
|
$ |
|
$ |
|
$ |
|
|||||||||||||||
| September 30 | |||||||||||||||||||||||
| 2020 | 2019 | ||||||||||||||||||||||
| Segments’ total assets | $ |
|
$ |
|
|||||||||||||||||||
|
Adjustments
(1)
:
|
|||||||||||||||||||||||
| ALM activities, including securities portfolio |
|
|
|||||||||||||||||||||
| Elimination of segment asset allocations to match liabilities |
(
|
(
|
|||||||||||||||||||||
| Other |
|
|
|||||||||||||||||||||
| Consolidated total assets | $ |
|
$ |
|
|||||||||||||||||||
(1)
Adjustments include consolidated income, expense and asset amounts not specifically allocated to individual business segments.
|
Bank of America
102
|
||||||||
Glossary
Alt-A Mortgage
–
A type of U.S. mortgage that is considered riskier than A-paper, or “prime,” and less risky than “subprime,” the riskiest category. Typically, Alt-A mortgages are characterized by borrowers with less than full documentation, lower credit scores and higher LTVs.
Assets Under Management (AUM)
– The total market value of assets under the investment advisory and/or discretion of
GWIM
which generate asset management fees based on a percentage of the assets’ market values. AUM reflects assets that are generally managed for institutional, high net worth and retail clients, and are distributed through various investment products including mutual funds, other commingled vehicles and separate accounts.
Banking Book
– All on- and off-balance sheet financial instruments of the Corporation except for those positions that are held for trading purposes.
Brokerage and Other Assets
– Non-discretionary client assets which are held in brokerage accounts or held for safekeeping.
Committed Credit Exposure
– Any funded portion of a facility plus the unfunded portion of a facility on which the lender is legally bound to advance funds during a specified period under prescribed conditions.
Credit Derivatives
– Contractual agreements that provide protection against a specified credit event on one or more referenced obligations.
Credit Valuation Adjustment (CVA)
– A portfolio adjustment required to properly reflect the counterparty credit risk exposure as part of the fair value of derivative instruments.
Debit Valuation Adjustment (DVA)
– A portfolio adjustment required to properly reflect the Corporation’s own credit risk exposure as part of the fair value of derivative instruments and/or structured liabilities.
Funding Valuation Adjustment (FVA)
– A portfolio adjustment required to include funding costs on uncollateralized derivatives and derivatives where the Corporation is not permitted to use the collateral it receives.
Interest Rate Lock Commitment (IRLC)
– Commitment with a loan applicant in which the loan terms are guaranteed for a designated period of time subject to credit approval.
Letter of Credit
– A document issued on behalf of a customer to a third party promising to pay the third party upon presentation of specified documents. A letter of credit effectively substitutes the issuer’s credit for that of the customer.
Loan-to-value (LTV)
– A commonly used credit quality metric. LTV is calculated as the outstanding carrying value of the loan divided by the estimated value of the property securing the loan.
Margin Receivable
–
An extension of credit secured by eligible securities in certain brokerage accounts.
Matched Book
– Repurchase and resale agreements or securities borrowed and loaned transactions where the overall asset and liability position is similar in size and/or maturity. Generally, these are entered into to accommodate customers where the Corporation earns the interest rate spread.
Mortgage Servicing Rights (MSR)
– The right to service a mortgage loan when the underlying loan is sold or securitized. Servicing includes collections for principal, interest and escrow payments from borrowers and accounting for and remitting principal and interest payments to investors.
Nonperforming Loans and Leases
– Includes loans and leases that have been placed on nonaccrual status, including nonaccruing loans whose contractual terms have been restructured in a manner that grants a concession to a borrower experiencing financial difficulties.
Prompt Corrective Action (PCA)
– A framework established by the U.S. banking regulators requiring banks to maintain certain levels of regulatory capital ratios, comprised of five categories of capitalization: “well capitalized,” “adequately capitalized,” “undercapitalized,” “significantly undercapitalized” and “critically undercapitalized.” Insured depository institutions that fail to meet certain of these capital levels are subject to increasingly strict limits on their activities, including their ability to make capital distributions, pay management compensation, grow assets and take other actions.
Subprime Loans
– Although a standard industry definition for subprime loans (including subprime mortgage loans) does not exist, the Corporation defines subprime loans as specific product offerings for higher risk borrowers.
Troubled Debt Restructurings (TDRs)
– Loans whose contractual terms have been restructured in a manner that grants a concession to a borrower experiencing financial difficulties. Certain consumer loans for which a binding offer to restructure has been extended are also classified as TDRs.
Value-at-Risk (VaR)
– VaR is a model that simulates the value of a portfolio under a range of hypothetical scenarios in order to generate a distribution of potential gains and losses. VaR represents the loss the portfolio is expected to experience with a given confidence level based on historical data. A VaR model is an effective tool in estimating ranges of potential gains and losses on our trading portfolios.
|
103
Bank of America
|
||||||||
Key Metrics
Active Digital Banking Users
–
Mobile and/or online users with activity over the last three months.
Active Mobile Banking Users
– Mobile users with activity over the last three months.
Book Value
– Ending common shareholders' equity divided by ending common shares outstanding.
Deposit Spread
–
Annualized net interest income divided by average deposits.
Efficiency Ratio
– Noninterest expense divided by total revenue, net of interest expense.
Financial advisor productivity
–
Adjusted MLGWM annualized revenue divided by average financial advisors.
Gross Interest Yield
– Effective annual percentage rate divided by average loans.
Net Interest Yield
– Net interest income divided by average total interest-earning assets.
Operating Margin
– Income before income taxes divided by total revenue, net of interest expense.
Risk-adjusted Margi
n
– Difference between total revenue, net of interest expense, and net credit losses divided by average loans.
Return on Average Allocated Capital
–
Adjusted net income divided by allocated capital.
Return on Average Assets
– Net income divided by total average assets.
Return on Average Common Shareholders' Equity
– Net income applicable to common shareholders divided by average common shareholders' equity.
Return on Average Shareholders' Equity
– Net income divided by average shareholders' equity.
Acronyms
| ABS | Asset-backed securities | ||||
| AFS | Available-for-sale | ||||
| ALM | Asset and liability management | ||||
| ARR | Alternative reference rates | ||||
| AUM | Assets under management | ||||
| AVM | Automated valuation model | ||||
| BANA | Bank of America, National Association | ||||
| BHC | Bank holding company | ||||
| BofAS | BofA Securities, Inc. | ||||
| BofASE | BofA Securities Europe SA | ||||
| bps | basis points | ||||
| CCAR | Comprehensive Capital Analysis and Review | ||||
| CDO | Collateralized debt obligation | ||||
| CECL | Current expected credit losses | ||||
| CET1 | Common equity tier 1 | ||||
| CFTC | Commodity Futures Trading Commission | ||||
| CLTV | Combined loan-to-value | ||||
| CVA | Credit valuation adjustment | ||||
| DVA | Debit valuation adjustment | ||||
| ECL | Expected credit losses | ||||
| EPS | Earnings per common share | ||||
| FHA | Federal Housing Administration | ||||
| FHLB | Federal Home Loan Bank | ||||
| FICC | Fixed income, currencies and commodities | ||||
| FICO | Fair Isaac Corporation (credit score) | ||||
| FTE | Fully taxable-equivalent | ||||
| FVA | Funding valuation adjustment | ||||
| GAAP |
Accounting principles generally accepted in the United States of America
|
||||
| GLS |
Global Liquidity Sources
|
||||
| GNMA |
Government National Mortgage Association
|
||||
| GSE |
Government-sponsored enterprise
|
||||
| G-SIB |
Global systemically important bank
|
||||
| GWIM |
Global Wealth & Investment Management
|
||||
| HELOC | Home equity line of credit | ||||
| HQLA | High Quality Liquid Assets | ||||
| HTM | Held-to-maturity | ||||
| IBOR |
Interbank Offered Rates
|
||||
| IRLC |
Interest rate lock commitment
|
||||
| ISDA |
International Swaps and Derivatives Association, Inc.
|
||||
| LCR | Liquidity Coverage Ratio | ||||
| LHFS | Loans held-for-sale | ||||
| LIBOR | London Interbank Offered Rate | ||||
| LTV | Loan-to-value | ||||
| MBS | Mortgage-backed securities | ||||
| MD&A |
Management’s Discussion and Analysis of Financial Condition and Results of Operations
|
||||
| MLGWM |
Merrill Lynch Global Wealth Management
|
||||
| MLI |
Merrill Lynch International
|
||||
| MLPCC | Merrill Lynch Professional Clearing Corp | ||||
| MLPF&S |
Merrill Lynch, Pierce, Fenner & Smith Incorporated
|
||||
| MSA | Metropolitan Statistical Area | ||||
| MSR | Mortgage servicing right | ||||
| OCI | Other comprehensive income | ||||
| OREO | Other real estate owned | ||||
| PCA | Prompt Corrective Action | ||||
| PPP | Paycheck Protection Program | ||||
| RWA | Risk-weighted assets | ||||
| SBA | Small Business Administration | ||||
| SBLC | Standby letter of credit | ||||
| SCB | Stress capital buffer | ||||
| SEC | Securities and Exchange Commission | ||||
| SLR | Supplementary leverage ratio | ||||
| TDR | Troubled debt restructurings | ||||
| TLAC | Total loss-absorbing capacity | ||||
| VaR | Value-at-Risk | ||||
| VIE | Variable interest entity | ||||
|
Bank of America
104
|
||||||||
Part II. Other Information
Bank of America Corporation and Subsidiaries
Item 1. Legal Proceedings
See Litigation and Regulatory Matters in
Note 10 – Commitments and Contingencies
to the Consolidated Financial Statements, which is incorporated by reference in this Item 1, for litigation and regulatory disclosure that supplements the disclosure in
Note 13 – Commitments and Contingencies
to the Consolidated Financial Statements of the Corporation’s 2019 Annual Report on Form 10-K.
Item 1A. Risk Factors
Our Annual Report on Form 10-K for the year ended December 31, 2019 (2019 Form 10-K) describes market, credit, geopolitical and business operations risk factors that could affect our businesses, results of operations or financial condition due to, among other things, “widespread health emergencies or pandemics.” On March 11, 2020, the World Health Organization declared the outbreak of a strain of novel coronavirus disease, COVID-19, a global pandemic. As conditions and circumstances related to the COVID-19 pandemic evolved subsequent to our 2019 Form 10-K filing, the Corporation disclosed a risk factor in its Quarterly Reports on Form 10-Q for the periods ended March 31, 2020 and June 30, 2020 captioned “Coronavirus Disease 2019” to supplement the risk factors described in its 2019 Form 10-K. The following supplements the risk factors described in the Corporation’s 2019 Form 10-K and Quarterly Reports on Form 10-Q for the periods ended March 31, 2020 and June 30, 2020.
Coronavirus Disease 2019
The COVID-19 pandemic has caused a significant global economic downturn that has adversely affected, and is expected to continue to adversely affect, the Corporation’s businesses and results of operations, and the duration and future impacts of the COVID-19 pandemic on the U.S. and/or global economy and the Corporation’s businesses, results of operations and financial condition remain uncertain.
The COVID-19 pandemic has resulted in authorities implementing numerous measures intended to contain the spread and impact of COVID-19, such as travel bans and restrictions, quarantines, shelter in place orders, and limitations on business activity, including closures. These measures have severely restricted economic activity, reduced economic output and resulted in a deterioration in economic conditions, globally and in the U.S. This has led to, among other things, high rates of unemployment and underemployment and caused volatility and disruptions in consumer spending and the global financial markets, including the energy and commodity markets. Although some of these restrictive measures have been eased in certain areas, many of the restrictive measures remain in place or have been reinstated, and in some cases additional restrictive measures are being or may need to be implemented. Businesses, market participants, our counterparties and clients, and the U.S. and global economy have been negatively impacted and may continue to be so for an extended period of time, as there remains significant uncertainty about the timing and strength of an economic recovery.
The negative economic conditions arising from the COVID-19 pandemic negatively impacted our financial results during the third quarter in various respects, including allowance for credit losses and noninterest expense. These negative economic conditions may have a continued adverse effect on
our businesses and results of operations, which could include, but not be limited to: decreased demand for and use of our products and services; protracted periods of historically low interest rates; lower fees, including asset management fees; lower sales and trading revenue due to decreased market liquidity resulting from heightened volatility; increased noninterest expense, including operational losses; and increased credit losses due to our customers' and clients' inability to fulfill contractual obligations and deterioration in the financial condition of our consumer and commercial borrowers, which may vary by region, sector or industry, that may increase our provision for credit losses and net charge-offs. Our provision for credit losses and net charge-offs may also continue to be impacted by volatility in the energy and commodity markets. Additionally, our liquidity and/or regulatory capital could be adversely impacted by customers’ withdrawal of deposits, volatility and disruptions in the capital and credit markets, volatility in foreign exchange rates and customer draws on lines of credit. Continued adverse macroeconomic conditions caused by COVID-19 could also result in potential downgrades to our credit ratings, negative impacts to regulatory capital and liquidity and further restrictions on dividends and/or repurchases of our common stock, which could limit the capital we return to shareholders.
If we become unable to operate our business from remote locations including, for example, because of an internal or external failure of our information technology infrastructure, we experience increased rates of employee illness or unavailability, or governmental restrictions are placed on our employees or operations, this could also have an adverse effect on our business continuity status and result in disruption to our businesses. Additionally we rely on third parties who could experience adverse effects on their business continuity status and business interruptions, which could increase our risks and have an adverse impact on the Corporation's businesses. To the extent the COVID-19 pandemic continues to adversely affect the U.S. and/or global economy and/or adversely affects our businesses, results of operations or financial condition, it may also have the effect of increasing the likelihood and/or magnitude of other risks described in the section captioned “Risk Factors” in our 2019 Form 10-K or risks described in our other filings with the Securities and Exchange Commission.
In response to the economic and market conditions resulting from the COVID-19 pandemic, governments and regulatory authorities, including central banks, have acted and may take further action to provide fiscal and monetary stimuli to support the global economy. However, there can be no assurance that these measures will stimulate the global economy or avert continued recessionary conditions in markets or economies in which we conduct operations. Our participation in and execution of measures taken by governments and regulatory authorities could result in reputational harm and government actions and proceedings, and has resulted in, and may continue to result in, litigation, including class actions. Such actions may result in judgments, settlements, penalties, and fines adverse to the Corporation.
We continue to closely monitor the COVID-19 pandemic and related risks as they evolve globally and in the U.S. The magnitude and duration of the current outbreak of COVID-19, the likelihood of further surges of COVID-19 cases, the timing and availability of effective medical treatments and vaccines, future actions taken by governmental authorities and/or other
|
105
Bank of America
|
||||||||
third parties in response to the COVID-19 pandemic, and its future direct and indirect effects on the global economy and our businesses, results of operation and financial condition are highly uncertain. The COVID-19 pandemic may cause prolonged
global or national recessionary economic conditions or longer lasting effects on economic conditions than currently exist, which could have a material adverse effect on our businesses, results of operations and financial condition.
Item 2. Unregistered Sales of Equity Securities and Use of Proceeds
The table below presents share repurchase activity for the three months ended September 30, 2020. The primary source of funds for cash distributions by the Corporation to its shareholders is dividends received from its banking subsidiaries. Each of the banking subsidiaries is subject to various regulatory policies and requirements relating to the payment of dividends, including requirements to maintain capital above regulatory minimums. All of the Corporation’s preferred stock outstanding has preference over the Corporation’s common stock with respect to payment of dividends.
| (Dollars in millions, except per share information; shares in thousands) |
Total Common Shares Repurchased
(1,2)
|
Weighted-Average Per Share Price |
Total Shares
Purchased as Part of Publicly Announced Programs |
Remaining Buyback
Authority Amounts |
|||||||||||||||||||
| July 1 - 31, 2020 | 5 | $ | 23.70 | — | $ | — | |||||||||||||||||
| August 1 - 31, 2020 | 5,391 | 27.90 | — | — | |||||||||||||||||||
| September 1 - 30, 2020 | 104 | 26.47 | — | — | |||||||||||||||||||
| Three months ended September 30, 2020 | 5,500 | 27.87 | — | ||||||||||||||||||||
(1)
Includes 1.5 million shares of the Corporation’s common stock acquired by the Corporation in connection with satisfaction of tax withholding obligations on vested restricted stock or restricted stock units and certain forfeitures and terminations of employment-related awards and for potential re-issuance to certain employees under equity incentive plans.
(2)
During the three months ended September 30, 2020, pursuant to the Board of Directors' authorization, the Corporation repurchased four million shares, or $114 million, of it's common stock solely to offset shares awarded under equity-based compensation plans. For more information, see Capital Management - CCAR and Capital Planning in the MD&A on page 23 and
Note 11 – Shareholders’ Equity
to the Consolidated Financial Statements.
The Corporation did not have any unregistered sales of equity securities during the three months ended September 30, 2020.
|
Bank of America
106
|
||||||||
Item 6. Exhibits
| Exhibit No. | Description | Notes | ||||||
| 3.1 | 1 | |||||||
| 3.2 | 1 | |||||||
| 31.1 | 1 | |||||||
| 31.2 | 1 | |||||||
| 32.1 | 1 | |||||||
| 32.2 | 1 | |||||||
| 101.INS | Inline XBRL Instance Document | 2 | ||||||
| 101.SCH | Inline XBRL Taxonomy Extension Schema Document | 1 | ||||||
| 101.CAL | Inline XBRL Taxonomy Extension Calculation Linkbase Document | 1 | ||||||
| 101.LAB | Inline XBRL Taxonomy Extension Label Linkbase Document | 1 | ||||||
| 101.PRE | Inline XBRL Taxonomy Extension Presentation Linkbase Document | 1 | ||||||
| 101.DEF | Inline XBRL Taxonomy Extension Definitions Linkbase Document | 1 | ||||||
| 104 | Cover Page Interactive Data File (formatted as Inline XBRL and contained in Exhibit 101) | |||||||
(1)
Filed herewith.
(2)
The instance document does not appear in the interactive data file because its XBRL tags are embedded within the inline XBRL document.
Signature
Pursuant to the requirements of the Securities Exchange Act of 1934, the registrant has duly caused this report to be signed on its behalf by the undersigned, thereunto duly authorized.
|
Bank of America Corporation
Registrant
|
|||||||||||||||||
| Date: | October 30, 2020 | /s/ Rudolf A. Bless | |||||||||||||||
|
Rudolf A. Bless
Chief Accounting Officer |
|||||||||||||||||
|
107
Bank of America
|
||||||||
TABLE OF CONTENTS
Part I. Financial InformationItem 1. Financial StatementsNote 10 Commitments and Contingencies)Note 1 Summary Of Significant Accounting PrinciplesNote 2 Net Interest Income and Noninterest IncomeNote 17 Business Segment InformationNote 3 DerivativesNote 9 Federal Funds Sold Or Purchased, Securities Financing Agreements, Short-term Borrowings and Restricted CashNote 4 SecuritiesNote 14 Fair Value MeasurementsNote 5 Outstanding Loans and Leases and Allowance For Credit LossesNote 15 Fair Value OptionNote 6 Securitizations and Other Variable Interest EntitiesNote 7 Securitizations and Other Variable Interest EntitiesNote 10 Commitments and ContingenciesNote 7 Goodwill and Intangible AssetsNote 8 LeasesNote 9 LeasesNote 11 Federal Funds Sold Or Purchased, Securities Financing Agreements, Short-term Borrowings and Restricted CashNote 13 Commitments and ContingenciesNote 11 Shareholders EquityNote 14 Shareholders EquityNote 12 Earnings Per Common ShareNote 13 Accumulated Other Comprehensive Income (loss)Note 21 Fair Value MeasurementsNote 22 Fair Value OptionNote 16 Fair Value Of Financial InstrumentsNote 24 Business Segment InformationPart II. Other InformationItem 1. Legal ProceedingsItem 1A. Risk FactorsItem 2. Unregistered Sales Of Equity Securities and Use Of ProceedsItem 6. Exhibits