BANC OF CALIFORNIA, INC.
10-Ks and 10-Qs
|
|
|
|
|
|
|
|
|
|
|
|
|
|
|
|
|
|
|
|
|
|
|
|
|
|
|
|
|
|
|
|
|
|
|
|
|
|
|
|
|
|
|
|
|
|
|
|
|
|
|
|
|
|
|
|
|
|
|
UNITED STATES
SECURITIES AND EXCHANGE COMMISSION
Washington, D.C. 20549
FORM 10-K
|
(Mark One)
ý
ANNUAL REPORT PURSUANT TO SECTION 13 OR 15(d) OF THE SECURITIES EXCHANGE ACT OF 1934
For the fiscal year ended December 31, 2018
or
¨
TRANSITION REPORT PURSUANT TO SECTION 13 OR 15(d) OF THE SECURITIES EXCHANGE ACT OF 1934
For the transition period from to
|
Commission file number 001-35522
BANC OF CALIFORNIA, INC.
(Exact name of registrant as specified in its charter)
|
Maryland
|
04-3639825
|
|
|
(State or other jurisdiction of incorporation or organization)
|
(IRS Employer Identification No.)
|
|
|
3 MacArthur Place, Santa Ana, California
|
92707
|
|
|
(Address of principal executive offices)
|
(Zip Code)
|
|
Registrant’s telephone number, including area code
(855) 361-2262
Securities registered pursuant to Section 12(b) of the Act:
|
Title of each class
|
Name of each exchange on which registered
|
|
|
Common Stock, par value $0.01 per share
|
New York Stock Exchange
|
|
|
Depositary Shares each representing a 1/40
th
Interest in a share of 7.375%
Non-Cumulative Perpetual Preferred Stock, Series D
|
New York Stock Exchange
|
|
|
Depositary Shares each representing a 1/40
th
Interest in a share of 7.00%
Non-Cumulative Perpetual Preferred Stock, Series E
|
New York Stock Exchange
|
|
Securities registered pursuant to Section 12(g) of the Act:
None
Indicate by check mark if the registrant is a well-known seasoned issuer, as defined in Rule 405 of the Securities Act. YES
ý
NO
¨
Indicate by check mark if the registrant is not required to file reports pursuant to Section 13 or Section 15(d) of the Act. YES
¨
NO
ý
Indicate by check mark whether the registrant (1) has filed all reports required to be filed by Section 13 or 15(d) of the Securities Exchange Act of 1934 during the preceding 12 months (or for such shorter period that the registrant was required to file such reports) and (2) has been subject to such filing requirements for the past 90 days. YES
ý
NO
¨
Indicate by check mark whether the registrant has submitted electronically every Interactive Data File required to be submitted pursuant to Rule 405 of Regulation S-T (§ 232.405 of this chapter) during the preceding 12 months (or for such shorter period that the registrant was required to submit such files). YES
ý
NO
¨
Indicate by check mark if disclosure of delinquent filers pursuant to Item 405 of Regulation S-K (§ 229.405 of this chapter) is not contained herein, and will not be contained, to the best of registrant’s knowledge, in definitive proxy or information statements incorporated by reference in Part III of this Form 10-K or any amendment to this Form 10-K.
¨
Indicate by check mark whether the registrant is a large accelerated filer, an accelerated filer, a non-accelerated filer, a smaller reporting company, or an emerging growth company. See the definitions of “large accelerated filer,” “accelerated filer” “smaller reporting company,” and "emerging growth company" in Rule 12b-2 of the Exchange Act.
|
Large accelerated filer
|
ý
|
Accelerated filer
|
¨
|
|
|
Non-accelerated filer
|
¨
|
Smaller reporting company
|
¨
|
|
|
Emerging growth company
|
¨
|
|||
If an emerging growth company, indicate by check mark if the registrant has elected not to use the extended transition period for complying with any new or revised financial accounting standards provided pursuant to Section 13(a) of the Exchange Act.
¨
Indicate by check mark whether the registrant is a shell company (as defined in Rule 12b-2 of the Act). YES
¨
NO
ý
The aggregate market value of the voting and non-voting common stock held by non-affiliates of the registrant, computed by reference to the closing price of such stock on the New York Stock Exchange as of
June 30, 2018
, was
$843.8 million
.
(The exclusion from such amount of the market value of the shares owned by any person shall not be deemed an admission by the registrant that such person is an affiliate of the registrant). As of
February 22, 2019
, the registrant had outstanding
50,180,041
shares of voting common stock and
477,321
shares of Class B non-voting common stock.
DOCUMENTS INCORPORATED BY REFERENCE
PART III of Form 10-K—Portions of the Proxy Statement for the Annual Meeting of Stockholders to be held in
2019
.
BANC OF CALIFORNIA, INC.
ANNUAL REPORT ON FORM 10-K
December 31, 2018
Table of Contents
|
Page
|
||
|
Part I
|
||
|
Item 1.
|
||
|
Item 1.A.
|
||
|
Item 1.B.
|
||
|
Item 2.
|
||
|
Item 3.
|
||
|
Item 4.
|
||
|
Part II
|
||
|
Item 5.
|
||
|
Item 6.
|
||
|
Item 7.
|
||
|
Item 7.A.
|
||
|
Item 8.
|
||
|
Item 9.
|
||
|
Item 9.A.
|
||
|
Item 9.B.
|
||
|
Part III
|
||
|
Item 10.
|
||
|
Item 11.
|
||
|
Item 12.
|
||
|
Item 13.
|
||
|
Item 14.
|
||
|
Part IV
|
||
|
Item 15.
|
||
2
Forward-Looking Statements
When used in this report and in public stockholder communications, in other documents of Banc of California, Inc. (the Company, we, us and our) filed with or furnished to the Securities and Exchange Commission (the SEC), or in oral statements made with the approval of an authorized executive officer, the words or phrases “believe,” “will,” “should,” “will likely result,” “are expected to,” “will continue,” “is anticipated,” “estimate,” “project,” “plans,” “guidance” or similar expressions are intended to identify “forward-looking statements” within the meaning of the Private Securities Litigation Reform Act of 1995. You are cautioned not to place undue reliance on any forward-looking statements, which speak only as of the date made. These statements may relate to our future financial performance, strategic plans or objectives, revenue, expense or earnings projections, or other financial items. By their nature, these statements are subject to numerous uncertainties that could cause actual results to differ materially from those anticipated in the statements.
Factors that could cause actual results to differ materially from the results anticipated or projected include, but are not limited to, the following:
|
i.
|
an ongoing investigation by the SEC as well as any related litigation or other litigation may result in adverse findings, reputational damage, the imposition of sanctions, increased costs and other negative consequences;
|
|
ii.
|
the costs and effects of litigation generally, including legal fees and other expenses, settlements and judgments;
|
|
iii.
|
the risk that we will not be successful in our efforts to transition to a core commercial banking platform;
|
|
iv.
|
the risks associated with any acquisitions we make of other banks, bank branches, other assets or other businesses;
|
|
v.
|
the risks that additional capital will not be available when needed and the risk that funds obtained from capital raising activities will not be utilized efficiently or effectively;
|
|
vi.
|
the risk that the savings we actually realize from our reduction in force and planned reduction in use of third party advisors will be less than anticipated and the risk that the costs associated with the reduction in force will be greater than anticipated;
|
|
vii.
|
the credit risks of lending activities, which may be affected by deterioration in real estate markets and the financial condition of borrowers, and the operational risk of lending activities, including but not limited to the effectiveness of our underwriting practices and the risk of fraud, any of which credit and operational risks may lead to increased loan and lease delinquencies, losses and non-performing assets in our loan and lease portfolio, and may result in our allowance for loan and lease losses not being adequate to cover actual losses and require us to materially increase our loan and lease loss reserves;
|
|
viii.
|
the quality and composition of our securities portfolio, which includes a large portfolio of collateralized loan obligations;
|
|
ix.
|
changes in general economic conditions, either nationally or in our market areas, or changes in financial markets;
|
|
x.
|
continuation of or changes in the historically low short-term interest rate environment, changes in the levels of general interest rates, volatility in the interest rate environment, the relative differences between short- and long-term interest rates, deposit interest rates, our net interest margin and funding sources;
|
|
xi.
|
fluctuations in the demand for loans and leases, the number of unsold homes and other properties and fluctuations in commercial and residential real estate values in our market area;
|
|
xii.
|
our ability to develop and maintain a strong core deposit base or other low cost funding sources necessary to fund our activities;
|
|
xiii.
|
results of examinations of us by regulatory authorities and the possibility that any such regulatory authority may, among other things, limit our business activities, require us to change our business mix, increase our allowance for loan and lease losses, write-down asset values, or increase our capital levels, or affect our ability to borrow funds or maintain or increase deposits, any of which could adversely affect our liquidity and earnings;
|
|
xiv.
|
legislative or regulatory changes that adversely affect our business, including, without limitation, changes in tax laws and policies and changes in regulatory capital or other rules, and the availability and resources to address and respond to such changes;
|
|
xv.
|
our ability to control operating costs and expenses;
|
|
xvi.
|
staffing fluctuations in response to product demand or the implementation of corporate strategies that affect our work force and potential associated charges;
|
|
xvii.
|
the risk that our implementation of new lines of business and/or new products and services will be unsuccessful or subject us to increased regulatory scrutiny or other legal risks;
|
|
xviii.
|
errors in estimates of the fair values of certain of our assets and liabilities, which may result in significant changes in valuation;
|
|
xix.
|
the network and computer systems on which we depend could fail or experience a security breach;
|
|
xx.
|
our ability to attract and retain key members of our senior management team;
|
|
xxi.
|
increased competitive pressures among financial services companies;
|
|
xxii.
|
changes in consumer spending, borrowing and saving habits;
|
|
xxiii.
|
the effects of severe weather, natural disasters, acts of war or terrorism and other external events on our business;
|
|
xxiv.
|
the ability of key third-party providers to perform their obligations to us;
|
|
xxv.
|
the dependency of our single family residential mortgage loan origination business on third party mortgage brokers who are not contractually obligated to do business with us;
|
|
xxvi.
|
changes in accounting policies and practices, as may be adopted by the financial institution regulatory agencies or the Financial Accounting Standards Board (FASB) or their application to our business, including additional guidance and interpretation on accounting issues and details of the implementation of new accounting methods;
|
|
xxvii.
|
share price volatility and reputational risks, related to, among other things, speculative trading and certain traders shorting our common shares and attempting to generate negative publicity about us;
|
|
xxviii.
|
the risk that our enterprise risk management framework may not be effective in mitigating risk and reducing the potential for losses; and
|
|
xxix.
|
other economic, competitive, governmental, regulatory, and technological factors affecting our operations, pricing, products and services and the other risks described in this report and from time to time in other documents that we file with or furnish to the SEC, including, without limitation, the risks described under “Part I. Item 1A. Risk Factors” of this Annual Report on Form 10-K.
|
The Company undertakes no obligation to update any such statement to reflect circumstances or events that occur after the date, on which the forward-looking statement is made, except as required by law.
3
PART I
Item 1. Business
General
Banc of California, Inc. is a financial holding company regulated by the Board of Governors of the Federal Reserve System (the Federal Reserve Board or FRB) and the parent company of Banc of California, National Association (the Bank), a California-based bank regulated by the Office of the Comptroller of the Currency (the OCC).
Banc of California, Inc. was incorporated under Maryland law in March 2002, and was formerly known as "First PacTrust Bancorp, Inc.", and changed its name to “Banc of California, Inc.” in July 2013. Unless the context indicates otherwise, all references to “Banc of California, Inc.” refer to Banc of California, Inc. excluding its consolidated subsidiaries and all references to the “Company,” “we,” “us” or “our” refer to Banc of California, Inc. including its consolidated subsidiaries.
The principal executive office of the Company is located at 3 MacArthur Place, Santa Ana, California, and its telephone number is (855) 361-2262.
The reports, proxy statements and other information that Banc of California, Inc. files with the SEC, as well as news releases, are available free of charge through the Company’s Internet site at http://www.bancofcal.com. This information can be found on the “News and Events” or “Investor relations” pages of our Internet site. Annual reports on Form 10-K, quarterly reports on Form 10-Q, current reports on Form 8-K, and amendments to those reports filed and furnished pursuant to Section 13(a) of the Exchange Act are available as soon as reasonably practicable after they have been filed or furnished to the SEC. Reference to the Company’s Internet address is not intended to incorporate any of the information contained on our Internet site into this document.
Business Overview
The Company is focused on California and core banking products and services designed to cater to the unique needs of California's diverse private businesses, entrepreneurs and communities through its
32
full service branches in San Diego, Orange, Santa Barbara, and Los Angeles Counties. Through the Bank and its predecessors, the Company has served California markets since 1941. The Company offers a variety of financial products and services designed around its target client in order to serve all of their banking and financial needs. Deposit and banking product and service offerings include checking, savings, money market, certificates of deposit, and retirement accounts. Additional product and service offerings include automated bill payment, cash and treasury management, master demand accounts, foreign exchange, interest rate swaps, card payment services, remote and mobile deposit capture, automated clearing house origination, wire transfer, direct deposit, and safe deposit boxes. Lending activities are focused on providing financing to California’s diverse private businesses, entrepreneurs, and communities, and loans are often secured by California commercial and residential real estate.
Significant Transactions
Banc Home Loans Sale
On March 30, 2017, the Company completed the sale of specific assets and activities related to its Banc Home Loans division to Caliber Home Loans, Inc. (Caliber). The Banc Home Loans division largely represented the Company's Mortgage Banking segment, the activities of which related to originating, servicing, underwriting, funding and selling residential mortgage loans. Assets sold to Caliber included mortgage servicing rights (MSRs) on certain conventional agency residential mortgage loans. The Banc Home Loans division, along with certain other mortgage banking related assets and liabilities that were to be sold or settled separately within one year, is classified as discontinued operations in the accompanying Consolidated Statements of Financial Condition and Consolidated Statements of Operations. Certain components of the Company’s Mortgage Banking segment, including MSRs on certain conventional government single family residential (SFR) mortgage loans that were not sold as part of the Banc Home Loans sale and the repurchase reserves related to previously sold loans, have been classified as continuing operations in the financial statements as they remain part of the Company’s ongoing operations.
The Company received a
$25.0 million
cash premium payment, in addition to the net book value of certain assets acquired by Caliber, totaling
$2.5 million
, upon the closing of the transaction. Caliber also purchased the MSRs of
$37.8 million
on approximately
$3.86 billion
in unpaid balances of conventional agency mortgage loans, subject to adjustment under certain circumstances. The entire transaction resulted in a net gain on disposal of
$15.2 million
in total for the years ended December 31, 2018 and 2017.
Additionally, the Company could receive an earn-out, payable quarterly, based on future performance over the 38 months following completion of the transaction. During the years ended December 31, 2018 and 2017, the Company recognized earn-out payments of $2.8 million and $1.1 million, respectively. Since the completion of the transaction, the Company has recognized a total earn-out of $4.0 million in Income from Discontinued Operations on the Consolidated Statements of Operations. Caliber retains an option to buy out the future earn-out payable to the Company for cash consideration of $35.0
4
million, less the aggregate amount of all earn-out payments made prior to the date on which Caliber pays the buyout amount. For additional information, see Note 2 to Consolidated Financial Statements included in Item 8 of this Annual Report on Form 10-K.
Commercial Equipment Finance Business Sale
On October 27, 2016, the Company sold its Commercial Equipment Finance business unit from its Commercial Banking segment to Hanmi Bank, a wholly owned subsidiary of Hanmi Financial Corporation (Hanmi). As part of the transaction, Hanmi acquired
$217.2 million
of equipment leases diversified across the U.S. with concentrations in California, Georgia and Texas. An additional
$25.4 million
of equipment leases were transferred during December 2016. Hanmi retained most of the Company’s former Commercial Equipment Finance employees. The Company recorded a gain on sale of business unit of
$2.6 million
on its Consolidated Statements of Operations during the year ended December 31, 2016. For additional information, see Note 2 to Consolidated Financial Statements included in Item 8 of this Annual Report on Form 10-K.
The Palisades Group Sale
On May 5, 2016, the Company completed the sale of all of its membership interests in The Palisades Group, a wholly owned subsidiary of the Company, to an entity wholly owned by Stephen Kirch and Jack Macdowell, who serve as the Chief Executive Officer and Chief Investment Officer of The Palisades Group. As part of the sale, The Palisades Group issued to the Company a
10 percent
,
$5.0 million
note due May 5, 2018 (the Note). The Company recognized a gain on sale of subsidiary of
$3.7 million
on its Consolidated Statements of Operations during the year ended December 31, 2016. On September 28, 2016, the Note was paid in full in cash prior to maturity and the Company recognized an additional gain of
$2.8 million
, which is included in Other Income on the Consolidated Statements of Operations for the year ended December 31, 2016. For additional information, see Note 2 to Consolidated Financial Statements included in Item 8 of this Annual Report on Form 10-K.
Lending Activities
General
The Company offers a number of commercial and consumer loan products including commercial and industrial loans; commercial real estate loans; multifamily loans; construction and renovation loans; SFR mortgage loans; warehouse loans; asset, insurance or security-backed loans; home equity lines of credit (HELOCs); consumer and business lines of credit; and other consumer loans.
Legal lending limits are calculated in conformance with OCC regulations, which prohibit a national bank from lending to any one individual or entity or its related interests on any amount that exceeds 15 percent of a bank’s capital and surplus, plus an additional 10 percent of a bank’s capital and surplus, if the amount that exceeds a bank’s 15 percent general limit is fully secured by readily marketable collateral. At
December 31, 2018
, the Bank’s authorized legal lending limits for loans to one borrower were
$168.0 million
for unsecured loans and an additional
$112.0 million
for specific secured loans.
At
December 31, 2018
, the Company's total loans and leases held-for-investment and loans held-for-sale were
$7.70 billion
or
72.4 percent
of total assets and
$8.1 million
or
0.1 percent
of total assets, respectively, compared to
$6.66 billion
or
64.5 percent
of total assets and
$67.1 million
or
0.6 percent
of total assets at
December 31, 2017
, respectively. For additional information concerning changes in loans and leases, see "Loans and Leases Receivable, Net" and "Loans Held-for-Sale" included in Item 7 of this Annual Report on Form 10-K.
5
Risk Governance
The Company conducts its business activities under a system of risk governance controls. Key elements of the Company's risk governance structure include the risk appetite framework and risk appetite statement. The risk appetite framework adopted by the Company has been developed in conjunction with the Company’s strategic and capital plans. The strategic and capital plans articulate the Board of Director's (Board's) approved statement of financial condition, loan concentration targets and the appropriate level of capital to manage our risks properly.
The risk appetite framework includes policies, procedures, controls, and systems through which the risk appetite is established, communicated, and monitored. The risk appetite framework utilizes a risk assessment process to identify inherent risks across the Company, gauges the effectiveness of the Company's internal controls, and establishes tolerances for residual risk in each of the following risk categories: strategic, reputational, earnings, capital, liquidity, asset quality (credit), market, operational, people, and diversification/concentration. Each risk category is assigned a qualitative statement as well as specific, measurable, risk metrics. The risk metrics have variance thresholds established which indicate whether the metric is within tolerance or at variance to plan. Variances are reported regularly to both executive management and to the Board and require remediation measures or risk acceptance, as appropriate.
The risk appetite framework includes a risk appetite statement, risk limits, and an outline of roles and responsibilities of those overseeing the implementation and monitoring of the framework. The risk appetite statement is an expression of the maximum level of residual risk that the Company is prepared to accept in order to achieve the Company's business objectives. Defining, communicating, and monitoring risk appetite are fundamental to a safe and sound control environment and a risk-focused culture. The Board of Directors establishes the Company’s strategic objectives and approves the Company’s risk appetite statement, which is developed in collaboration with the Company's executive leadership. The executive team translates the Board-approved strategic objectives and the risk appetite statement into targets and constraints for business lines and legal entities to follow.
The risk appetite framework is supported by an enterprise risk management program. Enterprise risk management at the Company and Bank integrates all risk efforts under one common framework. Key elements of enterprise risk management that are intended to support prudent lending activities include:
|
•
|
Policies—The Company's loan policy articulates the credit culture of the Company's lending business and provides clarity around encouraged and discouraged lending activities. Additional policies cover key business segments of the portfolio (for example, the Company's Commercial Real Estate Policy) and other important aspects supporting the Bank's lending activities (for example, policies relating to appraisals, risk ratings, fair lending, etc.).
|
|
•
|
Credit Approval Authorities—All material credit exposures of the Company are approved by a credit risk management group that is independent of the business units with the exception of SFR mortgage loans that have been provided delegated authority within the approved credit policy. Above this threshold, credit approvals are made by the chief credit officer or an executive management credit committee of the Bank. The joint credit and enterprise risk committees of the Company's Board of Directors and the Bank's Board of Directors review and approve material loan pool purchases, divestitures, and any other transactions as appropriate.
|
|
•
|
Concentration Risk Management Policy—To mitigate and manage the risk within the Company's loan portfolio, the Board of Directors of the Bank adopted a concentration risk management policy, pursuant to which it expects to review and revise concentration risk to tolerance thresholds at least annually and otherwise from time to time as appropriate. It is anticipated that these concentration risk to tolerance thresholds may change at any time when the Board of Directors is considering material strategic initiatives such as acquisitions, new product launches and terminations of products or other factors as the Board of Directors believes appropriate. The Company has developed procedures relating to the appropriate actions to be taken should management seek to increase the concentration guidelines or exceed the guideline maximum based on various factors. Concentration risk to tolerance thresholds are intended to aid management and the Board to ensure that the loan concentrations are consistent with the Board’s risk appetite.
|
|
•
|
Stress Testing—The Company has developed a stress test policy and stress testing methodology as a tool to evaluate our loan portfolio, capital levels and strategic plan with the objective of ensuring that our loan portfolio and balance sheet concentrations are consistent with the Board-approved risk appetite and strategic and capital plans.
|
|
•
|
Loan Portfolio Management—The Company has an internal asset review committee that formally reviews the loan portfolio on a regular basis. Risk rating trends, loan portfolio performance, including delinquency status, and the resolution of problem assets are reviewed and evaluated.
|
|
•
|
Commercial Real Estate Loan Pricing, Multifamily Loan Pricing and Residential Loan Pricing—Regular discussions occur between the areas of executive management, Treasury, Capital Markets, Credit and Risk Management and the business units with regard to the pricing of the Company's loan products. These groups meet to ensure that the Company is pricing its products appropriately and consistently with the Company's strategic and capital plans.
|
6
Commercial and Industrial Loans
Commercial and industrial loans are made to finance operations, provide working capital, finance the purchase of fixed assets, equipment or real property, business acquisitions and warehousing lending. A borrower’s cash flow from operations is generally the primary source of repayment. Accordingly, the Company's policies provide specific guidelines regarding debt coverage and other financial ratios. Commercial and industrial loans include lines of credit, commercial term loans and owner occupied commercial real estate loans. Commercial lines of credit are extended to businesses generally to finance operations, working capital needs and finance mortgage loans. Commercial term loans are typically made to finance the acquisition of fixed assets, refinance short-term debt originally used to purchase fixed assets or make business acquisitions. Owner occupied commercial real estate loans are extended to purchase or refinance real property and are usually 50 percent or more occupied by the underlying business and the business's cash flow is the primary source of repayment.
Commercial and industrial loans are extended based on the financial strength and integrity of the borrower and guarantor(s) and are generally collateralized by the borrower's assets such as mortgage loans, accounts receivable, inventory, equipment or real estate and typically have a term of 1-5 years.
Commercial and industrial loans may be unsecured, for well-capitalized and highly profitable borrowers. The interest rates on these loans generally are adjustable and usually are indexed to The Wall Street Journal’s prime rate (Prime Rate) or London Interbank Offered Rate (LIBOR) and will vary based on market conditions and be commensurate to the perceived credit risk. Where it can be negotiated, loans are written with a floor rate of interest. Some of the owner-occupied commercial real estate loans may be fixed for periods of up to 10 years and many have prepayment penalties. Commercial and industrial loans generally are made to businesses that have had profitable operations, and have a conservative debt-to-net worth ratio, good payment histories as evidenced by credit reports, acceptable working capital, and operating cash flow sufficient to demonstrate the ability to pay obligations as they become due.
The Company’s commercial and industrial loan policy includes credit file documentation and analysis of the borrower’s background, capacity to repay the loan, the adequacy of the borrower’s capital and collateral as well as an evaluation of global conditions affecting the borrower and the industry in which they participate. Detailed analysis of the borrower’s past, present and future cash flow is also an important aspect of the credit analysis, as it is the Company's primary source of repayment. In addition, commercial and industrial loans are typically monitored periodically to provide an early warning for deteriorating cash flow. All commercial and industrial loans must have well-defined primary and secondary or, at times, tertiary sources of repayment.
In order to mitigate the risk of borrower default, the Company generally requires collateral to support the credit and, in the case of loans made to businesses, personal guarantees from their owners. The Company attempts to control the risk by generally requiring loan-to-value (LTV) ratios of not more than 80 percent (owner occupied commercial real estate loans are typically 75 percent or less if SBA loans) and by regularly monitoring the amount and value of the collateral in order to maintain that ratio. However, the collateral securing the loans may depreciate over time, may be difficult to appraise and may fluctuate in value based on the success of the business. Because of the potential value reduction, the availability of funds for the repayment of commercial and industrial loans may be substantially dependent on the success of the business itself, which, in turn, is often dependent, in part, upon general economic conditions. See “Asset Quality” under "Loans and Leases Receivable, Net" included in Item 7 of this Annual Report on Form 10-K.
Commercial and industrial loan growth also assists in the growth of the Company's deposits because many commercial and industrial loan borrowers establish deposit accounts and treasury banking services relationships. Those deposit accounts help the Company to reduce the overall cost of funds and those banking service relationships provide a source of noninterest fee income.
Commercial Real Estate and Multifamily Loans
Commercial real estate and multifamily loans are secured primarily by multifamily dwellings, industrial/warehouse buildings, anchored and non-anchored retail centers, office buildings and, on a limited basis, hospitality properties primarily located in the Company’s market area.
The Company’s loans secured by commercial real estate and multifamily properties are originated with either a fixed or an adjustable interest rate. The interest rate on adjustable rate loans is based on a variety of indices, generally determined through negotiation with the borrower. LTV ratios on these loans typically do not exceed 75 percent of the appraised value of the property securing the loan. These loans typically require monthly payments, may contain balloon payments and generally have maturities of 15 years with maximum maturities of 30 years for multifamily loans and 10 years for commercial real estate loans.
7
Loans secured by commercial real estate and multifamily properties are underwritten based on the income producing potential of the property and the financial strength of the borrower and/or guarantor. The net operating income, which is the income derived from the operation of the property less all operating expenses, must be sufficient to cover the payments related to the outstanding debt. The Company generally requires an assignment of rents or leases in order to be assured that the cash flow from the project will be used to repay the debt. Appraisals on properties securing commercial real estate and multifamily loans are performed by independent state licensed appraisers approved by management. In order to monitor the adequacy of cash flows on income-producing properties, the borrower is generally required to provide periodic financial information. Because payments on loans secured by commercial real estate and multifamily properties are often dependent on the successful operation or management of the properties, repayment of these loans may be subject to adverse conditions in the real estate market or the economy. If the cash flow from the project is reduced, or if leases are not obtained or renewed, the borrower’s ability to repay the loan may be impaired. See “Asset Quality” under "Loans and Leases Receivable, Net" included in Item 7 of this Annual Report on Form 10-K.
Small Business Administration Loans
The Company provides numerous SBA loan products through the Bank. The Bank’s Preferred Lender Program status generally gives it the authority to make the final credit decision and have most servicing and liquidation authority. The Company provides the following SBA products:
|
•
|
7(a)—These loans provide the Bank with a guarantee from the SBA for up to 85 percent of the loan amount for loans up to $150,000 and 75 percent of the loan amount for loans of more than $150,000, with a maximum loan amount of $5 million. These are term loans that can be used for a variety of purposes including business acquisition, working capital, expansion, renovation, new construction, and equipment purchases. Depending on collateral, these loans can have terms ranging from 7 to 25 years. The guaranteed portion of these loans is often sold into the secondary market.
|
|
•
|
Cap Lines—In general, these lines are guaranteed up to 75 percent and are typically used for working capital purposes and secured by accounts receivable and/or inventory. These lines are generally allowed in amounts up to $5 million and can be issued with maturities of up to 5 years.
|
|
•
|
504 Loans—These are real estate loans in which the lender can advance up to 90 percent of the purchase price; retain 50 percent as a first trust deed; and have a Certified Development Company (CDC) retain the second trust deed for 40 percent of the total cost. CDCs are licensed by the SBA. Required equity of the borrower is 10 percent. Terms of the first trust deed are typically similar to market rates for conventional real estate loans, while the CDC establishes rates and terms for the second trust deed loan.
|
|
•
|
SBA Express—These loans offer a 50 percent guaranty by the SBA and are made in amounts up to a maximum of $350,000. These loans are typically revolving lines and have maturities of up to 7 years.
|
SBA loans are subject to federal legislation that can affect the availability and funding of the program. This dependence on legislative funding might cause future limitations and uncertainties with regard to the continued funding of such programs, which could potentially have an adverse financial impact on our business. The Company’s portfolio of SBA loans is subject to certain risks, including, but not limited to: (i) the effects of economic downturns on the economy; (ii) interest rate increases; (iii) deterioration of the value of the underlying collateral; and (iv) deterioration of a borrower's or guarantor's financial capabilities. The Company attempts to mitigate these risks through: (i) reviewing each loan request and renewal individually; (ii) adhering to written loan policies; (iii) adhering to SBA policies and regulations; (iv) obtaining independent third party appraisals; and (v) obtaining external independent credit reviews. SBA loans normally require monthly installment payments of principal and interest and therefore are continually monitored for past due conditions. In general, the Company receives and reviews financial statements and other documents of borrowers on an ongoing basis during the term of the relationship and responds to any deterioration identified.
Construction Loans
The Company provides short-term construction loans primarily relating to single family or multifamily residential properties. Construction loans are typically secured by first deeds of trust and guarantees of the borrower. The economic viability of the projects, borrower’s creditworthiness, and borrower’s and contractor’s experience are primary considerations in the loan underwriting decision. The Company utilizes independent state licensed appraisers approved by management and monitors projects during construction through inspections and a disbursement program tied to the percentage of completion of each project. The Company may, in the future, originate or purchase loans or participations in construction, renovation and rehabilitation loans on residential, multifamily and/or commercial real estate properties.
Lease Financing
On October 27, 2016, the Company sold its Commercial Equipment Finance business unit. For financial information, see Note 2 to Consolidated Financial Statements included in Item 8 of this Annual Report on Form 10-K.
8
Single Family Residential Mortgage Loans
The Company originates mortgage loans secured by a first deed of trust on single family residences mainly throughout California. The Company offers non-conforming SFR mortgage loans where the loan amount exceeds Fannie Mae or Freddie Mac limits, or the loans otherwise do not conform to Fannie Mae or Freddie Mac guidelines.
The Company’s residential lending activities include both a direct-to-consumer retail residential lending business and a wholesale and correspondent mortgage business. In the retail business, the Company's loan officers are located either in the Company's call center in Santa Ana or full service branches in San Diego, Orange, Santa Barbara and Los Angeles Counties, and originate mortgage loans directly to consumers. The wholesale mortgage business originates SFR mortgage loans submitted to the Company by outside mortgage brokers for underwriting and funding. The correspondent mortgage business acquires residential mortgage loans originated by third parties. The Company does not originate loans defined as high cost by state or federal regulators.
The Company generally underwrites SFR mortgage loans based on the applicant’s income and credit history and the appraised value of the subject property. Properties securing SFR mortgage loans are appraised by independent fee appraisers approved by management. The Company requires borrowers to obtain title insurance, hazard insurance, and flood insurance, if necessary. A majority of SFR mortgage loans originated by the Company are made to finance the purchase or the refinance of existing loans on owner occupied homes with a smaller percentage used to finance non-owner occupied homes.
The Company originates SFR mortgage loans on either a fixed or an adjustable rate basis, as consumer demand and the Bank’s risk management dictates. The Company’s pricing strategy for SFR mortgage loans includes setting interest rates that are competitive with other local financial institutions and mortgage originators.
Adjustable Rate Mortgage (ARM) loans are offered with flexible initial repricing dates, ranging from 1 to 10 years, and periodic repricing dates through the life of the loan. The Company uses a variety of indices to reprice ARM loans. During the year ended
December 31, 2018
, the Company originated
$1.01 billion
of held-for-investment SFR ARM loans with terms up to 30 years.
Of total SFR mortgage loans at
December 31, 2018
,
$59.3 million
, or
2.6 percent
, were fixed rate, and
$2.25 billion
, or
97.4 percent
, were adjustable rate. Of total SFR mortgage loans at
December 31, 2017
,
$380 thousand
, or
0.1 percent
, were fixed rate, and
$2.06 billion
, or
99.9 percent
, were adjustable rate.
The Company also offers interest only loans, which have payment features that allow interest only payments during the first five or seven years during which time the interest rate is fixed before converting to fully amortizing payments. Following the expiration of the fixed interest rate period, the interest rate and payment begins to adjust on an annual basis, with fully amortizing payments that include principal and interest calculated over the remaining term of the loan. The loan can be secured by owner or non-owner occupied properties that include single family units and second homes. For additional information, see “Non-Traditional Mortgage Portfolio” and “Non-Traditional Mortgage Loan Credit Risk Management” under “Loans and Leases Receivable, Net” included in Item 7 of this Annual Report on Form 10-K.
Other Consumer Loans
The Company offers a variety of secured consumer loans, including second deed of trust home equity loans and HELOCs and loans secured by deposits. The Company also offers a limited amount of unsecured loans. The Company originates consumer loans primarily in its market area. Consumer loans generally have shorter terms to maturity or variable interest rates, which reduce the Company's exposure to changes in interest rates, and carry higher rates of interest than do SFR mortgage loans. Management believes that offering consumer loan products helps to expand and create stronger ties to the Company’s existing customer base by increasing the number of customer relationships and providing cross-marketing opportunities.
HELOCs have a seven or ten year draw period and require the payment of 1.0 percent or 1.5 percent of the outstanding loan balance per month (depending on the terms) or interest only payment during the draw period. Following receipt of payments, the available credit includes amounts repaid up to the credit limit. HELOCs with a ten-year draw period have a balloon payment due at the end of the draw period or then fully amortize for the remaining term. For loans with shorter-term draw periods, once the draw period has lapsed, generally, the payment is fixed based on the loan balance and prevailing market interest rates at that time.
The Company proactively monitors changes in the market value of all home loans contained in its portfolio. The most recent valuations were effective as of
October 17, 2018
. The Company has the right to adjust, and has adjusted, existing lines of credit to address current market conditions subject to the terms of the loan agreement and covenants. At
December 31, 2018
, unfunded commitments totaled
$69.3 million
on consumer lines of credit. Consumer loan terms vary according to the type of collateral, length of contract and creditworthiness of the borrower.
9
Investment Activities
The general objectives of the Company's investment portfolio are to provide liquidity when loan and lease demand is high, to assist in maintaining earnings when loan and lease demand is low and to provide a relatively stable source of interest income while satisfactorily managing risk, including credit risk, reinvestment risk, liquidity risk and interest rate risk. For additional information, see Item 7A of this Annual Report on Form 10-K.
Currently, the Company primarily invests in collateralized loan obligations. Historically, in addition to collateralized loan obligations, the Company has invested in SBA loan pool securities, U.S. government agency and U.S. government sponsored enterprise (GSE) residential mortgage-backed securities, non-agency residential mortgage-backed securities, non-agency commercial mortgage-backed securities, and corporate bonds.
As an investor in CLOs, we purchase specific tranches, or slices, of debt instruments that are secured by professionally managed portfolios of senior secured loans to corporations. CLOs are not secured by residential or commercial mortgages. CLO managers are typically large non-bank financial institutions or banks. CLOs are typically $300 million to $1 billion in size, contain 100 or more loans, and have five to six credit tranches ranging from AAA, AA, A, BBB, BB, B and equity tranche. Interest and principal are paid out to the AAA tranche first then move down the capital stack. Losses are borne by the equity tranche first then move up the capital stack. CLOs typically have subordination levels that range from approximately
33 percent
to
39 percent
for AAA,
20 percent
to
28 percent
for AA,
15 percent
to
18 percent
for A and
10 percent
to
14 percent
for BBB.
The CLOs we currently hold may, from time to time, not be actively traded, and under certain market conditions may be relatively illiquid investments, and volatility in the CLO trading market may cause the value of these investments to decline. The market value of CLOs may be affected by, among other things, perceived changes in the economy, performance by the manager and performance of the underlying loans.
Although we attempt to mitigate the credit and liquidity risks associated with CLOs by purchasing CLOs with credit ratings of A or higher and by maintaining a pre-purchase due diligence and ongoing review process by a dedicated credit administration team, no assurance can be given that these risk mitigation efforts will be successful.
Sources of Funds
General
The Company’s primary sources of funds are deposits, certificates of deposits, sales of loans and investment securities, payments on and maturities of outstanding loans and leases and investment securities, and other short-term investments and funds provided from operations. While scheduled payments from loans and leases and investment securities, and maturing investment securities and short-term investments are relatively predictable sources of funds, deposit flows and loan and lease prepayments are greatly influenced by general interest rates, economic conditions, and competition. In addition, the Company invests excess funds in short-term interest-earning assets, which provide liquidity to meet lending requirements. The Company also generates cash through borrowings. The Company mainly utilizes Federal Home Loan Bank (FHLB) advances to leverage its capital base, to provide funds for its lending activities, as a source of liquidity, and to enhance its interest rate risk management.
Deposits
The Company offers a variety of deposit products to consumers, businesses, and institutional customers with a wide range of interest rates and terms. The Company's deposits consist of interest-bearing and noninterest-bearing demand accounts, savings accounts, money market deposit accounts, and certificates of deposit. The Company solicits deposits primarily in its market area, excluding brokered deposits. The Company primarily relies on competitive pricing policies, marketing and customer service to attract and retain deposits. The flow of deposits is influenced significantly by general economic conditions, prevailing interest rates and competition. The variety of deposit products the Company offers has allowed the Company to be competitive in obtaining funds and to respond with flexibility to changes in demand from actual and prospective consumer, business and institutional customers.
The Company tries to manage the pricing of deposits in keeping with the Company's asset/liability management, liquidity and profitability objectives, subject to market competitive factors. Based on the Company's experience, the Company believes that the Company's deposits are relatively stable sources of funds. Despite this stability, the Company's ability to attract and maintain these deposits and the rates paid on them have been and will continue to be significantly affected by market conditions.
Core deposits, which we define as interest-bearing and noninterest-bearing demand deposits, savings, money market deposit accounts, and certificates of deposit, excluding brokered and certain legacy high-rate, high-volatility deposits, increased
$579.4 million
during the year ended
December 31, 2018
and totaled
$6.21 billion
at
December 31, 2018
, representing
78.4 percent
of total deposits on that date. The run-off of the legacy high-rate, high-volatility deposits was completed during the first quarter of 2018. The Company held brokered deposits of
$1.71 billion
, or
21.6 percent
of total deposits, at
December 31, 2018
.
10
Borrowings
Although deposits are the Company's primary source of funds, the Company may utilize borrowings when they are a less costly source of funds and can be invested at a positive interest rate spread, when the Company desires additional capacity to fund loan and lease demand or when they meet the Company's asset/liability management goals to diversify funding sources and enhance interest rate risk management.
The Company utilizes FHLB advances and securities sold under repurchase agreements to leverage its capital base, to provide funds for its lending activities, to provide a source of liquidity, and to enhance its interest rate risk management. The Company also has the ability to borrow from the Federal Reserve Bank of San Francisco (Federal Reserve Bank), as well as through unsecured federal funds lines with correspondent banks. The Company may obtain advances from the FHLB by collateralizing the advances with certain of the Company’s loans and investment securities. These advances may be made pursuant to several different credit programs, each of which has its own interest rate, range of maturities and call features. At
December 31, 2018
, the Company had
$1.52 billion
in FHLB advances outstanding and the ability to borrow an additional
$1.35 billion
.
Availabilities and terms on securities sold under repurchase agreements are subject to the counterparties' discretion and pledging additional investment securities. At
December 31, 2018
, the Company had
no
securities sold under repurchase agreements. During the year ended December 31, 2017, the Company voluntarily terminated a line of credit of
$75.0 million
that was maintained at Banc of California, Inc. with an unaffiliated financial institution. The Company also had the ability to borrow
$60.6 million
from the Federal Reserve Bank and
$210.0 million
from unsecured federal funds lines with correspondent banks as of
December 31, 2018
. For additional information, see Note 11 to Consolidated Financial Statements included in Item 8 of this Annual Report on Form 10-K.
In addition, the Company has borrowed through the issuance of its senior notes and junior subordinated amortizing notes. The Company had
$173.2 million
in outstanding senior notes at
December 31, 2018
. During the year ended December 31, 2017, the Company made the final installment payments on the junior subordinated amortizing notes. For additional information, see Note 12 to Consolidated Financial Statements included in Item 8 of this Annual Report on Form 10-K.
Competition and Market Area
The Company faces strong competition in originating real estate and other loans and in attracting deposits. Competition in originating real estate loans comes primarily from other commercial banks, savings institutions, credit unions and mortgage bankers. Other commercial banks, savings institutions, credit unions and finance companies provide vigorous competition in consumer and commercial lending. The Company attracts deposits through its community banking branch network, its Treasury function and through the internet. Consequently, the Company has the ability to service client needs with a variety of deposit accounts and products at competitive rates. Competition for deposits is principally from other commercial banks, savings institutions, and credit unions, as well as mutual funds, broker dealers, registered investment advisors, investment banks financial institutions, financial service companies, and other alternative investments.
Based on the most recent branch deposit data as of
June 30, 2018
provided by the Federal Deposit Insurance Corporation (FDIC), the Bank's share of deposits in Los Angeles, Orange, San Diego, and Santa Barbara counties was as follows:
|
June 30, 2018
|
||
|
Los Angeles County
|
0.63
|
%
|
|
Orange County
|
3.28
|
%
|
|
San Diego County
|
0.53
|
%
|
|
Santa Barbara County
|
0.52
|
%
|
Employees
At
December 31, 2018
, the Company had a total of
730
full-time employees and
11
part-time employees. The Company's employees are not represented by any collective bargaining group. Management considers its employee relations to be satisfactory.
Regulation and Supervision
General
The Company is extensively regulated under federal laws. As a financial holding company, Banc of California, Inc. is subject to the Bank Holding Company Act of 1956, as amended (the BHCA), and its primary regulator is the FRB. As a national bank, the Bank is subject to regulation primarily by the OCC. In addition, the Bank is also subject to backup regulation from the FDIC.
Regulation and supervision by the federal banking agencies is intended primarily for the protection of customers and depositors and the Deposit Insurance Fund administered by the FDIC and not for the benefit of stockholders. Set forth below is a brief
11
description of material information regarding certain laws and regulations that are applicable to the Company and the Bank. This description, as well as other descriptions of laws and regulations in this Form 10-K, is not complete and is qualified in its entirety by reference to applicable laws and regulations.
Dodd-Frank Wall Street Reform and Consumer Protection Act
The Dodd-Frank Wall Street Reform and Consumer Protection Act (the Dodd-Frank Act) enacted on July 1, 2010 is one of the most significant pieces of financial legislation since the 1930s. The Dodd-Frank Act and FRB policy require requires that bank holding companies, such as the Company, act as a source of financial and managerial strength for their insured depository institution subsidiaries, such as the Bank, particularly when such subsidiaries are in financial distress. The FRB has extensive enforcement authority over the Company and the OCC has extensive enforcement authority over the Bank under federal law. Enforcement authority generally includes, among other things, the ability to assess civil money penalties, to issue cease-and-desist or removal orders and to initiate injunctive actions.
In general, these enforcement actions may be initiated for violations of laws and regulations and unsafe or unsound practices. Other actions or inactions may provide the basis for enforcement action, including misleading or untimely filing of reports. Except under certain circumstances, public disclosure of formal enforcement actions by the FRB and the OCC is required by law.
The Dodd-Frank Act made other significant changes to the regulation of bank holding companies and their subsidiary banks, including the regulation of the Company and the Bank, and other significant changes will continue to occur as rules are promulgated under the Dodd-Frank Act. These regulatory changes have had and will continue to have a material effect on the business and results of the Company and the Bank. The Dodd-Frank Act created the Consumer Financial Protection Bureau (CFPB), with the authority to promulgate regulations intended to protect consumers with respect to financial products and services, including those provided by the Bank, and to restrict unfair, deceptive or abusive conduct by providers of consumer financial products and services. The CFPB has issued rules under the Dodd-Frank Act affecting the Bank’s residential mortgage lending business, including ability-to-repay and qualified mortgage standards, mortgage servicing standards, loan originator compensation standards, high-cost mortgage requirements, appraisal and escrow standards and requirements for higher-priced mortgages. The activities of the Bank are also subject to regulation under numerous federal laws and state consumer protection statutes.
In addition to the Dodd-Frank Act, other legislative and regulatory proposals affecting banks have been made both domestically and internationally. Among other things, these proposals include significant additional capital and liquidity requirements and limitations on size or types of activity in which banks may engage.
Legislation is introduced from time to time in the United States Congress that may affect our operations. In addition, the regulations governing us may be amended from time to time. Any legislative or regulatory changes in the future, including those resulting from the Dodd-Frank Act, could adversely affect our operations and financial condition.
2018 Regulatory Reform
In May 2018 the Economic Growth, Regulatory Relief and Consumer Protection Act (the “Economic Growth Act”), was enacted to modify or remove certain financial reform rules and regulations, including some of those implemented under the Dodd-Frank Act. The Economic Growth Act, among other matters, directs the federal banking regulators to simplify the regulatory capital rules for financial institutions and their holding companies with total consolidated assets of less than $10 billion and includes regulatory relief regarding stress testing, mortgage disclosures and risk weights for certain high-risk commercial real estate loans, among other items. It is difficult at this time to predict when or how new standards under the Economic Growth Act will ultimately be applied, what specific impact this legislation and the yet-to-be-written implementing rules and regulations will have.
Banc of California, Inc.
As a bank holding company that has elected to become a financial holding company pursuant to the BHCA, Banc of California, Inc. may engage in activities permitted for bank holding companies and may affiliate with securities firms and insurance companies and engage in other activities that are financial in nature or incidental or complementary to activities that are financial in nature. “Financial in nature” activities include securities underwriting, dealing and market making; sponsoring mutual funds and investment companies; insurance underwriting and agency; and merchant banking. See “Volcker Rule” below.
Banc of California, Inc. is required to register and file reports with, and is subject to regulation and examination by the FRB. The FRB’s approval is required for the acquisition of the Company, or the acquisition by the Company, of another financial institution or holding company thereof, and, under certain circumstances, the Company’s acquisition of other subsidiaries.
As a bank holding company, Banc of California, Inc. is subject to the regulations of the FRB imposing capital requirements for a bank holding company, which establish a capital framework as described in “Capital Requirements” below. As of
12
December 31, 2018
, Banc of California, Inc. was considered well-capitalized, with capital ratios in excess of those required to qualify as such.
Under the FRB’s policy statement on the payment of cash dividends, a bank holding company should pay cash dividends only to the extent that its net income for the past year is sufficient to cover both the cash dividends and a rate of earnings retention that is consistent with the company’s capital needs, asset quality, and overall financial condition. A bank holding company must give the FRB prior notice of any purchase or redemption of its equity securities if the consideration for the purchase or redemption, when combined with the consideration for all such purchases or redemptions in the preceding 12 months, is equal to 10 percent or more of its consolidated net worth. Notice to the FRB would include, but may not be limited to, background information on a redemption, pro-forma financial statements that reflect the planned transaction including impact to the Company and stress testing that incorporates the transaction. The FRB may disapprove such a purchase or redemption if it determines that the proposal would be an unsafe or unsound practice or would violate any law, regulation, FRB order, or condition imposed in writing by the FRB. This notification requirement does not apply to a bank holding company that qualifies as well-capitalized, received a composite rating and a rating for management of “1” or “2” in its last examination and is not subject to any unresolved supervisory issue. Regarding dividends, see "Capital Requirements" below.
The Bank
The Bank is subject to a variety of requirements under federal law. The Bank is required to maintain sufficient liquidity to ensure safe and sound operations. For additional information, see "Liquidity" included in Item 7 of this Annual Report on Form 10-K.
The OCC has adopted guidelines establishing safety and soundness standards on such matters as loan and lease underwriting and documentation, asset quality, earnings standards, internal controls and audit systems, interest rate risk exposure, and compensation and other employee benefits. Any institution which fails to comply with these standards must submit a compliance plan.
The FRB requires all depository institutions to maintain noninterest bearing reserves at specified levels against their transaction accounts, primarily checking, NOW and Super NOW checking accounts. At
December 31, 2018
, the Bank was in compliance with these reserve requirements.
FDIC Insurance
The deposits of the Bank are insured up to the applicable limits by the FDIC, and such insurance is backed by the full faith and credit of the United States Government. The basic deposit insurance limit is generally $250,000. As insurer, the FDIC imposes deposit insurance premiums and is authorized to conduct examinations of and to require reporting by FDIC-insured institutions. The Bank’s deposit insurance premiums for the year ended
December 31, 2018
were
$5.8 million
. FDIC-insured institutions are required to pay an additional quarterly assessment called the FICO assessment in order to fund the interest on bonds issued to resolve thrift failures in the 1980s. This assessment will continue until the bonds mature in the years 2017 through 2019. For the fiscal year ended
December 31, 2018
, the Bank paid
$279 thousand
in FICO assessments.
The FDIC assesses deposit insurance premiums quarterly on each FDIC-insured institution based on annualized rates. Each institution with $10 billion or more in assets is assessed under a scorecard method using supervisory ratings, financial ratios and other factors. Such institutions are also subject to a temporary surcharge required by the Dodd-Frank Act which was discontinued for assessment periods commencing after September 30, 2018. As required by the Dodd-Frank Act, deposit insurance premiums are assessed on the amount of an institution’s total assets minus its branch Tier 1 capital. Smaller institutions are assessed by a method using supervisory ratings and financial ratios.
Capital Requirements
The Company and the Bank are subject to capital regulations adopted by the FRB and the OCC. The current regulations, which became effective January 1, 2015 (with some changes being phased in over several years), establish required minimum ratios for common equity Tier 1 (CET1) capital, Tier 1 capital and total capital and a leverage ratio; set risk-weighting for assets and certain other items for purposes of the risk-based capital ratios; require an additional capital conservation buffer over the minimum required capital ratios; and define what qualifies as capital for purposes of meeting the capital requirements. Under these capital regulations, the minimum capital ratios are: (i) a CET1 capital ratio of 4.5 percent of total risk-weighted assets; (ii) a Tier 1 capital ratio of 6.0 percent of total risk-weighted assets; (iii) a total capital ratio of 8.0 percent of total risk-weighted assets; and (iv) a leverage ratio (the ratio of Tier 1 capital to average total consolidated assets) of 4.0 percent.
CET1 capital generally consists of common stock, retained earnings, accumulated other comprehensive income (AOCI) except where an institution elects to exclude AOCI from regulatory capital, and certain minority interests, subject to applicable regulatory adjustments and deductions, including deduction of certain amounts of mortgage servicing assets and certain deferred tax assets that exceed specified thresholds. The Company elected to permanently opt out of including AOCI in regulatory capital. Tier 1 capital generally consists of CET1 capital plus noncumulative perpetual preferred stock and certain additional items less applicable regulatory adjustments and deductions. Tier 2 capital generally consists of subordinated debt;
13
certain other preferred stock, and allowance for loan and lease losses up to 1.25 percent of risk-weighted assets, less applicable regulatory adjustments and deductions. Total capital is the sum of Tier 1 capital and Tier 2 capital.
Assets and certain off-balance sheet items are assigned risk-weights ranging from 0 percent to 1,250 percent, reflecting credit risk and other risk exposure, to determine total risk-weighted assets for the risk-based capital ratios. For some items, risk-weights have changed compared to their risk-weights under rules in effect before January 1, 2015. These include a 150 percent risk-weight (up from 100 percent ) for certain high volatility commercial real estate acquisition, development and construction loans and for non-residential mortgage loans that are 90 days past due or otherwise in non-accrual status, a 20 percent (up from 0 percent) credit conversion factor for the unused portion of a commitment with an original maturity of one year or less that is not unconditionally cancellable, and a 250 percent risk-weight (up from 100 percent) for mortgage servicing and deferred tax assets that are not deducted from capital.
In addition to the minimum CET1, Tier 1, total capital and leverage ratios, the Company and the Bank must maintain a capital conservation buffer consisting of additional CET1 capital greater than 2.5 percent of risk-weighted assets above the required minimum risk-based capital levels in order to avoid limitations on paying dividends, engaging in share repurchases, and paying discretionary bonuses. The phase-in of the capital conservation buffer requirement began on January 1, 2016, when a buffer greater than 0.625 percent of risk-weighted assets was required, which amount increased each year until the buffer requirement became fully implemented on January 1, 2019.
The OCC may establish an individual minimum capital requirement for a particular bank, based on its circumstances, which may vary from what would otherwise be required. The OCC has not imposed such a requirement on the Bank.
To be considered well-capitalized, the Company must maintain on a consolidated basis a total risk-based capital ratio of 10.0 percent or more, a Tier 1 risk-based capital ratio of 8.0 percent or more and not be subject to any written agreement, capital directive or prompt corrective action directive issued by the FRB to meet and maintain a specific capital level for any capital measure. For the well-capitalized standard applicable to the Bank, see “Prompt Corrective Action” below.
Although the Company continues to evaluate the impact that the capital rules will have on the Company and the Bank, management anticipates that the Company and the Bank will remain well-capitalized, and will meet the capital conservation buffer requirement.
Prompt Corrective Action
The Bank is required to maintain specified levels of regulatory capital under the capital and prompt corrective action regulations of the OCC. To be adequately capitalized, an institution must have the minimum capital ratios discussed in “Capital Requirements” above. To be well-capitalized, an institution must have a CET1 risk-based capital ratio of at least 6.5 percent, Tier 1 risk-based capital ratio of at least 8.0 percent, a total risk-based capital ratio of at least 10.0 percent and a leverage ratio of at least 5.0 percent, and not be subject to any written agreement, capital directive or prompt corrective action directive issued by its primary Federal banking regulator to meet and maintain a specific capital level for any capital measure. Institutions that are not well-capitalized are subject to certain restrictions on brokered deposits and interest rates on deposits.
The OCC is authorized and, under certain circumstances, required to take certain actions against an institution that is less than adequately capitalized. Such an institution must submit a capital restoration plan, including a specified guarantee by its holding company, and until the plan is approved by the OCC, the institution may not increase its assets, acquire another institution, establish a branch or engage in any new activities, and generally may not make capital distributions.
For institutions that are not at least adequately capitalized, progressively more severe restrictions generally apply as capital ratios decrease or if the OCC reclassifies an institution into a lower capital category due to unsafe or unsound practices or unsafe or unsound condition. Such restrictions may cover all aspects of operations and may include a forced merger or acquisition. An institution that becomes “critically undercapitalized” because it has a tangible equity ratio of 2.0 percent or less is generally subject to the appointment of the FDIC as receiver or conservator for the institution within 90 days after it becomes critically undercapitalized. The imposition by the OCC of any of these measures on the Bank may have a substantial adverse effect on its operations and profitability.
Anti-Money Laundering and Suspicious Activity
Several federal laws, including the Bank Secrecy Act, the Money Laundering Control Act and the Uniting and Strengthening America by Providing Appropriate Tools Required to Intercept and Obstruct Terrorism Act of 2001 (the Patriot Act) require all financial institutions, including banks, to implement policies and procedures relating to anti-money laundering, compliance, suspicious activities, and currency transaction reporting and due diligence on customers. The Patriot Act also requires federal bank regulators to evaluate the effectiveness of an applicant in combating money laundering when determining whether to approve a proposed bank acquisition.
14
Community Reinvestment Act
The Bank is subject to the provisions of the Community Reinvestment Act (CRA). Under the terms of the CRA, the Bank has a continuing and affirmative obligation, consistent with safe and sound operation, to help meet the credit needs of its community, including providing credit to individuals residing in low- and moderate-income neighborhoods. The CRA does not establish specific lending requirements or programs for financial institutions, and does not limit an institution’s discretion to develop the types of products and services that it believes are best suited to its particular community in a manner consistent with the CRA.
The OCC regularly assesses the Bank on its record in meeting the credit needs of the communities it serves, including low-income and moderate-income neighborhoods. In the uniform four-tier- rating system used by federal banking agencies in assessing CRA performance, an "Outstanding" rating is the top tier rating. This CRA rating deals strictly with how well an institution is meeting its responsibilities under the CRA and the OCC takes into account performance under the CRA when considering a bank’s application to establish or relocate a branch or main office or to merge with, acquire assets, or assume liabilities of another insured depository institution. The bank’s record may be the basis for denying the application.
Performance under the CRA also is considered when the FRB reviews applications to acquire, merge or consolidate with another banking institution or its holding company. In the case of a bank holding company applying for approval to acquire a bank, the FRB will assess the records of each subsidiary depository institution of the applicant bank holding company, and that record may be the basis for denying the application.
Financial Privacy Under the Requirements of the Gramm-Leach-Bliley Act
The Company and its subsidiaries are required periodically to disclose to their retail customers the Company’s policies and practices with respect to the sharing of nonpublic customer information with its affiliates and others, and the confidentiality and security of that information. Under the Gramm-Leach-Bliley Act (the GLBA), retail customers also must be given the opportunity to “opt out” of information-sharing arrangements with non-affiliates, subject to certain exceptions set forth in the GLBA.
Limitations on Transactions with Affiliates and Loans to Insiders
Transactions between the Bank and any affiliate are governed by Sections 23A and 23B of the Federal Reserve Act. An affiliate of a bank is generally any company or entity which controls, is controlled by or is under common control with the bank but which is not a subsidiary of the bank. The Company and its subsidiaries are affiliates of the Bank. Generally, Section 23A limits the extent to which the Bank or its subsidiaries may engage in “covered transactions” with any one affiliate to an amount equal to 10.0 percent of the Bank’s capital stock and surplus, and limits all such transactions with all affiliates to an amount equal to 20.0 percent of such capital stock and surplus. Section 23B applies to “covered transactions” as well as certain other transactions and requires that all transactions be on terms substantially the same, or at least as favorable to the Bank, as those provided to a non-affiliate. The term “covered transaction” includes a loan by the Bank to an affiliate, the purchase of or investment in securities issued by an affiliate by the Bank, the purchase of assets by the Bank from an affiliate, the acceptance by the Bank of securities issued by an affiliate as collateral security for a loan or extension of credit to any person or company, or the issuance by the Bank of a guarantee, acceptance or letter of credit on behalf of an affiliate. Loans by the Bank to an affiliate must be collateralized.
In addition, Sections 22(g) and (h) of the Federal Reserve Act place restrictions on loans to executive officers, directors and principal stockholders of the Bank and its affiliates. Under Section 22(h), aggregate loans to a director, executive officer or greater than 10.0 percent stockholder of the Bank or any of its affiliates, and certain related interests of such a person may generally not exceed, together with all other outstanding loans to such person and related interests, 15.0 percent of the Bank’s unimpaired capital and surplus, plus an additional 10.0 percent of unimpaired capital and surplus for loans that are fully secured by readily marketable collateral having a value at least equal to the amount of the loan. Section 22(h) also requires that loans to directors, executive officers and principal stockholders be made on terms substantially the same as those offered in comparable transactions to other persons, and not involve more than the normal risk of repayment or present other unfavorable features.
There is an exception for loans that are made pursuant to a benefit or compensation program that (i) is widely available to employees of the Bank or its affiliate and (ii) does not give preference to any director, executive officer or principal stockholder or certain related interests over other employees of the Bank or its affiliate. Section 22(h) also requires prior board approval for certain loans. In addition, the aggregate amount of all loans to all of the executive officers, directors and principal stockholders of the Bank or its affiliates and certain related interests may not exceed 100.0 percent of the institution’s unimpaired capital and surplus. Furthermore, Section 22(g) places additional restrictions on loans to executive officers.
The Company and its affiliates, including the Bank, maintain programs to meet the limitations on transactions with affiliates and restrictions on loans to insiders and the Company believes it and the Bank are currently in compliance with these requirements.
15
Identity Theft
Under the Fair and Accurate Credit Transactions Act (FACT Act), the Bank is required to develop and implement a written Identity Theft Prevention Program to detect, prevent and mitigate identity theft “red flags” in connection with the opening of certain accounts or certain existing accounts. Under the FACT Act, the Bank is required to adopt reasonable policies and procedures to (i) identify relevant red flags for covered accounts and incorporate those red flags into the program: (ii) detect red flags that have been incorporated into the program; (iii) respond appropriately to any red flags that are detected to prevent and mitigate identity theft; and (iv) ensure the program is updated periodically, to reflect changes in risks to customers or to the safety and soundness of the financial institution or creditor from identity theft.
The Bank maintains a program to meet the requirements of the FACT Act and the Bank believes it is currently in compliance with these requirements.
Consumer Protection Laws and Regulations; Other Regulations
The Bank and its affiliates are subject to a broad array of federal and state consumer protection laws and regulations that govern almost every aspect of its business relationships with consumers, including but not limited to the Truth-in-Lending Act, the Truth in Savings Act, the Electronic Funds Transfer Act, the Expedited Funds Availability Act, the Equal Credit Opportunity Act, the Fair Housing Act, the Secure and Fair Enforcement in Mortgage Licensing Act, the Real Estate Settlement Procedures Act, the Home Mortgage Disclosure Act, the Fair Credit Reporting Act, the Fair Debt Collection Practices Act, the Service Members Civil Relief Act, the Right to Financial Privacy Act, the Home Ownership and Equity Protection Act, the Consumer Leasing Act, the Fair Credit Billing Act, the Homeowners Protection Act, the Check Clearing for the 21st Century Act, laws governing flood insurance, federal and state laws prohibiting unfair and deceptive business practices, foreclosure laws and various regulations that implement the foregoing. Among other things, these laws and regulations mandate certain disclosure requirements and regulate the manner in which financial institutions must deal with customers when taking deposits, making loans, collecting loans and providing other services. If the Bank fails to comply with these laws and regulations, it may be subject to various penalties.
The Dodd-Frank Act established the CFPB as an independent bureau within the Federal Reserve System that is responsible for regulating consumer financial products and services under federal consumer financial laws. The CFPB has broad rulemaking authority with respect to these laws. The Company and the Bank are subject to CFPB’s regulations regarding consumer financial services and products and to supervision and examination by the CFPB with respect to federal consumer protection laws and regulations. The CFPB has issued numerous regulations, and is expected to continue to do so in the next few years. The CFPB’s rulemaking, examination and enforcement authority has significantly affected, and is expected to continue to significantly affect, financial institutions involved in the provision of consumer financial products and services, including the Company and the Bank.
Restrictions on residential mortgages were also promulgated under the Dodd-Frank Act. The provisions include (i) a requirement that lenders make a determination that at the time a residential mortgage loan is consummated the consumer has a reasonable ability to repay the loan and related costs; (ii) a ban on loan originator compensation based on the interest rate or other terms of the loan (other than the amount of the principal); (iii) a ban on prepayment penalties for certain types of loans; (iv) bans on arbitration provisions in mortgage loans; and (v) requirements for enhanced disclosures in connection with the making of a loan. The Dodd-Frank Act also imposes a variety of requirements on entities that service mortgage loans.
The OCC must approve an acquisition of the Bank and the Bank’s acquisition of other financial institutions and certain other acquisitions, and its establishment of branches. Generally, the Bank may branch de novo nationwide, but branching by acquisition may be restricted by applicable state law.
The Bank’s general limit on loans to one borrower is 15 percent of its capital and surplus, plus an additional 10 percent of its capital and surplus if the amount of loans greater than 15 percent of capital and surplus is fully secured by readily marketable collateral. Capital and surplus means Tier 1 and Tier 2 capital plus the amount of allowance for loan and lease losses not included in Tier 2 capital. The Bank has no loans in excess of its loans-to-one borrower limit.
OCC regulations impose various restrictions on the ability of a bank to make capital distributions, which include dividends, stock redemptions or repurchases, and certain other items. Generally, a bank may make capital distributions during any calendar year equal to up to 100 percent of net income for the year-to-date plus retained net income for the two preceding years without prior OCC approval. However, the OCC may restrict dividends by an institution deemed to be in need of more than normal supervision. Dividends can also be restricted if the capital conservation buffer requirement is not met.
The Bank is a member of the FHLB, which makes loans or advances to members. All advances are required to be fully secured by sufficient collateral as determined by the FHLB. To be a FHLB member, financial institutions must demonstrate that they originate and/or purchase long-term home mortgage loans or mortgage-backed securities. The Bank is required to purchase and maintain stock in the FHLB. At
December 31, 2018
, the Bank had
$41.0 million
in FHLB stock, which was in compliance with this requirement.
16
Volcker Rule
The federal banking agencies have adopted regulations to implement the provisions of the Dodd-Frank Act known as the Volcker Rule. Under the regulations, FDIC-insured depository institutions, their holding companies, subsidiaries and affiliates (collectively, banking entities), are generally prohibited, subject to certain exemptions, from proprietary trading of securities and other financial instruments and from acquiring or retaining an ownership interest in a “covered fund.”
Trading in certain government obligations is not prohibited. These include, among others, obligations of or guaranteed by the United States or an agency or GSE of the United States, obligations of a State of the United States or a political subdivision thereof, and municipal securities. Proprietary trading generally does not include transactions under repurchase and reverse repurchase agreements, securities lending transactions and purchases and sales for the purpose of liquidity management if the liquidity management plan meets specified criteria; nor does it generally include transactions undertaken in a fiduciary capacity.
The term “covered fund” can include, in addition to many private equity and hedge funds and other entities, certain collateralized mortgage obligations, collateralized debt obligations and collateralized loan obligations, and other items, but it does not include wholly owned subsidiaries, certain joint ventures, or loan securitizations generally, if the underlying assets are solely loans. The term “ownership interest” includes not only an equity interest or a partnership interest, but also an interest that has the right to participate in selection or removal of a general partner, managing member, director, trustee or investment manager or advisor; to receive a share of income, gains or profits of the fund; to receive underlying fund assets after all other interests have been redeemed; to receive all or a portion of excess spread; or to receive income on a pass-through basis or income determined by reference to the performance of fund assets. In addition, “ownership interest” includes an interest under which amounts payable can be reduced based on losses arising from underlying fund assets.
Activities eligible for exemptions include, among others, certain brokerage, underwriting and marketing activities, and risk-mitigating hedging activities with respect to specific risks and subject to specified conditions.
Future Legislation or Regulation
In light of recent conditions in the United States economy and the financial services industry, the Trump administration, Congress, the regulators and various states continue to focus attention on the financial services industry. Additional proposals that affect the industry have been, and will likely continue to be, introduced. The Company cannot predict whether any of these proposals will be enacted or adopted or, if they are, the effect they would have on our business, the Company's operations or financial condition.
Item 1A. Risk Factors
An investment in our securities is subject to certain risks. These risk factors should be considered by prospective and current investors in our securities when evaluating the disclosures in this Annual Report on Form 10-K. The risks and uncertainties not presently known to us or that we currently deem immaterial also may impair our business operations. If any of the following risks actually occur, our business, results of operations and financial condition could suffer. In that event, the value of our securities could decline, and you may lose all or part of your investment.
Risks Relating to Our Business and Operating Environment
The primary focus of our business strategy is transitioning to a core commercial banking platform, which presents a number of challenges and risks.
For most of our operating history, reflecting the Bank’s roots as a thrift institution, the vast majority of our loans were secured by single family residential real estate. The Bank converted from a federal savings bank to a national bank in 2013, and we remain in the process of transitioning to a core commercial banking platform. At December 31, 2018, commercial loans totaled
$5.33 billion
, or
69.2 percent
of total loans and leases held for investment, as compared to
$1.04 billion
, or
42.7 percent
of total loans and leases held for investment, at December 31, 2013. Commercial loans at December 31, 2018 were principally comprised of commercial real estate and multifamily loans and commercial and industrial loans, totaling
$3.11 billion
and
$1.94 billion
, respectively, and representing
40.4 percent
and
25.2 percent
, respectively, of total loans and leases held for investment. As a general matter, commercial real estate and multifamily loans and commercial and industrial loans are higher yielding, but have a greater risk of loss, than single family residential real estate loans. See “--Our income property loans, consisting of commercial real estate and multifamily loans, involve higher principal amounts than other loans and repayment of these loans may be dependent on factors outside our control or the control of our borrowers” and “--Repayment of our commercial and industrial loans is often dependent on the cash flows of the borrower, which may be unpredictable, and the collateral securing these loans may not be sufficient to repay the loan in the event of default.”
As part of our efforts to transition to a core commercial banking platform, we are focused on marketing our products and services to small and medium-sized businesses. These businesses generally have fewer financial resources in terms of capital or borrowing capacity than larger entities. They are generally more vulnerable to economic downturns and may not have the capital needed to compete against their larger, more capitalized competitors. Additionally, their continued success is frequently
17
contingent on a small group of owners or senior management, and the death, disability or resignation of one or more such individuals could also have a material effect on the business and its ability to repay its loan obligations.
Building out our core commercial banking platform has required us to make a significant investment in human capital. During the fourth quarter of 2018, we added 13 new hires to our Business Banking team and may add more new hires in the future. No assurance can be given that we will be able to retain the recent hires or attract and retain additional new hires with the requisite qualifications. The expanded Business Banking team has been tasked with growing relationships and market share while delivering a tailored client experience. A key marker of success in this area will be growth in core deposits, which we define as interest-bearing and noninterest-bearing demand deposits, savings, money market deposit accounts, and certificates of deposit of $250,000 or less, excluding brokered deposits, to provide a less costly and more stable source of funding. It may prove difficult to grow our core deposit base. See “--We may not be able to expand our core deposit base or other low cost funding sources.”
If we are not successful in our efforts to transition to a core commercial banking platform, this could adversely affect our business, financial condition and results of operations.
To the extent we acquire other banks, bank branches, other assets or other businesses, we may be negatively impacted by certain risks inherent with such acquisitions.
Acquiring other banks, bank branches, other assets or other businesses involves various risks, including the risks of incorrectly assessing the credit quality of acquired assets, encountering greater than expected costs of integrating acquired banks, branches or businesses, the risk of loss of customers and/or employees of the acquired bank, branch or business, executing cost savings measures, not achieving revenue enhancements and otherwise not realizing the transaction’s anticipated benefits. Our ability to address these matters successfully cannot be assured. There is also the risk that the requisite regulatory approvals might not be received and other conditions to consummation of a transaction might not be satisfied during the anticipated timeframes, or at all. In addition, pursuing an acquisition may divert resources or management’s attention from ongoing business operations, may require investment in integration and in development and enhancement of additional operational and reporting processes and controls, and may subject us to additional regulatory scrutiny. To finance an acquisition, we may borrow funds, thereby increasing our leverage and diminishing our liquidity, or raise additional capital, which could dilute the interests of our existing stockholders.
An ongoing investigation by the SEC, as well as any related litigation or other litigation, may result in adverse findings, reputational damage, the imposition of sanctions, increased costs, diversion of management time and resources and other negative consequences, which could adversely affect our financial condition and future operating results.
Beginning on October 18, 2016, various anonymous blog posts raised questions about related party transactions, concerns over director independence and other issues, including suggestions that the Company was controlled by an individual who pled guilty to securities fraud in matters unrelated to us. In response to these allegations, the Company's Board of Directors formed a Special Committee consisting solely of independent directors to investigate the allegations. The Special Committee conducted its investigation with the assistance of independent legal counsel and did not find evidence that the individual named in the blog posts had any direct or indirect control or undue influence over the Company.
Furthermore, the inquiry did not find any violations of law or evidence establishing that any loan, related party transaction, or any other circumstance impaired the independence of any director. However, the Special Committee did find that certain public statements made by the Company in October 2016 regarding an earlier inquiry into these matters were not fully accurate.
On January 12, 2017, the Company received a formal order of investigation issued by the SEC and a subpoena seeking documents primarily related to certain of the issues that the Special Committee reviewed. The Company has been fully cooperating with the SEC in this investigation.
The SEC investigation could lead to the institution of civil or administrative proceedings against the Company as well as against individuals currently or previously associated with the Company. Any such proceedings or threatened proceedings might result in the imposition of monetary fines or other sanctions against the named parties. Resulting sanctions could include remedial measures that might prove costly or disruptive to our business. Additionally, as discussed under Item 3 in Part I of this Annual Report on Form 10-K, a consolidated class action lawsuit was filed against the Company on January 23, 2017, and other lawsuits have been filed against the Company by former officers and others. In addition to the risk of fines, sanctions, or monetary judgments, the SEC investigation and lawsuits may cause the Company to incur significant attorneys’ fees, both with regards to counsel representing the Company and with regards to indemnity obligations incurred by the Company.
The pendency of the SEC investigation and any resulting litigation or sanctions, as well as the pending lawsuits (or any other lawsuits) could harm our reputation, leading to a loss of existing and potential customers, and our ability to attract and retain deposits and greater difficulty in securing financing or other developments which could adversely affect our liquidity, financial condition and future operating results.
18
In addition, management time and resources have been and will continue to be diverted to address the investigation and any related litigation, as well as the pending lawsuits, and we have incurred and may continue to incur significant legal and other expenses in our defense of the investigation and any related litigation as well as the pending lawsuits.
We are reducing the overall size of our organization, and we may encounter difficulties in managing our business as a result of this reduction or attrition that may follow this reduction. In addition, we may not achieve anticipated savings from the reduction.
On June 26, 2018, we began implementing a reduction in force to reduce our workforce by approximately 9% of total staffing. The reduction in force resulted in the loss of some longer-term employees, the loss of institutional knowledge and expertise and the reallocation and combination of certain roles and responsibilities across the organization, all of which could adversely affect our operations. Given the complexity and nature of our business, we must continue to implement and improve our managerial, operational and financial systems, manage our facilities and continue to recruit and retain qualified personnel. This could be made more challenging by the reduction in force and additional measures we may take to reduce costs, including our planned reduction in use of third party advisors. As a result, our management may need to divert a disproportionate amount of its attention away from our day-to-day strategic and operational activities and devote a substantial amount of time to managing these organizational changes. Further, the restructuring and additional cost containment measures may have unintended consequences, such as attrition beyond our intended reduction in force and reduced employee morale. Employees who were not affected by the reduction in force may seek alternate employment, which could require us to obtain contract support at unplanned additional expense.
We estimated that we will recognize annual savings of approximately $15.0 million from the reduction in force and planned reduction in use of third party advisors. We incurred severance-related costs during the year ended 2018 of
$4.4 million
, pre-tax, as a result of the reduction in force. It is possible that the actual savings we realize from the reduction in force and our planned reduction in use of third party advisors will be less than anticipated and the costs associated with the reduction in force will be greater than anticipated.
Our financial condition and results of operations are dependent on the economy, particularly in the Bank’s market areas. A worsening in economic conditions in the market areas we serve may impact our earnings adversely and could increase the credit risk of our loan and lease portfolio.
Our primary market area is concentrated in the greater San Diego, Orange, Santa Barbara, and Los Angeles counties. Adverse economic conditions in any of these areas can reduce our rate of growth, affect our customers’ ability to repay loans and leases and adversely impact our financial condition and earnings. General economic conditions, including inflation, unemployment and money supply fluctuations, also may affect our profitability adversely.
A deterioration in economic conditions in the market areas we serve could result in the following consequences, any of which could have a material adverse effect on our business, financial condition and results of operations:
|
•
|
Demand for our products and services may decline;
|
|
•
|
Loan and lease delinquencies, problem assets and foreclosures may increase;
|
|
•
|
Collateral for our loans and leases may further decline in value; and
|
|
•
|
The amount of our low cost or noninterest-bearing deposits may decrease.
|
We cannot accurately predict the possibility of weakness in the national or local economy effecting our future operating results.
We cannot accurately predict the possibility of the national or local economy’s return to recessionary conditions or to a period of economic weakness, which would adversely impact the markets we serve. Any deterioration in national or local economic conditions would have an adverse effect, which could be material, on our business, financial condition, results of operations and prospects, and any economic weakness could present substantial risks for the banking industry and for us.
19
The enacted tax reform legislation effective January 1, 2018 is expected to have a significant impact on the Company and our financial condition and results of operations could be negatively affected by the broader implications of the legislation.
The Tax Cuts and Jobs Act was signed into law in December 2017, which included a number of provisions that will have impact on the banking industry, and on the borrowers and the market for residential and commercial real estate. Changes include a lower limit on the deductibility of interest on residential mortgage loans and home equity loans; a limitation on the deductibility of business interest expense; a limitation on the deductibility of property taxes and state and local income taxes, etc. The new law's limitation on the mortgage interest deduction and state and local tax deduction for individual taxpayers is expected to increase the after-tax cost of owning a home for many of our potential and existing customers and potentially lead to reduced demand for new residential mortgage loans that we originate. The value of the properties securing loans in our loan portfolio may be adversely impacted as a result of the changing economics of home ownership, which could require an increase in our provision for loan losses, which would reduce our profitability and could materially adversely affect our business, financial condition and results of operations. Further, these changes implemented by the new tax law could make some businesses and industries less inclined to borrow, potentially reducing demand for the Company’s commercial loan products. Finally, we may be negatively impacted more than our competitors because our business strategy focuses on California, which has a higher cost real estate market compared to other states.
We are also subject to potential tax audits in various jurisdictions and in such event, tax authorities may disagree with certain positions we have taken and assess penalties or additional taxes. While we assess regularly the likely outcomes of these potential audits, there can be no assurance that we will accurately predict the outcome of a potential audit, and an audit could have a material adverse impact on our business, results of operations, and financial condition.
Severe weather, natural disasters, acts of war or terrorism and other external events could significantly impact our business.
Severe weather, natural disasters such as earthquakes and wildfires, acts of war or terrorism and other adverse external events could have a significant impact on our ability to conduct business. Such events could affect the stability of our deposit base, impair the ability of our borrowers to repay their outstanding loans, cause significant property damage or otherwise impair the value of collateral securing our loans, and result in loss of revenue and/or cause us to incur additional expenses. Although we have established disaster recovery plans and procedures, and we monitor the effects of any such events on our loans, properties and investments, the occurrence of any such event could have a material adverse effect on us or our earnings or our financial condition.
There are risks associated with our lending activities and our allowance for loan and lease losses may prove to be insufficient to absorb actual incurred losses in our loan and lease portfolio.
Lending money is a substantial part of our business. Every loan and lease carries a certain risk that it will not be repaid in accordance with its terms or that any underlying collateral will not be sufficient to assure repayment. This risk is affected by, among other things:
|
•
|
Cash flow of the borrower and/or the project being financed;
|
|
•
|
In the case of a collateralized loan or lease, the changes and uncertainties as to the future value of the collateral;
|
|
•
|
The credit history of a particular borrower;
|
|
•
|
Changes in economic and industry conditions; and
|
|
•
|
The duration of the loan or lease.
|
We maintain an allowance for loan and lease losses which we believe is appropriate to provide for probable incurred losses inherent in our loan and lease portfolio. The amount of this allowance is determined by our management through a periodic review and consideration of several factors, including, but not limited to:
|
•
|
An ongoing review of the quality, size and diversity of the loan and lease portfolio;
|
|
•
|
Evaluation of non-performing loans and leases;
|
|
•
|
Historical default and loss experience;
|
|
•
|
Historical recovery experience;
|
|
•
|
Existing economic conditions;
|
|
•
|
Risk characteristics of the various classifications of loans and leases; and
|
|
•
|
The amount and quality of collateral, including guarantees, securing the loans and leases.
|
20
If actual losses on our loans and leases exceed our estimates used to establish our allowance for loan and lease losses, our business, financial condition and profitability may suffer.
The determination of the appropriate level of the allowance for loan and lease losses inherently involves a high degree of subjectivity and requires us to make various assumptions and judgments about the collectability of our loan and lease portfolio, including the creditworthiness of our borrowers and the value of the real estate and other assets serving as collateral for the repayment of many of our loans and leases. In determining the amount of the allowance for loan and lease losses, we review our loans and leases and the loss and delinquency experience, and evaluate economic conditions and make significant estimates of current credit risks and future trends, all of which may undergo material changes. If our estimates are incorrect, the allowance for loan and lease losses may not be sufficient to cover losses inherent in our loan and lease portfolio, resulting in the need for additions to our allowance through an increase in the provision for loan and lease losses. Deterioration in economic conditions affecting borrowers, new information regarding existing loans and leases, identification of additional problem loans and leases and other factors, both within and outside of our control, may require an increase in the allowance for loan and lease losses. Our allowance for loan and lease losses was
0.81 percent
of total loans and leases held-for-investment and
282.0 percent
of non-performing loans and leases at December 31, 2018. In addition, bank regulatory agencies periodically review our allowance for loan and lease losses and may require an increase in the provision for loan and lease losses or the recognition of further charge-offs (which will in turn also require an increase in the provision for loan losses if the charge-offs exceed the allowance for loan losses), based on judgments different than that of management. Any increases in the provision for loan and lease losses will result in a decrease in net income and may have a material adverse effect on our financial condition and results of operations.
Our business may be adversely affected by credit risk associated with residential property and declining property values.
At December 31, 2018,
$2.35 billion
, or
30.5 percent
of our total loans and leases held-for-investment, was secured by SFR mortgage loans and HELOCs, as compared with
$2.11 billion
, or
31.7 percent
of our total loans and leases held-for-investment, at December 31, 2017. This type of lending is generally sensitive to regional and local economic conditions that significantly impact the ability of borrowers to meet their loan payment obligations, making loss levels difficult to predict. The decline in residential real estate values as a result of a downturn in the California housing markets may reduce the value of the real estate collateral securing these types of loans and increase the risk that we would incur losses if borrowers default on their loans. Residential loans with high combined loan-to-value ratios generally will be more sensitive to declining property values than those with lower combined loan-to-value ratios and therefore may experience a higher incidence of default and severity of losses. In addition, if the borrowers sell their homes, the borrowers may be unable to repay their loans in full from the sale proceeds. As a result, these loans may experience higher rates of delinquencies, defaults and losses, which will in turn adversely affect our financial condition and results of operations.
Our loan portfolio possesses increased risk due to our level of adjustable rate loans.
A substantial majority of our real estate secured loans held are adjustable rate loans. Any rise in prevailing market interest rates may result in increased payments for some borrowers who have adjustable rate mortgage loans, increasing the possibility of defaults.
Our underwriting practices may not protect us against losses in our loan portfolio.
We seek to mitigate the risks inherent in our loan portfolio by adhering to specific underwriting practices, including: analyzing a borrower’s credit history, financial statements, tax returns and cash flow projections; valuing collateral based on reports of independent appraisers; and verifying liquid assets. Although we believe that our underwriting criteria are, and historically have been, appropriate for the various kinds of loans we make, we have incurred losses on loans that have met these criteria, and may continue to experience higher than expected losses depending on economic factors and borrower behavior. In addition, our ability to assess the creditworthiness of our customers may be impaired if the models and approaches we use to select, manage, and underwrite our customers become less predictive of future behaviors, or in the case of borrower fraud. Finally, we may have higher credit risk, or experience higher credit losses, to the extent our loans are concentrated by loan type, industry segment, borrower type, or location of the borrower or collateral. At December 31, 2018,
78.7 percent
of our commercial real estate loans,
89.2 percent
of our multifamily loans and
66.7 percent
of our originated SFR mortgage loans were secured by collateral in southern California. Deterioration in real estate values and underlying economic conditions in southern California could result in significantly higher credit losses to our portfolio.
21
Our non-traditional and interest only single family residential loans expose us to increased lending risk.
Many of the residential mortgage loans we have originated for investment consist of non-traditional SFR mortgage loans that do not conform to Fannie Mae or Freddie Mac underwriting guidelines as a result of loan-to-value ratios or debt-to-income ratios, loan terms, loan size (exceeding agency limits) or other exceptions from agency underwriting guidelines. Moreover, many of these loans do not meet the qualified mortgage definition established by the Consumer Financial Protection Bureau, and therefore contain additional regulatory and legal risks. See "Rulemaking changes by the CFPB in particular are expected to result in higher regulatory and compliance costs that may adversely affect our financial condition and results of operations.” In addition, the secondary market demand for nonconforming mortgage loans generally is limited, and consequently, we may have a difficult time selling the nonconforming loans in our portfolio should we decide to do so.
In the case of interest only loans, a borrower’s monthly payment is subject to change when the loan converts to fully-amortizing status. Since the borrower’s monthly payment may increase by a substantial amount, even without an increase in prevailing market interest rates, the borrower might not be able to afford the increased monthly payment. In addition, interest only loans have a large, balloon payment at the end of the loan term, which the borrower may be unable to pay. Negative amortization involves a greater risk to us because credit risk exposure increases when the loan incurs negative amortization and the value of the home serving as collateral for the loan does not increase proportionally. Negative amortization is only permitted up to 110 percent of the original loan to value ratio during the first five years the loan is outstanding, with payments adjusting periodically as provided in the loan documents, potentially resulting in higher payments by the borrower. The adjustment of these loans to higher payment requirements can be a substantial factor in higher loan delinquency levels because the borrowers may not be able to make the higher payments. Also, real estate values may decline, and credit standards may tighten in concert with the higher payment requirement, making it difficult for borrowers to sell their homes or refinance their loans to pay off their mortgage obligations. For these reasons, interest only loans and negative amortization loans are considered to have an increased risk of delinquency, default and foreclosure than conforming loans and may result in higher levels of realized losses. Our
interest only loans increased during the year ended December 31, 2018, from
$717.5 million
, or
10.8 percent
of our total loans and leases held-for-investment, at December 31, 2017 to
$753.1 million
, or
9.8 percent
of our total loans and leases held-for-investment, at December 31, 2018.
Our income property loans, consisting of commercial real estate and multifamily loans, involve higher principal amounts than other loans and repayment of these loans may be dependent on factors outside our control or the control of our borrowers.
We originate commercial real estate and multifamily loans for individuals and businesses for various purposes, which are secured by commercial properties. These loans typically involve higher principal amounts than other types of loans, and repayment is dependent upon income generated, or expected to be generated, by the property securing the loan in amounts sufficient to cover operating expenses and debt service, which may be adversely affected by changes in the economy or local market conditions. For example, if the cash flow from the borrower’s project is reduced as a result of leases not being obtained or renewed in a timely manner or at all, the borrower’s ability to repay the loan may be impaired.
Commercial real estate and multifamily loans also expose us to credit risk because the collateral securing these loans often cannot be sold easily. In addition, many of our commercial real estate and multifamily loans are not fully amortizing and contain large balloon payments upon maturity. Such balloon payments may require the borrower to either sell or refinance the underlying property in order to make the payment, which may increase the risk of default or non-payment.
If we foreclose on a commercial real estate or multifamily loan, our holding period for the collateral typically is longer than for residential mortgage loans because there are fewer potential purchasers of the collateral. Additionally, commercial real estate and multifamily loans generally have relatively large balances to single borrowers or groups of related borrowers. Accordingly, if we make any errors in judgment in the collectability of our commercial real estate and multifamily loans, any resulting charge-offs may be larger on a per loan basis than those incurred with our residential or consumer loan portfolios. Our commercial real estate and multifamily loans increased during the year ended December 31, 2018, from
$2.53 billion
, or
38.0 percent
of our total loans and leases held-for-investment, at December 31, 2017 to
$3.11 billion
, or
40.4 percent
of our total loans and leases held-for-investment, at December 31, 2018.
22
Our portfolio of Green Loans subjects us to greater risks of loss.
We have a portfolio of Green Account home equity loans which generally have a fifteen year draw period with interest only payment requirements, and a balloon payment requirement at the end of the draw period. The Green Loans include an associated “clearing account” that allows all types of deposit and withdrawal transactions to be performed by the borrower during the term. We ceased originating new Green Loans in 2011; however, existing Green Loan borrowers are entitled to continue to draw on their Green Loans. Green Loans in our portfolio decreased during the year ended December 31, 2018, from
$85.8 million
, or
1.3 percent
of our total loans and leases held-for-investment, at December 31, 2017 to
$70.1 million
, or
0.91 percent
of our total loans and leases held-for-investment, at December 31, 2018.
In 2011, we implemented an information reporting system which allowed us to capture more detailed information than was previously possible, including transaction level data concerning our Green Loans. Although such transaction level data would have enabled us to more closely monitor trends in the credit quality of our Green Loans, we do not possess the enhanced transaction level data relating to the Green Loans for periods prior to the implementation of those enhanced systems. Although we do not believe that the absence of such historical data itself represents a material impediment to our current mechanisms for monitoring the credit quality of the Green Loans, until we compile sufficient transaction level data going forward we are limited in our ability to use historical information to monitor trends in the portfolio that might assist us in anticipating credit problems. Green Loans expose us to greater credit risk than other residential mortgage loans because they are non- amortizing and contain large balloon payments upon maturity.
Although the loans require the borrowers to make monthly interest payments, we are also subject to an increased risk of loss in connection with the Green Loans because payments due under the loans can be made by means of additional advances drawn by the borrower, up to the amount of the credit limit, thereby increasing our overall loss exposure due to negative amortization. The balloon payment due on maturity may require the borrower to either sell or refinance the underlying property in order to make the payment, which may increase the risk of default or non-payment. Our ability to take remedial actions in response to these additional risks of loss is limited by the terms and conditions of the Green Loans and our alternatives consist primarily of the ability to curtail additional borrowing when we determine that either the collateral value of the underlying real property or the creditworthiness of the borrower no longer supports the level of credit originally extended. Additionally, many of our Green Loans have larger balances than traditional residential mortgage loans, and accordingly, if the loans go into default either during the draw period or at maturity, any resulting charge-offs may be larger on a per loan basis than those incurred with traditional residential loans.
If our investments in other real estate owned are not properly valued or sufficiently reserved to cover actual losses, or if we are required to increase our valuation reserves, our earnings could be reduced.
We obtain updated valuations in the form of appraisals and broker price opinions when a loan has been foreclosed upon and the property is taken in as other real estate owned (OREO), and at certain other times during the asset’s holding period. Our net book value (NBV) in the loan at the time of foreclosure and thereafter is compared to the updated market value (fair value) of the foreclosed property less estimated selling costs. A charge-off is recorded for any excess in the asset’s NBV over its fair value. If our valuation process is incorrect, the fair value of our investments in OREO may not be sufficient to recover our NBV in such assets, resulting in the need for additional write-downs. Additional write-downs to our investments in OREO could have a material adverse effect on our financial condition and results of operations. Our bank regulators periodically review our OREO and may require us to recognize further write-downs. Any increase in our write-downs, as required by such regulator, may have a material adverse effect on our financial condition and results of operations. As of December 31, 2018, we had OREO of
$672 thousand
.
Repayment of our commercial and industrial loans is often dependent on the cash flows of the borrower, which may be unpredictable, and the collateral securing these loans may not be sufficient to repay the loan in the event of default.
We make our commercial and industrial loans primarily based on the identified cash flow of the borrower and secondarily on the underlying collateral provided by the borrower. Collateral securing commercial and industrial loans may depreciate over time, be difficult to appraise and fluctuate in value. In the case of loans secured by accounts receivable, the availability of funds for the repayment of these loans may be substantially dependent on the ability of the borrower to collect the amounts due from its customers. As of December 31, 2018, our commercial and industrial loans totaled
$1.94 billion
, or
25.2 percent
of our total loans and leases held-for-investment.
23
We are exposed to risk of environmental liabilities with respect to real properties which we may acquire.
In prior years, due to weakness of the U.S. economy and, more specifically, the California economy, including higher levels of unemployment than the nationwide average and declines in real estate values, certain borrowers have been unable to meet their loan repayment obligations and, as a result, we have had to initiate foreclosure proceedings with respect to and take title to a number of real properties that had collateralized their loans. As an owner of such properties, we could become subject to environmental liabilities and incur substantial costs for any property damage, personal injury, investigation and clean-up that may be required due to any environmental contamination that may be found to exist at any of those properties, even though we did not engage in the activities that led to such contamination. In addition, if we are the owner or former owner of a contaminated site, we may be subject to common law claims by third parties seeking damages for environmental contamination emanating from the site. If we were to become subject to significant environmental liabilities or costs, our business, financial condition, results of operations and prospects could be adversely affected.
Our single family residential mortgage loan origination business is largely dependent on third party brokers, and a change in that business could adversely affect our business, financial condition and results of operations.
A majority of our residential mortgage loans are originated through third party mortgage brokers who are not contractually obligated to do business with us. Further, our competitors also have relationships with these brokers and actively compete with us in our efforts to expand our broker networks. Accordingly, we may not be successful in maintaining our existing relationships or expanding our broker networks.
Secondary mortgage market conditions could have a material adverse impact on our business, results of operations, financial condition or liquidity.
In addition to being affected by interest rates, the secondary mortgage markets are subject to investor demand for mortgage loans and mortgage-backed securities and investor yield requirements for those loans and securities. These conditions may fluctuate or even worsen in the future. Our SFR mortgage loan business strategy is to originate nonconforming jumbo conventional residential mortgage loans. We sell a portion of the single family residential loans that we originate in the secondary market. Secondary market demand for nonconforming jumbo residential mortgage loans generally is not as strong as the demand for conventional loans and can be volatile, reducing the demand or pricing for those loans; consequently, we may have a more difficult time selling the nonconforming jumbo residential mortgage loans that we originate or selling them at a price we believe is appropriate.
Originating loans for sale enables us to earn revenue from fees and gains on loan sales, while reducing our credit risk on the loans as well as our liquidity requirements. From time to time, as part of our balance sheet management process, we may also sell single family residential loans and other types of mortgage loans from our portfolio, including multifamily loans. We may use the proceeds of loan sales for generating new loans or for other purposes. If secondary mortgage market conditions were to deteriorate in the future and we cannot sell loans at our desired levels, our balance sheet management objectives might not be met. As a result, our business, results of operations, financial condition or liquidity may be adversely affected.
Any breach of representations and warranties made by us to our residential mortgage loan purchasers or credit default on our loan sales may require us to repurchase residential mortgage loans we have sold.
Prior to the sale of our Banc Home Loans division, we sold a majority of the residential mortgage loans we originated in the secondary market pursuant to agreements that generally require us to repurchase loans in the event of a breach of a representation or warranty made by us to the loan purchaser. Any fraud or misrepresentation during the mortgage loan origination process, whether by us, the borrower, mortgage broker, or other party in the transaction, or, in some cases, upon any early payment default on such mortgage loans, may require us to repurchase such loans.
We believe that, as a result of the increased defaults and foreclosures during the last recession resulting in increased demand for repurchases and indemnification in the secondary market, many purchasers of residential mortgage loans are particularly sensitive to obtaining indemnification or the requirement of originators to repurchase loans, and would benefit from enforcing any repurchase remedies they may have. Our exposure to repurchases under our representations and warranties could include the current unpaid balance of all loans we have sold. During the years ended December 31, 2018, 2017 and 2016, we sold residential mortgage loans aggregating
$14.5 million
,
$1.88 billion
, and
$5.13 billion
, respectively. To recognize the potential loan repurchase or indemnification losses, we maintained a total reserve of
$2.5 million
at December 31, 2018. Increases to this reserve reduce mortgage banking revenue. The determination of the appropriate level of the reserve inherently involves a high degree of subjectivity and requires us to make estimates of repurchase and indemnification risks and expected losses. The estimates used could be inaccurate, resulting in a level of reserve that is less than actual losses.
Deterioration in the economy, an increase in interest rates or a decrease in home values could increase customer defaults on loans that were sold and increase demand for repurchases and indemnification and increase our losses from loan repurchases and indemnification. If we are required to indemnify loan purchasers or repurchase loans and incur losses that exceed our reserve, this could adversely affect our business, financial condition and results of operations. In addition, any claims asserted
24
against us in the future by loan purchasers may result in liabilities or legal expenses that could have a material adverse effect on our results of operations and financial condition.
We may not be able to develop and maintain a strong core deposit base or other low cost funding sources.
We depend on checking, savings and money market deposit account balances and other forms of deposits as the primary source of funding for our lending activities. Our future growth will largely depend on our ability to expand core deposits, to provide a less costly and stable source of funding. The deposit markets are competitive, and therefore it may prove difficult to grow our core deposit base.
In 2018, the Bank focused on remixing the deposit base towards core relationship deposits. The Bank experienced net deposit outflows from large balance accounts (defined as $100 million or more in balances) primarily in the Institutional Banking business unit.
In 2018, the Bank increased its focus and attention toward expanding its core relationship deposit business, including recruiting sales and product personnel and adding subject matter expertise. Concurrently with the rise in short term interest rates, the competitive landscape for deposits intensified in the fourth quarter of 2017 and continued throughout 2018. Outflows were offset by new account and client acquisitions. In a competitive market, depositors have many choices as to where to place their deposit accounts. As the Bank continues to grow its core deposit base and seeks to reduce its exposure to high rate/high volatility accounts, it may continue to experience a net deposit outflow, which could negatively impact our business, financial condition and results of operations.
Other-than-temporary impairment charges in our investment securities portfolio could result in losses and adversely affect our continuing operations.
As of December 31, 2018, we had
$1.99 billion
of securities available-for-sale, as compared with
$2.58 billion
of securities available-for-sale as of December 31, 2017.
As of December 31, 2018, securities available-for-sale that were in an unrealized loss position had a total fair value of
$1.84 billion
with unrealized losses of
$34.3 million
. These unrealized losses primarily consisted of U.S. government agency and GSE residential mortgage-backed securities of
$437.4 million
with unrealized losses of
$24.5 million
, and collateralized loan obligations of
$1.40 billion
with unrealized losses of
$9.8 million
.
As of December 31, 2017, securities available-for-sale that were in an unrealized loss position had a fair value of
$579.5 million
and aggregate unrealized losses of
$15.6 million
.
The Company monitors to ensure it has adequate credit support and, as of December 31, 2018, except with respect to the CMBS portfolio (as noted below), the Company believed there was no other-than-temporary-impairment (OTTI) and did not have the intent to sell any of its securities in an unrealized loss position and it is likely that it will not be required to sell such securities before their anticipated recovery. The Company decided to sell its entire CMBS portfolio and, therefore, recorded OTTI loss of
$3.3 million
as of December 31, 2018. The portfolio was sold in January 2019.
The remaining portfolio is evaluated using either OTTI guidance provided by FASB Accounting Standards Codification (ASC) 320, Investments-Debt and Equity Securities, or ASC 325, Recognition of Interest Income and Impairment on Purchased Beneficial Interests and Beneficial Interests that Continue to be Held by a Transferor in Securitized Financial Assets. Investment securities classified as available-for-sale or held-to-maturity are generally evaluated for OTTI under ASC 320. However, certain purchased beneficial interests, including non-agency mortgage-backed securities, asset-backed securities, and collateralized debt obligations, that had credit ratings at the time of purchase below AA are evaluated using the model outlined in ASC 325. The non-agency residential mortgage-backed securities, commercial mortgage-backed securities and collateralized loan obligations in the Company’s portfolio referenced above were rated AA or above at purchase and are not within the scope of ASC 325. For more information about ASC 320 and ASC 325, see Note 1 to Consolidated Financial Statements included in Item 8 of this Annual Report on Form 10-K.
We closely monitor our investment securities for changes in credit risk. The valuation of our investment securities also is influenced by external market and other factors, including implementation of SEC and FASB guidance on fair value accounting. Accordingly, if market conditions deteriorate further and we determine our holdings of other investment securities are OTTI, our future earnings, stockholders’ equity, regulatory capital and continuing operations could be materially adversely affected.
25
More than 50 percent of our securities portfolio is invested in collateralized loan obligations.
As of December 31, 2018, based on fair value,
$1.42 billion
, or
71.3 percent
of our securities portfolio, was invested in collateralized loan obligations (CLOs). By comparison, as of December 31, 2017, based on fair value,
$1.70 billion
, or
66.1 percent
of our securities portfolio, was invested in CLOs.
As of December 31, 2018, based on amortized cost,
$79.0 million
of our CLO holdings were AAA rated and
$1.35 billion
were AA rated. As of December 31, 2018, there were no CLOs rated below AA and none of the CLOs were subject to ratings downgrade in 2018. All of our CLOs are floating rate, with rates set on a quarterly basis at three month LIBOR plus a spread.
As an investor in CLOs, we purchase specific tranches, or slices, of debt instruments that are secured by professionally managed portfolios of senior secured loans to corporations. CLOs are not secured by residential or commercial mortgages. CLO managers are typically large non-bank financial institutions or banks. CLOs are typically $300 million to $1 billion in size, contain 100 or more loans, and have five to six credit tranches ranging from AAA, AA, A, BBB, BB, B and equity tranche. Interest and principal are paid out to the AAA tranche first then move down the capital stack. Losses are borne by the equity tranche first then move up the capital stack. CLOs typically have subordination levels that range from approximately
33 percent
to
39 percent
for AAA,
20 percent
to
28 percent
for AA,
15 percent
to
18 percent
for A and
10 percent
to
14 percent
for BBB.
The CLOs we currently hold may, from time to time, not be actively traded, and under certain market conditions may be relatively illiquid investments, and volatility in the CLO trading market may cause the value of these investments to decline. The market value of CLOs may be affected by, among other things, perceived changes in the economy, performance by the manager and performance of the underlying loans.
Although we attempt to mitigate the credit and liquidity risks associated with CLOs by purchasing CLOs with credit ratings of AA or higher and by maintaining a pre-purchase due diligence and ongoing review process by a dedicated credit administration team, no assurance can be given that these risk mitigation efforts will be successful.
The Volcker Rule covered fund provisions could adversely affect us.
The so-called “Volcker Rule” provisions of the Dodd-Frank Act and its implementing regulations restrict our ability to sponsor or invest in “covered funds” (as defined in the implementing regulations). When the implementing regulations were adopted, banking entities such as us were required to conform our covered fund investments and activities by July 21, 2015. However, on December 18, 2014, the FRB extended the conformance period to July 21, 2016, for investments in, and relationships with, covered funds (including non-conforming CLOs) that were in place prior to December 31, 2013. The FRB later extended the conformance period until July 21, 2017. The Volcker Rule excludes from the definition of “covered fund” loan securitizations that meet specified investment criteria and do not invest in impermissible assets. Accordingly investments in CLOs that qualify for the loan securitization exclusion are not prohibited by the Volcker Rule. It is our practice to invest only in CLOs that meet the Volcker Rule’s definition of permissible loan securitizations and therefore are Volcker Rule compliant. However, the Volcker Rule and its implementing regulations are relatively new and untested, and it is possible that certain CLOs in which we have invested may be found subsequently to be covered funds. If so, we may be required to divest our interest in nonconforming CLOs, and we could incur losses on such divestitures.
Our business is subject to interest rate risk and variations in interest rates may hurt our profits.
To be profitable, we have to earn more money in interest that we receive on loans and investments than we pay to our depositors and lenders in interest. If interest rates rise, our net interest income and the value of our assets could be reduced if interest paid on interest-bearing liabilities, such as deposits and borrowings, increases more quickly than interest received on interest-earning assets, such as loans, other mortgage-related investments and investment securities. This is most likely to occur if short-term interest rates increase at a faster rate than long-term interest rates, which would cause our net interest income to go down. In addition, rising interest rates may hurt our income, because that may reduce the demand for loans and the value of our securities. In a rapidly changing interest rate environment, we may not be able to manage our interest rate risk effectively, which would adversely impact our financial condition and results of operations.
We face significant operational risks.
We operate many different financial service functions and rely on the ability of our employees, third party vendors and systems to process a significant number of transactions. Operational risk is the risk of loss from operations, including fraud by employees or outside persons, employees’ execution of incorrect or unauthorized transactions, data processing and technology errors or hacking and breaches of internal control systems.
26
Our enterprise risk management framework may not be effective in mitigating risk and reducing the potential for losses.
Our enterprise risk management framework seeks to mitigate risk and loss to us. We have established comprehensive policies and procedures and an internal control framework designed to provide a sound operational environment for the types of risk to which we are subject, including credit risk, market risk (interest rate and price risks), liquidity risk, operational risk, compliance risk, strategic risk, and reputational risk. However, as with any risk management framework, there are inherent limitations to our current and future risk management strategies, including risks that we have not appropriately anticipated or identified. In certain instances, we rely on models to measure, monitor and predict risks. However, these models are inherently limited because they involve techniques, including the use of historical data in some circumstances, and judgments that cannot anticipate every economic and financial outcome in the markets in which we operate, nor can they anticipate the specifics and timing of such outcomes. There is no assurance that these models will appropriately capture all relevant risks or accurately predict future events or exposures. Accurate and timely enterprise-wide risk information is necessary to enhance management’s decision-making in times of crisis. If our enterprise risk management framework proves ineffective or if our enterprise-wide management information is incomplete or inaccurate, we could suffer unexpected losses, which could materially adversely affect our results of operations or financial condition. In addition, our businesses and the markets in which we operate are continuously evolving. We may fail to fully understand the implications of changes in our businesses or the financial markets or fail to adequately or timely enhance our enterprise risk framework to address those changes. If our enterprise risk framework is ineffective, either because it fails to keep pace with changes in the financial markets, regulatory requirements, our businesses, our counterparties, clients or service providers or for other reasons, we could incur losses, suffer reputational damage or find ourselves out of compliance with applicable regulatory or contractual mandates.
An important aspect of our enterprise risk management framework is creating a risk culture in which all employees fully understand that there is risk in every aspect of our business and the importance of managing risk as it relates to their job functions. We continue to enhance our enterprise risk management program to support our risk culture, ensuring that it is sustainable and appropriate to our role as a major financial institution. Nonetheless, if we fail to create the appropriate environment that sensitizes all of our employees to managing risk, our business could be adversely impacted. For more information on our risk management framework, see "Governance" under “Lending Activities” included in Item 1 of this Annual Report on Form 10-K.
Managing reputational risk is important to attracting and maintaining customers, investors and employees.
Threats to our reputation can come from many sources, including adverse sentiment about financial institutions generally, unethical practices, employee misconduct, failure to deliver minimum standards of service or quality, compliance deficiencies, regulatory investigations, marketplace rumors and questionable or fraudulent activities of our customers. We have policies and procedures in place to promote ethical conduct and protect our reputation. However, these policies and procedures may not be fully effective and cannot adequately protect against all threats to our reputation. Negative publicity regarding our business, employees, or customers, with or without merit, may result in the loss of customers, investors and employees, costly litigation, a decline in revenues and increased governmental oversight.
Liquidity risk could impair our ability to fund operations and jeopardize our financial condition.
Liquidity is essential to our business. An inability to raise funds through deposits, borrowings, the sale of loans and other sources could have a substantial negative effect on our liquidity. Our access to funding sources in amounts adequate to finance our activities or on terms that are acceptable to us could be impaired by factors that affect us specifically or the financial services industry or economy in general.
Factors that could detrimentally impact our access to liquidity sources include a decrease in the level of our business activity as a result of a downturn in the markets in which our loans are concentrated or adverse regulatory action against us. Our ability to borrow could also be impaired by factors that are not specific to us, such as a disruption in the financial markets or negative views and expectations about the prospects for the financial services industry.
27
We depend on our directors and key management personnel.
Our success will, to a large extent, depend on the continued service of our directors and continued employment of our key management personnel. The unexpected loss of the services of any of these individuals could have a detrimental effect on our business. Although we have entered into employment agreements with our Chief Executive Officer and our Chief Financial Officer, no assurance can be given that these individuals, or any of our key management personnel, will continue to be employed by us. The loss of any of these individuals could negatively affect our ability to achieve our business plan and could have a material adverse effect on our results of operations and financial condition.
We currently hold a significant amount of bank owned life insurance.
At December 31, 2018, we held
$107.0 million
of bank owned life insurance (BOLI) on certain key and former employees and executives, with a cash surrender value of
$107.0 million
, as compared with
$104.9 million
of BOLI, with a cash surrender value of
$104.9 million
, at December 31, 2017. The eventual repayment of the cash surrender value is subject to the ability of the various insurance companies to pay death benefits or to return the cash surrender value to us if needed for liquidity purposes. We continually monitor the financial strength of the various companies with whom we carry these policies. Any one of these companies could experience a decline in financial strength, which could impair its ability to pay benefits or return our cash surrender value. If we need to liquidate these policies for liquidity purposes, we would be subject to taxation on the cumulative increase in cash surrender value and penalties for early termination, both of which would adversely impact our earnings.
If our investment in the Federal Home Loan Bank of San Francisco becomes impaired, our earnings and stockholders’ equity could decrease.
At December 31, 2018, we owned
$41.0 million
in FHLB stock. We are required to own this stock to be a member of and to obtain advances from our FHLB. This stock is not marketable and can only be redeemed by our FHLB. Our FHLB’s financial condition is linked, in part, to the eleven other members of the FHLB System and to accounting rules and asset quality risks that could materially lower their capital, which would cause our FHLB stock to be deemed impaired, resulting in a decrease in our earnings and assets.
We rely on numerous external vendors
.
We rely on numerous external vendors to provide us with products and services necessary to maintain our day-to-day operations. Accordingly, our operations are exposed to risk that these vendors will not perform in accordance with the contracted arrangements under service level agreements. The failure of an external vendor to perform in accordance with the contracted arrangements under service level agreements because of changes in the vendor's organizational structure, financial condition, support for existing products and services or strategic focus or for any other reason, could be disruptive to our operations, which in turn could have a material negative impact on our financial condition and results of operations. We also could be adversely affected to the extent such an agreement is not renewed by the third party vendor or is renewed on terms less favorable to us.
28
We are subject to certain risks in connection with our use of technology.
Our cyber-security measures may not be sufficient to mitigate the risk of a cyber attack or cyber theft.
Communications and information systems are essential to the conduct of our business, as we use such systems to manage our customer relationships, our general ledger and virtually all other aspects of our business. Our operations rely on the secure processing, storage, and transmission of confidential and other information in our computer systems and networks. Although we take protective measures and endeavor to modify them as circumstances warrant, the security of our computer systems, software, and networks may be vulnerable to breaches, unauthorized access, misuse, computer viruses, or other malicious code and other types of cyber attacks. If one or more of these events occur, this could jeopardize our customers' confidential and other information that we process and store, or otherwise cause interruptions in our operations or the operations of our customers or counterparties. If a cyber attack occurs, we may be required to expend significant additional resources to modify our protective measures or to investigate and remediate vulnerabilities or other exposures, and we may be subject to litigation and financial losses that are either not insured against or not fully covered through our current insurance policies. If a cyber attack succeeds in disrupting our operations or disclosing confidential data, we could also suffer significant reputational damage in addition to possible regulatory fines or customer lawsuits.
We provide internet banking services to our customers which have additional cyber risks related to our customer’s mobile devices. Any compromise of mobile device security could expose our customers to account take-overs (ATO) and the possibility for financial crimes such as fraud or identity theft and deter customers from using our internet banking services. We rely on industry-standard internet security systems to provide the security and authentication necessary to effect secure transmission of data. These precautions may not protect our systems from future compromises or data breaches.
Our security measures may not protect us from systems failures or interruptions.
While we have established policies and technical controls to prevent or limit the impact of systems failures and interruptions, there are no absolute assurances that such events will not occur or that the resulting damages will be adequately mitigated.
We rely on communications, information, operating and financial control systems technology from third party service providers, and we may suffer an interruption in those systems.
We outsource certain aspects of our data processing and operational functions to third party providers. If our third party providers encounter difficulties, or if we have difficulty in communicating with them, our ability to adequately process and account for transactions could be affected, and our business operations could be adversely impacted.
The occurrence of any systems failure or interruption could damage our reputation and result in a loss of customers and business, could subject us to additional regulatory scrutiny, or could expose us to legal liability. Any of these occurrences could have a material adverse effect on our financial condition and results of operations.
We rely heavily on third party service providers for much of our communications, information, operating and financial control systems technology, including our online banking services and data processing systems.
We rely on our third party providers to help ensure the confidentiality of our customer information and acknowledge the additional risks these third parties expose us to. Third party providers may experience unauthorized access to and disclosure of our consumer or customer information or result in the destruction or corruption of company information. Any failure or interruption, or breaches in security, of these systems could result in failures or interruptions in our customer relationship management, general ledger, deposit, loan origination and servicing systems, thereby harming our business reputation, operating results and financial condition. Additionally, interruptions in service and security breaches could lead existing customers to terminate their banking relationships with us and could make it more difficult for us to attract new banking customers in the future.
29
We operate in a highly regulated environment and our operations and income may be affected adversely by changes in laws, rules and regulations governing our operations
.
We are subject to extensive regulation and supervision by the FRB, the OCC and the CFPB. The FRB regulates the supply of money and credit in the United States. Its fiscal and monetary policies determine in a large part our cost of funds for lending and investing and the return that can be earned on those loans and investments, both of which affect our net interest margin. FRB policies can also materially affect the value of financial instruments that we hold, such as debt securities, certain mortgage loans held-for-sale and MSRs. Its policies also can affect our borrowers, potentially increasing the risk that they may fail to repay their loans or satisfy their obligations to us. Changes in policies of the FRB are beyond our control and the impact of changes in those policies on our activities and results of operations can be difficult to predict.
The Company and the Bank are heavily regulated. This oversight is to protect depositors, the federal deposit insurance fund (DIF) and the banking system as a whole, and not stockholders. These regulatory authorities have extensive discretion in connection with their supervisory and enforcement activities, including the ability to impose increased capital requirements and restrictions on a bank’s operations, to reclassify assets, to determine the adequacy of a bank’s allowance for loan and lease losses and to set the level of deposit insurance premiums assessed.
Congress, state legislatures and federal and state agencies continually review banking, lending and other laws, regulations and policies for possible changes. Any change in such regulation and oversight, whether in the form of regulatory policy, new regulations or legislation, that applies to us or additional deposit insurance premiums could have a material adverse impact on our operations. Because our business is highly regulated, the laws and applicable regulations are subject to frequent change. Any new laws, rules and regulations including the recently enacted California Consumer Privacy Act (CCPA) could make compliance more difficult, expensive, costly to implement or may otherwise adversely affect our business, financial condition or growth prospects. Such changes could subject us to additional costs, limit the types of financial services and products we may offer and/or increase the ability of non-banks to offer competing financial services and products, among other things.
The Dodd-Frank Act and supporting regulations could have a material adverse effect on us.
The Dodd-Frank Act provides for various capital requirements and new restrictions on financial institutions and their holding companies. These changes may result in additional restrictions on investments and other activities. Regulations under the Dodd-Frank Act significantly impact our operations, and we expect to continue to face increased regulation. These regulations may affect the manner in which we do business and the products and services that we provide, affect or restrict our ability to compete in our current businesses or our ability to enter into or acquire new businesses, reduce or limit our revenue or impose additional fees or assessments on us, intensify the regulatory supervision of us and the financial services industry, and adversely affect our business operations.
The Dodd-Frank Act, among other things, established the CFPB with broad authority to administer and enforce a new federal regulatory framework of consumer financial regulation. Many of the provisions of the Dodd-Frank Act have extended implementation periods and require extensive rulemaking, guidance and interpretation by various regulatory agencies. While some rules have been finalized or issued in proposed form, some have yet to be proposed. It is impossible to predict when all such additional rules will be issued or finalized, and what the content of such rules will be.
We must apply resources to ensure that we are in compliance with all applicable provisions of the Dodd-Frank Act and any implementing rules, which may increase our costs of operations and adversely impact our earnings. We expect that the Dodd-Frank Act, including current and future rules implementing its provisions and the interpretations of those rules, will reduce our revenues, increase our expenses, require us to change certain of our business practices, increase the regulatory supervision of us, increase our capital requirements and impose additional assessments and costs on us, and otherwise adversely affect our business.
30
As of March 31, 2017, the Company’s consolidated total assets and the Bank’s total assets, exceeded $10 billion for four consecutive quarters (the $10 billion threshold). As a result, we have become subject to additional regulatory scrutiny and a number of additional requirements that impose additional compliance costs on our business and higher expectations from regulators regarding risk management, strategic planning, governance and other aspects of our operations.
Pursuant to the Dodd-Frank Act and regulations adopted by the federal banking regulators, bank holding companies and banks with average total consolidated assets greater than $10 billion were required to conduct an annual “stress test” of capital and consolidated earnings and losses under the baseline, adverse and severely adverse scenarios provided by the federal banking regulators. On May 24, 2018, the Economic Growth, Regulatory Relief and Consumer Protection Act (the “Economic Growth Act”) was signed into law, which amended portions of the Dodd-Frank Act and immediately raised the asset threshold for company-run stress testing from $10 billion to $100 billion for bank holding companies. As a result, the Company is no longer subject to the Dodd-Frank Act company-run stress testing requirements. On July 6, 2018, the federal banking regulators issued an interagency statement that banks with less than $100 billion in total consolidated assets, including the Bank, would not be required to comply with company-run stress testing requirements until November 25, 2019, at which time such banks will become exempt from company-run stress testing requirements under the Economic Growth Act. In addition, the federal banking regulators have each proposed to amend their stress testing regulations consistent with the Economic Growth Act.
Despite the improvements for financial institutions that has resulted from Economic Growth Act, many provisions of the Dodd-Frank Act and its implementing regulations remain in place and will continue to result in additional operating and compliance costs that could have a material adverse effect on our business, financial condition, results of operation. In addition, the Economic Growth Act requires the enactment of a number of implementing regulations, the details of which may have a material effect on the ultimate impact of the law.
31
Rulemaking changes implemented by the CFPB in particular have resulted in higher regulatory and compliance costs that adversely affect our financial condition and results of operations.
As indicated above, the Dodd-Frank Act created the CFPB, an independent federal agency with broad rulemaking, supervisory and enforcement powers under various federal consumer financial protection laws, including the laws referenced above, fair lending laws and certain other statutes. The CFPB has examination and primary enforcement authority with respect to depository institutions, their affiliates, their service providers and certain non-depository entities such as debt collectors and consumer reporting agencies if the assets of the institution exceed the $10 billion threshold.
The CFPB has authority to prevent unfair, deceptive or abusive practices in connection with the offering of consumer financial products. The Dodd-Frank Act authorizes the CFPB to establish certain minimum standards for the origination of residential mortgages including a determination of the borrower’s ability to repay. In addition, the Dodd-Frank Act allows borrowers to raise certain defenses to foreclosure if they receive any loan other than a “qualified mortgage” as defined by the CFPB. The Dodd-Frank Act permits states to adopt consumer protection laws and standards that are more stringent than those adopted at the federal level and, in certain circumstances, permits state attorneys general to enforce compliance with both the state and federal laws and regulations.
The CFPB has finalized a number of significant rules which impact nearly every aspect of the lifecycle of a residential mortgage loan. Among other things, the rules adopted by the CFPB require banks to: (i) develop and implement procedures to ensure compliance with an “ability to repay” test and identify whether a loan meets a new definition for a “qualified mortgage,” in which case a rebuttable presumption exists that the creditor extending the loan has satisfied the ability to repay test; (ii) implement new or revised disclosures, policies and procedures for originating and servicing mortgages including, but not limited to, pre-loan counseling, early intervention with delinquent borrowers and specific loss mitigation procedures for loans secured by a borrower's principal residence; (iii) comply with additional restrictions on mortgage loan originator hiring and compensation; (iv) comply with new disclosure requirements and standards for appraisals and certain financial products; and (v) maintain escrow accounts for higher-priced mortgage loans for a longer period of time. The new rules include the TILA-RESPA Integrated Disclosure (TRID) rules. The TRID rules contain new requirements and new disclosure forms that are required to be provided to borrowers.
In order to comply with the CFPB rules, we have made significant changes to our residential mortgage business, including investments in technology, training of our personnel, changes in the loan products we offer, changes in compensation of our loan originators and mortgage brokers that do business with us, and a reduction in fees that we charge, We are continuing to analyze the impact that such rules may have on our business. In addition to the exercise of its rulemaking authority, the CFPB’s supervisory powers of the CFPB and the primary federal banking regulators entitle them to examine institutions for violations of consumer lending laws even in the absence of consumer complaints or damages. Compliance with the rules and policies adopted by the CFPB has limited the products we may permissibly offer to some or all of our customers, or limited the terms on which those products may be issued, or may adversely affect our ability to conduct our business as previously conducted. We may also be required to add compliance personnel or incur other significant compliance-related expenses. Our business, financial condition, results of operations and/or competitive position may be adversely affected as a result.
The short-term and long-term impact of the changing regulatory capital requirements and new capital rules is uncertain.
In July 2013, the FRB and the other federal bank regulatory agencies issued a final rule to revise their risk-based and leverage capital requirements and their method for calculating risk-weighted assets to make them consistent with Basel III and certain provisions of the Dodd-Frank Act. The final rule applies to all banking organizations. Among other things, the rule establishes a common equity Tier 1 minimum capital requirement of 4.5 percent of risk-weighted assets and a minimum Tier 1 risk-based capital requirement of 6.0 percent of risk-weighted assets and assigns higher risk-weightings than in the past (150 percent) to exposures that are more than 90 days past due or are on non-accrual status and certain commercial facilities that finance the acquisition, development or construction of real property. The final rule also limits a banking organization’s capital distributions and certain discretionary bonus payments if the banking organization does not hold a “capital conservation buffer” in excess of 2.5 percent of common equity tier 1 capital in addition to the minimum risk-based capital ratios. The final rule became effective for the Company and the Bank on January 1, 2015. The capital conservation buffer requirement was phased in over a three-year period that began on January 1, 2016 and ended on January 1, 2019, when the full capital conservation buffer requirement became effective. An institution is subject to limitations on paying dividends, engaging in share repurchases, and paying discretionary bonuses if its capital level falls below the buffer amount.
While our current capital levels exceed the capital requirements, our capital levels could decrease in the future as a result of factors such as acquisitions, faster than anticipated growth, reduced earnings levels, operating losses and other factors. The application of more stringent capital requirements for us could, among other things, result in lower returns on equity, require the raising of additional capital, and result in our inability to pay dividends or repurchase shares if we were to be unable to comply with such requirements.
32
We are subject to federal and state fair lending laws, and failure to comply with these laws could lead to material penalties.
Federal and state fair lending laws and regulations, such as the Equal Credit Opportunity Act and the Fair Housing Act, impose nondiscriminatory lending requirements on financial institutions. The Department of Justice, CFPB and other federal and state agencies are responsible for enforcing these laws and regulations. Private parties may also have the ability to challenge an institution’s performance under fair lending laws in private class action litigation. A successful challenge to our performance under the fair lending laws and regulations could adversely impact our rating under the CRA and result in a wide variety of sanctions, including the required payment of damages and civil money penalties, injunctive relief, imposition of restrictions on merger and acquisition activity and restrictions on expansion activity, which could negatively impact our reputation, business, financial condition and results of operations.
Non-compliance with the Patriot Act, Bank Secrecy Act, or other laws and regulations could result in fines or sanctions or operating restrictions.
We are subject to government legislation and regulation, including but not limited to the USA PATRIOT and Bank Secrecy Acts, which require financial institutions to develop programs to detect money laundering, terrorist financing, and other financial crimes. If detected, financial institutions are obligated to report such activity to the Financial Crimes Enforcement Network, a bureau of the United States Department of the Treasury. These regulations require financial institutions to establish procedures for identifying and verifying the identity of customers seeking to establish and maintain a relationship with a financial institution. Failure to comply with these regulations could result in fines, sanctions or restrictions that could have a material adverse effect on our strategic initiatives and operating results, and could require us to make changes to our operations and the customers that we serve. Several banking institutions have received large fines, or suffered limitations on their operations, for non-compliance with these laws and regulations. Although we have developed policies and procedures designed to assist in compliance with these laws and regulations, no assurance can be given that these policies and procedures will be effective in detecting violations of these laws and regulations.
Our federal regulators have extensive discretion in connection with their supervisory and enforcement activities over our operations and compliance with the USA PATRIOT and Bank Secrecy Acts. Current laws and applicable regulations are subject to frequent change. Any new laws and regulations could make compliance more difficult or expensive or otherwise adversely affect our business. One aspect of our business that we believe presents risks in this particular area is the conflict between federal and state law, including but not limited to cannabis and cannabis related businesses, which are legal in the State of California and prohibited by federal law. If our risk management and compliance programs prove to be ineffective, incomplete or inaccurate, we could suffer unexpected losses, which could materially adversely affect our results of operations or financial condition. As part of our federal regulators' enforcement authority, significant civil or criminal monetary penalties, consent orders, or other regulatory actions can be assessed against the Bank. Such actions could require us to make changes to our operations, including the customers that we serve, and may have an adverse impact on our operating results.
Increases in deposit insurance premiums and special FDIC assessments would negatively impact our earnings.
We may pay higher FDIC premiums in the future. The Dodd-Frank Act increased the minimum FDIC deposit insurance reserve ratio from 1.15 percent to 1.35 percent. The FDIC has adopted a plan under which it will meet this ratio by the statutory deadline of December 31, 2020.
The Dodd-Frank Act requires the FDIC to offset the effect of the increase in the minimum reserve ratio on institutions with assets less than $10 billion. To implement the offset requirement, the FDIC has imposed a temporary surcharge on institutions with assets greater than $10 billion, which was discontinued for assessment periods commencing after September 30, 2018. In addition to the minimum reserve ratio, the FDIC must set a designated reserve ratio. The FDIC has set a designated reserve ratio of 2.0, which exceeds the minimum reserve ratio.
Our holding company relies on dividends from the Bank for substantially all of its income and the net proceeds of capital raising transactions are currently the primary source of funds for cash dividends to our preferred and common stockholders.
Our primary source of revenue at the holding company level is dividends from the Bank and we also have previously relied on the net proceeds of capital raising transactions as the primary source of funds for cash dividends to our preferred and common stockholders. To the extent we are limited in our ability to raise capital in the future, our ability to pay cash dividends to our stockholders could likewise be limited, especially if we are unable to increase the amount of dividends the Bank pays to us. The OCC regulates and, in some cases, must approve the amounts the Bank pays as dividends to us. The Bank’s ability to pay dividends can be restricted or eliminated if the Bank does not meet the capital conservation buffer requirement or for other supervisory reasons. If the Bank is unable to pay dividends to us, then we may not be able to service our debt, including our senior notes, pay our other obligations or pay cash dividends on our preferred and common stock. Our inability to service our debt, pay our other obligations or pay dividends to our stockholders could have a material adverse impact on our financial condition and the value of your investment in our securities.
33
We may elect or be compelled to seek additional capital in the future, but that capital may not be available when it is needed or on acceptable terms.
We are required by federal regulatory authorities to maintain adequate levels of capital to support our operations. At some point, we may need to raise additional capital to support continued growth.
Our ability to raise additional capital, if needed, will depend on conditions in the capital markets, economic conditions, our financial performance and a number of other factors, many of which are outside our control. Accordingly, we cannot assure you of our ability to raise additional capital if needed or on terms acceptable to us. If we cannot raise additional capital when needed, our ability to further expand our operations could be materially impaired and our financial condition and liquidity could be materially and adversely affected.
The Company has a deferred tax asset that may or may not be fully realized.
The Company has a deferred tax asset (DTA) and cannot assure that it will be fully realized. Deferred tax assets and liabilities are the expected future tax amounts for the temporary differences between the carrying amounts and the tax basis of assets and liabilities computed using enacted tax rates. If we determine that we will not achieve sufficient future taxable income to realize our net deferred tax asset, we are required under generally accepted accounting principles (GAAP) to establish a full or partial valuation allowance. If we determine that a valuation allowance is necessary, we are required to incur a charge to operations. We regularly assess available positive and negative evidence to determine whether it is more likely than not that our net deferred tax asset will be realized. Realization of a deferred tax asset requires us to apply significant judgment and is inherently speculative because it requires estimates that cannot be made with certainty. At December 31, 2018, the Company had a net DTA of
$49.4 million
. For additional information, see Note 13 to Consolidated Financial Statements included in Item 8 of this Annual Report on Form 10-K.
We may experience future goodwill impairment.
If our estimates of the fair value of our reporting units change as a result of changes in our business or other factors, we may determine that a goodwill impairment charge is necessary. Estimates of fair value are based on a complex model using, among other things, estimated cash flows and industry pricing multiples. The Company tests its goodwill for impairment annually as of August 31 (the Measurement Date). At each Measurement Date, the Company, in accordance with ASC 350-20-35-3, evaluates, based on the weight of evidence, the significance of all qualitative factors to determine whether it is more likely than not that the fair value of each of the reporting units is less than its carrying amount.
The assessment of qualitative factors at the most recent Measurement Date (August 31, 2018) indicated that it was not more likely than not that impairment existed; as a result, no further testing was performed. At December 31, 2018, the Company had goodwill of $37.1 million. For additional information, see Note 9 to Consolidated Financial Statements included in Item 8 of this Annual Report on Form 10-K. No assurance can be given that the Company will not record an impairment loss on goodwill in the future and any such impairment loss could have a material adverse effect on our results of operations and financial condition.
Changes in accounting standards may affect our performance.
Our accounting policies and methods are fundamental to how we record and report our financial condition and results of operations. From time to time there are changes in the financial accounting and reporting standards and interpretations that govern the preparation of our financial statements. These changes can be difficult to predict and can materially impact how we report and record our financial condition and results of operations. In some cases, we could be required to apply a new or revised standard retroactively, resulting in a retrospective adjustment to prior financial statements.
New lines of business, new products and services, or strategic project initiatives may subject us to additional risks.
From time to time, we may seek to implement new lines of business or offer new products and services within existing lines of business. There are substantial risks and uncertainties associated with these efforts, particularly in instances where the markets are not fully developed. In developing and marketing new lines of business and/or new products and services, we may invest significant time and resources. Initial timetables for the introduction and development of new lines of business and/or new products or services may not be achieved, and price and profitability targets may not prove feasible, which could in turn have a material negative effect on our operating results. New lines of business and/or new products or services also could subject us to additional regulatory requirements, increased scrutiny by our regulators and other legal risks.
Additionally from time to time we undertake strategic project initiatives. Significant effort and resources are necessary to manage and oversee the successful completion of these initiatives. These initiatives often place significant demands on a limited number of employees with subject matter expertise and management and may involve significant costs to implement as well as increase operational risk as employees learn to process transactions under new systems. The failure to properly execute on these strategic initiatives could adversely impact our business and results of operations.
34
Strong competition within our market areas may limit our growth and profitability.
Competition in the banking and financial services industry is intense. In our market areas, we compete with commercial banks, savings institutions, mortgage brokerage firms, credit unions, finance companies, mutual funds, insurance companies, and brokerage and investment banking firms operating locally and elsewhere. Many of these competitors have substantially greater name recognition, resources and lending limits than we do and may offer certain services or prices for services that we do not or cannot provide. Our profitability depends upon our continued ability to successfully compete in our markets.
In addition, our future success will depend, in part, upon our ability to address the needs of our clients by using technology to provide products and services that will satisfy client demands for convenience, as well as to create additional efficiencies in our operations. Many of our competitors have substantially greater resources to invest in technological improvements. We may not be able to effectively implement new technology-driven products and services or be successful in marketing these products and services to our clients.
Our business could be negatively affected as a result of actions by activist stockholders.
Campaigns by stockholders to effect changes at publicly traded companies are sometimes led by investors seeking to increase stockholder value through various corporate actions. Certain activist stockholders have contacted us and made various proposals regarding changes in our corporate governance and the composition of our board of directors. We believe we have had a constructive dialogue with such stockholders. We have added to our board of directors members affiliated with two of our major stockholders, PL Capital Advisors LLC (PL Capital) and Patriot Financial Partners.
However, in the future we may have disagreements with activist stockholders which could prove disruptive to our operations. Activist stockholders could seek to elect their own candidates to our board of directors or could take other actions intended to challenge our business strategy and corporate governance. Responding to actions by activist stockholders may adversely affect our profitability or business prospects, by diverting the attention of management and our employees from executing our strategic plan. Any perceived uncertainties as to our future direction or strategy arising from activist stockholder initiatives could also cause increased reputational, operational, financial, regulatory and other risks, harm our ability to raise new capital, or adversely affect the market price or increase the volatility of our securities.
Short sellers of our stock may be manipulative and may drive down the market price of our common stock.
Short selling is the practice of selling securities that the seller does not own but rather has borrowed or intends to borrow from a third party with the intention of buying identical securities at a later date to return to the lender. A short seller hopes to profit from a decline in the value of the securities between the sale of the borrowed securities and the purchase of the replacement shares. Some short sellers may seek to drive down the price of shares they have sold short by disseminating negative reports about the issuers of such shares.
Beginning on October 18, 2016, the Company became aware of certain allegations posted anonymously in various financial blog posts. The authors of the blog posts have typically disclosed that they hold a short position in the Company’s stock. Following the posting of the first blog on October 18, 2016, the market price of our common stock initially dropped significantly. While the price of our common stock subsequently increased, additional postings and other negative publicity initiated by the author of the blog and others have led to intense public scrutiny and may cause further volatility in our stock price and a decline in the value of a stockholder’s investment in the Company.
When the market price of a company's stock drops significantly, as ours did initially following the posting of the first blog, it is not unusual for stockholder lawsuits to be filed or threatened against the company and its board of directors and for a company to suffer reputational damage. Multiple lawsuits were in fact threatened against the Company shortly following the posting of the first blog, and as discussed under Item 3 of this report, the first of several putative class lawsuits against the Company was filed on January 23, 2017. These lawsuits, and any other lawsuits, have caused us to incur substantial costs and diverted the time and attention of our board and management, and may continue to do so in the future. In addition, reputational damage to the Company may affect our ability to attract and retain deposits and may cause our deposit costs to increase, which could adversely affect our liquidity and earnings. Reputational damage may also affect our ability to attract and retain loan customers and maintain and develop other business relationships, which could likewise adversely affect our earnings. Continued negative reports issued by short sellers could also negatively impact our ability to attract and retain employees.
35
New accounting standards may result in a significant change to our recognition of credit losses and may materially impact our results of operations and financial condition.
In June 2016, the Financial Accounting Standards Board issued new authoritative accounting guidance under ASC Topic 326 “Financial Instruments - Credit Losses” amending the incurred loss impairment methodology in current accounting principles generally accepted in the United States of America (“GAAP”) with a methodology that reflects lifetime expected credit losses (“CECL”) and requires consideration of a broader range of reasonable and supportable information for credit loss estimates, which goes into effect for us on January 1, 2020. CECL is generally thought to result in the earlier recognition of credit losses in financial statements. Under the incurred loss model, we recognize losses when they have been incurred. CECL represents a departure from the incurred loss model.
CECL requires loans held for investment and held-to-maturity securities to be presented at the net amount expected to be collected (net of the allowance for credit losses). CECL also requires credit losses relating to available-for-sale debt securities to be recorded through an allowance for credit losses. In addition, the measurement of expected credit losses will take place at the time the financial asset is first added to the balance sheet (with periodic updates thereafter) and will be based on relevant information about past events, including historical experience, current conditions, and reasonable and supportable forecasts that affect the collectability of the reported amount.
The CECL model will materially impact how we determine our allowance for loan and lease losses and may require us to significantly increase our allowance for loan and lease losses. Furthermore, we may experience more fluctuations in our allowance for loan and lease losses, which may be significant. If we were required to materially increase our allowance for loan and lease losses, it may negatively impact our financial condition and results of operations. We are currently evaluating the new guidance and expect it to have an impact on our statements of operations and financial condition, the significance of which is not yet known. We expect the CECL model will require us to recognize a one-time cumulative adjustment to our allowance for loan and lease losses on January 1, 2020 in order to fully transition from the incurred loss model to the CECL model, which could have a material adverse effect on our results of operations and financial condition. The FRB, the OCC and the FDIC have adopted a rule that gives a banking organization the option to phase in over a three-year period the day-one adverse effects of CECL on its regulatory capital.
Uncertainty relating to the LIBOR calculation process and potential phasing out of LIBOR may adversely affect us.
On July 27, 2017, the Chief Executive of the United Kingdom Financial Conduct Authority, which regulates LIBOR, announced that it intends to stop persuading or compelling banks to submit rates for the calibration of LIBOR to the administrator of LIBOR after 2021. The announcement indicates that the continuation of LIBOR on the current basis cannot and will not be guaranteed after 2021. It is impossible to predict whether and to what extent banks will continue to provide LIBOR submissions to the administrator of LIBOR or whether any additional reforms to LIBOR may be enacted in the United Kingdom or elsewhere. At this time, no consensus exists as to what rate or rates may become acceptable alternatives to LIBOR and it is impossible to predict the effect of any such alternatives on the value of LIBOR-based securities and variable rate loans, debentures, or other securities or financial arrangements, given LIBOR's role in determining market interest rates globally. Uncertainty as to the nature of alternative reference rates and as to potential changes or other reforms to LIBOR may adversely affect LIBOR rates and the value of LIBOR-based loans and securities in our portfolio and may impact the availability and cost of hedging instruments and borrowings. If LIBOR rates are no longer available, and we are required to implement substitute indices for the calculation of interest rates under our loan agreements with our borrowers, we may incur significant expenses in effecting the transition, and may be subject to disputes or litigation with customers over the appropriateness or comparability to LIBOR of the substitute indices, which could have a material adverse effect on our results of operations and financial condition.
Item 1B. Unresolved Staff Comments
None.
Item 2. Properties
As of
December 31, 2018
, the Company conducts its operations from its main and executive offices at 3 MacArthur Place, Santa Ana, California and
32
branch offices in Los Angeles, Orange, San Diego, Santa Barbara counties in California. For additional information, see Note 6 to Consolidated Financial Statements included in Item 8 of this Annual Report on Form 10-K.
36
Item 3. Legal Proceedings
From time to time we are involved as plaintiff or defendant in various legal actions arising in the normal course of business.
On January 23, 2017, the first of three putative class action lawsuits, Garcia v. Banc of California, et al., Case No. 8:17-cv- 00118, was filed against Banc of California, James J. McKinney, Ronald J. Nicolas, Jr., and Steven A. Sugarman in the United States District Court for the Central District of California. Thereafter, two related putative class action lawsuits were filed in the United States District Court for the Central District of California: (1) Malak v. Banc of California, et al., Case No. 8:17-cv-00138 (January 26, 2017), asserting claims against Banc of California, James J. McKinney, and Steven A. Sugarman, and (2) Cardona v. Banc of California, et al., Case No. 2:17-cv-00621 (January 26, 2017), asserting claims against Banc of California, James J. McKinney, Ronald J. Nicolas, Jr., and Steven A. Sugarman. Those actions were consolidated, a lead plaintiff was appointed, and the lead plaintiff filed a Consolidated Amended Complaint against Banc of California, Steve A. Sugarman and James J. McKinney on May 31, 2017 alleging that the defendants violated sections 10(b) and 20(a) of the Securities Exchange Act of 1934.
In general, the Consolidated Amended Complaint alleges that the purported concealment of the defendants’ alleged relationship with Jason Galanis caused various statements made by the defendants to be false and misleading. The defendants moved to dismiss the Consolidated Amended Complaint. The plaintiff thereafter dismissed Mr. McKinney, leaving the Company and Mr. Sugarman as the remaining defendants. On September 18, 2017, the district court granted in part and denied in part the defendants’ motions to dismiss. Specifically, the court denied the defendants’ motions as to the Company’s April 15, 2016 Proxy Statement which listed Mr. Sugarman’s positions with COR Securities Holdings Inc., COR Clearing LLC, and COR Capital LLC while omitting their alleged connections with Jason Galanis. The lawsuits purport to be brought on behalf of stockholders who purchased stock in the Company between August 15, 2016 through January 20, 2017. The Court granted class certification on May 31, 2018. The lawsuits seek an award of unspecified compensatory and punitive damages, an award of reasonable costs and expenses, including attorneys’ fees, and other further relief as the Court may deem just and proper. Trial is currently set for October 21, 2019. The Company believes that the consolidated action is without merit and intends to vigorously contest it.
On August 15, 2017, COR Securities Holdings, Inc., and COR Clearing LLC filed an action in the United States District Court for the Central District of California, captioned COR Securities Holdings, Inc., et al. v. Banc of California, N.A., et al., Case No. 8:17-cv-01403 DOC JCGx), against the Bank and Hugh F. Boyle, the Company’s and the Bank’s Chief Risk Officer. The lawsuit asserts claims under various state and federal statutes related to computer fraud and abuse, as well as a claim of common law fraud. The plaintiffs allege that the Bank inappropriately gained access to their confidential and privileged documents on a cloud storage site. On October 2, 2017, the defendants filed a motion to dismiss. The Defendants also answered and asserted counterclaims. On February 2, 2018, the court granted in part and denied in part the motion to dismiss. Trial is set for June 2019. The Bank believes that the action is without merit and intends to vigorously contest it.
On August 11, 2017, Carlos P. Salas, the Bank’s former Chief of Staff, filed an action in the Los Angeles Superior Court, captioned Carlos P. Salas v. Banc of California, Inc., et al., Case No. BC672208, against the Company and the Bank asserting claims for breach of contract, breach of the covenant of good faith and fair dealing, breach of an implied in fact contract, promissory estoppel, promissory fraud, declaratory relief, fraud/intentional misrepresentation, unfair business practices, wrongful termination, violation of the right to privacy and violation of California’s Investigative Consumer Reporting Agencies Act. In general, Mr. Salas alleges that he was constructively terminated as a Bank employee and suffered damages in excess of $4 million. He seeks both compensatory and punitive damages. On September 18, 2017, the Company and the Bank filed a motion to compel arbitration, as required by Mr. Salas’ written agreement with the Bank, On January 17, 2018, the court granted the motion to compel arbitration and stayed the court action. On February 19, 2019, the parties reached a settlement in principle through mediation. The settlement will not have a material adverse effect on our financial condition, results of operations or liquidity.
On December 7, 2017, Heather Endresen filed an action in the Los Angeles Superior Court, captioned Heather Endresen v. Banc of California, Inc.; Banc of California, N.A., Case No. BC685641. Endresen’s complaint purports to state claims for retaliation, wrongful termination, breach of contract, breach of the implied covenant of good faith and fair dealing, and various statutory claims. Endresen dismissed the action without prejudice. On May 23, 2018, Endresen filed an action in the United States District Court for the Central District of California, captioned Heather Endresen v. Banc of California, Inc. and Banc of California, N.A., Case No. 8:18-cv-00899, asserting the claims she had made in the state court action and adding a claim for violation of the Sarbanes-Oxley Act. The complaint does not specify any amount of alleged damages. On September 20, 2018, the court granted Banc of California, Inc. and Banc of California, N.A’s motion to compel arbitration and stayed the litigation on the Sarbanes-Oxley Act claim pending arbitration. On December 4, 2018, Endresen filed her demand for arbitration. On December 18, 2018, Banc of California, Inc. and Banc of California, N.A. filed their answer to the demand and denied all claims. The arbitration has been scheduled for February 18-26, 2020. The Company believes that the claims are without merit and intends to vigorously contest them.
37
Item 4. Mine Safety Disclosures
Not applicable
38
PART II
Item 5. Market for Registrant’s Common Equity, Related Stockholder Matters and Issuer Purchases of Equity Securities
The Company’s voting common stock (symbol BANC) has been listed on the New York Stock Exchange (NYSE) since May 29, 2014 and prior to that date was listed on the NASDAQ Global Market. The Company’s Class B non-voting common stock is not listed or traded on any national securities exchange or automated quotation system, and there currently is no established trading market for such stock. The approximate number of holders of record of the Company’s voting common stock as of
December 31, 2018
was
1,386
. Certain shares are held in “nominee” or “street” name and accordingly, the number of beneficial owners of such shares is not known or included in the foregoing number. There were three holders of record of the Company’s Class B non-voting common stock as of
December 31, 2018
. At
December 31, 2018
there were
51,755,398
shares and
50,172,018
shares of voting common stock issued and outstanding, respectively, and
477,321
shares of Class B non-voting common stock issued and outstanding. The following table presents quarterly market price information for the Company’s voting common stock and quarterly per share cash dividend information for the Company's voting common stock and Class B non-voting common stock for the years ended
December 31, 2018
and
2017
. The per share cash dividends paid to holders of the Company's voting common stock and Class B non-voting common stock are identical.
|
Market Price Range
|
|||||||||||
|
High
|
Low
|
Dividends
|
|||||||||
|
Quarter ended December 31, 2018
|
$
|
18.76
|
|
$
|
12.45
|
|
$
|
0.13
|
|
||
|
Quarter ended September 30, 2018
|
$
|
20.25
|
|
$
|
18.70
|
|
$
|
0.13
|
|
||
|
Quarter ended June 30, 2018
|
$
|
20.30
|
|
$
|
18.15
|
|
$
|
0.13
|
|
||
|
Quarter ended March 31, 2018
|
$
|
21.70
|
|
$
|
18.70
|
|
$
|
0.13
|
|
||
|
Total
|
$
|
0.52
|
|
||||||||
|
Quarter ended December 31, 2017
|
$
|
23.05
|
|
$
|
19.65
|
|
$
|
0.13
|
|
||
|
Quarter ended September 30, 2017
|
$
|
22.10
|
|
$
|
17.15
|
|
$
|
0.13
|
|
||
|
Quarter ended June 30, 2017
|
$
|
22.60
|
|
$
|
19.90
|
|
$
|
0.13
|
|
||
|
Quarter ended March 31, 2017
|
$
|
20.95
|
|
$
|
14.65
|
|
$
|
0.13
|
|
||
|
Total
|
$
|
0.52
|
|
||||||||
Dividend Policy
The timing and amount of cash dividends paid to the Company’s preferred and common stockholders depends on the Company’s earnings, capital requirements, financial condition and other relevant factors. The Company’s primary source of revenue at the holding company level is dividends from the Bank. The Company also has previously relied on the net proceeds of capital raising transactions as the primary source of funds for cash dividends to its preferred and common stockholders. To the extent the Company is limited in its ability to raise capital in the future, its ability to pay cash dividends to its stockholders could likewise be limited, especially if it is unable to increase the amount of dividends the Bank pays to the Company. See “Item 1A. Risk Factors - Our holding company relies on dividends from the Bank for substantially all of its income and the net proceeds of capital raising transactions are currently the primary source of funds for cash dividends to our preferred and common stockholders” of this Annual Report on Form 10-K. The Bank paid dividends of
$94.3 million
to Banc of California, Inc. during the year ended
December 31, 2018
. For a description of the regulatory restriction on the ability of the Bank to pay dividends to Banc of California, Inc., and on the ability of Banc of California, Inc. to pay dividends to its stockholders, see “Regulation and Supervision” included in Item 1 of this Annual Report on Form 10-K.
As of
December 31, 2018
, the Company had
240,000
shares of preferred stock issued and outstanding, consisting of
115,000
shares of 7.375 percent Non-Cumulative Perpetual Preferred Stock, Series D, liquidation amount $1,000 per share (Series D Preferred Stock), and
125,000
shares of 7.00 percent Non-Cumulative Perpetual Preferred Stock, Series E, liquidation amount $1,000 per share (Series E Preferred Stock and together with the Series D Preferred Stock, the Preferred Stock). Each series of Preferred Stock ranks equally (pari passu) with the other series of Preferred Stock and senior to the Company's common stock in the payment of dividends and in the distribution of assets on any liquidation, dissolution or winding up of Banc of California, Inc.
39
Issuer Purchases of Equity Securities
The following table presents information for the three months ended
December 31, 2018
with respect to repurchases by the Company of its common stock:
|
Purchases of Equity Securities by the Issuer
|
||||||||||||
|
Period
|
Total Number of Shares Purchased
|
Weighted-Average Price Paid Per Share
|
Total Number of Shares Purchased as Part of Publicly Announced Plans
|
Total Number of Shares That May Yet be Purchased Under the Plan
|
||||||||
|
From October 1, 2018 to October 31, 2018
|
8,151
|
|
$
|
18.19
|
|
—
|
|
—
|
|
|||
|
From November 1, 2018 to November 30, 2018
|
1,249
|
|
$
|
16.59
|
|
—
|
|
—
|
|
|||
|
From December 1, 2018 to December 31, 2018
|
590
|
|
$
|
15.89
|
|
—
|
|
—
|
|
|||
|
Total
|
9,990
|
|
$
|
17.85
|
|
—
|
|
|||||
On the Annual Shareholder Meeting held on May 31, 2018, shareholders approved the new 2018 Omnibus Stock Incentive Plan (the “2018 Plan”) effective August 17, 2018. Under the 2018 Plan, shares tendered or withheld to pay the exercise price of an Option and Shares tendered or withheld to satisfy tax withholding obligations with respect to any award shall not be available for future Awards under the 2018 Plan. No new equity awards are granted under the 2013 Omnibus Stock Incentive Plan (the “2013 Plan”) effective May 31, 2018.
40
Stock Performance Graph
The following graph and related discussion are being furnished solely to accompany this Annual Report on Form 10-K pursuant to Item 201(e) of Regulation S-K and shall not be deemed to be “soliciting materials” or to be “filed” with the SEC (other than as provided in Item 201) nor shall this information be incorporated by reference into any future filing under the Securities Act or the Exchange Act, whether made before or after the date hereof and irrespective of any general incorporation language contained therein, except to the extent that the Company specifically incorporates it by reference into a filing.
The following graph shows a comparison of stockholder return on Banc of California, Inc.’s voting common stock with the cumulative total returns for: (i) the NYSE Composite Index; (ii) the Standard and Poor’s (S&P) 500 Financials Index; and (iii) the Keefe, Bruyette, and Woods, Inc.'s (KBW) Bank Index. The graph assumes an initial investment of $100 and reinvestment of dividends. The graph is historical only and may not be indicative of possible future performance.
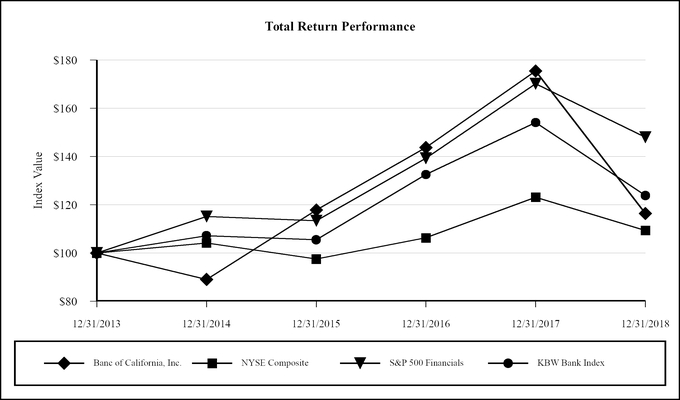
|
December 31,
|
||||||||||||||||||||||||
|
Index
|
2013
|
2014
|
2015
|
2016
|
2017
|
2018
|
||||||||||||||||||
|
Banc of California, Inc.
|
$
|
100.00
|
|
$
|
89.09
|
|
$
|
117.85
|
|
$
|
143.73
|
|
$
|
175.45
|
|
$
|
116.40
|
|
||||||
|
NYSE Composite
|
$
|
100.00
|
|
$
|
104.22
|
|
$
|
97.53
|
|
$
|
106.31
|
|
$
|
123.16
|
|
$
|
109.37
|
|
||||||
|
S&P 500 Financials
|
$
|
100.00
|
|
$
|
115.20
|
|
$
|
113.44
|
|
$
|
139.31
|
|
$
|
170.21
|
|
$
|
148.03
|
|
||||||
|
KBW Bank Index
|
$
|
100.00
|
|
$
|
107.22
|
|
$
|
105.52
|
|
$
|
132.53
|
|
$
|
154.07
|
|
$
|
123.87
|
|
||||||
41
Annual Rate of Stockholders' Return
The following graph shows a comparison of stockholder return on Banc of California, Inc.’s voting common stock with the annual rate of return for: (i) the NYSE Composite Index; (ii) the S&P 500 Financials Index; and (iii) the KBW Bank Index. The graph is historical only and may not be indicative of possible future performance.
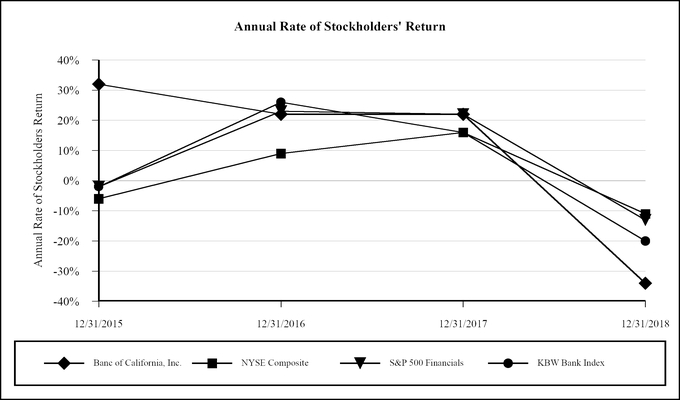
|
Year Ended December
31,
|
||||||||||||
|
Index
|
2015
|
2016
|
2017
|
2018
|
||||||||
|
Banc of California, Inc.
|
32
|
%
|
22
|
%
|
22
|
%
|
(34
|
)%
|
||||
|
NYSE Composite
|
(6
|
)%
|
9
|
%
|
16
|
%
|
(11
|
)%
|
||||
|
S&P 500 Financials
|
(2
|
)%
|
23
|
%
|
22
|
%
|
(13
|
)%
|
||||
|
KBW Bank Index
|
(2
|
)%
|
26
|
%
|
16
|
%
|
(20
|
)%
|
||||
42
Item 6. Selected Financial Data
The following table sets forth certain consolidated financial and other data of the Company at the dates and for the periods indicated. The information set forth below should be read in conjunction with “Management’s Discussion and Analysis of Financial Condition and Results of Operations” included herein at Item 7 and the Consolidated Financial Statements and Notes thereto included herein at Item 8.
|
As of or For the Year Ended December
31,
|
||||||||||||||||||||
|
($ in thousands, except per share data)
|
2018
|
2017
|
2016
(7)
|
2015
|
2014
(8)
|
|||||||||||||||
|
Selected financial condition data:
|
||||||||||||||||||||
|
Total assets
|
$
|
10,630,067
|
|
$
|
10,327,852
|
|
$
|
11,029,853
|
|
$
|
8,235,555
|
|
$
|
5,971,297
|
|
|||||
|
Cash and cash equivalents
|
391,592
|
|
387,699
|
|
439,510
|
|
156,124
|
|
231,199
|
|
||||||||||
|
Loans and leases receivable, net
|
7,638,681
|
|
6,610,074
|
|
5,994,308
|
|
5,148,861
|
|
3,919,642
|
|
||||||||||
|
Loans held-for-sale
|
8,116
|
|
67,069
|
|
298,018
|
|
293,264
|
|
918,036
|
|
||||||||||
|
Other real estate owned, net
|
672
|
|
1,796
|
|
2,502
|
|
1,097
|
|
423
|
|
||||||||||
|
Securities available-for-sale
|
1,992,500
|
|
2,575,469
|
|
2,381,488
|
|
833,596
|
|
345,695
|
|
||||||||||
|
Securities held-to-maturity
|
—
|
|
—
|
|
884,234
|
|
962,203
|
|
—
|
|
||||||||||
|
Bank owned life insurance
|
107,027
|
|
104,851
|
|
102,512
|
|
100,171
|
|
19,095
|
|
||||||||||
|
Time deposits in financial institutions
|
—
|
|
—
|
|
1,000
|
|
1,500
|
|
1,900
|
|
||||||||||
|
FHLB and other bank stock
|
68,094
|
|
75,654
|
|
67,842
|
|
59,069
|
|
42,241
|
|
||||||||||
|
Assets of discontinued operations
|
19,490
|
|
38,900
|
|
482,494
|
|
420,050
|
|
300,872
|
|
||||||||||
|
Deposits
|
7,916,644
|
|
7,292,903
|
|
9,142,150
|
|
6,303,085
|
|
4,671,831
|
|
||||||||||
|
Total borrowings
|
1,693,174
|
|
1,867,941
|
|
733,300
|
|
1,191,876
|
|
726,569
|
|
||||||||||
|
Liabilities of discontinued operations
|
—
|
|
7,819
|
|
34,480
|
|
20,856
|
|
14,853
|
|
||||||||||
|
Total stockholders' equity
|
945,534
|
|
1,012,308
|
|
980,239
|
|
652,405
|
|
503,315
|
|
||||||||||
|
Selected operations data:
|
||||||||||||||||||||
|
Total interest income
|
$
|
422,796
|
|
$
|
389,190
|
|
$
|
369,844
|
|
$
|
253,807
|
|
$
|
179,645
|
|
|||||
|
Total interest expense
|
136,720
|
|
85,000
|
|
59,499
|
|
42,621
|
|
32,862
|
|
||||||||||
|
Net interest income
|
286,076
|
|
304,190
|
|
310,345
|
|
211,186
|
|
146,783
|
|
||||||||||
|
Provision for loan and lease losses
|
30,215
|
|
13,699
|
|
5,271
|
|
7,469
|
|
10,976
|
|
||||||||||
|
Total noninterest income
|
23,915
|
|
44,670
|
|
98,630
|
|
75,748
|
|
49,173
|
|
||||||||||
|
Total noninterest expense
|
232,785
|
|
308,268
|
|
303,215
|
|
210,299
|
|
170,285
|
|
||||||||||
|
Income from continuing operations before income taxes
|
46,991
|
|
26,893
|
|
100,489
|
|
69,166
|
|
14,695
|
|
||||||||||
|
Income tax expense (benefit)
|
4,844
|
|
(26,581
|
)
|
13,749
|
|
28,048
|
|
(8,102
|
)
|
||||||||||
|
Income from continuing operations
|
42,147
|
|
53,474
|
|
86,740
|
|
41,118
|
|
22,797
|
|
||||||||||
|
Income from discontinued operations before income taxes
|
4,596
|
|
7,164
|
|
48,917
|
|
35,100
|
|
11,771
|
|
||||||||||
|
Income tax expense
|
1,271
|
|
2,929
|
|
20,241
|
|
14,146
|
|
4,363
|
|
||||||||||
|
Income from discontinued operations
|
3,325
|
|
4,235
|
|
28,676
|
|
20,954
|
|
7,408
|
|
||||||||||
|
Net income
|
45,472
|
|
57,709
|
|
115,416
|
|
62,072
|
|
30,205
|
|
||||||||||
|
Dividends paid on preferred stock
|
19,504
|
|
20,451
|
|
19,914
|
|
9,823
|
|
3,640
|
|
||||||||||
|
Impact of preferred stock redemption
|
2,307
|
|
—
|
|
—
|
|
—
|
|
—
|
|
||||||||||
|
Net income available to common stockholders
|
23,661
|
|
37,258
|
|
95,502
|
|
52,249
|
|
26,565
|
|
||||||||||
|
Basic earnings per total common share
|
||||||||||||||||||||
|
Income from continuing operations
|
$
|
0.38
|
|
$
|
0.64
|
|
$
|
1.36
|
|
$
|
0.79
|
|
$
|
0.65
|
|
|||||
|
Income from discontinued operations
|
$
|
0.07
|
|
$
|
0.08
|
|
$
|
0.61
|
|
$
|
0.57
|
|
$
|
0.26
|
|
|||||
|
Net income
|
$
|
0.45
|
|
$
|
0.72
|
|
$
|
1.97
|
|
$
|
1.36
|
|
$
|
0.91
|
|
|||||
|
Diluted earnings per total common share
|
||||||||||||||||||||
|
Income from continuing operations
|
$
|
0.38
|
|
$
|
0.63
|
|
$
|
1.34
|
|
$
|
0.78
|
|
$
|
0.64
|
|
|||||
|
Income from discontinued operations
|
$
|
0.07
|
|
$
|
0.08
|
|
$
|
0.60
|
|
$
|
0.56
|
|
$
|
0.26
|
|
|||||
|
Net income
|
$
|
0.45
|
|
$
|
0.71
|
|
$
|
1.94
|
|
$
|
1.34
|
|
$
|
0.90
|
|
|||||
43
|
As of or For the Year Ended December
31,
|
||||||||||||||||||||
|
($ in thousands, except per share data)
|
2018
|
2017
|
2016
(7)
|
2015
|
2014
(8)
|
|||||||||||||||
|
Performance ratios of consolidated operations:
(
1)
|
||||||||||||||||||||
|
Return on average assets
|
0.44
|
%
|
0.55
|
%
|
1.12
|
%
|
0.94
|
%
|
0.69
|
%
|
||||||||||
|
Return on average equity
|
4.57
|
%
|
5.72
|
%
|
12.73
|
%
|
10.14
|
%
|
7.31
|
%
|
||||||||||
|
Return on average tangible common equity
(2)
|
3.76
|
%
|
5.79
|
%
|
16.97
|
%
|
14.22
|
%
|
10.10
|
%
|
||||||||||
|
Dividend payout ratio
(3)
|
115.56
|
%
|
72.22
|
%
|
24.87
|
%
|
35.29
|
%
|
52.75
|
%
|
||||||||||
|
Net interest spread
|
2.67
|
%
|
2.92
|
%
|
3.15
|
%
|
3.35
|
%
|
3.54
|
%
|
||||||||||
|
Net interest margin
(4)
|
2.95
|
%
|
3.11
|
%
|
3.30
|
%
|
3.52
|
%
|
3.72
|
%
|
||||||||||
|
Noninterest expense to average total assets
|
2.28
|
%
|
3.50
|
%
|
4.28
|
%
|
5.02
|
%
|
6.06
|
%
|
||||||||||
|
Efficiency ratio
(5)
|
74.01
|
%
|
88.52
|
%
|
74.11
|
%
|
74.83
|
%
|
87.56
|
%
|
||||||||||
|
Efficiency ratio as adjusted
(2),
(5)
|
70.87
|
%
|
77.18
|
%
|
67.13
|
%
|
74.83
|
%
|
87.56
|
%
|
||||||||||
|
Average interest-earning assets to average interest-bearing liabilities
|
119.89
|
%
|
122.66
|
%
|
123.80
|
%
|
125.29
|
%
|
122.06
|
%
|
||||||||||
|
Asset quality ratios:
|
||||||||||||||||||||
|
Allowance for loan and lease losses (ALLL)
|
$
|
62,192
|
|
$
|
49,333
|
|
$
|
40,444
|
|
$
|
35,533
|
|
$
|
29,480
|
|
|||||
|
Non-performing loans and leases
|
22,055
|
|
19,382
|
|
14,942
|
|
45,129
|
|
38,381
|
|
||||||||||
|
Non-performing assets
|
22,727
|
|
21,178
|
|
17,444
|
|
46,226
|
|
38,804
|
|
||||||||||
|
Non-performing assets to total assets
|
0.21
|
%
|
0.21
|
%
|
0.16
|
%
|
0.56
|
%
|
0.65
|
%
|
||||||||||
|
ALLL to non-performing loans and leases
|
281.99
|
%
|
254.53
|
%
|
270.67
|
%
|
78.74
|
%
|
76.81
|
%
|
||||||||||
|
ALLL to total loans and leases
|
0.81
|
%
|
0.74
|
%
|
0.67
|
%
|
0.69
|
%
|
0.75
|
%
|
||||||||||
|
Capital Ratios:
|
||||||||||||||||||||
|
Average equity to average assets
|
9.73
|
%
|
9.58
|
%
|
8.77
|
%
|
9.25
|
%
|
9.51
|
%
|
||||||||||
|
Total stockholders' equity to total assets
|
8.89
|
%
|
9.80
|
%
|
8.89
|
%
|
7.92
|
%
|
8.43
|
%
|
||||||||||
|
Tangible common equity (TCE) to tangible assets
(2)
|
6.34
|
%
|
6.78
|
%
|
6.00
|
%
|
4.93
|
%
|
6.20
|
%
|
||||||||||
|
Book value per common share
|
$
|
14.10
|
|
$
|
14.69
|
|
$
|
14.25
|
|
$
|
12.14
|
|
$
|
12.17
|
|
|||||
|
TCE per common share
(2)
|
$
|
13.25
|
|
$
|
13.77
|
|
$
|
13.19
|
|
$
|
10.60
|
|
$
|
10.53
|
|
|||||
|
Book value per common share and per common share issuable under purchase contracts
|
$
|
14.10
|
|
$
|
14.69
|
|
$
|
14.20
|
|
$
|
11.95
|
|
$
|
11.51
|
|
|||||
|
TCE per common shares and per common share issuable under purchase contracts
(2)
|
$
|
13.25
|
|
$
|
13.77
|
|
$
|
13.14
|
|
$
|
10.44
|
|
$
|
9.97
|
|
|||||
|
Banc of California, Inc.
|
||||||||||||||||||||
|
Total risk-based capital ratio
|
13.71
|
%
|
14.56
|
%
|
13.70
|
%
|
11.18
|
%
|
11.28
|
%
|
||||||||||
|
Tier 1 risk-based capital ratio
|
12.77
|
%
|
13.79
|
%
|
13.22
|
%
|
10.71
|
%
|
10.54
|
%
|
||||||||||
|
Common equity tier 1 capital ratio
(6)
|
9.53
|
%
|
9.92
|
%
|
9.44
|
%
|
7.36
|
%
|
N/A
|
|
||||||||||
|
Tier 1 leverage ratio
|
8.95
|
%
|
9.39
|
%
|
8.17
|
%
|
8.07
|
%
|
8.57
|
%
|
||||||||||
|
Banc of California, N.A.
|
||||||||||||||||||||
|
Total risk-based capital ratio
|
15.71
|
%
|
16.56
|
%
|
14.73
|
%
|
13.45
|
%
|
12.04
|
%
|
||||||||||
|
Tier 1 risk-based capital ratio
|
14.77
|
%
|
15.78
|
%
|
14.12
|
%
|
12.79
|
%
|
11.29
|
%
|
||||||||||
|
Common equity tier 1 capital ratio
(6)
|
14.77
|
%
|
15.78
|
%
|
14.12
|
%
|
12.79
|
%
|
N/A
|
|
||||||||||
|
Tier 1 leverage ratio
|
10.36
|
%
|
10.67
|
%
|
8.71
|
%
|
9.64
|
%
|
9.17
|
%
|
||||||||||
|
(1)
|
Consolidated operations include both continuing and discontinued operations.
|
|
(2)
|
Non-GAAP measure. See non-GAAP measures for reconciliation of the calculation.
|
|
(3)
|
Ratio of dividends declared per common share to basic earnings per common share.
|
|
(4)
|
Net interest income divided by average interest-earning assets.
|
|
(5)
|
Efficiency ratio represents noninterest expense, excluding loss on investments in alternative energy partnerships, net, as a percentage of net interest income plus noninterest income.
|
|
(6)
|
Common equity tier 1 capital ratio became required from 2015.
|
|
(7)
|
The Company completed its sale of The Palisades Group on May
5, 2016.
|
|
(8)
|
The Company completed its acquisitions of RenovationReady and the Banco Popular North America's Southern California branches (BPNA Branch Acquisition) on January
31, 2014 and November
8, 2014, respectively.
|
44
Non-GAAP Financial Measures
Under Item 10(e) of SEC Regulation S-K, public companies disclosing financial measures in filings with the SEC that are not calculated in accordance with GAAP must also disclose, along with each non-GAAP financial measure, certain additional information, including a presentation of the most directly comparable GAAP financial measure, a reconciliation of the non-GAAP financial measure to the most directly comparable GAAP financial measure, as well as a statement of the reasons why the company’s management believes that presentation of the non-GAAP financial measure provides useful information to investors regarding the company’s financial condition and results of operations and, to the extent material, a statement of the additional purposes, if any, for which the company’s management uses the non-GAAP financial measure.
Return on average tangible common equity and efficiency ratio, as adjusted, tangible common equity to tangible assets, and tangible common equity per common share and tangible common equity per common share and per common share issuable under purchase contracts constitute supplemental financial information determined by methods other than in accordance with GAAP. These non-GAAP measures are used by management in its analysis of the Company's performance.
Tangible common equity is calculated by subtracting preferred stock, goodwill, and other intangible assets from stockholders’ equity. Tangible assets are calculated by subtracting goodwill and other intangible assets from total assets. Banking regulators also exclude goodwill and other intangible assets from stockholders’ equity when assessing the capital adequacy of a financial institution.
Adjusted efficiency ratio is calculated by subtracting loss on investments in alternative energy partnerships from noninterest expense and adding total pre-tax adjustments for investments in alternative energy partnerships, which includes the loss on investments in alternative energy partnerships, to the sum of net interest income and noninterest income (total revenue). Management believes the presentation of these financial measures adjusting the impact of these items provides useful supplemental information that is essential to a proper understanding of the financial results and operating performance of the Company.
This disclosure should not be viewed as a substitute for results determined in accordance with GAAP, nor is it necessarily comparable to non-GAAP performance measures that may be presented by other companies.
The following tables provide reconciliations of the non-GAAP measures with financial measures defined by GAAP.
Return on Average Tangible Common Equity
|
Year Ended December 31,
|
||||||||||||||||||||
|
($ in thousands)
|
2018
|
2017
|
2016
|
2015
|
2014
|
|||||||||||||||
|
Average total stockholders' equity
|
$
|
995,320
|
|
$
|
1,008,995
|
|
$
|
906,831
|
|
$
|
612,393
|
|
$
|
413,454
|
|
|||||
|
Less average preferred stock
|
(257,428
|
)
|
(269,071
|
)
|
(267,054
|
)
|
(161,288
|
)
|
(79,877
|
)
|
||||||||||
|
Less average goodwill
|
(37,144
|
)
|
(37,656
|
)
|
(39,244
|
)
|
(33,541
|
)
|
(32,326
|
)
|
||||||||||
|
Less average other intangible assets
|
(7,799
|
)
|
(11,375
|
)
|
(16,654
|
)
|
(22,222
|
)
|
(11,739
|
)
|
||||||||||
|
Average tangible common equity
|
$
|
692,949
|
|
$
|
690,893
|
|
$
|
583,879
|
|
$
|
395,342
|
|
$
|
289,512
|
|
|||||
|
Net income
|
$
|
45,472
|
|
$
|
57,709
|
|
$
|
115,416
|
|
$
|
62,072
|
|
$
|
30,205
|
|
|||||
|
Less preferred stock dividends and impact of preferred stock redemption
|
(21,811
|
)
|
(20,451
|
)
|
(19,914
|
)
|
(9,823
|
)
|
(3,640
|
)
|
||||||||||
|
Add amortization of intangible assets
|
3,007
|
|
3,928
|
|
4,851
|
|
5,836
|
|
4,079
|
|
||||||||||
|
Add impairment on intangible assets
|
—
|
|
336
|
|
690
|
|
258
|
|
48
|
|
||||||||||
|
Less tax effect on amortization and impairment of intangible assets
(1)
|
(631
|
)
|
(1,492
|
)
|
(1,939
|
)
|
(2,133
|
)
|
(1,445
|
)
|
||||||||||
|
Adjusted net income
|
$
|
26,037
|
|
$
|
40,030
|
|
$
|
99,104
|
|
$
|
56,210
|
|
$
|
29,247
|
|
|||||
|
Return on average equity
|
4.57
|
%
|
5.72
|
%
|
12.73
|
%
|
10.14
|
%
|
7.31
|
%
|
||||||||||
|
Return on average tangible common equity
|
3.76
|
%
|
5.79
|
%
|
16.97
|
%
|
14.22
|
%
|
10.10
|
%
|
||||||||||
(1) Utilized a 21 percent tax rate for 2018 and 35 percent tax rate for 2014 through 2017.
45
Efficiency ratio as adjusted to include the pre-tax effect of investments in alternative energy partnerships
|
Year Ended December 31,
|
||||||||||||||||||||
|
($ in thousands)
|
2018
|
2017
|
2016
|
2015
|
2014
|
|||||||||||||||
|
Noninterest expense
(1)
|
$
|
232,921
|
|
$
|
368,263
|
|
$
|
442,676
|
|
$
|
332,201
|
|
$
|
263,472
|
|
|||||
|
Loss on investments in alternative energy partnerships, net
|
(5,044
|
)
|
(30,786
|
)
|
(31,510
|
)
|
—
|
|
—
|
|
||||||||||
|
Total adjusted noninterest expense
|
$
|
227,877
|
|
$
|
337,477
|
|
$
|
411,166
|
|
$
|
332,201
|
|
$
|
263,472
|
|
|||||
|
Net interest income
(1)
|
$
|
286,741
|
|
$
|
311,242
|
|
$
|
325,473
|
|
$
|
223,717
|
|
$
|
155,277
|
|
|||||
|
Noninterest income
(1)
|
27,982
|
|
104,777
|
|
271,880
|
|
220,219
|
|
145,637
|
|
||||||||||
|
Total revenue
|
314,723
|
|
416,019
|
|
597,353
|
|
443,936
|
|
300,914
|
|
||||||||||
|
Tax credit from investments in alternative energy partnerships
|
9,647
|
|
38,196
|
|
33,405
|
|
—
|
|
—
|
|
||||||||||
|
Tax expense from tax basis reduction on investments in alternative energy partnerships
|
(1,023
|
)
|
(6,684
|
)
|
(5,846
|
)
|
—
|
|
—
|
|
||||||||||
|
Tax effect on tax credit and deferred tax expense
|
3,259
|
|
20,531
|
|
19,080
|
|
—
|
|
—
|
|
||||||||||
|
Loss on investments in alternative energy partnerships, net
|
(5,044
|
)
|
(30,786
|
)
|
(31,510
|
)
|
—
|
|
—
|
|
||||||||||
|
Total pre-tax adjustments for investments in alternative energy partnerships
|
6,839
|
|
21,257
|
|
15,129
|
|
—
|
|
—
|
|
||||||||||
|
Total adjusted revenue
|
$
|
321,562
|
|
$
|
437,276
|
|
$
|
612,482
|
|
$
|
443,936
|
|
$
|
300,914
|
|
|||||
|
Efficiency ratio
|
74.01
|
%
|
88.52
|
%
|
74.11
|
%
|
74.83
|
%
|
87.56
|
%
|
||||||||||
|
Efficiency ratio as adjusted to include the pre-tax effect of investments in alternative energy partnerships
|
70.87
|
%
|
77.18
|
%
|
67.13
|
%
|
74.83
|
%
|
87.56
|
%
|
||||||||||
|
Effective tax rate utilized for calculating tax effect on tax credit and deferred tax expense
|
27.42
|
%
|
39.45
|
%
|
40.91
|
%
|
—
|
%
|
—
|
%
|
||||||||||
|
(1)
|
Net interest income, noninterest income and noninterest expense includes income and expense from discontinued operations.
|
46
Tangible Common Equity to Tangible Assets and Tangible Common Equity per Common Share and per Common Share Issuable under Purchase Contracts
|
December 31,
|
||||||||||||||||||||
|
($ in thousands, except per share data)
|
2018
|
2017
|
2016
|
2015
|
2014
|
|||||||||||||||
|
Total stockholders' equity
|
$
|
945,534
|
|
$
|
1,012,308
|
|
$
|
980,239
|
|
$
|
652,405
|
|
$
|
503,315
|
|
|||||
|
Less goodwill
|
(37,144
|
)
|
(37,144
|
)
|
(39,244
|
)
|
(39,244
|
)
|
(31,591
|
)
|
||||||||||
|
Less other intangible assets
|
(6,346
|
)
|
(9,353
|
)
|
(13,617
|
)
|
(19,158
|
)
|
(25,252
|
)
|
||||||||||
|
Less preferred stock
|
(231,128
|
)
|
(269,071
|
)
|
(269,071
|
)
|
(190,750
|
)
|
(79,877
|
)
|
||||||||||
|
Tangible common equity
|
$
|
670,916
|
|
$
|
696,740
|
|
$
|
658,307
|
|
$
|
403,253
|
|
$
|
366,595
|
|
|||||
|
Total assets
|
$
|
10,630,067
|
|
$
|
10,327,852
|
|
$
|
11,029,853
|
|
$
|
8,235,555
|
|
$
|
5,971,297
|
|
|||||
|
Less goodwill
|
(37,144
|
)
|
(37,144
|
)
|
(39,244
|
)
|
(39,244
|
)
|
(31,591
|
)
|
||||||||||
|
Less other intangible assets
|
(6,346
|
)
|
(9,353
|
)
|
(13,617
|
)
|
(19,158
|
)
|
(25,252
|
)
|
||||||||||
|
Tangible assets
|
$
|
10,586,577
|
|
$
|
10,281,355
|
|
$
|
10,976,992
|
|
$
|
8,177,153
|
|
$
|
5,914,454
|
|
|||||
|
Total stockholders' equity to total assets
|
8.89
|
%
|
9.80
|
%
|
8.89
|
%
|
7.92
|
%
|
8.43
|
%
|
||||||||||
|
Tangible common equity to tangible assets
|
6.34
|
%
|
6.78
|
%
|
6.00
|
%
|
4.93
|
%
|
6.20
|
%
|
||||||||||
|
Common stock outstanding
|
50,172,018
|
|
50,083,345
|
|
49,695,299
|
|
38,002,267
|
|
34,190,740
|
|
||||||||||
|
Class B non-voting non-convertible common stock outstanding
|
477,321
|
|
508,107
|
|
201,922
|
|
37,355
|
|
609,195
|
|
||||||||||
|
Total common stock outstanding
|
50,649,339
|
|
50,591,452
|
|
49,897,221
|
|
38,039,622
|
|
34,799,935
|
|
||||||||||
|
Minimum number of shares issuable under purchase contracts
(1)
|
—
|
|
—
|
|
188,742
|
|
601,299
|
|
1,982,181
|
|
||||||||||
|
Total common stock outstanding and shares issuable under purchase contracts
|
50,649,339
|
|
50,591,452
|
|
50,085,963
|
|
38,640,921
|
|
36,782,116
|
|
||||||||||
|
Book value per common share
|
$
|
14.10
|
|
$
|
14.69
|
|
$
|
14.25
|
|
$
|
12.14
|
|
$
|
12.17
|
|
|||||
|
TCE per common share
|
$
|
13.25
|
|
$
|
13.77
|
|
$
|
13.19
|
|
$
|
10.60
|
|
$
|
10.53
|
|
|||||
|
Book value per common share and per common share issuable under purchase contracts
|
$
|
14.10
|
|
$
|
14.69
|
|
$
|
14.20
|
|
$
|
11.95
|
|
$
|
11.51
|
|
|||||
|
TCE per common share and per common share issuable under purchase contracts
|
$
|
13.25
|
|
$
|
13.77
|
|
$
|
13.14
|
|
$
|
10.44
|
|
$
|
9.97
|
|
|||||
(1) Purchase contracts relating to tangible equity units
47
Item 7. Management’s Discussion and Analysis of Financial Condition and Results of Operations
Critical Accounting Policies
The Company follows accounting and reporting policies and procedures that conform, in all material respects, to GAAP and to practices generally applicable to the financial services industry, the most significant of which are described in Note 1 to Consolidated Financial Statements included in Item 8 of this Annual Report on Form 10-K. The preparation of Consolidated Financial Statements in conformity with GAAP requires management to make judgments and accounting estimates that affect the amounts reported for assets, liabilities, revenues and expenses on the Consolidated Financial Statements and accompanying notes, and amounts disclosed as contingent assets and liabilities. While the Company bases estimates on historical experience, current information and other factors deemed to be relevant, actual results could differ from those estimates.
Accounting estimates are necessary in the application of certain accounting policies and procedures that are particularly susceptible to significant change. Critical accounting policies are defined as those that require the most complex or subjective judgment and are reflective of significant uncertainties, and could potentially result in materially different results under different assumptions and conditions. Management has identified the Company's most critical accounting policies and accounting estimates, which have been discussed with the appropriate committees of the Board of Directors, as follows:
Investment Securities
Under ASC 320, Investments - Debt and Equity Securities, investment securities must be classified as held-to-maturity, available-for-sale or trading. Management determines the appropriate classification at the time of purchase. The classification of securities is significant since it directly impacts the accounting for unrealized gains and losses on securities. Debt securities are classified as held-to-maturity and carried at amortized cost when management has the positive intent and the Company has the ability to hold the securities to maturity. Securities not classified as held-to-maturity are classified as available-for-sale and are carried at fair value, with the unrealized holding gains and losses, net of tax, reported in AOCI and do not affect earnings until realized unless a decline in fair value below amortized cost is considered to be OTTI.
The fair values of the Company’s securities are generally determined by reference to quoted prices from reliable independent third party sources and pricing services utilizing observable inputs. Certain of the Company’s fair values of securities may be determined by third party source and pricing services that may use models whose significant value drivers or assumptions may be unobservable and are significant to the fair value of the securities. These models are utilized when quoted prices are not available for certain securities or in markets where trading activity has slowed or ceased. When quoted prices are not available and are not provided by third party sources or pricing services, management judgment is necessary to determine fair value. As such, fair value is determined using discounted cash flow analysis models, incorporating default rates, estimation of prepayment characteristics and implied volatilities.
The Company evaluates all securities on a quarterly basis, and more frequently when economic conditions warrant additional evaluations, for determining if OTTI exists pursuant to guidelines established in ASC 320. In evaluating the possible impairment of securities, consideration is given to the length of time and the extent to which the fair value has been less than cost, the financial conditions and near-term prospects of the issuer, and the ability and intent of the Company to retain its investment in the issuer for a period of time sufficient to allow for any anticipated recovery in fair value. In analyzing an issuer’s financial condition, the Company may consider whether the securities are issued by the federal government or its agencies or government sponsored agencies, whether downgrades by bond rating agencies have occurred, and the results of reviews of the issuer’s financial condition.
If management determines that an investment experienced an OTTI, management must then determine the amount of the OTTI to be recognized in earnings. If management does not intend to sell the security and it is more likely than not that the Company will not be required to sell the security before recovery of its amortized cost basis less any current period loss, the OTTI will be separated into the amount representing the credit loss and the amount related to all other factors. The amount of OTTI related to the credit loss is determined based on the present value of cash flows expected to be collected and is recognized in earnings. The amount of the OTTI related to other factors will be recognized in AOCI, net of applicable taxes. The previous amortized cost basis less the OTTI recognized in earnings will become the new amortized cost basis of the investment. If management intends to sell the security or more likely than not will be required to sell the security before recovery of its amortized cost basis less any current period credit loss, the OTTI will be recognized in earnings equal to the entire difference between the investment’s amortized cost basis and its fair value at the balance sheet date. Any recoveries related to the value of these securities are recorded as an unrealized gain (as AOCI in stockholders’ equity) and not recognized in income until the security is ultimately sold.
The Company may, from time to time, dispose of an impaired security in response to asset/liability management decisions, future market movements, business plan changes, or if the net proceeds can be reinvested at a rate of return that is expected to recover the loss within a reasonable period of time.
48
Allowance for Loan and Lease Losses
The allowance for loan and lease losses is a reserve established through a provision for loan and lease losses charged to expense, and represents management’s best estimate of probable losses that may be incurred within the existing loan and lease portfolio as of the balance sheet date. Subsequent recoveries, if any, are credited to the allowance. The Company performs an analysis of the adequacy of the allowance at least on a quarterly basis. Management estimates the allowance balance required using past loan and lease loss experience, the nature and volume of the portfolio, information about specific borrower situations and estimated collateral values, economic conditions, and other factors. While management utilizes its best judgment and information available, the ultimate adequacy of the allowance for loan and lease losses is dependent upon a variety of factors beyond the Company’s control, including performance of the Company’s loan portfolio, the economy, changes in interest rates, and regulatory authorities altering their loan classification guidance.
The allowance consists of three elements: (i) specific valuation allowances established for probable losses on impaired loans and leases; (ii) quantitative valuation allowances calculated using loss experience for like loans and leases with similar characteristics and trends, adjusted, as necessary to reflect the impact of current conditions; and (iii) qualitative allowances based on economic and other factors that may be internal or external to the Company.
Deferred Income Taxes
Deferred income tax assets and liabilities are computed for differences between the financial statement and tax basis of assets and liabilities that will result in taxable or deductible amounts in the future based on enacted tax laws and rates applicable to the periods in which the differences are expected to affect taxable income. Deferred tax assets are also recognized for operating loss and tax credit carryforwards. Accounting guidance requires that companies assess whether a valuation allowance should be established against the deferred tax assets based on the consideration of all available evidence using a “more likely than not” standard.
Deferred tax assets are reduced by a valuation allowance when, in the opinion of management, it is more likely than not that some portion, or all, of the deferred tax asset will not be realized. In assessing the realization of deferred tax assets, management evaluates both positive and negative evidence on a quarterly basis, including the reversal of its taxable temporary differences, the existence of its historical earnings, the amounts of future projected earnings as well as the tax expiration periods of its income tax credits.
Alternative Energy Partnerships
The Company invests in certain alternative energy partnerships (limited liability companies) formed to provide sustainable energy projects that are designed to generate a return primarily through the realization of federal tax credits (energy tax credits) and other tax benefits. The Company is a limited partner in these partnerships, which were formed to invest in newly installed residential rooftop solar leases and power purchase agreements.
As the Company’s respective investments in these entities are more than minor, the Company has significant influence, but not control, over the investee’s activities that most significantly impact its economic performance. As a result, the Company is required to apply the equity method of accounting, which generally prescribes applying the percentage ownership interest to the investee’s GAAP net income in order to determine the investor’s earnings or losses in a given period. However, because the liquidation rights, tax credit allocations and other benefits to investors can change upon the occurrence of specified events, application of the equity method based on the underlying ownership percentages would not accurately represent the Company’s investment. As a result, the Company applies the Hypothetical Liquidation at Book Value (HLBV) method of the equity method of accounting. The HLBV method is a balance sheet approach where a calculation is prepared at each balance sheet date to estimate the amount that the Company would receive if the equity investment entity were to liquidate all of its assets (as valued in accordance with GAAP) and distribute that cash to the investors based on the contractually defined liquidation priorities. The difference between the calculated liquidation distribution amounts at the beginning and the end of the reporting period, after adjusting for capital contributions and distributions, is the Company’s share of the earnings or losses from the equity investment for the period.
To account for the tax credits earned on investments in alternative energy partnerships, the Company uses the flow-through income statement method. Under this method, the tax credits are recognized as a reduction to income tax expense and the initial book-tax differences in the basis of the investments are recognized as additional tax expense in the year they are earned. The Company does not believe the investments in alternative energy partnerships are impaired by the lower corporate income tax rate from the Tax Cuts and Jobs Act due to the protective provision built into the partnership agreements. However, the Company expects to take longer to utilize the investment tax credits generated from these investments.
49
Recent Accounting Pronouncements
See Note 1. Summary of Significant Accounting Policies of the Notes to Consolidated Financial Statements contained in “Item 8. Financial Statements and Supplementary Data” for information on recent accounting pronouncements and their expected impact, if any, on our consolidated financial statements.
50
Executive Overview
The Company is focused on California and core banking products and services designed to cater to the unique needs of California's diverse private businesses, entrepreneurs and communities through its
32
full service branches in San Diego, Orange, Santa Barbara, and Los Angeles Counties. The Company offers a variety of financial products and services designed around its target client in order to serve all of their banking and financial needs.
Financial Highlights
For the years ended
December 31, 2018
,
2017
and
2016
, net income from continuing operations was
$42.1 million
,
$53.5 million
and
$86.7 million
, respectively. Diluted earnings from continuing operations per total common share were
$0.38
,
$0.63
and
$1.34
, respectively, for the years ended
December 31, 2018
,
2017
and
2016
. The decrease in net income from continuing operations for the year ended
December 31, 2018
as compared to the year ended
December 31, 2017
was mainly due to decreases in net interest income, noninterest income and income tax benefit and an increase in provision for loan and lease losses, partially offset by a decrease in noninterest expense. The decrease in net income from continuing operations for the year ended
December 31, 2017
as compared to the year ended
December 31, 2016
was mainly due to increases in noninterest expense and provision for loan and lease losses and decreases in noninterest income and net interest income, partially offset by a decrease in income tax expense.
Total assets were
$10.63 billion
at
December 31, 2018
,
an increase
of
$302.2 million
, or
2.9 percent
, from
$10.33 billion
at
December 31, 2017
. The increase was mainly due to an increase in loans and leases held-for-investment partially offset by a decrease in investment securities.
Significant financial highlights include:
|
•
|
Securities available-for-sale were
$1.99 billion
at
December 31, 2018
, a decrease of
$583.0 million
, or
22.6 percent
, from
$2.58 billion
at
December 31, 2017
. The decrease was primarily due to a net decline in collateralized loan obligations due to call and sale activities and a decrease in commercial mortgage-backed-securities due to sales. The Company continued shrinking the amount of collateralized loan obligations in the investment securities portfolio and repositioned its securities available-for-sale portfolio to navigate a volatile rate environment by reducing the overall duration of the portfolio by selling longer-duration corporate debt securities and commercial mortgage-backed-securities. The sales of securities served to remix overall assets and the proceeds therefrom were primarily used to fund loan originations.
|
|
•
|
Loans and leases receivable, net of ALLL, were
$7.70 billion
at
December 31, 2018
, an increase of
$1.04 billion
, or
15.6 percent
, from
$6.66 billion
at
December 31, 2017
. The increase was mainly due to originations partially offset by an increase of
$12.9 million
in the ALLL and the sale of SFR mortgage loan pools during the year ended December 31, 2018.
|
|
•
|
Total deposits were
$7.92 billion
at
December 31, 2018
,
an increase
of
$623.7 million
, or
8.6 percent
, from
$7.29 billion
at
December 31, 2017
. The increase was mainly due to the Company's continuous efforts to build core deposits across the Company's business units, including strong growth from the community banking and private banking channel and increased brokered deposits.
|
|
•
|
Total stockholders' equity was
$945.5 million
at
December 31, 2018
, a decrease of
$66.8 million
, or
6.6 percent
, from
$1.01 billion
at
December 31, 2017
. The decrease was primarily the result of the redemption of the Company's Series C Preferred Stock for an aggregate amount of
$40.3 million
,
$45.5 million
of cash dividends on common stock and preferred stock and
$29.8 million
of other comprehensive loss on securities available-for-sale primarily due to increases in market interest rates, partially offset by net income of
$45.5 million
during the year ended
December 31, 2018
.
|
For the quarters ended
December 31, 2018
,
2017
and
2016
, net income from continuing operations was
$10.8 million
,
$10.9 million
and
$24.5 million
, respectively. Diluted earnings from continuing operations per total common share were
$0.12
,
$0.11
and
$0.36
, respectively, for the quarters ended
December 31, 2018
,
2017
and
2016
. The decrease in net income from continuing operations for the quarter ended
December 31, 2018
as compared to the year ended
December 31, 2017
was mainly due to decreases in net interest income, noninterest income and income tax benefit and an increase in provision for loan and lease losses, partially offset by a decrease in noninterest expense. The decrease in net income from continuing operations for the year ended
December 31, 2017
as compared to the year ended
December 31, 2016
was mainly due to a decrease in net interest income, an increase in provision for loan and lease losses and a decrease in noninterest income, partially offset by a decrease in noninterest expense.
51
Results of Operations
The following table presents condensed statements of operations for the periods indicated:
|
Year Ended December
31,
|
||||||||||||
|
($ in thousands, except per share data)
|
2018
|
2017
|
2016
|
|||||||||
|
Interest and dividend income
|
$
|
422,796
|
|
$
|
389,190
|
|
$
|
369,844
|
|
|||
|
Interest expense
|
136,720
|
|
85,000
|
|
59,499
|
|
||||||
|
Net interest income
|
286,076
|
|
304,190
|
|
310,345
|
|
||||||
|
Provision for loan and lease losses
|
30,215
|
|
13,699
|
|
5,271
|
|
||||||
|
Noninterest income
|
23,915
|
|
44,670
|
|
98,630
|
|
||||||
|
Noninterest expense
|
232,785
|
|
308,268
|
|
303,215
|
|
||||||
|
Income from continuing operations before income taxes
|
46,991
|
|
26,893
|
|
100,489
|
|
||||||
|
Income tax expense (benefit)
|
4,844
|
|
(26,581
|
)
|
13,749
|
|
||||||
|
Income from continuing operations
|
42,147
|
|
53,474
|
|
86,740
|
|
||||||
|
Income from discontinued operations before income taxes
|
4,596
|
|
7,164
|
|
48,917
|
|
||||||
|
Income tax expense
|
1,271
|
|
2,929
|
|
20,241
|
|
||||||
|
Income from discontinued operations
|
3,325
|
|
4,235
|
|
28,676
|
|
||||||
|
Net income
|
45,472
|
|
57,709
|
|
115,416
|
|
||||||
|
Preferred stock dividends
|
19,504
|
|
20,451
|
|
19,914
|
|
||||||
|
Impact of preferred stock redemption
|
2,307
|
|
—
|
|
—
|
|
||||||
|
Net income available to common stockholders
|
$
|
23,661
|
|
$
|
37,258
|
|
$
|
95,502
|
|
|||
|
Basic earnings per total common share
|
||||||||||||
|
Income from continuing operations
|
$
|
0.38
|
|
$
|
0.64
|
|
$
|
1.36
|
|
|||
|
Income from discontinued operations
|
0.07
|
|
0.08
|
|
0.61
|
|
||||||
|
Net income
|
$
|
0.45
|
|
$
|
0.72
|
|
$
|
1.97
|
|
|||
|
Diluted earnings per total common share
|
||||||||||||
|
Income from continuing operations
|
$
|
0.38
|
|
$
|
0.63
|
|
$
|
1.34
|
|
|||
|
Income from discontinued operations
|
0.07
|
|
0.08
|
|
0.60
|
|
||||||
|
Net income
|
$
|
0.45
|
|
$
|
0.71
|
|
$
|
1.94
|
|
|||
The following table presents condensed statements of operations of continuing and discontinued operations for the years ended December 31, 2018 and 2017:
|
Year Ended December 31, 2018
|
Year Ended December 31, 2017
|
|||||||||||||||||||||||
|
($ in thousands)
|
Continuing Operations
|
Discontinued Operations
|
Total
|
Continuing Operations
|
Discontinued Operations
|
Total
|
||||||||||||||||||
|
Interest and dividend income
|
$
|
422,796
|
|
$
|
665
|
|
$
|
423,461
|
|
$
|
389,190
|
|
$
|
7,052
|
|
$
|
396,242
|
|
||||||
|
Interest expense
|
136,720
|
|
—
|
|
136,720
|
|
85,000
|
|
—
|
|
85,000
|
|
||||||||||||
|
Net interest income
|
286,076
|
|
665
|
|
286,741
|
|
304,190
|
|
7,052
|
|
311,242
|
|
||||||||||||
|
Provision for loan and lease losses
|
30,215
|
|
—
|
|
30,215
|
|
13,699
|
|
—
|
|
13,699
|
|
||||||||||||
|
Noninterest income
|
23,915
|
|
4,067
|
|
27,982
|
|
44,670
|
|
60,107
|
|
104,777
|
|
||||||||||||
|
Noninterest expense
|
232,785
|
|
136
|
|
232,921
|
|
308,268
|
|
59,995
|
|
368,263
|
|
||||||||||||
|
Income before income taxes
|
46,991
|
|
4,596
|
|
51,587
|
|
26,893
|
|
7,164
|
|
34,057
|
|
||||||||||||
|
Income tax expense (benefit)
|
4,844
|
|
1,271
|
|
6,115
|
|
(26,581
|
)
|
2,929
|
|
(23,652
|
)
|
||||||||||||
|
Net income
|
$
|
42,147
|
|
$
|
3,325
|
|
$
|
45,472
|
|
$
|
53,474
|
|
$
|
4,235
|
|
$
|
57,709
|
|
||||||
52
Net Interest Income
The following table presents interest income, average interest-earning assets, interest expense, average interest-bearing liabilities, and their correspondent yields and costs expressed both in dollars and rates for the years indicated:
|
Year Ended December
31,
|
|||||||||||||||||||||||||||||||||
|
2018
|
2017
|
2016
|
|||||||||||||||||||||||||||||||
|
($ in thousands)
|
Average Balance
|
Interest
|
Yield/Cost
|
Average Balance
|
Interest
|
Yield/Cost
|
Average Balance
|
Interest
|
Yield/Cost
|
||||||||||||||||||||||||
|
Interest-earning assets:
|
|||||||||||||||||||||||||||||||||
|
Total loans and leases
(1)
|
$
|
7,108,600
|
|
$
|
329,937
|
|
4.64
|
%
|
$
|
6,531,069
|
|
$
|
288,123
|
|
4.41
|
%
|
$
|
6,780,826
|
|
$
|
296,996
|
|
4.38
|
%
|
|||||||||
|
Securities
|
2,248,488
|
|
83,567
|
|
3.72
|
%
|
2,954,235
|
|
99,742
|
|
3.38
|
%
|
2,711,112
|
|
79,527
|
|
2.93
|
%
|
|||||||||||||||
|
Other interest-earning assets
(2)
|
362,927
|
|
9,957
|
|
2.74
|
%
|
516,832
|
|
8,377
|
|
1.62
|
%
|
380,832
|
|
8,449
|
|
2.22
|
%
|
|||||||||||||||
|
Total interest-earning assets
|
9,720,015
|
|
423,461
|
|
4.36
|
%
|
10,002,136
|
|
396,242
|
|
3.96
|
%
|
9,872,770
|
|
384,972
|
|
3.90
|
%
|
|||||||||||||||
|
Allowance for loan and lease losses
|
(54,777
|
)
|
(43,150
|
)
|
(37,664
|
)
|
|||||||||||||||||||||||||||
|
BOLI and noninterest-earning assets
(3)
|
559,675
|
|
575,363
|
|
500,599
|
|
|||||||||||||||||||||||||||
|
Total assets
|
$
|
10,224,913
|
|
$
|
10,534,349
|
|
$
|
10,335,705
|
|
||||||||||||||||||||||||
|
Interest-bearing liabilities:
|
|||||||||||||||||||||||||||||||||
|
Savings
|
$
|
1,156,292
|
|
17,971
|
|
1.55
|
%
|
$
|
1,007,990
|
|
9,764
|
|
0.97
|
%
|
$
|
882,774
|
|
6,795
|
|
0.77
|
%
|
||||||||||||
|
Interest-bearing checking
|
1,812,980
|
|
18,261
|
|
1.01
|
%
|
2,035,954
|
|
15,161
|
|
0.74
|
%
|
2,066,623
|
|
13,723
|
|
0.66
|
%
|
|||||||||||||||
|
Money market
|
994,103
|
|
13,146
|
|
1.32
|
%
|
2,076,847
|
|
18,530
|
|
0.89
|
%
|
2,094,839
|
|
10,776
|
|
0.51
|
%
|
|||||||||||||||
|
Certificates of deposit
|
2,272,093
|
|
41,858
|
|
1.84
|
%
|
1,730,652
|
|
16,959
|
|
0.98
|
%
|
1,465,679
|
|
8,926
|
|
0.61
|
%
|
|||||||||||||||
|
Total interest-bearing deposits
|
6,235,468
|
|
91,236
|
|
1.46
|
%
|
6,851,443
|
|
60,414
|
|
0.88
|
%
|
6,509,915
|
|
40,220
|
|
0.62
|
%
|
|||||||||||||||
|
FHLB advances
|
1,627,608
|
|
34,995
|
|
2.15
|
%
|
1,054,978
|
|
12,951
|
|
1.23
|
%
|
1,153,208
|
|
5,717
|
|
0.50
|
%
|
|||||||||||||||
|
Securities sold under repurchase agreements
|
39,336
|
|
1,033
|
|
2.63
|
%
|
39,907
|
|
880
|
|
2.21
|
%
|
92,937
|
|
818
|
|
0.88
|
%
|
|||||||||||||||
|
Long-term debt and other interest-bearing liabilities
|
174,340
|
|
9,456
|
|
5.42
|
%
|
207,734
|
|
10,755
|
|
5.18
|
%
|
218,737
|
|
12,744
|
|
5.83
|
%
|
|||||||||||||||
|
Total interest-bearing liabilities
|
8,076,752
|
|
136,720
|
|
1.69
|
%
|
8,154,062
|
|
85,000
|
|
1.04
|
%
|
7,974,797
|
|
59,499
|
|
0.75
|
%
|
|||||||||||||||
|
Noninterest-bearing deposits
|
1,034,937
|
|
1,182,667
|
|
1,225,656
|
|
|||||||||||||||||||||||||||
|
Noninterest-bearing liabilities
|
117,904
|
|
188,625
|
|
228,421
|
|
|||||||||||||||||||||||||||
|
Total liabilities
|
9,229,593
|
|
9,525,354
|
|
9,428,874
|
|
|||||||||||||||||||||||||||
|
Total stockholders’ equity
|
995,320
|
|
1,008,995
|
|
906,831
|
|
|||||||||||||||||||||||||||
|
Total liabilities and stockholders’ equity
|
$
|
10,224,913
|
|
$
|
10,534,349
|
|
$
|
10,335,705
|
|
||||||||||||||||||||||||
|
Net interest income/spread
|
$
|
286,741
|
|
2.67
|
%
|
$
|
311,242
|
|
2.92
|
%
|
$
|
325,473
|
|
3.15
|
%
|
||||||||||||||||||
|
Net interest margin
(4)
|
2.95
|
%
|
3.11
|
%
|
3.30
|
%
|
|||||||||||||||||||||||||||
|
(1)
|
Total loans and leases includes income from discontinued operations. Total loans and leases are net of deferred fees, related direct costs and discounts, but exclude the allowance for loan and lease losses. Non-accrual loans and leases are included in the average balance. Net accretion of deferred loan fees and costs of
$612 thousand
,
$1.3 million
and
$1 thousand
and accretion of discount on purchased loans of
$637 thousand
,
$4.8 million
and
$36.8 million
for the years ended
December 31, 2018
,
2017
and
2016
, respectively, are included in the interest income.
|
|
(2)
|
Includes average balance of FHLB and Federal Reserve Bank stock at cost and average time deposits with other financial institutions.
|
|
(3)
|
Includes average balance of BOLI of
$105.8 million
,
$103.6 million
and
$101.2 million
for the years ended
December 31, 2018
,
2017
and
2016
, respectively.
|
|
(4)
|
Net interest income divided by average interest-earning assets.
|
53
Rate/Volume Analysis
The following table presents the changes in interest income and interest expense for major components of interest-earning assets and interest-bearing liabilities. Information is provided on changes attributable to (i) changes in volume multiplied by the prior rate and (ii) changes in rate multiplied by the prior volume. Changes attributable to both rate and volume which cannot be segregated have been allocated proportionately to the change due to volume and the change due to rate.
|
Year Ended December
31, 2018 vs. 2017
|
Year Ended December
31, 2017 vs. 2016
|
|||||||||||||||||||||||
|
Increase (Decrease) Due to
|
Net Increase (Decrease)
|
Increase (Decrease) Due to
|
Net Increase (Decrease)
|
|||||||||||||||||||||
|
($ in thousands)
|
Volume
|
Rate
|
Volume
|
Rate
|
||||||||||||||||||||
|
Interest-earning assets:
|
||||||||||||||||||||||||
|
Total loans and leases
(1)
|
$
|
26,302
|
|
$
|
15,512
|
|
$
|
41,814
|
|
$
|
(10,912
|
)
|
$
|
2,039
|
|
$
|
(8,873
|
)
|
||||||
|
Securities
|
(25,518
|
)
|
9,343
|
|
(16,175
|
)
|
7,452
|
|
12,763
|
|
20,215
|
|
||||||||||||
|
Other interest-earning assets
|
(3,010
|
)
|
4,590
|
|
1,580
|
|
2,560
|
|
(2,632
|
)
|
(72
|
)
|
||||||||||||
|
Total interest-earning assets
|
(2,226
|
)
|
29,445
|
|
27,219
|
|
(900
|
)
|
12,170
|
|
11,270
|
|
||||||||||||
|
Interest-bearing liabilities:
|
||||||||||||||||||||||||
|
Savings
|
1,621
|
|
6,586
|
|
8,207
|
|
1,048
|
|
1,921
|
|
2,969
|
|
||||||||||||
|
Interest-bearing checking
|
(1,822
|
)
|
4,922
|
|
3,100
|
|
(203
|
)
|
1,641
|
|
1,438
|
|
||||||||||||
|
Money market
|
(12,064
|
)
|
6,680
|
|
(5,384
|
)
|
(93
|
)
|
7,847
|
|
7,754
|
|
||||||||||||
|
Certificates of deposit
|
6,544
|
|
18,355
|
|
24,899
|
|
1,844
|
|
6,189
|
|
8,033
|
|
||||||||||||
|
FHLB advances
|
9,270
|
|
12,774
|
|
22,044
|
|
(529
|
)
|
7,763
|
|
7,234
|
|
||||||||||||
|
Securities sold under repurchase agreements
|
(13
|
)
|
166
|
|
153
|
|
(661
|
)
|
723
|
|
62
|
|
||||||||||||
|
Long-term debt and other interest-bearing liabilities
|
(1,783
|
)
|
484
|
|
(1,299
|
)
|
(618
|
)
|
(1,371
|
)
|
(1,989
|
)
|
||||||||||||
|
Total interest-bearing liabilities
|
1,753
|
|
49,967
|
|
51,720
|
|
788
|
|
24,713
|
|
25,501
|
|
||||||||||||
|
Net interest income
|
$
|
(3,979
|
)
|
$
|
(20,522
|
)
|
$
|
(24,501
|
)
|
$
|
(1,688
|
)
|
$
|
(12,543
|
)
|
$
|
(14,231
|
)
|
||||||
|
(1)
|
Total loans and leases includes income from discontinued operations.
|
Year Ended
December 31, 2018
Compared to Year Ended
December 31, 2017
Net interest income was
$286.7 million
for the year ended
December 31, 2018
,
a decrease
of
$24.5 million
, or
7.9 percent
, from
$311.2 million
for the year ended
December 31, 2017
. The decrease in net interest income from the prior year was due to higher average cost of interest-bearing liabilities and lower average balances of securities, partially offset by higher average yields from interest-earning assets and higher average balances of total loans and lower average balances of long term debt and other interest-bearing liabilities.
Interest income on total loans and leases was
$329.9 million
for the year ended
December 31, 2018
,
an increase
of
$41.8 million
, or
14.5 percent
, from
$288.1 million
for the year ended
December 31, 2017
. The increase in interest income on total loans and leases was due to a
$577.5 million
increase in average total loans and leases and a
23
bps increase in average yield. The increase in average balance was due mainly to increased loan originations, partially offset by the sales of the Banc Home Loans division during the three months ended March 31, 2017 and seasoned SFR mortgage loan pools during the year ended
December 31, 2017
. The increase in average yield was mainly due to higher interest rates on new loans and loans with variable interest rates from a rising interest rate environment, partially offset by a decrease of seasoned SFR mortgage loan pools, the discounts of which generated additional interest income of
$1.3 million
during the year ended December 31, 2017.
Interest income on securities was
$83.6 million
for the year ended
December 31, 2018
,
a decrease
of
$16.2 million
, or
16.2 percent
, from
$99.7 million
for the year ended
December 31, 2017
. The decrease in interest income on securities was due to a
$705.7 million
decrease in average balance, partially offset by a
34
bps increase in average yield. The decrease in average balance was mainly due to sales of certain longer-duration and fixed-rate mortgage-backed securities and corporate debt securities to navigate a volatile rate environment during 2017 and 2018 and reposition our earning assets from investment securities to loans. The increase in average yield was due to higher interest rates on newly purchased investment securities and
investment securities with variable interest rates from a rising interest rate environment.
54
Dividends and interest income on other interest-earning assets was
$10.0 million
for the year ended
December 31, 2018
,
an increase
of
$1.6 million
, or
18.9 percent
, from
$8.4 million
for the year ended
December 31, 2017
. The increase in dividends and interest income on other interest-earning assets was due to a
112
bps increase in average yield, partially offset by a
$153.9 million
decrease in average balance. The increase in average yield was mainly due to higher interest rates on interest-earning deposits in financial institutions from a rising interest rate environment. The decrease in average balance was mainly due to a reduced cash balance from decreases in deposits, the sale of BHL and decline in the related BHL portfolio, partially offset by an increase in FHLB stock purchases.
Interest expense on interest-bearing deposits was
$91.2 million
for the year ended
December 31, 2018
,
an increase
of
$30.8 million
, or
51.0 percent
, from
$60.4 million
for the year ended
December 31, 2017
. The increase in interest expense on interest-bearing deposits was due to a
58
bps increase in average cost, partially offset by a
$616.0 million
decrease in average balance during the year ended December 31, 2018. The increase in average cost was mainly due to a rising interest rate environment. The decrease in average balance was mainly due to a decline in money market and interest-bearing checking accounts, partially offset by an increase in certificates of deposit and savings accounts during the year ended
December 31, 2018
.
Interest expense on FHLB advances was
$35.0 million
for the year ended
December 31, 2018
,
an increase
of
$22.0 million
, or
170.2 percent
, from
$13.0 million
for the year ended
December 31, 2017
. The increase in interest expense on FHLB advances was due to a
92
bps increase in average cost and a
$572.6 million
increase in average balance. The increase in average cost was mainly due to a rising interest rate environment. The increase in average balance was mainly due to additional term advances, with primarily three- to ten-year durations, which were obtained as a result of asset and liability management activities to fund growth of the loan portfolio.
Interest expense on securities sold under repurchase agreements was
$1.0 million
for the year ended
December 31, 2018
,
an increase
of
$153 thousand
, or
17.4 percent
, from
$880 thousand
for the year ended
December 31, 2017
. The increase was mainly due to a
42
bps increase in average cost.
Interest expense on long-term debt and other interest-bearing liabilities was
$9.5 million
for the year ended
December 31, 2018
,
a decrease
of
$1.3 million
, or
12.1 percent
, from
$10.8 million
for the year ended
December 31, 2017
. The decrease was mainly due to the voluntary termination of a $75.0 million line of credit during the three months ended June 30, 2017 with an unaffiliated financial institution.
Year Ended
December 31, 2017
Compared to Year Ended
December 31, 2016
Net interest income was
$311.2 million
for the year ended
December 31, 2017
,
a decrease
of
$14.2 million
, or
4.4 percent
, from
$325.5 million
for the year ended
December 31, 2016
. The decrease in net interest income was due to an increase in interest expense, primarily due to an increase in the average rates paid, on interest-bearing liabilities and a decrease in interest income earned on total loans and leases, primarily due to a decrease in the average balance of loans and leases, partially offset by higher interest income from securities.
Interest income on total loans and leases was
$288.1 million
for the year ended
December 31, 2017
,
a decrease
of
$8.9 million
, or
3.0 percent
, from
$297.0 million
for the year ended
December 31, 2016
. The decrease in interest income on total loans and leases was due to a
$249.8 million
decrease in average total loans and leases, partially offset by a
3
bps increase in average yield. Ending balance of total loans and leases increased during the year ended
December 31, 2017
; however, the average balance decreased as the ending balance increased, which was mainly driven by a larger increase during the three months ended
December 31, 2017
. During the nine months ended September 30, 2017, total loans and leases decreased by
$403.4 million
to
$6.34 billion
due mainly to the sale of the Banc Home Loans division during the three months ended March 31, 2017 and the sale of seasoned SFR mortgage loan pools during the three months ended September 30, 2017. During the three months ended
December 31, 2017
, total loans and leases increased by
$429.2 million
to
$6.77 billion
due mainly to higher loan production in commercial loans. Year-over-year, total loans and leases increased by
$25.8 million
, or
0.4 percent
, to
$6.77 billion
at December 31, 2017 from
$6.74 billion
at
December 31, 2016
. The increase in average yield was mainly due to higher interest rates on new loans and loans with variable interest rates from a rising interest rate environment, partially offset by a decrease in seasoned SFR mortgage loan pools where discounts on these pools generated additional interest income. Such discount accretion totaled
$4.8 million
and
$36.8 million
for the years ended
December 31, 2017
and
2016
, respectively.
55
Interest income on securities was
$99.7 million
for the year ended
December 31, 2017
,
an increase
of
$20.2 million
, or
25.4 percent
, from
$79.5 million
for the year ended
December 31, 2016
. The increase in interest income on securities was due to a
$243.1 million
increase in average balance and a
45
bps increase in average yield. Ending balance of total investment securities
decreased during the year ended
December 31, 2017
; however, the average balance increased as the increase in prior year's
ending balance was proportionally larger than the decrease in 2017. During the year ended
December 31, 2017
, the Company
decreased investment securities to navigate a volatile rate environment by reducing the overall duration of the portfolio by
selling certain longer-duration and fixed rate mortgage-backed securities and corporate debt securities. Total investment
securities decreased by
$690.3 million
to
$2.58 billion
, or
21.1 percent
, during the year ended
December 31, 2017
, while it
increased by
$1.47 billion
, or
81.9 percent
, to
$3.27 billion
during the year ended
December 31, 2016
. The increase in average
yield was mainly due to higher yields on newly purchased investment securities and to an increase in yields on certain floating
rate investment securities during the year ended
December 31, 2017
as overall market rates increased.
Dividends and interest income on other interest-earning assets was
$8.4 million
for the year ended
December 31, 2017
,
a decrease
of
$72 thousand
, or
0.9 percent
, from
$8.4 million
for the year ended
December 31, 2016
. The decrease in dividends and interest income on other interest-earning assets was due to a
60
bps decrease in average yield, partially offset by a
$136.0 million
increase in average balance. The decrease in average yield was mainly due to a
$3.4 million
decrease in dividend
income on FHLB and other bank stocks, and partially offset by an increase in yield on interest-earning cash during the year
ended
December 31, 2017
as the federal fund rates increased. Ending balance of other interest-earning assets decreased during
the year ended
December 31, 2017
; however, the average balance increased as the increase in prior year's ending balance was
proportionally larger than the decrease in 2017. Total interest-earning cash decreased
$55.2 million
, or
13.0 percent
, to
$367.6 million
during the year ended
December 31, 2017
, while it increased by
$281.7 million
to
$422.7 million
, or
199.7 percent
,
during the year ended
December 31, 2016
.
Interest expense on interest-bearing deposits was
$60.4 million
for the year ended
December 31, 2017
,
an increase
of
$20.2 million
, or
50.2 percent
, from
$40.2 million
for the year ended
December 31, 2016
. The increase in interest expense on interest-bearing deposits was due to a
$341.5 million
increase in average balance and a
26
bps increase in average cost. Ending balance
of total interest-bearing deposits decreased during the year ended
December 31, 2017
; however, the average balance increased
as the increase in prior year's ending balance was proportionally larger than the decrease in 2017. Total interest-bearing deposits
decreased by
$1.64 billion
, or
20.8 percent
, to
$6.22 billion
during the year ended
December 31, 2017
, while it increased by
$2.68 billion
, or
51.7 percent
, to
$7.86 billion
during the year ended
December 31, 2016
. The increase in average cost was
mainly due to the overall higher interest rates on new deposit accounts and variable rate accounts as overall market rates
increased.
Interest expense on FHLB advances was
$13.0 million
for the year ended
December 31, 2017
,
an increase
of
$7.2 million
, or
126.5 percent
, from
$5.7 million
for the year ended
December 31, 2016
. The increase in interest expense on FHLB advances was due to a
73
bps increase in average cost, partially offset by a
$98.2 million
decrease in average balance. The increase in
average cost was due mainly to the rising interest rate environment. The decrease in average balance was due mainly to an
increase in average balance of deposits.
Interest expense on long-term debt and other interest-bearing liabilities was
$10.8 million
for the year ended
December 31, 2017
,
a decrease
of
$2.0 million
, or
15.6 percent
, from
$12.7 million
for the year ended
December 31, 2016
. The decrease was
mainly due to the maturity of the Company's
5.25 percent
junior subordinated amortizing notes due May 15, 2017 during the
year ended
December 31, 2017
and the redemption of the Company's
7.5 percent
senior notes due April 15, 2020 during the
year ended
December 31, 2016
.
Provision for Loan and Lease Losses
Provisions for loan and lease losses are charged to operations at a level required to reflect incurred credit losses in the loan and lease portfolio. The Company recorded
$30.2 million
,
$13.7 million
and
$5.3 million
, respectively, for the years ended
December 31, 2018
,
2017
and
2016
to its provision for loan and lease losses.
The increase in provision for loan and lease losses for the year ended
December 31, 2018
as compared to the year ended
December 31, 2017
was mainly due to a
$12.5 million
increase in net charge offs during the year,
15.6 percent
incremental growth in the loan and lease portfolio from the prior year, an increase in classified loans of
97.8 percent
and methodology enhancements implemented throughout the year ended December 31, 2018, such as extension of look-back period, enhancements of qualitative adjustments and loan segmentation, and annual update of the loss emergence period. During the three months ended March 31, 2018, the Company recorded a charge-off of
$13.9 million
, which reflected the outstanding balance under a
$15.0 million
line of credit that was originated during the three months ended March 31, 2018. Subsequent to the granting of the line of credit, representations from the borrower in applying for the line of credit were determined by the Bank to be false, and third party bank account statements provided by the borrower to secure the line of credit were found to be fraudulent. The line of credit was granted after the borrower appeared to have satisfied a pre-condition that the line of credit be fully cash collateralized and secured by a bank account at a third party financial institution pledged to the Bank. As part of the Bank’s
56
credit review and portfolio management process, the line of credit and disbursements were reviewed subsequent to closing and compliance with the borrower’s covenants was monitored. As part of this process, on March 9, 2018, the Bank received information that caused it to believe the existence of the pledged bank account had been misrepresented by the borrower and that the account had previously been closed. The Bank filed an action in federal court pursuing the borrower and other parties and is also considering other available sources of collection and other potential means of mitigating the loss; however, no assurance can be given that it will be successful in this regard. Upon extensive review of the underwriting process for this loan, the Bank determined that this loan was the result of an isolated event of external fraud.
The increase in provision for loan and lease losses for the year ended December 31, 2017 as compared to the year ended December 31, 2016 was mainly driven by a
$4.5 million
increase in net charge offs during the year, as well as
10 percent
incremental growth in the loan and lease portfolio from the prior year.
See further discussion in "Allowance for Loan and Lease Losses."
57
Noninterest Income
The following table presents the breakdown of noninterest income for the periods indicated:
|
Year Ended December
31,
|
||||||||||||
|
($ in thousands)
|
2018
|
2017
|
2016
|
|||||||||
|
Customer service fees
|
$
|
6,315
|
|
$
|
6,492
|
|
$
|
5,147
|
|
|||
|
Loan servicing income
|
3,720
|
|
1,025
|
|
633
|
|
||||||
|
Income from bank owned life insurance
|
2,176
|
|
2,339
|
|
2,341
|
|
||||||
|
Impairment loss on investment securities
|
(3,252
|
)
|
—
|
|
—
|
|
||||||
|
Net gain on sale of securities available-for-sale
|
5,532
|
|
14,768
|
|
29,405
|
|
||||||
|
Net gain on sale of loans
|
1,932
|
|
11,942
|
|
35,895
|
|
||||||
|
Net loss on sale of mortgage servicing rights
|
(2,260
|
)
|
—
|
|
—
|
|
||||||
|
Gain on sale of subsidiary
|
—
|
|
—
|
|
3,694
|
|
||||||
|
Gain on sale of business unit
|
—
|
|
—
|
|
2,629
|
|
||||||
|
Other income
|
9,752
|
|
8,104
|
|
18,886
|
|
||||||
|
Total noninterest income
|
$
|
23,915
|
|
$
|
44,670
|
|
$
|
98,630
|
|
|||
Year Ended
December 31, 2018
Compared to Year Ended
December 31, 2017
Noninterest income was
$23.9 million
for the year ended
December 31, 2018
,
a decrease
of
$20.8 million
, or
46.5 percent
, from
$44.7 million
for the year ended
December 31, 2017
. The decrease was mainly due to decreases in net gains on sales of securities available-for-sale and loans, impairment loss on investment securities coupled with net loss on sale of mortgage servicing rights, partially offset by an increase in loan servicing income during the year ended
December 31, 2018
.
Customer service fees were
$6.3 million
for the year ended
December 31, 2018
,
a decrease
of
$177 thousand
, or
2.7 percent
, from
$6.5 million
for the year ended
December 31, 2017
. The decrease was mainly due to the decrease in average balance of noninterest-bearing checking accounts.
Loan servicing income was
$3.7 million
for the year ended
December 31, 2018
,
an increase
of
$2.7 million
, or
262.9 percent
, from
$1.0 million
for the year ended
December 31, 2017
. Including loan servicing income from discontinued operations, total loan servicing income was
$3.7 million
and
$2.6 million
, respectively, for the years ended
December 31, 2018
and
2017
. The increase was mainly due to lower losses on fair value of mortgage servicing rights during the year ended
December 31, 2018
, partially offset by sales of MSRs during the first half of 2018. Losses on the fair value and runoff of servicing assets of
$1.3 million
and
$17.1 million
for the years ended
December 31, 2018
and
2017
, respectively, were due to generally lower interest rates. Servicing fees were
$5.0 million
and
$19.6 million
for the years ended
December 31, 2018
and
2017
, respectively, and unpaid principal balances of loans sold with servicing retained were
$204.0 million
and
$3.94 billion
at
December 31, 2018
and
2017
, respectively.
As of
December 31, 2018
, the Company changed its intent to sell its non-agency commercial mortgage-backed securities in an unrealized loss position due to its strategy to reposition its securities profile and recognized
$3.3 million
of OTTI losses for the year ended
December 31, 2018
. The Company did not record OTTI losses for investment securities for the years ended December 31, 2017 and 2016.
Net gain on the sale of securities available-for-sale was
$5.5 million
for the year ended
December 31, 2018
,
a decrease
of
$9.2 million
, or
62.5 percent
, from
$14.8 million
for the year ended
December 31, 2017
. The Company sold investment securities of
$406.8 million
and
$972.2 million
during the years ended
December 31, 2018
and
2017
, respectively. The Company further repositioned its securities available-for-sale portfolio to reduce duration by selling longer-duration and fixed rate mortgage-backed securities and corporate debt securities during the year ended
December 31, 2018
and
2017
.
Net gain on the sale of loans was
$1.9 million
for the year ended
December 31, 2018
,
a decrease
of
$10.0 million
, or
83.8 percent
, from
$11.9 million
for the year ended
December 31, 2017
. During the year ended
December 31, 2018
, the Company sold SFR mortgage loans of
$293.6 million
with a gain of
$1.2 million
, SBA loans of
$6.3 million
with a gain of
$480 thousand
and multifamily and other consumer loans of
$86.6 million
with a gain of
$207 thousand
. During the year ended
December 31, 2017
, the Company sold SFR mortgage loans of
$675.7 million
with a gain of
$2.7 million
, seasoned SFR mortgage loan pools of
$144.2 million
with a gain of
$5.1 million
, SBA loans of
$39.2 million
with a gain of
$3.6 million
, and multifamily and other consumer loans of
$14.6 million
with a gain of
$413 thousand
.
Other income was
$9.8 million
for the year ended
December 31, 2018
,
an increase
of
$1.6 million
, or
20.3 percent
, from
$8.1 million
for the year ended
December 31, 2017
. The increase was mainly due to proceeds of a legal settlement of
$2.1 million
received during the year ended
December 31, 2018
, partially offset by a decrease in loan brokerage income of
$1.2 million
as the Company did not have any brokered loan activity during the year ended
December 31, 2018
.
58
Year Ended
December 31, 2017
Compared to Year Ended
December 31, 2016
Noninterest income was
$44.7 million
for the year ended
December 31, 2017
,
a decrease
of
$54.0 million
, or
54.7 percent
, from
$98.6 million
for the year ended
December 31, 2016
. The decrease was mainly due to decreases in net gains on sales of securities available-for-sale and loans, advisory fees, loan brokerage income, and other income, as well as gains on sales of subsidiary and business units during the year ended
December 31, 2016
, partially offset by increases in customer service fees and loan servicing income.
Customer service fees were
$6.5 million
for the year ended
December 31, 2017
,
an increase
of
$1.3 million
, or
26.1 percent
, from
$5.1 million
for the year ended
December 31, 2016
. The increase was due mainly to the higher average number of customer deposit accounts.
Loan servicing income was
$1.0 million
for the year ended
December 31, 2017
,
an increase
of
$392 thousand
, or
61.9 percent
, from
$633 thousand
for the year ended
December 31, 2016
. Including loan servicing income from discontinued operations, total loan servicing income was $2.6 million and $5.4 million, respectively, for the years ended
December 31, 2017
and
2016
. The decrease was mainly due to a decrease in servicing fees from the decreased volume of loans sold with servicing retained, partially offset by a decrease in losses on the fair value of mortgage servicing rights. Losses on the fair value and runoff of servicing assets of $17.1 million and $17.7 million for the years ended
December 31, 2017
and
2016
, respectively, were due to generally lower interest rates. Servicing fees were $19.6 million and $23.1 million for the years ended
December 31, 2017
and
2016
, respectively, and unpaid principal balances of loans sold with servicing retained were $3.94 billion and $7.58 billion at
December 31, 2017
and
2016
, respectively.
Net gain on sales of securities available-for-sale was
$14.8 million
for the year ended
December 31, 2017
,
a decrease
of
$14.6 million
, or
49.8 percent
, from
$29.4 million
for the year ended
December 31, 2016
. During the year ended December 31, 2017, the Company further repositioned its securities available-for-sale portfolio to reduce duration by selling corporate debt securities. The Company sold investment securities of $972.2 million and $4.07 billion during the years ended
December 31, 2017
and
2016
, respectively.
Net gain on the sale of loans was
$11.9 million
for the year ended
December 31, 2017
,
a decrease
of
$24.0 million
, or
66.7 percent
, from
$35.9 million
for the year ended
December 31, 2016
. During the year ended
December 31, 2017
, the Company sold SFR mortgage loans of $675.7 million with a gain of $2.7 million, seasoned SFR mortgage loan pools of $144.2 million with a gain of $5.1 million, SBA loans of $39.2 million with a gain of $3.6 million, and other commercial loans of $14.6 million with a gain of $413 thousand. During the year ended
December 31, 2016
, the Company sold SFR mortgage loans of $585.9 million with a gain of $5.8 million, seasoned SFR mortgage loan pools of $707.4 million with a gain of $24.7 million, SBA loans of $42.1 million with a gain of $3.4 million, and other commercial loans of $115.4 million with a gain of $1.9 million.
The Company did not recognize any advisory service fees in 2017 due to the sale of The Palisades Group on May 5, 2016. The Company had $1.5 million of advisory fees in 2016. The Company does not expect to have advisory service fee income in future periods.
Gain on sale of subsidiary of
$3.7 million
was recognized for the year ended
December 31, 2016
, with no similar activity in 2017. The Company sold all of its membership interests in The Palisades Group, which represented the Company's Financial Advisory Segment.
Gain on sale of business unit of
$2.6 million
was recognized for the year ended
December 31, 2016
, with no similar activity in 2017. The Company sold the Company's Commercial Banking segment's Commercial Equipment Finance business unit to Hanmi. As part of the transaction, the Company sold $242.0 million of equipment leases to Hanmi.
Other income was
$8.1 million
for the year ended
December 31, 2017
,
a decrease
of
$10.8 million
, or
57.1 percent
, from
$18.9 million
for the year ended
December 31, 2016
. The decrease was mainly due to the gain recognized on the payment of the note issued to the Company by The Palisades Group as a part of the sale transaction, legal settlements and rental income from a newly purchased building during the year ended
December 31, 2016
, with no similar activity in 2017 and a decrease in the volume of brokered loans as the Company did not have any brokered loans activity during the year ended
December 31, 2017
.
59
Noninterest Expense
The following table presents the breakdown of noninterest expense for the periods indicated:
|
Year Ended December
31,
|
||||||||||||
|
($ in thousands)
|
2018
|
2017
|
2016
|
|||||||||
|
Salaries and employee benefits
|
$
|
109,974
|
|
$
|
129,153
|
|
$
|
146,147
|
|
|||
|
Occupancy and equipment
|
31,847
|
|
38,391
|
|
34,797
|
|
||||||
|
Professional fees
|
33,652
|
|
42,417
|
|
30,373
|
|
||||||
|
Outside service fees
|
4,667
|
|
5,840
|
|
6,989
|
|
||||||
|
Data processing
|
6,951
|
|
7,888
|
|
8,311
|
|
||||||
|
Advertising
|
12,664
|
|
5,313
|
|
6,894
|
|
||||||
|
Regulatory assessments
|
7,678
|
|
8,105
|
|
8,186
|
|
||||||
|
Reversal of provision for loan repurchases
|
(2,488
|
)
|
(1,812
|
)
|
(3,352
|
)
|
||||||
|
Amortization of intangible assets
|
3,007
|
|
3,928
|
|
4,851
|
|
||||||
|
Impairment on intangible assets
|
—
|
|
336
|
|
690
|
|
||||||
|
Restructuring expense
|
4,431
|
|
5,326
|
|
—
|
|
||||||
|
All other expense
|
15,358
|
|
32,597
|
|
27,819
|
|
||||||
|
Noninterest expense before loss on investments in alternative energy partnerships, net
|
227,741
|
|
277,482
|
|
271,705
|
|
||||||
|
Loss on investments in alternative energy partnerships, net
|
5,044
|
|
30,786
|
|
31,510
|
|
||||||
|
Total noninterest expense
|
$
|
232,785
|
|
$
|
308,268
|
|
$
|
303,215
|
|
|||
Year Ended
December 31, 2018
Compared to Year Ended
December 31, 2017
Noninterest expense was
$232.8 million
for the year ended
December 31, 2018
,
a decrease
of
$75.5 million
, or
24.5 percent
, from
$308.3 million
for the year ended
December 31, 2017
. The decrease was mainly due to overall expense reductions from the Company's effort to manage its expenses and a decrease in loss on investments in alternative energy partnerships, partially offset by an increase in advertising expense.
Salaries and employee benefits were
$110.0 million
for the year ended
December 31, 2018
,
a decrease
of
$19.2 million
, or
14.8 percent
, from
$129.2 million
for the year ended
December 31, 2017
. The decrease was mainly due to decreases in number of employees, commissions, and temporary staff expenses.
Occupancy and equipment expenses were
$31.8 million
for the year ended
December 31, 2018
,
a decrease
of
$6.5 million
, or
17.0 percent
, from
$38.4 million
for the year ended
December 31, 2017
. The decrease was mainly due to decreased rent and other equipment expenses from the sale of the Banc Home Loan division on March 30, 2017 and expiration of the lease contract of the previous headquarters building in Irvine in December 2017.
Professional fees were
$33.7 million
for the year ended
December 31, 2018
,
a decrease
of
$8.8 million
, or
20.7 percent
, from
$42.4 million
for the year ended
December 31, 2017
. The decrease was mainly due to insurance recoveries related to litigation and the SEC investigation of
$18.0 million
received during the year ended
December 31, 2018
and lower external audit fees.
Outside service fees were
$4.7 million
for the year ended
December 31, 2018
,
a decrease
of
$1.2 million
, or
20.1 percent
, from
$5.8 million
for the year ended
December 31, 2017
. The decrease was mainly due to a decrease in loan sub-servicing expenses resulting from sales of seasoned SFR mortgage loan pools, partially offset by an increase in recruiting expense.
Data processing expenses were
$7.0 million
for the year ended
December 31, 2018
,
a decrease
of
$937 thousand
, or
11.9 percent
, from
$7.9 million
for the year ended
December 31, 2017
. The decrease was mainly due to decreased transaction volume from lower average deposit balances during the year ended
December 31, 2018
.
Advertising costs were
$12.7 million
for the year ended
December 31, 2018
,
an increase
of
$7.4 million
, or
138.4 percent
, from
$5.3 million
for the year ended
December 31, 2017
. The increase was mainly due to
$6.7 million
of the Los Angeles Football Club (LAFC) naming rights commitment being expensed to marketing and advertising expenses during the year ended
December 31, 2018
and none being expensed during the year ended December 31, 2017.
Regulatory assessments were
$7.7 million
for the year ended
December 31, 2018
,
a decrease
of
$427 thousand
, or
5.3 percent
, from
$8.1 million
for the year ended
December 31, 2017
. The decrease was mainly due to lower FDIC assessment fees and OCC assessment fees during the year ended
December 31, 2018
.
60
Loss on investments in alternative energy partnerships was
$5.0 million
for the year ended
December 31, 2018
,
a decrease
of
$25.7 million
, or
83.6 percent
, from
$30.8 million
, for the year ended
December 31, 2017
. The decrease in loss was mainly due to lower HLBV loss resulting from less new equipment being placed into service.
Reversal of provision for loan repurchases was
$2.5 million
and
$1.8 million
for the years ended
December 31, 2018
and
2017
, respectively. Additionally, the Company recorded initial provisions for loan repurchases of
$126 thousand
and
$1.6 million
during the years ended
December 31, 2018
and
2017
, respectively, included in gain on sale of loans. As a result, total reversal of provision for loan repurchases was
$(2.4) million
and
$(190) thousand
for the years ended
December 31, 2018
and
2017
, respectively. The decrease was mainly due to the portfolio run-off and repurchase settlement activities.
Amortization of intangible assets was
$3.0 million
for the year ended
December 31, 2018
,
a decrease
of
$921 thousand
, or
23.4 percent
, from
$3.9 million
for the year ended
December 31, 2017
. The decrease was mainly due to scheduled amortization during the year ended December 31, 2018.
Restructuring expenses were
$4.4 million
during the year ended
December 31, 2018
,
a decrease
of
$895 thousand
, or
16.8 percent
, from
$5.3 million
for the year ended
December 31, 2017
. Restructuring expenses from severance related costs from a reduction in workforce during the year ended December 31, 2018 were lower than restructuring expenses from realigning back office staffing and amending certain system contracts precipitated from the sale of the Banc Home Loans division during the year ended December 31, 2017.
Other expenses were
$15.4 million
for the year ended
December 31, 2018
,
a decrease
of
$17.2 million
, or
52.9 percent
, from
$32.6 million
for the year ended
December 31, 2017
. The decrease was mainly due to the Company's effort to manage its expenses from supplies, business travel, and other administrative expenditures, coupled with a decrease in provision for unfunded loan commitments, and insurance recoveries from previous legal settlement expenses.
Year Ended
December 31, 2017
Compared to Year Ended
December 31, 2016
Noninterest expense was
$308.3 million
for the year ended
December 31, 2017
,
an increase
of
$5.1 million
, or
1.7 percent
, from
$303.2 million
for the year ended
December 31, 2016
. The increase was mainly due to increases in professional fees, occupancy and equipment, all other expenses, a decrease in reversal of provision for loan repurchases, and the recognition of restructuring expense during the year ended
December 31, 2017
, partially offset by decreases in salaries and employee benefits, outside service fees, and advertising expense.
Salaries and employee benefits were
$129.2 million
for the year ended
December 31, 2017
,
a decrease
of
$17.0 million
, or
11.6 percent
, from
$146.1 million
for the year ended
December 31, 2016
. The decrease was mainly due to decreases in salaries and overtime, bonus accruals including a reversal during 2017 of an excess bonus accrual in 2016, and stock compensation expense, partially offset by increases in temporary staff and vacation accrual, a decrease in direct loan origination cost, and certain severance payments during the year ended December 31, 2017. At December 31, 2016, the Company accrued a liability for estimated discretionary incentive compensation payments to certain employees. The amount paid was less than the accrued liability. Consequently, the Company reversed the excess accrual and recorded a credit to salaries and employee benefits on the consolidated statements of operations of
$7.8 million
during the three months ended March 31, 2017. The reversal, based on new information driven by changes to certain facts and circumstances, was determined to be a change in estimate.
Occupancy and equipment expenses were
$38.4 million
for the year ended
December 31, 2017
,
an increase
of
$3.6 million
, or
10.3 percent
, from
$34.8 million
for the year ended
December 31, 2016
. The increase was mainly due to increased building and maintenance costs.
Professional fees were
$42.4 million
for the year ended
December 31, 2017
,
an increase
of
$12.0 million
, or
39.7 percent
, from
$30.4 million
for the year ended
December 31, 2016
. The increase was mainly due to expenses related to the special committee investigation, pending SEC investigation, various other litigation and increased audit fees.
Outside service fees were
$5.8 million
for the year ended
December 31, 2017
,
a decrease
of
$1.1 million
, or
16.4 percent
, from
$7.0 million
for the year ended
December 31, 2016
. The decrease was mainly due to a decrease in loan sub-servicing expenses resulting from sales of seasoned SFR mortgage loan pools, partially offset by an increase in recruiting expense.
Data processing expenses were
$7.9 million
for the year ended
December 31, 2017
,
a decrease
of
$423 thousand
, or
5.1 percent
, from
$8.3 million
for the year ended
December 31, 2016
. The decrease was mainly due to a decreased volume of transactions from lower deposit balances.
Advertising costs were
$5.3 million
for the year ended
December 31, 2017
,
a decrease
of
$1.6 million
, or
22.9 percent
, from
$6.9 million
for the year ended
December 31, 2016
. The decrease was mainly due to a decrease in marketing and advertising expenses as part of the Company's effort to reduce overhead cost.
Regulatory assessments were
$8.1 million
for the year ended
December 31, 2017
,
a decrease
of
$81 thousand
, or
1.0 percent
, from
$8.2 million
for the year ended
December 31, 2016
. The Company's year-over-year balance sheet change was immaterial.
61
Loss on investments in alternative energy partnerships of
$30.8 million
and $31.5 million, was recognized during the years ended
December 31, 2017
and
2016
, respectively. The Company invests in certain alternative energy partnerships formed to provide sustainable energy projects that are designed to generate a return primarily through the realization of federal tax credits. The Company recognized federal tax credits of $38.2 million and $33.4 million, respectively, as well as income tax benefits relating to the recognition of its loss on investments in alternative energy partnerships during the year ended December 31, 2017 and 2016.
Reversal for loan repurchases was
$1.8 million
and
$3.4 million
for the years ended
December 31, 2017
and
2016
, respectively, which reflect subsequent changes in the reserve for loss on repurchased loans. The Company recorded initial provisions for loan repurchases of $1.6 million and $3.9 million related to new loan sales against income from discontinued operations during the years ended December 31, 2017 and 2016, respectively. Total provision (reversal) for loan repurchases provided to reserve for loss on repurchased loans was $(190) thousand and $590 thousand for the years ended
December 31, 2017
and 2016, respectively. The decrease in the initial provision was mainly due to a decrease in volume of loans sold and the decrease in provision for loan repurchases in noninterest expense was due to the lower reserve requirement compared to the preceding period.
Amortization of intangible assets was
$3.9 million
for the year ended
December 31, 2017
,
a decrease
of
$923 thousand
, or
19.0 percent
, from
$4.9 million
for the year ended
December 31, 2016
. The decrease was mainly due to impairment of the customer relationship intangible with no new intangible assets recognized during the year ended
December 31, 2017
.
Impairment of intangible assets of
$336 thousand
and
$690 thousand
was recognized for the years ended
December 31, 2017
and
2016
, respectively. During the year ended December 31, 2017, the Company also wrote off a customer relationship intangible of $246 thousand and a trade name intangible of $90 thousand related to RenovationReady. RenovationReady was acquired in 2014 and provided specialized loan services to financial institutions and mortgage bankers that originate agency eligible residential renovation and construction loan products. During the year ended
December 31, 2016
, the Company ceased to use the CS Financial trade name and wrote off the related trade name intangible of $690 thousand. CS Financial is a mortgage banking firm that the Bank acquired in 2013.
The Company recognized restructuring expenses of
$5.3 million
during the year ended
December 31, 2017
. In connection with the sale of the Banc Home Loans division and additional cost reduction initiatives, the Company restructured certain aspects of its infrastructure and back office operations by realigning back office staffing and amending certain system contracts in order to improve the Company's efficiency.
Other expenses were
$32.6 million
for the year ended
December 31, 2017
,
an increase
of
$4.8 million
, or
17.2 percent
, from
$27.8 million
for the year ended
December 31, 2016
. The increase was mainly due to a legal settlement accrual of $5.7 million and a loss from the equity method accounting on CRA investments of $3.8 million during the year ended December 31, 2017, and increases in aggregate director fees due to the increase in the number of outside directors as part of the Company's corporate governance enhancements, loan related expense, reserve for unfunded loan commitments due to the increased loan volume and impairments on previously capitalized software projects, partially offset by $2.7 million in expense for the redemption of the Company's 7.50 percent senior notes due April 15, 2020 during the year ended December 31, 2016.
62
Income Tax Expense
For the years ended
December 31, 2018
,
2017
and 2016, income tax expense (benefit) of continuing operations was
$4.8 million
,
$(26.6) million
and $13.7 million, respectively, and the effective tax rate was
10.3 percent
,
(98.8) percent
and 13.7 percent, respectively.
The Company’s effective tax rate of continuing operations for the year ended
December 31, 2018
was higher than the effective tax rate of continuing operations for the year ended
December 31, 2017
mainly due to the reduction in the recognition of tax credits on investments in alternative energy partnerships, which were
$9.6 million
for the year ended December 31, 2018, compared to
$38.2 million
for the year ended
December 31, 2017
. The reduction in tax credits received by the Bank on the investments in alternative energy partnerships is due to less new equipment being placed into service by the investments. The Company uses the flow-through income statement method to account for the tax credits earned on investments in alternative energy partnership. Under this method, the tax credits are recognized as a reduction to income tax expense and the initial book-tax difference in the basis of the investments are recognized as additional tax expense in the year they are earned. Also, in 2017 the Company recognized a $2.1 million net tax benefit as a result of re-measurement of the Company's deferred tax assets and liabilities due to the Tax Cuts and Jobs Act enacted in December 2017. The higher effective tax rate in 2018 was partially offset by a decrease in the federal statutory tax rate from 35% to 21% as a result of the Tax Cuts and Jobs Act, which became effective January 1, 2018.
For additional information, see Note 13 to Consolidated Financial Statements included in Item 8 of this Annual Report on Form 10-K.
63
Discontinued Operations
During the three months ended March 31, 2017, the Company completed the sale of the Banc Home Loans division, which largely represented the Company's Mortgage Banking segment. In accordance with ASC 205-20, the Company determined that the sale of the Banc Home Loans division and certain other mortgage banking related assets and liabilities that were to be sold or settled separately within one year met the criteria to be classified as a discontinued operation and its operating results and financial condition have been presented as discontinued operations in the consolidated financial statements. Certain components of the Company’s Mortgage Banking segment, including MSRs on certain conventional government SFR mortgage loans that were not sold as part of the Banc Home Loans sale and repurchase reserves related to previously sold loans, have been classified as continuing operations in the financial statements, as they will continue to be part of the Company’s ongoing operations.
The Banc Home Loans division originated conforming SFR mortgage loans and sold those loans in the secondary market. The amount of net revenue on mortgage banking activities was a function of mortgage loans originated for sale and the fair value adjustments of these loans and related derivatives. Net revenue on mortgage banking activities included mark to market pricing adjustments on loan commitments and forward sales contracts, and initial capitalized value of MSRs. For additional information, see Note 2 to Consolidated Financial Statements included in Item 8 of this Annual Report on Form 10-K.
Year Ended
December 31, 2018
Compared to Year Ended
December 31, 2017
Net income from discontinued operations was
$3.3 million
for the year ended
December 31, 2018
,
a decrease
of
$910 thousand
, or
21.5 percent
, from
$4.2 million
for the year ended
December 31, 2017
. Diluted earnings from discontinued operations per total common share were
$0.07
and
$0.08
for the years ended
December 31, 2018
and
2017
.
Interest income from discontinued operations was
$665 thousand
for the year ended
December 31, 2018
,
a decrease
of
$6.4 million
, or
90.6 percent
, from
$7.1 million
for the year ended
December 31, 2017
. The decrease was mainly due to a decrease in average balance of loans held-for-sale of discontinued operations.
Noninterest income from discontinued operations was
$4.1 million
for the year ended
December 31, 2018
,
a decrease
of
$56.0 million
, or
93.2 percent
, from
$60.1 million
for the year ended
December 31, 2017
. The decrease was mainly due to a decrease in net revenue from discontinued operations in the 2018 period.
Noninterest expense from discontinued operations was
$136 thousand
for the year ended
December 31, 2018
,
a decrease
of
$59.9 million
, or
99.8 percent
, from
$60.0 million
for the year ended
December 31, 2017
. Noninterest expense decreased significantly as the Company wound down the mortgage banking activities in discontinued operations.
Year Ended
December 31, 2017
Compared to Year Ended
December 31, 2016
Net income from discontinued operations was
$4.2 million
for the year ended
December 31, 2017
,
a decrease
of
$24.4 million
, or
85.2 percent
, from
$28.7 million
for the year ended
December 31, 2016
. Diluted earnings from discontinued operations per total common share were
$0.08
and
$0.60
for the years ended
December 31, 2017
and
2016
.
Interest income from discontinued operations was
$7.1 million
for the year ended
December 31, 2017
,
a decrease
of
$8.1 million
, or
53.4 percent
, from
$15.1 million
for the year ended
December 31, 2016
. The decrease was mainly due to a decrease in average balance of loans held-for-sale of discontinued operations.
Noninterest income from discontinued operations was
$60.1 million
for the year ended
December 31, 2017
,
a decrease
of
$113.1 million
, or
65.3 percent
, from
$173.3 million
for the year ended
December 31, 2016
. The decrease was mainly due to decreases in loan servicing income and net revenue on mortgage banking activities, partially offset by a net gain on disposal of discontinued operations of
$13.8 million
for the year ended December 31, 2017. The decreases in loan servicing income and net revenue on mortgage banking activities were mainly due to the discontinued operations of mortgage banking activities. The Company originated conforming SFR mortgage loans of
$1.53 billion
and
$5.14 billion
, respectively, and sold
$1.88 billion
and
$5.13 billion
, respectively, in the secondary market during the years ended
December 31, 2017
and
2016
.
Noninterest expense from discontinued operations was
$60.0 million
for the year ended
December 31, 2017
,
a decrease
of
$79.5 million
, or
57.0 percent
, from
$139.5 million
for the year ended
December 31, 2016
. The decrease was mainly due to the
discontinued operations of mortgage banking activities, partially offset by a restructuring expense of
$3.8 million
for the year
ended
December 31, 2017
. In connection with the sale of Banc Home Loans division, the Company restructured certain aspects
of its infrastructure and back office operations by realigning back office staffing and amending certain system contracts.
64
Financial Condition
Investment Securities
Investment securities that the Company has the ability and the intent to hold to maturity are classified as held-to-maturity. All
other securities are classified as available-for-sale. Investment securities classified as held-to-maturity are carried at amortized
cost. Investment securities classified as available-for-sale are carried at their estimated fair values with the changes in fair
values recorded in accumulated other comprehensive income, net of tax, as a component of stockholders’ equity. At
December 31, 2018
, all of the Company’s investment securities were classified as available-for-sale.
The primary goal of our investment securities portfolio is to provide a relatively stable source of interest income while satisfactorily managing risk, including credit risk, reinvestment risk, liquidity risk and interest rate risk. Certain investment securities provide a source of liquidity as collateral for FHLB advances, Federal Reserve Discount Window capacity, repurchase agreements and for certain public deposits.
The following table presents the amortized cost and fair value of the investment securities portfolio and the corresponding amounts of gross unrealized gains and losses recognized in accumulated other comprehensive income (loss) as of the dates indicated:
|
($ in thousands)
|
Amortized Cost
|
Gross Unrealized Gains
|
Gross Unrealized Losses
|
Fair Value
|
||||||||||||
|
December 31, 2018
|
||||||||||||||||
|
Securities available-for-sale:
|
||||||||||||||||
|
SBA loan pool securities
|
$
|
911
|
|
$
|
—
|
|
$
|
(1
|
)
|
$
|
910
|
|
||||
|
U.S. government agency and U.S. government sponsored enterprise residential mortgage-backed securities
|
461,987
|
|
—
|
|
(24,545
|
)
|
437,442
|
|
||||||||
|
Non-agency residential mortgage-backed securities
|
418
|
|
9
|
|
—
|
|
427
|
|
||||||||
|
Non-agency commercial mortgage-backed securities
|
132,199
|
|
—
|
|
—
|
|
132,199
|
|
||||||||
|
Collateralized loan obligations
|
1,431,171
|
|
141
|
|
(9,790
|
)
|
1,421,522
|
|
||||||||
|
Total securities available-for-sale
|
$
|
2,026,686
|
|
$
|
150
|
|
$
|
(34,336
|
)
|
$
|
1,992,500
|
|
||||
|
December 31, 2017
|
||||||||||||||||
|
Securities available-for-sale:
|
||||||||||||||||
|
SBA loan pool securities
|
$
|
1,056
|
|
$
|
2
|
|
$
|
—
|
|
$
|
1,058
|
|
||||
|
U.S. government agency and U.S. government sponsored enterprise residential mortgage-backed securities
|
492,255
|
|
10
|
|
(15,336
|
)
|
476,929
|
|
||||||||
|
Non-agency residential mortgage-backed securities
|
741
|
|
16
|
|
(1
|
)
|
756
|
|
||||||||
|
Non-agency commercial mortgage-backed securities
|
305,172
|
|
5,339
|
|
—
|
|
310,511
|
|
||||||||
|
Collateralized loan obligations
|
1,691,455
|
|
11,129
|
|
(266
|
)
|
1,702,318
|
|
||||||||
|
Corporate debt securities
|
76,714
|
|
7,183
|
|
—
|
|
83,897
|
|
||||||||
|
Total securities available-for-sale
|
$
|
2,567,393
|
|
$
|
23,679
|
|
$
|
(15,603
|
)
|
$
|
2,575,469
|
|
||||
|
December 31, 2016
|
||||||||||||||||
|
Securities held-to-maturity:
|
||||||||||||||||
|
Non-agency commercial mortgage-backed securities
|
$
|
305,918
|
|
$
|
2,949
|
|
$
|
(1,781
|
)
|
$
|
307,086
|
|
||||
|
Collateralized loan obligations
|
338,226
|
|
1,461
|
|
(61
|
)
|
339,626
|
|
||||||||
|
Corporate debt securities
|
240,090
|
|
13,032
|
|
(91
|
)
|
253,031
|
|
||||||||
|
Total securities held-to-maturity
|
$
|
884,234
|
|
$
|
17,442
|
|
$
|
(1,933
|
)
|
$
|
899,743
|
|
||||
|
Securities available-for-sale:
|
||||||||||||||||
|
SBA loan pool securities
|
$
|
1,221
|
|
$
|
—
|
|
$
|
—
|
|
$
|
1,221
|
|
||||
|
U.S. government agency and U.S. government sponsored enterprise residential mortgage-backed securities
|
830,682
|
|
9
|
|
(23,418
|
)
|
807,273
|
|
||||||||
|
Non-agency residential mortgage-backed securities
|
121,397
|
|
18
|
|
(4,238
|
)
|
117,177
|
|
||||||||
|
Collateralized loan obligations
|
1,395,094
|
|
12,449
|
|
(674
|
)
|
1,406,869
|
|
||||||||
|
Corporate debt securities
|
48,574
|
|
482
|
|
(108
|
)
|
48,948
|
|
||||||||
|
Total securities available-for-sale
|
$
|
2,396,968
|
|
$
|
12,958
|
|
$
|
(28,438
|
)
|
$
|
2,381,488
|
|
||||
During the three months ended June 30, 2017, the Company evaluated its securities held-to-maturity and determined that certain securities no longer adhered to the Company’s strategic focus and could be sold or reinvested to potentially improve the
65
Company’s liquidity position or duration profile. Accordingly, the Company was no longer able to assert that it had the intent to hold these securities until maturity. As a result, the Company transferred all
$740.9 million
of its held-to-maturity securities to available-for-sale, which resulted in a pre-tax increase to accumulated other comprehensive income of
$22.0 million
at the time of the transfer, which occurred before June 30, 2017. Due to the transfer, the Company’s ability to assert that it has both the intent and ability to hold debt securities to maturity will be limited for the foreseeable future.
Securities available-for-sale were
$1.99 billion
at
December 31, 2018
, a decrease of
$583.0 million
, or
22.6 percent
, from
$2.58 billion
at
December 31, 2017
. The decrease was mainly due to sales of
$406.8 million
, principal payments of
$43.4 million
, and calls and pay-offs of
$607.6 million
, partially offset by purchases of
$521.6 million
during the year ended
December 31, 2018
. Securities available-for-sale had a net unrealized
loss
of
$34.2 million
at
December 31, 2018
and a net unrealized gain of
$8.1 million
at
December 31, 2017
, respectively.
The Company repositioned its securities available-for-sale portfolio during the years ended
December 31, 2018
and 2017 to navigate a volatile rate environment by reducing the overall duration of the portfolio by selling certain longer-duration and fixed-rate non-agency mortgage-backed securities and corporate debt securities and continued shrinking the amount of collateralized loan obligations in the investment securities portfolio. During the three months ended March 31, 2018, the Company completed the sale of all remaining corporate debt securities, totaling
$76.8 million
, to reposition its securities available-for-sale portfolio. During the year ended
December 31, 2018
, the balance of collateralized loan obligations declined by
$280.8 million
due primarily to call and sale activities, partially offset by purchase activities. The net proceeds from the sale of securities and the run-off in collateralized loan obligations were redeployed to support loan growth.
CLOs totaled
$1.42 billion
and
$1.70 billion
, respectively, at
December 31, 2018
and
2017
. CLOs are floating rate debt securities backed by pools of senior secured commercial loans to a diverse group of companies across a broad spectrum of industries. Underlying loans are generally secured by a company’s assets such as inventory, equipment, property, and/or real estate. CLOs are structured to diversify exposure to a broad sector of industries. The payments on these commercial loans support interest and principal on the CLOs across classes that range from AAA rated to equity tranches. The Company believes that its CLO portfolio, consisting entirely of variable rate securities, supports the Company’s interest rate risk management strategy by lowering the extension risk and duration risk inherent to certain fixed rate investment securities. At
December 31, 2018
, the Company owned AAA and AA rated CLOs and did not own CLOs rated below AA. As all CLOs are also rated above investment grade credit ratings and were diversified across issuers, the Company believes that these CLOs enhance the Company's liquidity position. The Company also maintains pre-purchase due diligence and ongoing review processes by a dedicated credit administration team. The ongoing review process includes monitoring of performance factors including external credit ratings, collateralization levels, collateral concentration levels and other performance factors. The Company only acquires CLOs that it believes are Volcker Rule compliant.
As of
December 31, 2018
, the Company changed its intent to sell its non-agency commercial mortgage-backed securities in an unrealized loss position due to its strategy to reposition its securities profile and recognized
$3.3 million
of OTTI for the year ended December 31, 2018. The Company did not record OTTI for investment securities for the years ended
December 31, 2017
and
2016
. As of
December 31, 2018
, all of the Company's investment securities in an unrealized loss position had received an investment grade credit rating.
66
The following table presents the composition and the repricing and yield information of the investment securities portfolio as of
December 31, 2018
:
|
One year or less
|
More than One Year through Five Years
|
More than Five Years through Ten Years
|
More than Ten Years
|
Total
|
|||||||||||||||||||||||||||||||
|
($ in thousands)
|
Fair
Value
|
Weighted-Average Yield
|
Fair
Value
|
Weighted-Average Yield
|
Fair
Value
|
Weighted-Average Yield
|
Fair
Value
|
Weighted-Average Yield
|
Fair
Value
|
Weighted-Average Yield
|
|||||||||||||||||||||||||
|
Securities available-for-sale:
|
|||||||||||||||||||||||||||||||||||
|
SBA loan pool securities
|
$
|
—
|
|
—
|
%
|
$
|
—
|
|
—
|
%
|
$
|
—
|
|
—
|
%
|
$
|
910
|
|
2.84
|
%
|
$
|
910
|
|
2.84
|
%
|
||||||||||
|
U.S. government agency and U.S. government sponsored enterprise residential mortgage-backed securities
|
279
|
|
2.95
|
%
|
3,460
|
|
3.32
|
%
|
—
|
|
—
|
%
|
433,703
|
|
3.23
|
%
|
437,442
|
|
3.23
|
%
|
|||||||||||||||
|
Non-agency residential mortgage-backed securities
|
83
|
|
3.96
|
%
|
—
|
|
—
|
%
|
—
|
|
—
|
%
|
344
|
|
5.47
|
%
|
427
|
|
5.18
|
%
|
|||||||||||||||
|
Non-agency commercial mortgage-backed securities
|
—
|
|
—
|
%
|
—
|
|
—
|
%
|
132,199
|
|
3.75
|
%
|
—
|
|
—
|
%
|
132,199
|
|
3.75
|
%
|
|||||||||||||||
|
Collateralized loan obligations
|
1,421,522
|
|
4.44
|
%
|
—
|
|
—
|
%
|
—
|
|
—
|
%
|
—
|
|
—
|
%
|
1,421,522
|
|
4.44
|
%
|
|||||||||||||||
|
Total securities available-for-sale
|
$
|
1,421,884
|
|
4.44
|
%
|
$
|
3,460
|
|
3.32
|
%
|
$
|
132,199
|
|
3.75
|
%
|
$
|
434,957
|
|
3.23
|
%
|
$
|
1,992,500
|
|
4.13
|
%
|
||||||||||
67
Loans Held-for-Sale
Total loans held-for-sale on consolidated operations basis, including discontinued operations, were
$27.6 million
and
$105.8 million
, respectively, at
December 31, 2018
and
2017
. Loans held-for-sale consisted of two components: loans held-for-sale carried at fair value and loans held-for-sale carried at lower of cost or fair value.
As of December 31, 2018, loans held-for-sale carried at fair value are mainly repurchased conforming SFR mortgage loans that were previously sold. As of December 31, 2017, loans held-for-sale carried at fair value were mainly repurchased
conforming SFR mortgage loans that were previously sold and loans previously sold to GNMA that are delinquent more than
90 days and subject to a repurchase option by the Company. Loans held-for-sale carried at fair value on a consolidated operations basis were
$27.2 million
and
$105.3 million
, respectively, at
December 31, 2018
and
2017
. The
$78.1 million
, or
74.2 percent
, decrease was mainly due to a net decrease of
$66.0 million
in GNMA loans delinquent more than 90 days, which were subject to a repurchase option held by the Company, which option was eliminated as a result of the sale of the related MSRs to third parties during 2018. The decrease was also a result of loan sales of
$14.5 million
, partially offset by loan repurchases of
$12.7 million
.
During the three months ended March 31, 2017, the Company completed the sale of its Banc Home Loans division, which largely represented the Company's Mortgage Banking segment, and determined that the sale of the Mortgage Banking segment met the criteria to be classified as a discontinued operation. Loans held-for-sale carried at fair value related to the Banc Home Loans division were included in Assets of Discontinued Operations on the Consolidated Statements of Financial Condition. Such loans totaled
$19.5 million
and
$38.7 million
at
December 31, 2018
and
2017
, respectively.
Loans held-for-sale carried at the lower of cost or fair value are mainly non-conforming jumbo mortgage loans and SBA loans. Loans held-for-sale carried at the lower of cost or fair value on a consolidated operations basis were
$426 thousand
and
$466 thousand
, respectively, at
December 31, 2018
and
2017
.
During the three months ended June 30, 2017, the Company transferred all of its seasoned SFR mortgage loans with an aggregate unpaid principal amount and aggregate carrying value of
$168.3 million
and
$147.9 million
, respectively, to loans held-for-sale in order to improve the credit quality of the loan portfolio and provide additional liquidity. The Company transferred these loans at the lower of cost or fair value and recorded a fair value adjustment of
$1.8 million
against its ALLL. All of these loans were sold during the three months ended September 30, 2017. On the date of sale, the aggregate unpaid principal balance and aggregate carrying value were
$165.7 million
and
$144.2 million
, respectively, and the Company recognized a gain on sale of
$4.7 million
.
68
Loans and Leases Receivable, Net
The following table presents the composition of the Company’s loan and lease portfolio as of the dates indicated:
|
December 31,
|
|||||||||||||||||||||||||||||||||||
|
2018
|
2017
|
2016
|
2015
|
2014
|
|||||||||||||||||||||||||||||||
|
($ in thousands)
|
Amount
|
Percent
|
Amount
|
Percent
|
Amount
|
Percent
|
Amount
|
Percent
|
Amount
|
Percent
|
|||||||||||||||||||||||||
|
Commercial:
|
|||||||||||||||||||||||||||||||||||
|
Commercial and industrial
|
$
|
1,944,142
|
|
25.2
|
%
|
$
|
1,701,951
|
|
25.5
|
%
|
$
|
1,522,960
|
|
25.2
|
%
|
$
|
876,999
|
|
16.9
|
%
|
$
|
490,900
|
|
12.4
|
%
|
||||||||||
|
Commercial real estate
|
867,013
|
|
11.3
|
%
|
717,415
|
|
10.8
|
%
|
729,959
|
|
12.1
|
%
|
727,707
|
|
14.0
|
%
|
999,857
|
|
25.3
|
%
|
|||||||||||||||
|
Multifamily
|
2,241,246
|
|
29.2
|
%
|
1,816,141
|
|
27.3
|
%
|
1,365,262
|
|
22.6
|
%
|
904,300
|
|
17.5
|
%
|
955,683
|
|
24.2
|
%
|
|||||||||||||||
|
SBA
|
68,741
|
|
0.9
|
%
|
78,699
|
|
1.2
|
%
|
73,840
|
|
1.2
|
%
|
57,706
|
|
1.1
|
%
|
36,155
|
|
0.9
|
%
|
|||||||||||||||
|
Construction
|
203,976
|
|
2.6
|
%
|
182,960
|
|
2.7
|
%
|
125,100
|
|
2.1
|
%
|
55,289
|
|
1.1
|
%
|
42,198
|
|
1.1
|
%
|
|||||||||||||||
|
Lease financing
|
—
|
|
—
|
%
|
13
|
|
—
|
%
|
379
|
|
0.1
|
%
|
192,424
|
|
3.7
|
%
|
85,749
|
|
2.2
|
%
|
|||||||||||||||
|
Consumer:
|
|||||||||||||||||||||||||||||||||||
|
Single family residential mortgage
|
2,305,490
|
|
29.9
|
%
|
2,055,649
|
|
30.9
|
%
|
2,106,630
|
|
34.9
|
%
|
2,255,584
|
|
43.5
|
%
|
1,171,662
|
|
29.7
|
%
|
|||||||||||||||
|
Other consumer
|
70,265
|
|
0.9
|
%
|
106,579
|
|
1.6
|
%
|
110,622
|
|
1.8
|
%
|
114,385
|
|
2.2
|
%
|
166,918
|
|
4.2
|
%
|
|||||||||||||||
|
Total loans and leases
(1)
|
7,700,873
|
|
100.0
|
%
|
6,659,407
|
|
100.0
|
%
|
6,034,752
|
|
100.0
|
%
|
5,184,394
|
|
100.0
|
%
|
3,949,122
|
|
100.0
|
%
|
|||||||||||||||
|
Allowance for loan and lease losses
|
(62,192
|
)
|
(49,333
|
)
|
(40,444
|
)
|
(35,533
|
)
|
(29,480
|
)
|
|||||||||||||||||||||||||
|
Total loans and leases receivable, net
|
$
|
7,638,681
|
|
$
|
6,610,074
|
|
$
|
5,994,308
|
|
$
|
5,148,861
|
|
$
|
3,919,642
|
|
||||||||||||||||||||
|
(1)
|
Total loans and leases includes deferred loan origination costs/(fees) and premiums/(discounts), net of
$17.7 million
,
$6.4 million
,
$9.2 million
,
$6.4 million
,
$2.9 million
, respectively, at December 31, 2018, 2017, 2016, 2015, and 2014.
|
Total loans and leases were
$7.70 billion
at
December 31, 2018
,
an increase
of
$1.0 billion
, or
15.6 percent
, from
$6.66 billion
at
December 31, 2017
. The increase was mainly due to increases in multifamily loans, SFR mortgage loans, commercial and industrial loans, commercial real estate loans, and construction loans, partially offset by decreases in other consumer loans, SBA loans, and lease financing. The increases in multifamily loans, commercial and industrial loans, commercial real estate loans, and construction loans were mainly due to increased originations. The increase in SFR mortgage loans was mainly due to the
$59.5 million
of loans purchased to assist the Company in complying with its CRA requirements and increased originations, partially offset by loans transferred to loans held-for-sale of
$377.0 million
. The decreases in other consumer loans and lease financing was mainly due to reductions in principal balances and payoffs. See "Loan and Lease Originations, Purchases and Repayments" for the origination detail per loan and lease category.
69
The following table presents the contractual maturity with the weighted-average contractual yield of the loan and lease portfolio as of
December 31, 2018
:
|
One year or less
|
More than One Year through Five Years
|
More than Five Years through Ten Years
|
More than Ten Years
|
Total
|
|||||||||||||||||||||||||||||||
|
($ in thousands)
|
Amount
|
Weighted-Average Yield
|
Amount
|
Weighted-Average Yield
|
Amount
|
Weighted-Average Yield
|
Amount
|
Weighted-Average Yield
|
Amount
|
Weighted-Average Yield
|
|||||||||||||||||||||||||
|
Commercial:
|
|||||||||||||||||||||||||||||||||||
|
Commercial and industrial
|
$
|
1,126,097
|
|
4.47
|
%
|
$
|
473,074
|
|
5.36
|
%
|
$
|
299,659
|
|
5.24
|
%
|
$
|
45,312
|
|
4.62
|
%
|
$
|
1,944,142
|
|
4.81
|
%
|
||||||||||
|
Commercial real estate
|
49,296
|
|
5.19
|
%
|
146,463
|
|
4.74
|
%
|
624,588
|
|
4.49
|
%
|
46,666
|
|
5.08
|
%
|
867,013
|
|
4.60
|
%
|
|||||||||||||||
|
Multifamily
|
43,153
|
|
5.59
|
%
|
83,895
|
|
5.37
|
%
|
155,195
|
|
3.63
|
%
|
1,959,003
|
|
4.06
|
%
|
2,241,246
|
|
4.11
|
%
|
|||||||||||||||
|
SBA
|
412
|
|
7.26
|
%
|
3,639
|
|
7.63
|
%
|
43,194
|
|
6.69
|
%
|
21,496
|
|
5.62
|
%
|
68,741
|
|
6.41
|
%
|
|||||||||||||||
|
Construction
|
145,829
|
|
7.09
|
%
|
53,979
|
|
5.82
|
%
|
4,168
|
|
4.00
|
%
|
—
|
|
—
|
%
|
203,976
|
|
6.69
|
%
|
|||||||||||||||
|
Consumer:
|
|||||||||||||||||||||||||||||||||||
|
Single family residential mortgage
|
—
|
|
—
|
%
|
50,276
|
|
4.80
|
%
|
17,803
|
|
5.15
|
%
|
2,237,411
|
|
4.50
|
%
|
2,305,490
|
|
4.51
|
%
|
|||||||||||||||
|
Other consumer
|
13,890
|
|
6.22
|
%
|
8,372
|
|
4.78
|
%
|
1,891
|
|
6.33
|
%
|
46,112
|
|
5.97
|
%
|
70,265
|
|
5.89
|
%
|
|||||||||||||||
|
Total
|
$
|
1,378,677
|
|
4.82
|
%
|
$
|
819,698
|
|
5.25
|
%
|
$
|
1,146,498
|
|
4.66
|
%
|
$
|
4,356,000
|
|
4.33
|
%
|
$
|
7,700,873
|
|
4.57
|
%
|
||||||||||
70
The following table presents the interest rate profile of the loan and lease portfolio due after one year at
December 31, 2018
:
|
Due After One Year
|
||||||||||||
|
($ in thousands)
|
Fixed Rate
|
Variable Rate
|
Total
|
|||||||||
|
Commercial:
|
||||||||||||
|
Commercial and industrial
|
$
|
309,597
|
|
$
|
508,448
|
|
$
|
818,045
|
|
|||
|
Commercial real estate
|
461,617
|
|
356,100
|
|
817,717
|
|
||||||
|
Multifamily
|
32,574
|
|
2,165,519
|
|
2,198,093
|
|
||||||
|
SBA
|
16,416
|
|
51,913
|
|
68,329
|
|
||||||
|
Construction
|
—
|
|
58,147
|
|
58,147
|
|
||||||
|
Consumer:
|
||||||||||||
|
Single family residential mortgage
|
59,333
|
|
2,246,137
|
|
2,305,470
|
|
||||||
|
Other consumer
|
5,509
|
|
50,866
|
|
56,375
|
|
||||||
|
Total
|
$
|
885,046
|
|
$
|
5,437,130
|
|
$
|
6,322,176
|
|
|||
71
Loan and Lease Originations, Purchases, Sales and Repayments
The following table presents loan and lease originations, purchases, sales, and repayment activities excluding loans originated for sale, for the periods indicated:
|
Year Ended December
31,
|
||||||||||||
|
($ in thousands)
|
2018
|
2017
|
2016
|
|||||||||
|
Origination by rate type:
|
||||||||||||
|
Variable rate:
|
||||||||||||
|
Commercial and industrial
|
$
|
257,735
|
|
$
|
396,298
|
|
$
|
400,878
|
|
|||
|
Commercial real estate and multifamily
|
831,821
|
|
749,549
|
|
628,900
|
|
||||||
|
SBA
|
1,964
|
|
9,669
|
|
15,423
|
|
||||||
|
Construction
|
22,281
|
|
29,490
|
|
49,702
|
|
||||||
|
Single family residential mortgage
|
1,013,087
|
|
900,412
|
|
1,034,763
|
|
||||||
|
Other consumer
|
7,204
|
|
8,931
|
|
9,582
|
|
||||||
|
Total floating rate
|
2,134,092
|
|
2,094,349
|
|
2,139,248
|
|
||||||
|
Fixed rate:
|
||||||||||||
|
Commercial and industrial
|
178,663
|
|
160,860
|
|
284,542
|
|
||||||
|
Commercial real estate and multifamily
|
159,726
|
|
62,388
|
|
136,933
|
|
||||||
|
SBA
|
350
|
|
—
|
|
9,490
|
|
||||||
|
Construction
|
90,675
|
|
35,728
|
|
8,907
|
|
||||||
|
Lease financing
|
—
|
|
—
|
|
41,008
|
|
||||||
|
Other consumer
|
—
|
|
—
|
|
50
|
|
||||||
|
Total fixed rate
|
429,414
|
|
258,976
|
|
480,930
|
|
||||||
|
Total loans and leases originated
|
2,563,506
|
|
2,353,325
|
|
2,620,178
|
|
||||||
|
Purchases:
|
||||||||||||
|
Single family residential mortgage
|
59,481
|
|
—
|
|
90,984
|
|
||||||
|
Lease financing
|
—
|
|
—
|
|
91,247
|
|
||||||
|
Total loans and leases purchased
|
59,481
|
|
—
|
|
182,231
|
|
||||||
|
Transferred to loans held-for-sale
|
(376,995
|
)
|
(593,977
|
)
|
(191,666
|
)
|
||||||
|
Repayments:
|
||||||||||||
|
Principal repayments
|
(9,196,852
|
)
|
(10,194,770
|
)
|
(7,944,255
|
)
|
||||||
|
Sales
|
—
|
|
—
|
|
(970,587
|
)
|
||||||
|
Increase in other items, net
|
7,992,326
|
|
9,060,077
|
|
7,154,457
|
|
||||||
|
Net increase
|
$
|
1,041,466
|
|
$
|
624,655
|
|
$
|
850,358
|
|
|||
The decreases in changes from principal repayments and other items were mainly due to decreased advances and repayments in commercial lines of credit and warehouse lines of credit during the year ended
December 31, 2018
.
72
Seasoned SFR Mortgage Loan Pools
The Company did not have any outstanding seasoned SFR mortgage loan pools at
December 31, 2018
or 2017.
During the three months ended June 30, 2017, the Company transferred all of its seasoned SFR mortgage loans, which had an aggregate unpaid principal balance and an aggregate carrying value of
$168.3 million
and
$147.9 million
, respectively, to loans held-for-sale in order to improve the credit quality of the loan portfolio and provide additional liquidity. The Company transferred these loans at lower of cost or fair value and recorded a fair value adjustment of
$1.8 million
against its ALLL. This
transfer included PCI loans with an aggregate unpaid principal balance and aggregate carrying value of
$147.5 million
and
$128.4 million
, respectively, and recorded a fair value adjustment of
$274 thousand
. All of these loans were sold during the
three months ended September 30, 2017. On the date of sale settlement, the aggregate unpaid principal balance and aggregate
carrying value were
$165.7 million
and
$144.2 million
, respectively, and the Company recognized a gain on sale of
$4.7 million
. The Company sold seasoned SFR mortgage loans with an aggregate unpaid principal balance and aggregate carrying value of
$766.0 million
and
$707.4 million
respectively, during the year ended December 31, 2016, and the Company recognized a gain on sale of
$24.7 million
.
At December 31, 2016, the total unpaid principal balance and carrying value of the seasoned SFR mortgage loan pools were
$177.1 million
and
$155.2 million
, respectively. At the time of purchase, the Company determined that certain of these loans reflected credit quality deterioration since origination and it was probable that all contractually required payments would not be collected (Purchased Credit Impaired Loans, or PCI loans). Total unpaid principal balance and carrying value of PCI loans included in these pools were
$153.9 million
and
$133.2 million
, respectively, at December 31, 2016. These PCI loans were sold as part of the loan sales in 2017 described above.
The Company did not purchase any seasoned SFR mortgage loan pools during the year ended
December 31, 2018
or 2017. During the year ended December 31, 2016, the Company completed one seasoned SFR mortgage loan pool acquisition with unpaid principal balances and fair values of
$103.8 million
and
$91.0 million
, respectively, at the acquisition date. The Company determined that all of the loans in this seasoned SFR mortgage loan acquisition reflected credit quality deterioration since origination and it was probable, at acquisition, that all contractually required payments would not be collected.
73
Non-Traditional Mortgage Portfolio
The Company’s non-traditional mortgage (NTM) portfolio is comprised of three interest only products: Green Loans, fixed or adjustable rate hybrid interest only rate mortgage (Interest Only) loans and a small number of additional loans with the potential for negative amortization. As of
December 31, 2018
and
2017
, the NTM loans totaled
$826.7 million
, or
10.7 percent
of total loans and leases, and
$806.9 million
, or
12.1 percent
of total loans and leases, respectively. Total NTM portfolio
increased
by
$19.8 million
, or
2.5
percent, during the period. The following table presents the composition of the NTM portfolio as of the dates indicated:
|
December 31,
|
||||||||||||||||||||||||||||||||||||||||||||||||||
|
2018
|
2017
|
2016
|
2015
|
2014
|
||||||||||||||||||||||||||||||||||||||||||||||
|
($ in thousands)
|
Count
|
Amount
|
Percent
|
Count
|
Amount
|
Percent
|
Count
|
Amount
|
Percent
|
Count
|
Amount
|
Percent
|
Count
|
Amount
|
Percent
|
|||||||||||||||||||||||||||||||||||
|
Green Loans (HELOC) - first liens
|
88
|
|
$
|
67,729
|
|
8.2
|
%
|
101
|
|
$
|
82,197
|
|
10.2
|
%
|
107
|
|
$
|
87,469
|
|
9.9
|
%
|
121
|
|
$
|
105,131
|
|
13.4
|
%
|
148
|
|
$
|
123,177
|
|
35.1
|
%
|
|||||||||||||||
|
Interest only - first liens
|
519
|
|
753,061
|
|
91.1
|
%
|
468
|
|
717,484
|
|
88.9
|
%
|
522
|
|
784,364
|
|
88.6
|
%
|
521
|
|
664,358
|
|
84.4
|
%
|
207
|
|
209,207
|
|
59.7
|
%
|
||||||||||||||||||||
|
Negative amortization
|
11
|
|
3,528
|
|
0.4
|
%
|
11
|
|
3,674
|
|
0.5
|
%
|
22
|
|
9,756
|
|
1.1
|
%
|
30
|
|
11,602
|
|
1.5
|
%
|
32
|
|
13,099
|
|
3.7
|
%
|
||||||||||||||||||||
|
Total NTM - first liens
|
618
|
|
824,318
|
|
99.7
|
%
|
580
|
|
803,355
|
|
99.6
|
%
|
651
|
|
881,589
|
|
99.6
|
%
|
672
|
|
781,091
|
|
99.3
|
%
|
387
|
|
345,483
|
|
98.5
|
%
|
||||||||||||||||||||
|
Green Loans (HELOC) - second liens
|
10
|
|
2,413
|
|
0.3
|
%
|
12
|
|
3,578
|
|
0.4
|
%
|
12
|
|
3,559
|
|
0.4
|
%
|
16
|
|
4,704
|
|
0.6
|
%
|
19
|
|
4,979
|
|
1.4
|
%
|
||||||||||||||||||||
|
Interest only - second liens
|
—
|
|
—
|
|
—
|
%
|
—
|
|
—
|
|
—
|
%
|
—
|
|
—
|
|
—
|
%
|
1
|
|
113
|
|
0.1
|
%
|
1
|
|
113
|
|
0.1
|
%
|
||||||||||||||||||||
|
Total NTM - second liens
|
10
|
|
2,413
|
|
0.3
|
%
|
12
|
|
3,578
|
|
0.4
|
%
|
12
|
|
3,559
|
|
0.4
|
%
|
17
|
|
4,817
|
|
0.7
|
%
|
20
|
|
5,092
|
|
1.5
|
%
|
||||||||||||||||||||
|
Total NTM loans
|
628
|
|
$
|
826,731
|
|
100.0
|
%
|
592
|
|
$
|
806,933
|
|
100.0
|
%
|
663
|
|
$
|
885,148
|
|
100.0
|
%
|
689
|
|
$
|
785,908
|
|
100.0
|
%
|
407
|
|
$
|
350,575
|
|
100.0
|
%
|
|||||||||||||||
|
Percentage to total loans and leases
|
10.7%
|
12.1%
|
14.7%
|
15.2%
|
8.9%
|
|||||||||||||||||||||||||||||||||||||||||||||
The initial credit guidelines for the NTM portfolio were established based on borrower Fair Isaac Corporation (FICO) score, LTV ratio, property type, occupancy type, loan amount, and geography. Additionally, from an ongoing credit risk management perspective, the Company has determined the most significant performance indicators for NTMs to be LTV ratios and FICO scores. On a quarterly basis, the Company performs loan reviews of the NTM loan portfolio, which includes refreshing FICO scores on the Green Loans and HELOCs and ordering third party automated valuation models (AVMs) to confirm collateral values.
74
The following table presents the contractual maturity with number of loans of the NTM portfolio as of
December 31, 2018
:
|
One year or less
|
More than One Year through Five Years
|
More than Five Years through Ten Years
|
More than Ten Years
|
Total
|
||||||||||||||||||||||||||||||
|
Count
|
Amount
|
Count
|
Amount
|
Count
|
Amount
|
Count
|
Amount
|
Count
|
Amount
|
|||||||||||||||||||||||||
|
($ in thousands)
|
||||||||||||||||||||||||||||||||||
|
Green Loans (HELOC) - first liens
(1)
|
—
|
|
$
|
—
|
|
70
|
|
$
|
50,101
|
|
18
|
|
$
|
17,628
|
|
—
|
|
$
|
—
|
|
88
|
|
$
|
67,729
|
|
|||||||||
|
Interest only - first liens
(2)
|
—
|
|
—
|
|
1
|
|
109
|
|
—
|
|
—
|
|
518
|
|
752,952
|
|
519
|
|
753,061
|
|
||||||||||||||
|
Negative amortization
|
—
|
|
—
|
|
—
|
|
—
|
|
—
|
|
—
|
|
11
|
|
3,528
|
|
11
|
|
3,528
|
|
||||||||||||||
|
Total NTM - first liens
|
—
|
|
—
|
|
71
|
|
50,210
|
|
18
|
|
17,628
|
|
529
|
|
756,480
|
|
618
|
|
824,318
|
|
||||||||||||||
|
Green Loans (HELOC) - second liens
(1)
|
—
|
|
—
|
|
9
|
|
2,412
|
|
1
|
|
1
|
|
—
|
|
—
|
|
10
|
|
2,413
|
|
||||||||||||||
|
Interest only - second liens
(2)
|
—
|
|
—
|
|
—
|
|
—
|
|
—
|
|
—
|
|
—
|
|
—
|
|
—
|
|
—
|
|
||||||||||||||
|
Total NTM - second liens
|
—
|
|
—
|
|
9
|
|
2,412
|
|
1
|
|
1
|
|
—
|
|
—
|
|
10
|
|
2,413
|
|
||||||||||||||
|
Total NTM loans
|
—
|
|
$
|
—
|
|
80
|
|
$
|
52,622
|
|
19
|
|
$
|
17,629
|
|
529
|
|
$
|
756,480
|
|
628
|
|
$
|
826,731
|
|
|||||||||
|
(1)
|
Green Loans typically have a 15 year balloon maturity.
|
|
(2)
|
Interest Only loans typically switch to an amortizing basis after 5, 7, or 10 years.
|
At
December 31, 2018
, all negative amortization loans had outstanding balances less than their original principal balances.
75
Green Loans
The Company discontinued the origination of Green Loan products in 2011. Green Loans are SFR first and second mortgage
lines of credit with a linked checking account that allows all types of deposits and withdrawals to be performed. The loans are
generally interest only with a 15-year balloon payment due at maturity. The Company initiated the Green Loan products in
2005 and proactively refined underwriting and credit management practices and credit guidelines in response to changing
economic environments, competitive conditions and portfolio performance. The Company continues to manage credit risk, to
the extent possible, throughout the borrower’s credit cycle.
At December 31, 2018, Green Loans totaled
$70.1 million
,
a decrease
of
$15.6 million
, or
18.2 percent
from
$85.8 million
at
December 31, 2017
, primarily due to reductions in principal balance and payoffs. As of
December 31, 2018
and
2017
,
none
of the Company’s Green Loans were non-performing. As a result of their unique payment feature, Green Loans possess higher credit risk due to the potential of negative amortization; however, management believes the risk is mitigated through the Company’s loan terms and underwriting standards, including its policies on loan-to-value ratios and the Company’s contractual ability to curtail loans when the value of underlying collateral declines.
Green Loans are similar to HELOCs in that they are collateralized primarily by the equity in the borrower's home. However, some Green Loans differ from HELOCs relating to certain characteristics including one-action laws. Similar to Green Loans, HELOCs allow the borrower to draw down on the credit line based on an established loan amount for a period of time, typically 10 years, requiring an interest only payment with an option to pay principal at any time. A typical HELOC provides that at the end of the term the borrower can continue to make monthly principal and interest payments based on the loan balance until the maturity date. The Green Loan is an interest only loan with a maturity of 15 years, at which time the loan becomes due and payable with a balloon payment at maturity. The unique payment structure also differs from a traditional HELOC in that payments are made through the direct linkage of a personal checking account to the loan through a nightly sweep of funds into the Green Loan Account. This reduces any outstanding balance on the loan by the total amount deposited into the checking account. As a result, every time a deposit is made, effectively a payment to the Green Loan is made. HELOCs typically do not cause the loan to be paid down by a borrower’s depositing of funds into their checking account at the same bank.
Credit guidelines for Green Loans were established based on borrower FICO scores, property type, occupancy type, loan amount, and geography. Property types include single family residences and second trust deeds where the Company held the first liens, owner occupied as well as non-owner occupied properties. The Company utilized its underwriting guidelines for first liens to underwrite the Green Loan secured by second trust deeds as if the combined loans were a single Green Loan. For all Green Loans, the loan income was underwritten using either full income documentation or alternative income documentation.
Interest Only Loans
Interest only loans are primarily SFR mortgage loans with payment features that allow interest only payment in initial periods before converting to a fully amortizing loan. Interest only loans totaled
$753.1 million
at
December 31, 2018
, an
increase
of
$35.6 million
, or
5.0 percent
, from
$717.5 million
at
December 31, 2017
. The increase was primarily due to originations of
$252.8 million
, partially offset by paydowns and amortization of
$143.4 million
and loans transferred to held-for-sale of
$73.8 million
. As of December 31, 2018, all of these loans held for sale were sold. As of
December 31, 2018
and
2017
,
$0
and
$1.2 million
of the Interest only loans were non-performing, respectively.
Loans with the Potential for Negative Amortization
Negative amortization loans
decrease
d by
$146 thousand
, or
4.0
percent, to
$3.5 million
as of
December 31, 2018
from
$3.7 million
as of
December 31, 2017
. The Company discontinued origination of negative amortization loans in 2007. At
December 31, 2018
and
2017
,
none
of the loans with the potential for negative amortization were non-performing. These loans pose a potentially higher credit risk because of the lack of principal amortization and potential for negative amortization. However, management believes the risk is mitigated through the loan terms and underwriting standards, including the Company’s policies on LTV ratios.
76
Non-Traditional Mortgage Loan Credit Risk Management
The Company performs detailed reviews of collateral values on loans collateralized by residential real property included in its NTM portfolio based on appraisals or estimates from third party AVMs to analyze property value trends periodically. AVMs are used to identify loans that have experienced potential collateral deterioration. Once a loan has been identified that may have experienced collateral deterioration, the Company will obtain updated drive by or full appraisals in order to confirm the valuation. This information is used to update key monitoring metrics such as LTV ratios. Additionally, FICO scores are obtained in conjunction with the collateral analysis. In addition to LTV ratios and FICO scores, the Company evaluates the portfolio on a specific loan basis through delinquency and portfolio charge-offs to determine whether any risk mitigation or portfolio management actions are warranted. The borrowers may be contacted as necessary to discuss material changes in loan performance or credit metrics.
The Company’s risk management policy and credit monitoring includes reviewing delinquency, FICO scores, and LTV ratios on the NTM loan portfolio. The Company also continuously monitors market conditions for our geographic lending areas. The Company has determined that the most significant performance indicators for NTM are LTV ratios and FICO scores. The loan review provides an effective method of identifying borrowers who may be experiencing financial difficulty before they fail to make a loan payment. Upon receipt of the updated FICO scores, an exception report is run to identify loans with a decrease in FICO score of 10 percent or more and a resulting FICO score of 620 or less. The loans are then further analyzed to determine if the risk rating should be downgraded, which may require an increase in the ALLL the Company needs to establish for potential losses. A report is prepared and regularly monitored.
The Company proactively manages the portfolio by performing a detailed analysis with emphasis on the non-traditional mortgage portfolio. The Company conducts regular meetings to review the loans classified as special mention, substandard, or doubtful and determines whether suspension or reduction in credit limit is warranted. If the line has been suspended and the borrower would like to have their credit privileges reinstated, they would need to provide updated financials showing their ability to meet their payment obligations. During the year ended
December 31, 2018
, the Company made
no
curtailment in available commitments on Green Loans.
On the interest only loans, the Company projects future payment changes to determine if there will be an increase in payment of 3.50 percent or greater and then monitors the loans for possible delinquencies. The individual loans are monitored for possible downgrading of risk rating, and trends within the portfolio are identified that could affect other interest only loans scheduled for payment changes in the near future.
NTM loans may entail greater risk than do traditional SFR mortgage loans. For additional information regarding NTMs, see "Non-Traditional Mortgage Loans" under Note 5 to Consolidated Financial Statements included Item 8 of this Annual Report on Form 10-K.
77
Asset Quality
Past Due Loans and Leases
The following table presents a summary of total loans and leases that were past due at least 30 days but less than 90 days as of the dates indicated:
|
December 31,
|
||||||||||||||||||||
|
($ in thousands)
|
2018
|
2017
|
2016
|
2015
|
2014
|
|||||||||||||||
|
Commercial:
|
||||||||||||||||||||
|
Commercial and industrial
|
$
|
1,946
|
|
$
|
3,731
|
|
$
|
875
|
|
$
|
5,007
|
|
$
|
116
|
|
|||||
|
Commercial real estate
|
582
|
|
—
|
|
—
|
|
—
|
|
2,237
|
|
||||||||||
|
Multifamily
|
356
|
|
—
|
|
—
|
|
223
|
|
1,280
|
|
||||||||||
|
SBA
|
628
|
|
3,578
|
|
549
|
|
711
|
|
960
|
|
||||||||||
|
Construction
|
939
|
|
—
|
|
1,529
|
|
—
|
|
—
|
|
||||||||||
|
Lease financing
|
—
|
|
—
|
|
—
|
|
3,046
|
|
1,091
|
|
||||||||||
|
Consumer:
|
||||||||||||||||||||
|
Single family residential mortgage
|
18,528
|
|
21,171
|
|
31,309
|
|
71,239
|
|
52,259
|
|
||||||||||
|
Other consumer
|
3,705
|
|
3,607
|
|
10,956
|
|
11
|
|
392
|
|
||||||||||
|
Total
|
$
|
26,684
|
|
$
|
32,087
|
|
$
|
45,218
|
|
$
|
80,237
|
|
$
|
58,335
|
|
|||||
The following table presents a summary of traditional loans and leases that were past due at least 30 days but less than 90 days as of the dates indicated:
|
December 31,
|
||||||||||||||||||||
|
($ in thousands)
|
2018
|
2017
|
2016
|
2015
|
2014
|
|||||||||||||||
|
Commercial:
|
||||||||||||||||||||
|
Commercial and industrial
|
$
|
1,946
|
|
$
|
3,731
|
|
$
|
875
|
|
$
|
5,007
|
|
$
|
116
|
|
|||||
|
Commercial real estate
|
582
|
|
—
|
|
—
|
|
—
|
|
2,237
|
|
||||||||||
|
Multifamily
|
356
|
|
—
|
|
—
|
|
223
|
|
1,280
|
|
||||||||||
|
SBA
|
628
|
|
3,578
|
|
17
|
|
162
|
|
82
|
|
||||||||||
|
Construction
|
939
|
|
—
|
|
1,529
|
|
—
|
|
—
|
|
||||||||||
|
Lease financing
|
—
|
|
—
|
|
—
|
|
3,046
|
|
1,091
|
|
||||||||||
|
Consumer:
|
||||||||||||||||||||
|
Single family residential mortgage
|
10,481
|
|
10,232
|
|
12,570
|
|
19,649
|
|
25,063
|
|
||||||||||
|
Other consumer
|
3,705
|
|
3,607
|
|
10,956
|
|
11
|
|
98
|
|
||||||||||
|
Total
|
$
|
18,637
|
|
$
|
21,148
|
|
$
|
25,947
|
|
$
|
28,098
|
|
$
|
29,967
|
|
|||||
Traditional loans and leases that were past due at least 30 days but less than 90 days totaled
$18.6 million
at
December 31, 2018
,
a decrease
of
$2.5 million
, or
11.9 percent
, from
$21.1 million
at
December 31, 2017
. The decrease was mainly due to decreases in commercial and industrial and SBA loans, partially offset by increases in construction, commercial real estate, multifamily, SFR mortgage and other consumer loans.
The decrease in SFR mortgage loan delinquencies during the years ended December 31, 2017 and 2016 was mainly due to sales of SFR mortgage loan pools during the years ended December 31, 2017 and 2016. The Company did not have any outstanding seasoned SFR mortgage loan pools at
December 31, 2018
or 2017.
78
The following table presents a summary of NTM loans that were past due at least 30 days but less than 90 days as of the dates indicated:
|
December 31,
|
||||||||||||||||||||
|
($ in thousands)
|
2018
|
2017
|
2016
|
2015
|
2014
|
|||||||||||||||
|
Green Loans (HELOC) - first liens
|
$
|
4,099
|
|
$
|
5,999
|
|
$
|
—
|
|
$
|
7,913
|
|
$
|
8,853
|
|
|||||
|
Interest only - first liens
|
3,948
|
|
4,940
|
|
4,193
|
|
3,935
|
|
1,580
|
|
||||||||||
|
Negative amortization
|
—
|
|
—
|
|
—
|
|
—
|
|
—
|
|
||||||||||
|
Total NTM - first liens
|
8,047
|
|
10,939
|
|
4,193
|
|
11,848
|
|
10,433
|
|
||||||||||
|
Green Loans (HELOC) - second liens
|
—
|
|
—
|
|
—
|
|
—
|
|
294
|
|
||||||||||
|
Total NTM - second liens
|
—
|
|
—
|
|
—
|
|
—
|
|
294
|
|
||||||||||
|
Total NTM loans
|
$
|
8,047
|
|
$
|
10,939
|
|
$
|
4,193
|
|
$
|
11,848
|
|
$
|
10,727
|
|
|||||
There were 5 Green Loans that were past due at least 30 days but less than 90 days at
December 31, 2018
.
The following table presents a summary of PCI loans that were past due at least 30 days but less than 90 days as of the dates indicated:
|
December
31,
|
||||||||||||||||||||
|
($ in thousands)
|
2018
|
2017
|
2016
|
2015
|
2014
|
|||||||||||||||
|
Commercial:
|
||||||||||||||||||||
|
SBA
|
$
|
—
|
|
$
|
—
|
|
$
|
532
|
|
$
|
549
|
|
$
|
878
|
|
|||||
|
Consumer:
|
||||||||||||||||||||
|
Single family residential mortgage
|
—
|
|
—
|
|
14,546
|
|
39,742
|
|
16,763
|
|
||||||||||
|
Total
|
$
|
—
|
|
$
|
—
|
|
$
|
15,078
|
|
$
|
40,291
|
|
$
|
17,641
|
|
|||||
The Company did not have any outstanding PCI loans at
December 31, 2018
or 2017.
79
Non-Performing Assets
The following table presents a summary of non-performing assets, excluding loans held-for-sale, as of the dates indicated:
|
December
31,
|
||||||||||||||||||||
|
($ in thousands)
|
2018
|
2017
|
2016
|
2015
|
2014
|
|||||||||||||||
|
Commercial:
|
||||||||||||||||||||
|
Commercial and industrial
|
$
|
5,455
|
|
$
|
3,723
|
|
$
|
3,544
|
|
$
|
4,383
|
|
$
|
7,143
|
|
|||||
|
Commercial real estate
|
—
|
|
—
|
|
—
|
|
1,552
|
|
1,017
|
|
||||||||||
|
Multifamily
|
—
|
|
—
|
|
—
|
|
642
|
|
1,834
|
|
||||||||||
|
SBA
|
2,574
|
|
1,781
|
|
619
|
|
422
|
|
285
|
|
||||||||||
|
Construction
|
—
|
|
—
|
|
—
|
|
—
|
|
—
|
|
||||||||||
|
Lease financing
|
—
|
|
—
|
|
109
|
|
598
|
|
100
|
|
||||||||||
|
Consumer:
|
||||||||||||||||||||
|
Single family residential mortgage
|
12,929
|
|
9,347
|
|
10,287
|
|
37,318
|
|
27,753
|
|
||||||||||
|
Other consumer
|
627
|
|
4,531
|
|
383
|
|
214
|
|
249
|
|
||||||||||
|
Total non-accrual loans and leases
|
21,585
|
|
19,382
|
|
14,942
|
|
45,129
|
|
38,381
|
|
||||||||||
|
Loans past due over 90 days or more and still on accrual
|
470
|
|
—
|
|
—
|
|
—
|
|
—
|
|
||||||||||
|
Other real estate owned
|
672
|
|
1,796
|
|
2,502
|
|
1,097
|
|
423
|
|
||||||||||
|
Total non-performing assets
|
$
|
22,727
|
|
$
|
21,178
|
|
$
|
17,444
|
|
$
|
46,226
|
|
$
|
38,804
|
|
|||||
|
Performing troubled debt restructured loans
|
$
|
5,745
|
|
$
|
5,646
|
|
$
|
4,827
|
|
$
|
7,842
|
|
$
|
6,346
|
|
|||||
The increase in non-accrual commercial and industrial loans in 2018 was mainly due to two loans, which were individually evaluated for impairment, with a carrying value of
$1.9 million
at
December 31, 2018
. The increase in single family residential mortgage loans in 2018 was mainly due to two loans, which were individually evaluated for impairment, with a carrying value of
$5.3 million
at
December 31, 2018
. The decrease in non-accrual other consumer loans in 2018 was mainly due to the sale of the
$4.4 million
loan during the year ended December 31, 2018 which was classified as non-accrual as of
December 31, 2017
. The increase in non-accrual other consumer loans in 2017 was mainly due to one loan, which was individually evaluated for impairment, with a carrying value of
$4.4 million
at
December 31, 2017
.
With respect to loans that were on non-accrual status as of
December 31, 2018
, the gross interest income that would have been recorded during the year ended
December 31, 2018
had such loans and leases been current in accordance with their original terms and been outstanding throughout the year ended
December 31, 2018
(or since origination, if held for part of the year ended
December 31, 2018
), was
$1.3 million
. The amount of interest income on such loans that was included in net income for the year ended
December 31, 2018
was $
280 thousand
.
The following table presents a summary of non-performing NTM loans that are included in the above table as of the dates indicated:
|
December 31,
|
||||||||||||||||||||
|
($ in thousands)
|
2018
|
2017
|
2016
|
2015
|
2014
|
|||||||||||||||
|
Green Loans (HELOC) - first liens
|
$
|
—
|
|
$
|
—
|
|
$
|
—
|
|
$
|
10,088
|
|
$
|
12,334
|
|
|||||
|
Interest only - first liens
|
—
|
|
1,171
|
|
467
|
|
4,615
|
|
2,049
|
|
||||||||||
|
Negative amortization
|
—
|
|
—
|
|
—
|
|
—
|
|
—
|
|
||||||||||
|
Total NTM - first liens
|
—
|
|
1,171
|
|
467
|
|
14,703
|
|
14,383
|
|
||||||||||
|
Green Loans (HELOC) - second liens
|
—
|
|
—
|
|
—
|
|
—
|
|
209
|
|
||||||||||
|
Total NTM - second liens
|
—
|
|
—
|
|
—
|
|
—
|
|
209
|
|
||||||||||
|
Total NTM loans
|
$
|
—
|
|
$
|
1,171
|
|
$
|
467
|
|
$
|
14,703
|
|
$
|
14,592
|
|
|||||
The Company did not have any non-performing NTM loans at
December 31, 2018
.
80
Troubled Debt Restructured Loans
Loans that the Company modifies or restructures where the debtor is experiencing financial difficulties and makes a concession to the borrower in the form of changes in the amortization terms, reductions in the interest rates, the acceptance of interest only payments and, in limited cases, reductions in the outstanding loan balances are classified as troubled debt restructurings (TDRs). TDRs are loans modified for the purpose of alleviating temporary impairments to the borrower’s financial condition. A workout plan between a borrower and the Company is designed to provide a bridge for the cash flow shortfalls in the near term. If the borrower works through the near term issues, in most cases, the original contractual terms of the loan will be reinstated.
At
December 31, 2018
and 2017, the Company had
13
and
12
loans, respectively, with an aggregate balance of
$8.0 million
and
$8.3 million
, respectively, classified as TDRs. When a loan becomes a TDR the Company ceases accruing interest, and classifies it as non-accrual until the borrower demonstrates that the loan is again performing.
At
December 31, 2018
, of the
13
loans classified as TDRs,
12
loans totaling
$5.7 million
were making payments according to their modified terms and were less than 90-days delinquent under the modified terms and were in accruing status. At December 31, 2017, of the
12
loans classified as TDRs,
11
loans totaling
$5.6 million
were making payments according to their modified terms and were less than 90-days delinquent under the modified terms and were in accruing status.
81
Risk Ratings
Federal regulations provide for the classification of loans and leases and other assets, such as debt and equity securities considered to be of lesser quality, as substandard, doubtful or loss. An asset is considered substandard if it is inadequately protected by the current net worth and paying capacity of the obligor or of the collateral pledged, if any. Substandard assets include those characterized by the distinct possibility that the insured institution will sustain some loss if the deficiencies are not corrected. Assets classified as doubtful have all of the weaknesses inherent in those classified substandard, with the added characteristic that the weaknesses present make collection or liquidation in full, on the basis of currently existing facts, conditions, and values, highly questionable and improbable. Assets classified as loss are those considered uncollectible and of such little value that their continuance as assets without the establishment of a specific loss reserve or charge-off is not warranted.
When an insured institution classifies problem assets as either substandard or doubtful, it may establish general allocation allowances for loan and lease losses in an amount deemed prudent by management and approved by the Board of Directors. General allocation allowances represent loss allowances which have been established to recognize the inherent risk associated with lending activities, but, unlike specific allowances, have not been allocated to particular problem assets. When an insured institution classifies problem assets as loss, it is required either to establish a specific allocation allowance for losses equal to 100 percent of that portion of the asset so classified or to charge-off such amount. An institution’s determination as to the classification of its assets and the amount of its specific allocation allowances is subject to review by the OCC, which may order the establishment of additional general or specific loss allocation allowances.
In connection with the filing of the Bank’s periodic reports with the OCC and in accordance with policies for the Bank's classification of assets, the Bank regularly reviews the problem assets in our portfolio to determine whether any assets require classification in accordance with applicable regulations. On the basis of management’s review of assets, at
December 31, 2018
and
2017
, the Company had classified assets (including OREO) totaling
$84.5 million
and
$54.8 million
, respectively. The total amount classified represented
0.79 percent
and
0.53 percent
of the Company’s total assets at
December 31, 2018
and
2017
, respectively.
82
Allowance for Loan and Lease Losses
The Company maintains an ALLL to absorb probable incurred losses inherent in the loan and lease portfolio at the balance sheet date. The ALLL is based on ongoing assessment of the estimated probable losses presently inherent in the loan and lease portfolio. In evaluating the level of the ALLL, management considers the types of loans and leases and the amount of loans and leases in the portfolio, peer group information, historical loss experience, adverse situations that may affect the borrower’s ability to repay, estimated value of any underlying collateral, and prevailing economic conditions. This methodology takes into account many factors, including the Company’s own historical and peer loss trends, loan and lease-level credit quality ratings, loan and lease specific attributes along with a review of various credit metrics and trends. The process involves subjective as well as complex judgments. In addition, the Company uses adjustments for numerous factors including those found in the federal banking agencies' joint Interagency Policy Statement on ALLL, which include current economic conditions, loan and lease seasoning, underwriting experience, and collateral value changes among others. The Company evaluates all impaired loans and leases individually using guidance from ASC 310 primarily through the evaluation of cash flows or collateral values. The Company’s loan segmentation increased from
11
to
13
segments, with the addition of an Indirect Leverage Lending segment and a Warehouse FixNFlip segment. Management concluded these products represented unique credit and risk characteristics to warrant separate segmentation. Additionally, management enhanced the methodology in the areas of qualitative adjustments, and performed an annual update of the loss emergence period. These updates were designed to be systematic, transparent, and repeatable. None of the updates and enhancements made to the ALLL methodology had a material impact on the reserve at December 31, 2018.
At
December 31, 2018
, the Company's ALLL was
$62.2 million
or
0.81 percent
of total loans and leases, as compared to
$49.3 million
, or
0.74 percent
of total loans and leases at
December 31, 2017
. The Company recorded
$30.2 million
,
$13.7 million
and
$5.3 million
, respectively, for the years ended
December 31, 2018
,
2017
and
2016
to its provision for loan and lease losses. The increase in ALLL and provision for loan and lease losses for the year ended
December 31, 2018
as compared to the year ended
December 31, 2017
was mainly due to a
$12.5 million
increase in net charge offs during the year,
15.6 percent
incremental growth in the loan and lease portfolio from the prior year, an increase in classified loans of
97.8 percent
and methodology enhancements implemented throughout the year ended December 31, 2018, such as extension of look-back period, enhancements of qualitative adjustments and loan segmentation, and annual update of the loss emergence period. ALLL for loans and leases collectively evaluated for impairment at December 31, 2018 was $61.4 million, which represented 0.80 percent of the attributable loans and leases, as compared to $48.1 million, or 0.73 percent of attributable loans and leases at December 31, 2017. The ALLL for loans individually evaluated for impairment was $829 thousand at December 31, 2018 compared to $1.2 million at December 31, 2017. The Company held no unallocated ALLL at December 31, 2018 and 2017.
During the three months ended March 31, 2018, the Company recorded a charge-off of
$13.9 million
, which reflected the outstanding balance under a
$15.0 million
line of credit that was originated during the three months ended March 31, 2018. Subsequent to the granting of the line of credit, representations from the borrower in applying for the line of credit were determined by the Bank to be false, and third party bank account statements provided by the borrower to secure the line of credit were found to be fraudulent. The line of credit was granted after the borrower appeared to have satisfied a pre-condition that the line of credit be fully cash collateralized and secured by a bank account at a third party financial institution pledged to the Bank. As part of the Bank’s credit review and portfolio management process, the line of credit and disbursements were reviewed subsequent to closing and compliance with the borrower’s covenants was monitored. As part of this process, on March 9, 2018, the Bank received information that caused it to believe the existence of the pledged bank account had been misrepresented by the borrower and that the account had previously been closed. The Bank filed an action in federal court pursuing the borrower and other parties and is also considering other available sources of collection and other potential means of mitigating the loss; however, no assurance can be given that it will be successful in this regard. Upon extensive review of the underwriting process for this loan, the Bank determined that this loan was the result of an isolated event of external fraud.
The increase in ALLL and provision for loan and lease losses for the year ended December 31, 2017 as compared to the year ended December 31, 2016 was mainly driven by a $4.5 million increase in net charge offs during the year, as well as 10 percent incremental growth in the loan and lease portfolio from the prior year.
83
The following table presents the risk categories for total loans and leases as of
December 31, 2018
:
|
December 31, 2018
|
||||||||||||||||||||
|
($ in thousands)
|
Pass
|
Special Mention
|
Substandard
|
Doubtful
|
Total
|
|||||||||||||||
|
NTM loans:
|
||||||||||||||||||||
|
Single family residential mortgage
|
$
|
811,056
|
|
$
|
10,966
|
|
$
|
2,296
|
|
$
|
—
|
|
$
|
824,318
|
|
|||||
|
Other consumer
|
2,413
|
|
—
|
|
—
|
|
—
|
|
2,413
|
|
||||||||||
|
Total NTM loans
|
813,469
|
|
10,966
|
|
2,296
|
|
—
|
|
826,731
|
|
||||||||||
|
Traditional loans and leases:
|
||||||||||||||||||||
|
Commercial:
|
||||||||||||||||||||
|
Commercial and industrial
|
1,859,569
|
|
41,302
|
|
43,271
|
|
—
|
|
1,944,142
|
|
||||||||||
|
Commercial real estate
|
851,604
|
|
11,376
|
|
4,033
|
|
—
|
|
867,013
|
|
||||||||||
|
Multifamily
|
2,239,301
|
|
—
|
|
1,945
|
|
—
|
|
2,241,246
|
|
||||||||||
|
SBA
|
53,433
|
|
6,114
|
|
8,340
|
|
854
|
|
68,741
|
|
||||||||||
|
Construction
|
197,851
|
|
3,606
|
|
2,519
|
|
—
|
|
203,976
|
|
||||||||||
|
Lease financing
|
—
|
|
—
|
|
—
|
|
—
|
|
—
|
|
||||||||||
|
Consumer:
|
||||||||||||||||||||
|
Single family residential mortgage
|
1,461,721
|
|
2,602
|
|
16,849
|
|
—
|
|
1,481,172
|
|
||||||||||
|
Other consumer
|
66,228
|
|
979
|
|
645
|
|
—
|
|
67,852
|
|
||||||||||
|
Total traditional loans and leases
|
6,729,707
|
|
65,979
|
|
77,602
|
|
854
|
|
6,874,142
|
|
||||||||||
|
Total loans and leases
|
$
|
7,543,176
|
|
$
|
76,945
|
|
$
|
79,898
|
|
$
|
854
|
|
$
|
7,700,873
|
|
|||||
The following table presents the risk categories for total loans and leases as of
December 31, 2017
:
|
December 31, 2017
|
||||||||||||||||||||
|
($ in thousands)
|
Pass
|
Special Mention
|
Substandard
|
Doubtful
|
Total
|
|||||||||||||||
|
NTM loans:
|
||||||||||||||||||||
|
Single family residential mortgage
|
$
|
800,589
|
|
$
|
1,595
|
|
$
|
1,171
|
|
$
|
—
|
|
$
|
803,355
|
|
|||||
|
Other consumer
|
3,578
|
|
—
|
|
—
|
|
—
|
|
3,578
|
|
||||||||||
|
Total NTM loans
|
804,167
|
|
1,595
|
|
1,171
|
|
—
|
|
806,933
|
|
||||||||||
|
Traditional loans and leases:
|
||||||||||||||||||||
|
Commercial:
|
||||||||||||||||||||
|
Commercial and industrial
|
1,651,628
|
|
33,376
|
|
16,947
|
|
—
|
|
1,701,951
|
|
||||||||||
|
Commercial real estate
|
713,131
|
|
—
|
|
4,284
|
|
—
|
|
717,415
|
|
||||||||||
|
Multifamily
|
1,815,601
|
|
540
|
|
—
|
|
—
|
|
1,816,141
|
|
||||||||||
|
SBA
|
72,417
|
|
1,555
|
|
4,621
|
|
106
|
|
78,699
|
|
||||||||||
|
Construction
|
182,960
|
|
—
|
|
—
|
|
—
|
|
182,960
|
|
||||||||||
|
Lease financing
|
13
|
|
—
|
|
—
|
|
—
|
|
13
|
|
||||||||||
|
Consumer:
|
||||||||||||||||||||
|
Single family residential mortgage
|
1,240,866
|
|
2,282
|
|
9,146
|
|
—
|
|
1,252,294
|
|
||||||||||
|
Other consumer
|
98,030
|
|
422
|
|
4,549
|
|
—
|
|
103,001
|
|
||||||||||
|
Total traditional loans and leases
|
5,774,646
|
|
38,175
|
|
39,547
|
|
106
|
|
5,852,474
|
|
||||||||||
|
Total loans and leases
|
$
|
6,578,813
|
|
$
|
39,770
|
|
$
|
40,718
|
|
$
|
106
|
|
$
|
6,659,407
|
|
|||||
84
The following table presents information regarding non-performing assets and activity in the ALLL for the periods indicated:
|
December
31,
|
||||||||||||||||||||
|
($ in thousands)
|
2018
|
2017
|
2016
|
2015
|
2014
|
|||||||||||||||
|
Loans past due over 90 days or more still on accrual
|
$
|
470
|
|
$
|
—
|
|
$
|
—
|
|
$
|
—
|
|
$
|
—
|
|
|||||
|
Non-accrual loans and leases
|
21,585
|
|
19,382
|
|
14,942
|
|
45,129
|
|
38,381
|
|
||||||||||
|
Total non-performing loans and leases
|
22,055
|
|
19,382
|
|
14,942
|
|
45,129
|
|
38,381
|
|
||||||||||
|
Other real estate owned
|
672
|
|
1,796
|
|
2,502
|
|
1,097
|
|
423
|
|
||||||||||
|
Total non-performing assets
|
$
|
22,727
|
|
$
|
21,178
|
|
$
|
17,444
|
|
$
|
46,226
|
|
$
|
38,804
|
|
|||||
|
Allowance for loan and lease losses
|
||||||||||||||||||||
|
Balance at beginning of year
|
$
|
49,333
|
|
$
|
40,444
|
|
$
|
35,533
|
|
$
|
29,480
|
|
$
|
18,805
|
|
|||||
|
Charge-offs
|
(18,499
|
)
|
(5,581
|
)
|
(2,618
|
)
|
(1,942
|
)
|
(923
|
)
|
||||||||||
|
Recoveries
|
1,143
|
|
771
|
|
2,258
|
|
526
|
|
1,235
|
|
||||||||||
|
Transfer of loans to held-for-sale
|
—
|
|
—
|
|
—
|
|
—
|
|
(613
|
)
|
||||||||||
|
Provision for loan and lease losses
|
30,215
|
|
13,699
|
|
5,271
|
|
7,469
|
|
10,976
|
|
||||||||||
|
Balance at end of year
|
$
|
62,192
|
|
$
|
49,333
|
|
$
|
40,444
|
|
$
|
35,533
|
|
$
|
29,480
|
|
|||||
|
Non-performing loans and leases to total loans and leases
|
0.29
|
%
|
0.29
|
%
|
0.25
|
%
|
0.87
|
%
|
0.97
|
%
|
||||||||||
|
Non-performing assets to total assets
|
0.21
|
%
|
0.21
|
%
|
0.16
|
%
|
0.56
|
%
|
0.65
|
%
|
||||||||||
|
Non-performing loans and leases to ALLL
|
35.46
|
%
|
39.29
|
%
|
36.94
|
%
|
127.01
|
%
|
130.19
|
%
|
||||||||||
|
ALLL to non-performing loans and leases
|
281.99
|
%
|
254.53
|
%
|
270.67
|
%
|
78.74
|
%
|
76.81
|
%
|
||||||||||
|
ALLL to total loans and leases
|
0.81
|
%
|
0.74
|
%
|
0.67
|
%
|
0.69
|
%
|
0.75
|
%
|
||||||||||
|
Net charge-offs (recoveries) to average total loans and leases
|
0.25
|
%
|
0.07
|
%
|
0.01
|
%
|
0.03
|
%
|
(0.01
|
)%
|
||||||||||
The following table presents the ALLL allocation among loan and lease origination types as of the dates indicated:
|
December
31,
|
||||||||||||||||||||
|
($ in thousands)
|
2018
|
2017
|
2016
|
2015
|
2014
|
|||||||||||||||
|
Loan breakdown by origination type:
|
||||||||||||||||||||
|
Originated loans and leases
|
$
|
7,105,171
|
|
$
|
5,988,101
|
|
$
|
4,943,549
|
|
$
|
3,148,182
|
|
$
|
1,921,527
|
|
|||||
|
Acquired loans not impaired at acquisition
|
595,702
|
|
671,306
|
|
927,422
|
|
1,128,503
|
|
1,416,118
|
|
||||||||||
|
Non-impaired seasoned SFR mortgage loan pools
|
—
|
|
—
|
|
21,955
|
|
194,978
|
|
364,580
|
|
||||||||||
|
Acquired with deteriorated credit quality
|
—
|
|
—
|
|
141,826
|
|
712,731
|
|
246,897
|
|
||||||||||
|
Total loans and leases
|
$
|
7,700,873
|
|
$
|
6,659,407
|
|
$
|
6,034,752
|
|
$
|
5,184,394
|
|
$
|
3,949,122
|
|
|||||
|
ALLL breakdown by origination type:
|
||||||||||||||||||||
|
Originated loans and leases
|
$
|
61,255
|
|
$
|
48,110
|
|
$
|
38,531
|
|
$
|
33,082
|
|
$
|
26,551
|
|
|||||
|
Acquired loans not impaired at acquisition
|
937
|
|
1,223
|
|
1,703
|
|
2,245
|
|
2,906
|
|
||||||||||
|
Non-impaired seasoned SFR mortgage loan pools
|
—
|
|
—
|
|
106
|
|
—
|
|
—
|
|
||||||||||
|
Acquired with deteriorated credit quality
|
—
|
|
—
|
|
104
|
|
206
|
|
23
|
|
||||||||||
|
Total ALLL
|
$
|
62,192
|
|
$
|
49,333
|
|
$
|
40,444
|
|
$
|
35,533
|
|
$
|
29,480
|
|
|||||
|
Discount on purchased/acquired Loans:
|
||||||||||||||||||||
|
Acquired loans not impaired at acquisition
|
$
|
11,645
|
|
$
|
14,943
|
|
$
|
17,820
|
|
$
|
21,366
|
|
$
|
17,866
|
|
|||||
|
Non-impaired seasoned SFR mortgage loan pools
|
—
|
|
—
|
|
1,280
|
|
12,545
|
|
29,955
|
|
||||||||||
|
Acquired with deteriorated credit quality
|
—
|
|
—
|
|
22,454
|
|
68,372
|
|
55,865
|
|
||||||||||
|
Total discount
|
$
|
11,645
|
|
$
|
14,943
|
|
$
|
41,554
|
|
$
|
102,283
|
|
$
|
103,686
|
|
|||||
|
Percentage of ALLL to:
|
||||||||||||||||||||
|
Originated loans and leases
|
0.86
|
%
|
0.80
|
%
|
0.78
|
%
|
1.05
|
%
|
1.38
|
%
|
||||||||||
|
Originated loans and leases and acquired loans not impaired at acquisition
|
0.81
|
%
|
0.74
|
%
|
0.69
|
%
|
0.83
|
%
|
0.88
|
%
|
||||||||||
|
Total loans and leases:
|
0.81
|
%
|
0.74
|
%
|
0.67
|
%
|
0.69
|
%
|
0.75
|
%
|
||||||||||
85
The following table presents the ALLL allocation among loans and leases portfolio as of the dates indicated:
|
December
31,
|
|||||||||||||||||||||||||||||||||||
|
2018
|
2017
|
2016
|
2015
|
2014
|
|||||||||||||||||||||||||||||||
|
($ in thousands)
|
ALLL Amount
|
Percentage of Loans to Total Loans
|
ALLL Amount
|
Percentage of Loans to Total Loans
|
ALLL Amount
|
Percentage of Loans to Total Loans
|
ALLL Amount
|
Percentage of Loans to Total Loans
|
ALLL Amount
|
Percentage of Loans to Total Loans
|
|||||||||||||||||||||||||
|
Commercial:
|
|||||||||||||||||||||||||||||||||||
|
Commercial and industrial
|
$
|
18,191
|
|
25.2
|
%
|
$
|
14,280
|
|
25.5
|
%
|
$
|
7,584
|
|
25.2
|
%
|
$
|
5,850
|
|
16.9
|
%
|
$
|
6,910
|
|
12.4
|
%
|
||||||||||
|
Commercial real estate
|
6,674
|
|
11.3
|
%
|
4,971
|
|
10.8
|
%
|
5,467
|
|
12.1
|
%
|
4,252
|
|
14.0
|
%
|
3,840
|
|
25.3
|
%
|
|||||||||||||||
|
Multifamily
|
17,970
|
|
29.2
|
%
|
13,265
|
|
27.3
|
%
|
11,376
|
|
22.6
|
%
|
6,012
|
|
17.5
|
%
|
7,179
|
|
24.2
|
%
|
|||||||||||||||
|
SBA
|
1,827
|
|
0.9
|
%
|
1,701
|
|
1.2
|
%
|
939
|
|
1.2
|
%
|
683
|
|
1.1
|
%
|
335
|
|
0.9
|
%
|
|||||||||||||||
|
Construction
|
3,461
|
|
2.6
|
%
|
3,318
|
|
2.7
|
%
|
2,015
|
|
2.1
|
%
|
1,530
|
|
1.1
|
%
|
846
|
|
1.1
|
%
|
|||||||||||||||
|
Lease financing
|
—
|
|
—
|
%
|
—
|
|
—
|
%
|
6
|
|
0.1
|
%
|
2,195
|
|
3.7
|
%
|
873
|
|
2.2
|
%
|
|||||||||||||||
|
Consumer:
|
|||||||||||||||||||||||||||||||||||
|
Single family residential mortgage
|
13,128
|
|
29.9
|
%
|
10,996
|
|
30.9
|
%
|
12,075
|
|
34.9
|
%
|
13,854
|
|
43.5
|
%
|
7,192
|
|
29.7
|
%
|
|||||||||||||||
|
Other consumer
|
941
|
|
0.9
|
%
|
802
|
|
1.6
|
%
|
982
|
|
1.8
|
%
|
1,157
|
|
2.2
|
%
|
2,305
|
|
4.2
|
%
|
|||||||||||||||
|
Unallocated
|
—
|
|
—
|
|
—
|
|
—
|
|
—
|
|
|||||||||||||||||||||||||
|
Total
|
$
|
62,192
|
|
100.0
|
%
|
$
|
49,333
|
|
100.0
|
%
|
$
|
40,444
|
|
100.0
|
%
|
$
|
35,533
|
|
100.0
|
%
|
$
|
29,480
|
|
100.0
|
%
|
||||||||||
86
Premises and equipment, net
Premises and equipment, net of accumulated depreciation totaled
$129.4 million
at
December 31, 2018
,
a decrease
of
$6.3 million
, or
4.6 percent
, from
$135.7 million
at
December 31, 2017
. The
decrease
was primarily due to depreciation, disposals, and impairments of certain assets. The Company recognized depreciation expense of
$10.9 million
,
$12.4 million
and
$11.7 million
for the years ended
December 31, 2018
,
2017
, and
2016
, respectively.
During each of the years ended
December 31, 2018
and
2017
, the Company recorded an impairment loss of
$2.0 million
on previously capitalized software projects that were abandoned.
For additional information, see Note 6 to Consolidated Financial Statements included in item 8 of this Annual Report on Form 10-K.
Servicing Rights
Total mortgage and SBA servicing rights were
$3.4 million
and
$33.7 million
at
December 31, 2018
and
2017
, respectively. The fair value of the MSRs amounted to
$1.8 million
and
$31.9 million
and the amortized cost of the SBA servicing rights was
$1.7 million
and
$1.9 million
at
December 31, 2018
and
2017
, respectively. The Company retains servicing rights from certain sales of SFR mortgage loans and SBA loans.
The aggregate principal balance of the loans underlying total MSRs and SBA servicing rights was
$204.0 million
and
$96.4 million
, respectively, at
December 31, 2018
and
$3.94 billion
and
$101.0 million
, respectively, at
December 31, 2017
. The recorded amount of the MSR and SBA servicing rights as a percentage of the unpaid principal balance of the loans we are servicing was
0.87 percent
and
1.72 percent
, respectively, at
December 31, 2018
as compared to
0.81 percent
and
1.84 percent
, respectively, at
December 31, 2017
.
During the first half of 2018, the Company sold
$28.5 million
of MSRs on approximately
$3.55 billion
in unpaid principal
balances of conventional agency mortgage loans for cash consideration of
$30.1 million
, subject to prepayment protection
provision and standard representations and warranties. The sale of MSRs resulted in a net loss of
$2.3 million
for the year ended December 31, 2018, primarily related to transaction costs, provision for early repayments of loans, and expected repurchase obligations under standard representations and warranties.
The Company sold
$37.8 million
of MSRs as a part of discontinued operations during the three months ended March 31, 2017 and classified MSRs of
$29.8 million
as held-for-sale at December 31, 2017.
For additional information, see Note 7 to Consolidated Financial Statements included in item 8 of this Annual Report on Form 10-K.
Goodwill and other intangible assets
The Company had goodwill of
$37.1 million
at
December 31, 2018
and
2017
. Goodwill was allocated between the Commercial Banking and Mortgage Banking segments using a relative fair value approach in connection with the Company's realignment of segment reporting at December 31, 2014. The carrying values of goodwill allocated to the reportable segments were
$37.1 million
and
$2.1 million
to the Commercial Banking segment and Mortgage Banking segment, respectively, at December 31, 2016. During the year ended December 31, 2017, the Company discontinued its mortgage banking operations and wrote off goodwill of
$2.1 million
, which was previously allocated to its Mortgage Banking segment, against the gain on disposal of discontinued operations.
The Company conducts its evaluation of goodwill impairment as of August 31 each year, and more frequently if events or circumstances indicate that there may be impairment. The Company completed its annual goodwill impairment test as of August 31, 2018 and determined that
no
goodwill impairment existed.
The Company had core deposit intangibles of
$6.3 million
and
$9.4 million
at
December 31, 2018
and 2017, respectively. Core deposit intangibles are amortized over their useful lives ranging from 4 to 10 years. As of
December 31, 2018
, the weighted-average remaining amortization period for core deposit intangibles was approximately
5.3 years
.
The Company recorded impairment on intangible assets of
$0
,
$336 thousand
, and
$690 thousand
for the years ended
December 31, 2018
,
2017
, and
2016
, respectively. During the year ended December 31, 2017, the Company also wrote off a customer relationship intangible of
$246 thousand
and a trade name intangible of
$90 thousand
related to RenovationReady. RenovationReady was acquired in 2014 and provided specialized loan services to financial institutions and mortgage bankers that originate agency eligible residential renovation and construction loan products. During the year ended December 31, 2016, the Company ceased using the CS Financial trade name and wrote off the related trade name intangible of
$690 thousand
. CS Financial is a mortgage banking firm, which the Bank acquired in 2013.
For additional information, see Note 9 to Consolidated Financial Statements included in item 8 of this Annual Report on Form 10-K.
87
Alternative Energy Partnerships
The following table presents the activity related to the Company’s investment in alternative energy partnerships for the years ended
December 31, 2018
and
2017
:
|
Year Ended December
31,
|
||||||||
|
($ in thousands)
|
2018
|
2017
|
||||||
|
Balance at beginning of period
|
$
|
48,826
|
|
$
|
25,639
|
|
||
|
New funding
|
—
|
|
55,377
|
|
||||
|
Return of unused capital
|
(1,027
|
)
|
—
|
|
||||
|
Cash distribution from investments
|
(13,767
|
)
|
(1,404
|
)
|
||||
|
Loss on investments using HLBV method
|
(5,044
|
)
|
(30,786
|
)
|
||||
|
Balance at end of period
|
$
|
28,988
|
|
$
|
48,826
|
|
||
|
Unfunded equity commitments
|
$
|
—
|
|
$
|
50,084
|
|
||
The Company’s investments in alternative energy partnerships are primarily returned through the realization of energy tax credits and other tax benefits rather than through distributions or through the sale of the investment. During the year ended
December 31, 2018
, the Company recognized energy tax credits of
$9.6 million
, offset by
$1.0 million
of tax expenses from tax basis reduction in connection with new equipment being placed into service as well as income tax benefits of
$1.4 million
(based on a current effective tax rate of
27.4 percent
, which excludes the foregoing energy tax credits and related deferred tax expense) related to the recognition of its loss through its HLBV application. During the year ended
December 31, 2017
, the Company recognized energy tax credits of
$38.2 million
, offset by
$6.7 million
of tax expense from tax basis reduction as well as income tax benefits of
$12.1 million
(based on a current effective tax rate of
39.5 percent
, which excludes the foregoing energy tax credits and related deferred tax expense) related to the recognition of its loss through its HLBV application. The HLBV loss for the period is largely driven by accelerated tax depreciation on equipment and the recognition of energy tax credits which reduces the amount distributable by the investee in a hypothetical liquidation under the contractual liquidation provisions.
For additional information, see Note 20 to Consolidated Financial Statements included in Item 8 of this Annual Report on Form 10-K.
88
Deposits
Total deposits were
$7.92 billion
at
December 31, 2018
,
an increase
of
$623.7 million
, or
8.6 percent
, from
$7.29 billion
at
December 31, 2017
. The increase was mainly due to the Company's continuous efforts to build core deposits across the Company's business units, including strong growth from the community banking and private banking channel and increased brokered deposits. As a result, this is one of the factors that caused net interest margin to decline during the year ended December 31, 2018. Brokered deposits were
$1.71 billion
at
December 31, 2018
,
an increase
of
$252.1 million
, or
17.3 percent
, from
$1.46 billion
at
December 31, 2017
. Brokered deposits represented
21.6 percent
and
20.0 percent
of total deposits at
December 31, 2018
and
2017
, respectively. The following table presents the composition of deposits as of
December 31, 2018
and
2017
:
|
December
31,
|
Change
|
||||||||||||||
|
($ in thousands)
|
2018
|
2017
|
Amount
|
Percentage
|
|||||||||||
|
Noninterest-bearing deposits
|
$
|
1,023,360
|
|
$
|
1,071,608
|
|
$
|
(48,248
|
)
|
(4.5
|
)%
|
||||
|
Interest-bearing demand deposits
|
1,556,410
|
|
2,089,016
|
|
(532,606
|
)
|
(25.5
|
)%
|
|||||||
|
Money market accounts
|
873,153
|
|
1,146,859
|
|
(273,706
|
)
|
(23.9
|
)%
|
|||||||
|
Savings accounts
|
1,265,847
|
|
1,059,628
|
|
206,219
|
|
19.5
|
%
|
|||||||
|
Certificates of deposit of $250,000 or less
|
2,388,592
|
|
1,365,452
|
|
1,023,140
|
|
74.9
|
%
|
|||||||
|
Certificates of deposit of more than $250,000
|
809,282
|
|
560,340
|
|
248,942
|
|
44.4
|
%
|
|||||||
|
Total deposits
|
$
|
7,916,644
|
|
$
|
7,292,903
|
|
$
|
623,741
|
|
8.6
|
%
|
||||
The following table presents the scheduled maturities of certificates of deposit as of
December 31, 2018
:
|
($ in thousands)
|
Three Months or Less
|
Over Three Months Through Six Months
|
Over Six Months Through Twelve Months
|
Over One Year
|
Total
|
|||||||||||||||
|
Certificates of deposit of $250,000 or less
|
$
|
802,233
|
|
$
|
972,982
|
|
$
|
243,390
|
|
$
|
369,987
|
|
$
|
2,388,592
|
|
|||||
|
Certificates of deposit of more than $250,000
|
358,935
|
|
99,321
|
|
168,844
|
|
182,182
|
|
809,282
|
|
||||||||||
|
Total certificates of deposit
|
$
|
1,161,168
|
|
$
|
1,072,303
|
|
$
|
412,234
|
|
$
|
552,169
|
|
$
|
3,197,874
|
|
|||||
For additional information, see Note 10 to Consolidated Financial Statements included in Item 8 of this Annual Report on Form 10-K.
Borrowings
Although deposits are the Company's primary source of funds, the Company may utilize borrowings when they are a less costly source of funds and can be invested at a positive interest rate spread, when the Company desires additional capacity to fund loan and lease demand or when they meet the Company's asset/liability management goals to diversify funding sources and enhance the interest rate risk management.
The Company utilizes FHLB advances and securities sold under repurchase agreements to leverage its capital base, to provide funds for its lending activities, to provide a source of liquidity, and to enhance its interest rate risk management. The Company also has the ability to borrow from the Federal Reserve Bank of San Francisco (Federal Reserve Bank), as well as through unsecured federal funds lines with correspondent banks. The Company may obtain advances from the FHLB by collateralizing the advances with certain of the Company’s loans and investment securities. These advances may be made pursuant to several different credit programs, each of which has its own interest rate, range of maturities and call features.
FHLB advances totaled
$1.52 billion
and
$1.70 billion
, respectively, at
December 31, 2018
and
2017
. At
December 31, 2018
,
$805.0 million
of the Bank's advances from FHLB were fixed rate and had interest rates ranging from
1.61 percent
to
3.32 percent
with a weighted-average interest rate of
2.58 percent
, and
$715.0 million
of the Bank's advances from FHLB were variable rate and had a weighted-average interest rate of
2.56 percent
. At
December 31, 2018
and
2017
, the Bank’s advances from the FHLB were collateralized by certain real estate loans with an aggregate unpaid principal balance of
$4.05 billion
and
$2.90 billion
, respectively, and securities with carrying values of
$0
and
$405.6 million
, respectively. The Bank’s investment in capital stock of the FHLB of San Francisco totaled
$41.0 million
and
$48.7 million
, respectively, at
December 31, 2018
and
2017
. Based on this collateral and the Bank’s holdings of FHLB stock, the Bank was eligible to borrow an additional
$1.35 billion
at
December 31, 2018
.
The Company did not have any outstanding securities sold under agreements to repurchase at
December 31, 2018
or
2017
. On June 30, 2017, the Company voluntarily terminated a line of credit of $75.0 million that it maintained at Banc of California,
89
Inc. with an unaffiliated financial institution. The line had a maturity date of July 17, 2017. The Company had $50.0 million of borrowings outstanding under the line, which were repaid in connection with the termination of the line.
The Company entered into a new line of credit for $15.0 million on February 14, 2019, which bears interest at LIBOR plus 2% and is scheduled to mature on February 13, 2020.
For additional information, see Note 11 to Consolidated Financial Statements included Item 8 of this Annual Report on Form 10-K.
90
Long-Term Debt
The following table presents the Company's long-term debt as of the dates indicated:
|
December
31,
|
||||||||||||||||
|
2018
|
2017
|
|||||||||||||||
|
($ in thousands)
|
Par Value
|
Unamortized Debt Issuance Cost and Discount
|
Par Value
|
Unamortized Debt Issuance Cost and Discount
|
||||||||||||
|
5.25% senior notes due April 15, 2025
|
$
|
175,000
|
|
$
|
(1,826
|
)
|
$
|
175,000
|
|
$
|
(2,059
|
)
|
||||
|
Total
|
$
|
175,000
|
|
$
|
(1,826
|
)
|
$
|
175,000
|
|
$
|
(2,059
|
)
|
||||
On April 15, 2016, the Company redeemed all of its outstanding 7.50 percent senior notes due April 15, 2020, which had an aggregate outstanding principal amount of $84.8 million, at a redemption price of 100 percent of the principal amount plus accrued and unpaid interest to the redemption date. On May 15, 2017, the Company made the final installment payment on its 7.50 percent junior subordinated amortizing notes due May 15, 2017.
For additional information, see Note 12 to Consolidated Financial Statements included Item 8 of this Annual Report on Form 10-K.
Reserve for Unfunded Loan Commitments
The Company maintains a reserve for unfunded loan commitments at a level that is considered adequate to cover the estimated and known inherent risks. The probability of usage of the unfunded loan commitments and credit risk factors are determined based on outstanding loans that share similar credit risk exposure. Reserve for unfunded loan commitments totaled
$4.6 million
at
December 31, 2018
,
an increase
of
$906 thousand
, or
24.4 percent
, from
$3.7 million
at
December 31, 2017
. The increase was primarily driven by higher balances in unfunded loan commitments.
The following table presents a summary of activity in the reserve for unfunded loan commitments for the periods indicated:
|
Year Ended December
31,
|
||||||||||||
|
($ in thousands)
|
2018
|
2017
|
2016
|
|||||||||
|
Balance at beginning of period
|
$
|
3,716
|
|
$
|
2,385
|
|
$
|
2,067
|
|
|||
|
Provision for unfunded loan commitments
|
906
|
|
1,331
|
|
318
|
|
||||||
|
Balance at end of period
|
$
|
4,622
|
|
$
|
3,716
|
|
$
|
2,385
|
|
|||
Reserve for Loss on Repurchased Loans
When the Company sells residential mortgage loans into the secondary mortgage market, the Company makes customary representations and warranties to the purchasers about various characteristics of each loan, such as the manner of origination, the nature and extent of underwriting standards applied and the types of documentation being provided. Typically, these representations and warranties are in place for the life of the loan. If a defect in the origination process is identified, the Company may be required to either repurchase the loan or indemnify the purchaser for losses it sustains on the loan. If there are no such defects, generally the Company has no liability to the purchaser for losses it may incur on such loan. In addition, the Company had the option to buy out severely delinquent loans at par from Ginnie Mae pools for which the Company was the servicer and issuer of the pool. The Company maintains a reserve for losses on repurchased loans to account for the expected losses related to loans the Company might be required to repurchase (or the indemnity payments the Company may have to make to purchasers). The reserve takes into account both the estimate of expected losses on loans sold during the current accounting period, as well as adjustments to the previous estimates of expected losses on loans sold. In each case, these estimates are based on the most recent data available, including data from third parties, regarding demand for loan repurchases, actual loan repurchases, and actual credit losses on repurchased loans, among other factors.
Reserve for loss on repurchased loans totaled
$2.5 million
at
December 31, 2018
,
a decrease
of
$3.8 million
, or
60.3 percent
, from
$6.3 million
at
December 31, 2017
. Approximately
$1.5 million
of the decrease was due to portfolio run-off and repurchase settlement activities.
Provisions added to the reserve for loss on repurchased loans are initially recorded against income from discontinued operations at the time of sale, and any subsequent increase or decrease in the provision is then recorded under noninterest expense on the Consolidated Statements of Operations as an increase or decrease to provision for loan repurchases. Initial provisions for loan repurchases were
$126 thousand
,
$1.6 million
and
$3.9 million
, respectively, and subsequent changes in the prevision were
$(2.5) million
,
$(1.8) million
and
$(3.4) million
, respectively, for the years ended
December 31, 2018
,
2017
and
2016
.
91
The Company believes that all repurchase demands received were adequately reserved for at
December 31, 2018
. For additional information, see Note 14 to Consolidated Financial Statements included Item 8 of this Annual Report on Form 10-K.
92
Liquidity Management
The Company is required to maintain sufficient liquidity to ensure a safe and sound operation. Liquidity may increase or decrease depending upon availability of funds and comparative yields on investments in relation to the return on loans. Historically, the Company has maintained liquid assets above levels believed to be adequate to meet the requirements of normal operations, including potential deposit outflows, and dividend payments. Cash flow projections are regularly reviewed and updated to ensure that adequate liquidity is maintained.
Banc of California, N.A.
The Bank's liquidity, represented by cash and cash equivalents and securities available-for-sale, is a product of its operating, investing, and financing activities. The Bank's primary sources of funds are deposits, payments and maturities of outstanding loans and investment securities; sale of loans and investment securities and other short-term investments and funds provided from operations. While scheduled payments from the amortization of loans and investment securities, and maturing investment securities and short-term investments are relatively predictable sources of funds, deposit flows and loan prepayments are greatly influenced by general interest rates, economic conditions, and competition. In addition, the Bank invests excess funds in short-term interest-earning assets, which provide liquidity to meet lending requirements. The Bank also generates cash through borrowings. The Bank mainly utilizes FHLB advances and securities sold under repurchase agreements to leverage its capital base, to provide funds for its lending activities, as a source of liquidity, and to enhance its interest rate risk management. The Bank also has the ability to obtain brokered deposits and collect deposits through its wholesale and treasury operations. Liquidity management is both a daily and long-term function of business management. Any excess liquidity is typically invested in federal funds or investment securities. On a longer-term basis, the Bank maintains a strategy of investing in various lending products. The Bank uses its sources of funds primarily to meet its ongoing loan and other commitments, and to pay maturing certificates of deposit and savings withdrawals.
Banc of California, Inc.
The primary sources of funds for Banc of California, Inc., on a stand-alone holding company basis, are dividends and intercompany tax payments from the Bank, outside borrowing, and its ability to raise capital and issue debt securities. Dividends from the Bank are largely dependent upon the Bank's earnings and are subject to restrictions under certain regulations that limit its ability to transfer funds to the holding company. OCC regulations impose various restrictions on the ability of a bank to make capital distributions, which include dividends, stock redemptions or repurchases, and certain other items. Generally, a well-capitalized bank may make capital distributions during any calendar year equal to up to 100 percent of year-to-date net income plus retained net income for the two preceding years without prior OCC approval. At
December 31, 2018
, the Bank had
$104.3 million
available to pay dividends to Banc of California, Inc. without prior OCC approval. However, any dividend granted by the Bank would be limited by the need to maintain its well capitalized status plus the capital buffer in order to avoid additional dividend restrictions. During the year ended
December 31, 2018
, the Bank paid dividends of
$94.3 million
to Banc of California, Inc. At
December 31, 2018
, Banc of California, Inc. had
$25.3 million
in cash, all of which was on deposit at the Bank.
On a consolidated basis, the Company maintained
$391.6 million
of cash and cash equivalents, which was
3.7 percent
of total assets at
December 31, 2018
. The Company's cash and cash equivalents
increased
by
$3.9 million
, or
1.0 percent
, from
$387.7 million
, or
3.8 percent
of total assets, at
December 31, 2017
. The increase was mainly due to increases in deposits and a decrease in securities, partially offset by an increase in loans, a decrease in FHLB advances and redemption of the Company's Series C Preferred Stock. The Company also strategically decreased its securities portfolio to navigate a volatile rate environment by reducing overall duration by selling longer-duration and fixed rate mortgage-backed securities and corporate debt securities and continued allowing collateralized loan obligations to run off. All of these strategic actions were taken in order to expand core lending activities across the organization, while reducing risk on the Company's balance sheet.
At
December 31, 2018
, the Company had available unused secured borrowing capacities of
$1.35 billion
from FHLB and
$60.6 million
from Federal Reserve Discount Window, as well as
$210.0 million
from unused unsecured federal funds lines of credit. The Company also maintained repurchase agreements and had
no
outstanding securities sold under repurchase agreements at
December 31, 2018
. Availabilities and terms on repurchase agreements are subject to the counterparties' discretion and pledging additional investment securities. The Company had unpledged securities available-for-sale of
$1.83 billion
at
December 31, 2018
. On June 30, 2017, the Company voluntarily terminated a line of credit of $75.0 million that was maintained at Banc of California, Inc. with an unaffiliated financial institution. The line originally had a maturity date of July 17, 2017. The Company had $50.0 million of borrowings outstanding under the line, which were repaid in connection with the termination of the line.
The Company believes that its liquidity sources are stable and are adequate to meet its day-to-day cash flow requirements. As of
December 31, 2018
, the Company believes that there are no events, uncertainties, material commitments, or capital expenditures that were reasonably likely to have a material effect on its liquidity position.
93
Commitments
The following table presents information as of
December 31, 2018
regarding the Company’s commitments and contractual obligations:
|
Commitments and Contractual Obligations
|
||||||||||||||||||||
|
($ in thousands)
|
Total Amount Committed
|
Less Than One Year
|
One to Three Years
|
Three to Five Years
|
More than Five Years
|
|||||||||||||||
|
Commitments to extend credit
|
$
|
290,937
|
|
$
|
65,690
|
|
$
|
172,796
|
|
$
|
11,968
|
|
$
|
40,483
|
|
|||||
|
Unused lines of credit
|
1,120,672
|
|
874,408
|
|
96,773
|
|
42,117
|
|
107,374
|
|
||||||||||
|
Standby letters of credit
|
9,827
|
|
7,084
|
|
2,246
|
|
102
|
|
395
|
|
||||||||||
|
Total commitments
|
$
|
1,421,436
|
|
$
|
947,182
|
|
$
|
271,815
|
|
$
|
54,187
|
|
$
|
148,252
|
|
|||||
|
FHLB advances
|
$
|
1,520,000
|
|
$
|
840,000
|
|
$
|
269,000
|
|
$
|
91,000
|
|
$
|
320,000
|
|
|||||
|
Long-term debt
|
175,000
|
|
—
|
|
—
|
|
—
|
|
175,000
|
|
||||||||||
|
Operating and capital lease obligations
|
31,220
|
|
7,051
|
|
11,057
|
|
5,345
|
|
7,767
|
|
||||||||||
|
Certificates of deposit
|
3,197,874
|
|
2,645,704
|
|
544,606
|
|
7,564
|
|
—
|
|
||||||||||
|
Total contractual obligations
|
$
|
4,924,094
|
|
$
|
3,492,755
|
|
$
|
824,663
|
|
$
|
103,909
|
|
$
|
502,767
|
|
|||||
During the three months ended March 31, 2017, the Bank entered into certain definitive agreements which grant the Bank the exclusive naming rights to the Banc of California Stadium, a soccer stadium of The Los Angeles Football Club (LAFC) as well as the right to be the official bank of LAFC. In exchange for the Bank’s rights as set forth in the agreements, the Bank agreed to pay LAFC
$100.0 million
over a period of
15 years
, beginning in 2017 and ending in 2032. The advertising benefits of such rights are amortized on a straight-line basis and recorded as advertising and promotion expense beginning in 2018. As of
December 31, 2018
, the Bank has paid
$15.3 million
of the
$100.0 million
commitment. The prepaid commitment balance, net of amortization, was
$8.7 million
as of
December 31, 2018
, which was recognized as a prepaid asset and included in Other Assets in the Consolidated Statements of Financial Condition. See Note 26 to Consolidated Financial Statements included Item 8 of this Annual Report on Form 10-K for additional information.
The Company had unfunded commitments of
$11.5 million
,
$8.8 million
, and
$501 thousand
for Affordable Housing Fund Investment, SBIC, and Other Investments at
December 31, 2018
, respectively.
94
Stockholders’ Equity
Stockholders’ equity totaled
$945.5 million
at
December 31, 2018
, a decrease of
$66.8 million
, or
6.6 percent
, from
$1.01 billion
at
December 31, 2017
. The
decrease
was primarily the result of the redemption of the Company's Series C Preferred Stock for an aggregate amount of
$40.3 million
, cash dividends for common stock of
$26.0 million
, cash dividends for preferred stock of
$19.5 million
and
$29.8 million
of other comprehensive loss on securities available-for-sale due primarily to increases in market interest rates, partially offset by net income of $45.5 during the year ended
December 31, 2018
. For additional information, see Note 18 to Consolidated Financial Statements included Item 8 of this Annual Report on Form 10-K.
In order to maintain adequate levels of capital, the Company continuously assesses projected sources and uses of capital to support projected asset growth, operating needs and credit risk. The Company considers, among other things, earnings generated from operations and access to capital from financial markets. In addition, the Company performs capital stress tests on an annual basis to assess the impact of adverse changes in the economy on the Company's capital base.
Regulatory Capital
The Company and the Bank are subject to the regulatory capital adequacy guidelines that are established by the Federal banking regulators. In July 2013, the Federal banking regulators approved a final rule to implement the revised capital adequacy standards of the Basel III and to address relevant provisions of the Dodd-Frank Act. The final rule strengthens the definition of regulatory capital, increases risk-based capital requirements, makes selected changes to the calculation of risk-weighted assets, and adjusts the prompt corrective action thresholds. The Company and the Bank became subject to the new rule on January 1, 2015 and certain provisions of the new rule were phased in through January 1, 2019. Inclusive of the fully phased-in capital conservation buffer, the common equity Tier 1 capital, Tier 1 risk-based capital and total risk-based capital ratio minimums are 7.0%, 8.5% and 10.5%, respectively. For additional information on BASEL III capital rules, see Note 19 to Consolidated Financial Statements included in Item 8 of this Annual Report on Form 10-K. The following table presents the regulatory capital ratios for the Company and the Bank as of dates indicated:
|
Banc of California, Inc.
|
Banc of California, NA
|
Minimum Regulatory Requirements
|
Well-Capitalized Requirements (Bank)
|
|||||||||
|
December 31, 2018
|
||||||||||||
|
Total risk-based capital ratio
|
13.71
|
%
|
15.71
|
%
|
8.00
|
%
|
10.00
|
%
|
||||
|
Tier 1 risk-based capital ratio
|
12.77
|
%
|
14.77
|
%
|
6.00
|
%
|
8.00
|
%
|
||||
|
Common equity tier 1 capital ratio
|
9.53
|
%
|
14.77
|
%
|
4.50
|
%
|
6.50
|
%
|
||||
|
Tier 1 leverage ratio
|
8.95
|
%
|
10.36
|
%
|
4.00
|
%
|
5.00
|
%
|
||||
|
December 31, 2017
|
||||||||||||
|
Total risk-based capital ratio
|
14.56
|
%
|
16.56
|
%
|
8.00
|
%
|
10.00
|
%
|
||||
|
Tier 1 risk-based capital ratio
|
13.79
|
%
|
15.78
|
%
|
6.00
|
%
|
8.00
|
%
|
||||
|
Common equity tier 1 capital ratio
|
9.92
|
%
|
15.78
|
%
|
4.50
|
%
|
6.50
|
%
|
||||
|
Tier 1 leverage ratio
|
9.39
|
%
|
10.67
|
%
|
4.00
|
%
|
5.00
|
%
|
||||
Pursuant to the Dodd-Frank Act and regulations adopted by the federal banking regulators, bank holding companies and banks with average total consolidated assets greater than $10 billion were required to conduct an annual “stress test” of capital and consolidated earnings and losses under the baseline, adverse and severely adverse scenarios provided by the federal banking regulators. On May 24, 2018, the Economic Growth, Regulatory Relief and Consumer Protection Act (the “Economic Growth Act”) was signed into law, which amended portions of the Dodd-Frank Act and immediately raised the asset threshold for company-run stress testing from $10 billion to $100 billion for bank holding companies. As a result, the Company is no longer subject to the Dodd-Frank Act company-run stress testing requirements. On July 6, 2018, the federal banking regulators issued an interagency statement that banks with less than $100 billion in total consolidated assets, including the Bank, would not be required to comply with company-run stress testing requirements until November 25, 2019, at which time such banks will become exempt from company-run stress testing requirements under the Economic Growth Act. In addition, the federal banking regulators have each proposed to amend their stress testing regulations consistent with the Economic Growth Act. The federal banking regulators noted in their July 6, 2018 interagency statement that the capital planning and risk management practices of banks with assets less than $100 billion will continue to be reviewed through the regular supervisory process.
95
Item 7A. Quantitative and Qualitative Disclosures About Market Risk
Our Risk When Interest Rates Change.
The rates of interest we earn on assets and pay on liabilities generally are established contractually for a period of time. Market interest rates change over time. Accordingly, our results of operations, like those of other financial institutions, are impacted by changes in interest rates and the interest rate sensitivity of our assets and liabilities. The risk associated with changes in interest rates and our ability to adapt to these changes is known as interest rate risk and is our most significant market risk.
How We Measure Our Risk of Interest Rate Changes.
As part of our attempt to manage our exposure to changes in interest rates and comply with applicable regulations, we have established an asset/liability committee (ALCO) to monitor our interest rate risk. In monitoring interest rate risk we continually analyze and manage assets and liabilities based on their payment streams and interest rates, the timing of their maturities and/or prepayments, and their sensitivity to actual or potential changes in market interest rates.
We maintain both a management ALCO (Management ALCO), comprised of select members of senior management, and an ALCO of the Company’s Board of Directors (Board ALCO, together with Management ALCO, ALCOs). In order to manage the risk of potential adverse effects of material and prolonged increases in interest rates on our results of operations, we have adopted asset/liability management policies to align maturities and repricing terms of interest-earning assets to interest-bearing liabilities. The asset/liability management policies establish guidelines for the volume and mix of assets and funding sources taking into account relative costs and spreads, interest rate sensitivity and liquidity needs, while the ALCOs monitor adherence to those guidelines. The objectives are to manage assets and funding sources to produce results that are consistent with liquidity, capital adequacy, growth, risk, and profitability goals. The ALCOs meet periodically to review, among other things, economic conditions and interest rate outlook, current and projected liquidity needs and capital position, anticipated changes in the volume and mix of assets and liabilities and interest rate risk exposure limits versus current projections pursuant to our net present value of equity analysis.
In order to manage our assets and liabilities and achieve the desired liquidity, credit quality, interest rate risk, profitability and capital targets, we evaluate various strategies including:
|
•
|
Originating and purchasing adjustable rate mortgage loans,
|
|
•
|
Originating shorter-term consumer loans,
|
|
•
|
Managing the duration of investment securities,
|
|
•
|
Managing our deposits to establish stable deposit relationships,
|
|
•
|
Using FHLB advances and/or certain derivatives such as swaps to align maturities and repricing terms, and
|
|
•
|
Managing the percentage of fixed rate loans in our portfolio.
|
At times, depending on the level of general interest rates, the relationship between long- and short-term interest rates, market conditions and competitive factors, the ALCOs may decide to increase the Company’s interest rate risk position within the asset/liability tolerance set forth by the Company's Board of Directors.
As part of their procedures, the ALCOs regularly review interest rate risk by forecasting the impact of alternative interest rate environments on net interest income and market value of portfolio equity, which is defined as the net present value of an institution’s existing assets, liabilities and off-balance sheet instruments, and evaluating such impacts against the maximum potential changes in net interest income and market value of portfolio equity.
96
Interest Rate Sensitivity of Economic Value of Equity and Net Interest Income
The following table presents the projected change in the Bank’s net portfolio value at
December 31, 2018
that would occur upon an immediate change in interest rates based on independent analysis, but without giving effect to any steps that management might take to counteract that change:
|
Change in Interest Rates in Basis Points (bps)
(1)
|
||||||||||||||||||||||
|
Economic Value of Equity
|
Net Interest Income
|
|||||||||||||||||||||
|
($ in thousands)
|
Amount
|
Amount Change
|
Percentage Change
|
Amount
|
Amount Change
|
Percentage Change
|
||||||||||||||||
|
December 31, 2018
|
||||||||||||||||||||||
|
+200 bps
|
$
|
1,175,333
|
|
$
|
(83,587
|
)
|
(6.6
|
)%
|
$
|
292,583
|
|
$
|
2,781
|
|
1.0
|
%
|
||||||
|
+100 bps
|
1,228,621
|
|
(30,299
|
)
|
(2.4
|
)%
|
292,044
|
|
2,242
|
|
0.8
|
%
|
||||||||||
|
0 bp
|
1,258,920
|
|
289,802
|
|
||||||||||||||||||
|
-100 bps
|
1,255,710
|
|
(3,210
|
)
|
(0.3
|
)%
|
285,077
|
|
(4,725
|
)
|
(1.6
|
)%
|
||||||||||
|
(1)
|
Assumes an instantaneous uniform change in interest rates at all maturities
|
As with any method of measuring interest rate risk, certain shortcomings are inherent in the method of analysis presented in the foregoing table. For example, although certain assets and liabilities may have similar maturities or periods to repricing, they may react in different degrees to changes in market interest rates. Also, the interest rates on certain types of assets and liabilities may fluctuate in advance of changes in market interest rates, while interest rates on other types may lag behind changes in market rates. Additionally, certain assets, such as adjustable rate mortgage loans, have features which restrict changes in interest rates on a short-term basis and over the life of the asset. Further, if interest rates change, expected rates of prepayments on loans and early withdrawals from certificates of deposit could deviate significantly from those assumed in calculating the table.
Interest rate risk is the most significant market risk affecting the Company. Other types of market risk, such as foreign currency exchange risk and commodity price risk, do not arise in the normal course of the Company’s business activities and operations.
97
Item 8. Financial Statements and Supplementary Data
BANC OF CALIFORNIA, INC.
CONSOLIDATED FINANCIAL STATEMENTS
December 31, 2018
,
2017
, and
2016
Contents
|
CONSOLIDATED FINANCIAL STATEMENTS
|
|
98
REPORT OF INDEPENDENT REGISTERED PUBLIC ACCOUNTING FIRM
To the Stockholders and Board of Directors
Banc of California, Inc.:
Opinion on the Consolidated Financial Statements
We have audited the accompanying consolidated statements of financial condition of Banc of California, Inc. and subsidiaries (the Company) as of
December 31, 2018
and
2017
, the related consolidated statements of operations, comprehensive income, stockholders’ equity, and cash flows for each of the years in the three-year period ended
December 31, 2018
, and the related notes (collectively, the consolidated financial statements). In our opinion, the consolidated financial statements present fairly, in all material respects, the financial position of the Company as of
December 31, 2018
and
2017
, and the results of its operations and its cash flows for each of the years in the three-year period ended
December 31, 2018
, in conformity with U.S. generally accepted accounting principles.
We also have audited, in accordance with the standards of the Public Company Accounting Oversight Board (United States) (PCAOB), the Company’s internal control over financial reporting as of
December 31, 2018
, based on criteria established in
Internal Control - Integrated Framework (2013)
issued by the Committee of Sponsoring Organizations of the Treadway Commission, and our report dated
February 28, 2019
expressed an unqualified opinion on the effectiveness of the Company’s internal control over financial reporting.
Basis for Opinion
These consolidated financial statements are the responsibility of the Company’s management. Our responsibility is to express an opinion on these consolidated financial statements based on our audits. We are a public accounting firm registered with the PCAOB and are required to be independent with respect to the Company in accordance with the U.S. federal securities laws and the applicable rules and regulations of the Securities and Exchange Commission and the PCAOB.
We conducted our audits in accordance with the standards of the PCAOB. Those standards require that we plan and perform the audit to obtain reasonable assurance about whether the consolidated financial statements are free of material misstatement, whether due to error or fraud. Our audits included performing procedures to assess the risks of material misstatement of the consolidated financial statements, whether due to error or fraud, and performing procedures that respond to those risks. Such procedures included examining, on a test basis, evidence regarding the amounts and disclosures in the consolidated financial statements. Our audits also included evaluating the accounting principles used and significant estimates made by management, as well as evaluating the overall presentation of the consolidated financial statements. We believe that our audits provide a reasonable basis for our opinion.
|
/s/ KPMG LLP
KPMG LLP
|
|
We have served as the Company’s auditor since 2012.
Irvine, California
February 28, 2019
99
ITEM 1 – FINANCIAL STATEMENTS
BANC OF CALIFORNIA, INC.
CONSOLIDATED STATEMENTS OF FINANCIAL CONDITION
($ in thousands, except share and per share data)
|
December
31,
|
|||||||
|
2018
|
2017
|
||||||
|
ASSETS
|
|||||||
|
Cash and due from banks
|
$
|
21,875
|
|
$
|
20,117
|
|
|
|
Interest-earning deposits in financial institutions
|
369,717
|
|
367,582
|
|
|||
|
Total cash and cash equivalents
|
391,592
|
|
387,699
|
|
|||
|
Securities available-for-sale, carried at fair value
|
1,992,500
|
|
2,575,469
|
|
|||
|
Loans held-for-sale, carried at fair value
|
7,690
|
|
66,603
|
|
|||
|
Loans held-for-sale, carried at lower of cost or fair value
|
426
|
|
466
|
|
|||
|
Loans and leases receivable
|
7,700,873
|
|
6,659,407
|
|
|||
|
Allowance for loan and lease losses
|
(62,192
|
)
|
(49,333
|
)
|
|||
|
Loans and leases receivable, net
|
7,638,681
|
|
6,610,074
|
|
|||
|
Federal Home Loan Bank and other bank stock, at cost
|
68,094
|
|
75,654
|
|
|||
|
Servicing rights, net
|
3,428
|
|
33,708
|
|
|||
|
Other real estate owned, net
|
672
|
|
1,796
|
|
|||
|
Premises, equipment, and capital leases, net
|
129,394
|
|
135,699
|
|
|||
|
Bank owned life insurance
|
107,027
|
|
104,851
|
|
|||
|
Goodwill
|
37,144
|
|
37,144
|
|
|||
|
Investments in alternative energy partnerships, net
|
28,988
|
|
48,826
|
|
|||
|
Deferred income taxes, net
|
49,404
|
|
31,074
|
|
|||
|
Income tax receivable
|
2,695
|
|
8,739
|
|
|||
|
Other intangible assets, net
|
6,346
|
|
9,353
|
|
|||
|
Other assets
|
146,496
|
|
161,797
|
|
|||
|
Assets of discontinued operations
|
19,490
|
|
38,900
|
|
|||
|
Total Assets
|
$
|
10,630,067
|
|
$
|
10,327,852
|
|
|
|
LIABILITIES AND STOCKHOLDERS’ EQUITY
|
|||||||
|
Noninterest-bearing deposits
|
$
|
1,023,360
|
|
$
|
1,071,608
|
|
|
|
Interest-bearing deposits
|
6,893,284
|
|
6,221,295
|
|
|||
|
Total deposits
|
7,916,644
|
|
7,292,903
|
|
|||
|
Advances from Federal Home Loan Bank
|
1,520,000
|
|
1,695,000
|
|
|||
|
Long-term debt, net
|
173,174
|
|
172,941
|
|
|||
|
Reserve for loss on repurchased loans
|
2,506
|
|
6,306
|
|
|||
|
Accrued expenses and other liabilities
|
72,209
|
|
140,575
|
|
|||
|
Liabilities of discontinued operations
|
—
|
|
7,819
|
|
|||
|
Total liabilities
|
9,684,533
|
|
9,315,544
|
|
|||
|
Commitments and contingent liabilities
|
—
|
|
—
|
|
|||
|
Preferred stock
|
231,128
|
|
269,071
|
|
|||
|
Common stock, $0.01 par value per share, 446,863,844 shares authorized; 51,755,398 shares issued and 50,172,018 shares outstanding at December 31, 2018; 51,666,725 shares issued and 50,083,345 shares outstanding at December 31, 2017
|
518
|
|
517
|
|
|||
|
Class B non-voting non-convertible common stock, $0.01 par value per share, 3,136,156 shares authorized; 477,321 shares issued and outstanding at December 31, 2018 and 508,107 shares issued and outstanding December 31, 2017
|
5
|
|
5
|
|
|||
|
Additional paid-in capital
|
625,834
|
|
621,435
|
|
|||
|
Retained earnings
|
140,952
|
|
144,839
|
|
|||
|
Treasury stock, at cost (1,583,380 common shares at December 31, 2018 and 2017)
|
(28,786
|
)
|
(28,786
|
)
|
|||
|
Accumulated other comprehensive (loss) income, net
|
(24,117
|
)
|
5,227
|
|
|||
|
Total stockholders’ equity
|
945,534
|
|
1,012,308
|
|
|||
|
Total liabilities and stockholders’ equity
|
$
|
10,630,067
|
|
$
|
10,327,852
|
|
|
See accompanying notes to consolidated financial statements.
100
BANC OF CALIFORNIA, INC.
CONSOLIDATED STATEMENTS OF OPERATIONS
($ in thousands, except per share data)
|
Year Ended December 31,
|
|||||||||||
|
2018
|
2017
|
2016
|
|||||||||
|
Interest and dividend income
|
|||||||||||
|
Loans and leases, including fees
|
$
|
329,272
|
|
$
|
281,071
|
|
$
|
281,868
|
|
||
|
Securities
|
83,567
|
|
99,742
|
|
79,527
|
|
|||||
|
Other interest-earning assets
|
9,957
|
|
8,377
|
|
8,449
|
|
|||||
|
Total interest and dividend income
|
422,796
|
|
389,190
|
|
369,844
|
|
|||||
|
Interest expense
|
|||||||||||
|
Deposits
|
91,236
|
|
60,414
|
|
40,220
|
|
|||||
|
Federal Home Loan Bank advances
|
34,995
|
|
12,951
|
|
5,717
|
|
|||||
|
Securities sold under repurchase agreements
|
1,033
|
|
880
|
|
818
|
|
|||||
|
Long-term debt and other interest-bearing liabilities
|
9,456
|
|
10,755
|
|
12,744
|
|
|||||
|
Total interest expense
|
136,720
|
|
85,000
|
|
59,499
|
|
|||||
|
Net interest income
|
286,076
|
|
304,190
|
|
310,345
|
|
|||||
|
Provision for loan and lease losses
|
30,215
|
|
13,699
|
|
5,271
|
|
|||||
|
Net interest income after provision for loan and lease losses
|
255,861
|
|
290,491
|
|
305,074
|
|
|||||
|
Noninterest income
|
|||||||||||
|
Customer service fees
|
6,315
|
|
6,492
|
|
5,147
|
|
|||||
|
Loan servicing income
|
3,720
|
|
1,025
|
|
633
|
|
|||||
|
Income from bank owned life insurance
|
2,176
|
|
2,339
|
|
2,341
|
|
|||||
|
Impairment loss on investment securities
|
(3,252
|
)
|
—
|
|
—
|
|
|||||
|
Net gain on sale of securities available-for-sale
|
5,532
|
|
14,768
|
|
29,405
|
|
|||||
|
Net gain on sale of loans
|
1,932
|
|
11,942
|
|
35,895
|
|
|||||
|
Net loss on sale of mortgage servicing rights
|
(2,260
|
)
|
—
|
|
—
|
|
|||||
|
Gain on sale of subsidiary
|
—
|
|
—
|
|
3,694
|
|
|||||
|
Gain on sale of business unit
|
—
|
|
—
|
|
2,629
|
|
|||||
|
Other income
|
9,752
|
|
8,104
|
|
18,886
|
|
|||||
|
Total noninterest income
|
23,915
|
|
44,670
|
|
98,630
|
|
|||||
|
Noninterest expense
|
|||||||||||
|
Salaries and employee benefits
|
109,974
|
|
129,153
|
|
146,147
|
|
|||||
|
Occupancy and equipment
|
31,847
|
|
38,391
|
|
34,797
|
|
|||||
|
Professional fees
|
33,652
|
|
42,417
|
|
30,373
|
|
|||||
|
Outside service fees
|
4,667
|
|
5,840
|
|
6,989
|
|
|||||
|
Data processing
|
6,951
|
|
7,888
|
|
8,311
|
|
|||||
|
Advertising
|
12,664
|
|
5,313
|
|
6,894
|
|
|||||
|
Regulatory assessments
|
7,678
|
|
8,105
|
|
8,186
|
|
|||||
|
Loss on investments in alternative energy partnerships, net
|
5,044
|
|
30,786
|
|
31,510
|
|
|||||
|
Reversal of provision for loan repurchases
|
(2,488
|
)
|
(1,812
|
)
|
(3,352
|
)
|
|||||
|
Amortization of intangible assets
|
3,007
|
|
3,928
|
|
4,851
|
|
|||||
|
Impairment on intangible assets
|
—
|
|
336
|
|
690
|
|
|||||
|
Restructuring expense
|
4,431
|
|
5,326
|
|
—
|
|
|||||
|
All other expense
|
15,358
|
|
32,597
|
|
27,819
|
|
|||||
|
Total noninterest expense
|
232,785
|
|
308,268
|
|
303,215
|
|
|||||
|
Income from continuing operations before income taxes
|
46,991
|
|
26,893
|
|
100,489
|
|
|||||
|
Income tax expense (benefit)
|
4,844
|
|
(26,581
|
)
|
13,749
|
|
|||||
|
Income from continuing operations
|
42,147
|
|
53,474
|
|
86,740
|
|
|||||
|
Income from discontinued operations before income taxes (including net gain on disposal of $1,439 and $13,796 for the year ended December 31, 2018 and 2017, respectively)
|
4,596
|
|
7,164
|
|
48,917
|
|
|||||
|
Income tax expense
|
1,271
|
|
2,929
|
|
20,241
|
|
|||||
|
Income from discontinued operations
|
3,325
|
|
4,235
|
|
28,676
|
|
|||||
|
Net income
|
45,472
|
|
57,709
|
|
115,416
|
|
|||||
|
Preferred stock dividends
|
19,504
|
|
20,451
|
|
19,914
|
|
|||||
|
Impact of preferred stock redemption
|
2,307
|
|
—
|
|
—
|
|
|||||
|
Net income available to common stockholders
|
$
|
23,661
|
|
$
|
37,258
|
|
$
|
95,502
|
|
||
|
Basic earnings per common share
|
|||||||||||
|
Income from continuing operations
|
$
|
0.38
|
|
$
|
0.64
|
|
$
|
1.36
|
|
||
|
Income from discontinued operations
|
0.07
|
|
0.08
|
|
0.61
|
|
|||||
|
Net income
|
$
|
0.45
|
|
$
|
0.72
|
|
$
|
1.97
|
|
||
|
Diluted earnings per common share
|
|||||||||||
|
Income from continuing operations
|
$
|
0.38
|
|
$
|
0.63
|
|
$
|
1.34
|
|
||
|
Income from discontinued operations
|
0.07
|
|
0.08
|
|
0.60
|
|
|||||
|
Net income
|
$
|
0.45
|
|
$
|
0.71
|
|
$
|
1.94
|
|
||
|
Basic earnings per class B common share
|
|||||||||||
|
Income from continuing operations
|
$
|
0.38
|
|
$
|
0.64
|
|
$
|
1.36
|
|
||
|
Income from discontinued operations
|
0.07
|
|
0.08
|
|
0.61
|
|
|||||
|
Net income
|
$
|
0.45
|
|
$
|
0.72
|
|
$
|
1.97
|
|
||
|
Diluted earnings per class B common share
|
|||||||||||
|
Income from continuing operations
|
$
|
0.38
|
|
$
|
0.64
|
|
$
|
1.36
|
|
||
|
Income from discontinued operations
|
0.07
|
|
0.08
|
|
0.61
|
|
|||||
|
Net income
|
$
|
0.45
|
|
$
|
0.72
|
|
$
|
1.97
|
|
||
See accompanying notes to consolidated financial statements.
101
BANC OF CALIFORNIA, INC.
CONSOLIDATED STATEMENTS OF COMPREHENSIVE INCOME
($ in thousands)
|
Year Ended December 31,
|
|||||||||||
|
2018
|
2017
|
2016
|
|||||||||
|
Net income
|
$
|
45,472
|
|
$
|
57,709
|
|
$
|
115,416
|
|
||
|
Other comprehensive (loss) income, net of tax:
|
|||||||||||
|
Unrealized gain (loss) on securities available-for-sale:
|
|||||||||||
|
Unrealized (loss) gain arising during the period
|
(28,230
|
)
|
10,068
|
|
11,140
|
|
|||||
|
Unrealized gain arising from the reclassification of securities held-to-maturity to securities available-for-sale
|
—
|
|
12,845
|
|
—
|
|
|||||
|
Reclassification adjustment for gain included in net income
|
(3,906
|
)
|
(8,644
|
)
|
(17,187
|
)
|
|||||
|
Reclassification adjustment for OTTI loss included in net income
|
2,296
|
|
—
|
|
—
|
|
|||||
|
Total change in unrealized (loss) gain on securities available-for-sale
|
(29,840
|
)
|
14,269
|
|
(6,047
|
)
|
|||||
|
Total other comprehensive (loss) income
|
(29,840
|
)
|
14,269
|
|
(6,047
|
)
|
|||||
|
Comprehensive income
|
$
|
15,632
|
|
$
|
71,978
|
|
$
|
109,369
|
|
||
See accompanying notes to consolidated financial statements.
102
BANC OF CALIFORNIA, INC.
CONSOLIDATED STATEMENTS OF STOCKHOLDERS’ EQUITY
($ in thousands, except per share data)
|
Preferred Stock
|
Common Stock
|
Additional Paid-in Capital
|
Retained Earnings
|
Treasury Stock
|
Accumulated Other Comprehensive Income (Loss)
|
Total Stockholders' Equity
|
|||||||||||||||||||||||||
|
Voting
|
Class B Non-Voting
|
||||||||||||||||||||||||||||||
|
Balance at December 31, 2015
|
$
|
190,750
|
|
$
|
395
|
|
$
|
1
|
|
$
|
429,790
|
|
$
|
63,534
|
|
$
|
(29,070
|
)
|
$
|
(2,995
|
)
|
$
|
652,405
|
|
|||||||
|
Comprehensive income (loss):
|
|||||||||||||||||||||||||||||||
|
Net income
|
—
|
|
—
|
|
—
|
|
—
|
|
115,416
|
|
—
|
|
—
|
|
115,416
|
|
|||||||||||||||
|
Other comprehensive loss, net
|
—
|
|
—
|
|
—
|
|
—
|
|
—
|
|
—
|
|
(6,047
|
)
|
(6,047
|
)
|
|||||||||||||||
|
Issuance of common stock
|
—
|
|
120
|
|
1
|
|
174,957
|
|
—
|
|
—
|
|
—
|
|
175,078
|
|
|||||||||||||||
|
Issuance of preferred stock
|
120,255
|
|
—
|
|
—
|
|
—
|
|
—
|
|
—
|
|
—
|
|
120,255
|
|
|||||||||||||||
|
Redemption of preferred stock
|
(41,934
|
)
|
—
|
|
—
|
|
—
|
|
(66
|
)
|
—
|
|
—
|
|
(42,000
|
)
|
|||||||||||||||
|
Issuance of common stock to Stock Employee Compensation Trust
|
—
|
|
25
|
|
—
|
|
(25
|
)
|
—
|
|
—
|
|
—
|
|
—
|
|
|||||||||||||||
|
Cash settlement of stock options
|
—
|
|
—
|
|
—
|
|
(359
|
)
|
—
|
|
—
|
|
—
|
|
(359
|
)
|
|||||||||||||||
|
Stock-based compensation expense
|
—
|
|
—
|
|
—
|
|
11,947
|
|
—
|
|
—
|
|
—
|
|
11,947
|
|
|||||||||||||||
|
Restricted stock surrendered due to employee tax liability
|
—
|
|
(3
|
)
|
—
|
|
(4,433
|
)
|
—
|
|
—
|
|
—
|
|
(4,436
|
)
|
|||||||||||||||
|
Tax effect from stock compensation plan
|
—
|
|
—
|
|
—
|
|
2,116
|
|
—
|
|
—
|
|
—
|
|
2,116
|
|
|||||||||||||||
|
Shares purchased under Dividend Reinvestment Plan
|
—
|
|
—
|
|
—
|
|
233
|
|
(175
|
)
|
—
|
|
—
|
|
58
|
|
|||||||||||||||
|
Stock appreciation right dividend equivalents
|
—
|
|
—
|
|
—
|
|
—
|
|
(759
|
)
|
—
|
|
—
|
|
(759
|
)
|
|||||||||||||||
|
Dividends declared ($0.49 per common share)
|
—
|
|
—
|
|
—
|
|
—
|
|
(23,521
|
)
|
—
|
|
—
|
|
(23,521
|
)
|
|||||||||||||||
|
Preferred stock dividends
|
—
|
|
—
|
|
—
|
|
—
|
|
(19,914
|
)
|
—
|
|
—
|
|
(19,914
|
)
|
|||||||||||||||
|
Balance at December 31, 2016
|
$
|
269,071
|
|
$
|
537
|
|
$
|
2
|
|
$
|
614,226
|
|
$
|
134,515
|
|
$
|
(29,070
|
)
|
$
|
(9,042
|
)
|
$
|
980,239
|
|
|||||||
|
Comprehensive income:
|
|||||||||||||||||||||||||||||||
|
Net income
|
—
|
|
—
|
|
—
|
|
—
|
|
57,709
|
|
—
|
|
—
|
|
57,709
|
|
|||||||||||||||
|
Other comprehensive income, net
|
—
|
|
—
|
|
—
|
|
—
|
|
—
|
|
—
|
|
14,269
|
|
14,269
|
|
|||||||||||||||
|
Issuance of common stock
|
—
|
|
4
|
|
3
|
|
(7
|
)
|
—
|
|
—
|
|
—
|
|
—
|
|
|||||||||||||||
|
Cancellation of common stock for termination of Stock Employee Compensation Trust
|
—
|
|
(25
|
)
|
—
|
|
25
|
|
—
|
|
—
|
|
—
|
|
—
|
|
|||||||||||||||
|
Exercise of stock options
|
—
|
|
3
|
|
—
|
|
1,756
|
|
—
|
|
284
|
|
—
|
|
2,043
|
|
|||||||||||||||
|
Stock-based compensation expense
|
—
|
|
—
|
|
—
|
|
12,134
|
|
—
|
|
—
|
|
—
|
|
12,134
|
|
|||||||||||||||
|
Restricted stock surrendered due to employee tax liability
|
—
|
|
(2
|
)
|
—
|
|
(6,822
|
)
|
—
|
|
—
|
|
—
|
|
(6,824
|
)
|
|||||||||||||||
|
Shares purchased under Dividend Reinvestment Plan
|
—
|
|
—
|
|
—
|
|
123
|
|
(181
|
)
|
—
|
|
—
|
|
(58
|
)
|
|||||||||||||||
|
Stock appreciation right dividend equivalents
|
—
|
|
—
|
|
—
|
|
—
|
|
(811
|
)
|
—
|
|
—
|
|
(811
|
)
|
|||||||||||||||
|
Dividends declared ($0.52 per common share)
|
—
|
|
—
|
|
—
|
|
—
|
|
(25,942
|
)
|
—
|
|
—
|
|
(25,942
|
)
|
|||||||||||||||
|
Preferred stock dividends
|
—
|
|
—
|
|
—
|
|
—
|
|
(20,451
|
)
|
—
|
|
—
|
|
(20,451
|
)
|
|||||||||||||||
|
Balance at December 31, 2017
|
$
|
269,071
|
|
$
|
517
|
|
$
|
5
|
|
$
|
621,435
|
|
$
|
144,839
|
|
$
|
(28,786
|
)
|
$
|
5,227
|
|
$
|
1,012,308
|
|
|||||||
|
Reclassification of stranded tax effects to retained earnings
|
—
|
|
—
|
|
—
|
|
—
|
|
(496
|
)
|
—
|
|
496
|
|
—
|
|
|||||||||||||||
|
Adjusted Balance at December 31, 2017
|
269,071
|
|
517
|
|
5
|
|
621,435
|
|
144,343
|
|
(28,786
|
)
|
5,723
|
|
1,012,308
|
|
|||||||||||||||
|
Comprehensive income:
|
|||||||||||||||||||||||||||||||
|
Net income
|
—
|
|
—
|
|
—
|
|
—
|
|
45,472
|
|
—
|
|
—
|
|
45,472
|
|
|||||||||||||||
|
Other comprehensive loss, net
|
—
|
|
—
|
|
—
|
|
—
|
|
—
|
|
—
|
|
(29,840
|
)
|
(29,840
|
)
|
|||||||||||||||
|
Issuance of common stock
|
—
|
|
2
|
|
—
|
|
(2
|
)
|
—
|
|
—
|
|
—
|
|
—
|
|
|||||||||||||||
|
Redemption of preferred stock
|
(37,943
|
)
|
—
|
|
—
|
|
—
|
|
(2,307
|
)
|
—
|
|
—
|
|
(40,250
|
)
|
|||||||||||||||
|
Stock-based compensation expense
|
—
|
|
—
|
|
—
|
|
6,565
|
|
—
|
|
—
|
|
—
|
|
6,565
|
|
|||||||||||||||
|
Restricted stock surrendered due to employee tax liability
|
—
|
|
(1
|
)
|
—
|
|
(2,365
|
)
|
—
|
|
—
|
|
—
|
|
(2,366
|
)
|
|||||||||||||||
|
Shares purchased under Dividend Reinvestment Plan
|
—
|
|
—
|
|
—
|
|
201
|
|
(254
|
)
|
—
|
|
—
|
|
(53
|
)
|
|||||||||||||||
|
Stock appreciation right dividend equivalents
|
—
|
|
—
|
|
—
|
|
—
|
|
(811
|
)
|
—
|
|
—
|
|
(811
|
)
|
|||||||||||||||
|
Dividends declared ($0.52 per common share)
|
—
|
|
—
|
|
—
|
|
—
|
|
(25,987
|
)
|
—
|
|
—
|
|
(25,987
|
)
|
|||||||||||||||
|
Preferred stock dividends
|
—
|
|
—
|
|
—
|
|
—
|
|
(19,504
|
)
|
—
|
|
—
|
|
(19,504
|
)
|
|||||||||||||||
|
Balance at December 31, 2018
|
$
|
231,128
|
|
$
|
518
|
|
$
|
5
|
|
$
|
625,834
|
|
$
|
140,952
|
|
$
|
(28,786
|
)
|
$
|
(24,117
|
)
|
$
|
945,534
|
|
|||||||
See accompanying notes to consolidated financial statements.
103
BANC OF CALIFORNIA, INC.
CONSOLIDATED STATEMENTS OF CASH FLOWS
($ in thousands)
|
Year Ended December 31,
|
|||||||||||
|
2018
|
2017
|
2016
|
|||||||||
|
Cash flows from operating activities:
|
|||||||||||
|
Net income
|
$
|
45,472
|
|
$
|
57,709
|
|
$
|
115,416
|
|
||
|
Adjustments to reconcile net income to net cash provided by (used in) operating activities
|
|||||||||||
|
Provision for loan and lease losses
|
30,215
|
|
13,699
|
|
5,271
|
|
|||||
|
Provision for unfunded loan commitments
|
906
|
|
1,331
|
|
318
|
|
|||||
|
Reversal of provision for loan repurchases
|
(2,488
|
)
|
(1,812
|
)
|
(3,352
|
)
|
|||||
|
Depreciation on premises and equipment
|
10,878
|
|
12,425
|
|
11,680
|
|
|||||
|
Amortization of intangible assets
|
3,007
|
|
3,928
|
|
4,851
|
|
|||||
|
Amortization of debt issuance cost
|
233
|
|
247
|
|
704
|
|
|||||
|
Net amortization (accretion) of premium and discount on securities
|
1,213
|
|
(2,432
|
)
|
1,206
|
|
|||||
|
Net accretion of deferred loans cost and fees
|
(612
|
)
|
(1,318
|
)
|
(1
|
)
|
|||||
|
Accretion of discounts on purchased loans
|
(637
|
)
|
(4,808
|
)
|
(36,800
|
)
|
|||||
|
Deferred income tax (benefit) expense
|
(5,911
|
)
|
(30,372
|
)
|
5,613
|
|
|||||
|
Bank owned life insurance income
|
(2,176
|
)
|
(2,339
|
)
|
(2,341
|
)
|
|||||
|
Share-based compensation expense
|
6,565
|
|
12,134
|
|
11,947
|
|
|||||
|
Loss on investments in alternative energy partnerships
|
5,044
|
|
30,786
|
|
31,510
|
|
|||||
|
Impairment on intangible assets
|
—
|
|
336
|
|
690
|
|
|||||
|
Impairment on capitalized software projects
|
1,975
|
|
1,957
|
|
595
|
|
|||||
|
Debt redemption costs
|
—
|
|
—
|
|
2,737
|
|
|||||
|
Net revenue on mortgage banking activities
|
(428
|
)
|
(42,889
|
)
|
(167,024
|
)
|
|||||
|
Net gain on sale of loans
|
(1,932
|
)
|
(11,942
|
)
|
(35,895
|
)
|
|||||
|
Net gain on sale of securities available for sale
|
(5,532
|
)
|
(14,768
|
)
|
(29,405
|
)
|
|||||
|
Impairment loss on investment securities
|
3,252
|
|
—
|
|
—
|
|
|||||
|
Loss from change of fair value on mortgage servicing rights
|
1,533
|
|
17,051
|
|
17,729
|
|
|||||
|
(Gain) loss on sale or disposal of property and equipment
|
(1,741
|
)
|
1,070
|
|
122
|
|
|||||
|
Loss on sale of mortgage servicing rights
|
2,260
|
|
—
|
|
—
|
|
|||||
|
Gain on sale of subsidiary
|
—
|
|
—
|
|
(3,694
|
)
|
|||||
|
Gain on sale of business unit
|
—
|
|
—
|
|
(2,629
|
)
|
|||||
|
Net gain on disposal of discontinued operations
|
(1,439
|
)
|
(13,796
|
)
|
—
|
|
|||||
|
Repurchase of mortgage loans
|
(12,666
|
)
|
(31,913
|
)
|
(40,822
|
)
|
|||||
|
Originations of loans held-for-sale from mortgage banking
|
—
|
|
(1,533,889
|
)
|
(5,135,046
|
)
|
|||||
|
Originations of other loans held-for-sale
|
(5,839
|
)
|
(97,156
|
)
|
(614,596
|
)
|
|||||
|
Proceeds from sales of and principal collected on loans held-for-sale from mortgage
(1)
|
25,216
|
|
1,961,275
|
|
5,279,187
|
|
|||||
|
Proceeds from sales of and principal collected on other loans held-for-sale
|
7,037
|
|
302,695
|
|
615,437
|
|
|||||
|
Change in accrued interest receivable and other assets
|
24,860
|
|
2,604
|
|
(43,200
|
)
|
|||||
|
Change in accrued interest payable and other liabilities
(1)
|
(5,262
|
)
|
(66,802
|
)
|
27,905
|
|
|||||
|
Net cash provided by operating activities
|
123,003
|
|
563,011
|
|
18,113
|
|
|||||
|
Cash flows from investing activities:
|
|||||||||||
|
Proceeds from sales of securities available-for-sale
|
417,870
|
|
981,481
|
|
4,096,453
|
|
|||||
|
Proceeds from maturities and calls of securities available-for-sale
|
607,601
|
|
518,978
|
|
51,550
|
|
|||||
|
Proceeds from principal repayments of securities available-for-sale
|
43,378
|
|
43,936
|
|
95,556
|
|
|||||
|
Proceeds from maturities and calls of securities held-to-maturity
|
—
|
|
143,505
|
|
78,050
|
|
|||||
|
Purchases of securities available-for-sale
|
(521,575
|
)
|
(962,390
|
)
|
(5,723,578
|
)
|
|||||
|
Net cash provided by disposal of discontinued operations
|
—
|
|
56,123
|
|
—
|
|
|||||
|
Proceeds from sale of subsidiary
|
—
|
|
—
|
|
259
|
|
|||||
|
Proceeds from sale of business unit
|
—
|
|
—
|
|
246,957
|
|
|||||
|
Loan originations and principal collections, net
|
(1,374,702
|
)
|
(1,128,172
|
)
|
(1,778,994
|
)
|
|||||
|
Purchase of loans and leases
|
(59,481
|
)
|
—
|
|
(182,231
|
)
|
|||||
|
Redemption of Federal Home Loan Bank stock
|
66,710
|
|
29,612
|
|
38,988
|
|
|||||
|
Purchase of Federal Home Loan Bank and other bank stocks
|
(59,150
|
)
|
(37,424
|
)
|
(47,798
|
)
|
|||||
|
Proceeds from sale of loans held-for-sale/held-for-investment
|
376,837
|
|
605,502
|
|
930,342
|
|
|||||
|
Net change in time deposits in financial institutions
|
—
|
|
1,000
|
|
500
|
|
|||||
|
Proceeds from sale of other real estate owned
|
1,795
|
|
3,508
|
|
1,737
|
|
|||||
|
Proceeds from sale of mortgage servicing rights
|
30,056
|
|
1,496
|
|
5
|
|
|||||
|
Proceeds from sale of premises and equipment
|
4,193
|
|
2,663
|
|
28
|
|
|||||
|
Additions to premises and equipment
|
(9,001
|
)
|
(15,323
|
)
|
(44,683
|
)
|
|||||
|
Payments of capital lease obligations
|
(463
|
)
|
(1,434
|
)
|
(954
|
)
|
|||||
|
Funding of equity investment
|
(6,361
|
)
|
(35,826
|
)
|
(23,324
|
)
|
|||||
|
Net decrease (increase) in investments in alternative energy partnerships
|
12,547
|
|
(55,377
|
)
|
(57,149
|
)
|
|||||
|
Net cash (used in) provided by investing activities
|
(469,746
|
)
|
151,858
|
|
(2,318,286
|
)
|
|||||
|
Cash flows from financing activities:
|
|||||||||||
|
Net increase (decrease) in deposits
|
623,741
|
|
(1,849,247
|
)
|
2,839,065
|
|
|||||
|
Net (decrease) increase in short-term Federal Home Loan Bank advances
|
(430,000
|
)
|
805,000
|
|
(390,000
|
)
|
|||||
|
Repayment of long-term Federal Home Loan Bank advances
|
(125,000
|
)
|
(100,000
|
)
|
(50,000
|
)
|
|||||
|
Proceeds from long-term Federal Home Loan Bank advances
|
380,000
|
|
500,000
|
|
—
|
|
|||||
|
Net (decrease) increase in other borrowings
|
—
|
|
(68,000
|
)
|
68,000
|
|
|||||
|
Net proceeds from issuance of common stock
|
—
|
|
—
|
|
175,078
|
|
|||||
|
Net proceeds from issuance of preferred stock
|
—
|
|
—
|
|
120,255
|
|
|||||
|
Redemption of preferred stock
|
(40,250
|
)
|
—
|
|
(42,000
|
)
|
|||||
|
Payment of junior subordinated amortizing notes
|
—
|
|
(2,684
|
)
|
(5,078
|
)
|
|||||
|
Redemption of senior notes
|
—
|
|
—
|
|
(84,750
|
)
|
|||||
|
Cash settlements of stock options
|
—
|
|
—
|
|
(359
|
)
|
|||||
|
Proceeds from exercise of stock options
|
—
|
|
2,043
|
|
—
|
|
|||||
|
Restricted stock surrendered due to employee tax liability
|
(2,366
|
)
|
(6,824
|
)
|
(4,436
|
)
|
|||||
|
Dividend equivalents paid on stock appreciation rights
|
(810
|
)
|
(810
|
)
|
(742
|
)
|
|||||
|
Dividends paid on preferred stock
|
(21,954
|
)
|
(20,451
|
)
|
(19,630
|
)
|
|||||
|
Dividends paid on common stock
|
(32,725
|
)
|
(25,707
|
)
|
(21,844
|
)
|
|||||
|
Net cash provided by (used in) financing activities
|
350,636
|
|
(766,680
|
)
|
2,583,559
|
|
|||||
|
Net change in cash and cash equivalents
|
3,893
|
|
(51,811
|
)
|
283,386
|
|
|||||
|
Cash and cash equivalents at beginning of year
|
387,699
|
|
439,510
|
|
156,124
|
|
|||||
|
Cash and cash equivalents at end of year
|
$
|
391,592
|
|
$
|
387,699
|
|
$
|
439,510
|
|
||
|
Supplemental cash flow information
|
|||||||||||
|
Interest paid on deposits and borrowed funds
|
$
|
130,793
|
|
$
|
81,805
|
|
$
|
59,380
|
|
||
|
Income taxes paid
|
8,324
|
|
11,318
|
|
42,377
|
|
|||||
|
Income taxes refunds received
|
4,532
|
|
14,119
|
|
1
|
|
|||||
|
Supplemental disclosure of non-cash activities
|
|||||||||||
|
Transfer from loans to other real estate owned, net
|
672
|
|
3,086
|
|
3,269
|
|
|||||
|
Transfer of loans held-for-investment to loans held-for-sale
|
376,995
|
|
593,977
|
|
191,666
|
|
|||||
|
Transfer of loans held-for-sale to loans held-for-investment
|
—
|
|
88,591
|
|
7,115
|
|
|||||
|
Reclassification of securities held-to-maturity to securities available-for-sale
|
—
|
|
740,863
|
|
—
|
|
|||||
|
Equipment acquired under capital leases
|
82
|
|
1,452
|
|
16
|
|
|||||
|
Reclassification of stranded tax effects to retained earnings
|
496
|
|
—
|
|
—
|
|
|||||
|
Receivable on unsettled securities sales
|
—
|
|
5,559
|
|
—
|
|
|||||
|
Due on unsettled securities purchases
|
—
|
|
—
|
|
50,149
|
|
|||||
|
Loans sold to Ginnie Mae that are subject to a repurchase option
|
—
|
|
65,998
|
|
16,513
|
|
|||||
|
(1)
|
The Company made certain immaterial reclassification adjustments within operating activities during the years ended December 31, 2017 and 2016.
|
See accompanying notes to consolidated financial statements.
104
BANC OF CALIFORNIA, INC.
NOTES TO CONSOLIDATED FINANCIAL STATEMENTS
December 31, 2018
,
2017
and
2016
NOTE 1 – SUMMARY OF SIGNIFICANT ACCOUNTING POLICIES
Nature of Operations
:
Banc of California, Inc. is a financial holding company under the Bank Holding Company Act of 1956, as amended, headquartered in Orange County, California and incorporated under the laws of Maryland. Banc of California, Inc.'s assets primarily consist of the outstanding stock of the Bank. Banc of California, Inc. is subject to regulation by the FRB and the Bank operates under a national bank charter issued by the OCC, its primary regulator. The Bank is a member of the FHLB system, and maintains insurance on deposit accounts with the FDIC.
The Bank offers a variety of financial services to meet the banking and financial needs of the communities it serves, with operations conducted through
32
banking offices, serving San Diego, Los Angeles, Santa Barbara, and Orange counties in California as of
December 31, 2018
.
Basis of Presentation:
The consolidated financial statements include the accounts of the Company and all other entities in which it has a controlling financial interest. All significant intercompany accounts and transactions have been eliminated in consolidation. Unless the context requires otherwise, all references to the Company include its wholly owned subsidiaries. The accounting and reporting polices of the Company are based upon U.S. generally accepted accounting principles, which we may refer to as "GAAP" and conform to predominant practices within the financial services industry. Significant accounting policies followed by the Company are presented below.
Use of Estimates in the Preparation of Financial Statements:
The preparation of financial statements in conformity with GAAP requires management to make estimates and assumptions based on available information. These estimates and assumptions affect the amounts reported in the financial statements and disclosures provided, and actual results could differ. The allowance for loan and lease losses, reserve for loss on repurchased loans, reserve for unfunded loan commitments, servicing rights, realization of deferred tax assets, the valuation of goodwill and other intangible assets, mortgage banking derivatives, purchased credit impaired loan discount accretion, HLBV of investments in alternative energy partnerships, fair value of assets and liabilities acquired in business combinations, and the fair value measurement of financial instruments are particularly subject to change and such change could have a material effect on the consolidated financial statements.
Change in Estimate:
At December 31, 2016 the Company accrued a liability for estimated discretionary incentive compensation payments to certain employees. The amount paid was less than the accrued liability. Consequently, the Company reversed the excess accrual and recorded a pre-tax credit to salaries and employee benefits on the consolidated statements of operations of
$7.8 million
during the three months ended March 31, 2017. The reversal, based on new information driven by changes to certain facts and circumstances subsequent to December 31, 2016, was determined to be a change in estimate.
Discontinued Operations:
During the year ended December 31, 2017, the Company completed the sale of its Banc Home Loans division, which largely represented the Company's Mortgage Banking segment. In accordance with ASC 205-20, the Company determined that the sale of the Banc Home Loans division and certain other mortgage banking related assets and liabilities that will be sold or settled separately within one year met the criteria to be classified as a discontinued operation and the related operating results and financial condition have been presented as discontinued operations on the consolidated financial statements. See Note 2 for additional information. Unless otherwise indicated, information included in these notes to consolidated financial statements is presented on a consolidated operations basis, which includes results from both continuing and discontinued operations, for all periods presented.
Segment Reporting:
In connection with the sale of its Banc Home Loans division, which largely represented the Company's Mortgage Banking segment, the Company reassessed its reportable operating segments. Based on this internal evaluation, the Company determined that all
three
of its previously disclosed reportable segments, Commercial Banking, Mortgage Banking, and Corporate/Other, are no longer applicable. Accordingly, to better reflect how the Company is now managed and how information is reviewed by the chief operating decision maker, the Company's chief executive officer, the Company determined that all services offered by the Company relate to Commercial Banking. As a result, the Company's only reportable segment is Commercial Banking.
105
Variable Interest Entities:
The Company holds ownership interests in certain special purpose entities. The Company evaluates its interest in these entities to determine whether they meet the definition of a variable interest entity (VIE) and whether the Company is required to consolidate these entities. A VIE is consolidated by its primary beneficiary, the party that has both the power to direct the activities that most significantly impact the VIE and a variable interest that could be significant to the VIE. A variable interest is a contractual, ownership or other interest that changes with changes in the fair value of the VIE’s net assets. To determine whether or not a variable interest the Company holds could be significant to the VIE, the Company considers both qualitative and quantitative factors regarding the nature, size and form of its involvement with the VIE. The Company analyzes whether the Company is the primary beneficiary of VIE on an ongoing basis. Changes in facts and circumstances occurring since the previous primary beneficiary determination are considered as part of this ongoing assessment. See Note 20 for additional information.
Cash and Cash Equivalents:
Cash and cash equivalents include cash on hand, cash items in transit, cash due from the Federal Reserve Bank and other financial institutions, and federal funds sold with original maturities less than 90 days.
Time Deposits in Financial Institutions:
Time deposits in financial institutions have original maturities over 90 days and are carried at cost.
Investment Securities:
Investment securities are classified at the time of purchase as available-for-sale, held-to-maturity or held-for-trading. The Company had no investment securities classified as held-to-maturity or held-for-trading at December 31, 2018 and 2017. Debt securities are classified as available-for-sale when they might be sold before maturity. Securities available-for-sale are carried at fair value with unrealized holding gains and losses. Unrealized holding gains and losses, net of taxes, and OTTI, net of taxes, reported in AOCI on the Consolidated Statements of Financial Condition.
During the year ended December 31, 2017, the Company evaluated its securities held-to-maturity and determined that certain securities no longer adhered to the Company’s strategic focus and could be sold or reinvested to potentially improve the Company’s liquidity position or duration profile. Accordingly, the Company was no longer able to assert that it had the intent to hold these securities until maturity. As a result, the Company transferred all
$740.9 million
of its held-to-maturity securities to available-for-sale, which resulted in a pre-tax increase to accumulated other comprehensive income of
$22.0 million
at the time of the transfer, June 30, 2017. Due to the transfer, the Company’s ability to assert that it has both the intent and ability to hold debt securities to maturity will be limited for the foreseeable future.
Accreted discounts and amortized premiums are included in interest income using the level yield method, and realized gains or losses from sales of securities are calculated using the specific identification method.
Management evaluates securities for OTTI at least on a quarterly basis, and more frequently when economic conditions warrant such an evaluation. Investment securities classified as available-for-sale or held-to-maturity are generally evaluated for OTTI under ASC 320, Accounting for Certain Investments in Debt and Equity Securities. In determining OTTI under the ASC 320 model, management considers the extent and duration of the unrealized loss and the financial condition and near-term prospects of the issuer. Management also considers whether the market decline was affected by macroeconomic conditions, and assesses whether the Company intends to sell, or it is more likely than not it will be required to sell a security in an unrealized loss position before recovery of its amortized cost basis. The assessment of whether OTTI exists involves a high degree of subjectivity and judgment and is based on the information available to management at a point in time.
When OTTI occurs in either model, the amount of the impairment recognized in earnings depends on the Company’s intent to sell the security or if it is more likely than not that it will be required to sell the security before recovery of its amortized cost basis. If either of the criteria regarding intent or requirement to sell is met, the entire difference between amortized cost and fair value is recognized as impairment through earnings. For debt securities that do not meet the aforementioned criteria, the amount of impairment is split into two components as follows: (i) OTTI related to credit loss, which must be recognized in the income statement and (ii) OTTI related to other factors, which is recognized in other comprehensive income. The credit loss is defined as the difference between the present value of the cash flows expected to be collected and the amortized cost basis. For equity securities the entire amount of impairment is recognized through earnings.
106
Federal Home Loan Bank and Federal Reserve Bank Stock:
The Bank is a member of the FHLB and Federal Reserve Bank system. Members are required to own a certain amount of FHLB and Federal Reserve Bank stock based on the level of borrowings and other factors, and may invest in additional amounts. FHLB and Federal Reserve Bank stock is carried at cost, classified as a restricted security, and periodically evaluated for impairment based on ultimate recovery of par value. Both cash and stock dividends are reported on the Consolidated Statements of Operations under Interest and Dividend Income from Other Interest-Earning Assets.
Loans Held-For-Sale, Carried at Fair Value:
Loans held for sale, carried at fair value, are conforming SFR mortgage loans that are originated and intended for sale in the secondary market, repurchased loans that were previously sold to Ginnie Mae and other GSEs, and loans sold to Ginnie Mae that are delinquent more than 90 days and subject to a unilateral purchase option by the Company. The fair value of loans held-for-sale is based on commitments outstanding from investors as well as what secondary market investors are currently offering for portfolios with similar characteristics, except for loans that are repurchased out of Ginnie Mae loan pools, and loans sold to Ginnie Mae that are delinquent more than 90 days and subject to a unilateral purchase option by the Company, which are valued based on an internal model.
Loans Held-for-Sale, Carried at Lower of Cost or Fair Value:
The Company records non-conforming jumbo mortgage loans held-for-sale and certain commercial loans held-for-sale at the lower of cost or fair value, on an aggregate basis. Deferred loan origination fees and costs or purchase discounts or premiums included in the carrying value of the loans are not amortized and are included in the determination of gains or losses from the sale of the related loans. A valuation allowance is established if the fair value of such loans is lower than their cost, with a corresponding charge to noninterest income. When the Company changes its intent to hold loans for investment, the loans are transferred to held-for-sale at lower of cost or fair value on the transfer date and amortization of deferred fees and costs or purchase discounts or premiums is ceased. If a determination is made that a loan held-for-sale cannot be sold in the foreseeable future, it is held-for-investment at lower of cost or fair value on the transfer date.
Loans and Leases:
When a determination is made at the time of commitment to originate or purchase loans as held-for-investment, it is the Company’s intent to hold these loans to maturity or for the foreseeable future, subject to periodic review under the Company’s management evaluation processes, including asset/liability management. Loans and leases, other than PCI loans, that management has the intent and ability to hold for the foreseeable future, or until maturity or payoff are recorded at the principal balance outstanding, net of charge-offs, unamortized purchase premiums and discounts, and deferred loan fees and costs. Amortization of deferred loan origination fees and costs or purchase premiums and discounts are recognized in interest income as an adjustment to yield over the terms of loans and leases using the effective interest method. Deferred loan origination fees and costs on revolving lines of credit are amortized using the straight line method. Interest on loans and leases is credited to interest income as earned based on the interest rate applied to principal amounts outstanding. Interest income is accrued on the unpaid principal balance and is discontinued when management believes, after considering economic and business conditions and collection efforts, that the borrower’s financial condition is such that full collection of principal or interest becomes doubtful, regardless of the length of past due status. Generally, loans and leases are placed on non-accrual status when scheduled payments become past due for
90 days
or more. When accrual of interest is discontinued, any unpaid accrued interest receivable is reversed against interest income. Interest received on such loans and leases is accounted for on the cash-basis or cost-recovery method, until qualifying for return to accrual. Loans are returned to accrual status when all the principal and interest amounts contractually due are brought current and future payments are reasonably assured. A charge-off is generally recorded at
180 days
past due for SFR mortgage loans if the unpaid principal balance exceeds the fair value of the collateral less costs to sell. Commercial and industrial and commercial real estate loans and lease financings are subject to a detailed review when 90 days past due to determine accrual status, or when payment is uncertain and a specific consideration is made to put a loan or lease on non-accrual status. A charge-off for commercial and industrial and commercial real estate loans, and lease financing is recorded when a loss is confirmed. Consumer loans, other than those secured by real estate, are typically charged off no later than 120 days past due. Loans and leases are returned to accrual status when the payment status becomes current or is restructured and the borrower has demonstrated a satisfactory payment trend subject to management’s assessment of the borrower’s ability to repay the loan or lease.
Allowance for Loan and Lease Losses:
The ALLL is a reserve established through a provision for loan and lease losses, and represents management’s best estimate of probable losses that may be incurred within the existing loan and lease portfolio as of the date of the consolidated statements of financial condition. Confirmed losses are charged against the ALLL. Subsequent recoveries, if any, are credited to the ALLL. The Company performs an analysis of the adequacy of the ALLL at least quarterly. Management estimates the required ALLL balance using past loan and lease loss experience, the nature and volume of the portfolio, information about specific borrower situations and estimated collateral values, economic conditions, and other factors. The ALLL consists of three elements; (i) a specific allowance established for probable losses on individually identified impaired loans and leases, (ii) a quantitative allowance calculated using historical loss experience adjusted as necessary to reflect current conditions; and (iii) a qualitative allowance to capture economic, underwriting, process, credit, and other factors and trends that are not adequately reflected in the historical loss rates.
107
A loan or lease is deemed impaired when, based on current information and events, it is probable that the Company will be unable to collect all amounts due according to the contractual terms of the loan or lease agreement. The Company measures expected credit losses on all impaired loans and leases individually under the guidance of ASC 310,
Receivables
, primarily through the evaluation of collateral values and estimated cash flows expected to be collected. Cash receipts on impaired loans for which the accrual of interest has been discontinued are applied first to principal and then to interest income. Loans for which the terms have been modified by granting a concession that normally would not be provided and where the borrower is experiencing financial difficulties are considered TDRs and classified as impaired.
Factors considered by management in determining impairment include payment status, collateral value, and the probability of collecting scheduled principal and interest payments when due. Loans that experience insignificant payment delays and payment shortfalls generally are not classified as impaired. Management determines the significance of payment delays and payment shortfalls on a case-by-case basis, taking into consideration all of the circumstances surrounding the loan and the borrower, including the length of the delay, the reasons for the delay, the borrower’s prior payment record, and the amount of the shortfall in relation to the principal and interest owed. The impairment amount on a collateral dependent loan is generally charged-off to the ALLL, and the impairment amount on a loan that is not collateral dependent is set-up as a specific reserve. TDRs are also measured at the present value of estimated future cash flows using the loan’s effective rate at inception or at the fair value of collateral, less costs to sell, if repayment is expected solely from the collateral. For TDRs that subsequently default, the Company determines the amount of reserve in accordance with the accounting policy for the ALLL.
At
December 31, 2018
, the following loan and lease portfolio segments have been identified:
|
•
|
Commercial and industrial (general commercial and industrial, warehouse lending, and direct leveraged lending)
|
|
•
|
Commercial real estate
|
|
•
|
Multifamily
|
|
•
|
SBA
|
|
•
|
Construction
|
|
•
|
SFR - 1st deeds of trust (general SFR mortgage and other)
|
|
•
|
Indirect Leverage Lending
|
|
•
|
Warehouse FixNFlip
|
|
•
|
Other consumer (HELOC and other)
|
The Company categorizes loans and leases into risk categories based on relevant information about the ability of borrowers and lessees (also referred to as borrowers) to service their obligations such as: current financial information, historical payment experience, credit documentation, public information, and current economic trends, among other factors. The Company analyzes loans and leases individually by classifying the loans and leases as to credit risk.
Loans secured by multifamily and commercial real estate properties generally involve a greater degree of credit risk than SFR mortgage loans. Because payments on loans secured by multifamily and commercial real estate properties are often dependent on the successful operation or management of the properties, repayment of these loans may be subject to adverse conditions in the real estate market or the economy. Commercial and industrial loans are also considered to have a greater degree of credit risk than SFR mortgage loans due to the fact commercial and industrial loans are typically made on the basis of the borrower’s ability to make repayment from the cash flow of the borrower’s business. As a result, the availability of funds for the repayment of commercial and industrial loans may be substantially dependent on the success of the business itself (which, in turn, is often dependent in part upon general economic conditions). SBA loans are similar to commercial and industrial loans, but have additional credit enhancement provided by the U.S. Small Business Administration, for up to
85 percent
of the loan amount for loans up to $150 thousand and
75 percent
of the loan amount for loans of more than $150 thousand. As a result, the availability of funds for the repayment of lease financing may be substantially dependent on the success of the business itself (which, in turn, is often dependent in part upon general economic conditions). Consumer loans may entail greater risk than SFR mortgage loans given that collection of these loans is dependent on the borrower’s continuing financial stability and, thus, are more likely to be adversely affected by job loss, divorce, illness, or personal bankruptcy.
Green Loans are also considered to carry a higher degree of credit risk due to their unique cash flows. Credit risk on this asset class is also managed through the completion of regular AVMs of the underlying collateral and monitoring of the borrower’s usage of this account to determine if the borrower is making monthly payments from external sources or “drawdowns” on their line. In cases where the property values have declined to levels less than the original LTV ratios, or other levels deemed prudent by the Company, the Company may curtail the line and/or require monthly payments or principal reductions to bring the loan in balance.
On the interest only loans, the Company projects future payment changes to determine if there will be a material increase in the required payment and then monitors the loans for possible delinquency. Individual loans are monitored for possible downgrading of risk rating.
108
Troubled Debt Restructurings:
A loan is identified as a TDR when a borrower is experiencing financial difficulties and for economic or legal reasons related to these difficulties, the Company grants a concession to the borrower in the restructuring that it would not otherwise consider. The Company has granted a concession when, as a result of the restructuring to a troubled borrower, it does not expect to collect all amounts due, including principal and/or interest accrued at the original terms of the loan. The concessions may be granted in various forms, including a below-market change in the stated interest rate, a reduction in the loan balance or accrued interest, an extension of the maturity date, or a note split with principal forgiveness. Loans for which the borrower has been discharged under Chapter 7 bankruptcy are considered collateral dependent TDRs, impaired at the date of discharge, and charged down to the fair value of collateral less cost to sell. A restructuring executed at an interest rate that is at market interest rates based on the current credit characteristics of the borrower is not a TDR.
The Company’s policy is to place consumer loan TDRs, except those that were performing prior to TDR status, on non-accrual status for a minimum period of
6 months
. Commercial TDRs are evaluated on a case-by-case basis for determination of whether or not to place them on non-accrual status. Loans qualify for return to accrual status once they have demonstrated performance under the restructured terms of the loan for a minimum of 6 months. Initially, all TDRs are reported as impaired. Generally, TDRs are classified as impaired loans and reported as TDRs for the remaining life of the loan. Impaired and TDR classification may be removed if the borrower demonstrates compliance with the modified terms for a minimum of
6 months
and through one fiscal year-end and the restructuring agreement specifies a market rate of interest equal to that which would be provided to a borrower with similar credit at the time of restructuring. In the limited circumstance that a loan is removed from TDR classification, it is the Company’s policy to continue to base its measure of loan impairment on the contractual terms specified by the loan agreement.
Other Real Estate Owned:
OREO, which represents real estate acquired through foreclosure in satisfaction of commercial and real estate loans, is initially recorded at fair value less estimated selling costs of the real estate, based on current independent appraisals obtained at the time of acquisition, less costs to sell when acquired, establishing a new cost basis. Loan balances in excess of fair value of the real estate acquired at the date of acquisition are charged off against the ALLL. A valuation allowance is established for any subsequent declines in fair value less estimated selling costs and adjusted as applicable. Gains and losses on the sale of OREO and reductions in fair value subsequent to foreclosure, and any subsequent operating expenses or income of such properties are included in All Other Expense on the Consolidated Statements of Operations.
Bank Owned Life Insurance:
The Bank has purchased life insurance policies on certain key employees. BOLI is recorded at the amount that can be realized under the insurance contract, which is the cash surrender value.
Premises, Equipment, and Capital Leases:
Land is carried at cost. Premises and equipment are recorded at cost less accumulated depreciation. The straight-line method is used for depreciation with the following estimated useful lives: building -
40 years
and leasehold improvements - life of lease, and furniture, fixtures, and equipment -
3
to
7 years
. Maintenance and repairs are expensed as incurred and improvements that extend the useful lives of assets are capitalized.
Servicing Rights - Mortgage (Carried at Fair Value):
A servicing asset or liability is recognized when undertaking an obligation to service a financial asset under a mortgage servicing contract, as a result of the transfer of the Company's financial assets that meet the requirements for sale accounting. Such servicing asset or liability is initially measured at fair value based on either market prices for comparable servicing contracts or alternatively is based on a valuation model that is based on the present value of the contractually specified servicing fee, net of servicing costs, over the estimated life of the loan, using a discount rate based on the related loan rate and is recorded on the Consolidated Statements of Financial Condition.
The Company measures servicing rights at fair value at each reporting date and reports changes in fair value of servicing assets in earnings in the period in which the changes occur, and such changes are included within Net Revenue on Mortgage Banking Activities on the Statements of Operations of discontinued operations. The fair values of servicing rights are subject to significant fluctuations as a result of changes in estimates and actual prepayment speeds and default rates and losses. Currently the Company does not hedge the effects of changes in fair value of its servicing assets. At
December 31, 2018
, MSRs of
$66 thousand
were classified as held-for-sale and valued based on a market bid adjusted for estimated early payoffs and paydowns.
Servicing fee income, which is reported in Loan Servicing Income on the Consolidated Statements of Operations, is recorded for fees earned for servicing loans. The fees are based on a contractual percentage of the outstanding principal; or a fixed amount per loan and are recorded as income when earned. Late fees and ancillary fees related to loan servicing are not material.
109
Servicing Rights - SBA Loans (Carried at Lower of Cost or Fair Value):
The Bank originates and sells the guaranteed portion of its SBA loans. To calculate the gain (loss) on sales of SBA loans, the Bank’s investment in the loan is allocated among the retained portion of the loan, the servicing retained, the interest-only strip and the sold portion of the loan, based on the relative fair market value of each portion. The gain (loss) on the sold portion of the loan is recognized at the time of sale based on the difference between sale proceeds and the amount of the allocated investment to the sold portion of the loan.
The portion of the servicing fees that represent contractually specified servicing fees (contractual servicing) is reflected as a servicing asset and is amortized over the estimated life of the servicing. In the event future prepayments exceed management’s estimates and future expected cash flows are inadequate to cover the servicing asset, impairment is recognized. The portion of servicing fees in excess of contractual servicing fees is reflected as interest-only strip receivables. Interest-only strip receivables are carried at fair value, with unrealized gains and losses recorded on the Consolidated Statements of Operations. The Company had no interest-only strip receivables at
December 31, 2018
and
2017
.
Goodwill and Other Intangible Assets:
Goodwill represents the excess purchase price of businesses acquired over the fair value of the identifiable net assets acquired and is assigned to specific reporting units. Goodwill is not subject to amortization and is evaluated for impairment at least annually, normally during the third fiscal quarter, or more frequently in the interim if events occur or circumstances change indicating it would more likely than not result in a reduction of the fair value of a reporting unit below its carrying value. Goodwill is evaluated for impairment by either performing a qualitative evaluation or a two-step quantitative test.
The qualitative evaluation is an assessment of factors to determine whether it is more likely than not that the fair value of a reporting unit is less than its carrying amount (Step 0). If it is more likely than not that the fair value of a reporting unit is below its carrying value based on the Step 0 analysis, the Company performs Step 1 of the two-step quantitative test. In Step 1, the fair value of a reporting unit is compared to its carrying amount, including goodwill. The Company determines the estimated fair value of each reporting unit using a discounted cash flow analysis. Discounted cash flow estimates include significant management assumptions relating to revenue growth rates, net interest margins, weighted-average cost of capital, and future economic and market conditions. If the fair value of the reporting unit exceeds its carrying amount, goodwill of the reporting unit is not considered impaired, and it is not necessary to continue to Step 2 of the impairment process. Otherwise, Step 2 is performed where the implied fair value of goodwill is compared to the carrying value of goodwill in the reporting unit. If a reporting unit's carrying value exceeds fair value, the difference is charged to noninterest expense.
Other intangible assets represent purchased assets that lack physical substance but can be distinguished from goodwill because of contractual or other legal rights, or because the asset is capable of being sold or exchanged either separately or in combination with a related contract, asset or liability. Other intangible assets with finite useful lives are amortized to noninterest expense over their estimated useful lives and are evaluated for impairment whenever events occur or circumstances change indicating the carrying amount of the asset may not be recoverable.
Alternative Energy Partnerships:
The Company invests in certain alternative energy partnerships (limited liability companies) formed to provide sustainable energy projects that are designed to generate a return primarily through the realization of federal tax credits (energy tax credits) and other tax credits. The Company is a limited partner in these partnerships, which were formed to invest in newly installed residential rooftop solar leases and power purchase agreements.
As the Company’s respective investments in these entities are more than minor, the Company has significant influence, but not control, over the investee’s activities that most significantly impact its economic performance. As a result, the Company is required to apply the equity method of accounting, which generally prescribes applying the percentage ownership interest to the investee’s GAAP net income in order to determine the investor’s earnings or losses in a given period. However, because the liquidation rights, tax credit allocations and other benefits to investors can change upon the occurrence of specified events, application of the equity method based on the underlying ownership percentages would not accurately represent the Company’s investment. As a result, the Company applies the HLBV method of the equity method of accounting. The HLBV method is a balance sheet approach where a calculation is prepared at each balance sheet date to estimate the amount that the Company would receive if the equity investment entity were to liquidate all of its assets (as valued in accordance with GAAP) and distribute that cash to the investors based on the contractually defined liquidation priorities. The difference between the calculated liquidation distribution amounts at the beginning and the end of the reporting period, after adjusting for capital contributions and distributions, is the Company’s share of the earnings or losses from the equity investment for the period.
To account for the tax credits earned on investments in alternative energy partnerships, the Company uses the flow-through income statement method. Under this method, the tax credits are recognized as a reduction to income tax expense and the initial book-tax differences in the basis of the investments are recognized as additional tax expense in the year they are earned. The Company does not believe the investments in alternative energy partnerships are impaired by the lower corporate income tax rate from the Tax Cuts and Jobs Act of 2017 due to the protective provision built into the partnership agreements; however, the Company expects to take longer to utilize the investment tax credits generated from these investments.
110
Affordable Housing Fund Investment:
The Company has invested in limited partnerships that were formed to develop and operate several apartment complexes designed as high-quality affordable housing for lower income tenants throughout the State of California and other states. The Company accounts for these investments under the proportional amortization method. The Company’s ownership in each limited partnership varies from
8 percent
to
23 percent
. Each of the partnerships must meet the regulatory minimum requirements for affordable housing for a minimum
15
-year compliance period to fully utilize the tax credits. If the partnerships cease to qualify during the compliance period, the credit may be denied for any period in which the project is not in compliance and a portion of the credit previously taken is subject to recapture with interest.
As part of the 2017 Tax Cuts and Jobs Act, investments accounted for under the proportional amortization method are required to be tested for impairment when events or changes in circumstances indicate that it is more-likely-than-not that the carrying amount of the investment will not be realized. Impairment is measured as the difference between the investment’s carrying amount and its fair value.
Long-Term Assets:
Premises and equipment and other long-term assets are reviewed for impairment when events indicate their carrying amount may not be recoverable from future undiscounted cash flows. If impaired, the assets are recorded at fair value, less selling costs. For impairment purposes, fair value is determined utilizing market values of similar assets or replacement cost as applicable.
Reserve for Loss on Repurchased Loans:
In the ordinary course of business, as loans are sold, the Bank makes standard industry representations and warranties about the loans. The Bank may have to subsequently repurchase certain loans or reimburse certain investor losses that may have occurred due to defects in the origination of the loans. Such defects include documentation or underwriting errors. In addition, certain investor contracts require the Bank to repurchase loans from previous whole loan sales transactions that experience early payment defaults. If no losses are sustained due to such defects or early payment defaults, the Bank has no obligation to repurchase the loans. In addition, we have the option to buy out severely delinquent loans at par from Ginnie Mae pools for which we are the servicer and issuer of the pool. When such loans are repurchased, they are recorded initially at fair value at the time of repurchase. The resulting loss is charged against the repurchase reserve, typically the difference between unpaid principal balance plus accrued interest and the fair value at the time of repurchase. The reserve for loss on repurchased loans is an estimate that requires management judgment. The Bank’s reserve is based on expected future repurchase trends for loans already sold, and the expected loss recognized when such loans are repurchased, which include first and second trust deed loans. If loss reimbursements are made directly to the investor, the reserve for loss on repurchased loans is charged for the reimbursement losses incurred.
Reserve for Unfunded Loan Commitments:
The reserve for unfunded loan commitments provides for probable losses inherent with funding the unused portion of legal commitments to lend. The reserve for unfunded loan commitments includes factors that are consistent with ALLL methodology using the expected loss factors and a draw down factor applied to the underlying borrower risk and facility grades. Changes in the reserve for unfunded loan commitments are reported as a component of All Other Expense on the Consolidated Statements of Operations.
Deferred Financing Costs:
Deferred financing costs associated with the Company’s senior notes and junior subordinated amortizing notes (Amortizing Notes) are included in Long-Term Debt, Net on the Consolidated Statements of Financial Condition. The deferred financing costs are being amortized on a basis that approximates a level yield method over the
8
year term of the senior notes. On May 15, 2017, the Company made the final installment payment on the Amortizing Notes and there were no outstanding Amortizing Notes at December 31, 2017. The deferred financing costs of Amortizing Notes were amortized on a basis that approximates a level yield method over the
5
year term.
Loan Commitments and Related Financial Instruments:
Financial instruments include off-balance sheet credit instruments, such as commitments to make loans and commercial letters of credit, issued to meet customer financing needs. The face amount for these items represents the exposure to loss, before considering customer collateral or ability to repay. Such financial instruments are recorded when they are funded.
Stock-Based Compensation:
Compensation cost is recognized for stock options, restricted stock awards and units, and stock appreciation rights issued to employees and directors, based on the fair value of these awards at the date of grant. A Black-Scholes model is utilized to estimate the fair value of stock options and stock appreciation rights, while the market price of the Company’s voting common stock at the date of grant is used for restricted stock awards and units. Generally, compensation cost is recognized over the required service period, defined as meeting performance goals and the vesting period. For awards with graded vesting, compensation cost is recognized on a straight-line basis over the requisite service period for the entire award. Compensation cost reflects estimated forfeitures, adjusted as necessary for actual forfeitures.
Income Taxes:
Income tax expense is the total of the current year income tax due or refundable and the change in deferred tax assets and liabilities. Deferred income tax assets and liabilities are computed for differences between the financial statement and tax basis of assets and liabilities that will result in taxable or deductible amounts in the future based on enacted tax laws and rates applicable to the periods in which the differences are expected to affect taxable income. Deferred tax assets are also recognized for operating loss and tax credit carryforwards. Accounting guidance requires that companies assess whether a
111
valuation allowance should be established against the deferred tax assets based on the consideration of all available evidence using a “more likely than not” standard.
Deferred tax assets are reduced by a valuation allowance when, in the opinion of management, it is more likely than not that some portion, or all, of the deferred tax asset will not be realized. In assessing the realization of deferred tax assets, management evaluates both positive and negative evidence on a quarterly basis, including the reversal of its taxable temporary differences, the existence of its historical earnings, the amounts of future projected earnings as well as the tax expiration periods of its income tax credits.
The Company and its subsidiaries are subject to U.S. Federal income tax as well as income tax in multiple state jurisdictions. The Company is no longer subject to examination by U.S. Federal taxing authorities for years before 2015. The statute of limitations for the assessment of California Franchise taxes has expired for tax years before 2014; other state income and franchise tax statutes of limitations vary by state.
Tax positions that are uncertain but meet a more-likely-than-not, recognition threshold are initially and subsequently measured as the largest amount of tax benefit that has a greater than 50 percent likelihood of being realized upon settlement with a taxing authority that has full knowledge of all relevant information. The determination of whether or not a tax position meets the more likely than not recognition threshold considers the facts, circumstances and information available at the reporting date and is subject to management's judgment.
The Company early adopted ASU 2018-02 effective January 1, 2018. As a result of the adoption, the Company reclassifies stranded tax effects from accumulated other comprehensive income to retained earnings in which the effect of changes in corporate income tax rates related to Tax Cuts and Jobs Act of 2017 was recorded.
Earnings Per Common Share:
Earnings per common share is computed under the two-class method. Basic EPS is computed by dividing net income allocated to common stockholders by the weighted-average number of shares outstanding, including the minimum number of shares issuable under purchase contracts relating to the tangible equity units (see the discussion of the tangible equity units in Note 18). Diluted EPS is computed by dividing net income allocated to common stockholders by the weighted-average number of shares outstanding, adjusted for the dilutive effect of the restricted stock units, the potentially issuable shares in excess of the minimum under purchase contracts relating to the tangible equity units, outstanding stock options, preferred stock redemption, and warrants to purchase common stock. Net income allocated to common stockholders is computed by subtracting income allocated to participating securities, participating securities dividends and preferred stock dividend from net income. Participating securities are instruments granted in stock-based payment transactions that contain rights to receive non-forfeitable dividends or dividend equivalents, which includes the Stock Appreciation Rights to the extent they confer dividend equivalent rights.
Comprehensive Income:
Comprehensive income consists of net income and other comprehensive income or loss. Other comprehensive income or loss includes unrealized gains and losses on securities available-for-sale, net of tax, which are recognized as a separate component of stockholders’ equity.
Derivative Instruments:
The Company records its derivative instruments at fair value as either assets or liabilities on the Consolidated Statements of Financial Condition in Other Assets and Accrued Expenses and Other Liabilities, respectively, and has elected to present all derivatives with counterparties on a gross basis. For hedged derivatives, the Company records changes in fair value in AOCI on the Consolidated Statements of Financial Condition and records any hedge ineffectiveness in Other Income on the Consolidated Statements of Operations. For non-hedged derivatives, the Company records changes in fair value in Net Revenue on Mortgage Banking Activities or Other Income on the Consolidated Statements of Operations.
Interest Rate Swaps and Caps.
The Company offers interest rate swaps and caps products to certain loan customers to allow them to hedge the risk of rising interest rates on their variable rate loans. The Company originates a variable rate loan and enters into a variable-to-fixed interest rate swap with the customer. The Company also enters into an offsetting swap with a correspondent bank. These back-to-back agreements are intended to offset each other and allow the Company to originate a variable rate loan, while providing a contract for fixed interest payments for the customer. The net cash flow for the Company is equal to the interest income received from a variable rate loan originated with the customer. The Company accounts for these derivative instruments as non-hedged derivatives with changes in fair value recorded to earnings each period. The changes in fair value on these instruments are recorded in Other Income on the Consolidated Statements of Operations.
Foreign Exchange Contracts
.
The Company offers short-term foreign exchange contracts to its customers to purchase and/or sell foreign currencies at set rates in the future. These products allow customers to hedge the foreign exchange rate risk of their deposits and loans denominated in foreign currencies. In conjunction with these products the Company also enters into offsetting contracts with institutional counterparties to hedge the Company’s foreign exchange rate risk. These back-to-back contracts allow the Company to offer its customers foreign exchange products while minimizing its exposure to foreign exchange rate fluctuations. The fair value of these instruments is determined at each reporting date based on the change in the foreign exchange rate. Given the short-term nature of the contracts, the counterparties’ credit risks are considered nominal and
112
resulted in no adjustments to the valuation of the short-term foreign exchange contracts. The changes in fair value on these instruments are recorded in Other Income on the Consolidated Statements of Operations.
Fair Values of Financial Instruments:
The Company measures certain assets and liabilities on a fair value basis, in accordance with ASC Topic 820, "Fair Value Measurement." Fair value is used on a recurring basis for certain assets and liabilities in which fair value is the primary basis of accounting. Examples of these include derivative instruments and available-for-sale securities. Additionally, fair value is used on a non-recurring basis to evaluate assets or liabilities for impairment in accordance with ASC Topic 825, "Financial Instruments." Examples of these include impaired loans, long-lived assets, OREO, goodwill, and core deposit intangible assets as well as loans held-for-sale accounted for at the lower of cost or fair value.
Fair value is the exchange price that would be received for an asset or paid to transfer a liability in an orderly transaction between market participants. When observable market prices are not available, fair value is estimated using modeling techniques such as discounted cash flow analysis. These modeling techniques utilize assumptions that market participants would use in pricing the asset or the liability, including assumptions about the risk inherent in a particular valuation technique, the effect of a restriction on the sale or use of an asset, and the risk of nonperformance. Depending on the nature of the asset or liability, the Company uses various valuation techniques and assumptions when estimating the instrument’s fair value. Considerable judgment may be involved in determining the amount that is most representative of fair value.
To increase consistency and comparability of fair value measures, ASC Topic 820, "Fair Value Measurement" established a three-level hierarchy to prioritize the inputs used in valuation techniques between observable inputs among (i) observable inputs that reflect quoted prices in active markets, (ii) inputs other than quoted prices with observable market data, and (iii) unobservable data such as the Company’s own data or single dealer non-binding pricing quotes. The Company assesses the valuation hierarchy for each asset or liability measured at the end of each quarter; as a result, assets or liabilities may be transferred within hierarchy levels due to changes in availability of observable market inputs to measure fair value at the measurement date.
Transfer of Financial Assets:
Transfers of financial assets are accounted for as sales when control over the assets has been surrendered. Control over transferred assets is generally considered to have been surrendered when (i) the transferred assets are legally isolated from the Company or its consolidated affiliates, even in bankruptcy or other receivership, (ii) the transferee has the right to pledge or exchange the assets with no conditions that constrain the transferee or provide more than a trivial benefit to the Company, and (iii) the Company does not maintain an obligation or the unilateral ability to reclaim or repurchase the assets.
The Company has sold financial assets in the normal course of business, the majority of which are residential mortgage loan sales primarily to GSEs through the Company's mortgage banking activities and other individual or portfolio loans and securities sales. In accordance with accounting guidance for asset transfers, the Company considers any ongoing involvement with transferred assets in determining whether the assets can be derecognized from the balance sheet. With the exception of servicing and certain performance-based guarantees, the Company’s continuing involvement with financial assets sold is minimal and generally limited to market customary representation and warranty clauses.
When the Company sells financial assets, it may retain servicing rights and/or other interests in the financial assets. The gain or loss on sale depends on the previous carrying amount of the transferred financial assets and the fair value of the consideration received, including cash, originated mortgage servicing rights and other interests in the sold assets, and any liabilities incurred in exchange for the transferred assets. Upon transfer, any servicing assets and other interests retained by the Company are carried at fair value or the lower of cost or fair value.
Loss Contingencies:
Loss contingencies, including claims and legal actions, are recorded as liabilities when the likelihood of loss is probable and an amount or range of loss can be reasonably estimated. Management does not believe there are any such matters that will have a material effect on the consolidated financial statements that are not currently accrued for.
Dividend Restriction:
Banking regulations require maintaining certain capital levels and may limit the dividends paid by the Bank to the Company or by the Company to its stockholders.
113
Fee Revenue:
Generally, fee revenue from deposit service charges and loans is recognized when earned, except where collection is uncertain, in which case revenue is recognized when received. As ASC 606 become effective in 2018, the Company has evaluated the accounting impact of adopting this guidance. The scope of this guidance explicitly excludes net interest income, as well as other revenues from transactions involving financial instruments such as loans, leases, and securities. Certain noninterest income items such as service charges on deposits accounts, gain and loss on other real estate owned sales, and other income items are within the scope of this guidance. The Company identified and reviewed revenue streams within the scope of this guidance, including escrow fees, trust and fiduciary fees, deposit service fees, debit card fees, investment commissions, and gains on sales of OREO, which represent a significant portion of the Company’s noninterest income that falls into the scope of this guidance. Based on its review, the Company determined that this guidance did not require significant changes to the manner in which income from those revenue streams within the scope of ASC 606 is currently recognized.
Marketing Costs:
Marketing costs are expensed as incurred.
Adopted Accounting Pronouncements:
During the year ended December 31, 2018, the following pronouncements applicable to the Company were adopted:
In May 2014, the FASB issued Accounting Standard Update (ASU) 2014-09, “Revenue from Contracts with Customers (Topic 606).”
This Update outlines a single comprehensive model for entities to use in accounting for revenue arising from contracts with customers and supersedes most current revenue recognition guidance, including industry-specific guidance. The model is based on the principle that an entity should recognize revenue to depict the transfer of goods or services to customers in an amount that reflects the consideration to which the entity expects to be entitled in exchange for those goods or services. This Update also requires additional disclosure about the nature, amount, timing and uncertainty of revenue and cash flows arising from customer contracts, including significant judgments and changes in judgments and assets recognized from costs incurred to fulfill a contract. The Update, as amended by ASU 2015-14, ASU 2016-08, ASU 2016-10, ASU 2016-12, ASU 2016-20, ASU 2017-13, and ASU 2017-14, is effective for interim and annual periods beginning after December 15, 2017. The Company’s revenue streams primarily consist of net interest income and noninterest income. The scope of this Update explicitly excludes net interest income, as well as other revenues from transactions involving financial instruments, such as loans, leases, and securities. Certain noninterest income items such as service charges on deposits accounts, gain and loss on other real estate owned sales, and other income items are within the scope of this Update. The Company evaluated the accounting impact of adopting this guidance based on the following “Five-step Model” prescribed in ASC 606:
|
1.
|
identify the contract;
|
|
2.
|
identify the performance obligation in the contract;
|
|
3.
|
determine the transaction price;
|
|
4.
|
allocate the transaction price to the performance obligation; and
|
|
5.
|
recognize revenue when (or as) the performance obligation is satisfied.
|
The Company identified and reviewed the revenue streams within the scope of the Update, including escrow fees, trust and fiduciary fees, deposit service fees, debit card fees, investment commissions, gains on sales of OREO, referral fees, and income from joint marketing with a certain credit card company. The Company determined that the new guidance will not require significant changes to the manner in which income from those revenue streams is currently recognized. Adoption of the new guidance did not have a material impact on the Company's consolidated financial statements. However, the Company has enhanced its processes to identify contracts within the scope of Topic 606 and apply the Five-step Model to determine how revenue should be recognized. The Company adopted this Update and its related amendments effective January 1, 2018 utilizing the modified retrospective approach. Since there was no net income impact upon adoption of the new guidance, a cumulative effect adjustment to opening retained earnings was not deemed necessary. See Note 24 for additional information.
In January 2016, the FASB issued ASU 2016-01, “Financial Instruments-Overall (Subtopic 825-10): Recognition and Measurement of Financial Assets and Financial Liabilities.”
This Update amends certain aspects of recognition, measurement, presentation, and disclosure of financial instruments. The ASU requires equity investments (except those accounted for under the equity method of accounting or those that result in consolidation of the investee) to be measured at fair value with changes in fair value recognized in net income; simplifies the impairment assessment of equity investments by requiring a qualitative assessment; eliminates the requirement for public business entities to disclose methods and assumptions for financial instruments measured at amortized cost on the statement of financial position; requires the exit price notion to be used when measuring the fair value of financial instruments for disclosure purposes; requires an entity to present separately in other comprehensive income the portion of the total change in the fair value of a liability; requires separate presentation of financial assets and liabilities by measurement category; and certain other requirements. This ASU and ASU 2018-04 became effective for interim and annual periods beginning on or after December 15, 2017. Adoption of the new guidance did not have a material impact on the Company's consolidated financial statements. With regard to the aforementioned exit price notion, the Company measured the fair value of its loans and leases portfolio for disclosure purposes starting March 31, 2018 using an exit price notion. See Note 3 for additional information.
114
In August 2016, the FASB issued ASU 2016-15, "Statement of Cash Flows (Topic 230)." The amendments in this Update provide guidance on classification of certain cash receipts and cash payments.
For public business entities that are SEC filers, this Update was effective for fiscal years beginning after December 15, 2017, and interim periods within those fiscal years. Adoption of the new guidance did not have a material impact on the Company's consolidated financial statements.
In November 2016, the FASB issued ASU 2016-18, “Statement of Cash Flows (Topic 230).”
The amendments in this Update are intended to reduce diversity in practice regarding classification of changes in restricted cash, requiring an entity to provide changes in restricted cash and restricted cash equivalents during the period in a statement of cash flows. This Update is effective for public business entities with fiscal years beginning after December 15, 2017, including interim periods within those fiscal years. Adoption of the new guidance had no impact on the Company's consolidated financial statements.
In January 2017, the FASB issued ASU 2017-01, “Business Combinations (Topic 805).”
This Update provides guidance on evaluating whether transactions should be accounted for as an acquisition (or disposal) of assets or a businesses. This Update provides a more robust framework to use when determining whether a set of assets and activities represents a business. Public business entities must prospectively apply the amendment in this Update to annual periods beginning after December 15, 2017, including interim periods. Adoption of the new guidance had no impact on the Company's consolidated financial statements.
In February 2017, the FASB issued ASU 2017-05, “Other Income - Gains and Losses from the Derecognition of Nonfinancial Assets (Subtopic 610-20): Clarifying the Scope of Asset Derecognition Guidance and Accounting for Partial Sales of Nonfinancial Assets.”
This Update clarifies the scope and application of ASC 610-20 on the sale or transfer of nonfinancial assets, including real estate, and in substance nonfinancial assets to noncustomers, including partial sales. An entity should identify each distinct nonfinancial asset or in substance nonfinancial asset promised to a counterparty and derecognize each asset when the counterparty obtains control of it. In addition, the amendment requires an entity to derecognize a distinct nonfinancial asset, or an in-substance nonfinancial asset, in a partial sale transaction when the entity does not retain a controlling financial interest in the legal entity that holds the asset and transfers control of the asset. Once control is transferred, any non-controlling interest received is required to be measured at fair value. The new guidance was effective for public business entities in annual and interim reporting periods beginning after December 15, 2017. Adoption of the new guidance had no impact on the Company's consolidated financial statements.
In May 2017, the FASB issued ASU 2017-09, “Stock Compensation - Scope of Modification Accounting (Topic 718): Scope of Modification Accounting.”
This Update provides guidance on when changes to the terms or conditions of a share-based payment award are to be accounted for as modifications. Under the new guidance, entities are not required to apply modification accounting to a share-based payment award when the award’s fair value, vesting conditions, and classification as an entity or a liability instrument remain the same after the change. The new guidance was effective for all entities beginning after December 15, 2017, including interim periods within the fiscal year. Upon adoption, the guidance was applied prospectively to awards modified on or after the adoption date. Adoption of the new guidance had no impact on the Company's consolidated financial statements.
In February 2018, the FASB issued ASU 2018-02. "Income Statement - Reporting Comprehensive Income (Topic 220): Reclassification of Certain Tax Effects from Accumulated Other Comprehensive Income."
This Update allows a reclassification from accumulated other comprehensive income to retained earnings for stranded tax effects resulting from the Tax Cuts and Jobs Act. The amendments in this Update also require certain disclosures about stranded tax effects. The amendments in this Update are effective for all entities for fiscal years beginning after December 15, 2018, and interim periods within those fiscal years. Early adoption of the amendments in this Update is permitted, including adoption in any interim period for public business entities for reporting periods for which financial statements have not yet been issued. The Company early adopted this Update during the three months ended March 31, 2018 and reclassified its stranded tax effect in accumulated other comprehensive income that resulted from the change in the U.S. federal corporate tax rate to retained earnings.
In August 2018, the FASB issued ASU 2018-15. “Intangibles - Goodwill and Other - Internal-Use Software (Subtopic 350-40): Customer's Accounting for Implementation Costs Incurred in a Cloud Computing Arrangement That Is a Service Contract.”
The ASU reduces complexity for the accounting for costs of implementing a cloud computing service arrangement and was issued in response to a consensus reached by the FASB Emerging Issues Task Force. The amendments in this Update align the requirements for capitalizing implementation costs incurred in a hosting arrangement that is a service contract with the requirements for those incurred to develop or obtain internal-use software. The customer in a hosting arrangement that is a service contract is required to follow the guidance in Subtopic 350-40 to determine which implementation costs to capitalize as an asset related to the service contract. For public business entities, this guidance should be applied either retrospectively or prospectively and is effective for fiscal years beginning after December 15, 2019, and interim periods therein. Early adoption is permitted. The Company early adopted this guidance during the quarter ended June 30, 2018 to allow for the capitalization of implementation costs associated with cloud computing solutions. Adoption of the new guidance had no impact on the Company's consolidated financial statements.
115
Recent Accounting Guidance Not Yet Effective
In February 2016, the FASB established Topic 842, "Leases"
, by issuing Accounting Standards Update (ASU) No. 2016-02, which impacts our accounting for leases as a lessee. Topic 842 requires lessees to recognize leases on-balance sheet and disclose key information about leasing arrangements. Topic 842 was subsequently amended by ASU No. 2018-01, Land Easement Practical Expedient for Transition to Topic 842; ASU No. 2018-10, Codification Improvements to Topic 842, Leases; and ASU No. 2018-11, Targeted Improvements.
For lessees, the new standard establishes a right-of-use model (ROU) that requires a lessee to recognize a ROU asset and lease liability on the balance sheet for all leases with a term longer than 12 months. Leases will be classified as finance or operating, with classification affecting the pattern and classification of expense recognition in the income statement.
For lessors, a lease is a sales-type lease if any one of five criteria are met, each of which indicates that the lease, in effect, transfers control of the underlying asset to the lessee. If none of those five criteria are met, but two additional criteria are both met, indicating that the lessor has transferred substantially all the risks and benefits of the underlying asset to the lessee and a third party, the lease is a direct financing lease. All leases that are not sales-type or direct financing leases are operating leases.
The new standard is effective for us on January 1, 2019, with early adoption permitted. A modified retrospective transition approach is required, applying the new standard to all leases existing at the date of initial application. An entity may choose to use either its effective date or the beginning of the earliest comparative period presented in the financial statements as its date of initial application. If an entity chooses the second option, the transition requirements for existing leases also apply to leases entered into between the date of initial application and the effective date. The entity must also recast its comparative period financial statements and provide the disclosures required by the new standard for the comparative periods. We will adopt the new standard on January 1, 2019 and use the effective date as our date of initial application. Consequently, financial information will not be updated and the disclosures required under the new standard will not be provided for dates and periods before January 1, 2019. The new standard provides a number of optional practical expedients in transition. We will elect the ‘package of practical expedients’, which permits us not to reassess under the new standard our prior conclusions about lease identification, lease classification and initial direct costs. We will not expect to elect the use-of-hindsight or the practical expedient pertaining to land easements; the latter not being applicable to us.
As a lessee, we expect that this standard will have a material effect on our financial statements. We believe the most significant effects to the adoption of the new standard relate to the recognition of ROU assets and lease liabilities on our balance sheet for our real estate operating leases and providing significant new disclosures regarding our leasing activities. We do not expect significant changes in our leasing activities between now and adoption. On adoption, we currently expect to recognize additional operating liabilities ranging from
$23.0 million
to
$25.0 million
, with corresponding ROU assets of the same or less amount based on the present value of the remaining minimum rental payments under current leasing standards for existing operating leases. As a result, our capital ratios will be negatively impacted ranging from
2
to
5
basis points.
For lessees, the new standard also provides practical expedients for an entity’s ongoing accounting. Accordingly, as a lessee, we will elect the short-term lease recognition exemption for all leases that qualify. This means, for those leases that qualify, we will not recognize ROU assets or lease liabilities, and this includes not recognizing ROU assets or lease liabilities for existing short-term leases of those assets in transition. We also will elect the practical expedient to not separate lease and non-lease components for all of our leases.
As a lessor, the new standard will not have a material effect on our financial statements and do not expect significant changes in our leasing activities between now and adoption. We believe all of our leases will continue to be classified as operating leases under the new standard.
For lessors, while the new standard identifies common area building maintenance as a non-lease component of our real estate lease contracts, we will apply the practical expedient to account for our real estate leases and associated common area maintenance service components as a single, combined operating lease component. Consequently, the new standard’s changed guidance on contract components will not affect our financial reporting.
In June 2016, the FASB issued ASU 2016-13,
Financial Instruments-Credit Losses (Topic 326)
(“ASU 2016-13”).
This guidance is intended to provide financial statement users with more decision-useful information about the expected credit losses on financial instruments and other commitments to extend credit held by a reporting entity at each reporting date. To achieve this objective, the amendments in this guidance replace the incurred loss impairment methodology in current US GAAP with a methodology that reflects expected credit losses and requires consideration of a broader range of reasonable and supportable information to credit loss estimates. This ASU will be effective for fiscal years beginning after December 15, 2019. Early adoption is available as of the fiscal year beginning after December 15, 2018. Currently, the Company cannot reasonably estimate the impact that adoption of ASU 2016-13 will have on its Consolidated Financial Statements; however, the impact may be significant. That assessment is based upon the fact that, unlike the incurred loss models in existing GAAP, the current expected credit loss (“CECL”) model in ASU 2016-13 does not specify a threshold for the recognition of an impairment allowance. Rather, the Company will recognize an impairment allowance equal to its estimate of lifetime expected credit losses,
116
adjusted for prepayments, for in-scope financial instruments as of the end of the reporting period. Accordingly, the impairment allowance measured under the CECL model could increase significantly from the impairment allowance measured under the Company’s existing incurred loss model. We have established a working group under the direction of the CECL Committee composed of our Chief Financial Officer, Chief Credit Officer, Chief Risk Officer and Chief Accounting Officer. The Company has engaged a third-party vendor to assist in the CECL calculation and has developed an internal governance framework to oversee the CECL implementation. Other significant CECL implementation matters in process and being addressed by the Company include selecting loss estimation methodologies, identifying, sourcing and storing data, addressing data gaps, defining a reasonable and supportable forecast period, selecting historical loss information which will be reverted to, documenting the CECL estimation process, assessing the impact to internal controls over financial reporting, capital planning and seeking process approval from audit and regulatory stakeholders.
In January 2017, the FASB issued ASU No. 2017-04,
Intangibles - Goodwill and Other (Topic 350): Simplifying the Test for Goodwill Impairment
("ASU 2017-04").
The amendments in this ASU simplify how an entity is required to test goodwill for impairment by eliminating Step 2 from the goodwill impairment test. Step 2 measures a goodwill impairment loss by comparing the implied fair value of a reporting unit’s goodwill with the carrying amount of that goodwill. Instead, under the amendments in this ASU, an entity should perform its annual, or interim, goodwill impairment test by comparing the fair value of a reporting unit with its carrying amount. An entity still has the option to perform the qualitative assessment for a reporting unit to determine if the quantitative impairment test is necessary. ASU 2017-04 is effective for annual or interim goodwill impairment tests in fiscal years beginning after December 15, 2019. Early adoption is permitted for interim or annual goodwill impairment tests performed on testing dates after January 1, 2017. The Company does not expect the adoption of ASU 2017-04 to have a material impact on its consolidated financial statements.
In August 2018, the FASB issued ASU No. 2018-13,
Fair Value Measurement (Topic 820): Disclosure Framework-Changes to the Disclosure Requirements for Fair Value Measurement
("ASU 2018-13").
The primary objective of ASU 2018-13 is to improve the effectiveness of disclosures in the notes to financial statements. ASU 2018-13 is effective for interim and annual reporting periods beginning after December 15, 2019, although early adoption is permitted. The adoption of ASU 2018-13 is not expected to significantly impact the Company's consolidated financial statements.
117
NOTE 2 – SALES OF BRANCH, SUBSIDIARY AND BUSINESS UNITS
The Palisades Group Sale
On May 5, 2016, the Company completed the sale of all of its membership interests in The Palisades Group, a wholly owned subsidiary of the Company, to an entity wholly owned by Stephen Kirch and Jack Macdowell who serve as the Chief Executive Officer and Chief Investment Officer of The Palisades Group, respectively. As part of the sale, The Palisades Group issued to the Company a
10 percent
,
$5.0 million
note due
May 5, 2018
. The Company recognized a gain on sale of subsidiary of
$3.7 million
on its Consolidated Statements of Operations for the year ended December 31, 2016.
The following table summarizes the calculation of the gain on sale of The Palisades Group recognized:
|
($ in thousands)
|
Year Ended December 31, 2016
|
|||
|
Consideration received (paid)
|
||||
|
Liabilities forgiven by The Palisades Group
|
$
|
1,862
|
|
|
|
Liabilities assumed by the Company
|
(1,078
|
)
|
||
|
The Note
|
2,370
|
|
||
|
Aggregate fair value of consideration received
|
3,154
|
|
||
|
Less: net assets sold (carrying amount of The Palisades Group)
|
(540
|
)
|
||
|
Gain on sale of The Palisades Group
|
$
|
3,694
|
|
|
The Company estimated various potential future cash flow projection scenarios for The Palisades Group and established probability thresholds for each scenario to arrive at a probability weighted cash flow expectation, which was then discounted to yield a fair value of the Note at sale date of
$2.4 million
.
On September 28, 2016, the Note was paid in full in cash prior to maturity and the Company recognized an additional gain of
$2.8 million
, which is included in Other Income on the Consolidated Statements of Operations for the year ended December 31, 2016.
Commercial Equipment Finance Business Sale
On October 27, 2016, the Company sold its Commercial Equipment Finance business unit from its Commercial Banking segment to Hanmi. As part of the transaction, Hanmi acquired
$217.2 million
of equipment leases diversified across the U.S. with concentrations in California, Georgia and Texas. An additional
$25.4 million
of equipment leases were transferred during December 2016. Hanmi retained most of the Company’s former Commercial Equipment Finance employees. The Company recorded a gain on sale of business unit of
$2.6 million
in its Consolidated Statements of Operations during the year ended December 31, 2016.
Banc Home Loans Sale
On March 30, 2017, the Company completed the sale of specific assets and activities related to its Banc Home Loans division to Caliber Home Loans, Inc. (Caliber). The Banc Home Loans division largely represented the Company's Mortgage Banking segment, the activities of which related to originating, servicing, underwriting, funding and selling single family residential (SFR) mortgage loans. Assets sold to Caliber included mortgage servicing rights (MSRs) on certain conventional agency SFR mortgage loans. The Banc Home Loans division, along with certain other mortgage banking related assets and liabilities that were sold or settled separately within one year, is classified as discontinued operations in the accompanying Consolidated Statements of Financial Condition and Consolidated Statements of Operations. Certain components of the Company’s Mortgage Banking segment, including MSRs on certain conventional agency SFR mortgage loans that were not sold as part of the Banc Home Loans sale and repurchase reserves related to previously sold loans, have been classified as continuing operations in the consolidated financial statements as they remain part of the Company’s ongoing operations.
The specific assets acquired by Caliber include, among other things, the leases relating to the Company’s dedicated mortgage loan origination offices and rights to certain portions of the Company’s unlocked pipeline of residential mortgage loan applications. Caliber has assumed certain obligations and liabilities of the Company under the acquired leases, and with respect to the employment of transferred employees. The Company received a
$25.0 million
cash premium payment, in addition to the net book value of certain assets acquired by Caliber, totaling
$2.5 million
, upon the closing of the transaction. Additionally, the Company could receive an earn-out, payable quarterly, based on future performance over the 38 months following completion of the transaction. During the year ended
December 31, 2018
and
2017
, the Company recognized an earn-out of
$2.8 million
and
$1.1 million
, respectively. Since the completion of the transaction, the Company has recognized a total earn-out of
$4.0 million
in Income from Discontinued Operations on the Consolidated Statements of Operations. Caliber retains an option to buy out the future earn-out payable to the Company for cash consideration of
$35.0 million
, less the aggregate amount of all earn-out payments made prior to the date on which Caliber pays the buyout amount.
118
Caliber also purchased the MSRs of
$37.8 million
on approximately
$3.86 billion
in unpaid balances of conventional agency mortgage loans, subject to adjustment under certain circumstances. During the year ended
December 31, 2018
and
2017
, the Company recorded
$1.4 million
and
$13.8 million
, respectively, to net gain on disposal of discontinued operations. Net gain on
disposal of discontinued operations recognized in the first half of 2018 was primarily the result of the release of
$1.0 million
in
liability for estimated discretionary incentive compensation payments to certain employees transferred to Caliber as the amount
paid was less than the accrued liability. During the two years ended December 31, 2018, the entire transaction has resulted in a net gain on disposal of
$15.2 million
.
The Banc Home Loans division originated conforming SFR mortgage loans and sold these loans in the secondary market. The amount of net revenue on mortgage banking activities was a function of mortgage loans originated for sale and the fair values of these loans and related derivatives. Net revenue on mortgage banking activities included mark to market pricing adjustments on loan commitments and forward sales contracts, and initial capitalized value of MSRs.
The following table summarizes the calculation of the net gain on disposal of discontinued operations:
|
Year Ended December, 31
|
||||||||||||
|
($ in thousands)
|
2018
|
2017
|
Total Net Gain on Disposal After Completion of Sale
|
|||||||||
|
Proceeds from the transaction
|
$
|
—
|
|
$
|
63,054
|
|
$
|
63,054
|
|
|||
|
Compensation expense related to the transaction
|
1,003
|
|
(3,500
|
)
|
(2,497
|
)
|
||||||
|
Other transaction costs
|
436
|
|
(3,431
|
)
|
(2,995
|
)
|
||||||
|
Net cash proceeds
|
1,439
|
|
56,123
|
|
57,562
|
|
||||||
|
Book value of certain assets sold
|
—
|
|
(2,455
|
)
|
(2,455
|
)
|
||||||
|
Book value of MSRs sold
|
—
|
|
(37,772
|
)
|
(37,772
|
)
|
||||||
|
Goodwill
|
—
|
|
(2,100
|
)
|
(2,100
|
)
|
||||||
|
Net gain on disposal
|
$
|
1,439
|
|
$
|
13,796
|
|
$
|
15,235
|
|
|||
The following tables present the financial information of discontinued operations as of the dates and for the periods indicated:
Statements of Financial Condition of Discontinued Operations
|
December 31,
|
||||||||
|
($ in thousands)
|
2018
|
2017
|
||||||
|
ASSETS
|
||||||||
|
Loans held-for-sale, carried at fair value
(1)
|
$
|
19,490
|
|
$
|
38,696
|
|
||
|
Loans held-for-sale, carried at lower of cost or fair value
|
—
|
|
—
|
|
||||
|
Servicing rights carried at fair value
|
—
|
|
—
|
|
||||
|
Premises, equipment, and capital leases, net
|
—
|
|
—
|
|
||||
|
Goodwill
|
—
|
|
—
|
|
||||
|
Other assets
|
—
|
|
204
|
|
||||
|
Assets of discontinued operations
|
$
|
19,490
|
|
$
|
38,900
|
|
||
|
LIABILITIES
|
||||||||
|
Accrued expenses and other liabilities
(1)
|
$
|
—
|
|
$
|
7,819
|
|
||
|
Liabilities of discontinued operations
|
$
|
—
|
|
$
|
7,819
|
|
||
|
(1)
|
Includes
$0
and
$7.1 million
of GNMA loans, respectively, that were delinquent more than 90 days and subject to a repurchase option by the Company at
December 31, 2018
and
2017
, respectively. As such, the Company is deemed to have regained control over those previously transferred assets and has re-recognized them with an offsetting liability recognized in Accrued Expenses and Other Liabilities in the Statements of Financial Condition of Discontinued Operations, as a secured borrowing. Because the Company intends to exercise its option to repurchase and sell them within one year, they have been classified as part of discontinued operations.
|
119
Statements of Operations of Discontinued Operations
|
Year Ended December 31,
|
||||||||||||
|
($ in thousands)
|
2018
|
2017
|
2016
|
|||||||||
|
Interest income
|
||||||||||||
|
Loans, including fees
|
$
|
665
|
|
$
|
7,052
|
|
$
|
15,128
|
|
|||
|
Total interest income
|
665
|
|
7,052
|
|
15,128
|
|
||||||
|
Noninterest income
|
||||||||||||
|
Net gain on disposal
|
1,439
|
|
13,796
|
|
—
|
|
||||||
|
Loan servicing income
|
—
|
|
1,551
|
|
4,752
|
|
||||||
|
Net revenue on mortgage banking activities
|
428
|
|
42,889
|
|
167,024
|
|
||||||
|
All other income
|
2,200
|
|
1,871
|
|
1,474
|
|
||||||
|
Total noninterest income
|
4,067
|
|
60,107
|
|
173,250
|
|
||||||
|
Noninterest expense
|
||||||||||||
|
Salaries and employee benefits
|
20
|
|
38,374
|
|
111,771
|
|
||||||
|
Occupancy and equipment
|
—
|
|
3,964
|
|
10,972
|
|
||||||
|
Professional fees
|
—
|
|
2,546
|
|
920
|
|
||||||
|
Outside Service Fees
|
—
|
|
5,625
|
|
6,063
|
|
||||||
|
Data processing
|
8
|
|
687
|
|
2,522
|
|
||||||
|
Advertising
|
—
|
|
1,357
|
|
3,846
|
|
||||||
|
Restructuring expense
|
—
|
|
3,794
|
|
—
|
|
||||||
|
All other expenses
|
108
|
|
3,648
|
|
3,367
|
|
||||||
|
Total noninterest expense
|
136
|
|
59,995
|
|
139,461
|
|
||||||
|
Income from discontinued operations before income taxes
|
4,596
|
|
7,164
|
|
48,917
|
|
||||||
|
Income tax expense
|
1,271
|
|
2,929
|
|
20,241
|
|
||||||
|
Income from discontinued operations
|
$
|
3,325
|
|
$
|
4,235
|
|
$
|
28,676
|
|
|||
Statements of Cash Flows of Discontinued Operations
|
Year Ended December 31,
|
||||||||||||
|
($ in thousands)
|
2018
|
2017
|
2016
|
|||||||||
|
Net cash provided by (used in) operating activities
|
$
|
14,916
|
|
$
|
365,045
|
|
$
|
(19,757
|
)
|
|||
|
Net cash provided by investing activities
|
—
|
|
56,123
|
|
—
|
|
||||||
|
Net cash provided by (used in) discontinued operations
|
$
|
14,916
|
|
$
|
421,168
|
|
$
|
(19,757
|
)
|
|||
120
NOTE 3 – FAIR VALUES OF FINANCIAL INSTRUMENTS
Fair Value Hierarchy
ASC 820-10 establishes a fair value hierarchy which requires an entity to maximize the use of observable inputs and minimize the use of unobservable inputs when measuring fair value. The topic describes three levels of inputs that may be used to measure fair value:
|
•
|
Level 1: Quoted prices (unadjusted) for identical assets or liabilities in active markets that the entity has the ability to access as of the measurement date.
|
|
•
|
Level 2: Significant observable inputs other than Level 1 prices such as quoted prices for similar assets or liabilities; quoted prices in markets that are not active; or other inputs that are observable or can be corroborated by observable market data.
|
|
•
|
Level 3: Significant unobservable inputs that reflect a reporting entity’s own assumptions about the assumptions that market participants would use in pricing an asset or liability.
|
Categorization within the valuation hierarchy is based upon the lowest level of input that is significant to the fair value measurement.
Assets and Liabilities Measured on a Recurring Basis
Securities Available-for-Sale:
The fair values of securities available-for-sale are generally determined by quoted market prices in active markets, if available (Level 1). If quoted market prices are not available, the Company primarily employs independent pricing services that utilize pricing models to calculate fair value. Such fair value measurements consider observable data such as dealer quotes, market spreads, cash flows, yield curves, live trading levels, trade execution data, market consensus prepayment speeds, credit information, and respective terms and conditions for debt instruments. The Company employs procedures to monitor the pricing service's assumptions and establishes processes to challenge the pricing service's valuations that appear unusual or unexpected. Multiple quotes or prices may be obtained in this process and the Company determines which fair value is most appropriate based on market information and analysis. Quotes obtained through this process are generally non-binding. The Company follows established procedures to ensure that assets and liabilities are properly classified in the fair value hierarchy. Level 2 securities include SBA loan pool securities, U.S. government agency and U.S. government sponsored enterprise residential mortgage-backed securities, non-agency residential mortgage-backed securities, non-agency commercial mortgage-backed securities, collateralized loan obligations, and corporate debt securities. When a market is illiquid or there is a lack of transparency around the inputs to valuation, including at least one unobservable input, the securities are classified as Level 3 and reliance is placed upon internally developed models, and management judgment and evaluation for valuation. The Company had no securities available-for-sale classified as Level 3 at
December 31, 2018
and
2017
.
Loans Held-for-Sale, Carried at Fair Value:
The fair value of loans held-for-sale is based on commitments outstanding from investors as well as what secondary market investors are currently offering for portfolios with similar characteristics, except for loans that are repurchased out of Ginnie Mae loan pools that become severely delinquent which are valued based on an internal model. Loans previously sold to GNMA that are delinquent more than 90 days are subject to a repurchase option when that condition exists. These loans were re-recognized at fair value and offset by a secured borrowing, as the loans were still legally owned by GNMA but failed sale accounting treatment under GAAP due to the repurchase option. Loans held-for-sale subject to recurring fair value adjustments are classified as Level 2 or, in the case of loans repurchased, Level 3. The fair value includes the servicing value of the loans as well as any accrued interest. As of
December 31, 2018
, there were no loans delinquent more than 90 days and eligible to be repurchased out of GNMA loan pools. GNMA loans delinquent more than 90 days were subject to a repurchase option that was eliminated as a result of the sale of the related MSRs to third parties during 2018. As of
December 31, 2017
, loans eligible to be repurchased out of GNMA loan pools of
$66.0 million
were classified as Level 3.
Derivative Assets and Liabilities
:
Interest Rate Swaps and Caps
. The Company offers interest rate swaps and caps products to certain loan customers to allow them to hedge the risk of rising interest rates on their variable rate loans. The Company originates a variable rate loan and enters into a variable-to-fixed interest rate swap with the customer. The Company also enters into an offsetting swap with a correspondent bank. These back-to-back agreements are intended to offset each other and allow the Company to originate a variable rate loan, while providing a contract for fixed interest payments for the customer. The net cash flow for the Company is equal to the interest income received from a variable rate loan originated with the customer. The fair value of these derivatives is based on a discounted cash flow approach. Due to the observable nature of the inputs used in deriving the fair value of these derivative contracts, the valuation of interest rate swaps is classified as Level 2.
Mortgage Servicing Rights:
The Company retains servicing on some of its mortgage loans sold and elected the fair value option for these MSRs. Generally, the value is estimated based on a valuation from a third party provider that calculates the present value of the expected net servicing income from the portfolio based on key factors that include interest rates, prepayment assumptions, discount rate and estimated cash flows. Because of the significance of unobservable inputs, these servicing rights
121
are classified as Level 3. At
December 31, 2018
and
2017
, MSRs valued based on a third party provider's valuation were
$1.7 million
and
$2.1 million
, respectively. At
December 31, 2018
and
2017
, MSRs held-for-sale of
$66 thousand
and
$29.8 million
, respectively, were valued based on a market bid adjusted for early payoffs and paydowns and included as Level 3.
The following table presents the Company’s financial assets and liabilities measured at fair value on a recurring basis as of
December 31, 2018
:
|
Fair Value Measurement Level
|
||||||||||||||||
|
($ in thousands)
|
Carrying Value
|
Quoted Prices in Active Markets for Identical Assets
(Level 1)
|
Significant Other Observable Inputs
(Level 2)
|
Significant Unobservable Inputs
(Level 3)
|
||||||||||||
|
December 31, 2018
|
||||||||||||||||
|
Assets
|
||||||||||||||||
|
Securities available-for-sale:
|
||||||||||||||||
|
SBA loan pools securities
|
$
|
910
|
|
$
|
—
|
|
$
|
910
|
|
$
|
—
|
|
||||
|
U.S. government agency and U.S. government sponsored enterprise residential mortgage-backed securities
|
437,442
|
|
—
|
|
437,442
|
|
—
|
|
||||||||
|
Non-agency residential mortgage-backed securities
|
427
|
|
—
|
|
427
|
|
—
|
|
||||||||
|
Non-agency commercial mortgage-backed securities
|
132,199
|
|
—
|
|
132,199
|
|
—
|
|
||||||||
|
Collateralized loan obligations
|
1,421,522
|
|
—
|
|
1,421,522
|
|
—
|
|
||||||||
|
Loans held-for-sale, carried at fair value
(1)
|
27,180
|
|
—
|
|
2,140
|
|
25,040
|
|
||||||||
|
Mortgage servicing rights
(2)
|
1,770
|
|
—
|
|
—
|
|
1,770
|
|
||||||||
|
Derivative assets:
|
||||||||||||||||
|
Interest rate swaps and caps
(3)
|
1,534
|
|
—
|
|
1,534
|
|
—
|
|
||||||||
|
Liabilities
|
||||||||||||||||
|
Derivative liabilities:
|
||||||||||||||||
|
Interest rate swaps and caps
(4)
|
1,600
|
|
—
|
|
1,600
|
|
—
|
|
||||||||
|
(1)
|
Includes loans held-for-sale carried at fair value of
$19.5 million
(
$2.1 million
at Level 2 and
$17.4 million
at Level 3) of discontinued operations, which are included in Assets of Discontinued Operations on the Consolidated Statements of Financial Condition
|
|
(2)
|
Included in Servicing Rights, Net on the Consolidated Statements of Financial Condition
|
|
(3)
|
Included in Other Assets on the Consolidated Statements of Financial Condition
|
|
(4)
|
Included in Accrued Expenses and Other Liabilities on the Consolidated Statements of Financial Condition
|
122
The following table presents the Company’s financial assets and liabilities measured at fair value on a recurring basis as of
December 31, 2017
:
|
Fair Value Measurement Level
|
||||||||||||||||
|
($ in thousands)
|
Carrying Value
|
Quoted Prices in Active Markets for Identical Assets
(Level 1)
|
Significant Other Observable Inputs
(Level 2)
|
Significant Unobservable Inputs
(Level 3)
|
||||||||||||
|
December 31, 2017
|
||||||||||||||||
|
Assets
|
||||||||||||||||
|
Securities available-for-sale:
|
||||||||||||||||
|
SBA loan pools securities
|
$
|
1,058
|
|
$
|
—
|
|
$
|
1,058
|
|
$
|
—
|
|
||||
|
U.S. government agency and U.S. government sponsored enterprise residential mortgage-backed securities
|
476,929
|
|
—
|
|
476,929
|
|
—
|
|
||||||||
|
Non-agency residential mortgage-backed securities
|
756
|
|
—
|
|
756
|
|
—
|
|
||||||||
|
Non-agency commercial mortgage-backed securities
|
310,511
|
|
—
|
|
310,511
|
|
—
|
|
||||||||
|
Collateralized loan obligations
|
1,702,318
|
|
—
|
|
1,702,318
|
|
—
|
|
||||||||
|
Corporate debt securities
|
83,897
|
|
—
|
|
83,897
|
|
—
|
|
||||||||
|
Loans held-for-sale, carried at fair value
(1)
|
105,299
|
|
—
|
|
6,359
|
|
98,940
|
|
||||||||
|
Mortgage servicing rights
(2)
|
31,852
|
|
—
|
|
—
|
|
31,852
|
|
||||||||
|
Derivative assets
|
||||||||||||||||
|
Interest rate swaps and caps
(3)
|
1,005
|
|
—
|
|
1,005
|
|
—
|
|
||||||||
|
Liabilities
|
||||||||||||||||
|
Derivative liabilities
|
||||||||||||||||
|
Interest rate swaps and caps
(4)
|
1,033
|
|
—
|
|
1,033
|
|
—
|
|
||||||||
|
(1)
|
Includes loans held-for-sale carried at fair value of
$38.7 million
(
$6.4 million
at Level 2 and
$32.3 million
at Level 3) of discontinued operations, which are included in Assets of Discontinued Operations on the Consolidated Statements of Financial Condition.
|
|
(2)
|
Included in Servicing Rights, Net in the Consolidated Statements of Financial Condition.
|
|
(3)
|
Included in Other Assets in the Consolidated Statements of Financial Condition.
|
|
(4)
|
Included in Accrued Expenses and Other Liabilities in the Consolidated Statements of Financial Condition.
|
123
The following table presents a reconciliation of assets measured at fair value on a recurring basis using significant unobservable inputs (Level 3), on a consolidated operations basis, for the periods indicated:
|
Year Ended December 31,
|
||||||||||||
|
($ in thousands)
|
2018
|
2017
|
2016
|
|||||||||
|
Mortgage servicing rights
|
||||||||||||
|
Balance at beginning of period
(1)
|
$
|
31,852
|
|
$
|
76,121
|
|
$
|
49,939
|
|
|||
|
Total gains or losses (realized/unrealized):
|
||||||||||||
|
Included in earnings—fair value adjustment
(4)
|
(1,155
|
)
|
(10,240
|
)
|
(5,709
|
)
|
||||||
|
Additions
|
—
|
|
12,127
|
|
49,293
|
|
||||||
|
Sales, paydowns, and other
(2)
|
(28,927
|
)
|
(46,156
|
)
|
(17,402
|
)
|
||||||
|
Balance at end of period
|
$
|
1,770
|
|
$
|
31,852
|
|
$
|
76,121
|
|
|||
|
Loans repurchased
or eligible to be repurchased
from Ginnie Mae Loan Pools
(3)
|
||||||||||||
|
Balance at beginning of period
|
$
|
98,940
|
|
$
|
58,260
|
|
$
|
18,291
|
|
|||
|
Total gains or losses (realized/unrealized):
|
||||||||||||
|
Included in earnings—fair value adjustment
(5)
|
(1,378
|
)
|
(781
|
)
|
216
|
|
||||||
|
Additions
|
23,678
|
|
117,215
|
|
51,123
|
|
||||||
|
Sales, settlements, and other
(6)
|
(96,200
|
)
|
(75,754
|
)
|
(11,370
|
)
|
||||||
|
Balance at end of period
|
$
|
25,040
|
|
$
|
98,940
|
|
$
|
58,260
|
|
|||
|
(1)
|
Includes MSRs of discontinued operations, which is included in Assets of Discontinued Operations on the Consolidated Statements of Financial Condition, of
$0
,
$37.7 million
, and
$22.9 million
, respectively, for the years ended
December 31, 2018
,
2017
and
2016
in balance at beginning of period.
|
|
(2)
|
Includes
$37.8 million
of MSRs sold as a part of discontinued operations for the year ended December 31, 2017.
|
|
(3)
|
Includes loans repurchased from Ginnie Mae loan pools of discontinued operations, which is included in Assets of Discontinued Operations on the Consolidated Statements of Financial Condition, of
$32.3 million
,
$58.3 million
and
$18.3 million
, respectively, in balance at beginning of period, and
$17.3 million
,
$32.3 million
and
$58.3 million
, respectively, in balance at end of period for the years ended
December 31, 2018
,
2017
and
2016
.
|
|
(4)
|
Included in Loan Servicing Income in the Consolidated Statements of Operations.
|
|
(5)
|
Included in Net Gain on Sale of Loans in the Consolidated Statements of Operations.
|
|
(6)
|
Included in sales, settlements and other are
$66.0 million
of GNMA loans subject to repurchase option that were derecognized when the associated mortgage servicing rights were sold during the year ended December 31, 2018.
|
Loans repurchased or eligible to be repurchased from Ginnie Mae loan pools had aggregate unpaid principal balances of
$25.5 million
and
$99.7 million
at
December 31, 2018
and
2017
, respectively.
The following table presents, as of the dates indicated, quantitative information about Level 3 fair value measurements on a recurring basis, other than loans that become severely delinquent and are repurchased out of Ginnie Mae loan pools that were valued based on an estimate of the expected loss the Company will incur on these loans, which was included as Level 3 at
December 31, 2018
and
2017
:
|
($ in thousands)
|
Fair Value
|
Valuation Technique(s)
|
Unobservable Input(s)
|
Range (Weighted-Average)
|
||||||
|
December 31, 2018
|
||||||||||
|
Mortgage servicing rights
(1)
|
$
|
3,362
|
|
Discounted cash flow
|
Discount rate
|
9.50% to 13.00% (11.27%)
|
||||
|
Prepayment rate
|
8.00% to 66.34% (12.67%)
|
|||||||||
|
December 31, 2017
|
||||||||||
|
Mortgage servicing rights
(1)
|
$
|
3,915
|
|
Discounted cash flow
|
Discount rate
|
8.50% to 13.00% (10.87%)
|
||||
|
Prepayment rate
|
8.00% to 49.97% (12.49%)
|
|||||||||
|
(1)
|
Excludes MSRs held-for-sale of
$66 thousand
and
$29.8 million
, respectively, which were valued based on a market bid adjusted for expected obligations arising from standard representations and warranties at
December 31, 2018
and
2017
.
|
124
The significant unobservable inputs used in the fair value measurement of the Company’s servicing rights include the discount rate and prepayment rate. The significant unobservable inputs used in the fair value measurement of the Company's loans repurchased from Ginnie Mae pools at
December 31, 2018
and
2017
included an expected loss rate of
1.55 percent
for insured loans and
20.00 percent
for uninsured loans. There may be inherent weaknesses in any calculation technique, and changes in the underlying assumptions used, including discount rates and estimates of future cash flows, could significantly affect the results.
Fair Value Option
Loans Held-for-Sale, Carried at Fair Value:
The Company elected the fair value option for certain SFR mortgage loans held-for-sale. Electing to measure SFR mortgage loans held-for-sale at fair value reduces certain timing differences and better matches changes in the value of these assets with changes in the value of derivatives used as economic hedges for these assets. The Company also elected to record loans repurchased from GNMA at fair value, as the Company intends to sell them after curing any defects and, accordingly, they are classified as held-for-sale. Loans previously sold to GNMA that are delinquent more than 90 days are subject to a repurchase option when that condition exists. These loans were re-recognized at fair value and offset by a secured borrowing, as the loans were still legally owned by GNMA.
The following table presents the fair value and aggregate principal balance of certain assets, on a consolidated operations basis, under the fair value option:
|
December
31,
|
||||||||||||||||||||||||
|
2018
|
2017
|
|||||||||||||||||||||||
|
($ in thousands)
|
Fair Value
|
Unpaid Principal Balance
|
Difference
|
Fair Value
|
Unpaid Principal Balance
|
Difference
|
||||||||||||||||||
|
Loans held-for-sale, carried at fair value in continuing operations:
|
||||||||||||||||||||||||
|
Total loans
|
$
|
7,690
|
|
$
|
7,906
|
|
$
|
(216
|
)
|
$
|
66,603
|
|
$
|
67,415
|
|
$
|
(812
|
)
|
||||||
|
Non-accrual loans
(1)
|
2,427
|
|
2,538
|
|
(111
|
)
|
60,999
|
|
61,900
|
|
(901
|
)
|
||||||||||||
|
Loans past due 90 days or more and still accruing
|
—
|
|
—
|
|
—
|
|
—
|
|
—
|
|
—
|
|
||||||||||||
|
Loans held-for-sale, carried at fair value in discontinued operations:
|
||||||||||||||||||||||||
|
Total loans
|
$
|
19,490
|
|
$
|
20,027
|
|
$
|
(537
|
)
|
$
|
38,696
|
|
$
|
39,541
|
|
$
|
(845
|
)
|
||||||
|
Non-accrual loans
(2)
|
8,430
|
|
8,496
|
|
(66
|
)
|
24,073
|
|
24,297
|
|
(224
|
)
|
||||||||||||
|
Loans past due 90 days or more and still accruing
|
—
|
|
—
|
|
—
|
|
—
|
|
—
|
|
—
|
|
||||||||||||
|
(1)
|
Includes loans guaranteed by the U.S. government of
$1.6 million
and
$54.2 million
, respectively, at
December 31, 2018
and
2017
.
|
|
(2)
|
Includes loans guaranteed by the U.S. government of
$7.6 million
and
$20.7 million
, respectively, at
December 31, 2018
and
2017
.
|
The assets and liabilities accounted for under the fair value option are initially measured at fair value. Gains and losses from initial measurement and subsequent changes in fair value are recognized in earnings. The following table presents changes in fair value related to initial measurement and subsequent changes in fair value included in earnings for these assets and liabilities measured at fair value for the periods indicated:
|
Year Ended December
31,
|
||||||||||||
|
($ in thousands)
|
2018
|
2017
|
2016
|
|||||||||
|
Net gains (losses) from fair value changes
|
||||||||||||
|
Net gain (loss) on sale of loans (continuing operations)
|
$
|
204
|
|
$
|
(170
|
)
|
$
|
29
|
|
|||
|
Net revenue on mortgage banking activities (discontinued operations)
|
159
|
|
(288
|
)
|
7,365
|
|
||||||
Changes in fair value due to instrument-specific credit risk were insignificant for the years ended
December 31, 2018
,
2017
and
2016
. Interest income on loans held-for-sale under the fair value option is measured based on the contractual interest rate and reported in Loans and Leases, including Fees under Interest and Dividend Income and Income from Discontinued Operations on the Consolidated Statements of Operations.
125
Assets and Liabilities Measured on a Non-Recurring Basis
Impaired Loans and Leases:
The fair value of impaired loans and leases with specific allocations of the ALLL based on collateral values is generally based on recent real estate appraisals and AVMs. These appraisals may utilize a single valuation approach or a combination of approaches including comparable sales and the income approach. Adjustments are routinely made in the appraisal process by the appraisers to adjust for differences between the comparable sales and income data available. Such adjustments are typically deemed significant unobservable inputs used for determining fair value and result in a Level 3 classification.
Other Real Estate Owned Assets:
OREO assets initially are recorded at fair value at the time of foreclosure. Thereafter, they are recorded at the lower of cost or fair value. The fair value of other real estate owned assets is generally based on recent real estate appraisals adjusted for estimated selling costs. These appraisals may utilize a single valuation approach or a combination of approaches including comparable sales and the income approach. Adjustments are routinely made in the appraisal process by the appraisers to adjust for differences between the comparable sales and income data available. Such adjustments may be significant and result in a Level 3 classification due to the unobservable inputs used for determining fair value. Only OREO assets with a valuation allowance are considered to be carried at fair value. The Company recorded valuation allowance expense for OREO assets of
$53 thousand
,
$236 thousand
and
$31 thousand
, respectively, for the years ended
December 31, 2018
,
2017
and
2016
in All Other Expense on the Consolidated Statements of Operations.
126
The following table presents the Company’s financial assets and liabilities measured at fair value on a non-recurring basis as of the dates indicated:
|
Fair Value Measurement Level
|
||||||||||||||
|
($ in thousands)
|
Carrying Value
|
Quoted Prices in Active Markets for Identical Assets
(Level 1) |
Significant Other Observable Inputs
(Level 2) |
Significant Unobservable Inputs
(Level 3) |
||||||||||
|
December 31, 2018
|
||||||||||||||
|
Assets
|
||||||||||||||
|
Impaired loans:
|
||||||||||||||
|
SBA
|
$
|
226
|
|
—
|
|
—
|
|
$
|
226
|
|
||||
|
December 31, 2017
|
||||||||||||||
|
Assets
|
||||||||||||||
|
Impaired loans:
|
||||||||||||||
|
SBA
|
174
|
|
—
|
|
—
|
|
174
|
|
||||||
|
Other real estate owned:
|
||||||||||||||
|
Single family residential
|
1,415
|
|
—
|
|
—
|
|
1,415
|
|
||||||
The following table presents the gains and (losses) recognized on assets measured at fair value on a non-recurring basis for the periods indicated:
|
Year Ended December
31,
|
||||||||||||
|
($ in thousands)
|
2018
|
2017
|
2016
|
|||||||||
|
Impaired loans:
|
||||||||||||
|
Single family residential mortgage
|
$
|
(115
|
)
|
$
|
(164
|
)
|
$
|
—
|
|
|||
|
Commercial real estate
|
(1,752
|
)
|
—
|
|
—
|
|
||||||
|
SBA
|
(1,048
|
)
|
(200
|
)
|
—
|
|
||||||
|
Other consumer
|
(141
|
)
|
(29
|
)
|
—
|
|
||||||
|
Other real estate owned:
|
||||||||||||
|
Single family residential
|
229
|
|
(284
|
)
|
(235
|
)
|
||||||
127
Estimated Fair Values of Financial Instruments
The following table presents the carrying amounts and estimated fair values of financial assets and liabilities as of the dates indicated:
|
Carrying Amount
|
Fair Value Measurement Level
|
|||||||||||||||||||
|
($ in thousands)
|
Level 1
|
Level 2
|
Level 3
|
Total
|
||||||||||||||||
|
December 31, 2018
|
||||||||||||||||||||
|
Financial assets
|
||||||||||||||||||||
|
Cash and cash equivalents
|
$
|
391,592
|
|
$
|
391,592
|
|
$
|
—
|
|
$
|
—
|
|
$
|
391,592
|
|
|||||
|
Securities available-for-sale
|
1,992,500
|
|
—
|
|
1,992,500
|
|
—
|
|
1,992,500
|
|
||||||||||
|
Federal Home Loan Bank and other bank stock
|
68,094
|
|
—
|
|
68,094
|
|
—
|
|
68,094
|
|
||||||||||
|
Loans held-for-sale
(1)
|
27,606
|
|
—
|
|
2,566
|
|
25,040
|
|
27,606
|
|
||||||||||
|
Loans and leases receivable, net of allowance
|
7,638,681
|
|
—
|
|
—
|
|
7,513,910
|
|
7,513,910
|
|
||||||||||
|
Accrued interest receivable
|
38,807
|
|
38,807
|
|
—
|
|
—
|
|
38,807
|
|
||||||||||
|
Derivative assets
|
1,534
|
|
—
|
|
1,534
|
|
—
|
|
1,534
|
|
||||||||||
|
Financial liabilities
|
||||||||||||||||||||
|
Deposits
|
7,916,644
|
|
—
|
|
—
|
|
7,689,324
|
|
7,689,324
|
|
||||||||||
|
Advances from Federal Home Loan Bank
|
1,520,000
|
|
—
|
|
1,517,761
|
|
—
|
|
1,517,761
|
|
||||||||||
|
Long-term debt
|
173,174
|
|
—
|
|
174,059
|
|
—
|
|
174,059
|
|
||||||||||
|
Derivative liabilities
|
1,600
|
|
—
|
|
1,600
|
|
—
|
|
1,600
|
|
||||||||||
|
Accrued interest payable
|
13,253
|
|
13,253
|
|
—
|
|
—
|
|
13,253
|
|
||||||||||
|
December 31, 2017
|
||||||||||||||||||||
|
Financial assets
|
||||||||||||||||||||
|
Cash and cash equivalents
|
$
|
387,699
|
|
$
|
387,699
|
|
$
|
—
|
|
$
|
—
|
|
$
|
387,699
|
|
|||||
|
Securities available-for-sale
|
2,575,469
|
|
—
|
|
2,575,469
|
|
—
|
|
2,575,469
|
|
||||||||||
|
Federal Home Loan Bank and other bank stock
|
75,654
|
|
—
|
|
75,654
|
|
—
|
|
75,654
|
|
||||||||||
|
Loans held-for-sale
(2)
|
105,765
|
|
—
|
|
6,866
|
|
98,940
|
|
105,806
|
|
||||||||||
|
Loans and leases receivable, net of allowance
|
6,610,074
|
|
—
|
|
—
|
|
6,601,767
|
|
6,601,767
|
|
||||||||||
|
Accrued interest receivable
|
35,355
|
|
35,355
|
|
—
|
|
—
|
|
35,355
|
|
||||||||||
|
Derivative assets
|
1,005
|
|
—
|
|
1,005
|
|
—
|
|
1,005
|
|
||||||||||
|
Financial liabilities
|
||||||||||||||||||||
|
Deposits
|
7,292,903
|
|
—
|
|
—
|
|
7,063,613
|
|
7,063,613
|
|
||||||||||
|
Advances from Federal Home Loan Bank
|
1,695,000
|
|
—
|
|
1,695,039
|
|
—
|
|
1,695,039
|
|
||||||||||
|
Long-term debt
|
172,941
|
|
—
|
|
180,560
|
|
—
|
|
180,560
|
|
||||||||||
|
Derivative liabilities
|
1,033
|
|
—
|
|
1,033
|
|
—
|
|
1,033
|
|
||||||||||
|
Accrued interest payable
|
7,321
|
|
7,321
|
|
—
|
|
—
|
|
7,321
|
|
||||||||||
|
(1)
|
Includes loans held-for-sale carried at fair value of
$19.5 million
(
$2.1 million
at Level 2 and
$17.4 million
at Level 3) of discontinued operations.
|
|
(2)
|
Includes loans held-for-sale carried at fair value of
$38.7 million
(
$6.4 million
at Level 2 and
$32.3 million
at Level 3) of discontinued operations.
|
128
On January 1, 2018, the Company adopted ASU 2016-01 and ASU 2018-03, which require the use of the exit price notion when measuring the fair values of financial instruments for disclosure purposes. Starting in the first quarter of 2018, the Company updated our methodology used to estimate fair values for our loan portfolio to conform to the new requirements. The methods and assumptions used to estimate fair value for the Company's financial instruments note recorded at fair value on a recurring or non-recurring basis are described as follows:
Cash and Cash Equivalents and Time Deposits in Financial Institutions:
The carrying amounts of cash and cash equivalents and time deposits in financial institutions approximate fair value due to the short-term nature of these instruments (Level 1).
Federal Home Loan Bank and Other Bank Stock:
Federal Home Loan Bank and other bank stock are recorded at cost, which approximates fair value. Ownership of FHLB stock is restricted to member banks, and purchases and sales of these securities are at par value with the issuer (Level 2).
Loans and Leases Receivable, Net of ALLL:
For the year ended December 31, 2017, the fair value of loans and leases receivable is estimated based on the discounted cash flow approach. The discount rate was derived from the associated yield curve plus spreads and reflects the rates offered by the Bank for loans with similar financial characteristics. Yield curves are constructed by product and payment types. These rates could be different from what other financial institutions could offer for these loans. Additionally, the fair value of our loans may differ significantly from the values that would have been used had a ready market existed for such loans and may differ materially from the values that we may ultimately realize (Level 3). This method of estimating fair value does not incorporate the exit-price concept of fair value prescribed by ASC Topic 820. For the year ended December 31, 2018, we utilized the exit price notion to determine the fair value of loans and leases receivable.
Accrued Interest Receivable:
The carrying amount of accrued interest receivable approximates its fair value (Level 1).
Deposits:
The fair value of deposits is estimated based on discounted cash flows. The cash flows for non-maturity deposits, including savings accounts and money market checking, are estimated based on their historical decaying experiences. The discount rate used for fair valuation is based on interest rates currently being offered by the Bank on comparable deposits as to amount and term (Level 3).
Advances from Federal Home Loan Bank and Other Borrowings:
The fair values of advances from FHLB and other borrowings are estimated based on a discounted cash flow approach. The discount rate was derived from the current market rates for borrowings with similar remaining maturities (Level 2).
Long-Term Debt:
Fair value of long-term debt is determined by observable data such as market spreads, cash flows, yield curves, credit information, and respective terms and conditions for debt instruments (Level 2).
Accrued Interest Payable:
The carrying amount of accrued interest payable approximates its fair value (Level 1).
129
NOTE 4 – INVESTMENT SECURITIES
The following table presents the amortized cost and fair value of the investment securities portfolio as of the dates indicated:
|
($ in thousands)
|
Amortized Cost
|
Gross Unrealized Gains
|
Gross Unrealized Losses
|
Fair Value
|
||||||||||||
|
December 31, 2018
|
||||||||||||||||
|
Securities available-for-sale:
|
||||||||||||||||
|
SBA loan pool securities
|
$
|
911
|
|
$
|
—
|
|
$
|
(1
|
)
|
$
|
910
|
|
||||
|
U.S. government agency and U.S. government sponsored enterprise residential mortgage-backed securities
|
461,987
|
|
—
|
|
(24,545
|
)
|
437,442
|
|
||||||||
|
Non-agency residential mortgage-backed securities
|
418
|
|
9
|
|
—
|
|
427
|
|
||||||||
|
Non-agency commercial mortgage-backed securities
|
132,199
|
|
—
|
|
—
|
|
132,199
|
|
||||||||
|
Collateralized loan obligations
|
1,431,171
|
|
141
|
|
(9,790
|
)
|
1,421,522
|
|
||||||||
|
Total securities available-for-sale
|
$
|
2,026,686
|
|
$
|
150
|
|
$
|
(34,336
|
)
|
$
|
1,992,500
|
|
||||
|
December 31, 2017
|
||||||||||||||||
|
Securities available-for-sale:
|
||||||||||||||||
|
SBA loan pool securities
|
$
|
1,056
|
|
$
|
2
|
|
$
|
—
|
|
$
|
1,058
|
|
||||
|
U.S. government agency and U.S. government sponsored enterprise residential mortgage-backed securities
|
492,255
|
|
10
|
|
(15,336
|
)
|
476,929
|
|
||||||||
|
Non-agency residential mortgage-backed securities
|
741
|
|
16
|
|
(1
|
)
|
756
|
|
||||||||
|
Non-agency commercial mortgage-backed securities
|
305,172
|
|
5,339
|
|
—
|
|
310,511
|
|
||||||||
|
Collateralized loan obligations
|
1,691,455
|
|
11,129
|
|
(266
|
)
|
1,702,318
|
|
||||||||
|
Corporate debt securities
|
76,714
|
|
7,183
|
|
—
|
|
83,897
|
|
||||||||
|
Total securities available-for-sale
|
$
|
2,567,393
|
|
$
|
23,679
|
|
$
|
(15,603
|
)
|
$
|
2,575,469
|
|
||||
During the three months ended June 30, 2017, the Company evaluated its securities held-to-maturity and determined that certain securities no longer adhered to the Company’s strategic focus and could be sold or reinvested to potentially improve the Company’s liquidity position or duration profile. Accordingly, the Company was no longer able to assert that it had the intent to hold these securities until maturity. As a result, the Company transferred all
$740.9 million
of its held-to-maturity securities to available-for-sale, which resulted in a pre-tax increase to accumulated other comprehensive income of
$22.0 million
at the time of the transfer, June 30, 2017. Due to the transfer, the Company’s ability to assert that it has both the intent and ability to hold debt securities to maturity will be limited for the foreseeable future.
During the three months ended March 31, 2018, the Company completed the sale of all remaining corporate debt securities,
totaling
$76.8 million
, to reposition its securities available-for-sale portfolio. At
December 31, 2018
, the Company's
investment securities portfolio consisted of SBA loan pool securities, mortgage-backed securities, and collateralized loan
obligations. The expected maturities of these types of securities may differ from contractual maturities because borrowers may
have the right to call or prepay obligations with or without call or prepayment penalties.
As of
December 31, 2018
, the Company changed its intent to sell its non-agency commercial mortgage-backed securities in an unrealized loss position due to its strategy to remix its securities profile and recognized
$3.3 million
of OTTI loss for the year ended December 31, 2018. The Company did not record OTTI losses for investment securities for the years ended
December 31, 2017
or
2016
.
At
December 31, 2018
and
2017
, there were
no
holdings of any one issuer, other than the U.S. Government and its agencies, in an amount greater than
10 percent
of stockholders’ equity.
The following table presents proceeds from sales and calls of securities available-for-sale and the associated gross gains and losses realized through earnings upon the sales and calls of securities available-for-sale for the periods indicated:
|
Year Ended December
31,
|
||||||||||||
|
($ in thousands)
|
2018
|
2017
|
2016
|
|||||||||
|
Gross realized gains on sales and calls of securities available-for-sale
|
$
|
5,532
|
|
$
|
14,768
|
|
$
|
30,919
|
|
|||
|
Gross realized losses on sales and calls of securities available-for-sale
|
—
|
|
—
|
|
(1,514
|
)
|
||||||
|
Net realized gains on sales and calls of securities available-for-sale
|
$
|
5,532
|
|
$
|
14,768
|
|
$
|
29,405
|
|
|||
|
Proceeds from sales and calls of securities available-for-sale
|
$
|
1,025,471
|
|
$
|
1,500,459
|
|
$
|
4,148,003
|
|
|||
130
Investment securities with carrying values of
$163.0 million
and
$564.4 million
as of
December 31, 2018
and
2017
, respectively, were pledged to secure FHLB advances, public deposits and for other purposes as required or permitted by law.
The following table summarizes the investment securities with unrealized losses by security type and length of time in a continuous unrealized loss position as of the dates indicated:
|
Less Than 12 Months
|
12 Months or Longer
|
Total
|
||||||||||||||||||||||
|
($ in thousands)
|
Fair Value
|
Gross Unrealized Losses
|
Fair Value
|
Gross Unrealized Losses
|
Fair Value
|
Gross Unrealized Losses
|
||||||||||||||||||
|
December 31, 2018
|
||||||||||||||||||||||||
|
Securities available-for-sale:
|
||||||||||||||||||||||||
|
SBA loan pool securities
|
$
|
—
|
|
$
|
—
|
|
$
|
910
|
|
$
|
(1
|
)
|
$
|
910
|
|
$
|
(1
|
)
|
||||||
|
U.S. government agency and U.S. government sponsored enterprise residential mortgage-backed securities
|
$
|
13,494
|
|
$
|
(133
|
)
|
$
|
423,916
|
|
$
|
(24,412
|
)
|
$
|
437,410
|
|
$
|
(24,545
|
)
|
||||||
|
Non-agency residential mortgage-backed securities
|
90
|
|
—
|
|
16
|
|
—
|
|
106
|
|
—
|
|
||||||||||||
|
Collateralized loan obligations
|
1,364,317
|
|
(9,480
|
)
|
32,790
|
|
(310
|
)
|
1,397,107
|
|
(9,790
|
)
|
||||||||||||
|
Total securities available-for-sale
|
$
|
1,377,901
|
|
$
|
(9,613
|
)
|
$
|
457,632
|
|
$
|
(24,723
|
)
|
$
|
1,835,533
|
|
$
|
(34,336
|
)
|
||||||
|
December 31, 2017
|
||||||||||||||||||||||||
|
Securities available-for-sale:
|
||||||||||||||||||||||||
|
U.S. government agency and U.S. government sponsored enterprise residential mortgage-backed securities
|
4,880
|
|
(35
|
)
|
470,092
|
|
(15,301
|
)
|
474,972
|
|
(15,336
|
)
|
||||||||||||
|
Non-agency residential mortgage-backed securities
|
—
|
|
—
|
|
148
|
|
(1
|
)
|
148
|
|
(1
|
)
|
||||||||||||
|
Collateralized loan obligations
|
104,334
|
|
(266
|
)
|
—
|
|
—
|
|
104,334
|
|
(266
|
)
|
||||||||||||
|
Total securities available-for-sale
|
$
|
109,214
|
|
$
|
(301
|
)
|
$
|
470,240
|
|
$
|
(15,302
|
)
|
$
|
579,454
|
|
$
|
(15,603
|
)
|
||||||
At
December 31, 2018
, the Company’s securities available-for-sale portfolio consisted of
145
securities,
118
of which were in an unrealized loss position. At December 31, 2017, the Company’s securities available-for-sale portfolio consisted of
191
securities,
33
of which were in an unrealized loss position.
The Company monitors its securities portfolio to ensure it has adequate credit support. The majority of unrealized losses are
related to the Company's mortgage-backed securities issued by U.S government sponsored entities and agencies. The Company
also considers the lowest credit rating for identification of potential OTTI for other securities. As of
December 31, 2018
, nearly
all of the Company's non-agency mortgage-backed securities or collateralized loan obligations investment securities in an
unrealized loss position received an investment grade credit rating. The decline in fair value is attributable to changes in interest
rates and not credit quality. Other than the OTTI recognized related to the non-agency commercial mortgage-backed securities, as of
December 31, 2018
, the Company did not have the intent to sell its securities in an unrealized loss position and further believes it is not likely that it will be required to sell these securities before their anticipated recovery.
131
The following table presents the composition and the repricing and yield information of the investment securities portfolio as of
December 31, 2018
:
|
One year or less
|
More than One Year through Five Years
|
More than Five Years through Ten Years
|
More than Ten Years
|
Total
|
|||||||||||||||||||||||||||||||
|
($ in thousands)
|
Fair
Value
|
Weighted-Average Yield
|
Fair
Value
|
Weighted-Average Yield
|
Fair
Value
|
Weighted-Average Yield
|
Fair
Value
|
Weighted-Average Yield
|
Fair
Value
|
Weighted-Average Yield
|
|||||||||||||||||||||||||
|
Securities available-for-sale:
|
|||||||||||||||||||||||||||||||||||
|
SBA loan pool securities
|
$
|
—
|
|
—
|
%
|
$
|
—
|
|
—
|
%
|
$
|
—
|
|
—
|
%
|
$
|
910
|
|
2.84
|
%
|
$
|
910
|
|
2.84
|
%
|
||||||||||
|
U.S. government agency and U.S. government sponsored enterprise residential mortgage-backed securities
|
279
|
|
2.95
|
%
|
3,460
|
|
3.32
|
%
|
—
|
|
—
|
%
|
433,703
|
|
3.23
|
%
|
437,442
|
|
3.23
|
%
|
|||||||||||||||
|
Non-agency residential mortgage-backed securities
|
83
|
|
3.96
|
%
|
—
|
|
—
|
%
|
—
|
|
—
|
%
|
344
|
|
5.47
|
%
|
427
|
|
5.18
|
%
|
|||||||||||||||
|
Non-agency commercial mortgage-backed securities
|
—
|
|
—
|
%
|
—
|
|
—
|
%
|
132,199
|
|
3.75
|
%
|
—
|
|
—
|
%
|
132,199
|
|
3.75
|
%
|
|||||||||||||||
|
Collateralized loan obligations
|
1,421,522
|
|
4.44
|
%
|
—
|
|
—
|
%
|
—
|
|
—
|
%
|
—
|
|
—
|
%
|
1,421,522
|
|
4.44
|
%
|
|||||||||||||||
|
Total securities available-for-sale
|
$
|
1,421,884
|
|
4.44
|
%
|
$
|
3,460
|
|
3.32
|
%
|
$
|
132,199
|
|
3.75
|
%
|
$
|
434,957
|
|
3.23
|
%
|
$
|
1,992,500
|
|
4.13
|
%
|
||||||||||
132
NOTE 5 – LOANS AND LEASES AND ALLOWANCE FOR LOAN AND LEASE LOSSES
The following table presents the balances in the Company’s loans and leases portfolio as of the dates indicated:
|
($ in thousands)
|
NTM Loans
|
Traditional Loans and Leases
|
Total Loans and Leases Receivable
|
|||||||||
|
December 31, 2018
|
||||||||||||
|
Commercial:
|
||||||||||||
|
Commercial and industrial
|
$
|
—
|
|
$
|
1,944,142
|
|
$
|
1,944,142
|
|
|||
|
Commercial real estate
|
—
|
|
867,013
|
|
867,013
|
|
||||||
|
Multifamily
|
—
|
|
2,241,246
|
|
2,241,246
|
|
||||||
|
SBA
|
—
|
|
68,741
|
|
68,741
|
|
||||||
|
Construction
|
—
|
|
203,976
|
|
203,976
|
|
||||||
|
Lease financing
|
—
|
|
—
|
|
—
|
|
||||||
|
Consumer:
|
||||||||||||
|
Single family residential mortgage
|
824,318
|
|
1,481,172
|
|
2,305,490
|
|
||||||
|
Other consumer
|
2,413
|
|
67,852
|
|
70,265
|
|
||||||
|
Total loans and leases
(1)
|
$
|
826,731
|
|
$
|
6,874,142
|
|
$
|
7,700,873
|
|
|||
|
Percentage to total loans and leases
|
10.7
|
%
|
89.3
|
%
|
100.0
|
%
|
||||||
|
Allowance for loan and lease losses
|
(62,192
|
)
|
||||||||||
|
Loans and leases receivable, net
|
$
|
7,638,681
|
|
|||||||||
|
December 31, 2017
|
||||||||||||
|
Commercial:
|
||||||||||||
|
Commercial and industrial
|
$
|
—
|
|
$
|
1,701,951
|
|
$
|
1,701,951
|
|
|||
|
Commercial real estate
|
—
|
|
717,415
|
|
717,415
|
|
||||||
|
Multifamily
|
—
|
|
1,816,141
|
|
1,816,141
|
|
||||||
|
SBA
|
—
|
|
78,699
|
|
78,699
|
|
||||||
|
Construction
|
—
|
|
182,960
|
|
182,960
|
|
||||||
|
Lease financing
|
—
|
|
13
|
|
13
|
|
||||||
|
Consumer:
|
||||||||||||
|
Single family residential mortgage
|
803,355
|
|
1,252,294
|
|
2,055,649
|
|
||||||
|
Other consumer
|
3,578
|
|
103,001
|
|
106,579
|
|
||||||
|
Total loans and leases
(1)
|
$
|
806,933
|
|
$
|
5,852,474
|
|
$
|
6,659,407
|
|
|||
|
Percentage to total loans and leases
|
12.1
|
%
|
87.9
|
%
|
100.0
|
%
|
||||||
|
Allowance for loan and lease losses
|
(49,333
|
)
|
||||||||||
|
Loans and leases receivable, net
|
$
|
6,610,074
|
|
|||||||||
|
(1)
|
Total loans and leases includes deferred loan origination costs/(fees) and premiums/(discounts), net of
$17.7 million
and
$6.4 million
, respectively, at December 31, 2018 and 2017.
|
133
Non-Traditional Mortgage Loans
The Company’s NTM portfolio is comprised of three interest only products: Green Loans, Interest Only loans and a small number of additional loans with the potential for negative amortization. As of
December 31, 2018
and
2017
, the NTM loans totaled
$826.7 million
, or
10.7 percent
of total loans and leases, and
$806.9 million
, or
12.1 percent
of total loans and leases, respectively. The total NTM portfolio
increased
by
$19.8 million
, or
2.5 percent
, during the year ended
December 31, 2018
.
The following table presents the composition of the NTM portfolio as of the dates indicated:
|
December
31,
|
||||||||||||||||||||
|
2018
|
2017
|
|||||||||||||||||||
|
($ in thousands)
|
Count
|
Amount
|
Percent
|
Count
|
Amount
|
Percent
|
||||||||||||||
|
Green Loans (HELOC) - first liens
|
88
|
|
$
|
67,729
|
|
8.2
|
%
|
101
|
|
$
|
82,197
|
|
10.2
|
%
|
||||||
|
Interest only - first liens
|
519
|
|
753,061
|
|
91.1
|
%
|
468
|
|
717,484
|
|
88.9
|
%
|
||||||||
|
Negative amortization
|
11
|
|
3,528
|
|
0.4
|
%
|
11
|
|
3,674
|
|
0.5
|
%
|
||||||||
|
Total NTM - first liens
|
618
|
|
824,318
|
|
99.7
|
%
|
580
|
|
803,355
|
|
99.6
|
%
|
||||||||
|
Green Loans (HELOC) - second liens
|
10
|
|
2,413
|
|
0.3
|
%
|
12
|
|
3,578
|
|
0.4
|
%
|
||||||||
|
Total NTM - second liens
|
10
|
|
2,413
|
|
0.3
|
%
|
12
|
|
3,578
|
|
0.4
|
%
|
||||||||
|
Total NTM loans
|
628
|
|
$
|
826,731
|
|
100.0
|
%
|
592
|
|
$
|
806,933
|
|
100.0
|
%
|
||||||
|
Total loans and leases
|
$
|
7,700,873
|
|
$
|
6,659,407
|
|
||||||||||||||
|
Percentage to total loans and leases
|
10.7
|
%
|
12.1
|
%
|
||||||||||||||||
Green Loans
Green Loans are single family residential first and second mortgage lines of credit with a linked checking account that allows all types of deposits and withdrawals to be performed. The loans are generally interest only for a
15
-year term with a balloon payment due at maturity. At
December 31, 2018
and
2017
, Green Loans totaled
$70.1 million
and
$85.8 million
, respectively. At
December 31, 2018
and
2017
,
none
of the Company’s Green Loans were non-performing. As a result of their unique payment feature, Green Loans possess higher credit risk due to the potential for negative amortization; however, management believes the risk is mitigated through the Company’s loan terms and underwriting standards, including its policies on LTV ratios and the Company’s contractual ability to curtail loans when the value of the underlying collateral declines. The Company discontinued origination of the Green Loan products in 2011.
Interest Only Loans
Interest Only loans are primarily single family residential first mortgage loans with payment features that allow interest only payments in initial periods before converting to a fully amortizing loan. At
December 31, 2018
and
2017
, Interest Only loans totaled
$753.1 million
and
$717.5 million
, respectively. At
December 31, 2018
and
2017
,
$0
and
$1.2 million
of the Interest Only loans were non-performing, respectively.
Loans with the Potential for Negative Amortization
Negative amortization loans totaled
$3.5 million
and
$3.7 million
at
December 31, 2018
and
2017
, respectively. The Company discontinued origination of negative amortization loans in 2007. At
December 31, 2018
and
2017
,
none
of the loans with the potential for negative amortization were non-performing. These loans pose a potentially higher credit risk because of the lack of principal amortization and potential for negative amortization; however, management believes the risk is mitigated through the loan terms and underwriting standards, including the Company’s policies on LTV ratios.
134
Risk Management of Non-Traditional Mortgages
The Company has determined that significant performance indicators for NTMs are LTV ratios and FICO scores. Accordingly, the Company manages credit risk in the NTM portfolio through periodic review of the loan portfolio that includes refreshing FICO scores on the Green Loans and HELOCs, as needed in conjunction with portfolio management, and ordering third party AVMs. The loan review is designed to provide a method of identifying borrowers who may be experiencing financial difficulty before they actually fail to make a loan payment. Upon receipt of the updated FICO scores, an exception report is run to identify loans with a decrease in FICO score of
10 percent
or more and/or a resulting FICO score of 620 or less. The loans are then further analyzed to determine if the risk rating should be downgraded, which will increase the reserves the Company will establish for potential losses. A report of the periodic loan review is published and regularly monitored.
As these loans are revolving lines of credit, the Company, based on the loan agreement and loan covenants of the particular loan, as well as applicable rules and regulations, could suspend the borrowing privileges or reduce the credit limit at any time the Company reasonably believes that the borrower will be unable to fulfill their repayment obligations under the agreement or certain other conditions are met. In many cases, the decrease in FICO score is the first indication that the borrower may have difficulty in making their future payment obligations.
The Company proactively manages the NTM portfolio by performing detailed analyses on the portfolio. The Company’s IARC meets at least quarterly to review the loans classified as special mention, substandard, or doubtful and determines whether a suspension or reduction in credit limit is warranted. If a line has been suspended and the borrower would like to have their credit privileges reinstated, they would need to provide updated financials showing their ability to meet their payment obligations.
On the interest only loans, the Company projects future payment changes to determine if there will be a material increase in the required payment and then monitors the loans for possible delinquency. Individual loans are monitored for possible downgrading of risk rating.
Non-Traditional Mortgage Performance Indicators
The following table presents the Company’s Green Loans first lien portfolio at
December 31, 2018
by FICO scores that were obtained during the quarter ended
December 31, 2018
, comparing to the FICO scores for those same loans that were obtained during the quarter ended
December 31, 2017
:
|
December 31, 2018
|
||||||||||||||||||||||||||||||
|
By FICO Scores Obtained During the Quarter Ended December
31, 2018
|
By FICO Scores Obtained During the Quarter Ended December
31, 2017
|
Change
|
||||||||||||||||||||||||||||
|
($ in thousands)
|
Count
|
Amount
|
Percent
|
Count
|
Amount
|
Percent
|
Count
|
Amount
|
Percent
|
|||||||||||||||||||||
|
FICO score
|
||||||||||||||||||||||||||||||
|
800+
|
16
|
|
$
|
10,617
|
|
15.7
|
%
|
12
|
|
$
|
7,407
|
|
10.9
|
%
|
4
|
|
$
|
3,210
|
|
4.8
|
%
|
|||||||||
|
700-799
|
50
|
|
34,888
|
|
51.5
|
%
|
44
|
|
28,327
|
|
41.8
|
%
|
6
|
|
6,561
|
|
9.7
|
%
|
||||||||||||
|
600-699
|
16
|
|
14,098
|
|
20.8
|
%
|
23
|
|
23,406
|
|
34.6
|
%
|
(7
|
)
|
(9,308
|
)
|
(13.8
|
)%
|
||||||||||||
|
<600
|
3
|
|
4,347
|
|
6.4
|
%
|
5
|
|
4,679
|
|
6.9
|
%
|
(2
|
)
|
(332
|
)
|
(0.5
|
)%
|
||||||||||||
|
No FICO score
|
3
|
|
3,779
|
|
5.6
|
%
|
4
|
|
3,910
|
|
5.8
|
%
|
(1
|
)
|
(131
|
)
|
(0.2
|
)%
|
||||||||||||
|
Total
|
88
|
|
$
|
67,729
|
|
100.0
|
%
|
88
|
|
$
|
67,729
|
|
100.0
|
%
|
—
|
|
$
|
—
|
|
—
|
%
|
|||||||||
135
Loan to Value Ratio
LTV ratio represents estimated current loan to value ratio, determined by dividing current unpaid principal balance by latest estimated property value received per the Company policy. The table below represents the Company’s single family residential NTM first lien portfolio by LTV ratios as of the dates indicated:
|
LTV Ratios
|
Green
|
Interest Only
|
Negative Amortization
|
Total
|
||||||||||||||||||||||||||||||||||||
|
($ in thousands)
|
Count
|
Amount
|
Percent
|
Count
|
Amount
|
Percent
|
Count
|
Amount
|
Percent
|
Count
|
Amount
|
Percent
|
||||||||||||||||||||||||||||
|
December 31, 2018
|
||||||||||||||||||||||||||||||||||||||||
|
< 61
|
69
|
|
$
|
51,827
|
|
76.5
|
%
|
312
|
|
$
|
495,930
|
|
65.9
|
%
|
11
|
|
$
|
3,528
|
|
100.0
|
%
|
392
|
|
$
|
551,285
|
|
66.9
|
%
|
||||||||||||
|
61-80
|
17
|
|
13,476
|
|
19.9
|
%
|
201
|
|
245,568
|
|
32.6
|
%
|
—
|
|
—
|
|
—
|
%
|
218
|
|
259,044
|
|
31.4
|
%
|
||||||||||||||||
|
81-100
|
2
|
|
2,426
|
|
3.6
|
%
|
5
|
|
7,441
|
|
1.0
|
%
|
—
|
|
—
|
|
—
|
%
|
7
|
|
9,867
|
|
1.2
|
%
|
||||||||||||||||
|
> 100
|
—
|
|
—
|
|
—
|
%
|
1
|
|
4,122
|
|
0.5
|
%
|
—
|
|
—
|
|
—
|
%
|
1
|
|
4,122
|
|
0.5
|
%
|
||||||||||||||||
|
Total
|
88
|
|
$
|
67,729
|
|
100.0
|
%
|
519
|
|
$
|
753,061
|
|
100.0
|
%
|
11
|
|
$
|
3,528
|
|
100.0
|
%
|
618
|
|
$
|
824,318
|
|
100.0
|
%
|
||||||||||||
|
December 31, 2017
|
||||||||||||||||||||||||||||||||||||||||
|
< 61
|
60
|
|
$
|
51,241
|
|
62.3
|
%
|
242
|
|
$
|
407,810
|
|
56.8
|
%
|
9
|
|
$
|
2,826
|
|
76.9
|
%
|
311
|
|
$
|
461,877
|
|
57.5
|
%
|
||||||||||||
|
61-80
|
33
|
|
25,072
|
|
30.5
|
%
|
220
|
|
300,500
|
|
41.9
|
%
|
2
|
|
848
|
|
23.1
|
%
|
255
|
|
326,420
|
|
40.6
|
%
|
||||||||||||||||
|
81-100
|
8
|
|
5,884
|
|
7.2
|
%
|
6
|
|
9,174
|
|
1.3
|
%
|
—
|
|
—
|
|
—
|
%
|
14
|
|
15,058
|
|
1.9
|
%
|
||||||||||||||||
|
> 100
|
—
|
|
—
|
|
—
|
%
|
—
|
|
—
|
|
—
|
%
|
—
|
|
—
|
|
—
|
%
|
—
|
|
—
|
|
—
|
%
|
||||||||||||||||
|
Total
|
101
|
|
$
|
82,197
|
|
100.0
|
%
|
468
|
|
$
|
717,484
|
|
100.0
|
%
|
11
|
|
$
|
3,674
|
|
100.0
|
%
|
580
|
|
$
|
803,355
|
|
100.0
|
%
|
||||||||||||
136
Allowance for Loan and Lease Losses
The Company has established credit risk management processes that include regular management review of the loan and lease portfolio to identify problem loans and leases. During the ordinary course of business, management becomes aware of borrowers and lessees who may not be able to fulfill the contractual payment requirements of the loan and lease agreements. Such loans and leases are subject to increased monitoring. Consideration is given to placing the loan or lease on non-accrual status, assessing the need for additional ALLL, and partial or full charge-off of the principal balance. The Company maintains the ALLL at a level that is considered adequate to cover the estimated incurred loss in the loan and lease portfolio.
The Company also maintains a separate reserve for unfunded loan commitments at a level that is considered adequate to cover the estimated incurred loss. The estimated funding of the loan commitments and credit risk factors determined based on outstanding loans that share similar credit risk exposure are used to determine the adequacy of the reserve. At
December 31, 2018
and
2017
, the reserve for unfunded loan commitments was
$4.6 million
and
$3.7 million
, respectively, which are recorded in Accrued Expenses and Other Liabilities on the Consolidated Statements of Financial Condition.
The credit risk monitoring system is designed to identify impaired and potential problem loans, and to perform periodic evaluation of impairment and the adequacy of the allowance for credit losses in a timely manner. In addition, the Board of Directors of the Bank has adopted a credit policy that includes a credit review and control system that it believes should be effective in ensuring that the Company maintains an adequate allowance for loan and lease losses. The Board of Directors also provides oversight and guidance for management’s allowance evaluation process. The Company’s loan segmentation increased from
11
to
13
segments, with the addition of an Indirect Leverage Lending segment and a Warehouse FixNFlip segment. Management concluded these products represented unique credit and risk characteristics to warrant separate segmentation. Additionally, management enhanced the methodology in the areas of qualitative adjustments, and performed an annual update of the loss emergence period. These updates were designed to be systematic, transparent, and repeatable. None of the updates and enhancements made to the ALLL methodology had a material impact on the reserve at December 31, 2018.
The following table presents a summary of activity in the ALLL for the periods indicated:
|
Year Ended December
31,
|
||||||||||||
|
($ in thousands)
|
2018
|
2017
|
2016
|
|||||||||
|
Balance at beginning of year
|
$
|
49,333
|
|
$
|
40,444
|
|
$
|
35,533
|
|
|||
|
Loans and leases charged-off
|
(18,499
|
)
|
(5,581
|
)
|
(2,618
|
)
|
||||||
|
Recoveries of loans and leases previously charged off
|
1,143
|
|
771
|
|
2,258
|
|
||||||
|
Provision for loan and lease losses
|
30,215
|
|
13,699
|
|
5,271
|
|
||||||
|
Balance at end of year
|
$
|
62,192
|
|
$
|
49,333
|
|
$
|
40,444
|
|
|||
During the three months ended March 31, 2018, the Company recorded a charge-off of
$13.9 million
, which reflected the outstanding balance under a
$15.0 million
line of credit that was originated during the three months ended March 31, 2018. Subsequent to the granting of the line of credit, representations from the borrower in applying for the line of credit were determined by the Bank to be false, and third party bank account statements provided by the borrower to secure the line of credit were found to be fraudulent. The line of credit was granted after the borrower appeared to have satisfied a pre-condition that the line of credit be fully cash collateralized and secured by a bank account at a third party financial institution pledged to the Bank. As part of the Bank’s credit review and portfolio management process, the line of credit and disbursements were reviewed subsequent to closing and compliance with the borrower’s covenants was monitored. As part of this process, on March 9, 2018, the Bank received information that caused it to believe the existence of the pledged bank account had been misrepresented by the borrower and that the account had previously been closed. The Bank filed an action in federal court pursuing the borrower and other parties and is also considering other available sources of collection and other potential means of mitigating the loss; however, no assurance can be given that it will be successful in this regard. Upon extensive review of the underwriting process for this loan, the Bank determined that this loan was the result of an isolated event of external fraud.
137
The following table presents the activity and balance in the ALLL and the recorded investment, excluding accrued interest, in loans and leases by portfolio segment and is based on the impairment method as of or for the year ended
December 31, 2018
:
|
($ in thousands)
|
Commercial and Industrial
|
Commercial Real Estate
|
Multifamily
|
SBA
|
Construction
|
Lease Financing
|
Single Family Residential Mortgage
|
Other Consumer
|
Total
|
|||||||||||||||||||||||||||
|
ALLL:
|
||||||||||||||||||||||||||||||||||||
|
Balance at December 31, 2017
|
$
|
14,280
|
|
$
|
4,971
|
|
$
|
13,265
|
|
$
|
1,701
|
|
$
|
3,318
|
|
$
|
—
|
|
$
|
10,996
|
|
$
|
802
|
|
$
|
49,333
|
|
|||||||||
|
Charge-offs
|
(1,927
|
)
|
—
|
|
(14
|
)
|
(1,927
|
)
|
—
|
|
—
|
|
(558
|
)
|
(14,073
|
)
|
(18,499
|
)
|
||||||||||||||||||
|
Recoveries
|
396
|
|
—
|
|
—
|
|
273
|
|
—
|
|
15
|
|
436
|
|
23
|
|
1,143
|
|
||||||||||||||||||
|
Provision
|
5,442
|
|
1,703
|
|
4,719
|
|
1,780
|
|
143
|
|
(15
|
)
|
2,254
|
|
14,189
|
|
30,215
|
|
||||||||||||||||||
|
Balance at December 31, 2018
|
$
|
18,191
|
|
$
|
6,674
|
|
$
|
17,970
|
|
$
|
1,827
|
|
$
|
3,461
|
|
$
|
—
|
|
$
|
13,128
|
|
$
|
941
|
|
$
|
62,192
|
|
|||||||||
|
Individually evaluated for impairment
|
$
|
—
|
|
$
|
—
|
|
$
|
—
|
|
$
|
562
|
|
$
|
—
|
|
$
|
—
|
|
$
|
161
|
|
$
|
106
|
|
$
|
829
|
|
|||||||||
|
Collectively evaluated for impairment
|
18,191
|
|
6,674
|
|
17,970
|
|
1,265
|
|
3,461
|
|
—
|
|
12,967
|
|
835
|
|
61,363
|
|
||||||||||||||||||
|
Total ending ALLL
|
$
|
18,191
|
|
$
|
6,674
|
|
$
|
17,970
|
|
$
|
1,827
|
|
$
|
3,461
|
|
$
|
—
|
|
$
|
13,128
|
|
$
|
941
|
|
$
|
62,192
|
|
|||||||||
|
Loans and leases:
|
||||||||||||||||||||||||||||||||||||
|
Individually evaluated for impairment
|
$
|
5,455
|
|
$
|
—
|
|
$
|
—
|
|
$
|
2,376
|
|
$
|
—
|
|
$
|
—
|
|
$
|
18,193
|
|
$
|
921
|
|
$
|
26,945
|
|
|||||||||
|
Collectively evaluated for impairment
|
1,938,687
|
|
867,013
|
|
2,241,246
|
|
66,365
|
|
203,976
|
|
—
|
|
2,287,297
|
|
69,344
|
|
7,673,928
|
|
||||||||||||||||||
|
Total loans and leases
|
$
|
1,944,142
|
|
$
|
867,013
|
|
$
|
2,241,246
|
|
$
|
68,741
|
|
$
|
203,976
|
|
$
|
—
|
|
$
|
2,305,490
|
|
$
|
70,265
|
|
$
|
7,700,873
|
|
|||||||||
138
The following table presents the activity and balance in the ALLL and the recorded investment, excluding accrued interest, in loans and leases by portfolio segment and is based on the impairment method as of or for the year ended
December 31, 2017
:
|
($ in thousands)
|
Commercial and Industrial
|
Commercial Real Estate
|
Multifamily
|
SBA
|
Construction
|
Lease Financing
|
Single Family Residential Mortgage
|
Other Consumer
|
Total
|
|||||||||||||||||||||||||||
|
ALLL:
|
||||||||||||||||||||||||||||||||||||
|
Balance at December 31, 2016
|
$
|
7,584
|
|
$
|
5,467
|
|
$
|
11,376
|
|
$
|
939
|
|
$
|
2,015
|
|
$
|
6
|
|
$
|
12,075
|
|
$
|
982
|
|
$
|
40,444
|
|
|||||||||
|
Charge-offs
|
(1,730
|
)
|
(113
|
)
|
—
|
|
(625
|
)
|
(29
|
)
|
—
|
|
(2,806
|
)
|
(278
|
)
|
(5,581
|
)
|
||||||||||||||||||
|
Recoveries
|
54
|
|
—
|
|
—
|
|
422
|
|
—
|
|
32
|
|
1
|
|
262
|
|
771
|
|
||||||||||||||||||
|
Provision
|
8,372
|
|
(383
|
)
|
1,889
|
|
965
|
|
1,332
|
|
(38
|
)
|
1,726
|
|
(164
|
)
|
13,699
|
|
||||||||||||||||||
|
Balance at December 31, 2017
|
$
|
14,280
|
|
$
|
4,971
|
|
$
|
13,265
|
|
$
|
1,701
|
|
$
|
3,318
|
|
$
|
—
|
|
$
|
10,996
|
|
$
|
802
|
|
$
|
49,333
|
|
|||||||||
|
Individually evaluated for impairment
|
$
|
498
|
|
$
|
—
|
|
$
|
—
|
|
$
|
435
|
|
$
|
—
|
|
$
|
—
|
|
$
|
277
|
|
$
|
7
|
|
$
|
1,217
|
|
|||||||||
|
Collectively evaluated for impairment
|
13,782
|
|
4,971
|
|
13,265
|
|
1,266
|
|
3,318
|
|
—
|
|
10,719
|
|
795
|
|
48,116
|
|
||||||||||||||||||
|
Total ending ALLL
|
$
|
14,280
|
|
$
|
4,971
|
|
$
|
13,265
|
|
$
|
1,701
|
|
$
|
3,318
|
|
$
|
—
|
|
$
|
10,996
|
|
$
|
802
|
|
$
|
49,333
|
|
|||||||||
|
Loans and leases:
|
||||||||||||||||||||||||||||||||||||
|
Individually evaluated for impairment
|
$
|
3,582
|
|
$
|
—
|
|
$
|
—
|
|
$
|
944
|
|
$
|
—
|
|
$
|
—
|
|
$
|
14,699
|
|
$
|
4,825
|
|
$
|
24,050
|
|
|||||||||
|
Collectively evaluated for impairment
|
1,698,369
|
|
717,415
|
|
1,816,141
|
|
77,755
|
|
182,960
|
|
13
|
|
2,040,950
|
|
101,754
|
|
6,635,357
|
|
||||||||||||||||||
|
Total loans and leases
|
$
|
1,701,951
|
|
$
|
717,415
|
|
$
|
1,816,141
|
|
$
|
78,699
|
|
$
|
182,960
|
|
$
|
13
|
|
$
|
2,055,649
|
|
$
|
106,579
|
|
$
|
6,659,407
|
|
|||||||||
139
The following table presents loans and leases individually evaluated for impairment by class of loans and leases as of the dates indicated. The recorded investment, excluding accrued interest, presents customer balances net of any partial charge-offs recognized on the loans and leases and net of any deferred fees and costs and any purchase premium or discount.
|
December
31,
|
||||||||||||||||||||||||
|
2018
|
2017
|
|||||||||||||||||||||||
|
($ in thousands)
|
Unpaid Principal Balance
|
Recorded Investment
|
Allowance for Loan and Lease Losses
|
Unpaid Principal Balance
|
Recorded Investment
|
Allowance for Loan and Lease Losses
|
||||||||||||||||||
|
With no related allowance recorded:
|
||||||||||||||||||||||||
|
Commercial:
|
||||||||||||||||||||||||
|
Commercial and industrial
|
$
|
5,491
|
|
$
|
5,455
|
|
$
|
—
|
|
$
|
471
|
|
$
|
453
|
|
$
|
—
|
|
||||||
|
SBA
|
1,668
|
|
1,588
|
|
—
|
|
342
|
|
335
|
|
—
|
|
||||||||||||
|
Consumer:
|
||||||||||||||||||||||||
|
Single family residential mortgage
|
12,115
|
|
12,161
|
|
—
|
|
7,521
|
|
7,553
|
|
—
|
|
||||||||||||
|
Other consumer
|
469
|
|
469
|
|
—
|
|
4,664
|
|
4,663
|
|
—
|
|
||||||||||||
|
With an allowance recorded:
|
||||||||||||||||||||||||
|
Commercial:
|
||||||||||||||||||||||||
|
Commercial and industrial
|
—
|
|
—
|
|
—
|
|
3,146
|
|
3,129
|
|
498
|
|
||||||||||||
|
SBA
|
823
|
|
788
|
|
562
|
|
635
|
|
609
|
|
435
|
|
||||||||||||
|
Consumer:
|
||||||||||||||||||||||||
|
Single family residential mortgage
|
5,993
|
|
6,032
|
|
161
|
|
7,090
|
|
7,146
|
|
277
|
|
||||||||||||
|
Other consumer
|
468
|
|
452
|
|
106
|
|
157
|
|
162
|
|
7
|
|
||||||||||||
|
Total
|
$
|
27,027
|
|
$
|
26,945
|
|
$
|
829
|
|
$
|
24,026
|
|
$
|
24,050
|
|
$
|
1,217
|
|
||||||
140
The following table presents information on impaired loans and leases, disaggregated by class, for the periods indicated:
|
Year Ended December
31,
|
||||||||||||||||||||||||||||||||||||
|
2018
|
2017
|
2016
|
||||||||||||||||||||||||||||||||||
|
($ in thousands)
|
Average Recorded Investment
|
Interest Income Recognized
|
Cash Basis Interest Recognized
|
Average Recorded Investment
|
Interest Income Recognized
|
Cash Basis Interest Recognized
|
Average Recorded Investment
|
Interest Income Recognized
|
Cash Basis Interest Recognized
|
|||||||||||||||||||||||||||
|
Commercial:
|
||||||||||||||||||||||||||||||||||||
|
Commercial and industrial
|
$
|
5,380
|
|
$
|
4
|
|
$
|
4
|
|
$
|
1,034
|
|
$
|
—
|
|
$
|
—
|
|
$
|
3,490
|
|
$
|
183
|
|
$
|
208
|
|
|||||||||
|
Commercial real estate
|
—
|
|
—
|
|
—
|
|
—
|
|
—
|
|
—
|
|
148
|
|
24
|
|
24
|
|
||||||||||||||||||
|
Multifamily
|
—
|
|
—
|
|
—
|
|
—
|
|
—
|
|
—
|
|
—
|
|
—
|
|
—
|
|
||||||||||||||||||
|
SBA
|
986
|
|
4
|
|
3
|
|
357
|
|
—
|
|
—
|
|
—
|
|
—
|
|
—
|
|
||||||||||||||||||
|
Construction
|
—
|
|
—
|
|
—
|
|
382
|
|
—
|
|
—
|
|
—
|
|
—
|
|
—
|
|
||||||||||||||||||
|
Lease Financing
|
—
|
|
—
|
|
—
|
|
19
|
|
—
|
|
—
|
|
—
|
|
—
|
|
—
|
|
||||||||||||||||||
|
Consumer:
|
||||||||||||||||||||||||||||||||||||
|
Single family residential mortgage
|
19,694
|
|
236
|
|
199
|
|
12,611
|
|
199
|
|
182
|
|
27,150
|
|
862
|
|
835
|
|
||||||||||||||||||
|
Other consumer
|
771
|
|
12
|
|
11
|
|
1,757
|
|
8
|
|
8
|
|
294
|
|
8
|
|
9
|
|
||||||||||||||||||
|
Total
|
$
|
26,831
|
|
$
|
256
|
|
$
|
217
|
|
$
|
16,158
|
|
$
|
207
|
|
$
|
190
|
|
$
|
31,081
|
|
$
|
1,077
|
|
$
|
1,076
|
|
|||||||||
Past Due Loans and Leases
The following table presents the aging of the recorded investment in past due loans and leases as of
December 31, 2018
, excluding accrued interest receivable (which is not considered to be material), by class of loans and leases:
|
December 31, 2018
|
||||||||||||||||||||||||
|
($ in thousands)
|
30 - 59 Days Past Due
|
60 - 89 Days Past Due
|
Greater than 89 Days Past due
|
Total Past Due
|
Current
|
Total
|
||||||||||||||||||
|
NTM loans:
|
||||||||||||||||||||||||
|
Single family residential mortgage
|
$
|
7,430
|
|
$
|
617
|
|
$
|
—
|
|
$
|
8,047
|
|
$
|
816,271
|
|
$
|
824,318
|
|
||||||
|
Other consumer
|
—
|
|
—
|
|
—
|
|
—
|
|
2,413
|
|
2,413
|
|
||||||||||||
|
Total NTM loans
|
7,430
|
|
617
|
|
—
|
|
8,047
|
|
818,684
|
|
826,731
|
|
||||||||||||
|
Traditional loans and leases:
|
||||||||||||||||||||||||
|
Commercial:
|
||||||||||||||||||||||||
|
Commercial and industrial
|
350
|
|
1,596
|
|
3,340
|
|
5,286
|
|
1,938,856
|
|
1,944,142
|
|
||||||||||||
|
Commercial real estate
|
—
|
|
582
|
|
—
|
|
582
|
|
866,431
|
|
867,013
|
|
||||||||||||
|
Multifamily
|
356
|
|
—
|
|
—
|
|
356
|
|
2,240,890
|
|
2,241,246
|
|
||||||||||||
|
SBA
|
551
|
|
77
|
|
862
|
|
1,490
|
|
67,251
|
|
68,741
|
|
||||||||||||
|
Construction
|
—
|
|
939
|
|
—
|
|
939
|
|
203,037
|
|
203,976
|
|
||||||||||||
|
Lease financing
|
—
|
|
—
|
|
—
|
|
—
|
|
—
|
|
—
|
|
||||||||||||
|
Consumer:
|
||||||||||||||||||||||||
|
Single family residential mortgage
|
7,321
|
|
3,160
|
|
9,198
|
|
19,679
|
|
1,461,493
|
|
1,481,172
|
|
||||||||||||
|
Other consumer
|
3,132
|
|
573
|
|
446
|
|
4,151
|
|
63,701
|
|
67,852
|
|
||||||||||||
|
Total traditional loans and leases
|
11,710
|
|
6,927
|
|
13,846
|
|
32,483
|
|
6,841,659
|
|
6,874,142
|
|
||||||||||||
|
Total loans and leases
|
$
|
19,140
|
|
$
|
7,544
|
|
$
|
13,846
|
|
$
|
40,530
|
|
$
|
7,660,343
|
|
$
|
7,700,873
|
|
||||||
141
The following table presents the aging of the recorded investment in past due loans and leases as of
December 31, 2017
, excluding accrued interest receivable (which is not considered to be material), by class of loans and leases:
|
December 31, 2017
|
||||||||||||||||||||||||
|
($ in thousands)
|
30 - 59 Days Past Due
|
60 - 89 Days Past Due
|
Greater than 89 Days Past due
|
Total Past Due
|
Current
|
Total
|
||||||||||||||||||
|
NTM loans:
|
||||||||||||||||||||||||
|
Single family residential mortgage
|
$
|
9,060
|
|
$
|
1,879
|
|
$
|
1,171
|
|
$
|
12,110
|
|
$
|
791,245
|
|
$
|
803,355
|
|
||||||
|
Other consumer
|
—
|
|
—
|
|
—
|
|
—
|
|
3,578
|
|
3,578
|
|
||||||||||||
|
Total NTM loans
|
9,060
|
|
1,879
|
|
1,171
|
|
12,110
|
|
794,823
|
|
806,933
|
|
||||||||||||
|
Traditional loans and leases:
|
||||||||||||||||||||||||
|
Commercial:
|
||||||||||||||||||||||||
|
Commercial and industrial
|
136
|
|
3,595
|
|
948
|
|
4,679
|
|
1,697,272
|
|
1,701,951
|
|
||||||||||||
|
Commercial real estate
|
—
|
|
—
|
|
—
|
|
—
|
|
717,415
|
|
717,415
|
|
||||||||||||
|
Multifamily
|
—
|
|
—
|
|
—
|
|
—
|
|
1,816,141
|
|
1,816,141
|
|
||||||||||||
|
SBA
|
3,578
|
|
—
|
|
1,319
|
|
4,897
|
|
73,802
|
|
78,699
|
|
||||||||||||
|
Construction
|
—
|
|
—
|
|
—
|
|
—
|
|
182,960
|
|
182,960
|
|
||||||||||||
|
Lease financing
|
—
|
|
—
|
|
—
|
|
—
|
|
13
|
|
13
|
|
||||||||||||
|
Consumer:
|
||||||||||||||||||||||||
|
Single family residential mortgage
|
6,862
|
|
3,370
|
|
6,012
|
|
16,244
|
|
1,236,050
|
|
1,252,294
|
|
||||||||||||
|
Other consumer
|
3,194
|
|
413
|
|
92
|
|
3,699
|
|
99,302
|
|
103,001
|
|
||||||||||||
|
Total traditional loans and leases
|
13,770
|
|
7,378
|
|
8,371
|
|
29,519
|
|
5,822,955
|
|
5,852,474
|
|
||||||||||||
|
Total loans and leases
|
$
|
22,830
|
|
$
|
9,257
|
|
$
|
9,542
|
|
$
|
41,629
|
|
$
|
6,617,778
|
|
$
|
6,659,407
|
|
||||||
142
Non-accrual Loans and Leases
The following table presents the composition of non-accrual loans and leases as of the dates indicated:
|
December
31,
|
||||||||||||||||||||||||
|
2018
|
2017
|
|||||||||||||||||||||||
|
($ in thousands)
|
NTM Loans
|
Traditional Loans and Leases
|
Total
|
NTM Loans
|
Traditional Loans and Leases
|
Total
|
||||||||||||||||||
|
Commercial:
|
||||||||||||||||||||||||
|
Commercial and industrial
|
$
|
—
|
|
$
|
5,455
|
|
$
|
5,455
|
|
$
|
—
|
|
$
|
3,723
|
|
$
|
3,723
|
|
||||||
|
SBA
|
—
|
|
2,574
|
|
2,574
|
|
—
|
|
1,781
|
|
1,781
|
|
||||||||||||
|
Consumer:
|
||||||||||||||||||||||||
|
Single family residential mortgage
|
—
|
|
12,929
|
|
12,929
|
|
1,171
|
|
8,176
|
|
9,347
|
|
||||||||||||
|
Other consumer
|
—
|
|
627
|
|
627
|
|
—
|
|
4,531
|
|
4,531
|
|
||||||||||||
|
Total
|
$
|
—
|
|
$
|
21,585
|
|
$
|
21,585
|
|
$
|
1,171
|
|
$
|
18,211
|
|
$
|
19,382
|
|
||||||
At
December 31, 2018
and
2017
,
$470 thousand
and
$0
of loans were past due 90 days or more and still accruing.
Loans in Process of Foreclosure
At
December 31, 2018
and
2017
, consumer mortgage loans of
$5.1 million
and
$4.3 million
, respectively, were secured by residential real estate properties for which formal foreclosure proceedings were in the process according to local requirements of the applicable jurisdiction.
Troubled Debt Restructurings
A modification of a loan constitutes a TDR when the Company, for economic or legal reasons related to a borrower’s financial difficulties, grants a concession to the borrower that it would not otherwise consider. The concessions may be granted in various forms, including reduction in the stated interest rate, reduction in the amount of principal amortization, forgiveness of a portion of the loan balance or accrued interest, or extension of the maturity date. In order to determine whether a borrower is experiencing financial difficulty, an evaluation is performed of the probability that the borrower will be in payment default on any of its debt in the foreseeable future without the modification. This evaluation is performed under the Company’s internal underwriting policy.
Troubled debt restructured loans and leases consisted of the following as of the dates indicated:
|
December
31,
|
||||||||||||||||||||||||
|
2018
|
2017
|
|||||||||||||||||||||||
|
($ in thousands)
|
NTM Loans
|
Traditional Loans
|
Total
|
NTM Loans
|
Traditional Loans
|
Total
|
||||||||||||||||||
|
Commercial:
|
||||||||||||||||||||||||
|
Commercial and industrial
|
$
|
—
|
|
$
|
2,276
|
|
$
|
2,276
|
|
$
|
—
|
|
$
|
2,675
|
|
$
|
2,675
|
|
||||||
|
SBA
|
—
|
|
187
|
|
187
|
|
—
|
|
—
|
|
—
|
|
||||||||||||
|
Consumer:
|
||||||||||||||||||||||||
|
Single family residential mortgage
|
2,668
|
|
2,596
|
|
5,264
|
|
2,699
|
|
2,653
|
|
5,352
|
|
||||||||||||
|
Other consumer
|
294
|
|
—
|
|
294
|
|
294
|
|
—
|
|
294
|
|
||||||||||||
|
Total
|
$
|
2,962
|
|
$
|
5,059
|
|
$
|
8,021
|
|
$
|
2,993
|
|
$
|
5,328
|
|
$
|
8,321
|
|
||||||
The Company did not have any commitments to lend to customers with outstanding loans that were classified as troubled debt restructurings as of
December 31, 2018
and
2017
. Accruing TDRs were
$5.7 million
and non-accrual TDRs were
$2.3 million
at December 31, 2018 compared to accruing TDRs
$5.6 million
and non-accrual TDRs of
$2.7 million
at December 31, 2017.
143
The following table summarizes the pre-modification and post-modification balances of the new TDRs for the periods indicated:
|
Year Ended December
31,
|
|||||||||||||||||||||||||||||||||
|
2018
|
2017
|
2016
|
|||||||||||||||||||||||||||||||
|
($ in thousands)
|
Number of Loans
|
Pre-Modification Outstanding Recorded Investment
|
Post-Modification Outstanding Recorded Investment
|
Number of Loans
|
Pre-Modification Outstanding Recorded Investment
|
Post-Modification Outstanding Recorded Investment
|
Number of Loans
|
Pre-Modification Outstanding Recorded Investment
|
Post-Modification Outstanding Recorded Investment
|
||||||||||||||||||||||||
|
Commercial:
|
|||||||||||||||||||||||||||||||||
|
Commercial and industrial
|
2
|
|
$
|
171
|
|
$
|
163
|
|
1
|
|
$
|
2,706
|
|
$
|
2,706
|
|
—
|
|
$
|
—
|
|
$
|
—
|
|
|||||||||
|
SBA
|
1
|
|
187
|
|
187
|
|
—
|
|
—
|
|
—
|
|
—
|
|
—
|
|
—
|
|
|||||||||||||||
|
Consumer:
|
|||||||||||||||||||||||||||||||||
|
Single family residential mortgage
|
—
|
|
—
|
|
—
|
|
3
|
|
2,416
|
|
2,433
|
|
42
|
|
10,278
|
|
10,273
|
|
|||||||||||||||
|
Total
|
3
|
|
$
|
358
|
|
$
|
350
|
|
4
|
|
$
|
5,122
|
|
$
|
5,139
|
|
42
|
|
$
|
10,278
|
|
$
|
10,273
|
|
|||||||||
For the years ended
December 31, 2018
,
2017
, and
2016
, there were
no
loans and leases that were modified as TDRs during the past 12 months that had subsequent payment defaults during the periods.
The following table summarizes the TDRs by modification type for the periods indicated:
|
Modification Type
|
||||||||||||||||||||||||||||||||||||||||||
|
Change in Principal Payments and Interest Rates
|
Change in Principal Payments
|
Change in Interest Rates
|
Chapter 7 Bankruptcy
|
Other
|
Total
|
|||||||||||||||||||||||||||||||||||||
|
($ in thousands)
|
Count
|
Amount
|
Count
|
Amount
|
Count
|
Amount
|
Count
|
Amount
|
Count
|
Amount
|
Count
|
Amount
|
||||||||||||||||||||||||||||||
|
Year ended December
31, 2018
|
||||||||||||||||||||||||||||||||||||||||||
|
Commercial:
|
||||||||||||||||||||||||||||||||||||||||||
|
Commercial and industrial
|
—
|
|
$
|
—
|
|
2
|
|
$
|
163
|
|
—
|
|
$
|
—
|
|
—
|
|
$
|
—
|
|
—
|
|
$
|
—
|
|
2
|
|
$
|
163
|
|
||||||||||||
|
SBA
|
—
|
|
—
|
|
—
|
|
—
|
|
—
|
|
—
|
|
—
|
|
—
|
|
1
|
|
187
|
|
1
|
|
187
|
|
||||||||||||||||||
|
Total
|
—
|
|
$
|
—
|
|
2
|
|
$
|
163
|
|
—
|
|
$
|
—
|
|
—
|
|
$
|
—
|
|
1
|
|
$
|
187
|
|
3
|
|
$
|
350
|
|
||||||||||||
|
Year ended December
31, 2017
|
||||||||||||||||||||||||||||||||||||||||||
|
Commercial:
|
||||||||||||||||||||||||||||||||||||||||||
|
Commercial and industrial
|
—
|
|
$
|
—
|
|
1
|
|
$
|
2,706
|
|
—
|
|
$
|
—
|
|
—
|
|
$
|
—
|
|
—
|
|
$
|
—
|
|
1
|
|
$
|
2,706
|
|
||||||||||||
|
Consumer:
|
||||||||||||||||||||||||||||||||||||||||||
|
Single family residential mortgage
|
2
|
|
1,290
|
|
1
|
|
1,143
|
|
—
|
|
—
|
|
—
|
|
—
|
|
—
|
|
—
|
|
3
|
|
2,433
|
|
||||||||||||||||||
|
Total
|
2
|
|
$
|
1,290
|
|
2
|
|
$
|
3,849
|
|
—
|
|
$
|
—
|
|
—
|
|
$
|
—
|
|
—
|
|
$
|
—
|
|
4
|
|
$
|
5,139
|
|
||||||||||||
|
Year ended December
31, 2016
|
||||||||||||||||||||||||||||||||||||||||||
|
Consumer:
|
||||||||||||||||||||||||||||||||||||||||||
|
Single family residential mortgage
|
34
|
|
$
|
8,622
|
|
4
|
|
$
|
780
|
|
2
|
|
$
|
146
|
|
1
|
|
$
|
519
|
|
1
|
|
$
|
206
|
|
42
|
|
$
|
10,273
|
|
||||||||||||
|
Total
|
34
|
|
$
|
8,622
|
|
4
|
|
$
|
780
|
|
2
|
|
$
|
146
|
|
1
|
|
$
|
519
|
|
1
|
|
$
|
206
|
|
42
|
|
$
|
10,273
|
|
||||||||||||
144
Credit Quality Indicators
The Company categorizes loans and leases into risk categories based on relevant information about the ability of borrowers to service their debt such as: current financial information, historical payment experience, credit documentation, public information, and current economic trends, among other factors. The Company performs historical loss analysis that is combined with a comprehensive loan or lease to value analysis to analyze the associated risks in the current loan and lease portfolio. The Company analyzes loans and leases individually by classifying the loans and leases as to credit risk. This analysis includes all loans and leases delinquent over
60 days
and non-homogeneous loans and leases such as commercial and commercial real estate loans and leases. The Company uses the following definitions for risk ratings:
Pass
: Loans and leases classified as pass are in compliance in all respects with the Bank’s credit policy and regulatory requirements, and do not exhibit any potential or defined weakness as defined under “Special Mention”, “Substandard” or “Doubtful”.
Special Mention
: Loans and leases classified as special mention have a potential weakness that deserves management’s close attention. If left uncorrected, these potential weaknesses may result in deterioration of the repayment prospects for the loan or lease or of the Company’s credit position at some future date.
Substandard
: Loans and leases classified as substandard are inadequately protected by the current net worth and paying capacity of the obligor or of the collateral pledged, if any. Loans and leases so classified have a well-defined weakness or weaknesses that jeopardize the liquidation of the debt. They are characterized by the distinct possibility that the institution will sustain some loss if the deficiencies are not corrected.
Doubtful
: Loans and leases classified as doubtful have all the weaknesses inherent in those classified as substandard, with the added characteristic that the weaknesses make collection or liquidation in full, on the basis of currently existing facts, conditions, and values, highly questionable and improbable.
Loans and leases not meeting the criteria above that are analyzed individually as part of the above described process are considered to be pass rated loans and leases.
145
The following table presents the risk categories for total loans and leases as of
December 31, 2018
:
|
December 31, 2018
|
||||||||||||||||||||
|
($ in thousands)
|
Pass
|
Special Mention
|
Substandard
|
Doubtful
|
Total
|
|||||||||||||||
|
NTM loans:
|
||||||||||||||||||||
|
Single family residential mortgage
|
$
|
811,056
|
|
$
|
10,966
|
|
$
|
2,296
|
|
$
|
—
|
|
$
|
824,318
|
|
|||||
|
Other consumer
|
2,413
|
|
—
|
|
—
|
|
—
|
|
2,413
|
|
||||||||||
|
Total NTM loans
|
813,469
|
|
10,966
|
|
2,296
|
|
—
|
|
826,731
|
|
||||||||||
|
Traditional loans and leases:
|
||||||||||||||||||||
|
Commercial:
|
||||||||||||||||||||
|
Commercial and industrial
|
1,859,569
|
|
41,302
|
|
43,271
|
|
—
|
|
1,944,142
|
|
||||||||||
|
Commercial real estate
|
851,604
|
|
11,376
|
|
4,033
|
|
—
|
|
867,013
|
|
||||||||||
|
Multifamily
|
2,239,301
|
|
—
|
|
1,945
|
|
—
|
|
2,241,246
|
|
||||||||||
|
SBA
|
53,433
|
|
6,114
|
|
8,340
|
|
854
|
|
68,741
|
|
||||||||||
|
Construction
|
197,851
|
|
3,606
|
|
2,519
|
|
—
|
|
203,976
|
|
||||||||||
|
Lease financing
|
—
|
|
—
|
|
—
|
|
—
|
|
—
|
|
||||||||||
|
Consumer:
|
||||||||||||||||||||
|
Single family residential mortgage
|
1,461,721
|
|
2,602
|
|
16,849
|
|
—
|
|
1,481,172
|
|
||||||||||
|
Other consumer
|
66,228
|
|
979
|
|
645
|
|
—
|
|
67,852
|
|
||||||||||
|
Total traditional loans and leases
|
6,729,707
|
|
65,979
|
|
77,602
|
|
854
|
|
6,874,142
|
|
||||||||||
|
Total loans and leases
|
$
|
7,543,176
|
|
$
|
76,945
|
|
$
|
79,898
|
|
$
|
854
|
|
$
|
7,700,873
|
|
|||||
The following table presents the risk categories for total loans and leases as of
December 31, 2017
:
|
December 31, 2017
|
||||||||||||||||||||
|
($ in thousands)
|
Pass
|
Special Mention
|
Substandard
|
Doubtful
|
Total
|
|||||||||||||||
|
NTM loans:
|
||||||||||||||||||||
|
Single family residential mortgage
|
$
|
800,589
|
|
$
|
1,595
|
|
$
|
1,171
|
|
$
|
—
|
|
$
|
803,355
|
|
|||||
|
Other consumer
|
3,578
|
|
—
|
|
—
|
|
—
|
|
3,578
|
|
||||||||||
|
Total NTM loans
|
804,167
|
|
1,595
|
|
1,171
|
|
—
|
|
806,933
|
|
||||||||||
|
Traditional loans and leases:
|
||||||||||||||||||||
|
Commercial:
|
||||||||||||||||||||
|
Commercial and industrial
|
1,651,628
|
|
33,376
|
|
16,947
|
|
—
|
|
1,701,951
|
|
||||||||||
|
Commercial real estate
|
713,131
|
|
—
|
|
4,284
|
|
—
|
|
717,415
|
|
||||||||||
|
Multifamily
|
1,815,601
|
|
540
|
|
—
|
|
—
|
|
1,816,141
|
|
||||||||||
|
SBA
|
72,417
|
|
1,555
|
|
4,621
|
|
106
|
|
78,699
|
|
||||||||||
|
Construction
|
182,960
|
|
—
|
|
—
|
|
—
|
|
182,960
|
|
||||||||||
|
Lease financing
|
13
|
|
—
|
|
—
|
|
—
|
|
13
|
|
||||||||||
|
Consumer:
|
||||||||||||||||||||
|
Single family residential mortgage
|
1,240,866
|
|
2,282
|
|
9,146
|
|
—
|
|
1,252,294
|
|
||||||||||
|
Other consumer
|
98,030
|
|
422
|
|
4,549
|
|
—
|
|
103,001
|
|
||||||||||
|
Total traditional loans and leases
|
5,774,646
|
|
38,175
|
|
39,547
|
|
106
|
|
5,852,474
|
|
||||||||||
|
Total loans and leases
|
$
|
6,578,813
|
|
$
|
39,770
|
|
$
|
40,718
|
|
$
|
106
|
|
$
|
6,659,407
|
|
|||||
146
Purchases and Sales
The following table presents loans and leases purchased and/or sold by portfolio segment, excluding loans held-for-sale, loans and leases acquired in business combinations or sold in sales of branches and business units, and PCI loans for the periods indicated:
|
Year Ended December
31,
|
||||||||||||||||||||||||
|
2018
|
2017
|
2016
|
||||||||||||||||||||||
|
($ in thousands)
|
Purchases
|
Sales
|
Purchases
|
Sales
|
Purchases
|
Sales
|
||||||||||||||||||
|
Commercial:
|
||||||||||||||||||||||||
|
Lease financing
|
$
|
—
|
|
$
|
—
|
|
$
|
—
|
|
$
|
—
|
|
$
|
91,247
|
|
$
|
(19,741
|
)
|
||||||
|
Consumer:
|
||||||||||||||||||||||||
|
Single family residential mortgage
|
59,481
|
|
—
|
|
—
|
|
—
|
|
—
|
|
(149,413
|
)
|
||||||||||||
|
Total
|
$
|
59,481
|
|
$
|
—
|
|
$
|
—
|
|
$
|
—
|
|
$
|
91,247
|
|
$
|
(169,154
|
)
|
||||||
Loan purchases during the year ended
December 31, 2018
were made at a net premium of
$2.3 million
. For the purchased loans and leases disclosed above, the Company did not incur any specific allowances for loan and lease losses during the years ended
December 31, 2018
,
2017
, and
2016
. The Company determined that it was probable at acquisition that all contractually required payments would be collected. The sales of loans and leases above exclude the transfer of lease financing loans totaling
$242.7 million
in the sale of the Commercial Equipment Finance business unit to Hanmi during the year ended December 31, 2016.
The following table presents loans and leases transferred from (to) loans held-for-sale by portfolio segment, excluding loans and leases transferred in connection with sales of branches and business units, and PCI loans for the periods indicated:
|
Year Ended December
31,
|
||||||||||||||||||||||||
|
2018
|
2017
|
2016
|
||||||||||||||||||||||
|
($ in thousands)
|
Transfers from Held-For-Sale
|
Transfers to Held-For-Sale
|
Transfers from Held-For-Sale
|
Transfers to Held-For-Sale
|
Transfers from Held-For-Sale
|
Transfers to Held-For-Sale
|
||||||||||||||||||
|
Commercial:
|
||||||||||||||||||||||||
|
Commercial and industrial
|
$
|
—
|
|
$
|
(1,133
|
)
|
$
|
—
|
|
$
|
(3,924
|
)
|
$
|
—
|
|
$
|
(1,757
|
)
|
||||||
|
Commercial real estate
|
—
|
|
—
|
|
—
|
|
(1,329
|
)
|
—
|
|
(2,792
|
)
|
||||||||||||
|
Multifamily
|
—
|
|
(81,449
|
)
|
—
|
|
(6,583
|
)
|
—
|
|
(81,780
|
)
|
||||||||||||
|
SBA
|
—
|
|
—
|
|
—
|
|
(1,865
|
)
|
—
|
|
—
|
|
||||||||||||
|
Construction
|
—
|
|
(434
|
)
|
—
|
|
(1,528
|
)
|
—
|
|
—
|
|
||||||||||||
|
Consumer:
|
||||||||||||||||||||||||
|
Single family residential mortgage
|
—
|
|
(289,617
|
)
|
88,591
|
|
(450,625
|
)
|
7,115
|
|
(105,337
|
)
|
||||||||||||
|
Other consumer
|
—
|
|
(4,362
|
)
|
—
|
|
—
|
|
—
|
|
—
|
|
||||||||||||
|
Total
|
$
|
—
|
|
$
|
(376,995
|
)
|
$
|
88,591
|
|
$
|
(465,854
|
)
|
$
|
7,115
|
|
$
|
(191,666
|
)
|
||||||
147
Purchased Credit Impaired Loans
The Company had no PCI loans at
December 31, 2018
or 2017, due mainly to the sale of seasoned SFR mortgage PCI loans during the year ended December 31, 2017. The Company had acquired loans through business combinations and purchases of loan pools for which there was evidence of deterioration of credit quality subsequent to origination and it was probable, at acquisition, that all contractually required payments would not be collected.
The following table presents a summary of accretable yield, or income expected to be collected for the periods indicated for PCI loans:
|
Year Ended December
31,
|
||||||||||||
|
($ in thousands)
|
2018
|
2017
|
2016
|
|||||||||
|
Balance at beginning of year
|
$
|
—
|
|
$
|
41,181
|
|
$
|
205,549
|
|
|||
|
New loans or leases purchased
|
—
|
|
—
|
|
23,568
|
|
||||||
|
Accretion of income
|
—
|
|
(3,833
|
)
|
(34,616
|
)
|
||||||
|
Decrease in expected cash flows
|
—
|
|
(225
|
)
|
(10,650
|
)
|
||||||
|
Disposals
|
—
|
|
(34,886
|
)
|
(142,670
|
)
|
||||||
|
Other
|
—
|
|
(2,237
|
)
|
—
|
|
||||||
|
Balance at end of year
|
$
|
—
|
|
$
|
—
|
|
$
|
41,181
|
|
|||
The following table presents PCI loans purchased for the periods indicated:
|
Year Ended December
31,
|
||||||||||||
|
($ in thousands)
|
2018
|
2017
|
2016
|
|||||||||
|
Consumer:
|
||||||||||||
|
Single family residential mortgage
|
$
|
—
|
|
$
|
—
|
|
$
|
103,799
|
|
|||
|
Outstanding unpaid principal balance at acquisition
|
$
|
—
|
|
$
|
—
|
|
$
|
103,799
|
|
|||
|
Cash flows expected to be collected at acquisition
|
$
|
—
|
|
$
|
—
|
|
$
|
114,552
|
|
|||
|
Fair value of acquired loans at acquisition
|
$
|
—
|
|
$
|
—
|
|
$
|
90,984
|
|
|||
During the three months ended June 30, 2017, the Company transferred all of its seasoned SFR mortgage loans, which had an aggregate unpaid principal balance and an aggregate carrying value of
$168.3 million
and
$147.9 million
, respectively, to loans held-for-sale in order to improve the credit quality of the loan portfolio and provide additional liquidity. The Company transferred these loans at lower of cost or fair value and recorded a fair value adjustment of
$1.8 million
against its ALLL. This
transfer included PCI loans with an aggregate unpaid principal balance and aggregate carrying value of
$147.5 million
and
$128.4 million
, respectively, and recorded a fair value adjustment of
$274 thousand
. All of these loans were sold during the
three months ended September 30, 2017. On the date of sale settlement, the aggregate unpaid principal balance and aggregate
carrying value were
$165.7 million
and
$144.2 million
, respectively, and the Company recognized a gain on sale of
$4.7 million
. The Company sold seasoned SFR mortgage loans with an aggregate unpaid principal balance and aggregate carrying value of
$766.0 million
and
$707.4 million
respectively, during the year ended December 31, 2016, and the Company recognized a gain on sale of
$24.7 million
.
148
NOTE 6 – PREMISES, EQUIPMENT, AND CAPITAL LEASES, NET
The following table summarizes premises, equipment, and capital lease, net, as of the dates indicated:
|
December 31,
|
||||||||
|
($ in thousands)
|
2018
|
2017
|
||||||
|
Land
|
$
|
9,020
|
|
$
|
10,160
|
|
||
|
Building and improvement
|
109,228
|
|
110,168
|
|
||||
|
Furniture, fixtures, and equipment
|
41,576
|
|
36,946
|
|
||||
|
Leasehold improvements
|
13,531
|
|
12,807
|
|
||||
|
Construction in process
|
1,043
|
|
175
|
|
||||
|
Total
|
174,398
|
|
170,256
|
|
||||
|
Less accumulated depreciation
|
(45,004
|
)
|
(34,557
|
)
|
||||
|
Premises, equipment and capital lease, net
|
$
|
129,394
|
|
$
|
135,699
|
|
||
On March 30, 2017, the Company completed the sale of specific assets and activities related to its Banc Home Loans division. The transaction included net book values of
$1.7 million
of furniture, fixtures, and equipment and
$748 thousand
of leasehold improvements at the transaction date.
During the years ended
December 31, 2018
,
2017
, and
2016
, the Company recorded an impairment loss of
$2.0 million
,
$2.0 million
, and
$595 thousand
respectively, on previously capitalized software projects that were abandoned in All Other Expense on the Consolidated Statements of Operations.
The Company recognized depreciation expense of
$10.9 million
,
$12.4 million
and
$11.7 million
for the years ended
December 31, 2018
,
2017
, and
2016
, respectively.
The Company leases certain equipment under capital leases. Capital lease obligations totaled
$1.1 million
and
$1.5 million
at
December 31, 2018
and
2017
, respectively. The capital lease arrangements require monthly payments through
2021
.
The Company leases certain properties under operating leases. Total rent expense for the years ended
December 31, 2018
,
2017
, and
2016
amounted to
$7.1 million
,
$11.0 million
and
$16.8 million
, respectively. Pursuant to the terms of non-cancellable lease agreements in effect at
December 31, 2018
pertaining to banking premises and equipment, future minimum rent commitments, including contractual rent escalations, under various operating leases are as follows, before considering renewal options that generally are present.
The following table presents the future commitments under operating leases and capital leases as of
December 31, 2018
:
|
($ in thousands)
|
2019
|
2020
|
2021
|
2022
|
2023
|
2024 and After
|
Total
|
|||||||||||||||||||||
|
Commitments under operating leases
|
$
|
6,472
|
|
$
|
6,087
|
|
$
|
4,466
|
|
$
|
3,087
|
|
$
|
2,258
|
|
$
|
7,767
|
|
$
|
30,137
|
|
|||||||
|
Commitments under capital lease
|
579
|
|
487
|
|
17
|
|
—
|
|
—
|
|
—
|
|
1,083
|
|
||||||||||||||
|
Total
|
$
|
7,051
|
|
$
|
6,574
|
|
$
|
4,483
|
|
$
|
3,087
|
|
$
|
2,258
|
|
$
|
7,767
|
|
$
|
31,220
|
|
|||||||
149
NOTE 7 – SERVICING RIGHTS
The Company retains MSRs from certain of its sales of residential mortgage loans. MSRs on residential mortgage loans are reported at fair value. Income earned by the Company on its MSRs is derived primarily from contractually specified mortgage servicing fees and late fees, net of curtailment costs and third party subservicing costs. The Company retains servicing rights in connection with its SBA loan operations, which are measured using the amortization method.
The following table presents a composition of total income from servicing rights, which is reported in Loan Servicing Income on the Consolidated Statements of Operations, on a consolidated operations basis, for the periods indicated:
|
Year Ended December
31,
|
||||||||||||
|
($ in thousands)
|
2018
|
2017
|
2016
|
|||||||||
|
Servicing fees for sold loans with servicing retained
|
$
|
5,048
|
|
$
|
19,642
|
|
$
|
23,117
|
|
|||
|
Losses on the fair value and runoff of servicing rights
|
(1,328
|
)
|
(17,066
|
)
|
(17,732
|
)
|
||||||
|
Total income from servicing rights
(1)
|
$
|
3,720
|
|
$
|
2,576
|
|
$
|
5,385
|
|
|||
|
(1)
|
Includes
$1.6 million
and
$4.8 million
in Income from discontinued operations for the years ended
December 31, 2017
and 2016.
|
During the three months ended March 31, 2017, the Company suspended sales of MSRs under a flow-agreement with a third
party investor that occurred contemporaneous with SFR mortgage loan sales to GSEs. The Company does not expect to resume
sales under the flow-agreement, as the Company has discontinued its mortgage banking activities.
During the first half of 2018, the Company sold
$28.5 million
of MSRs on approximately
$3.55 billion
in unpaid principal
balances of conventional agency mortgage loans for cash consideration of
$30.1 million
, subject to a prepayment protection
provision and standard representations and warranties. The sale of MSRs resulted in a net loss of
$2.3 million
for the year ended December 31, 2018, primarily related to transaction costs, provision for early repayments of loans, and expected repurchase obligations under standard representations and warranties.
The following table presents a composition of servicing rights, on a consolidated operations basis, as of the dates indicated:
|
December
31,
|
||||||||
|
($ in thousands)
|
2018
|
2017
|
||||||
|
Mortgage servicing rights, at fair value
|
$
|
1,770
|
|
$
|
31,852
|
|
||
|
SBA servicing rights, at cost
|
1,658
|
|
1,856
|
|
||||
|
Total
|
$
|
3,428
|
|
$
|
33,708
|
|
||
Mortgage loans sold with servicing retained are not reported as assets and are subserviced by a third party vendor. The unpaid principal balance of these loans at
December 31, 2018
and
2017
was
$204.0 million
and
$3.94 billion
, respectively. Custodial escrow balances maintained in connection with serviced loans were
$300 thousand
and
$17.8 million
at
December 31, 2018
and
2017
, respectively. The reductions in these balances were principally driven by the sale of
$28.5 million
of MSRs during the year ended December 31, 2018. The unpaid principal balance of the loans underlying our SBA servicing rights at
December 31, 2018
and
2017
was
$96.4 million
and
$101.0 million
, respectively.
Mortgage Servicing Rights
At
December 31, 2018
and
2017
, MSRs of
$66 thousand
and
$29.8 million
, respectively, were held for sale and valued based on a market bid adjusted for expected repurchase obligations under standard representations and warranties as a
Level 3 fair value measurement.
The value of retained MSRs is generally estimated based on a valuation from a third party provider that calculates the present
value of the expected net servicing income from the portfolio based on key factors that include interest rates, prepayment
assumptions, discount rate and estimated cash flows. The following table presents the key characteristics, inputs and economic
assumptions used to estimate the fair value of the MSRs as of the dates indicated:
|
December
31,
|
||||||||
|
($ in thousands)
|
2018
|
2017
|
||||||
|
Fair value of retained MSRs
|
$
|
1,704
|
|
$
|
2,059
|
|
||
|
Discount rate
|
13.00
|
%
|
13.00
|
%
|
||||
|
Constant prepayment rate
|
17.21
|
%
|
16.54
|
%
|
||||
|
Weighted-average life
|
4.93 years
|
|
5.07 years
|
|
||||
150
The following table presents activity in the MSRs, on a consolidated operations basis, for the periods indicated:
|
Year Ended December
31,
|
||||||||||||
|
($ in thousands)
|
2018
|
2017
|
2016
|
|||||||||
|
Balance at beginning of year
|
$
|
31,852
|
|
$
|
76,121
|
|
$
|
49,939
|
|
|||
|
Additions
|
—
|
|
12,127
|
|
49,293
|
|
||||||
|
Changes in fair value resulting from valuation inputs or assumptions
|
(1,155
|
)
|
(10,240
|
)
|
(5,709
|
)
|
||||||
|
Sales of servicing rights
(1)
|
(28,549
|
)
|
(39,345
|
)
|
(5,382
|
)
|
||||||
|
Other—loans paid off
|
(378
|
)
|
(6,811
|
)
|
(12,020
|
)
|
||||||
|
Balance at end of year
|
$
|
1,770
|
|
$
|
31,852
|
|
$
|
76,121
|
|
|||
(1) Includes
$37.8 million
of MSRs sold as a part of discontinued operations for the year ended December 31, 2017.
SBA Servicing Rights
The value of SBA servicing rights is estimated based on a present value of the expected net servicing income from the portfolio based on key factors that include interest rates, prepayment assumptions, discount rate and estimated cash flows. The following table presents the key characteristics, inputs and economic assumptions used to estimate the fair value of the SBA servicing rights as of the dates indicated:
|
December
31,
|
||||||||
|
($ in thousands)
|
2018
|
2017
|
||||||
|
Servicing rights
|
$
|
1,658
|
|
$
|
1,856
|
|
||
|
Discount rate
|
9.50
|
%
|
8.50
|
%
|
||||
|
Constant prepayment rate
|
8.00
|
%
|
8.00
|
%
|
||||
|
Weighted-average life
|
4.29 years
|
|
4.54 years
|
|
||||
The following table presents activity in the SBA servicing rights for the periods indicated:
|
Year Ended December
31,
|
||||||||||||
|
($ in thousands)
|
2018
|
2017
|
2016
|
|||||||||
|
Balance at beginning of year
|
$
|
1,856
|
|
$
|
1,496
|
|
$
|
788
|
|
|||
|
Additions
|
127
|
|
761
|
|
877
|
|
||||||
|
Amortization, including prepayments
|
(298
|
)
|
(318
|
)
|
(157
|
)
|
||||||
|
Impairment
|
(27
|
)
|
(83
|
)
|
(12
|
)
|
||||||
|
Balance at end of year
|
$
|
1,658
|
|
$
|
1,856
|
|
$
|
1,496
|
|
|||
NOTE 8 – OTHER REAL ESTATE OWNED
The following table presents the activity in other real estate owned for the periods indicated:
|
Year Ended December
31,
|
||||||||||||
|
($ in thousands)
|
2018
|
2017
|
2016
|
|||||||||
|
Balance at beginning of year
|
$
|
1,796
|
|
$
|
2,502
|
|
$
|
1,097
|
|
|||
|
Additions
|
672
|
|
3,086
|
|
3,269
|
|
||||||
|
Sales and net direct write-downs
|
(2,038
|
)
|
(3,556
|
)
|
(1,833
|
)
|
||||||
|
Net change in valuation allowance
|
242
|
|
(236
|
)
|
(31
|
)
|
||||||
|
Balance at end of year
|
$
|
672
|
|
$
|
1,796
|
|
$
|
2,502
|
|
|||
151
The following table presents the activity in the other real estate owned valuation allowance for the periods indicated:
|
Year Ended December
31,
|
||||||||||||
|
($ in thousands)
|
2018
|
2017
|
2016
|
|||||||||
|
Balance at beginning of year
|
$
|
242
|
|
$
|
6
|
|
$
|
70
|
|
|||
|
Additions
|
143
|
|
242
|
|
31
|
|
||||||
|
Recoveries
|
(90
|
)
|
—
|
|
—
|
|
||||||
|
Net direct write-downs and removals from sale
|
(295
|
)
|
(6
|
)
|
(95
|
)
|
||||||
|
Balance at end of year
|
$
|
—
|
|
$
|
242
|
|
$
|
6
|
|
|||
The following table presents expenses related to foreclosed assets included in All Other Expense on the Consolidated Statements of Operations for the periods indicated:
|
Year Ended December
31,
|
||||||||||||
|
($ in thousands)
|
2018
|
2017
|
2016
|
|||||||||
|
Net loss on sales
|
$
|
(13
|
)
|
$
|
(48
|
)
|
$
|
(96
|
)
|
|||
|
Operating expenses, net of rental income
|
(134
|
)
|
(51
|
)
|
(108
|
)
|
||||||
|
Total
|
$
|
(147
|
)
|
$
|
(99
|
)
|
$
|
(204
|
)
|
|||
The Company did not provide loans to finance the purchase of its OREO properties during the years ended
December 31, 2018
,
2017
or
2016
.
152
NOTE 9 – GOODWILL AND OTHER INTANGIBLE ASSETS, NET
At
December 31, 2018
and
2017
, the Company had goodwill of
$37.1 million
. The following table presents changes in the carrying amount of goodwill for the periods indicated:
|
Year Ended December
31,
|
||||||||||||
|
($ in thousands)
|
2018
|
2017
|
2016
|
|||||||||
|
Goodwill balance at beginning of the year
|
$
|
37,144
|
|
$
|
39,244
|
|
$
|
39,244
|
|
|||
|
Goodwill adjustments for discontinued operations
|
—
|
|
(2,100
|
)
|
—
|
|
||||||
|
Goodwill balance at end of year
|
$
|
37,144
|
|
$
|
37,144
|
|
$
|
39,244
|
|
|||
|
Accumulated impairment losses at end of year
|
$
|
2,100
|
|
$
|
2,100
|
|
$
|
—
|
|
|||
Goodwill was allocated between the Commercial Banking and Mortgage Banking segments using a relative fair value approach in connection with the Company's realignment of segment reporting at December 31, 2014. The carrying values of goodwill allocated to the reportable segments were
$37.1 million
and
$2.1 million
to the Commercial Banking segment and Mortgage Banking segment, respectively, at December 31, 2016. During the year ended December 31, 2017, the Company discontinued its mortgage banking operations following the sale of its Banc Home Loans division and wrote off goodwill of
$2.1 million
, which was previously allocated to its Mortgage Banking segment, against the gain on disposal of discontinued operations. The Company determined that its Mortgage Banking segment is no longer applicable, and Commercial Banking is now the Company's only reportable segment. See Note 2 for additional information.
The Company evaluates goodwill impairment as of August 31 each year, and more frequently if events or circumstances indicate that there may be impairment. The Company completed its annual goodwill impairment test (Step 0) as of August 31, 2018 and determined that
no
goodwill impairment existed.
Core deposit intangibles are amortized over their useful lives ranging from
four
to
ten
years. As of
December 31, 2018
, the weighted-average remaining amortization period for core deposit intangibles was approximately
5.3 years
. The following table presents a summary of other intangible assets as of the dates indicated:
|
($ in thousands)
|
Gross Carrying Value
|
Accumulated Amortization
|
Net Carrying Value
|
|||||||||
|
December 31, 2018
|
||||||||||||
|
Core deposit intangibles
|
$
|
30,904
|
|
$
|
24,558
|
|
$
|
6,346
|
|
|||
|
December 31, 2017
|
||||||||||||
|
Core deposit intangibles
|
$
|
30,904
|
|
$
|
21,551
|
|
$
|
9,353
|
|
|||
The Company recorded impairment on intangible assets of
$0
,
$336 thousand
, and
$690 thousand
for the years ended
December 31, 2018
,
2017
, and
2016
, respectively. During the year ended December 31, 2017, the Company also wrote off a customer relationship intangible of
$246 thousand
and a trade name intangible of
$90 thousand
related to RenovationReady. RenovationReady was acquired by the Company in 2014 and provided specialized loan services to financial institutions and mortgage bankers that originate agency eligible residential renovation and construction loan products. During the year ended December 31, 2016, the Company ceased to use the CS Financial trade name and wrote off the related trade name intangible of
$690 thousand
. CS Financial is a mortgage banking firm, which is the Bank's wholly owned subsidiary and which the Bank acquired in 2013. The impairment losses recognized related to intangible assets are recorded in Impairment on Intangible Assets on the Consolidated Statements of Operations.
Aggregate amortization of intangible assets was
$3.0 million
,
$3.9 million
and
$4.9 million
for the years ended
December 31, 2018
,
2017
, and
2016
, respectively. The following table presents estimated future amortization expenses as of
December 31, 2018
:
|
($ in thousands)
|
2019
|
2020
|
2021
|
2022
|
2023
|
2024 and After
|
Total
|
||||||||||||||||||||
|
Estimated future amortization expense
|
$
|
2,195
|
|
$
|
1,518
|
|
$
|
1,082
|
|
$
|
799
|
|
517
|
|
$
|
235
|
|
$
|
6,346
|
|
|||||||
153
NOTE 10 – DEPOSITS
The following table presents the components of deposits as of the dates indicated:
|
December 31,
|
||||||||
|
($ in thousands)
|
2018
|
2017
|
||||||
|
Noninterest-bearing deposits
|
$
|
1,023,360
|
|
$
|
1,071,608
|
|
||
|
Interest-bearing deposits
|
||||||||
|
Interest-bearing demand deposits
|
1,556,410
|
|
2,089,016
|
|
||||
|
Money market accounts
|
873,153
|
|
1,146,859
|
|
||||
|
Savings accounts
|
1,265,847
|
|
1,059,628
|
|
||||
|
Certificates of deposit of $250,000 or less
|
2,388,592
|
|
1,365,452
|
|
||||
|
Certificates of deposit of more than $250,000
|
809,282
|
|
560,340
|
|
||||
|
Total interest-bearing deposits
|
6,893,284
|
|
6,221,295
|
|
||||
|
Total deposits
|
$
|
7,916,644
|
|
$
|
7,292,903
|
|
||
The aggregate amount of deposits reclassified as loans, such as overdrafts, was
$477 thousand
and
$978 thousand
, respectively, at
December 31, 2018
and
2017
.
The Company had California State Treasurer’s deposits of
$300.0 million
and
$250.0 million
, and accrued interests on these deposits, in certificates of deposit of more than $250,000, respectively, at
December 31, 2018
and
2017
. The California State Treasurer’s deposits are subject to withdrawal based on the State’s periodic evaluations. At
December 31, 2018
and
2017
, the Company provided letters of credit of
$330.0 million
and
$275.0 million
, respectively, through the FHLB of San Francisco as collateral for the California State Treasurer’s deposits. In addition, the Company had other public deposits of
$18.6 million
and
$4.0 million
, respectively, at
December 31, 2018
and
2017
. Securities with carrying values of
$57.8 million
and
$32.7 million
, respectively, were pledged as collateral for these deposits, at
December 31, 2018
and
2017
.
At
December 31, 2018
and
2017
, the Company had brokered deposits of
$1.71 billion
and
$1.46 billion
, respectively. The following table presents a summary of brokered deposits:
|
December 31,
|
||||||||
|
($ in thousands)
|
2018
|
2017
|
||||||
|
Interest-bearing demand deposits
|
$
|
770
|
|
$
|
8,751
|
|
||
|
Money market accounts
|
164,505
|
|
532,047
|
|
||||
|
Certificates of deposit of $250,000 or less
|
1,543,269
|
|
915,623
|
|
||||
|
Certificates of deposit of more than $250,000
|
—
|
|
—
|
|
||||
|
Total brokered deposits
|
$
|
1,708,544
|
|
$
|
1,456,421
|
|
||
The following table presents scheduled maturities of certificates of deposit as of
December 31, 2018
:
|
($ in thousands)
|
2019
|
2020
|
2021
|
2022
|
2023 and After
|
Total
|
||||||||||||||||||
|
Certificates of deposit of $250,000 or
less
|
$
|
2,018,605
|
|
$
|
336,618
|
|
$
|
27,124
|
|
$
|
3,542
|
|
$
|
2,703
|
|
$
|
2,388,592
|
|
||||||
|
Certificates of deposit of more than $250,000
|
627,100
|
|
172,503
|
|
8,361
|
|
513
|
|
805
|
|
809,282
|
|
||||||||||||
|
Total certificates of deposit
|
$
|
2,645,705
|
|
$
|
509,121
|
|
$
|
35,485
|
|
$
|
4,055
|
|
$
|
3,508
|
|
$
|
3,197,874
|
|
||||||
154
NOTE 11 – FEDERAL HOME LOAN BANK ADVANCES AND OTHER BORROWINGS
At
December 31, 2018
,
$805.0 million
of the Bank's advances from FHLB were fixed rate and had interest rates ranging from
1.61 percent
to
3.32 percent
with a weighted-average interest rate of
2.58 percent
, and
$715.0 million
of the Bank's advances from FHLB were variable rate and had a weighted-average interest rate of
2.56 percent
. At
December 31, 2017
,
$550.0 million
of the Bank’s advances from the FHLB were fixed rate and had interest rates ranging from
1.23 percent
to
3.00 percent
with a weighted-average interest rate of
2.02 percent
, and
$1.15 billion
of the Bank’s advances from the FHLB were variable-rate and had a weighted-average interest rate of
1.40 percent
. The following table presents contractual maturities by year of the Bank's advances as of
December 31, 2018
:
|
($ in thousands)
|
2019
|
2020
|
2021
|
2022
|
2023 and After
|
Total
|
||||||||||||||||||
|
Fixed rate
|
$
|
125,000
|
|
$
|
124,000
|
|
$
|
145,000
|
|
$
|
46,000
|
|
$
|
365,000
|
|
$
|
805,000
|
|
||||||
|
Variable rate
|
715,000
|
|
—
|
|
—
|
|
—
|
|
—
|
|
715,000
|
|
||||||||||||
|
Total
|
$
|
840,000
|
|
$
|
124,000
|
|
$
|
145,000
|
|
$
|
46,000
|
|
$
|
365,000
|
|
$
|
1,520,000
|
|
||||||
Each advance is payable at its maturity date. Advances paid early are subject to a prepayment penalty. At
December 31, 2018
and
2017
, the Bank’s advances from the FHLB were collateralized by certain real estate loans with an aggregate unpaid principal balance of
$4.05 billion
and
$2.90 billion
, respectively, and securities with carrying values of
$0
and
$405.6 million
, respectively. The Bank’s investment in capital stock of the FHLB of San Francisco totaled
$41.0 million
and
$48.7 million
, respectively, at
December 31, 2018
and
2017
. Based on this collateral and the Bank’s holdings of FHLB stock, the Bank was eligible to borrow an additional
$1.35 billion
at
December 31, 2018
.
The following table presents financial data of FHLB advances as of the dates or for the periods indicated:
|
As of or For the Year Ended December
31,
|
||||||||||||
|
($ in thousands)
|
2018
|
2017
|
2016
|
|||||||||
|
Weighted-average interest rate at end of year
|
2.57
|
%
|
1.60
|
%
|
0.67
|
%
|
||||||
|
Average interest rate during the year
|
2.15
|
%
|
1.23
|
%
|
0.49
|
%
|
||||||
|
Average balance
|
$
|
1,627,608
|
|
$
|
1,054,978
|
|
$
|
1,153,208
|
|
|||
|
Maximum amount outstanding at any month-end
|
$
|
2,030,000
|
|
$
|
1,695,000
|
|
$
|
1,990,000
|
|
|||
|
Balance at end of year
|
$
|
1,520,000
|
|
$
|
1,695,000
|
|
$
|
490,000
|
|
|||
The Bank maintained a line of credit of
$60.6 million
from the Federal Reserve Discount Window, to which the Bank pledged securities with a carrying value of
$78.8 million
with
no
outstanding borrowings at
December 31, 2018
. The Bank maintained available unsecured federal funds lines with correspondent banks totaling
$210.0 million
at
December 31, 2018
.
The Bank also maintained repurchase agreements and had
no
outstanding securities sold under agreements to repurchase at
December 31, 2018
and
2017
. Availabilities and terms on repurchase agreements are subject to the counterparties' discretion and pledging additional investment securities.
On June 30, 2017, the Company voluntarily terminated a line of credit of
$75.0 million
that was maintained at Banc of California, Inc. with an unaffiliated financial institution. The line had a maturity date of July 17, 2017 and a floating interest rate equal to a LIBOR rate plus
2.25 percent
or the Prime Rate. The Company had
$50.0 million
of borrowings outstanding under the line, which were repaid in connection with the termination of the line. The proceeds of the line were used for working capital purposes.
155
NOTE 12 – LONG-TERM DEBT
The following table presents the Company's long-term debts as of the dates indicated:
|
December
31,
|
||||||||||||||||
|
2018
|
2017
|
|||||||||||||||
|
($ in thousands)
|
Par Value
|
Unamortized Debt Issuance Cost and Discount
|
Par Value
|
Unamortized Debt Issuance Cost and Discount
|
||||||||||||
|
5.25% senior notes due April 15, 2025
|
$
|
175,000
|
|
$
|
(1,826
|
)
|
$
|
175,000
|
|
$
|
(2,059
|
)
|
||||
|
Total
|
$
|
175,000
|
|
$
|
(1,826
|
)
|
$
|
175,000
|
|
$
|
(2,059
|
)
|
||||
Senior Notes
On
April 6, 2015, the Company completed the issuance and sale of
$175.0 million
aggregate principal amount of its
5.25 percent
senior notes due
April 15, 2025
(the Senior Notes). Net proceeds after discounts were approximately
$172.8 million
.
The Senior Notes are the Company’s senior unsecured debt obligations and rank equally with all of the Company’s other present and future unsecured unsubordinated obligations. The Company makes interest payments on the Senior Notes semi-annually in arrears.
The Company may, at its option, on or after
January 15, 2025
(i.e.,
90 days
prior to the maturity date of the Senior Notes), redeem the Senior Notes in whole at any time or in part from time to time, in each case on not less than
30
nor more than
60
days’ prior notice. The Senior Notes will be redeemable at a redemption price equal to
100 percent
of the principal amount of the Senior Notes to be redeemed plus accrued and unpaid interest to the date of redemption.
The Senior Notes were issued under the Senior Debt Securities Indenture, dated as of April 23, 2012 (the Base Indenture), as supplemented by the Second Supplemental Indenture dated as of April 6, 2015 (the Supplemental Indenture and together with the Base Indenture, the Indenture). The Indenture contains several covenants which, among other things, restrict the Company’s ability and the ability of the Company’s subsidiaries to dispose of or incur liens on the voting stock of certain subsidiaries and also contains customary events of default. The Company was in compliance with all covenants under the Indenture at December 31, 2018.
On April 15, 2016, the Company completed the redemption of all of its outstanding
7.5 percent
senior notes due April 15, 2020 at a redemption price of
100 percent
of the principal amount plus accrued and unpaid interest to the redemption date. In connection with this transaction, the Company recognized a debt redemption cost of
$2.7 million
in All Other Expense on the Consolidated Statements of Operations for the year ended December 31, 2016.
Tangible Equity Units - Junior Subordinated Amortizing Notes
On May 21, 2014, the Company issued and sold
$69.0 million
of
8.00 percent
tangible equity units (TEUs) in an underwritten public offering. A total of
1,380,000
TEUs were issued, including
180,000
TEUs issued to the underwriter upon exercise of its overallotment option, with each TEU having a stated amount of
$50.00
. Each TEU was comprised of (i) a prepaid stock purchase contract (each a Purchase Contract) settled by delivery of a specified number of shares of Company Common Stock and (ii) a junior subordinated amortizing note due
May 15, 2017
(each an Amortizing Note) that had an initial principal amount of
$10.604556
per Amortizing Note, bore interest at a rate of
7.50 percent
per annum and had a final installment payment date of May 15, 2017.
The Purchase Contracts and Amortizing Notes were accounted for separately. The Purchase Contract component of the TEUs was recorded in Additional Paid in Capital on the Consolidated Statements of Financial Condition. The Amortizing Note component was recorded in Long-Term Debt on the Consolidated Statements of Financial Condition. The relative fair values of the Amortizing Notes and Purchase Contracts were estimated to be approximately
$14.6 million
and
$54.4 million
, respectively, at the date of issuance. Total issuance costs associated with the TEUs were
$4.0 million
(including the underwriter discount of
$3.3 million
), of which
$857 thousand
was allocated to the debt component and
$3.2 million
was allocated to the equity component of the TEUs. The portion of the issuance costs allocated to the debt component of the TEUs was amortized over the term of the Amortizing Notes.
On each August 15, November 15, February 15 and May 15, commencing on August 15, 2014, the Company paid holders of Amortizing Notes equal quarterly cash installments of
$1.00
per Amortizing Note (or, in the case of the installment payment due on August 15, 2014,
$0.933333
per Amortizing Note) (such installments, the installment payments), which installment payments in the aggregate were equivalent to a
8.00 percent
cash distribution per year with respect to each
$50.00
stated amount of TEUs. Each installment payment constituted a payment of interest (at a rate of
7.50 percent
per annum) and a partial repayment of principal on each Amortizing Note.
156
On May 15, 2017, the Company made the final installment payment on the Amortizing Notes and all Purchase Contracts that had not previously been settled were settled. See Note 18 for additional information.
157
NOTE 13 – INCOME TAXES
The following table presents the components of income tax expense (benefit) of continuing operations for the periods indicated:
|
Year Ended December
31,
|
||||||||||||
|
($ in thousands)
|
2018
|
2017
|
2016
|
|||||||||
|
Current income taxes:
|
||||||||||||
|
Federal
|
$
|
5,720
|
|
$
|
(2,215
|
)
|
$
|
(3,044
|
)
|
|||
|
State
|
5,035
|
|
6,006
|
|
11,180
|
|
||||||
|
Total current income tax expense
|
10,755
|
|
3,791
|
|
8,136
|
|
||||||
|
Deferred income taxes:
|
||||||||||||
|
Federal
|
(4,418
|
)
|
(25,938
|
)
|
6,699
|
|
||||||
|
State
|
(1,493
|
)
|
(4,434
|
)
|
(1,086
|
)
|
||||||
|
Total deferred income tax expense
|
(5,911
|
)
|
(30,372
|
)
|
5,613
|
|
||||||
|
Income tax expense (benefit)
|
$
|
4,844
|
|
$
|
(26,581
|
)
|
$
|
13,749
|
|
|||
The following table presents a reconciliation of the recorded income tax expense (benefit) of continuing operations to the amount of taxes computed by applying the applicable statutory Federal income tax rate of
21.0 percent
to income from continuing operations before income taxes for the year ended
December 31, 2018
, and
35.0 percent
for the years ended
December 31, 2017
and
2016
:
|
Year Ended December
31,
|
|||||||||
|
2018
|
2017
|
2016
|
|||||||
|
Computed expected income tax expense (benefit) at Federal statutory rate
|
21.0
|
%
|
35.0
|
%
|
35.0
|
%
|
|||
|
Increase (decrease) resulting from:
|
|||||||||
|
Proportional amortization
|
4.3
|
%
|
5.1
|
%
|
0.4
|
%
|
|||
|
Other permanent book-tax differences
|
0.4
|
%
|
(2.1
|
)%
|
0.2
|
%
|
|||
|
State tax expense, net of federal benefit
|
5.9
|
%
|
3.7
|
%
|
6.4
|
%
|
|||
|
Income tax credits
|
(25.4
|
)%
|
(149.5
|
)%
|
(33.9
|
)%
|
|||
|
Basis reduction in investment in alternative energy partnership
|
2.2
|
%
|
24.9
|
%
|
5.8
|
%
|
|||
|
Write-off of Goodwill for discontinued operations
|
—
|
%
|
2.7
|
%
|
—
|
%
|
|||
|
Bank owned life insurance policies
|
(1.0
|
)%
|
(3.0
|
)%
|
(0.8
|
)%
|
|||
|
Equity compensation windfall tax benefits
|
(0.5
|
)%
|
(7.0
|
)%
|
—
|
%
|
|||
|
Remeasurement from the Tax Cuts and Jobs Act
|
—
|
%
|
(7.8
|
)%
|
—
|
%
|
|||
|
Reserve for uncertain tax positions
|
0.1
|
%
|
1.9
|
%
|
—
|
%
|
|||
|
Other, net
|
3.3
|
%
|
(2.7
|
)%
|
0.6
|
%
|
|||
|
Effective tax rates
|
10.3
|
%
|
(98.8
|
)%
|
13.7
|
%
|
|||
The Company’s effective tax rate of continuing operations for the year ended
December 31, 2018
was higher than the effective tax rate of continuing operations for the year ended
December 31, 2017
mainly due to the reduction in the recognition of tax credits on investments in alternative energy partnerships of
$9.6 million
, partially offset by tax expense from tax basis reduction of
$1.0 million
related to investments in alternative energy partnerships for the year ended
December 31, 2018
, compared to
$38.2 million
of tax credits recognized, partially offset by tax expense from tax basis reduction of
$6.7 million
for the year ended
December 31, 2017
. The reduction in tax credits received by the Bank on the investments in alternative energy partnerships is due to less new equipment being placed into service by the investments. The higher effective tax rate was also partially offset by the decrease in the federal statutory tax rate from
35%
to
21%
as a result of the Tax Cuts and Jobs Act, which became effective on January 1, 2018. The Company’s effective tax rate of continuing operations for the year ended
December 31, 2017
was lower than the effective tax rate of continuing operations for the year ended
December 31, 2016
mainly due to the increase in the recognition of tax credits on investments in alternative energy partnerships of
$38.2 million
, partially offset by tax expense from tax basis reduction of
$6.7 million
related to investments in alternative energy partnerships for the year ended
December 31, 2017
, compared to
$33.4 million
of tax credits recognized, partially offset by tax expense from tax basis reduction of
$5.8 million
for the year ended
December 31, 2016
. The lower pre-tax book income of
$34.1 million
for the year ended
December 31, 2017
compared to
$149.4 million
for
2016
also enlarged the impact of the tax credits to the effective tax rate. The Company uses the flow-through income statement method to account for the tax credits earned on investments in alternative energy partnerships. Under this method, the tax credits are recognized as a reduction to income tax expense and the initial book-tax difference in the basis of the investments are recognized as additional tax expense in the year they are earned.
158
On
December 22, 2017
, the Tax Cuts and Jobs Act (the “Tax Act”) was enacted into law in the United States. The legislation provides for significant changes to the IRC that impact corporate taxation requirements, such as the reduction of the federal income tax rate for corporations from
35 percent
to
21 percent
and changes or limitations to certain tax deductions. As of
December 31, 2017, the Company remeasured its deferred tax assets and liabilities based on the reduced federal corporate
income tax rate of
21 percent
which resulted in an income tax benefit of
$2.1 million
to continuing operations. At December 31,
2017, the Company was able to make reasonable estimates of the tax effects on enactment of the Tax Cuts and Jobs Act and
completed its analysis for the tax effects of enactment of the Tax Act on all items.
At
December 31, 2018
, the Company had
$2.2 million
of available unused federal net operating loss (NOL) carryforwards that may be applied against future taxable income through
2031
. The Company had available at
December 31, 2018
,
$9.1 million
of unused state NOL carryforwards that may be applied against future taxable income through
2031
. Utilization of these NOL carryforwards are subject to annual limitations set forth in Section 382 of the U.S. Internal Revenue Code (IRC). The tax attributes acquired in Gateway Bancorp acquisitions are subject to an annual IRC Section 382 limitation of
$474 thousand
.
In addition, as of
December 31, 2018
and 2017, the Company had income tax credit carryforwards of $
26.9 million
and $
27.4 million
, respectively. The tax credits, if unused, will expire on December 31, 2037.
The following table presents the tax effects of temporary differences that give rise to significant portions of deferred tax assets and deferred tax liabilities as of the dates indicated:
|
December
31,
|
||||||||
|
($ in thousands)
|
2018
|
2017
|
||||||
|
Deferred tax assets:
|
||||||||
|
Allowance for loan and lease losses
|
$
|
18,813
|
|
$
|
15,178
|
|
||
|
Stock-based compensation expense
|
2,249
|
|
2,899
|
|
||||
|
Accrued expenses
|
2,678
|
|
1,465
|
|
||||
|
Reserve for loss on repurchased loans
|
736
|
|
2,031
|
|
||||
|
Federal net operating losses
|
471
|
|
571
|
|
||||
|
State net operating losses
|
759
|
|
871
|
|
||||
|
Federal income tax credits
|
27,087
|
|
27,550
|
|
||||
|
Unrealized loss on securities available-for-sale
|
10,046
|
|
—
|
|
||||
|
Deferred loan fees
|
2,446
|
|
—
|
|
||||
|
Amortization of intangible assets
|
1,101
|
|
732
|
|
||||
|
Prior year state tax deduction
|
1,272
|
|
1,527
|
|
||||
|
Other deferred tax assets
|
3,456
|
|
3,468
|
|
||||
|
Total deferred tax assets
|
71,114
|
|
56,292
|
|
||||
|
Deferred tax liabilities:
|
||||||||
|
Investments in partnerships
|
(5,317
|
)
|
(237
|
)
|
||||
|
Mortgage servicing rights
|
(520
|
)
|
(9,337
|
)
|
||||
|
Deferred loan fees and costs
|
(8,528
|
)
|
(7,005
|
)
|
||||
|
Depreciation on premises and equipment
|
(4,710
|
)
|
(3,797
|
)
|
||||
|
Unrealized gain on securities available-for-sale
|
—
|
|
(2,368
|
)
|
||||
|
Other deferred tax liabilities
|
(2,635
|
)
|
(2,474
|
)
|
||||
|
Total deferred tax liabilities
|
(21,710
|
)
|
(25,218
|
)
|
||||
|
Valuation allowance
|
—
|
|
—
|
|
||||
|
Net deferred tax assets
|
$
|
49,404
|
|
$
|
31,074
|
|
||
Deferred tax assets are reduced by a valuation allowance when, in the opinion of management, it is more-likely-than-not that some portion, or all, of the deferred tax asset will not be realized. In assessing the realization of deferred tax assets, management will continue to evaluate both positive and negative evidence on a quarterly basis, including the reversal of its taxable temporary differences, the existence of its historical earnings, the amounts of future projected earnings as well as the tax expiration periods of its income tax credits. Based on this analysis, management determined that it was more likely than not that all of the deferred tax assets would be realized. Therefore, the Company recorded
no
valuation allowance against net deferred tax assets at
December 31, 2018
and
2017
, respectively. Based on this analysis, management determined that it was more likely than not the Company believes it will generate sufficient future taxable income to realize net deferred tax assets.
159
During the year ended
December 31, 2018
, estimated taxable income before utilization of NOLs of
$64.5 million
allowed the Company to utilize
$474 thousand
and
$1.4 million
, respectively, of federal and state NOLs (representing approximately
16.8 percent
of the total NOLs included in the Company’s deferred tax assets),
$9.6 million
of alternative energy investment tax credits,
$400 thousand
of Federal research credits, and
$500 thousand
of state research tax credits. The Company believes that the utilization of a significant portion of tax credits in 2018, along with the Company’s projection of future taxable income should be considered significant positive evidence that the deferred tax assets for income tax credits will be realized in future periods prior to their expiration dates.
ASC 740-10-25 relates to the accounting for uncertainty in income taxes recognized in an enterprise’s financial statements. ASC 740-10-25 prescribes a threshold and a measurement process for recognizing in the financial statements a tax position taken or expected to be taken in a tax return and also provides guidance on de-recognition, classification, interest and penalties, accounting in interim periods, disclosure and transition. The Company had unrecognized tax benefits of
$1.2 million
and
$1.0 million
, respectively, at
December 31, 2018
and
2017
. The Company does not believe that the unrecognized tax benefits will change within the next twelve months. As of
December 31, 2018
, the total unrecognized tax benefit that, if recognized, would impact the effective tax rate was
$1.0 million
.
At
December 31, 2018
and
2017
, the Company had
no
accrued interest or penalties, respectively. The table below summarizes the activity related to the Company's unrecognized tax benefits for the periods indicated:
|
Year Ended December
31,
|
||||||||||||
|
($ in thousands)
|
2018
|
2017
|
2016
|
|||||||||
|
Beginning balance
|
$
|
1,047
|
|
$
|
—
|
|
$
|
—
|
|
|||
|
Increase related to prior year tax positions
|
—
|
|
867
|
|
—
|
|
||||||
|
Increase in current year tax positions
|
180
|
|
180
|
|
—
|
|
||||||
|
Ending balance
|
$
|
1,227
|
|
$
|
1,047
|
|
$
|
—
|
|
|||
In the event the Company is assessed interest and/or penalties by federal or state tax authorities, such amounts will be classified on the consolidated financial statements as income tax expense.
The Company and its subsidiaries are subject to U.S. federal income tax as well as income tax in multiple state jurisdictions. The Company is no longer subject to examination by U.S. federal taxing authorities for years before 2015. The statute of limitations for the assessment of California franchise taxes has expired for tax years before 2014 (other state income and franchise tax statutes of limitations vary by state).
The Company accounts for qualified affordable housing investments under the proportional amortization method. The gross investments in these limited partnerships amounted to
$29.3 million
and the unfunded portion was
$11.5 million
at
December 31, 2018
. The balances of these investments were
$20.0 million
and
$22.0 million
as of
December 31, 2018
and
2017
, respectively. The Company utilized
$1.9 million
of tax deductions from these investments in
2018
, but the
$1.8 million
of low income housing tax credits generated in
2018
were limited and not utilized in
2018
. Thus, there were
$2.7 million
and
$849 thousand
of unused tax credit carryforwards as of
December 31, 2018
and
2017
, respectively. Investment book proportional amortization amounted to
$2.0 million
,
$1.4 million
and
$394 thousand
for the years ended
December 31, 2018
,
2017
and
2016
, respectively.
The Company early adopted ASU 2018-02 effective January 1, 2018. ASU 2018-02 permits companies to reclassify stranded
tax effects due to the Tax Cuts and Jobs Act from accumulated other comprehensive income to retained earnings. As a result of
the adoption, the Company recorded an increase in accumulated other comprehensive income of
$496 thousand
and reduced
retained earnings by
$496 thousand
to eliminate the stranded tax effects at that date from the reduction in the federal statutory
tax rate that was enacted in December 2017 and became effective January 1, 2018.
160
NOTE 14 – RESERVE FOR LOSS ON REPURCHASED LOANS
The Company records a representation and warranty reserve representing its estimate of losses expected on mortgage loan repurchases or loss reimbursements attributable to underwriting or documentation defects on previously sold loans. The reserve for loss on repurchased loans is initially recorded at fair value against net revenue on mortgage banking activities at the time of sale, and any subsequent change in the reserve is recorded on the Consolidated Statements of Operations as an increase or decrease to the provision for loan repurchases (noninterest expense). The following table presents a summary of activity in the reserve for losses on repurchased loans for the periods indicated:
|
Year Ended December
31,
|
||||||||||||
|
($ in thousands)
|
2018
|
2017
|
2016
|
|||||||||
|
Balance at beginning of year
|
$
|
6,306
|
|
$
|
7,974
|
|
$
|
9,700
|
|
|||
|
Initial provision for loan repurchases
|
126
|
|
1,622
|
|
3,942
|
|
||||||
|
Subsequent change in the reserve
|
(2,488
|
)
|
(1,812
|
)
|
(3,352
|
)
|
||||||
|
Utilization of reserve for loan repurchases
|
(1,438
|
)
|
(2,238
|
)
|
(2,316
|
)
|
||||||
|
Other adjustments
|
—
|
|
760
|
|
—
|
|
||||||
|
Balance at end of year
|
$
|
2,506
|
|
$
|
6,306
|
|
$
|
7,974
|
|
|||
During the year ended
December 31, 2018
, reserve for loss on repurchased loans decreased by
$3.8 million
. During the year ended
December 31, 2018
, approximately
$1.5 million
of the decrease was due to portfolio run-off and repurchase settlement activities.
The Company believes that its obligations for mortgage loan repurchases or loss reimbursements were adequately reserved for
at
December 31, 2018
.
NOTE 15 – DERIVATIVE INSTRUMENTS
The Company uses derivative instruments and other risk management techniques to reduce its exposure to adverse fluctuations in interest rates and foreign currency exchange rates in accordance with its risk management policies.
Derivative Instruments Related to Mortgage Banking Activities:
In connection with mortgage banking activities, if interest rates increase, the value of the Company’s loan commitments to borrowers and mortgage loans held-for-sale are adversely impacted. The Company attempts to economically hedge the risk of the overall change in the fair value of loan commitments to borrowers and mortgage loans held-for-sale with forward loan sale contracts and TBA mortgage-backed securities trades. Forward contracts on loan sale commitments, TBA mortgage-based securities trades, and loan commitments to borrowers are non-designated derivative instruments and the gains and losses resulting from these derivative instruments are included in Net Revenue on Mortgage Banking Activities in the Statement of Operations of discontinued operations. The fair value of resulting derivative assets and liabilities are included in Other Assets and Accrued Expenses and Other Liabilities, respectively, in the Statement of Financial Condition of discontinued operations.
The net gains (losses) relating to these derivative instruments used for mortgage banking activities, which were included in Net Revenue on Mortgage Banking Activities in the Statement of Operations of discontinued operations, were
$0
,
$(12.4) million
and
$2.2 million
for the years ended
December 31, 2018
,
2017
and
2016
, respectively. At
December 31, 2018
, the Company had
no
outstanding derivative instruments related to mortgage banking activities.
Interest Rate Swaps and Caps on Loans:
The Company offers interest rate swap and cap products to certain loan customers to allow them to hedge the risk of rising interest rates on their variable rate loans. When such products are issued, the Company also enters into an offsetting swap with institutional counterparties to eliminate the interest rate risk. These back-to-back agreements are intended to offset each other and allow the Company to retain the credit risk of the transaction with its customer in exchange for a fee. The net cash flow for the Company is equal to the interest income received from a variable rate loan originated with the customer plus the fee. These swaps and caps are not designated as hedging instruments and are recorded at fair value in Other Assets and Accrued Expenses and Other Liabilities on the Consolidated Statement of Financial Condition. The changes in fair value are recorded in Other Income on the Consolidated Statements of Operations. During the years ended
December 31, 2018
,
2017
and
2016
, changes in fair value recorded through Other Income on the Consolidated Statements of Operations were insignificant.
161
Foreign Exchange Contracts:
The Company offers short-term foreign exchange contracts to its customers to purchase and/or sell foreign currencies at set rates in the future. These products allow customers to hedge the foreign exchange rate risk of their deposits and loans denominated in foreign currencies. In conjunction with these products the Company also enters into offsetting contracts with institutional counterparties to hedge the Company’s foreign exchange rate risk. These back-to-back contracts allow the Company to offer its customers foreign exchange products while minimizing its exposure to foreign exchange rate fluctuations. These foreign exchange contracts are not designated as hedging instruments and are recorded at fair value in Other Assets and Accrued Expenses and Other Liabilities on the Consolidated Statement of Financial Condition. At
December 31, 2018
and 2017, the Company had
no
outstanding foreign exchange contracts.
The following table presents the notional amount and fair value of derivative instruments included in other assets and other liabilities on the Consolidated Statements of Financial Condition as of the dates indicated. Note 3 contains further disclosures pertaining to the fair value of mortgage banking derivatives.
|
December
31,
|
||||||||||||||||
|
2018
|
2017
|
|||||||||||||||
|
($ in thousands)
|
Notional Amount
|
Fair Value
|
Notional Amount
|
Fair Value
|
||||||||||||
|
Included in assets:
|
||||||||||||||||
|
Interest rate swaps and cap on loans
|
$
|
103,812
|
|
$
|
1,534
|
|
$
|
70,486
|
|
$
|
1,005
|
|
||||
|
Total included in assets
|
$
|
103,812
|
|
$
|
1,534
|
|
$
|
70,486
|
|
$
|
1,005
|
|
||||
|
Included in liabilities:
|
||||||||||||||||
|
Interest rate swaps and caps on loans
|
$
|
103,812
|
|
$
|
1,600
|
|
$
|
70,486
|
|
$
|
1,033
|
|
||||
|
Total included in liabilities
|
$
|
103,812
|
|
$
|
1,600
|
|
$
|
70,486
|
|
$
|
1,033
|
|
||||
The Company has entered into agreements with counterparty financial institutions, which include master netting agreements that provide for the net settlement of all contracts with a single counterparty in the event of default. However, the Company elected to account for all derivatives with counterparty institutions on a gross basis. Due to clearinghouse rule changes, beginning January 1, 2017, variation margin payments are treated as settlements of derivative exposure rather than as collateral.
162
NOTE 16 – EMPLOYEE STOCK COMPENSATION
On May 31, 2018 (the Effective Date), the Company's stockholders approved the Company's 2018 Omnibus Stock Incentive
Plan (2018 Omnibus Plan). As of the Effective Date, the Company discontinued granting awards under the Company’s 2013
Omnibus Incentive Plan (2013 Omnibus Plan) or any prior equity incentive plans and future stock-based compensation awards
to its directors and employees will be made pursuant to the 2018 Omnibus Plan. The 2018 Omnibus Plan provides that the
maximum number of shares that will be available for awards is
4,417,882
, which represents the number of shares that were
available for new awards under the 2013 Omnibus Plan immediately prior to the Effective Date. As of
December 31, 2018
,
4,346,189
shares were available for future awards.
On December 28, 2017, the Company initiated the termination of the Banc of California Capital and Liquidity Enhancement
Employee Compensation Trust, a Maryland statutory trust (the SECT), which was established to fund employee stock
compensation and benefit obligations of the Company. The termination of the SECT was completed during the quarter ended
September 30, 2018. See Note 17 for additional information.
Stock-based Compensation Expense
The following table presents stock-based compensation expense and the related tax benefits for the periods indicated:
|
Year Ended December 31,
|
||||||||||||
|
($ in thousands)
|
2018
|
2017
|
2016
|
|||||||||
|
Stock options
|
$
|
174
|
|
$
|
360
|
|
$
|
531
|
|
|||
|
Restricted stock awards and units
|
6,391
|
|
11,732
|
|
11,398
|
|
||||||
|
Stock appreciation rights
|
—
|
|
42
|
|
18
|
|
||||||
|
Total stock-based compensation expense
|
$
|
6,565
|
|
$
|
12,134
|
|
$
|
11,947
|
|
|||
|
Related tax benefits
|
$
|
1,929
|
|
$
|
5,078
|
|
$
|
4,963
|
|
|||
The following table presents unrecognized stock-based compensation expense as of
December 31, 2018
:
|
($ in thousands)
|
Unrecognized Expense
|
Weighted-Average Remaining Expected Recognition Period
|
||||
|
Stock option awards
|
$
|
148
|
|
1.4 years
|
||
|
Restricted stock awards and restricted stock units
|
9,037
|
|
2.2 years
|
|||
|
Total
|
$
|
9,185
|
|
2.2 years
|
||
Stock Options
The Company has issued stock options to certain employees, officers and directors. Stock options are issued at the closing market price immediately before the grant date, and generally have a
three
to
five
year vesting period and contractual terms of
seven
to
ten
years. The Company recognizes an income tax deduction upon exercise of a stock option to the extent taxable income is recognized by the option holder. In the case of a non-qualified stock option, the option holder recognizes taxable income based on the fair market value of the shares acquired at the time of exercise less the exercise price.
The weighted-average estimated fair value per share options granted was estimated on the date of grant using the Black-Scholes option-pricing model with the following weighted-average assumptions.
|
Year Ended December 31,
|
||||||||||||
|
($ in thousands, except per share data)
|
2018
|
2017
|
2016
|
|||||||||
|
Granted date fair value of options granted
|
$
|
—
|
|
$
|
—
|
|
$
|
1,630
|
|
|||
|
Fair value of options vested
|
$
|
160
|
|
$
|
611
|
|
$
|
497
|
|
|||
|
Total intrinsic value of options exercised
|
$
|
96
|
|
$
|
3,747
|
|
$
|
722
|
|
|||
|
Cash received from options exercised
|
$
|
—
|
|
$
|
2,043
|
|
$
|
—
|
|
|||
|
Weighted-average estimated fair value per share of options granted
|
$
|
—
|
|
$
|
—
|
|
$
|
5.09
|
|
|||
Expected volatility was determined based on the historical monthly volatility of our stock price over a period equal to the expected term of the options granted. The expected term of the options represents the period that options granted are expected to be outstanding based primarily on the historical exercise behavior associated with previous options grants. The risk-free
163
interest rate was based on the U.S. Treasury yield curve at the time of grant for a period equal to the expected term of the options granted.
The following table presents a summary of weighted-average assumptions used for calculating fair value options for the periods indicated:
|
Year Ended December 31,
|
|||||||||
|
2018
|
2017
|
2016
|
|||||||
|
Dividend yield
|
—
|
%
|
—
|
%
|
3.57
|
%
|
|||
|
Expected volatility
|
—
|
%
|
—
|
%
|
43.30
|
%
|
|||
|
Expected term
|
0.0 years
|
|
0.0 years
|
|
6.5 years
|
|
|||
|
Risk-free interest rate
|
—
|
%
|
—
|
%
|
1.61
|
%
|
|||
The following table represents stock option activity and weighted-average exercise price per share for the periods indicated:
|
Year Ended December
31,
|
||||||||||||||||||||
|
2018
|
2017
|
2016
|
||||||||||||||||||
|
Number of Shares
|
Weighted-Average Exercise Price per Share
|
Number of Shares
|
Weighted-Average Exercise Price per Share
|
Number of Shares
|
Weighted-Average Exercise Price per Share
|
|||||||||||||||
|
Outstanding at beginning of year
|
210,973
|
|
$
|
13.99
|
|
968,591
|
|
$
|
13.95
|
|
960,879
|
|
$
|
12.86
|
|
|||||
|
Granted
|
—
|
|
$
|
—
|
|
—
|
|
$
|
—
|
|
320,000
|
|
$
|
16.78
|
|
|||||
|
Cash settled
|
—
|
|
$
|
—
|
|
—
|
|
$
|
—
|
|
55,826
|
|
$
|
14.33
|
|
|||||
|
Exercised
|
(24,000
|
)
|
$
|
17.50
|
|
(488,281
|
)
|
$
|
12.53
|
|
(51,666
|
)
|
$
|
11.48
|
|
|||||
|
Forfeited
|
—
|
|
$
|
—
|
|
(269,337
|
)
|
$
|
16.49
|
|
(202,743
|
)
|
$
|
13.84
|
|
|||||
|
Expired
|
—
|
|
$
|
—
|
|
—
|
|
$
|
—
|
|
(2,053
|
)
|
$
|
13.88
|
|
|||||
|
Outstanding at end of year
|
186,973
|
|
$
|
13.54
|
|
210,973
|
|
$
|
13.99
|
|
968,591
|
|
$
|
13.95
|
|
|||||
|
Exercisable at end of year
|
123,125
|
|
$
|
13.67
|
|
105,541
|
|
$
|
14.68
|
|
449,655
|
|
$
|
12.68
|
|
|||||
The following table represents changes in unvested stock options and related information as of and for the periods indicated:
|
Year Ended December
31,
|
||||||||||||||||||||
|
2018
|
2017
|
2016
|
||||||||||||||||||
|
Number of Shares
|
Weighted-Average Exercise Price per Share
|
Number of Shares
|
Weighted-Average Exercise Price per Share
|
Number of Shares
|
Weighted-Average Exercise Price per Share
|
|||||||||||||||
|
Outstanding at beginning of year
|
105,432
|
|
$
|
13.31
|
|
518,936
|
|
$
|
15.04
|
|
566,266
|
|
$
|
12.99
|
|
|||||
|
Granted
|
—
|
|
$
|
—
|
|
—
|
|
$
|
—
|
|
320,000
|
|
$
|
16.77
|
|
|||||
|
Vested
|
(41,584
|
)
|
$
|
13.32
|
|
(174,833
|
)
|
$
|
14.10
|
|
(170,837
|
)
|
$
|
12.81
|
|
|||||
|
Forfeited
|
—
|
|
$
|
—
|
|
(238,671
|
)
|
$
|
16.50
|
|
(196,493
|
)
|
$
|
13.86
|
|
|||||
|
Outstanding at end of year
|
63,848
|
|
$
|
13.30
|
|
105,432
|
|
$
|
13.31
|
|
518,936
|
|
$
|
15.04
|
|
|||||
164
The following table presents a summary of stock options outstanding as of
December 31, 2018
:
|
Options Outstanding
|
Options Exercisable
|
||||||||||||||||||||||||
|
Number of Shares
|
Intrinsic Value
|
Weighted-Average Exercise Price per Share
|
Weighted-Average Remaining Contractual Life
|
Number of Shares
|
Intrinsic Value
|
Weighted-Average Exercise Price per Share
|
Weighted-Average Remaining Contractual Life
|
||||||||||||||||||
|
$10.90 to $11.88
|
7,344
|
|
$
|
17,699
|
|
$
|
10.90
|
|
5.5 years
|
6,240
|
|
$
|
15,038
|
|
$
|
10.90
|
|
5.5 years
|
|||||||
|
$11.88 to $12.86
|
—
|
|
—
|
|
$
|
—
|
|
0.0 years
|
—
|
|
—
|
|
$
|
—
|
|
0.0 years
|
|||||||||
|
$12.86 to $13.84
|
163,464
|
|
2,320
|
|
$
|
13.44
|
|
6.1 years
|
100,720
|
|
1,200
|
|
$
|
13.50
|
|
6.0 years
|
|||||||||
|
$13.84 to $14.82
|
—
|
|
—
|
|
$
|
—
|
|
0.0 years
|
—
|
|
—
|
|
$
|
—
|
|
0.0 years
|
|||||||||
|
$14.82 to $15.82
|
16,165
|
|
—
|
|
$
|
15.81
|
|
2.5 years
|
16,165
|
|
—
|
|
$
|
15.81
|
|
2.5 years
|
|||||||||
|
Total
|
186,973
|
|
$
|
20,019
|
|
$
|
13.54
|
|
5.8 years
|
123,125
|
|
$
|
16,238
|
|
$
|
13.67
|
|
5.5 years
|
|||||||
165
Restricted Stock Awards and Restricted Stock Units
The Company also has granted restricted stock awards and restricted stock units to certain employees, officers and directors. The restricted stock awards and units are valued at the closing price of the Company’s stock on the measurement date. The restricted stock awards and units fully vest after a specified period (generally ranging from
one
to
five years
) of continued service from the date of grant plus, in some cases, the satisfaction of performance conditions. These performance targets include conditions relating to the Company’s profitability and regulatory standing. The actual amounts of stock released upon vesting will be determined by the Compensation Committee of the Company's Board of Directors upon the Committee's certification of the satisfaction of the target level of performance. The Company recognizes an income tax deduction in an amount equal to the taxable income reported by the holders of the restricted stock, generally upon vesting or, in the case of restricted stock units, when settled. The following table presents unvested restricted stock awards and restricted stock units activity as of and for the periods indicated:
|
Year Ended December
31,
|
||||||||||||||||||||
|
2018
|
2017
|
2016
|
||||||||||||||||||
|
Number of Shares
|
Weighted-Average Price per Share
|
Number of Shares
|
Weighted-Average Price per Share
|
Number of Shares
|
Weighted-Average Price per Share
|
|||||||||||||||
|
Outstanding at beginning of year
|
911,633
|
|
$
|
18.73
|
|
1,417,144
|
|
$
|
16.16
|
|
1,516,361
|
|
$
|
12.40
|
|
|||||
|
Granted
(1)
|
650,676
|
|
$
|
18.89
|
|
859,722
|
|
$
|
20.81
|
|
1,711,968
|
|
$
|
17.99
|
|
|||||
|
Vested
(2)
|
(415,994
|
)
|
$
|
18.65
|
|
(854,031
|
)
|
$
|
15.95
|
|
(758,999
|
)
|
$
|
13.12
|
|
|||||
|
Forfeited
(3)
|
(312,714
|
)
|
$
|
18.54
|
|
(511,202
|
)
|
$
|
17.80
|
|
(1,052,186
|
)
|
$
|
13.92
|
|
|||||
|
Outstanding at end of year
|
833,601
|
|
$
|
18.96
|
|
911,633
|
|
$
|
18.73
|
|
1,417,144
|
|
$
|
16.16
|
|
|||||
|
(1)
|
The number of granted shares includes aggregate performance-based shares/units of
306,801
,
152,709
and
602,671
, respectively, for the years ended
December 31, 2018
,
2017
and
2016
.
|
|
(2)
|
The number of vested shares includes aggregate performance-based shares/units of
44,817
,
10,000
and
0
, respectively, for the years ended
December 31, 2018
,
2017
and
2016
|
|
(3)
|
The number of forfeited shares includes aggregate performance-based shares/units of
86,936
,
107,545
and
615,223
, respectively, for the years ended
December 31, 2018
,
2017
and
2016
.
|
Stock Appreciation Rights
On August 21, 2012, the Company granted to Steven A. Sugarman, its then- (now former) chief executive officer a
ten
-year stock appreciation right (SAR) for
500,000
shares (Initial SAR) of the Company’s common stock with a base price of
$12.12
per share with
one-third
of the Initial SAR vesting on the grant date and the remaining amount vesting over a period of
2 years
. The Initial SAR entitles Mr. Sugarman to dividend equivalent rights and originally contained an anti-dilution provision pursuant to which additional SARs (Additional SARs) were issued to Mr. Sugarman upon certain stock issuances by the Company, as described below. On March 24, 2016, concurrent with entering into a new employment agreement with the Company, Mr. Sugarman entered into a letter agreement that eliminated this anti-dilution provision of the Initial SAR. Under the terms of the March 24, 2016 letter agreement, in consideration of the removal of the anti-dilution provision of the Initial SAR, the Company granted Mr. Sugarman a onetime performance based restricted stock award with an aggregate grant date fair market value of
$5.0 million
, which would vest in full on March 24, 2017, but was also subject to restrictions on sale or transfer through March 24, 2021. In connection with Mr. Sugarman’s resignation as the Company’s chief executive officer on January 23, 2017, all unvested equity awards (including any unvested SARs) immediately vested and became free of all restrictions. In addition, the SARs continued (and continue) to remain exercisable for their full terms, with dividend equivalent rights of the SARs also continuing in effect during their full terms.
As described more fully in the SAR agreement, the original anti-dilution provision of the Initial SAR did not apply to certain issuances of the Company’s common stock for compensatory purposes, but did apply to certain other issuances of the Company’s common stock, including the issuances of common stock to raise capital. Pursuant to this anti-dilution provision, the Company issued Additional SARs to the former chief executive officer with a base price determined as of each date of issuance, but otherwise with the same terms and conditions as the Initial SAR, except for an Additional SAR granted relating to a public offering of the Company’s TEUs on May 21, 2014 that has different terms (Additional TEU SAR).
Regarding the Additional TEU SAR, each TEU contained a Purchase Contract that could be settled in shares of the Company’s voting common stock based on a maximum settlement rate (subject to adjustment) and a minimum settlement rate (subject to adjustment) as more fully described under Note 18. The Additional TEU SAR was calculated using the initial maximum settlement rate and, therefore, the number of shares underlying the Additional TEU SAR was subject to adjustment and forfeiture if the aggregate number of shares of stock issued in settlement of any single Purchase Contract was less than the initial maximum settlement rate.
166
By its original terms, the Additional TEU SAR was to vest in full on
May 15, 2017
or accelerate in vesting upon early settlement of a Purchase Contract at the holders' option, and until it vested, the Additional TEU SAR was to have no dividend equivalent rights and the shares underlying the Additional TEU SAR were subject to forfeiture.
The following table represents SARs activity and the weighted-average exercise price per share for the periods indicated:
|
Year Ended December
31,
|
||||||||||||||||||||
|
2018
|
2017
|
2016
|
||||||||||||||||||
|
Number of Shares
|
Weighted-Average Exercise Price per Share
|
Number of Shares
|
Weighted-Average Exercise Price per Share
|
Number of Shares
|
Weighted-Average Exercise Price per Share
|
|||||||||||||||
|
Outstanding at beginning of year
|
1,559,012
|
|
$
|
11.60
|
|
1,559,047
|
|
$
|
11.60
|
|
1,561,681
|
|
$
|
11.60
|
|
|||||
|
Granted
|
—
|
|
$
|
—
|
|
—
|
|
$
|
—
|
|
—
|
|
$
|
—
|
|
|||||
|
Exercised
|
—
|
|
$
|
—
|
|
—
|
|
$
|
—
|
|
—
|
|
$
|
—
|
|
|||||
|
Forfeited
|
—
|
|
$
|
—
|
|
(35
|
)
|
$
|
10.09
|
|
(2,634
|
)
|
$
|
10.09
|
|
|||||
|
Outstanding at end of year
|
1,559,012
|
|
$
|
11.60
|
|
1,559,012
|
|
$
|
11.60
|
|
1,559,047
|
|
$
|
11.60
|
|
|||||
|
Exercisable at end of year
|
1,559,012
|
|
$
|
11.60
|
|
1,559,012
|
|
$
|
11.60
|
|
1,550,978
|
|
$
|
11.61
|
|
|||||
The following table represents changes in unvested SARs and related information as of and for the periods indicated:
|
Year Ended December
31,
|
||||||||||||||||||||
|
2018
|
2017
|
2016
|
||||||||||||||||||
|
Number of Shares
|
Weighted-Average Exercise Price per Share
|
Number of Shares
|
Weighted-Average Exercise Price per Share
|
Number of Shares
|
Weighted-Average Exercise Price per Share
|
|||||||||||||||
|
Outstanding at beginning of year
|
—
|
|
$
|
—
|
|
8,069
|
|
$
|
10.09
|
|
25,963
|
|
$
|
10.09
|
|
|||||
|
Granted
|
—
|
|
$
|
—
|
|
—
|
|
$
|
—
|
|
—
|
|
$
|
—
|
|
|||||
|
Vested
|
—
|
|
$
|
—
|
|
(8,034
|
)
|
$
|
10.09
|
|
(15,260
|
)
|
$
|
10.09
|
|
|||||
|
Forfeited
|
—
|
|
$
|
—
|
|
(35
|
)
|
$
|
10.09
|
|
(2,634
|
)
|
$
|
10.09
|
|
|||||
|
Outstanding at end of year
|
—
|
|
$
|
—
|
|
—
|
|
$
|
—
|
|
8,069
|
|
$
|
10.09
|
|
|||||
167
NOTE 17 – EMPLOYEE BENEFIT PLANS
The Company has a 401(k) plan whereby all employees generally can participate in the plan. Employees may contribute up to
100
percent of their compensation subject to certain limits based on federal tax laws. The Company makes an enhanced safe-harbor matching contribution equal to
100 percent
of the first
4
percent of the employee’s deferral rate not to exceed 4 percent of the employee’s compensation. The safe-harbor matching contribution is fully vested by the participant when made.
For the years ended
December 31, 2018
,
2017
and
2016
, expense attributable to 401(k) plans amounted to
$2.1 million
,
$3.1 million
and
$3.9 million
, respectively.
The Company has adopted a Deferred Compensation Plan under Section 401 of the IRC. The purpose of this plan is to provide specified benefits to a select group of management and highly compensated employees. Participants may elect to defer compensation, which accrues interest quarterly at the Prime Rate as of the last business day of the prior quarter. The Company does not make contributions to the Plan.
Employee Equity Ownership Plan
The Company established the Employee Equity Ownership Plan (EEOP) effective October 15, 2013 for the benefit of employees. The EEOP is administered under the Company’s 2013 Omnibus Stock Incentive Plan and the awards thereunder are issued upon the terms and conditions and subject to the restrictions of the Company’s 2013 Omnibus Stock Incentive Plan. The EEOP provides that employees eligible to receive restricted stock awards or units under the EEOP are any employees who are not otherwise given shares pursuant to any other Company-sponsored equity program, with grants generally vesting in
five
equal annual installments beginning on the first anniversary of the date of grant. After evaluation of all then-current equity plans, the Company discontinued the Employee Equity Ownership Program (“EEOP”) effective January 1, 2018. On April 2, 2018, all final stock awards due under the EEOP were granted to eligible employees, including employees who were eligible for a five-year service award during 2018 calendar year.
The Company issued
72,561
,
35,016
and
98,693
shares with respect to restricted stock awards and units under the EEOP for the years ended
December 31, 2018
,
2017
and
2016
. At
December 31, 2018
, there were
83,900
unvested shares of restricted stock and restricted stock units with an unrecognized stock-based compensation expense of
$1.5 million
.
NOTE 18 – STOCKHOLDERS’ EQUITY
Warrants
On
November 1, 2010
, the Company issued warrants to TCW Shared Opportunity Fund V, L.P. for up to
240,000
shares of non-voting common stock at an original exercise price of
$11.00
per share, subject to certain adjustments to the number of shares underlying the warrants as well as certain adjustments to the warrant exercise price as applicable. These warrants were exercisable from the date of original issuance through
November 1, 2015
. On
August 3, 2015
, these warrants were exercised in full using a cashless (net) exercise, resulting in a net number of shares of non-voting common stock issued in the aggregate of
70,690
, which were immediately thereafter exchanged pursuant to a separate exchange agreement entered into on May 29, 2013 for an aggregate of
70,690
shares of voting common stock. Based on automatic adjustments to the original
$11.00
exercise price, the exercise price at the time of exercise of the warrants was
$9.13
per share.
On
November 1, 2010
, the Company also issued warrants to COR Advisors LLC (COR Advisors), an entity controlled by Steven A. Sugarman, who became a director of the Company on that date and later became President and Chief Executive Officer of the Company (and resigned from those and all other positions with the Company and the Bank on January 23, 2017). The warrants entitled COR Advisors to purchase up to
1,395,000
shares of non-voting common stock at an exercise price of
$11.00
per share, subject to certain adjustments to the number of shares underlying the warrants as well as certain adjustments to the warrant exercise price as applicable. On August 3, 2011, COR Advisors transferred warrants for the right to purchase
960,000
shares of non-voting common stock to COR Capital Holdings LLC (COR Capital Holdings), an entity controlled by Steven A. Sugarman, and transferred warrants for the right to purchase the remaining
435,000
shares of non-voting common stock to Jeffrey T. Seabold, then- (now former) Executive Vice President and Management Vice-Chair.
On August 22, 2012, COR Capital Holdings transferred its warrants for the right to purchase
960,000
shares of non-voting common stock to a living trust for Steven A. Sugarman and his spouse. These warrants vested in tranches, with each tranche being exercisable for
five years
after the tranche’s vesting date. With respect to the warrants transferred by COR Capital Holdings to the living trust for Steven A. Sugarman and his spouse, warrants to purchase
50,000
shares vested on October 1, 2011 and the remainder vested in seven equal quarterly installments beginning January 1, 2012 and ending on July 1, 2013. With respect to the warrants transferred by COR Advisors to Mr. Seabold, warrants to purchase
95,000
shares vested on January 1, 2011; warrants to acquire
130,000
shares vested on each of April 1 and July 1, 2011, and warrants to purchase
80,000
shares vested on October 1, 2011.
168
On August 17, 2016, the living trust for Steven A. Sugarman and his spouse transferred warrants to purchase
480,000
shares to Steven A. Sugarman's brother, Jason Sugarman. These transferred warrants were last exercisable on
September 30, 2016
,
December 31, 2016
,
March 31, 2017
,
June 30, 2017
and
September 30, 2017
for
50,000
,
130,000
,
130,000
,
130,000
, and
40,000
shares, respectively. On August 17, 2016, Jason Sugarman irrevocably elected to fully exercise each tranche of the transferred warrants. Under his irrevocable election, Jason Sugarman directed that each such exercise would occur on the last exercisable date for each tranche using a cashless (net) exercise method and also directed that each exercise be for either non-voting common stock, or, if allowed under the terms of the warrant, for voting common stock.
At September 30, 2016, December 31, 2016, March 31, 2017, June 30, 2017 and September 30, 2017, in accordance with Jason Sugarman’s irrevocable election, warrants to purchase
50,000
,
130,000
,
130,000
,
130,000
, and
40,000
shares, respectively, had been exercised, resulting in issuances of
25,051
and
64,962
shares of the Company's voting common stock and
75,875
,
77,376
and
23,237
shares of the Company's non-voting common stock, respectively. Based on automatic adjustments to the original
$11.00
exercise price, the exercise price at the time of exercise was
$8.80
,
$8.72
,
$8.66
,
$8.61
and
$8.55
per share, respectively. As a result of these exercises, Jason Sugarman no longer holds any warrants to purchase shares of the Company’s stock. During the three months ended June 30, 2018, based on additional documentation received from Jason Sugarman, it was determined that Jason Sugarman was eligible to receive voting common stock under the terms of the transferred warrant for the exercises that previously occurred on March 31, 2017, June 30, 2017 and September 30, 2017. Accordingly, on June 6, 2018, an aggregate of
176,488
shares of the Company's non-voting common stock owned by Jason Sugarman were canceled and he was issued
176,488
shares of the Company's voting common stock in lieu thereof.
On August 16, 2016, the living trust for Steven A. Sugarman and his spouse irrevocably elected to exercise its warrants to purchase
480,000
shares. Under its irrevocable election, the living trust for Steven A. Sugarman and his spouse directed that each such exercise would occur on the last exercisable date for each tranche of such warrants (
September 30, 2017
,
December 31, 2017
,
March 31, 2018
and
June 30, 2018
with respect to
90,000
,
130,000
,
130,000
, and
130,000
shares, respectively) using a cashless net exercise method and also directed that each exercise be for non-voting common stock. On September 30, 2017, in accordance with its irrevocable election, warrants to purchase
90,000
shares were exercised by the living trust for Steven A. Sugarman and his spouse, resulting in the issuance of
52,284
shares of the Company's non-voting common stock. Based on an automatic adjustment to the original
$11.00
exercise price, the exercise price at the time of exercise was
$8.55
per share.
On December 27, 2017, March 30, 2018 and June 29, 2018, the Company was notified that the living trust for Steven A. Sugarman and his spouse purportedly transferred warrants with respect to
130,000
shares, with a last exercisable date of December 31, 2017,
130,000
shares with a last exercisable date of March 31, 2018 and
130,000
shares with a last exercisable
date of June 30, 2018, respectively, to a separate entity, Sugarman Family Partners. In accordance with the irrevocable election to exercise previously submitted by the living trust for Steven A. Sugarman and his spouse, the Company considered these transferred warrants to have been exercised with respect to
130,000
shares on December 31, 2017,
130,000
shares on March
31, 2018 and
130,000
shares on June 30, 2018, respectively, resulting in the issuance of
77,413
,
72,159
, and
73,543
shares of the Company's non-voting common stock, respectively, on December 31, 2017, April 2, 2018 and July 2, 2018, respectively. Based on an automatic adjustment to the original
$11.00
exercise price, the exercise price at the time of exercise was
$8.49
per share,
$8.44
per share and
$8.38
per share, respectively. As a result of these exercises, none of these warrants remain
outstanding.
On December 8, 2015, March 9, 2016, June 17, 2016, and September 30, 2016, Mr. Seabold exercised his warrants with respect to
95,000
,
130,000
,
130,000
, and
80,000
shares, respectively, using cashless (net) exercises, resulting in a net number of shares of non-voting common stock issued in the aggregate of
37,355
,
53,711
,
70,775
, and
40,081
, respectively. Based on automatic adjustments to the original
$11.00
exercise price, the exercise price at the time of exercise was
$9.04
,
$8.90
,
$8.84
, and
$8.80
per share, respectively. As a result of these exercises, Mr. Seabold
no
longer holds any warrants to purchase shares of the Company's stock.
Under the terms of the respective warrants, the warrants were exercisable for voting common stock in lieu of non-voting common stock following a transfer of the warrants under certain circumstances described in the terms of the warrants. The terms and issuance of the foregoing warrants were approved by the Company's stockholders at a special meeting held on October 25, 2010.
Common Stock
On
March 8, 2016
, the Company issued and sold
4,850,000
shares of its voting common stock in an underwritten public offering, for gross proceeds of approximately
$66.5 million
. On the same date, the Company issued an additional
727,500
shares of voting common stock upon the exercise in full by the underwriters of their
30
-day over-allotment option, for additional gross proceeds of approximately
$10.5 million
.
On
May 11, 2016
, the Company issued and sold
5,250,000
shares of its voting common stock in an underwritten public offering for gross proceeds of approximately
$100.0 million
.
169
Preferred Stock
The Company is authorized to issue
50,000,000
shares of preferred stock with par value of
$0.01
per share. Preferred shares outstanding rank senior to common shares both as to dividends and liquidation preference but generally have no voting rights. All of the Company's outstanding shares of preferred stock have a
$1,000
per share liquidation preference. The following table presents the Company's total outstanding preferred stock as of dates indicated:
|
December
31,
|
||||||||||||||||||||||
|
2018
|
2017
|
|||||||||||||||||||||
|
($ in thousands)
|
Shares Authorized and Outstanding
|
Liquidation Preference
|
Carrying Value
|
Shares Authorized and Outstanding
|
Liquidation Preference
|
Carrying Value
|
||||||||||||||||
|
Series C
8.00% non-cumulative perpetual |
—
|
|
$
|
—
|
|
$
|
—
|
|
40,250
|
|
$
|
40,250
|
|
$
|
37,943
|
|
||||||
|
Series D
7.375% non-cumulative perpetual |
115,000
|
|
115,000
|
|
110,873
|
|
115,000
|
|
115,000
|
|
110,873
|
|
||||||||||
|
Series E
7.00% non-cumulative perpetual |
125,000
|
|
125,000
|
|
120,255
|
|
125,000
|
|
125,000
|
|
120,255
|
|
||||||||||
|
Total
|
240,000
|
|
$
|
240,000
|
|
$
|
231,128
|
|
280,250
|
|
$
|
280,250
|
|
$
|
269,071
|
|
||||||
On September 17, 2018, the Company completed the redemption of all
40,250
outstanding shares of the Company's
8.00 percent
Series C Non-Cumulative Perpetual Preferred Stock (Series C Preferred Stock), which resulted in the simultaneous
redemption of all
1,610,000
of the outstanding related depositary shares (Series C Depository Shares), each representing a
1/40
th
interest in a share of Series C Preferred Stock, at a redemption price of the liquidation amount of
$1,000
per share of
Series C Preferred Stock (equivalent to
$25
per Series C Depository Share). The redemption price represented an aggregate
amount of
$40.3 million
and did not accrue interest from and following the regularly scheduled dividend payment date of
September 15, 2018. Deferred stock issuance costs of
$2.3 million
originally recorded as a reduction to preferred stock upon
issuance of the Series C Preferred Stock were reclassified to retained earnings and resulted in a one-time, non-cash reduction to
net income allocated to common stockholders. This affected the computation of basic and diluted earnings per common share
for the year ended December 31, 2018. See Note 21 for additional information.
On
April 8, 2015
, the Company completed the issuance and sale, in an underwritten public offering, of
4,000,000
depositary shares, each representing a 1/40
th
interest in a share of its
7.375 percent
Non-Cumulative Perpetual Preferred Stock, Series D, liquidation preference of
$1,000
per share (equivalent to
$25
per depositary share), for gross proceeds of
$96.9 million
. The Company also granted the underwriters a
30
-day option to purchase up to an additional
600,000
depositary shares to cover over-allotments, which the underwriters exercised in full concurrently, resulting in additional gross proceeds of
$14.5 million
. A total of
115,000
shares of Series D Non-Cumulative Perpetual Preferred Stock were issued.
On
February 8, 2016
, the Company completed the issuance and sale, in an underwritten public offering, of
5,000,000
depositary shares, each representing a 1/40
th
interest in a share of its
7.00 percent
Non-Cumulative Perpetual Preferred Stock, Series E (with
125,000
shares of Series E Non-Cumulative Perpetual Preferred Stock issued), with a liquidation preference of
$1,000
per share (equivalent to
$25
per depositary share), for gross proceeds of
$121.1 million
.
On
April 1, 2016
, the Company completed the redemption of all
32,000
outstanding shares of the Company's Non-Cumulative Perpetual Preferred Stock, Series A, and all
10,000
outstanding shares of the Company's Non-Cumulative Perpetual Preferred Stock, Series B. The shares were redeemed at a redemption price equal to the liquidation amount of
$1,000
per share plus the unpaid dividends for the current dividend period to, but excluding, the redemption date. Both the Series A Preferred Stock and the Series B preferred Stock were issued as part of the U.S. Department of the Treasury's Small Business Lending Fund Program.
Stock Employee Compensation Trust
On August 3, 2016, the Company established the SECT pursuant to the Trust Agreement, dated as of August 3, 2016 (the SECT Trust Agreement), between the Company and Newport Trust Company, as trustee (as successor trustee to Evercore Trust Company, N.A.) (the SECT Trustee) to fund employee compensation and benefit obligations of the Company using shares of the Company’s common stock. On August 3, 2016, the Company sold
2,500,000
shares of voting common stock to the SECT at a purchase price of
$21.45
per share (the closing price of the voting common stock on August 2, 2016), or
$53.6 million
in the aggregate, in exchange for a cash amount equal to the aggregate par value of the shares and a promissory note for the balance of the purchase price. The SECT was to terminate on January 1, 2032 unless terminated earlier in accordance with the SECT Trust Agreement, including by the Company’s Board of Directors.
On December 28, 2017, in order to effectuate the early termination of the SECT, as authorized by the Company’s Board of Directors, the Company purchased from the SECT all
2,500,000
shares of voting common stock held by the SECT at a
170
purchase price of
$21.00
per share (the closing price per share of the voting common stock on December 27, 2017), or
$52.5 million
in the aggregate (the SECT Termination Sale). Following the SECT Termination Sale, such shares of voting common stock were canceled. Of the proceeds from the SECT Termination Sale,
$2.7 million
was to be utilized for the purpose of funding obligations under certain of the Company’s benefit plans to which
126,517
shares of voting common stock had been allocated prior to the SECT Termination Sale, and
$49.8 million
was remitted by the SECT Trustee to the Company, which was deemed to be in satisfaction and termination of all remaining obligations of the SECT under the promissory note, which had an outstanding principal balance of
$50.9 million
plus accrued interest. During the quarter ended September 30, 2018, the
remaining cash balance in the SECT, including the aforementioned proceeds of
$2.7 million
from the SECT Termination Sale,
was disbursed from the SECT to the Company to fund the Company's 401(k) plan as well as health and welfare plans. The
termination of the SECT was completed upon the filing of a certificate of cancellation with the Maryland Department of
Assessments and Taxation on September 24, 2018.
Tangible Equity Units - Prepaid Stock Purchase Contracts
On
May 21, 2014
, the Company completed an underwritten public offering of
1,380,000
of its tangible equity units (TEUs), which included
180,000
TEUs issued to the underwriter upon the full exercise of its over-allotment option, resulting in net proceeds of
$65.0 million
. The relative fair values of the Amortizing Notes and Purchase Contracts were estimated to be
$14.6 million
and
$54.4 million
, respectively, at the date of issuance. Total issuance costs associated with the TEUs were
$4.0 million
, of which
$857 thousand
was allocated to the debt component and
$3.2 million
was allocated to the equity component of the TEUs.
Each TEU was comprised of a Purchase Contract and an Amortizing Note. The terms of the Purchase Contracts provided that unless settled early at the holder’s option as described below, on May 15, 2017, each Purchase Contract would automatically settle and the Company would deliver a number of shares of its voting common stock based on the then-applicable market value of the voting common stock, ranging from an initial minimum settlement rate of
4.4456
shares per Purchase Contract (subject to adjustment) if the applicable market value is equal to or greater than
$11.247
per share to an initial maximum settlement rate of
5.1124
shares per Purchase Contract (subject to adjustment) if the applicable market value is less than or equal to
$9.78
per share.
From the first business day following the issuance of the TEUs, excluding the third business day immediately preceding May 15, 2017, a holder of a Purchase Contract could settle its Purchase Contract early, and the Company would deliver to the holder
4.4456
shares of voting common stock. On May 15, 2017, all Purchase Contracts that had not previously been settled early as described above were settled. The Company issued an aggregate of
6,134,988
shares of voting common stock pursuant to the Purchase Contracts. See Note 12 for additional information.
Change in Accumulated Other Comprehensive Income (Loss)
The Company’s AOCI includes unrealized gain (loss) on securities available-for-sale. Changes to AOCI are presented net of tax effect as a component of stockholders' equity. Reclassifications from AOCI are recorded on the Consolidated Statements of Operations either as a gain or loss. The following table presents changes to AOCI for the periods indicated:
|
Year Ended December 31,
|
||||||||||||
|
($ in thousands)
|
2018
|
2017
|
2016
|
|||||||||
|
Unrealized gain (loss) on securities available-for -sale
|
||||||||||||
|
Balance at beginning of period
|
$
|
5,227
|
|
$
|
(9,042
|
)
|
$
|
(2,995
|
)
|
|||
|
Unrealized (loss) gain arising during the period
|
(40,476
|
)
|
16,334
|
|
19,097
|
|
||||||
|
Unrealized gain arising from the reclassification of securities held-to-maturity to securities available-for-sale
|
—
|
|
21,990
|
|
—
|
|
||||||
|
Reclassification adjustment from other comprehensive income
|
(5,532
|
)
|
(14,768
|
)
|
(29,405
|
)
|
||||||
|
Amounts reclassified from accumulated other comprehensive income (loss) to net income
|
3,252
|
|
—
|
|
—
|
|
||||||
|
Tax effect of current period changes
|
12,916
|
|
(9,287
|
)
|
4,261
|
|
||||||
|
Total changes, net of taxes
|
(29,840
|
)
|
14,269
|
|
(6,047
|
)
|
||||||
|
Reclassification of stranded tax effects to retained earnings
|
496
|
|
—
|
|
—
|
|
||||||
|
Balance at end of period
|
$
|
(24,117
|
)
|
$
|
5,227
|
|
$
|
(9,042
|
)
|
|||
171
NOTE 19 – REGULATORY CAPITAL MATTERS
The Company and the Bank are subject to regulatory capital requirements administered by federal banking agencies. Capital adequacy guidelines and prompt corrective action regulations involve quantitative measures of assets, liabilities, and certain off-balance sheet items calculated under regulatory accounting practices. Capital amounts and classifications are also subject to qualitative judgments by regulators. Failure to meet capital requirements can initiate regulatory action. Management believes as of
December 31, 2018
, the Company and the Bank met all capital adequacy requirements to which they were then subject. With respect to the Bank, prompt corrective action regulations provide five classifications: well-capitalized, adequately capitalized, undercapitalized, significantly undercapitalized, and critically undercapitalized, although these terms are not used to represent overall financial condition. If only adequately capitalized, regulatory approval is required to accept brokered deposits. If undercapitalized, capital distributions are limited, as is asset growth and expansion, and a capital restoration plan is required. At
December 31, 2018
, the most recent regulatory notification categorized the Bank as well-capitalized under the regulatory framework for prompt corrective action. There are no conditions or events since that notification that management believes have changed the institution’s category.
The following table presents the regulatory capital amounts and ratios for the Company and the Bank as of dates indicated:
|
Minimum Capital Requirements
|
Minimum Required to Be Well-Capitalized Under Prompt Corrective Action Provisions
|
||||||||||||||||||||
|
($ in thousands)
|
Amount
|
Ratio
|
Amount
|
Ratio
|
Amount
|
Ratio
|
|||||||||||||||
|
December 31, 2018
|
|||||||||||||||||||||
|
Banc of California, Inc.
|
|||||||||||||||||||||
|
Total risk-based capital
|
$
|
977,342
|
|
13.71
|
%
|
$
|
570,368
|
|
8.00
|
%
|
N/A
|
|
N/A
|
|
|||||||
|
Tier 1 risk-based capital
|
910,528
|
|
12.77
|
%
|
427,776
|
|
6.00
|
%
|
N/A
|
|
N/A
|
|
|||||||||
|
Common equity tier 1 capital
|
679,400
|
|
9.53
|
%
|
320,832
|
|
4.50
|
%
|
N/A
|
|
N/A
|
|
|||||||||
|
Tier 1 leverage
|
910,528
|
|
8.95
|
%
|
407,145
|
|
4.00
|
%
|
N/A
|
|
N/A
|
|
|||||||||
|
Banc of California, NA
|
|||||||||||||||||||||
|
Total risk-based capital
|
$
|
1,120,122
|
|
15.71
|
%
|
$
|
570,382
|
|
8.00
|
%
|
$
|
712,977
|
|
10.00
|
%
|
||||||
|
Tier 1 risk-based capital
|
1,053,308
|
|
14.77
|
%
|
427,786
|
|
6.00
|
%
|
570,382
|
|
8.00
|
%
|
|||||||||
|
Common equity tier 1 capital
|
1,053,308
|
|
14.77
|
%
|
320,840
|
|
4.50
|
%
|
463,435
|
|
6.50
|
%
|
|||||||||
|
Tier 1 leverage
|
1,053,308
|
|
10.36
|
%
|
406,694
|
|
4.00
|
%
|
508,368
|
|
5.00
|
%
|
|||||||||
|
December 31, 2017
|
|||||||||||||||||||||
|
Banc of California, Inc.
|
|||||||||||||||||||||
|
Total risk-based capital
|
$
|
1,002,200
|
|
14.56
|
%
|
$
|
550,499
|
|
8.00
|
%
|
N/A
|
|
N/A
|
|
|||||||
|
Tier 1 risk-based capital
|
949,151
|
|
13.79
|
%
|
412,874
|
|
6.00
|
%
|
N/A
|
|
N/A
|
|
|||||||||
|
Common equity tier 1 capital
|
682,539
|
|
9.92
|
%
|
309,656
|
|
4.50
|
%
|
N/A
|
|
N/A
|
|
|||||||||
|
Tier 1 leverage
|
949,151
|
|
9.39
|
%
|
404,339
|
|
4.00
|
%
|
N/A
|
|
N/A
|
|
|||||||||
|
Banc of California, NA
|
|||||||||||||||||||||
|
Total risk-based capital
|
$
|
1,131,057
|
|
16.56
|
%
|
$
|
546,359
|
|
8.00
|
%
|
$
|
682,949
|
|
10.00
|
%
|
||||||
|
Tier 1 risk-based capital
|
1,078,008
|
|
15.78
|
%
|
409,769
|
|
6.00
|
%
|
546,359
|
|
8.00
|
%
|
|||||||||
|
Common equity tier 1 capital
|
1,078,008
|
|
15.78
|
%
|
307,327
|
|
4.50
|
%
|
443,917
|
|
6.50
|
%
|
|||||||||
|
Tier 1 leverage
|
1,078,008
|
|
10.67
|
%
|
404,060
|
|
4.00
|
%
|
505,074
|
|
5.00
|
%
|
|||||||||
172
In July 2013, the Federal banking regulators approved a final rule to implement the revised capital adequacy standards of the Basel Committee on Banking Supervision, commonly called Basel III, and to address relevant provisions of the Dodd-Frank Act. The final rule strengthens the definition of regulatory capital, increases risk-based capital requirements, makes selected changes to the calculation of risk-weighted assets, and adjusts the prompt corrective action thresholds. The Company and the Bank became subject to the new rule on January 1, 2015 and certain provisions of the new rule were phased in through 2019. The final provision related to this follows implements a new capital conservation buffer requirement for a banking organization to maintain a common equity capital ratio more than 2.5 percent above the minimum common equity Tier 1 capital, Tier 1 capital and total risk-based capital ratios in order to avoid limitations on capital distributions, including dividend payments, and certain discretionary bonus payments. The capital conservation buffer requirement was phased in, beginning on January 1, 2016 at 0.625 percent, with additional 0.625 percent increments annually, and became fully phased in at 2.50 percent on January 1, 2019. Inclusive of the fully phased-in capital conservation buffer, the common equity Tier 1 capital, Tier 1 risk-based capital and total risk-based capital ratio minimums are 7.0%, 8.5% and 10.5%, respectively. A banking organization with a buffer of less than the required amount is subject to increasingly stringent limitations on such distributions and payments as the buffer approaches zero. The new rule also generally prohibits a banking organization from making such distributions or payments during any quarter if its eligible retained income is negative and its capital conservation buffer ratio was 2.5 percent or less at the end of the previous quarter. The eligible retained income of a banking organization is defined as its net income for the four calendar quarters preceding the current calendar quarter, based on the organization’s quarterly regulatory reports, net of any distributions and associated tax effects not already reflected in net income.
Dividend Restrictions
The Company’s principal source of funds for dividend payments is dividends received from the Bank. Federal banking laws and regulations limit the amount of dividends that may be paid without prior approval of regulatory agencies. Under these regulations, in the case of the Bank, the amount of dividends that may be paid in any calendar year is limited to the current year’s net profits, combined with the retained net profits of the preceding two years, subject to the capital requirements described above. At
December 31, 2018
, the Bank had
$104.3 million
available to pay dividends to the Company without prior OCC approval. However, any dividend granted by the Bank would be limited by the need to maintain its well capitalized status plus the capital buffer in order to avoid additional dividend restrictions. In addition to dividends on its preferred stock, the Company declared and paid dividends on its common stock of $0.13 per share for each of the quarters of 2018. The Bank paid dividends of
$94.3 million
to Banc of California, Inc. during the year ended
December 31, 2018
.
NOTE 20 – VARIABLE INTEREST ENTITIES
T
he Company holds ownership interests in alternative energy partnerships, qualified affordable housing partnerships, and held an interest in the SECT prior to the termination of the SECT. The Company evaluates its interests in these entities to determine whether they meet the definition of a VIE and whether the Company is required to consolidate these entities. A VIE is consolidated by its primary beneficiary, which is the party that has both (i) the power to direct the activities that most significantly impact the economic performance of the VIE and (ii) a variable interest that could potentially be significant to the VIE. To determine whether or not a variable interest the Company holds could potentially be significant to the VIE, the Company considers both qualitative and quantitative factors regarding the nature, size and form of the Company's involvement with the VIE. The Company has determined that its interests in these entities meet the definition of a variable interest.
Unconsolidated VIEs
Alternative Energy Partnerships
The Company invests in certain alternative energy partnerships (limited liability companies) formed to provide sustainable energy projects that are designed to generate a return primarily through the realization of federal tax credits (energy tax credits). These entities were formed to invest in newly installed residential rooftop solar leases and power purchase agreements. As a result of its investments, the Company has the right to certain investment tax credits and tax depreciation benefits (recognized on the flow through and income statement method in accordance with ASC 740), and to a lesser extent, cash flows generated from the installed solar systems leased to individual consumers for a fixed period of time.
While the Company's interest in the alternative energy partnerships meets the definition of a VIE in accordance with ASC 810, the Company has determined that the Company is not the primary beneficiary because the Company does not have the power to direct the activities that most significantly impact the economic performance of the entities including operational and credit risk management activities. As the Company is not the primary beneficiary, the Company did not consolidate the entities. The Company uses the Hypothetical Liquidation at Book Value (HLBV) method to account for these investments in energy tax credits as an equity investment under ASC 970-323-25-17. Under the HLBV method, an equity method investor determines its share of an investee's earnings by comparing its claim on the investee's book value at the beginning and end of the period, assuming the investee were to liquidate all assets at their U.S. GAAP amounts and distribute the resulting cash to creditors and investors under their respective priorities. The difference between the calculated liquidation distribution amounts at the
173
beginning and the end of the reporting period, after adjusting for capital contributions and distributions, is the Company’s share of the earnings or losses from the equity investment for the period. To account for the tax credits earned on investments in alternative energy partnerships, the Company uses the flow-through income statement method. Under this method, the tax credits are recognized as a reduction to income tax expense and the initial book-tax differences in the basis of the investments are recognized as additional tax expense in the year they are earned.
During the years ended
December 31, 2018
and
2017
, The Company funded
$0
and
$55.4 million
, respectively, and recognized a loss on investment of
$5.0 million
and
$30.8 million
, respectively, through its HLBV application. As a result, the balance of its investments was
$29.0 million
and
$48.8 million
, respectively, at
December 31, 2018
and
2017
. During the year ended December 31, 2017, the Company completed the funding on one of its investments. While the Company had committed
$100.0 million
to the investment, the amount that was drawn down and funded by the Company was
$62.8 million
and the remaining
$37.2 million
of the commitment was canceled. During the three months ended June 30, 2018, the Company reached the completion deadline of its remaining investment. While the Company had committed
$100.0 million
to that investment, the amount that was drawn down and funded by the Company was
$49.9 million
, of which
$1.0 million
was unused and returned to the Company, and the remaining
$50.1 million
of commitment was canceled.
From an income tax benefit perspective, the Company recognized investment tax credits of
$9.6 million
and
$38.2 million
, respectively, as well as income tax benefits relating to the recognition of its loss through its HLBV application during the years ended
December 31, 2018
and
2017
.
The following table represents the carrying value of the associated assets and liabilities and the associated maximum loss exposure for the alternative energy partnerships as of the dates indicated:
|
December
31,
|
||||||||
|
($ in thousands)
|
2018
|
2017
|
||||||
|
Cash
|
$
|
3,012
|
|
$
|
16,518
|
|
||
|
Equipment, net of depreciation
|
259,464
|
|
246,297
|
|
||||
|
Other assets
|
4,470
|
|
2,444
|
|
||||
|
Total unconsolidated assets
|
$
|
266,946
|
|
$
|
265,259
|
|
||
|
Total unconsolidated liabilities
|
$
|
6,269
|
|
$
|
7,181
|
|
||
|
Maximum loss exposure
|
$
|
28,988
|
|
$
|
98,910
|
|
||
174
The maximum loss exposure that would be absorbed by the Company in the event that all of the assets in the alternative energy partnerships are deemed worthless is
$29.0 million
, which is the Company's recorded investment amount at
December 31, 2018
.
The Company believes that the loss exposure on its investments is reduced considering its return on its investment is provided not only by the cash flows of the underlying customer leases and power purchase agreements, but also through the significant tax benefits, including federal tax credits generated from the investments. In addition, the arrangements include a transition manager to support any transition of the solar company sponsor whose role includes that of the servicer and operation and maintenance provider, in the event the sponsor would be required to be removed from its responsibilities (e.g., bankruptcy, breach of contract, etc.), thereby further limiting the Company’s exposure.
Qualified Affordable Housing Partnerships
The Company invests in limited partnerships that operate qualified affordable housing projects. The returns on these investments are generated primarily through allocated Federal tax credits and other tax benefits. In addition, these investments contribute to the Company's compliance with the Community Reinvestment Act. These limited partnerships are considered to be VIEs, because either (i) they do not have sufficient equity investment at risk or (ii) the limited partners with equity at risk do not have substantive kick-out rights through voting rights or substantive participating rights over the general partner. As a limited partner, the Company is not the primary beneficiary because the general partner has the ability to direct the activities of the VIEs that most significantly impact their economic performance. Therefore, the Company does not consolidate these partnerships.
The Company funded
$4.1 million
,
$4.5 million
and
$104 thousand
, respectively, into these partnerships and recognized proportional amortization expense of
$2.0 million
,
$1.4 million
and
$394 thousand
, respectively, during the years ended
December 31, 2018
,
2017
and
2016
. As a result, the balance of these investments was
$20.0 million
and
$22.0 million
, respectively, at
December 31, 2018
and
2017
. As of
December 31, 2018
, the Company had funded
$17.8 million
of its
$29.3 million
aggregated funding commitments. The Company had an unfunded commitment of
$11.5 million
at
December 31, 2018
. From an income tax benefit perspective, the Company recognized investment tax credits of
$1.9 million
,
$849 thousand
and
$435 thousand
, respectively, during the years ended
December 31, 2018
,
2017
and
2016
. The maximum loss exposure that would be absorbed by the Company in the event that all of the assets in this investment are deemed worthless is
$20.0 million
, which is the Company's recorded investment amount at
December 31, 2018
. The recorded investment amount is included in Other Assets on the Consolidated Statements of Financial Condition and the proportional amortization expense is recorded in Income Tax (Benefit) Expense on the Consolidated Statements of Operations.
As the investments in alternative energy partnerships and qualified affordable housing partnerships represent unconsolidated VIEs to the Company, the assets and liabilities of the investments themselves are not recorded on the Company's statements of financial condition.
Consolidated VIE
On August 3, 2016, the Company established the SECT pursuant to the SECT Trust Agreement to fund employee compensation and benefit obligations of the Company using shares of the Company’s common stock. On August 3, 2016, the Company sold
2,500,000
shares of voting common stock to the SECT at a purchase price of
$21.45
per share (the closing price of the voting common stock on August 2, 2016), or
$53.6 million
in the aggregate, in exchange for a cash amount equal to the aggregate par value of the shares and a promissory note for the balance of the purchase price. The SECT was to terminate on January 1, 2032 unless terminated earlier in accordance with the SECT Trust Agreement, including by the Company’s Board of Directors.
The Company evaluated its interest in the SECT and determined that it was a VIE for which the Company was the primary beneficiary. As such, the SECT was consolidated by the Company. The entire amount of assets and liabilities of the SECT represented the transactions between the Company and the SECT. As a result, the note receivable on the Company and the note payable on the SECT were eliminated on a consolidated basis. All other transactions, such as note principal and dividend payments and receipts, were also eliminated on a consolidated basis, accordingly.
On December 28, 2017, in order to effectuate the early termination of the SECT, as authorized by the Company’s Board of Directors, the Company purchased from the SECT all
2,500,000
shares of voting common stock held by the SECT. On September 24, 2018, the termination of the SECT was completed. See Note 18 for additional information.
175
NOTE 21 – EARNINGS PER COMMON SHARE
The following table presents computations of basic and diluted EPS for the periods indicated:
|
Year Ended December
31,
|
||||||||||||||||||||||||||||||||||||
|
2018
|
2017
|
2016
|
||||||||||||||||||||||||||||||||||
|
($ in thousands, except per share data)
|
Common Stock
|
Class B Common Stock
|
Total
|
Common Stock
|
Class B Common Stock
|
Total
|
Common Stock
|
Class B Common Stock
|
Total
|
|||||||||||||||||||||||||||
|
Income from continuing operations
|
$
|
41,732
|
|
$
|
415
|
|
$
|
42,147
|
|
$
|
53,136
|
|
$
|
338
|
|
$
|
53,474
|
|
$
|
86,500
|
|
$
|
240
|
|
$
|
86,740
|
|
|||||||||
|
Less: income allocated to participating securities
|
—
|
|
—
|
|
—
|
|
(309
|
)
|
(2
|
)
|
(311
|
)
|
(2,268
|
)
|
(6
|
)
|
(2,274
|
)
|
||||||||||||||||||
|
Less: participating securities dividends
|
(803
|
)
|
(8
|
)
|
(811
|
)
|
(806
|
)
|
(5
|
)
|
(811
|
)
|
(757
|
)
|
(2
|
)
|
(759
|
)
|
||||||||||||||||||
|
Less: preferred stock dividends
|
(19,312
|
)
|
(192
|
)
|
(19,504
|
)
|
(20,322
|
)
|
(129
|
)
|
(20,451
|
)
|
(19,859
|
)
|
(55
|
)
|
(19,914
|
)
|
||||||||||||||||||
|
Less: impact of preferred stock redemption
|
(2,284
|
)
|
(23
|
)
|
(2,307
|
)
|
—
|
|
—
|
|
—
|
|
—
|
|
—
|
|
—
|
|
||||||||||||||||||
|
Income from continuing operations allocated to common stockholders
|
19,333
|
|
192
|
|
19,525
|
|
31,699
|
|
202
|
|
31,901
|
|
63,616
|
|
177
|
|
63,793
|
|
||||||||||||||||||
|
Income from discontinued operations
|
3,292
|
|
33
|
|
3,325
|
|
4,208
|
|
27
|
|
4,235
|
|
28,597
|
|
79
|
|
28,676
|
|
||||||||||||||||||
|
Net income allocated to common stockholders
|
$
|
22,625
|
|
$
|
225
|
|
$
|
22,850
|
|
$
|
35,907
|
|
$
|
229
|
|
$
|
36,136
|
|
$
|
92,213
|
|
$
|
256
|
|
$
|
92,469
|
|
|||||||||
|
Weighted-average common shares outstanding
|
50,125,132
|
|
498,090
|
|
50,623,222
|
|
49,936,627
|
|
317,968
|
|
50,254,595
|
|
46,699,050
|
|
129,413
|
|
46,828,463
|
|
||||||||||||||||||
|
Add: Dilutive effects of restricted stock units
|
135,644
|
|
—
|
|
135,644
|
|
72,655
|
|
—
|
|
72,655
|
|
218,121
|
|
—
|
|
218,121
|
|
||||||||||||||||||
|
Add: Dilutive effects of stock options
|
39,036
|
|
—
|
|
39,036
|
|
159,734
|
|
—
|
|
159,734
|
|
197,435
|
|
—
|
|
197,435
|
|
||||||||||||||||||
|
Add: Dilutive effects of warrants
|
53,692
|
|
—
|
|
53,692
|
|
332,806
|
|
—
|
|
332,806
|
|
394,086
|
|
—
|
|
394,086
|
|
||||||||||||||||||
|
Average shares and dilutive common shares
|
50,353,504
|
|
498,090
|
|
50,851,594
|
|
50,501,822
|
|
317,968
|
|
50,819,790
|
|
47,508,692
|
|
129,413
|
|
47,638,105
|
|
||||||||||||||||||
|
Basic earnings per common share
|
||||||||||||||||||||||||||||||||||||
|
Income from continuing operations
|
$
|
0.38
|
|
$
|
0.38
|
|
$
|
0.38
|
|
$
|
0.64
|
|
$
|
0.64
|
|
$
|
0.64
|
|
$
|
1.36
|
|
$
|
1.36
|
|
$
|
1.36
|
|
|||||||||
|
Income from discontinued operations
|
0.07
|
|
0.07
|
|
0.07
|
|
0.08
|
|
0.08
|
|
0.08
|
|
0.61
|
|
0.61
|
|
0.61
|
|
||||||||||||||||||
|
Net income
|
$
|
0.45
|
|
$
|
0.45
|
|
$
|
0.45
|
|
$
|
0.72
|
|
$
|
0.72
|
|
$
|
0.72
|
|
$
|
1.97
|
|
$
|
1.97
|
|
$
|
1.97
|
|
|||||||||
|
Diluted earnings per common share
|
||||||||||||||||||||||||||||||||||||
|
Income from continuing operations
|
$
|
0.38
|
|
$
|
0.38
|
|
$
|
0.38
|
|
$
|
0.63
|
|
$
|
0.64
|
|
$
|
0.63
|
|
$
|
1.34
|
|
$
|
1.36
|
|
$
|
1.34
|
|
|||||||||
|
Income from discontinued operations
|
0.07
|
|
0.07
|
|
0.07
|
|
0.08
|
|
0.08
|
|
0.08
|
|
0.60
|
|
0.61
|
|
0.60
|
|
||||||||||||||||||
|
Net income
|
$
|
0.45
|
|
$
|
0.45
|
|
$
|
0.45
|
|
$
|
0.71
|
|
$
|
0.72
|
|
$
|
0.71
|
|
$
|
1.94
|
|
$
|
1.97
|
|
$
|
1.94
|
|
|||||||||
For the years ended
December 31, 2018
,
2017
, and
2016
, there were
0
,
145,349
, and
0
restricted stock units, respectively, and
267,834
,
59,178
and
272,878
stock options, respectively, that were not considered in computing diluted earnings per common share, because they were anti-dilutive.
176
NOTE 22 – LOAN COMMITMENTS AND OTHER RELATED ACTIVITIES
Some financial instruments such as loan commitments, credit lines, letters of credit, and overdraft protection are issued to meet customer financing needs. These are agreements to provide credit or to support the credit of others, as long as conditions established in the contract are met, and usually have expiration dates. Commitments may expire without being used. Risk of credit loss exists up to the face amount of these instruments. The same credit policies are used to make such commitments as are used for loans, including obtaining collateral at exercise of the commitment.
The contractual amount of financial instruments with off-balance sheet risk was as follows for the dates indicated:
|
December
31,
|
||||||||||||||||
|
2018
|
2017
|
|||||||||||||||
|
($ in thousands)
|
Fixed Rate
|
Variable Rate
|
Fixed Rate
|
Variable Rate
|
||||||||||||
|
Commitments to extend credit
(1)
|
$
|
2,167
|
|
$
|
288,770
|
|
$
|
1,851
|
|
$
|
335,654
|
|
||||
|
Unused lines of credit
|
1,514
|
|
1,119,158
|
|
19,085
|
|
1,309,170
|
|
||||||||
|
Letters of credit
|
1,266
|
|
8,561
|
|
1,050
|
|
12,976
|
|
||||||||
|
(1)
|
Included
no
commitments to extend credit related to discontinued operations at
December 31, 2018
and
2017
.
|
Commitments to extend credit are generally made for periods of
30
days or less.
Other Commitments
During the three months ended March 31, 2017, the Bank entered into certain definitive agreements which grant the Bank the exclusive naming rights to the Banc of California Stadium, a soccer stadium of LAFC, as well as the right to be the official bank of LAFC. In exchange for the Bank’s rights as set forth in the agreements, the Bank agreed to pay LAFC
$100.0 million
over a period of
15 years
, beginning in 2017 and ending in 2032. The advertising benefits of such rights are amortized on a straight-line basis and recorded as advertising and promotion expense beginning in 2018. As of
December 31, 2018
, the Bank has paid
$15.3 million
of the
$100.0 million
commitment. The prepaid commitment balance, net of amortization, was
$8.7 million
as of
December 31, 2018
, which was recognized as a prepaid asset and included in Other Assets in the Consolidated Statements of Financial Condition.
The Company had unfunded commitments of
$11.5 million
,
$8.8 million
, and
$501 thousand
for Affordable Housing Fund Investment, SBIC, and Other Investments at
December 31, 2018
, respectively.
NOTE 23 – RESTRUCTURING
On June 26, 2018, the Company announced a reduction in force to the Company’s workforce by approximately
9%
of total
staffing. In addition, the Company reduced the use of third party advisors during the third and fourth quarters of 2018, with each of these actions intended to align the Company’s cost structure with its focused commercial banking platform. The plan was fully completed during the fourth quarter of 2018. The Company incurred severance-related costs in 2018 aggregating
$4.4 million
, pre-tax, related to the reduction in force.
In connection with the sale of its Banc Home Loans division in 2017, the Company restructured certain aspects of its infrastructure and back office operations by realigning back office staffing resulting in certain severance and other employee related costs including accelerated vesting of equity awards, and amending certain system contracts in order to improve the Company's efficiency. These employees and systems primarily supported the Company's mortgage banking activities. The Company recognized
$9.1 million
of total restructuring expense during the year ended December 31, 2017.
The Company had outstanding unpaid accrued liabilities of
$117 thousand
and
$202 thousand
, respectively, at
December 31, 2018
and
2017
. The following table presents activities in accrued liabilities and related expenses for the restructuring as of or for the years ended
December 31, 2018
and
2017
, respectively:
177
|
Expense
|
||||||||||||||||
|
($ in thousands)
|
Continuing Operations
|
Discontinued Operations
|
Total
|
Accrued Liabilities
|
||||||||||||
|
As of or For the Year Ended December 31, 2018
|
||||||||||||||||
|
Balance at beginning of period
|
$
|
202
|
|
|||||||||||||
|
Accrual:
|
||||||||||||||||
|
Severance and other employee related costs
|
$
|
4,431
|
|
$
|
—
|
|
$
|
4,431
|
|
4,431
|
|
|||||
|
Total
|
$
|
4,431
|
|
$
|
—
|
|
$
|
4,431
|
|
4,431
|
|
|||||
|
Payments:
|
||||||||||||||||
|
Severance and other employee related costs
|
(4,516
|
)
|
||||||||||||||
|
Other restructuring expense
|
—
|
|
||||||||||||||
|
Total
|
$
|
(4,516
|
)
|
|||||||||||||
|
Balance at end of period
|
$
|
117
|
|
|||||||||||||
|
As of or For the Year Ended December 31, 2017
|
||||||||||||||||
|
Balance at beginning of period
|
$
|
—
|
|
|||||||||||||
|
Accrual:
|
||||||||||||||||
|
Severance and other employee related costs
|
$
|
5,326
|
|
$
|
2,899
|
|
$
|
8,225
|
|
8,225
|
|
|||||
|
Other restructuring expense
|
—
|
|
895
|
|
895
|
|
895
|
|
||||||||
|
Total
|
$
|
5,326
|
|
$
|
3,794
|
|
$
|
9,120
|
|
9,120
|
|
|||||
|
Payments:
|
||||||||||||||||
|
Severance and other employee related costs
|
(8,023
|
)
|
||||||||||||||
|
Other restructuring expense
|
(895
|
)
|
||||||||||||||
|
Total
|
$
|
(8,918
|
)
|
|||||||||||||
|
Balance at end of period
|
$
|
202
|
|
|||||||||||||
178
NOTE 24 - REVENUE RECOGNITION
On January 1, 2018, the Company adopted ASU 2014-09, “Revenue from Contracts with Customers (Topic 606)”, and all subsequent amendments. As stated in Note 1, the implementation of the new standard did not have a material impact on the measurement, timing, or recognition of revenue. Accordingly, no cumulative effect adjustment to opening retained earnings was deemed necessary. Results for reporting periods beginning after January 1, 2018 are presented under Topic 606, while prior period amounts were not adjusted and continue to be reported in accordance with our historic accounting under Topic 605.
Topic 606 does not apply to revenue associated with financial instruments, including revenue from loans and securities. In addition, certain noninterest income streams such as gain or loss associated with mortgage servicing rights, financial guarantees, derivatives, and income from bank owned life insurance are also not within the scope of the new guidance. Topic 606 is applicable to noninterest income such as trust and asset management income, deposit related fees, interchange fees, merchant related income, and annuity and insurance commissions. However, the recognition of these revenue streams did not change significantly upon adoption of Topic 606. Noninterest income considered to be within the scope of Topic 606 is discussed below.
Debit Card Fees
When customers use their debit cards to pay merchants for goods or services, the Company retains a fee from the funds collected from the related deposit account and transfers the remaining funds to the payment network for remittance to the merchant. The performance obligation to the merchant is satisfied and the fee is recognized at the point in time when the funds are collected and transferred to the payment network.
Investment Commissions
The Company acts as an agent for a third party vendor that provides investment services and products to customers. Upon completion of a sale of investment services or products to a customer, the Company receives a commission from the third party vendor. The performance obligation to the third party vendor is satisfied and the commission income is recognized at that point in time.
Deposit Service Fees
Service charges on deposit accounts consist of account analysis fees, monthly service fees, check orders, and other deposit related fees. The Company’s performance obligation for account analysis fees and monthly service fees is generally satisfied, and the related revenue recognized, over the period in which the service is provided. Check orders and other deposit account related fees are largely transactional based, and therefore, the Company’s performance obligation is satisfied, and related revenue recognized, at a point in time as incurred.
Other
Other noninterest income primarily consists of other recurring revenue streams from gains or losses on sales of OREO, and merchant referral commissions. The Company's performance obligation for sale of OREO is the transfer of title and ownership rights of the OREO to the buyer, which occurs at the settlement date when the sale proceeds are received and income is recognized. The Company's performance obligation for merchant referral commissions is satisfied with the successful sale of services to those referred merchants, which is when the commission is received and the income is recognized.
The following presents noninterest income, segregated by revenue streams in-scope and out-of-scope of Topic 606, for the periods indicated.
|
Year Ended December 31,
|
||||||||||||
|
($ in thousands)
|
2018
|
2017
|
2016
|
|||||||||
|
Noninterest Income
|
||||||||||||
|
In scope of Topic 606
|
||||||||||||
|
Deposit Service Fees
|
$
|
3,000
|
|
$
|
2,947
|
|
$
|
2,567
|
|
|||
|
Debit Card Fees
|
659
|
|
1,698
|
|
1,873
|
|
||||||
|
Investment Commissions
|
1,625
|
|
1,893
|
|
1,877
|
|
||||||
|
Other
|
320
|
|
31
|
|
5
|
|
||||||
|
Noninterest Income (in-scope of Topic 606)
|
5,604
|
|
6,569
|
|
6,322
|
|
||||||
|
Noninterest Income (out-of-scope of Topic 606)
|
18,311
|
|
38,101
|
|
92,308
|
|
||||||
|
Total Noninterest Income
|
$
|
23,915
|
|
$
|
44,670
|
|
$
|
98,630
|
|
|||
179
The Company does not typically enter into long-term revenue contracts with customers. As of
December 31, 2018
and
2017
, the Company did not have any significant contract balances. As of
December 31, 2018
, the Company did not capitalize any contract acquisition costs.
NOTE 25 – PARENT COMPANY FINANCIAL STATEMENTS
The parent company only condensed statements of financial condition as of
December 31, 2018
and
2017
, and the related condensed statements of operations and condensed statements of cash flows for the years ended
December 31, 2018
,
2017
, and
2016
are presented below:
Condensed Statements of Financial Condition
|
December 31,
|
||||||||
|
($ in thousands)
|
2018
|
2017
|
||||||
|
ASSETS
|
||||||||
|
Cash and cash equivalents
|
$
|
25,256
|
|
$
|
40,496
|
|
||
|
Other assets
|
13,746
|
|
13,366
|
|
||||
|
Investment in subsidiaries
|
1,088,658
|
|
1,146,788
|
|
||||
|
Total assets
|
$
|
1,127,660
|
|
$
|
1,200,650
|
|
||
|
LIABILITIES AND STOCKHOLDERS’ EQUITY
|
||||||||
|
Notes payable, net
|
173,174
|
|
172,941
|
|
||||
|
Accrued expenses and other liabilities
|
8,952
|
|
15,401
|
|
||||
|
Stockholders’ equity
|
945,534
|
|
1,012,308
|
|
||||
|
Total liabilities and stockholders’ equity
|
$
|
1,127,660
|
|
$
|
1,200,650
|
|
||
180
Condensed Statements of Operations
|
Year Ended December 31,
|
||||||||||||
|
($ in thousands)
|
2018
|
2017
|
2016
|
|||||||||
|
Income
|
||||||||||||
|
Dividends from subsidiaries
|
$
|
94,250
|
|
$
|
18,000
|
|
$
|
57,505
|
|
|||
|
Interest income on loans
|
—
|
|
—
|
|
5
|
|
||||||
|
Gain on sale of subsidiary
|
—
|
|
—
|
|
3,694
|
|
||||||
|
Other operating income
|
76
|
|
2,285
|
|
3,973
|
|
||||||
|
Total income
|
94,326
|
|
20,285
|
|
65,177
|
|
||||||
|
Expenses
|
||||||||||||
|
Interest expense for notes payable and other borrowings
|
9,421
|
|
10,764
|
|
12,703
|
|
||||||
|
Provision for loan and lease losses
|
—
|
|
13
|
|
—
|
|
||||||
|
Loss on investments in alternative energy partnerships, net
|
—
|
|
8,493
|
|
31,510
|
|
||||||
|
Other operating expense
|
19,507
|
|
37,201
|
|
23,730
|
|
||||||
|
Total expenses
|
28,928
|
|
56,471
|
|
67,943
|
|
||||||
|
Income (loss) before income taxes and equity in undistributed (loss) earnings of subsidiaries
|
65,398
|
|
(36,186
|
)
|
(2,766
|
)
|
||||||
|
Income tax benefit
|
(9,017
|
)
|
(31,453
|
)
|
(52,989
|
)
|
||||||
|
Income (loss) before equity in undistributed earnings of subsidiaries
|
74,415
|
|
(4,733
|
)
|
50,223
|
|
||||||
|
Equity in undistributed (losses) earnings of subsidiaries
|
(28,943
|
)
|
62,442
|
|
65,193
|
|
||||||
|
Net income
|
$
|
45,472
|
|
$
|
57,709
|
|
$
|
115,416
|
|
|||
181
Condensed Statements of Cash Flows
|
Year Ended December
31,
|
||||||||||||
|
($ in thousands)
|
2018
|
2017
|
2016
|
|||||||||
|
Cash flows from operating activities:
|
||||||||||||
|
Net income
|
$
|
45,472
|
|
$
|
57,709
|
|
$
|
115,416
|
|
|||
|
Adjustments to reconcile net income to net cash provided by operating activities
|
||||||||||||
|
Equity in undistributed losses (earnings) of subsidiaries
|
28,943
|
|
(62,442
|
)
|
(65,193
|
)
|
||||||
|
Stock-based compensation expense
|
2,814
|
|
2,520
|
|
5,080
|
|
||||||
|
Amortization of debt issuance cost
|
233
|
|
247
|
|
704
|
|
||||||
|
Debt redemption costs
|
—
|
|
—
|
|
2,737
|
|
||||||
|
Gain on sale of subsidiary
|
—
|
|
—
|
|
(3,694
|
)
|
||||||
|
Deferred income tax (benefit) expense
|
(30,188
|
)
|
14,604
|
|
4,538
|
|
||||||
|
Loss on investments in alternative energy partnerships, net
|
—
|
|
8,493
|
|
31,510
|
|
||||||
|
Net change in other assets and liabilities
|
35,591
|
|
(12,957
|
)
|
(14,972
|
)
|
||||||
|
Net cash provided by operating activities
|
82,865
|
|
8,174
|
|
76,126
|
|
||||||
|
Cash flows from investing activities:
|
||||||||||||
|
Loan purchases from bank and principal collections, net
|
—
|
|
—
|
|
221
|
|
||||||
|
Proceeds from sale of subsidiary
|
—
|
|
—
|
|
259
|
|
||||||
|
Capital contribution to bank subsidiary
|
—
|
|
—
|
|
(195,000
|
)
|
||||||
|
Capital contribution to non-bank subsidiary
|
—
|
|
—
|
|
(25
|
)
|
||||||
|
Investments in alternative energy partnerships
|
—
|
|
(3,712
|
)
|
(57,149
|
)
|
||||||
|
Net cash used in investing activities
|
—
|
|
(3,712
|
)
|
(251,694
|
)
|
||||||
|
Cash flows from financing activities:
|
||||||||||||
|
Net (decrease) increase in other borrowings
|
—
|
|
(68,000
|
)
|
68,000
|
|
||||||
|
Net proceeds from issuance of common stock
|
—
|
|
—
|
|
175,078
|
|
||||||
|
Net proceeds from issuance of preferred stock
|
—
|
|
—
|
|
120,255
|
|
||||||
|
Redemption of preferred stock
|
(40,250
|
)
|
—
|
|
(42,000
|
)
|
||||||
|
Redemption of senior notes
|
—
|
|
—
|
|
(84,750
|
)
|
||||||
|
Payment of junior subordinated amortizing notes
|
—
|
|
(2,684
|
)
|
(5,078
|
)
|
||||||
|
Cash settlements of stock options
|
—
|
|
—
|
|
(359
|
)
|
||||||
|
Proceeds from exercise of stock options
|
—
|
|
2,043
|
|
—
|
|
||||||
|
Restricted stock surrendered due to employee tax liability
|
(2,366
|
)
|
(6,824
|
)
|
(4,436
|
)
|
||||||
|
Dividend equivalents paid on stock appreciation rights
|
(810
|
)
|
(810
|
)
|
(742
|
)
|
||||||
|
Dividends paid on common stock
|
(32,725
|
)
|
(25,707
|
)
|
(21,844
|
)
|
||||||
|
Dividends paid on preferred stock
|
(21,954
|
)
|
(20,451
|
)
|
(19,630
|
)
|
||||||
|
Net cash (used in) provided by financing activities
|
(98,105
|
)
|
(122,433
|
)
|
184,494
|
|
||||||
|
Net change in cash and cash equivalents
|
(15,240
|
)
|
(117,971
|
)
|
8,926
|
|
||||||
|
Cash and cash equivalents at beginning of year
|
40,496
|
|
158,467
|
|
149,541
|
|
||||||
|
Cash and cash equivalents at end of year
|
$
|
25,256
|
|
$
|
40,496
|
|
$
|
158,467
|
|
|||
|
Supplemental disclosure of noncash activities:
|
||||||||||||
|
Reclassification of stranded tax effects to retained earnings
|
$
|
496
|
|
$
|
—
|
|
$
|
—
|
|
|||
182
NOTE 26 – RELATED-PARTY TRANSACTIONS
General.
The Bank has granted loans to certain executive officers and directors and their related interests and to the Bank's affiliated entities. Excluding the loan amounts described in detail below, loans outstanding to persons who were executive officers and directors during the year ended at
December 31, 2018
and
2017
, and their related interests as well as to the Bank's affiliated entities amounted to
$0
and
$249 thousand
, respectively, at
December 31, 2018
and
2017
, all of which were performing in accordance with their respective terms as of those dates. These loans were made in the ordinary course of business and on substantially the same terms and conditions, including interest rates and collateral, as those of comparable transactions with non-insiders prevailing at the time, in accordance with the Bank’s underwriting guidelines, and do not involve more than the normal risk of collectability or present other unfavorable features.
The Bank has an Employee Loan Program which is available to all employees and offers executive officers, directors and principal stockholders that meet the eligibility requirements the opportunity to participate on the same terms as employees generally, provided that any loan to an executive officer, director or principal stockholder must be approved by the Bank’s Board of Directors. The sole benefit provided under the Employee Loan Program is a reduction in loan fees.
Deposits from executive officers, directors, and their related interests amounted to
$11.1 million
and
$2.2 million
at
December 31, 2018
and
2017
, respectively. There are certain deposits described below, which are not included in the foregoing amounts.
Transactions with Current Related Parties
The Company and the Bank have engaged in transactions described below with the Company’s directors, executive officers, and beneficial owners of more than 5 percent of the outstanding shares of the Company’s voting common stock and certain persons related to them.
Indemnification for Costs of Counsel in Connection with Special Committee Investigation, SEC Investigation and Related Matters
. On November 3, 2016, in connection with an investigation by the Special Committee of the Company’s Board of Directors, the Company Board authorized and directed the Company to provide indemnification, advancement and/or reimbursement for the costs of separate independent counsel retained by any then-current officer or director, in their individual capacity, with respect to matters related to the investigation, and to advise them on their rights and obligations with respect to the investigation. At the direction of the Company Board, this indemnification, advancement and/or reimbursement is, to the extent applicable, subject to the indemnification agreement that each officer and director previously entered into with the Company, which includes an undertaking to repay any expenses advanced if it is ultimately determined that the officer or director was not entitled to indemnification under such agreements and applicable law. In addition, the Company is providing indemnification, advancement and/or reimbursement for costs related to (i) a formal order of investigation issued by the SEC on January 4, 2017 directed primarily at certain of the issues that the Special Committee reviewed and (ii) any related civil or administrative proceedings against the Company as well as officers currently or previously associated with the Company.
During the year ended
December 31, 2018
, indemnification costs paid by the Company included
$415 thousand
incurred by the Company's General Counsel Emeritus John Grosvenor;
$854 thousand
incurred by director Halle J. Benett;
$854 thousand
incurred by director Jonah F. Schnel; and
$854 thousand
incurred by director Robert Sznewajs. Indemnification costs were paid on behalf of other executive officers and directors in lesser amounts for the year ended
December 31, 2018
.
During the year ended
December 31, 2017
, indemnification costs paid by the Company included
$501 thousand
incurred by the Company's General Counsel Emeritus John Grosvenor. Indemnification costs were paid on behalf of other executive officers
and directors in lesser amounts for the year ended
December 31, 2017
.
Company’s Sale of Shares to and Purchase of Shares from SECT
. As reported in a Schedule 13G filed with the SEC on
February 13, 2017
, Evercore Trust Company, as trustee of the SECT (which was later succeeded as trustee by Newport Trust Company, N.A.), beneficially owned
2,500,000
shares of the Company’s voting common stock as of December 31, 2016, which Evercore Trust Company stated represented more than
5 percent
of the total number of shares of the Company’s voting common stock outstanding as of that date. These shares were sold by the Company to the SECT on August 3, 2016 when the Company originally established the SECT. On December 28, 2017, in order to effectuate the early termination of the SECT, the Company purchased the
2,500,000
shares of voting common stock held by the SECT, all as more fully described in Note 18. As
reported in a Schedule 13G amendment filed with the SEC on February 2, 2018, Evercore Trust Company reported that as of December 31, 2017, it no longer beneficially owned shares of the Company’s voting common stock.
Sabal Loan
. On September 5, 2017 John A. Bogler became the Chief Financial Officer of the Company and the Bank. Mr. Bogler is a founding member, and since 2015 and up until his employment with the Company, was a board member and Chief Financial Officer, of Sabal Capital Partners, LLC. Sabal Capital Partners, LLC is the sole owner of Sabal Opportunities Fund I, LLC, which in turn is the sole owner of Sabal TL1, LLC (together, Sabal). As of September 1, 2018, Mr. Bogler had completely divested his ownership in Sabal. Effective
June 26, 2015
, the Bank provided a
$35.0 million
committed revolving repurchase facility, which was increased to
$40.0 million
effective
June 11, 2017
, to Sabal TL1, LLC, with a maximum funding amount of
183
$100.0 million
in certain situations. On June 6, 2018, the revolving repurchase facility was extended for 90 days beyond its original maturity date of June 10, 2018. The repurchase facility's outstanding balance was $
3.5 million
before it was completely paid off in August 2018. The extension was not renewed and expired on September 10, 2018.
Under the Sabal repurchase facility, commercial mortgage loans originated by Sabal were purchased from Sabal by the Bank, together with a simultaneous agreement by Sabal to repurchase the commercial mortgage loans from the Bank at a future date. The advances under the Sabal repurchase facility were secured by commercial mortgage loans that had a market value in excess of the balance of the advances under the facility. During the years ended
December 31, 2018
and
2017
, the largest aggregate amount of principal outstanding under the Sabal repurchase facility was
$32.5 million
and
$94.7 million
, respectively. The amount outstanding as of
December 31, 2018
and
2017
was
$0.0 million
and
$23.6 million
, respectively.
Interest on the outstanding balance under the Sabal repurchase facility accrued at the six month LIBOR rate plus a margin.
$210.4 million
and
$600.4 million
in principal, respectively, and
$370 thousand
and
$1.1 million
, respectively, in interest was paid by Sabal on the facility to the Bank during the years ended
December 31, 2018
and
2017
.
Underwriting Services
. Keefe, Bruyette & Woods, Inc., a Stifel company, acted as an underwriter of public offerings of the Company’s securities in 2016, and acted as financial advisor for the Company's sale of its Commercial Equipment Finance Division in 2016. Halle J. Benett, a director of the Company and the Bank, was employed as a Managing Director and Head of the Diversified Financials Group at Keefe, Bruyette & Woods, Inc. until August 31, 2016 and received compensation for certain deals that closed subsequent to August 31, 2016 that he originated or actively managed (none involving the Company or the Bank). In addition, Mr. Benett agreed to provide unpaid consulting services to Keefe, Bruyette & Woods, Inc., for a small number of transactions (none involving the Company or the Bank) through December 31, 2016.
The details of the financial advisory services are as follows:
|
•
|
On
October 27, 2016
, the Company sold its Commercial Equipment Finance Division to Hanmi Bank, a wholly- owned subsidiary of Hanmi Financial Corporation (Hanmi). Beginning on February 1, 2016, Keefe, Bruyette & Woods provided financial advisory and investment banking services to the Company with respect the possible sale of the division and, contingent upon the closing of the sale, received a non-refundable contingent fee from the Company of
$516 thousand
(less expenses, the amount was
$500 thousand
).
|
The details of the underwritten public offerings are as follows:
|
•
|
On
March 8, 2016
, the Company issued and sold
5,577,500
shares of its voting common stock. Pursuant to an underwriting agreement entered into with the Company for that offering on
March 2, 2016
, Keefe, Bruyette & Woods, Inc. received gross underwriting fees and commissions from the Company of approximately
$1.0 million
(less estimated expenses, the amount was
$846 thousand
).
|
|
•
|
On
February 8, 2016
, the Company issued and sold
5,000,000
depositary shares (Series E Depositary Shares) each representing a 1/40
th
ownership interest in a share of
7.00 percent
Non-Cumulative Perpetual Preferred Stock, Series E, with a liquidation preference of
$1,000
per share (equivalent to
$25
per depositary share). Pursuant to an underwriting agreement entered into with the Company for that offering on
February 1, 2016
, Keefe, Bruyette & Woods, Inc. received gross underwriting fees and commission from the Company of approximately
$944 thousand
(less estimated expenses, the amount was
$849 thousand
).
|
Legion Affiliates
. As reported in a Schedule 13D amendment filed with the SEC on
May 23, 2017
, Legion Partners Asset Management, LLC (Legion Partners), Legion Partners, L.P. I, Legion and its affiliates (collectively, the Legion Group) beneficially owned
2,938,679
shares of the Company’s voting common stock as of
May 19, 2017
, which the Legion Group reported represented
5.6 percent
of the Company’s total shares outstanding. As reported in a Schedule 13D amendment filed with the SEC on April 26, 2018, the Legion Group beneficially owned
2,439,751
shares of the Company’s voting common stock as of that date, which the Legion Group reported represented
4.8 percent
of the Company’s total shares outstanding. According to a Form 13-F filed with the SEC on February 14, 2019, the Legion Group no longer held any shares of the Company’s voting common stock as of December 31, 2018.
Cooperation Agreement
. On March 13, 2017, the Company entered into a cooperation agreement with the Legion Group (the Legion Group Cooperation Agreement). Under the terms of such agreement, among other things:
|
•
|
The Legion Group agreed to irrevocably withdraw its notice of director nomination and submission of a business proposal.
|
|
•
|
The Company agreed to conduct a search for two additional independent directors in collaboration with the Legion Group. In accordance with this provision, following a search initiated by the Company Board and (following entry into the Legion Group Cooperation Agreement) conducted in consultation with Legion Group, the Company Board appointed Mary A. Curran and Bonnie G. Hill as new independent directors, for terms that became effective on June 9, 2017 at the conclusion of the Company's 2017 Annual Meeting of Stockholders. Ms. Curran is serving as a Class I director, for a term to expire at the Company’s 2019 Annual Meeting of Stockholders. Dr. Hill's initial term
|
184
as a director expired at the Company's 2018 Annual Meeting of Stockholders, at which she was re-elected for a one year term to expire at the Company’s 2019 Annual Meeting of Stockholders. Simultaneously with the effectiveness of their appointments to the Company Board, each of Ms. Curran and Dr. Hill was appointed as a director of the Bank.
|
•
|
From March 13, 2017 until June 10, 2017, the day after the Company’s 2017 Annual Meeting, the Legion Group agreed to vote all the shares of the Company's voting common stock that it beneficially owned (i) in favor of the Company’s slate of directors, (ii) against any stockholder’s nominations for directors not approved and recommended by the Board and against any proposals or resolutions to remove any director and (iii) in accordance with the Board’s recommendations on all other proposals of the Board set forth in the Company’s proxy statement.
|
|
•
|
The Legion Group agreed to certain standstill provisions that restricted the Legion Group and its affiliates, associates and representatives, from March 13, 2017 until June 10, 2017, from, among other things, acquiring additional voting securities of the Company that would result in the Legion Group having ownership or voting interest in
10 percent
or more of the outstanding shares of voting common stock, engaging in proxy solicitations in an election contest, subjecting any shares to any voting arrangements except as expressly provided in the Legion Group Cooperation Agreement, making or being a proponent of a stockholder proposal, seeking to call a meeting of stockholders or solicit consents from stockholders, seeking to obtain representation on the Board except as otherwise expressly provided in the Legion Group Cooperation Agreement, seeking to remove any director from the Board, seeking to amend any provision of the governing documents of the Company, or proposing or participating in certain extraordinary corporate transactions involving the Company.
|
|
•
|
The Company agreed to reimburse the Legion Group up to
$100 thousand
for its legal fees and expenses incurred in connection with its investment in the Company.
|
PL Capital Affiliates
. As reported in a Schedule 13D amendment filed with the SEC on
February 10, 2017
, PL Capital Advisors, LLC (PL Capital Advisors) and certain of its affiliates (collectively, the PL Capital Group) owned
3,427,219
shares of the Company’s voting common stock as of
February 7, 2017
, which the PL Capital Group reported represented
6.9 percent
of the Company’s total shares outstanding.
Cooperation Agreement
. On February 7, 2017, Richard J. Lashley, a co-founder of PL Capital Advisors, LLC, was appointed to the Boards of Directors of the Company and the Bank, which appointments became effective February 16, 2017. Mr. Lashley was appointed as a Class I director of the Company, for a term that will expire at the Company’s 2019 Annual Meeting of Stockholders. In connection with the appointment of Mr. Lashley to the Boards, on February 8, 2017, the PL Capital Group and Mr. Lashley entered into a cooperation agreement with the Company (PL Capital Cooperation Agreement), in which PL Capital Group agreed, among other matters:
|
•
|
From February 8, 2017 until June 10, 2017 (PL Capital Restricted Period), the PL Capital Group agreed to vote all the shares of Common Stock that it beneficially owned (i) in favor of the Company’s slate of directors, (ii) against any stockholder’s nominations for directors not approved and recommended by the Company’s Board and against any proposals or resolutions to remove any director and (iii) in accordance with the recommendations by the Company’s Board on all other proposals of the Company’s Board set forth in the Company’s proxy statement.
|
|
•
|
In addition, during the PL Capital Restricted Period, the PL Capital Group agreed to certain standstill provisions that restricted the PL Capital Group and its affiliates, associates and representatives, during the PL Capital Restricted Period, from, among other things, acquiring additional voting securities of the Company that would result in the PL Capital Group having ownership or voting interest in
10 percent
or more of the outstanding shares of voting common stock, engaging in proxy solicitations in an election contest, subjecting any shares to any voting arrangements except as expressly provided in the PL Capital Cooperation Agreement, making or being a proponent of a stockholder proposal, seeking to call a meeting of stockholders or solicit consents from stockholders, seeking to obtain representation on the Company’s Board except as otherwise expressly provided in the PL Capital Cooperation Agreement, seeking to remove any director from the Company’s Board, seeking to amend any provision of the governing documents of the Company, or proposing or participating in certain extraordinary corporate transactions involving the Company.
|
|
•
|
Pursuant to the PL Capital Cooperation Agreement, during the three months ended March 31, 2017, the Company reimbursed PL Capital Group
$150 thousand
for a portion of its legal fees and expenses incurred in connection with its investment in the Company.
|
Patriot Affiliates
. As reported in a Schedule 13D amendment filed with the SEC on
November 10, 2014
, Patriot’s last public filing reporting ownership of the Company’s securities, Patriot Financial Partners, L.P. (together with its affiliates referred to as Patriot Partners) owned
3,100,564
shares of the Company’s voting common stock as of
November 7, 2014
, which Patriot Partners reported represented
9.3 percent
of the Company’s outstanding voting common stock as of that date. For the details of the transaction in which Patriot Partners acquired certain of these shares, see
“Securities Purchase Agreement with Patriot”
below. As indicated below, W. Kirk Wycoff, a managing partner of Patriot Partners, was appointed to the Boards of Directors of
185
the Company and the Bank. On
December 6, 2018
Mr. Wycoff filed a Form 4 with the SEC which reported total holdings for Patriot Partners of
1,461,945
shares.
Director
.
On February 9, 2017, Mr. Wycoff was appointed to the Boards of Directors of the Company and the Bank, which appointment became effective on February 16, 2017. Mr. Wycoff was appointed as a Class III director of the Company, for an initial term that expired at the Company’s 2018 Annual Meeting of Stockholders, at which Mr. Wycoff was re-elected for a one-year term to expire at the Company’s 2019 Annual Meeting of Stockholders.
From 2010 to 2015, Mr. Wycoff was a director of, and Patriot Partners was a stockholder of, Square 1 Financial, Inc. (Square 1). Douglas H. Bowers, who became President and Chief Executive Officer of the Company and the Bank and a director of the Bank effective May 8, 2017 and a director of the Company on June 9, 2017 at the conclusion of the Company’s 2017 Annual Meeting of Stockholders, served as President and Chief Executive Officer of Square 1 from 2011 to 2015. There are no arrangements or understandings between Mr. Bowers and either Mr. Wycoff or Patriot Partners pursuant to which Mr. Bowers was selected as a director and an officer of the Company.
Securities Purchase Agreement with Patriot
.
As noted above, as reported in a Schedule 13D amendment filed on
November 10, 2014
with the SEC, Patriot Partners owned
3,100,564
shares of the Company’s voting common stock as of
November 7, 2014
, which Patriot Partners reported represented
9.3 percent
of the Company’s total shares outstanding as of the dates set forth in the Schedule 13D. On April 22, 2014, the Company entered into a Securities Purchase Agreement (Patriot SPA) with Patriot Partners to raise a portion of the capital to be used to finance the acquisition of select assets and assumption of certain liabilities by the Bank from Banco Popular North America (BPNA) comprising BPNA's network of
20
California Branches (the BPNA Branch Acquisition), which was completed on November 8, 2014. The Patriot SPA was due to expire by its terms on October 31, 2014. Prior to such expiration, the Company and Patriot Partners entered into a Securities Purchase Agreement, dated as of October 30, 2014 (New Patriot SPA). Pursuant to the New Patriot SPA, substantially concurrently with the BPNA Branch Acquisition, Patriot Partners purchased from the Company (i)
1,076,000
shares of the Company's voting common stock at a price of
$9.78
per share and (ii)
824,000
shares of the Company's voting common stock at a price of
$11.55
per share, for an aggregate purchase price of
$20.0 million
. In consideration for Patriot Partners’ commitment under the New SPA and pursuant the terms of the New SPA, on the closing of the sale of such shares on November 7, 2014, the Company paid Patriot Partners an equity support payment of
$538 thousand
and also reimbursed Patriot Partners
$100 thousand
in out-of-pocket expenses.
On October 30, 2014, concurrent with the execution of the New Patriot SPA, Patriot and the Company entered into a Settlement Agreement and Release (the Patriot Settlement Agreement) in order to resolve, without admission of any wrongdoing by either party, a prior dispute regarding, among other things, the proper interpretation of certain provisions of the SPA, including but not limited to the computation of the purchase price per share (the Dispute).
Pursuant to the Patriot Settlement Agreement, Patriot and the Company released any claims they may have had against the other party with respect to the Dispute. In addition, Patriot and the Company agreed for the period beginning on the date of the Patriot Settlement Agreement and ending on December 31, 2016, that neither Patriot nor the Company would disparage the other party or its affiliates.
During the period beginning on the date of the Patriot Settlement Agreement and ending on December 31, 2016, Patriot also agreed not to:
|
•
|
institute, solicit, assist or join, as a party, any proxy solicitation, consent solicitation, board nomination or director removal relating to the Company against or involving the Company or any of its subsidiaries, affiliates, successors, assigns, directors, officers, employees, agents, attorneys or financial advisors;
|
|
•
|
take any action relative to the governance of the Company that would violate its passivity commitments or vote the shares of voting common stock held or controlled by it on any matters related to the election, removal or replacement of directors or the calling of any meeting related thereto, other than in accordance with management’s recommendations included in the Company’s proxy statement for any annual meeting or special meeting;
|
|
•
|
form or join in a partnership, limited partnership, syndicate or other group, or solicit proxies or written consents of stockholders or conduct any other type of referendum (binding or non-binding) with respect to, or from the holders of, the voting common stock and any other securities of the Company entitled to vote in the election of directors, or securities convertible into, or exercisable or exchangeable for, voting common stock or such other securities (such other securities, together with the voting common stock, being referred to as Voting Securities), or become a participant in or assist, encourage or advise any person in any solicitation of any proxy, consent or other authority to vote any Voting Securities; or
|
186
|
•
|
enter into any negotiations, agreements, arrangements or understandings with any person with respect to any of the foregoing or advise, assist, encourage or seek to persuade any person to take any action with respect to any of the foregoing.
|
The Company also agreed, during the same period, not to:
|
•
|
institute, solicit, assist or join, as a party, any proxy solicitation, consent solicitation, board nomination or director removal relating to Patriot against or involving Patriot or any of its subsidiaries, affiliates, successors, assigns, officers, partners, principals, employees, agents, attorneys or financial advisors; or
|
|
•
|
enter into any negotiations, agreements, arrangements or understandings with any person with respect to any of the foregoing or advise, assist, encourage or seek to persuade any person to take any action with respect to any of the foregoing.
|
Transactions with Former Related Parties
In addition to the transactions described above with former related parties, the Company and the Bank have engaged in transactions described below with the Company’s then (now former) directors, executive officers, and beneficial owners of more than 5 percent of the outstanding shares of the Company’s voting common stock and certain persons related to them.
Indemnification for Costs of Counsel for Former Executive Officers and Former Directors in Connection with Special Committee Investigation, SEC Investigation and Related Matters
. On November 3, 2016, in connection with the investigation by the Special Committee of the Company's Board of Directors, the Company Board authorized and directed the Company to provide indemnification, advancement and/or reimbursement for the costs of separate independent counsel retained by any then-current officer or director, in their individual capacity, with respect to matters related to the investigation, and to advise them on their rights and obligations with respect to the investigation. At the direction of the Company Board, this indemnification, advancement and/or reimbursement is, to the extent applicable, subject to the indemnification agreement that each officer and director previously entered into with the Company, which includes an undertaking to repay any expenses advanced if it is ultimately determined that the officer or director was not entitled to indemnification under such agreements and applicable law. In addition, the Company is also providing indemnification, advancement and/or reimbursement for costs related to (i) a formal order of investigation issued by the SEC on January 4, 2017 directed primarily at certain of the issues that the Special Committee reviewed and (ii) any related civil or administrative proceedings against the Company as well as officers currently or previously associated with the Company.
During the year ended
December 31, 2018
, indemnification costs paid by the Company included
$8.5 million
incurred by the Company’s former Chair, President and Chief Executive Officer Steven A. Sugarman;
$497 thousand
incurred by the Bank’s former Management Vice Chair Jeffrey T. Seabold;
$400 thousand
jointly incurred by the Company’s former Interim Chief Financial Officer and Chief Strategy Officer J. Francisco A. Turner and the Company’s former Chief Financial Officer James J. McKinney;
$292 thousand
incurred by the Bank’s former director Cynthia Abercrombie; and
$854 thousand
incurred by the Company’s former director Jeffrey Karish. Indemnification costs were paid on behalf of other former executive officers and other former directors in lesser amounts for the year ended
December 31, 2018
.
During the year ended December 31, 2017 (excluding indemnification costs paid in January 2017), indemnification costs paid by the Company included
$3.0 million
incurred by Mr. Sugarman;
$1.4 million
incurred by Mr. Seabold;
$631 thousand
jointly incurred by the Company’s former Interim Chief Financial Officer and Chief Strategy Officer J. Francisco A. Turner and the Company’s former Chief Financial Officer James J. McKinney; and
$509 thousand
incurred by the Company’s former director Chad Brownstein. Indemnification costs were paid on behalf of other former executive officers and other former directors in lesser amounts for the year ended December 31, 2017 (excluding fees paid in January 2017).
For the year ended December 31, 2016, indemnification costs incurred under the arrangement described above (which were paid in January 2017) included
$573 thousand
incurred by Mr. Sugarman;
$57 thousand
incurred by Mr. Seabold;
$135 thousand
incurred jointly by Messrs. Turner and McKinney; and
$29 thousand
incurred by Mr. Brownstein. Indemnification was paid on behalf of other former executive officers and former directors in lesser amounts for the years ended December 31, 2016 (which were paid in January 2017).
Settlement Agreement
. On September 5, 2017, Jeffrey T. Seabold, the Bank’s former Management Vice Chair, submitted a notice of termination of employment pursuant to his employment agreement with the Bank and, that same day, filed a complaint in the Superior Court of the State of California, County of Los Angeles, against the Company and the Bank and multiple unnamed defendants asserting claims for breach of contract, wrongful termination, retaliation and unfair business practices. On January 19, 2018, the parties reached a settlement in principle through mediation and a final settlement agreement was entered into by the Company, the Bank and Mr. Seabold on February 14, 2018 (the Settlement Agreement).
Under the Settlement Agreement, which provides for a mutual release of claims and the dismissal of Mr. Seabold’s complaint with prejudice, Mr. Seabold received lump sum cash payments from the Company and the Bank aggregating
$4.3 million
, less applicable withholdings for the portions of such payments representing employee compensation. Included within this amount
187
are cash payments totaling
$576 thousand
representing a benefit with respect to Mr. Seabold's unvested stock options and restricted stock awards. Mr. Seabold also received a cash payment of
$38 thousand
as reimbursement for his premiums for health care coverage for the period October 1, 2017 through March 2019. In addition, in accordance with the Settlement Agreement the Bank paid
$650 thousand
of attorneys’ fees incurred by Mr. Seabold in connection with his lawsuit and the Settlement Agreement. All the cash payments to Mr. Seabold under the Settlement Agreement were made during the three months ended March 31, 2018. The Settlement Agreement contains certain standstill provisions that, prior to December 31, 2018, generally restrict Mr. Seabold and his affiliates from, among other things, acquiring beneficial ownership of any shares of the Company’s common stock or common stock equivalents to the extent this would result in Mr. Seabold beneficially owning in excess of
4.99 percent
of the total number of shares of common stock outstanding, soliciting proxies in opposition to any matter not recommended by the Company’s Board of Directors or in favor of any matter not approved by the Company’s Board of Directors or initiating any stockholder proposal.
Banc of California Stadium Naming Rights and Sponsorship and Los Angeles Football Club Loans
. Effective
August 8, 2016
, the Bank provided
$40.3 million
out of a
$145.0 million
committed construction line of credit (the Stadco Loan) to LAFC Stadium Co, LLC (Stadco) for the construction of a soccer-specific stadium for the LAFC in Los Angeles, California as well as to fund the interest and fees that become due under the Stadco Loan. LAFC is a Major League Soccer expansion franchise that debuted at the beginning of 2018. Also effective
August 8, 2016
, the Bank provided
$9.7 million
out of a
$35.0 million
committed senior secured line of credit (the Team Loan) to LAFC Sports, LLC (Team) to fund distributions to LAFC Partners, LLLP (Holdco) that will be used for stadium construction, funding interest and fees that become due under such Team Loan and to pay all other fees, costs and expenses payable by the Team in connection with project costs related to the stadium construction.
All of the outstanding equity interests in Stadco and Team are held by Holdco, and Holdco serves as sole guarantor of the Team Loan described above. At the time the Stadco Loan and Team Loan were underwritten, minority limited partnership interests in Holdco were held by, among others: (i) Jason Sugarman, who is the brother of the Company’s and the Bank’s then- (now former) Chairman, President and Chief Executive Officer, Steven A. Sugarman; and (ii) Jason Sugarman’s father-in-law, who served during 2016 (and may continue to serve) as Executive Chairman and a member of Holdco’s board of directors, which was (and may continue to be) appointed by Holdco’s general partner and primarily functions in an advisory capacity. The foregoing statements are based primarily on information provided to the Company by Holdco through its legal counsel.
As of
December 31, 2018
and
2017
, there were
$0
and
$23.3 million
outstanding advances, respectively, by the Bank under the Stadco Loan. On August 30, 2018, all outstanding advances under Stadco Loan were paid off. The Bank collected
$66 thousand
and
$295 thousand
, respectively, in unused loan fees during the years ended
December 31, 2018
and
2017
. Interest on the outstanding balance under the Stadco Loan accrues at LIBOR plus a margin. During the years ended
December 31, 2018
and
2017
,
$1.1 million
and
$325 thousand
interest, respectively, was paid by Stadco to the Bank on the Stadco Loan.
As of
December 31, 2018
and
2017
, there were
$0
and
$5.4 million
outstanding advances, respectively, by the Bank under Team Loan. The Bank collected
$22 thousand
and
$140 thousand
, respectively, in unused loan fees during the years ended
December 31, 2018
and
2017
. Interest on the outstanding balance under the Team Loan accrues at LIBOR plus a margin. During the years ended
December 31, 2018
and
2017
,
$471 thousand
and
$83 thousand
interest, respectively, was paid by Team to the Bank on the Team Loan.
Team obtained a corporate credit card with a
$100 thousand
line of credit from a third party unaffiliated with the Bank. Effective November 24, 2017, the Bank provided a guaranty for the card by obtaining a standby letter of credit issued by another institution unaffiliated with the Bank in the amount of
$100 thousand
for the benefit of the issuer of the credit card. This letter of credit had never been drawn upon and was terminated during the quarter ended June 30, 2018.
Following the closing of the Stadco Loan and the Term Loan, the Bank on August 22, 2016 reached agreement with the Team concerning, among other things, the Bank’s right to name the stadium to be operated by Stadco as “Banc of California Stadium.” The August 22, 2016 agreement, which contemplated the negotiation and execution of more detailed definitive agreements between the Bank, on the one hand, and Stadco and the Team on the other hand (LAFC Transaction), also included a sponsorship relationship between the Bank and the Team with an initial term ending on the completion date of LAFC’s
15
th full Major League Soccer (MLS) season, and the Bank having a right of first offer to extend the term for an additional
10
years (LAFC Term). On February 28, 2017, the Bank executed more detailed definitive agreements with LAFC and Stadco relating to the LAFC Transaction, which are subject to MLS rules and/or approval (the LAFC Agreements).
The LAFC Agreements provide that, during the LAFC Term, the Bank has the exclusive right to name the Banc of California Stadium and has the right to be the exclusive provider of financial services to (and the exclusive financial services sponsor of) the Team and Stadco. In connection with its right to name the Banc of California Stadium, the Bank will receive, among other rights, signage (including prominent exterior signage) and related branding rights throughout the exterior and interior of the Banc of California Stadium facility (including exclusive branding rights within certain designated areas and venues within the facility), receives the right to locate a Bank branch within the Banc of California Stadium facility, and the exclusive right to install and operate ATMs in the Banc of California Stadium facility, receives the exclusive right to process payments and
188
provide other financial services (with certain exceptions) throughout the facility. In addition, the Bank receives suite access for LAFC and certain other events held at the Banc of California Stadium and receives certain hospitality, event, media and other rights ancillary to its naming rights relating to the Banc of California Stadium and its sponsorship rights relating to the Team. In conjunction with the LAFC Agreements, the Company decreased its other planned marketing and sponsorship expenses.
In exchange for the Bank’s rights as set forth in the LAFC Agreements, the Bank (i) paid the Team
$10.0 million
on March 31, 2017 and (ii) has agreed to pay the following annual aggregate amounts: for the Team’s 2018 MLS season,
$5.3 million
; for 2019,
$5.4 million
; for 2020,
$5.5 million
; for 2021,
$5.6 million
; for 2022,
$5.7 million
; for 2023,
$5.8 million
; for 2024,
$5.9 million
; for 2025,
$6.0 million
; for 2026,
$6.1 million
; for 2027,
$6.2 million
; for 2028,
$6.3 million
; for 2029,
$6.4 million
; for 2030,
$6.5 million
; for 2031,
$6.6 million
; and for 2032,
$6.7 million
. The advertising benefits of such rights are amortized
on a straight-line basis and recorded as advertising expense beginning in 2018. During the year ended
December 31, 2018
, the Bank paid
$5.3 million
for the Team's 2018 MLS season and the related advertising and promotion expense recorded
was
$6.7 million
. As of December 31, 2018, the Bank has paid
$15.3 million
of the
$100.0 million
commitment. The prepaid
commitment balance, net of amortization, was
$8.7 million
as of December 31, 2018, which was recognized as a prepaid asset
and included in Other Assets in the Consolidated Statements of Financial Condition.
As of
December 31, 2018
and
2017
, the various entities affiliated with LAFC held
$19.4 million
and
$33.1 million
, respectively, of deposits at the Bank.
Legal Fees and Other Matters.
During July 2017, the Company and the Bank became aware that the former Chair, President and Chief Executive Officer of the Company and the Bank, Steven A. Sugarman, became of counsel to Michelman & Robinson, LLP, a law firm that previously provided legal services to the Bank. For legal services that were performed for the Bank over a period of more than four months, the Bank paid Michelman & Robinson, LLP approximately
$330 thousand
in fees during the three months ended March 31, 2017. No legal services were provided and
$0
was paid to Michelman & Robinson, LLP from April 1, 2017 to December 31, 2018. Michelman & Robinson, LLP previously had
three
outstanding letters of credit with the Bank,which were issued under a line of credit that was originally extended to Michelman & Robinson, LLP prior to 2008. All three letters of credit were canceled in February 2018, and none were drawn upon as of December 31, 2017 or subsequent to that date. Michelman & Robinson, LLP elected to pay in full all outstanding borrowings under the line of credit in June 2017 and, thereafter, the line of credit was terminated. During the three months ended March 31, 2017, the Bank reimbursed Michelman & Robinson, LLP
$100 thousand
in connection with a matter concerning funds wired by a third party to a deposit account Michelman & Robinson, LLP held at the Bank.
Consulting Agreement for the Bank.
On August 4, 2016, the Bank entered into a Management Services Agreement with Carlos Salas, who was, at the time, the Chief Executive Officer of COR Clearing LLC (COR Clearing) and Chief Financial Officer of COR Securities Holding, Inc. (CORSHI). Steven A. Sugarman, the then- (now former) Chairman, President and Chief Executive Officer of the Company and the Bank, is believed by the Company to be the Chief Executive Officer, as well as a controlling equity owner, of both COR Clearing and CORSHI. For management consulting and advisory services provided to the Bank through the termination of the Management Services Agreement on November 30, 2016, Mr. Salas earned
$108 thousand
in fees. On December 1, 2016, Mr. Salas became a full-time employee of the Bank and tendered his resignation from his positions as Chief Executive Officer of COR Clearing and Chief Financial Officer of CORSHI effective upon the orderly transition of his duties, but in no case later than March 31, 2017. Mr. Salas earned
$17 thousand
as a full time employee of the Bank during the year ended December 31, 2016. Mr. Salas separated from the Bank on February 1, 2017.
CS Financial Acquisition
. Effective October 31, 2013, the Company acquired CS Financial, which was controlled by Jeffrey T. Seabold and in which certain relatives of Steven A. Sugarman (the then- (now former) Chairman, President and Chief Executive Officer of the Company and the Bank) directly or through their affiliated entities also owned certain minority, non-controlling interests. Mr. Seabold previously served as Management Vice Chair of the Bank and also held prior positions as a director of the Company and the Bank; on September 5, 2017, Mr. Seabold submitted a notice of termination of employment as Management Vice Chair of the Bank pursuant to his employment agreement with the Bank effective immediately. The Company’s acquisition of CS Financial (the CS Financial Merger) was effected pursuant to an Agreement and Plan of Merger (the CS Financial Merger Agreement) with CS Financial, the stockholders of CS Financial (Sellers) and Mr. Seabold, as the Sellers’ Representative.
Subject to the terms and conditions set forth in the CS Financial Merger Agreement, which was approved by the Board of Directors of each of the Company, the Bank and CS Financial, at the effective time of the CS Financial Merger, the outstanding shares of common stock of CS Financial were converted into the right to receive in the aggregate: (i) upon the closing of the CS Financial Merger, (a)
173,791
shares (Closing Date Shares) of voting common stock, par value
$0.01
per share, of the Company, and (b)
$1.5 million
in cash and
$3.2 million
in the form of a noninterest-bearing note issued by the Company to Mr. Seabold that was due and paid by the Company on January 2, 2014; and (i) upon the achievement of certain performance targets by the Bank’s lending activities following the closing of the CS Financial Merger that are set forth in the CS Financial Merger Agreement, up to
92,781
shares (Performance Shares) of voting common stock ((i) and (ii), together, CS Financial Merger Consideration).
189
The Sellers under the CS Financial Merger Agreement included Mr. Seabold, and the following relatives of Steven A. Sugarman: Jason Sugarman (brother), Elizabeth Sugarman (sister-in-law), and Michael Sugarman (father), who each owned minority, non-controlling interests in CS Financial. Upon the closing of the CS Financial Merger and pursuant to the terms of the CS Financial Merger Agreement, the aggregate shares of voting common stock issued as the consideration to the Sellers was
173,791
shares, which was allocated by the Sellers and issued as follows: (i)
103,663
shares to Mr. Seabold; (ii)
16,140
shares to Jason Sugarman; (iii)
16,140
shares to Elizabeth Sugarman; (iv)
3,228
shares to Michael Sugarman; and (v)
34,620
shares to certain employees of CS Financial. Of the
103,663
shares to be issued to Mr. Seabold, as allowed under the CS Financial Merger Agreement and in consideration of repayment of a certain debt incurred by CS Financial owed to an entity controlled by Elizabeth Sugarman, Mr. Seabold requested the Company to issue all
103,663
shares directly to Elizabeth Sugarman, and such shares were so issued by the Company to Elizabeth Sugarman.
On October 31, 2014, certain of the Performance Shares were issued as follows: (i)
28,545
shares to Mr. Seabold; (ii)
1,082
shares to Jason Sugarman; (iii)
1,082
shares to Elizabeth Sugarman; and (iv)
216
shares to Michael Sugarman. An additional portion of the Performance Shares was issued on November 2, 2015 as follows: (i)
28,545
shares to Mr. Seabold; (ii)
1,082
shares to Jason Sugarman; (iii)
1,082
shares to Elizabeth Sugarman; and (iv)
216
shares to Michael Sugarman. The final tranche of the Performance Shares were issued on October 31, 2016 as follows: (i)
28,547
shares to Mr. Seabold; (ii)
1,083
shares to Jason Sugarman; (iii)
1,083
shares to Elizabeth Sugarman and (iv)
218
shares to Michael Sugarman.
All decisions and actions with respect to the CS Financial Merger Agreement and the CS Financial Merger (including without limitation the determination of the CS Financial Merger Consideration and the other material terms of the CS Financial Merger Agreement) were under the purview and authority of special committees of the Board of Directors of each of the Company and the Bank, each of which was composed exclusively of independent, disinterested directors of the Boards of Directors, with the assistance of outside financial and legal advisors. Mr. Sugarman abstained from the vote of each of the Boards of Directors of the Company and the Bank to approve the CS Financial Merger Agreement and the CS Financial Merger.
NOTE 27 – LITIGATION
From time to time we are involved as plaintiff or defendant in various legal actions arising in the normal course of business. In accordance with applicable accounting guidance, the Company establishes an accrued liability when those matters present loss contingencies that are both probable and estimable. The Company continues to monitor the matter for further developments that could affect the amount of the accrued liability that has been previously established. As of
December 31, 2018
, the Company accrued
$781 thousand
for various litigation filed against the Company and the Bank.
The Company was named as a defendant in several complaints filed in the United States District Court for the Central District of California in January 2017 alleging violations of sections 10(b) and 20(a) of the Securities Exchange Act of 1934. The complaints were brought as purported class actions on behalf of stockholders who purchased shares of the Company’s common stock between varying dates, inclusive of August 7, 2015 through January 23, 2017. Those actions were consolidated, a lead plaintiff was appointed, and the lead plaintiff filed a Consolidated Amended Complaint on May 31, 2017. The defendants moved to dismiss the Consolidated Amended Complaint. On September 18, 2017, the district court granted in part and denied in part Defendants’ motions to dismiss. Specifically, the court denied the defendants’ motions as to the Company’s April 15, 2016 Proxy Statement which listed the positions held by Steven A. Sugarman (the Company’s then (now former) Chairman, President and Chief Executive Officer) with COR Securities Holdings Inc., COR Clearing LLC, and COR Capital LLC while omitting their alleged connections with Jason Galanis. Trial is currently set for October
21, 2019. The Company believes that the action is without merit and intends to vigorously contest it.
On September 26, 2017, a shareholder derivative action captioned Gordon v. Sznewajs, Case No. 17-CV-1678, was filed in the United States District Court for the Central District of California against four of the Company’s directors (Robert D. Sznewajs, Halle J. Benett, Jonah F. Schnel and now former director Jeffrey Karish) alleging that they breached their fiduciary duties to the Company. In that action, the Company is a nominal defendant. The complaint seeks monetary and equitable relief on behalf of the Company. The Company believes that the shareholder was required to, but failed to, make a demand on the Company to bring such claims, and that this failure requires dismissal of the action. The Company filed a motion to dismiss on those grounds. Rather than oppose the Company’s motion, plaintiff elected to file an amended complaint. The amended complaint was filed on February
6, 2018, which added Richard J. Lashley, Doug H. Bowers and John Grosvenor as individual defendants, and which added purported claims for gross negligence and unjust enrichment. The Company filed a motion to dismiss the amended complaint. That motion was granted and the action was dismissed on June 22, 2018.
On September 5, 2017, Jeffrey T. Seabold, a former officer of the Company and the Bank, filed a complaint in the Los Angeles Superior Court against the Company and multiple unnamed defendants asserting claims for breach of contract, wrongful termination, retaliation and unfair business practices. Mr. Seabold alleges that he was constructively terminated as a Company
190
and Bank employee and seeks in excess of
$5 million
in damages. On January
19, 2018, the parties reached a settlement in principle through mediation and a final settlement agreement was executed on February
14, 2018. The settlement did not have a material adverse effect on our financial condition, results of operations or liquidity.
191
NOTE 28 – QUARTERLY RESULTS OF OPERATIONS (UNAUDITED)
The following table presents the unaudited quarterly results of operations for the year ended
December 31, 2018
:
|
Three Months Ended,
|
||||||||||||||||
|
($ in thousands, except per share data)
|
March
31, 2018
|
June
30, 2018
|
September
30, 2018
|
December
31, 2018
|
||||||||||||
|
Interest income
|
$
|
98,707
|
|
$
|
105,185
|
|
$
|
107,774
|
|
$
|
111,130
|
|
||||
|
Interest expense
|
27,269
|
|
32,421
|
|
36,582
|
|
40,448
|
|
||||||||
|
Net interest income
|
71,438
|
|
72,764
|
|
71,192
|
|
70,682
|
|
||||||||
|
Provision for loan losses
|
19,499
|
|
2,653
|
|
1,410
|
|
6,653
|
|
||||||||
|
Noninterest income
|
8,582
|
|
8,061
|
|
4,824
|
|
2,448
|
|
||||||||
|
Noninterest expense
|
59,800
|
|
62,539
|
|
60,877
|
|
49,569
|
|
||||||||
|
Income from continuing operations before income taxes
|
721
|
|
15,633
|
|
13,729
|
|
16,908
|
|
||||||||
|
Income tax (benefit) expense
|
(6,353
|
)
|
1,779
|
|
3,301
|
|
6,117
|
|
||||||||
|
Income from continuing operations
|
7,074
|
|
13,854
|
|
10,428
|
|
10,791
|
|
||||||||
|
Income from discontinued operations before income taxes
|
2,044
|
|
1,281
|
|
924
|
|
347
|
|
||||||||
|
Income tax expense
|
560
|
|
355
|
|
256
|
|
100
|
|
||||||||
|
Income from discontinued operations
|
1,484
|
|
926
|
|
668
|
|
247
|
|
||||||||
|
Net income
|
8,558
|
|
14,780
|
|
11,096
|
|
11,038
|
|
||||||||
|
Dividends on preferred stock
|
5,113
|
|
5,113
|
|
4,970
|
|
4,308
|
|
||||||||
|
Impact of preferred stock redemption
|
—
|
|
—
|
|
2,307
|
|
—
|
|
||||||||
|
Net income available to common stockholders
|
$
|
3,445
|
|
$
|
9,667
|
|
$
|
3,819
|
|
$
|
6,730
|
|
||||
|
Basic earnings per common share
|
||||||||||||||||
|
Income from continuing operations
|
$
|
0.03
|
|
$
|
0.17
|
|
$
|
0.06
|
|
$
|
0.12
|
|
||||
|
Income from discontinued operations
|
0.03
|
|
0.02
|
|
0.01
|
|
0.01
|
|
||||||||
|
Net income
|
$
|
0.06
|
|
$
|
0.19
|
|
$
|
0.07
|
|
$
|
0.13
|
|
||||
|
Diluted earnings per common share
|
||||||||||||||||
|
Income from continuing operations
|
$
|
0.03
|
|
$
|
0.16
|
|
$
|
0.06
|
|
$
|
0.12
|
|
||||
|
Income from discontinued operations
|
0.03
|
|
0.02
|
|
0.01
|
|
0.01
|
|
||||||||
|
Net income
|
$
|
0.06
|
|
$
|
0.18
|
|
$
|
0.07
|
|
$
|
0.13
|
|
||||
|
Basic earnings per class B common share
|
||||||||||||||||
|
Income from continuing operations
|
$
|
0.03
|
|
$
|
0.17
|
|
$
|
0.06
|
|
$
|
0.12
|
|
||||
|
Income from discontinued operations
|
0.03
|
|
0.02
|
|
0.01
|
|
0.01
|
|
||||||||
|
Net income
|
$
|
0.06
|
|
$
|
0.19
|
|
$
|
0.07
|
|
$
|
0.13
|
|
||||
|
Diluted earnings per class B common share
|
||||||||||||||||
|
Income from continuing operations
|
$
|
0.03
|
|
$
|
0.17
|
|
$
|
0.06
|
|
$
|
0.12
|
|
||||
|
Income from discontinued operations
|
0.03
|
|
0.02
|
|
0.01
|
|
0.01
|
|
||||||||
|
Net income
|
$
|
0.06
|
|
$
|
0.19
|
|
$
|
0.07
|
|
$
|
0.13
|
|
||||
192
The following table presents the unaudited quarterly results of operations for the year ended
December 31, 2017
:
|
Three Months Ended,
|
||||||||||||||||
|
($ in thousands, except per share data)
|
March
31, 2017
|
June
30, 2017
|
September
30, 2017
|
December
31, 2017
|
||||||||||||
|
Interest income
|
$
|
98,842
|
|
$
|
96,440
|
|
$
|
96,751
|
|
$
|
97,157
|
|
||||
|
Interest expense
|
18,361
|
|
20,940
|
|
21,715
|
|
23,984
|
|
||||||||
|
Net interest income
|
80,481
|
|
75,500
|
|
75,036
|
|
73,173
|
|
||||||||
|
Provision for loan losses
|
2,583
|
|
2,503
|
|
3,561
|
|
5,052
|
|
||||||||
|
Noninterest income
|
14,903
|
|
5,707
|
|
18,365
|
|
5,695
|
|
||||||||
|
Noninterest expense
|
89,896
|
|
76,319
|
|
75,671
|
|
66,382
|
|
||||||||
|
Income from continuing operations before income taxes
|
2,905
|
|
2,385
|
|
14,169
|
|
7,434
|
|
||||||||
|
Income tax benefit
|
(6,471
|
)
|
(12,753
|
)
|
(3,939
|
)
|
(3,418
|
)
|
||||||||
|
Income from continuing operations
|
9,376
|
|
15,138
|
|
18,108
|
|
10,852
|
|
||||||||
|
Income (loss) from discontinued operations before income taxes
|
13,348
|
|
(4,991
|
)
|
(1,958
|
)
|
765
|
|
||||||||
|
Income tax expense (benefit)
|
5,523
|
|
(2,110
|
)
|
(799
|
)
|
315
|
|
||||||||
|
Income (loss) from discontinued operations
|
7,825
|
|
(2,881
|
)
|
(1,159
|
)
|
450
|
|
||||||||
|
Net income
|
17,201
|
|
12,257
|
|
16,949
|
|
11,302
|
|
||||||||
|
Dividends on preferred stock
|
5,113
|
|
5,113
|
|
5,112
|
|
5,113
|
|
||||||||
|
Net income available to common stockholders
|
$
|
12,088
|
|
$
|
7,144
|
|
$
|
11,837
|
|
$
|
6,189
|
|
||||
|
Basic earnings per common share
|
||||||||||||||||
|
Income from continuing operations
|
$
|
0.08
|
|
$
|
0.20
|
|
$
|
0.25
|
|
$
|
0.11
|
|
||||
|
Income (loss) from discontinued operations
|
0.15
|
|
(0.06
|
)
|
(0.02
|
)
|
0.01
|
|
||||||||
|
Net income
|
$
|
0.23
|
|
$
|
0.14
|
|
$
|
0.23
|
|
$
|
0.12
|
|
||||
|
Diluted earnings per common share
|
||||||||||||||||
|
Income from continuing operations
|
$
|
0.08
|
|
$
|
0.20
|
|
$
|
0.25
|
|
$
|
0.11
|
|
||||
|
Income (loss) from discontinued operations
|
0.15
|
|
(0.06
|
)
|
(0.02
|
)
|
0.01
|
|
||||||||
|
Net income
|
$
|
0.23
|
|
$
|
0.14
|
|
$
|
0.23
|
|
$
|
0.12
|
|
||||
|
Basic earnings per class B common share
|
||||||||||||||||
|
Income from continuing operations
|
$
|
0.08
|
|
$
|
0.20
|
|
$
|
0.25
|
|
$
|
0.11
|
|
||||
|
Income (loss) from discontinued operations
|
0.15
|
|
(0.06
|
)
|
(0.02
|
)
|
0.01
|
|
||||||||
|
Net income
|
$
|
0.23
|
|
$
|
0.14
|
|
$
|
0.23
|
|
$
|
0.12
|
|
||||
|
Diluted earnings per class B common share
|
||||||||||||||||
|
Income from continuing operations
|
$
|
0.08
|
|
$
|
0.20
|
|
$
|
0.25
|
|
$
|
0.11
|
|
||||
|
Income (loss) from discontinued operations
|
0.15
|
|
(0.06
|
)
|
(0.02
|
)
|
0.01
|
|
||||||||
|
Net income
|
$
|
0.23
|
|
$
|
0.14
|
|
$
|
0.23
|
|
$
|
0.12
|
|
||||
NOTE 29 – SUBSEQUENT EVENTS
The Company entered into a new line of credit for
$15.0 million
on February 14, 2019, which bears interest at LIBOR plus
2%
and is scheduled to mature on February 13, 2020.
The Company evaluated subsequent events through the date of issuance of the financial data included herein. Other than the event discussed above, there have been no subsequent events occurred during such period that would require disclosure in this report or would be required to be recognized on the Consolidated Financial Statements as of
December 31, 2018
.
193
Item 9. Changes in and Disagreements With Accountants on Accounting and Financial Disclosure
None
Item 9A. Controls and Procedures
Evaluation of Disclosure Controls and Procedures
An evaluation of the Company’s disclosure controls and procedures (as defined in Rule 13a-15(e) under the Securities Exchange Act of 1934 (the Act)) as of December 31, 2018 was carried out under the supervision and with the participation of the Company’s Chief Executive Officer, Chief Financial Officer and other members of the Company’s senior management. Based up that evaluation, the Company's Chief Executive Officer and Chief Financial Officer concluded that as of December 31, 2018, the Company’s disclosure controls and procedures were effective in ensuring that the information required to be disclosed by the Company in the reports it files or submits under the Act is (i) accumulated and communicated to the Company’s management (including the Principal Executive Officer and Principal Financial Officer) to allow timely decisions regarding required disclosure, and (ii) recorded, processed, summarized and reported within the time periods specified in the SEC’s rules and forms.
The Company's Report on Internal Control Over Financial Reporting
The management of the Company is responsible for establishing and maintaining adequate internal control over financial reporting, as such term is defined in Exchange Act Rule 13a-15(f). The Company’s internal control over financial reporting is a process designed to provide reasonable assurance regarding the reliability of financial reporting and the preparation of the financial statements for external purposes in accordance with accounting principles generally accepted in the United States of America. The Company’s internal control over financial reporting includes those policies and procedures that (i) pertain to the maintenance of records that, in reasonable detail, accurately and fairly reflect the transactions and dispositions of the assets of the Company; (ii) provide reasonable assurance that transactions are recorded as necessary to permit preparation of financial statements in accordance with accounting principles generally accepted in the United States of America, and that receipts and expenditures of the Company are being made only in accordance with authorizations of management and directors of the Company; and (iii) provide reasonable assurance regarding prevention or timely detection of unauthorized acquisition, use, or disposition of the Company’s assets that could have a material effect on the financial statements.
Because of its inherent limitations, internal control over financial reporting may not prevent or detect misstatements. All internal control systems, no matter how well designed, have inherent limitations, including the possibility of human error and the circumvention of overriding controls. Accordingly, even effective internal control over financial reporting can only provide reasonable assurance with respect to financial statement preparation. Also, projections of any evaluation of effectiveness to future periods are subject to the risk that controls may become inadequate because of changes in conditions, or that degree of compliance with the policies or procedures may deteriorate.
The Company has assessed the effectiveness of the Company’s internal control over financial reporting as of December 31, 2018, based on the framework set forth by the Committee of Sponsoring Organizations of the Treadway Commission (COSO) in Internal Control-Integrated Framework (2013). Based on that assessment, management concluded that the Company's internal control over financial reporting was effective as of December 31, 2018 based on the criteria established in the Company's Internal Control-Integrated Framework (2013).
The effectiveness of the Company's internal control over financial reporting as of December 31, 2018, has been audited by KPMG LLP (KPMG), an independent registered public accounting firm, as stated in their report entitled "Report of Independent Registered Public Accounting Firm" which appears herein under "Item 8. Financial Statements and Supplementary Data."
194
Changes in Internal Control Over Financial Reporting
There were no changes in internal control over financial reporting during the three months ended December 31, 2018 that has materially affected, or is reasonably likely to materially affect, our internal control over financial reporting.
Attestation Report of the Independent Registered Public Accounting Firm
The effectiveness of the Company’s internal control over financial reporting as of
December 31, 2018
, has been audited by KPMG LLP, an independent registered public accounting firm.
|
/s/ Douglas H. Bowers
|
/s/ John A. Bogler
|
|
|
Douglas H. Bowers
|
John A. Bogler
|
|
|
President/Chief Executive Officer
|
Executive Vice President/Chief Financial Officer
|
|
195
Report of Independent Registered Public Accounting Firm
To the Stockholders and Board of Directors
Banc of California, Inc.:
Opinion on Internal Control Over Financial Reporting
We have audited Banc of California, Inc.'s and subsidiaries’ (the Company) internal control over financial reporting as of
December 31, 2018
, based on criteria established in
Internal Control - Integrated Framework (2013)
issued by the Committee of Sponsoring Organizations of the Treadway Commission. In our opinion, the Company maintained, in all material respects, effective internal control over financial reporting as of
December 31, 2018
, based on criteria established in
Internal Control - Integrated Framework (2013)
issued by the Committee of Sponsoring Organizations of the Treadway Commission.
We also have audited, in accordance with the standards of the Public Company Accounting Oversight Board (United States) (PCAOB), the consolidated statements of financial condition of the Company as of
December 31, 2018
and
2017
, the related consolidated statements of operations, comprehensive income, stockholders’ equity, and cash flows for each of the years in the three-year period ended
December 31, 2018
, and the related notes (collectively, the consolidated financial statements), and our report dated
February 28, 2019
expressed an unqualified opinion on those consolidated financial statements.
Basis for Opinion
The Company’s management is responsible for maintaining effective internal control over financial reporting and for its assessment of the effectiveness of internal control over financial reporting, included in the accompanying
Management’s Report on Internal Control over Financial Reporting
. Our responsibility is to express an opinion on the Company’s internal control over financial reporting based on our audit. We are a public accounting firm registered with the PCAOB and are required to be independent with respect to the Company in accordance with the U.S. federal securities laws and the applicable rules and regulations of the Securities and Exchange Commission and the PCAOB.
We conducted our audit in accordance with the standards of the PCAOB. Those standards require that we plan and perform the audit to obtain reasonable assurance about whether effective internal control over financial reporting was maintained in all material respects. Our audit of internal control over financial reporting included obtaining an understanding of internal control over financial reporting, assessing the risk that a material weakness exists, and testing and evaluating the design and operating effectiveness of internal control based on the assessed risk. Our audit also included performing such other procedures as we considered necessary in the circumstances. We believe that our audit provides a reasonable basis for our opinion.
Definition and Limitations of Internal Control Over Financial Reporting
A company’s internal control over financial reporting is a process designed to provide reasonable assurance regarding the reliability of financial reporting and the preparation of financial statements for external purposes in accordance with generally accepted accounting principles. A company’s internal control over financial reporting includes those policies and procedures that (1) pertain to the maintenance of records that, in reasonable detail, accurately and fairly reflect the transactions and dispositions of the assets of the company; (2) provide reasonable assurance that transactions are recorded as necessary to permit preparation of financial statements in accordance with generally accepted accounting principles, and that receipts and expenditures of the company are being made only in accordance with authorizations of management and directors of the company; and (3) provide reasonable assurance regarding prevention or timely detection of unauthorized acquisition, use, or disposition of the company’s assets that could have a material effect on the financial statements.
Because of its inherent limitations, internal control over financial reporting may not prevent or detect misstatements. Also, projections of any evaluation of effectiveness to future periods are subject to the risk that controls may become inadequate because of changes in conditions, or that the degree of compliance with the policies or procedures may deteriorate.
|
/s/ KPMG LLP
KPMG LLP
|
|
Irvine, California
February 28, 2019
196
Item 9B. Other Information
On February 27, 2019, John C. Grosvenor, who has been employed by the Company as General Counsel Emeritus since his retirement as General Counsel and Corporate Secretary effective May 15, 2018, informed the Company of his intent to retire as General Counsel Emeritus effective April 15, 2019.
197
PART III
Item 10. Directors, Executive Officers and Corporate Governance
Directors and Executive Officers.
The information concerning directors and executive officers of the Company required by this item is incorporated herein by reference from the Company’s definitive proxy statement for its
2019
Annual Meeting of Stockholders, a copy of which will be filed with the Securities and Exchange Commission not later than 120 days after the end of the Company’s fiscal year.
Audit Committee and Audit Committee Financial Experts.
Information concerning the audit committee of the Company’s Board of Directors required by this item, including information regarding the audit committee financial experts serving on the audit committee, is incorporated herein by reference from the Company’s definitive proxy statement for its
2019
Annual Meeting of Stockholders, except for information contained under the heading “Report of the Audit Committee,” a copy of which will be filed not later than 120 days after the close of the fiscal year.
Code of Ethics.
The Company adopted a written Code of Business Conduct and Ethics based upon the standards set forth under Item 406 of Regulation S-K of the Securities Exchange Act. The Code of Business Conduct and Ethics applies to all of the Company’s directors, officers and employees. A full text of the Code is available on the Company’s website at www.bancofcal.com, by clicking "About Us," then "Investor Relations," then "Corporate Overview" and then "Governance Documents."
Section 16(a) Beneficial Ownership Reporting Compliance.
The information concerning compliance with the reporting requirements of Section 16(a) of the Securities Exchange Act of 1934 by directors, officers and ten percent stockholders of the Company required by this item is incorporated herein by reference from the Company’s definitive proxy statement for its
2019
Annual Meeting of Stockholders, a copy of which will be filed with the Securities and Exchange Commission not later than 120 days after the end of the Company’s fiscal year.
Nomination Procedures.
There have been no material changes to the procedures by which stockholders may recommend nominees to the Company’s Board of Directors.
Item 11. Executive Compensation
The information concerning compensation and other matters required by this item is incorporated herein by reference from the Company’s definitive proxy statement for its
2019
Annual Meeting of Stockholders, except for information contained under the headings “Compensation Committee report on Executive Compensation” a copy of which will be filed with the Securities and Exchange Commission not later than 120 days after the end of the Company’s fiscal year.
Item 12. Security Ownership of Certain Beneficial Owners and Management and Related Stockholder Matters
The information concerning security ownership of certain beneficial owners and management required by this item is incorporated herein by reference from the Company’s definitive proxy statement for its
2019
Annual Meeting of Stockholders, a copy of which will be filed with the Securities and Exchange Commission not later than 120 days after the end of the Company’s fiscal year.
The following table summarizes our equity compensation plans as of
December 31, 2018
:
|
Plan Category
|
Number of Securities to be issued upon exercise of outstanding options and rights
|
Weighted-average exercise price of outstanding options and rights
|
Number of Securities remaining available for future issuance under equity compensation plans
(excluding securities reflected in first column)
(1)
|
|||||||
|
Equity compensation plans approved by security holders
|
1,745,985
|
|
$
|
11.81
|
|
4,346,189
|
|
|||
|
Equity compensation plans not approved by security holders
|
—
|
|
$
|
—
|
|
—
|
|
|||
|
(1)
|
The 2018 Omnibus Plan, which is the only equity compensation plan approved by the Company's stockholders under which awards could be made as of December 31, 2018, provides that the maximum number of shares that are available for awards is
4,417,882
.
|
198
Item 13. Certain Relationships and Related Transactions, and Director Independence
Information concerning certain relationships and related transactions and director independence required by this item is incorporated herein by reference from the Company’s definitive proxy statement for its
2019
Annual Meeting of Stockholders, a copy of which will be filed not later than 120 days after the close of the fiscal year.
Item 14. Principal Accounting Fees and Services
Information concerning principal accounting fees and services is incorporated herein by reference from the Company’s definitive proxy statement for its
2019
Annual Meeting of Stockholders, a copy of which will be filed no later than 120 days after the close of the fiscal year.
199
PART IV
ITEM 15. Exhibits and Financial Statement Schedules
(a)(1) Financial Statements: See Part II—Item 8. Financial Statements and Supplementary Data
|
(a)(2)
|
Financial Statement Schedule: All financial statement schedules have been omitted as the information is not required under the related instructions or is not applicable.
|
|
(a)(3)
|
Exhibits
|
|
2.1
|
Footnote 1
|
|
|
2.2
|
Footnote 2
|
|
|
2.3
|
Footnote 3
|
|
|
2.4
|
Footnote 3
|
|
|
3.1
|
Footnote 41
|
|
|
3.2
|
Footnote 4
|
|
|
4.1
|
Footnote 5
|
|
|
4.2
|
Footnote 6
|
|
|
4.3
|
Footnote 6
|
|
|
4.4
|
Footnote 7
|
|
|
4.5
|
Footnote 8
|
|
|
4.6
|
Footnote 9
|
|
|
4.7
|
Footnote 10
|
|
|
4.8
|
Footnote 10
|
|
|
4.9
|
Footnote 10
|
|
|
4.10
|
Footnote 11
|
|
|
10.1
|
Footnote 12
|
|
|
10.2
|
Footnote 13
|
|
|
10.3
|
Footnote 14
|
|
|
10.3A
|
Footnote 15
|
|
|
10.3B
|
Footnote 40
|
|
|
10.4
|
Footnote 16
|
|
|
10.4A
|
Footnote 15
|
|
|
10.5
|
Footnote 44
|
|
200
|
10.8
|
Footnote 16
|
|
|
10.8A
|
Footnote 16
|
|
|
10.8B
|
Footnote 17
|
|
|
10.8C
|
Footnote 18
|
|
|
10.8D
|
Footnote 19
|
|
|
10.8E
|
Footnote 20
|
|
|
10.8F
|
Footnote 20
|
|
|
10.8G
|
Footnote 21
|
|
|
10.9
|
Footnote 20
|
|
|
10.9A
|
Footnote 39
|
|
|
10.10
|
Footnote 23
|
|
|
10.10A
|
Footnote 24
|
|
|
10.10B
|
Footnote 15
|
|
|
10.10C
|
Footnote 39
|
|
|
10.11
|
Footnote 15
|
|
|
10.11A
|
Footnote 20
|
|
|
10.11B
|
Footnote 25
|
|
|
10.12
|
[Reserved]
|
Footnote 22
|
|
10.13
|
[Reserved]
|
Footnote 26
|
|
10.14
|
[Reserved]
|
Footnote 46
|
|
10.15
|
Footnote 27
|
|
|
10.15A
|
Footnote 28
|
|
|
10.16
|
Footnote 29
|
|
|
10.16A
|
[Reserved]
|
Footnote 47
|
|
10.16B
|
Footnote 30
|
|
|
10.16C
|
Footnote 30
|
|
|
10.16D
|
Footnote 31
|
|
|
10.16E
|
Footnote 31
|
|
|
10.16F
|
Footnote 18
|
|
|
10.16G
|
Footnote 18
|
|
|
10.16H
|
Footnote 24
|
|
201
|
10.16I
|
[Reserved]
|
Footnote 48
|
|
10.16J
|
Footnote 24
|
|
|
10.16K
|
Footnote 24
|
|
|
10.16L
|
Footnote 39
|
|
|
10.17
|
Footnote 42
|
|
|
10.17A
|
Footnote 45
|
|
|
10.17B
|
Footnote 45
|
|
|
10.17C
|
Footnote 45
|
|
|
10.17D
|
Footnote 45
|
|
|
10.17E
|
Footnote 45
|
|
|
10.17F
|
|
Footnote 45
|
|
10.17G
|
Footnote 45
|
|
|
10.17H
|
Footnote 45
|
|
|
10.17I
|
Footnote 45
|
|
|
10.17J
|
Footnote 45
|
|
|
10.17K
|
Footnote 45
|
|
|
10.18
|
Footnote 32
|
|
|
10.18A
|
Footnote 33
|
|
|
10.19
|
Footnote 2
|
|
|
10.19A
|
Footnote 34
|
|
|
10.20
|
Footnote 34
|
|
|
10.21
|
Footnote 35
|
|
|
10.22
|
Footnote 15
|
|
|
10.23
|
Footnote 36
|
|
|
10.23A
|
Footnote 36
|
|
|
10.24
|
Footnote 37
|
|
|
10.25
|
Footnote 38
|
|
|
11.0
|
[Reserved]
|
Footnote 43
|
|
21.0
|
21.0
|
|
202
|
23.0
|
23.0
|
|
|
24.0
|
Footnote 49
|
|
|
31.1
|
31.1
|
|
|
31.2
|
31.2
|
|
|
32.0
|
32.0
|
|
|
101.0
|
The following financial statements and footnotes from the Registrant’s Annual Report on Form 10-K for the year ended December
31, 2018 formatted in Extensible Business Reporting Language (XBRL): (i) Consolidated Statements of Financial Condition; (ii) Consolidated Statements of Operations; (iii) Consolidated Statements of Comprehensive Income (Loss); (iv) Consolidated Statements of Stockholders’ Equity; (v) Consolidated Statements of Cash Flows; and (vi) the Notes to Consolidated Financial Statements.
|
101.0
|
203
|
(1)
|
Filed as an exhibit to the Registrant’s Current Report on Form 8-K filed on October
31, 2013 and incorporated herein by reference.
|
|
(2)
|
Filed as an exhibit to the Registrant’s Current Report on Form 8-K filed on April
25, 2014 and incorporated herein by reference.
|
|
(3)
|
Filed as an exhibit to the Registrant's Current Report on Form 8-K filed on April 5, 2017 and incorporated herein by referenc
e.
|
|
(4)
|
Filed as an exhibit to the Registrant’s Current Report on Form 8-K filed on June
30, 2017 and incorporated herein by reference.
|
|
(5)
|
Filed as an exhibit to the Registrant’s Current Report on Form 8-K/A filed on November
16, 2010 and incorporated herein by reference.
|
|
(6)
|
Filed as an exhibit to the Registrant’s Current Report on Form 8-K filed on April
23, 2012 and incorporated herein by reference.
|
|
(7)
|
Filed as an exhibit to the Registrant's Current Report on Form 8-K filed on April
6, 2015 and incorporated herein by reference.
|
|
(8)
|
Filed as an exhibit to the Registrant’s Current Report on Form 8-K filed on June
12, 2013 and incorporated herein by reference.
|
|
(9)
|
Filed as an exhibit to the Registrant's Current Report on Form 8-K filed on April
8, 2015 and incorporated herein by reference.
|
|
(10)
|
Filed as an exhibit to the Registrant’s Current Report on Form 8-K filed on May
21, 2014 and incorporated herein by reference.
|
|
(11)
|
Filed as an exhibit to the Registrant's Current Report on Form 8-K filed on February
8, 2016 and incorporated herein by reference.
|
|
(12)
|
Filed as an exhibit to the Registrant's Current Report on Form 8-K filed on April
27, 2017 and incorporated herein by reference.
|
|
(13)
|
Filed as an exhibit to the Registrant’s Quarterly Report on Form 10-Q for the quarter ended September
30, 2017 and incorporated herein by reference.
|
|
(14)
|
Field as an exhibit to the Registrant’s Quarterly Report on Form 10-Q for the quarter ended September
30, 2013 and incorporated herein by reference.
|
|
(15)
|
Filed as an exhibit to the Registrant’s Annual Report on Form 10-K for the year ended December
31, 2015 and incorporated herein by reference.
|
|
(16)
|
Filed as an exhibit to the Registrant’s Quarterly Report on Form 10-Q for the quarter ended September
30, 2012 and incorporated herein by reference.
|
|
(17)
|
Filed as an exhibit to the Registrant’s Quarterly Report on Form 10-Q for the quarter ended March
31, 2014 and incorporated herein by reference.
|
|
(18)
|
Filed as an exhibit to the Registrant’s Quarterly Report on Form 10-Q for the quarter ended June
30, 2014 and incorporated herein by reference.
|
|
(19)
|
Filed as an exhibit to the Registrant's Current Report on Form 8-K filed on March
8, 2016 and incorporated herein by reference.
|
|
(20)
|
Filed as an exhibit to the Registrant's Current Report on Form 8-K filed on March
25, 2016 and incorporated herein by reference.
|
|
(21)
|
Filed as an exhibit to the Registrant's Current Report on Form 8-K filed on January
25, 2017 and incorporated herein by reference.
|
|
(22)
|
[Reserved]
|
|
(23)
|
Field as an exhibit to the Registrant’s Quarterly Report on Form 10-Q for the quarter ended June
30, 2013 and incorporated herein by reference.
|
|
(24)
|
Filed as an exhibit to the Registrant’s Quarterly Report on Form 10-Q for the quarter ended March
31, 2015 and incorporated herein by reference.
|
|
(25)
|
Filed as an exhibit to the Registrant's Current Report on Form 8-K filed on June
14, 2017 and incorporated herein by reference.
|
|
(26)
|
[Reserved]
|
|
(27)
|
Filed as an appendix to the Registrant’s definitive proxy statement filed on April
25, 2011 and incorporated herein by reference.
|
|
(28)
|
Filed as an exhibit to the Registrant’s Annual Report on Form 10-K for the year ended December 31, 2011 and incorporated herein by reference.
|
|
(29)
|
Filed as an appendix to the Registrant’s definitive proxy statement filed on June
11, 2013 and incorporated herein by reference.
|
|
(30)
|
Filed as an exhibit to the Registrant’s Registration Statement on Form S-8 filed on July
31, 2013 and incorporated herein by reference.
|
|
(31)
|
Filed as an exhibit to the Registrant’s Annual Report on Form 10-K for the year ended December
31, 2013 and incorporated herein by reference.
|
|
(32)
|
Filed as an exhibit to the Registrant’s Current Report on Form 8-K filed on June
4, 2013 and incorporated herein by reference.
|
|
(33)
|
Filed as an exhibit to the Registrant’s Annual Report on Form 10-K for the year ended December
31, 2014 and incorporated herein by reference.
|
|
(34)
|
Filed as an exhibit to the Registrant’s Current Report on Form 8-K filed on October
30, 2014 and incorporated herein by reference.
|
|
(35)
|
Filed as an exhibit to the Registrant's Current Report on Form 8-K filed on October
2, 2015 and incorporated herein by reference.
|
|
(36)
|
Filed as an exhibit to the Registrant’s Quarterly Report on Form 10-Q for the quarter ended June
30, 2016 and incorporated herein by reference.
|
|
(37)
|
Filed as an exhibit to the Registrant's Current Report on Form 8-K filed on February
8, 2017 and incorporated herein by reference.
|
|
(38)
|
Filed as an exhibit to the Registrant's Current Report on Form 8-K filed on March
14, 2017 and incorporated herein by reference.
|
|
(39)
|
Filed as an exhibit to the Registrant’s Annual Report on Form 10-K for the year ended December 31, 2017 and incorporated herein by reference.
|
|
(40)
|
Files as an exhibit to the Registrant’s Quarterly Report on Form 10-Q for the quarter ended March 31, 2018 and incorporated herein by reference.
|
|
(41)
|
Filed as an exhibit to the Registrant’s Current Report on Form 8-K filed on June 5, 2018 and incorporated herein by reference.
|
|
(42)
|
Included as an appendix to the Registrant’s definitive proxy statement filed on April 19, 2018 and incorporated herein by reference.
|
|
(43)
|
[Reserved]
|
|
(44)
|
Filed as an exhibit to the Registrant’s Current Report on Form 8-K filed on October 19, 2018 and incorporated herein by reference.
|
|
(45)
|
Filed as an exhibit to the Registrant’s Registration Statement on Form S-8 filed on August
17, 2018 and incorporated herein by reference.
|
|
(46)
|
[Reserved]
|
|
(47)
|
[Reserved]
|
|
(48)
|
[Reserved]
|
|
(49)
|
Included on signatory pages of this report.
|
204
SIGNATURES
Pursuant to the requirements of Section 13 or 15 (d) of the Securities Exchange Act of 1934, the registrant has duly caused this report to be signed on its behalf by the undersigned, and hereunto duly authorized.
|
BANC OF CALIFORNIA, INC.
|
||
|
Date: February 28, 2019
|
/s/ Douglas H. Bowers
|
|
|
Douglas H. Bowers
|
||
|
President/Chief Executive Officer
|
||
|
(Duly Authorized Representative)
|
||
POWER OF ATTORNEY
We, the undersigned officers and directors of BANC OF CALIFORNIA, INC., hereby severally and individually constitute and appoint Douglas H. Bowers and John A. Bogler, and each of them, the true and lawful attorneys and agents of each of us to execute in the name, place and stead of each of us (individually and in any capacity stated below) any and all amendments to this Annual Report on Form 10-K and all instruments necessary or advisable in connection therewith and to file the same with the Securities and Exchange Commission, each of said attorneys and agents to have the power to act with or without the others and to have full power and authority to do and perform in the name and on behalf of each of the undersigned every act whatsoever necessary or advisable to be done in the premises as fully and to all intents and purposes as any of the undersigned might or could do in person, and we hereby ratify and confirm our signatures as they may be signed by our said attorneys and agents or each of them to any and all such amendments and instruments.
Pursuant to the requirements of the Securities Exchange Act of 1934, this report has been signed below by the following persons on behalf of the registrant and in the capacities and on the dates indicated.
|
Date: February 28, 2019
|
/s/ Douglas H. Bowers
|
|
|
Douglas H. Bowers
|
||
|
President/Chief Executive Officer/Director
(Principal Executive Officer) |
||
|
Date: February 28, 2019
|
/s/ John A. Bogler
|
|
|
John A. Bogler
|
||
|
Executive Vice President/Chief Financial Officer
(Principal Financial Officer) |
||
|
Date: February 28, 2019
|
/s/ Mike Smith
|
|
|
Mike Smith
|
||
|
Senior Vice President/Chief Accounting Officer and Director of Treasury
(Principal Accounting Officer) |
||
|
Date: February 28, 2019
|
/s/ Robert D. Sznewajs
|
|
|
Robert D. Sznewajs, Chairman of the Board of Directors
|
||
|
Date: February 28, 2019
|
/s/ Halle J. Benett
|
|
|
Halle J. Benett, Director
|
||
|
Date: February 28, 2019
|
/s/ Mary A. Curran
|
|
|
Mary A. Curran, Director
|
||
|
Date: February 28, 2019
|
/s/ Bonnie G. Hill
|
|
|
Bonnie G. Hill, Director
|
||
|
Date: February 28, 2019
|
/s/ Richard J. Lashley
|
|
|
Richard J. Lashley, Director
|
||
|
Date: February 28, 2019
|
/s/ Jonah F. Schnel
|
|
|
Jonah F. Schnel, Director
|
||
|
Date: February 28, 2019
|
/s/ Barbara Fallon-Walsh
|
|
|
Barbara Fallon-Walsh, Director
|
||
|
Date: February 28, 2019
|
/s/ W. Kirk Wycoff
|
|
|
W. Kirk Wycoff, Director
|
||
205
TABLE OF CONTENTS
Part IItem 1. BusinessItem 1A. Risk FactorsItem 1B. Unresolved Staff CommentsItem 2. PropertiesItem 3. Legal ProceedingsItem 4. Mine Safety DisclosuresPart IIItem 5. Market For Registrant S Common Equity, Related Stockholder Matters and Issuer Purchases Of Equity SecuritiesItem 6. Selected Financial DataItem 7. Management S Discussion and Analysis Of Financial Condition and Results Of OperationsItem 7A. Quantitative and Qualitative Disclosures About Market RiskItem 8. Financial Statements and Supplementary DataItem 1 Financial StatementsNote 1 Summary Of Significant Accounting PoliciesNote 2 Sales Of Branch, Subsidiary and Business UnitsNote 3 Fair Values Of Financial InstrumentsNote 4 Investment SecuritiesNote 5 Loans and Leases and Allowance For Loan and Lease LossesNote 6 Premises, Equipment, and Capital Leases, NetNote 7 Servicing RightsNote 8 Other Real Estate OwnedNote 9 Goodwill and Other Intangible Assets, NetNote 10 DepositsNote 11 Federal Home Loan Bank Advances and Other BorrowingsNote 12 Long-term DebtNote 13 Income TaxesNote 14 Reserve For Loss on Repurchased LoansNote 15 Derivative InstrumentsNote 16 Employee Stock CompensationNote 17 Employee Benefit PlansNote 18 Stockholders EquityNote 19 Regulatory Capital MattersNote 20 Variable Interest EntitiesNote 21 Earnings Per Common ShareNote 22 Loan Commitments and Other Related ActivitiesNote 23 RestructuringNote 24 - Revenue RecognitionNote 25 Parent Company Financial StatementsNote 26 Related-party TransactionsNote 27 LitigationNote 28 Quarterly Results Of Operations (unaudited)Note 29 Subsequent EventsItem 9. Changes in and Disagreements with Accountants on Accounting and Financial DisclosureItem 9A. Controls and ProceduresItem 9B. Other InformationPart IIIItem 10. Directors, Executive Officers and Corporate GovernanceItem 11. Executive CompensationItem 12. Security Ownership Of Certain Beneficial Owners and Management and Related Stockholder MattersItem 13. Certain Relationships and Related Transactions, and Director IndependenceItem 14. Principal Accounting Fees and ServicesPart IVItem 15. Exhibits and Financial Statement Schedules