|
|
|
|
|
|
|
|
|
|
|
|
|
|
|
|
|
|
|
|
|
|
|
|
|
|
|
|
|
|
|
|
|
|
|
|
|
|
|
|
|
|
|
|
|
|
|
|
|
|
|
|
|
Table of Contents
UNITED STATES
SECURITIES AND EXCHANGE COMMISSION
Washington, D.C. 20549
FORM 10-K
ANNUAL REPORT PURSUANT TO SECTION 13 OR 15 (d) OF
THE SECURITIES EXCHANGE ACT OF 1934
| For the Fiscal Year Ended December 31, 2011 | Commission File Number 0-14384 |
BANCFIRST CORPORATION
(Exact name of registrant as specified in its charter)
| OKLAHOMA | 73-1221379 | |
|
(State or other jurisdiction of
incorporation or organization) |
(I.R.S. Employer Identification No.) |
101 North Broadway, Oklahoma City, Oklahoma 73102
(Address of principal executive offices) (Zip Code)
Registrant’s telephone number, including area code: (405) 270-1086
Securities registered pursuant to Section 12(b) of the Act:
|
Title of each class |
Name of each exchange on which registered |
|
| Common Stock, $1.00 Par Value Per Share | NASDAQ Global Select Market System |
Securities registered pursuant to Section 12(g) of the Act: None
Indicate by check mark if the registrant is a well-known seasoned issuer, as defined in Rule 405 of the Securities Act. Yes ¨ No x
Indicate by check mark if the registrant is not required to file reports pursuant to Section 13 or Section 15(d) of the Act. Yes ¨ No x
Indicate by check mark whether the registrant (1) has filed all reports required by Section 13 or 15(d) of the Securities Exchange Act of 1934 during the preceding 12 months (or for such shorter period that the registrant was required to file such reports), and (2) has been subject to such filing requirements for the past 90 days. Yes x No ¨
Indicate by check mark whether the registrant has submitted electronically and posted on its corporate Website, if any, every Interactive Data File required to be submitted and posted pursuant to Rule 405 of Regulation S-T during the preceding 12 months (or for such shorter period that the registrant was required to submit and post such files). Yes ¨ No ¨
Indicate by check mark if disclosure of delinquent filers pursuant to Item 405 of Regulation S-K is not contained herein, and will not be contained, to the best of registrant’s knowledge, in definitive proxy or information statements incorporated by reference in Part III of this Form 10-K or any amendment to this Form 10-K. ¨
Indicate by check mark whether the registrant is a large accelerated filer, an accelerated filer, or a non-accelerated filer. See definition of “accelerated filer and large accelerated filer” in Rule 12b-2 of the Exchange Act.
| Large accelerated filer | ¨ | Accelerated filer | x | |||
| Non-accelerated filer | ¨ (Do not check if a smaller reporting company) | Smaller reporting company | ¨ | |||
Indicate by check mark whether the registrant is a shell company (as defined by Rule 12b-2 of the Exchange Act). Yes ¨ No x
The aggregate market value of the Common Stock held by nonaffiliates of the registrant computed using the last sale price on June 30, 2011 was approximately $282,700,842.
As of February 28, 2012, there were 15,136,680 shares of Common Stock outstanding.
DOCUMENTS INCORPORATED BY REFERENCE:
Portions of the Proxy Statement for the 2012 Annual Meeting of Stockholders of the registrant (the “2012 Proxy Statement”) to be filed pursuant to Regulation 14A are incorporated by reference into Part III of this report.
Table of Contents
BANCFIRST CORPORATION
ANNUAL REPORT ON FORM 10-K
|
Item |
PART I | Page | ||||
| 1. | 1 | |||||
| 1A. | 14 | |||||
| 1B. | 22 | |||||
| 2. | 22 | |||||
| 3. | 22 | |||||
| 4. | 22 | |||||
| PART II | ||||||
| 5. | 23 | |||||
| 6. | 25 | |||||
| 7. |
Management’s Discussion and Analysis of Financial Condition and Results of Operations |
27 | ||||
| 7A. | 47 | |||||
| 8. | 49 | |||||
| 9. |
Changes in and Disagreements with Accountants on Accounting and Financial Disclosure |
93 | ||||
| 9A. | 93 | |||||
| 9B. | 97 | |||||
| PART III | ||||||
| 10. | 97 | |||||
| 11. | 97 | |||||
| 12. |
Security Ownership of Certain Beneficial Owners and Management |
97 | ||||
| 13. |
Certain Relationships and Related Transactions and Director Independence |
97 | ||||
| 14. | 97 | |||||
| PART IV | ||||||
| 15. | 98 | |||||
| 101 | ||||||
Table of Contents
General
BancFirst Corporation (the “Company”) is an Oklahoma business corporation and a financial holding company under Federal law. It conducts virtually all of its operating activities through its principal wholly-owned subsidiary, BancFirst (the “Bank” or “BancFirst”), a state-chartered bank headquartered in Oklahoma City, Oklahoma. The Company also owns 100% of the common securities of BFC Capital Trust II, 100% of the common securities of Union National Statutory Trust I (both Delaware business trusts), 100% of the common securities of FBC Statutory Trust I (a Connecticut business trust); 100% of 1st Bank Oklahoma in Claremore, Oklahoma; 100% of Council Oak Partners LLC, an Oklahoma limited liability company engaging in investing activities, and 100% of BancFirst Insurance Services, Inc., an Oklahoma business corporation operating as an independent insurance agency. The Company merged 1st Bank Oklahoma into BancFirst on February 17, 2012.
The Company was incorporated as United Community Corporation in July 1984 for the purpose of becoming a bank holding company. In June 1985, it merged with seven Oklahoma bank holding companies that had operated under common ownership and the Company has conducted business as a bank holding company since that time. Over the next several years the Company acquired additional banks and bank holding companies, and in November 1988 the Company changed its name to BancFirst Corporation. Effective April 1, 1989, the Company consolidated its 12 subsidiary banks and formed BancFirst. Over the intervening decades, the Company has continued to expand through acquisitions and de-novo branches. The Company currently has 93 banking locations serving 51 communities throughout Oklahoma.
The Company’s strategy focuses on providing a full range of commercial banking services to retail customers and small to medium-sized businesses in both the non-metropolitan trade centers of Oklahoma and the metropolitan markets of Oklahoma City, Tulsa, Lawton, Muskogee, Norman and Shawnee. The Company operates as a “super community bank”, managing its community banking offices on a decentralized basis, which permits them to be responsive to local customer needs. Underwriting, funding, customer service and pricing decisions are made by presidents in each market within the Company’s strategic parameters. At the same time, the Company generally has a larger lending capacity, broader product line and greater operational scale than its principal competitors in the non-metropolitan market areas (which typically are independently-owned community banks). In the metropolitan markets served by the Company, the Company’s strategy is to focus on the needs of local businesses that are not served adequately by larger institutions.
The Bank maintains a strong community orientation by, among other things, selecting members of the communities in which the Bank’s branches operate to local consulting boards that assist in marketing and providing feedback on the Bank’s products and services to meet customer needs. As a result of the development of broad banking relationships with its customers and community branch network, the Bank’s lending and investing activities are funded almost entirely by core deposits.
The Bank centralizes virtually all of its processing, support and investment functions in order to achieve consistency and operational efficiencies. The Bank maintains centralized control functions such as operations support, bookkeeping, accounting, loan review, compliance and internal auditing to ensure effective risk management. The Bank also provides centrally certain specialized financial services that require unique expertise.
The Bank provides a wide range of retail and commercial banking services, including: commercial, real estate, agricultural and consumer lending; depository and funds transfer services; collections; safe deposit boxes; cash management services; retail brokerage services; and other services tailored for both individual and corporate customers. The Bank also offers trust services and acts as executor, administrator, trustee, transfer agent and in various other fiduciary capacities. Through its Technology and Operations Center, the Bank provides item processing, research and other correspondent banking services to financial institutions and governmental units.
1
Table of Contents
The Bank’s primary lending activity is the financing of business and industry in its market areas. Its commercial loan customers are generally small to medium-sized businesses engaged in light manufacturing, local wholesale and retail trade, commercial and residential real estate development and construction, services, agriculture, and the energy industry. Most forms of commercial lending are offered, including commercial mortgages, other forms of asset-based financing and working capital lines of credit. In addition, the Bank offers Small Business Administration (“SBA”) guaranteed loans through BancFirst Commercial Capital, a division established in 1991.
Consumer lending activities of the Bank consist of traditional forms of financing for automobiles, residential mortgage loans, home equity loans, and other personal loans. Residential loans consist primarily of home loans in non-metropolitan areas which are generally shorter in duration than typical mortgages and reprice within five years.
The Bank’s range of deposit services include checking accounts, Negotiable Order of Withdrawal (“NOW”) accounts, savings accounts, money market accounts, sweep accounts, club accounts, individual retirement accounts and certificates of deposit. Overdraft protection and auto draft services are also offered. Deposits of the Bank are insured by the Bank Insurance Fund administered by the Federal Deposit Insurance Corporation (“FDIC”). In addition, certain Bank employees are licensed insurance agents qualified to offer tax deferred annuities.
Trust services offered through the Bank’s Trust and Investment Management Division (the “Trust Division”) consist primarily of investment management and administration of trusts for individuals, corporations and employee benefit plans. Investment options include pooled equity and fixed income funds managed by the Trust Division and advised by nationally recognized investment management firms. In addition, the Trust Division serves as bond trustee and paying agent for various Oklahoma municipalities and governmental entities.
BancFirst has the following principal subsidiaries: Council Oak Investment Corporation, a small business investment corporation, Council Oak Real Estate, Inc., a real estate investment company, BancFirst Agency, Inc., a credit life insurance agency, and BancFirst Community Development Corporation, a certified community development entity. All of these companies are Oklahoma corporations.
The Company had approximately 1,641 full-time equivalent employees at December 31, 2011, compared to approximately 1,532 full-time equivalent employees at December 31, 2010. Its principal executive offices are located at 101 North Broadway, Oklahoma City, Oklahoma 73102, telephone number (405) 270-1086.
Market Areas and Competition
The banking environment in Oklahoma is very competitive. The geographic dispersion of the Company’s banking locations presents several different levels and types of competition. In general, however, each location competes with other banking institutions, savings and loan associations, brokerage firms, personal loan finance companies and credit unions within their respective market areas. The communities in which the Bank maintains offices are generally local trade centers throughout Oklahoma. The major areas of competition include interest rates charged on loans, underwriting terms and conditions, interest rates paid on deposits, fees on non-credit services, levels of service charges on deposits, completeness of product lines and quality of service.
Management believes the Company is in an advantageous competitive position operating as a “super community bank.” Under this strategy, the Company provides a broad line of financial products and services to small to medium-sized businesses and consumers through full service community banking offices with decentralized management, while achieving operating efficiency and product scale through product standardization and centralization of processing and other functions. Each full service banking office has senior management with significant lending experience who exercise substantial autonomy over credit and pricing decisions. This decentralized management approach, coupled with continuity of service by the same staff
2
Table of Contents
members, enables the Bank to develop long-term customer relationships, maintain high quality service and respond quickly to customer needs. The majority of its competitors in the non-metropolitan areas are much smaller, and neither offer the range of products and services nor have the lending capacity of BancFirst. In the metropolitan communities, the Company’s strategy is to be more responsive to, and more focused on, the needs of local businesses that are not served effectively by larger institutions. As reported by the FDIC, the Company’s market share of deposits for Oklahoma (including 1 st Bank Oklahoma acquired in July 2011) was 6.90% as of June 30, 2011 and 6.25% as of June 30, 2010.
Marketing to existing and potential customers is performed through a variety of media advertising, direct mail and direct personal contacts. The Company monitors the needs of its customer base through its Product Development Group, which develops and enhances products and services in response to such needs. Sales, customer service and product training are coordinated with incentive programs to motivate employees to cross-sell the Bank’s products and services.
Operating Segments
The Company has four principal business units: metropolitan banks, community banks, other financial services, and executive, operations and support. For more information on the Company’s Operating Segments see Note (22), “Segment Information” to the Company’s Consolidated Financial Statements.
Control of Company
Affiliates of the Company beneficially own approximately 53% of the outstanding shares of the Company’s common stock as of February 28, 2012. Under Oklahoma law and the Company’s Certificate of Incorporation, holders of a majority of the outstanding shares of common stock are able to elect all of the directors and approve significant corporate actions, including business combinations. Accordingly, the affiliates have the ability to control the business and affairs of the Company.
Supervision and Regulation
Banking is a complex, highly regulated industry. The Company’s growth and earnings performance and those of the Bank can be affected not only by management decisions and general and local economic conditions, but also by the statutes administered by, and the regulations and policies of, various governmental regulatory authorities. These authorities include, but are not limited to, the Board of Governors of the Federal Reserve System (the “Federal Reserve Board”), the FDIC and the Oklahoma State Banking Department.
The primary goals of the bank regulatory framework are to maintain a safe and sound banking system and to facilitate the conduct of sound monetary policy. This regulatory framework is intended primarily for the protection of a financial institution’s depositors, rather than the institution’s stockholders and creditors. The following discussion describes certain of the material elements of the regulatory framework applicable to bank holding companies and financial holding companies and their subsidiaries and provides certain specific information relevant to the Company, which is both a bank holding company and a financial holding company. The descriptions are qualified in their entirety by reference to the specific statutes and regulations discussed. Further, such statutes, regulations and policies are continually under review by Congress and state legislatures, and Federal and state regulatory agencies. A change in statutes, regulations or regulatory policies applicable to the Company, including changes in interpretation or implementation thereof, could have a material effect on the Company’s business.
Regulatory Agencies
As a financial holding company and a bank holding company, the Company is subject to comprehensive regulation by the Federal Reserve Board under the Bank Holding Company Act of 1956, as amended by the Gramm-Leach-Bliley Act of 1999 (the “GLB Act”), the Dodd-Frank Wall Street Reform and Consumer
3
Table of Contents
Protection Act (the “Dodd-Frank Act”), enacted on July 21, 2010, and other legislation (as so amended, the “Bank Holding Company Act”), as well as other Federal and state laws governing the banking business. The Company must file reports with the Federal Reserve Board and such additional information as the Federal Reserve Board may require, and the Company and non-banking affiliates are subject to examination by the Federal Reserve Board. Under Federal Reserve Board policy, the Dodd-Frank Act and Federal Reserve Board regulations, a bank holding company must serve as a source of strength for its subsidiary banks. The Federal Reserve Board may require a holding company to contribute additional capital to an undercapitalized subsidiary bank. The Bank Holding Company Act provides that a bank holding company must obtain Federal Reserve Board approval before:
| • |
Acquiring directly or indirectly, ownership or control of any voting shares of another bank or bank holding company if, after such acquisition, it would own or control more than 5% of such shares (unless it already owns or controls the majority of such shares); |
| • |
Acquiring all or substantially all of the assets of another bank or bank holding company, or |
| • |
Merging or consolidating with another bank holding company. |
The Bank Holding Company Act generally prohibits a bank holding company from acquiring direct or indirect ownership or control of more than 5% of the voting shares of any company which is not a bank or bank holding company, or from engaging directly or indirectly in activities other than those of banking, managing or controlling banks, or providing services for its subsidiaries. The principal exceptions to these prohibitions involve certain non-bank activities which, by statute or by Federal Reserve Board regulation or order, have been identified as activities closely related to the business of banking or managing or controlling banks. The list of activities permitted by the Federal Reserve Board includes, among other things: lending; operating a savings institution, mortgage company, finance company, credit card company or factoring company; performing certain data processing operations; providing certain investment and financial advice; underwriting and acting as an insurance agent for certain types of credit-related insurance; leasing property on a full-payout, non-operating basis; selling money orders, travelers’ checks and United States Savings Bonds (until December 31, 2011); real estate and personal property appraising; providing tax planning and preparation services; and, subject to certain limitations, providing securities brokerage services for customers. These activities may also be affected by Federal legislation.
The GLB Act amended portions of the Bank Holding Company Act of 1956 to authorize bank holding companies, such as the Company, directly or through non-bank subsidiaries to engage in securities, insurance and other activities that are financial in nature or incidental to a financial activity. In order to undertake these activities, a bank holding company must become a “financial holding company” by submitting to the appropriate Federal Reserve Bank a declaration that the company elects to be a financial holding company and a certification that all of the depository institutions controlled by the company are well capitalized and well managed. The Company became a financial holding company in March 2000.
The Company’s banking subsidiary is subject to regulation and supervision by various regulatory authorities, including the Oklahoma State Banking Department and the FDIC. The Company and its subsidiaries and affiliates are also subject to various other laws, regulations, supervision and examination by other regulatory agencies, all of which directly or indirectly affect the operations and management of the Company and its ability to make distributions to stockholders.
Additionally, the Company’s common stock is registered with the SEC under Section 12(b) of the Securities Exchange Act of 1934, as amended (the “Exchange Act”). Consequently, the Company is subject to the information, proxy solicitation, insider trading and other restrictions and requirements of the SEC under the Exchange Act and, as a company whose shares are traded on the NASDAQ Global Select Market System, the rules of the NASDAQ Stock Market, Inc. (the “NASDAQ”).
4
Table of Contents
Bank Holding Company Activities
“Financial in Nature” Requirement
As a bank holding company that has elected to become a financial holding company pursuant to the Bank Holding Company Act, the Company may affiliate with securities firms and insurance companies and engage in other activities that are financial in nature or incidental or complementary to activities that are financial in nature. “Financial in nature” activities include securities underwriting, dealing and market making, sponsoring mutual funds and investment companies, insurance underwriting and agency, merchant banking, and other activities that the Federal Reserve Board, in consultation with the Secretary of the U.S. Treasury, determines from time to time to be financial in nature or incidental to such financial activity or is complementary to a financial activity and does not pose a safety and soundness risk.
Federal Reserve Board approval is not required for the Company to acquire a company (other than a bank holding company, bank or savings association) engaged in activities that are financial in nature or incidental to activities that are financial in nature, as determined by the Federal Reserve Board. Prior Federal Reserve Board approval is required before the Company may acquire the beneficial ownership or control of more than 5% of the voting shares or substantially all of the assets of a bank holding company, bank or savings association.
Because the Company is a financial holding company, if its subsidiary bank receives a rating under the Community Reinvestment Act of 1977, as amended (“CRA”), of less than satisfactory, the Company will be prohibited, until the rating is raised to satisfactory or better, from engaging in new activities or acquiring companies other than bank holding companies, banks or savings associations, except that the Company could engage in new activities, or acquire companies engaged in activities, that are closely related to banking under the Bank Holding Company Act. In addition, if the Federal Reserve Board finds that the Company’s subsidiary bank is not well capitalized or well managed, the Company would be required to enter into an agreement with the Federal Reserve Board to comply with all applicable capital and management requirements and which may contain additional limitations or conditions. Until corrected, the Company would not be able to engage in any new activity or acquire companies engaged in activities that are not closely related to banking under the Bank Holding Company Act without prior Federal Reserve Board approval. If the Company fails to correct any such condition within a prescribed period, the Federal Reserve Board could order the Company to divest of its banking subsidiary or, in the alternative, to cease engaging in activities other than those closely related to banking under the Bank Holding Company Act. Although the Company is a financial holding company, it continues to maintain its status as a bank holding company for purposes of other Federal Reserve Board regulations.
Interstate Banking
Under the Riegle-Neal Interstate Banking and Branching Act (the “Riegle-Neal Act”), a bank holding company may acquire banks in states other than its home state, subject to any state requirement that the bank has been organized and operating for a minimum period of time, not to exceed five years, and the requirement that the bank holding company not control, prior to or following the proposed acquisition, more than 10% of the total amount of deposits of insured depository institutions nationwide or, unless the acquisition is the bank holding company’s initial entry into the state, more than 30% of such deposits in the state (or such lesser or greater amount set by the state).
The Riegle-Neal Act also authorizes banks to merge across state lines, thereby creating interstate branches. Banks are also permitted to either acquire existing banks and to establish new branches in other states where authorized under the laws of those states.
Regulatory Approval
In determining whether to approve a proposed bank acquisition, Federal bank regulators will consider, among other factors, the effect of the acquisition on competition, financial condition, and future prospects including current and projected capital ratios and levels, the competence, experience, and integrity of
5
Table of Contents
management and record of compliance with laws and regulations, the convenience and needs of the communities to be served, including the acquiring institution’s record of compliance under the CRA, and the effectiveness of the acquiring institution in combating money laundering activities.
Dividend Restrictions
Various Federal and state statutory provisions and regulations limit the amount of dividends the Company’s subsidiary bank and certain other subsidiaries may pay without regulatory approval. The payment of dividends by any subsidiary bank may also be affected by other regulatory requirements and policies, such as the maintenance of adequate capital. If, in the opinion of the applicable regulatory authority, a bank under its jurisdiction is engaged in, or is about to engage in, an unsafe or unsound practice (which, depending on the financial condition of the bank, could include the payment of dividends), such authority may require, after notice and hearing, that such bank cease and desist from such practice. The FDIC has formal and informal policies which provide that insured banks should generally pay dividends only out of current operating earnings.
Holding Company Structure
Transfer of Funds from Subsidiary Bank
The Bank is subject to restrictions under Federal law that limits the transfer of funds or other items of value from the Bank to the Company and its nonbank subsidiaries (including affiliates) in so-called “covered transactions.” In general, covered transactions include loans and other extensions of credit, investments and asset purchases, as well as certain other transactions involving the transfer of value from a subsidiary bank to an affiliate or for the benefit of an affiliate. Unless an exemption applies, covered transactions by a subsidiary bank with a single affiliate are limited to 10% of the subsidiary bank’s capital and surplus and, with respect to all covered transactions with affiliates in the aggregate, to 20% of the subsidiary bank’s capital and surplus. Also, loans and extensions of credit to affiliates generally are required to be secured in specified amounts. A bank’s transactions with its nonbank affiliates are also generally required to be on arm’s length terms.
Source of Strength
Federal Reserve Board policy requires bank holding companies to act as a source of financial and managerial strength to each of its subsidiary banks and, under appropriate circumstances, to commit resources to support each such subsidiary bank. This support may be required at times when the bank holding company may not have the resources to provide the support.
The FDIC may order the assessment of the Company if the capital of the Bank were to become impaired. If the Company failed to pay the assessment within three months, the FDIC could order the sale of the Company’s stock in the Bank to cover the deficiency.
Capital loans by a bank holding company to its subsidiary bank are subordinate in right of payment to deposits and certain other indebtedness of the subsidiary bank. In addition, in the event of a bank holding company’s bankruptcy, any commitment by the bank holding company to a Federal bank regulatory agency to maintain the capital of its subsidiary bank will be assumed by the bankruptcy trustee and entitled to priority of payment.
Depositor Preference
The Federal Deposit Insurance Act (the “FDI Act”) provides that, in the event of the “liquidation or other resolution” of an insured depository institution, the claims of depositors of the institution (including the claims of the FDIC as subrogee of insured depositors) and certain claims for administrative expenses of the FDIC as a receiver, will have priority over other general unsecured claims against the institution. If an insured depository
6
Table of Contents
institution fails, insured and uninsured depositors, along with the FDIC, will have priority in payment ahead of unsecured, non-deposit creditors with respect to any extensions of credit they have made to such insured depository institution.
Capital Requirements
The Federal Reserve Board, the Comptroller of the Currency and the FDIC have issued substantially similar risk-based and leverage capital guidelines applicable to United States banking organizations. In addition, these regulatory agencies may from time to time require that a banking organization maintain capital above the minimum levels, whether because of its financial condition or actual or anticipated growth. The risk-based guidelines of the FDIC, the regulatory agency with oversight over state nonmember banks such as the Bank, define a three-tier capital framework. Core, or “Tier 1,” capital, consists of common and qualifying preferred stockholders’ equity, less certain intangibles and other adjustments. Supplementary, or “Tier 2,” capital includes, among other items, certain other debt and equity investments that do not qualify as Tier 1 capital. Market risk, or “Tier 3,” capital, includes qualifying unsecured subordinated debt. The sum of Tier 1 and Tier 2 capital less investments in unconsolidated subsidiaries represents qualifying total capital. Risk-based capital ratios are calculated by dividing Tier 1 and total capital by risk-weighted assets. Assets and off-balance sheet exposures are assigned to one of four categories of risk-weights, based primarily on relative credit risk. The minimum Tier 1 capital ratio is 4% and the minimum total capital ratio is 8%.
Applicable banking regulations also require banking organizations such as the Bank to maintain a minimum “leverage ratio” (Tier 1 capital to adjusted total assets) of 3%. The principal objective of this measure is to place a constraint on the maximum degree to which banks can leverage their equity capital base. These ratio requirements are minimums. Any institution operating at or near those levels would be expected by the regulators to have well-diversified risk, including no undue interest rate risk exposures, excellent asset quality, high liquidity, and good earnings and, in general, would have to be considered a strong banking organization. All other organizations and any institutions experiencing or anticipating significant growth are expected to maintain capital ratios at least one to two percent above the minimum levels, and higher capital ratios can be required if warranted by particular circumstances or risk profile.
The various regulatory agencies have adopted substantially similar regulations that define the five capital categories (well capitalized, adequately capitalized, undercapitalized, significantly undercapitalized and critically undercapitalized) for classifying insured depository institutions, using the total risk-based capital, Tier 1 risk-based capital and leverage capital ratios as the relevant capital measures, and requires the respective Federal regulatory agencies to implement systems for “prompt corrective action” for insured depository institutions that do not meet minimum capital requirements within such categories. Such regulations establish progressively more restrictive constraints on operations, management and capital distributions depending on the category in which an institution is classified.
To be “well capitalized” under Federal bank regulatory agency definitions, a depository institution must have (i) a Tier 1 risk-based capital ratio of 6% or greater, (ii) a total risk-based capital ratio of 10% or greater, and (iii) a leverage ratio of 5% or greater. An “adequately capitalized” bank is defined as one that has (i) a Tier 1 risk-based capital ratio of 4% or greater, (ii) a total risk-based capital ratio of 8% or greater, and (iii) a leverage ratio of 4% or greater, and an “undercapitalized” bank is defined as one that has (i) a Tier 1 risk-based capital ratio of less than 4%, (ii) a total risk-based capital ratio of less than 8%, and (iii) a leverage ratio of less than 4%. A bank is considered “significantly undercapitalized” if the bank has (i) a Tier 1 risk-based capital ratio of less than 3%, (ii) a total risk-based capital ratio of less than 6%, and (iii) a leverage ratio of less than 3%, and “critically undercapitalized” if the bank has a ratio of tangible equity to total assets equal to or less than 2%. The applicable Federal regulatory agency for a bank that is “well capitalized” may reclassify it as an “adequately capitalized” or “undercapitalized” institution and subject it to the supervisory actions applicable to the next lower capital category, if it determines that the bank is in an unsafe or unsound condition or deems the bank to be engaged in an unsafe or unsound practice and not to have corrected the deficiency. Under Federal banking laws,
7
Table of Contents
failure to meet the minimum regulatory capital requirements could subject a banking institution to a variety of enforcement remedies available to Federal regulatory authorities, including the termination of deposit insurance by the FDIC and seizure of the institution. As of December 31, 2011, the Bank had a Tier 1 ratio of 13.09%, a combined Tier 1 and Tier 2 ratio of 14.25%, and a leverage ratio of 7.88% and, accordingly, was considered to be “well capitalized” as of such date.
In addition, the Federal Reserve Board has established minimum risk based capital guidelines and leverage ratio guidelines for bank holding companies that are substantially similar to those adopted by bank regulatory agencies with respect to depository institutions. These guidelines provide for a minimum leverage ratio of 3% for bank holding companies that meet certain specified criteria, including those having the highest regulatory rating. All other bank holding companies generally are required to maintain a leverage ratio of at least 4%. As of December 31, 2011, the Company had a Tier 1 ratio of 13.49%, a combined Tier 1 and Tier 2 ratio of 14.62%, and a leverage ratio of 8.14% and, accordingly, was in compliance with all of the Federal Reserve Board’s capital guidelines.
The FDI Act requires Federal bank regulatory agencies to take “prompt corrective action” with respect to FDIC-insured depository institutions that do not meet minimum capital requirements. A depository institution’s treatment for purposes of the prompt corrective action provisions will depend upon how its capital levels compare to various capital measures and certain other factors, as established by regulation.
From time to time, the Federal Reserve Board and the Federal Financial Institutions Examination Council propose changes and amendments to, and issue interpretations of, risk-based capital guidelines and related reporting instructions. Such proposals or interpretations could, if implemented in the future, affect the Company’s reported capital ratios and net risk-adjusted assets.
As an additional means to identify problems in the financial management of depository institutions, the FDI Act requires Federal bank regulatory agencies to establish certain non-capital safety and soundness standards for institutions for which they are the primary Federal regulator. The standards relate generally to operations and management, asset quality, interest rate exposure and executive compensation. The agencies are authorized to take action against institutions that fail to meet such standards.
Deposit Insurance Assessments
The bank is a member of the Deposit Insurance Fund (“DIF”), which is administered by the FDIC. Deposits are insured up to the applicable limits by the FDIC, backed by the full faith and credit of the United States Government. Under current law, the basic deposit insurance limit is $250,000, with unlimited insurance coverage of noninterest-bearing transaction accounts through December 31, 2012. As insurer, the FDIC is authorized to conduct examinations of and to require reporting by DIF-insured institutions. It also may prohibit any DIF-insured institution from engaging in any activity the FDIC determines by regulation or order to pose a serious threat to the DIF. The FDIC also has the authority to take enforcement actions against insured institutions.
The FDIC assesses deposit insurance premiums on each FDIC-insured institution quarterly, based on annualized rates for one of four risk categories, subject to certain adjustments. Under the rules in effect through March 31, 2011, these rates were applied to the institution’s deposits. Each institution is assigned to one of four risk categories based on its capital, supervisory ratings and other factors. Well capitalized institutions that are financially sound with only a few minor weaknesses are assigned to Risk Category I. Risk Categories II, III and IV present progressively greater risks to the DIF. Under FDIC’s current risk-based assessment rules, the initial base assessment rates prior to adjustments range from 12 to 16 basis points for Risk Category I, and range from 22 basis points to 45 basis points for Risk Categories II – IV. Initial base assessment rates are subject to adjustments based on an institution’s unsecured debt, secured liabilities and brokered deposits, such that the total base assessment rates after adjustments range from 7 to 24 basis points for Risk Category I, and 17 to 77.5 basis points for Risk Categories II – IV.
8
Table of Contents
On April 1, 2011, the deposit insurance assessment base changed from total domestic deposits to average total assets minus average tangible equity, pursuant to rules issued by the FDIC as required by the Dodd-Frank Act. Under these rules, an institution with total assets of less than $10 billion was assigned to a Risk Category as described above, and a range of initial base assessment rates will apply to each category, subject to adjustment downward based on unsecured debt issued by the institution and, except for an institution in Risk Category I, adjustment upward if the institution’s brokered deposits exceed 10% of its domestic deposits, to produce total base assessment rates. Total base assessment rates range from 2.5 to 9 basis points for Risk Category I, 9 to 24 basis points for Risk Category II, 18 to 33 basis points for Risk Category III, and 30 to 45 basis points for Risk Category IV, all subject to further adjustment upward if the institution holds more than a de minimis amount of unsecured debt issued by another FDIC-insured institution. The FDIC may increase or decrease its rates by 2.0 basis points without further rulemaking. In an emergency, the FDIC may also impose a special assessment. The Company’s deposit insurance expense during 2009 included $1.9 million recognized in the second quarter related to the special assessment.
In November 2009, the FDIC issued a rule that required all insured depository institutions, with limited exceptions, to prepay their estimated quarterly risk-based assessments for the fourth quarter of 2009 and for all of 2010, 2011 and 2012. As of December 31, 2011, $12.3 million in prepaid deposit insurance is included in other assets in the accompanying consolidated balance sheet.
In October 2010, the FDIC adopted a new DIF restoration plan to ensure that the fund reserve ratio reaches 1.35% by September 30, 2020, as required by the Dodd-Frank Act. At least semi-annually, the FDIC will update its loss and income projections for the fund and, if needed, will increase or decrease assessment rates, following notice-and-comment rulemaking if required.
The Company’s FDIC insurance expense totaled $3.7 million, $5.7 million and $7.8 million in 2011, 2010 and 2009, respectively. FDIC insurance expense includes deposit insurance assessments as well as Financing Corporation (“FICO”) assessments. All FDIC-insured depository institutions must pay an annual FICO assessment to provide funds for the payment of interest on bonds issued by FICO during the 1980s to resolve the thrift bailout. FDIC-insured depository institutions paid an average of 0.93 basis points on assessable deposits in 2011.
Insurance of deposits may be terminated by the FDIC upon a finding that the institution has engaged or is engaging in unsafe and unsound practices, is in an unsafe or unsound condition to continue operations or has violated any applicable law, regulation, rule, order or condition imposed by the FDIC or written agreement entered into with the FDIC. The Company does not know of any practice, condition or violation that might lead to termination of deposit insurance for its banking subsidiary.
Fiscal and Monetary Policies
The Company’s business and earnings are affected significantly by the fiscal and monetary policies of the Federal government and its agencies. The Company is particularly affected by the policies of the Federal Reserve Board, which regulates the supply of money and credit in the United States. Among the instruments of monetary policy available to the Federal Reserve Board are (a) conducting open market operations in United States government securities, (b) changing the discount rates of borrowings of depository institutions, (c) imposing or changing reserve requirements against depository institutions’ deposits, and (d) imposing or changing reserve requirements against certain borrowings by banks and their affiliates. These methods are used in varying degrees and combinations to directly affect the availability of bank loans and deposits, as well as the interest rates charged on loans and paid on deposits. The policies of the Federal Reserve Board may have a material effect on the Company’s business, results of operations and financial condition.
9
Table of Contents
Privacy Provisions of the GLB Act
Federal banking regulators, as required under the GLB Act, have adopted rules limiting the ability of banks and other financial institutions to disclose nonpublic information about consumers to nonaffiliated third parties. The rules require disclosure of privacy policies to consumers and, in some circumstances, allow consumers to prevent disclosure of certain personal information to nonaffiliated third parties. The privacy provisions of the GLB Act affect how consumer information is transmitted through diversified financial services companies and conveyed to outside vendors.
Regulation of Securities Activities of Banks
The GLB Act also amended the Federal securities laws to eliminate the blanket exceptions that banks traditionally have had from the definition of “broker” and “dealer”, but provided for certain transactional activities that would not be considered “brokerage” activities, which banks could effect without having to register as a broker. In September 2007, the Federal Reserve Board and the SEC approved Regulation R to clarify the permissible bank securities activities that can be conducted under the transactional exceptions provided by the GLB Act. Regulation R provides exceptions for networking arrangements with third party broker-dealers and authorizes compensation for bank employees who refer bank customers to such broker-dealers. The rules also provide exemptions to banks for effecting securities transactions in a trustee or fiduciary capacity, for sweeping funds into certain money market funds, and for accepting orders to effect securities transactions for custody accounts. Banks that conduct activities outside the exceptions provided by Regulation R had until the first day of their first fiscal year that commenced after September 30, 2008 to either register as a broker-dealer or “push out” their brokerage activities to affiliated broker-dealers. Regulation R did not have an effect on the securities activities that the Bank currently conducts for customers.
Patriot Act
The USA Patriot Act of 2001 (the “Patriot Act”) is intended to strengthen the ability of U.S. law enforcement agencies and intelligence communities to work together to combat terrorism on a variety of fronts. The Patriot Act substantially broadened the scope of the U.S. anti-money laundering laws and regulations by imposing significant new compliance and due diligence obligations, creating new crimes and penalties and expanding the extra-territorial jurisdiction of the United States. The U.S. Treasury Department has issued a number of implementing regulations which apply various requirements of the Patriot Act to financial institutions such as the Bank. Those regulations impose new obligations on financial institutions to maintain appropriate policies, procedures and controls to detect, prevent and report money laundering and terrorist financing, and has significant implications for depository institutions, brokers, dealers and other businesses involved in the transfer of money. The Patriot Act also requires Federal bank regulators to evaluate the effectiveness of an applicant in combating money laundering in determining whether to approve a proposed bank acquisition.
Community Reinvestment Act
The CRA requires depository institutions to assist in meeting the credit needs of their market areas consistent with safe and sound banking practice. Under the CRA, each depository institution is required to help meet the credit needs of its market areas by, among other things, providing credit to low- and moderate-income individuals and communities. Depository institutions are periodically examined for compliance with the CRA and are assigned ratings. In order for a financial holding company to commence any new activity permitted by the Bank Holding Company Act, or to acquire any company engaged in any new activity permitted by the Bank Holding Company Act, each insured depository institution subsidiary of the financial holding company must have received a rating of at least “satisfactory” in its most recent examination under the CRA. Furthermore, banking regulations take into account CRA rating when considering approval of a proposed transaction.
10
Table of Contents
Office of Foreign Asset Control
The Company and BancFirst, like all United States companies and individuals, are prohibited from transacting business with certain individuals and entities named on the Office of Foreign Asset Control’s list of Specially Designated Nationals and Blocked Persons. Failure to comply may result in fines and other penalties. The Office of Foreign Asset Control has issued guidance directed at financial institutions in which it asserts that it may, in its discretion, examine institutions determined to be high-risk or to be lacking in their efforts to comply with these prohibitions.
The Dodd-Frank Act
The Dodd-Frank Act significantly revised and expanded the rulemaking, supervisory, and enforcement authority of the Federal bank regulatory agencies. The numerous rules and regulations that have been promulgated and are yet to be promulgated and finalized under the Dodd-Frank Act are likely to significantly impact the Company’s operations and compliance costs. The Dodd-Frank Act followed the Emergency Economic Stabilization Act of 2008 (“EESA”) and the American Recovery and Reinvestment Act of 2009 (“ARRA”) as legislative responses to the economic downturn and financial industry instability. Additional initiatives may be proposed or introduced before Congress and other government bodies in the future. Such proposals, if enacted, may further alter the structure, regulation, and competitive relationship among financial institutions and may subject the Company to increased supervision and disclosure and reporting requirements. In addition, the various bank regulatory agencies often adopt new rules and regulations and policies to implement and enforce existing legislation. It cannot be predicted whether, or in what form, any such legislation or regulatory changes in policy may be enacted or the extent to which the business of the Company would be affected thereby.
The Dodd-Frank Act impacts many aspects of the financial industry and, in many cases, will impact larger and smaller financial institutions and community banks differently over time. Many of the following key provisions of the Dodd-Frank Act affecting the financial industry are now either effective or are in the proposed rule or implementation stage:
| • |
the creation of a Financial Services Oversight Counsel to identify emerging systemic risks and improve interagency cooperation; |
| • |
expanded FDIC authority to conduct the orderly liquidation of certain systemically significant non-bank financial companies in addition to depository institutions; |
| • |
the establishment of strengthened capital and liquidity requirements for banks and bank holding companies, including minimum leverage and risk-based capital requirements no less than the strictest requirements in effect for depository institutions as of the date of enactment; |
| • |
the requirement by statute that bank holding companies serve as a source of financial strength for their depository institution subsidiaries; |
| • |
enhanced regulation of financial markets, including the derivative and securitization markets, and the elimination of certain proprietary trading activities by banks ( the “Volcker Rule”); |
| • |
the termination of investments by the U.S. Treasury under the Troubled Asset Relief Program (“TARP”); |
| • |
the elimination and phase out of trust preferred securities from Tier 1 capital generally for banks exceeding $10 billion in assets (the Company is currently exempt); |
| • |
a permanent increase of the previously implemented temporary increase of FDIC deposit insurance to $250,000 and an extension of Federal deposit coverage until January 1, 2013, for the full net amount held by depositors in non-interest bearing transaction accounts; |
| • |
authorization for financial institutions to pay interest on business checking accounts; |
11
Table of Contents
| • |
changes in the calculation of FDIC deposit insurance assessments, such that the assessment base will no longer be the institution’s deposit base, but instead, will be its average consolidated total assets less its average tangible equity; |
| • |
the elimination of remaining barriers to de novo interstate branching by banks; |
| • |
expanded restrictions on transactions with affiliates and insiders under Section 23A and 23B of the Federal Reserve Act and lending limits for derivative transactions, repurchase agreements, and securities lending and borrowing transactions; |
| • |
the elimination of the Office of Thrift Supervision and the transfer of oversight of thrift institutions and their holding companies to the Office of the Comptroller of the Currency or the FDIC and the Federal Reserve; |
| • |
provisions that affect corporate governance and executive compensation at most United States publicly traded companies, including (i) stockholder advisory votes on executive compensation, (ii) executive compensation “clawback” requirements for companies listed on national securities exchanges in the event of materially inaccurate statements of earnings, revenues, gains or other criteria, (iii) enhanced independence requirements for compensation committee members, and (iv) giving the SEC authority to adopt proxy access rules which would permit stockholders of publicly traded companies to nominate candidates for election as director and have those nominees included in a company’s proxy statement; |
| • |
limits on debit card interchange fees charged by issuer banks (commonly known as the Durbin Amendment); and |
| • |
the creation of a Bureau of Consumer Financial Protection, which is authorized to promulgate and enforce consumer protection regulations relating to bank and non-bank financial products and which may examine and enforce its regulations on banks with more than $10 billion in assets. |
In general, more stringent capital, liquidity and leverage requirements are expected to impact our business as the Dodd-Frank Act is fully implemented. The Federal agencies have issued proposed rules which will apply directly to larger institutions with either more than $50 billion in assets or more than $10 billion in assets, such as proposed Federal Reserve regulations for financial institutions deemed systemically significant. The Federal Reserve and the FDIC have proposed rules requiring stress tests and the Federal Reserve has proposed rules to implement the Volcker Rule. Further, the requirements and policies imposed on larger institutions may, in some cases, become “best practices” for smaller institutions. Therefore, as a result of the changes required by the Dodd-Frank Act, the profitability of our business activities may be impacted and we may be required to make changes to certain of our business practices. These changes may also require us to devote significant management attention and resources to evaluate and make any changes necessary to comply with new statutory and regulatory requirements.
State Regulation
BancFirst is an Oklahoma-chartered state bank. Accordingly, BancFirst’s operations are subject to various requirements and restrictions of Oklahoma state law relating to loans, lending limits, interest rates payable on deposits, investments, mergers and acquisitions, borrowings, dividends, capital adequacy, and other matters. However, Oklahoma banking law specifically empowers a state-chartered bank such as BancFirst to exercise the same powers as are conferred upon national banks by the laws of the United States and the regulations and policies of the Office of the Comptroller of the Currency, unless otherwise prohibited or limited by the State Banking Commissioner or the State Banking Board. Accordingly, unless a specific provision of Oklahoma law otherwise provides, a state-chartered bank is empowered to conduct all activities that a national bank may conduct.
National banks are authorized by the GLB Act to engage, through “financial subsidiaries,” in any activity that is permissible for a financial holding company and any activity that the Secretary of the Treasury, in consultation with the Federal Reserve Board, determines is financial in nature or incidental to any such financial
12
Table of Contents
activity, except (1) insurance underwriting, (2) real estate development or real estate investment activities (unless otherwise permitted by law), (3) insurance company portfolio investments and (4) merchant banking. The authority of a national bank to invest in a financial subsidiary is subject to a number of conditions, including, among other things, requirements that the bank must be well managed and well capitalized (after deducting from the bank’s capital outstanding investments in financial subsidiaries). The GLB Act provides that state nonmember banks, such as BancFirst, may invest in financial subsidiaries (assuming they have the requisite investment authority under applicable state law), subject to the same conditions that apply to national bank investments in financial subsidiaries.
As a state nonmember bank, BancFirst is subject to primary supervision, periodic examination and regulation by the State Banking Board and the FDIC, and Oklahoma law provides that BancFirst must maintain reserves against deposits as required by the FDI Act. The Oklahoma State Bank Commissioner is authorized by statute to accept an FDIC examination in lieu of a state examination. In practice, the FDIC and the Oklahoma State Banking Department alternate examinations of BancFirst. If, as a result of an examination of a bank, the Oklahoma Banking Department determines that the financial condition, capital resources, asset quality, earnings prospects, management, liquidity, or other aspects of the bank’s operations are unsatisfactory or that the management of the bank is violating or has violated any law or regulation, various remedies, including the remedy of injunction, are available to the Oklahoma Banking Department. Oklahoma law permits the acquisition of an unlimited number of wholly-owned bank subsidiaries so long as aggregate deposits at the time of acquisition in a multi-bank holding company do not exceed 20% of the total amount of deposits of insured depository institutions located in Oklahoma.
In addition to the provisions of the GLB Act that authorize state nonmember banks to invest in financial subsidiaries (assuming they have the requisite investment authority under applicable state law) on the same conditions that apply to national banks, FDICIA provides that FDIC-insured state banks such as BancFirst may engage directly or through a subsidiary in certain activities that are not permissible for a national bank, if the activity is authorized by applicable state law, the FDIC determines that the activity does not pose a significant risk to the DIF, and the bank is in compliance with its applicable capital standards.
Securities Laws
The Company’s common stock is publicly held and listed on the NASDAQ Global Select Market, and the Company is subject to the periodic reporting, information, proxy solicitation, insider trading, corporate governance and other requirements and restrictions of the Securities Exchange Act of 1934 and the regulations of the SEC promulgated thereunder as well as listing requirements of the NASDAQ. In addition, the Dodd-Frank Act includes provisions that affect corporate governance and executive compensation at most United States publicly traded companies, including the Company, as describe above under “the Dodd-Frank Act”.
The Company is also subject to the accounting oversight and corporate governance requirements of the Sarbanes-Oxley Act of 2002, including:
| • |
required executive certification of financial presentation; |
| • |
increased requirements for board audit committees and their members; |
| • |
enhanced disclosures of controls and procedures and internal control over financial reporting; |
| • |
enhanced controls over, and reporting of, insider trading; and |
| • |
increased penalties for financial crimes and forfeiture of executive bonuses in certain circumstances. |
Available Information
The Company maintains a website at www.bancfirst.com. The Company provides copies of the most recently filed 10-K, 10-Q and proxy statements, and amendments to those reports filed or furnished pursuant to Section 13(a) or 15(d) of the Exchange Act as soon as reasonably practicable after the Company electronically
13
Table of Contents
files the material with, or furnishes it to, the SEC. The website also provides links to the SEC’s website (http://www.sec.gov) where all of the Company’s filings with the SEC can be obtained immediately upon filing. You may also request a copy of the Company’s filings, at no cost, by writing or telephoning us at the following address:
BancFirst Corporation
101 N. Broadway
Oklahoma City, Oklahoma 73102
ATTENTION: Joe T. Shockley, Jr.
Executive Vice President
(405) 270-1086
In the course of conducting our business operations, the Company and our subsidiaries are exposed to a variety of risks that are inherent to the financial services industry. The following discusses some of the key inherent risk factors that could affect our business and operations, as well as other risk factors which are particularly relevant to us in the current period of significant economic and market disruption. Other factors besides those discussed below or elsewhere in this report also could adversely affect our business and operations, and these risk factors should not be considered a complete list of potential risks that may affect the Company and our subsidiaries.
Risks Related to Our Industry
Changes in the economic and financial environment pose significant challenges for us and could adversely affect our financial condition and results of operations.
We currently are operating in a challenging and uncertain economic environment, both nationally and in the local markets that we serve. Financial institutions continue to be affected by sustained declines in the value of financial instruments and real estate values, and while we are taking steps to manage our market and credit risk exposure, we nonetheless are affected by these issues in view of our retaining a securities portfolio and a loan portfolio consisting of commercial and residential construction loans, residential and commercial real estate loans and commercial and industrial loans. Possible declines in the value of our investment securities could result in our recording losses on the other-than-temporary impairment (“OTTI”) of securities, which would reduce our earnings and therefore our capital. Declines in real estate values and home sales, and an increase in the financial stress on borrowers stemming from an uncertain economic environment, including relatively high unemployment, continue to have an adverse effect on our borrowers or their customers, which could adversely impact the repayment of the loans we have made. The overall deterioration in economic conditions also could subject us to increased regulatory scrutiny. In addition, deterioration in local economic conditions, could result in further increases in loan delinquencies; increases in problem assets and foreclosures; and declines in the values of the collateral for our loans, which could reduce our customers’ borrowing power. Furthermore, further deterioration in local economic conditions could drive the level of loan losses beyond the level we have provided for in our loan loss allowance, which could necessitate an increase in our provision for loan losses, which, in turn, would reduce our earnings and capital. Additionally, the demand for our products and services could be reduced, which would adversely impact our liquidity and the level of revenues we generate.
There can be no assurance that actions of the U.S. Government, Federal Reserve and other governmental and regulatory bodies for the purpose of stabilizing the financial markets will achieve the intended effect.
Beginning in the fourth quarter of 2008, the U.S. Government responded to the ongoing financial crisis and economic slowdown by enacting new legislation and expanding or establishing a number of programs and initiatives. The U.S. Treasury, the FDIC and the Federal Reserve Board each have developed programs and facilities, including, among others, the TARP Capital Purchase Program, the Dodd-Frank Act and other efforts, designed to increase inter-bank lending, improve funding for consumer receivables and restore consumer and
14
Table of Contents
counterparty confidence in the banking sector, as more particularly described in “Item 1. Business—Supervision and Regulation.” There can be no assurance as to the impact that any such initiatives or governmental programs will have on the financial markets, including the high levels of volatility and limited credit availability. The failure of these efforts to stabilize the financial markets, the continuation or worsening of current financial market conditions or unintended long-term consequences of these programs or initiatives could materially and adversely affect our business, financial condition, results of operations, access to credit, or the trading price of our common stock and other equity and debt securities.
Fluctuations in interest rates could reduce our profitability.
We realize income primarily from the difference between interest earned on loans and investments and the interest paid on deposits and borrowings. We expect that we will periodically experience “gaps” in the interest rate sensitivities of our assets and liabilities, meaning that either our interest-earning assets will be more sensitive to changes in market interest rates than our interest-bearing liabilities, or vice versa. Changes in market interest rates could either positively or negatively affect our net interest income and our profitability, depending on the magnitude, direction and duration of the change. If interest rates remain low, our net interest margin could experience further compression.
We are unable to predict fluctuations of market interest rates, which are affected by, among other factors, changes in inflation rates, economic growth, money supply, government debt, domestic and foreign financial markets and political developments, including terrorist acts and acts of war. Our asset-liability management strategy, which is designed to mitigate our risk from changes in market interest rates, may not be able to mitigate changes in interest rates from having a material adverse effect on our results of operations and financial condition.
We operate in a highly regulated environment and may be adversely affected by changes in Federal and state laws and regulations.
We are subject to extensive regulation, supervision and examination by Federal and state banking authorities. Any change in applicable regulations or Federal or state legislation could have a substantial impact on us and our results of operations. Additional legislation and regulations may be enacted or adopted in the future that could significantly affect our powers, authority and operations, which could have a material adverse effect on our financial condition and results of operations. Further, regulators have significant discretion and power to prevent or remedy unsafe or unsound practices or violations of laws by banks and bank holding companies in the performance of their supervisory and enforcement duties. The exercise of regulatory power may have a negative impact on our results of operations and financial condition.
We may be required to pay significantly higher FDIC deposit insurance premiums and assessments in the future.
During 2008 and continuing in 2009, higher levels of bank failures dramatically increased resolution costs of the FDIC and depleted the DIF. In addition, the Dodd-Frank Act has permanently increased the maximum amount of deposit insurance for banks, savings institutions and credit unions to $250,000 per depositor, retroactive to January 1, 2009, and noninterest-bearing transactions accounts have unlimited deposit insurance through December 31, 2012. These programs have placed additional stress on the DIF. In order to maintain a strong funding position and restore reserve ratios of the DIF, the FDIC has increased assessment rates of insured depository institutions. In addition, on November 12, 2009, the FDIC adopted a rule requiring banks to prepay three years’ worth of estimated deposit insurance premiums by December 31, 2009. We are generally unable to control the amount of premiums that we are required to pay for FDIC insurance. If additional bank or financial institution failures continue or increase, or if the cost of resolving prior failures exceeds expectations, we may be required to pay even higher FDIC premiums than these recently increased levels. Any future increases or required prepayments of FDIC insurance premiums may adversely impact our earnings and financial condition.
15
Table of Contents
Our FDIC insurance related costs were $3.7 million for the year ended December 31, 2011 compared with $5.7 million and $7.8 million for the years ended December 31, 2010 and 2009, respectively. We are unable to predict the impact in future periods; including whether and when additional special assessments will occur, in the event the economic crisis continues.
Tax law changes may adversely affect our net income, effective tax rate and our overall results of operations and financial condition.
Our financial performance is impacted by Federal and state tax laws. Given the current economic and political environment, and ongoing state budgetary pressures, the enactment of new Federal or state tax legislation may occur. The enactment of such legislation, or changes in the interpretation of existing law, including provisions impacting tax rates, apportionment, consolidation or combination, income, expenses, and credits, may have a material adverse effect on our financial condition and results of operations.
Recently enacted regulatory reforms could have a significant impact on our business, financial condition and results of operations.
Recently enacted and proposed changes in the laws and regulations affecting public companies or financial institutions could cause us to incur increased costs as we evaluate the implications of new rules and respond to new requirements. We continue to evaluate and monitor developments with respect to these new and proposed rules, and we cannot predict or estimate the amount of the additional costs, if any, we may incur or the timing of such costs.
The Dodd-Frank Act represents a significant overhaul of many aspects of the regulation of the financial-services industry, addressing, among other things, systemic risk, capital adequacy, deposit insurance assessments, consumer financial protection, interchange fees, derivatives, lending limits, and changes among the bank regulatory agencies. Many of these provisions are subject to further study, rulemaking, and the discretion of regulatory bodies, such as the Financial Stability Oversight Council, which will regulate the systemic risk of the financial system. While the provisions of the Act receiving the most public attention have generally been those more likely to affect larger institutions with assets over $10 billion and most likely to affect institutions with assets greater than $50 billion, the Dodd-Frank Act also contains many provisions which will affect smaller institutions such as ours in substantial ways. For example, one year after the date of its enactment, the Dodd-Frank Act eliminated the Federal prohibitions on paying interest on business checking accounts, thus allowing businesses to have interest bearing checking accounts. Depending on competitive responses, this significant change to existing law could have an adverse impact on our interest expense. Compliance with the Dodd-Frank Act’s provisions may curtail our revenue opportunities, increase our operating costs, require us to hold higher levels of regulatory capital or liquidity or both or otherwise adversely affect our business or financial results in the future. Our management continues to actively review the provisions of the Dodd-Frank Act and assess its probable impact on our business, financial condition, and results of operations. However, because many aspects of the Dodd-Frank Act are subject to future rulemaking, it is difficult to precisely anticipate its overall financial impact on us at this time.
Changes in monetary policies may have an adverse effect on our business.
Our results of operations are affected by credit policies of monetary authorities, particularly the Federal Reserve. Actions by monetary and fiscal authorities, including the Federal Reserve, could have an adverse effect on our deposit levels, loan demand or business earnings. See “Item 1—Business-Supervision and Regulation.”
Risks Related to Our Business
Our recent results may not be indicative of future results.
We may not be able to sustain our historical rate of growth or may not be able to grow our business at all. Various factors, such as poor economic conditions, changes in interest rates, regulatory and legislative
16
Table of Contents
considerations and competition may also impede or inhibit our ability to expand our market presence. If we experience a significant decrease in our rate of growth, our results of operations and financial condition may be adversely affected due to a high percentage of our operating costs being fixed expenses.
If a significant number of customers fail to perform under their loans, our business, profitability, and financial condition would be adversely affected.
As a lender, we face the risk that a significant number of our borrowers will fail to pay their loans when due. If borrower defaults cause losses in excess of our allowance for loan losses, it could have an adverse effect on our business, profitability, and financial condition. We have established an evaluation process designed to recognize loan losses as they occur. While this evaluation process uses historical and other objective information, the classification of loans and the estimation of loan losses are dependent to a great extent on our experience and judgment. If charge-offs in future periods exceed the allowance for loan losses, we will need additional provisions to increase the allowance for loan losses. Any increases in the allowance for loan losses will result in a decrease in net income and, possibly, capital, and may have a material adverse effect on our financial condition and results of operations. See “Management’s Discussion and Analysis of Financial Condition and Results of Operations” located elsewhere in this report for further discussion related to our process for determining the appropriate level of the allowance for loan losses. We cannot assure you that our future loan losses will not have any material adverse effects on our business, profitability or financial condition.
Adverse changes in economic conditions, especially in the State of Oklahoma, could have a material adverse effect on our business, growth, and profitability.
Our bank subsidiary operates exclusively within the State of Oklahoma and, unlike larger national or superregional banks that serve a broader and more diverse geographic region; our lending is also primarily concentrated in the State of Oklahoma. As a result, our financial condition, results of operations and cash flows are subject to changes in the economic conditions in our state. Our continued success is largely dependent upon the continued growth or stability of the communities we serve. A decline in the economies of these communities could negatively impact our net income and profitability. Additionally, declines in the economies of these communities and of the State of Oklahoma in general could affect our ability to generate new loans or to receive repayments of existing loans, and our ability to attract new deposits, adversely affecting our financial condition.
The soundness of other financial institutions could have a material adverse effect on our business, growth, and profitability.
Financial services institutions are interrelated as a result of trading, clearing, counterparty, or other relationships. We have exposure to many different industries and counterparties, and routinely execute transactions with counterparties in the financial services industry, including commercial banks, brokers and dealers, investment banks, and other institutional clients. Many of these transactions expose our business to credit risk in the event of a default by a counterparty or client. In addition, our credit risk may be exacerbated when the collateral we hold cannot be realized upon or is liquidated at prices not sufficient to recover the full amount of the credit or derivative exposure due to us. Any such losses could have a material adverse effect on our financial condition and results of operations.
Competition with other financial institutions could adversely affect our profitability.
We face vigorous competition from banks and other financial institutions, including savings and loan associations, savings banks, finance companies and credit unions. Certain of these banks and other financial institutions have substantially greater resources and lending limits, larger branch systems and other banking services that we do not offer. To a limited extent, we also compete with other providers of financial services, such as money market mutual funds, brokerage firms, consumer finance companies and insurance companies. When new competitors seek to enter one of our markets, or when existing market participants seek to increase
17
Table of Contents
their market share, they sometimes undercut the pricing and/or credit terms prevalent in that market. This competition may reduce or limit our margins on banking and trust services, reduce our market share and adversely affect our results of operations and financial condition.
A substantial portion of our loan portfolio is secured by real estate, in particular commercial real estate. Continued deterioration in the real estate markets could lead to additional losses, which could have a material negative effect on our financial condition and results of operations.
Loans secured by real estate have been a large portion of our loan portfolio. At December 31, 2011, this percentage was 65.2% compared to 62.6% at December 31, 2010. While our record of asset quality has historically been solid, we cannot guarantee that our record of asset quality will be maintained in future periods. Although we were not, and are not, involved in subprime lending, the ramifications of the subprime lending crisis and the turmoil in the financial and capital markets that followed have been far-reaching, with real estate values declining and unemployment and bankruptcies rising throughout the nation, including the region we serve. The ability of our borrowers to repay their loans could be adversely impacted by the significant change in market conditions, which not only could result in our experiencing an increase in charge-offs, but also could necessitate increasing our provision for loan losses. In addition, because multi-family and commercial real estate (“CRE”) loans represent the majority of our real estate loans outstanding, a decline in tenant occupancy due to such factors or for other reasons could adversely impact the ability of our borrowers to repay their loans on a timely basis, which could have a negative impact on our financial condition and results of operations.
We rely heavily on our management team, and the unexpected loss of key managers may adversely affect our operations.
Our success to-date has been strongly influenced by our ability to attract and to retain senior management experienced in banking and financial services. Our ability to retain executive officers and the current management teams of each of our lines of business will continue to be important to successful implementation of our strategies. We do not have employment or non-compete agreements with these key employees. The unexpected loss of services of any key management personnel, or the inability to recruit and retain qualified personnel in the future, could have an adverse effect on our business and financial results.
Our information systems may experience an interruption or breach in security.
We rely heavily on communications and information systems to conduct our business. Any failure, interruption or breach in security of these systems could result in failures or disruptions in our customer relationship management, general ledger, deposit, loan and other systems. While we have policies and procedures designed to prevent or limit the effect of the failure, interruption or security breach of our information systems, there can be no assurance that any such failures, interruptions or security breaches will not occur or, if they do occur, that they will be adequately addressed. The occurrence of any failures, interruptions or security breaches of our information systems could damage our reputation, result in a loss of customer business, and subject us to additional regulatory scrutiny or civil litigation and possible financial liability, any of which could have a material adverse effect on our financial condition and results of operations.
We rely on certain external vendors.
We are reliant upon certain external vendors to provide products and services necessary to maintain our day-to-day operations. Accordingly, our operations are exposed to risk that these vendors will not perform in accordance with the contracted arrangements under service level agreements. The failure of an external vendor to perform in accordance with the contracted arrangements under service level agreements could be disruptive to our operations, which could have a material adverse impact on our business and, in turn, our financial condition and results of operations.
18
Table of Contents
We are subject to environmental liability risk associated with lending activities.
A significant portion of our loan portfolio is secured by real property. During the ordinary course of business, we may foreclose on and take title to properties securing certain loans. In doing so, there is a risk that hazardous or toxic substances could be found on these properties. If hazardous or toxic substances are found, we may be liable for remediation costs, as well as for personal injury and property damage. Environmental laws may require us to incur substantial expenses and may materially reduce the affected property’s value or limit our ability to use or sell the affected property. In addition, future laws or more stringent interpretations or enforcement policies with respect to existing laws may increase our exposure to environmental liability. Although we have policies and procedures to perform an environmental review before initiating any foreclosure action on real property, these reviews may not be sufficient to detect all potential environmental hazards. The remediation costs and any other financial liabilities associated with an environmental hazard could have a material adverse effect on our financial condition and results of operations.
There can be no assurance that the integration of our acquisitions will be successful or will not result in unforeseen difficulties that may absorb significant management attention.
Our completed acquisitions, or any future acquisition, may not produce the revenue, cost savings, earnings or synergies that we anticipated. The process of integrating acquired companies into our business may also result in unforeseen difficulties. Unforeseen operating difficulties may absorb significant management attention, which we might otherwise devote to our existing business. Also, the process may require significant financial resources that we might otherwise allocate to other activities, including the ongoing development or expansion of our existing operations. Additionally, we may be exposed to potential asset quality issues or unknown or contingent liabilities of the banks, businesses, assets and liabilities we acquire. If these issues or liabilities exceed our estimates, our results of operations and financial condition may be negatively affected.
If we pursue a future acquisition, our management could spend a significant amount of time and effort identifying and completing the acquisition. If we make a future acquisition, we could issue equity securities which would dilute current stockholders’ percentage ownership, incur substantial debt, assume contingent liabilities, incur a one-time charge or be required to record an impairment of goodwill, or any combination of the foregoing.
If we fail to maintain an effective system of internal controls, we may not be able to accurately report our financial results or prevent fraud.
Effective internal controls are necessary for us to provide reliable financial reports and effectively prevent fraud. Any inability to provide reliable financial reports or prevent fraud could harm our business. The Sarbanes-Oxley Act of 2002 requires management and our auditors to evaluate and assess the effectiveness of our internal control over financial reporting. These requirements may be modified, supplemented or amended from time to time. Implementing these changes may take a significant amount of time and may require specific compliance training of our personnel. We have in the past discovered, and may in the future discover, areas of our internal control over financial reporting that need improvement. If we or our auditors discover a material weakness, the disclosure of that fact, even if quickly remedied, could reduce the market’s confidence in our financial statements and have an adverse effect on our stock price. We may not be able to effectively and timely implement necessary control changes and employee training to ensure continued compliance with the Sarbanes-Oxley Act and other regulatory and reporting requirements. Our historic growth and our planned expansion through acquisitions present challenges to maintaining the internal control and disclosure control standards applicable to public companies. If we fail to maintain effective internal controls we could be subject to regulatory scrutiny and sanctions, our ability to recognize revenue could be impaired and investors could lose confidence in the accuracy and completeness of our financial reports. We cannot assure you that we will continue to fully comply with the requirements of the Sarbanes-Oxley Act or that management or our auditors will conclude that our internal control over financial reporting is effective in future periods.
19
Table of Contents
Maintaining or increasing our market share depends on market acceptance and regulatory approval of new products and services.
Our success depends, in part, upon our ability to adapt our products and services to evolving industry standards and consumer demand. There is increasing pressure on financial services companies to provide products and services at lower prices. In addition, the widespread adoption of new technologies, including Internet-based services, could require us to make substantial expenditures to modify or adapt our existing products or services. A failure to achieve market acceptance of any new products we introduce, or a failure to introduce products that the market may demand, could have an adverse effect on our business, profitability, or growth prospects.
We have businesses other than banking.
In addition to commercial banking services, we provide life and other insurance products, as well as other business and financial services. We may in the future develop or acquire other non-banking businesses. As a result of other such businesses, our earnings could be subject to risks and uncertainties that are different from those to which our commercial banking services are subject.
We have a continuing need for technological change.
The financial services industry is undergoing rapid technological changes with frequent introductions of new technology-driven products and services. In addition to better serving our customers, the effective use of technology increases efficiency and enables financial institutions to reduce costs. Our future success will depend in part upon our ability to address the needs of our customers by using technology to provide products and services that will satisfy customer demands for convenience as well as to create additional efficiencies in our operations as we continue to grow and expand our market area. Many of our larger competitors have substantially greater resources to invest in technological improvements. As a result, they may be able to offer additional or superior products to those that we will be able to offer, which would put us at a competitive disadvantage. Accordingly, we cannot assure you that we will be able to effectively implement new technology-driven products and services or be successful in marketing such products and services to our customers.
The recent repeal of Federal prohibitions on payment of interest on business checking accounts could increase our Company’s interest expense.
All Federal prohibitions on the ability of financial institutions to pay interest on business checking accounts were repealed as part of the Dodd-Frank Act beginning on July 21, 2011. As a result, some financial institutions have commenced offering interest on business checking accounts to compete for customers. We do not yet know what interest rates other institutions may offer as market interest rates begin to increase. Our interest expense will increase and our net interest margin will decrease if we begin offering interest on business checking accounts to attract additional customers or maintain current customers, which could have a material adverse effect on our business, financial condition and results of operations.
We may need to raise additional capital in the future, and such capital may not be available when needed or at all.
We may need to raise additional capital in the future to provide us with sufficient capital resources and liquidity to meet our commitments and business needs, particularly if our asset quality or earnings were to deteriorate significantly. Our ability to raise additional capital, if needed, will depend on, among other things, conditions in the capital markets at that time, which are outside of our control, and our financial performance. Economic conditions and the loss of confidence in financial institutions may increase our cost of funding and limit access to certain customary sources of capital, including inter-bank borrowings, repurchase agreements and borrowings from the discount window of the Federal Reserve.
20
Table of Contents
We cannot assure that such capital will be available on acceptable terms or at all. Any occurrence that may limit our access to the capital markets, such as a decline in the confidence of debt purchasers, depositors or counterparties participating in the capital markets, or a downgrade of our debt ratings, may adversely affect our capital costs and our ability to raise capital and, in turn, our liquidity. Moreover, if we need to raise capital in the future, we may have to do so when many other financial institutions are also seeking to raise capital and we would have to compete with those institutions for investors. An inability to raise additional capital on acceptable terms when needed could have a materially adverse effect on our businesses, financial condition and results of operations.
Risks Associated with Our Common Stock
Our stock price can be volatile.
Investors should carefully consider the risks described in this “Risk Factors” section and the other information in this report, including our consolidated financial statements with related notes and documents incorporated by reference. If any of these risks or other risks, which have not been identified or which we may believe are immaterial or unlikely, actually occur, our business, financial condition and results of operations could be harmed. Stock price volatility may make it more difficult for you to resell your common stock when you want and at prices you find attractive. Our stock price can fluctuate significantly in response to a variety of factors including, among other things: actual or anticipated variations in quarterly results of operations; recommendations by securities analysts; operating and stock price performance of other companies that investors deem comparable to us; news reports relating to trends, concerns and other issues in the financial services industry; perceptions in the marketplace regarding us and/or our competitors; new technology used, or services offered by competitors; significant acquisitions or business combinations, strategic partnerships, joint ventures or capital commitments by or involving us or our competitors; failure to integrate acquisitions or realize anticipated benefits from acquisitions; changes in government regulations; and geopolitical conditions such as acts or threats of terrorism or military conflicts.
General market fluctuations, industry factors and general economic and political conditions and events, such as economic slowdowns or recessions, interest rate changes or credit loss trends, could also cause our stock price to decrease regardless of operating results.
We may not continue to pay dividends on our common stock in the future.
We have historically paid a common stock dividend. However, BancFirst Corporation is a bank holding company, and our ability to declare and pay dividends is dependent on certain Federal regulatory considerations, including the guidelines of the Federal Reserve regarding capital adequacy and dividends. In the current stressed financial markets and declining economy, which has resulted in higher FDIC insurance premiums and special assessments on FDIC-insured financial institutions, including the Bank, there can be no certainty that our common dividend will continue to be paid at the current levels. It is possible that our common dividend could be reduced or even cease to be paid. In such case, the trading price of our common stock could decline, and investors may lose all or part of their investment.
An investment in our common stock is not an insured deposit.
Our common stock is not a bank deposit and, therefore, is not insured against loss by the FDIC, any other deposit insurance fund or by any other public or private entity. Investment in our common stock is inherently risky for the reasons described in this “Risk Factors” section and elsewhere in this report and is subject to the same market forces that affect the price of common stock in any company. As a result, if you acquire our common stock, you could lose some or all of your investment.
21
Table of Contents
Our directors and executive officers own a significant portion of our common stock and can influence stockholder decisions.
Our directors and executive officers, as a group, beneficially owned approximately 53% of our outstanding common stock as of February 28, 2012. As a result of their ownership, the directors and executive officers have the ability, by voting their shares in concert, to influence the outcome of any matter submitted to our stockholders for approval, including the election of directors. The directors and executive officers may vote to cause us to take actions with which our other stockholders do not agree.
Our stockholder rights plan, amended and restated certificate of incorporation, as well as provisions of Oklahoma law, could make it difficult for a third party to acquire our company.
We have a stockholder rights plan that may have the effect of discouraging unsolicited takeover proposals. The rights issued under the stockholder rights plan would cause substantial dilution to a person or group that attempts to acquire us on terms not approved in advance by our board of directors. In addition, Oklahoma corporate law and our amended and restated certificate of incorporation contain provisions that could delay, deter or prevent a change in control of our company or our management. Together, these provisions may discourage transactions that otherwise could provide for the payment of a premium over prevailing market prices of our common stock, and also could limit the price that investors are willing to pay in the future for shares of our common stock.
The trading volume in our common stock is less than that of other larger financial services companies.
Although our common stock is listed for trading on the NASDAQ Global Select Market, the trading volume in our common stock is less than that of other, larger financial services companies. A public trading market having the desired characteristics of depth, liquidity and orderliness depends on the presence in the marketplace of willing buyers and sellers of our common stock at any given time. This presence depends on the individual decisions of investors and general economic and market conditions over which we have no control. Given the lower trading volume of our common stock, significant sales of our common stock, or the expectation of these sales, could cause our stock price to fall.
None.
The principal offices of the Company are located at 101 North Broadway, Oklahoma City, Oklahoma 73102. The Company owns substantially all of the properties and buildings in which its various offices and facilities are located. These properties include the main bank, a technology and operations center and 92 branches. BancFirst also owns properties for future expansion. There are no significant encumbrances on any of these properties. (See Note 6—“Premises and Equipment, Net” to the Consolidated Financial Statements for further information on the Company’s properties).
The Company has been named as a defendant in various legal actions arising from the conduct of its normal business activities. Although the amount of any liability that could arise with respect to these actions cannot be accurately predicted, in the opinion of the Company, any such liability will not have a material adverse effect on the consolidated financial statements of the Company.
22
Table of Contents
Common Stock Market Prices and Dividends
The Company’s Common Stock is listed on the NASDAQ Global Select Market System (“NASDAQ/GS”) and is traded under the symbol “BANF”. The following table sets forth, for the periods indicated, (i) the high and low sales prices of the Company’s Common Stock as reported in the NASDAQ/GS consolidated transaction reporting system and (ii) the quarterly dividends per share declared on the Common Stock.
| Price Range | ||||||||||||
| High | Low |
Cash
Dividends Declared |
||||||||||
|
2011 |
||||||||||||
|
Fourth Quarter |
$ | 40.85 | $ | 31.35 | $ | 0.27 | ||||||
|
Third Quarter |
$ | 39.98 | $ | 30.50 | $ | 0.27 | ||||||
|
Second Quarter |
$ | 43.06 | $ | 35.03 | $ | 0.25 | ||||||
|
First Quarter |
$ | 44.67 | $ | 40.50 | $ | 0.25 | ||||||
|
2010 |
||||||||||||
|
Fourth Quarter |
$ | 43.58 | $ | 39.70 | $ | 0.25 | ||||||
|
Third Quarter |
$ | 41.88 | $ | 34.87 | $ | 0.25 | ||||||
|
Second Quarter |
$ | 47.15 | $ | 36.23 | $ | 0.23 | ||||||
|
First Quarter |
$ | 44.20 | $ | 35.58 | $ | 0.23 | ||||||
As of February 28, 2012 there were 326 holders of record of the Common Stock. The closing price of our Common Stock on February 28, 2012 was $41.55 per share.
Future dividend payments will be determined by the Company’s Board of Directors in light of the earnings and financial condition of the Company and the Bank, their capital needs, applicable governmental policies and regulations and such other factors as the Board of Directors deems appropriate.
BancFirst Corporation is a legal entity separate and distinct from the Bank, and its ability to pay dividends is substantially dependent upon dividend payments received from the Bank. Various laws, regulations and regulatory policies limit the Bank’s ability to pay dividends to BancFirst Corporation, as well as BancFirst Corporation’s ability to pay dividends to its stockholders. See “Liquidity and Funding” and “Capital Resources” under “Management’s Discussion and Analysis of Financial Condition and Results of Operations,” “Description of Business-Supervision and Regulation” and Note (15) of the Notes to Consolidated Financial Statements for further information regarding limitations on the payment of dividends by BancFirst Corporation and the Bank.
Stock Repurchases
In November 1999, the Company adopted a Stock Repurchase Program (the “SRP”). The SRP may be used as a means to increase earnings per share and return on equity, to purchase treasury stock for the exercise of stock options or for distributions under the Deferred Stock Compensation Plan, to provide liquidity for optionees to dispose of stock from exercises of their stock options, and to provide liquidity for stockholders wishing to sell their stock. All shares repurchased under the SRP have been retired and not held as treasury stock. The timing, price and amount of stock repurchases under the SRP may be determined by management and approved by the Company’s Executive Committee. At December 31, 2011 there were 241,751 shares remaining that could be repurchased under the Company’s November 1999 Stock Repurchase Program. The amount approved is subject to amendment. The Stock Repurchase Program will remain in effect until all shares are repurchased.
23
Table of Contents
The following table provides information with respect to purchases made by or on behalf of the Company or any “affiliated purchaser” (as defined in Rule 10b-18(a)(3) under the Securities Exchange Act of 1934), of the Company’s common stock during the three months ended December 31, 2011.
|
Period |
Total Number of
Shares Purchased |
Average Price
Paid Per Share |
Total Number of
Shares Purchased as Part of Publicly Announced Plan |
Maximum
Number of Shares That May Yet Be Purchased Under the Plan at the End of the Period |
||||||||||||
|
October 1, 2011 to October 31, 2011 (1) |
5,305 | $ | 32.72 | — | 258,529 | |||||||||||
|
November 1, 2011 to November 30, 2011 (1) |
16,778 | $ | 34.17 | — | 241,751 | |||||||||||
|
December 1, 2011 to December 31, 2011 |
— | $ | — | — | 241,751 | |||||||||||
| (1) | Represents repurchases made in connection with the Company’s November 1999 Stock Repurchase Program. The amount approved is subject to amendment. The Stock Repurchase Program will remain in effect until all shares are repurchased. |
Performance Graph
The Company’s performance graph is incorporated by reference from “Company Performance” contained on the last page of this 10-K report.
24
Table of Contents
The following table sets forth certain historical consolidated financial data as of and for the five years ended December 31, 2011. The historical consolidated financial data has been derived from our audited consolidated financial statements. The historical consolidated financial data should be read in conjunction with Management’s Discussion and Analysis of Financial Condition and Results of Operations and our audited consolidated financial statements and the related notes included elsewhere in this report.
| At and for the Year Ended December 31, | ||||||||||||||||||||
| 2011 | 2010 | 2009 | 2008 | 2007 | ||||||||||||||||
| (Dollars in thousands, except per share data) | ||||||||||||||||||||
|
Income Statement Data |
||||||||||||||||||||
|
Net interest income |
$ | 156,897 | $ | 142,757 | $ | 131,304 | $ | 139,006 | $ | 148,033 | ||||||||||
|
Provision for loan losses |
4,515 | 2,954 | 10,389 | 10,676 | 3,329 | |||||||||||||||
|
Noninterest income |
76,961 | 69,938 | 66,881 | 74,486 | 71,391 | |||||||||||||||
|
Noninterest expense |
158,646 | 144,095 | 139,117 | 135,006 | 134,446 | |||||||||||||||
|
Net income |
45,621 | 42,309 | 32,609 | 44,358 | 53,093 | |||||||||||||||
|
Balance Sheet Data |
||||||||||||||||||||
|
Total assets |
$ | 5,608,825 | $ | 5,060,249 | $ | 4,416,115 | $ | 3,867,204 | $ | 3,743,006 | ||||||||||
|
Securities |
614,977 | 743,803 | 416,170 | 449,780 | 461,884 | |||||||||||||||
|
Total loans (net of unearned interest) |
3,013,498 | 2,811,964 | 2,738,654 | 2,757,854 | 2,487,099 | |||||||||||||||
|
Allowance for loan losses |
37,656 | 35,745 | 36,383 | 34,290 | 29,127 | |||||||||||||||
|
Deposits |
5,037,735 | 4,503,754 | 3,929,016 | 3,377,608 | 3,288,504 | |||||||||||||||
|
Long-term borrowings |
18,476 | 34,265 | — | — | 606 | |||||||||||||||
|
Junior subordinated debentures |
36,083 | 28,866 | 26,804 | 26,804 | 26,804 | |||||||||||||||
|
Stockholders’ equity |
483,041 | 458,594 | 430,750 | 413,791 | 371,962 | |||||||||||||||
|
Per Common Share Data |
||||||||||||||||||||
|
Net income—basic |
$ | 2.99 | $ | 2.76 | $ | 2.13 | $ | 2.91 | $ | 3.41 | ||||||||||
|
Net income—diluted |
2.93 | 2.70 | 2.09 | 2.85 | 3.33 | |||||||||||||||
|
Cash dividends |
1.04 | 0.96 | 0.90 | 0.84 | 0.76 | |||||||||||||||
|
Book value |
31.95 | 29.84 | 28.14 | 27.08 | 24.44 | |||||||||||||||
|
Tangible book value |
28.07 | 26.19 | 25.41 | 24.34 | 21.66 | |||||||||||||||
|
Selected Financial Ratios |
||||||||||||||||||||
|
Performance ratios: |
||||||||||||||||||||
|
Return on average assets |
0.85 | % | 0.92 | % | 0.78 | % | 1.17 | % | 1.49 | % | ||||||||||
|
Return on average stockholders’ equity |
9.65 | 9.45 | 7.70 | 11.30 | 14.66 | |||||||||||||||
|
Cash dividends payout ratio |
34.78 | 34.78 | 42.25 | 28.87 | 22.29 | |||||||||||||||
|
Net interest spread |
2.96 | 3.06 | 2.97 | 3.31 | 3.59 | |||||||||||||||
|
Net interest margin |
3.20 | 3.37 | 3.42 | 4.05 | 4.63 | |||||||||||||||
|
Efficiency ratio |
67.84 | 67.75 | 70.20 | 63.24 | 61.27 | |||||||||||||||
|
Balance Sheet Ratios: |
||||||||||||||||||||
|
Average loans to deposits |
60.64 | % | 67.58 | % | 74.57 | % | 78.82 | % | 76.04 | % | ||||||||||
|
Average earning assets to total assets |
92.49 | 92.74 | 92.56 | 91.23 | 90.86 | |||||||||||||||
|
Average stockholders’ equity to average assets |
8.85 | 9.74 | 10.15 | 10.35 | 10.18 | |||||||||||||||
|
Asset Quality Ratios: |
||||||||||||||||||||
|
Nonperforming and restructured loans to total loans |
0.76 | % | 1.00 | % | 1.46 | % | 0.86 | % | 0.54 | % | ||||||||||
|
Nonperforming and restructured assets to total assets |
0.71 | 1.01 | 1.13 | 0.72 | 0.40 | |||||||||||||||
|
Allowance for loan losses to total loans |
1.25 | 1.27 | 1.33 | 1.24 | 1.17 | |||||||||||||||
|
Allowance for loan losses to nonperforming and restructured loans |
163.54 | 127.25 | 91.06 | 144.52 | 215.57 | |||||||||||||||
|
Net charge-offs to average loans |
0.09 | 0.13 | 0.30 | 0.21 | 0.08 | |||||||||||||||
25
Table of Contents
Taxable Equivalent Basis (Dollars in thousands)
| December 31, 2011 | December 31, 2010 | December 31, 2009 | ||||||||||||||||||||||||||||||||||
|
Average
Balance |
Interest
Income/ Expense |
Average
Yield/ Rate |
Average
Balance |
Interest
Income/ Expense |
Average
Yield/ Rate |
Average
Balance |
Interest
Income/ Expense |
Average
Yield/ Rate |
||||||||||||||||||||||||||||
|
ASSETS |
||||||||||||||||||||||||||||||||||||
|
Earning assets: |
||||||||||||||||||||||||||||||||||||
|
Loans (1) |
$ | 2,893,263 | $ | 164,484 | 5.69 | % | $ | 2,761,986 | $ | 155,131 | 5.62 | % | $ | 2,749,544 | $ | 153,059 | 5.57 | % | ||||||||||||||||||
|
Securities—taxable |
571,193 | 12,321 | 2.16 | 481,783 | 12,378 | 2.57 | 379,702 | 13,436 | 3.54 | |||||||||||||||||||||||||||
|
Securities—tax exempt |
69,921 | 2,889 | 4.13 | 36,228 | 1,913 | 5.28 | 38,081 | 2,151 | 5.65 | |||||||||||||||||||||||||||
|
Federal funds sold and interest-bearing deposits with banks |
1,410,788 | 3,585 | 0.25 | 982,059 | 2,474 | 0.25 | 695,167 | 2,241 | 0.32 | |||||||||||||||||||||||||||
|
|
|
|
|
|
|
|
|
|
|
|
|
|||||||||||||||||||||||||
|
Total earning assets |
4,945,165 | 183,279 | 3.71 | 4,262,056 | 171,896 | 4.03 | 3,862,494 | 170,887 | 4.42 | |||||||||||||||||||||||||||
|
|
|
|
|
|
|
|
|
|
|
|
|
|||||||||||||||||||||||||
|
Nonearning assets: |
||||||||||||||||||||||||||||||||||||
|
Cash and due from banks |
142,256 | 108,440 | 113,207 | |||||||||||||||||||||||||||||||||
|
Interest receivable and other assets |
295,963 | 261,521 | 233,885 | |||||||||||||||||||||||||||||||||
|
Allowance for loan losses |
(36,729 | ) | (36,466 | ) | (36,607 | ) | ||||||||||||||||||||||||||||||
|
|
|
|
|
|
|
|||||||||||||||||||||||||||||||
|
Total nonearning assets |
401,490 | 333,495 | 310,485 | |||||||||||||||||||||||||||||||||
|
|
|
|
|
|
|
|||||||||||||||||||||||||||||||
|
Total assets |
$ | 5,346,655 | $ | 4,595,551 | $ | 4,172,979 | ||||||||||||||||||||||||||||||
|
|
|
|
|
|
|
|||||||||||||||||||||||||||||||
|
LIABILITIES AND STOCKHOLDERS’ EQUITY |
||||||||||||||||||||||||||||||||||||
|
Interest-bearing liabilities: |
||||||||||||||||||||||||||||||||||||
|
Transaction deposits |
$ | 709,609 | $ | 1,423 | 0.20 | % | $ | 612,442 | $ | 1,404 | 0.23 | % | $ | 518,914 | $ | 1,218 | 0.23 | % | ||||||||||||||||||
|
Savings deposits |
1,633,555 | 8,981 | 0.55 | 1,424,252 | 12,215 | 0.86 | 1,228,697 | 15,513 | 1.26 | |||||||||||||||||||||||||||
|
Time deposits |
921,984 | 11,467 | 1.24 | 838,589 | 12,462 | 1.49 | 885,403 | 19,777 | 2.23 | |||||||||||||||||||||||||||
|
Short-term borrowings |
8,276 | 58 | 0.70 | 3,099 | 6 | 0.19 | 2,883 | 11 | 0.38 | |||||||||||||||||||||||||||
|
Long-term borrowings |
31,826 | 882 | 2.77 | 3,129 | 61 | 1.95 | — | — | — | |||||||||||||||||||||||||||
|
Junior subordinated debentures |
32,287 | 2,184 | 6.76 | 27,284 | 1,993 | 7.30 | 26,804 | 1,966 | 7.33 | |||||||||||||||||||||||||||
|
|
|
|
|
|
|
|
|
|
|
|
|
|||||||||||||||||||||||||
|
Total interest-bearing liabilities |
3,337,537 | 24,995 | 0.75 | 2,908,795 | 28,141 | 0.97 | 2,662,701 | 38,485 | 1.45 | |||||||||||||||||||||||||||
|
|
|
|
|
|
|
|
|
|
|
|
|
|||||||||||||||||||||||||
|
Interest-free funds: |
||||||||||||||||||||||||||||||||||||
|
Noninterest-bearing deposits |
1,506,371 | 1,211,712 | 1,054,291 | |||||||||||||||||||||||||||||||||
|
Interest payable and other liabilities |
29,755 | 27,487 | 32,239 | |||||||||||||||||||||||||||||||||
|
Stockholders’ equity |
472,992 | 447,557 | 423,748 | |||||||||||||||||||||||||||||||||
|
|
|
|
|
|
|
|||||||||||||||||||||||||||||||
|
Total interest free-funds |
2,009,118 | 1,686,756 | 1,510,278 | |||||||||||||||||||||||||||||||||
|
|
|
|
|
|
|
|||||||||||||||||||||||||||||||
|
Total liabilities and stockholders’ equity |
$ | 5,346,655 | $ | 4,595,551 | $ | 4,172,979 | ||||||||||||||||||||||||||||||
|
|
|
|
|
|
|
|||||||||||||||||||||||||||||||
|
Net interest income |
$ | 158,284 | $ | 143,755 | $ | 132,402 | ||||||||||||||||||||||||||||||
|
|
|
|
|
|
|
|||||||||||||||||||||||||||||||
|
Net interest spread |
2.96 | % | 3.06 | % | 2.97 | % | ||||||||||||||||||||||||||||||
|
|
|
|
|
|
|
|||||||||||||||||||||||||||||||
|
Net interest margin |
3.20 | % | 3.37 | % | 3.42 | % | ||||||||||||||||||||||||||||||
|
|
|
|
|
|
|
|||||||||||||||||||||||||||||||
| (1) | Nonaccrual loans are included in the average loan balances and any interest on such nonaccrual loans is recognized on a cash basis. |
26
Table of Contents
The following discussion and analysis presents factors that the Company believes are relevant to an assessment and understanding of the Company’s financial position and results of operations for the three years ended December 31, 2011. This discussion and analysis should be read in conjunction with the consolidated financial statements and notes thereto and the selected consolidated financial data included herein.
FORWARD LOOKING STATEMENTS
The Company may make forward-looking statements within the meaning of Section 27A of the Securities Act of 1933 and Section 21E of the Securities Exchange Act of 1934 with respect to earnings, credit quality, corporate objectives, interest rates and other financial and business matters. Forward-looking statements include estimates and give management’s current expectations or forecasts of future events. The Company cautions readers that these forward-looking statements are subject to numerous assumptions, risks and uncertainties, including economic conditions; the performance of financial markets and interest rates; legislative and regulatory actions and reforms; competition; as well as other factors, all of which change over time. Actual results may differ materially from forward-looking statements.
SUMMARY
BancFirst Corporation’s net income for 2011 was $45.6 million, or $2.93 per diluted share, compared to $42.3 million, or $2.70 per diluted share for 2010 and $32.6 million, or $2.09 per diluted share for 2009.
In 2011, net interest income was $156.9 million, compared to $142.8 million in 2010 and $131.3 million in 2009. The Company’s net interest margin was 3.20% for 2011, down 17 basis points from 3.37% in 2010 and down 22 basis points from 3.42% in 2009. Provision for loan losses was $4.5 million in 2011 compared to $3.0 million in 2010 and $10.4 million in 2009. Noninterest income was $77.0 million in 2011 compared to $69.9 million in 2010 and $66.9 million in 2009, while noninterest expense was $158.6 million in 2011 compared to $144.1 million in 2010 and $139.1 million in 2009. The earnings of the Company in 2011 and 2010 were affected primarily by the continued low interest rate environment which resulted in a slightly lower net interest margin partially offset by growth in earning assets.
Total assets at December 31, 2011 were $5.6 billion, up from $5.1 billion at December 31, 2010 and $4.4 billion at December 31, 2009. Total loans at December 31, 2011 were $3.0 billion versus $2.8 billion for 2010 and $2.7 billion for 2009. Total deposits increased to $5.0 billion from $4.5 billion for 2010 and $3.9 billion for 2009. The Company’s liquidity remains strong as its average loan-to-deposit ratio was 60.6% for 2011, compared to 67.6% for 2010 and 74.6% for 2009. Stockholders’ equity was $483.0 million compared to $458.6 million for 2010 and $430.8 million for 2009. Average stockholders’ equity to average assets was 8.85% at December 31, 2011, compared to 9.74% at December 31, 2010 and 10.15% at December 31, 2009.
Asset quality improved in 2011 as measured by a ratio of nonperforming and restructured assets to total assets of 0.71% for the year ended December 31, 2011, compared to 1.01% at December 31, 2010 and 1.13% at December 31, 2009. The Company sold a commercial property held in other real estate owned valued at $6.0 million in the first quarter of 2011. The allowance for loan losses equaled 163.5% of nonperforming and restructured loans at December 31, 2011, versus 127.2% at the end of 2010 and 91.1% at the end of 2009. Net charge-offs to average loans for 2011 decreased to 0.09%, compared to 0.13% for 2010 and 0.30% for 2009. The allowance for loan losses as a percentage of total loans was 1.25% in 2011 compared to 1.27% in 2010 and 1.33% in 2009.
On January 19, 2012, Council Oak Investment Corporation, a wholly-owned subsidiary of BancFirst completed the sale of one of its investments that resulted in a pretax gain of approximately $4.5 million. After related expenses and income taxes, the increase in net income approximated $2.6 million or $0.17 per share on a fully diluted basis. The gain will be included in first quarter 2012 earnings.
27
Table of Contents
On July 12, 2011, the Company completed the acquisition of FBC Financial Corporation and its subsidiary bank, 1st Bank Oklahoma with banking locations in Claremore, Verdigris, and Inola, Oklahoma. The Company paid a premium of $1.5 million above the equity capital of FBC Financial Corporation. At acquisition, 1st Bank Oklahoma had approximately $217 million in total assets, $116 million in loans, $178 million in deposits and $18 million in equity capital. 1st Bank Oklahoma operated as a subsidiary of BancFirst Corporation until it was merged into BancFirst on February 17, 2012. The acquisition did not have a material effect on the Company’s consolidated financial statements.
The Federal Reserve enacted a final rule on June 29, 2011 establishing the debit card interchange rate at $0.21 per transaction and five basis points multiplied by the value of the transaction that was effective on October 1, 2011 for banks exceeding $10 billion in assets. Although the rule does not apply directly to the Company, the possible competitive response may have an impact on the Company’s pricing of these services.
On December 15, 2010, the Company completed the acquisition of OK Bancorporation, Inc., and its subsidiary bank, The Okemah National Bank. At acquisition, The Okemah National Bank had approximately $73 million in total assets, $32 million in loans, $62 million in deposits, and $9 million in equity capital. The Okemah National Bank operated as a subsidiary of BancFirst Corporation until it was merged into BancFirst on October 21, 2011. The acquisition did not have a material effect on the Company’s consolidated financial statements.
On December 10, 2010, the Company completed the acquisition of Exchange Bancshares of Moore, Inc., and its subsidiary bank, Exchange National Bank of Moore. At acquisition, Exchange National Bank of Moore had approximately $147 million in total assets, $47 million in loans, $116 million in deposits, and $10 million in equity capital. Exchange National Bank operated as a subsidiary of BancFirst Corporation until it was merged into BancFirst on June 17, 2011. The acquisition did not have a material effect on the Company’s consolidated financial statements.
On October 8, 2010, the Company completed the acquisition of Union National Bancshares, Inc., and its subsidiary bank, Union Bank of Chandler with offices in Chandler and Tulsa, Oklahoma. At acquisition, Union Bank of Chandler had approximately $134 million in total assets, $90 million in loans, $117 million in deposits, and $15 million in equity capital. Union Bank of Chandler operated as a subsidiary of BancFirst Corporation until it was merged into BancFirst on November 12, 2010. The acquisition did not have a material effect on the Company’s consolidated financial statements.
The Company recorded a total of $13.3 million of goodwill and core deposit intangibles as a result of the three acquisitions completed in 2010. The combined acquisitions added approximately $371 million in total assets, $169 million in loans and $295 million in deposits. The effects of these acquisitions are included in the consolidated financial statements of the Company from the date of acquisition forward. The Company does not believe these acquisitions, individually or in aggregate are material to the Company’s consolidated financial statements.
Effective June 30, 2010, the Company ceased participation in the Transaction Account Guarantee Program (“TAGP”) for extended coverage of noninterest-bearing transaction deposit accounts. Accordingly, the standard deposit insurance amount was in effect for the Company’s deposit accounts through December 31, 2010. In November 2010, the Federal Deposit Insurance Corporation (“FDIC”) issued a final rule to implement provisions of the Dodd-Frank Act that provide for temporary unlimited coverage for noninterest-bearing transaction accounts. The separate coverage for noninterest-bearing transaction accounts became effective on December 31, 2010 and terminates on December 31, 2012.
On April 1, 2010, the Company’s insurance agency BancFirst Insurance Services, Inc., formerly known as Wilcox, Jones & McGrath, Inc., completed its acquisition of RBC Agency, Inc., which had offices in Shawnee and Stillwater. BancFirst Insurance Services, Inc. also has offices in Oklahoma City, Tulsa, Lawton and Muskogee. The acquisition did not have a material effect on the Company’s consolidated financial statements.
28
Table of Contents
On March 21, 2010, Congress passed student loan reform legislation centralizing student lending in a governmental agency, which as of June 30, 2010 resulted in an end to the student loan programs provided by the Company. The Company sold all student loans held for sale of $144.5 million in October 2010. As of December 31, 2011, the Company had approximately $46.7 million of student loans held for investment remaining in the loan portfolio.
On December 8, 2009, the Company completed the acquisition of First Jones Bancorporation. On November 30, 2009, First State Bank, Jones, the subsidiary bank, had approximately $36 million in assets, $31 million in deposits, and $4.5 million in equity capital. First State Bank, Jones operated as a subsidiary of BancFirst Corporation until it was merged into BancFirst in early March 2010. The acquisition enhanced the presence of BancFirst in eastern Oklahoma County. The acquisition did not have a material effect on the Company’s consolidated financial statements.
In November 2009, the FDIC issued a rule that required insured depository institutions to prepay their estimated quarterly risk-based assessments for the fourth quarter of 2009 and for all of 2010, 2011 and 2012. In December 2009, the Company paid $20.2 million in prepaid risk-based assessments, which included $1.2 million related to the fourth quarter of 2009 that would have otherwise been payable in the first quarter of 2010. This amount is included in deposit insurance expense for 2009. Prepaid deposit insurance of approximately $12.3 million and $15.0 million was included in other assets in the accompanying consolidated balance sheets as of December 31, 2011 and 2010, respectively.
On May 22, 2009 the FDIC increased deposit insurance premiums and imposed a Special Assessment on member financial institutions that was based on June 30, 2009 assets less tier one capital. These increases caused the Company’s noninterest expense to increase in 2009. The amount of $1.9 million was expensed on June 30, 2009.
The Company did not accept funds from the U.S. Treasury’s Capital Purchase Program and also did not participate in the Debt Guarantee Program for newly issued senior unsecured debt. The Company’s capital levels have continued to exceed the well-capitalized guidelines.
CRITICAL ACCOUNTING POLICIES AND ESTIMATES
The Company’s significant accounting policies are described in Note (1) to the consolidated financial statements. The preparation of financial statements in conformity with accounting principles generally accepted in the United States inherently involves the use of estimates and assumptions, which affect the amounts reported in the financial statements and the related disclosures. These estimates relate principally to the allowance for loan losses, income taxes, intangible assets and the fair value of financial instruments. Such estimates and assumptions may change over time and actual amounts realized may differ from those reported. The following is a summary of the accounting policies and estimates that management believes are the most critical.
Allowance for Loan Losses
The allowance for loan losses is management’s estimate of the probable losses incurred in the Company’s loan portfolio through the balance sheet date.
The allowance for loan losses is increased by provisions charged to operating expense and is reduced by net loan charge-offs. The amount of the allowance for loan losses is based on past loan loss experience, evaluations of known impaired loans, levels of adversely classified loans, general economic conditions and other environmental factors. A loan is considered impaired when it is probable that the Company will be unable to collect all amounts due according to the contractual terms of the loan agreement. The majority of the Company’s impaired loans are collateral dependent. For collateral dependent loans, the amount of impairment is measured based upon the fair value of the underlying collateral and is included in the allowance for loan losses.
29
Table of Contents
The amount of the allowance for loan losses is first estimated by each business unit’s management based on their evaluation of their unit’s portfolio. This evaluation involves identifying impaired and adversely classified loans. Specific allowances for losses are determined for impaired loans based on either the loans’ estimated discounted cash flows or the fair values of the collateral. Allowances for adversely classified loans are estimated using historical loss percentages for each type of loan adjusted for various economic and environmental factors related to the underlying loans. An allowance is also estimated for non-adversely classified loans using a historical loss percentage based on losses arising specifically from non-adversely classified loans, adjusted for various economic and environmental factors related to the underlying loans. Each month the Company’s Senior Loan Committee reviews each business unit’s allowance, and the aggregate allowance for the Company and, on a quarterly basis, adjusts and approves the adequacy of the allowance. In addition, annually or more frequently as needed, the Senior Loan Committee evaluates and establishes the loss percentages used in the estimates of the allowance based on historical loss data, and giving consideration to their assessment of current economic and environmental conditions. To facilitate the Senior Loan Committee’s evaluation, the Company’s Asset Quality Department performs periodic reviews of each of the Company’s business units and reports on the adequacy of management’s identification of impaired and adversely classified loans, and their adherence to the Company’s loan policies and procedures.
The process of evaluating the adequacy of the allowance for loan losses necessarily involves the exercise of judgment and consideration of numerous subjective factors and, accordingly, there can be no assurance that the estimate of incurred losses will not change in light of future developments and economic conditions. Different assumptions and conditions could result in a materially different amount for the allowance for loan losses.
Income Taxes
The Company files a consolidated income tax return. Deferred taxes are recognized under the liability method based upon the future tax consequences of temporary differences between the carrying amounts and tax basis of assets and liabilities, using the tax rates expected to apply to taxable income in the periods when the related temporary differences are expected to be realized.
The amount of accrued current and deferred income taxes is based on estimates of taxes due or receivable from taxing authorities either currently or in the future. Changes in these accruals are reported as tax expense, and involve estimates of the various components included in determining taxable income, tax credits, other taxes and temporary differences. Changes periodically occur in the estimates due to changes in tax rates, tax laws and regulations, and implementation of new tax planning strategies. The process of determining the accruals for income taxes necessarily involves the exercise of considerable judgment and consideration of numerous subjective factors.
Management performs an analysis of the Company’s tax positions annually and believes it is more likely than not that all of its tax positions will be utilized in future years.
Intangible Assets and Goodwill
Core deposit intangibles are amortized on a straight-line basis over the estimated useful lives of seven to ten years and customer relationship intangibles are amortized on a straight-line basis over the estimated useful life of eight to eighteen years. Mortgage servicing rights are amortized based on current prepayment assumptions. Goodwill is not amortized. At least annually in the fourth quarter, intangible assets, excluding mortgage servicing rights, and goodwill are evaluated for possible impairment. Impairment losses are measured by comparing the fair values of the intangible assets with their recorded amounts. Any impairment losses are reported in the statement of comprehensive income. Mortgage servicing rights are revalued quarterly.
The evaluation of remaining original core deposit intangibles for possible impairment involves reassessing the useful lives and the recoverability of the intangible assets. The evaluation of the useful lives is performed by reviewing the levels of core deposits of the respective branches acquired. The actual life of a core deposit base
30
Table of Contents
may be longer than originally estimated due to more successful retention of customers, or may be shorter due to more rapid runoff. Amortization of core deposit intangibles would be adjusted, if necessary, to amortize the remaining net book values over the remaining lives of the core deposits. The evaluation for recoverability is only performed if events or changes in circumstances indicate that the carrying amount of the intangibles may not be recoverable.
The evaluation of goodwill for possible impairment is performed by comparing the fair values of the related reporting units with their carrying amounts including goodwill. The fair values of the related business units are estimated using market data for prices of recent acquisitions of banks and branches.
The evaluation of intangible assets and goodwill for the years ended December 31, 2011, 2010 and 2009 resulted in no material impairments.
Fair Value of Financial Instruments
Securities that are being held for indefinite periods of time, or that may be sold as part of the Company’s asset/liability management strategy, to provide liquidity or for other reasons, are classified as available for sale and are stated at estimated market value. Unrealized gains or losses on securities available for sale are reported as a component of stockholders’ equity, net of income tax. Securities that are determined to be impaired, and for which such impairment is determined to be other than temporary, are adjusted to fair value and a corresponding loss is recognized.
The estimates of fair values of securities and other financial instruments are based on a variety of factors. In some cases, fair values represent quoted market prices for identical or comparable instruments. In other cases, fair values have been estimated based on assumptions concerning the amount and timing of estimated future cash flows and assumed discount rates reflecting varying degrees of risk. Accordingly, the fair values may not represent actual values of the financial instruments that could have been realized as of year end or that will be realized in the future.
Future Application of Accounting Standards
See Note (1) of the Notes to Consolidated Financial Statements for a discussion of recently issued accounting pronouncements and their expected impact on the Company’s financial statements.
Segment Information
See Note (22) of the Notes to Consolidated Financial Statements for disclosures regarding the Company’s operating business segments.
RESULTS OF OPERATIONS
Net Interest Income
In 2011, net interest income, which is the Company’s principal source of operating revenue, increased $14.1 million to $156.9 million compared to an increase of $11.4 million in 2010, and a decrease of $7.8 million in 2009. In 2011, $12.0 million of the increase in net interest income was related to the Company’s acquisitions made in the later part of 2010 and the acquisition made during 2011. The net interest margin on a taxable equivalent basis for 2011 was 3.20%, compared to 3.37% for 2010 and 3.42% for 2009. Changes in the volume of earning assets and interest-bearing liabilities, and changes in interest rates determine the changes in net interest income. The following volume/rate analysis summarizes the relative contribution of each of these components to the changes in net interest income in 2011 and 2010. For 2011, the decrease in net interest margin was due to continued low interest rates and an increase in earning assets at relatively low rates. For 2010, lower deposit rates resulted in a positive rate variance partially offset by higher deposit volumes. For 2009, declining
31
Table of Contents
loan rates resulted in a significant decrease in net interest income. If interest rates and/or loan volume do not increase, management expects continued compression of its net interest margin in 2012 as higher yielding loans and securities mature and are replaced at current market rates.
VOLUME/RATE ANALYSIS
Taxable Equivalent Basis
| Change in 2011 | Change in 2010 | |||||||||||||||||||||||
| Total |
Due to
Volume(1) |
Due to
Rate |
Total |
Due to
Volume(1) |
Due to
Rate |
|||||||||||||||||||
| (Dollars in thousands) | ||||||||||||||||||||||||
|
INCREASE (DECREASE) |
||||||||||||||||||||||||
|
Interest Income: |
||||||||||||||||||||||||
|
Loans |
$ | 9,353 | $ | 12,739 | $ | (3,386 | ) | $ | 2,072 | $ | 184 | $ | 1,888 | |||||||||||
|
Investments—taxable |
(57 | ) | 1,675 | (1,732 | ) | (1,058 | ) | 3,486 | (4,544 | ) | ||||||||||||||
|
Investments—tax exempt |
976 | 1,846 | (870 | ) | (238 | ) | (151 | ) | (87 | ) | ||||||||||||||
|
Interest-bearing deposits with banks and Federal funds sold |
1,111 | 1,073 | 38 | 232 | 924 | (692 | ) | |||||||||||||||||
|
|
|
|
|
|
|
|
|
|
|
|
|
|||||||||||||
|
Total interest income |
11,383 | 17,333 | (5,950 | ) | 1,008 | 4,443 | (3,435 | ) | ||||||||||||||||
|
|
|
|
|
|
|
|
|
|
|
|
|
|||||||||||||
|
Interest Expense: |
||||||||||||||||||||||||
|
Transaction deposits |
19 | 109 | (90 | ) | 186 | 206 | (20 | ) | ||||||||||||||||
|
Savings deposits |
(3,234 | ) | (2,661 | ) | (573 | ) | (3,333 | ) | (2,861 | ) | (472 | ) | ||||||||||||
|
Time deposits |
(995 | ) | 5,507 | (6,502 | ) | (7,314 | ) | 4,559 | (11,873 | ) | ||||||||||||||
|
Short-term borrowings |
52 | 35 | 17 | (5 | ) | (3 | ) | (2 | ) | |||||||||||||||
|
Long-term borrowings |
821 | 630 | 191 | 95 | 69 | 26 | ||||||||||||||||||
|
Junior subordinated debentures |
191 | 367 | (176 | ) | 27 | 35 | (8 | ) | ||||||||||||||||
|
|
|
|
|
|
|
|
|
|
|
|
|
|||||||||||||
|
Total interest expense |
(3,146 | ) | 3,987 | (7,133 | ) | (10,344 | ) | 2,005 | (12,349 | ) | ||||||||||||||
|
|
|
|
|
|
|
|
|
|
|
|
|
|||||||||||||
|
Net interest income |
$ | 14,529 | $ | 13,346 | $ | 1,183 | $ | 11,352 | $ | 2,438 | $ | 8,914 | ||||||||||||
|
|
|
|
|
|
|
|
|
|
|
|
|
|||||||||||||
| (1) | Changes in the mix of earning assets and interest-bearing liabilities have been combined with the changes due to volume. |
The following interest rate sensitivity analysis measures the sensitivity of the Company’s net interest margin to changes in interest rates by analyzing the repricing relationship between its earning assets and interest-bearing liabilities. This analysis is limited by the fact that it presents a static position as of a single day and is not necessarily indicative of the Company’s position at any other point in time, and does not take into account the sensitivity of rates of specific assets and liabilities to changes in market rates. The Company’s approach to managing the interest sensitivity gap limits risk while taking advantage of the Company’s stable core deposit base and the historical existence of a positively sloped yield curve.
The Analysis of Interest Rate Sensitivity presents the Company’s earning assets and interest-bearing liabilities based on maturity and repricing frequency at December 31, 2011. The Company’s cumulative negative gap position in the one year interval decreased to $193 million at December 31, 2011 from $621 million at December 31, 2010, and decreased as a percentage of total earning assets to 3.7% from 13.2% for the years ended December 31, 2011 and 2010, respectively. This negative gap position assumes that the Company’s core savings and transaction deposits are immediately rate sensitive. In a falling rate or sustained low rate environment, the benefit of the Company’s noninterest-bearing funds is decreased, resulting in a decrease in the Company’s net interest margin over time.
In the first quarter of 2011 with rates remaining at historically low levels, the Company, through its Asset and Liability Committee (“ALCO”) and Senior Loan Committee decided to offer a seven to fifteen year, fixed
32
Table of Contents
rate, amortizing loan product primarily for commercial real estate loans. During 2011, the Company added approximately $160 million of this fixed rate product with maturities between seven and fifteen years and amortizations ranging primarily from ten to twenty years. To offset this fixed rate exposure, the Company purchased approximately $254 million of floating rate securities from securities maturing during 2011. The Company believes this will help stabilize its net interest margin if rates remain low for the next several years.
ANALYSIS OF INTEREST RATE SENSITIVITY
December 31, 2011
| Interest Rate Sensitive | Noninterest Rate Sensitive | |||||||||||||||||||
|
0 to 3
Months |
4 to 12
Months |
1 to 5
Years |
Over 5
Years |
Total | ||||||||||||||||
| (Dollars in thousands) | ||||||||||||||||||||
|
EARNING ASSETS |
||||||||||||||||||||
|
Loans |
$ | 466,902 | $ | 550,748 | $ | 1,229,082 | $ | 766,766 | $ | 3,013,498 | ||||||||||
|
Securities |
274,099 | 73,692 | 177,241 | 89,945 | 614,977 | |||||||||||||||
|
Federal funds sold and interest-bearing deposits |
1,544,435 | — | — | — | 1,544,435 | |||||||||||||||
|
|
|
|
|
|
|
|
|
|
|
|||||||||||
|
Total |
$ | 2,285,436 | $ | 624,440 | $ | 1,406,323 | $ | 856,711 | $ | 5,172,910 | ||||||||||
|
|
|
|
|
|
|
|
|
|
|
|||||||||||
|
FUNDING SOURCES |
||||||||||||||||||||
|
Noninterest-bearing demand deposits (1) |
$ | — | $ | — | $ | — | $ | 1,294,450 | $ | 1,294,450 | ||||||||||
|
Savings and transaction deposits |
2,424,573 | — | — | — | 2,424,573 | |||||||||||||||
|
Time deposits of $100 or more |
108,018 | 180,973 | 101,847 | 24,096 | 414,934 | |||||||||||||||
|
Time deposits under $100 |
128,902 | 242,736 | 98,248 | 23,193 | 493,079 | |||||||||||||||
|
Short-term borrowings |
8,274 | — | — | — | 8,274 | |||||||||||||||
|
Long-term borrowings |
— | 9,294 | 9,182 | — | 18,476 | |||||||||||||||
|
Junior subordinated debentures |
— | — | — | 36,083 | 36,083 | |||||||||||||||
|
Stockholders’ equity |
— | — | — | 483,041 | 483,041 | |||||||||||||||
|
|
|
|
|
|
|
|
|
|
|
|||||||||||
|
Total |
$ | 2,669,767 | $ | 433,003 | $ | 209,277 | $ | 1,860,863 | $ | 5,172,910 | ||||||||||
|
|
|
|
|
|
|
|
|
|
|
|||||||||||
|
Interest sensitivity gap |
$ | (384,331 | ) | $ | 191,437 | $ | 1,197,046 | $ | (1,004,152 | ) | ||||||||||
|
Cumulative gap |
$ | (384,331 | ) | $ | (192,894 | ) | $ | 1,004,152 | $ | — | ||||||||||
|
Cumulative gap as a percentage of total earning assets |
(7.4 | )% | (3.7 | )% | 19.4 | % | — | % | ||||||||||||
| (1) | Represents the amount of demand deposits required to support earning assets in excess of interest-bearing liabilities and stockholders’ equity. |
Provision for Loan Losses
The provision for loan losses was $4.5 million for 2011, compared to $3.0 million for 2010 and $10.4 million for 2009. During 2011, $1.7 million of the increase in the provision for loan losses was related to the Company’s acquisitions made in the later part of 2010 and the acquisition made during 2011. During 2010, credit quality generally stabilized as previously identified problem loans were moved to other real estate owned while potential problem loans decreased. In 2009, credit quality deteriorated with higher levels of potential problem loans and nonperforming loans resulting in an additional provision for loan losses. The Company establishes an allowance as an estimate of the probable inherent losses in the loan portfolio at the balance sheet date. Net loan charge-offs were $2.6 million for 2011, compared to $3.6 million for 2010 and $8.3 million for 2009. The net charge-offs equated to 0.09%, 0.13% and 0.30% of average loans for 2011, 2010 and 2009, respectively. A more detailed discussion of the allowance for loan losses is provided under “Loans (Including Acquired Loans).”
33
Table of Contents
Noninterest Income
Noninterest income was $77.0 million in 2011 versus $69.9 million in 2010 and $66.9 million in 2009. Total noninterest income increased $7.1 million in 2011, an increase of 10.0%. This compares to an increase of $3.0 million, or 4.5%, in 2010. For 2011, the Company’s acquisitions made in the later part of 2010 and the acquisition made during 2011 increased noninterest income by approximately $3.3 million. In addition, noninterest income was higher in 2011 due to a securities gain of $1.3 million on the sale of an investment made by the Company’s venture capital subsidiary, Council Oak Investment Corporation, higher commercial deposit revenues, trust income and insurance commissions. Noninterest income was higher in 2010 due to higher deposit revenues, trust income and insurance commissions partially offset by lower cash management fee revenues. Core noninterest income was up in 2009 due to increases in commercial deposit income and sales of mortgage loans and student loans offset by lower cash management revenues. The Company’s fee income has increased in each of the last five years due to improved pricing strategies, enhanced product lines, acquisitions and internal deposit growth.
The Company had income from debit card usage totaling $15.1 million, $12.8 million and $10.8 million for the years 2011, 2010 and 2009, respectively. The recently enacted Dodd-Frank Act has given the Federal Reserve the authority to establish rules regarding debit card interchange fees charged for electronic debit transactions by payment card issuers. Because of the uncertainty as to any future rulemaking by the Federal Reserve and the inability to forecast competitive responses, the Company cannot provide any assurance as to the ultimate impact of the Dodd-Frank Act on the amount of income from debit card usage reported in future periods.
The Company recognized a net gain on the sale of securities of $1.6 million in 2011 due primarily to an investment sale made by the Company’s venture capital subsidiary, Council Oak Investment Corporation, compared to a gain of $324,000 in 2010 and a gain of $336,000 in 2009. The Company’s practice is to maintain a liquid portfolio of securities and not engage in trading activities. The Company has the ability and intent to hold securities classified as available for sale that were in an unrealized loss position until they mature or until fair value exceeds amortized cost.
The Company earned $2.0 million on the sale of loans in 2011 compared to $2.9 million in 2010 and $2.8 million in 2009. The activity in the secondary market for mortgage loans increased during 2010 and 2009 due to a large number of refinancings in the historically low interest rate environment. The final sale of student loans occurred in 2010 while activity in student loans was up slightly in 2009 due to less local competition in the market. Student loan activity ceased during 2010 when Congress passed student loan reform legislation centralizing student lending in a governmental agency, which eliminated guaranteed student lending by financial institutions.
Noninterest Expense
Total noninterest expense increased by $14.6 million, or 10.1% to $158.6 million in 2011. This compares to increases of $5.0 million, or 3.6%, for 2010, and $4.1 million, or 3.0%, for 2009. The increase in noninterest expense during 2011 was primarily related to the Company’s acquisitions made in the later part of 2010 and the acquisition made during 2011, which added approximately $10.1 million of noninterest expense. Other factors were an increase in salaries and benefits excluding acquisitions of approximately $2.6 million, write downs on other real estate of $1.7 million, and merger related expenses of approximately $884,000, partially offset by a gain on the sale of other real estate of approximately $1.1 million. Noninterest expense increased in 2010 due to higher benefit and acquisition costs partially offset by lower FDIC insurance costs. The increase in noninterest expense in 2009 was primarily due to the FDIC special assessment and higher deposit insurance premium totaling $7.3 million which was partially offset by a $1.8 million reduction in loan origination expense and $900,000 in lower salaries and employee benefits.
34
Table of Contents
During 2009, in response to the higher noninterest expense and lower operating margins, the Company continued a salary freeze for all non-exempt employees along with suspension of branch expansion. These measures were relaxed during 2010 and 2011.
Income Taxes
Income tax expense totaled $25.1 million in 2011, compared to $23.3 million in 2010 and $16.1 million for 2009. Income tax expense declined in 2009 due to lower pretax income. The effective tax rates for 2011, 2010 and 2009 were 35.5%, 35.5% and 33.0%, respectively. The primary reasons for the difference between the Company’s effective tax rate and the Federal statutory rate were tax-exempt income, nondeductible amortization, Federal and state tax credits, and state tax expense. The Company’s effective tax rate increased in 2010 due to the full utilization of $1.5 million of Federal tax credits.
Certain financial information is prepared on a taxable equivalent basis to facilitate analysis of yields and changes in components of earnings. Average balance sheets, comprehensive income statements and other financial statistics are also presented on a taxable equivalent basis.
Impact of Inflation
The impact of inflation on financial institutions differs significantly from that of industrial or commercial companies. The assets of financial institutions are predominantly monetary, as opposed to fixed or nonmonetary assets such as premises, equipment and inventory. As a result, there is little exposure to inflated earnings by understated depreciation charges or significantly understated current values of assets. Although inflation can have an indirect effect by leading to higher interest rates, financial institutions are in a position to monitor the effects on interest costs and yields and respond to inflationary trends through management of interest rate sensitivity. Inflation can also have an impact on noninterest expenses such as salaries and employee benefits, occupancy, services and other costs.
Impact of Deflation
In a period of deflation, it would be reasonable to expect widely decreasing prices for real assets. In such an economic environment, assets of businesses and individuals, such as real estate, commodities or inventory, could decline. The inability of customers to repay or refinance their loans could result in loan losses incurred by the Company far in excess of historical experience due to deflated collateral values.
FINANCIAL POSITION
Cash, Federal Funds Sold and Interest-Bearing Deposits with Banks
Cash consists of cash and cash items on hand, noninterest-bearing deposits and amounts due from other banks, reserves deposited with the Federal Reserve Bank, and interest-bearing deposits with other banks. Federal funds sold consist of overnight investments of excess funds with other financial institutions. Due to the Federal Reserve Bank’s intervention into the Federal funds market that has resulted in near zero overnight Fed funds rates, the Company has continued to maintain the majority of its excess funds with the Federal Reserve Bank. The Federal Reserve Bank pays interest on these funds based upon the lowest target rate for the maintenance period.
The amount of cash, Federal funds sold and interest-bearing deposits with the Federal Reserve Bank carried by the Company is a function of the availability of funds presented to other institutions for clearing, and the Company’s requirements for liquidity, operating cash and reserves, available yields, and interest rate sensitivity management. Balances of these items can fluctuate widely based on these various factors. Cash and Federal funds sold increased $462.8 million in 2011, $203.8 million in 2010 and $587.4 million in 2009. The increases were primarily due to increased deposits.
35
Table of Contents
Securities
For the year ended December 31, 2011, total securities decreased $128.8 million to $615.0 million, a decrease of 17.3%. This compares to an increase of $329.2 million, or 78.9%, in 2010 and a decrease of $38.4 million, or 8.4%, in 2009. For the year ended December 31, 2011, securities decreased due to a shift in emphasis to higher yielding loans from lower yielding securities available in the current market. For the year ended December 31, 2010, securities increased due to acquisitions and higher pledging requirements for public deposits. Securities available for sale represented 96.3% of the total securities portfolio at December 31, 2011, compared to 97.1% at December 31, 2010 and 92.9% at December 31, 2009. Securities available for sale had a net unrealized gain of $14.6 million at December 31, 2011, compared to a net unrealized gain of $13.0 million at December 31, 2010 and a net unrealized gain of $16.9 million at December 31, 2009. These unrealized gains are included in the Company’s stockholders’ equity as accumulated other comprehensive income, net of income tax, in the amounts of $9.4 million, $8.5 million and $11.0 million for December 31, 2011, 2010 and 2009 respectively.
SECURITIES
| December 31 | ||||||||||||
| 2011 | 2010 | 2009 | ||||||||||
| (Dollars in thousands) | ||||||||||||
|
Held for Investment (at amortized cost) |
||||||||||||
|
U.S. Treasury, other Federal agencies and mortgage-backed securities |
$ | 997 | $ | 1,207 | $ | 1,446 | ||||||
|
States and political subdivisions |
21,480 | 20,804 | 28,350 | |||||||||
|
|
|
|
|
|
|
|||||||
|
Total |
$ | 22,477 | $ | 22,011 | $ | 29,796 | ||||||
|
|
|
|
|
|
|
|||||||
|
Estimated market value |
$ | 22,958 | $ | 22,640 | $ | 30,736 | ||||||
|
|
|
|
|
|
|
|||||||
|
Available for Sale (at estimated market value) |
||||||||||||
|
U.S. Treasury, other Federal agencies and mortgage-backed securities |
$ | 517,629 | $ | 646,665 | $ | 346,837 | ||||||
|
States and political subdivisions |
62,709 | 64,210 | 9,625 | |||||||||
|
Other securities |
12,162 | 10,917 | 29,912 | |||||||||
|
|
|
|
|
|
|
|||||||
|
Total |
$ | 592,500 | $ | 721,792 | $ | 386,374 | ||||||
|
|
|
|
|
|
|
|||||||
|
Total Securities |
$ | 614,977 | $ | 743,803 | $ | 416,170 | ||||||
|
|
|
|
|
|
|
|||||||
The Company does not engage in securities trading activities. Any sales of securities are for the purpose of executing the Company’s asset/liability management strategy, eliminating a perceived credit risk in a specific security, or providing liquidity. Securities that are being held for indefinite periods of time, or that may be sold as part of the Company’s asset/liability management strategy, to provide liquidity or for other reasons, are classified as available for sale and are stated at estimated market value. Unrealized gains or losses on securities available for sale are reported as a component of stockholders’ equity, net of income tax. Securities for which the Company has the intent and ability to hold to maturity are classified as held for investment and are stated at cost, adjusted for amortization of premiums and accretion of discounts computed under the interest method. Securities that are determined to be impaired, and for which such impairment is determined to be other than temporary, are adjusted to fair value and a corresponding loss is recognized. Gains or losses from sales of securities are based upon the book values of the specific securities sold.
Declines in the fair value of held for investment and available-for-sale securities below their cost that are deemed to be other than temporary are reflected in earnings as realized losses. In estimating other-than-temporary impairment losses, management considers, among other things, (i) the length of time and the extent to which the fair value has been less than cost, (ii) the financial condition and near-term prospects of the issuer, and (iii) the intent and ability of the Company to retain its investment in the issuer for a period of time sufficient to allow for any anticipated recovery in fair value.
36
Table of Contents
Management has the ability and intent to hold the securities classified as held for investment until they mature, at which time the Company will receive full value for the securities. As of December 31, 2011, the Company had net unrealized gains largely due to decreases in market interest rates from the yields available at the time the underlying securities were purchased. The fair value of those securities having unrealized losses is expected to recover as the securities approach their maturity date or repricing date or if market yields for similar investments decline. Management does not believe any of the securities are impaired due to reasons of credit quality. Furthermore, as of December 31, 2011, management also had the ability and intent to hold all securities classified as available for sale with an unrealized loss for a period of time sufficient for a recovery of cost. Accordingly, as of December 31, 2011, management believes the impairments were temporary and no material impairment loss was realized in the Company’s consolidated statement of comprehensive income.
MATURITY DISTRIBUTION OF SECURITIES
The following maturity distribution of securities table summarizes the weighted average maturity and weighted average taxable equivalent yields of the securities portfolio at December 31, 2011. The Company manages its securities portfolio for liquidity and as a tool to execute its asset/liability management strategy. Consequently, the average maturity of the portfolio is relatively short. Securities maturing within five years represent 79.7% of the total portfolio.
| Within One Year |
After One Year
But Within Five Years |
After Five Years
But Within Ten Years |
After Ten Years | Total | ||||||||||||||||||||||||||||||||||||
| Amount | Yield* | Amount | Yield* | Amount | Yield* | Amount | Yield* | Amount | Yield* | |||||||||||||||||||||||||||||||
| (Dollars in thousands) | ||||||||||||||||||||||||||||||||||||||||
|
Held for Investment |
||||||||||||||||||||||||||||||||||||||||
|
U.S. Treasury and other Federal agencies |
$ | 23 | 1.79 | % | $ | 603 | 4.12 | % | $ | 370 | 5.81 | % | $ | 1 | 1.96 | % | $ | 997 | 4.69 | % | ||||||||||||||||||||
|
State and political subdivisions |
5,845 | 5.43 | 13,911 | 4.51 | 1,724 | 6.51 | — | — | 21,480 | 4.92 | ||||||||||||||||||||||||||||||
|
|
|
|
|
|
|
|
|
|
|
|||||||||||||||||||||||||||||||
|
Total |
$ | 5,868 | 5.42 | $ | 14,514 | 4.49 | $ | 2,094 | 6.39 | $ | 1 | 1.96 | $ | 22,477 | 4.91 | |||||||||||||||||||||||||
|
|
|
|
|
|
|
|
|
|
|
|||||||||||||||||||||||||||||||
|
Percentage of total |
26.1 | % | 64.6 | % | 9.3 | % | — | % | 100.0 | % | ||||||||||||||||||||||||||||||
|
|
|
|
|
|
|
|
|
|
|
|||||||||||||||||||||||||||||||
|
Available for Sale |
||||||||||||||||||||||||||||||||||||||||
|
U.S. Treasury and other Federal agencies |
$ | 102,646 | 4.60 | % | $ | 339,238 | 1.15 | % | $ | 18,265 | 2.04 | % | $ | 57,480 | 1.02 | % | $ | 517,629 | 1.85 | % | ||||||||||||||||||||
|
State and political subdivisions |
4,923 | 3.86 | 23,177 | 3.23 | 23,728 | 4.52 | 10,881 | 6.09 | 62,709 | 4.27 | ||||||||||||||||||||||||||||||
|
Other securities |
— | — | — | — | — | — | 12,162 | 13.92 | 12,162 | 13.92 | ||||||||||||||||||||||||||||||
|
|
|
|
|
|
|
|
|
|
|
|||||||||||||||||||||||||||||||
|
Total |
$ | 107,569 | 4.57 | $ | 362,415 | 1.28 | $ | 41,993 | 3.44 | $ | 80,523 | 3.65 | $ | 592,500 | 2.35 | |||||||||||||||||||||||||
|
|
|
|
|
|
|
|
|
|
|
|||||||||||||||||||||||||||||||
|
Percentage of total |
18.1 | % | 61.2 | % | 7.1 | % | 13.6 | % | 100.0 | % | ||||||||||||||||||||||||||||||
|
|
|
|
|
|
|
|
|
|
|
|||||||||||||||||||||||||||||||
|
Total securities |
$ | 113,437 | 4.62 | % | $ | 376,929 | 1.41 | % | $ | 44,087 | 3.59 | % | $ | 80,524 | 3.65 | % | $ | 614,977 | 2.45 | % | ||||||||||||||||||||
|
|
|
|
|
|
|
|
|
|
|
|||||||||||||||||||||||||||||||
|
Percentage of total |
18.4 | % | 61.3 | % | 7.2 | % | 13.1 | % | 100.0 | % | ||||||||||||||||||||||||||||||
* Yield on a taxable equivalent basis
Loans (Including Acquired Loans)
The Company has historically generated loan growth from both internal originations and acquisitions. Total loans increased $201.5 million to $3.0 billion, an increase of 7.2%, in 2011 compared to an increase of $73.3 million or 2.7% in 2010 and a decrease of $19.2 million, or 0.7%, in 2009. Loans increased in 2011 due primarily to bank acquisitions and internal growth. Loans increased in 2010 due to bank acquisitions offset by the sale of the student loan portfolio. Loans declined slightly in 2009 due to the slowing regional economy. During 2011, the Company acquired loans from acquisitions of approximately $108.2 million, compared to $161.8 million during 2010.
37
Table of Contents
Composition
The Company’s loan portfolio was diversified among various types of commercial and individual borrowers. Commercial loans were comprised principally of loans to companies in light manufacturing, retail and service industries. Consumer loans were comprised primarily of loans to individuals for automobiles. Student loans have decreased to $46.7 million at December 31, 2011 down from $57.4 million at December 31, 2010 and $148.2 million at December 31, 2009. On March 21, 2010, Congress passed student loan reform legislation centralizing student lending in a governmental agency, which as of June 30, 2010 resulted in an end to the student loan programs provided by the Company. The Company sold all student loans held for sale of $144.5 million in October 2010. The Company did not have any credit card receivables at year end 2011, 2010 or 2009 and does not expect to engage in this type of activity.
Loans secured by real estate, including farmland, multifamily, commercial, one to four family housing and construction and development loans, have been a large portion of the Company’s loan portfolio. The Company is subject to risk of future market fluctuations in property values relating to these loans. The Company attempts to manage this risk through rigorous loan underwriting standards.
LOANS BY CATEGORY
| December 31, | ||||||||||||||||||||||||||||||||||||||||
| 2011 | 2010 | 2009 | 2008 | 2007 | ||||||||||||||||||||||||||||||||||||
| Amount |
% of
Total |
Amount |
% of
Total |
Amount |
% of
Total |
Amount |
% of
Total |
Amount |
% of
Total |
|||||||||||||||||||||||||||||||
| (Dollars in thousands) | ||||||||||||||||||||||||||||||||||||||||
|
Commercial, financial and other |
$ | 796,349 | 26.43 | % | $ | 777,576 | 27.65 | % | $ | 733,386 | 26.76 | % | $ | 726,602 | 26.35 | % | $ | 711,124 | 28.59 | % | ||||||||||||||||||||
|
Real estate—construction |
207,953 | 6.90 | 230,367 | 8.19 | 201,704 | 7.37 | 246,269 | 8.93 | 222,820 | 8.96 | ||||||||||||||||||||||||||||||
|
Real estate—one to four family |
655,134 | 21.74 | 608,786 | 21.65 | 569,592 | 20.80 | 543,183 | 19.70 | 513,969 | 20.67 | ||||||||||||||||||||||||||||||
|
Real estate—farmland, multifamily and commercial |
1,101,731 | 36.56 | 921,958 | 32.79 | 881,495 | 32.19 | 905,862 | 32.84 | 768,451 | 30.89 | ||||||||||||||||||||||||||||||
|
Consumer |
252,331 | 8.37 | 273,277 | 9.72 | 352,477 | 12.88 | 335,938 | 12.18 | 270,735 | 10.89 | ||||||||||||||||||||||||||||||
|
|
|
|
|
|
|
|
|
|
|
|
|
|
|
|
|
|
|
|
|
|||||||||||||||||||||
|
Total |
$ | 3,013,498 | 100.00 | % | $ | 2,811,964 | 100.00 | % | $ | 2,738,654 | 100.00 | % | $ | 2,757,854 | 100.00 | % | $ | 2,487,099 | 100.00 | % | ||||||||||||||||||||
|
|
|
|
|
|
|
|
|
|
|
|
|
|
|
|
|
|
|
|
|
|||||||||||||||||||||
38
Table of Contents
MATURITY AND RATE SENSITIVITY OF LOANS
The following table presents the Maturity and Rate Sensitivity of Loans at December 31, 2011, for commercial, financial and other loans, and real estate loans, excluding one to four family residential loans and consumer loans. Approximately 41% of the commercial real estate and other commercial loans have maturities of one year or less. However, many of these loans are renewed at existing or similar terms after scheduled principal reductions. Also, approximately 57% of the commercial real estate and other commercial loans had adjustable interest rates at December 31, 2011.
| Maturing | ||||||||||||||||
|
Within
One Year |
After One
But Within Five Years |
After Five
Years |
Total | |||||||||||||
| (Dollars in thousands) | ||||||||||||||||
|
Commercial, financial and other |
$ | 406,285 | $ | 341,113 | $ | 48,951 | $ | 796,349 | ||||||||
|
Real estate—construction |
162,315 | 31,058 | 14,580 | 207,953 | ||||||||||||
|
Real estate—farmland, multifamily and commercial (excluding loans secured by 1 to 4 family residential properties) |
294,531 | 395,787 | 411,413 | 1,101,731 | ||||||||||||
|
|
|
|
|
|
|
|
|
|||||||||
|
Total |
$ | 863,131 | $ | 767,958 | $ | 474,944 | $ | 2,106,033 | ||||||||
|
|
|
|
|
|
|
|
|
|||||||||
|
Loans with predetermined interest rates |
$ | 327,224 | $ | 376,560 | $ | 197,196 | $ | 900,980 | ||||||||
|
Loans with adjustable interest rates |
535,907 | 391,398 | 277,748 | 1,205,053 | ||||||||||||
|
|
|
|
|
|
|
|
|
|||||||||
|
Total |
$ | 863,131 | $ | 767,958 | $ | 474,944 | $ | 2,106,033 | ||||||||
|
|
|
|
|
|
|
|
|
|||||||||
|
Percentage of total |
41.0 | % | 36.5 | % | 22.5 | % | 100.0 | % | ||||||||
During 2009 the Company set rate floors. At December 31, 2011 approximately 74% of the floating rate loan portfolio was at the floor rate. Short-term rates would have to increase approximately 100 basis points before the Company’s loan portfolio would experience a measurable increase in yield.
The information relating to the maturity and rate sensitivity of loans is based upon contractual maturities and original loan terms. In the ordinary course of business, loans maturing within one year may be renewed, in whole or in part, at interest rates prevailing at the date of renewal.
Nonperforming Loans, Restructured Loans and Other Real Estate Owned
During 2011, nonperforming and restructured loans decreased $5.1 million to $23.0 million, a decrease of 18.0%. This compares to a decrease of $11.9 million to $28.1 million, or 29.7%, in 2010 and an increase of $16.2 million to $40.0 million, or 68.4%, in 2009. The decrease in 2011 was primarily due to the transfer of several commercial properties from nonperforming loans to other real estate owned. The decrease in 2010 was due to the transfer of two commercial properties totaling $11.6 million from nonperforming loans to other real estate owned while the increase in 2009 resulted from nonperformance on loans of several commercial customers. Nonperforming and restructured loans as a percentage of total loans, is shown in the table below.
Nonaccrual loans negatively impact the Company’s net interest margin. A loan is placed on nonaccrual status when, in the opinion of management, the future collectability of interest or principal or both is in serious doubt. Interest income is recognized on certain of these loans on a cash basis if the full collection of the remaining principal balance is reasonably expected. Otherwise, interest income is not recognized until the principal balance is fully collected. In 2011, nonaccrual loans decreased $5.5 million, a decrease of 20.7%, compared to a decrease of $10.4 million or 28.1% in 2010 and an increase of $15.8 million or 73.9% in 2009. Total interest income which was not accrued on nonaccrual loans outstanding was approximately $1.1 million at December 31, 2011, $1.0 million at December 31, 2010 and $1.4 million at December 31, 2009. Only a small amount of this interest is expected to be ultimately collected. Net interest income for 2010 included nonrecurring interest income from the disposition of nonperforming assets of $1.3 million.
39
Table of Contents
The classification of a loan as nonperforming does not necessarily indicate that loan principal and interest will ultimately be uncollectible; although in a weakening economy, the Company’s experience has been that the level of collections decline. The above normal risk associated with nonperforming loans has been considered in the determination of the allowance for loan losses. At December 31, 2011, the allowance for loan losses as a percentage of nonperforming and restructured loans was 163.5%, compared to 127.3%, at the end of 2010 and 91.1% at the end of 2009.
At December 31, 2011, other real estate owned and repossessed assets decreased as shown in the following table. In addition to several sales and write downs of other real estate owned and repossessed assets, the decrease in 2011 was due in part to the sale of one nonperforming commercial real estate property valued at $6.9 million, sold at a sheriff’s sale, which paid off the Company’s loan balance and the interest due on the loan. The increase during 2010 was due to two commercial properties totaling $11.6 million that were previously on nonaccrual that were transferred to other real estate owned. Other real estate owned consists of properties acquired through foreclosure proceedings or acceptance of a deed in lieu of foreclosure, and premises held for sale. These properties are carried at the lower of the book values of the related loans or fair market values based upon appraisals, less estimated costs to sell. Write downs arising at the time of reclassification of such properties from loans to other real estate owned are charged directly to the allowance for loan losses. Any losses on bank premises designated to be sold are charged to operating expense at the time of transfer from premises to other real estate owned. Decreases in values of properties subsequent to their classification as other real estate owned are charged to operating expense.
NONPERFORMING AND RESTRUCTURED ASSETS
| December 31, | ||||||||||||||||||||
| 2011 | 2010 | 2009 | 2008 | 2007 | ||||||||||||||||
| (Dollars in thousands) | ||||||||||||||||||||
|
Past due over 90 days and still accruing |
$ | 798 | $ | 1,096 | $ | 853 | $ | 1,346 | $ | 823 | ||||||||||
|
Nonaccrual |
21,187 | 26,701 | 37,133 | 21,359 | 11,568 | |||||||||||||||
|
Restructured |
1,041 | 294 | 1,970 | 1,022 | 1,121 | |||||||||||||||
|
|
|
|
|
|
|
|
|
|
|
|||||||||||
|
Total nonperforming and restructured loans |
23,026 | 28,091 | 39,956 | 23,727 | 13,512 | |||||||||||||||
|
Other real estate owned and repossessed assets |
16,640 | 23,179 | 9,881 | 3,997 | 1,568 | |||||||||||||||
|
|
|
|
|
|
|
|
|
|
|
|||||||||||
|
Total nonperforming and restructured assets |
$ | 39,666 | $ | 51,270 | $ | 49,837 | $ | 27,724 | $ | 15,080 | ||||||||||
|
|
|
|
|
|
|
|
|
|
|
|||||||||||
|
Nonperforming and restructured loans to total loans |
0.76 | % | 1.00 | % | 1.46 | % | 0.86 | % | 0.54 | % | ||||||||||
|
|
|
|
|
|
|
|
|
|
|
|||||||||||
|
Nonperforming and restructured assets to total assets |
0.71 | % | 1.01 | % | 1.13 | % | 0.72 | % | 0.40 | % | ||||||||||
|
|
|
|
|
|
|
|
|
|
|
|||||||||||
Potential problem loans are performing loans to borrowers with a weakened financial condition, or which are experiencing unfavorable trends in their financial condition, which causes management to have concerns as to the ability of such borrowers to comply with the existing repayment terms. The Company had approximately $26.3 million, $10.1 million and $8.6 million of these loans at December 31, 2011, 2010 and 2009, respectively, which were not included in nonperforming and restructured loans. In general, these loans are adequately collateralized and have no specific identifiable probable loss. Loans which are considered to have identifiable probable loss potential are placed on nonaccrual status, are allocated a specific allowance for loss or are directly charged-down, and are reported as nonperforming. The Company’s nonaccrual loans are primarily commercial and real estate loans.
Allowance for Loan Losses/Fair Market Value Adjustments on Acquired Loans
The allowance for loan losses reflects management’s estimate of loss incurred in the Company’s loan portfolio through the balance sheet date. The allowance and its adequacy is determined through consideration of many factors, including past loan loss experience, current evaluations of known impaired loans, levels of
40
Table of Contents
adversely classified loans, general economic conditions and other environmental factors. The Company’s methodology causes an increase in the reserve upon identification of a potential problem loan. The process of evaluating the adequacy of the allowance for loan losses necessarily involves the exercise of judgment and consideration of numerous subjective factors existing at year end. Accordingly, there can be no assurance that the estimate of incurred losses will not change as economic and environmental factors change from that date. Furthermore, in the future, additional loan loss provisions will be required for future losses as they occur. At December 31, 2011, the Company’s allowance for loan losses represented 1.25% of total loans, compared to 1.27% at December 31, 2010 and 1.33% at December 31, 2009. The overall credit portfolio generally stabilized and net charge-offs declined in 2011 and 2010. In 2009, the Company’s loan portfolio began to experience some isolated credit issues with several customers due primarily to a decline in collateral values and to a lesser extent, nonperformance. Although the national economy and the credit markets have recently stabilized, if unforeseen deterioration occurs, it would be reasonable to expect that the allowance for loan losses would increase in future periods.
Notwithstanding the foregoing, the Company’s recent net charge-off experience continued to remain low compared to the banking industry at both the state and national levels. In 2011, the Company recognized $2.6 million of net charge-offs, which represented 0.09% of average loans, compared to $3.6 million, or 0.13% for 2010 and $8.3 million, or 0.30% for 2009.
The fair market value adjustment on acquired loans contains a market component to adjust the rates on the loans to market value and a credit component to absorb potential and identified credit exposures in the acquired loans. The credit component was $3.7 million at December 31, 2011 and $2.8 million at December 31, 2010, while the acquired loans outstanding were $193.4 million and $161.8 million, respectively.
41
Table of Contents
ANALYSIS OF ALLOWANCE FOR LOAN LOSSES
| Year Ended December 31, | ||||||||||||||||||||
| 2011 | 2010 | 2009 | 2008 | 2007 | ||||||||||||||||
| (Dollars in thousands) | ||||||||||||||||||||
|
Balance at beginning of period |
$ | 35,745 | $ | 36,383 | $ | 34,290 | $ | 29,127 | $ | 27,700 | ||||||||||
|
|
|
|
|
|
|
|
|
|
|
|||||||||||
|
Charge-offs: |
||||||||||||||||||||
|
Commercial |
(925 | ) | (584 | ) | (4,940 | ) | (1,901 | ) | (455 | ) | ||||||||||
|
Real estate |
(1,292 | ) | (2,851 | ) | (2,182 | ) | (3,326 | ) | (1,304 | ) | ||||||||||
|
Consumer |
(822 | ) | (689 | ) | (1,008 | ) | (897 | ) | (888 | ) | ||||||||||
|
Other |
(58 | ) | (56 | ) | (823 | ) | (151 | ) | (36 | ) | ||||||||||
|
|
|
|
|
|
|
|
|
|
|
|||||||||||
|
Total charge-offs |
(3,097 | ) | (4,180 | ) | (8,953 | ) | (6,275 | ) | (2,683 | ) | ||||||||||
|
|
|
|
|
|
|
|
|
|
|
|||||||||||
|
Recoveries: |
||||||||||||||||||||
|
Commercial |
134 | 151 | 172 | 187 | 200 | |||||||||||||||
|
Real estate |
169 | 141 | 137 | 118 | 203 | |||||||||||||||
|
Consumer |
131 | 185 | 252 | 221 | 312 | |||||||||||||||
|
Other |
59 | 111 | 96 | 236 | 66 | |||||||||||||||
|
|
|
|
|
|
|
|
|
|
|
|||||||||||
|
Total recoveries |
493 | 588 | 657 | 762 | 781 | |||||||||||||||
|
|
|
|
|
|
|
|
|
|
|
|||||||||||
|
Net charge-offs |
(2,604 | ) | (3,592 | ) | (8,296 | ) | (5,513 | ) | (1,902 | ) | ||||||||||
|
Provision charged to operations |
4,515 | 2,954 | 10,389 | 10,676 | 3,329 | |||||||||||||||
|
|
|
|
|
|
|
|
|
|
|
|||||||||||
|
Balance at end of period |
$ | 37,656 | $ | 35,745 | $ | 36,383 | $ | 34,290 | $ | 29,127 | ||||||||||
|
|
|
|
|
|
|
|
|
|
|
|||||||||||
|
Average loans |
$ | 2,893,263 | $ | 2,761,986 | $ | 2,749,544 | $ | 2,612,553 | $ | 2,364,618 | ||||||||||
|
|
|
|
|
|
|
|
|
|
|
|||||||||||
|
Total loans |
$ | 3,013,498 | $ | 2,811,964 | $ | 2,738,654 | $ | 2,757,854 | $ | 2,487,099 | ||||||||||
|
|
|
|
|
|
|
|
|
|
|
|||||||||||
|
Net charge-offs to average loans |
0.09 | % | 0.13 | % | 0.30 | % | 0.21 | % | 0.08 | % | ||||||||||
|
|
|
|
|
|
|
|
|
|
|
|||||||||||
|
Allowance to total loans |
1.25 | % | 1.27 | % | 1.33 | % | 1.24 | % | 1.17 | % | ||||||||||
|
|
|
|
|
|
|
|
|
|
|
|||||||||||
|
Allocation of the allowance by category of loans: |
||||||||||||||||||||
|
Commercial, financial and other |
$ | 9,703 | $ | 10,558 | $ | 9,789 | $ | 9,520 | $ | 8,453 | ||||||||||
|
Real estate—construction |
4,229 | 3,884 | 3,447 | 3,231 | 3,261 | |||||||||||||||
|
Real estate—mortgage |
20,741 | 18,060 | 18,533 | 17,421 | 14,269 | |||||||||||||||
|
Consumer |
2,983 | 3,243 | 4,614 | 4,118 | 3,144 | |||||||||||||||
|
|
|
|
|
|
|
|
|
|
|
|||||||||||
|
Total |
$ | 37,656 | $ | 35,745 | $ | 36,383 | $ | 34,290 | $ | 29,127 | ||||||||||
|
|
|
|
|
|
|
|
|
|
|
|||||||||||
|
Percentage of loans in each category to total loans: |
||||||||||||||||||||
|
Commercial, financial and other |
25.77 | % | 29.54 | % | 26.90 | % | 27.76 | % | 29.02 | % | ||||||||||
|
Real estate—construction |
11.23 | 10.86 | 9.47 | 9.42 | 11.20 | |||||||||||||||
|
Real estate—mortgage |
55.08 | 50.52 | 50.95 | 50.81 | 48.99 | |||||||||||||||
|
Consumer |
7.92 | 9.08 | 12.68 | 12.01 | 10.79 | |||||||||||||||
|
|
|
|
|
|
|
|
|
|
|
|||||||||||
|
Total |
100.00 | % | 100.00 | % | 100.00 | % | 100.00 | % | 100.00 | % | ||||||||||
|
|
|
|
|
|
|
|
|
|
|
|||||||||||
Goodwill, Other Intangible Assets and Other Assets
Identifiable intangible assets and goodwill totaled $58.8 million, $56.2 million and $41.8 million at December 31, 2011, 2010 and 2009, respectively. The increase in 2011 was due to the acquisition of one community bank. The increase in 2010 was due to the acquisitions of an insurance agency and three community banks.
42
Table of Contents
Other assets at December 31, 2011 include $57.4 million of cash surrender value of life insurance from life insurance companies with satisfactory credit ratings and $12.3 million of prepaid FDIC deposit insurance premium. Other assets at December 31, 2010 include $55.1 million of cash surrender value of life insurance from life insurance companies with satisfactory credit ratings and $15.0 million of prepaid FDIC deposit insurance premium. Other assets at December 31, 2009 include $46.4 million of cash surrender value of life insurance from life insurance companies with satisfactory credit ratings and $19.0 million of prepaid FDIC deposit insurance premium.
Liquidity and Funding
The Company’s principal source of liquidity and funding is its broad deposit base generated from customer relationships. The availability of deposits is affected by economic conditions, competition with other financial institutions, and alternative investments available to customers. Through interest rates paid, service charge levels and services offered, the Company can, to a limited extent, affect its level of deposits. The level and maturity of funding necessary to support the Company’s lending and investment functions is determined through the Company’s asset/liability management process. In addition to deposits, short-term borrowings comprised primarily of Federal funds purchased and repurchase agreements provide additional funding sources. The Company had $5.0 million in brokered CDs due to its 2011 acquisition, which were liquidated in February 2012. The Company currently does not rely heavily on long-term borrowings. The Company could utilize the sale of loans, securities, and liquidation of other assets as sources of liquidity and funding.
Historically, the Bank is more liquid than its peers. This liquidity positions the Bank to respond to increased loan demand and other requirements for funds, or to decreases in funding sources. The liquidity of BancFirst Corporation, however, is dependent upon dividend payments from the Bank and its ability to obtain financing. Banking regulations limit bank dividends based upon net earnings retained by the bank and minimum capital requirements. Dividends in excess of these limits require regulatory approval. At January 1, 2012, the Bank had approximately $54.4 million of equity available for dividends to BancFirst Corporation without regulatory approval. During 2011, the Bank declared four common stock dividends totaling $16.0 million and two preferred stock dividends totaling $1.9 million.
Deposits
Total deposits increased $534.0 million to $5.0 billion, an increase of 11.9% in 2011, compared to an increase of $574.7 million or 14.6%, in 2010, and $551.4 million or 16.3%, in 2009. The increase in deposits during 2011 and 2010 was due to acquisitions and internal growth while the increase in 2009 was largely due to approximately $450 million in overnight sweep funds that moved into interest-bearing transaction accounts due to low interest rates on money market funds. Demand deposits as a percentage of total deposits averaged 31.6% in 2011, 29.7% in 2010 and 28.5% in 2009. The Company’s core deposits provide it with a stable, low-cost funding source. Core deposits averaged 91.2%, 90.4% and 89.3% of total deposits in 2011, 2010 and 2009, respectively. If interest rates were to rise, some of the deposits which migrated from overnight sweep funds during 2009 and some of the deposit growth in 2010 and 2011 may move back into money market funds or to other depository institutions.
ANALYSIS OF AVERAGE DEPOSITS
| Year Ended December 31, | ||||||||||||||||||||
| 2011 | 2010 | 2009 | 2008 | 2007 | ||||||||||||||||
| (Dollars in thousands) | ||||||||||||||||||||
|
Average Balances |
||||||||||||||||||||
|
Demand deposits |
$ | 1,506,371 | $ | 1,211,712 | $ | 1,054,291 | $ | 955,847 | $ | 877,474 | ||||||||||
|
Interest-bearing transaction deposits |
709,609 | 612,442 | 518,914 | 423,773 | 398,786 | |||||||||||||||
|
Savings deposits |
1,633,555 | 1,424,252 | 1,228,697 | 1,100,184 | 1,048,935 | |||||||||||||||
|
Time deposits under $100 |
499,707 | 446,799 | 504,931 | 492,651 | 486,089 | |||||||||||||||
|
|
|
|
|
|
|
|
|
|
|
|||||||||||
|
Total core deposits |
4,349,242 | 3,695,205 | 3,306,833 | 2,972,455 | 2,811,284 | |||||||||||||||
|
Time deposits of $100 or more |
422,277 | 391,790 | 395,438 | 342,061 | 298,316 | |||||||||||||||
|
|
|
|
|
|
|
|
|
|
|
|||||||||||
|
Total deposits |
$ | 4,771,519 | $ | 4,086,995 | $ | 3,702,271 | $ | 3,314,516 | $ | 3,109,600 | ||||||||||
|
|
|
|
|
|
|
|
|
|
|
|||||||||||
43
Table of Contents
PERCENTAGE OF TOTAL AVERAGE DEPOSITS AND AVERAGE RATES PAID
| 2011 | 2010 | 2009 | 2008 | 2007 | ||||||||||||||||||||||||||||||||||||
|
% of
Total |
Rate |
% of
Total |
Rate |
% of
Total |
Rate |
% of
Total |
Rate |
% of
Total |
Rate | |||||||||||||||||||||||||||||||
|
Demand deposits |
31.57 | % | 29.65 | % | 28.47 | % | 28.84 | % | 28.22 | % | ||||||||||||||||||||||||||||||
|
Interest-bearing transaction deposits |
14.87 | 0.20 | % | 14.99 | 0.23 | % | 14.02 | 0.23 | % | 12.79 | 0.50 | % | 12.83 | 0.75 | % | |||||||||||||||||||||||||
|
Savings deposits |
34.24 | 0.55 | 34.85 | 0.86 | 33.19 | 1.26 | 33.19 | 2.21 | 33.73 | 3.81 | ||||||||||||||||||||||||||||||
|
Time deposits under $100 |
10.47 | 1.21 | 10.93 | 1.49 | 13.64 | 2.26 | 14.86 | 3.52 | 15.63 | 4.47 | ||||||||||||||||||||||||||||||
|
|
|
|
|
|
|
|
|
|
|
|||||||||||||||||||||||||||||||
|
Total core deposits |
91.15 | 90.42 | 89.32 | 89.68 | 90.41 | |||||||||||||||||||||||||||||||||||
|
Time deposits of $100 or more |
8.85 | 1.29 | 9.58 | 1.49 | 10.68 | 2.19 | 10.32 | 3.67 | 9.59 | 4.71 | ||||||||||||||||||||||||||||||
|
|
|
|
|
|
|
|
|
|
|
|||||||||||||||||||||||||||||||
|
Total deposits |
100.00 | % | 100.00 | % | 100.00 | % | 100.00 | % | 100.00 | % | ||||||||||||||||||||||||||||||
|
|
|
|
|
|
|
|
|
|
|
|||||||||||||||||||||||||||||||
|
Average rate paid on interest- bearing deposits |
0.67 | % | 0.91 | % | 1.36 | % | 2.39 | % | 3.52 | % | ||||||||||||||||||||||||||||||
|
|
|
|
|
|
|
|
|
|
|
|||||||||||||||||||||||||||||||
At December 31, 2011, 69.6% of the Company’s time deposits of $100,000 or more mature in one year or less. The following table shows the maturity of time deposits of $100,000 or more:
MATURITY OF TIME DEPOSITS
|
December 31,
2011 |
||||
| (Dollars in thousands) | ||||
|
$100,000 or More |
||||
|
Three months or less |
$ | 108,018 | ||
|
Over three months through six months |
77,324 | |||
|
Over six months through twelve months |
103,649 | |||
|
Over twelve months |
125,943 | |||
|
|
|
|||
|
Total |
$ | 414,934 | ||
|
|
|
|||
Short-Term Borrowings
Short-term borrowings, consisting primarily of Federal funds purchased and repurchase agreements, are another source of funds for the Company. The level of these borrowings is determined by various factors, including customer demand and the Company’s ability to earn a favorable spread on the funds obtained. Short-term borrowings totaled $8.3 million at December 31, 2011, compared to $7.2 million at December 31, 2010 and $100,000 at December 31, 2009.
Long-Term Borrowings
The Company has a line of credit from the Federal Home Loan Bank (“FHLB”) of Topeka, Kansas to use for liquidity or to match-fund certain long-term fixed rate loans. The Company’s assets, including residential first mortgages of $503.8 million, are pledged as collateral for the borrowings under the line of credit. As of December 31, 2011, the Company had the ability to draw up to $48.8 million on the FHLB line of credit based on FHLB stock holdings of $3.0 million with approximately $18.5 million in advances outstanding due to recent acquisitions. The advances mature at varying dates through 2014 and had rates between 1.7% and 4.3%. The Company had approximately $19.8 million in advances outstanding due to acquisitions at December 31, 2010 and no FHLB borrowings at December 31, 2009.
44
Table of Contents
On December 13, 2010, the Company borrowed $14.5 million from a commercial bank for a three year term. The loan had an interest rate of 3% per annum, payable quarterly on the first day of March, June, September and December until the maturity date of November 30, 2013. The proceeds were used to fund a portion of the Company’s recent acquisitions. On July 22, 2011, the Company made a payment of $6.0 million and paid the remaining balance of $8.5 million on October 25, 2011.
Capital Resources
Stockholders’ equity totaled $483.0 million at December 31, 2011, compared to $458.6 million at December 31, 2010 and $430.8 million at December 31, 2009. Stockholders’ equity has continued to increase due to net earnings retained, stock option exercises, and unrealized gains on securities, partially offset by common stock repurchases, dividends and unrealized losses on securities. The Company’s average equity capital ratio for 2011 was 8.85%, compared to 9.74% for 2010 and 10.15% for 2009. At December 31, 2011, the Company’s leverage ratio was 8.14%, its Tier 1 capital ratio was 13.49%, and its total risk-based capital ratio was 14.62%; compared to minimum requirements of 3%, 4% and 8%, respectively. Banking institutions are generally expected to maintain capital well above the minimum levels.
See Note (15) of the Notes to Consolidated Financial Statements for a discussion of capital ratio requirements.
In November 1999, the Company adopted a Stock Repurchase Program (the “SRP”) authorizing management to repurchase shares of the Company’s common stock. The SRP may be used as a means to increase earnings per share and return on equity, to purchase treasury stock for the exercise of stock options or for distributions under the Deferred Stock Compensation Plan, to provide liquidity for optionees to dispose of stock from exercises of their stock options, and to provide liquidity for stockholders wishing to sell their stock. All shares repurchased under the SRP have been retired and not held as treasury stock. The timing, price and amount of stock repurchases under the SRP may be determined by management and approved by the Company’s Executive Committee. At December 31, 2011 there were 241,751 shares remaining that could be repurchased under the SRP. For the year ended December 31, 2011 the Company repurchased 302,149 shares of its common stock for $10.8 million or an average price of $35.74 per share under the SRP and for the year ended December 31, 2010, the Company repurchased 16,500 shares of its common stock for $605,400 or an average price of $36.69 per share under the SRP. No shares were repurchased in 2009.
In January 2004, BancFirst Corporation established BFC Capital Trust II (“BFC II”), a trust formed under the Delaware Business Trust Act. BancFirst Corporation owns all of the common securities of BFC II. In February 2004, BFC II issued $25 million of aggregate liquidation amount of 7.20% Cumulative Trust Preferred Securities (the “Cumulative Trust Preferred Securities”) to other investors. In March 2004, BFC II issued an additional $1 million in Cumulative Trust Preferred Securities through the execution of an over-allotment option. The proceeds from the sale of the Cumulative Trust Preferred Securities and the common securities of BFC II were invested in $26.8 million of 7.20% Junior Subordinated Debentures of BancFirst Corporation. Interest payments on the $26.8 million of 7.20% Junior Subordinated Debentures are payable January 15, April 15, July 15 and October 15 of each year. Such interest payments may be deferred for up to twenty consecutive quarters. The stated maturity date of the $26.8 million of 7.20% Junior Subordinated Debentures is March 31, 2034, but they are subject to mandatory redemption pursuant to optional prepayment terms. The Cumulative Trust Preferred Securities represent an undivided interest in the $26.8 million of 7.20% Junior Subordinated Debentures and are guaranteed by BancFirst Corporation. During any deferral period or during any event of default, BancFirst Corporation may not declare or pay any dividends on any of its capital stock. In March 2005, the Federal Reserve Board adopted a final rule that allows the continued limited inclusion of trust preferred securities in the Tier 1 capital of bank holding companies. The Cumulative Trust Preferred Securities were callable at par, in whole or in part, after March 31, 2009.
In October 2010, BancFirst Corporation acquired Union National Statutory Trust I (“UNST I”), a trust formed under the Delaware Business Trust Act, from the merger of Union National Bancshares, Inc. BancFirst
45
Table of Contents
Corporation owns all of the common securities of UNST I. The trust had issued $2 million of aggregate liquidation amount of Fixed/Floating Rate Junior Subordinated Deferrable Interest Debentures (the “Deferrable Interest Debentures”) to other investors. The proceeds from the sale of the Deferrable Interest Debentures and the common securities of UNST I were invested in $2.1 million of Junior Subordinated Debentures of Union National Bancshares, Inc., which were assumed by BancFirst Corporation as a result of the merger. Interest payments on the $2.1 million of Junior Subordinated Debentures are payable March 15, June 15, September 15 and December 15 of each year. The interest rate on the $2.1 million of Junior Subordinated Debentures was set at 6.5% through March 2011 at which time the rate switched to three-month LIBOR plus 165 basis points. Such interest payments may be deferred for up to twenty consecutive quarters. The stated maturity date of the $2.1 million of Junior Subordinated Debentures is March 15, 2036, but they are subject to mandatory redemption pursuant to optional prepayment terms. The Deferrable Interest Debentures represent an undivided interest in the $2.1 million of Junior Subordinated Debentures and are guaranteed by BancFirst Corporation. During any deferral period or during any event of default, BancFirst Corporation may not declare or pay any dividends on any of its capital stock. The Deferrable Interest Debentures were callable at par, in whole or in part, after March 15, 2011.
On July 12, 2011, BancFirst Corporation acquired FBC Financial Corp. Statutory Trust I (“FBCST I”), a trust formed under the Connecticut Business Trust Act, from the merger of FBC Financial Corp. BancFirst Corporation owns all of the common securities of FBCST I. The trust had issued $7 million of aggregate liquidation amount of Fixed/Floating Rate Junior Subordinated Deferrable Interest Debentures (the “Deferrable Interest Debentures”) to other investors. The proceeds from the sale of the Deferrable Interest Debentures and the common securities of FBCST I were invested in $7.2 million of Junior Subordinated Debentures of FBC Financial Corp., which were assumed by BancFirst Corporation as a result of the merger. Interest payments on the $7.2 million of Junior Subordinated Debentures are payable March 17, June 17, September 17 and December 17 of each year. The interest rate on the $7.2 million of Junior Subordinated Debentures was set at three-month LIBOR plus 285 basis points. Such interest payments may be deferred for up to twenty consecutive quarters. The stated maturity date of the $7.2 million of Junior Subordinated Debentures is December 17, 2033, but they are subject to mandatory redemption pursuant to optional prepayment terms. The Deferrable Interest Debentures represent an undivided interest in the $7.2 million of Junior Subordinated Debentures and are guaranteed by BancFirst Corporation. During any deferral period or during any event of default, BancFirst Corporation may not declare or pay any dividends on any of its capital stock. The Deferrable Interest Debentures were callable at par, in whole or in part, after December 17, 2008.
Future dividend payments will be determined by the Company’s Board of Directors in light of the earnings and financial condition of the Company and the Bank, their capital needs, applicable governmental policies and regulations and such other factors as the Board of Directors deems appropriate. While no assurance can be given as to the Company’s ability to pay dividends, management believes that, based upon the anticipated performance of the Company, regular dividend payments will continue in 2012.
Related Party Transactions
See Note (18) of the Notes to Consolidated Financial Statements for disclosures regarding the Company’s related party transactions.
46
Table of Contents
CONTRACTUAL OBLIGATIONS
The Company has various contractual obligations that require future cash payments. The following table presents certain known payments for contractual obligations, by payment due period, as of December 31, 2011.
| Payment Due By Period | ||||||||||||||||||||||||
|
Less Than
One Year |
1 to 3
Years |
3 to 5
Years |
Over Five
Years |
Indeterminate
Maturity |
Total | |||||||||||||||||||
| (Dollars in Thousands) | ||||||||||||||||||||||||
|
Junior subordinated debentures (1) |
$ | 2,296 | $ | 4,592 | $ | 4,592 | $ | 75,054 | $ | — | $ | 86,534 | ||||||||||||
|
Operating lease payments |
764 | 746 | 255 | 621 | — | 2,386 | ||||||||||||||||||
|
Long-term borrowings |
9,294 | 9,182 | — | — | — | 18,476 | ||||||||||||||||||
|
Time deposits |
663,876 | 196,985 | 47,146 | 6 | — | 908,013 | ||||||||||||||||||
|
|
|
|
|
|
|
|
|
|
|
|
|
|||||||||||||
|
Total contractual cash obligations |
$ | 676,230 | $ | 211,505 | $ | 51,993 | $ | 75,681 | $ | — | $ | 1,015,409 | ||||||||||||
|
|
|
|
|
|
|
|
|
|
|
|
|
|||||||||||||
| (1) | Includes principal and interest |
Market risk refers to the risk of loss arising from adverse changes in interest rates, foreign currency exchange rates, commodity prices, and other relevant market rates and prices, such as equity prices. The risk of loss can be assessed from the perspective of adverse changes in fair values, cash flows, and future earnings. Due to the nature of its operations, the Company is primarily exposed to interest rate risk arising principally from its lending, investing, deposit and borrowing activities and, to a lesser extent, liquidity risk.
Interest rate risk on the Company’s balance sheet consists of repricing, option, and basis risks. Repricing risk results from the differences in the maturity, or repricing, of asset and liability portfolios. Option risk arises from “embedded options” present in many financial instruments such as loan prepayment options, deposit early withdrawal options and interest rate options. These options allow customers opportunities to benefit when market interest rates change, which typically results in higher costs or lower revenue for the Company. Basis risk refers to the potential for changes in the underlying relationship between market rates and indices, which subsequently result in a narrowing of the profit spread on an earning asset or liability. Basis risk is also present in administered rate liabilities, such as savings accounts, negotiable order of withdrawal accounts, and money market accounts where historical pricing relationships to market rates may change due to the level or directional change in market interest rates.
The Company seeks to reduce fluctuations in its net interest margin and to optimize net interest income with acceptable levels of risk through periods of changing interest rates. Accordingly, the Company’s interest rate sensitivity and liquidity are monitored on an ongoing basis by its Asset and Liability Committee (“ALCO”). ALCO establishes risk measures, limits and policy guidelines for managing the amount of interest rate risk and its effect on net interest income and capital. A variety of measures are used to provide for a comprehensive view of the magnitude of interest rate risk, the distribution of risk, the level of risk over time and the exposure to changes in certain interest rate relationships.
The Company utilizes an earnings simulation model as a quantitative tool in measuring the amount of interest rate risk associated with changing market rates. The model quantifies the effects of various interest rate scenarios on projected net interest income over the next 12 months. These simulations incorporate assumptions regarding pricing and the repricing and maturity characteristics of the existing balance sheet.
The ALCO continuously monitors and manages the balance between interest rate-sensitive assets and liabilities. The objective is to manage the impact of fluctuating market rates on net interest income within acceptable levels. In order to meet this objective, management may lengthen or shorten the duration of assets or liabilities.
47
Table of Contents
As of December 31, 2011, the model simulations projected that a 100 and 200 basis point increase would result in positive variance in net interest income of 3.86% and 9.37%, respectively, relative to the base case, over the next 12 months. Conversely, the model simulation projected that a decrease in interest rates of 25 basis points would result in a negative variance in net interest income of 1.36% relative to the base case, over the next 12 months. The likelihood of a decrease in interest rates beyond 25 basis points as of December 31, 2011 was considered to be remote given prevailing interest rate levels.
The following table presents the Company’s financial instruments that are sensitive to changes in interest rates, their expected maturities and their estimated fair values at December 31, 2011.
|
Avg.
Rate |
Expected Maturity / Principal Repayments at December 31, | Balance | Fair Value | |||||||||||||||||||||||||||||||||
| 2012 | 2013 | 2014 | 2015 | 2016 | Thereafter | |||||||||||||||||||||||||||||||
| (Dollars in thousands) | ||||||||||||||||||||||||||||||||||||
|
Interest Sensitive Assets |
||||||||||||||||||||||||||||||||||||
|
Loans |
5.69 | % | $ | 1,682,904 | $ | 515,794 | $ | 347,581 | $ | 129,197 | $ | 129,290 | $ | 208,732 | $ | 3,013,498 | $ | 3,060,275 | ||||||||||||||||||
|
Securities |
2.45 | 113,437 | 107,109 | 181,219 | 51,062 | 37,538 | 124,612 | 614,977 | 615,458 | |||||||||||||||||||||||||||
|
Federal funds sold and interest-bearing deposits |
0.25 | 1,544,435 | — | — | — | — | — | 1,544,435 | 1,544,435 | |||||||||||||||||||||||||||
|
Interest Sensitive Liabilities |
||||||||||||||||||||||||||||||||||||
|
Savings and transaction deposits |
0.44 | 4,129,722 | — | — | — | — | — | 4,129,722 | 4,138,579 | |||||||||||||||||||||||||||
|
Time deposits |
1.24 | 663,876 | 150,354 | 46,631 | 20,727 | 26,419 | 6 | 908,013 | 913,891 | |||||||||||||||||||||||||||
|
Short-term borrowings |
0.70 | 8,274 | — | — | — | — | — | 8,274 | 8,274 | |||||||||||||||||||||||||||
|
Long-term borrowings |
2.77 | 9,294 | 5,182 | 4,000 | — | — | — | 18,476 | 18,578 | |||||||||||||||||||||||||||
|
Junior subordinated debentures |
6.76 | — | — | — | — | — | 36,083 | 36,083 | 39,300 | |||||||||||||||||||||||||||
|
Off Balance Sheet Items |
||||||||||||||||||||||||||||||||||||
|
Loan commitments |
— | — | — | — | — | — | — | 1,257 | ||||||||||||||||||||||||||||
|
Letters of credit |
— | — | — | — | — | — | — | 419 | ||||||||||||||||||||||||||||
The expected maturities and principal repayments are based upon the contractual terms of the instruments. Prepayments have been estimated for certain instruments with predictable prepayment rates. Savings and transaction deposits are assumed to mature all in the first year as they are not subject to withdrawal restrictions and any assumptions regarding decay rates would be very subjective. The actual maturities and principal repayments for the financial instruments could vary substantially from the contractual terms and assumptions used in the analysis.
48
Table of Contents
Report of Independent Registered Public Accounting Firm
Board of Directors and Shareholders
BancFirst Corporation
We have audited the accompanying consolidated balance sheets of BancFirst Corporation (an Oklahoma corporation) and Subsidiaries (collectively, the Company) as of December 31, 2011 and 2010, and the related consolidated statements of comprehensive income, stockholders’ equity and cash flow for each of the three years in the period ended December 31, 2011. These financial statements are the responsibility of the Company’s management. Our responsibility is to express an opinion on these financial statements based on our audits.
We conducted our audits in accordance with the standards of the Public Company Accounting Oversight Board (United States). Those standards require that we plan and perform the audit to obtain reasonable assurance about whether the financial statements are free of material misstatement. An audit includes examining, on a test basis, evidence supporting the amounts and disclosures in the financial statements. An audit also includes assessing the accounting principles used and significant estimates made by management, as well as evaluating the overall financial statement presentation. We believe that our audits provide a reasonable basis for our opinion.
In our opinion, the consolidated financial statements referred to above present fairly, in all material respects, the financial position of BancFirst Corporation and Subsidiaries as of December 31, 2011 and 2010, and the results of their operations and their cash flows for each of the three years in the period ended December 31, 2011, in conformity with accounting principles generally accepted in the United States of America.
We also have audited, in accordance with the standards of the Public Company Accounting Oversight Board (United States), the Company’s internal control over financial reporting as of December 31, 2011, based on criteria established in Internal Control—Integrated Framework issued by the Committee of Sponsoring Organizations of the Treadway Commission (COSO) and our report dated March 15, 2012 expressed an unqualified opinion.
/s/ GRANT THORNTON LLP
Oklahoma City, Oklahoma
March 15, 2012
49
Table of Contents
BANCFIRST CORPORATION
CONSOLIDATED BALANCE SHEETS
(Dollars in thousands, except per share data)
| December 31, | ||||||||
| 2011 | 2010 | |||||||
| ASSETS | ||||||||
|
Cash and due from banks |
$ | 163,698 | $ | 93,059 | ||||
|
Interest-bearing deposits with banks |
1,544,035 | 1,111,020 | ||||||
|
Federal funds sold |
400 | 41,207 | ||||||
|
Securities (market value: $615,458 and $744,432, respectively) |
614,977 | 743,803 | ||||||
|
Loans: |
||||||||
|
Total loans (net of unearned interest) |
3,013,498 | 2,811,964 | ||||||
|
Allowance for loan losses |
(37,656 | ) | (35,745 | ) | ||||
|
|
|
|
|
|||||
|
Loans, net |
2,975,842 | 2,776,219 | ||||||
|
Premises and equipment, net |
111,355 | 97,796 | ||||||
|
Other real estate owned, net |
16,109 | 22,956 | ||||||
|
Intangible assets, net |
14,219 | 11,610 | ||||||
|
Goodwill |
44,545 | 44,548 | ||||||
|
Accrued interest receivable |
18,662 | 21,914 | ||||||
|
Other assets |
104,983 | 96,117 | ||||||
|
|
|
|
|
|||||
|
Total assets |
$ | 5,608,825 | $ | 5,060,249 | ||||
|
|
|
|
|
|||||
| LIABILITIES AND STOCKHOLDERS’ EQUITY | ||||||||
|
Deposits: |
||||||||
|
Noninterest-bearing |
$ | 1,704,996 | $ | 1,318,431 | ||||
|
Interest-bearing |
3,332,739 | 3,185,323 | ||||||
|
|
|
|
|
|||||
|
Total deposits |
5,037,735 | 4,503,754 | ||||||
|
Short-term borrowings |
8,274 | 7,250 | ||||||
|
Accrued interest payable |
2,710 | 3,235 | ||||||
|
Long-term borrowings |
18,476 | 34,265 | ||||||
|
Other liabilities |
22,506 | 24,285 | ||||||
|
Junior subordinated debentures |
36,083 | 28,866 | ||||||
|
|
|
|
|
|||||
|
Total liabilities |
5,125,784 | 4,601,655 | ||||||
|
|
|
|
|
|||||
|
Commitments and contingent liabilities (Note 19) |
||||||||
|
Stockholders’ equity: |
||||||||
|
Senior preferred stock, $1.00 par; 10,000,000 shares authorized; none issued |
— | — | ||||||
|
Cumulative preferred stock, $5.00 par; 900,000 shares authorized; none issued |
— | — | ||||||
|
Common stock, $1.00 par; 20,000,000 shares authorized; shares issued and outstanding: 15,117,430 and 15,368,717, respectively |
15,118 | 15,369 | ||||||
|
Capital surplus |
77,462 | 73,040 | ||||||
|
Retained earnings |
381,017 | 361,680 | ||||||
|
Accumulated other comprehensive income, net of income tax of $5,084 and $4,551, respectively |
9,444 | 8,505 | ||||||
|
|
|
|
|
|||||
|
Total stockholders’ equity |
483,041 | 458,594 | ||||||
|
|
|
|
|
|||||
|
Total liabilities and stockholders’ equity |
$ | 5,608,825 | $ | 5,060,249 | ||||
|
|
|
|
|
|||||
The accompanying notes are an integral part of these consolidated financial statements.
50
Table of Contents
BANCFIRST CORPORATION
(Dollars in thousands, except per share data)
| Year Ended December 31, | ||||||||||||
| 2011 | 2010 | 2009 | ||||||||||
|
INTEREST INCOME |
||||||||||||
|
Loans, including fees |
$ | 164,108 | $ | 154,822 | $ | 152,731 | ||||||
|
Securities: |
||||||||||||
|
Taxable |
12,321 | 12,359 | 13,419 | |||||||||
|
Tax-exempt |
1,878 | 1,243 | 1,398 | |||||||||
|
Federal funds sold |
48 | 12 | 1 | |||||||||
|
Interest-bearing deposits with banks |
3,537 | 2,462 | 2,240 | |||||||||
|
|
|
|
|
|
|
|||||||
|
Total interest income |
181,892 | 170,898 | 169,789 | |||||||||
|
|
|
|
|
|
|
|||||||
|
INTEREST EXPENSE |
||||||||||||
|
Deposits |
21,871 | 26,081 | 36,508 | |||||||||
|
Short-term borrowings |
58 | 6 | 11 | |||||||||
|
Long-term borrowings |
882 | 61 | — | |||||||||
|
Junior subordinated debentures |
2,184 | 1,993 | 1,966 | |||||||||
|
|
|
|
|
|
|
|||||||
|
Total interest expense |
24,995 | 28,141 | 38,485 | |||||||||
|
|
|
|
|
|
|
|||||||
|
Net interest income |
156,897 | 142,757 | 131,304 | |||||||||
|
Provision for loan losses |
4,515 | 2,954 | 10,389 | |||||||||
|
|
|
|
|
|
|
|||||||
|
Net interest income after provision for loan losses |
152,382 | 139,803 | 120,915 | |||||||||
|
|
|
|
|
|
|
|||||||
|
NONINTEREST INCOME |
||||||||||||
|
Trust revenue |
6,672 | 6,288 | 5,826 | |||||||||
|
Service charges on deposits |
42,683 | 39,343 | 37,096 | |||||||||
|
Securities transactions |
1,598 | 324 | 336 | |||||||||
|
Income from sales of loans |
2,015 | 2,942 | 2,779 | |||||||||
|
Insurance commissions |
10,457 | 8,543 | 6,979 | |||||||||
|
Cash management |
7,430 | 6,536 | 8,476 | |||||||||
|
Gain on sale of other assets |
3 | 379 | 213 | |||||||||
|
Other |
6,103 | 5,583 | 5,176 | |||||||||
|
|
|
|
|
|
|
|||||||
|
Total noninterest income |
76,961 | 69,938 | 66,881 | |||||||||
|
|
|
|
|
|
|
|||||||
|
NONINTEREST EXPENSE |
||||||||||||
|
Salaries and employee benefits |
92,231 | 82,359 | 79,019 | |||||||||
|
Occupancy and fixed assets expense, net |
10,128 | 9,050 | 8,346 | |||||||||
|
Depreciation |
8,014 | 7,424 | 7,520 | |||||||||
|
Amortization of intangible assets |
1,668 | 1,107 | 920 | |||||||||
|
Data processing services |
4,942 | 4,352 | 3,636 | |||||||||
|
Net expense from other real estate owned |
958 | 948 | 366 | |||||||||
|
Marketing and business promotion |
6,552 | 5,887 | 5,529 | |||||||||
|
Deposit insurance |
3,674 | 5,722 | 7,833 | |||||||||
|
Other |
30,479 | 27,246 | 25,948 | |||||||||
|
|
|
|
|
|
|
|||||||
|
Total noninterest expense |
158,646 | 144,095 | 139,117 | |||||||||
|
|
|
|
|
|
|
|||||||
|
Income before taxes |
70,697 | 65,646 | 48,679 | |||||||||
|
Income tax expense |
25,076 | 23,337 | 16,070 | |||||||||
|
|
|
|
|
|
|
|||||||
|
Net income |
$ | 45,621 | $ | 42,309 | $ | 32,609 | ||||||
|
|
|
|
|
|
|
|||||||
|
NET INCOME PER COMMON SHARE |
||||||||||||
|
Basic |
$ | 2.99 | $ | 2.76 | $ | 2.13 | ||||||
|
|
|
|
|
|
|
|||||||
|
Diluted |
$ | 2.93 | $ | 2.70 | $ | 2.09 | ||||||
|
|
|
|
|
|
|
|||||||
|
OTHER COMPREHENSIVE INCOME |
||||||||||||
|
Unrealized gains (losses) on securities, net of tax of $(763), $1,265 and $1,862, respectively |
$ | 1,367 | $ | (2,334 | ) | $ | (3,421 | ) | ||||
|
Reclassification adjustment for gains included in net income, net of tax of $230, $99 and $126, respectively |
(428 | ) | (184 | ) | (233 | ) | ||||||
|
|
|
|
|
|
|
|||||||
|
Other comprehensive income (loss), net of tax of $(533), $1,364 and $1,988, respectively |
939 | (2,518 | ) | (3,654 | ) | |||||||
|
|
|
|
|
|
|
|||||||
|
Comprehensive income |
$ | 46,560 | $ | 39,791 | $ | 28,955 | ||||||
|
|
|
|
|
|
|
|||||||
The accompanying notes are an integral part of these consolidated financial statements.
51
Table of Contents
BANCFIRST CORPORATION
CONSOLIDATED STATEMENTS OF STOCKHOLDERS’ EQUITY
(Dollars in thousands, except share data)
| Year Ended December 31, | ||||||||||||||||||||||||
| 2011 | 2010 | 2009 | ||||||||||||||||||||||
| Shares | Amount | Shares | Amount | Shares | Amount | |||||||||||||||||||
|
COMMON STOCK |
||||||||||||||||||||||||
|
Issued at beginning of period |
15,368,717 | $ | 15,369 | 15,308,741 | $ | 15,309 | 15,281,141 | $ | 15,281 | |||||||||||||||
|
Shares issued |
50,862 | 51 | 76,476 | 76 | 27,600 | 28 | ||||||||||||||||||
|
Shares acquired and canceled |
(302,149 | ) | (302 | ) | (16,500 | ) | (16 | ) | — | — | ||||||||||||||
|
|
|
|
|
|
|
|
|
|
|
|
|
|||||||||||||
|
Issued at end of period |
15,117,430 | $ | 15,118 | 15,368,717 | $ | 15,369 | 15,308,741 | $ | 15,309 | |||||||||||||||
|
|
|
|
|
|
|
|
|
|
|
|
|
|||||||||||||
|
CAPITAL SURPLUS |
||||||||||||||||||||||||
|
Balance at beginning of period |
$ | 73,040 | $ | 69,725 | $ | 67,975 | ||||||||||||||||||
|
Common stock issued |
990 | 1,581 | 460 | |||||||||||||||||||||
|
Tax effect of stock options |
357 | 516 | 252 | |||||||||||||||||||||
|
Stock based compensation arrangements |
3,075 | 1,218 | 1,038 | |||||||||||||||||||||
|
|
|
|
|
|
|
|||||||||||||||||||
|
Balance at end of period |
$ | 77,462 | $ | 73,040 | $ | 69,725 | ||||||||||||||||||
|
|
|
|
|
|
|
|||||||||||||||||||
|
RETAINED EARNINGS |
||||||||||||||||||||||||
|
Balance at beginning of period |
$ | 361,680 | $ | 334,693 | $ | 315,858 | ||||||||||||||||||
|
Net income |
45,621 | 42,309 | 32,609 | |||||||||||||||||||||
|
Dividends on common stock
|
(15,787 | ) | (14,733 | ) | (13,774 | ) | ||||||||||||||||||
|
Common stock acquired and canceled |
(10,497 | ) | (589 | ) | — | |||||||||||||||||||
|
|
|
|
|
|
|
|||||||||||||||||||
|
Balance at end of period |
$ | 381,017 | $ | 361,680 | $ | 334,693 | ||||||||||||||||||
|
|
|
|
|
|
|
|||||||||||||||||||
|
ACCUMULATED OTHER COMPREHENSIVE INCOME |
||||||||||||||||||||||||
|
Unrealized gains (losses) on securities: |
||||||||||||||||||||||||
|
Balance at beginning of period |
$ | 8,505 | $ | 11,023 | $ | 14,677 | ||||||||||||||||||
|
Net change |
939 | (2,518 | ) | (3,654 | ) | |||||||||||||||||||
|
|
|
|
|
|
|
|||||||||||||||||||
|
Balance at end of period |
$ | 9,444 | $ | 8,505 | $ | 11,023 | ||||||||||||||||||
|
|
|
|
|
|
|
|||||||||||||||||||
|
Total stockholders’ equity |
$ | 483,041 | $ | 458,594 | $ | 430,750 | ||||||||||||||||||
|
|
|
|
|
|
|
|||||||||||||||||||
The accompanying notes are an integral part of these consolidated financial statements.
52
Table of Contents
BANCFIRST CORPORATION
(Dollars in thousands)
| December 31, | ||||||||||||
| 2011 | 2010 | 2009 | ||||||||||
|
CASH FLOWS FROM OPERATING ACTIVITIES |
||||||||||||
|
Net income |
$ | 45,621 | $ | 42,309 | $ | 32,609 | ||||||
|
Adjustments to reconcile to net cash provided by operating activities: |
||||||||||||
|
Provision for loan losses |
4,515 | 2,954 | 10,389 | |||||||||
|
Depreciation and amortization |
9,682 | 8,531 | 8,440 | |||||||||
|
Net amortization of securities premiums and discounts |
3,907 | 2,723 | 2,556 | |||||||||
|
Realized securities gains |
(1,598 | ) | (324 | ) | (336 | ) | ||||||
|
Gain on sales of loans |
(2,015 | ) | (2,942 | ) | (2,779 | ) | ||||||
|
Cash receipts from the sale of loans originated for sale |
166,254 | 313,902 | 287,795 | |||||||||
|
Cash disbursements for loans originated for sale |
(164,665 | ) | (239,439 | ) | (321,856 | ) | ||||||
|
Deferred income tax (benefit) provision |
(5,282 | ) | (58 | ) | 467 | |||||||
|
Gain on other assets |
(1,060 | ) | (341 | ) | (57 | ) | ||||||
|
Decrease in interest receivable |
3,874 | 1,666 | 2,728 | |||||||||
|
Decrease in interest payable |
(595 | ) | (1,152 | ) | (1,941 | ) | ||||||
|
Amortization of stock based compensation arrangements |
3,075 | 1,218 | 1,038 | |||||||||
|
Prepayment of deposit insurance |
— | — | (19,075 | ) | ||||||||
|
Other, net |
697 | 1,843 | 728 | |||||||||
|
|
|
|
|
|
|
|||||||
|
Net cash provided by operating activities |
62,410 | 130,890 | 706 | |||||||||
|
|
|
|
|
|
|
|||||||
|
INVESTING ACTIVITIES |
||||||||||||
|
Net cash and due from banks provided by (used for) acquisitions |
27,741 | (37,226 | ) | (5,452 | ) | |||||||
|
Purchases of securities: |
||||||||||||
|
Held for investment |
(6,400 | ) | (345 | ) | (2,423 | ) | ||||||
|
Available for sale |
(286,186 | ) | (296,959 | ) | (91,292 | ) | ||||||
|
Maturities of securities: |
||||||||||||
|
Held for investment |
5,930 | 7,978 | 7,067 | |||||||||
|
Available for sale |
360,536 | 67,927 | 109,822 | |||||||||
|
Proceeds from sales and calls of securities: |
||||||||||||
|
Held for investment |
2 | 155 | 24 | |||||||||
|
Available for sale |
94,658 | 5,783 | 7,413 | |||||||||
|
Net decrease/(increase) in Federal funds sold |
40,807 | 1,749 | (4,000 | ) | ||||||||
|
Purchases of loans |
(41,395 | ) | (3,935 | ) | (27,278 | ) | ||||||
|
Proceeds from sales of loans |
9,458 | 27,818 | 14,895 | |||||||||
|
Net other (increase)/decrease in loans |
(63,956 | ) | (22,726 | ) | 46,689 | |||||||
|
Purchases of premises, equipment and computer software |
(16,380 | ) | (7,508 | ) | (6,013 | ) | ||||||
|
Proceeds from the sale of other assets |
15,588 | 6,458 | 7,661 | |||||||||
|
|
|
|
|
|
|
|||||||
|
Net cash provided by (used in) investing activities |
140,403 | (250,831 | ) | 57,113 | ||||||||
|
|
|
|
|
|
|
|||||||
|
FINANCING ACTIVITIES |
||||||||||||
|
Net increase in demand, transaction and savings deposits |
433,205 | 323,196 | 523,533 | |||||||||
|
Net (decrease)/increase in time deposits |
(71,967 | ) | (43,237 | ) | 27,875 | |||||||
|
Net (decrease)/increase in short-term borrowings |
(9,862 | ) | 7,250 | (12,784 | ) | |||||||
|
(Paydown)/issuance of long-term borrowings |
(25,541 | ) | 13,466 | — | ||||||||
|
Issuance of common stock |
1,398 | 2,173 | 740 | |||||||||
|
Acquisition of common stock |
(10,799 | ) | (605 | ) | — | |||||||
|
Cash dividends paid |
(15,593 | ) | (14,733 | ) | (13,774 | ) | ||||||
|
|
|
|
|
|
|
|||||||
|
Net cash provided by financing activities |
300,841 | 287,510 | 525,590 | |||||||||
|
|
|
|
|
|
|
|||||||
|
Net increase in cash, due from banks and interest-bearing deposits |
503,654 | 167,569 | 583,409 | |||||||||
|
Cash, due from banks and interest-bearing deposits at the beginning of the period |
1,204,079 | 1,036,510 | 453,101 | |||||||||
|
|
|
|
|
|
|
|||||||
|
Cash, due from banks and interest-bearing deposits at the end of the period |
$ | 1,707,733 | $ | 1,204,079 | $ | 1,036,510 | ||||||
|
|
|
|
|
|
|
|||||||
|
SUPPLEMENTAL DISCLOSURES OF CASH FLOW INFORMATION: |
||||||||||||
|
Cash paid during the year for interest |
$ | 25,520 | $ | 28,792 | $ | 40,426 | ||||||
|
|
|
|
|
|
|
|||||||
|
Cash paid during the year for income taxes |
$ | 29,202 | $ | 23,389 | $ | 12,400 | ||||||
|
|
|
|
|
|
|
|||||||
The accompanying notes are an integral part of these consolidated financial statements.
53
Table of Contents
BANCFIRST CORPORATION
NOTES TO CONSOLIDATED FINANCIAL STATEMENTS
(1) SUMMARY OF SIGNIFICANT ACCOUNTING POLICIES
The accounting and reporting policies of BancFirst Corporation and its subsidiaries (the “Company”) conform to generally accepted accounting principles and general practice within the banking industry. A summary of the significant accounting policies follows.
Nature of Operations
BancFirst Corporation is an Oklahoma business corporation and a financial holding company under Federal law. It conducts virtually all of its operating activities through its principal wholly-owned subsidiary, BancFirst (the “Bank” or “BancFirst”), a state-chartered bank headquartered in Oklahoma City, Oklahoma. The Bank provides a wide range of retail and commercial banking services, including: commercial, real estate, agricultural and consumer lending; depository and funds transfer services; collections; safe deposit boxes; cash management services; retail brokerage services; and other services tailored for both individual and corporate customers. The Bank also offers trust services and acts as executor, administrator, trustee, transfer agent and in various other fiduciary capacities. Through its Technology and Operations Center, the Bank provides item processing, research and other correspondent banking services to financial institutions and governmental units.
Basis of Presentation
The accompanying consolidated financial statements include the accounts of BancFirst Corporation, Council Oak Partners, LLC, BancFirst Insurance Services Inc., 1 st Bank Oklahoma and BancFirst and its subsidiaries. The principal operating subsidiaries of BancFirst are Council Oak Investment Corporation, Council Oak Real Estate Inc., BancFirst Agency, Inc., and BancFirst Community Development Corporation. All significant intercompany accounts and transactions have been eliminated. Assets held in a fiduciary or agency capacity are not assets of the Company and, accordingly, are not included in the consolidated financial statements. Certain amounts from 2010 and 2009 have been reclassified to conform to the 2011 presentation. These reclassifications were not material to the Company’s financial statements.
Use of Estimates
The preparation of financial statements in conformity with accounting principles generally accepted in the United States inherently involves the use of estimates and assumptions that affect the amounts reported in the financial statements and the related disclosures. These estimates relate principally to the determination of the allowance for loan losses, income taxes, the fair value of financial instruments and the valuation of intangibles. Such estimates and assumptions may change over time and actual amounts realized may differ from those reported.
Securities
The Company does not engage in securities trading activities. Any sales of securities are for the purpose of executing the Company’s asset/liability management strategy, eliminating a perceived credit risk in a specific security, or providing liquidity. Securities that are being held for indefinite periods of time, or that may be sold as part of the Company’s asset/liability management strategy, to provide liquidity or for other reasons, are classified as available for sale and are stated at estimated market value. Unrealized gains or losses on securities available for sale are reported as a component of stockholders’ equity, net of income tax. Gains or losses from sales of securities are based upon the book values of the specific securities sold. Securities for which the Company has the intent and ability to hold to maturity are classified as held for investment and are stated at cost, adjusted for amortization of premiums and accretion of discounts computed under the interest method. The Company reviews
54
Table of Contents
its portfolio of securities for impairment at least quarterly. Impairment is considered to be other-than-temporary if it is likely that all amounts contractually due will not be received for debt securities and when there is no positive evidence indicating that an investment’s carrying amount is recoverable in the near term for equity securities. When impairment is considered other-than-temporary, the cost basis of the security is written down to fair value, with the impairment charge included in earnings. In evaluating whether the impairment is temporary or other-than-temporary, the Company considers, among other things, the time period the security has been in an unrealized loss position, and whether the Company has the intent and ability to hold a security for a period of time sufficient to allow for any anticipated recovery in fair value.
Loans
Loans originated within the bank are stated at the principal amount outstanding, net of unearned interest, loan fees, and allowance for loan losses. Interest income on certain installment loans is recorded by use of a method that produces a reasonable approximation of a constant yield on the outstanding principal. Interest on all other performing loans is recognized, on a simple interest basis, based upon the principal amount outstanding. A loan is placed on nonaccrual status when, in the opinion of management, the future collectability of interest and/or principal is not probable. When interest accrual is discontinued, all unpaid accrued interest is reversed. Interest income is recognized on certain of these loans on a cash basis if the full collection of the remaining principal balance is reasonably expected. Otherwise, interest income is not recognized until the principal balance is fully collected. See Note (5) for loan disclosures.
Acquired Loans
Loans acquired through business combinations since December 2009 are required to be carried at fair value as of the date of the combination. Loans that would have a general allowance for loan losses or have specific evidence of deterioration of credit quality since origination are adjusted to fair value and any allowance for loan losses is eliminated. The fair value adjustment estimates the current value of the loans for which it is probable, at acquisition, that the Company will be unable to collect all contractually required payments (as determined by the present value of expected future cash flows). The difference between the undiscounted cash flows expected at acquisition and the investment in the loan, or the “accretable yield,” is recognized in interest income on a level-yield method over the life of the loan. Contractually required payments for interest and principal that exceed the undiscounted cash flows expected at acquisition, or the “nonaccretable difference,” are not recognized as yield adjustments or as loss accruals or valuation allowances. Increases in expected cash flows subsequent to the initial investment are recognized prospectively through adjustment of the yield on the loan over its remaining life. Decreases in expected cash flows are recognized as impairments. Any probable loss due to subsequent credit deterioration of the loans since acquisition is provided for in the allowance for loan losses.
Loans Held For Sale
The Company originates mortgage loans to be sold. At the time of origination, the acquiring bank has already been determined and the terms of the loan, including the interest rate, have already been set by the acquiring bank allowing the Company to originate the loan at fair value. Mortgage loans are generally sold within 30 days of origination. Loans held for sale are carried at the lower of cost or market. Gains or losses recognized upon the sale of the loans are determined on a specific identification basis.
Allowance for Loan Losses
The allowance for loan losses is an estimate of probable credit losses related to specifically identified loans and for losses inherent in the portfolio that have been incurred as of the balance sheet date. The allowance for loan losses is increased by provisions charged to operating expense and is reduced by net loan charge-offs. The amount of the allowance for loan losses is based on past loan loss experience, evaluations of known impaired loans, levels of adversely graded loans, general economic conditions and other environmental factors. Loans are
55
Table of Contents
considered impaired when, based on current information and events, it is probable the Company will be unable to collect all amounts due in accordance with the original contractual terms of the loan agreement, including scheduled principal and interest payments. Impairment is evaluated in aggregate for smaller-balance loans of a similar nature and on an individual loan basis for other loans. If a loan is impaired, a specific allowance is provided, if necessary, so that the loan is reported net, at the present value of estimated future cash flows using the loan’s existing rate or at the fair value of collateral if repayment is expected primarily from the collateral. Interest payments on impaired loans are typically applied to principal unless collectability of the principal amount is reasonably assured, in which case interest is recognized on a cash basis. Impaired loans, or portions thereof, are charged off when deemed uncollectible.
Premises and Equipment
Premises and equipment are stated at cost, less accumulated depreciation. Depreciation is charged to operating expense and is computed using the straight-line method over the estimated useful lives of the assets. Maintenance and repairs are charged to expense as incurred while improvements are capitalized. Premises and equipment is tested for impairment if events or changes in circumstances occur that indicate that the carrying amount of any premises and equipment may not be recoverable. Impairment losses are measured by comparing the fair values of the premises and equipment with their recorded amounts. Premises that are identified to be sold are transferred to other real estate owned at the lower of their carrying amounts or their fair market values less estimated costs to sell. Any losses on premises identified to be sold are charged to operating expense. When premises and equipment are transferred to other real estate owned, sold, or otherwise retired, the cost and applicable accumulated depreciation are removed from the respective accounts and any resulting gains or losses are reported in the statement of comprehensive income.
Other Real Estate Owned
Other real estate owned consists of properties acquired through foreclosure proceedings or acceptance of a deed in lieu of foreclosure, and premises held for sale. These properties are carried at the lower of the book values of the related loans or fair market values based upon appraisals, less estimated costs to sell. Losses arising at the time of reclassification of such properties from loans to other real estate owned are charged directly to the allowance for loan losses. Any losses on premises identified to be sold are charged to operating expense at the time of transfer from premises to other real estate owned. Losses from declines in value of the properties subsequent to classification as other real estate owned are charged to operating expense.
Intangible Assets and Goodwill
Core deposit intangibles are amortized on a straight-line basis over the estimated useful lives of seven to ten years. Goodwill is not amortized, but is evaluated at a reporting unit level at least annually for impairment or more frequently if other indicators of impairment are present. Customer relationship intangibles are amortized on a straight-line basis over the estimated useful lives of eight to eighteen years. Mortgage servicing rights are amortized based on current prepayment assumptions. All intangible assets are reviewed annually in the fourth quarter for impairment. Impairment losses are measured by comparing the fair values of the intangible assets with their recorded amounts. Any impairment losses are reported in the statement of comprehensive income.
Derivatives
The Company recognizes all of its derivative instruments as assets or liabilities in the balance sheet at fair value and recognizes the realized and unrealized change in fair value in the statement of comprehensive income.
Stock-Based Compensation
The Company recognizes stock-based compensation as compensation cost in the statement of comprehensive income based on the fair value of the Company’s stock options on the measurement date, which, for the Company, is the date of the grant. The fair value of each option grant is estimated on the date of grant
56
Table of Contents
using the Black-Scholes option-pricing model and is based on certain assumptions including risk-free rate of return, dividend yield, stock price volatility, and the expected term. The fair value of each option is expensed over its vesting period.
Income Taxes
The Company files a consolidated income tax return with its subsidiaries. Federal and state income tax expense or benefit has been allocated to subsidiaries on a separate return basis. Deferred taxes are recognized under the liability method based upon the future tax consequences of temporary differences between the carrying amounts and tax basis of assets and liabilities, using the tax rates expected to apply to taxable income in the periods when the related temporary differences are expected to be realized. Realization of deferred tax assets is dependent upon the generation of a sufficient level of future taxable income and recoverable taxes paid in prior years. Although realization is not assured, management believes it is more likely than not that all of the deferred tax assets will be realized.
Earnings Per Common Share
Basic earnings per common share is computed by dividing net income, less any preferred dividends requirement, by the weighted average of common shares outstanding. Diluted earnings per common share reflects the potential dilution that could occur if options, convertible securities or other contracts to issue common stock were exercised or converted into common stock or resulted in the issuance of common stock that then shared in the earnings of the Company.
Comprehensive Income
Comprehensive income includes all changes in stockholders’ equity during a period, except those resulting from transactions with stockholders. Besides net income, other components of the Company’s comprehensive income includes the after tax effect of changes in the net unrealized gain/loss on securities available for sale.
Statement of Cash Flows
For purposes of the statement of cash flows, the Company considers cash and due from banks, and interest-bearing deposits with banks as cash equivalents.
Recent Accounting Pronouncements
The Financial Accounting Standards Board (“FASB”) Accounting Standards Codification (“ASC”) was effective for the Company’s financial statements for periods ending after September 15, 2009. On July 1, 2009, the ASC became the single source of authoritative non-governmental U.S. generally accepted accounting principles (“GAAP”). Rules and interpretive releases of the Securities and Exchange Commission (“SEC”) under authority of Federal securities laws are also sources of authoritative guidance for SEC registrants. All guidance contained in the Codification carries an equal level of authority. All non-grandfathered, non-SEC accounting literature not included in the Codification is superseded and deemed non-authoritative. Implementation of the ASC did not have a significant impact on the Company’s financial statements.
In December 2011, the FASB issued Accounting Standards Update (“ASU”) No. 2011-12, “Comprehensive Income (Topic 220)—Deferral of the Effective Date for Amendments to the Presentation of Reclassifications of Items out of Accumulated Other Comprehensive Income in Accounting Standards Update No. 2011-05.” ASU 2011-12 defers changes in ASU No. 2011-05 that relate to the presentation of reclassification adjustments to allow the FASB time to redeliberate whether to require presentation of such adjustments on the face of the financial statements to show the effects of reclassifications out of accumulated other comprehensive income on the components of net income and other comprehensive income. ASU 2011-12 allows entities to continue to report reclassifications out of accumulated other comprehensive income consistent with the presentation
57
Table of Contents
requirements in effect before ASU No. 2011-05. All other requirements in ASU No. 2011-05 are not affected by ASU No. 2011-12. ASU 2011-12 is effective for annual and interim periods beginning after December 15, 2011 and is not expected to have a significant impact on the Company’s financial statements.
In November 2011, the FASB issued ASU No. 2011-11, “Balance Sheet (Topic 210)—Disclosure about Offsetting Assets and Liabilities.” ASU 2011-11 is an amendment to require an entity to disclose both net and gross information about offsetting assets and liabilities to enable users of its financial statements to understand the effect of those arrangements. Arrangements include derivatives, sale and repurchase agreements and transactions, securities borrowing and securities lending arrangements. ASU 2011-11 is effective for annual and interim periods beginning on January 1, 2013 and is not expected to have a significant impact on the Company’s financial statements.
In September 2011, the FASB issued ASU No. 2011-08, “Intangibles—Goodwill and Other (Topic 350).” ASU 2011-08 is an update to simplify how entities test for goodwill impairment. The amendments in the update permit the Company to first assess qualitative factors to determine whether it is more likely than not that the fair value of a reporting unit is less than its carrying amount. If these factors determined that the fair value exceeds the carrying amount then the Company is not required to calculate the fair value of the reporting unit. The Company adopted ASU 2011-08 as of September 30, 2011. Adoption of ASU 2011-08 did not have a significant effect on the Company’s financial statements.
In June 2011, the FASB issued ASU No. 2011-05, “Comprehensive Income (Topic 220)—Presentation of Comprehensive Income.” ASU 2011-05 is an update to improve the comparability, consistency, and transparency of financial reporting, to increase the prominence of items reported in other comprehensive income, and to facilitate convergence of GAAP and International Financial Reporting Standards (“IFRS”). The Company adopted ASU 2011-05 as of September 30, 2011, and it applies retrospectively. The adoption of ASU 2011-05 did not have a significant effect on the Company’s financial statements.
In May 2011, the FASB issued ASU No. 2011-04, “Fair Value Measurement (Topic 820)—Amendments to Achieve Common Fair Value Measurement and Disclosure Requirements in GAAP and IFRS.” ASU 2011-04 is an update to explain how to measure fair value. This amendment does not require additional fair value measurements and is not intended to establish valuation standards or affect valuation practices outside of financial reporting. This amendment was put forth in order to describe many of the requirements in GAAP for measuring fair value and for disclosing information about fair value measurements consistent with IFRS. ASU 2011-04 is effective for annual and interim periods beginning after December 16, 2011, and applies prospectively. Adoption of ASU 2011-04 is not expected to have a significant effect on the Company’s financial statements.
In April 2011, the FASB issued ASU No. 2011-02, “Receivables (Topic 310)—A Creditor’s Determination of Whether a Restructuring Is a Troubled Debt Restructuring.” ASU 2011-02 clarifies which loan modifications constitute troubled debt restructurings and is intended to assist creditors in determining whether a modification of the terms of a receivable meets the criteria to be considered a troubled debt restructuring, both for purposes of recording an impairment loss and for disclosure of troubled debt restructurings. In evaluating whether a restructuring constitutes a troubled debt restructuring, a creditor must separately conclude, under the guidance clarified by ASU 2011-02, that both of the following exist: (a) the restructuring constitutes a concession; and (b) the debtor is experiencing financial difficulties. ASU 2011-02 was effective for the Company on July 1, 2011, and applies retrospectively to restructurings occurring on or after January 1, 2011. Adoption of ASU 2011-02 did not have a significant effect on the Company’s financial statements.
In December 2010, the FASB issued ASU 2010-29 “Business Combinations (Topic 805)—Disclosures of Supplementary Pro Forma Information for Business Combinations.” The amendments in this update affect any public entity as defined in Topic 805 that enters into business combinations that are material on an individual or aggregate basis. The amendments in the update specify that if a public entity presents comparative financial
58
Table of Contents
statements, the entity should disclose revenue and earnings of the combined entity as though the business combination(s) that occurred during the current year had occurred as of the beginning of the comparable prior annual reporting period only. The amendments in this update also expand the supplemental pro forma disclosures under Topic 805 to include a description of the nature and amount of material, nonrecurring pro forma adjustments directly attributable to the business combination included in the reported pro forma revenue and earnings. The amendments in this update were effective prospectively for business combinations for which the acquisition date was on or after December 15, 2010. The Company did not have any material business combination(s) for the periods presented. The adoption of this update did not have an effect on the Company’s financial statements.
In December 2010, the FASB issued ASU 2010-28 “Intangibles—Goodwill and Other (Topic 350)—When to Perform Step 2 of the Goodwill Impairment Test for Reporting Units with Zero or Negative Carrying Amounts.” The amendments in this update affect all entities that have recognized goodwill and have one or more reporting units whose carrying amount for purposes of performing Step 1 of the goodwill impairment test is zero or negative. For public entities, the amendments in this update were effective for fiscal years, and interim periods within those years, beginning after December 15, 2010. The Company does not have any reporting units with zero or negative carrying amounts, therefore the adoption of this update did not have an effect on the Company’s financial statements.
In July 2010, the FASB issued ASU 2010-20 “Receivables (Topic 310)—Disclosures about the Credit Quality of Financing Receivables and the Allowance for Credit Losses,” which expands the disclosure requirements concerning the credit quality of an entity’s financing receivables and its allowance for loan losses. The new disclosures that relate to information as of the end of the reporting period were effective as of December 31, 2010, whereas the disclosures related to activity that occurred during the reporting periods were effective January 1, 2011. The adoption of this disclosure-only guidance did not have an effect on the Company’s financial statements. See Note (5) for disclosure.
In January 2010 the FASB issued ASU 2010-06 “Fair Value Measurements and Disclosures (Topic 820): Improving Disclosures about Fair Value Measurements.” ASU 2010-06 amends Codification Subtopic 820-10 to now require entities to make new disclosures about the different classes of assets and liabilities measured at fair value. The new requirements are as follows: (1) a reporting entity should disclose separately the amounts of significant transfers between Level 1 and Level 2 fair value measurements and the reasons for the transfers, and (2) in the reconciliation for fair value measurements using significant unobservable inputs (Level 3), a reporting entity should present separately information on purchases, sales, issuances and settlements on a gross basis. The FASB also clarified existing fair value measurement disclosure guidance about the level of disaggregation of assets and liabilities, and information about the valuation techniques and inputs used in estimating Level 2 and Level 3 fair value measurements. Except for certain detailed Level 3 disclosures, which were effective for fiscal years beginning after December 15, 2010 and interim periods within those fiscal years, the new guidance was effective for the Company’s financial statements for the periods ending after December 15, 2009. The adoption of this disclosure-only guidance did not have an effect on the Company’s financial statements. See Note (20) for disclosure.
In April 2009, the FASB issued ASC Topic 320 “Investments – Debt and Equity Securities Recognition and Presentation of Other-Than-Temporary Impairments” amends the other-than-temporary impairment guidance under GAAP for debt securities to make the guidance more operational and improve the presentation and disclosure in the financial statements. The ASU specifies that if a company does not have the intent to sell a debt security prior to recovery and it is more likely than not that it will not have to sell the debt security prior to recovery; the security would not be considered other-than-temporarily impaired unless there is a credit loss. The credit loss component of other-than-temporarily impaired debt security must be determined based on the company’s best estimate of cash flows expected to be collected. This guidance became effective for the interim and annual periods ending after June 15, 2009. Implementation of this pronouncement did not have a significant impact on the Company’s financial statements. See Note (4) for disclosure.
59
Table of Contents
(2) RECENT DEVELOPMENTS, INCLUDING MERGERS & ACQUISITIONS
On July 12, 2011, the Company completed the acquisition of FBC Financial Corporation and its subsidiary bank, 1st Bank Oklahoma with banking locations in Claremore, Verdigris, and Inola, Oklahoma. The Company paid a premium of $1.5 million above the equity capital of FBC Financial Corporation. At acquisition, 1st Bank Oklahoma had approximately $217 million in total assets, $116 million in loans, $178 million in deposits and $18 million in equity capital. 1st Bank Oklahoma operated as a subsidiary of BancFirst Corporation until it was merged into BancFirst on February 17, 2012. The acquisition did not have a material effect on the Company’s consolidated financial statements.
The Federal Reserve enacted a final rule on June 29, 2011 establishing the debit card interchange rate at $0.21 per transaction and five basis points multiplied by the value of the transaction that was effective on October 1, 2011 for banks exceeding $10 billion in assets. Although the rule does not apply directly to the Company, the possible competitive response may have an impact on the Company’s pricing of these services.
On December 15, 2010, the Company completed the acquisition of OK Bancorporation, Inc., and its subsidiary bank, The Okemah National Bank. At acquisition, The Okemah National Bank had approximately $73 million in total assets, $32 million in loans, $62 million in deposits, and $9 million in equity capital. The Okemah National Bank operated as a subsidiary of BancFirst Corporation until it was merged into BancFirst on October 21, 2011. The acquisition did not have a material effect on the Company’s consolidated financial statements.
On December 10, 2010, the Company completed the acquisition of Exchange Bancshares of Moore, Inc., and its subsidiary bank, Exchange National Bank of Moore. At acquisition, Exchange National Bank of Moore had approximately $147 million in total assets, $47 million in loans, $116 million in deposits, and $10 million in equity capital. Exchange National Bank of Moore operated as a subsidiary of BancFirst Corporation until it was merged into BancFirst on June 17, 2011. The acquisition did not have a material effect on the Company’s consolidated financial statements.
On October 8, 2010, the Company completed the acquisition of Union National Bancshares, Inc., and its subsidiary bank, Union Bank of Chandler with offices in Chandler and Tulsa, Oklahoma. At acquisition, Union Bank of Chandler had approximately $134 million in total assets, $90 million in loans, $117 million in deposits, and $15 million in equity capital. Union Bank of Chandler operated as a subsidiary of BancFirst Corporation until it was merged into BancFirst on November 12, 2010. The acquisition did not have a material effect on the Company’s consolidated financial statements.
The Company recorded a total of $13.3 million of goodwill and core deposit intangibles as a result of the three acquisitions completed in 2010. The combined acquisitions added approximately $371 million in total assets, $169 million in loans and $295 million in deposits. The effects of these acquisitions were included in the consolidated financial statements of the Company from the date of acquisition forward. The Company does not believe these acquisitions, individually or in aggregate were material to the Company’s consolidated financial statements.
Effective as of June 30, 2010, the Company ceased participation in the Transaction Account Guarantee Program (“TAGP”) for extended coverage of noninterest-bearing transaction deposit accounts. Accordingly, the standard deposit insurance amount was in effect for the Company’s deposit accounts through December 31, 2010. In November 2010, the Federal Deposit Insurance Corporation (“FDIC”) issued a final rule to implement provisions of the Dodd-Frank Act that provide for temporary unlimited coverage for noninterest-bearing transaction accounts. The separate coverage for noninterest-bearing transaction accounts became effective on December 31, 2010 and terminates on December 31, 2012.
On April 1, 2010, the Company’s insurance agency BancFirst Insurance Services, Inc., formerly known as Wilcox, Jones & McGrath, Inc., completed its acquisition of RBC Agency, Inc., which had offices in Shawnee
60
Table of Contents
and Stillwater. BancFirst Insurance Services, Inc. also has offices in Oklahoma City, Tulsa, Lawton and Muskogee. The acquisition did not have a material effect on the Company’s consolidated financial statements.
On March 21, 2010, Congress passed student loan reform legislation centralizing student lending in a governmental agency, which as of June 30, 2010 resulted in an end to the student loan programs provided by the Company. The Company sold all student loans held for sale of $144.5 million in October 2010. As of December 31, 2011 and 2010, the Company had no student loans held for sale. See Note (5) for the amount of student loans held for investment.
On December 8, 2009, the Company completed the acquisition of First Jones Bancorporation. On November 30, 2009, First State Bank, Jones, the subsidiary bank, had approximately $36 million in assets, $31 million in deposits, and $4.5 million in equity capital. First State Bank, Jones operated as a subsidiary of BancFirst Corporation until it was merged into BancFirst in early March 2010. The acquisition enhanced the presence of BancFirst in eastern Oklahoma County. The acquisition did not have a material effect on the Company’s consolidated financial statements.
In November 2009, the FDIC issued a rule that required insured depository institutions to prepay their estimated quarterly risk-based assessments for the fourth quarter of 2009 and for all of 2010, 2011 and 2012. In December 2009, the Company paid $20.2 million in prepaid risk-based assessments, which included $1.2 million related to the fourth quarter of 2009 that would have otherwise been payable in the first quarter of 2010. This amount was included in deposit insurance expense for 2009. Prepaid deposit insurance of approximately $12.3 million and $15.0 million was included in other assets in the accompanying consolidated balance sheets for the years ended December 31, 2011 and 2010, respectively.
On May 22, 2009 the FDIC increased deposit insurance premiums and imposed a Special Assessment on member financial institutions that was based on June 30, 2009 assets less tier one capital. The amount of $1.9 million was expensed on June 30, 2009.
(3) CASH, DUE FROM BANKS, INTEREST-BEARING DEPOSITS AND FEDERAL FUNDS SOLD
The Company maintains accounts with the Federal Reserve Bank and various other financial institutions primarily for the purpose of holding excess liquidity and clearing cash items. It may also sell Federal funds to certain of these institutions on an overnight basis. At December 31, 2011 and 2010 the Company had no significant concentrations of credit risk with other financial institutions. The Company maintained vault cash and excess funds with the Federal Reserve Bank, which is included in the table below.
The Company is required, as a matter of law, to maintain a reserve balance in the form of vault cash or cash on deposit with the Federal Reserve Bank. The average amount of required reserves for each of the years ended December 31, 2011 and 2010 is included in the following table:
| December 31, | ||||||||
| 2011 | 2010 | |||||||
| (Dollars in thousands) | ||||||||
|
Vault cash and excess funds with the Federal Reserve Bank |
$ | 1,554,010 | $ | 1,112,694 | ||||
|
Average required reserves |
35,744 | 45,896 | ||||||
61
Table of Contents
(4) SECURITIES
The following table summarizes securities held for investment and securities available for sale:
| December 31, | ||||||||
| 2011 | 2010 | |||||||
| (Dollars in thousands) | ||||||||
|
Held for investment at cost (market value: $22,958 and $22,640, respectively) |
$ | 22,477 | $ | 22,011 | ||||
|
Available for sale, at market value |
592,500 | 721,792 | ||||||
|
|
|
|
|
|||||
|
Total |
$ | 614,977 | $ | 743,803 | ||||
|
|
|
|
|
|||||
The following table summarizes the amortized cost and estimated market values of securities held for investment:
|
Amortized
Cost |
Gross
Unrealized Gains |
Gross
Unrealized Losses |
Estimated
Market Value |
|||||||||||||
| (Dollars in thousands) | ||||||||||||||||
|
December 31, 2011 |
||||||||||||||||
|
U.S. Treasury and other Federal agencies |
$ | 997 | $ | 75 | $ | — | $ | 1,072 | ||||||||
|
States and political subdivisions |
21,480 | 406 | — | 21,886 | ||||||||||||
|
|
|
|
|
|
|
|
|
|||||||||
|
Total |
$ | 22,477 | $ | 481 | $ | — | $ | 22,958 | ||||||||
|
|
|
|
|
|
|
|
|
|||||||||
|
December 31, 2010 |
||||||||||||||||
|
U.S. Treasury and other Federal agencies |
$ | 1,207 | $ | 82 | $ | — | $ | 1,289 | ||||||||
|
States and political subdivisions |
20,804 | 556 | (9 | ) | 21,351 | |||||||||||
|
|
|
|
|
|
|
|
|
|||||||||
|
Total |
$ | 22,011 | $ | 638 | $ | (9 | ) | $ | 22,640 | |||||||
|
|
|
|
|
|
|
|
|
|||||||||
The following table summarizes the amortized cost and estimated market values of securities available for sale:
|
Amortized
Cost |
Gross
Unrealized Gains |
Gross
Unrealized Losses |
Estimated
Market Value |
|||||||||||||
| (Dollars in thousands) | ||||||||||||||||
|
December 31, 2011 |
||||||||||||||||
|
U.S. Treasuries |
$ | — | $ | — | $ | — | $ | — | ||||||||
|
U.S. Federal agencies (1) |
481,486 | 6,673 | (116 | ) | 488,043 | |||||||||||
|
Mortgage backed securities |
28,984 | 615 | (13 | ) | 29,586 | |||||||||||
|
States and political subdivisions |
60,239 | 2,490 | (20 | ) | 62,709 | |||||||||||
|
Other securities (2) |
7,222 | 4,940 | — | 12,162 | ||||||||||||
|
|
|
|
|
|
|
|
|
|||||||||
|
Total |
$ | 577,931 | $ | 14,718 | $ | (149 | ) | $ | 592,500 | |||||||
|
|
|
|
|
|
|
|
|
|||||||||
|
December 31, 2010 |
||||||||||||||||
|
U.S. Treasuries |
$ | 64,962 | $ | 8 | $ | — | $ | 64,970 | ||||||||
|
U.S. Federal agencies (1) |
560,247 | 11,177 | (719 | ) | 570,705 | |||||||||||
|
Mortgage backed securities |
10,779 | 222 | (11 | ) | 10,990 | |||||||||||
|
States and political subdivisions |
65,115 | 235 | (1,140 | ) | 64,210 | |||||||||||
|
Other securities (2) |
7,686 | 3,653 | (422 | ) | 10,917 | |||||||||||
|
|
|
|
|
|
|
|
|
|||||||||
|
Total |
$ | 708,789 | $ | 15,295 | $ | (2,292 | ) | $ | 721,792 | |||||||
|
|
|
|
|
|
|
|
|
|||||||||
| (1) | Primarily consists of FHLMC, FNMA, GNMA and mortgage backed securities through U.S. agencies. |
| (2) | Primarily consists of government guaranteed corporate bonds and equity securities. |
62
Table of Contents
The maturities of securities held for investment and available for sale are summarized in the following table using contractual maturities. Actual maturities may differ from contractual maturities due to obligations that are called or prepaid. For purposes of the maturity table, mortgage-backed securities, which are not due at a single maturity date, have been presented at their contractual maturity.
| December 31, | ||||||||||||||||
| 2011 | 2010 | |||||||||||||||
|
Amortized
Cost |
Estimated
Market Value |
Amortized
Cost |
Estimated
Market Value |
|||||||||||||
| (Dollars in thousands) | ||||||||||||||||
|
Held for Investment |
||||||||||||||||
|
Contractual maturity of debt securities: |
||||||||||||||||
|
Within one year |
$ | 5,845 | $ | 5,908 | $ | 5,722 | $ | 5,779 | ||||||||
|
After one year but within five years |
13,967 | 14,256 | 12,815 | 13,267 | ||||||||||||
|
After five years but within ten years |
1,883 | 1,943 | 2,483 | 2,528 | ||||||||||||
|
After ten years |
782 | 851 | 991 | 1,066 | ||||||||||||
|
|
|
|
|
|
|
|
|
|||||||||
|
Total |
$ | 22,477 | $ | 22,958 | $ | 22,011 | $ | 22,640 | ||||||||
|
|
|
|
|
|
|
|
|
|||||||||
|
Available for Sale |
||||||||||||||||
|
Contractual maturity of debt securities: |
||||||||||||||||
|
Within one year |
$ | 105,169 | $ | 107,109 | $ | 360,682 | $ | 362,149 | ||||||||
|
After one year but within five years |
317,979 | 321,661 | 168,310 | 177,781 | ||||||||||||
|
After five years but within ten years |
61,412 | 63,358 | 69,276 | 68,390 | ||||||||||||
|
After ten years |
86,149 | 88,210 | 102,914 | 102,635 | ||||||||||||
|
|
|
|
|
|
|
|
|
|||||||||
|
Total debt securities |
570,709 | 580,338 | 701,182 | 710,955 | ||||||||||||
|
Equity securities |
7,222 | 12,162 | 7,607 | 10,837 | ||||||||||||
|
|
|
|
|
|
|
|
|
|||||||||
|
Total |
$ | 577,931 | $ | 592,500 | $ | 708,789 | $ | 721,792 | ||||||||
|
|
|
|
|
|
|
|
|
|||||||||
The following is a detail of proceeds from sales and calls, and realized securities gains and losses, on available for sale securities:
| Year Ended December 31, | ||||||||||||
| 2011 | 2010 | 2009 | ||||||||||
| (Dollars in thousands) | ||||||||||||
|
Proceeds |
$ | 94,658 | $ | 5,783 | $ | 7,413 | ||||||
|
Gross gains realized |
1,940 | 528 | 380 | |||||||||
|
Gross losses realized |
342 | 204 | 44 | |||||||||
The following table is a summary of the Company’s book value of securities that were pledged as collateral for public funds on deposit, repurchase agreements and for other purposes as required or permitted by law:
| Year Ended December 31, | ||||||||
| 2011 | 2010 | |||||||
| (Dollars in thousands) | ||||||||
|
Book value of pledged securities |
$ | 527,211 | $ | 628,911 | ||||
63
Table of Contents
The following table summarizes securities with unrealized losses, segregated by the duration of the unrealized loss, at December 31, 2011 and 2010 respectively:
| Less than 12 Months | More than 12 Months | Total | ||||||||||||||||||||||
|
Estimated
Fair Value |
Unrealized
Losses |
Estimated
Fair Value |
Unrealized
Losses |
Estimated
Fair Value |
Unrealized
Losses |
|||||||||||||||||||
| (Dollars in thousands) | ||||||||||||||||||||||||
|
December 31, 2011 |
||||||||||||||||||||||||
|
Held for Investment |
||||||||||||||||||||||||
|
U.S. Federal agencies |
$ | — | $ | — | $ | — | $ | — | $ | — | $ | — | ||||||||||||
|
States and political subdivisions |
205 | — | — | — | 205 | — | ||||||||||||||||||
|
|
|
|
|
|
|
|
|
|
|
|
|
|||||||||||||
|
Total |
$ | 205 | $ | — | $ | — | $ | — | $ | 205 | $ | — | ||||||||||||
|
|
|
|
|
|
|
|
|
|
|
|
|
|||||||||||||
|
Available for Sale |
||||||||||||||||||||||||
|
U.S. Federal agencies |
$ | — | $ | — | $ | 148,576 | $ | 116 | $ | 148,576 | $ | 116 | ||||||||||||
|
States and political subdivisions |
40 | — | 3,571 | 33 | 3,611 | 33 | ||||||||||||||||||
|
|
|
|
|
|
|
|
|
|
|
|
|
|||||||||||||
|
Total |
$ | 40 | $ | — | $ | 152,147 | $ | 149 | $ | 152,187 | $ | 149 | ||||||||||||
|
|
|
|
|
|
|
|
|
|
|
|
|
|||||||||||||
|
December 31, 2010 |
||||||||||||||||||||||||
|
Held for Investment |
||||||||||||||||||||||||
|
U.S. Federal agencies |
$ | — | $ | — | $ | — | $ | — | $ | — | $ | — | ||||||||||||
|
States and political subdivisions |
105 | — | 521 | 9 | 626 | 9 | ||||||||||||||||||
|
|
|
|
|
|
|
|
|
|
|
|
|
|||||||||||||
|
Total |
$ | 105 | $ | — | $ | 521 | $ | 9 | $ | 626 | $ | 9 | ||||||||||||
|
|
|
|
|
|
|
|
|
|
|
|
|
|||||||||||||
|
Available for Sale |
||||||||||||||||||||||||
|
U.S. Federal agencies |
$ | 20,442 | $ | 23 | $ | 59,703 | $ | 1,129 | $ | 80,145 | $ | 1,152 | ||||||||||||
|
States and political subdivisions |
357 | 2 | 51,973 | 1,138 | 52,330 | 1,140 | ||||||||||||||||||
|
|
|
|
|
|
|
|
|
|
|
|
|
|||||||||||||
|
Total |
$ | 20,799 | $ | 25 | $ | 111,676 | $ | 2,267 | $ | 132,475 | $ | 2,292 | ||||||||||||
|
|
|
|
|
|
|
|
|
|
|
|
|
|||||||||||||
Declines in the fair value of held for investment and available-for-sale securities below their cost that are deemed to be other than temporary are reflected in earnings as realized losses. In estimating other-than-temporary impairment losses, management considers, among other things, (i) the length of time and the extent to which the fair value has been less than cost, (ii) the financial condition and near-term prospects of the issuer, and (iii) the intent and ability of the Company to retain its investment in the issuer for a period of time sufficient to allow for any anticipated recovery in fair value.
Management has the ability and intent to hold the securities classified as held for investment until they mature, at which time the Company will receive full value for the securities. Furthermore, as of December 31, 2011 and 2010, the Company also had the ability and intent to hold the securities classified as available for sale for a period of time sufficient for a recovery of cost. The unrealized losses are largely due to increases in market interest rates over the yields available at the time the underlying debt securities were purchased. The fair value is expected to recover as the securities approach their maturity date or repricing date or if market yields for such investments decline. Management does not believe any of the securities are impaired due to reasons of credit quality and therefore has not recognized any impairment in the Company’s consolidated statement of comprehensive income.
64
Table of Contents
(5) LOANS AND ALLOWANCE FOR LOAN LOSSES
The following is a schedule of loans outstanding by category:
| December 31, | ||||||||||||||||
| 2011 | 2010 | |||||||||||||||
| Amount | Percent | Amount | Percent | |||||||||||||
| (Dollars in thousands) | ||||||||||||||||
|
Commercial and industrial |
$ | 547,942 | 18.19 | % | $ | 549,050 | 19.53 | % | ||||||||
|
Oil & gas production & equipment |
115,786 | 3.84 | 94,535 | 3.36 | ||||||||||||
|
Agriculture |
86,297 | 2.86 | 87,879 | 3.13 | ||||||||||||
|
State and political subdivisions: |
||||||||||||||||
|
Taxable |
6,939 | 0.23 | 9,627 | 0.34 | ||||||||||||
|
Tax-exempt |
17,070 | 0.57 | 10,301 | 0.37 | ||||||||||||
|
Real estate: |
||||||||||||||||
|
Construction |
207,953 | 6.90 | 230,367 | 8.19 | ||||||||||||
|
Farmland |
103,923 | 3.45 | 93,137 | 3.31 | ||||||||||||
|
One to four family residences |
655,134 | 21.74 | 608,786 | 21.65 | ||||||||||||
|
Multifamily residential properties |
37,734 | 1.25 | 31,257 | 1.11 | ||||||||||||
|
Commercial |
960,074 | 31.86 | 797,564 | 28.36 | ||||||||||||
|
Consumer |
252,331 | 8.37 | 273,277 | 9.73 | ||||||||||||
|
Other |
22,315 | 0.74 | 26,184 | 0.92 | ||||||||||||
|
|
|
|
|
|
|
|
|
|||||||||
|
Total loans |
$ | 3,013,498 | 100.00 | % | $ | 2,811,964 | 100.00 | % | ||||||||
|
|
|
|
|
|
|
|
|
|||||||||
|
Loans held for sale (included above) |
$ | 12,126 | $ | 11,776 | ||||||||||||
|
|
|
|
|
|||||||||||||
|
Student loans held for investment (included above) |
$ | 46,651 | $ | 57,375 | ||||||||||||
|
|
|
|
|
|||||||||||||
The Company’s loans are mostly to customers within Oklahoma and over 60% of the loans are secured by real estate. Credit risk on loans is managed through limits on amounts loaned to individual borrowers, underwriting standards and loan monitoring procedures. The amounts and types of collateral obtained, if any, to secure loans are based upon the Company’s underwriting standards and management’s credit evaluation. Collateral varies, but may include real estate, equipment, accounts receivable, inventory, livestock and securities. The Company’s interest in collateral is secured through filing mortgages and liens, and in some cases, by possession of the collateral.
As of December 31, 2011 and 2010, the Company had no student loans held for sale. Student loans held for investment are included in the table above. Student loans are classified as consumer loans in the preceding table and valued at the lower of cost or market. On March 21, 2010, Congress passed student loan reform legislation centralizing student lending in a governmental agency, which as of June 30, 2010 resulted in an end to the student loan programs provided by the Company. During October 2010 the Company sold student loans held for sale of approximately $144.5 million.
Appraisal Policy
An updated appraisal of the collateral is obtained when a loan is first identified as a problem loan. Appraisals are reviewed annually and are updated as needed, or are updated more frequently if significant changes are believed to have occurred in the collateral or market conditions. Other real estate owned appraisals are consistent with this policy.
65
Table of Contents
Nonaccrual Policy
The Company does not accrue interest on (1) any loan upon which a default of principal or interest has existed for a period of ninety (90) days or over unless the collateral margin or guarantor support are such that full collection of principal and interest are not in doubt, and an orderly plan for collection is in process; and (2) any other loan for which it is expected full collection of principal and interest is not probable.
A nonaccrual loan may be restored to an accrual status when none of its principal and interest is past due and unpaid or otherwise becomes well secured and in the process of collection and when prospects for future contractual payments are no longer in doubt. With the exception of a formal debt forgiveness agreement, no loan which has had principal charged-off shall be restored to accrual status unless the charged-off principal has been recovered.
Charge-off Policy
When a loan deteriorates to the point that the account officer or the Loan Committee concludes it no longer represents a viable asset, it will be charged off. Similarly, any portion of a loan that is deemed to no longer be a viable asset will be charged off. A loan will not be charged off unless such action has been approved by the branch President.
Nonperforming and Restructured Assets
Nonaccrual loans, accruing loans past due more than 90 days, and restructured loans are shown in the table below. Had nonaccrual loans performed in accordance with their original contract terms, the Company would have recognized additional interest income of approximately $1.1 million in 2011, $1.0 million in 2010 and $1.4 million in 2009.
The following is a summary of nonperforming and restructured assets:
| December 31, | ||||||||
| 2011 | 2010 | |||||||
| (Dollars in thousands) | ||||||||
|
Past due over 90 days and still accruing |
$ | 798 | $ | 1,096 | ||||
|
Nonaccrual |
21,187 | 26,701 | ||||||
|
Restructured |
1,041 | 294 | ||||||
|
|
|
|
|
|||||
|
Total nonperforming and restructured loans |
23,026 | 28,091 | ||||||
|
Other real estate owned and repossessed assets |
16,640 | 23,179 | ||||||
|
|
|
|
|
|||||
|
Total nonperforming and restructured assets |
$ | 39,666 | $ | 51,270 | ||||
|
|
|
|
|
|||||
|
Nonperforming and restructured loans to total loans |
0.76 | % | 1.00 | % | ||||
|
|
|
|
|
|||||
|
Nonperforming and restructured assets to total assets |
0.71 | % | 1.01 | % | ||||
|
|
|
|
|
|||||
Loans are segregated into classes based upon the nature of the collateral and the borrower. These classes are used to estimate the credit risk component in the allowance for loan losses.
66
Table of Contents
The following table is a summary of amounts included in nonaccrual loans, segregated by class of loans. Residential real estate refers to one-to-four family real estate.
| December 31, | ||||||||
| 2011 | 2010 | |||||||
| (Dollars in thousands) | ||||||||
|
Non-residential real estate |
$ | 8,576 | $ | 11,343 | ||||
|
Residential real estate |
4,798 | 7,033 | ||||||
|
Non-consumer non-real estate |
1,214 | 1,586 | ||||||
|
Consumer non-real estate |
161 | 297 | ||||||
|
Other loans |
3,247 | 4,574 | ||||||
|
Acquired loans |
3,191 | 1,868 | ||||||
|
|
|
|
|
|||||
|
Total |
$ | 21,187 | $ | 26,701 | ||||
|
|
|
|
|
|||||
The following table presents an age analysis of past due loans, segregated by class of loans:
| Age Analysis of Past Due Receivables | ||||||||||||||||||||||||
|
30-89
Days Past Due |
Greater
than 90 Days |
Total
Past Due Loans |
Current
Loans |
Total Loans |
Accruing
Loans 90 Days or More Past Due |
|||||||||||||||||||
| (Dollars in thousands) | ||||||||||||||||||||||||
|
As of December 31, 2011 |
||||||||||||||||||||||||
|
Non-residential real estate |
$ | 18,678 | $ | 755 | $ | 19,433 | $ | 1,031,765 | $ | 1,051,198 | $ | — | ||||||||||||
|
Residential real estate |
4,760 | 1,769 | 6,529 | 688,094 | 694,623 | 375 | ||||||||||||||||||
|
Non-consumer non-real estate |
2,424 | 252 | 2,676 | 724,014 | 726,690 | 24 | ||||||||||||||||||
|
Consumer non-real estate |
2,416 | 254 | 2,670 | 197,546 | 200,216 | 241 | ||||||||||||||||||
|
Other loans |
2,366 | 2,774 | 5,140 | 153,903 | 159,043 | 60 | ||||||||||||||||||
|
Acquired loans |
2,325 | 963 | 3,288 | 178,440 | 181,728 | 98 | ||||||||||||||||||
|
|
|
|
|
|
|
|
|
|
|
|
|
|||||||||||||
|
Total |
$ | 32,969 | $ | 6,767 | $ | 39,736 | $ | 2,973,762 | $ | 3,013,498 | $ | 798 | ||||||||||||
|
|
|
|
|
|
|
|
|
|
|
|
|
|||||||||||||
|
As of December 31, 2010 |
||||||||||||||||||||||||
|
Non-residential real estate |
$ | 3,806 | $ | 2,150 | $ | 5,956 | $ | 905,782 | $ | 911,738 | $ | 559 | ||||||||||||
|
Residential real estate |
4,625 | 3,018 | 7,643 | 665,245 | 672,888 | 212 | ||||||||||||||||||
|
Non-consumer non-real estate |
4,844 | 729 | 5,573 | 690,674 | 696,247 | 39 | ||||||||||||||||||
|
Consumer non-real estate |
2,240 | 168 | 2,408 | 196,666 | 199,074 | 94 | ||||||||||||||||||
|
Other loans |
3,402 | 4,075 | 7,477 | 147,826 | 155,303 | — | ||||||||||||||||||
|
Acquired loans |
1,528 | 1,635 | 3,163 | 173,551 | 176,714 | 192 | ||||||||||||||||||
|
|
|
|
|
|
|
|
|
|
|
|
|
|||||||||||||
|
Total |
$ | 20,445 | $ | 11,775 | $ | 32,220 | $ | 2,779,744 | $ | 2,811,964 | $ | 1,096 | ||||||||||||
|
|
|
|
|
|
|
|
|
|
|
|
|
|||||||||||||
Impaired Loans
Loans are considered impaired when, based on current information and events, it is probable the Company will be unable to collect the full amount of scheduled principal and interest payments in accordance with the original contractual terms of the loan agreement. If a loan is impaired, a specific valuation allowance may be allocated, if necessary, so that the loan is reported net at the present value of future cash flows using the loan’s existing rate or the fair value of collateral if repayment is expected solely from the collateral. When it is not deemed necessary to allocate a specific valuation allowance to an impaired loan, the loan nevertheless will have an allowance based on a historically adequate percentage determined for the class of loans.
67
Table of Contents
The following table presents impaired loans, segregated by class of loans. No material amount of interest income was recognized on impaired loans subsequent to their classification as impaired.
| Impaired Loans | ||||||||||||||||
|
Unpaid
Principal Balance |
Recorded
Investment with Allowance |
Related
Allowance |
Average
Recorded Investment |
|||||||||||||
| (Dollars in thousands) | ||||||||||||||||
|
As of December 31, 2011 |
||||||||||||||||
|
Non-residential real estate |
$ | 9,311 | $ | 8,576 | $ | 952 | $ | 9,583 | ||||||||
|
Residential real estate |
5,526 | 4,798 | 1,331 | 6,040 | ||||||||||||
|
Non-consumer non-real estate |
1,535 | 1,214 | 282 | 1,584 | ||||||||||||
|
Consumer non-real estate |
196 | 161 | 24 | 195 | ||||||||||||
|
Other loans |
3,345 | 3,247 | 405 | 4,086 | ||||||||||||
|
Acquired loans |
4,513 | 3,191 | 20 | 3,289 | ||||||||||||
|
|
|
|
|
|
|
|
|
|||||||||
|
Total |
$ | 24,426 | $ | 21,187 | $ | 3,014 | $ | 24,777 | ||||||||
|
|
|
|
|
|
|
|
|
|||||||||
|
As of December 31, 2010 |
||||||||||||||||
|
Non-residential real estate |
$ | 12,364 | $ | 11,343 | $ | 1,046 | $ | 20,975 | ||||||||
|
Residential real estate |
7,861 | 7,033 | 1,770 | 6,363 | ||||||||||||
|
Non-consumer non-real estate |
2,492 | 1,586 | 451 | 1,804 | ||||||||||||
|
Consumer non-real estate |
308 | 297 | 102 | 291 | ||||||||||||
|
Other loans |
4,644 | 4,574 | 143 | 3,605 | ||||||||||||
|
Acquired loans |
1,967 | 1,868 | — | 525 | ||||||||||||
|
|
|
|
|
|
|
|
|
|||||||||
|
Total |
$ | 29,636 | $ | 26,701 | $ | 3,512 | $ | 33,563 | ||||||||
|
|
|
|
|
|
|
|
|
|||||||||
Credit Risk Monitoring and Loan Grading
The Company employs several means to monitor the risk in the loan portfolio including volume and severity of loan delinquencies, nonaccrual loans, internal grading of loans, historical loan loss experience, and economic conditions.
Loans are subject to an internal risk grading system which indicates the risk and acceptability of that loan. The loan grades used by the Company are for internal risk identification purposes and do not directly correlate to regulatory classification categories or any financial reporting definitions.
The general characteristics of the risk grades are as follows:
G rade 1—Acceptable— Loans graded 1 represent reasonable and satisfactory credit risk which requires normal attention and supervision. Capacity to repay through primary and/or secondary sources is not questioned.
G rade 2— Acceptable—Increased Attention —This category consists of loans that have credit characteristics deserving management’s close attention. These potential weaknesses could result in deterioration of the repayment prospects for the loan or the Bank’s credit position at some future date. Such credit characteristics include loans to highly leveraged borrowers in cyclical industries, adverse financial trends which could potentially weaken repayment capacity, loans that have fundamental structure deficiencies, loans lacking secondary sources of repayment where prudent, and loans with deficiencies in essential documentation, including financial information.
G rade 3 — Loans with Problem P otential — This category consists of performing loans which are considered to exhibit problem potential. Loans in this category would generally include, but not be limited to, borrowers with a weakened financial condition or poor performance history, past dues, loans restructured to reduce payments to an amount that is below market standards and/or loans with severe documentation problems. In general, these loans have no identifiable loss potential in the near future, however, the possibility of a loss developing is heightened.
68
Table of Contents
G rade 4—Problem Loans/Assets—Nonperforming— This category consists of nonperforming loans/assets which are considered to be problems. Nonperforming loans are described as being 90 days and over past due and still accruing, and loans that are nonaccrual. The government guaranteed portion of SBA loans is excluded.
G rade 5—Loss Potential— This category consists of loans/assets which are considered to possess loss potential. While the loss may not occur in the current year, management expects that loans/assets in this category will ultimately result in a loss, unless substantial improvement occurs.
G rade 6—Charge Off— This category consists of loans that are considered uncollectible and other assets with little or no value.
The following table presents internal loan grading by class of loans:
| Internal Loan Grading | ||||||||||||||||||||||||
| Grade | ||||||||||||||||||||||||
| 1 | 2 | 3 | 4 | 5 | Total | |||||||||||||||||||
| (Dollars in thousands) | ||||||||||||||||||||||||
|
As of December 31, 2011 |
||||||||||||||||||||||||
|
Non-residential real estate |
$ | 907,687 | $ | 104,614 | $ | 30,519 | $ | 8,378 | $ | — | $ | 1,051,198 | ||||||||||||
|
Residential real estate |
599,337 | 74,480 | 15,567 | 5,239 | — | 694,623 | ||||||||||||||||||
|
Non-consumer non-real estate |
626,735 | 91,497 | 7,399 | 1,059 | — | 726,690 | ||||||||||||||||||
|
Consumer non-real estate |
188,180 | 9,229 | 2,431 | 376 | — | 200,216 | ||||||||||||||||||
|
Other loans |
152,798 | 2,546 | 1,653 | 2,046 | — | 159,043 | ||||||||||||||||||
|
Acquired loans |
131,534 | 37,192 | 9,581 | 3,421 | — | 181,728 | ||||||||||||||||||
|
|
|
|
|
|
|
|
|
|
|
|
|
|||||||||||||
|
Total |
$ | 2,606,271 | $ | 319,558 | $ | 67,150 | $ | 20,519 | $ | — | $ | 3,013,498 | ||||||||||||
|
|
|
|
|
|
|
|
|
|
|
|
|
|||||||||||||
|
As of December 31, 2010 |
||||||||||||||||||||||||
|
Non-residential real estate |
$ | 782,616 | $ | 89,501 | $ | 29,159 | $ | 10,462 | $ | — | $ | 911,738 | ||||||||||||
|
Residential real estate |
578,003 | 74,737 | 12,833 | 7,315 | — | 672,888 | ||||||||||||||||||
|
Non-consumer non-real estate |
595,071 | 87,400 | 11,707 | 2,069 | — | 696,247 | ||||||||||||||||||
|
Consumer non-real estate |
188,919 | 7,865 | 2,098 | 189 | 3 | 199,074 | ||||||||||||||||||
|
Other loans |
146,750 | 3,054 | 1,542 | 3,957 | — | 155,303 | ||||||||||||||||||
|
Acquired loans |
135,000 | 30,406 | 9,416 | 1,892 | — | 176,714 | ||||||||||||||||||
|
|
|
|
|
|
|
|
|
|
|
|
|
|||||||||||||
|
Total |
$ | 2,426,359 | $ | 292,963 | $ | 66,755 | $ | 25,884 | $ | 3 | $ | 2,811,964 | ||||||||||||
|
|
|
|
|
|
|
|
|
|
|
|
|
|||||||||||||
A llowance for Loan Losses Methodology
The allowance for loan losses (“ALLL”) is determined by a calculation based on segmenting the loans into the following categories: (1) adversely graded loans [grades 3, 4, and 5] that have a specific reserve allocation; (2) loans without a specific reserve segmented by loans secured by real estate other than 1-4 family residential property, loans secured by 1-4 family residential property, commercial, industrial, and agricultural loans not secured by real estate, consumer purpose loans not secured by real estate, and loans over 60 days past due that are not otherwise Grade 3, 4, or 5; (3) grade 2 loans; (4) grade 1 loans; and (5) loans held for sale which are excluded.
The ALLL is calculated as the sum of the following: (1) the total dollar amount of specific reserve allocations; (2) the dollar amount derived by multiplying each segment of adversely graded loans without a specific reserve allocation times its respective reserve factor; (3) the dollar amount derived by multiplying Grade 2 loans and Grade 1 loans (less exclusions) times the respective reserve factor; and (4) other adjustments as deemed appropriate and documented by the Senior Loan Committee or Board of Directors.
69
Table of Contents
The amount of the ALLL is an estimate based upon factors which are subject to rapid change due to changing economic conditions and the economic prospects of borrowers. It is reasonably possible that a material change could occur in the estimated ALLL in the near term.
Changes in the ALLL are summarized as follows:
| Year Ended December 31, | ||||||||||||
| 2011 | 2010 | 2009 | ||||||||||
| (Dollars in thousands) | ||||||||||||
|
Balance at beginning of period |
$ | 35,745 | $ | 36,383 | $ | 34,290 | ||||||
|
|
|
|
|
|
|
|||||||
|
Charge-offs |
(3,097 | ) | (4,180 | ) | (8,953 | ) | ||||||
|
Recoveries |
493 | 588 | 657 | |||||||||
|
|
|
|
|
|
|
|||||||
|
Net charge-offs |
(2,604 | ) | (3,592 | ) | (8,296 | ) | ||||||
|
|
|
|
|
|
|
|||||||
|
Provisions charged to operations |
4,515 | 2,954 | 10,389 | |||||||||
|
|
|
|
|
|
|
|||||||
|
Balance at end of period |
$ | 37,656 | $ | 35,745 | $ | 36,383 | ||||||
|
|
|
|
|
|
|
|||||||
The following table details activity in the ALLL by class of loans for the period presented. Allocation of a portion of the allowance to one category of loans does not preclude its availability to absorb losses in other categories.
| ALLL | ||||||||||||||||||||||||||||
|
Non-Residential
Real Estate |
Residential
Real Estate |
Non-
Consumer Non-Real Estate |
Consumer
Non-Real Estate |
Other
Loans |
Acquired
Loans |
Total | ||||||||||||||||||||||
| (Dollars in thousands) | ||||||||||||||||||||||||||||
|
As of December 31, 2011 |
||||||||||||||||||||||||||||
|
Allowance for loan losses: |
||||||||||||||||||||||||||||
|
Balance at December 31, 2010 |
$ | 13,142 | $ | 8,957 | $ | 9,587 | $ | 2,301 | $ | 1,758 | $ | — | $ | 35,745 | ||||||||||||||
|
Charge-offs |
(353 | ) | (752 | ) | (524 | ) | (652 | ) | (270 | ) | (546 | ) | (3,097 | ) | ||||||||||||||
|
Recoveries |
23 | 141 | 156 | 120 | 28 | 25 | 493 | |||||||||||||||||||||
|
|
|
|
|
|
|
|
|
|
|
|
|
|
|
|||||||||||||||
|
Net charge-offs |
(330 | ) | (611 | ) | (368 | ) | (532 | ) | (242 | ) | (521 | ) | (2,604 | ) | ||||||||||||||
|
Provisions charged to operations |
1,136 | 1,418 | (63 | ) | 546 | 370 | 1,108 | 4,515 | ||||||||||||||||||||
|
|
|
|
|
|
|
|
|
|
|
|
|
|
|
|||||||||||||||
|
Balance at December 31, 2011 |
$ | 13,948 | $ | 9,764 | $ | 9,156 | $ | 2,315 | $ | 1,886 | $ | 587 | $ | 37,656 | ||||||||||||||
|
|
|
|
|
|
|
|
|
|
|
|
|
|
|
|||||||||||||||
|
Ending balances: |
||||||||||||||||||||||||||||
|
Individually evaluated for impairment |
$ | 3,295 | $ | 2,636 | $ | 1,445 | $ | 328 | $ | 254 | $ | — | $ | 7,958 | ||||||||||||||
|
Collectively evaluated for impairment |
10,653 | 7,128 | 7,711 | 1,987 | 1,632 | 587 | 29,698 | |||||||||||||||||||||
|
|
|
|
|
|
|
|
|
|
|
|
|
|
|
|||||||||||||||
|
Balance at December 31, 2011 |
$ | 13,948 | $ | 9,764 | $ | 9,156 | $ | 2,315 | $ | 1,886 | $ | 587 | $ | 37,656 | ||||||||||||||
|
|
|
|
|
|
|
|
|
|
|
|
|
|
|
|||||||||||||||
|
Loans—ending balances: |
||||||||||||||||||||||||||||
|
Individually evaluated for impairment |
$ | 38,897 | $ | 20,806 | $ | 8,458 | $ | 2,807 | $ | 261 | $ | — | $ | 71,229 | ||||||||||||||
|
Collectively evaluated for impairment |
1,012,301 | 673,817 | 718,232 | 197,409 | 158,782 | 168,726 | 2,929,267 | |||||||||||||||||||||
|
Loans acquired with deteriorated credit quality |
— | — | — | — | — | 13,002 | 13,002 | |||||||||||||||||||||
|
|
|
|
|
|
|
|
|
|
|
|
|
|
|
|||||||||||||||
|
Balance at December 31, 2011 |
$ | 1,051,198 | $ | 694,623 | $ | 726,690 | $ | 200,216 | $ | 159,043 | $ | 181,728 | $ | 3,013,498 | ||||||||||||||
|
|
|
|
|
|
|
|
|
|
|
|
|
|
|
|||||||||||||||
70
Table of Contents
| ALLL | ||||||||||||||||||||||||||||
|
Non-Residential
Real Estate |
Residential
Real Estate |
Non-
Consumer Non-Real Estate |
Consumer
Non-Real Estate |
Other
Loans |
Acquired
Loans |
Total | ||||||||||||||||||||||
| (Dollars in thousands) | ||||||||||||||||||||||||||||
|
As of December 31, 2010 |
||||||||||||||||||||||||||||
|
Allowance for loan losses: |
||||||||||||||||||||||||||||
|
Balance at December 31, 2009 |
$ | 14,044 | $ | 8,963 | $ | 9,454 | $ | 2,441 | $ | 1,481 | $ | — | $ | 36,383 | ||||||||||||||
|
Charge-offs.. |
(1,687 | ) | (1,102 | ) | (477 | ) | (520 | ) | (241 | ) | (153 | ) | (4,180 | ) | ||||||||||||||
|
Recoveries |
72 | 71 | 213 | 118 | 48 | 66 | 588 | |||||||||||||||||||||
|
|
|
|
|
|
|
|
|
|
|
|
|
|
|
|||||||||||||||
|
Net charge-offs. |
(1,615 | ) | (1,031 | ) | (264 | ) | (402 | ) | (193 | ) | (87 | ) | (3,592 | ) | ||||||||||||||
|
Provisions charged to operations |
713 | 1,025 | 397 | 262 | 470 | 87 | 2,954 | |||||||||||||||||||||
|
|
|
|
|
|
|
|
|
|
|
|
|
|
|
|||||||||||||||
|
Balance at December 31, 2010 |
$ | 13,142 | $ | 8,957 | $ | 9,587 | $ | 2,301 | $ | 1,758 | $ | — | $ | 35,745 | ||||||||||||||
|
|
|
|
|
|
|
|
|
|
|
|
|
|
|
|||||||||||||||
|
Ending balances: |
||||||||||||||||||||||||||||
|
Individually evaluated for impairment |
$ | 3,986 | $ | 1,874 | $ | 2,261 | $ | 321 | $ | 242 | $ | — | $ | 8,684 | ||||||||||||||
|
Collectively evaluated for impairment |
9,156 | 7,083 | 7,326 | 1,980 | 1,516 | — | 27,061 | |||||||||||||||||||||
|
|
|
|
|
|
|
|
|
|
|
|
|
|
|
|||||||||||||||
|
Balance at December 31, 2010 |
$ | 13,142 | $ | 8,957 | $ | 9,587 | $ | 2,301 | $ | 1,758 | $ | — | $ | 35,745 | ||||||||||||||
|
|
|
|
|
|
|
|
|
|
|
|
|
|
|
|||||||||||||||
|
Loans—ending balances: |
||||||||||||||||||||||||||||
|
Individually evaluated for impairment |
$ | 40,566 | $ | 19,987 | $ | 10,517 | $ | 2,613 | $ | 447 | $ | — | $ | 74,130 | ||||||||||||||
|
Collectively evaluated for impairment |
871,172 | 652,901 | 685,730 | 196,461 | 154,856 | 165,406 | 2,726,526 | |||||||||||||||||||||
|
Loans acquired with deteriorated credit quality |
— | — | — | — | — | 11,308 | 11,308 | |||||||||||||||||||||
|
|
|
|
|
|
|
|
|
|
|
|
|
|
|
|||||||||||||||
|
Balance at December 31, 2010 |
$ | 911,738 | $ | 672,888 | $ | 696,247 | $ | 199,074 | $ | 155,303 | $ | 176,714 | $ | 2,811,964 | ||||||||||||||
|
|
|
|
|
|
|
|
|
|
|
|
|
|
|
|||||||||||||||
The following table is a summary of amounts included in the ALLL for impaired loans with specific reserves and the recorded balance of the related loans. No material amounts of interest income were collected on impaired loans with specific reserves for 2011, 2010 or 2009.
| Year Ended December 31, | ||||||||||||
| 2011 | 2010 | 2009 | ||||||||||
| (Dollars in thousands) | ||||||||||||
|
Allowance for loss on impaired loans |
$ | 2,779 | $ | 3,040 | $ | 1,782 | ||||||
|
Recorded balance of impaired loans |
13,437 | 10,510 | 7,423 | |||||||||
|
Average recorded investment. |
11,974 | 8,967 | 9,412 | |||||||||
Transfers from Loans
Transfers from loans to other real estate owned and repossessed assets are non-cash transactions, and are not included in the statements of cash flow.
71
Table of Contents
Transfers from loans to other real estate owned and repossessed assets are summarized as follows:
| Year Ended December 31, | ||||||||
| 2011 | 2010 | |||||||
| (Dollars in thousands) | ||||||||
|
Other real estate owned |
$ | 5,091 | $ | 17,651 | ||||
|
Repossessed assets |
1,460 | 1,190 | ||||||
|
|
|
|
|
|||||
|
Total |
$ | 6,551 | $ | 18,841 | ||||
|
|
|
|
|
|||||
Related Party Loans
The Company has made loans in the ordinary course of business to the executive officers and directors of the Company and to certain affiliates of these executive officers and directors. Management believes that all such loans were made on substantially the same terms as those prevailing at the time for comparable transactions with other persons and do not represent more than a normal risk of collectability or present other unfavorable features. A summary of these loans is as follows:
|
Year Ended
|
Balance Beginning
of the Period |
Additions |
Collections/
Terminations |
Balance End of
the Period |
||||||||||||
| (Dollars in thousands) | ||||||||||||||||
|
2011 |
$ | 21,287 | $ | 8,162 | $ | (4,185 | ) | $ | 25,264 | |||||||
|
2010 |
$ | 20,222 | $ | 36,968 | $ | (35,903 | ) | $ | 21,287 | |||||||
|
2009 |
$ | 21,918 | $ | 35,132 | $ | (36,828 | ) | $ | 20,222 | |||||||
(6) PREMISES AND EQUIPMENT, NET
The following is a summary of premises and equipment by classification:
|
Estimated
Useful Lives |
December 31, | |||||||||||
| 2011 | 2010 | |||||||||||
| (Dollars in thousands) | ||||||||||||
|
Land |
$ | 27,738 | $ | 23,593 | ||||||||
|
Buildings |
10 to 40 years | 112,614 | 103,064 | |||||||||
|
Furniture, fixtures and equipment |
3 to 15 years | 58,340 | 53,636 | |||||||||
|
Accumulated depreciation |
(87,337 | ) | (82,497 | ) | ||||||||
|
|
|
|
|
|||||||||
|
Premises and equipment, net |
$ | 111,355 | $ | 97,796 | ||||||||
|
|
|
|
|
|||||||||
(7) INTANGIBLE ASSETS AND GOODWILL
The following is a summary of intangible assets:
|
Gross
Carrying Amount |
Accumulated
Amortization |
Net
Carrying Amount |
||||||||||
| (Dollars in thousands) | ||||||||||||
|
As of December 31, 2011 |
||||||||||||
|
Core deposit intangibles |
$ | 14,800 | $ | (5,662 | ) | $ | 9,138 | |||||
|
Customer relationship intangibles |
5,657 | (1,639 | ) | 4,018 | ||||||||
|
Mortgage servicing intangibles |
1,100 | (37 | ) | 1,063 | ||||||||
|
|
|
|
|
|
|
|||||||
|
Total |
$ | 21,557 | $ | (7,338 | ) | $ | 14,219 | |||||
|
|
|
|
|
|
|
|||||||
72
Table of Contents
|
Gross
Carrying Amount |
Accumulated
Amortization |
Net
Carrying Amount |
||||||||||
| (Dollars in thousands) | ||||||||||||
|
As of December 31, 2010 |
||||||||||||
|
Core deposit intangibles |
$ | 11,586 | $ | (4,343 | ) | $ | 7,243 | |||||
|
Customer relationship intangibles |
5,657 | (1,290 | ) | 4,367 | ||||||||
|
Mortgage servicing intangibles |
— | — | — | |||||||||
|
|
|
|
|
|
|
|||||||
|
Total |
$ | 17,243 | $ | (5,633 | ) | $ | 11,610 | |||||
|
|
|
|
|
|
|
|||||||
Estimated amortization of intangible assets, as of December 31, 2011, is as follows (dollars in thousands):
|
Estimated Amortization |
|
|||
|
2012 |
$ | 1,896 | ||
|
2013 |
1,703 | |||
|
2014 |
1,512 | |||
|
2015 |
1,504 | |||
|
2016 |
1,293 | |||
At December 31, 2011, the weighted-average remaining life all intangible assets was approximately 7.8 years which consisted of customer relationship intangibles with a weighted-average life of 12.3 years and core deposit intangibles with a weighted-average life of 6.0 years. Mortgage servicing intangibles had a weighted-average life of 9.8 years based on current prepayment assumptions.
The following is a summary of goodwill by business segment:
|
Metropolitan
Banks |
Community
Banks |
Other
Financial Services |
Executive,
Operations & Support |
Consolidated | ||||||||||||||||
| (Dollars in thousands) | ||||||||||||||||||||
|
Year Ended December 31, 2011 |
||||||||||||||||||||
|
Balance at beginning of period |
$ | 8,079 | $ | 30,507 | $ | 5,464 | $ | 498 | $ | 44,548 | ||||||||||
|
Adjustments |
— | 45 | — | (48 | ) | (3 | ) | |||||||||||||
|
|
|
|
|
|
|
|
|
|
|
|||||||||||
|
Balance at end of period |
$ | 8,079 | $ | 30,552 | $ | 5,464 | $ | 450 | $ | 44,545 | ||||||||||
|
|
|
|
|
|
|
|
|
|
|
|||||||||||
|
Year Ended December 31, 2010 |
||||||||||||||||||||
|
Balance at beginning of period |
$ | 6,150 | $ | 23,652 | $ | 4,258 | $ | 624 | $ | 34,684 | ||||||||||
|
Acquisitions |
1,929 | 7,032 | 1,206 | — | 10,167 | |||||||||||||||
|
Adjustments |
— | (177 | ) | — | (126 | ) | (303 | ) | ||||||||||||
|
|
|
|
|
|
|
|
|
|
|
|||||||||||
|
Balance at end of period |
$ | 8,079 | $ | 30,507 | $ | 5,464 | $ | 498 | $ | 44,548 | ||||||||||
|
|
|
|
|
|
|
|
|
|
|
|||||||||||
(8) TIME DEPOSITS
Time deposits include certificates of deposit and individual retirement accounts.
At December 31, 2011, the scheduled maturities of all time deposits are as follows (Dollars in thousands):
|
2012 |
$ | 663,876 | ||
|
2013 |
150,354 | |||
|
2014 |
46,631 | |||
|
2015 |
20,727 | |||
|
2016 |
26,419 | |||
|
Thereafter |
6 | |||
|
|
|
|||
|
Total |
$ | 908,013 | ||
|
|
|
73
Table of Contents
The following table is a summary of large time deposits for the periods presented:
| December 31, | ||||||||
| 2011 | 2010 | |||||||
| (Dollars in thousands) | ||||||||
|
Time deposits of $100,000 or more |
$ | 414,934 | $ | 409,470 | ||||
(9) SHORT-TERM BORROWINGS
The following is a summary of short-term borrowings:
| December 31, | ||||||||
| 2011 | 2010 | |||||||
| (Dollars in thousands) | ||||||||
|
Federal funds purchased |
$ | — | $ | 6,000 | ||||
|
Repurchase agreements |
8,274 | 1,250 | ||||||
|
|
|
|
|
|||||
|
Total |
$ | 8,274 | $ | 7,250 | ||||
|
|
|
|
|
|||||
|
Weighted average interest rate |
0.70 | % | 0.19 | % | ||||
|
|
|
|
|
|||||
|
End of period interest rate |
0.54 | % | 0.18 | % | ||||
|
|
|
|
|
|||||
Federal funds purchased represents borrowings of overnight funds from other financial institutions.
The Company enters into sales of securities to certain of its customers with simultaneous agreements to repurchase. These agreements represent an overnight borrowing of funds.
(10) LONG-TERM BORROWINGS
The Company has a line of credit from the Federal Home Loan Bank (“FHLB”) of Topeka, Kansas to use for liquidity or to match-fund certain long-term fixed rate loans. The Company’s assets, including residential first mortgages of $503.8 million, are pledged as collateral for the borrowings under the line of credit. As of December 31, 2011, the Company had the ability to draw up to $48.8 million on the FHLB line of credit based on FHLB stock holdings of $3.0 million with approximately $18.5 million in advances outstanding due to recent acquisitions. The advances mature at varying dates through 2014 and had rates between 1.7% and 4.6% at December 31, 2011.
On December 13, 2010, the Company borrowed $14.5 million from a commercial bank for a three year term. The loan had an interest rate of 3% per annum, payable quarterly on the first day of March, June, September and December until the maturity date of November 30, 2013. Scheduled principal payments were due on or before November 30, 2011 and November 30, 2012 equal to 25% of the unpaid principal amount outstanding. The loan could be prepaid in whole or in part without fee or penalty at any time. The proceeds were used to fund a portion of the Company’s recent acquisitions. The Company made an advance payment of $6.0 million on July 22, 2011 and paid off the remaining balance of $8.5 million on October 25, 2011.
The following table shows the contractual maturities of the long-term borrowings at December 31, 2011, (Dollars in thousands):
|
2012 |
$ | 9,294 | ||
|
2013 |
5,182 | |||
|
2014 |
4,000 | |||
|
|
|
|||
|
Total |
$ | 18,476 | ||
|
|
|
74
Table of Contents
(11) JUNIOR SUBORDINATED DEBENTURES
The following is a summary of the Junior Subordinated Debentures:
|
December 31, 2011 |
||||||||||
|
Issue |
Amount | Rate | Maturity | |||||||
| (Dollars in thousands) | ||||||||||
|
BFC II |
$ | 26,804 | 7.20% | 03/31/2034 | ||||||
|
UNST I |
2,062 | 3 month LIBOR + 1.65% | 03/15/2036 | |||||||
|
FBCST I |
7,217 | 3 month LIBOR + 2.85% | 12/17/2033 | |||||||
|
|
|
|||||||||
|
Total |
$ | 36,083 | ||||||||
|
|
|
|||||||||
In January 2004, BancFirst Corporation established BFC Capital Trust II (“BFC II”), a trust formed under the Delaware Business Trust Act. BancFirst Corporation owns all of the common securities of BFC II. In February 2004, BFC II issued $25 million of aggregate liquidation amount of 7.20% Cumulative Trust Preferred Securities (the “Cumulative Trust Preferred Securities”) to other investors. In March 2004, BFC II issued an additional $1 million in Cumulative Trust Preferred Securities through the execution of an over-allotment option. The proceeds from the sale of the Cumulative Trust Preferred Securities and the common securities of BFC II were invested in $26.8 million of 7.20% Junior Subordinated Debentures of BancFirst Corporation. Interest payments on the $26.8 million of 7.20% Junior Subordinated Debentures are payable January 15, April 15, July 15 and October 15 of each year. Such interest payments may be deferred for up to twenty consecutive quarters. The stated maturity date of the $26.8 million of 7.20% Junior Subordinated Debentures is March 31, 2034, but they are subject to mandatory redemption pursuant to optional prepayment terms. The Cumulative Trust Preferred Securities represent an undivided interest in the $26.8 million of 7.20% Junior Subordinated Debentures and are guaranteed by BancFirst Corporation. During any deferral period or during any event of default, BancFirst Corporation may not declare or pay any dividends on any of its capital stock. The Cumulative Trust Preferred Securities were callable at par, in whole or in part, after March 31, 2009.
In October 2010, BancFirst Corporation acquired Union National Statutory Trust I (“UNST I”), a trust formed under the Delaware Business Trust Act, from the merger of Union National Bancshares, Inc. BancFirst Corporation owns all of the common securities of UNST I. The trust had issued $2 million of aggregate liquidation amount of Fixed/Floating Rate Junior Subordinated Deferrable Interest Debentures (the “Deferrable Interest Debentures”) to other investors. The proceeds from the sale of the Deferrable Interest Debentures and the common securities of UNST I were invested in $2.1 million of Junior Subordinated Debentures of Union National Bancshares, Inc., which were assumed by BancFirst Corporation as a result of the merger. Interest payments on the $2.1 million of Junior Subordinated Debentures are payable March 15, June 15, September 15 and December 15 of each year. The interest rate on the $2.1 million of Junior Subordinated Debentures was set at 6.5% through March 2011 at which time the rate switched to three-month LIBOR plus 165 basis points. Such interest payments may be deferred for up to twenty consecutive quarters. The stated maturity date of the $2.1 million of Junior Subordinated Debentures is March 15, 2036, but they are subject to mandatory redemption pursuant to optional prepayment terms. The Deferrable Interest Debentures represent an undivided interest in the $2.1 million of Junior Subordinated Debentures and are guaranteed by BancFirst Corporation. During any deferral period or during any event of default, BancFirst Corporation may not declare or pay any dividends on any of its capital stock. The Deferrable Interest Debentures were callable at par, in whole or in part, after March 15, 2011.
On July 12, 2011, BancFirst Corporation acquired FBC Financial Corp. Statutory Trust I (“FBCST I”), a trust formed under the Connecticut Business Trust Act, from the merger of FBC Financial Corp. BancFirst Corporation owns all of the common securities of FBCST I. The trust had issued $7 million of aggregate liquidation amount of Fixed/Floating Rate Junior Subordinated Deferrable Interest Debentures (the “Deferrable
75
Table of Contents
Interest Debentures”) to other investors. The proceeds from the sale of the Deferrable Interest Debentures and the common securities of FBCST I were invested in $7.2 million of Junior Subordinated Debentures of FBC Financial Corp., which were assumed by BancFirst Corporation as a result of the merger. Interest payments on the $7.2 million of Junior Subordinated Debentures are payable March 17, June 17, September 17 and December 17 of each year. The interest rate on the $7.2 million of Junior Subordinated Debentures was set at three-month LIBOR plus 285 basis points. Such interest payments may be deferred for up to twenty consecutive quarters. The stated maturity date of the $7.2 million of Junior Subordinated Debentures is December 17, 2033, but they are subject to mandatory redemption pursuant to optional prepayment terms. The Deferrable Interest Debentures represent an undivided interest in the $7.2 million of Junior Subordinated Debentures and are guaranteed by BancFirst Corporation. During any deferral period or during any event of default, BancFirst Corporation may not declare or pay any dividends on any of its capital stock. The Deferrable Interest Debentures were callable at par, in whole or in part, after December 17, 2008.
(12) INCOME TAXES
The components of the Company’s income tax expense (benefit) are as follows:
| Year Ended December 31, | ||||||||||||
| 2011 | 2010 | 2009 | ||||||||||
| (Dollars in thousands) | ||||||||||||
|
Current taxes: |
||||||||||||
|
Federal |
$ | 26,489 | $ | 20,240 | $ | 13,886 | ||||||
|
State |
3,869 | 3,155 | 1,717 | |||||||||
|
Deferred taxes. |
(5,282 | ) | (58 | ) | 467 | |||||||
|
|
|
|
|
|
|
|||||||
|
Total income taxes |
$ | 25,076 | $ | 23,337 | $ | 16,070 | ||||||
|
|
|
|
|
|
|
|||||||
Income tax expense applicable to securities transactions approximated $560,000, $106,000 and $134,000 for the years ended December 31, 2011, 2010 and 2009, respectively.
A reconciliation of tax expense at the Federal statutory tax rate applied to income before taxes is presented in the following table:
| Year Ended December 31, | ||||||||||||
| 2011 | 2010 | 2009 | ||||||||||
| (Dollars in thousands) | ||||||||||||
|
Tax expense at the Federal statutory tax rate |
$ | 24,744 | $ | 22,976 | $ | 17,038 | ||||||
|
Increase (decrease) in tax expense from: |
||||||||||||
|
Tax-exempt income, net |
(904 | ) | (648 | ) | (701 | ) | ||||||
|
Modified endowment life contracts |
(809 | ) | (705 | ) | (715 | ) | ||||||
|
State tax expense, net of Federal tax benefit |
3,916 | 3,098 | 1,737 | |||||||||
|
Federal tax credits |
(1,227 | ) | (1,914 | ) | (1,709 | ) | ||||||
|
Other, net |
(644 | ) | 530 | 420 | ||||||||
|
|
|
|
|
|
|
|||||||
|
Total tax expense |
$ | 25,076 | $ | 23,337 | $ | 16,070 | ||||||
|
|
|
|
|
|
|
|||||||
76
Table of Contents
The net deferred tax asset/(liability) consisted of the following:
| December 31, | ||||||||
| 2011 | 2010 | |||||||
| (Dollars in thousands) | ||||||||
|
Provision for loan losses |
$ | 14,252 | $ | 13,014 | ||||
|
Write-downs of other real estate owned |
973 | 247 | ||||||
|
Deferred compensation |
1,787 | 1,499 | ||||||
|
Stock based compensation |
2,260 | 1,795 | ||||||
|
Other |
910 | 625 | ||||||
|
|
|
|
|
|||||
|
Gross deferred tax assets |
20,182 | 17,180 | ||||||
|
|
|
|
|
|||||
|
Unrealized net gains on securities |
(5,085 | ) | (4,551 | ) | ||||
|
Premium on securities of banks acquired |
(1,080 | ) | (1,308 | ) | ||||
|
Intangibles |
(2,175 | ) | (1,936 | ) | ||||
|
Basis difference related to tax credits |
(664 | ) | (3,875 | ) | ||||
|
Depreciation |
(3,923 | ) | (3,326 | ) | ||||
|
Leveraged lease |
(2,982 | ) | (3,350 | ) | ||||
|
Other |
(1,336 | ) | (693 | ) | ||||
|
|
|
|
|
|||||
|
Gross deferred tax liabilities |
(17,245 | ) | (19,039 | ) | ||||
|
|
|
|
|
|||||
|
Net deferred tax asset/( liability) |
$ | 2,937 | $ | (1,859 | ) | |||
|
|
|
|
|
|||||
The Company recognizes accrued interest and penalties related to unrecognized tax benefits, if applicable, in income tax expense. During the years ended December 31, 2011, 2010 and 2009, the Company did not recognize or accrue any interest and penalties related to unrecognized tax benefits. Federal and various state income tax statutes dictate that tax returns filed in any of the previous three reporting periods remain open to examination which includes the years 2009 to 2011. The Company has no open examinations with either the Internal Revenue Service or any state agency.
Management performs an analysis of the Company’s tax position annually and believes it is more likely than not that all of its tax positions will be utilized in future years.
(13) STOCK-BASED COMPENSATION
BancFirst Corporation adopted a nonqualified incentive stock option plan (the “BancFirst ISOP”) in May 1986. The Company amended the BancFirst ISOP to increase the number of shares to be issued under the plan to 2,800,000 shares in May 2011. At December 31, 2011, 64,860 shares were available for future grants. The BancFirst ISOP will terminate on December 31, 2014. The options are exercisable beginning four years from the date of grant at the rate of 25% per year for four years. Options expire at the end of fifteen years from the date of grant. Options outstanding as of December 31, 2011 will become exercisable through the year 2018. The option price must be no less than 100% of the fair market value of the stock relating to such option at the date of grant.
In June 1999, the Company adopted the BancFirst Corporation Non-Employee Directors’ Stock Option Plan (the “BancFirst Directors’ Stock Option Plan”). Each non-employee director is granted an option for 10,000 shares. The Company amended the BancFirst Directors’ Stock Option Plan to increase the number of shares to be issued under the plan to 205,000 shares in May 2009. At December 31, 2011, 30,000 shares were available for future grants. The options are exercisable beginning one year from the date of grant at the rate of 25% per year for four years, and expire at the end of fifteen years from the date of grant. Options outstanding as of December 31, 2011 will become exercisable through the year 2015. The option price must be no less than 100% of the fair value of the stock relating to such option at the date of grant.
77
Table of Contents
During 2009, the Company repriced stock options granted under the BancFirst ISOP that were held by 27 optionees through an exchange of certain issued and outstanding stock options for new options. The new options were issued with an exercise price equal to the market price of the Company’s common stock at the effective date of the exchange and were subject to the seven-year vesting and 15-year term as provided by the plan. The Company’s compensation expense related to these options for the year ended December 31, 2009 was reduced by approximately $14,000 due to the unamortized value of the old options being amortized over a new seven-year vesting period. The total incremental compensation expense of $565,000 due to the repricing will be recognized over the seven-year vesting period of the new options.
The Company currently uses newly issued stock to satisfy stock-based exercises, but reserves the right to use treasury stock purchased under the Company’s Stock Repurchase Program (the “SRP”) in the future.
The following is a summary of the activity under both the BancFirst ISOP and the BancFirst Directors’ Stock Option Plan:
| Options |
Wgtd.
Avg. Exercise Price |
Wgtd. Avg.
Remaining Contractual Term |
Aggregate
Intrinsic Value |
|||||||||||||
| (Dollars in thousands, except per share data) | ||||||||||||||||
|
Year Ended December 31, 2011 |
||||||||||||||||
|
Outstanding at December 31, 2010 |
1,172,181 | $ | 28.32 | |||||||||||||
|
Options granted |
180,000 | 39.39 | ||||||||||||||
|
Options exercised |
(48,750 | ) | 19.76 | |||||||||||||
|
Options canceled, forfeited, or expired |
(5,000 | ) | 37.50 | |||||||||||||
|
|
|
|||||||||||||||
|
Outstanding at December 31, 2011 |
1,298,431 | 30.14 | 8.66 | $ | 9,607 | |||||||||||
|
|
|
|
|
|
|
|||||||||||
|
Exercisable at December 31, 2011 |
706,731 | 23.27 | 5.34 | $ | 10,083 | |||||||||||
|
|
|
|
|
|
|
|||||||||||
|
Year Ended December 31, 2010 |
||||||||||||||||
|
Outstanding at December 31, 2009 |
1,209,553 | $ | 27.41 | |||||||||||||
|
Options granted |
49,000 | 41.64 | ||||||||||||||
|
Options exercised |
(74,972 | ) | 21.49 | |||||||||||||
|
Options canceled, forfeited, or expired |
(11,400 | ) | 33.59 | |||||||||||||
|
|
|
|||||||||||||||
|
Outstanding at December 31, 2010 |
1,172,181 | 28.32 | 8.58 | $ | 15,085 | |||||||||||
|
|
|
|
|
|
|
|||||||||||
|
Exercisable at December 31, 2010 |
699,656 | 21.95 | 6.13 | $ | 13,465 | |||||||||||
|
|
|
|
|
|
|
|||||||||||
The following table is a summary of the Company’s non-vested options as of December 31, 2011, and any changes during the year ending December 31, 2011:
| Options | ||||
|
Non-vested at December 31, 2010 |
472,525 | |||
|
Options granted |
180,000 | |||
|
Options vested |
(55,825 | ) | ||
|
Options forfeited |
(5,000 | ) | ||
|
|
|
|||
|
Non-vested at December 31, 2011 |
591,700 | |||
|
|
|
|||
78
Table of Contents
The following table has additional information regarding options granted and options exercised under both the BancFirst ISOP and the BancFirst Directors’ Stock Option Plan:
| Year Ended December 31, | ||||||||||||
| 2011 | 2010 | 2009 | ||||||||||
|
(Dollars in thousands, except per share data) |
||||||||||||
|
Weighted average grant-date fair value per share of options granted |
$ | 12.79 | $ | 15.69 | $ | 20.37 | ||||||
|
Total intrinsic value of options exercised |
912 | 1,445 | 314 | |||||||||
|
Cash received from options exercised |
963 | 1,611 | 378 | |||||||||
|
Tax benefit realized from options exercised |
353 | 559 | 122 | |||||||||
The fair value of each option grant is estimated on the date of grant using the Black-Scholes option-pricing model and is based on certain assumptions including risk-free rate of return, dividend yield, stock price volatility, and the expected term. The fair value of each option is expensed over its vesting period.
The following table is a summary of the Company’s recorded stock-based employee compensation expense:
| Year Ended December 31, | ||||||||||||
| 2011 | 2010 | 2009 | ||||||||||
| (Dollars in thousands) | ||||||||||||
|
Stock-based employee compensation expense |
$ | 1,375 | $ | 1,218 | $ | 1,073 | ||||||
|
Tax |
532 | 471 | 415 | |||||||||
|
|
|
|
|
|
|
|||||||
|
Stock-based employee compensation expense, net of tax |
$ | 843 | $ | 747 | $ | 658 | ||||||
|
|
|
|
|
|
|
|||||||
The Company will continue to amortize the remaining fair value of stock options over the remaining vesting period of approximately seven years. The following table shows the remaining fair value of stock options:
| December 31, 2011 | ||
| (Dollars in thousands) | ||
|
Fair value of stock options |
$ 6,360 |
The following table shows the assumptions used for computing stock-based employee compensation expense under the fair value method:
| Year Ended December 31, | ||||||||||||
| 2011 | 2010 | 2009 | ||||||||||
|
Risk-free interest rate |
1.97% to 3.61% | 2.62% to 4.00% | 2.17% to 3.64% | |||||||||
|
Dividend yield |
2.00% | 2.00% | 1.50% | |||||||||
|
Stock price volatility |
25.26% to 38.43% | 27.28% to 38.61% | 52.71% to 74.84% | |||||||||
|
Expected term |
10Yrs | 10Yrs | 10Yrs | |||||||||
The risk-free interest rate is determined by reference to the spot zero-coupon rate for the U.S. Treasury security with a maturity similar to the expected term of the options. The dividend yield is the expected yield for the expected term. The stock price volatility is estimated from the recent historical volatility of the Company’s stock. The expected term is estimated from the historical option exercise experience.
In May 1999, the Company adopted the BancFirst Corporation Directors’ Deferred Stock Compensation Plan (the “BancFirst Deferred Stock Compensation Plan”). The Company amended the BancFirst Deferred Stock Compensation Plan to increase the number of shares to be issued under the plan to 80,000 shares in May 2009. Under the plan, directors and members of the community advisory boards of the Company and its subsidiaries may defer up to 100% of their board fees. They are credited for each deferral with a number of stock units based on the current market price of the Company’s stock, which accumulate in an account until such time as the
79
Table of Contents
director or community board member terminates serving as a board member. Shares of common stock of the Company are then distributed to the terminating director or community board member based upon the number of stock units accumulated in his or her account. A summary of the accumulated stock units is as follows:
| December 31, | ||||||||
| 2011 | 2010 | |||||||
|
Accumulated stock units |
51,190 | 47,971 | ||||||
|
Average price |
$ | 33.21 | $ | 32.89 | ||||
(14) RETIREMENT PLANS
In May 1986, the Company adopted the BancFirst Corporation Employee Stock Ownership (“ESOP”) and Thrift Plan (“401(k)”) effective January 1, 1985. The plan was separated into two individual plans effective January 1, 2009. The 401(k) and ESOP plans cover all eligible employees, as defined in the plans, of the Company and its subsidiaries. The 401(k) plan allows employees to defer up to the maximum legal limit of their compensation, of which the Company may match 50%, but not to exceed 3% of their compensation. In addition, the Company may make discretionary contributions based on employee contributions or eligible compensation to the ESOP plan, as determined by the Company’s Board of Directors. The aggregate amounts of contributions by the Company to the 401(k) and ESOP plans are shown in the following table:
| December 31, | ||||||||||||
| 2011 | 2010 | 2009 | ||||||||||
| (Dollars in thousands) | ||||||||||||
|
401(k) contributions |
$ | 1,534 | $ | 1,465 | $ | 1,378 | ||||||
|
ESOP contributions |
1,629 | 1,353 | 1,102 | |||||||||
|
|
|
|
|
|
|
|||||||
|
Total contributions |
$ | 3,163 | $ | 2,818 | $ | 2,480 | ||||||
|
|
|
|
|
|
|
|||||||
(15) STOCKHOLDERS’ EQUITY
As of December 31, 2011, 2010 and 2009, the Company’s authorized and outstanding preferred and common stock, was as follows:
|
No. of Shares
Authorized at December 31, 2011 |
No. of Shares Outstanding at December 31, |
Par
Value
Share |
Dividends |
Voting
Rights |
||||||||||||||||||||
|
Class of Stock |
2011 | 2010 | 2009 | |||||||||||||||||||||
|
Senior Preferred |
10,000,000 | — | — | — | $ | 1.00 | As declared | Voting | ||||||||||||||||
|
10% Cumulative Preferred |
900,000 | — | — | — | $ | 5.00 | As declared | Non-voting | ||||||||||||||||
|
Common |
20,000,000 | 15,117,430 | 15,368,717 | 15,308,741 | $ | 1.00 | As declared | Voting | ||||||||||||||||
The following is a description of the capital stock of the Company:
(a) Senior Preferred Stock: No shares issued or outstanding. Shares may be issued with such voting, dividend, redemption, sinking fund, conversion, exchange, liquidation and other rights as shall be determined by the Company’s Board of Directors, without approval of the stockholders. The Senior Preferred Stock would have a preference over common stock as to payment of dividends, as to the right to distribution of assets upon redemption of such shares or upon liquidation of the Company.
(b) 10% Cumulative Preferred Stock: Redeemable at the Company’s option at $5.00 per share plus accumulated dividends; non-voting; cumulative dividends at the rate of 10% payable semi-annually on January 15 and July 15; no shares issued or outstanding.
(c) Common stock: At December 31, 2011, 2010 and 2009 the shares issued equaled shares outstanding.
80
Table of Contents
In November 1999, the Company adopted a Stock Repurchase Program (the “SRP”). The SRP may be used as a means to increase earnings per share and return on equity, to purchase treasury stock for the exercise of stock options or for distributions under the Deferred Stock Compensation Plan, to provide liquidity for optionees to dispose of stock from exercises of their stock options, and to provide liquidity for stockholders wishing to sell their stock. All shares repurchased under the SRP have been retired and not held as treasury stock. The timing, price and amount of stock repurchases under the SRP may be determined by management and approved by the Company’s Executive Committee. At December 31, 2011 there were 241,751 shares remaining that could be repurchased under the SRP.
The following table is a summary of the shares repurchased under the program:
| Year Ended December 31, | ||||||||||||
| 2011 | 2010 | 2009 | ||||||||||
|
Number of shares repurchased |
302,149 | 16,500 | — | |||||||||
|
Average price of shares repurchased |
$ | 35.74 | $ | 36.69 | $ | — | ||||||
BancFirst Corporation’s ability to pay dividends is dependent upon dividend payments received from BancFirst. Banking regulations limit bank dividends based upon net earnings retained and minimum capital requirements. Dividends in excess of these requirements require regulatory approval. At January 1, 2012, approximately $54.4 million of the equity of BancFirst was available for dividend payments to BancFirst Corporation.
During any deferral period or any event of default on the Junior Subordinated Debentures, BancFirst Corporation may not declare or pay any dividends on any of its capital stock.
81
Table of Contents
The Company and BancFirst are subject to risk-based capital guidelines issued by the Board of Governors of the Federal Reserve System and FDIC. These guidelines are used to evaluate capital adequacy and involve both quantitative and qualitative evaluations of the Company’s and BancFirst’s assets, liabilities, and certain off-balance-sheet items calculated under regulatory practices. Failure to meet the minimum capital requirements can initiate certain mandatory or discretionary actions by the regulatory agencies that could have a direct material effect on the Company’s financial statements. Management believes, as of December 31, 2011, that the Company and BancFirst met all capital adequacy requirements to which they are subject. The required capital amounts and the Company’s and BancFirst’s respective ratios are shown in the following table:
| Actual |
For Capital
Adequacy Purposes |
To Be Well
Capitalized Under Prompt Corrective Action Provisions |
||||||||||||||||||||||
| Amount | Ratio | Amount | Ratio | Amount | Ratio | |||||||||||||||||||
| (Dollars in thousands) | ||||||||||||||||||||||||
|
As of December 31, 2011: |
||||||||||||||||||||||||
|
Total Capital |
||||||||||||||||||||||||
|
(to Risk Weighted Assets)- |
||||||||||||||||||||||||
|
BancFirst Corporation |
$ | 489,629 | 14.62 | % | $ | 267,937 | 8.00 | % | N/A | N/A | ||||||||||||||
|
BancFirst |
459,978 | 14.25 | % | 258,209 | 8.00 | % | $ | 322,761 | 10.00 | % | ||||||||||||||
|
Tier I Capital |
||||||||||||||||||||||||
|
(to Risk Weighted Assets)- |
||||||||||||||||||||||||
|
BancFirst Corporation |
451,973 | 13.49 | % | 133,969 | 4.00 | % | N/A | N/A | ||||||||||||||||
|
BancFirst |
422,429 | 13.09 | % | 129,104 | 4.00 | % | 193,656 | 6.00 | % | |||||||||||||||
|
Tier I Capital |
||||||||||||||||||||||||
|
(to Total Assets)- |
||||||||||||||||||||||||
|
BancFirst Corporation |
451,973 | 8.14 | % | 168,410 | 3.00 | % | N/A | N/A | ||||||||||||||||
|
BancFirst |
422,429 | 7.88 | % | 162,234 | 3.00 | % | 270,390 | 5.00 | % | |||||||||||||||
|
As of December 31, 2010: |
||||||||||||||||||||||||
|
Total Capital |
||||||||||||||||||||||||
|
(to Risk Weighted Assets)- |
||||||||||||||||||||||||
|
BancFirst Corporation |
$ | 455,668 | 14.68 | % | $ | 248,379 | 8.00 | % | N/A | N/A | ||||||||||||||
|
BancFirst |
435,083 | 14.57 | % | 238,913 | 8.00 | % | $ | 298,641 | 10.00 | % | ||||||||||||||
|
Tier I Capital |
||||||||||||||||||||||||
|
(to Risk Weighted Assets)- |
||||||||||||||||||||||||
|
BancFirst Corporation |
419,923 | 13.53 | % | 124,190 | 4.00 | % | N/A | N/A | ||||||||||||||||
|
BancFirst |
399,344 | 13.37 | % | 119,456 | 4.00 | % | 179,184 | 6.00 | % | |||||||||||||||
|
Tier I Capital |
||||||||||||||||||||||||
|
(to Total Assets)- |
||||||||||||||||||||||||
|
BancFirst Corporation |
419,923 | 8.39 | % | 151,807 | 3.00 | % | N/A | N/A | ||||||||||||||||
|
BancFirst |
399,344 | 8.37 | % | 144,256 | 3.00 | % | 240,427 | 5.00 | % | |||||||||||||||
As of December 31, 2011, the most recent notification from the Federal Reserve Bank of Kansas City and the FDIC categorized BancFirst as “well capitalized” under the regulatory framework for prompt corrective action. To be well capitalized under Federal bank regulatory agency definitions, a depository institution must have a Tier 1 Ratio of at least 6%, a combined Tier 1 and Tier 2 Ratio of at least 10%, and a Leverage Ratio of at least 5%. The Company’s trust preferred securities will continue to be included in Tier 1 capital as the Company’s total assets do not exceed $10 billion. There are no conditions or events since the most recent notification of BancFirst’s capital category that management believes would change its category.
82
Table of Contents
(16) NET INCOME PER COMMON SHARE
Basic and diluted net income per common share are calculated as follows:
|
Income
(Numerator) |
Shares
(Denominator) |
Per
Share Amount |
||||||||||
|
(Dollars in thousands, except per share
data) |
||||||||||||
|
Year Ended December 31, 2011 |
||||||||||||
|
Basic |
||||||||||||
|
Income available to common stockholders |
$ | 45,621 | 15,267,357 | $ | 2.99 | |||||||
|
|
|
|||||||||||
|
Effect of stock options |
— | 282,774 | ||||||||||
|
|
|
|
|
|||||||||
|
Diluted |
||||||||||||
|
Income available to common stockholders plus assumed exercises of stock options |
$ | 45,621 | 15,550,131 | $ | 2.93 | |||||||
|
|
|
|
|
|
|
|||||||
|
Year Ended December 31, 2010 |
||||||||||||
|
Basic |
||||||||||||
|
Income available to common stockholders |
$ | 42,309 | 15,348,102 | $ | 2.76 | |||||||
|
|
|
|||||||||||
|
Effect of stock options |
— | 303,210 | ||||||||||
|
|
|
|
|
|||||||||
|
Diluted |
||||||||||||
|
Income available to common stockholders plus assumed exercises of stock options |
$ | 42,309 | 15,651,312 | $ | 2.70 | |||||||
|
|
|
|
|
|
|
|||||||
|
Year Ended December 31, 2009 |
||||||||||||
|
Basic |
||||||||||||
|
Income available to common stockholders |
$ | 32,609 | 15,299,781 | $ | 2.13 | |||||||
|
|
|
|||||||||||
|
Effect of stock options |
— | 294,008 | ||||||||||
|
|
|
|
|
|||||||||
|
Diluted |
||||||||||||
|
Income available to common stockholders plus assumed exercises of stock options |
$ | 32,609 | 15,593,789 | $ | 2.09 | |||||||
|
|
|
|
|
|
|
|||||||
The following table shows the number and average exercise price of options that were excluded from the computation of diluted net income per common share for each year because the options’ exercise prices were greater than the average market price of the common shares.
| Shares |
Average
Exercise Price |
|||||||
|
December 31, 2011 |
550,495 | $ | 38.85 | |||||
|
December 31, 2010 |
420,679 | $ | 38.31 | |||||
|
December 31, 2009 |
304,292 | $ | 43.01 | |||||
83
Table of Contents
(17) CONDENSED PARENT COMPANY FINANCIAL STATEMENTS
BALANCE SHEETS
| December 31, | ||||||||
| 2011 | 2010 | |||||||
| (Dollars in thousands) | ||||||||
| ASSETS | ||||||||
|
Cash |
$ | 4,774 | $ | 3,088 | ||||
|
Securities |
199 | 217 | ||||||
|
Premises and equipment, net |
— | 240 | ||||||
|
Investments in subsidiaries |
511,698 | 493,487 | ||||||
|
Intangible assets |
450 | 498 | ||||||
|
Dividends receivable |
5,138 | 4,800 | ||||||
|
Other assets |
1,654 | 4,827 | ||||||
|
|
|
|
|
|||||
|
Total assets |
$ | 523,913 | $ | 507,157 | ||||
|
|
|
|
|
|||||
| LIABILITIES AND STOCKHOLDERS’ EQUITY | ||||||||
|
Other liabilities |
$ | 4,789 | $ | 5,197 | ||||
|
Long-term borrowings |
— | 14,500 | ||||||
|
Junior subordinated debentures |
36,083 | 28,866 | ||||||
|
Stockholders’ equity |
483,041 | 458,594 | ||||||
|
|
|
|
|
|||||
|
Total liabilities and stockholders’ equity |
$ | 523,913 | $ | 507,157 | ||||
|
|
|
|
|
|||||
STATEMENTS OF INCOME
| Year Ended December 31, | ||||||||||||
| 2011 | 2010 | 2009 | ||||||||||
| (Dollars in thousands) | ||||||||||||
|
OPERATING INCOME |
||||||||||||
|
Dividends from subsidiaries |
$ | 19,011 | $ | 17,762 | $ | 16,609 | ||||||
|
Interest on interest-bearing deposits |
20 | 153 | 228 | |||||||||
|
Other |
88 | (190 | ) | — | ||||||||
|
|
|
|
|
|
|
|||||||
|
Total operating income |
19,119 | 17,725 | 16,837 | |||||||||
|
|
|
|
|
|
|
|||||||
|
OPERATING EXPENSE |
||||||||||||
|
Interest |
2,501 | 2,016 | 1,966 | |||||||||
|
Other |
740 | 299 | 236 | |||||||||
|
|
|
|
|
|
|
|||||||
|
Total operating expense |
3,241 | 2,315 | 2,202 | |||||||||
|
|
|
|
|
|
|
|||||||
|
Income before taxes and equity in undistributed earnings of subsidiaries |
15,878 | 15,410 | 14,635 | |||||||||
|
Allocated income tax benefit |
886 | 689 | 733 | |||||||||
|
|
|
|
|
|
|
|||||||
|
Income before equity in undistributed earnings of subsidiaries |
16,764 | 16,099 | 15,368 | |||||||||
|
Equity in undistributed earnings of subsidiaries |
28,857 | 26,210 | 17,241 | |||||||||
|
|
|
|
|
|
|
|||||||
|
Net income |
$ | 45,621 | $ | 42,309 | $ | 32,609 | ||||||
|
|
|
|
|
|
|
|||||||
84
Table of Contents
STATEMENTS OF CASH FLOW
| Year Ended December 31, | ||||||||||||
| 2011 | 2010 | 2009 | ||||||||||
| (Dollars in thousands) | ||||||||||||
|
CASH FLOWS FROM OPERATING ACTIVITIES |
||||||||||||
|
Net income |
$ | 45,621 | $ | 42,309 | $ | 32,609 | ||||||
|
Adjustments to reconcile to net cash provided by operating activities: |
||||||||||||
|
Equity in undistributed earnings of subsidiaries |
(31,856 | ) | (27,428 | ) | (18,280 | ) | ||||||
|
Amortization of stock based compensation arrangements |
3,075 | 1,218 | 1,038 | |||||||||
|
Other, net |
12,326 | (1,790 | ) | 450 | ||||||||
|
|
|
|
|
|
|
|||||||
|
Net cash provided by operating activities |
29,166 | 14,309 | 15,817 | |||||||||
|
|
|
|
|
|
|
|||||||
|
INVESTING ACTIVITIES |
||||||||||||
|
Net cash used for acquisitions |
11,748 | (26,934 | ) | (5,452 | ) | |||||||
|
Purchases of securities |
(2 | ) | — | — | ||||||||
|
Sales and maturities of held for investment and available for sale securities |
28 | 200 | — | |||||||||
|
Other, net |
240 | — | — | |||||||||
|
|
|
|
|
|
|
|||||||
|
Net cash provided by (used for) investing activities |
12,014 | (26,734 | ) | (5,452 | ) | |||||||
|
|
|
|
|
|
|
|||||||
|
FINANCING ACTIVITIES |
||||||||||||
|
Issuance of common stock |
1,398 | 2,173 | 740 | |||||||||
|
Acquisition of common stock |
(10,799 | ) | (605 | ) | — | |||||||
|
Cash dividends paid |
(15,593 | ) | (14,733 | ) | (13,774 | ) | ||||||
|
(Paydown)/issuance of long-term borrowings |
(14,500 | ) | 14,500 | — | ||||||||
|
|
|
|
|
|
|
|||||||
|
Net cash (used for) provided by financing activities |
(39,494 | ) | 1,335 | (13,034 | ) | |||||||
|
|
|
|
|
|
|
|||||||
|
Net increase (decrease) in cash |
1,686 | (11,090 | ) | (2,669 | ) | |||||||
|
Cash at the beginning of the period |
3,088 | 14,178 | 16,847 | |||||||||
|
|
|
|
|
|
|
|||||||
|
Cash at the end of the period |
$ | 4,774 | $ | 3,088 | $ | 14,178 | ||||||
|
|
|
|
|
|
|
|||||||
|
SUPPLEMENTAL DISCLOSURE |
||||||||||||
|
Cash paid during the period for interest |
$ | 2,818 | $ | 2,039 | $ | 1,966 | ||||||
|
|
|
|
|
|
|
|||||||
|
Cash received during the period for income taxes, net |
$ | 1,195 | $ | 1,089 | $ | 1,366 | ||||||
|
|
|
|
|
|
|
|||||||
(18) RELATED PARTY TRANSACTIONS
Refer to Note (5) for information regarding loan transactions with related parties.
(19) COMMITMENTS AND CONTINGENT LIABILITIES
The Company is a party to financial instruments with off balance sheet risk in the normal course of business to meet the financing needs of its customers. These financial instruments include loan commitments and standby letters of credit which involve elements of credit and interest-rate risk to varying degrees. The Company’s exposure to credit loss in the event of nonperformance by the other party to the instrument is represented by the instrument’s contractual amount. To control this credit risk, the Company uses the same underwriting standards as it uses for loans recorded on the balance sheet. The amounts of financial instruments with off-balance-sheet risk are as follows:
| December 31, | ||||||||
| 2011 | 2010 | |||||||
| (Dollars in thousands) | ||||||||
|
Loan commitments |
$ | 718,191 | $ | 625,970 | ||||
|
Stand-by letters of credit |
55,804 | 55,339 | ||||||
85
Table of Contents
Loan commitments are agreements to lend to a customer, as long as there is no violation of any condition established in the contract. Stand-by letters of credit are conditional commitments issued by the Company to guarantee the performance of a customer to a third party. These instruments generally have fixed expiration dates or other termination clauses and may require payment of a fee. Since many of the instruments are expected to expire without being drawn upon, the total amounts do not necessarily represent commitments that will be funded in the future.
The Company leases office space in seventeen buildings, three parcels of land on which it owns buildings, and fifteen ATM locations. These leases expire at various dates through 2064.
The future minimum rental payments under these leases at December 31, 2011, were as follows (Dollars in thousands):
|
2012 |
$ | 764 | ||
|
2013 |
476 | |||
|
2014 |
270 | |||
|
2015 |
139 | |||
|
2016 |
116 | |||
|
Later years |
621 | |||
|
|
|
|||
|
Total |
$ | 2,386 | ||
|
|
|
Rental expense on all property and equipment rented, including those rented on a monthly or temporary basis were as follows (Dollars in thousands):
|
Year Ending December 31: |
||||
|
2011 |
$ | 1,112 | ||
|
2010 |
$ | 1,044 | ||
|
2009 |
$ | 1,035 |
The Company is a defendant in legal actions arising from normal business activities. Management believes that all legal actions against the Company are without merit or that the ultimate liability, if any, resulting from them will not materially affect the Company’s financial position, results of operations or cash flows.
(20) FAIR VALUE MEASUREMENTS
FASB ASC Topic 820 establishes a fair value hierarchy for valuation inputs that gives the highest priority to quoted prices in active markets for identical assets or liabilities and the lowest priority to unobservable inputs. The fair value hierarchy is as follows:
| • |
Level 1 Inputs to the valuation methodology are quoted prices (unadjusted) for identical assets or liabilities in active markets. |
| • |
Level 2 Inputs to the valuation methodology include quoted prices for similar assets and liabilities in active markets, and inputs that are observable for the asset and liability, either directly or indirectly, for substantially the full term of the financial instrument. |
| • |
Level 3 Unobservable inputs for determining the fair values of assets or liabilities that reflect an entity’s own assumptions about the assumptions that market participants would use in pricing the assets or liabilities. |
A description of the valuation methodologies used for instruments measured at fair value, as well as the general classification of such instruments pursuant to the valuation hierarchy, is set forth below. These valuation methodologies were applied to all of the Company’s financial assets and financial liabilities carried at fair value.
86
Table of Contents
Securities Available for Sale
Securities classified as available for sale are reported at fair value. U.S. Treasuries are valued using Level 1 inputs. Other securities available for sale including U.S. Federal agencies, mortgage backed securities, and states and political subdivisions are valued using prices from an independent pricing service utilizing Level 2 data. The fair value measurements consider observable data that may include dealer quotes, market spreads, cash flows, the U.S. Treasury yield curve, live trading levels, trade execution data, market consensus prepayment speeds, credit information and the bond’s terms and conditions, among other things. The Company also invests in equity securities classified as available for sale for which observable information is not readily available. These securities are reported at fair value utilizing Level 3 inputs. For these securities, management determines the fair value based on replacement cost, the income approach or information provided by outside consultants or lead investors.
The Company reviews the prices for Level 1 and Level 2 securities supplied by the independent pricing service for reasonableness and to ensure such prices are aligned with traditional pricing matrices. In general, the Company does not purchase investment portfolio securities that are esoteric or that have complicated structures. The Company’s entire portfolio consists of traditional investments including U.S. Treasury obligations, Federal agency mortgage pass-through securities, general obligation municipal bonds and a small amount of municipal revenue bonds. Pricing for such instruments is fairly generic and is easily obtained. For in-state bond issues that have relatively low issue sizes and liquidity, the Company utilizes the same parameters adjusted for the specific issue. From time to time, the Company will validate, on a sample basis, prices supplied by the independent pricing service by comparison to prices obtained from third party sources.
Derivatives
Derivatives are reported at fair value utilizing Level 2 inputs. The Company obtains dealer and market quotations to value its oil and gas swaps and options. The Company utilizes dealer quotes and observable market data inputs to substantiate internal valuation models.
Loans Held For Sale
The Company originates mortgage loans to be sold. At the time of origination, the acquiring bank has already been determined and the terms of the loan, including interest rate, have already been set by the acquiring bank allowing the Company to originate the loan at fair value. Mortgage loans are generally sold within 30 days of origination. Loans held for sale are valued using Level 2 inputs. Gains or losses recognized upon the sale of the loans are determined on a specific identification basis.
The following tables summarize financial assets and financial liabilities measured at fair value on a recurring basis as of December 31, 2011 and 2010, segregated by the level of the valuation inputs within the fair value hierarchy utilized to measure fair value:
|
Level 1
Inputs |
Level 2
Inputs |
Level 3
Inputs |
Total Fair
Value |
|||||||||||||
| (Dollars in thousands) | ||||||||||||||||
|
December 31, 2011 |
||||||||||||||||
|
Securities available for sale |
$ | — | $ | 580,338 | $ | 12,162 | $ | 592,500 | ||||||||
|
Derivative assets |
— | 7,082 | — | 7,082 | ||||||||||||
|
Derivative liabilities |
— | 5,420 | — | 5,420 | ||||||||||||
|
Loans held for sale |
— | 12,126 | — | 12,126 | ||||||||||||
|
December 31, 2010 |
||||||||||||||||
|
Securities available for sale |
$ | 64,970 | $ | 645,985 | $ | 10,837 | $ | 721,792 | ||||||||
|
Derivative assets |
— | 5,229 | — | 5,229 | ||||||||||||
|
Derivative liabilities |
— | 3,664 | — | 3,664 | ||||||||||||
|
Loans held for sale |
— | 11,776 | — | 11,776 | ||||||||||||
87
Table of Contents
The changes in Level 3 assets measured at estimated fair value on a recurring basis during the years ended December 31, 2011 and 2010 were as follows:
| 2011 | 2010 | |||||||
| (Dollars in thousands) | ||||||||
|
Balance at the beginning of the year |
$ | 10,837 | $ | 9,506 | ||||
|
Purchases, issuances and settlements |
92 | 914 | ||||||
|
Sales |
(473 | ) | (751 | ) | ||||
|
Losses included in earnings |
(4 | ) | (200 | ) | ||||
|
Total unrealized gains |
1,710 | 1,368 | ||||||
|
|
|
|
|
|||||
|
Balance at the end of the year |
$ | 12,162 | $ | 10,837 | ||||
|
|
|
|
|
|||||
The following methods and assumptions were used to estimate the fair value of each class of financial instruments:
Cash and Due from Banks; Federal Funds Sold and Interest-Bearing Deposits
The carrying amounts of these short-term instruments are reasonable estimates of fair value.
Securities
For securities, which are generally traded in secondary markets, fair values are based on quoted market prices or dealer quotes, if available. If a quoted market price is not available, fair value is estimated using quoted market prices for similar securities making adjustments for credit or liquidity if applicable. The Company also invests in equity securities for which observable information is not readily available. These securities are reported at fair valued based on replacement cost, the income approach or information provided by outside consultants or lead advisors.
Loans
For certain homogeneous categories of loans, such as some residential mortgages, fair values are estimated using the quoted market prices for securities backed by similar loans, adjusted for differences in loan characteristics. For residential mortgage loans held for sale, the carrying amount is a reasonable estimate of fair value. The fair value of other types of loans is estimated by discounting the future cash flows using the current rates at which similar loans would be made to borrowers with similar credit ratings and for the same remaining maturities.
Derivatives
Derivatives are reported at fair value using dealer quotes and observable market data.
Deposits
The fair values of transaction and savings accounts are the amounts payable on demand at the reporting date. The fair values of fixed-maturity certificates of deposit are estimated using the rates currently offered for deposits of similar remaining maturities.
Short-term Borrowings
The amounts payable on these short-term instruments are reasonable estimates of fair value.
Long-term Borrowings
The fair values of fixed-rate long-term borrowings are estimated using the rates that would be charged for borrowings of similar remaining maturities.
88
Table of Contents
Junior Subordinated Debentures
The fair values of junior subordinated debentures are estimated using the rates that would be charged for junior subordinated debentures of similar remaining maturities.
Loan Commitments and Letters of Credit
The fair values of commitments are estimated using the fees currently charged to enter into similar agreements, taking into account the terms of the agreements. The fair values of letters of credit are based on fees currently charged for similar agreements.
The estimated fair values of the Company’s financial instruments are as follows:
| December 31, | ||||||||||||||||
| 2011 | 2010 | |||||||||||||||
|
Carrying
Amount |
Fair Value |
Carrying
Amount |
Fair Value | |||||||||||||
| (Dollars in thousands) | ||||||||||||||||
|
FINANCIAL ASSETS |
||||||||||||||||
|
Cash and due from banks |
$ | 163,698 | $ | 163,698 | $ | 93,059 | $ | 93,059 | ||||||||
|
Federal funds sold and interest-bearing deposits |
1,544,435 | 1,544,435 | 1,152,227 | 1,152,227 | ||||||||||||
|
Securities |
614,977 | 615,458 | 743,803 | 744,432 | ||||||||||||
|
Loans: |
||||||||||||||||
|
Loans (net of unearned interest) |
3,013,498 | 2,811,964 | ||||||||||||||
|
Allowance for loan losses |
(37,656 | ) | (35,745 | ) | ||||||||||||
|
|
|
|
|
|||||||||||||
|
Loans, net |
2,975,842 | 3,022,619 | 2,776,219 | 2,791,741 | ||||||||||||
|
Derivative assets |
7,082 | 7,082 | 5,229 | 5,229 | ||||||||||||
|
FINANCIAL LIABILITIES |
||||||||||||||||
|
Deposits |
5,037,735 | 5,052,470 | 4,503,754 | 4,514,182 | ||||||||||||
|
Short-term borrowings |
8,274 | 8,274 | 7,250 | 7,250 | ||||||||||||
|
Long-term borrowings |
18,476 | 18,578 | 34,265 | 33,520 | ||||||||||||
|
Derivative liabilities |
5,420 | 5,420 | 3,664 | 3,664 | ||||||||||||
|
Junior subordinated debentures |
36,083 | 39,300 | 28,866 | 31,010 | ||||||||||||
|
OFF-BALANCE SHEET FINANCIAL INSTRUMENTS |
||||||||||||||||
|
Loan commitments |
1,257 | 1,095 | ||||||||||||||
|
Letters of credit |
419 | 415 | ||||||||||||||
Non-financial Assets and Non-financial Liabilities
The Company has no non-financial assets or non-financial liabilities measured at fair value on a recurring basis. Certain non-financial assets and non-financial liabilities measured at fair value on a nonrecurring basis include foreclosed assets (upon initial recognition or subsequent impairment), and intangible assets and other non-financial long-lived assets measured at fair value for impairment assessment. These items are evaluated at least annually for impairment, of which there were none as of December 31, 2011 or 2010. The overall levels of non-financial assets and non-financial liabilities were not considered to be significant to the Company at December 31, 2011 or 2010.
The Company is required under current authoritative accounting guidance to disclose the estimated fair value of their financial instrument assets and liabilities including those subject to the requirements discussed above. For the Company, as for most financial institutions, substantially all of its assets and liabilities are considered financial instruments as defined.
89
Table of Contents
Assets and Liabilities Measured at Fair Value on a Nonrecurring Basis
Certain financial assets and financial liabilities are measured at fair value on a nonrecurring basis; that is, the instruments are not measured at fair value on an ongoing basis but are subject to fair value adjustments in certain circumstances (for example, when there is evidence of impairment).
Impaired loans are reported at the fair value of the underlying collateral if repayment is dependent on liquidation of the collateral. The impaired loans are adjusted to fair value through a specific allocation of the allowance for loan losses.
Foreclosed assets, upon initial recognition, are measured and adjusted to fair value through charge-offs to the allowance for loan losses based upon the fair values of the foreclosed assets.
Other real estate owned is remeasured at fair value subsequent to initial recognition, with any losses recognized in net expense from other real estate owned.
The following table summarizes assets measured at fair value on a nonrecurring basis and the related gains or losses recognized during the year:
| Level 1 | Level 2 | Level 3 |
Total
Fair Value |
Gains
(Losses) |
||||||||||||||||
| (Dollars in thousands) | ||||||||||||||||||||
|
Year Ended December 31, 2011 |
||||||||||||||||||||
|
Impaired loans (less specific allowance) |
— | — | $ | 18,173 | $ | 18,173 | $ | — | ||||||||||||
|
Foreclosed assets |
— | — | 531 | 531 | (4,205 | ) | ||||||||||||||
|
Other real estate owned |
— | — | 16,109 | 16,109 | 1,057 | |||||||||||||||
|
Year Ended December 31, 2010 |
||||||||||||||||||||
|
Impaired loans (less specific allowance) |
— | — | $ | 10,510 | $ | 10,510 | $ | — | ||||||||||||
|
Foreclosed assets |
— | — | 223 | 223 | — | |||||||||||||||
|
Other real estate owned |
— | — | 22,956 | 22,956 | (650 | ) | ||||||||||||||
(21) DERIVATIVE FINANCIAL INSTRUMENTS
The Company enters into oil and gas swaps and options contracts to accommodate the business needs of its customers. Upon the origination of an oil or gas swap or option contract with a customer, the Company simultaneously enters into an offsetting contract with a counterparty to mitigate the exposure to fluctuations in oil and gas prices. These derivatives are not designated as hedged instruments and are recorded on the Company’s consolidated balance sheet at fair value.
90
Table of Contents
The Company utilizes dealer quotations and observable market data inputs to substantiate internal valuation models. The notional amounts and estimated fair values of oil and gas derivative positions outstanding are presented in the following table:
| December 31, | ||||||||||||||||||||
| 2011 | 2010 | |||||||||||||||||||
|
Oil and Natural Gas Swaps and Options |
Notional Units |
Notional
Amount |
Estimated
Fair Value |
Notional
Amount |
Estimated
Fair Value |
|||||||||||||||
| (Notional amounts and dollars in thousands) | ||||||||||||||||||||
| Oil | ||||||||||||||||||||
|
Derivative assets |
Barrels | 454 | $ | 4,693 | 372 | $ | 5,417 | |||||||||||||
|
Derivative liabilities |
Barrels | (454 | ) | (3,693 | ) | (372 | ) | (4,627 | ) | |||||||||||
| Natural Gas | ||||||||||||||||||||
|
Derivative assets |
MMBTUs | 3,307 | $ | 2,389 | 1,733 | $ | 2,329 | |||||||||||||
|
Derivative liabilities |
MMBTUs | (3,307 | ) | (1,727 | ) | (1,733 | ) | (1,554 | ) | |||||||||||
|
Total Fair Value |
Included in | |||||||||||||||||||
|
Derivative assets |
Other assets | 7,082 | 5,229 | |||||||||||||||||
|
Derivative liabilities |
Other liabilities | 5,420 | 3,664 | |||||||||||||||||
The following table is a summary of the Company’s recognized income related to the activity, which was included in other noninterest income:
| Year Ended December 31, | ||||||||||||
| 2011 | 2010 | 2009 | ||||||||||
| (Dollars in thousands) | ||||||||||||
|
Derivative income |
$ | 569 | $ | 501 | $ | 616 | ||||||
The Company’s credit exposure on oil and gas swaps and options varies based on the current market prices of oil and natural gas. Other than credit risk, changes in the fair value of customer positions will be offset by equal and opposite changes in the counterparty positions. The net positive fair value of the contracts is the profit derived from the activity and is unaffected by market price movements.
Customer credit exposure is managed by strict position limits and is primarily offset by first liens on production while the remainder is offset by cash. Counterparty credit exposure is managed by selecting highly rated counterparties (rated A- or better by Standard and Poor’s) and monitoring market information.
The following table is a summary of the Company’s credit exposure relating to oil and gas swaps and options with bank counterparties:
| December 31, | ||||||||
| 2011 | 2010 | |||||||
| (Dollars in thousands) | ||||||||
|
Credit exposure |
$ | 2,258 | $ | 3,244 | ||||
The Company entered into a $30 million five year guaranty with a counterparty on June 4, 2008 for the timely payment of the obligations of its subsidiary Bank related to the settlement of oil and gas positions.
91
Table of Contents
(22) SEGMENT INFORMATION
The Company evaluates its performance with an internal profitability measurement system that measures the profitability of its business units on a pre-tax basis. The four principal business units are metropolitan banks, community banks, other financial services, and executive, operations and support. Metropolitan and community banks offer traditional banking products such as commercial and retail lending, and a full line of deposit accounts. Metropolitan banks consist of banking locations in the metropolitan Oklahoma City and Tulsa areas. Community banks consist of banking locations in communities throughout Oklahoma. Other financial services are specialty product business units including guaranteed small business lending, residential mortgage lending, trust services, securities brokerage, electronic banking and insurance. The executive, operations and support groups represent executive management, operational support and corporate functions that are not allocated to the other business units.
The results of operations and selected financial information for the four business units are as follows:
|
Metropolitan
Banks |
Community
Banks |
Other
Financial Services |
Executive,
Operations & Support |
Eliminations | Consolidated | |||||||||||||||||||
| (Dollars in thousands) | ||||||||||||||||||||||||
|
December 31, 2011 |
||||||||||||||||||||||||
|
Net interest income (expense) |
$ | 50,952 | $ | 102,528 | $ | 7,055 | $ | (3,638 | ) | $ | — | $ | 156,897 | |||||||||||
|
Provision for loan losses |
21 | 4,205 | 276 | 13 | — | 4,515 | ||||||||||||||||||
|
Noninterest income |
11,226 | 39,529 | 23,148 | 51,144 | (48,086 | ) | 76,961 | |||||||||||||||||
|
Depreciation and amortization |
1,733 | 6,128 | 505 | 1,316 | — | 9,682 | ||||||||||||||||||
|
Other expenses |
29,527 | 74,527 | 19,569 | 25,627 | (286 | ) | 148,964 | |||||||||||||||||
|
|
|
|
|
|
|
|
|
|
|
|
|
|||||||||||||
|
Income before taxes |
$ | 30,897 | $ | 57,197 | $ | 9,853 | $ | 20,550 | $ | (47,800 | ) | $ | 70,697 | |||||||||||
|
|
|
|
|
|
|
|
|
|
|
|
|
|||||||||||||
|
Total assets |
$ | 1,738,426 | $ | 3,660,239 | $ | 153,872 | $ | 602,577 | $ | (546,289 | ) | $ | 5,608,825 | |||||||||||
|
|
|
|
|
|
|
|
|
|
|
|
|
|||||||||||||
|
Capital expenditures |
$ | 2,265 | $ | 12,561 | $ | 107 | $ | 1,447 | $ | — | $ | 16,380 | ||||||||||||
|
|
|
|
|
|
|
|
|
|
|
|
|
|||||||||||||
|
December 31, 2010 |
||||||||||||||||||||||||
|
Net interest income (expense) |
$ | 46,928 | $ | 91,730 | $ | 7,489 | $ | (3,390 | ) | $ | — | $ | 142,757 | |||||||||||
|
Provision for loan losses |
528 | 2,199 | 228 | (1 | ) | — | 2,954 | |||||||||||||||||
|
Noninterest income |
10,687 | 35,818 | 20,822 | 46,809 | (44,198 | ) | 69,938 | |||||||||||||||||
|
Depreciation and amortization |
1,628 | 5,269 | 502 | 1,132 | — | 8,531 | ||||||||||||||||||
|
Other expenses |
26,738 | 66,838 | 18,394 | 23,879 | (285 | ) | 135,564 | |||||||||||||||||
|
|
|
|
|
|
|
|
|
|
|
|
|
|||||||||||||
|
Income before taxes |
$ | 28,721 | $ | 53,242 | $ | 9,187 | $ | 18,409 | $ | (43,913 | ) | $ | 65,646 | |||||||||||
|
|
|
|
|
|
|
|
|
|
|
|
|
|||||||||||||
|
Total assets |
$ | 1,534,552 | $ | 3,298,409 | $ | 140,854 | $ | 611,979 | $ | (525,545 | ) | $ | 5,060,249 | |||||||||||
|
|
|
|
|
|
|
|
|
|
|
|
|
|||||||||||||
|
Capital expenditures |
$ | 1,614 | $ | 4,584 | $ | 162 | $ | 1,148 | $ | — | $ | 7,508 | ||||||||||||
|
|
|
|
|
|
|
|
|
|
|
|
|
|||||||||||||
|
December 31, 2009 |
||||||||||||||||||||||||
|
Net interest income (expense) |
$ | 40,308 | $ | 87,446 | $ | 7,391 | $ | (3,841 | ) | $ | — | $ | 131,304 | |||||||||||
|
Provision for loan losses |
6,673 | 3,618 | 97 | 1 | — | 10,389 | ||||||||||||||||||
|
Noninterest income |
10,501 | 34,543 | 19,025 | 36,850 | (34,038 | ) | 66,881 | |||||||||||||||||
|
Depreciation and amortization |
1,506 | 5,225 | 468 | 1,241 | — | 8,440 | ||||||||||||||||||
|
Other expenses |
25,359 | 64,589 | 15,840 | 25,134 | (245 | ) | 130,677 | |||||||||||||||||
|
|
|
|
|
|
|
|
|
|
|
|
|
|||||||||||||
|
Income before taxes |
$ | 17,271 | $ | 48,557 | $ | 10,011 | $ | 6,633 | $ | (33,793 | ) | $ | 48,679 | |||||||||||
|
|
|
|
|
|
|
|
|
|
|
|
|
|||||||||||||
|
Total assets |
$ | 1,386,748 | $ | 2,779,110 | $ | 221,033 | $ | 523,350 | $ | (494,126 | ) | $ | 4,416,115 | |||||||||||
|
|
|
|
|
|
|
|
|
|
|
|
|
|||||||||||||
|
Capital expenditures |
$ | 1,625 | $ | 3,088 | $ | 91 | $ | 1,209 | $ | — | $ | 6,013 | ||||||||||||
|
|
|
|
|
|
|
|
|
|
|
|
|
|||||||||||||
92
Table of Contents
The financial information for each business unit is presented on the basis used internally by management to evaluate performance and allocate resources. The Company utilizes a transfer pricing system to allocate the benefit or cost of funds provided or used by the various business units. Certain services provided by the support group to other business units, such as item processing, are allocated at rates approximating the cost of providing the services. Eliminations are adjustments to consolidate the business units and companies. Capital expenditures are generally charged to the business unit using the asset.
(23) SELECTED QUARTERLY FINANCIAL DATA (UNAUDITED)
A summary of the unaudited quarterly results of operations for the years ended December 31, 2011 and 2010 is as follows:
| Quarter | ||||||||||||||||
| Fourth | Third | Second | First | |||||||||||||
| (Dollars in thousands, except per share data) | ||||||||||||||||
|
2011 |
||||||||||||||||
|
Net interest income |
$ | 41,384 | $ | 40,218 | $ | 38,006 | $ | 37,289 | ||||||||
|
Provision for loan losses |
829 | 885 | 2,013 | 788 | ||||||||||||
|
Noninterest income |
19,435 | 20,117 | 19,679 | 17,730 | ||||||||||||
|
Noninterest expense |
41,380 | 41,259 | 39,610 | 36,397 | ||||||||||||
|
Net income |
11,598 | 12,553 | 10,115 | 11,355 | ||||||||||||
|
Net income per common share: |
||||||||||||||||
|
Basic |
0.77 | 0.82 | 0.66 | 0.74 | ||||||||||||
|
Diluted |
0.75 | 0.81 | 0.65 | 0.72 | ||||||||||||
|
2010 |
||||||||||||||||
|
Net interest income |
$ | 37,158 | $ | 36,071 | $ | 35,668 | $ | 33,860 | ||||||||
|
Provision for loan losses |
718 | 469 | 871 | 896 | ||||||||||||
|
Noninterest income |
18,801 | 18,163 | 17,012 | 15,962 | ||||||||||||
|
Noninterest expense |
39,300 | 35,389 | 34,505 | 34,901 | ||||||||||||
|
Net income |
10,177 | 11,787 | 11,042 | 9,303 | ||||||||||||
|
Net income per common share: |
||||||||||||||||
|
Basic |
0.66 | 0.77 | 0.72 | 0.61 | ||||||||||||
|
Diluted |
0.65 | 0.75 | 0.71 | 0.60 | ||||||||||||
(24) SUBSEQUENT EVENT
On January 19, 2012, Council Oak Investment Corporation, a wholly-owned subsidiary of BancFirst, completed the sale of one of its investments that resulted in a pretax gain of approximately $4.5 million. After related expenses and income taxes, the increase in net income approximated $2.6 million or $0.17 per share on a fully diluted basis. The gain will be included in first quarter 2012 earnings.
None.
The Company’s Chief Executive Officer, Chief Financial Officer and Disclosure Committee, which includes the Company’s Chief Risk Officer, Chief Asset Quality Officer, Chief Internal Auditor, Treasurer, Controller and General Counsel, have evaluated, as of the last day of the period covered by this report, the Company’s disclosure controls and procedures. Based on their evaluation they concluded that the disclosure controls and procedures of the Company are effective to ensure that information required to be disclosed by the
93
Table of Contents
Company in the reports filed or submitted by it under the Securities Exchange Act of 1934 is recorded, processed, summarized and reported, within the time periods specified in the applicable rules and forms. No changes were made to the Company’s internal control over financial reporting during the last fiscal quarter of 2011 that materially affected, or are likely to materially affect, the Company’s internal control over financial reporting. There have been no significant changes in the Company’s internal controls or in other factors that could significantly affect internal controls subsequent to the date of their evaluation.
94
Table of Contents
Management’s Report on Internal Control Over Financial Reporting
Management is responsible for establishing and maintaining internal control over financial reporting and for assessing the effectiveness of internal control over financial reporting, as such term is defined in Exchange Act Rules 13a-15(f) and 15d-15(f). Management has assessed the effectiveness of the Company’s internal control over financial reporting based on the criteria established in “Internal Control — Integrated Framework,” issued by the Committee of Sponsoring Organizations (“COSO”) of the Treadway Commission. Based on that assessment and criteria, management has determined that the Company has maintained effective internal control over financial reporting as of December 31, 2011.
Grant Thornton LLP, independent registered public accounting firm, has audited the effectiveness of the Company’s internal control over financial reporting as of December 31, 2011 and has issued an unqualified report thereon.
BancFirst Corporation
Oklahoma City, Oklahoma
March 15, 2012
| / S / D AVID E. R AINBOLT |
| David E. Rainbolt |
| President and Chief Executive Officer |
| (Principal Executive Officer) |
|
/ S / J OE T. S HOCKLEY , J R . |
| Joe T. Shockley, Jr. |
| Executive Vice President and |
| Chief Financial Officer |
| (Principal Financial Officer) |
|
/ S / R ANDY F ORAKER |
| Randy Foraker |
| Executive Vice President and |
| Chief Risk Officer |
| (Principal Accounting Officer) |
95
Table of Contents
Report of Independent Registered Public Accounting Firm
Board of Directors and Shareholders
BancFirst Corporation
We have audited BancFirst Corporation (an Oklahoma corporation) and Subsidiaries (collectively, the Company) internal control over financial reporting as of December 31, 2011, based on criteria established in Internal Control—Integrated Framework issued by the Committee of Sponsoring Organizations of the Treadway Commission (COSO). The Company’s management is responsible for maintaining effective internal control over financial reporting and for its assessment of the effectiveness of internal control over financial reporting, included in the accompanying Management’s Report on Internal Control Over Financial Reporting. Our responsibility is to express an opinion on the Company’s internal control over financial reporting based on our audit.
We conducted our audit in accordance with the standards of the Public Company Accounting Oversight Board (United States). Those standards require that we plan and perform the audit to obtain reasonable assurance about whether effective internal control over financial reporting was maintained in all material respects. Our audit included obtaining an understanding of internal control over financial reporting, assessing the risk that a material weakness exists, testing and evaluating the design and operating effectiveness of internal control based on the assessed risk, and performing such other procedures as we considered necessary in the circumstances. We believe that our audit provides a reasonable basis for our opinion.
A company’s internal control over financial reporting is a process designed to provide reasonable assurance regarding the reliability of financial reporting and the preparation of financial statements for external purposes in accordance with generally accepted accounting principles. A company’s internal control over financial reporting includes those policies and procedures that (1) pertain to the maintenance of records that, in reasonable detail, accurately and fairly reflect the transactions and dispositions of the assets of the company; (2) provide reasonable assurance that transactions are recorded as necessary to permit preparation of financial statements in accordance with generally accepted accounting principles, and that receipts and expenditures of the company are being made only in accordance with authorizations of management and directors of the company; and (3) provide reasonable assurance regarding prevention or timely detection of unauthorized acquisition, use, or disposition of the company’s assets that could have a material effect on the financial statements.
Because of its inherent limitations, internal control over financial reporting may not prevent or detect misstatements. Also, projections of any evaluation of effectiveness to future periods are subject to the risk that controls may become inadequate because of changes in conditions, or that the degree of compliance with the policies or procedures may deteriorate.
In our opinion, the Company maintained, in all material respects, effective internal control over financial reporting as of December 31, 2011, based on criteria established in Internal Control—Integrated Framework issued by COSO.
We also have audited, in accordance with the standards of the Public Company Accounting Oversight Board (United States), the consolidated balance sheets of BancFirst Corporation and Subsidiaries, as of December 31, 2011 and 2010, and the related consolidated statements of comprehensive income, stockholders’ equity and cash flow for each of the three years in the period ended December 31, 2011 and our report dated March 15, 2012 expressed an unqualified opinion.
/s/ GRANT THORNTON LLP
Oklahoma City, Oklahoma
March 15, 2012
96
Table of Contents
There is no information required to be disclosed in a report on Form 8-K during the fourth quarter of the year that was not reported.
The information required by Item 401 of Regulation S-K will be contained in the 2012 Proxy Statement under the caption “Election of Directors” and is hereby incorporated by reference. The information required by Item 405 of Regulation S-K will be contained in the 2012 Proxy Statement under the caption “16(a) Beneficial Ownership Reporting Compliance” and is hereby incorporated by reference. The information required by Item 406 of Regulation S-K will be contained in the 2012 Proxy Statement under the caption “Code of Ethics” and is hereby incorporated by reference.
The information required by Item 402 of Regulation S-K will be contained in the 2012 Proxy Statement under the captions “Executive Compensation” and “Compensation Discussion and Analysis” and is hereby incorporated by reference.
The information required by Item 201(d) of Regulation S-K will be contained in the 2012 Proxy Statement under the caption “Equity Compensation Plan Information” and is hereby incorporated by reference. The information required by Item 403 of Regulation S-K will be contained in the 2012 Proxy Statement under the caption “Security Ownership” and is hereby incorporated by reference.
The information required by Item 404 of Regulation S-K will be contained in the 2012 Proxy Statement under the caption “Transactions with Related Persons” and is hereby incorporated by reference.
The information required by Item 9(e) of Schedule 14A will be contained in the 2012 Proxy Statement under the caption “Ratification of Selection of Independent Registered Public Accounting Firm” and is hereby incorporated by reference.
97
Table of Contents
(a) For the financial statements of BancFirst Corporation, reference is made to Part II, Item 8, of this Annual Report on Form 10-K.
(1) Financial Statements:
Reports of Independent Registered Public Accounting Firm
Consolidated Balance Sheets at December 31, 2011 and 2010
Consolidated Statements of Comprehensive Income for the three years ended December 31, 2011, 2010 and 2009
Consolidated Statements of Stockholders’ Equity for the three years ended December 31, 2011, 2010 and 2009
Consolidated Statements of Cash Flow for the three years ended December 31, 2011, 2010 and 2009
Notes to Consolidated Financial Statements
(2) All other schedules are omitted because they are not applicable or the required information is shown in the financial statements or notes thereto.
(3) The following Exhibits are filed with this Report or are incorporated by reference as set forth below:
|
Exhibit
|
Exhibit |
|
| 3.1 | Second Amended and Restated Certificate of Incorporation of BancFirst Corporation (filed as Exhibit 1 to the Company’s 8-A/A filed July 23, 1998 and incorporated herein by reference). | |
| 3.2 | Certificate of Amendment of the Second Amended and Restated Certificate of Incorporation of BancFirst Corporation dated June 15, 2004 (filed as Exhibit 3.5 to the Company’s Quarterly Report on Form 10-Q for the Quarter Ended June 30, 2004 and incorporated herein by reference). | |
| 3.3 | Certificate of Designations of Preferred Stock (filed as Exhibit 3.2 to the Company’s Annual Report on Form 10-K for the fiscal year ended December 31, 1998 and incorporated herein by reference). | |
| 3.4 | Amended By-Laws (filed as Exhibit 3.2 to the Company’s Annual Report on Form 10-K for the fiscal year ended December 31, 1992 and incorporated herein by reference). | |
| 3.5 | Resolution of the Board of Directors amending Section XXVII of the Company’s By-Laws (filed as Exhibit 3.1 to the Company’s Current Report on Form 8-K dated February 26, 2004 and incorporated herein by reference). | |
| 3.6 | Resolution of the Board of Directors amending Article XVI, Section 1 and Article XVII, Section 1 of the Company’s By-Laws (filed as Exhibit 3.1 to the Company’s Current Report on Form 8-K dated February 28, 2008 and incorporated herein by reference). | |
| 4.1 | Instruments defining the rights of securities holders (see Exhibits 3.1, 3.2, 3.3 and 3.4 above). | |
| 4.2 | Rights Agreement, dated as of February 25, 1999, between BancFirst Corporation and BancFirst, as Rights Agent, including as Exhibit A the form of Certificate of Designations of the Company setting forth the terms of the Preferred Stock, as Exhibit B the form of Right Certificate and as Exhibit C the form of Summary of Rights Agreement (filed as Exhibit 4.1 to the Company’s 8-K dated January 28, 2009 and incorporated herein by reference). | |
| 4.3 | Amendment No. 1 to Rights Agreement, dated as of February 25, 1999, between BancFirst Corporation and BancFirst, as Rights Agent (filed as Exhibit 4.2 to the Company’s 8-K dated January 28, 2009 and incorporated herein by reference). | |
98
Table of Contents
|
Exhibit
|
Exhibit |
|
| 4.4 | Form of Amended and Restated Trust Agreement relating to the 7.20% Cumulative Trust Preferred Securities of BFC Capital Trust II (filed as Exhibit 4.5 to the Company’s registration statement on Form S-3/A, File No. 333-112488 dated February 23, 2004, and incorporated herein by reference). | |
| 4.5 |
Form of 7.20% Cumulative Trust Preferred Security Certificate for BFC Capital Trust II (filed as Exhibit D to Exhibit 4.5 to the Company’s registration statement on Form
S-3/A,
File No. 333-112488 dated February 23, 2004, and incorporated herein by reference). |
|
| 4.6 | Form of Indenture relating to the 7.20% Junior Subordinated Deferrable Interest Debentures of BancFirst Corporation issued to BFC Capital Trust II (filed as Exhibit 4.1 to the Company’s registration statement on Form S-3, File No. 333-112488 dated February 4, 2004, and incorporated herein by reference). | |
| 4.7 |
Form of Certificate of 7.20% Junior Subordinated Deferrable Interest Debenture of BancFirst Corporation (filed as Exhibit 4.2 on Form S-3 to the Company’s registration
statement,
File No. 333-112488 dated February 4, 2004, and incorporated herein by reference). |
|
| 4.8 | Form of Guarantee of BancFirst Corporation relating to the 7.20% Cumulative Trust Preferred Securities of BFC Capital Trust II (filed as Exhibit 4.7 to the Company’s registration statement on Form S-3/A, File No. 333-112488 dated February 23, 2004, and incorporated herein by reference). | |
| 4.9 | Form of Indenture relating to the Union National Bancshares, Inc. (BancFirst Corp. as successor) Fixed/Floating Rate Junior Subordinated Deferrable Interest Debentures, Form of Fixed/Floating Rate Junior Subordinated Deferrable Interest Debenture, and Form of Certificate to Trustee. (filed as Exhibit 4.9 to the Company’s Annual Report on Form 10-K for the Year Ended December 31, 2010 and incorporated herein by reference). | |
| 4.10 | Form of Indenture relating to the FBC Financial Corporation (BancFirst Corp. as successor) Floating Rate Junior Subordinated Deferrable Interest Debentures, Form of Floating Rate Junior Subordinated Deferrable Interest Debenture, and Form of Certificate to Trustee. (filed as Exhibit 4.10 to the Company’s Quarterly Report on Form 10-Q for the Quarter Ended September 30, 2011 and incorporated herein by reference). | |
| 10.1 | Tenth Amended and Restated BancFirst Corporation Stock Option Plan (filed as Exhibit 4.1 to the Company’s registration statement on Form S-8, File No. 333-175914 dated July 29, 2011, and incorporated herein by reference). | |
| 10.2 | BancFirst Corporation Employee Stock Ownership and Trust Agreement adopted December 21, 2006 effective January 1, 2007 (filed as Exhibit 10.2 to the Company’s Quarterly Report on Form 10-Q for the quarter ended March 31, 2008 and incorporated herein by reference). | |
| 10.3 | Second Amended and Restated BancFirst Corporation Non-Employee Directors’ Stock Option Plan (filed as Exhibit 10.7 to the Company’s Quarterly Report on Form 10-Q for the Quarter Ended June 30, 2009 and incorporated herein by reference). | |
| 10.4 | Third Amended and Restated BancFirst Corporation Directors’ Deferred Stock Compensation Plan (filed as Exhibit 10.8 to the Company’s Quarterly Report on Form 10-Q for the Quarter Ended June 30, 2009 and incorporated herein by reference). | |
| 10.5 | Amended and Restated BancFirst Corporation Thrift Plan adopted March 25, 2010 effective January 1, 2010 (filed as Exhibit 10.6 to the Company’s Quarterly Report on Form 10-Q for the Quarter Ended June 30, 2010 and incorporated herein by reference). | |
| 10.6 | Amendment (Code Section 415 Compliance) to the BancFirst Corporation Employee Stock Ownership Plan and Trust Agreement, adopted July 23, 2009 (filed as Exhibit 10.7 to the Company’s Quarterly Report on Form 10-Q for the Quarter Ended June 30, 2010 and incorporated herein by reference). | |
99
Table of Contents
|
Exhibit
|
Exhibit |
|
| 10.7 | Amendment (Pension Protection Act, Heart Act and the Worker, Retiree, and Employer Recovery Act) to the BancFirst Corporation Employee Stock Ownership Plan and Trust Agreement, adopted December 17, 2009 (filed as Exhibit 10.8 to the Company’s Quarterly Report on Form 10-Q for the Quarter Ended June 30, 2010 and incorporated herein by reference). | |
| 10.8 | Amendment to the Amended and Restated BancFirst Corporation Thrift Plan adopted December 16, 2010 effective January 1, 2011 (filed as Exhibit 10.9 to the Company’s Annual Report on Form 10-K for the Year Ended December 31, 2010 and incorporated herein by reference). | |
| 10.9* | Amendment to the Amended and Restated BancFirst Corporation Thrift Plan adopted October 27, 2011 effective October 1, 2011. | |
| 10.10* | Amendment to the Amended and Restated BancFirst Corporation Employee Ownership Plan adopted October 27, 2011 effective October 1, 2011. | |
| 21.1* | Subsidiaries of Registrant. | |
| 23.1* | Consent of Independent Registered Public Accounting Firm. | |
| 31.1* | Chief Executive Officer’s Certification pursuant to Rule 13a-14(a) or Rule 15d-14(a). | |
| 31.2* | Chief Financial Officer’s Certification pursuant to Rule 13a-14(a) or Rule 15d-14(a). | |
| 32.1* | CEO’s Certification Pursuant to 18 U.S.C. Section 1350, As Adopted Pursuant to Section 906 of the Sarbanes-Oxley Act of 2002. | |
| 32.2* | CFO’s Certification Pursuant to 18 U.S.C. Section 1350, As Adopted Pursuant to Section 906 of the Sarbanes-Oxley Act of 2002. | |
| 101.INS** | XBRL Instance Document | |
| 101.SCH** | XBRL Taxonomy Extension Schema | |
| 101.CAL** | XBRL Taxonomy Extension Calculation Linkbase | |
| 101.DEF** | XBRL Taxonomy Extension Definition Linkbase | |
| 101.LAB** | XBRL Taxonomy Extension Label Linkbase | |
| 101.PRE** | XBRL Taxonomy Extension Presentation Linkbase | |
| * | Filed herewith. |
| ** | Furnished herewith. |
100
Table of Contents
Pursuant to the requirements of Section 13 or 15(d) of the Securities Exchange Act of 1934, the registrant has duly caused this report to be signed on its behalf by the undersigned, thereunto duly authorized.
| March 15, 2012 | BANCFIRST CORPORATION | |||
| /s/ David E. Rainbolt | ||||
| David E. Rainbolt | ||||
|
President and Chief Executive Officer (Principal Executive Officer) |
||||
Pursuant to the requirements of the Securities Exchange Act of 1934, this report has been signed below by the following persons on behalf of the registrant and in the capacities indicated on March 15, 2012.
|
/s/ H. E. Rainbolt |
/s/ David E. Rainbolt |
|||
| H. E. Rainbolt | David E. Rainbolt | |||
| Chairman of the Board | President, Chief Executive Officer and Director | |||
| (Principal Executive Officer) | (Principal Executive Officer) | |||
|
/s/ Dennis L. Brand |
/s/ C. L. Craig, Jr. |
|||
| Dennis L. Brand | C. L. Craig, Jr. | |||
| Chief Executive Officer, BancFirst and Director | Director | |||
| (Principal Executive Officer) | ||||
|
/s/ William H. Crawford |
/s/ James R. Daniel |
|||
| William H. Crawford | James R. Daniel | |||
| Director | Vice Chairman of the Board | |||
| (Principal Executive Officer) | ||||
|
/s/ F. Ford Drummond |
/s/ K. Gordon Greer |
|||
| F. Ford Drummond | K. Gordon Greer | |||
| Director | Vice Chairman of the Board | |||
| (Principal Executive Officer) | ||||
|
/s/ Dr. Donald B. Halverstadt |
/s/ William O. Johnstone |
|||
| Dr. Donald B. Halverstadt | William O. Johnstone | |||
| Director | Vice Chairman of the Board | |||
| (Principal Executive Officer) | ||||
|
/s/ J. Ralph McCalmont |
/s/ Tom H. McCasland, III |
|||
| J. Ralph McCalmont | Tom H. McCasland, III | |||
| Director | Director | |||
|
/s/ Ronald J. Norick |
/s/ Paul B. Odom, Jr. |
|||
| Ronald J. Norick | Paul B. Odom, Jr. | |||
| Director | Director | |||
101
Table of Contents
|
/s/ David Ragland |
/s/ Cynthia S. Ross |
|||
| David Ragland | Cynthia S. Ross | |||
| Director | Director | |||
|
/s/ G. Rainey Williams, Jr. |
/s/ Michael K. Wallace |
|||
| G. Rainey Williams, Jr. | Michael K. Wallace | |||
| Director | Director | |||
|
/s/ Randy Foraker |
/s/ Joe T. Shockley, Jr. |
|||
| Randy Foraker | Joe T. Shockley, Jr. | |||
| Executive Vice President and Chief Risk Officer | Executive Vice President and Chief Financial Officer | |||
| (Principal Accounting Officer) | (Principal Financial Officer) | |||
102
Table of Contents
COMPANY PERFORMANCE
Presented below is a line graph which compares the percentage in the cumulative total return on the Company’s Common Stock to the cumulative total return of the NASDAQ Stock Market (U.S. Companies) Index and the NASDAQ Bank Stock Index, both as compiled by the University of Chicago Center for Research in Security Price (“CRSP”). The period presented is from January 1, 2007 through December 31, 2011. The graph assumes an investment on January 1, 2007 of $100 in the Company’s Common Stock and in each index, and that any dividends were reinvested. The values presented for each quarter during the period represent the cumulative market values of the respective investment.
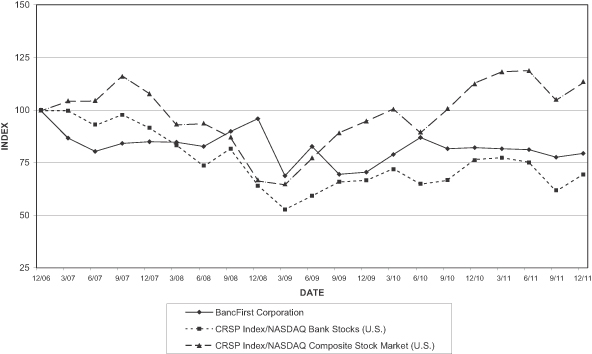
103
Table of Contents
INDEX TO EXHIBITS
|
Exhibit
|
Exhibit |
|
| 3.1 | Second Amended and Restated Certificate of Incorporation of BancFirst Corporation (filed as Exhibit 1 to the Company’s 8-A/A filed July 23, 1998 and incorporated herein by reference). | |
| 3.2 | Certificate of Amendment of the Second Amended and Restated Certificate of Incorporation of BancFirst Corporation dated June 15, 2004 (filed as Exhibit 3.5 to the Company’s Quarterly Report on Form 10-Q for the Quarter Ended June 30, 2004 and incorporated herein by reference). | |
| 3.3 | Certificate of Designations of Preferred Stock (filed as Exhibit 3.2 to the Company’s Annual Report on Form 10-K for the fiscal year ended December 31, 1998 and incorporated herein by reference). | |
| 3.4 | Amended By-Laws (filed as Exhibit 3.2 to the Company’s Annual Report on Form 10-K for the fiscal year ended December 31, 1992 and incorporated herein by reference). | |
| 3.5 | Resolution of the Board of Directors amending Section XXVII of the Company’s By-Laws (filed as Exhibit 3.1 to the Company’s Current Report on Form 8-K dated February 26, 2004 and incorporated herein by reference). | |
| 3.6 | Resolution of the Board of Directors amending Article XVI, Section 1 and Article XVII, Section 1 of the Company’s By-Laws (filed as Exhibit 3.1 to the Company’s Current Report on Form 8-K dated February 28, 2008 and incorporated herein by reference). | |
| 4.1 | Instruments defining the rights of securities holders (see Exhibits 3.1, 3.2, 3.3 and 3.4 above). | |
| 4.2 | Rights Agreement, dated as of February 25, 1999, between BancFirst Corporation and BancFirst, as Rights Agent, including as Exhibit A the form of Certificate of Designations of the Company setting forth the terms of the Preferred Stock, as Exhibit B the form of Right Certificate and as Exhibit C the form of Summary of Rights Agreement (filed as Exhibit 4.1 to the Company’s 8-K dated January 28, 2009 and incorporated herein by reference). | |
| 4.3 | Amendment No. 1 to Rights Agreement, dated as of February 25, 1999, between BancFirst Corporation and BancFirst, as Rights Agent (filed as Exhibit 4.2 to the Company’s 8-K dated January 28, 2009 and incorporated herein by reference). | |
| 4.4 | Form of Amended and Restated Trust Agreement relating to the 7.20% Cumulative Trust Preferred Securities of BFC Capital Trust II (filed as Exhibit 4.5 to the Company’s registration statement on Form S-3/A, File No. 333-112488 dated February 23, 2004, and incorporated herein by reference). | |
| 4.5 | Form of 7.20% Cumulative Trust Preferred Security Certificate for BFC Capital Trust II (filed as Exhibit D to Exhibit 4.5 to the Company’s registration statement on Form S-3/A, File No. 333-112488 dated February 23, 2004, and incorporated herein by reference). | |
| 4.6 | Form of Indenture relating to the 7.20% Junior Subordinated Deferrable Interest Debentures of BancFirst Corporation issued to BFC Capital Trust II (filed as Exhibit 4.1 to the Company’s registration statement on Form S-3, File No. 333-112488 dated February 4, 2004, and incorporated herein by reference). | |
| 4.7 | Form of Certificate of 7.20% Junior Subordinated Deferrable Interest Debenture of BancFirst Corporation (filed as Exhibit 4.2 on Form S-3 to the Company’s registration statement, File No. 333-112488 dated February 4, 2004, and incorporated herein by reference). | |
| 4.8 | Form of Guarantee of BancFirst Corporation relating to the 7.20% Cumulative Trust Preferred Securities of BFC Capital Trust II (filed as Exhibit 4.7 to the Company’s registration statement on Form S-3/A, File No. 333-112488 dated February 23, 2004, and incorporated herein by reference). | |
Table of Contents
|
Exhibit
|
Exhibit |
|
| 4.9 | Form of Indenture relating to the Union National Bancshares, Inc. (BancFirst Corp. as successor) Fixed/Floating Rate Junior Subordinated Deferrable Interest Debentures, Form of Fixed/Floating Rate Junior Subordinated Deferrable Interest Debenture, and Form of Certificate to Trustee. (filed as Exhibit 4.9 to the Company’s Annual Report on Form 10-K for the Year Ended December 31, 2010 and incorporated herein by reference). | |
| 4.10 | Form of Indenture relating to the FBC Financial Corporation (BancFirst Corp. as successor) Floating Rate Junior Subordinated Deferrable Interest Debentures, Form of Floating Rate Junior Subordinated Deferrable Interest Debenture, and Form of Certificate to Trustee. (filed as Exhibit 4.10 to the Company’s Quarterly Report on Form 10-Q for the Quarter Ended September 30, 2011 and incorporated herein by reference). | |
| 10.1 | Tenth Amended and Restated BancFirst Corporation Stock Option Plan (filed as Exhibit 4.1 to the Company’s registration statement on Form S-8, File No. 333-175914 dated July 29, 2011, and incorporated herein by reference). | |
| 10.2 | BancFirst Corporation Employee Stock Ownership and Trust Agreement adopted December 21, 2006 effective January 1, 2007 (filed as Exhibit 10.2 to the Company’s Quarterly Report on Form 10-Q for the quarter ended March 31, 2008 and incorporated herein by reference). | |
| 10.3 | Second Amended and Restated BancFirst Corporation Non-Employee Directors’ Stock Option Plan (filed as Exhibit 10.7 to the Company’s Quarterly Report on Form 10-Q for the Quarter Ended June 30, 2009 and incorporated herein by reference). | |
| 10.4 | Third Amended and Restated BancFirst Corporation Directors’ Deferred Stock Compensation Plan (filed as Exhibit 10.8 to the Company’s Quarterly Report on Form 10-Q for the Quarter Ended June 30, 2009 and incorporated herein by reference). | |
| 10.5 | Amended and Restated BancFirst Corporation Thrift Plan adopted March 25, 2010 effective January 1, 2010 (filed as Exhibit 10.6 to the Company’s Quarterly Report on Form 10-Q for the Quarter Ended June 30, 2010 and incorporated herein by reference). | |
| 10.6 | Amendment (Code Section 415 Compliance) to the BancFirst Corporation Employee Stock Ownership Plan and Trust Agreement, adopted July 23, 2009 (filed as Exhibit 10.7 to the Company’s Quarterly Report on Form 10-Q for the Quarter Ended June 30, 2010 and incorporated herein by reference). | |
| 10.7 | Amendment (Pension Protection Act, Heart Act and the Worker, Retiree, and Employer Recovery Act) to the BancFirst Corporation Employee Stock Ownership Plan and Trust Agreement, adopted December 17, 2009 (filed as Exhibit 10.8 to the Company’s Quarterly Report on Form 10-Q for the Quarter Ended June 30, 2010 and incorporated herein by reference). | |
| 10.8 | Amendment to the Amended and Restated BancFirst Corporation Thrift Plan adopted December 16, 2010 effective January 1, 2011 (filed as Exhibit 10.9 to the Company’s Annual Report on Form 10-K for the Year Ended December 31, 2010 and incorporated herein by reference). | |
| 10.9* | Amendment to the Amended and Restated BancFirst Corporation Thrift Plan adopted October 27, 2011 effective October 1, 2011. | |
| 10.10* | Amendment to the Amended and Restated BancFirst Corporation Employee Ownership Plan adopted October 27, 2011 effective October 1, 2011. | |
| 21.1* | Subsidiaries of Registrant. | |
| 23.1* | Consent of Independent Registered Public Accounting Firm. | |
Table of Contents
|
Exhibit
|
Exhibit |
|
| 31.1* | Chief Executive Officer’s Certification pursuant to Rule 13a-14(a) or Rule 15d-14(a). | |
| 31.2* | Chief Financial Officer’s Certification pursuant to Rule 13a-14(a) or Rule 15d-14(a). | |
| 32.1* | CEO’s Certification Pursuant to 18 U.S.C. Section 1350, As Adopted Pursuant to Section 906 of the Sarbanes-Oxley Act of 2002. | |
| 32.2* | CFO’s Certification Pursuant to 18 U.S.C. Section 1350, As Adopted Pursuant to Section 906 of the Sarbanes-Oxley Act of 2002. | |
| 101.INS** | XBRL Instance Document | |
| 101.SCH** | XBRL Taxonomy Extension Schema | |
| 101.CAL** | XBRL Taxonomy Extension Calculation Linkbase | |
| 101.DEF** | XBRL Taxonomy Extension Definition Linkbase | |
| 101.LAB** | XBRL Taxonomy Extension Label Linkbase | |
| 101.PRE** | XBRL Taxonomy Extension Presentation Linkbase | |
| * | Filed herewith. |
| ** | Furnished herewith. |