UNITED STATES SECURITIES AND EXCHANGE COMMISSION
WASHINGTON, D.C. 20549
FORM 20-F
¨ REGISTRATION STATEMENT PURSUANT TO SECTION 12(b) OR (g) OF THE
SECURITIES EXCHANGE ACT OF 1934
OR
x ANNUAL REPORT PURSUANT TO SECTION 13 OR 15(d) OF THE SECURITIES
EXCHANGE ACT OF 1934
For the fiscal year ended December 31 st , 2017
OR
¨ TRANSITION REPORT PURSUANT TO SECTION 13 OR 15(d) OF THE SECURITIES
EXCHANGE ACT OF 1934
OR
¨ SHELL COMPANY REPORT PURSUANT TO SECTION 13 OR 15 (d) OF THE SECURITIES
EXCHANGE ACT OF 1934
Date of event requiring this shell company report ______________
For the transition period from to
Commission file number 1-14014
| CREDICORP LTD. |
|
(Exact name of registrant as specified in its charter) |
| BERMUDA |
| (Jurisdiction of incorporation or organization) |
| Of our subsidiary |
| Banco de Credito del Peru: |
| Calle Centenario 156 |
| La Molina |
| Lima 12, Peru |
| (Address of principal executive offices) |
| Cesar Rios |
| Chief Financial Officer |
| Credicorp Ltd |
| Banco de Credito del Peru: |
| Calle Centenario 156 |
| La Molina |
| Lima 12, Peru |
| Phone (+511) 313 2014 |
| Facsimile (+511) 313 2121 |
| (Name, Telephone, Email and/or Facsimile number and Address of Company Contact Person) |
Securities registered or to be registered pursuant to Section 12(b) of the Act.
| Title of each class | Name of each exchange on which registered | |
| Common Shares, par value $5.00 per share | New York Stock Exchange |
Securities registered or to be registered pursuant to Section 12(g) of the Act. None
Securities for which there is a reporting obligation pursuant to Section 15(d) of the Act. None
Indicate the number of outstanding shares of each of the issuer’s classes of capital or common stock as of the close of the period covered by the annual report. Common Shares, par value $5.00 per share 94,382,317
Indicate by check mark if the registrant is a well-known seasoned issuer, as defined in Rule 405 of the Securities Act.
| Yes x | No ¨ |
If this report is an annual or transition report, indicate by check mark if the registrant is not required to file reports pursuant to Section 13 or 15(d) of the Securities Exchange Act of 1934.
| Yes ¨ | No x |
Indicate by check mark whether the registrant (1) has filed all reports required to be filed by Section 13 or 15(d) of the Securities Exchange Act of 1934 during the preceding 12 months (or for such shorter period that the registrant was required to file such reports), and (2) has been subject to such filing requirements for the past 90 days.
| Yes x | No ¨ |
Indicate by check mark whether the registrant has submitted electronically and posted on its corporate Web site, if any, every Interactive Data File required to be submitted and posted pursuant to Rule 405 of Regulation S-T (§232.405 of this chapter) during the preceding 12 months (or for such shorter period that the registrant was required to submit and post such files).
| Yes x | No ¨ |
Indicate by check mark whether the registrant is a large accelerated filer, an accelerated filer, a non-accelerated filer, or an emerging growth company. See the definitions of “large accelerated filer,” “accelerated filer,” and “emerging growth company” in Rule 12b-2 of the Exchange Act
| Large accelerated filer | x | Accelerated filer | ¨ |
| Non-accelerated filer | ¨ | Emerging Growth Company | ¨ |
If an emerging growth company that prepares its financial statements in accordance with U.S. GAAP, indicate by check mark if the registrant has elected not to use the extended transition period for complying with any new or revised financial accounting standards † provided pursuant to Section 13(a) of the Exchange Act ¨
† The term “new or revised financial accounting standard” refers to any update issued by the Financial Accounting Standards Board to its Accounting Standards Codification after April 5, 2012.
Indicate by check mark which basis of accounting the registrant has used to prepare the financial statements included in this filing:
| U.S. GAAP ¨ | International Financial Reporting Standards as issued | Other ¨ |
| by the International Accounting Standards Board x |
If “Other” has been checked in response to the previous question, indicate by check mark which financial statement item the registrant has elected to follow.
| Item 17 ¨ | Item 18 ¨ |
If this is an annual report, indicate by check mark whether the registrant is a shell company (as defined in Rule 12b-2 of the Exchange Act).
| Yes ¨ | No x |
| 2 |
| 3 |
| Abbreviations | Meaning | |
| AFM | Administradora de Fondos Mutuos or Mutual Fund Administrators | |
| AFP | Administradora de Fondo de Pensiones or Private Pension Funds Administrators - Peru | |
| AGF | Administradora General de Fondos or General Funds Management | |
| ALCO | Asset and Liabilities Committee | |
| ALM | Asset and Liabilities Management Service | |
| AML | Anti-Money Laundering | |
| AMV | Autorregulador del Mercado de Valores de Colombia or Colombia's Stock Market Self-regulator | |
| APERHU | Asociacion Peruana de Recursos Humanos or Peruvian Association of Human Resources | |
| ASB | Atlantic Security Bank | |
| ASBANC | Asociacion de Bancos del Peru or Association of Banks of Peru | |
| ASFI | Autoridad Supervisora del Sistema Financiero or Financial System Supervisory Authority - Bolivia | |
| ASHC | Atlantic Security Holding Corporation | |
| ASOMIF | Asociacion de Instituciones de Microfinanzas del Peru or Association of Microfinance Institutions of Peru | |
| ATM | Automated Teller Machine (cash machine) | |
| ATPDEA | Andean Trade Promotion and Drug Eradication Act | |
| AuC | Assets under Custody | |
| AuMs | Assets under Management | |
| BCB | Banco Central de Bolivia or Bolivian Central Bank | |
| BCI | Banco de Credito e Inversiones | |
| BCM | Business Continuity Management | |
| BCP Bolivia | Banco de Credito de Bolivia | |
| BCP Consolidated | Banco de Credito del Peru, including subsidiaries such as Mibanco. It is also called BCP | |
| BCP Stand-alone | Banco de Credito del Peru including BCP Panama and BCP Miami, branches located overseas, and excluding subsidiaries. | |
| BCRP | Banco Central de Reserva del Peru or Peruvian Central Bank | |
| BEX | Banca Exclusiva | |
| Bladex | Banco Latinoamericano de Comercio Exterior | |
| BLMIS | Bernard L. Madoff Investment Securities LLC |
| 4 |
| BOB | Bolivianos, Bolivian Currency | |
| BVL | Bolsa de Valores de Lima or Lima Stock Exchange | |
| CAE | Chief Audit Executive | |
| CAF | Corporacion Andina de Fomento or Andean Development Corporation | |
| CCSI | Credicorp Capital Securities Inc. | |
| CDR | Resettable Certificate of Deposits | |
| CET1 | Common Equity Tier I | |
| CGU | Cash-Generating Unit | |
| CID | Corporate and International Division | |
| CIMA | Cayman Islands Monetary Authority | |
| CLP | Chilean peso | |
| CMF | Comision del Mercado Financiero or Financial Markets Commission | |
| CODM | Chief Operating Decision Maker | |
| COFIDE | Corporacion Financiera de Desarrollo S.A. or Peruvian government-owned development bank | |
| CONFIEP | Confederacion Nacional de Instituciones Empresariales Privadas or National Confederation of Private Business Institutions in Peru | |
| Congress | Congress of the Republic of Peru | |
| COO | Chief Operating Officer | |
| COP | Colombian peso | |
| COSO | Committee of Sponsoring Organizations of the Treadway Commission | |
| CPS | Comisión de Protección Social or Social Protection Committee | |
| Credicorp Capital | Credicorp Capital Ltd., formerly Credicorp Investments Ltd. | |
| Credicorp Capital Bolsa | Credicorp Capital Sociedad Agente de Bolsa S.A., formerly Credibolsa S.A. | |
| Credicorp Capital Chile | Credicorp Capital Chile S.A., operating subsidiary of Credicorp Capital Holding Chile | |
| Credicorp Capital Colombia | Credicorp Capital Colombia S.A., formerly Correval S.A. | |
| Credicorp Capital Fondos | Credicorp Capital Sociedad Administradora de Fondos S.A., formerly Credifondos S.A. | |
| Credicorp Capital Holding Chile | Credicorp Capital Holding Chile S.A., holding subsidiary of Credicorp Capital Ltd. | |
| Credicorp Capital Holding Colombia | Credicorp Capital Holding Colombia S.A.S., holding subsidiary of Credicorp Capital Ltd. | |
| Credicorp Capital Holding Peru | Credicorp Capital Holding Peru S.A., holding subsidiary of Credicorp Capital Ltd. | |
| Credicorp Capital Peru | Credicorp Capital Peru S.A.A., operating subsidiary of Credicorp Capital Holding Peru, and formerly BCP Capital S.A.A. |
| 5 |
| Credicorp Capital Servicios Financieros | Credicorp Capital Servicios Financieros S.A., formerly BCP Capital Financial Services S.A. | |
| Credicorp Capital Titulizadora | Credicorp Capital Sociedad Titulizadora S.A., formerly Credititulos S.A. | |
| CRM | Customer Relationship Management | |
| CRS | Common Reporting Standards | |
| CTS | Severance indemnity deposits | |
| D&S | Disability and Survivorship | |
| DCM | Debt Capital Markets | |
| DTA | Deferred Tax Assets | |
| DTL | Deferred Tax Liabilities | |
| ECM | Equity Capital Management | |
| Edpyme | Empresas de Desarrollo de Pequeña y Microempresa or Small and Micro Firm Development Institutions | |
| Edyficar | Empresa Financiera Edyficar S.A. | |
| ENEL | Enel Distribucion Peru S.A.A. | |
| EPS | Entidad Prestadora de Salud or Health Care Facility | |
| FARC | Fuerzas Armadas Revolucionarias Colombianas or Revolutionary Armed Forces of Colombia | |
| FC | Foreign Currency | |
| FCG | Financial Consolidated Group | |
| FED | Federal Reserve System - US | |
| FELABAN | Federation of Latin American Banks | |
| FFIEC | Federal Financial Institutions Examination Council | |
| FI | Financial Institutions | |
| FIBA | Florida International Bankers Associations | |
| FINRA | Financial Industry Regulatory Authority - US | |
| FMV | Fair market value | |
| FSGC | Financial Services Guidance Committee | |
| FTA | Free Trade Agreement | |
| FuMs | Funds under Management | |
| Fund | Deposit Insuance Fund | |
| FX | Foreign exchange | |
| GAAP | Generally Accepted Accounting Principles | |
| GDP | Gross Domestic Product | |
| IASB | International Accounting Standards Board |
| 6 |
| IBNR | Incurred but not reported | |
| ICBSA | Inversiones Credicorp Bolivia S.A. | |
| IFC | International Finance Corporation | |
| IFRS | International Financial Reporting Standards | |
| IGA | Intergovernmental Agreements | |
| IGBVL | Indice General de la Bolsa de Valores de Lima or General Index of the Lima Stock Exchange | |
| IGV | Impuesto General a las Ventas or Value Added Tax | |
| IIA | Institute for Internal Auditing | |
| ILCR | Internal liquidity coverage ratio | |
| IMF | International Monetary Fund | |
| Inversiones IMT | Inversiones IMT S.A., currently eliminated, and replaced as an operating subsidiary by Credicorp Capital Chile | |
| IPO | Initial Public Offering | |
| IPPF | International Framework for Professional Practice of Internal Auditing | |
| IRB | Internal Ratings-Based | |
| IRS | Internal Revenue Service | |
| ISACA | Information Systems Audit and Control Association | |
| IT | Information Technology | |
| KRI | Key Risk Indicators | |
| LC | Local Currency | |
| LCR | Liquidity Coverage Ratio | |
| LIBOR | London InterBank Offered Rate | |
| LTV | Loan to Value | |
| LTV | Loan to Value | |
| M&A | Mergers and Acquisitions | |
| MALI | Museo de Arte de Lima or Lima's Fine Arts Museum | |
| MEF | Ministry of Economics and Finance | |
| Mibanco | Mibanco, Banco de la Microempresa S.A. | |
| MILA | Mercado Integrado Latinoamericano or Integrated Latin American Market -among Chile, Colombia and Peru | |
| MMD | Middle-Market Division | |
| MOU | Memorandum of undestanding | |
| MRTA | Movimiento Revolucionario Tupac Amaru or Tupac Amaru Revolutionary Movement | |
| NIM | Net Interest Margin | |
| NIST | National Institute of Standards and Technology |
| 7 |
| NPL | Non-performing loans | |
| NYSE | New York Stock Exchange | |
| OCI | Other Comprehensive Income | |
| OECD | Organization for Economic Cooperation and Development | |
| OPA | Oferta Publica de Adquisicion or Public Tender Offer | |
| P&C | Property and casualty (P&C) | |
| PEN | Peruvian Sol | |
| PPS | El Pacifico Peruano Suiza Compañia de Seguros y Reaseguros | |
| RB&WM | Retail Banking & Wealth Management Group | |
| REDESUR | Red Electrica del Sur S.A. | |
| REJA | Special Regime for Early Retirement | |
| ROAA | Return on Average Assets | |
| ROAE | Return on Average Equity | |
| ROE | Return on equity | |
| RWA | Risk-Weighted Assets | |
| S&P | Standard and Poor's | |
| SAM | Standardized Approach Method | |
| SARs | Stock Appreciation Rights | |
| SBP | Superintendencia de Bancos de Panama | |
| SBS | Superintendencia de Banca, Seguros y Administradoras Privadas de Fondos de Pensiones or Superintendency of Banks, Insurance and Pension Funds - Peru | |
| SCTR | Seguro Complementario de Trabajo de Riesgo or Complementary Work Risk Insurance | |
| SEC | U.S. Securities and Exchange Commission | |
| SFC | Superintendencia Financiera de Colombia or Superintendency of Securities and Insurance | |
| SME | Small and medium enterprise | |
| SME - Pyme | Small and medium enterprise – Pequeña y microempresa or Small and micro enterprise | |
| SMV | Superintendencia del Mercado de Valores or Superintendence of the Securities Market - Peru | |
| SMVP | Superintendencia de Mercado de Valores de Panama | |
| Solucion EAH | Solucion Empresa Administradora Hipotecaria | |
| SPP | Sistema Privado de Pensiones or Private Pension System | |
| SUNAT | Superintendencia Nacional de Aduanas y de Administracion Tributaria or Superintendence of Tax Administration - Peru | |
| TAG | Consultancy boutique for Microsoft | |
| TOSE | Total Liabilities Subject to Reserve Requirements |
| 8 |
| TPP | Trans-pacific Parternship | |
| UAI | Internal Audit Unit | |
| VaR | Value at Risk | |
| VAT | Value-added tax | |
| VRAEM | Valley of Rivers, Apurimac, Ene and Mantaro | |
| WBG | Wholesale Banking Group |
| 9 |
PRESENTATION OF FINANCIAL INFORMATION
Credicorp Ltd. is a Bermuda limited liability company (and is referred to in this Annual Report as Credicorp, the Company, the Group, we, or us, and means either Credicorp as a separate entity or as an entity together with our consolidated subsidiaries, as the context may require). We maintain our financial books and records in Peruvian Soles and present our financial statements in accordance with International Financial Reporting Standards (IFRS), as issued by the International Accounting Standards Board (IASB). IFRS differ in certain respects from Accounting Principles Generally Accepted in the United States (U.S. GAAP).
We operate primarily through our four operating segments: banking, investment banking, insurance, and pension funds. See information about operating segments in “Item 4.-Information on the Company: (A) History and Development of the Company, and (B) Business Overview”.
Our six principal operating subsidiaries are: (i) Banco de Credito del Peru (which, together with its consolidated subsidiaries, is referred to as BCP Consolidated or just BCP); (ii) Atlantic Security Bank, which we hold through Atlantic Security Holding Corporation (which are referred to as ASB and ASHC, respectively); (iii) Pacífico Compañía de Seguros y Reaseguros (“PPS”, which together with its consolidated subsidiaries, is referred to as Grupo Pacifico); (iv) Prima AFP; (v) Credicorp Capital Ltd. (“Credicorp Capital”, which consolidates the companies of our investment banking platform); and (vi) Banco de Credito de Bolivia, which we hold through Inversiones Credicorp Bolivia S.A. (“ICBSA”). As of and for the year ended December 31, 2017, BCP contributed with 81.9% of our total assets, 71.8% of our net income and 70.8% of our net equity attributable to Credicorp’s equity holders 1 . Unless otherwise specified, the individual financial information for BCP Stand-alone, ASB, Grupo Pacifico, Prima AFP and Credicorp Capital included in this Annual Report is presented in accordance with IFRS and before eliminations for consolidation purposes. See “Item 3. Key Information – 3.A Selected Financial Data” and “Item 4. Information on the Company - 4.A History and Development of the Company.” We refer to BCP Stand-alone, ASB, Grupo Pacifico, Banco de Credito de Bolivia, Prima AFP and Credicorp Capital as our main operating subsidiaries, and we refer to Grupo Credito S.A. (“Grupo Credito”) and ASHC as our two main holding subsidiaries.
“Item 3. Key Information - 3.A Selected Financial Data” contains key information related to our performance. This information was obtained mainly from our Consolidated Financial Statements as of December 31, 2013, 2014, 2015, 2016 and 2017.
1 For the purposes of this document, equity holder refers to a shareholder
| 10 |
Unless otherwise specified or the context otherwise requires, references in this Annual Report to “S/”, “Sol”, “local currency” or “Soles” are to Peruvian Soles (each Sol is divided into 100 centimos (cents)), and references to “$”, “US$,” “Dollars,” “foreign currency” or “U.S. Dollars” are to United States Dollars.
In light of changes in the Peruvian economy and Credicorp’s operations in Peru, the Board of Directors of Credicorp determined, in its session held on January 22, 2014, that from and after January 1, 2014 the Peruvian Sol would be the functional currency and the currency in which Credicorp’s financial statements would be presented. This decision was made in accordance with the International Financial Reporting Standards (“IFRS”), and specifically IAS 21, based on an analysis performed by Credicorp’s management, which revealed that the Sol has become since 2014 the most relevant currency for Credicorp’s subsidiaries in Peru, and specifically for Credicorp’s main subsidiary, Banco de Credito del Peru. This decision does not change the currency (U.S. Dollar) in which the nominal value of Credicorp’s shares is denominated. In accordance with Credicorp’s Bye-laws, these values remain in U.S. Dollars, the currency in which Credicorp’s stock is listed on the New York Stock Exchange (the “NYSE”) and on the Lima Stock Exchange (BVL by its Spanish initials). For this Annual Report, we have restated in Soles the financial information presented for years prior to 2014. The methodology used for the restatement is in accordance with the IFRS and specifically IAS 21 "The Effects of Changes in Foreign Exchange Rates". The methodology applied is explained in “Item 4. Information on the Company - 4.B Business overview - (10) Selected Statistical Information”.
Some of our subsidiaries, namely ASB; Credicorp Capital Securities Inc. (“CSI”); and Credicorp Capital Asset Management (subsidiaries of Credicorp Capital), maintain their operations and balances in U.S. Dollars and other currencies. As a result, in certain instances throughout this Annual Report, we have translated U.S. Dollars and other currencies to Soles. You should not construe any of these translations as representations that the U.S. Dollar amounts actually represent such equivalent Sol amounts or that such U.S. Dollar amounts could be converted into Soles at the rate indicated, as of the dates mentioned herein, or at all. Unless otherwise indicated, these Sol amounts have been translated from U.S. Dollar amounts at an exchange rate of S/3.241 = US$1.00, which is the December 31, 2017 exchange rate set by the Peruvian Superintendent of Banks, Insurance and Pension Funds (SBS by its Spanish initials). Converting U.S. Dollars to Soles on a specified date (at the prevailing exchange rate on that date) may result in the presentation of Sol amounts that are different from the Sol amounts that would result by converting the same amount of U.S. Dollars on a different specified date (at the prevailing exchange rate on such date). Our Bolivian subsidiary operates in Bolivianos. For consolidation purposes, our Bolivian subsidiary’s financial statements are also presented in Soles. Our Colombian and Chilean subsidiaries, Credicorp Capital Holding Colombia S.A.S. (“Credicorp Capital Holding Colombia”) and Credicorp Capital Holding Chile S.A. (“Credicorp Capital Holding Chile”) operate in Colombian Pesos and Chilean Pesos, respectively, and their financial statements are also converted into Soles for consolidation purposes.
| 11 |
Our management’s criteria for translating foreign currency, for the purpose of preparing the Credicorp Consolidated Financial Statements, are described in “Item 5. Operating and Financial Review and Prospects- 5.A Operating Results—(1) Critical Accounting Policies – 1.3 Foreign Exchange”
| 12 |
CAUTIONARY STATEMENT WITH RESPECT TO FORWARD-LOOKING STATEMENTS
Certain statements contained in this Annual Report are not historical facts, including, without limitation, certain statements made in the sections entitled “Item 3. Key Information”, “Item 4. Information on the Company”, “Item 5. Operating and Financial Review and Prospects” and “Item 11. Quantitative and Qualitative Disclosures about Market Risk”, which are forward-looking statements within the meaning of Section 27A of the U.S. Securities Act of 1933 and Section 21E of the U.S. Securities Exchange Act of 1934 (or the Exchange Act). You can find many of these statements by looking for words such as “approximates”, “believes”, “expects”, “anticipates”, “estimates”, “intends”, “plans”, “would”, “may”, or other similar expressions. These forward-looking statements are based on our management’s current views and assumptions and involve known and unknown risks and uncertainties that could cause actual results, performance or events to differ materially from those expressed or implied in the forward-looking statements. Therefore, actual results, performance or events may be materially different from those in the forward-looking statements due to, without limitation:
| • | General economic conditions, including in particular economic conditions in Peru; |
| • | Performance of financial markets, including emerging markets; |
| • | The frequency and severity of insured loss events; |
| • | Interest rate levels; |
| • | Currency exchange rates, including the Sol/U.S. Dollar exchange rate; |
| • | Increasing levels of competition in Peru and other emerging markets; |
| • | Changes in laws and regulations; |
| • | Changes in the policies of central banks and/or foreign governments; |
| • | General competitive factors, in each case on a global, regional and/or national basis; |
| • | Effectiveness of our risk management policies; and |
| • | Losses associated with counterparty exposures. |
See “Item 3. Key Information - 3.D Risk Factors” and “Item 5. Operating and Financial Review and Prospects”.
We are not under any obligation to, and we expressly disclaim any obligation to, update or alter any forward-looking statements contained in this Annual Report whether as a result of new information, future events or otherwise.
| 13 |
ITEM 1. IDENTITY OF DIRECTORS, SENIOR MANAGEMENT AND ADVISERS
Not applicable
ITEM 2. OFFER STATISTICS AND EXPECTED TIMETABLE
Not applicable.
| 3. A | Selected financial data |
The following table presents a summary of our consolidated financial information at the dates and for the periods indicated. This selected financial data is presented in Soles. You should read this information in conjunction with, and qualify this information in its entirety by reference to, the Consolidated Financial Statements, which are also presented in Soles.
The summary of our consolidated financial data as of, and for the years ended, December 31, 2013, and 2014 was derived from the Consolidated Financial Statements audited by Paredes, Zaldivar, Burga & Asociados S.C.R.L, member firm of Ernst & Young Global (“EY Global”), independent registered public accountants. The consolidated financial data as of, and for the years ended, December 31, 2015, 2016, 2017 was derived from the Consolidated Financial Statements audited by Gaveglio, Aparicio y Asociados S.C.R.L, member firm of PricewaterhouseCoopers International Limited, independent registered public accountants.
The report of Gaveglio, Aparicio y Asociados S.C.R.L on the Consolidated Financial Statements as of December 31, 2016 and 2017 and for the years ended December 31, 2015, 2016 and 2017 appears elsewhere in this Annual Report.
| 14 |
SELECTED FINANCIAL DATA
| Year ended December 31, | ||||||||||||||||||||||||
| 2013 | 2014 | 2015 | 2016 | 2017 | 2017 | |||||||||||||||||||
| (Soles in thousands, except percentages, ratios, and per common share data) |
U.S.
Dollars in
thousands (1) |
|||||||||||||||||||||||
| INCOME STATEMENT DATA: | ||||||||||||||||||||||||
| IFRS: | ||||||||||||||||||||||||
| Interest income | 7,086,470 | 8,578,664 | 9,784,089 | 10,773,055 | 11,030,683 | 3,391,361 | ||||||||||||||||||
| Interest expenses | (2,052,913 | ) | (2,191,062 | ) | (2,527,133 | ) | (2,914,714 | ) | (2,959,196 | ) | (909,799 | ) | ||||||||||||
| Net Interest, income and expenses | 5,033,557 | 6,387,602 | 7,256,956 | 7,858,341 | 8,071,487 | 2,481,562 | ||||||||||||||||||
| Provision for loan losses, net of recoveries (2) | (1,230,371 | ) | (1,715,809 | ) | (1,880,898 | ) | (1,785,495 | ) | (1,789,165 | ) | (550,075 | ) | ||||||||||||
| Net interest, income after provision for loan losses | 3,803,186 | 4,671,793 | 5,376,058 | 6,072,846 | 6,282,322 | 1,931,487 | ||||||||||||||||||
| Commissions and fees | 2,259,927 | 2,521,829 | 2,644,191 | 2,771,561 | 2,911,408 | 895,106 | ||||||||||||||||||
| Net gains on sales of securities | 96,228 | 220,737 | 248,723 | 336,759 | 741,781 | 228,059 | ||||||||||||||||||
| Net gains on derivatives held for trading | (63,660 | ) | 22,202 | 207,938 | 44,500 | 103,580 | 31,845 | |||||||||||||||||
| Net gains from exchange difference | - | 172,095 | 46,563 | - | 17,394 | 5,348 | ||||||||||||||||||
| Net gains on financial assets designated at fair value through profit or loss | - | - | - | 51,667 | 67,633 | 20,794 | ||||||||||||||||||
| Net gains on foreign exchange transactions | 534,442 | 453,405 | 773,798 | 698,159 | 650,228 | 199,911 | ||||||||||||||||||
| Net premiums earned | 2,142,777 | 2,189,666 | 1,733,978 | 1,799,115 | 1,808,340 | 555,970 | ||||||||||||||||||
| Other income | 441,193 | 639,572 | 325,666 | 344,460 | 396,683 | 121,959 | ||||||||||||||||||
| Net claims incurred for life, general and health insurance contracts | (1,460,461 | ) | (1,426,733 | ) | (1,031,659 | ) | (1,098,905 | ) | (1,118,304 | ) | (343,820 | ) | ||||||||||||
| Others expenses (3) | (5,420,912 | ) | (6,075,096 | ) | (5,964,664 | ) | (6,128,734 | ) | (6,286,131 | ) | (1,932,657 | ) | ||||||||||||
| Profit before income tax | 2,332,720 | 3,389,470 | 4,360,592 | 4,891,428 | 5,574,934 | 1,714,002 | ||||||||||||||||||
| Income tax | (775,177 | ) | (968,224 | ) | (1,197,207 | ) | (1,281,448 | ) | (1,393,286 | ) | (428,363 | ) | ||||||||||||
| Net profit | 1,557,543 | 2,421,246 | 3,163,385 | 3,609,980 | 4,181, 648 | 1,285,639 | ||||||||||||||||||
| Attributable to: | ||||||||||||||||||||||||
| Credicorp’s equity holders | 1,538,307 | 2,387,852 | 3,092,303 | 3,514,582 | 4,091,753 | 1,258,001 | ||||||||||||||||||
| Non-controlling interest | 19,236 | 33,394 | 71,082 | 95,398 | 89,895 | 27,638 | ||||||||||||||||||
| Number of shares as adjusted to reflect changes in capital | ||||||||||||||||||||||||
| Net income per common share attributable to Credicorp’s equity holders (4) | 19.35 | 30.04 | 38.91 | 44.23 | 51.49 | 15.83 | ||||||||||||||||||
| Diluted net income per share | 19.31 | 29.97 | 38.84 | 44.15 | 51.35 | 15.79 | ||||||||||||||||||
| Cash dividends declared and paid per common share U.S Dollar (5) | 1.90 | - | - | - | - | - | ||||||||||||||||||
| Cash dividends declared per common share Soles (5) | - | 6.7700 | 8.1910 | 12.2865 | 14.1726 | - | ||||||||||||||||||
| Additional cash dividends declared per common share Soles (5) | 15.7000 | |||||||||||||||||||||||
| BALANCE SHEET DATA: | ||||||||||||||||||||||||
| IFRS: | ||||||||||||||||||||||||
| Total assets | 114,094,220 | 134,834,372 | 155,480,217 | 156,435,222 | 170,472,283 | 52,598,668 | ||||||||||||||||||
| Total loans (6) | 64,361,927 | 79,509,360 | 90,328,499 | 94,768,901 | 100,477,775 | 31,002,090 | ||||||||||||||||||
| Allowance for loan losses (2) | (2,385,958 | ) | (3,102,096 | ) | (4,032,219 | ) | (4,416,692 | ) | (4,943,008 | ) | (1,525,149 | ) | ||||||||||||
| Total deposits(7) | 68,182,519 | 76,783,964 | 88,307,962 | 85,583,120 | 96,717,674 | 29,841,923 | ||||||||||||||||||
| Equity attributable to Credicorp’s equity holders | 11,831,511 | 13,979,455 | 16,128,016 | 19,656,135 | 21,756,567 | 6,712,918 | ||||||||||||||||||
| Non-controlling interest | 511,594 | 646,570 | 599,554 | 460,376 | 497,136 | 153,390 | ||||||||||||||||||
| Total equity | 12,343,105 | 14,626,025 | 16,727,570 | 20,116,511 | 22,253,703 | 6,866,308 | ||||||||||||||||||
| 15 |
| 2013 | 2014 | 2015 | 2016 | 2017 | ||||||||||||||||
| (Soles in thousands, except percentages, ratios, and per common share data) | ||||||||||||||||||||
| SELECTED RATIOS | ||||||||||||||||||||
| IFRS: | ||||||||||||||||||||
| Net interest margin – NIM (8) | 5.07 | % | 5.65 | % | 5. 45 | % | 5.46 | % | 5.33 | % | ||||||||||
| Return on average total assets - ROAA(9) | 1.41 | % | 1.92 | % | 2.13 | % | 2.25 | % | 2.50 | % | ||||||||||
| Return on average equity -ROAE (10) | 13.70 | % | 18.50 | % | 20.54 | % | 19.64 | % | 19.76 | % | ||||||||||
| Operating expenses as a percentage of net interest and non-interest income (11) | 46.16 | % | 46.15 | % | 43.52 | % | 43.27 | % | 43.98 | % | ||||||||||
| Operating expenses as a percentage of average assets (12) | 4.25 | % | 4.32 | % | 3.76 | % | 3.64 | % | 3.62 | % | ||||||||||
| Equity attributable to Credicorp’s equity holders as a percentage of period end total assets | 10.37 | % | 10.37 | % | 10.37 | % | 12.57 | % | 12.76 | % | ||||||||||
| Regulatory capital as a percentage of risk weighted assets – BIS ratio (13) | 15.05 | % | 14.99 | % | 15.95 | % | 16.33 | % | 15.92 | % | ||||||||||
| Total internal overdue loan amounts as a percentage of total loans (14) | 2.23 | % | 2.53 | % | 2.56 | % | 2.77 | % | 3.01 | % | ||||||||||
| Allowance for direct loan losses as a percentage of total loans | 3.52 | % | 3.76 | % | 4.25 | % | 4.44 | % | 4.48 | % | ||||||||||
| Allowance for loan losses as a percentage of total loans and other off-balance-sheet items (15) | 3.08 | % | 3.20 | % | 3.69 | % | 3.85 | % | 4.12 | % | ||||||||||
| Allowance for direct loan losses as a percentage of total internal overdue loans (16) | 157.50 | % | 148.65 | % | 166.16 | % | 160.55 | % | 148.98 | % | ||||||||||
| Allowance for direct loan losses as a percentage of impaired loans (17) | 102.44 | % | 99.22 | % | 105.35 | % | 99.90 | % | 98.36 | % | ||||||||||
In this document the total internal overdue includes internal overdue loans and under legal collection loans.
| (1) | The exchange rate used was 3.241 for balance sheet (end of year) and 3.252583 for Profit and Losses (average of the year). The latter includes more decimals looking for as accurate as possible figures in the Profit and Losses statement. |
| (2) | Provision for loan losses and allowance for loan losses include provisions and reserves with respect to total loans and off-balance sheet items such as letters of credit, performance bonds and stand-by letters. The figure in the Income Statement is net of write-off and recoveries. |
| (3) | The other expenses include loss on foreign exchange transactions (S/309.4 million in 2013 and S/60.6 million in 2016) and loss on financial assets designated at fair value through profit or loss (S/18.1 million in 2013, S/4.1 million in 2014 and S/33.5 million in 2015), |
| (4) | As of December 31, 2017, we had 94.4 million common shares issued and outstanding. Of this amount, 14.6 million were held by ASHC and 0.3 million are maintained for the share-based compensation plan, and are therefore considered treasury shares. The per-common-share data given considers net outstanding shares (total outstanding common shares net of treasury shares) of 79.5 million. See Notes 17 and 28 to the Consolidated Financial Statements. |
| (5) | Dividends based on net income attained for the financial years 2013 were declared and paid in U.S. Dollar. Dividends based on net income attained for the financial years 2014 and 2015 were declared in Soles and paid in U.S. Dollar after converting the Soles amount using the weighted exchange rate of PEN/US$ registered by the SBS for the transactions at the close of business on the declaration date. Dividends based on net income attained for the financial years 2016 and 2017 were declared in Soles and we will be paid in U.S. Dollar on May 12, 2017 and May 11, 2018, respectively, using the weighted exchange rate registered by the SBS for the transactions at the close of business on May 10, 2017 and May 09, 2018, respectively. . In October 2017, the Board of Director agreed to pay an additional dividend, which were declared in Soles and we will be paid in U.S. Dollar on November 24, 2017, using the weighted exchange rate registered by the SBS for the transactions at the close of business on November 22, 2017. |
| (6) | Total loans refer to direct loans plus accrued interest minus unearned interest. In our Consolidated Financial Statements, “loans, net of unearned income” refers to direct loans plus accrued interest minus unearned interest. See Note 7 to the Consolidated Financial Statements. In addition to loans outstanding, we had off-balance-sheet items, including those mentioned in Note (2) that amounted to S/13,036.7 million, S/17,319.5 million, S/19,004.7 million, S/19,832.0 million and S/19,369.6 million, as of December 31, 2013, 2014, 2015, 2016 and 2017, respectively. See Note 20 to the Consolidated Financial Statements. |
| (7) | Accrued interests are not included in Total deposits. |
| (8) | Net interest income as a percentage of average interest-earning assets, computed as the average of period-beginning and period-ending balances. |
| (9) | Net income attributable to Credicorp’s equity holders as a percentage of average total assets, computed as the average of period-beginning and period-ending balances. |
| (10) | Net income attributable to Credicorp’s equity holders as a percentage of average equity attributable to our equity holders, computed as the average of period-beginning and period-ending balances. |
| (11) | Sum of the salaries and employee´s benefits, administrative expenses, depreciation and amortization, acquisition cost, all as percentage of the sum of net interest income, commissions and fees, net gain on foreign exchange transactions, net gain from associates and net premiums earned. Acquisition cost includes net fees, underwriting expenses and underwriting income. |
| (12) | Sum of the salaries and employee´s benefits, administrative expenses, depreciation and amortization, acquisition cost, all as percentage of average assets. |
| (13) | Regulatory capital calculated in accordance with guidelines by the Basel Committee on Banking Regulations and Supervisory Practices of International Settlements (or the BIS II Accord) as adopted by the SBS. See “Item 5. Operating and Financial Review and Prospects – 5.B Liquidity and Capital Resources - (1) Capital Adequacy Requirements for Credicorp.” |
| (14) | Depending on the type of loan, BCP and Mibanco consider internal overdue loans for corporate, large business and medium business loans after 15 days; for overdrafts, small and micro business loans after 30 days; and for consumer, mortgage and leasing loans the past-due installments are considered overdue after 30 to 90 days. After 90 days, the outstanding balance of the loan is considered internal overdue. ASB considers internal overdue loans all overdue loans except for consumer loans, which are considered internal overdue loans when the scheduled principal and/or interest payments are overdue for more than 90 days. BCP Bolivia considers loans as internal overdue after 30 days. |
| (15) | Other off-balance-sheet items primarily consist of Stand-by letters, Letters of Credit and Performance Bonds. See Note 20 to the Consolidated Financial Statements. |
| (16) | Allowance for direct loan losses, as a percentage of all internal overdue loans without for collateral securing such loans. |
| (17) | Allowance for direct loan losses as a percentage of loans classified in categories C, D and E. See “Item 4. Information on the Company - 4.B Business Overview - (10) Selected Statistical Information - 10.3 Loan Portfolio - 10.3.7 Classification of the Loan Portfolio. |
| 16 |
| 3. B | Capitalization and Indebtedness |
Not applicable.
| 3. C | Reasons for the Offer and Use of Proceeds |
Not applicable.
| 3. D | Risk Factors |
Our businesses are affected by many external and other factors in the markets in which we operate. Different risk factors can impact our businesses, our ability to operate effectively and our business strategies. You should consider the risk factors carefully and read them in conjunction with all the information in this document. You should note that the risk factors described below are not the only risks to consider. Rather, these are the risks that we currently consider material. There may be additional risks that we consider immaterial or of which we are unaware, and any of these risks could have similar effects to those set forth below.
(1) Our geographic location exposes us to risk related to Peruvian political, social and economic conditions
Most operations of BCP, Grupo Pacifico, Prima AFP, and a significant part of Credicorp Capital’s operations are located in Peru. In addition, while ASB is based outside of Peru, most of its customers are located in Peru. Therefore, our results are affected by economic activity in Peru. Changes in economic conditions, both international and domestic, or government policies can alter the financial health and normal development of our business. The changes may include, but are not limited to, high inflation, currency depreciation, confiscation of private property and financial regulation. Similarly, terrorist activity, political and social unrest, and possible natural disasters (i.e. earthquakes, flooding, etc.) can adversely impact our operations.
| 17 |
Peru has a long history of political instability that includes military coups and a succession of regimes that featured heavy government intervention in the economy. In 1990, Alberto Fujimori took office as president in the middle of hyperinflation (7,649.7% in 1990) and insecurity due to terrorist activities. Market-based reforms and the gradual success of the authorities in capturing terrorist leaders allowed the country to stabilize, and by 1995 Fujimori was re-elected. The administration was accused of authoritarian behavior, especially after closing Peru’s Congress in 1992 and crafting a new constitution. The Fujimori administration also faced several corruption charges. Shortly after starting a controversial third term, Fujimori resigned the presidency and a transitional government led by Valentin Paniagua called for elections to be held in April 2001. After spending several years in Japan, Fujimori was brought back to Peru and was sentenced in 2009 to 25 years in prison for human rights violations. The governments that have been elected since 2001 are those of Alejandro Toledo, from 2001 to 2006; Alan Garcia, from 2006 to 2011; Ollanta Humala from 2011 to 2016; and Pedro Pablo Kuczynski, whose term began in 2016 (as described below) and was to end in 2021. These administrations, despite their different policy priorities, have each been characterized by political fragmentation (more than ten different political organizations have nominated candidates for President in each of the four elections since 2001) and low popularity (usually around 20% - 30% approval ratings). Each of these administrations has also shared mostly cordial relationships with neighboring countries.
Humala’s presidency ended on July 28, 2016. The first round of presidential elections was held on April 10, 2016. A second round between candidates Ms. Keiko Fujimori and Mr. Pedro Pablo Kuczynski was necessary as none of the candidates obtained more than 50% of the valid votes. The second round was held on June 5, 2016, and Pedro Pablo Kuczynski was elected president for the 2016-2021 term with 50.12% of the vote. Kuczynski’s presidential period started in July 28, 2016, with high economic expectations due to the highly skilled technical team that backed him and the government. However, the Lava-Jato case that started in Brazil has put on hold on-going infrastructure projects in Peru that started during the last two governments 2 . Moreover, in midst of the Lava-Jato case investigations, in December 2017 a Presidential Vacancy motion was proposed by Congress. The vote did not succeed because only 79 of 87 votes required were obtained. Furthermore, in March 2018, a second Presidential Vacancy motion was presented by Congress. On March 21 ST 2018 Pedro Pablo Kuczynski presented his resignation as President to Congress amid high political turmoil. His resignation was accepted on March 22. On March 23 Martin Vizcarra (Kuczynski’s former first vice-president) assumed as President, as provided in the Constitution. While the three major international credit rating agencies (Moody’s, S&P and Fitch) remarked that general macroeconomic policies are not expected to change under the new government, any disruption of large-scale projects and a high degree of political uncertainty could affect Peru’s GDP and deteriorate the financial situation of some of Credicorp’s clients.
2 In December 2016 the United States Department of Justice revealed that Odebrecht, the largest Brazilian construction company, had secured around 100 projects in 12 countries (including Peru, Colombia, Ecuador, Panama, Dominican Republic, etc.) using bribery and corruption. Since early 2017 Peruvian prosecutors have investigated the case which allegedly implicated former and current local authorities.
| 18 |
Notwithstanding, during the past 17 years Peru has experienced a period of relative economic and political stability, especially compared to the period between 1980 and 2000. This stability has been reflected in Peru’s average growth rate of 5.1% for GDP and 5.5% for Domestic Demand (2001-2017); four consecutive democratic transitions; a relatively consistent free-market approach to economic policy; and growth in GDP per capita, which reached US$6,598 in 2017 (equivalent to S/ 21,386 at an exchange rate of S/ 3.241), according to the International Monetary Fund (IMF). Nevertheless, political risk is present in any Peruvian presidential election because it is possible that a radical candidate with more interventionist economic policies could prevail. Ollanta Humala was elected in 2011 on a far-left policy platform, which was cast aside after he assumed office. Moreover, in the 2016 first round Presidential Elections, candidate Veronika Mendoza, also with a leftist policy platform, came in third place amid promises of curbs on mining projects and renegotiating gas export contracts. Hence, there is a sizeable portion of the electorate still demanding an economy that is more reliant on public spending. Therefore, there remains a risk of significant political and economic change.
Peru also has a history of domestic terrorism. Between the late 1970s and the early 1990s, both Shining Path (Sendero Luminoso in Spanish) and Movimiento Revolucionario Tupac Amaru (“MRTA”) conducted a series of terrorist attacks that caused thousands of casualties and affected normal political, economic and social activities in many parts of the country, including Lima, the capital of Peru. In 1992, the leader of Shining Path, Abimael Guzman, was captured and later sentenced to life in prison (a new trial affirmed the sentence in 2006). By the end of the 1990s, most other members of Shining Path, as well as MRTA, were also captured and sentenced to prison terms. However, in late 1996 a group of MRTA members stormed the residence of Japan’s Ambassador to Peru and held a group of politicians, diplomats and public figures hostage for approximately four months. In April 1997, a military operation put an end to the hostage situation. All 14 terrorists died in the confrontation, while all but one hostage survived. Since then, and for the following 20 years, terrorist activity in Peru has been mostly confined to small-scale operations in the Huallaga Valley and the VRAEM (Valleys of Rivers Apurimac, Ene and Mantaro) areas, both in the Eastern part of the country. In 2012, the Peruvian government captured Florindo Flores, one of the last remaining leaders of Shining Path, which substantially weakened the organization’s activities in the Huallaga Valley.
Despite these efforts, terrorist activity and the illegal drug trade continue to be significant challenges for Peruvian authorities. The Huallaga Valley and VRAEM constitute the largest areas of coca cultivation in the country and thus serve as a hub for the illegal drug trade. Any violence derived from the drug trade or a resumption of large-scale terrorist activities could hurt our operations.
After serving 25 years in prison due to terrorist activity, a total of seven members from Shining Path and two from MRTA were released in 2017.
| 19 |
Another source of risk is related to political and social unrest in areas where mining, oil and gas operations take place. In recent years, Peru has experienced protests against mining projects in several regions around the country. Mining is an important part of the Peruvian economy. In 2017 it represented approximately 10% of Peru’s GDP and approximately 60% of the country’s exports, while oil and gas represented 2% of Peru’s GDP and 7% of Peru’s exports according to the Peruvian Central Bank (BCRP by its Spanish initials). On several occasions, local communities have opposed these operations and accused them of polluting the environment and hurting agricultural and other traditional economic activities. In late 2011 and throughout 2012, social and political tension peaked around Conga, a gold mining project in the northern region of Cajamarca. The launch of Conga, which involved investments of approximately US$4.5 billion, failed because of the protests. Peru’s government commissioned an Environmental Impact Study developed by international experts which introduced recommendations for the project.
Delays or cancellations of mining projects could reduce economic growth and business confidence, thereby hurting the financial system both directly (many mining projects are at least partially financed by local financial institutions) and indirectly (overall economic activity could decelerate).
(2) It may be difficult to serve process on or enforce judgments against us or our principals residing outside of the United States
A significant majority of our directors and officers live outside the United States (principally in Peru). Most of our assets and those of our principal subsidiaries are located outside the United States. As a result, it may not be possible for investors to effect service of process within the United States upon us or our principals to initiate a civil suit under the United States securities laws in United States courts. We have also been advised by our Peruvian counsel that liability under the United States federal securities laws may not be enforceable in original actions in Peruvian courts. In addition, judgments of United States courts obtained in actions under the United States federal securities laws may not be enforceable. Similarly, our Bermuda counsel have advised us that courts in Bermuda may not enforce judgments obtained in other jurisdictions, or entertain actions in Bermuda, against us or our directors or officers under the securities laws of those jurisdictions.
In addition, our Bye-laws contain a broad waiver by our shareholders of any claim or right of action, both individually and on our behalf, against any of our officers or directors. This waiver limits the rights of shareholders to assert claims against our officers and directors for any action taken by an officer or director. It also limits the rights of shareholders to assert claims against officers for the failure of an officer or director to take any action in the performance of his or her duties, except with respect to any matter involving willful negligence, willful default, fraud or dishonesty on the part of the officer or director.
| 20 |
(3) Our ability to pay dividends to shareholders and to pay corporate expenses may be adversely affected by the ability of our subsidiaries to pay dividends to us
As a holding company, our ability to make dividend payments, if any, and to pay corporate expenses will depend upon the receipt of dividends and other distributions from our operating subsidiaries. Our principal operating subsidiaries are BCP, BCP Bolivia, Grupo Pacifico, ASB, Prima AFP and Credicorp Capital. Subject to certain reserve and capital adequacy requirements under applicable regulations, we are able to cause our subsidiaries to declare dividends. If our subsidiaries do not have funds available, or are otherwise restricted from paying us dividends, we may be limited in our ability to pay dividends to shareholders. Currently, despite the minimum capital requirements, there are no restrictions on the ability of BCP, BCP Bolivia, Grupo Pacifico, ASB, Prima AFP or Credicorp Capital to pay dividends abroad. In addition, our right to participate in the distribution of assets of any subsidiary, upon any subsidiary’s liquidation or reorganization (and thus the ability of holders of our securities to benefit indirectly from such distribution), is subject to the prior claims of creditors of that subsidiary, except where we are considered an unsubordinated creditor of the subsidiary. Accordingly, our securities will effectively be subordinated to all existing and future liabilities of our subsidiaries, and holders of our securities should look only to our assets for payments.
In addition, the value of any dividend paid by our operating subsidiaries that declare dividends in a currency different from Credicorp’s dividends (e.g. ASB, BCP Bolivia, Credicorp Capital Holding Chile, and Credicorp Capital Holding Colombia) is subject to the impact of the depreciation of the dividend’s currency against Credicorp’s functional currency. This would have a negative impact on our ability to pay dividends to shareholders. For further details about Credicorp’s Dividend Policy refer to Item 8. Financial Information – 8.A Consolidated Statements and Other Financial Information – (3) Dividend Policy.
Since January 1, 2014, the functional currency of our financial statements has been the Sol; however, Credicorp’s subsidiaries generate revenues in Soles, U.S. Dollars, Bolivian Pesos, Colombian Pesos, and Chilean Pesos. Mainly in BCP, BCP Bolivia, ASB, Credicorp Capital Colombia and Credicorp Capital Chile are particularly exposed to foreign exchange fluctuations. As a result, the fluctuation of our functional currency against other currencies could have an adverse impact on our results. In addition, any exchange controls implemented in the countries in which we operate may adversely affect our financial condition and results of operations.
| 21 |
The Peruvian government does not impose restrictions on a company’s ability to transfer Soles, U.S. Dollars or other currencies from Peru to other countries, or to convert Peruvian currency into other currencies. Nevertheless, Peru has implemented restrictive exchange controls in its history, and the Peruvian government might in the future consider it necessary to implement restrictions on such transfers, payments or conversions. For further details see “Item 10. Additional Information- 10.D Exchange Controls”.
The interest income we earn on our interest-earning assets and the interest expense we pay on our interest-bearing liabilities, could be affected by changes in domestic and international market interest rates, which are sensitive to many factors beyond our control, including monetary policies and domestic and international economic and political conditions.
We have implemented several policies to manage the interest rate risk exposure and seek proactively to update the interest rate risk profile to minimize losses and optimize net revenues; however a sudden and/or significant volatility in market interest rates could have a material adverse effect on our financial condition and results of operations. For further detail see “Item 11. Quantitative and Qualitative Disclosures about Market Risk – (9) Sensitivity to Changes in Interest Rates
We also face foreign exchange risk on credit that we extend through our banking business, which is primarily conducted through BCP. To address this risk, BCP’s Foreign Exchange Credit Risk Management identifies borrowers that may not meet their debt obligations due to currency mismatches by performing a sensitivity analysis of the credit rating of companies and the debt-service capacity of individuals. Then, we classify borrowers according to their level of foreign exchange credit risk exposure. We closely monitor these clients and, on an ongoing basis, we revise our risk policies to underwrite loans as well as to manage our portfolio of foreign currency denominated loans; however, these policies may not sufficiently address our foreign exchange risk, resulting in adverse effects on our financial condition and results of operation.
We have taken steps to manage the gap between our foreign currency-denominated assets and liabilities in several ways, including closely matching their volumes and maturities. Nevertheless, a sudden and significant depreciation of the Sol could have a material adverse effect on our financial condition and results of operations. See “Item 11. Quantitative and Qualitative Disclosures about Market Risk - (10) Foreign Exchange Risk”.
| 22 |
(5) Regulatory changes and adoption of new international guidelines to sectors in which we operate could impact our earnings and adversely affect our operating performance
Because we are subject to regulation and supervision in Peru, Bolivia, Colombia, Chile, the Cayman Islands, the United States of America, and Panama, changes to the regulatory framework in any of these countries or changes in tax laws could adversely affect our business.
Banking
We are, most directly, subject to extensive supervision and regulation through the SBS’s Banking and Insurance System Law (Ley General del Sistema Financiero y del Sistema de Seguros y Orgánica de la Superintendencia de Banca y Seguros) and the Regulation of the Consolidated Supervision of Financial and Mixed Conglomerates (Reglamento para la Supervision Consolidada de los Conglomerados Financieros y Mixtos).
The SBS and the Peruvian Central Bank supervise and regulate BCP and Mibanco’s operations. Peru’s constitution and the SBS’s statutory charter grant the SBS the authority to oversee and control banks and other financial institutions, including pension funds and insurance companies. The SBS and the Peruvian Central Bank have general administrative responsibilities over BCP, including defining capital and reserve requirements. In past years, the Peruvian Central Bank has, on numerous occasions, changed the deposit reserve requirements applicable to Peruvian commercial banks as well as the rate of interest paid on deposit reserves and the amount of deposit reserves on which no interest is payable by the Peruvian Central Bank. Such changes in the supervision and regulation of BCP may adversely affect our results of operations and financial condition. See “Item 4. Information on the Company — 4.B Business Overview — (9) Supervision and Regulation — 9.2 BCP and Mibanco”. Furthermore, changes in regulation related to consumer protection made by these agencies may also affect our business.
The Superintendency of the Securities Market (Superintendencia del Mercado de Valores or SMV by its Spanish initials) also supervises some of our subsidiaries such as BCP, Credicorp Capital Sociedad Agente de Bolsa (Credicorp Capital Bolsa) and Credicorp Capital Sociedad Administradora de Fondos (Credicorp Capital Fondos).
In Colombia, we are subject to supervision and regulation through the Superintendency of Securities and Insurance (SFC - Superintendencia Financiera de Colombia) and the Colombian Stock Market Self-regulator (AMV - Autorregulador del Mercado de Valores de Colombia). In Chile, we are subject to supervision and regulation through the Commission of Financial Market from Chile (CMF - Comisión del Mercado Financiero). See “Item 4. Information on the Company — 4.B Business Overview — (9) Supervision and Regulation — 9.5 Credicorp Capital”.
| 23 |
Changes in U.S. laws or regulations applicable to our business, or the adoption of new regulations, such as under the Foreign Account Tax Compliance Act (FATCA) or the Dodd-Frank Wall Street Reform and Consumer Protection Act, may have an adverse effect on our financial performance and operations.
We are also regulated by the United States Federal Reserve System, which shares its regulatory responsibility with the State of Florida Department of Banking and Finance - Office of Financial Regulation, with respect to BCP’s Miami agency, and by the Securities and Exchange Commission (SEC) and the Financial Industry Regulatory Authority, Inc. (FINRA), with respect to Credicorp Capital Securities, a U.S. broker dealer.
Similarly, we are regulated by other governmental entities in other jurisdictions. In the Cayman Islands, we are subject to the supervision and regulation of the Cayman Islands Monetary Authority (CIMA). In Bolivia, we are subject to the supervision of the Financial System Supervisory Authority (ASFI by its Spanish initials) that has assumed all regulatory functions held previously by the Superintendency of Banks and Financial Entities and the Superintendency of Pensions, Securities and Insurance. Nonetheless, in 2010 the Insurance and Pensions sectors have come out of this regulation and have their own Supervision Authority: Pensions and Insurance Inspection and Control Authority (Autoridad de Fiscalización y Control de Pensiones y Seguros – APS)
Finally, in Panama, we are subject to the supervision of the Superintendency of Banks of Panama and the regulatory framework set forth in the Decree Law 9 of February 25, 1998. Changes in the supervision and regulation of our subsidiaries in other countries may adversely affect our results of operations and financial condition.
Taxation
For Peruvian Regulation see Item 10.Additional Information – 10.E. Taxation.
The Chilean Statutory Income Tax rate to resident legal entities is 25% under the attribution regime and 27% under the semi-integrated regime (25.5% for semi-integrated regime only for 2017).
| 24 |
On the other hand, foreign resident individuals or legal entities are subject to a 35% dividend withholding tax. This tax applies at the moment of the effective remittance of the dividend and the corporate income tax can be used as a credit. In case of non-treaty country resident shareholders, the corporate tax credit is limited to 65% of the corporate income tax associated to such dividend. Therefore, in this case, the total tax burden for foreign taxpayers, subject to a 35% tax rate, will be of 44.45%. Nonetheless, the “65% limit” does not apply to those investors domiciled or resident in a country with which Chile has a Double Taxation Treaty in force. Additionally, a transitory rule provides that this benefit will also be applicable to those investors who are residents of countries with which Chile has a Double Taxation Treaty subscribed and pending ratification, to the extent that the treaty was signed prior to January 1, 2017. This transitory rule would be in effect until 2019.
If the Chilean entity has chosen the attributed regime, the corporate tax will be fully creditable, regardless of the country of residence of the shareholder.
The Group chose the “Income Tax semi-integrated system”. The additional tax rate has not been changed.
The Colombian statutory income tax rate is 34% (33% as from 2018 and onwards). A temporary income surtax of 6% and 4% was introduced for fiscal year 2017 and 2018, respectively. This surtax will apply only from a tax base equal to or greater than 800,000,000 Colombian pesos, approximately US$268,096.
As of 2017 distribution of dividends to non-residents is subject to a 5 percent withholding tax, which will be increased to 35 percent if dividends are distributed out of previously untaxed earnings after the 5% percent withholding tax is assessed.
Profits earned up to December 31, 2016, are not subject to the 5 percent withholding tax on dividends, even though the distribution occurs from and after January 1, 2017.
For details on Income tax review by the Tax Authorities on the jurisdictions in which we operate, please refer to note 18 (d) of the consolidated financial statements.
Insurance
Our Property and Casualty (P&C) and Life insurance business is carried out by Pacifico Seguros y Reaseguros S.A., which is part of Grupo Pacifico. The insurance business is subject to regulation by the SBS. New legislation or regulations may adversely affect Grupo Pacifico’s ability to underwrite and price risks accurately, which in turn would affect underwriting results and business profitability. Grupo Pacifico is unable to predict whether and to what extent new laws and regulations that may affect its business will be adopted in the future.
| 25 |
On April 14, 2016, the Congress of the Republic of Peru (“Congress”) approved a law that modifies some aspects of the nation’s private pension system. The new law, which was promulgated on April 21, 2016, might continue to have a negative effect on part of Pacifico’s annuities business, which is composed of retirement and disability and survivorship. Retirement annuities, which represents approximately 1.9% of Pacifico’s total gross premiums earned in 2017, is the only line of business that has been affected by the change in regulation thus far.
Grupo Pacifico is also unable to predict the timing of the adoption of any new laws and the effects any such new laws or regulations may have on its operations, profitability and financial condition in future years. However, we still expect Peru to adopt new legislation in the coming years, similar to the measure enacted by the European Union through Solvency II, which sought to further reduce the insolvency risk faced by insurance companies by improving the regulation regarding the amount of capital that insurance companies in the European Union must hold.
Our operating performance and financial condition depend on Grupo Pacifico’s ability to underwrite and set premium rates accurately across a full spectrum of risks. In order to be profitable, Grupo Pacifico must generate sufficient premiums to offset losses, loss adjustment expenses and underwriting expenses.
To price premium rates accurately, Grupo Pacifico must:
| · | collect and analyze a substantial volume of data; |
| · | provide sufficient resources to its technical units; |
| · | develop, test and apply appropriate rating formulae; |
| · | closely monitor changes in trends in a timely fashion; and |
| · | predict both severity and frequency with reasonable accuracy. |
If Grupo Pacifico fails to assess the risks that it assumes accurately or does not accurately estimate its retention, it may fail to establish adequate premium rates. Failure to establish adequate premium rates could reduce income and have a material adverse effect on our operating results or financial condition. Moreover, there is inherent uncertainty in the process of establishing life insurance reserves and property and casualty (P&C) loss reserves. Reserves are estimates based on actuarial and statistical projections at a given point in time of what Grupo Pacifico ultimately expects to pay out on claims and the related costs of adjusting those claims, based on the facts and circumstances then known. Factors affecting these projections include, among others: (i) in the case of life insurance reserves, changes in mortality/longevity rates, interest rates, persistency rates and regulation; and (ii) in the case of P&C loss reserves, changes in medical costs, repair costs and regulation. Any negative effect on Grupo Pacifico could have a material adverse effect on our results of operations and financial condition.
| 26 |
Pension fund
Despite the fact that private pension fund administrators have always been closely regulated by the SBS, in 2012, the Peruvian government passed a Law to Reform the Private Pension System (SPP by its Spanish initials). The reform aimed to expand coverage for individuals (referred to as “affiliates”), create greater competition, and reduce administration fees in the SPP. The Law to Reform the SPP is being implemented in phases. See “Item 4. Information on the Company – 4.B. Business Overview – (9) Supervision and Regulation – 9.7 Prima AFP”.
(6) A deterioration in the quality of our loan portfolio may adversely affect our results of operations.
Given that a significant percentage of our income is related to lending activities, a significant deterioration of loan quality would have a material adverse effect on our business, financial condition and results of operations. We are subject to concentration default risks in our loan portfolio. Problems with one or more of our largest borrowers may adversely affect our financial condition and results of operations. While loan portfolio risk associated with lending to certain economic sectors or clients in certain market segments can be mitigated through adequate diversification, our pursuit of opportunities in which we can charge higher interest rates, and thereby increase revenue, may reduce diversification of our loan portfolio and expose us to greater credit risk.
In addition, loan concentration in commercial sectors is particularly salient in Peru and significant deterioration in such sectors may have a material adverse effect on our business, financial condition and results of operations. Our current strategy includes increasing our exposure to market segments with heightened credit risk, including middle-market and consumer segments, such as unsecured small companies and consumer loans and consumer mortgages, which have higher risk profiles as compared to loans to large corporate customers. Given the changing composition of our loan portfolio and possible adverse changes in the environment in which we operate, our future results may differ significantly from our past results.
| 27 |
(7) Our banking and capital market operations in neighboring countries expose us to risk related to political and economic conditions.
BCP Bolivia, Credicorp Capital Holding Colombia and Credicorp Capital Holding Chile expose us to risk related to Bolivian, Colombian and Chilean political and economic conditions, respectively. Most economies in Latin America and the Caribbean experienced low economic growth in 2017, due to: (i) weak global demand, (ii) a high political polarization, and (iii) sluggish investment. Significant changes to Bolivian, Colombian and Chilean political and economic conditions could have an adverse effect on our business, financial condition and results of operations.
Bolivia
In October 2014, Evo Morales was reelected as President of Bolivia for a third five year term. During this third term, the government is expected to continue the economic policies and reforms of the first two presidential terms of Mr. Morales, which concentrated on (i) redistribution programs through different bonus schemes, (ii) deepening the industrialization of strategic economic sectors, and (iii) closing Bolivia’s infrastructure gap. Given the government’s high dependence on income from exports of natural gas to Brazil and Argentina, declines in the price of the gas exported (which is linked to the price of oil) could strain government finances and reduce its ability to continue the high levels of public spending of the last several years.
In February 2016, the government called up for a referendum on whether President Evo Morales could serve as president for a fourth term. With 51.30% votes against the approval of a third term, Movimiento al Socialismo, (President Morales’ political party) will have to nominate a new presidential candidate for the next presidential election. However, in November 2017, the Plurinational Constitutional Court, in a controversial decision, authorized Evo Morales to run again in the presidential elections scheduled for November 2019. Political instability ahead of the 2019 elections could lead to a reduction on foreign investment and a deterioration in the investment climate in Bolivia.
Additionally, the financial services law (Ley de Servicios Financieros N° 393), which was enacted in 2013, established lending quotas and caps on interest rates that could negatively impact interest margins on banks and reduce their ability to generate enough capital to maintain the growth rates in their lending portfolios experienced during the last several years.
During 2017, Bolivia’s macroeconomic indicators continued to deteriorate. GDP growth was a healthy 4.3% and among the highest rates in the region, but below the average growth rate of the last five years and below the budgeted growth rate of 4.8%. Also, in 2017 and for a third consecutive year, Bolivia experienced both fiscal and current account deficits due to lower exports and increased government spending. Inflation in 2017 was the lowest since 2009 at 2.7%, well below the Central Bank´s target of 5.3%. On the other hand, as of December 2017, international reserves represented 28% of GDP (US$10.261 billion), having increased by 1.8% relative to 2016.
| 28 |
Colombia
The Colombian economy continued to slow down last year, particularly as a result of the negative effect on private consumption from the tax reform that came into force in January 2017, which increased the value added tax from 16% to 19%. The decision to implement a new tax reform was based on the need to adjust the fiscal accounts to lower oil prices. This, jointly with a high political polarization after the peace deal with the FARC guerrillas, drove economic sentiment to low levels during the year. GDP grew by approximately 1.7% in 2017. External and fiscal imbalances continued to correct last year. Regarding external accounts, a slight recovery in oil prices and sluggish domestic demand led the current account deficit to narrow from 4.4% of GDP in 2016 to approximately 3.6% in 2017. On the fiscal front, tax reform and lower public spending allowed the government to meet its fiscal deficit target of 3.6% of GDP last year, compared to 4.0% in 2016. Inflation reached 4.1% in 2017, 1.7 percentage points (“pp”) below the figure recorded in 2016 amid a reversion of temporary factors that affected prices that year, a stabilization of the foreign exchange, and a wider output gap. Standard & Poor’s, cut Colombia’s sovereign long-term foreign currency rating from BBB to BBB- due to lower potential growth and fiscal challenges from 2019 onwards. Overall, considering that both presidential and Congressional elections will be held in 2018, expectation is that activity is likely to remain slow for some additional months until economic agents are familiar with the president and his policies.. Likewise, proposals by candidates on the fiscal front will be key for avoiding further rating actions as the fiscal path set in the fiscal rule for the upcoming years is demanding. Currently, the consensus expects continuity in economic policy as the most likely scenario.
Chile
Chilean GDP grew by approximately 1.5% in 2017 as compared to 1.6% GDP growth for 2016. Throughout the year, economic activity remained sluggish amid certain one-off events such as La Escondida labor strike in early-2017 and overall weakness in different sectors. Although some leading indicators reversed their downward trend by the end of last year, pessimism in confidence indicators (consumer and business) continued to affect private consumption and investment figures. Particularly, the construction sector still acted as a drag on the economy, leading aggregate investment to contract for the fourth year in a row. The reform agenda proposed by the Bachelet administration added to the uncertainty, particularly in respect of social security area (pensions). Importantly, in December 2017 Sebastian Piñera (Chile Vamos Coalition, center-right) succeeded against Alejandro Guillier (Fuerza de la Mayoria, left) in the presidential election. President Piñera aims to introduce policy changes to several areas, including pensions (including, among other things, to increase by 4 percentage points the monthly contributions directed to individual accounts and to incentivize people to postpone their retirement age), tax system (including, among other things, to reintegrate the tax regime and to reduce the corporate rate from 27% to 24-25%) and infrastructure (including, among other things, to promote public to private partnership agreements focused on highways, ports, and airports). That said, the new Congress composition will limit president-elect Piñera’s ability to implement his main reform objectives as no coalition will run an absolute majority. Finally, certain imbalances remain in the economy with the fiscal deficit standing at 2.8% of GDP, the current account deficit reaching 1% of GDP, and inflation lying at 2.3%.
| 29 |
(8) Our trading activities expose us to volatility in market prices, declines in market liquidity or fluctuations in foreign currency exchange rates, which may result in losses that could have a material adverse effect on our business, financial condition and results of operations.
The securities and derivative financial instruments in our trading portfolio may cause us to record gains or losses, when sold or marked to market, and may fluctuate considerably from period to period due to numerous factors that are beyond our control, including foreign currency exchange rates, interest rate levels, the credit risk of our counterparties and general market volatility. These losses from trading activities could have a material adverse effect on our business, financial condition and results of operations. In this sense, risk is inherent in the Group’s trading activities but it is managed through a process of ongoing identification, measurement and monitoring, subject to risk limits and other controls. This process of risk management is critical to the Group’s continuing profitability.
(9) Natural disasters in Peru could disrupt our businesses and affect our results of operations and financial condition.
We are exposed to natural disasters in Peru, such as earthquakes, floods and mudslides. Earthquakes in Peru are common occurrences as the country is located in a seismic zone: the interface between the Nazca and South American tectonic plates. Peru has been adversely affected by earthquakes in the past, including a 7.9 magnitude earthquake that struck the central coast of Peru in 2007. The country is also vulnerable to El Niño, which provokes floods and mudslides in the north and central Andean regions. Due to its very strong intensity, the 1997-1998 El Niño destroyed crops and infrastructure equivalent to 2.2% of GDP (Gross Domestic Product). Heavy rains caused by El Niño have severely damaged infrastructure in early 2017. This weather phenomenon will affect negatively Peru’s GDP and may affect the financial situation of some of Credicorp’s clients.
| 30 |
Similar natural disasters or other types of disaster could impair our operational capacity. Our business continuity plans include emergency response, disaster recovery, operations continuity, crisis management, data protection and recovery, and critical systems redundancy. Although we test our business continuity plans annually, these plans may prove to be ineffective which could have a material adverse effect on our ability to carry out our businesses, especially if an incidence or disaster affects computer-based data systems or damages customer or other data. In addition, if a significant number of our employees were affected by the natural disaster, our ability to conduct business could be impaired.
Our subsidiary Grupo Pacifico is further exposed to risks associated with natural disasters. To protect Grupo Pacifico’s solvency and liquidity, our insurance business historically has obtained reinsurance for a substantial portion of its earthquake-related risks through automatic quota share and excess loss treaties; however, there can be no assurance that a major catastrophe would not have a material adverse impact on our results of operations or financial condition or that our reinsurance policies will be an effective hedge against our exposure to risks resulting from natural disasters.
(10) We operate in a competitive banking environment that may limit our potential to grow, particularly in the medium term, as more foreign banks establish or expand operations in Peru.
BCP has experienced increased competition, including increased pressure on margins. This is primarily a result of the following:
| • | Highly liquid foreign-owned commercial banks in the market; |
| • | Local and foreign investment banks with substantial capital, technology, and marketing resources; and |
| • | Local pension funds that lend to BCP’s corporate customers through participation in those customers’ securities issuances. |
Larger Peruvian companies have gained access to new sources of capital through the local and international capital markets, and BCP’s existing and new competitors have increasingly made inroads into the higher margin, middle market and retail banking sectors. Such increased competition, with entrants who may have greater access to capital at lower costs, has affected BCP’s loan growth as well as reduced the average interest rates that BCP can charge its customers.
| 31 |
Competitors may also dedicate greater resources to, and be more successful in, the development of technologically advanced products and services that may compete directly with BCP’s products and services. Such competition would adversely affect the acceptance of BCP’s products and/or lead to adverse changes in the spending and saving habits of BCP’s customer base. If competing entities are successful in developing products and services that are more effective or less costly than the products and services developed by BCP, BCP’s products and services may be unable to compete successfully. BCP may not be able to maintain its market share if it is not able to match its competitors’ loan pricing or keep pace with their development of new products and services. Even if BCP’s products and services prove to be more effective than those developed by other entities, such other entities may be more successful in marketing their products and services than BCP because of their greater financial resources, higher sales and marketing capacity or other similar factors.
As a result of Peru’s strong economic growth, which has outpaced growth by nearby countries, some banks have sought and obtained authorization to open representative offices in Peru. With the increased competition, more individuals will have access to credit, and the percentage of the population using banking services will likely climb. This will eventually put downward pressure on interest rates. Any negative impact on BCP as a result of increased competition could have a material adverse effect on our results of operations and financial condition. See “Item 4. Information on the Company – 4.B. Business Overview – (6) Competition”.
(11) Economic and market conditions in other countries may affect the Peruvian economy and the market price of Peruvian securities.
Economic conditions in other countries and developments in international financial markets can affect Peru’s economic growth. The country’s exports are highly concentrated in the mining industry; with tax revenues from the sector that peaked at 14% in 2007, and in 2017 they represented 3.4% of total tax revenues. In addition, gold and copper exports represented 48% of all shipments in 2017. Therefore, Peruvian trade responds significantly to fluctuations in metal prices, especially gold and copper, which fell 36.6% and 41.7%, respectively, between December 2012 and December 2015. This turned a US$6.4 billion trade surplus in 2012 into a US$2.9 billion trade deficit in 2015. In contrast, 2017 registered a US$6.3 billion trade surplus (2016: US$ 1.9 billion) due to a US$5.6 billion increase in copper exports since 2015 (the exported volume of copper increased 48.5%) and US$1.3 billion increase in gold exports since 2015 (average export prices of gold increased 8.4%). In 2017 the price of copper increased 32% and stood at its highest price in three years, and the terms of trade increased 7.3%, the first positive result in six years.
| 32 |
In addition to changes in prices, Peru is also vulnerable to fluctuations in foreign demand, especially from the United States and China. A more pronounced economic slowdown in China over the next few years poses a risk to Peruvian growth as it may impact exports and foreign direct investment. Lower growth in Latin America can also impact the Peruvian economy and our business, especially with regard to Chile, Colombia, Bolivia and Panama, where we have operations, as well as Brazil and Mexico, which have a broad impact throughout the region because of their size. Moreover, regarding the Trans-Pacific Partnership (TPP), after long held negotiations between the Trade ministers of the 12 Asia-Pacific countries, a final agreement was signed on February 4, 2016. The free trade agreement would enter into force 60 days after the date in which all original signatories have notified the Depositary of the Agreement (responsible for receiving and disseminating documents) of their approval of the amendment in accordance with their respective applicable legal procedures. However, because the President of the United States has indicated that the United States would not ratify the agreement, the state of the TPP execution remains uncertain.
Furthermore, financial conditions in global markets also affect the economy, affecting interest rates for local corporate bonds and influencing the exchange rate. Monetary policy tightening in developed economies, particularly on the part of the Federal Reserve System in the United States, could affect economic activity in Peru to the degree that it strengthens the dollar and increases interest rates, thereby reducing access to funding for some local businesses. Also, since the Peruvian economy still has some level of dollarization (29.1% of loans and 39.9% of deposits as of December 2017), potential balance sheet effects should also be contemplated since a higher exchange rate could increase debt burdens for individuals and businesses that have taken loans in dollars but earn their income in local currency.
However, the BCRP has taken steps to foster de-dollarization and thus reduce this vulnerability by defining in January 2015 the so-called “De-dollarization Program” that implies additional foreign currency reserve requirements on financial institutions when:
| · | balance of total loans in dollars (excluding loans for foreign trade operations) at December 2015 were above 90% of the balance recorded in September 2013; the target for December 2016 was updated to 80% of the balance of September 2013, this target continued to apply for December 2017; and |
| · | balance of car loans and mortgage loans in dollars at December 2015 were above 85% of the balance in February 2013; the target for December 2016 was updated to 70% of the balance recorded in February 2013; and thereafter the target would be lowered by 10 percentage points each year. Therefore, the target for December 2017 was 60% of the balance recorded in February 2013. |
| 33 |
In the context of the aforementioned “De-dollarization Program”, Credicorp’s main subsidiary BCP Stand-alone has reduced significantly the level of foreign exchange risk on credit risk, which in turn reduces the impact mentioned in this risk factor. For further details, see “Item 4. Information on the company – 4.B Business Overview – (9) Supervision and Regulation – 9.2 BCP and Mibanco – 9.2.7 The Peruvian Central bank monetary and macro prudential policy”.
These targets were complemented by the addition of two new types of Currency Report Operations (known as Repo). The instruments complemented the de-dollarization process by:
| · | providing liquidity in local currency to financial institutions for an amount up to 20% of such institution’s Total Liabilities Subject to Reserve Requirements (TOSE by its Spanish Initials) in foreign currency through a Repo - Expansion. However, under no circumstance, can the median reserve requirements decrease below 25%; |
| · | providing foreign currency to financial institutions at spot prices in order to finance the re-denomination of their foreign currency loans through a Repo – Substitution. |
(12) A failure in, or breach of, our operational or security systems, fraud by employees or outsiders, other operational errors, and the failure of our system of internal controls to discover and rectify such matters could temporarily interrupt our businesses, increasing our costs and causing losses.
We have defined and implemented governance with specific roles for risk and control assessment, monitoring and awareness programs, security initiatives, business objectives, corporate alignment and regulatory compliance with banking, credit card, insurance and pension fund industry requirements in Peru, Bolivia, Chile, Colombia, Panama, the Cayman Islands and the United States.
Although we have a strong IT infrastructure and highly-skilled professionals managing our IT operations, our risk exposure could be significant. We are still vulnerable to failure of our operational systems and to cybersecurity threats.
Credicorp has not experienced any material losses related to cyber-attacks or operational instability. Credicorp is continuously working and investing resources in maintaining and updating control processes in order to prepare and adapt to new technologies and to strengthen our cyber and operational security. As a matter of policy, Credicorp maintains an investment protection program to ensure that the group has the technologies and processes it needs to keep its operations and assets safe. However, our use of the internet and telecommunications technologies to conduct financial transactions, as well as the increased sophistication and activities of organized criminals, hackers and other external parties, could potentially impact the confidentiality, integrity and availability of critical information.
| 34 |
A failure in, or breach of, our operational or cybersecurity systems could temporarily interrupt our business, increasing our costs and causing losses. Temporary interruptions or failures in hardware and software that support our business and customers’ transactions could result in regulatory fines, penalties, and reputational loss. Like other financial institutions and global companies, we constantly strive to provide more, and better, functionality to our customers; expanding our mobile and internet based products and services, and thus increasing our footprint and visibility. Also, like most significant financial companies, we are regularly the target of attempted cyber-attacks that use increasingly sophisticated techniques; we use sophisticated tools available to us and undertake to keep and maintain our operations sound and safe.
As are other financial institutions, we are susceptible to, among other things, fraud by employees or outsiders, unauthorized transactions by employees and other operational errors (including clerical or record keeping errors and errors resulting from faulty computer or telecommunications systems). While we believe that we maintain a system of internal controls designed to monitor and control operational risk, we cannot assure you that our system of internal controls will be entirely effective. Losses from the failure of our system of internal controls to discover and rectify such matters could have a material adverse effect on our business, financial condition and results of operations.
Credicorp has developed recovery strategies (disaster recovery plans and operational continuity plans) and response plans (incident management and crisis management) that, in the face of risk situations that interrupt the main products and services, may mitigate the financial, legal and reputational impact. We are aware that new threats may be presented, but the company is constantly working to strengthen response mechanisms and recovery strategies to be more resilient to this kind of events.
(13) Our anti-money laundering and anti-terrorist financing measures might not prevent third parties from using us as a conduit for such activities and could damage our reputation or expose us to fines, sanctions or legal enforcement, which could have a material adverse effect on our business, financial condition and results of operation.
We comply with applicable anti-money laundering and anti-terrorist financing laws and regulations. Also, we have developed various policies and procedures, under a comprehensive approach based in international practices, including internal controls and “know-your-customer” procedures, aimed at preventing money laundering and terrorist financing. Our anti- money laundering policies and procedures are based upon, and comply with the applicable law of our different operations. However, such measures, policies and procedures may not be completely effective in preventing third parties from using us as a conduit for money laundering (including illegal cash operations) or terrorist financing without our knowledge. If we were to be associated with money laundering (including illegal cash operations) or terrorist financing, our reputation could be impacted, and/or we could become subject to fines, sanctions or legal enforcement (including being added to any “blacklists” that would prohibit certain parties from engaging in transactions with us), which could have an adverse effect on our business, financial condition and results of operation. To mitigate the above-mentioned risk our Corporate Compliance Division has established several programs to strengthen the ethical behavior of Credicorp. For further details see “Item 4. Information on the Company — 4.B Business Overview — (2) Corporate compliance”
| 35 |
(14) Acquisitions and strategic partnerships may not perform as expected, which could have an adverse effect on our business, financial condition and results of operation.
Acquisitions and strategic partnerships, including those made in our investment banking and insurance businesses, may not perform as expected since our assessment could be based on assumptions with respect to operations, profitability and other matters that may subsequently prove to be incorrect. Future acquisitions, investments and alliances may not produce the anticipated synergies or perform in accordance with our expectations, which could have an adverse effect on our business, financial condition and results of operation.
(15) Reinsurance is an important tool in risk management of any primary insurance company and as such, it allows achieving a level of risk diversification that in turns helps to reduce losses. But, we face the possibility that the reinsurance companies will be unable to honor their contractual obligations.
Credicorp assumes reinsurance risk in the normal course of business for our insurance contracts when applicable. Premiums and claims on assumed reinsurance are recognized as revenue or expenses in the same manner as they would be if the reinsurance were considered direct business, taking into account the product classification of the reinsured business.
| 36 |
To mitigate the above-mentioned risk, Credicorp’s requirements in regard to reinsurer counterparty credit risk are higher than local regulatory requirements, as set by Grupo Pacifico’s risk management unit and approved by the Risk Management Committee.
(16) Risks not contemplated in our insurance policies may affect our results of operation.
We maintain insurance in amounts that we believe to be adequate to cover risks related to our operations including, among others, general banking liability insurance for our business, general professional liability for services we provide, general directors and officers liability for our directors and executives and general liability against fraudulent activity. However, it is possible that the terms and conditions of the insurance policies we have will not cover a specific event or incident or that our insurance will cover only part of the losses that we may incur.
If any uninsured events occur with respect to a significant portion of our operations, such lack of coverage could have a material adverse effect on our financial conditions and results of operations. Additionally, if we are unable to renew our insurance policies from time to time or losses or other liabilities occur that are not covered by insurance or that exceed our insurance limits, we could be subject to significant unexpected additional costs which could adversely affect our business.
ITEM 4. INFORMATION ON THE COMPANY
| 4. A | History and development of the company |
Credicorp Ltd. is a limited liability company that was formed in Bermuda on October 20, 1995 to act as a holding company, to coordinate the policy and administration of our subsidiaries BCP, ASB, BCP Bolivia, Grupo Pacifico and Credicorp Capital. We currently hold, directly and indirectly, 97.7% of BCP, 100% of ASHC, 95.84% of BCP Bolivia and 98.5% of Grupo Pacifico. See “Item 4. Information on the Company — 4.C Organizational Structure”.
Our principal activity is to coordinate and manage the business plans of our subsidiaries in an effort to implement a universal banking service mainly in Peru, Bolivia, Colombia and Chile and to develop our insurance and investment banking businesses. Though we primarily focus on the aforementioned countries, we also make limited investments in other countries in the same region. Our registered address is Clarendon House, 2 Church Street, Bermuda. The management and administrative office (i.e., principal place of business) of our subsidiary, Banco de Credito del Peru, is located at Calle Centenario 156, La Molina, Lima 12, Peru, and the phone number is +51-1-313-2000.
| 37 |
As of December 31, 2017, our total assets were S/ 170.5 billion and our net equity was S/ 21.8 billion. Our net income attributable to our equity holders in 2015, 2016 and 2017 was S/ 3,092.3 million, S/ 3,514.6 million and S/ 4,091.8 million, respectively. See “Item 3. Key Information — 3.A Selected Financial Data” and “Item 5. Operating and Financial Review and Prospects”.
During 2012, Credicorp, as part of our strategic plan, initiated the creation of a regional investment banking platform. On April 27, 2012, Credicorp acquired a 51% stake in Correval S.A. Comisionista de Bolsa, a brokerage entity established in Bogota, Colombia, for approximately US$72.3 million (approximately S/246.6 million). On July 31, 2012, Credicorp acquired 60.6% of IM Trust S.A. Corredores de Bolsa, an investment banking entity established in Santiago, Chile, for approximately US$131.5 million (approximately S/447.1 million), For our investment banking operations in Peru, we created Credicorp Capital Peru S.A.A. (formerly BCP Capital S.A.A.), a company incorporated in Peru that was established in April 2012 through the split of an equity block of BCP. Assets transferred included Credicorp Capital Bolsa, Credicorp Capital Titulizadora, Credicorp Capital Fondos and BCP’s investment banking activities. The equity block split had no effect on Credicorp’s consolidated financial statements; no gains or losses arose from it.
On September 25, 2014, Credicorp announced that its subsidiary PPS had reached an initial agreement with Banmedica S.A. (“Banmedica”, a Santiago Stock Exchange listed company with a market capitalization of US$1,317 million as of September 25, 2014), to develop businesses in the healthcare industry in Peru and further providing medical services, health insurance and health plans. This transaction reflects Credicorp’s strategy to capitalize on PPS’s in-depth knowledge of the Peruvian market and Banmedica’s extensive know-how and successful experience in the health care industry. On December 30, 2014, PPS signed the final agreement with Banmedica to enter into the healthcare market in Peru. Based on this agreement, Credicorp lost control of its subsidiary Pacifico Entidad Prestadora de Salud (Pacifico EPS), which became an associate. This agreement came into effect on January 1, 2015.
The agreement has two major parts:
| (i) | both parties agreed to develop healthcare plans and medical services in Peru, exclusively through Pacifico EPS and its subsidiaries. Banmedica contributed their Peruvian subsidiaries Clinica San Felipe and Laboratorios ROE, plus US$32 million in cash to obtain 50% interest in the capital stock of Pacifico EPS. |
| 38 |
| (ii) | Banmedica paid US$25 million in cash to PPS to obtain 50% of the results related to PPS’s health insurance business in Peru. The distributable income is held in equal parts (50/50) and it is determined based on a formula agreed to by both parties in the contract. Health insurance business, which is a line of business of Credicorp, via its subsidiary Pacifico, who assumes the risk insurance. |
This transaction resulted in profits of S/99 million, which is recognized in “Net gain on sales of securities” in the consolidated statements of income.
At Grupo Credito’s shareholder meeting held on February 11, 2015, shareholders approved the terms of split of equity block of Grupo Credito in favor of Credicorp Capital Holding Peru S.A., a company incorporated on September 3, 2014 and a subsidiary of Credicorp Capital Ltd. (“Credicorp Capital”). The equity block was composed of the investment that Grupo Credito held in Credicorp Capital Holding Peru, whose net equity was approximately S/511.3 million as of May 31, 2015. As a result, Grupo Credito reduced its share capital by approximately S/491.7 million. Credicorp Capital Holding Peru also increased its share capital by about S/491.7 million and issued 491,686,830 new shares with a nominal value of S/1.00 each in favor of Credicorp Ltd (shareholder of Grupo Credito). In October 2015, Credicorp’s Board of Directors approved the transfer of the shares to Credicorp Capital, finishing the reorganization process to regroup, under Credicorp Capital, all the investments in subsidiaries related to capital markets.
On March 20, 2014, Credicorp, through its subsidiary Edyficar, acquired a 60.68% stake in Mibanco, Banco de la Microempresa S.A. (Mibanco), a local bank that specialized in the micro and small entities sector, for approximately S/504.8 million or US$179.5 million, in cash. On April 8, 2014, Grupo Credito S.A. and Edyficar, subsidiaries of Credicorp Ltd., acquired from the International Finance Corporation (IFC) an additional 6.5% stake in Mibanco (5% through Grupo Credito S.A. and 1.5% through Edyficar) for approximately S/54.1 million. In addition, Credicorp’s subsidiaries made a Public Tender Offer (Oferta Publica de Adquisicion or OPA by its Spanish initials) to non-controlling shareholders of Mibanco pursuant to the Capital Markets Law. Credicorp acquired an additional 18.56% of Mibanco’s capital stock for approximately S/153.6 million; and in September 2014, acquired an additional 1.19% for approximately S/10 million. As of December 31, 2014, Credicorp held 86.93% of Mibanco’s capital stock and paid an aggregate of approximately S/722.5 million. A merger transaction between Edyficar and Mibanco, which involved a spin-off of the majority of the assets and liabilities of Edyficar, was made effective on March 2, 2015. No gains or losses were recognized in the income statement. As of the merger day, Credicorp held 95.36% of the new Mibanco's capital stock.
| 39 |
On May 12, 2016, Banco de Credito del Peru (BCP) sold its shares of Banco de Credito de Bolivia (“BCP Bolivia”) to ICBSA, an indirect subsidiary of Credicorp Ltd., through a book auction over the Bolivian Stock Exchange. This transfer was part of the rearrangement of Credicorp’s organizational structure in Bolivia to efficiently manage its investments in that country and to comply with applicable Bolivian rules and regulations. The transaction was executed over the Bolivian Stock Exchange. A total of 43,237 shares were sold at a price of Bs.25,811 per share, which account for Bs.1,115,990,207 of revenue, equivalent to US$162,680,788.19. To finance the acquisition by ICBSA, Grupo Credito S.A. (shareholder of this company and subsidiary of Credicorp Ltd.) made a capital contribution in Bolivianos to ICBSA equivalent to US$163 million.
On September 30, 2016, Credicorp Capital, through its holding subsidiaries, concluded the acquisition of the non-controlling interest, which it did not own, in its operating subsidiaries Credicorp Capital Colombia S.A. (“Credicorp Capital Colombia”, formerly Correval) and Inversiones IMT S.A. (currently eliminated, and replaced as an operating subsidiary by Credicorp Capital Chile S.A. (“Credicorp Capital Chile”)). During this acquisition process and after the approval of its Board of Directors, Credicorp made several capital contributions totaling US$120,146,350 to Credicorp Capital, which, in addition to other available resources, allowed its subsidiary to proceed with the aforementioned acquisitions.
In January 2017, Credicorp’s Board of Directors approved the transfer of 9% of BCP’s total shares to Grupo Credito (Credicorp’s Peruvian wholly owned subsidiary) through a capital contribution, to facilitate Credicorp’s future investments in Peru without modifying the controlling structure of BCP. The total amount paid for all the shares was S/3,505,916,484.50. Under the new structure, Credicorp directly holds 3.7% of BCP’s total shares and, in conjunction with its subsidiary Grupo Credito, continues to control the same 97.7% of such shares without modifying the internal governance structure. This modified organizational structure did not affect the way Credicorp and BCP manage their day-to-day operations, and Credicorp’s dividend policy has not changed as a result of this transaction.
At the respective mandatory Annual Shareholders' Meetings of PPS and Pacifico Vida, each held on February 23, 2017, the merger between PPS and Pacifico Vida was approved, pursuant to which PPS will transfer all of its equity to Pacifico Vida (including the transfer of all assets, rights, obligations and other legal relationships deriving from or linked to such assets and liabilities), all in accordance with the absorption merger form contemplated in section 2 of article 344 of the General Companies Law. The merger came into effect on August 1, 2017, when the respective Public Deed of Merger was granted, which occurred after the Superintendent of Banking, Insurance and AFP issued the corresponding Merger authorization. As a result of the dissolution of PPS, the company's shares were excluded from the Public Securities Market Registry and delisted from the Lima Stock Exchange, without the obligation to make a Public Offering by exclusion. The merger permits Credicorp to realize synergies in its decision-making process and through the integration of all its insurance business lines. The closer proximity between companies also allows Grupo Pacifico to improve its value proposition to customers, who seek integral insurance solutions. No gains or losses were recognized in the income statement.
| 40 |
| 4. B | Business Overview |
(1) Credicorp operating segments
We are the largest financial services holding company in Peru. For management purposes, Credicorp is organized into four operating segments based on our products and services. According to IFRS, an operating segment is a component of an entity that engages in business activities from which it may earn revenues and incur expenses, whose operating results are regularly reviewed by the entity’s chief operating decision maker, who makes decisions about resources allocated for the segment and assesses its performance, and for which discrete financial information is available. We conduct our financial services business through our operating segments as follows: banking, insurance, pension funds and investment banking.
The terms “Peruvian commercial bank,” “Peruvian insurance company” and other similar terms used in this Annual Report do not include the assets, results or operations of any foreign parent company or foreign subsidiary of such Peruvian company.
| 1.1 | Banking |
Our banking business, in terms of lending and investment, is organized into (i) wholesale banking activities, including our corporate and middle-market banking business segments, which are carried out by BCP’s Wholesale Banking Group (WBG); (ii) retail banking activities, including our SME-Business, SME-Pyme, mortgage, consumer financing, credit card and wealth management segments, which are carried out by BCP’s Retail Banking & Wealth Management Group (RB&WM); (iii) treasury activities, including money market trades, foreign exchange trading, derivatives and proprietary trading; (iv) micro-lending, which is conducted through Mibanco; (v) wholesale and retail banking activities in Bolivia; and (vi) private banking, asset management and proprietary investment activities, which we perform through ASB, a Cayman Islands licensed bank.
The majority of our banking business is carried out through BCP Stand-alone, which together with Mibanco, held 32.6% of the Peruvian market share in loans and 32.5% market share in deposits, as of December 31, 2017. A portion of our banking business is also carried out by ASB. We conduct banking activities in Bolivia through BCP Bolivia, a full service commercial bank, which as of December 2017 increased its market share in loans and deposits reaching 9.6% and 9.8% respectively. BCP Bolivia is fourth with respect to loan market share and fifth with respect to deposit market share in the Bolivian banking system.
| 41 |
We apply uniform credit policies and approval and review procedures, which are based on conservative criteria adopted by BCP, to all of BCP subsidiaries. Our Chief Operating Officer (COO) is in charge of setting the general credit policies for our different business areas. These policies are set within the guidelines established by the laws and regulations of the markets in which we operate (see “Item 4. Information on the Company – 4.B Business Overview - (9) Supervision and Regulation”) and the guidelines set forth by our Board of Directors.
Our deposit-taking operations are principally managed by BCP’s RB&WM group and ASB’s private banking group. See “Item 4. Information on the Company – 4.B Business Overview - (10) Selected Statistical Information — 10.4 Deposits”.
1.1.1 BCP and Subsidiaries
(1) General
BCP Consolidated consists of a group of subsidiaries offering specialized financial services, which complement BCP’s commercial banking activities. In addition to its local subsidiaries, BCP has an agency in Miami and a branch in Panama. See Item 4. Information on the Company – 4.C Organizational Structure – (2) BCP.
BCP’s activities include wholesale banking, retail banking and wealth management and treasury. As of December 31, 2017, the consolidated operations of BCP ranked first among Peruvian banks in terms of total assets (S/ 139.5 billion), total loans (S/ 91.6 billion), deposits (S/ 85.5 billion) and net equity (S/ 15.6 billion).
As of and for the year ended December 31, 2017, BCP contributed with 81.9% of our total assets, 71.8% of our net income and 70.8% of our net equity attributable to Credicorp’s equity holders. BCP’s operations are supervised and regulated by the SBS and the Peruvian Central Bank.
The following table shows the client segmentation of BCP and Mibanco. This segmentation was a result of an analysis, which addressed multiple factors such as the size and volume of activity for each client, our clients’ affiliation with other companies or groups, the degree of follow-up required, and their credit ratings.
| 42 |
| Client Segmentation | ||||||
| Subsidiary | Business | Group | Income/Sales/Total debt | |||
| Banco de Credito del Peru | Wholesale Banking Group (WBG) (1) | Corporate | Annual sales higher than $100 million | |||
| (equivalent to S/324 million) | ||||||
| Middle-Market | Annual sales from $10 million to $100 million | |||||
| (equivalent to S/32 million to S/324 million) | ||||||
| Retail Banking Wealth Management Group (RB&WM) | Private Banking | Over US$ 1 million in AuMs (Do not include CTS) | ||||
| Enalta | Individual monthly income at least S/20,000; or more than US$ 200,000 in AuMs (Do not include CTS). | |||||
| Affluent | Individual monthly income from S/5,000 to S/20,000 | |||||
| Consumer | Focus on medium-low income individuals | |||||
| SME - Business | Annual sales from S/5.6 million to S/32 million; or | |||||
| Total debt from S/1.2 million to S/10 million | ||||||
| SME- Pyme |
Annual sales up to S/5.6 million; or Total debt up to S/1.2 million |
|||||
| Mibanco (2) | SME & Microlending | SME – medium (3) | Annual sales up to S/20 million. | |||
| Total debt higher than S/0.3 million and not issued debt in the capital market. | ||||||
| SME – small (4) | Total debt from S/0.02 million to S/0.3 million. | |||||
| Micro-Business (5) | Total debt up to S/0.02 million. | |||||
| Consumer (6) | Focus on debt unrelated to business. | |||||
| Mortgage (7) | Focus on individuals for acquisition, construction of homeownership and granted with mortgages. | |||||
| (1) | Converted into Soles at the exchange rate of S/3.241 per U.S. Dollar, December 31, 2017 - SBS. |
| (2) | As of December 31, 2017, Mibanco registered 958,262 clients. |
| (3) | SME – Medium segment is focused on financing production, trade or service activities, granted to companies, which (1) total debt in the last 6 months was higher than S/300,000, (2) annual sales up to S/20 million in the last 2 consecutive years and (3) that have not participated in the capital markets. This segment represents 2% of total loans in Mibanco and registered 1,861 clients. |
| (4) | SME – Small segment is focused on financing production, trade or service activities, granted to companies, which total debt is between S/20,000 and S/300,000 in the last 6 months (without including mortgage loans). This segment represents 57% of total loans in Mibanco and registered 152,781 clients. |
| (5) | Micro-Business loans focus on financing production, trade or service activities, granted to companies, which total debt is up to S/20,000 in the last 6 months (without including mortgage loans). Micro-Business loans represent 29% of total loans in Mibanco and registered 595,914 clients. |
| (6) | Consumer loans focus on financing individuals to cover payments of goods and services or expenses no related to business. Consumer loans represent 7% of total loans in Mibanco and registered 205,142 clients. |
| (7) | Mortgage loans focus on financing individuals for the acquisition, construction, renovation, remodeling, expansion, improvement and subdivision of homeownership. Mortgage loans represent 5% of total loans in Mibanco, and registered 5,704 clients. Mibanco’s mortgage segment has an LTV up to 90% approximately. |
| 43 |
(2) BCP Stand-alone - business segments
(2.1) Wholesale Banking Group (WBG)
Our Wholesale Banking Group competes with local and foreign banks. BCP Stand-alone’s traditional long-term relationships with medium-sized and large corporate companies provide WBG with a competitive advantage.
WBG obtained lower loan growth, posting average daily balances of S/ 39,029 million in 2015 (a 21.8% year-over-year increase), S/ 41,793 million in 2016 (a 7.1% year-over-year increase) and S/ 40,964 million in 2017 (a -2.0% year-over-year decrease). It also maintained its leadership in the wholesale banking market with a 39.7% market share [3] in loans. It has also established longstanding client relationships with virtually all of the major industrial and commercial groups in Peru. WBG provides its customers with cash management solutions, short- and medium-term loans in local and foreign currencies, foreign trade-related financing and lease and project financing.
WBG is divided into the following two divisions:
(i) Corporate and International Division (CID)
| • | CID provides loans and other credit and financial services, focuses on serving large-sized companies that have an annual turnover of over US$100 million, corporate governance, audited financial statements and dominant market positions in their particular brands or product areas. Even if clients do not meet any of these criteria, the CID may provide services to firms under this category if they belong to a large economic group of an industry that is important to Peru’s economy. |
| • | International banking and leasing subdivision manages the relationship with financial institutions (locally and abroad), trade products, international operational services and financial leasing products. |
| • | Cash management and transactional services subdivision develops products and services to support clients’ daily activities of cash management, collections, payments, and investments, among others. |
3 Source: Superintendence of Banking, Insurance and Pension Funds for all market share figures showed in this document for BCP Stand-alone and considering (i) total Peruvian Financial System, excluding Banco de la Nacion (Estate-owned bank); and (ii) using BCP’s client segmentation.
| 44 |
BCP Stand-alone continues to meet the needs of its corporate clients, assisting them with financial services, cash management solutions and short- and medium-term financing through the CID. As a result, BCP Stand-alone’s corporate banking loans grew from S/ 25,747 million in 2015 to S/ 28,162 million in 2016, but decreased to S/ 26,807 million in 2017.
The lower pace of the CID’s growth is due to (i) intense competition from foreign banks, which finance their operations at lower costs due primarily to the fact that our monetary authority has high reserve requirements for foreign currency for local banks and (ii) the problems derived from the “ Lava Jato ” case and from the effects of El Niño, which caused a lower economic growth. Nevertheless, BCP has a leading position in the Peruvian banking system with the 42.8% of the market share for loans.
The CID offers a broad range of products and tailors its product offerings to meet each client’s unique requirements. In general, this division is expected to offer high-value-added products, advisory and financial services, particularly cash management solutions, at competitive prices.
The CID’s financing is provided to fund capital expenditures and investments, sales, international trade and inventories. To finance capital expenditures, the CID offers medium and long-term financing, financial lease and project finance.
(ii) Middle-Market Banking Division (MMD)
| • | MMD serves mid-sized companies. MMD’s clients have annual revenues that vary from US$10 million to US$100 million, and are serviced nationwide by 13 BCP regional managers. |
| • | Additionally, there is an Institutional Banking subdivision focused on serving profit and non-profit organizations, state-owned companies and other major institutions. |
MMD provides banking services targeted to medium-sized companies from various economic sectors. The products offered to middle-market clients are similar to those offered to corporate banking clients. The major types of products are:
| • | Revolving credit lines to finance working capital needs and international trade financing; |
| • | Stand-by letters of credit and bond guarantees; |
| • | Structured long-term and medium-term financing, through loans or financial leasing; and |
| • | Cash Management, Transactional products and electronic banking. |
| 45 |
The MMD has continued to make progress toward implementing its strategic goals by:
| • | Creating dedicated points of contact to meet the needs of its customers more efficiently; |
| • | Streamlining its lending processes to provide middle-market customers with prompt service; |
| • | Introducing new electronic financial products to make its services more accessible to customers; |
| • | Incorporating sophisticated technical tools in order to implement a risk-based pricing model; |
| • | Focusing on fee income and loan portfolio growth; |
| • | Introducing a new commercial planning model that employs an efficient and standardized methodology; and |
| • | Maintaining risk controls using sophisticated tools created by BCP’s Risk Management Unit. |
The MMD loan portfolio reached S/ 13,282 million in 2015, S/ 13,631 million in 2016 and S/ 14,157 million in 2017. As of December 31, 2017, BCP had a market share of 35.3% in this segment.
We believe that middle-market companies have benefited from the overall economic improvements in Peru over the past few years. Loan quality problems have been addressed through procedures and organizational changes that have focused on improving the loan approval and credit-risk assessment processes.
(iii) Support areas
International banking unit
The International Banking Unit focuses on obtaining and providing short-term funding for international trade. Medium-term lines of credit funded by international commercial banks and other countries’ governmental institutions are also provided to clients. In addition, this unit earns fees by confirming letters of credit and guarantees issued by international banks and other fees as a result of the international payment and trade finance business. The International Banking Unit also promotes international trade activities with its local clients by structuring trade products and services, organizing and sponsoring conferences and advising customers through a wide range of trade products.
BCP maintains business relationship with correspondent banks, development banks, multilateral and export credit agencies in different countries around the world. At present, BCP manages credit lines for foreign trade transactions, working capital and medium and long-term investment projects.
| 46 |
BCP’s import business volume amounted to S/ 38.8 billion in 2015, S/ 46.1 billion in 2016 and S/ 51.2 billion in 2017 and the export business reached a volume of S/ 45.8 billion in 2015, S/ 57.2 billion in 2016 and S/ 64.2 billion in 2017.
Cash management and transactional services unit
Our Cash Management and Transactional Services Unit is in charge of developing transactional services that handle the exchange of information and money transfers among corporations, midsized companies, institutions and micro-business companies. Services managed by this unit include collections (automated trade bill collection), automated payments (loans to personnel and suppliers’ accounts, reverse factoring and money transfers), electronic office banking, electronic lending solutions and cash management through checking accounts with special features.
(2.2) Retail Banking & Wealth Management Group (RB&WM)
At the end of 2017, RB&WM related loans represented 46% of BCP’s total loans, while deposits accounted for 63% of BCP’s total deposits.
With the segmentation of its retail client base, BCP is able to focus on cross-selling its products and improving per-client profitability. The RB&WM Group has undertaken several projects to improve one-on-one marketing techniques and tools for the sale of its products to profitable market segments. BCP’s management expects the RB&WM businesses to continue being one of the principal growth areas for BCP’s activities.
| (i) | Wealth management |
The affluent segments are targeted by the Wealth Management Division and are divided between BCP’s private banking unit (“BCP Banca Privada”) and BCP´s super affluent unit (“Enalta”).
| § | BCP Banca Privada services include investment advisory, securities-based lending, financial planning, wealth planning, family office and day to day banking services including loans and cash accounts. Clients benefit of customized products, three exclusive branches and dedicated experts. BCP Banca Privada has approximately 2,749 clients. |
| § | Enalta services include investment advisory, securities-based lending, financial planning and day to day banking services including loans and cash accounts. Enalta clients have access to twelve exclusive branches and benefit of personalized advice from investment, insurance and loan experts. Enalta has approximately 33,938 clients. |
| 47 |
| (ii) | Banca Exclusiva (BEX) |
Customers in BCP’s “mass affluent” segment receive a differentiated value proposition that includes: dedicated customer services channels, such as specialized account managers, preferential service by tellers at branches and call center phone banking, and preferential interest rates on loans. Approximately 50% of the mass affluent clients are serviced through specialized account managers responsible for improving per-client profitability and achieving long-term relationships through personalized service, cross-selling and share of wallet strategies. BCP has approximately 352,074 mass affluent customers.
| (iii) | Consumer Banking |
Our Consumer Banking Division is in charge of developing strategies for the retail customers who are not included in affluent banking or small business banking. Its customer base consists of approximately 7 million medium to low income individuals. Consumer Banking focuses on customers who receive their payroll through BCP (which represent slightly more than 1.1 million clients). Its strategies vary from basic acquisition of new accounts for wage-earners with special terms regarding fees and interest rates, to more sophisticated, aggressive cross-sell and retention programs that expand benefits to non-banking products (i.e., access to discounted products) and access to payroll advances.
| (iv) | SME-Business and SME-Pyme |
BCP’s SME-Business and SME-Pyme Banking Segments serve approximately 589,270 clients. Customers are divided into two groups with different business models, services levels, and product access. SME-Business serves approximately 14,332 clients directly managed by the bank and SME-Pyme serves approximately 574,938 small business clients.
| (v) | Mortgage |
As of December 31, 2017, BCP was the largest mortgage lender in Peru with a market share of 30.31%. This was largely the result of the consolidation of major process improvements in credit disbursement started in 2016, extensive marketing campaigns and a deeper integration with BCP’s real estate business.
BCP expects the mortgage lending business to continue growing because of:
| · | increasing housing demand, especially in the middle income segment; |
| · | low levels of penetration in the financial market; |
| · | availability of funds from the Peruvian government allocated to MiVivienda housing program; and |
| · | current economic outlook for controlled inflation and economic growth in Peru. |
| 48 |
As of December 31, 2017, mortgage loans accounted for 16% of Credicorp’s total loan portfolio, with an average LTV (loan-to-value) of 67%. All of our mortgage-financing programs are available to customers with a minimum monthly income of S/1,500. The maximum maturity of the mortgage loans BCP offered was 25 years.
One of the product lines responsible for present and future growth is MiVivienda. MiVivienda program provides government funded loans to purchasers of properties valued up to S/405,000. Under the program, BCP extended mortgages with a maximum amount up to 90% of the appraised value of a property (in local currency) and monthly mortgage payments that did not exceed 40% of the client’s stable net income. With this program, BCP is targeting middle income customers who buy their first home and offer the customers access to government assistance with their down payment. Mortgage loans to this sector represent approximately 16.3% of Credicorp’s total mortgage loans and 2.6% of Credicorp’s total loans.
Mortgage loans are associated with low losses because of their low LTV, and they have the added benefit of generating opportunities for cross selling other banking products, which has had a positive impact on Credicorp’s results.
| (vi) | Credit card and installment loans |
BCP´s outstanding balances grew S/ 130 million between 2015 and 2017, but decreased 1.2% between 2016 and 2017. As of December 31, 2017, BCP maintained market share at 21.5% and 2018 is expected to be a year of growth based on a higher demand for loans. In addition to interest income, BCP derives income from maintenance, retailer transaction merchant, finance and credit card penalty fees.
In the credit card business, BCP continued to apply segmented strategies. BCP offers value to low-end customers by giving them access to credit and value to its medium and high-end customers through loyalty programs such as the partnership with LATAM airline. The loyalty programs in the high-end customers have very good results, both in points that clients gained and in the points redemeed, increasing customer loyalty and credit card use.
To keep a healthy credit card portfolio, very strict policies of activation and use and enforced, eliminating credit cards that do not generate value to BCP and allowing for a more efficient use of capital and reducing IT costs. At the end of 2017 we had 683,245 of primary credit cardholders.
| 49 |
In regards to installment loans, outstanding balances grew S/ 204 million. Between 2015 and 2016 growth was 1.4%. In addition to interest income, BCP earns non-interest income. In order to increase penetration in the lower income segments, in 2017 BCP offered loans in lower amounts and short debt maturities, as part of a low and grow strategy which allows to serve these segments and permits to explore the segments in a profitable way. For a second year BCP has improved prospecting techniques, income forecasting and optimized scoring models allowing it to increase pre-approved and approved loans. 80% of sales of credit cards and installment loans are the result of pre-approved operations which facilitates proactive sale on cost effective distribution channels.
In 2017 we launched the digital channel for the distribution of installment loans. Through the digital channel we sold approximately 11% of the total installment loans originated in the year.
(2.3) Treasury
Treasury, Foreign Exchange, Derivatives and Proprietary Trading
BCP’s Treasury function is managed through three different units in order to have strong governance, the Assets and Liabilities Management (ALM) group, the trading unit (comprised of the Foreign Exchange, Derivatives and Proprietary Trading units) and the Foreign Exchange and Derivatives Distribution Unit.
The ALM group is responsible for managing BCP’s balance sheet and for taking reasonable interest rate and liquidity risks under the oversight of our Asset and Liabilities Committee (ALCO). ALM is also responsible for maintaining our liquidity asset portfolio and compliance with Liquidity Coverage Ratio (LCR) and Common Equity Tier 1 (CET1) ratio under Basel III standards. In addition, the ALM group is an active participant in money and debt capital markets, oversees reserve requirements, manage BCP’s liquidity and the bank’s balance sheet. The ALM group has been active in auctions held by the Peruvian Central Bank for certificates of deposit as well as in financing its funding needs through certificates of deposit, interbank transactions and guaranteed negotiable notes, among other instruments.
BCP’s Foreign Exchange (FX) Unit offers spot FX operations for its clients in Soles, G-10 and, Latin-America currencies and actively participates in FX transactions related to the different instruments designed by the Central Bank of Peru in the local currency market.
BCP’s Derivatives Unit offers FX forwards, FX options, interest rate swaps, cross currency swaps, as well as tailor-made derivatives for our customers in Peru and Latin-America. A strong team of highly trained market professionals, with years of experience in various markets, allows BCP to provide sounds and cost-effective financial solutions to its customer base. To minimize risks, BCP’s Derivatives Unit is closely monitored by BCP’s Treasury Risk Unit.
| 50 |
BCP’s proprietary trading consists of short-term investments in securities (corporate and governmental), which includes instruments from various countries. In the case of Peru, BCP is one of the main liquidity providers in the government bond local market where it is part of the Market Maker Program of the Ministry of Economy of Peru.
BCP’s FX and Derivatives Sales Unit helps both individuals and companies with their foreign exchange needs (spot and hedging) through all BCP’s channels (sales desk, branch network, agents and electronic channels). The broad portfolio of foreign exchange products provided to its ample client base has allowed the Unit to position itself as the most important in the FX business in the Peruvian market.
(2.4) Lending policies and procedures
The Bank has adopted a risk appetite framework and established objective metrics and thresholds to periodically monitor the Bank’s evolving risk profile. The framework was approved by the Board of Directors, and will be managed and monitored by the Risk Management Unit within the Bank’s Central Risk Management Group. The adoption of a risk appetite framework reflects the Bank’s commitment to aligning its forward-looking business strategy with its corporate risk vision.
BCP’s uniform credit policies and approval and review procedures are based upon conservative criteria and are uniformly applied to all of its subsidiaries. These policies are administered in accordance with guidelines established by the Peruvian financial sector laws and SBS regulations. See “Item 4. Information on the Company – 4.B Business Overview - (9) Supervision and Regulation – 9.2 BCP and Mibanco”.
BCP’s credit approval process is based primarily on an evaluation of each borrower’s repayment capacity and commercial and banking references. BCP determines a corporate borrower’s repayment capacity by analyzing the historical and projected financial condition of the company and of the industry in which it operates. Other important factors that BCP analyzes include the company’s current management, banking references, past experiences in similar transactions, and the quality of any collateral to be provided. In addition, BCP’s credit officers analyze the corporate client’s ability to repay obligations, determine the probability of default of the client using an internal risk rating model, and define the maximum credit exposure that BCP wants to hold with the client.
| 51 |
BCP’s individual and small business borrowers are evaluated by considering the client’s repayment capacity, a documented set of policies (including, among other issues, the client’s financial track record and the degree of knowledge of the client), and credit scores, which assign loan-loss probabilities relative to the expected return of each market segment. In BCP, about 80% of credit card and consumer loan application decisions, and about 50% of SME loan application decisions, are made through automatic means. Mortgage and the remaining portions of small business and consumer loan application decisions are made by credit officers who use credit scores and profitability models as inputs for their evaluations and report to a centralized unit.
Our success in small business and personal lending areas depends largely on BCP’s ability to obtain reliable credit and client information about prospective borrowers. BCP counts with a vast transactional information that is heavily used in credit risk models. On the other hand, the SBS has an extensive credit bureau, which has expanded its credit exposure database service to cover businesses and individuals that have borrowed any amounts from Peruvian financial institutions. This database includes risk classifications for each borrower: “Normal,” “Potential Problem,” “Substandard,” “Doubtful” and “Loss.”
BCP has a strictly enforced policy that limits the lending authority of its loan officers. It also has procedures to ensure that these limits are adhered to before a loan is disbursed. Under BCP’s credit approval process, the lending authority for Wholesale Banking is centralized into a specialized credit risk analysis division; and there exists another specialized credit risk analysis division for Retail Banking. These divisions are operated by officers that have specific lending limits. In addition to the controls built into the loan approval workflow systems, the credit divisions and BCP’s internal auditors regularly examine credit approvals to ensure that loan officers and credit analysis officers are complying with lending policies.
In accordance with international standards, BCP has established the limit of the lending authority based on risk rating (probability of default) and particular guarantees of the borrower. Requests for credit facilities in excess of the limits set for Credit Officers are reviewed by the Chief Operating Officer, Credit Risk Committee, Executive Committee or, if the amount requested is sufficiently large, by the Board of Directors.
In addition, BCP has approved concentration limits by industry, based on its target market share and loan portfolio participation.
BCP believes that an important factor to maintain the quality of its loan portfolio is the selection and training of its loan and risk officers. BCP requires loan officers to have degrees in economics, accounting, business administration or related fields from competitive local or foreign universities. In addition, training at the very beginning is based on a three-month “Bank Specialization Program”. Trainees in this program are taught all aspects of banking and finance. After the training program finishes, trainees are hired as loans officers and receive specialized training in credit risk. Loan officers also receive training in specific matters throughout their careers at BCP and also through a comprehensive training program called “Triple A”. Laterally-hired officers generally are required to have prior experience as loan officers.
| 52 |
BCP operates in substantial part as a secured lender. As of December 31, 2017, approximately S/41.9 billion of our loan portfolio and off-balance-sheet exposure were secured by collateral, which represents 44.9% of the total loan portfolio based upon our unconsolidated figures (excluding BCP Panama and BCP Miami, branch offices located overseas), as compared to 48.6% in 2016 and 54.0% in 2015.
Liquid collateral is a small portion of BCP’s total collateral. In general, when BCP requires collateral for the extension of credit, it requires collateral valued at between 110% and 150% of the principal amount of the credit facility granted. The appraisal of illiquid collateral, in particular real estate assets, machinery and equipment, is performed by independent experts.
Pursuant to a Peruvian regulation (Article 222° under Law No. 26702) that became effective in December 1998, the existence of collateral does not affect the loan classification process. For Peruvian accounting purposes, secured loans (or the portion of any loans covered by collateral) that are classified in Class “B”, “C,” or “D” risk categories or that are otherwise classified as substandard loans (see “Item 4. Information on the Company - 4.B Business Overview - (10) Selected Statistical Information – 10.3 Loan Portfolio – 10.3.7 Classification of the Loan Portfolio”) have a lower loan loss provision requirement than similar unsecured loans. If a borrower is classified as substandard or below, then BCP’s entire credit exposure to that borrower is so classified.
BCP’s internal audit division conducts selected revisions and analyses on borrower’s financial statements, consistent with the local banking regulations of the jurisdictions in which it operates.
(2.5) Transformation
In October 2015 the InnovaCXion Center was launched with the mission of improving customer experience through digital innovations.
At the end of 2016, BCP decided to launch a Digital Transformation initiative that included, besides the InnovaCXion Center, the following units: IT Division, Customer Experience Area, Strategic Information Analysis and Governance Area, and Change Management.
| 53 |
During 2017, BCP chose to merge its Digital Transformation initiative and its Cultural Transformation initiative, Samay, both of which were developing on their own track. The objective was to manage a single Transformation initiative, so the bank could “Bring our customers’ dreams to live”.
In order to accelerate our Transformation initiative, new work streams were incorporated: Digital Risk, Digital Operations, Distribution Channels, and Governance.
| (2.5.1) | Information technology (IT) |
BCP considers its technology platform as one of its main competitive strengths and continues to invest in this area to maintain a competitive position in the banking sector. During 2012, IT changed its operating model, outsourcing the administration and operation of the IT infrastructure, application development and maintenance of some of the applications to three companies, who are leaders in their field: IBM, Tata Consulting Services and Everis. During the following years, IT has continued to expand the scope of its services. As a result, in 2017, IT maintained the delivery level for projects/requirements compared to 2016 (delivering 73% more than in 2011), met its time-to-market objectives (since 2011), and strengthened its contingency and business continuity plan. Today IT is focused on accompanying the business in its digital transformation, incorporating into its processes the use of agile methodologies to achieve the speed and early feedback the environment demands. Under this new approach, 30% of the most significant projects of BCP applying agile methodologies.
BCP’s investments in IT reached S/185.2 million in 2015, S/227 million in 2016 and S/260.5 in 2017. BCP’s expenses on IT totaled S/648.1 million in 2015, S/702 million in 2016 and S/705.2 in 2017. Although the bank has been making important investments related to its digital transformation, continuous control and optimization efforts have led us to obtain similar expenses levels than 2016. Finally, as a result of the new operating model, our ratio of IT expenses as a percent of revenues improved from 9.4% in 2011, to 8.13% in 2016 and 8.09% in 2017.
| (2.5.2) | InnovaCXion Center and Customer Experience Area |
The InnovaCXion Center is focused on changing the way we work through Agile and learning new human centered design methodologies to achieve a WOW! experience in our customer journeys, which refer to the set of touchpoints with the bank before, during, and after the experience of a product or service. A WOW experience means that we are focused on make our clients feel a high level of client satisfaction when using our products and services, and in general when they interact with us. During 2017, we developed further on the following i) digital performance bonds, which reduced the time for delivering the product to clients from 2 days to a few hours; ii) the loans project, which is a platform that evaluates customers’ credit needs online; iii) peer-to-peer payments App YAPE; and iv) the Remote Investment Advisory, a digital platform that enables clients to get investment advisory.
| 54 |
The Customer Experience Area focuses on improving customer journeys’ satisfaction through non-digital tools. Currently, 7 key customer journeys have been identified and 3 of them have already been addressed with positive results.
| (2.5.3) | Strategic Analysis and Governance Area |
This area comprises the following teams:
| i. | Strategic Analysis |
The main objective of our Strategic Analysis team is to optimize processes, products or services in the organization based on data analysis, and techniques such as statistics and data processing. In 2017, the team continued to develop use cases and advanced statistical models such as pricing optimization, fraud detection, demand projection, and installed capacity optimization for our call center.
| ii. | Customer Relationship Management (CRM) |
BCP continues to develop strategies to approach different retail customer groups through our customized outreach strategy known as Customer Relationship Management (CRM). This has enabled BCP to reach customers proactively and provide them with personalized offers and terms, in a timely manner while using cost effective channels and maximizing efficiency.
The CRM team is responsible for developing and distributing an adequate service through the different channels such as telemarketing, sales forces, Sales and Service Advisors, ATM, and Online Banking. During 2017, the team continued to increase the volume and complexity of the operations, starting the CRM Transformation project that will enable a customer 360 view and real-time campaigns.
| iii. | Architecture and Data Governance |
This team develops projects that enable us to process large volumes of information, of varied typologies, and at a great speed. In 2017, the team continued the project to transform the Data Architecture, having already implemented the new big data technologic platform.
| 55 |
| iv. | Big Data Laboratory |
In April 2017, Crecemas BCP was launched, the first big data product of BCP that provides analytical information to businesses about their customers, competitors, and economic sector.
| v. | eBusiness and Digital Marketing |
The team focuses on maximizing the sales through digital channels and optimizing digital marketing efforts. Big data and web analytics are used for granular analysis of all the activities that are implemented.
| vi. | Center of Excellence |
In 2017, our Center of Excellence built a data lake, a storage repository holding a vast amount of raw data . Currently, the Center of Excellence has been working on populating the data lake, an asset that in the future will enable us to develop better use cases.
1.1.2 BCP Bolivia
BCP Bolivia’s activities include wholesale banking and retail banking. As of December 31, 2017, the operations of BCP Bolivia in terms of total assets (S/9,118.3 million), total net loans (S/6,089.3 million), deposits (S/8,048.3 million) and net equity (S/636.7 million).
At the end of 2017, BCP Bolivia’s loans represented approximately 9.6% of total loans in the Bolivian financial system. BCP Bolivia’s deposits represented approximately 9.8% of total deposits in the Bolivian financial system.
The following table shows the client segmentation of BCP Bolivia. This segmentation was a result of an analysis, which addressed multiple factors such as the size and volume of activity for each client, our clients’ affiliation with other companies or groups, the degree of follow-up required, and their credit ratings.
| 56 |
| Client Segmentation | ||||||
| Subsidiary | Business | Group | Income/Sales/Total debt | |||
| Wholesale Banking |
Large companies (2) Medium companies (3) |
Annual sales higher than approximately S/49 million Annual sales from approximately S/6 million to S/49 million |
||||
|
BCP Bolivia
(1) |
Retail Banking (4) |
Small Business (5) Micro Business (5) Consumer (6) Mortgage Banking (7) |
Annual sales from approximately S/0.1 million to S/6 million Annual sales of at least approximately S/0.1 million Payroll workers and self-employed workers Payroll workers, independent professionals and business owners |
|||
| (1) | Converted into Soles at the exchange rate of S/0.47245 per Boliviano, December 31, 2017 - SBS. |
| (2) | Loans to Large companies account for 32.0% of BCP Bolivia’s total loans. This segment accounts for approximately 690 customers. |
| (3) | Loans to Medium companies account for 11.0% of BCP Bolivia‘s total loans. This segment accounts for approximately 1,450 customers. |
| (4) | At the end of 2017, retail banking loans accounted for 57.0% of total loans of BCP Bolivia, while retail banking deposits accounted for 27.0% of BCP Bolivia's total deposits. |
| (5) | Small and Micro business banking accounts for 16.0% of total loans of BCP Bolivia, small business banking serves approximately 10,900 clients while Micro Business serves approximately 9,400 business clients. |
| (6) | Consumer banking accounts for 11.0% of total loans of BCP. Its customer base consists of approximately 45,400 Payroll and self-employed workers. Our strategies are based on cross-selling and retention programs that expand benefits to non-banking products. |
| (7) | This segment serves 9,100 customers, representing 30.0% of BCP Bolivia’s total loans. BCP Bolivia’s mortgage segment has an average LTV of 80% and represents less than 2% of Credicorp’s total loans. |
1.1.3 Atlantic Security Bank (ASB)
ASB is a Cayman Islands licensed bank that engages in private banking, asset management and proprietary investment. It was incorporated in September 1984 in the Cayman Islands and principally serves Peruvian-based customers. ASB has an international licensee branch in Panama, through which it conducts all commercial business
As of December 31, 2017, ASB had total assets of S/6,651.7 million and shareholders’ equity of S/874.1 million. Furthermore, as of December 31, 2017, ASB had approximately 2,759 customers, 93% of whom were Peruvian. ASB deposits reached S/5,218.4 million in 2017.
At the end of November 2017, ASB concluded the acquisition of Correval Panama, S.A., a subsidiary of a group related party, Credicorp Capital Colombia S.A. Correval Panama serves as a brokerage company with operations in Panama and the international market. Its activities are regulated by the “Superintendencia de Mercado de Valores de Panama”. With this acquisition, ASB looks to improve and consolidate processes, services and operations in its Panamanian branch and also improve its services and products related to brokerage activities.
| 57 |
ASB trades on its own account primarily by making medium-term investments in investment grade fixed-income securities and sovereign debt. Non-investment grade fixed-income securities fall behind investment grade securities in terms of portfolio allocation, while equity and hedge-fund positions, though present, are less relevant. As of December 31, 2017, ASB’s investment portfolio was S/3,242.7 million.
Third-party asset management is an important activity for ASB. Total assets under management (AuM) reached S/17,608.2 million as of December 31, 2017, compared to S/14,921.3 million as of December 31, 2016 and S/12,359.8 million as of December 31, 2015. These assets comprise a range of unsolicited securities and ASB acts as an intermediary in the management and custody of such assets in fixed income and variable income securities.
ASB also maintains total loans, which amounted to S/2,638.7 million at year-end 2017, and approximately 93% of these loans were guaranteed by customers’ deposits and investments.
ASB’s overall investment strategy, the general profile of its investment portfolio and its specific investment decisions, are reviewed on a monthly basis by an investment committee. Its credit risk by counterparty, including direct and indirect risk, is evaluated on a consolidated basis and covers all activities that generate credit exposure such as interbank placements, commercial loans and securities investment. Market, liquidity and operational risks are monitored by ASB’s Risk Management Unit, which in turn reports to and is supervised by a Corporate Risk Committee, an Asset-Liability Committee and the Board of Directors.
1.2 Insurance
We conduct our insurance business exclusively through Grupo Pacifico that operates in Peru and Bolivia, which is the second largest Peruvian insurance company in terms of premiums. Grupo Pacifico provides a broad range of insurance products focusing on three business areas: property and casualty (P&C), life and pension through Pacifico Seguros, and health insurance through Pacifico EPS, which also conducts private hospital operations. Grupo Pacifico, like other major Peruvian insurance companies, sells its products both directly and through independent brokers, agents, banking channels and sponsors.
In 2015, Grupo Pacifico signed an agreement with Banmedica to participate as equal partners in the health insurance business. This association includes the private health insurance business managed by Pacifico Seguros, the corporate health insurance for employees sold by Pacifico EPS, and medical subsidiaries that provide medical services.
| 58 |
As a result, Grupo Pacifico transferred the majority control of Pacifico EPS to Banmedica. Therefore, Pacifico EPS and the medical subsidiaries no longer consolidate with Pacifico Seguros for accounting purposes, and are reported as an investment in associates. Nevertheless, at the end of January 2018, UnitedHealth Group Inc signed a definitive agreement to buy Chilean healthcare company Banmedica SA for US$2.8 billion. With the closing of the transaction, UnitedHealth Group now owns 96.8% of Empresas Banmedica.
On August 1, 2017, the merger between Pacifico Vida and Pacifico Seguros Generales went into effect after the approval of the Superintendence of Banking, Insurance and AFP (SBS) and the subscription of the respective Public Deed.
Therefore, Pacifico Vida has acquired all of the rights and obligations of Pacifico Seguros Generales. Additionally, the resulting company shall be named Pacifico Compañia de Seguros y Reaseguros, with abbreviated name "Pacifico Seguros". This merger allows Pacifico Seguros to strengthen its assets and improve solvency and regulatory indicators, providing greater support for its obligations.
1.3 Pension funds
Credicorp conducts all of its pension fund activities through its private pension fund administrator Prima AFP. Prima AFP manages pension funds through individual capitalization accounts, providing its affiliates with retirement, disability, survival and burial benefits. See “Item 4. Information on the Company - 4.B Business Overview - (5) Review of 2017 – 5.2.5 Prima AFP” and “Item 4. Information on the Company - 4.B Business Overview - (9) Supervision and regulation – 9.7 Prima AFP” for more information about this business.
1.4 Investment banking
The integration of Latin American markets is a strategic focus for Credicorp. The creation of MILA (by its Spanish initials), a Latin American integrated market shared among Chile, Colombia and Peru, has opened up opportunities to further integrate asset management, brokerage and corporate finance cross-border operations. This can offer benefits for companies that have a significant presence in these markets. Since the formation of MILA, Credicorp’s investment banking business units grouped under Credicorp Capital have been very active. Credicorp Capital carries out its operations in the region through Credicorp Capital Peru, Credicorp Capital Colombia and Credicorp Capital Chile, holding a considerable market share in the Peruvian, Colombian and Chilean markets, respectively. Our main business lines are asset management, sales & trading and corporate finance.
| 59 |
Asset management
Through the regional platform provided by MILA, we offer a wide array of products, including mutual funds, alternative funds and portfolio management, as well as structured products, to a broad base of clients, including clients in our retail, private and high net worth, corporate and institutional segments.
Sales & trading
Our regional investment banking platform has an active role in secondary markets, particularly equity and fixed income products, as well as exchange rate products and derivatives. Participation in the placement of equity and debt instruments, vis-à-vis our corporate finance team, is becoming equally relevant.
Corporate finance
Corporate finance provides advisory services to structure mid- and long-term financing and structure and place equity and fixed income instruments in capital markets. It also offers a wide range of financial advisory services and advisory services for mergers and acquisitions.
(2) Corporate compliance
Our Corporate Compliance programs cover all Group companies and have been developed under a comprehensive approach based on international best practices and the principles and ethical values of the corporation.
Compliance is responsible for managing the following corporate programs:
| · | Anti-Money Laundering |
| · | International Control Lists |
| · | Fiscal Transparency |
| · | Regulatory Compliance |
| · | Ethics and Conduct |
| · | Anti-Corruption |
| · | Market Abuse Prevention |
| · | Protection of Personal Information |
| · | Occupational Safety and Health |
| · | Consumer Protection |
The management model of the corporate program includes the appointment of Compliance Officers in each company of the Credicorp Group, each of whom reports to the Corporate Compliance Officer of Credicorp, who in turn reports to the Board of Directors and has full autonomy to carry out its duties independently.
| 60 |
The Corporate Compliance Division establishes policies, guidelines and controls that regulate compliance programs to provide reasonable assurance of compliance with local and international standards, mitigation of conduct risks and strengthening of the ethical behavior and values of Credicorp, all with the aim of protecting the reputation and business of Credicorp.
In 2017, the Corporate Compliance Division focused on developing an advanced management model integrating compliance processes into the business and the culture of the organization. This allows us to provide immediate business advice, generate value and provide alternative solutions, and to be innovative in how we apply the benefits of big data and analytics to improve efficiency and effectiveness in the identification of financial crimes and the reduction of non-financial risk.
Fiscal Transparency
Fiscal Transparency oversees the implementation of Foreign Account Tax Compliance Act (FATCA) & Common Reporting Standard (CRS), regulations for Exchanging Tax Information that apply to all Credicorp Financial Institutions. Understanding FATCA & CRS requirements and having a comprehensive FATCA & CRS compliance program is essential for financial institutions (FI) to limit non-compliance risk and meet the obligations set out by the relevant Intergovernmental Agreements (IGAs), the Internal Revenue Service (IRS) and the Organization for Economic Co-operation and Development (OECD). Beyond compliance, Fiscal Transparency initiatives represent a prime opportunity for FI´s to enforce a business culture that promotes the reduction of tax evasion globally.
FATCA implementation at Credicorp: Credicorp has FI´s located in countries under IGA Model I (Bahamas, Luxembourg, Colombia, Cayman Islands and Panama), IGA Model II (Bermuda and Chile), and General Regulation (Bolivia). Obligations of FIs in those locations include complying with Client Due Diligence, Client Annual Reporting and Financial Counterparties Exchange of Status Information.
In the case of Peru, it still holds the category of “Country with an agreement in substance” while the Peruvian government and the Department of Treasury of the US continue with the negotiations to subscribe an IGA. However, the jurisdiction is treated as having an In-Effect agreement and all Peruvian FIs must comply with FATCA obligations.
CRS implementation at Credicorp: Credicorp has FIs located in countries that started CRS implementation in 2016 and that issued their first multiple report in 2017 (Colombia, Cayman Island and Luxembourg). Panama and Chile initiated Client Due Diligence obligations in 2017 and are expected to begin Client Annual Reporting in 2018.
| 61 |
In the case of Peru, in 2017 the Ministry of Economy and Finance (MEF) announced his the intention to subscribe to a CRS agreement; however, to do so, Peru first must become a member of the Organization for Economic Cooperation and Development (OECD). Meanwhile, the Peruvian government is working to promote legislative changes to make possible to meet the OECD requirements to acquire the full member status.
(3) Internal Audit
According to our mission, during 2017 we focused on creating a permanent framework through which we evaluate the effectiveness and efficiency of Credicorp's risk management, control and governance processes, with the aim of improving and protecting the value of the corporation, providing assurance, advice and analysis based on risk. For this purpose, the audit unit formulates the Annual Audit Plan using the Risk Based Audit methodology, which is aligned with the Rules of the IIA Institute of Internal Audit Global and approved by the Peruvian Superintendency of Banks, Insurance and Pension Funds.
During 2017 the result of the internal evaluation, in compliance with Standard 1311 of the IIA for the sixth consecutive year, was "Generally Compliant" (highest possible rating according to the IIA) as a result of the Quality Assurance and Improvement Program. It should be noted that in September 2013, we obtained the International Quality Certification for the Internal Audit Activity with a "Generally Compliant" rating granted by the IIA in the External Quality Assessment, in accordance with Rule 1312 of the IIA. This shows that it complies with the International Standards for Professional Practice, the Fundamental Principles and the IIA Code of Ethics. Currently the Internal Audit Unit (UAI) is managing the new external evaluation (after 5 years) with the Global IIA, which demonstrates its commitment to continuous improvement and compliance with the standard.
In 2017 the Internal Corporate Auditor (CAE) participated as a member of the Financial Services Guidance Committee (FSGC) of the IIA, whose mission is to strategically direct the development of the International Framework for Professional Practice of Internal Auditing (IPPF for its acronyms in English) to support the advancement of professional auditing practice in the global financial services industry by identifying, prioritizing, launching and, ultimately, approving guidelines specifically geared to the special needs of internal auditors who provide services to the financial services industry. In December 2017, the Committee published the first specialized Guide on the Audit of Liquidity Risk.
In September 2017, the Manager of the Internal Audit Unit of the Pacific Group, Mr. Guillermo Zegarra, was appointed as Chaiman of ISACA Lima - Chapter, an association that brings together professionals in information technology (IT) in fields such as information security, IT management, IT risks, IT audit and cybersecurity.
| 62 |
During 2017, 14,572 hours of training were provided with an average of 72 hours / per auditor (above the 40 hours / per auditor recommended by the international practices) in topics related to fraud prevention, the new IFRS 9 on recognition and measurement of financial instruments, new cybersecurity frameworks such as the one of IIA, NIST or the FFIEC, internal quality assessment, data analytics, money laundering, validation of models and other topics of financial and operational audit.
(4) Strategy
Credicorp was established to create a financial group that benefits from synergies among the Group’s companies and our companies’ boards.
Credicorp endeavors to become a leader in each market where we operate. In December 2017, we announced to the market that to enhance the management of Credicorp’s subsidiaries, the Board of Directors unanimously resolved, at its meeting held on Wednesday, December 20 to organize Credicorp’s subsidiaries in four Lines of Business:

1. Includes Banco de Credito del Peru-BCP and Banco de Credito de Bolivia
2. Includes MiBanco and Encumbra
3. Includes Grupo Pacifico and Prima AFP
4. Includes Credicorp Capital, Wealth Management of BCP and Atlantic Security Bank.
This change was effective since April 1 st , 2018.
| 63 |
We have an international presence, offering a diversified business portfolio:

Furthermore, our long-term strategy consists of four strategic pillars: efficient growth; adequate risk management; focus on client satisfaction; and profitability. We seek to achieve an optimal balance of market share, profitability and operating efficiency.
| 64 |
Long-term strategy

Focus on client satisfaction: We are highly dedicated to providing products and services that offer strong value propositions for the clients we serve through each of our businesses. Our main value proposition will be a digital banking initiative that would allow us to get to know and satisfy our customers through a prompt digital solution.
We will continue to educate, and inform our customers by helping them understand the different financial products and services they can access through our distribution channel network and sales force.
We have improved our communication with clients to keep them well informed of the products and services we launch and the product enhancements we implement. We continuously upgrade our platform in response to questions, complaints and requests from customers.
Adequate risk management: This strategic pillar of Credicorp’s strategy is based on the corporate principles approved by the Corporate Governance Committee: involvement of executive management; independence of the risk functions; corporate governance, including risk appetite, corporate risk policies, and risk-adjusted performance measures; and sufficiency and quality of resources dedicated to the risk management role.
Credicorp is committed to applying best practices to assess, quantify and manage the different risks to which we are exposed to, such as credit, market, compliance and operational, reputational, and insurance underwriting risks. We are constantly fine-tuning our models for risk management and our stress-testing methodologies. Our strategy is based on implementing an advanced and fully integrated risk management approach to achieve sustainable growth and enhanced profitability.
| 65 |
In the area of credit risk management, we have implemented enhanced risk-adjusted pricing models and in-house credit models (origination, scoring, behavioral and collection models) that maximize the use of our proprietary information and knowledge about the Peruvian system. These are essential sources of competitive advantage. We have also developed a risk monitoring process that provides a timely and comprehensive picture of risk exposures across risk types and from multiple business lines.
Efficient Growth: Credicorp promotes consciousness in our management of expenses and investments based on: i) productivity management; ii) the establishment of new mechanisms for approving, managing and reporting budget execution; and iii) process improvement. Our efficient growth will be based on the Jaw concept; this means it will be focused on managing the gap between income growth and expenses growth, in an effort to achieve higher growth in income than in expenses.
Profitability: We will continue to manage our businesses with the objective of maximizing our shareholders’ sustainable return on equity.
(5) Review of 2017
The following table provides certain financial information about our principal business segments as of and for the year ended December 31, 2017 (see Note 29 to the Consolidated Financial Statements):
| As of and for the Year ended December 31, 2017 | ||||||||||||||||||||||||
| Total Income | Operating Income(1) | Total Assets | ||||||||||||||||||||||
| (Soles in millions, except percentages) | ||||||||||||||||||||||||
| Amount | % Total | Amount | % Total | Amount | % Total | |||||||||||||||||||
| Banking | 14,071 | 79.4 | 8,154 | 93.0 | 145,999 | 85.6 | ||||||||||||||||||
| Insurance | 2,474 | 14.0 | 619 | 7.1 | 10,988 | 6.4 | ||||||||||||||||||
| Pension fund | 392 | 2.2 | 1 | - | 798 | 0.5 | ||||||||||||||||||
| Investment Banking | 791 | 4.4 | (12 | ) | (0.1 | ) | 12,687 | 7.5 | ||||||||||||||||
| Credicorp | 17,728 | 100.0 | 8,762 | 100.0 | 170,472 | 100.0 | ||||||||||||||||||
| (1) | Operating income includes the net interest income from banking activities in the Banking operating segment; the amount of the net earned premiums, less insurance claims plus net interest income in the Insurance operating segment; the net interest income in the Pension Fund and in the Investment Banking operating segments. |
| 66 |
5.1 Consolidated contributions
The following table sets forth the contribution to the consolidated net income attributable to our equity holders by each of our principal subsidiaries:
| 2015 | 2016 | 2017 | ||||||||||||||||||||||
| (Soles in millions, except percentages) | ||||||||||||||||||||||||
| Amount | % Total | Amount | % Total | Amount | % Total | |||||||||||||||||||
| BCP (1) | 2,420 | 78.3 | 2,708 | 77.0 | 2,937 | 71.8 | ||||||||||||||||||
| BCB (2) | 57 | 1.8 | 81 | 2.3 | 75 | 1.8 | ||||||||||||||||||
| ASHC | 133 | 4.3 | 143 | 4.1 | 175 | 4.3 | ||||||||||||||||||
| Grupo Pacifico (3) | 345 | 11.2 | 299 | 8.5 | 321 | 7.8 | ||||||||||||||||||
| Prima AFP | 162 | 5.2 | 155 | 4.4 | 140 | 3.4 | ||||||||||||||||||
| Credicorp Capital (4) | - | - | 79 | 2.2 | 69 | 1.7 | ||||||||||||||||||
| Others (5) | (25 | ) | (0.8 | ) | 50 | 1.5 | 375 | 9.2 | ||||||||||||||||
| Total | 3,092 | 100.0 | 3,515 | 100.0 | 4,092 | 100.0 | ||||||||||||||||||
| (1) | Includes Mibanco, which contributed S/380.6 million in 2017, S/320.4 million in 2016, S/212.4 million in 2015. Also includes BCP Emisiones Latam 1 S.A. and Solucion EAH (merged with Edyficar Peru S.A). For comparative purposes, BCB 2015 net profit is shown on the BCB line. |
| (2) | Until May 12, 2016, BCB was a subsidiary of BCP. For comparative purposes, the net profit of the BCB for the period 2015 was separated from the net profit of the BCP and presented in this line. |
| (3) | Includes Crediseguro S.A. Seguros Personales y Crediseguro S.A. Generales (incorporated in 2017). |
| (4) | Credicorp Capital Ltd, which mainly includes Credicorp Capital Holding Chile, Credicorp Capital Holding Colombia, Credicorp Capital Securities and Credicorp Capital Holding Peru (which includes Credicorp Capital SAF, Credicorp Capital SAB, Credicorp Capital Sociedad Titulizadora and Credicorp Capital Servicios Financieros). |
| (5) | Includes Credicorp Ltd. which mainly includes expenses and the tax withheld in connection with the estimation of the dividends to be distributed to us by our Peruvian subsidiaries (BCP and Grupo Pacifico); and others. In 2017 includes the profit of the sale of 50% of BCI shares to a third party, additionally includes the sale of the shares of ENEL (profit of the sale of 50% of BCI shares to a third party in 2016). |
The following table shows our main subsidiaries’ percentage contribution to our total assets, total revenues, net income and net equity attributable to Credicorp´s equity holders for the year ended December 31, 2017:
| As of and for the Year ended December 31, 2017 (1) | ||||||||||||||||
| Total Assets | Total Revenue |
Net Income /
(Loss) |
Equity attributable to
Credicorp´s holders |
|||||||||||||
| BCP (2) | 81.9 | % | 73.9 | % | 71.8 | % | 70.8 | % | ||||||||
| BCB | 5.3 | % | 3.5 | % | 1.8 | % | 2.9 | % | ||||||||
| ASHC | 4.1 | % | 1.8 | % | 4.3 | % | 3.8 | % | ||||||||
| Grupo Pacifico | 6.7 | % | 13.9 | % | 7.8 | % | 13.0 | % | ||||||||
| Prima AFP | 0.5 | % | 2.2 | % | 3.4 | % | 2.8 | % | ||||||||
| Credicorp Capital (3) | 2.2 | % | 3.4 | % | 1.7 | % | 3.6 | % | ||||||||
| Others (4) | (0.7 | )% | 1.3 | % | 9.2 | % | 3.1 | % | ||||||||
| Total | 100.0 | % | 100.0 | % | 100.0 | % | 100.0 | % | ||||||||
| (1) | Percentages determined based on the Consolidated Financial Statements. |
| (2) | Includes Mibanco, BCP Emisiones Latam 1 S.A. and Solucion EAH. |
| (3) | Credicorp Capital Ltd, which mainly includes Credicorp Capital Holding Chile, Credicorp Capital Holding Colombia, Credicorp Capital Securities and Credicorp Capital Holding Peru (which includes Credicorp Capital SAF, Credicorp Capital SAB, Credicorp Capital Sociedad Titulizadora and Credicorp Capital Servicios Financieros). |
| (4) | Includes Grupo Credito S.A., CCR Inc, Inversiones Credicorp Bolivia and others. |
| 67 |
The following table shows the main subsidiaries’ percentage contribution of BCP Consolidated to its total assets, total revenues, net income and net equity attributable to BCP’S Consolidated for the year ended December 31, 2017:
| As of and for the Year ended December 31, 2017 (1) | ||||||||||||||||
| Total assets | Total revenue | Net Income/(Loss) | Net equity | |||||||||||||
| BCP Stand-alone | 93.0 | % | 81.4 | % | 86.7 | % | 88.4 | % | ||||||||
| Mibanco | 6.9 | % | 18.4 | % | 13.1 | % | 11.0 | % | ||||||||
| Others (2) | 0.1 | % | 0.2 | % | 0.2 | % | 0.6 | % | ||||||||
| Total | 100.0 | % | 100.0 | % | 100.0 | % | 100.0 | % | ||||||||
| (1) | Percentages determined based on BCP’s consolidated financial statements of and for the year ended December 31, 2017. |
| (2) | Includes Solucion Empresa Administradora Hipotecaria S.A and BCP Emisiones Latam 1 S.A. |
5.2 Financial performance
In 2017, we recorded net income after non-controlling interest of S/ 4,091.8 million (S/ 3,514,6 million in 2016 and S/ 3,092.3 million in 2015). This represented a 16.4% increase compared to 2016, which led to a ROAE of 19.8% (19.6% in 2016 and 20.5% in 2015) and ROAA of 2.5% (2.3% in 2016 and 2.1% in 2015).
The results of 2017 include some non-recurring income, which totaled approximately S/ 444.7 million. The recurring net income totaled S/ 3,647.1 million, which represented a 6.1% increase compared to 2016. As such, excluding the effect of non-recurring items, ROAE and ROAA at Credicorp in 2017 were 17.8% and 2.2%, respectively (vs 19.3% and 2.2% in 2016, respectively).
The main non-recurring income and expenses net of tax are:
| § | Non-financial income due to the sale of BCI shares for S/ 281.0 million; and |
| § | Non-financial income due to the sale of ENEL shares for S/ 164.0 million. |
The main factors behind Credicorp’s results were:
| § | Growth of 2.5% in net interest income in comparison to the level posted in 2016. The increase was primarily attributable to expansion in interest income on securities and interest income on loans, which contributed to the increase of 2.9% compared to the level posted in 2016, all of which offset the increase in interest expenses (4.2% above the level in 2016). The NIM for 2017 was 5.33%, 13 basis points below our NIM for 2016. This indicator was affected by strong growth year-over-year in average interest-earning assets. |
| 68 |
| § | Although gross provisions reduced 0.3% in 2017, net provisions for loan losses increased 0.2% year-over-year due to a lower level of recoveries and reversals during the year in comparison to the level posted in 2016. However, due to strong loan growth in year-end balances, the cost of risk improved and reached a level of 1.78%, comparing favorably to the 1.88% posted in 2016. The credit quality ratios are explained below in section “5.2.1 Assets Structure - (i) Portfolio quality”. |
| § | The 17.9% year-over-year increase in non-financial income was due to growth in net gain on sale of securities (131.9%) and fee income (4.7%). The former was attributable to extraordinary income from our sale in 2017 of shares of BCI and ENEL. |
| § | Net earned premiums increased 1.4% as a result of higher net earned premiums in the Life Insurance Business and, to a lesser degree, in the Property and Casualty business. |
| § | Operating expenses grew 3.4% due to the expansion of salaries and social benefits, and administrative, general and tax expenses, mainly as a result of higher expense on consultants and marketing campaigns due to the Transformation project. |
See Item 5.Operating and financial review and prospects – 5.A. Operating results – (2) Historical Discussion and Analysis - 2.1 Results of Operations for the Three Years Ended December 31, 2015, 2016 and 2017.
(i) Main ratios
| 2015 | 2016 | 2017 | 2016 - 2015 | 2017 - 2016 | ||||||||||||||||
| basis points | ||||||||||||||||||||
| ROAE (1) | 20.5 | % | 19.6 | % | 19.8 | % | (90 | ) | 20 | |||||||||||
| ROAA (2) | 2.1 | % | 2.3 | % | 2.5 | % | 20 | 20 | ||||||||||||
| Net interest margin (3) | 5.45 | % | 5.46 | % | 5.33 | % | 1 | (13 | ) | |||||||||||
| Funding cost (4) | 2.0 | % | 2.1 | % | 2.1 | % | 10 | 0 | ||||||||||||
| Cost of risk (5) | 2.08 | % | 1.88 | % | 1.78 | % | (20 | ) | (10 | ) | ||||||||||
| Loan to deposit (6) | 101.9 | % | 110.3 | % | 103.4 | % | 840 | (690 | ) | |||||||||||
| Internal overdue ratio (7) | 2.56 | % | 2.77 | % | 3.01 | % | 21 | 24 | ||||||||||||
| Non-performing loan ratio (8) | 3.41 | % | 3.66 | % | 3.92 | % | 25 | 26 | ||||||||||||
| Coverage of Internal overdue loans (9) | 166.2 | % | 160.6 | % | 149.0 | % | (560 | ) | (1,160 | ) | ||||||||||
| Coverage on NPL (10) | 124.7 | % | 121.4 | % | 114.3 | % | (330 | ) | (710 | ) | ||||||||||
| Operating efficiency (11) | 43.5 | % | 43.3 | % | 44.0 | % | (20 | ) | 70 | |||||||||||
(1) Net income attributable to Credicorp / Average* equity before non-controlling interest.
(2) Net income attributable to Credicorp / Average* assets.
(3) Net interest margin / Average* interest earning assets.
(4) Interest expense / Average* liabilities
| 69 |
(5) Provisions for loan losses, net of recoveries / Total loans.
(6) Total loans / Total deposits.
(7) Internal overdue loans / Total loans. For the definition of Internal overdue loans See ITEM 3. KEY INFORMATION, 3. A Selected financial data, Note (14).
(8) Non-performing loans / Total loans. Non-performing loans = Internal Overdue Loans + Refinanced Loans + Restructured Loans
(9) Allowance for loan losses / Internal overdue loans.
(10) Allowance for loan losses / Non-performing loans.
(11) (Operating expenses - Other expenses + Acquisition cost) / (Net interest income + Fee income + Net gain on foreign exchange transactions + Net gain from associates + Net earned premiums + Gross margin from medical services).
* Averages are determined as the average of period-beginning and period-ending balances.
5.2.1 Assets structure
Our total assets amounted to S/ 170.5 billion at year end 2017 (S/ 156.4 billion in 2016 and S/ 155.5 billion in 2015). The 9.0% increase in total assets in 2017 as compared to 2016 was a result of: (i) a 30.7% increase in investments available-for-sale (a decrease of 0.4% in 2016 and an increase of 19.2% in 2015) (ii) the growth of our loan portfolio, which grew by 6.0% in 2017 (4.9% in 2016 and 13.6% in 2015), and (iii) a 39.5% increase of cash (which includes cash collateral, reverse repurchase agreements and securities borrowings) mainly at BCP, primarily associated with an increase in cash and reserves held at BCRP (a decrease of 25.7% in 2016 and an increase of 3.2% in 2015). See Item 5.Operating and financial review and prospects – 5.A. Operating results –(3) –Financial Position.
As of December 31, 2017, Credicorp’s total loans increased 6% year-over-year (4.9% and 13.6% in 2016 and 2015, respectively), which represented an expansion of 7.5%, after excluding the impact of the U.S. Dollar depreciation on our loan book (currency-adjusted growth).
In terms of average daily balances, Credicorp’s loan book expanded 1.9% year-over-year, which represents a 3.3% currency-adjusted growth rate. This growth was, primarily due to:
| § | The 3.1% year-over-year increase of our Retail Banking’s loan book, which represented a currency-adjusted growth rate of 3.8% year-over-year; and |
| § | BCP Bolivia and Mibanco’s expansion of their loan books by 15.5% and 8.6%, respectively; which represented currency-adjusted growth rates of 19.2% and 8.8%, respectively. |
| 70 |
The growth was offset by the following segments:
| § | The 1.1% year-over-year decrease of our Wholesale Banking’s loan book, which represented a slight currency-adjusted growth rate of 0.6% year-over-year; and |
| § | ASB’s decrease of 11.1%, which represented a currency-adjusted decrease of 8.3% year-over-year. |
(i) Portfolio quality
In terms of portfolio quality, our internal overdue ratio (which includes loans under legal collection) was 3.01% at the end of 2017, 24 basis points higher than the 2.77% ratio recorded at the end of 2016 (2.56% at the end of 2015). The increase reported in our internal overdue ratio over the last year reflects deterioration in segments such as SME-Pyme, Mortgage, and Wholesale Banking. It is important to keep in mind that traditional delinquency indicators like internal overdue loan ratio continue to be distorted by the presence of loans with real estate collateral (commercial and residential properties). This means that a significant portion of loans that are more than 150 days past due cannot be written off although they are fully provisioned given that it is necessary to first undergo a judicial process to execute foreclosure and liquidate the collateral, which takes on average five years. SME-Pyme and Mortgage were affected by this distortion since approximately 50% of the SME-PYME loans have real estate collateral and all mortages have real estate collateral.
An analysis of the internal overdue ratio by business segment shows that:
| § | Wholesale Banking closed the year with an internal overdue ratio that was higher than the ratio reported last year (0.47% in 2017, 0.29% in 2016 and 0.32% in 2015). However, the ratio continued to reflect the low levels that are typical of this business line. The internal overdue loan portfolio growth rate outpaced the growth rate of the total Wholesale portfolio in a macroeconomic scenario characterized by very low growth, low demand for credit and aggressive competition for good clients, like the clients in this segment. |
| § | In the SME-Business segment, the internal overdue ratio increased 10 basis points as compared to 2016 level (4.59%, 4.49% and 5.21% in 2017, 2016 and 2015, respectively). This was due to low loan growth, measured in year-end balances. It is important to note that the risk of the segment remained within the organization’s risk appetite. This increase was due to the higher growth rate in internal overdue loans compared with the growth of the total SME-Business book. The clients in the SME-Business segment have a high level of real estate coverage, which is currently at approximately 70%. |
| 71 |
| § | The SME-Pyme segment reported a slight increase in its internal overdue ratio (12.61%, 12.41% and 11.10% in 2017, 2016 and 2015, respectively); nonetheless, it is important to note that in March 2017, the ratio hit a peak of 13.14%, mainly due to the impact that the El Niño Phenomenon had on some clients. This point marked a turning point given that in the second half of the year delinquency decreased. It is worth mentioning that the level of real estate guarantees in this segment is approximately 50%, which means that loans that are more than 150 days overdue cannot be written-off. |
| § | The Mortgage segment reported an increase in its internal overdue ratio (3.14%, 2.66% and 2.10% in 2017, 2016 and 2015, respectively), due to the distortion created by the existence of real estate collateral. |
| § | The Consumer segment’s internal overdue ratio in 2017 was 2.93%, a decrease from 3.02% in 2016 (2.62% in 2015). This was due to the reduction in internal overdue loans (in value), which in turn was reinforced by loan growth in the segment. It is important to note that, at the end of 2017, 75% of the portfolio corresponded to vintages from 2016 or later that present a better risk profile than those associated with vintages from 2015 or before, which generated the delinquency problem. The new composition of the portfolio reflects a calibrated profile after policies for risk acceptance were changed, which means that lower level of provisions is required. |
| § | The Credit Card segment’s internal overdue ratio in 2017 was 4.79%, which was an increase from 4.65% in 2016 and 4.17% in 2015. This increase is in line mainly with the delinquency problems faced by some clients in El Niño Phenomenon disaster areas, which was accentuated by the slowdown in loan growth during 2017. |
| § | Mibanco’s internal overdue ratio was 4.68% at the end of 2017 (4.39% in 2016 and 4.76% in 2015). This level is slightly higher than Edyficar’s historic level (approximately 4%), in line with the expiration of the skip program offered to clients affected by El Niño. |
| § | Delinquency ratios at BCP Bolivia have remained at very low levels this year (1.88% in 2017, 1.80% in 2016 and 1.57% in 2015). The increase in internal overdue loans came mainly from SME-Business segment. |
The skip program implemented by BCP and Mibanco due to El Niño was defined in coordination with the SBS of Peru in order to proactively contact customers to offer the re-scheduling of their debt through measures such as: suspending payment of scheduled loan installments for up to six months, and/or extending the tenor of loans for up to an additional year. These efforts were intended to allow clients to focus on their immediate personal needs. The re-scheduling option did not imply a downgrade of the clients’ risk rating; as such their credit history was protected.
Provisions for loan losses (the P&L account) were almost flat (increased by 0.2%). The latter, coupled with portfolio growth resulted in the cost of risk to improve, reaching a 1.78% level in 2017 (1.88% level in 2016 and 2.08% in 2015). This result was even more noteworthy if we consider the provisions set aside in 2017 for the El Niño Phenomenon and the Lava Jato case. The latter reflects the improvements made over the last 3 years in commercial and risk management capabilities, that resulted in new loan vintages with better risk quality since 2016. The internal overdue loan ratio does not show the improvement given that some of these loans, despite being fully provisioned, cannot be charged-off due to the existence of real estate guarantees that require five years on average to liquidate.
| 72 |
At the end of 2017, the coverage ratio was 149.0%, which was a drop from the 160.6% recorded at the end of 2016 (166.2% at the end of 2015), given that growth in the internal overdue loan portfolio outpaced the increase in the allowance for loan losses.
5.2.2 Funding structure
At the end of 2017, Credicorp’s total liabilities were S/148.2 billion, which represents a 8.9% increase as compared to 2016’s figure (S/ 136.3 billion and S/138.8 billion at the end of 2016 and 2015, respectively). See Item 5.Operating and financial review and prospects – 5.A. Operating results – (3) –Financial Position. The increase in total funding was in line with a context marked by low loan growth, which registered a recovery by the end of 2017, and the strategy to maintain internal limits for asset and liability mismatch in terms of both duration and currency. Credicorp’s funding structure, throughout 2017, was characterized by an increase in Deposits’ share of total funding and, in a lesser extent, by an increase in Bonds and notes issued (1.8%).
Deposits continued to represent the main source of financing within total liabilities, with a share of 65.6% for fiscal year 2017 (63% in 2016 and 63.9% in 2015). Increase in deposits was mainly associated with a higher level in time deposits (33.8%) and saving deposits (7.3%).
The increase in time deposits and saving deposits reflected both the positive impact of the Temporary Regimen for Capital Repatriation (tax amnesty that was implemented to achieve capital repatriation of non-declared income) and the initiatives to capture deposits that were rolled out throughout the year. At the subsidiary level and by client type, growth in deposits in 2017 was associated primarily with deposits from individuals through BCP Stand-alone.
Bonds and notes issued maintained their share of BAP’s total funding mix, which was in line with the new debt issuances of BCP Stand-alone during year 2017.
However, the accounts payable related to repurchase agreements and security lending activities, which includes BCRP instruments, posted a drop of -11.3% and represented 9.1% of BAP’s total funding at the end of 2017 (11.1% at the end of 2016 and 10.5% at the end of 2015). The aforementioned was due primarily to the lower volume of repurchase agreements for expansion and substitution repos with BCRP mainly at BCP.
| 73 |
5.2.3 Distribution channels
Credicorp’s distribution network had 9,967 points of access for our clients at the end of 2017, which represented a 3% increase with regard to 2016’s level. This increase was due primarily to efforts to implement Agentes BCP in 2017, which reflected the banking penetration strategy and migration to cost-efficient channels. In the case of BCP Bolivia, the increase in points of contact was due to growth in Agentes BCP, which was in line with the goal to implement 200 agents by the end of 2017.
The table below shows the evolution of the points of contact (branches, ATM, Agentes BCP) of each of Credicorp’s subsidiaries:
| 2015 | 2016 | 2017 | ||||||||||
| BCP | 8,489 | 8,880 | 9,087 | |||||||||
| Mibanco | 323 | 316 | 324 | |||||||||
| BCP Bolivia | 354 | 464 | 555 | |||||||||
| Grupo Pacifico | 150 | 127 | 117 | |||||||||
| Prima AFP | 17 | 18 | 18 | |||||||||
| Credicorp Capital | 15 | 16 | 19 | |||||||||
| Credicorp | 9,348 | 9,821 | 10,120 | |||||||||
5.2.4 Grupo Pacifico
Grupo Pacifico is the second largest Peruvian insurance company, with a market share of 28.88% based on written premiums in 2017 (27.43% in 2016). This market share calculation includes gross written premiums from Pacifico Seguros and Pacifico EPS and represents our total market share in the insurance market and the healthcare sector. Additionally, the company registered the highest growth rate of the Peruvian insurance market, which generated an increase of 1.2 percentage points in market share.
Grupo Pacifico achieved net income of S/ 325.0 million in 2017, 7.17% higher than the S/ 303.3 million reported in 2016 (S/349.5 million in 2015). The aforementioned is a result of a higher net financial income due to (i) extraordinary income from the sale of investments in fixed income, equity and real estate, and (ii) an optimal investment management in terms of profitability and control. Additionally, the annual results include exceptional income from operational activities and a decrease in income tax rate.
| 74 |
These favorable effects offset the lower underwriting result that is explained by i) higher claims associated with El Niño damages, and ii) higher acquisition costs due to an increase of written premiums in the life insurance business.
Gross Written premiums
| S/. in Thousands | 2015 | 2016 | 2017 | |||||||||
| GROSS WRITTEN PREMIUMS (¹) | 2,719,810 | 2,757,044 | 2,943,861 | |||||||||
| Medical Assistance (²)(³) | 360,481 | 381,730 | 393,736 | |||||||||
| Individual Annuity Line | 378,763 | 222,074 | 358,481 | |||||||||
| Automobile | 336,667 | 360,869 | 347,749 | |||||||||
| Credit Life | 300,363 | 354,841 | 415,728 | |||||||||
| Individual Life | 300,117 | 325,031 | 332,781 | |||||||||
| Fire and Allied Lines | 241,487 | 271,742 | 257,288 | |||||||||
| Group Life | 193,952 | 209,093 | 217,577 | |||||||||
| Others | 607,980 | 631,664 | 620,521 | |||||||||
| (1) | Without eliminations. Includes premiums assumed from other companies |
| (2) | Since 2015, corporate health insurance business and medical services (network of clinics, medical centers and laboratories) are excluded from Grupo Pacifico consolidated financial statements. Since 2015, Health insurance only includes Medical Assistance. |
| (3) | The joint venture agreement with Banmedica stipulates that the corporate health insurance business and medical services (network of clinics, medical centers and laboratories) must be reported as an investment in associates. Both businesses are managed by Banmedica and Grupo Pacifico receives 50% of net earnings. In that way, EPS does not consolidate |
Pacifico Seguros reported written premiums of S/ 2,943.9 million in 2017, which represent a 6.7% increase compared to 2016. In that way, the company registered the highest growth rate of the Peruvian insurance market, reaching an increase in market share from 24.4% in 2016 to 25.9% in 2017.
The higher written premiums were mainly due to the increase in the life insurance business, in all its lines, especially in Individual Annuities, Credit Life, and Disability and Survivorship. It is important to mention that the increase in Individual Annuities was due to the higher sales of Vida Garantizada Flex and Renta Flex. These products are focused on collect AFP affiliates surplus as a result of reforms in the private pension system. The aforementioned is related with the release of Law N° 30425 which allows affiliates over the age of 65 years old to choose between receiving a pension or requesting AFPs to free up to 95.5% of their funds.
Nevertheless, written premiums on P&C business registered a decrease, especially in commercial P&C and personal lines due to (i) a market contraction associated with the lower country economic growth, (ii) downward pressure on market rates and (iii) the exchange rate appreciation which affects the accounting of dollar premiums in local currency. In term of market share, Grupo Pacifico maintain stable in the P&C segment with 24.7%.
| 75 |
Claims and Reserves
In 2017, Grupo Pacifico’s net loss ratio was 46.1%, which represented a decrease compared to the 48.5% net loss ratio recorded in 2016.
| Net Loss Ratio (1) | 2015 | 2016 | 2017 | |||||||||
| Property and Casualty | 52.4 | % | 51.4 | % | 54.5 | % | ||||||
| Life business | 39.8 | % | 46.6 | % | 40.7 | % | ||||||
| Health business | - | - | ||||||||||
| Grupo Pacifico (2)(3) | 45.0 | % | 48.5 | % | 46.1 | % | ||||||
| (1) | Net claims / Net earned premiums: Net earned premium does not include the life insurance mathematical reserves estimated for long-term policies. This effect applies for 2015-2016-2017. |
| (2) | 2015 figure does not include Pacifico EPS results due to the agreement with Banmedica |
| (3) | Figures do not include eliminations for Credicorp’s consolidation purposes |
The decrease was caused by a reduction in the life insurance business, especially in Disability and Survivorship, due to the quota share contract (reinsurance contract which Pacifico cedes 50% of claims) that went into effect in January 2017. In contrast, the increase in P&C business is attributable to two lines of business: (i) Commercial P&C, due to the damages caused by El Niño and (ii) Personal Lines, due to the higher claims in Personal accident and homeowners insurance.
Underwriting, clients and reinsurance
Underwriting guidelines for substantially all P&C and health insurance risks are developed by profit centers in collaboration with the actuarial staff. Grupo Pacifico’s P&C unit has an engineering staff which inspects most medium and medium-to-large commercial property insured risks prior to underwriting, whereas third party surveyors are employed to inspect smaller risks and/or lower risk property. Pricing and underwriting guidelines, rates and approval thresholds for these risks are periodically reviewed by the profit centers with the actuarial staff, and informed to the risk committee. Conditions are monitored continuously to ensure they are within competitive market conditions and profitability targets.
| 76 |
Grupo Pacifico’s P&C business transfers risks to reinsurers in order to limit its maximum aggregate potential losses and minimize exposures on large individual risks. Reinsurance is placed with reinsurance companies based on the evaluation of the credit quality of the reinsurer, terms of coverage and price. The P&C business acts as a reinsurer on a very limited basis, providing excess facultative reinsurance capacity to other Peruvian insurers that are unable to satisfy their reinsurance requirements and/or the interests of Peruvian clients in the Latin American region.
Historically, Grupo Pacifico’s P&C business has obtained reinsurance for a substantial portion of its earthquake-related insurance portfolio through excess loss reinsurance treaties. In 2012 Grupo Pacifico’s P&C business negotiated proportional reinsurance support for this portfolio, which it maintains as of December 31, 2017. Grupo Pacifico’s P&C business has property catastrophe reinsurance coverage in place that covers its probable maximum loss under local regulatory requirements. However, there can be no assurance that a major catastrophe would not have a material adverse impact on Grupo Pacifico’s financial condition and/or its operations.
Heavy rains caused by El Niño in early 2017 generated losses in Grupo Pacifico’s P&C business of approximately US$119.2 million. Of these approximately US$119.2 million in losses, 95% was ceded to reinsurers and 5.0% were net retained losses, which were within the risk appetite and risk tolerance parameters set by Grupo Pacifico’s risk management unit and approved by the Risk Management Committee.
Pacifico Vida holds excess of loss reinsurance contracts for Individual Life, Personal Accident, Group Life and Credit Life products; and in the case of Work Compensation Risk Insurance and disability and survivorship, these hold a quota share contract. Catastrophic reinsurance contracts cover all the company’s lines (Individual Life, Personal Accident, Group Life, Credit Life, SCTR and D&S), except for the Individual Annuity line. Premiums ceded to reinsurers represented less than 6.9% of written premiums in 2017.
Investment portfolio
Grupo Pacifico’s investments are made primarily to meet its solvency equity ratio and to provide reserves for its claims. Investments are managed by product within the property and casualty lines, and the life and annuities lines, designed to contain sufficient assets to match the company’s liabilities and to comply with the specific technical requirements of each business line. Grupo Pacifico has adopted strict policies related to investment decisions that are reviewed and approved by Grupo Pacifico’s Board of Directors. Its investment strategy is reviewed by the Investment Committee and the Board of Directors on a monthly basis. Grupo Pacifico invests in local and international markets, emphasizing investments in Peru, the U.S. and Latin America.
| 77 |
As of December 31, 2017, the market value of Grupo Pacifico’s investment portfolio was S/ 8,949 million, which included mainly S/543 million in equity securities, S/1,074 million in investment properties, and S/7,332 million in fixed income instruments. The portfolio is well diversified and it follows an asset-liability management strategy focused on cash flow matching, duration matching and currency matching of assets (portfolio) and liabilities (reserves), and improving the capital structure of the company. Grupo Pacifico’s financial income increased 11.5% in 2017 (S/489.6 million in 2017, S/ 432.0 million in 2016, and S/337.6 million in 2015).
5.2.5 Prima AFP
In 2017, Prima AFP managed 1.7 million affiliate accounts of the Private Pension System (SPP), 0.2 million more than the number of affiliate accounts managed in the previous year, representing 25.5% of market share.
In 2017, Prima AFP’s Funds under Management (FuM) reached S/49.3 billion (S/43.2 billion in 2016 and S/39.3 billion in 2015), which represented a market share of 31.5%. The returns of our funds in the 12 months ended on December 31, 2017 were 4.4%, 9.6%, 12.2% and 12.1% for Funds 0, 1, 2 and 3, respectively.
Given that pension funds are long-term investments, it is best to review their returns over a long-term period. For the 11 years ended December 31, 2017 (since Prima AFP’s entry into the SPP), our funds’ nominal annual profitability were 6.8%, 7.9% and 7.2% for Funds 1, 2 and 3, respectively (not considering the Fund Type Zero). These returns place the company above the SPP in fund’s performance in Funds 1 and 2.
In 2017, Prima AFP recorded revenues of S/384.4 million (S/407.2 million in 2016 and S/402.2 million in 2015) and net income of S/140.1 million (S/155.8 million in 2016 and S/162.1 million in 2015). This decline of financial results is due to reductions in administration fees as explained below.
In December 2016, Prima AFP won the third public tender by offering the lowest mixed-commission scheme fees: 0.18% of monthly income and an annual fee of 1.25% over the client’s funds. This tender process requires that all workers who enter to the SPP for the first time become members of Prima AFP exclusively between June 2017 and May 2019.
In addition, due to the 2012 Pension System Reform, the monthly salary component of the mixed-commission fee scheme dropped from 1.19% to 0.87% in February 2017, and due to the third tender process decreased to 0.18% in June 2017. The fees apply to new and existing affiliates under the mixed-fee scheme.
| 78 |
On the other side, the administration fee of the remuneration based scheme remained in 1.6%, and hasn’t changed since 2012. This fee hasn’t been included in the tender processes held to date.
5.2.6 Credicorp Capital
Credicorp Capital registered Net Income in 2017 of S/. 77.3 million. In a difficult year for the investment banking business, we were able to maintain our leadership position in asset intermediation and financial advisory for the main companies in the region, as well as to grow in our asset management businesses, thereby exceeding the non-financial income obtained in 2016 (growth of 6.4% to S/. 569.2 million).
| § | In Corporate Finance, in a context of lower investments than expected, the pipeline of projects was lower than that observed in previous years. However, we continue with the strengthening of the teams and consolidating our presence in the region, especially in the face of a greater number of cross-border financial consultancies demanded by clients. |
2017 stood out especially for an increased activity in the bond structuring business of Peruvian issuers for the international market, with outstanding examples such as Orazul Energy and Cerro del Aguila. We also had an important participation in the structuring of local bond issuances, allowing us to maintain a leading position in Peru and Chile. On the Equity Capital Markets (ECM) side, we also participated in important transactions, such as the IPO of Nexa Resources and the takeover bid launched by Glencore for Volcan shares.
| § | The Asset Management business had an excellent year in terms of growth in traditional proprietary funds, highlighting the entry of institutional clients in the three countries. Likewise, the commercial approach to more private banking clients, especially in Chile, generated a significant increase in assets managed during the year. |
Also, we continued the expansion of the operations of Credicorp Capital's alternative funds at the regional level, with advances in the development of Infrastructure and Private Debt funds. Within our operations of the year, the sale of Mall Paseo Viña in Chile stood out, which generated a success fee of approximately S/14.6 million.
| 79 |
With respect to Assets under Management (AuM), we have reached approximately S/.58 billion, an increase of 21% compared to 2016. This amount includes assets managed in both proprietary and third-party funds.
| 2015 | 2016 | 2017 | ||||||||||
| Soles in millions | ||||||||||||
| AuM – Credicorp Capital Peru (1) | 17,348 | 23,970 | 24,641 | |||||||||
| AuM – Credicorp Capital Colombia | 5,423 | 7,530 | 10,717 | |||||||||
| AuM – Credicorp Capital Chile | 7,505 | 16,911 | 23,112 | |||||||||
| Total AuM - Credicorp Capital | 30,276 | 48,411 | 58,470 | |||||||||
| Total AuC - Credicorp Capital (2) | 38,885 | 56,337 | 53,796 | |||||||||
| (1) | Includes AuM for which there is a service agreement between ASB and Credicorp Capital for the latter to perform functions as Portfolio Manager (ASB funds in millions of Soles are: S/.4,776, S/.4,553 and S/.4,380 in 2015, 2016 and 2017, respectively). |
| (2) | Assets under custody. |
| · | The Sales & Trading business also faced a difficult year due to political issues in the region and weather issues like El Niño. However, the Fixed Income and Equities teams maintained leadership positions in intermediation in their respective markets and the business was also supported by the good results obtained in operations of Equity Capital Markets (ECM) and Debt Capital Markets (DCM), especially in Peru. |
Finally, in line with the business strategy of working jointly with ASB, the transfer to this vehicle of the International Fixed Income Portfolio was successfully carried out, generating capital and funding efficiencies for Credicorp.
| 80 |
| Traded volume | 2015 | 2016 | 2017 | |||||||||
| Soles in millions | ||||||||||||
| Equity securities – Credicorp Capital Peru 1 | 3,412 | 6,974 | 15,760 | |||||||||
| Fixed income – Credicorp Capital Peru 1 | 2,478 | 6,473 | 11,478 | |||||||||
| Equity securities - Credicorp Capital Colombia 2 | 16,436 | 17,551 | 18,892 | |||||||||
| Fixed income - Credicorp Capital Colombia 2 | 235,029 | 248,338 | 299,423 | |||||||||
| Equity securities – Credicorp Capital Chile 3 | 18,066 | 22,181 | 24,175 | |||||||||
| Fixed income – Credicorp Capital Chile 3 | 111,443 | 74,216 | 98,381 | |||||||||
| (1) | Peru: Lima Stock Exchange information. Fixed Income also includes information from Datatec platform. Does not include repo operations. |
| (2) | Colombia: Colombia Stock Exchange information. Fixed Income also includes Banco de la Republica’s information. Does not consider repo operations. |
| (3) | Chile: Santiago Stock Exchange information. It does not consider repo operations. Fixed Income includes financial intermediation operations. Equity includes operations with investment fund shares and foreign stock. |
(6) Competition
6.1 Banking
6.1.1 Overview
In recent years, several foreign companies have showed interest in entering the Peruvian market while financial companies already in Peru have taken steps to expand operations and develop new businesses.
Throughout 2017, the most relevant events in terms of new entrants or financial institutions that have been granted new licensees are:
| · | In April 2016, the SBS authorized JP Morgan to operate as an investment bank in Peru, commencing operations in March 2017. Over the last 20 years, JP Morgan has had a representative office in Peru and has given counseling to local businesses about the issue of shares in the United States. Now, as an investment bank, it can expand its business in Peru by getting involved in sales and trading of BCRP and Government instruments, as well as foreign exchange trading. |
| · | In June 2017, the SBS authorized the merger by absorption between Los Andes (a rural savings bank from the Peruvian financial system) and Edpyme Solidaridad, merging the latter into the former. This reduces the number of entities in the Peruvian financial system. Additionally, in November 2017, Los Andes bought part of the portfolio from its peer, “La Santa”, increasing its market share even more. |
| · | In August 2017, the SBS authorized the voluntary dissolution and subsequent initiation of the liquidation process of Leasing Peru. In October 2017, Leasing Peru, at the time a member of the Bancolombia Group, approved the distribution of its capital stock and final Income Statement after all of their fixed assets, making the operations closure official. |
| 81 |
While new entries into the Peruvian banking system over the last three years have not been as pronounced as in previous years, there is evidence that additional foreign-owned banks are taking steps to begin operations in the Peruvian market. For example, Itau Unibanco, Bladex, Morgan Stanley, Bank of Tokyo Mitsubishi and Sumitomo Mitsui Banking opened representative offices in Peru.
6.1.2 Peruvian financial system
On December 31, 2017, the Peruvian financial system consisted of the following principal participants: the Peruvian Central Bank, the SBS, 55 financial institutions and four state-owned banks (not including the Peruvian Central Bank): Banco de la Nacion, COFIDE, Agrobanco and Fondo MiVivienda.
| 2017 | ||||||||||||||||
|
Number of
entities |
Assets |
Deposits
(Soles in 000) |
Loans | |||||||||||||
| Multiple banking | 16 | 371,302,881 | 229,357,835 | 245,551,558 | ||||||||||||
| Financial firms | 11 | 13,327,728 | 6,640,184 | 11,259,514 | ||||||||||||
| Municipal savings banks | 12 | 24,127,028 | 18,872,736 | 19,693,092 | ||||||||||||
| Rural savings banks | 6 | 1,786,580 | 1,095,349 | 1,453,036 | ||||||||||||
| Edpymes | 9 | 2,284,702 | - | 1,993,326 | ||||||||||||
| Leasing companies | 1 | 247,266 | - | 190,607 | ||||||||||||
| Total | 55 | 413,076,185 | 255,966,104 | 280,141,133 | ||||||||||||
| (i) | Multiple banking |
| Major Peruvian Banks | As % of Peruvian Financial System | As % of Multiple Banking | ||||||||||||||||||||||
| as of December 31, 2017 | Assets | Deposits | Loans | Assets | Deposits | Loans | ||||||||||||||||||
| BCP Stand-alone | 31.4 | % | 29.9 | % | 29.5 | % | 34.9 | % | 33.4 | % | 33.6 | % | ||||||||||||
| BBVA Banco Continental | 18.5 | % | 19.0 | % | 18.5 | % | 20.6 | % | 21.2 | % | 21.1 | % | ||||||||||||
| Scotiabank Peru | 14.0 | % | 13.0 | % | 14.7 | % | 15.6 | % | 14.6 | % | 16.8 | % | ||||||||||||
| Interbank | 11.0 | % | 11.8 | % | 10.0 | % | 12.3 | % | 13.1 | % | 11.4 | % | ||||||||||||
| Banco Interamericano de Finanzas | 3.2 | % | 3.5 | % | 3.3 | % | 3.5 | % | 3.9 | % | 3.8 | % | ||||||||||||
| Mibanco | 2.9 | % | 2.9 | % | 3.3 | % | 3.3 | % | 3.2 | % | 3.8 | % | ||||||||||||
As of December 31, 2017, BCP Stand-alone ranked first among all Peruvian banks in terms of assets, deposits and loans.
In 2017, the Peruvian banking system reported a balance of loans of S/164,708 million in local currency and US$24,944 million in foreign currency. These figures represented an annual expansion of loan balances of 2.7% and 11.7%, respectively (5.5% and 2.2%, respectively, from December 31, 2015 to December 31, 2016). As a result, the dollarization of loans reached 32.9% at the end of 2017 (compared to 31.8% in 2016 and 32.9% in 2015). As of December 31, 2017, the total amount of multiple banking deposits was S/229,358 million, which represented a dollarization rate of 42.9% (compared to 47.6% in 2016 and 52.9% in 2015).
| 82 |
As part of its plan to decrease the dollarization of loans, BRCP established a de-dollarization program that is explained in the “Item 4. Information on the company – 4.B Business overview – (9) Supervision and Regulation – 9.2 BCP and Mibanco - 9.2.7 The Peruvian Central bank monetary and macro prudential policy.”
Peru’s capital ratio (regulatory capital/risk-weighted assets) reached 15.18% as of December 31, 2017, which was above the 10% legal minimum that became effective in July 2011. This represented an increase of 17 basis points from the capital ratio reported at the end of December 2016 (15.01%). In 2016, the ratio increased 84 basis points from the ratio of 14.17% as of December 31, 2015.
Peru’s loan portfolio quality indicators deteriorated in 2017. As of December 31, 2017, internal overdue ratio reached 3.04%, 24 basis points more than the ratio reported as of December 31, 2016 (2.8%). At the end of 2016, the ratio had increased 7 basis points compared to December 31, 2015 (2.54%). Also, the internal overdue, refinanced and re-structured loans over total loans ratio was 4.39% as of December 31, 2017, 37 basis points higher than the figure reported at year-end 2016, 4.02% (3.6% in 2015). Similarly, the coverage ratio of Peru’s internal overdue loan portfolio was 152.6% as of December 31, 2017 (compared to 160.6% as of December 31, 2016 and 166.6% as of December 31, 2015).
Finally, the liquidity of the banking system remained at high and comfortable levels. The local currency liquidity ratio and foreign currency liquidity ratio closed 2017 at 34.3% and 44.9%, respectively (27.4% and 43.9% in 2016; and 26.5% and 46.6% in 2015, respectively). These ratio levels were well above the minimums required by SBS regulations (8% in local currency and 20% in foreign currency).
(ii) Other financial institutions
BCP faced strong competition from credit providers, primarily with respect to consumer loans and SME-Pyme loans. SME-Pyme loan providers lent S/14.9 billion in 2017, compared to the S/12.9 billion in 2016 and S/11.4 billion in 2015. In 2017, overall SME-Pyme loans to customers of other financial institutions represented 21.3% of the total in the financial system (compared to 19% in 2016 and 17.3% in 2015).
Consumer loan providers lent S/10.5 billion in 2017, compared to the S/8.9 billion and S/7.6 billion in 2016 and 2015, respectively. In 2017, overall loans to consumers of other financial institutions represented 19.3% of total loans in the financial system (compared to 17.5% in 2016 and 16.3% in 2015).
| 83 |
6.2 Investment banking
Credicorp Capital is organized around its three main business units: Asset Management, Sales & Trading and Corporate Finance. In addition, the company has organized a regional business support team, has structured an integrated regional sales force and has a centrally managed Treasury Department.
In the Asset Management business, Credicorp Capital continued to strengthen its proprietary funds with an increasing participation by institutional and retail clients (supported by the development of Wealth Management teams in Colombia and Chile and an already strong team in Peru). As an example of its position, Credicorp Capital maintains its leadership in Mutual Funds Peru with a market share of 40.8% of total market AuMs. Also, the company keeps developing alternative funds in Real Estate, Infrastructure and Private Debt at a regional level, and offers third-party funds from global asset managers to its clients.
In the Sales & Trading business, the brokerage house in Peru reaffirmed its leadership, reaching market shares of 38% and 16%, in equities (1 st place) and fixed income (2 nd place), respectively (Source: Lima Stock Exchange). In the same way, the brokerage company in Colombia reached the first place among brokers in equities and fixed income with 26% and 23% (Source: Colombia Stock Exchange), respectively. Finally, in Chile, Credicorp Capital reached the 4th place in equities with 9% and a 2 nd place in fixed income with a 12% share in proprietary volumes (Source: Santiago Stock Exchange).
In the Corporate Finance business, we maintained a strong position and our teams are recognized in Peru and Chile. Some of the main highlights are the business of Capital Markets and Lending in Peru and M&A and Capital Markets in Chile. Colombia’s team is less known, but there is a growing opportunity to build its reputation as financial advisors for infrastructure projects.
Finally, Credicorp Capital also offers Trust Services to its clients in Peru and Colombia. In Peru, we have a very strong leadership position in fiduciary and custody services to retail and institutional clients, but growth is limited by market size. On the other hand, we still have a very low market share in fiduciary services in Colombia, but it has become a high-growing business.
| 84 |
6.3 Insurance
The Peruvian insurance market is highly concentrated. As of December 31, 2017, four companies accounted for 84.6% of the market share by premiums, and the leading two had a combined market share of 61.7%. Together, Pacifico Seguros and Pacifico EPS constituted the second largest insurance company in Peru, with a 28.7% market share. Peruvian insurance companies compete principally on the basis of price, as well as on the basis of brand recognition, customer service and product features. Grupo Pacifico’s insurance businesses believe that their competitive pricing, strong and positive image, and quality of customer service are significant aspects of their overall competitiveness. While increased foreign entry into the Peruvian insurance market may put additional pressure on premium rates, particularly for commercial coverage, Grupo Pacifico believes that foreign competition will in the long-term increase the quality and strength of the industry. Grupo Pacifico believes that its size and its extensive experience in the Peruvian insurance market provide it with a competitive advantage over foreign competitors.
However, competition in the Peruvian insurance industry has increased substantially since the industry was deregulated in 1991, with particularly strong competition in the area of large commercial policies, for which rates and coverage typically are negotiated individually. A loss by Grupo Pacifico to competitors of even a small number of major customers or brokers could have a material impact on Grupo Pacifico’s premium levels and market share.
(7) Peruvian government and economy
While we are incorporated in Bermuda, most of BCP and Grupo Pacifico’s operations and customers are located in Peru. On the other hand, although ASHC is based outside of Peru, a substantial number of its customers are also located in Peru. Therefore, the results of our operations and our financial health could be affected by changes in economic or other policies of the Peruvian government. We are also exposed to other types of changes in Peruvian economic conditions, such as the depreciation of the Sol relative to the U.S. Dollar or social unrest related to extractive industries such as mining. The level of economic activity in Peru is also very important for our financial results and the normal conduct of our business.
7.1 Peruvian government
During the past several decades, Peru has had a history of political instability that has included several military coups and multiple government changes. On many occasions, changes in Peru’s government have altered the nation’s economy, financial system, and agricultural sector, among other components of its infrastructure. In 1987, President Alan Garcia attempted to nationalize the banking system, including BCP. At that time, the majority shareholders of BCP sold a controlling interest in BCP to its employees, which prevented the government from assuming control of BCP.
| 85 |
Beginning in 1990, President Alberto Fujimori implemented a series of market-oriented reforms; since that time, these reforms have largely remained in place. After President Fujimori resigned in November 2000 following a series of corruption cases, a transitional government was arranged and elections were called in April 2001. Alejandro Toledo won the elections and took office that year, maintaining most of the economic policies of the prior decade. In 2006, former president Alan Garcia was elected again and, unlike his first term in the 1980s, maintained the same market-oriented economic policies of prior governments.
In 2011, Ollanta Humala was elected president. While his initial proposals as a candidate were designed to change radically the existing market-oriented policies and move toward a more state-run economy, his first cabinet changed their approach upon taking office, especially after President Humala chose Luis Castilla, who had worked in the previous administration as Deputy Finance Minister, to serve as Minister of Finance. President Humala also decided to ratify the appointment of the Central Bank’s president, Julio Velarde, which was perceived as an attempt to gain confidence from business leaders and financial markets. Both appointments contributed to a recovery in Peru’s investment climate, which had deteriorated during the presidential campaign. Economic growth in 2011 and 2012 reached 6.5% and 6.0%, respectively, and both rates were seen as being in line with the country’s potential output. In 2013, however, the economy’s growth rate decelerated to 5.8% amid concerns about metal prices (especially gold, which fell 28.3% that year), monetary policy in the United States and Chinese growth, which also affected the performance of other emerging markets. In 2014, supply-side shocks in the mining and fishing industries led to a 2.3% contraction in the primary sector, its worst performance since 1992. This added to the pressures of a difficult international environment and as a result the economy grew 2.4%. In 2015, GDP grew 3.3%, as economic activity was boosted by primary sector growth (6.9%). The partial reversal of the supply-side shocks experienced during 2014 and the increase of production capacity in the copper industry due to the result of operations of the mines in Toromocho and Constancia, and the ramp-up of Cerro Verde’s expansion, contributed to the GDP growth in 2015.
In 2016, new presidential elections were held, with a first round on April 10, 2016. A second round between candidates Ms. Keiko Fujimori and Mr. Pedro Pablo Kuczynski was necessary as none of the candidates obtained more than 50% of the valid votes. The second round was held on June 5, 2016, and Pedro Pablo Kuczynski was elected president for the 2016-2021 period with 50.12% of the vote. President Kuczynski, a former Wall Street veteran and World Bank official, was expected to maintain the current economic model. This model includes: (i) maintaining the Constitution and respect for the already signed trade agreements, (ii) bolstering private investment, and (iii) decreasing the extent of the informal economy. Moreover, one of President Kuczynski’s main objectives was for Peru to enter the OECD by 2021. However, President Kuczynski faced a minority in Congress (17 of 130 seats) and political negotiation is a key factor to carry out his political agenda. To compound the difficulties that President Kuczynski faced, in October 2016 Congress granted, for a period of 90 days, legislative powers to the Executive Branch relating to (i) economic recovery and formalization, (ii) administrative simplification, (iii) water and sanitation, (iv) combatting corruption, and (v) citizen security. The Executive Branch enacted a total of 112 legislative decrees under this authority. Moreover, amid the Lava-jato case investigations that started in early 2017, two Presidential Vacancy motions were proposed by Congress. Amid high political turmoil, Pedro Pablo Kuczynski resigned as President and his first vice-president, Martin Vizcarra, took office in March 2018
See “Item 3. Key Information — 3.D Risk Factors — (1) Our geographic location exposes us to risk related to Peruvian political, social and economic conditions .”
| 86 |
7.2 Peruvian economy
The adoption of market-oriented macroeconomic policies since the early 1990s and a positive outlook for Peru’s economy among international investors has allowed Peru to grow at an average rate of 4.9% since 2000. Peru’s economy even experienced a positive, albeit small, growth rate during the global financial crisis in 2009 (1.0%). In subsequent years, and as international financial conditions improved, growth resumed in most economies, and Peru continued to outperform the global economy, growing 6.0% in 2012 and 5.8% in 2013. In 2014, the economy decelerated and grew 2.4% because of lower international prices for metals, supply-side shocks in the mining, fishing and coffee industries and a contraction of public investment at the subnational level. In 2015, the economy grew 3.3%, at a faster pace compared to 2014 due to the growth in the primary sector (6.9%). In 2016, the economy grew 3.9%, above growth rates for 2015 and 2014, mainly due to the expansion of the mining sector (21.2%) as operations from Las Bambas and Cerro Verde’s expansion reached peak capacity and copper production grew 40.1%. In 2017, GDP grew 2.5% due to the adverse effects of El Niño, the Lava-Jato case and the context of high political noise.
Peruvian economic policy is based on three pillars: trade policy, fiscal policy and monetary policy.
Peru’s has maintained an open trade policy for more than two decades. In 2007, Peru signed a Free Trade Agreement (FTA) with the United States, which went into effect in 2009, and made permanent the special access to the U.S. market previously enjoyed under the Andean Trade Promotion and Drug Eradication Act (ATPDEA). Exports from Peru to the United States were US$6.9 billion in 2017 (15.3% of Peru’s total exports). With the available information, the FTA with United States has not been affected after the U.S. Presidential Election. In terms of bilateral trade, Peru remains as a net importer from the U.S. At the end of 2017, the amount of net imports reached US$824 million and did not represent major competition for the U.S. industrial sector. Another trade agreement was signed with China in 2009 and went into effect in 2011. Exports from Peru to China reached US$11.6 billion in 2017 (25.8% of total exports). In addition, Peru has also signed trade agreements with the European Union, Japan, South Korea, Singapore and Thailand, among others. Within Latin America, Peru has trade agreements with Chile, Colombia and Mexico and is a founding member, along with these countries, of the Alliance of the Pacific. Furthermore, the country is part of the Trans-Pacific Partnership (TPP), a trade agreement involving twelve Pacific Rim countries. However, because the President of the United States has indicated that United States would not ratify the agreement, the state of the TPP remains uncertain.
| 87 |
In 2017, exports increased 21.3% compared to 2016, to US$44.9 billion. Imports amounted to US$38.7 billion, and grew 10.0% compared to 2016. As a result, the 2017 trade surplus was US$6.3 billion, the highest it has been since 2012. As a result, the current account deficit represented 1.3% of GDP, the lowest in 9 years.
Peruvian policymakers have also maintained an orthodox approach with regards to fiscal policy and government spending. The debt-to-GDP ratio has fallen from 51.1% in 1999 to 24.8% in 2017 as the government cut its spending and privatized some state-run enterprises. The fiscal position has also benefited from the accumulation of surpluses over the major part of the last decade. In 1999, Congress approved the Law of Fiscal Responsibility and Transparency, which includes the following rules: (i) the fiscal deficit cannot exceed 1% of GDP; (ii) spending corresponding to government consumption cannot grow above 4% in real terms; and (iii) in years in which general elections take place, government spending in the first seven months of the year shall not exceed 60% of the budget for such year. In 2013, these measures were further refined, following the best international practices, with the approval of the Law Strengthening Fiscal Responsibility and Transparency, which introduced a structural-guidance approach based on the evolution of structural commodity prices and potential GDP and established that the structural fiscal deficit cannot exceed 1% of GDP. While the 1999 framework helped the country to reduce its debt, the changes introduced in 2013 allow for the implementation of counter-cyclical policy (when a negative output gap of more than 2% of potential GDP exists, the spending limit can be adjusted by, at most, 0.5% of GDP, and corrective measures should be employed once the output gap falls below 2%) and delineates the responsibilities of national, regional and local governments (the latter two can only borrow for investment projects and debt cannot exceed the four-year moving average of annual revenues). In March 2016, Congress approved the bill that establishes the gradual convergence of the structural deficit for 2017 (1.5%, previously 2.5%) and 2018 (1.0%, previously 2.0%). These rules, together with low debt levels and fiscal savings of about 15% of GDP have allowed Peru to not only retain its investment grade status but also to improve its credit rating, standing at BBB+ for S&P as well as Fitch Ratings and A3 for Moody’s.
| 88 |
The new government introduced changes to the fiscal rules amid the legislative powers granted by Congress to the Executive Branch. The following changes are among the most notable: (i) the migration from a structural framework to a conventional deficit rule, with an expected trajectory of 2.5% of GDP in 2017, 2.3% in 2018, 2.0% in 2019, 1.5% in 2020 and 1.0% in 2021; (ii) the legal limit to public debt of the non-financial public sector is kept at 30% of GDP, but, exceptionally, a deviation of up to 4 bps in cases of financial volatility (and if other fiscal rules are fulfilled) is allowed; (iii) a limit is established for the real growth of non-financial public spending from the General Government. The limit is the upper bound of a 20-year average GDP growth +/- 1bps (the 20-year average includes: the 15 previous years, the estimate for the current year, and forecast for the 4 years ahead); (iv) a limit to the real growth of current spending from the General Government, excluding maintenance expenditure, which is the lower bound of the range referred to in item (iii); and (v) simplification of fiscal rules of subnational governments. After El Niño in 2017, the conventional deficit rule referred to in item (i), was modified in order to comply with the Reconstruction spending assumed by the Government. The new trajectory for the conventional fiscal deficit was set to 3.0% of the GDP in 2017, 3.5% in 2018, 2.9% in 2019, 2.0% in 2020 and 1.0% in 2021.
In 2017, the non-financial public sector reported a deficit equivalent to 3.2% of GDP. Fiscal revenues represented 18.0% of GDP and stood at its minimum level in 14 years. It should be noted, however, that in the fourth quarter of 2017, fiscal revenues of the General Government increased 8.4% YoY in real terms, the highest expansion in 19 quarters due to the improvement in terms of trade. In contrast, after a 10.1% YoY contraction in the first semester of 2017, in the fourth quarter of 2017, public investment of the General Government grew 12.2% YoY in real terms. Hence, in 2017 it registered a 3.3% expansion compared to the -3.1% achieved on 2016. Peru ended 2017 as the only MILA country with an investment grade that holds a stable outlook from the three main Credit Rating Agencies.
In 2016, relying upon legislative powers granted by Congress, the Executive branch established changes on tax measures. Some of the most important decrees in tax measures were: (i) the VAT will be cut from 18% to 17% from July 2017 onwards, provided that government revenues from VAT excluding tax refunds reach 7.2% of GDP by May 2017; (ii) the corporate income tax was increased from 28% to 29.5%, the dividend tax was cut from 6.8% to 5% (this reverted the changes established by the previous administration in which the corporate income tax would be cut gradually and reach 26% by 2019), while additional deductions to the individual income tax were established in Health, Housing Spending, and others; and (iii) tax amnesty was implemented to achieve capital repatriation of non-declared income, with a 10% rate for income that is declared and 7% for capital that is repatriated and invested, among other measures. Regarding item (i), the condition was not met, and the VAT tax rate remains at 18%. Moreover, the tax amnesty of item (iii) enabled fiscal revenues for a total of S/ 1,007 million during 2017.
| 89 |
The BCRP, which is officially autonomous and presides over a system of reserve banking, is responsible for monetary policy. In 2002, BCRP set an inflation target of 2.5% (+/-1 %), which it later reduced to 2.0% (+/-1%) in 2007. The mid-point of the target range of 2.0% is the lowest in Latin America and reflects the Central Bank’s commitment to price stability. BCRP also has considerable foreign reserves, equivalent to approximately 30% of GDP as of year-end 2017, and other mechanisms to provide liquidity to Peru’s domestic financial system. The Central Bank also sets regulations for the financial system, including pension funds, in coordination with the SBS. Finally, the currency regime in Peru does not have currency controls or barriers to capital inflows but has the Central Bank as an important player in the market, selling or buying foreign currency in order to soften volatility.
During 2017, the Central Bank (BCRP) lowered its reference rate from 4.25% on December 2016 to 3.25% on December 2017, which entails a 100 bps reduction in a year. The stimulus from the monetary authority was in line with annual inflation, which lowered from 4.00% on March 2017 (mainly affected by El Niño’s effect on food prices) to 1.4% on December 2017 (as the supply-side shock reversed). Moreover, economic activity grew consistently below its potential during 2017, which gave space to the BCRP to apply monetary stimulus. In January 2018, the Central Bank made another 25 bps rate cut which took the reference rate to 3.00%, in order to maintain the level of monetary stimulus.
During 2016 the Central Bank increased the minimum percentage for current account deposits in local currency subject to reserve requirements, from 0.75% at the close of 2015 to 1.00% by March 2016, and in 2017 made no changes to this ruling. Moreover, in 2017 the BCRP lowered its reserve requirements in local currency (from 6.5% on December 2016 to 5.0% on April 2017) and in foreign currency (from 70% on December 2016 to 40% on December 2017). The BCRP continued to lower the marginal reserve requirements to 39% on January 2018, 38% on February 2018 and 37% on March 2018.
Inflation in 2017 was 1.4%, below the 3.2% print of 2016 and below the mid-point of the target range (1-3%) of the Central Bank for the first time in 8 years. Similar to 2016, Peru recorded an inflation rate lower than that observed in other countries in the region (Mexico: 6.8%, Colombia: 4.1%, Brazil: 3.0%, Chile: 2.3%). Also, at the end of 2017, the exchange rate was at S/ 3.241 per U.S. Dollar, which represents an annual appreciation of 3.5%. This represented the second consecutive year of appreciation for the Sol in a context were the price of copper increased 32% and the trade balance surplus reached a maximum level since 2012. Moreover, the Central Bank made net purchases for US$ 5.2 billion, the highest amount since 2012, in order to reduce appreciation pressures on the Sol.
| 90 |
Also, in 2016, the Central Bank lowered its outstanding FX swaps (sales) from a maximum of S/34.4 billion in February 2016 to S/0.5 billion at the close of 2016. By January 2017, the outstanding FX swaps (sales) was null.
(8) The Peruvian financial system
As our activities are conducted primarily through banking and insurance subsidiaries operating in Peru, a summary of the Peruvian financial system is set forth below.
8.1 General
Peruvian Law No. 26702 (“Peruvian Banking Law” or “Law No. 26702”) regulates Peruvian financial and insurance companies. In general, it provides for loan loss reserve standards, brings asset risk weighting in line with Basel Committee on Banking Regulations and Supervisory Practices of International Settlements (or the Basel Accord) guidelines, broadens supervision of financial institutions by the SBS to include holding companies, and includes specific treatment of a series of recently developed products in the capital markets and derivatives areas.
8.2 The Peruvian Central Bank
The Peruvian Central Bank was established in 1922. Pursuant to the Peruvian Constitution, its primary role is to ensure the stability of the Peruvian monetary system. The Peruvian Central Bank regulates Peru’s money supply, administers international reserves, issues currency, determines Peru’s balance of payments and other monetary accounts, and furnishes information regarding the country’s financial situation. It also represents the government of Peru at the IMF and the Latin American Reserve Fund (a financial institution whose purpose is to provide balance of payments assistance to its member countries by granting credits or guaranteeing loans to third parties).
The highest decision-making authority within the Peruvian Central Bank is its seven-member board of directors. Each director serves a five-year term. Of the seven directors, four are selected by the executive branch and three are selected by the Congress. The Chairman of the Peruvian Central Bank is one of the executive branch nominees but must be approved by Peru’s Congress.
| 91 |
The Peruvian Central Bank’s board of directors develops and oversees monetary policy, establishes reserve requirements for entities within the financial system, and approves guidelines for the management of international reserves. All entities within the financial system are required to comply with the decisions of the Peruvian Central Bank.
8.3 The Superintendency of banks, insurance and pension funds (SBS)
The SBS, whose authority and activities are discussed in “—(9) Supervision and Regulation” is the regulatory authority in charge of implementing and enforcing Law No. 26702 and, more generally, supervising and regulating all financial, insurance and pension fund institutions in Peru.
In June 2008, Legislative Decree 1028 and 1052 were approved modifying Law No. 26702 with the following objectives: (i) to strengthen and to increase competitiveness, (ii) to implement Basel II and (iii) to adapt Peru’s existing regulatory framework to the FTA signed between Peru and the United States.
The main amendments defined in Law No. 1028 were designed to promote the development of Peruvian capital markets by extending the range of financial services that could be offered by microfinance institutions (i.e., non-banks) without requiring SBS authorization. Law No. 1028 also modified the framework in which the Peruvian financial system is to be harmonized with the international standards established by the Basel II Accord (which aims to minimize the issues regarding regulatory arbitrage). Since July 2009, Peruvian financial institutions generally have applied a standardized method to calculate their capital requirement related to credit, market and operational risk. As an alternative to the standardized method, financial institutions may request authorization from the SBS to use different models for calculating the reserve amount associated with any of these three risks. In July 2009, the SBS started receiving applications to use alternative models, referred to as Internal Models Methods. If the amount of an institution’s reserve requirements would be higher using the standard model than it would be using the approved Internal Models Method, then the institution will have to maintain between 80% and 95% of the standard amount during a phase-in period. Even after the phase-in period, institutions using an Internal Models Method will be subject to regulatory capital floors.
Law No. 1052 aims to include and synchronize Law No. 26702 and the FTA’s framework, particularly regarding insurance services. The amendments allow companies to offer cross-border services and have simplified the process for international institutions to enter into the Peruvian market by establishing subsidiaries.
| 92 |
8.4 Financial system institutions
Under Peruvian law, financial institutions are classified as banks, financing companies, other non-banking institutions, specialized companies and investment banks. BCP is classified as a bank.
8.4.1 Banks
A bank is defined by Law No. 26702 as an enterprise whose principal business consists of (i) receiving money from the public, whether by deposits or by any other form of contract, and (ii) using such money (together with the bank’s own capital and funds obtained from other sources) to grant loans or discount documents, or in operations that are subject to market risks.
Banks are permitted to carry out various types of financial operations, including the following:
| (i) | receiving demand deposits, time deposits, savings deposits and deposits in trust; |
| (ii) | granting direct loans; |
| (iii) | discounting or advancing funds against bills of exchange, promissory notes and other credit instruments; |
| (iv) | granting mortgage loans and accepting bills of exchange in connection with the mortgage loans; |
| (v) | granting conditional and unconditional guaranties; |
| (vi) | issuing, confirming, receiving and discounting letters of credit; |
| (vii) | acquiring and discounting certificates of deposit, warehouse receipts, bills of exchange and invoices of commercial transactions; |
| (viii) | performing credit operations with local and foreign banks, as well as making deposits in those institutions; |
| (ix) | issuing and placing local currency and foreign currency bonds, as well as promissory notes and negotiable certificates of deposits; |
| (x) | issuing certificates in foreign currency and entering into foreign exchange transactions; |
| (xi) | purchasing banks and non-Peruvian institutions which conduct financial intermediation or securities exchange transactions in order to maintain an international presence; |
| (xii) | purchasing, holding and selling gold and silver as well as stocks and bonds listed on one of the Peruvian stock exchanges and issued by companies incorporated in Peru; |
| (xiii) | acting as financial agent for investments in Peru for external parties; |
| 93 |
| (xiv) | purchasing, holding and selling instruments evidencing public debt, whether internal or external, as well as obligations of the Peruvian Central Bank; |
| (xv) | making collections, payments and transfers of funds; |
| (xvi) | receiving securities and other assets in trust and leasing safety deposit boxes; and |
| (xvii) | issuing and administering credit cards and accepting and performing trust functions. |
In addition, banks may carry out financial leasing operations by forming separate departments or subsidiaries. Banks may also promote and direct operations in foreign commerce, underwrite initial public offerings, and provide financial advisory services apart from the administration of their clients’ investment portfolios. By forming a separate department within the bank, a bank may also act as a trustee for trust agreements.
Law No. 26702 authorizes banks to operate, through their subsidiaries, warehouse companies and securities brokerage companies. Banks may also establish and administer mutual funds.
Peruvian branches of foreign banks enjoy the same rights and are subject to the same obligations as Peruvian banks. Multinational banks, with operations in various countries, may perform the same activities as Peruvian banks, although their foreign activities are not subject to Peruvian regulations. To carry out banking operations in local Peruvian markets, multinational banks must maintain a certain portion of their capital in Peru, in at least the minimum amount that is required for Peruvian banks.
8.4.2 Finance companies
Under Law No. 26702, finance companies are authorized to carry out the same operations as banks, with the exception of (i) issuing loans as overdrafts in checking accounts and (ii) participating in derivative operations. These operations can be carried out by finance companies only if they fulfill the requirements stated by the SBS.
8.4.3 Other financial institutions
The Peruvian financial system has a number of less significant entities which may provide credit, accept deposits or otherwise act as financial intermediaries on a limited basis. Leasing companies specialize in financial leasing operations where goods are leased over the term of the contract and in which one party has the option of purchasing the goods at a predetermined price. Savings and loans associations or cooperatives may accept certain types of savings deposits and provide other similar financial services.
| 94 |
Peru also has numerous mutual housing associations, municipal savings and credit associations, savings and credit cooperatives and municipal credit bureaus. Over the past five years the entry of new participants, including foreign banks and non-bank financial institutions, has increased the level of competition in Peru.
8.4.4 Insurance companies
Since the Peruvian insurance industry was deregulated in 1991, insurance companies have been authorized to conduct all types of operations and to enter into all forms of agreements that are needed to offer risk coverage to customers. Insurance companies may also invest in financial and non-financial assets, although they are subject to the regulations on investments and reserves established in Law No. 26702 and the regulations issued by the SBS.
Law No. 26702 is the principal law governing insurance companies in Peru. The SBS is charged with the supervision and regulation of all insurance companies. The formation of an insurance company requires prior authorization of the SBS. The insurance industry was comprised of 21 companies as of December 31, 2017.
(9) Supervision and regulation
9.1 Credicorp
Currently, there are no applicable regulations under Bermuda Law that are likely to materially impact our operations as they are currently structured. Under Bermuda law, there is no regulation applicable to us as a holding company that would require that we separate the operations of our subsidiaries incorporated and existing outside Bermuda. Because our activities are conducted primarily through our subsidiaries in Peru, the Cayman Islands, Bolivia, Chile, Colombia and Panama, a summary of the main regulations governing our businesses is set forth below.
Our common shares are listed on the New York Stock Exchange (NYSE). We are therefore subject to regulation by the NYSE and the SEC as a “foreign private issuer”. We also must comply with the Sarbanes-Oxley Act of 2002.
We are, along with BCP, subject to certain requirements set forth by Law 26702 as well as certain banking statutes issued by the Peruvian banking regulator, SBS, including SBS Resolution No. 11823-2010, enacted in September 2010 and which approved the “Regulation of the Consolidated Supervision of Financial and Mixed Conglomerates”. Resolution N° 11823-2010 was partially amended by Resolution N° 2945-2013 enacted in May 2013. These regulations affect BCP and us primarily in the areas of reporting, risk control guidelines, limitations, ratios and capital requirements.
| 95 |
Since our common shares are listed on the Lima Stock Exchange in addition to the New York Stock Exchange, we are subject to certain reporting requirements to Superintendencia del Mercado de Valores, the Peruvian securities market regulator, and the Lima Stock Exchange. See “Item 9. The Offer and Listing — 9.C Markets — (1) The Lima Stock Exchange – 1.2 Market Regulation”.
9.2 BCP and Mibanco
9.2.1 Overview
BCP and Mibanco’s operations are regulated by Peruvian law. The regulations governing operations in the Peruvian financial sector are stated in Law 26702. The SBS periodically issues resolutions under Law 26702. See “Item 4. Information on the Company – 4.B Business Overview – (8) The Peruvian Financial System”. The SBS supervises and regulates entities that Law 26702 classifies as financial institutions. These entities include commercial banks, finance companies, small business finance companies, savings and loan corporations, financial services companies such as trust companies and investment banks, and insurance companies. Financial institutions must obtain the SBS’s authorization before beginning operations.
BCP and Mibanco’s operations are supervised and regulated by the SBS and the Peruvian Central Bank. Those who violate Law 26702 and its underlying regulations are subject to administrative sanctions and criminal penalties. Additionally, the SBS and the Peruvian Central Bank have the authority to issue fines to financial institutions and their directors and officers if they violate the laws or regulations of Peru, or their own institutions’ Bye-laws.
The SMV is the Peruvian government institution in charge of: (i) promoting the securities market, (ii) making sure fair competition takes place in the securities markets, (iii) supervising the management of businesses that trade in the securities markets, and (iv) regulating their activities and accounting practices. BCP and Mibanco must inform SMV of significant events that affect its business and is required to provide financial statements to it and the Lima Stock Exchange each quarter. Both institutions are also regulated by SMV when it conducts operations in the local Peruvian securities market.
Under Peruvian law, banks may conduct brokerage operations and administer mutual funds but must do so through subsidiaries. However, bank employees may market the financial products of the bank’s brokerage and mutual fund subsidiaries. Banks are prohibited from issuing insurance policies, but are not prohibited from distributing insurance policies issued by insurance companies.
| 96 |
9.2.2 Authority of the SBS
Peru’s Constitution and Law 26702 (which contains the statutory charter of the SBS) grant the SBS the authority to oversee and control banks and financial institutions (with the exception of brokerage firms, which are regulated by SMV), insurance and reinsurance companies, companies that receive deposits from the general public, AFPs and other similar entities as defined by Law 26702. The SBS is also responsible for supervising the Peruvian Central Bank to ensure that it abides by its statutory charter and Bye-laws.
The SBS has administrative, financial and operating autonomy. Its objectives include protecting the public interest, ensuring the financial stability of the institutions over which it has authority and punishing violators of its regulations. Its responsibilities include: (i) reviewing and approving, with the assistance of the Peruvian Central Bank, the establishment and organization of subsidiaries of the institutions it regulates; (ii) overseeing mergers, dissolutions and reorganization of banks, financial institutions and insurance companies; (iii) supervising financial, insurance and related companies from which information on an individual or consolidated basis is required, through changes in ownership and management control (this supervision also applies to non-bank holding companies, such as us); (iv) reviewing the Bye-laws and amendments of Bye-laws of these companies; (v) issuing criteria governing the transfer of bank shares, when permitted by law, for valuation of assets and liabilities and for minimum capital requirements; and (vi) controlling the Bank’s Risk Assessment Center, to which all banks are legally required to provide information regarding all businesses and individuals with whom they deal without regard to the amount of credit risk (the information provided is made available to all banks to allow them to monitor individual borrowers’ overall exposure to Peru’s banks). The SBS is also responsible for setting criteria for the establishment of financial or mixed conglomerates in Peru and for supervising these entities. As a result, in addition to its supervision of BCP and Mibanco, the SBS also supervises Credicorp Ltd. because Credicorp Ltd. is a financial conglomerate conducting the majority of its operations in Peru.
9.2.3 Management of operational risk
SBS Resolution No. 37-2008, which sets forth the guidelines for enterprise risk management (ERM), and 2116-2009 collectively established guidelines for operational risk management. Under these resolutions, operational risk management is defined broadly to include those risk resulting from the possibility of suffering financial losses due to inadequate or failed internal processes, people and systems, or from adverse external events. The resolutions also establish responsibilities for developing policies and procedures to identify, measure, control and report such risks. Banks are required to manage risks involved in the performance and continuity of their operations and services adequately in order to minimize possible financial losses and reputation damage due to inadequate or non-existent policies or procedures. Banks also are required to develop an information security model to guarantee physical and logical information integrity, confidentiality and availability. On April 1, 2018, SBS Resolution N° 37-2008 has been replaced by SBS Resolution N° 272-2017.
| 97 |
Credicorp, following these SBS requirements, as well as the guidelines issued by the Basel Committee on Banking Supervision, and the advice of international consultants, has appointed a specialized team responsible for operational risk management across our organization. This team reports regularly to our risk committee, top managers and the Board of Directors.
In evaluating operational risks and potential consequences, we mainly assess risks related to critical processes, critical suppliers, critical information assets, technological components, new products and significant changes to our services, and channels. To support the operational risk management process, we have developed a Business Continuity Management (BCM) discipline, which involves the implementation of continuity plans for critical business processes, incident management, and training and testing. In addition, our methodology and data processing team has developed procedures to register, collect, analyze and report operational risk losses, using advanced models for operational risk capital allocation. Lastly, we have monitoring and reporting procedures, designed to monitor Key Risk Indicators (KRI) and other performance metrics.
We intend to be guided by the risk control standards of international financial institutions that are noted for their leadership in this field. Our overall objective is to implement an efficient and permanent monitoring system to control operational risks, while training our operational units to mitigate risks directly.
Pursuant to Section 404 of the Sarbanes-Oxley Act of 2002, we are required to make certain certifications regarding our internal controls over financial reporting as of December 31, 2017. We have developed internal methods to identify and evaluate risk and controls over our critical processes to determinate how effective internal controls are over financial reporting using the COSO 2013 Internal Control Framework.
9.2.4 Capital adequacy requirements for BCP and Mibanco
Capital adequacy requirements applicable to us are set forth in the Law No. 26702 through Legislative Decree 1028. Legislative Decree 1028 was aimed at adapting Law No. 26702 to the capital guidelines and standards established by the second Basel Accord (Basel II). Capital adequacy requirements are also included in Peruvian GAAP accounting guidelines. Pursuant to the Basel II guidelines, financial institutions are required to hold regulatory capital that is greater than or equal to the sum of (i) 10% of credit risk-weighted assets, and (ii) 10 times the amount required to cover market and operational risks.
| 98 |
On July 20, 2011, the SBS issued SBS Resolution 8425-2011, establishing the methodologies and the implementation schedule of additional capital requirements consistent with certain aspects of Basel III, which is a comprehensive set of reform measures, developed by the SBS, to strength the regulation, supervision and risk management of the banking sector. The new capital requirements include requirements to cover concentration, interest rate and systemic risk. Additionally, pro-cyclical capital requirements were established. These additional requirements were fully implemented in July 2016.
Article 184 of Law No. 26702, as amended by Legislative Decree 1028, provides that regulatory capital may be used to cover credit risk, market risk and operational risk. Regulatory capital is comprised of the sum of basic capital and supplementary capital, and is calculated as follows:
| • | Basic Capital: Basic Capital or Tier 1 capital is comprised of: |
| (i) | paid-in-capital (which includes common stock and perpetual non-cumulative preferred stock), legal reserves, supplementary capital premiums, voluntary reserves distributable only with prior SBS approval, and retained earnings with capitalization agreements (earnings that the shareholders or our Board of Directors, as the case may be, have committed to capitalize as common stock); |
| (ii) | other elements that have characteristics of permanence and loss absorption that are in compliance with regulations enacted by the SBS, such as hybrid securities; and |
| (iii) | unrealized gains and retained earnings in Subsidiaries. |
Items deducted from Tier 1 capital include:
| (a) | current and past years’ unrealized losses; |
| (b) | deficits of loan loss provisions; |
| (c) | goodwill resulting from corporate reorganizations or acquisitions; and |
| (d) | half of the amount referred to in “Deductions” below. Absent any Tier 2 capital, 100% of the amount referred to in “Deductions” below must be deducted from Tier 1 capital. |
The elements referred to in item (ii) above should not exceed 17.65% of the amount resulting from adding components (i) and (iii) of Tier 1 capital net of the deductions in (a), (b) and (c) in this paragraph.
| 99 |
| • | Supplementary Capital: Supplementary capital is comprised of the sum of Tier 2 and Tier 3 capital. Tier 2 capital elements include: |
| (i) | voluntary reserves that may be reduced without prior consent from the SBS; |
| (ii) | the eligible portion of redeemable subordinated debt and of any other components that have characteristics of debt and equity as provided by the SBS; |
| (iii) | for banks using the Standardized Approach Method (SAM), the generic loan loss provision up to 1.25% of credit risk-weighted assets; or, alternatively, for banks using the IRB Method, the generic loan loss provision up to 0.6% of total credit risk-weighted assets (pursuant to article 189 of the Law); and |
| (iv) | half of the amount referred to in “Deductions” below. Tier 3 capital is comprised of redeemable subordinated debt that is incurred with the exclusive purpose of covering market risk, as referred to in Article 233 of the Law. |
| • | Deductions: The following elements are deducted from Tier 1 and Tier 2 capital: |
| (i) | all investments in shares and subordinated debt issued by other local or foreign financial institutions and insurance companies; |
| (ii) | all investments in shares and subordinated debt issued by an affiliate with which the bank consolidates its financial statements, including its holding company and such subsidiaries referred to in Articles 34 and 224 of the Law; |
| (iii) | the amount in which an investment in shares issued by a company with which the bank does not consolidate its financial statements and which is not part of the bank’s negotiable portfolio exceeds 15% of the bank’s regulatory capital; |
| (iv) | the aggregate amount of all investments in shares issued by companies with which the bank does not consolidate its financial statements and which are not part of the bank’s negotiable portfolio exceeds 60% of the regulatory capital; |
| (v) | when applicable, the amount resulting from the formula prescribed in Article 189 of the Law. |
| (vi) | unrealized gains and retained earnings in Subsidiaries. |
For the purposes herein, “regulatory capital” excludes the amounts referred to in (iii), (iv) and (v) of this paragraph.
Article 185 of Law No. 26702 also provides that the following limits apply when calculating regulatory capital:
| 100 |
| (i) | the aggregate amount of supplementary capital must not exceed the aggregate amount of basic capital; |
| (ii) | the amount of redeemable Tier 2 subordinated instruments must be limited to 50% of the amount resulting from the sum of Tier 1 elements net of the deductions in (a), (b), and (c) in “Basic Capital” above; |
| (iii) | the amount of Tier 3 capital must be limited to 250% of the amount resulting from the sum of Tier 1 elements net of the deductions (a), (b), and (c) in “Basic Capital” above in the amounts assigned to cover market risk. |
SBS Resolution 8548-2012, adopted in 2012, modified the regulatory capital requirements for credit risk weighted assets in SBS Resolution 14354-2009 and established a schedule for implementing the modifications.
As of December 31, 2017, BCP’s regulatory capital was 15.05% of its unconsolidated risk-weighted assets. As of December 31, 2016 and December 31, 2015, BCP’s regulatory capital was 15.35% and 14.34% of its unconsolidated risk-weighted assets, respectively.
In November 2013, BCP’s board of directors decided to track a Basel III ratio known as Common Equity Tier 1. Common Equity Tier 1 is comprised of:
| (i) | paid-in-capital (which includes common stock and perpetual non-cumulative preferred stock), |
| (ii) | legal and other capital reserves, |
| (iii) | accumulated earnings, |
| (iv) | unrealized profits (losses), |
| (v) | deficits of loan loss provisions, |
| (vi) | intangibles, |
| (vii) | net deferred taxes that rely on future profitability, |
| (viii) | goodwill resulting from corporate reorganizations or acquisitions; and |
| (ix) | 100% of the amount referred to in “Deductions” above. |
As of December 31, 2017, BCP’s Common Equity Tier 1 Ratio was 11.83% of its unconsolidated risk-weighted assets, well above the 10.50% limit that BCP set for itself. This limit was approved in March 2017 by the BCP’s Risk Committee and is part of the Risk Appetite framework. BCP’s Basel III Common Equity Tier 1 Ratio is estimated based on BCP’s understanding, expectations and interpretation of the proposed Basel III requirements in Peru.
| 101 |
Capital management
On February 24, 2016, SBS issued Resolution 975 -2016 - “Subordinated Debt Regulation”, which aims to improve the quality of the total regulatory capital and align Peruvian regulation towards Basel III, by modifying:
| · | The characteristics that subordinated debt must meet to be considered in the calculation of total regulatory capital: and |
| · | The calculation of risk-weighted assets |
The new regulation considers that subordinated debt issued prior to the new regulation and that does not meet the new requirements, may be recognized as total regulatory capital, according to the following:
| · | Tier 1 subordinated debt: as of January 2017, and for ten (10) years that follow, Tier 1 subordinated debt is subject to a 10% discount. However, the amount not computable as Tier 1 regulatory capital may be computed as a Tier 2 instrument, if it has a residual maturity equal to or greater than fifteen (15) years. |
As of December 2017, BCP’s Tier 1 subordinated debt (issued in 2009) totals S/. 729 million, and matures in 2069. Thus, as of January 2018, the amount to be discounted from Tier 1 regulatory capital is now eligible in Tier 2 regulatory capital.
| · | Tier 2 subordinated debt: during the five (5) years prior to maturity, the principal balance will be discounted by 20%. In the year prior to its maturity the tier 2 subordinated debt will not be considered in the calculation of Tier 2. This treatment is similar to that stipulated in the current regulation. As a result, there will be no impact in Tier 2 subordinated debt computed in December 2017. |
In addition, the SBS Resolution also includes changes to the calculation of risk-weighted assets (RWAs) of the following accounting items:
| · | Intangible (excluding Goodwill); |
| · | Deferred Tax Assets (DTAs) that are originated by operating losses. Deferred Tax Assets are to be net of Deferred Income Tax Liabilities (DTLs); and |
| · | Deferred Tax Assets (DTAs) that are associated with temporary differences and that exceed the threshold of 10% of the “adjusted total capital”. Deferred Tax Assets are to be net of Deferred Tax Liabilities (DTLs). |
These assets will experience a gradual increase in their risk weights (until they reach a maximum of 1000% in 2026) to replicate the deductions established by Basel III. It is important to highlight that these increases in risk weights are not associated with a higher level of risk in these assets. These RWAs will be used exclusively for calculating the BIS ratio.
| 102 |
Furthermore, the new regulation requires the calculation of a new solvency ratio: Adjusted total capital on adjusted total risk weight assets. This methodology is similar to that which is used to calculate the Common Equity Tier 1 ("CET1") ratio under Basel III. As a result, the accounting items mentioned above are deducted from the numerator of the new solvency ratio, and the calculation of RWAs (the denominator) does not consider these deductions. As of December 2017, the CET1 ratio was 11.83%. This ratio will not change because it is already calculating using adjusted total risk weight.
Finally, for transparency purposes and to demonstrate the calculation of the CET1 ratio, Credicorp will periodically publish the Adjusted Total RWAs.
Regulatory capital information f or BCP and Mibanco as of December 31, 2015, 2016 and 2017
| BCP Stand-alone- Regulatory Capital and Capital Adequacy Ratios | ||||||||||||
| Soles in thousands | 2015 | 2016 | 2017 | |||||||||
| Capital stock | 5,854,051 | 7,066,346 | 7,933,342 | |||||||||
| Legal and other capital reserves | 3,157,906 | 3,582,218 | 3,885,494 | |||||||||
| Accumulated earnings with capitalization agreement | 600,000 | - | - | |||||||||
| Loan loss reserves (1) | 1,146,571 | 1,181,200 | 1,234,999 | |||||||||
| Perpetual subordinated debt | 852,750 | 839,000 | 729,225 | |||||||||
| Subordinated debt | 4,588,342 | 4,520,406 | 3,978,406 | |||||||||
| Unrealized profit (loss) | - | - | - | |||||||||
| Investment in subsidiaries and others | (1,922,061 | ) | (1,513,593 | ) | (1,587,715 | ) | ||||||
| Unrealized profit and net income in subsidiaries | 334,132 | 305,624 | 346,656 | |||||||||
| Goodwill | (122,083 | ) | (122,083 | ) | (122,083 | ) | ||||||
| Total Regulatory Capital | 14,489,608 | 15,859,118 | 16,398,324 | |||||||||
| Tier 1 (2) | 9,715,725 | 10,761,497 | 11,805,448 | |||||||||
| Tier 2 (3) + Tier 3 (4) | 4,773,882 | 5,097,621 | 4,592,875 | |||||||||
| Total risk-weighted assets | 101,068,772 | 103,350,373 | 108,950,141 | |||||||||
| Market risk-weighted assets (5) | 2,047,887 | 745,539 | 1,391,099 | |||||||||
| Credit risk-weighted assets | 91,725,676 | 94,495,998 | 98,799,888 | |||||||||
| Operational risk-weighted assets | 7,295,209 | 8,108,836 | 8,759,154 | |||||||||
| Capital ratios | ||||||||||||
| Tier 1 ratio (6) | 9.61 | % | 10.41 | % | 10.84 | % | ||||||
| Common Equity Tier 1 ratio (7) | 9.34 | % | 11.08 | % | 11.83 | % | ||||||
| BIS ratio (8) | 14.34 | % | 15.35 | % | 15.05 | % | ||||||
| Risk-weighted assets / Regulatory Capital (9) | 6.98 | 6.52 | 6.64 | |||||||||
(1) Up to 1.25% of total risk-weighted assets.
(2) Tier 1 = Capital + Legal and other capital reserves + Accumulated earnings with capitalization agreement + Unrealized profit and net income in subsidiaries - Goodwill - (0.5 x Investment in Subsidiaries) + Perpetual subordinated debt (maximum amount that can be included is 17.65% of Capital + Reserves + Accumulated earnings with capitalization agreement + Unrealized profit and net income in subsidiaries - Goodwill).
(3) Tier 2 = Subordinated debt + Loan loss reserves - (0.5 x Investment in subsidiaries).
(4) Tier 3 = Subordinated debt covering market risk only.
(5) It includes capital requirement to cover price and rate risk.
(6) Tier 1 / Risk-weighted assets
(7) Common Equity Tier I = Capital + Reserves + retained earnings + unrealized gains – 100% of applicable deductions (investment in subsidiaries, goodwill, intangibles and net deferred taxes that rely on future profitability).
(8) Regulatory Capital / Risk-weighted assets (legal minimum = 10% since July 2011)
(9) Since July 2012, Risk-weighted assets = Credit risk-weighted assets * 1.00 + Capital requirement to cover market risk * 10 + Capital requirement to cover operational risk * 10 * 1.0 (since July 2014).
| 103 |
| Mibanco - Regulatory Capital and Capital Adequacy Ratios | ||||||||||||
| Soles in thousands | 2015 | 2016 | 2017 | |||||||||
| Total Regulatory capital | 1,314,456 | 1,461,472 | 1,453,361 | |||||||||
| Tier 1 (1) | 992,812 | 1,054,084 | 1,085,350 | |||||||||
| Tier 2 (3) | 321,644 | 407,388 | 368,011 | |||||||||
| Total risk-weighted assets | 8,582,380 | 9,403,959 | 9,516,019 | |||||||||
| Market risk-weighted assets (3) | 8,157,047 | 8,895,164 | 8,933,974 | |||||||||
| Credit risk-weighted assets | 82,024 | 98,437 | 59,904 | |||||||||
| Operational risk-weighted assets | 343,309 | 410,358 | 522,141 | |||||||||
| Capital ratios | ||||||||||||
| Tier 1 ratio (4) | 11.57 | % | 11.21 | % | 11.41 | % | ||||||
| Common Equity Tier 1 ratio (5) | 12.08 | % | 14.46 | % | 14.92 | % | ||||||
| BIS ratio (6) | 15.32 | % | 15.54 | % | 15.27 | % | ||||||
| Risk-weighted assets/Regulatory Capital(7) | 6.53 | 6.43 | 6.55 | |||||||||
(1) Tier 1 = Capital + Legal and other capital reserves + Accumulated earnings with capitalization agreement + Unrealized profit and net income in subsidiaries - Goodwill - (0.5 x Investment in Subsidiaries) + Perpetual subordinated debt (maximum amount that can be included is 17.65% of Capital + Reserves + Accumulated earnings with capitalization agreement + Unrealized profit and net income in subsidiaries - Goodwill).
(2) Tier 2 = Subordinated debt + Loan loss reserves - (0.5 x Investment in subsidiaries).
(3) It includes capital requirement to cover price and rate risk.
(4) Tier 1 / Risk-weighted assets
(5) Common Equity Tier I = Capital + Reserves + retained earnings + unrealized gains – 100% of applicable deductions (investment in subsidiaries, goodwill, intangibles and net deferred taxes that rely on future profitability).
(6) Regulatory Capital / Risk-weighted assets (legal minimum = 10% since July 2011)
(7) Since July 2012, Risk-weighted assets = Credit risk-weighted assets * 1.00 + Capital requirement to cover market risk * 10 + Capital requirement to cover operational risk * 10 * 1.0 (since July 2014).
9.2.5 Legal reserve requirements
In accordance with Peruvian regulation -article 67 of Law No. 26702- a reserve of up to at least 35% of paid-in capital of the Group’s subsidiaries operating in Peru is required to be established through annual transfers of at least 10% of their net income. In accordance with Bolivian regulation, a reserve of up to at least 50% of paid-in capital of the Group’s subsidiaries operating in Bolivia is required to be established through annual transfers of at least 10% of their net income. As of December 31, 2017, 2016, and 2015, these reserves amounted to approximately S/4,480.3 million, S/3,987.5 million and S/2,996.7 million, respectively.
9.2.6 Provisions for loan losses
Credicorp’s allowance model is an IFRS compliant loss estimation model that comprises a number of methodologies which estimate losses for Wholesale Banking and Retail Banking in line with IAS39. Depending on the portfolio analyzed, each methodology takes into consideration collateral recovery projections, outstanding debt, and qualitative aspects that reinforce the estimate. Some examples of qualitative aspects are the complexity of the recovery processes, sector trends, and officers’ judgment of the estimated recovery values.
| 104 |
The methodology includes three estimation scenarios: base, upper threshold and lower threshold. These scenarios are generated by modifying some assumptions, such as collateral recovery values and adverse effects due to changes in the political and economic environments. The process to select the best estimate within the range is based on management’s best judgment, complemented by historical loss experience. See “Item 4. Information on the Company - 4.B Business Overview - (10) Selected Statistical Information - 10.3 Loan Portfolio - 10.3.12 Allocation of Loan Loss Reserves”.
9.2.7 The Peruvian central bank monetary and macroprudential policy
The reference interest rate is periodically revised by the Peruvian Central Bank in accordance with its monetary policy objectives. Once a month the board of directors of the Peruvian Central Bank approves and announces the monetary program through a press release. The following chart summarizes the reference interest rate changes in 2015, 2016 and 2017:
| Changes in BCRP's reference interest rate | ||||
| Month | Rate | |||
| July 2014 | 3.75 | % | ||
| September 2014 | 3.50 | % | ||
| January 2015 | 3.25 | % | ||
| September 2015 | 3.50 | % | ||
| December 2015 | 3.75 | % | ||
| January 2016 | 4.00 | % | ||
| February 2016 | 4.25 | % | ||
| May 2017 | 4.00 | % | ||
| July 2017 | 3.75 | % | ||
| September 2017 | 3.50 | % | ||
| November 2017 | 3.25 | % | ||
The tightening of the Peruvian Central Bank’s monetary policy up to February 2016 intended to anchor inflation expectations within the target range, which ranges from 1% to 3%, in a context where inflation closed at 4.40% in 2015. Thereafter, the Central Bank’s monetary policy rate remained at 4.25% amid the expectation that inflation would lower towards the target range.
Inflation accelerated from 3.2% by December 2016 to 4.0% in March 2017 due to El Niño’s effect on food prices. However, as the supply-side shock reversed, inflation closed 2017 at 1.4% and economic activity grew below its potential during 2017. In such context, the BCRP lowered its reference rate to prove monetary stimulus for economic activity.
Under Law No. 26702, banks and financial institutions are required to maintain legal reserve requirements for certain obligations. The Peruvian Central Bank requires financial institutions to maintain marginal reserve requirements for foreign currency obligations and sets the exact level and method of calculation of such requirement. The reserve requirements in Peru apply to obligations such as demand and time deposits, savings accounts, securities, certain bonds and funds administered by banks. Additionally, the Peruvian Central Bank requires reserves on amounts due to foreign banks and other foreign financial institutions. Furthermore, as of January 2011, obligations of foreign subsidiaries and affiliates are also subject to the reserve requirement.
| 105 |
For 2015, the Peruvian Central Bank set the minimum level of reserves for banks at 6.5% for local currency and 9.0% for foreign currency. However, the Peruvian Central Bank also establishes a marginal reserve requirement of 70.0% in foreign currency for funds that exceed a certain level set by the Central Bank. Foreign currency cannot be used to comply with reserve requirements for liabilities in domestic currency, and vice versa. The Peruvian Central Bank oversees compliance with the reserve requirements.
During 2017, the Peruvian Central Bank lowered the local currency reserve requirement rate (from 6.5% on December 2016 to 5.0% on April 2017) and lowered the foreign currency marginal reserve requirement rate (from 70% on December 2016 to 40% on December 2017). The BCRP continued to lower the marginal reserve requirements to 39% in January 2018, 38% in February 2018 and 37% in March 2018. According to the Peruvian Central Bank, this reduction in rates aims to maintain flexible credit conditions considering decreasing demands for loans and increasing external rates. By December 2017, the commercial banks average reserve requirement ratio for foreign currency was 36.6%.
In addition to overall changes in reserve requirements, in 2016 the Central Bank increased the minimum for current account deposits in local currency subject to reserve requirements, from 0.75% at the close of 2015 to 1.00% by March 2016. No further changes were made to this ruling in 2017.
In order to offset the excessive pressure of the derivatives market on the domestic currency, the Central Bank adjusted additional reserve requirements in Soles according to the level of bank’s forwards contracts involving foreign currencies. Moreover, the Central Bank established a program aimed at contributing to the de-dollarization of credit to reduce the risks to economic agents associated with borrowing in foreign currency in light of the depreciation observed in 2014 (6.8%) and 2015 (14.6%). Thus, additional reserve requirements of 30% were established for loans in foreign currency to increase their cost. Particularly, the program seeks that banks reduce their balances of loans in Dollars: (i) the balance of a bank’s total loans (excluding loans for foreign trade and loans issued for more than 3 years for amounts that exceed US$ 10 million) at December 2016 was required to be equal to 80% of the balance recorded in September 2013 (90% of the same balance at December 2015) and (ii) the balance of a bank’s car and mortgage loans at December 2016 was required to be equal to 70% of the balance in February 2013 (85% of the same balance at December 2015). Thereafter, the reduction for car and mortgage loans will increase by 10% at the end of each year. No further changes were made to this ruling in 2017. In the case of FC total loans, the reduction target is calculated based on period-end balances (in Peru GAAP) as of September 2013. The reduction target for the joint portfolio of mortgage and car loans was calculated with period-end balances (in Peru GAAP) as of February 2013. However, compliance levels for both targets are calculated using average daily balances.
| 106 |
In such context, in 2017 BCP achieved the total loans in foreign currency target, but came short of the car and mortgage loans target:
| (i) | By December 2017, the total loans in dollars (excluding loans for foreign trade operations) were 77.9% of the balance of September 2013, below the 80% target established by the BCRP; |
| (ii) | By December 2017, car and mortgage loans in dollars were 60.8% of the balance of February 2013, above the 60% target of the BCRP. |
No monetary penalties were derived from not achieving the car and mortgage loans target. We built US$21 million in foreign currency as foreign currency reserve requirements after applying the rule states.
As a result of these measures, the loan dollarization ratio stood at 29.1% by December 2017 compared to 29.2% in December 2016 and 30.5% in December 2015. Additionally, in order to reduce the pressures on the Dollar, at the end of August 2015, the Central Bank established a new instrument called special Repo, which consists of the simultaneous sale of a resettable certificate of deposit (CDR) by the Central Bank and a securities Repo operation in which financial institutions use the CDR as collateral to lend Soles to the BCRP. Consequently, the instrument does not provide additional liquidity to financial institutions. As a result of this operation, private banking receives domestic currency generating a liability and maintains an asset equivalent to the CDR that is left as collateral at the Central Bank.
In 2017, amid the measures adopted by the Peruvian Central Bank and despite a year of subdued economic growth, loans to the private sector (considering a constant exchange rate of S/ 3.24 per U.S. dollar) expanded 6.7%, slightly above 2016 (5.6%) but below the observed in 2015 (8.0%). By denomination, in 2017 loans in local currency grew 5.6%, compared to 7.2% in 2016 and 28.0% in 2015. Finally, loans in foreign currency expanded 8.0%, compared to 2.1% in 2016 and a contraction of 20.7% in 2015.
9.2.8 Lending activities
Law No. 26702 sets the maximum amount of credit that a financial institution may extend to a single borrower, which can be an individual or an economic group. Resolution SBS No. 5780-2015 establishes that an “economic group” is one that has a single or common risk exposure and includes a person, such person’s close relatives and the companies in which such person or his or her close relatives have significant share ownership or decision-making capability. Significant decision-making capability is deemed to be present when, among other factors, a person or group can exercise material and continuous influence over the decisions of a company, when a person or company holds seats on the board of directors or has principal officers in another company, or when it can be assumed that one company or person is the beneficiary of credit facilities granted to another company.
| 107 |
The limit on credit that may be extended to one borrower varies according to the type of borrower and the collateral received. The credit limit to credit for any Peruvian borrower is 10% of the bank’s regulatory capital, applied to both unconsolidated and consolidated records, which may be increased to up to 30% if the loan is collateralized in a manner acceptable under Law No. 26702. If a financial institution exceeds these limits, the SBS may impose a fine on the institution. As of December 31, 2017, 2016 and 2015, the 10.0% unconsolidated credit limit per borrower of BCP for unsecured loans was S/1,639.8 million, S/1,585.9 million and S/1,449.0 million, respectively. As of December 31, 2017, 2016 and 2015 the 30.0% credit limit for secured loans was S/4,919.5 million, S/4,757.7 million and S/4,346.9 million, respectively.
Pursuant to Article 52 of the organic law of the Peruvian Central Bank, in certain circumstances, the Peruvian Central Bank has the authority to establish limits on interest rates charged by commercial banks and other financial institutions. No such limits are currently in place; however, there can be no assurance that the Peruvian Central Bank will not establish such limits on interest rates in the future.
9.2.9 Related party transactions
Law 26702 regulates transactions between financial institutions on the one hand and related parties and or affiliates on the other. SBS and SMV have also enacted regulations that define indirect ownership, related parties and economic groups, in order to limit transactions with related parties and affiliates. These regulations also provide standards for the supervision of financial and mixed conglomerates formed by financial institutions.
The total amount of loans to directors, employees or close relatives of any such persons may not exceed 7% of a bank’s regulatory capital. All loans made to any single director or employee borrower, considering his/her close relatives, may not exceed 0.35% of regulatory capital (i.e., 5% of the overall 7% limit).
Pursuant to Law 26702, as amended by Law 27102, the aggregate amount of loans to related party borrowers considered to be part of an economic group (as defined above) may not exceed 30% of a bank’s regulatory capital. For purposes of this test, related party borrowers include (i) any person holding, directly or indirectly, 4% or more of a bank’s shares, (ii) directors, (iii) certain principal executive officers of a bank or (iv) people affiliated with the administrators of the bank. Loans to individual related party borrowers are also subject to the limits on lending to a single borrower described under “—Lending Activities” above. All loans to related parties must be made on terms no more favorable than the best terms that BCP or Mibanco offers to the public.
| 108 |
9.2.10 Ownership restrictions
Law 26702 establishes certain restrictions on the ownership of a bank’s shares. Banks must have a minimum of two shareholders. Among other restrictions, those convicted of drug trafficking, money laundering, terrorism and other felonies, or those who are directors, employees and advisors of public entities that regulate and supervise the activities of banks, are subject to ownership limitations. All transfers of shares in a bank must be recorded at the SBS. Transfers involving the acquisition by any individual or corporation, whether directly or indirectly, of more than 10% of a bank’s capital stock require prior authorization from the SBS. The SBS may deny authorization to such transfer of shares if the purchasers (or their shareholders, directors or employees in the case of juridical persons) are legally disabled, have engaged in illegal activity in the area of banking, finance, insurance or reinsurance, or if objections are raised on the basis of the purchaser’s moral fitness or economic solvency, among others. The decision of the SBS is final, and cannot be overturned by the courts. If a transfer is made without obtaining the prior approval of the SBS, the purchaser shall be fined with an amount equivalent to the value of the transferred shares and is obligated to sell the shares within 30 days, or the fine is doubled. In addition, the purchaser is not allowed to exercise its voting rights at the shareholders’ meetings. Foreign investors receive the same treatment as Peruvian nationals and are subject to the limitations described above.
Finally, under Peruvian law, individuals or corporations that acquire, directly or indirectly, 1% of the capital stock of a bank in a period of 12 months or acquire a 3% or more share participation, have the obligation to provide the information that the SBS may require to identify such individuals’ or corporations’ main economic activities and assets structure.
9.2.11 Risk rating
Law No. 26702 and SBS Resolutions No. 672 and 18400-2010 require that all financial companies be rated by at least two risk rating companies on a semi-annual basis, in addition to the SBS’s assessment. Criteria to be considered in the rating include risk management and control procedures, loan quality, financial strength, profitability, liquidity and financial efficiency. Five risk categories are assigned, from “A” (lowest risk) to “E” (highest risk), allowing for sub-categories within each category. As of September 2017, BCP and Mibanco were assigned the “A+” and “A” risk category, respectively, by their two rating agencies, Equilibrium Clasificadora de Riesgo and Apoyo and Associates International. As of December 2017, BCP and Mibanco maintained the risk category of “A+” and “A”, respectively.
| 109 |
9.2.12 Deposit insurance fund
Law 26702 provides for mandatory deposit insurance to protect the deposits of financial institutions by establishing the Fondo de Seguro de Depositos (Deposit Insurance Fund or the Fund) for individuals, associations, not-for-profit companies, and demand deposits of non-financial companies. Financial institutions must pay an annual premium calculated on the basis of the type of deposits accepted by the entity and the risk classification of such entity, made by the SBS and at least two independent risk-rating agencies. The annual premium begins at 0.65% of total funds on deposit under the coverage of the Fund and increases to 1.45% applicable to banks in the highest risk category. BCP and Mibanco are currently classified in the lowest risk category. The maximum amount (defined on a monthly basis) that a customer is entitled to recover from the Fund is S/.97,529 as of December 31, 2017 and S/ 98,205 from the period starting on March 2018 until May 2018.
9.2.13 Intervention by the SBS
Pursuant to Law 26702, as amended by Law 27102, the SBS has the authority to seize the operations and assets of a bank. These laws provide for three levels of action by the SBS: a supervisory regime, an intervention regime and the liquidation of the bank. Any of these actions may be taken if certain events occur, including if the bank: (i) interrupts payments on its liabilities, (ii) repeatedly fails to comply with the regulations of the SBS or the Peruvian Central Bank, (iii) repeatedly violates the law or the provisions of the bank’s Bye-laws, (iv) repeatedly manages its operations in an unauthorized or unsound manner or (v) has its regulatory capital fall or be reduced by more than 50%.
During the intervention regime, rather than seizing the operations and assets of a bank, the SBS may adopt other measures, including (i) placing additional requirements on the bank, (ii) ordering it to increase its capital stock or divest certain or all of its assets, or (iii) imposing a special supervision regime during which the bank must adhere to a financial restructuring plan.
The SBS intervention regime stops a bank’s operations for up to 45 days and may be extended for an additional 45 days. During this time, the SBS may institute measures such as: (i) canceling losses by reducing reserves, capital and subordinated debt, (ii) segregating certain assets and liabilities for transfer to another financial institution and (iii) merging the intervened bank with an acquiring institution according to the program established by Urgent Decree No. 108-2000, enacted in November 2000. After the intervention, the SBS will liquidate the bank unless it is merged with an acquiring institution, as described in (iii) above.
| 110 |
9.2.14 Regulation from the United States Federal Reserve and from the State of Florida Department of Banking and Finance
Banco de Credito del Peru Miami Agency (“BCP Miami Agency”) is licensed to operate as an International Agency in the State of Florida and was authorized to transact business by the Comptroller of Florida on September 3, 2002. The Office of Financial Regulation of the State of Florida shares regulatory responsibility with the Federal Reserve Bank of Atlanta.
9.2.15 Regulation from the Superintendency of Banks in Panama
BCP Panama is a branch of BCP that is registered in the Republic of Panama. It began operating in June 2002 under an International License issued by the Panamanian Superintendence of Banks, in accordance with Law Decree N° 9 of February 26, 1998, as amended. BCP Panama is subject to an inspection made by auditors and inspectors of the Panamanian Superintendence of Banks, to determine, among other things, its compliance with the Decree Law N° 2 of February 22, 2008 and N° 23 of April 27, 2015 Law on the Prevent Money Laundering, the Financing of Terrorism and the Financing of the Proliferation of Mass Destruction Weapons.
9.3 Atlantic Security Bank ( ASB)
9.3.1 General
ASB, a subsidiary of ASHC, is a Cayman Islands bank with a branch in Panama. ASB is regulated and supervised by the regulatory authorities of the Cayman Islands (Cayman Island Monetary Authority) while its Panama branch is regulated by the Superintendence of Banking of Panama (SBP - Superintendencia de Bancos de Panama). In November 22, 2017, ASB acquired Correval Panama, S.A. a brokerage company based in Panama with operations in the local and international markets. This subsidiary is regulated by the Panamanian Superintendence of Security Market (SMVP - Superintendencia de Mercado de Valores de Panama).
ASB is registered as an exempt company and is licensed in the Cayman Islands pursuant to the Banks and Trust Companies Law (“Cayman Banking Law”). ASB holds an unrestricted Category B Banking and Trust License, as well as a Mutual Fund Administrator License. As a holder of a Category B License, ASB may not take deposits from any person residing in the Cayman Islands other than another licensee, an exempt company or an ordinary non-resident company which is not carrying on business in the Cayman Islands.
| 111 |
ASB may not invest in any asset which represents a claim on any person residing in the Cayman Islands, except a claim resulting from: (i) a loan to an exempt or an ordinary non-resident company not carrying on business in the Cayman Islands; (ii) a loan by way of mortgage to a member of its staff or to a person possessing or being deemed to possess Caymanian status under the immigration law, for the purchase or construction of a residence in the Cayman Islands to be owner-occupied; (iii) a transaction with another licensee or (iv) the purchase of bonds or other securities issued by the government of the Cayman Islands, a body incorporated by statute, or a company in which the government is the sole or majority beneficial owner. In addition, ASB may not, without the written approval of the Cayman Islands Monetary Authority (the “Authority”), carry on any business in the Cayman Islands other than business permitted by the Category B License.
There are no ratio or liquidity requirements under the Cayman Banking Law, but the Authority expects observance of prudent banking practices. As a matter of general practice, the ratio of liabilities to capital and surplus should not exceed 40-to-1 and the ratio of risk-weighted assets to capital and surplus should not exceed 8.33-to-1 (approximately 12%). There is a statutory minimum net worth requirement of US$500,000 (approximately S/1,620,500), but the Authority generally requires a bank or trust company to maintain a higher paid-in capital appropriate to its business. The Authority requires compliance with the guidelines promulgated by the Basel Accord on Banking Regulations and Supervisory Practices although, in special circumstances, different gearing and/or capital risk asset ratios may be negotiated. Compliance with the Cayman Banking Law is monitored by the Authority.
9.3.2 Continuing requirements
Under the law of the Cayman Islands, ASB is subject to the following continuing requirements: (i) to remain in good standing under the Cayman Islands Companies Law, including the filing of annual and other returns and the payment of annual fees; (ii) to file with the Registrar of Companies any change in the information or documents required to be provided and to pay annual fees; (iii) to file certain prescribed forms with the Authority on a quarterly basis; (iv) to file with the Authority audited accounts within three months of each financial year (in the case of a locally incorporated bank which is not part of a substantial international banking group, a senior officer or board member discusses these accounts each year at a meeting with the Authority) and (v) to file an annual questionnaire.
ASB is required by the Cayman Banking Law to have at least two directors. Additionally, ASB must receive prior approval from the Authority (i) for any proposed change in the directors or senior officers, though in exceptional cases a waiver can be obtained enabling changes to be reported after the event or annually in the case of a branch of a substantial international bank; (ii) for the issue, transfer or other disposal of shares (it is rare for a waiver to be granted with respect to shares except in the case of a branch of a substantial international bank and where the shares are widely held and publicly traded); (iii) for any significant change in the business plan filed on the original license application or (iv) to open a subsidiary, branch, agency or representative office outside the Cayman Islands. Finally, ASB must obtain the prior approval of the Authority to change its name and must notify the Authority of any change in its principal office or its authorized agent in the Cayman Islands.
| 112 |
Under Panamanian Law, ASB has a registered branch in Panama (ASB Panama Branch), which holds an International Banking License issued by the Superintendence of Banking of Panama. This license allows institutions to carry out banking operations with effects outside of the jurisdiction from a permanent establishment in the Republic of Panama. SBP acts as the main regulator for the Panama Branch, although supervision activities are closely coordinated with CIMA as regulator for the Head Office in the Cayman Islands.
Correval Panama S.A (Correval) is a wholly owned subsidiary of ASB, incorporated in Panama. Correval holds a Securities Broker license issued by the Superintendence of the Securities Market that enables the entity to act as securities broker, manager and custodian. Correval is required to comply with regulations pertaining to corporate governance; minimum working capital and liquidity requirements to meet obligations with customers and vendors; adequate accounting practices and recordkeeping; provision of regulatory reports; adherence to confidentiality standards, code of ethics and prevention of conflict of interest and adequate anti-money laundering and terrorism finance laundering controls, policies and programs, among others.
9.4 BCP Bolivia
Until November 2013, the Bolivian banking system operated under the Law of Banks and Financial Entities No. 1488, enacted on April 14, 1993 and later modified by Law 3076 of June 20, 2005. On August 21, 2013, the Bolivian Government enacted a new Banking Law (Law 393), which became effective on November 21, 2013. This new law envisions a more active role of government in the financial services industry and emphasizes the social objective of financial services.
Pursuant to Supreme Decree 29894, in May 2009 the ASFI was vested with the authority to regulate the Bolivian banking system. ASFI also supervises brokerage and mutual fund management activities that Credicorp Ltd. conducts through BCP Bolivia’s affiliates, Credibolsa and Credifondo. These affiliates operate under the Securities Markets Law No. 1834, enacted on March 31, 1998. Additionally, the Central Bank of Bolivia (BCB by its Spanish initials) regulates financial intermediation and deposit activities, determines monetary and foreign exchange policy, and establishes reserve requirements on deposits.
| 113 |
In 2012, the Bolivian government imposed an additional income tax of 12.5% on earnings before taxes, which applied to all financial institutions with a ratio of earnings before taxes to equity in excess of 13%. Additionally, in November 2012, the government approved a new tax on sales of foreign exchange. This new tax, which levied all sales of foreign exchange with a 0.70% rate on the amount of foreign currency sold, was in effect for 36 months and thus expired in December 2015.
In December 2015, the additional income tax was elevated to 22%, applied to all financial institutions with a ratio of earnings before taxes to equity in excess of 6%. In February 2017, the government stated its intention to increase the additional income tax to 25%, as of the date of this report there is no official regulation on the proposed increase.
In 2013, Presidential Decree 1842 set interest rate caps for social housing loans ranging from 5.5% to 6.5% and established loan quotas pursuant to which, by December 31, 2018, at least 60% of the loan portfolio of all universal banks needs to be comprised of loans to productive sectors and social housing loans.
In 2014, the Bolivian government through Presidential Decree 2137 established the creation of a guarantee fund for new mortgages without down payment. This fund, which is aimed at providing guarantees of up to 20% of the amount financed, was established in 2015 through an additional obligatory 6% tax on 2014 net income.
In November 2015, Presidential Decree 2614 established the creation of a new guarantee fund aimed at guaranteeing loans to productive sectors. The fund was established in 2016 through an additional obligatory 6% tax on 2015 net income. In December 2016, Presidential Decree 3036 established an additional obligatory 6% tax on 2016 net income, half of which will be destined to replenish the guarantee fund for social housing established in 2015, while the other half will be destined for a new fund whose objective is to fund seed capital.
9.5 Credicorp Capital
9.5.1 Credicorp Capital Securities, Inc. (CCSI)
Credicorp Capital Securities, Inc. (“CCSI”) (CRD No. 122199) is a registered broker-dealer with FINRA and with the SEC. CCSI is owned by Credicorp Capital Limited which is wholly owned by Credicorp. Headquartered in Coral Gables, Florida, CCSI provides brokerage services through a clearing agreement with Pershing, LLC. There are currently five registered principals at CCSI, all of whom are Series 7 and Series 24 (our General Securities Principal) licensed. At the trading desk, all registered representatives maintain their Series 7 and Series 63 licenses. We also have one Series 27 licensed (our Financial and Operations Principal).
| 114 |
9.5.2 Credicorp Capital Peru, S.A.A.
Credicorp Capital Peru falls under the supervision of the SMV, a specialized technical body attached to the Ministry of Economics and Finance, aimed to ensure the protection of investors, efficiency and transparency of the markets, as well as the diffusion of the information required for such purposes. It enjoys functional, administrative, economic, technical and budgetary autonomy. The Securities Market Law as amended, approved by Legislative Decree Nº 861, governs the public offering and trading of securities listed on the SMV and the Lima Stock Exchange. The latter institution, as the only stock exchange in Peru, also provides internal regulations which form part of the regulations and administrative rulings that govern the offering and trading of securities.
9.5.3 Credicorp Capital Colombia S.A.
Credicorp Capital Colombia falls under the supervision of the Superintendencia Financiera de Colombia, an entity whose main function is to oversee the financial and insurance sectors. Although it has an important role in monitoring and surveillance, it also has certain regulatory powers that permit it to issue laws and decrees. Additionally, the AMV supervises and regulates the conduct of securities intermediaries, as well as the certification of those who carry out such activities. AMV is a private entity, and is the product of a self-regulatory scheme established after the termination of Law 964 of 2005.
9.5.4 Credicorp Capital Chile S.A.
Credicorp Capital Chile is supervised directly by the Comision del Mercado Financiero (CMF). The CMF ensures that persons or supervised institutions, from formation until liquidation, comply with laws, regulations, statutes and other provisions governing the functioning of these markets. The SVS also authorizes companies to manage mutual funds (Mutual Fund Administrators and General Fund Management or AFM and AGF, respectively, by its Spanish initials) and oversees such companies and their respective funds to ensure compliance with laws and regulations by monitoring their legal, financial and accounting information
In Chile, there are laws, regulations and rules that govern the various sectors of the stock market. One such law is the Securities Market Law, which governs the functioning of the Chilean market and the laws relating to corporations, management of third-party funds (investment funds, mutual funds, pension funds and others) and the deposit and custody of securities.
| 115 |
9.6 Grupo Pacifico
9.6.1 Overview
Grupo Pacifico’s operations are regulated by Law No. 26702 and the SBS. Peruvian insurance companies must submit regular reports to the SBS concerning their operations. In addition, the SBS conducts on-site reviews on an annual basis, primarily to evaluate a company’s compliance with solvency margin, reserve and investment requirements and rules governing the recognition of premium income. If the SBS determines that a company is unable to meet the solvency margin or technical reserve requirements, or is unable to pay claims as they become due, it may either liquidate the company or permit it to merge with another insurance company.
On May 27, 2013, a new Peruvian insurance law, Insurance Act No. 29946, became effective. The act governs all insurance contracts, except for those that are expressly governed by other regulations. It substantially changes how insurance policies are offered by insurance companies, regulates the information provided by the insured, and includes changes to termination and arbitration clauses included in insurance contracts. The Insurance Act No. 29946 also provides a list of terms and conditions that cannot be included in any insurance contract and ensures that any changes in the contract can only be made if 45 days’ notice is given to the policyholder prior to renewal of the policy. Other measures include restrictions on the duration and renewal of contracts, consumer protection rules, and regulations governing how to address non-payment of premium installments required under insurance contracts.
In September 2013, the SBS initiated reforms to the SPP, by establishing a tender process for the exclusive right to manage the SPP’s collective insurance policy for D&S and burial expenses. Tender offers for the collective insurance contract were submitted on September 13, 2013 and the winning bidder obtained the right to manage the SPP’s collective insurance policies from October 1, 2013 until December 31, 2014. The bid submitted by our subsidiary Pacifico Vida was not selected, and as a result Pacifico Vida has not issued insurance policies in the SPP for D&S and burial expenses since October 2013. However in December 2014, Pacifico Vida won the tender process and was able to issue policies for D&S and burial expenses in the SPP system, from January 2015 to December 2016. Finally, in 2017 Pacifico Vida won the third tender process, which allows the company to continue in the disability and survivorship business for 2017 and 2018.
Under Peruvian law, insurance companies may engage in certain credit risk operations, such as guarantees, bonds and trusteeships, but are prohibited from offering other banking services, operating mutual funds or offering portfolio management services. In addition, insurance companies may not conduct brokerage operations for third parties.
| 116 |
Peruvian insurance companies are also prohibited from having an ownership interest in other insurance or reinsurance companies of the same class unless such risks are developed by insurance companies acting as subsidiaries and that risk is withdraw from the principal insurance company activities (Resolution SBS No. 3930-2017); or in private pension funds.
9.6.2 Establishment of insurance company
Insurance companies must be authorized by the SBS to commence operations. Peruvian law establishes certain minimum capital requirements for insurance and reinsurance companies, which must be satisfied by cash investments in the company. The statutory amounts are expressed in constant value.
9.6.3 Solvency requirements
Pursuant to Law No. 26702, the SBS regulates the solvency margin of Peruvian insurance companies. The solvency margin calculations take into account the amount of premiums written and losses incurred during a specified period prior to the date of the calculation.
Insurance companies must also maintain solvency equity, which must be the greater of (i) the solvency margin and (ii) the minimum capital requirement, as established by law. The required amount of solvency equity is recalculated at least quarterly. If an insurance company has outstanding credit risk operations, part of the solvency equity must be set aside for its coverage.
| Regulatory Ratios (%) - S/ in thousands | Dec 15 | Dec 16 | Dec 17 | |||||||||
| (A) Capital Adequacy | 1,292,452 | 1,462,807 | 1,462,936 | |||||||||
| (B) Regulatory Capital Requeriment | 946,726 | 964,462 | 913,427 | |||||||||
| (B.1) Solvency I Required capital | 699,216 | 712,247 | 676,741 | |||||||||
| (B.2) Security Fund | 244,548 | 249,118 | 236,687 | |||||||||
| (B.3) Credit risk | 0 | 0 | 0 | |||||||||
| (B.4) Other Capital Requeriment | 2,962 | 3,097 | 0 | |||||||||
| (C) Leverage | 578,205 | 495,770 | 592,397 | |||||||||
| Surplus 1 = (A) - (B) | 345,726 | 498,345 | 549,509 | |||||||||
| Ratio (A)/(B) | 1.4 | 1.5 | 1.6 | |||||||||
| Surplus 1 = (A) - (C) | 714,247 | 967,037 | 870,539 | |||||||||
| Ratio (A)/(C) | 2.2 | 3.0 | 2.5 | |||||||||
| 117 |
9.6.4 Legal reserve requirements
Peruvian law also requires that all insurance companies establish a legal guarantee reserve for policyholders by setting aside 10% of income before taxes until the reserve reaches at least 35% of paid-in capital.
9.6.5 Reserve requirements
Pursuant to Law No. 26702 and regulations issued by the SBS, Peruvian insurance companies must establish technical reserves. Law No. 26702 also requires insurance companies to create a reserve for IBNR claims that are reflected as a liability, net of recoveries and reinsurance, in our Consolidated Financial Statements. Reserves for IBNR claims are estimated by using generally accepted actuarial reserving methods. I Note 3(e) to our Consolidated Financial Statements. Finally, Grupo Pacifico is required by the SBS to establish pre-event reserves for risk of catastrophes, which, in accordance with IFRS principles, are not considered in our financial statements. See Item 4. Information on the Company — (5) Review of 2016 - 5.2 Financial Performance - 5.2.4 Grupo Pacifico”.
According to a new regulation associated with the Actuarial Management, Resolution SBS N° 3863-2016, the Actuarial function must (i) ensure the use of real and adequate parameters in both pricing and technical reserves calculation and (ii) guarantee the consistency of the results obtained. Likewise, based on the sufficiency evaluation analysis, Actuarial management must propose changes in the methodologies applied in the calculation of technical or additional reserves.
9.6.6 Investment requirements
Pursuant to Law No. 26702 and regulation issued by the SBS (Resolution SBS N° 1041-2016), the total amount of an insurance company’s solvency equity and technical reserves must be permanently supported by diversified assets, which may not be pledged or otherwise encumbered. The investment regulations further state that deposits in and bonds of one financial institution together cannot exceed 7% of the total of an insurer’s solvency equity and technical reserves combined. In general, no more than 15% of an insurance company’s combined solvency equity and technical reserves may be invested in instruments (including stocks and bonds) issued by a company or group of companies. In order for an insurance company to invest in non-Peruvian securities, the securities must be rated by an internationally recognized credit rating company and the asset class must be authorized by Peruvian SBS regulations. Securities owned by insurance companies must be registered in the Public Registry of Securities of Peru or the comparable registry of their respective country.
| 118 |
Additionally, according to the resolution SBS N° 1041-2016, the current account balance (cash) in one financial institution cannot exceed 5% of the total of an insurer’s solvency equity and technical reserves combined.
9.6.7 Related party transactions
Law No. 26702 generally provides that insurance companies may not extend credit to or guarantee the obligations of employees or members of the board of directors, except for certain home mortgage loans to employees.
9.6.8 Ownership restrictions
Law No. 26702 sets forth the same types of restrictions regarding the ownership and transfer of insurance company shares as it does regarding the ownership and transfer of shares in banks. See “Item 4. Information on the Company - 4.B Business overview - (9) Supervision and Regulation - 9.2 BCP and Mibanco - 9.2.1 Overview”.
9.7 Prima AFP
Prima AFP’s operations are regulated in Peru by the Unified Text of the Private System for the Administration of Funds Act, approved by Supreme Decree No. 054-97-EF. Operations are controlled and supervised by the SBS. In addition, AFPs are under the supervision of the SMV. AFPs must submit reports to the SBS, members and beneficiaries in general, with regard to the administration of pension funds and any information linked to the AFP’s operations.
Under Peruvian legislation, AFPs can only have one type of business activity: they can only offer services linked to the administration of pension funds under the category of individual capitalization accounts made up of mandatory and/or voluntary contributions.
Also, AFPs must provide payments related to retirement, disability, and death benefits, and funeral expenses. AFPs must submit audited financial information, in accordance with SBS regulations. There are certain limitations on the ownership and transfer of AFP shares.
SBS authorization is required for an AFP to begin operations. Peruvian law establishes a minimum capital requirement, paid in cash by the shareholders.
| 119 |
SBS has set investment limits, which, among others, restrict investments in certain asset classes, economic groups, and issuers. In addition, some of these limits vary according to the risk profile of the fund. The general limits are:
• The total amount invested in instruments issued or guaranteed by the Peruvian State cannot exceed 30% of the fund value;
• The total amount invested in instruments issued or guaranteed by BCRP cannot exceed 30% of the fund value;
• The total amount jointly invested under the two aforementioned limits cannot exceed 40% of the fund value and;
• The total amount invested in instruments issued by the government, financial institutions, and non-financial institutions whose commercial activities are mostly abroad, cannot exceed 46% of the fund value as end of 2017. For this specific limit, the SBS sets the maximum and the Peruvian Central Bank (BCRP by its Spanish initials) administers the effective level (operating limit).
SBS requires a guaranteed minimum profitability for funds under management. Part of the guarantee is a reserve requirement, which must be funded by the AFP. The amount depends on the instruments in the portfolio, but is, on average, 1% of Funds under Management. In addition, Peruvian law establishes that companies must set up a legal reserve equivalent to 10% of net income, until the reserve is at least 20% of share capital.
Private Pension System Reform in 2012
In 2012, the Peruvian government passed the Law to Reform the Private Pension System (SPP). The relevant changes that are contemplated in the Law are as follows:
• A tender process for affiliates entering the SPP for the first time, held every 24 months, was incorporated. The AFP that offers the lowest administration fees wins the tender. As a result, new affiliates to the SPP are required to become members of the AFP that wins the tender and remain with this pension fund administrator for the next 24 months. Although the first public tender was held in December 2012, a prior short-term tender procedure with a duration of 8 months (September 2012 – May 2013) was won by Prima AFP.
| 120 |
| N° | Tender Process Date | Period | Winner | |||
| - | September 2012 | October 2012 - May 2013 | Prima AFP | |||
| 1st | December 2012 | June 2013 - May 2015 | AFP Habitat | |||
| 2nd | December 2014 | June 2015 - May 2017 | AFP Habitat | |||
| 3rd | December 2016 | June 2017 - May 2019 | Prima AFP |
• A tender process for the exclusive right to manage the SPP’s collective insurance policy for disability, survivor and burial expenses was also established. The insurance is managed by the insurance company that presents the best economic proposal in the tender and applies for new and existing affiliates.
• A mixed-commission scheme was incorporated into the SPP and includes two types of administration fees: a commission charged on the affiliates’ monthly income and a commission based on the clients’ fund made up of new contributions from 2013 onwards. New affiliates enter the SPP under the mixed-commission scheme and existing affiliates had an opportunity in 2013 to choose between the new scheme and the prior monthly remuneration based scheme.
• A Zero Fund or a Capital Protection Fund was established by each AFP and began operations in April 2016. This fund focus on low-risk investments and its objective is to ensure that affiliates over the age of 65 (retirement age) have a fund that maintains a stable value.
Changes to Private Pension System in 2014
In 2014, new local and foreign investment regulations contributed to the flexibility in SPP’s registration process for new investment securities. Under the new regulations, AFPs can make non-complex investments through vehicles such as bonds, shares and mutual funds without authorization from the SBS. Additionally, AFPs can use derivative instruments without authorization from the SBS under certain restrictions, such as specific limits regarding each type of fund. These changes are expected to improve the management and risk-return profile of our portfolios while providing flexibility and additional opportunities to execute these kinds of transactions.
Changes to Private Pension System in 2015
During 2015, the Reform of the SPP in terms of investments and risk management continued, mainly with the publication of the Resolution SBS No. 3233-2015, which introduces changes to the treatment of the regulatory requirements of both local and foreign investments in order to generate greater flexibility in both direct and indirect investments. The main changes lie in the minimum requirements to be met by structured instruments, bonds for infrastructure projects, the participation fees of mutual and investment funds, as well as repurchase agreements and securities lending. Those requirements seek the efficient administration of the investments and risks associated with the process. SBS Resolution No. 5540-2015 was also published, which regulates the new Fund Type Zero, mandatory for participants from the age of 65 and up who opt for a statutory retirement pension. The Fund Type Zero may only invest in short-term instruments and debt securities, and took effect on April 1, 2016.
| 121 |
Changes to Private Pension System in 2016
In December 2015, the Peruvian Congress passed a draft law that modifies some aspects of the current framework of the pension fund system. This law was observed by the President in January 2016.
On April 14, 2016, the Congress passed the law N° 30425 (further modified by law N° 30478) and it came into effect on April 21, 2016. Among the most relevant changes, the law allows affiliates to: (i) withdraw up to 95.5% of their pension funds when they reach the age of 65 (retirement age); (ii) use up to 25% of their pension funds as the initial payment or amortization of a mortgage loan used to buy their first property (any affiliate), and (iii) withdraw up to 50% of their pension funds in the case of affiliates with terminal illness. The new law also extends the Special Regime of Early Retirement (REJA by its Spanish initials) until December 31, 2018 for affiliates who have been unemployed for at least 12 months, and applies to men and women who are at least 55 and 50 years old respectively, and pensioners who chose the retirement program. During 2016, the withdrawal of funds in Prima AFP was approximately S/ 2,237 million.
Changes to Private Pension System in 2017
In 2017, BCRP raised the foreign investment limit for pension funds to encourage AFPs to diversify their investments. The limit increased from 42% to 45% on July 17, 2017 and to 46% on August 17, 2017. This ceiling has been raised gradually from 10.5% in 2006.
In July 2017, a procedure related to the affiliates’ contributions incorrectly made by regional authorities to the National Pension System instead of the SPP was approved. It requires that these authorities schedule the payment of the debts to the AFPs, for the benefit of the affiliates.
In January 2017, the Economy and Finance Ministry (MEF) established the Social Protection Committee (CPS), which, in November 2017, presented a report including proposals on pension system reforms, health financing and unemployment insurance. The proposals haven’t been discussed yet between the related parties.
| 122 |
(10) Selected Statistical Information
In the following tables, we have set forth certain selected statistical information and ratios regarding our business for the periods indicated. You should read the selected statistical information in conjunction with the information included in “Item 5. Operating and Financial Review and Prospects – 5.A Operating Results” and the Consolidated Financial Statements (and the notes that accompany the financial statements). The statistical information and discussion and analysis given below for the years 2013 through 2017 reflect our consolidated financial position as well as that of our subsidiaries, as of December 31, 2013, 2014, 2015, 2016 and 2017 and our results of operations for such years.
Credicorp’s Board decided that from January 1, 2014, the Sol would be the company’s functional currency and the presentation currency of our financial statements. For this reason, the financial statements for the previous years were restated using Soles as the presentation currency and we have prepared the financial statements from 2014 onward using Soles as both the functional and presentation currency. For this restatement, we used the methodology of IFRS and specifically IAS 21 “The Effects of Changes in Foreign Exchange Rates”. The methodology applied is as follows:
Income statement
Income and expenses expressed in U.S. Dollars for the year 2013 were converted to Soles using the weighted average exchange rate, which was 2.7126855. These rates were obtained from the Superintendencia de Banca, Seguros y AFP (SBS). The accumulated result of every period corresponds to the sum of the restated figures of each month of the period. This accumulated result of the period is presented as part of the entity’s net shareholders’ equity. The difference between the restated retained earnings according to the aforementioned methodology and the restated net shareholders’ equity at the end of the period is recognized under “Reserves”.
Balance sheet
The balance of each account in the balance sheet expressed in U.S. Dollars as of December 31, 2013 was converted to Soles using the period-end exchange rate defined by the SBS, which was 2.795. For net shareholders’ equity, each account is restated using the closing exchange rate except for retained earnings which is restated using the methodology described under “Income statement” above. Likewise, foreign currency translation reserve is restated as explained in Note 3(c) of the Consolidated Financial Statements. The differences are included under “Reserves”.
| 123 |
10.1 Average balance sheets and income from interest-earning assets
The tables below set forth selected statistical information based on our average balance sheets prepared on a consolidated basis. Except as otherwise indicated, we have classified average balances by currency (Soles or foreign currency, primarily U.S. Dollars) rather than by the domestic or international nature of the balance. In addition for the years 2013 and 2014, except where noted, the average balances are computed as the average of period-beginning and period-ending balances on a quarterly basis. For the years 2017, 2016 and 2015 the average balance are computed as the average of period-beginning and period-ending balances on a monthly basis. Any of these quarter-end balances that were denominated in U.S. Dollars have been converted into Soles using the applicable SBS exchange rate as of the date of such balance. Our management does not believe that the stated averages present trends materially different from those that would be presented by daily averages.
| 124 |
Average Balance Sheets
Assets, interest earned and average interest rates
| Year ended December 31, | ||||||||||||||||||||||||||||||||||||
| 2015 | 2016 | 2017 | ||||||||||||||||||||||||||||||||||
| ASSETS: | Average | Interest | Nominal | Average | Interest | Nominal | Average | Interest | Nominal | |||||||||||||||||||||||||||
| Balance | Earned | Avg. Rate | Balance | Earned | Avg. Rate | Balance | Earned | Avg. Rate | ||||||||||||||||||||||||||||
| (Soles in thousands, except percentages) | ||||||||||||||||||||||||||||||||||||
| Interest-earning assets: | ||||||||||||||||||||||||||||||||||||
| Deposits in BCRP | ||||||||||||||||||||||||||||||||||||
| Soles | 406,902 | 7,094 | 1.74 | % | 182,411 | 8,694 | 4.77 | % | 450,352 | 12,299 | 2.73 | % | ||||||||||||||||||||||||
| Foreign Currency | 11,990,709 | 7,992 | 0.07 | 11,460,028 | 13,964 | 0.12 | 11,794,540 | 37,146 | 0.31 | |||||||||||||||||||||||||||
| Total | 12,397,611 | 15,086 | 0.12 | 11,642,439 | 22,658 | 0.19 | 12,244,892 | 49,445 | 0.40 | |||||||||||||||||||||||||||
| Deposits in other Banks | ||||||||||||||||||||||||||||||||||||
| Soles | 304,888 | 7,955 | 2.61 | 91,219 | 9,256 | 10.15 | 136,359 | 7,576 | 5.56 | |||||||||||||||||||||||||||
| Foreign Currency | 12,064,395 | 9,777 | 0.08 | 15,060,698 | 16,712 | 0.11 | 12,084,168 | 31,338 | 0.26 | |||||||||||||||||||||||||||
| Total | 12,369,283 | 17,732 | 0.14 | 15,151,917 | 25,968 | 0.17 | 12,220,527 | 38,914 | 0.32 | |||||||||||||||||||||||||||
| Investment securities | ||||||||||||||||||||||||||||||||||||
| Soles | 12,326,115 | 541,793 | 4.40 | 14,472,747 | 702,910 | 4.86 | 20,331,681 | 904,881 | 4.45 | |||||||||||||||||||||||||||
| Foreign Currency | 10,266,744 | 380,110 | 3.70 | 12,510,462 | 402,128 | 3.21 | 11,379,424 | 394,964 | 3.47 | |||||||||||||||||||||||||||
| Total | 22,592,859 | 921,903 | 4.08 | 26,983,209 | 1,105,038 | 4.10 | 31,711,105 | 1,299,845 | 4.10 | |||||||||||||||||||||||||||
| Total loans (1) | ||||||||||||||||||||||||||||||||||||
| Soles | 48,397,991 | 6,365,714 | 13.15 | 56,027,984 | 7,128,293 | 12.72 | 56,005,287 | 7,498,053 | 13.39 | |||||||||||||||||||||||||||
| Foreign Currency | 36,987,509 | 2,340,658 | 6.33 | 36,942,460 | 2,351,574 | 6.37 | 39,379,438 | 2,048,401 | 5.20 | |||||||||||||||||||||||||||
| Total | 85,385,500 | 8,706,372 | 10.20 | 92,970,444 | 9,479,867 | 10.20 | 95,384,725 | 9,546,454 | 10.01 | |||||||||||||||||||||||||||
| Total dividend-earning assets | ||||||||||||||||||||||||||||||||||||
| Soles | 756,082 | 46,937 | 6.21 | 739,555 | 43,798 | 5.92 | 735,850 | 32,207 | 4.38 | |||||||||||||||||||||||||||
| Foreign Currency | 982,337 | 8,657 | 0.88 | 744,223 | 8,033 | 1.08 | 418,714 | 20,699 | 4.94 | |||||||||||||||||||||||||||
| Total | 1,738,419 | 55,594 | 3.20 | 1,483,778 | 51,831 | 3.49 | 1,154,564 | 52,906 | 4.58 | |||||||||||||||||||||||||||
| Total interest-earning assets | ||||||||||||||||||||||||||||||||||||
| Soles | 62,191,978 | 6,969,493 | 11.21 | 71,513,916 | 7,892,951 | 11.04 | 77,659,529 | 8,455,016 | 10.89 | |||||||||||||||||||||||||||
| Foreign Currency | 72,291,694 | 2,747,194 | 3.80 | 76,717,871 | 2,792,411 | 3.64 | 75,056,284 | 2,532,548 | 3.37 | |||||||||||||||||||||||||||
| Total | 134,483,672 | 9,716,687 | 7.23 | 148,231,787 | 10,685,362 | 7.21 | 152,715,813 | 10,987,564 | 7.19 | |||||||||||||||||||||||||||
| Noninterest-earning assets: | ||||||||||||||||||||||||||||||||||||
| Cash and due from banks | ||||||||||||||||||||||||||||||||||||
| Soles | 2,328,120 | 2,127,988 | 2,335,051 | |||||||||||||||||||||||||||||||||
| Foreign Currency | 1,452,454 | 1,658,451 | 2,034,910 | |||||||||||||||||||||||||||||||||
| Total | 3,780,574 | 3,786,439 | 4,369,961 | |||||||||||||||||||||||||||||||||
| Allowance for direct loan losses | ||||||||||||||||||||||||||||||||||||
| Soles | (2,475,759 | ) | (2,764,531 | ) | (3,102,394 | ) | ||||||||||||||||||||||||||||||
| Foreign Currency | (1,146,549 | ) | (1,285,636 | ) | (1,226,409 | ) | ||||||||||||||||||||||||||||||
| Total | (3,622,308 | ) | (4,050,167 | ) | (4,328,803 | ) | ||||||||||||||||||||||||||||||
| Premises and equipment | ||||||||||||||||||||||||||||||||||||
| Soles | 1,132,370 | 975,150 | 997,885 | |||||||||||||||||||||||||||||||||
| Foreign Currency | 565,600 | 625,937 | 661,952 | |||||||||||||||||||||||||||||||||
| Total | 1,697,970 | 1,601,087 | 1,659,837 | |||||||||||||||||||||||||||||||||
| Other non-interest-earning assets and gain from derivatives instruments and other interest income | ||||||||||||||||||||||||||||||||||||
| Soles | 882,467 | 47,289 | 4,508,824 | 78,745 | 3,780,241 | 35,652 | ||||||||||||||||||||||||||||||
| Foreign Currency | 8,868,464 | 20,113 | 5,096,607 | 8,948 | 5,255,753 | 7,467 | ||||||||||||||||||||||||||||||
| Total | 9,750,931 | 67,402 | 9,605,431 | 87,693 | 9,035,994 | 43,119 | ||||||||||||||||||||||||||||||
| Total non-interest-earning assets | ||||||||||||||||||||||||||||||||||||
| Soles | 1,867,198 | 47,289 | 4,847,431 | 78,745 | 4,010,783 | 35,652 | ||||||||||||||||||||||||||||||
| Foreign Currency | 9,739,969 | 20,113 | 6,095,359 | 8,948 | 6,726,206 | 7,467 | ||||||||||||||||||||||||||||||
| Total | 11,607,167 | 67,402 | 10,942,790 | 87,693 | 10,736,989 | 43,119 | ||||||||||||||||||||||||||||||
| Total average assets | ||||||||||||||||||||||||||||||||||||
| Soles | 64,059,176 | 7,016,782 | 10.95 | 76,361,347 | 7,971,696 | 10.44 | 81,670,312 | 8,490,668 | 10.40 | |||||||||||||||||||||||||||
| Foreign Currency | 82,031,663 | 2,767,307 | 3.37 | 82,813,230 | 2,801,359 | 3.38 | 81,782,490 | 2,540,015 | 3.11 | |||||||||||||||||||||||||||
| Total | 146,090,839 | 9,784,089 | 6.70 | 159,174,577 | 10,773,055 | 6.77 | 163,452,802 | 11,030,683 | 6.75 | |||||||||||||||||||||||||||
| (1) | Figures for total loans include internal overdue loans, but do not include accrued but unpaid interest on such internal overdue loans in the year in which such loans became internal overdue loans. Accrued interest is included. |
| 125 |
Average Balance Sheets
Liabilities, Interest Paid and Average Interest Rates
| Year ended December 31, | ||||||||||||||||||||||||||||||||||||
| 2015 | 2016 | 2017 | ||||||||||||||||||||||||||||||||||
| LIABILITIES |
Average Balance |
Interest Paid |
Nominal Avg. Rate |
Average Balance |
Interest Paid |
Nominal Avg. Rate |
Average Balance |
Interest Paid |
Nominal Avg. Rate |
|||||||||||||||||||||||||||
| (Soles in thousand, except percentages) | ||||||||||||||||||||||||||||||||||||
| Interest-bearing liabilities: | ||||||||||||||||||||||||||||||||||||
| Savings deposits | ||||||||||||||||||||||||||||||||||||
| Soles (1) | 11,426,660 | 66,243 | 0.58 | % | 12,283,090 | 70,108 | 0.57 | % | 13,341,548 | 77,061 | 0.58 | % | ||||||||||||||||||||||||
| Foreign Currency (1) | 11,186,924 | 34,361 | 0.31 | 13,382,283 | 41,090 | 0.31 | 13,326,600 | 45,150 | 0.34 | |||||||||||||||||||||||||||
| Total | 22,613,584 | 100,604 | 0.44 | 25,665,373 | 111,198 | 0.43 | 26,668,148 | 122,211 | 0.46 | |||||||||||||||||||||||||||
| Time deposits | ||||||||||||||||||||||||||||||||||||
| Soles (1) | 14,089,138 | 546,073 | 3.88 | 15,910,352 | 718,632 | 4.52 | 16,987,973 | 709,245 | 4.17 | |||||||||||||||||||||||||||
| Foreign Currency (1) | 17,818,973 | 269,525 | 1.51 | 18,383,326 | 283,663 | 1.54 | 19,388,313 | 311,797 | 1.61 | |||||||||||||||||||||||||||
| Total | 31,908,111 | 815,598 | 2.56 | 34,293,678 | 1,002,295 | 2.92 | 36,376,286 | 1,021,042 | 2.81 | |||||||||||||||||||||||||||
| Due to banks and correspondents | ||||||||||||||||||||||||||||||||||||
| Soles | 12,338,837 | 574,886 | 4.66 | 14,768,243 | 642,869 | 4.35 | 13,190,091 | 570,066 | 4.32 | |||||||||||||||||||||||||||
| Foreign Currency | 6,592,277 | 183,509 | 2.78 | 5,492,583 | 179,645 | 3.27 | 7,262,974 | 193,370 | 2.66 | |||||||||||||||||||||||||||
| Total | 18,931,114 | 758,395 | 4.01 | 20,260,826 | 822,514 | 4.06 | 20,453,065 | 763,436 | 3.73 | |||||||||||||||||||||||||||
| Bonds | ||||||||||||||||||||||||||||||||||||
| Soles | 2,236,690 | 152,516 | 6.82 | 2,376,839 | 171,783 | 7.23 | 2,985,873 | 184,383 | 6.18 | |||||||||||||||||||||||||||
| Foreign Currency | 13,589,144 | 600,657 | 4.42 | 13,416,720 | 633,568 | 4.72 | 12,692,444 | 650,872 | 5.13 | |||||||||||||||||||||||||||
| Total | 15,825,834 | 753,173 | 4.76 | 15,793,559 | 805,351 | 5.10 | 15,678,317 | 835,255 | 5.33 | |||||||||||||||||||||||||||
| Total interest-bearing liabilities | ||||||||||||||||||||||||||||||||||||
| Soles | 40,091,325 | 1,339,718 | 3.34 | 45,338,524 | 1,603,392 | 3.54 | 46,505,485 | 1,540,755 | 3.31 | |||||||||||||||||||||||||||
| Foreign Currency | 49,187,318 | 1,088,052 | 2.21 | 50,674,912 | 1,137,966 | 2.25 | 52,670,331 | 1,201,189 | 2.38 | |||||||||||||||||||||||||||
| Total | 89,278,643 | 2,427,770 | 2.72 | 96,013,436 | 2,741,358 | 2.86 | 99,175,816 | 2,741,944 | 2.76 | |||||||||||||||||||||||||||
| Non-interest-bearing liabilities and net equity: | ||||||||||||||||||||||||||||||||||||
| Demand deposits (2) | ||||||||||||||||||||||||||||||||||||
| Soles (1) | 9,857,708 | 33,130 | 0.34 | 9,211,357 | 35,396 | 0.38 | 10,657,824 | 76,069 | 0.71 | % | ||||||||||||||||||||||||||
| Foreign Currency (1) | 18,583,945 | 23,669 | 0.13 | 20,006,321 | 34,219 | 0.17 | 18,533,473 | 41,343 | 0.22 | |||||||||||||||||||||||||||
| Total | 28,441,653 | 56,799 | 0.20 | 29,217,678 | 69,615 | 0.24 | 29,191,297 | 117,412 | 0.40 | |||||||||||||||||||||||||||
| Other liabilities and loss from derivatives instruments and other interest expenses | ||||||||||||||||||||||||||||||||||||
| Soles | 5,248,737 | 4,326 | 6,205,882 | (666 | ) | 6,589,644 | 21,384 | |||||||||||||||||||||||||||||
| Foreign Currency | 7,562,677 | 38,238 | 9,233,420 | 104,407 | 7,250,235 | 78,456 | ||||||||||||||||||||||||||||||
| Total | 12,811,414 | 42,564 | 15,439,302 | 103,741 | 13,839,879 | 99,840 | ||||||||||||||||||||||||||||||
| Equity attributable to Credicorp equity holders | ||||||||||||||||||||||||||||||||||||
| Soles | ||||||||||||||||||||||||||||||||||||
| Foreign Currency | 14,957,854 | 17,963,624 | 20,781,728 | |||||||||||||||||||||||||||||||||
| Total | 14,957,854 | 17,963,624 | 20,781,728 | |||||||||||||||||||||||||||||||||
| Non-controlling interest | ||||||||||||||||||||||||||||||||||||
| Soles | ||||||||||||||||||||||||||||||||||||
| Foreign Currency | 601,275 | 540,537 | 464,082 | |||||||||||||||||||||||||||||||||
| Total | 601,275 | 540,537 | 464,082 | |||||||||||||||||||||||||||||||||
| Total non-interest-bearing liabilities and equity | ||||||||||||||||||||||||||||||||||||
| Soles | 15,106,445 | 37,456 | 15,417,239 | 34,730 | 17,247,468 | 97,453 | ||||||||||||||||||||||||||||||
| Foreign Currency | 41,705,751 | 61,907 | 47,743,902 | 138,626 | 47,029,518 | 119,799 | ||||||||||||||||||||||||||||||
| Total | 56,812,196 | 99,363 | 63,161,141 | 173,356 | 64,276,986 | 217,252 | ||||||||||||||||||||||||||||||
| Total average liabilities and equity | ||||||||||||||||||||||||||||||||||||
| Soles | 55,197,770 | 1,377,174 | 2.49 | 60,755,763 | 1,638,122 | 2.70 | 63,752,953 | 1,638,208 | 2.57 | |||||||||||||||||||||||||||
| Foreign Currency | 90,893,069 | 1,149,959 | 1.27 | 98,418,814 | 1,276,592 | 1.30 | 99,699,847 | 1,320,988 | 1.32 | |||||||||||||||||||||||||||
| Total | 146,090,839 | 2,527,133 | 1.73 | 159,174,577 | 2,914,714 | 1.83 | 163,452,800 | 2,959,196 | 1.81 | |||||||||||||||||||||||||||
| (1) | Includes the amount paid - for the deposit insurance fund. |
| (2) | Our policy does not consider the payment of interests for demand deposits; however, exceptionally the group pays interest for certain demand deposits of corporate clients that exceed certain amounts. These payments are not considered material |
| 126 |
10.1.1 Changes in net interest income and expense: volume and rate analysis
The table below sets forth the net effect of annual variation in interest income and interest expense, considering the increase or decrease due to changes in volume and rate. The net changes in interest income and interest expense are presented both in functional currency (Sol) and foreign currency:
| 2016/2015 | 2017/2016 | |||||||||||||||||||||||
| Increase/(Decrease) due to changes in: | Increase/(Decrease due to changes in: | |||||||||||||||||||||||
| Volume | Rate | Net Change | Volume | Rate | Net Change | |||||||||||||||||||
| (Soles in thousand) | ||||||||||||||||||||||||
| Interest Income: | ||||||||||||||||||||||||
| Interest-earning deposits in BCRP | ||||||||||||||||||||||||
| Soles | (7,307 | ) | 8,907 | 1,600 | 10,044 | (6,439 | ) | 3,605 | ||||||||||||||||
| Foreign Currency | (500 | ) | 6,472 | 5,972 | 731 | 22,451 | 23,182 | |||||||||||||||||
| Total | (7,807 | ) | 15,379 | 7,572 | 10,775 | 16,012 | 26,787 | |||||||||||||||||
| Deposits in other banks | ||||||||||||||||||||||||
| Soles | (13,628 | ) | 14,929 | 1,301 | 3,544 | (5,224 | ) | (1,680 | ) | |||||||||||||||
| Foreign Currency | 2,877 | 4,058 | 6,935 | (5,511 | ) | 20,137 | 14,626 | |||||||||||||||||
| Total | (10,751 | ) | 18,987 | 8,236 | (1,967 | ) | 14,913 | 12,946 | ||||||||||||||||
| Investment securities | ||||||||||||||||||||||||
| Soles | 99,306 | 61,811 | 161,117 | 272,657 | (70,686 | ) | 201,971 | |||||||||||||||||
| Foreign Currency | 77,595 | (55,577 | ) | 22,018 | (37,806 | ) | 30,642 | (7,164 | ) | |||||||||||||||
| Total | 176,901 | 6,234 | 183,135 | 234,851 | (40,044 | ) | 194,807 | |||||||||||||||||
| Total loans(1) | ||||||||||||||||||||||||
| Soles | 987,153 | (224,574 | ) | 762,579 | (2,963 | ) | 372,723 | 369,760 | ||||||||||||||||
| Foreign Currency | (2,859 | ) | 13,775 | 10,916 | 140,945 | (444,118 | ) | (303,173 | ) | |||||||||||||||
| Total | 984,294 | (210,799 | ) | 773,495 | 137,982 | (71,395 | ) | 66,587 | ||||||||||||||||
| Total dividend-earning assets | ||||||||||||||||||||||||
| Soles | (1,002 | ) | (2,137 | ) | (3,139 | ) | (191 | ) | (11,400 | ) | (11,591 | ) | ||||||||||||
| Foreign Currency | (2,334 | ) | 1,710 | (624 | ) | (9,802 | ) | 22,468 | 12,666 | |||||||||||||||
| Total | (3,336 | ) | (427 | ) | (3,763 | ) | (9,993 | ) | 11,068 | 1,075 | ||||||||||||||
| Total interest-earning assets | ||||||||||||||||||||||||
| Soles | 1,036,756 | (113,298 | ) | 923,458 | 673,689 | (111,624 | ) | 562,065 | ||||||||||||||||
| Foreign Currency | 164,654 | (119,437 | ) | 45,217 | (58,272 | ) | (201,591 | ) | (259,863 | ) | ||||||||||||||
| Total | 1,201,410 | (232,735 | ) | 968,675 | 615,417 | (313,215 | ) | 302,202 | ||||||||||||||||
| Interest Expense: | ||||||||||||||||||||||||
| Demand deposits | ||||||||||||||||||||||||
| Soles | (2,328 | ) | 4,594 | 2,266 | 7,941 | 32,732 | 40,673 | |||||||||||||||||
| Foreign Currency | 2,122 | 8,428 | 10,550 | (2,902 | ) | 10,026 | 7,124 | |||||||||||||||||
| Total | (206 | ) | 13,022 | 12,816 | 5,039 | 42,758 | 47,797 | |||||||||||||||||
| Savings deposits | ||||||||||||||||||||||||
| Soles | 4,927 | (1,061 | ) | 3,866 | 6,077 | 875 | 6,952 | |||||||||||||||||
| Foreign Currency | 6,742 | (13 | ) | 6,729 | (180 | ) | 4,240 | 4,060 | ||||||||||||||||
| Total | 11,669 | (1,074 | ) | 10,595 | 5,897 | 5,115 | 11,012 | |||||||||||||||||
| Time deposits | ||||||||||||||||||||||||
| Soles | 76,424 | 96,135 | 172,559 | 46,832 | (56,219 | ) | (9,387 | ) | ||||||||||||||||
| Foreign Currency | 8,622 | 5,516 | 14,138 | 15,835 | 12,299 | 28,134 | ||||||||||||||||||
| Total | 85,046 | 101,651 | 186,697 | 62,667 | (43,920 | ) | 18,747 | |||||||||||||||||
| Due to banks and correspondents and issued bonds | ||||||||||||||||||||||||
| Soles | 109,472 | (41,489 | ) | 67,983 | (68,452 | ) | (4,351 | ) | (72,803 | ) | ||||||||||||||
| Foreign Currency | (33,290 | ) | 29,426 | (3,864 | ) | 52,519 | (38,794 | ) | 13,725 | |||||||||||||||
| Total | 76,182 | (12,063 | ) | 64,119 | (15,933 | ) | (43,145 | ) | (59,078 | ) | ||||||||||||||
| Bonds | ||||||||||||||||||||||||
| Soles | 9,843 | 9,424 | 19,267 | 40,813 | (28,213 | ) | 12,600 | |||||||||||||||||
| Foreign Currency | (7,882 | ) | 40,793 | 32,911 | (35,672 | ) | 52,976 | 17,304 | ||||||||||||||||
| Total | 1,961 | 50,217 | 52,178 | 5,141 | 24,763 | 29,904 | ||||||||||||||||||
| Total interest-bearing liabilities | ||||||||||||||||||||||||
| Soles | 180,455 | 83,219 | 263,674 | 39,966 | (102,603 | ) | (62,637 | ) | ||||||||||||||||
| Foreign Currency | 33,156 | 16,758 | 49,914 | 45,158 | 18,065 | 63,223 | ||||||||||||||||||
| Total | 213,611 | 99,977 | 313,588 | 85,124 | (84,538 | ) | 586 | |||||||||||||||||
| (1) | Figures for total loans include internal overdue loans, but do not include accrued but unpaid interest on such internal overdue loans in the year in which such loans became internal overdue loans. Accrued interest is included. |
| 127 |
10.1.2 Average interest-earning assets, net interest margin and yield spread
The following table shows for each of the periods indicated, by currency, the levels of average interest-earning assets, net interest income, gross yield, net interest margin and yield spread, all on a nominal basis:
| Year ended December 31, | ||||||||||||
| 2015 | 2016 | 2017 | ||||||||||
| (Soles in thousands, except percentages) | ||||||||||||
| Average interest-earning assets | ||||||||||||
| Soles | 62,191,978 | 71,513,916 | 77,659,529 | |||||||||
| Foreign Currency | 72,291,694 | 76,717,871 | 75,056,284 | |||||||||
| Total | 134,483,672 | 148,231,787 | 152,715,813 | |||||||||
| Net interest income from interest-earning assets | ||||||||||||
| Soles | 5,629,775 | 6,289,559 | 6,914,261 | |||||||||
| Foreign Currency | 1,659,142 | 1,654,445 | 1,331,359 | |||||||||
| Total (1) | 7,288,917 | 7,944,004 | 8,245,620 | |||||||||
| Gross yield (2) | ||||||||||||
| Soles | 11.21 | % | 11.04 | % | 10.89 | % | ||||||
| Foreign Currency | 3.80 | % | 3.64 | % | 3.37 | % | ||||||
| Weighted-average rate | 7.23 | % | 7.21 | % | 7.19 | % | ||||||
| Net interest margin (3) | ||||||||||||
| Soles | 9.05 | % | 8.79 | % | 8.90 | % | ||||||
| Foreign Currency | 2.30 | % | 2.16 | % | 1.77 | % | ||||||
| Weighted-average rate | 5.42 | % | 5.36 | % | 5.40 | % | ||||||
| Yield spread (4) | ||||||||||||
| Soles | 7.86 | % | 7.50 | % | 7.57 | % | ||||||
| Foreign Currency | 1.59 | % | 1.39 | % | 1.09 | % | ||||||
| Weighted-average rate | 4.51 | % | 4.35 | % | 4.43 | % | ||||||
| (1) | Net interest income includes the interest earned of total interest-earning assets and interest paid of the total interest-bearing liabilities, shown in section 10.1 Average balance sheets and income from interest-earning assets. |
| (2) | Gross yield is interest income divided by average interest-earning assets. |
| (3) | Net interest margin represents net interest income divided by average interest-earning assets. |
| (4) | Yield spread, on a nominal basis, represents the difference between gross yield on average interest-earning assets and average cost of interest-bearing liabilities. |
10.1.3 Interest-earning deposits with other banks
The following table shows the short-term funds deposited with other banks. These deposits are denominated by currency as of the dates indicated. Deposits held in countries other than Peru are denominated in several currencies; however, the majority of these deposits are denominated in U.S. Dollars. All currencies were converted to Soles using the applicable SBS exchange rate as of the dates indicated.
| 128 |
| Year ended December 31, | ||||||||||||
| 2015 | 2016 | 2017 | ||||||||||
| (Soles in thousands) | ||||||||||||
| Sol-denominated: | ||||||||||||
| The Peruvian Central Bank | 88,665 | 179,400 | 453,463 | |||||||||
| Commercial banks | 96,850 | 173,737 | 178,505 | |||||||||
| Total Sol-denominated | 185,515 | 353,137 | 631,968 | |||||||||
| Foreign Currency-denominated: | ||||||||||||
| The Peruvian Central Bank (U.S. Dollars) | 13,865,174 | 8,463,256 | 14,682,782 | |||||||||
| Commercial banks (U.S. Dollars) | 3,031,969 | 2,091,276 | 1,739,755 | |||||||||
| Commercial banks (other currencies) | 295,826 | 169,443 | 147,706 | |||||||||
| Total Foreign Currency-denominated | 17,192,969 | 10,723,975 | 16,570,243 | |||||||||
| Total | 17,378,484 | 11,077,112 | 17,202,211 | |||||||||
10.2 Investment portfolio
The following table shows the fair value of our trading, available-for-sale and held to maturity investment securities without interest designated by type of security at the dates indicated (see Note 6 to the Consolidated Financial Statements):
| Year ended December 31, | ||||||||||||
| 2015 | 2016 | 2017 | ||||||||||
| Sol-denominated: | ||||||||||||
| Peruvian Government Bonds | 3,905,464 | 5,479,972 | 6,700,376 | |||||||||
| Equity securities | 686,108 | 793,002 | 678,698 | |||||||||
| Bonds | 1,520,669 | 2,022,734 | 2,273,728 | |||||||||
| Certificates of deposit BCRP | 6,006,110 | 7,062,505 | 10,026,037 | |||||||||
| Other investments | 523,174 | 567,950 | 832,682 | |||||||||
| Total Sol-denominated | 12,641,525 | 15,926,163 | 20,511,521 | |||||||||
| Foreign Currency-denominated: | ||||||||||||
| Equity securities | 859,705 | 628,740 | 208,689 | |||||||||
| Bonds | 7,949,126 | 8,650,295 | 8,774,670 | |||||||||
| Peruvian Government Bonds | 1,271,900 | 750,394 | 1,291,618 | |||||||||
| Other investment | 1,702,726 | 1,601,308 | 1,761,603 | |||||||||
| Total foreign currency-denominated | 11,783,457 | 11,630,737 | 12,036,580 | |||||||||
| Total securities holdings (1): | 24,424,982 | 27,556,900 | 32,548,101 | |||||||||
| (1) | Excludes accrued interest, which amounts to S/249.2 million, S/262.2 million and S/313.9 million as of December 31, 2015, 2016 and 2017, respectively. |
The allowance for decline in value of marketable securities is debited from the value of each individual security.
The weighted-average yield on our Sol-denominated interest-earning investment securities was 4.4% in 2015, 4.9% in 2016 and 4.5% in 2017. The weighted-average yield on our foreign currency-denominated portfolio was 3.7% in 2015, 3.2% in 2016 and 3.5% in 2017. The total weighted-average yield of our investment securities was 4.1% in 2015, 2016 and 2017.
| 129 |
The weighted-average yield on our Sol-denominated dividend-earning assets was 6.2% in 2015, 5.9% in 2016 and 4.4% in 2017. The weighted-average yield on our foreign currency-denominated portfolio was 0.9% in 2015, 1.1% in 2016 and 4.9% in 2017. The total weighted-average yield of our dividend-earning assets was 3.2% in 2015, 3.5% in 2016 and 4.6% in 2017.
The interest accrued on investments trading, investments available for sale and investments held to maturity were presented separately in Note 6 to the Consolidated Financial Statements.
As of December 31, 2017, the investments available-for-sale and held-to-maturity pledged as collateral amounted to S/5,278.8 million. The following table shows the maturities , as of December 31, 2017, of our trading, available-for-sale and held to maturity investment securities designated by type of security:
|
Without
maturity |
Within
1 year |
After 1 year
but within 3 years |
Maturing
after 3 years but within 5 years |
Maturing after
5 years but within 10 years |
After 10
Years |
Total | ||||||||||||||||||||||
| (Soles in thousands) | ||||||||||||||||||||||||||||
| Sol-denominated: | ||||||||||||||||||||||||||||
| Peruvian government bonds | - | 367,667 | 1,887,830 | - | 2,240,908 | 2,203,971 | 6,700,376 | |||||||||||||||||||||
| Equity securities (1) | 678,698 | - | - | - | - | - | 678,698 | |||||||||||||||||||||
| Bonds and debentures | - | 59,961 | 162,948 | 134,450 | 592,183 | 1,324,186 | 2,273,728 | |||||||||||||||||||||
| Certificates of deposit BCRP | - | 9,962,998 | 63,039 | - | - | - | 10,026,037 | |||||||||||||||||||||
| Other investments | 579,751 | 9,499 | - | 9,363 | 21,033 | 213,036 | 832,682 | |||||||||||||||||||||
| Total Sol-denominated | 1,258,449 | 10,400,125 | 2,113,817 | 143,813 | 2,854,124 | 3,741,193 | 20,511,521 | |||||||||||||||||||||
| Foreign Currency-denominated: | ||||||||||||||||||||||||||||
| Peruvian government bonds | - | 13,003 | 502,857 | 21,220 | 444,621 | 309,917 | 1,291,618 | |||||||||||||||||||||
| Equity securities (1) | 208,689 | - | - | - | - | - | 208,689 | |||||||||||||||||||||
| Bonds | - | 1,017,285 | 1,758,125 | 1,521,024 | 2,602,534 | 1,875,702 | 8,774,670 | |||||||||||||||||||||
| The Peruvian Central Bank certif. notes | - | - | - | - | - | - | - | |||||||||||||||||||||
| Other investments | 888,682 | 319,112 | 175,117 | 122,081 | 88,786 | 167,825 | 1,761,603 | |||||||||||||||||||||
| Total Foreign Currency-denominated | 1,097,371 | 1,349,400 | 2,436,099 | 1,664,325 | 3,135,941 | 2,353,444 | 12,036,580 | |||||||||||||||||||||
| Total securities holdings: | 2,355,820 | 11,749,525 | 4,549,916 | 1,808,138 | 5,990,065 | 6,094,637 | 32,548,101 | |||||||||||||||||||||
| Weighted-average yield | 6.20 | % | ||||||||||||||||||||||||||
| (1) | Equity securities in our account are categorized as without maturity. |
The maturities of our investment securities classified as trading and available-for-sale, as of December 31, 2017, are described in “Item 11. Quantitative and Qualitative Disclosures about Market Risk.”
| 130 |
Pursuant to the criteria described below, our management has determined that the unrealized losses of our investments available-for-sale, as of December 31, 2017, 2016 and 2015 which amounted to S/36.7 million, S/178.4 million and S/450.5 million, respectively, were temporary and intends to hold each investment for a sufficient period of time to allow for a potential recovery in fair value. This holding period will last until the earlier of the investment’s recovery or maturity.
For equity investments, management considers the following criteria to determine whether a loss is temporary:
| • | The length of time and the extent to which fair value has been below cost; |
| • | The severity of the impairment; |
| • | The cause of the impairment and the financial condition and near-term prospects of the issuer; and |
| • | Activity in the market of the issuer which may indicate adverse credit conditions. |
For debt investments, management considers the following criteria to determine whether a loss is temporary:
Management assesses the probability that the company will receive all amounts due (principal and interest) under the contract of the security. It considers a number of factors in identifying a credit-impaired security, including: (i) the nature of the security and the underlying collateral, (ii) the amount of subordination or credit enhancement supporting the security, (iii) the published credit rating and (iv) other analyses of the probable cash flows from the security. If recovery of all amounts due is not likely, management may determine that credit impairment exists and record unrealized losses on our consolidated income statement. The unrealized loss recorded in income represents the security’s decline in fair value, which includes the decline due to forecasted cash flow shortfalls as well as widening market spread. For a security with an unrealized loss not identified as credit impairment, management determines whether it is desirable to hold the security for a period of time to allow for a potential recovery in the security’s amortized cost. Management estimates a security’s forecasted recovery period using current estimates of volatility in market interest rates (including liquidity and risk premiums).
Management considers a number of factors to determine whether to hold an investment, including (i) a quantitative estimate of the expected recovery period (which may extend to maturity), (ii) the severity of the impairment and (iii) its strategy with respect to the security or portfolio. If management determines it is not desirable to hold the security for a sufficient period of time to allow for a potential recovery in the security’s amortized cost, we record the unrealized loss in our consolidated income statement.
| 131 |
10.3 Loan portfolio
10.3.1 Loans by type of loan
The following table shows our loans by type of loan, at the dates indicated:
| On December 31, | ||||||||||||||||||||
| 2013 | 2014 | 2015 | 2016 | 2017 | ||||||||||||||||
| (Soles in thousands) | ||||||||||||||||||||
| Loans (1) | 50,774,283 | 63,804,147 | 73,989,049 | 78,829,537 | 84,592,203 | |||||||||||||||
| Leasing receivables | 8,588,951 | 9,280,086 | 9,574,964 | 8,302,898 | 7,401,018 | |||||||||||||||
| Discounted notes | 1,499,540 | 1,661,592 | 1,794,928 | 1,921,403 | 1,999,099 | |||||||||||||||
| Factoring receivables | 831,803 | 1,002,893 | 1,261,516 | 1,428,571 | 1,722,436 | |||||||||||||||
| Advances and overdrafts in current account | 456,689 | 560,743 | 75,220 | 151,613 | 113,630 | |||||||||||||||
| Refinanced and restructured loans | 371,833 | 647,802 | 769,309 | 844,956 | 915,614 | |||||||||||||||
| Total performing loans | 62,523,099 | 76,957,263 | 87,464,986 | 91,478,978 | 96,744,000 | |||||||||||||||
| Internal overdue loans | 1,437,253 | 2,009,328 | 2,311,242 | 2,620,411 | 3,020,914 | |||||||||||||||
| Unearned interest | (75,378 | ) | (117,160 | ) | (192,381 | ) | (114,879 | ) | (66,823 | ) | ||||||||||
| Accrued interest | 476,953 | 659,929 | 744,652 | 784,391 | 779,684 | |||||||||||||||
| Total loans (2) | 64,361,927 | 79,509,360 | 90,328,499 | 94,768,901 | 100,477,775 | |||||||||||||||
| (1) | The credit card amount is included by the years 2013 S/2,865 million, 2014 S/3,377 million, 2015 S/6,954 million, 2016 S/7,037 million and 2017 S/6,880 million |
| (2) | Total loans refer to direct loans plus accrued interest minus unearned interest. In our Consolidated Financial Statements, “loans, net of unearned income” refers to direct loans minus unearned interest plus accrued interest. See Note 7 to the Consolidated Financial Statements. In addition to loans outstanding, we had off-balance-sheet items, including those mentioned in note (2), that amounted to S/13,036.7 million, S/17,319.5 million, S/19,004.7 million, S/19,832.0 million and S/19,369.6 million, as of December 31, 2013, 2014, 2015, 2016 and 2017 respectively. See Note 20 to the Consolidated Financial Statements. |
The loan portfolio categories set forth in the table above are based on internal classification, which apply to loans generated by BCP, BCP Bolivia and ASB. We categorize loans as follows:
| § | Loans: Basic term loans documented by promissory notes and other extensions of credit, such as mortgage loans, credit cards and other consumer loans in various forms, including trade finance loans to importers and exporters on specialized terms adapted to the needs of the international trade transaction. |
| § | Leasing receivables: Transactions that involve our acquisition of an asset and the financial leasing of that asset to a client. |
| § | Discounted notes: Loans discounted at the outset (the client signs a promissory note or other evidence of indebtedness for the principal amount payable at a future date). Discounted loans also include discounting of drafts, where we make a loan supported by a draft signed by one party and discounted by another party, with recourse to both parties. |
| 132 |
| § | Factoring receivables: The sale of title of a company’s accounts receivables to a bank (or financial company). The receivables are sold without recourse, and the bank cannot recover from the seller in the event that the accounts are uncollectible. Under factoring loans, the seller receives funds from the bank prior to the average maturity date based on the invoice amount of the receivable, less cash discounts and allowances for estimated claims and returns, among other items. |
| § | Advances and overdrafts in current account: Extensions of credit to clients by way of an overdraft facility in the client’s checking account. This category also includes secured short-term advances. |
| § | Refinanced loans: Loans that were refinanced because the client was unable to pay at maturity. A loan is categorized as a refinanced loan when the debtor is experiencing payment problems and asks for a new payment schedule that will allow the debtor to comply with the installments. This policy is based on internal models and past experience as well as IFRS. |
| § | Internal overdue loans: Includes overdue loans. See “Item 4. Information on the Company — 4.B Business Overview — (10) Selected statistical information — 10.3 Loan Portfolio — 10.3.9 Internal overdue Loan Portfolio” for further detail. |
| 133 |
10.3.2 Loans by economic activity
The following table shows our total loan portfolio composition, net of unearned interest, based on the borrower’s principal economic activity:
| At December 31, | ||||||||||||||||||||||||||||||||||||||||
| 2013 | 2014 | 2015 | 2016 | 2017 | ||||||||||||||||||||||||||||||||||||
| (Soles in thousands, except percentages) | ||||||||||||||||||||||||||||||||||||||||
| Amount | % Total | Amount | % Total | Amount | % Total | Amount | % Total | Amount | % Total | |||||||||||||||||||||||||||||||
| Economic Activity | ||||||||||||||||||||||||||||||||||||||||
| Commerce | 9,163,740 | 14.24 | 11,427,341 | 14.37 | 8,592,281 | 9.51 | 15,522,180 | 16.38 | 16,418,351 | 16.34 | ||||||||||||||||||||||||||||||
| Manufacturing | 10,580,629 | 16.44 | 13,082,471 | 16.45 | 14,180,845 | 15.70 | 14,321,394 | 15.11 | 15,536,369 | 15.46 | ||||||||||||||||||||||||||||||
| Mortgage Loans | 10,730,628 | 16.67 | 12,498,191 | 15.72 | 13,258,992 | 14.68 | 14,495,454 | 15.30 | 15,452,087 | 15.38 | ||||||||||||||||||||||||||||||
| Consumer Loans (1) | 8,607,602 | 13.37 | 11,647,219 | 14.65 | 13,878,711 | 15.36 | 11,831,353 | 12.48 | 11,930,879 | 11.87 | ||||||||||||||||||||||||||||||
| Realty Business and Leasing Services | 3,579,330 | 5.56 | 5,134,696 | 6.46 | 6,554,783 | 7.26 | 7,084,598 | 7.48 | 6,025,150 | 6.00 | ||||||||||||||||||||||||||||||
| Communication, Storage and Transportation | 2,436,731 | 3.79 | 3,766,683 | 4.74 | 3,978,516 | 4.40 | 4,933,580 | 5.21 | 5,275,257 | 5.25 | ||||||||||||||||||||||||||||||
| Small Business | 4,118,941 | 6.40 | 3,813,398 | 4.80 | 7,378,361 | 8.17 | 4,625,421 | 4.88 | 4,973,681 | 4.95 | ||||||||||||||||||||||||||||||
| Electricity, Gas and Water | 3,015,101 | 4.68 | 3,932,016 | 4.95 | 4,434,448 | 4.91 | 4,672,459 | 4.93 | 4,281,746 | 4.26 | ||||||||||||||||||||||||||||||
| Mining | 2,933,733 | 4.56 | 2,508,209 | 3.15 | 2,736,641 | 3.03 | 2,378,855 | 2.51 | 3,124,405 | 3.11 | ||||||||||||||||||||||||||||||
| Agriculture | 1,379,604 | 2.14 | 1,740,497 | 2.19 | 2,195,990 | 2.43 | 2,297,446 | 2.42 | 2,584,970 | 2.57 | ||||||||||||||||||||||||||||||
| Financial Services | 792,103 | 1.23 | 1,397,287 | 1.76 | 1,718,962 | 1.90 | 2,216,396 | 2.34 | 2,302,449 | 2.29 | ||||||||||||||||||||||||||||||
| Construction | 1,327,429 | 2.06 | 1,884,714 | 2.37 | 1,996,678 | 2.21 | 2,056,598 | 2.17 | 2,112,349 | 2.10 | ||||||||||||||||||||||||||||||
| Education, Health and Other Services | 867,451 | 1.35 | 1,052,337 | 1.32 | 5,795,456 | 6.42 | 1,361,442 | 1.44 | 1,254,541 | 1.25 | ||||||||||||||||||||||||||||||
| Fishing | 580,815 | 0.90 | 426,458 | 0.54 | 420,734 | 0.47 | 411,860 | 0.43 | 414,042 | 0.41 | ||||||||||||||||||||||||||||||
| Others (2) | 3,846,515 | 5.99 | 4,655,074 | 5.85 | 2,654,830 | 2.94 | 5,890,353 | 6.21 | 8,078,638 | 8.05 | ||||||||||||||||||||||||||||||
| Sub total | 63,960,352 | 99.38 | 78,966,591 | 99.32 | 89,776,228 | 99.39 | 94,099,389 | 99.29 | 99,764,914 | 99.29 | ||||||||||||||||||||||||||||||
| Unearned interest | (75,378 | ) | (0.12 | ) | (117,160 | ) | (0.15 | ) | (192,381 | ) | (0.21 | ) | (114,879 | ) | (0.12 | ) | (66,823 | ) | (0.07 | ) | ||||||||||||||||||||
| Earned interest | 476,953 | 0.74 | 659,929 | 0.83 | 744,652 | 0.82 | 784,391 | 0.83 | 779,684 | 0.78 | ||||||||||||||||||||||||||||||
| Total | 64,361,927 | 100.00 | 79,509,360 | 100.00 | 90,328,499 | 100.00 | 94,768,901 | 100.00 | 100,477,775 | 100.00 | ||||||||||||||||||||||||||||||
| (1) | These amounts comprise: |
| 2013 | 2014 | 2015 | 2016 | 2017 | ||||||||||||||||
| (Soles in thousands) | ||||||||||||||||||||
| Personal Loans | 5,742,434 | 8,270,517 | 6,719,258 | 7,347,714 | 7,469,877 | |||||||||||||||
| Credit card | 2,865,168 | 3,376,702 | 7,159,453 | 4,483,639 | 4,461,002 | |||||||||||||||
| 8,607,602 | 11,647,219 | 13,878,711 | 11,831,353 | 11,930,879 | ||||||||||||||||
| (2) | Includes community services, hotels and restaurants and other sectors. |
As of December 31, 2017, 91.02% of the loan portfolio was concentrated in Peru, and 6.28% of the loan portfolio was concentrated in Bolivia.
| 134 |
10.3.3 Concentrations of loan portfolio and lending limits
As of December 31, 2017, loans and other off-balance-sheet exposure to our 20 largest customers (considered economic groups), equaled S/16,076.0 million, and represented 16.75% of our total loan portfolio. See “Item 4 Information on the company — 4.B Business Overview — (9) Supervision and Regulation — 9.2 BCP and Mibanco— 9.2.8 Lending Activities” for the definition of “economic group”. Our total loans and other off-balance-sheet exposure outstanding to each of these customers ranged from S/403.0 million to S/1,484.4 million, including 11 customers with over S/693.1 million. Total loans and other off-balance-sheet exposure outstanding to our 20 largest customers were ranked in the following risk categories as of December 31, 2017: Class A (normal)—95.91%; Class B (potential problems)—2.02%; Class C (substandard)—2.07%; Class D (doubtful)— 0.00% percent; and Class E (loss)—0.00%. See “Item 4. Information on the Company – 4.B Business Overview - (10) Selected Statistical Information – 10.3 Loan Portfolio – 10.3.7 Classification of the Loan Portfolio”.
BCP’s loans to a single borrower are subject to lending limits imposed by Law 26702. See “Item 4 Information on the Company — 4.B Business overview — (9) Supervision and Regulation — 9.2 BCP and Mibanco — 9.2.8 Lending Activities”. The lending limits depend on the nature of the borrower involved and the type of collateral received. The sum of BCP’s loans to and deposits in either another Peruvian universal bank or Peruvian financial institution, plus any guarantees of third party performance received by BCP from such institution, may not exceed 30% of BCP’s regulatory capital (as defined by the SBS). The sum of BCP’s loans to and deposits in non-Peruvian financial institutions, plus any guarantees of third party performance received by BCP from such institutions, are limited to 5%, 10% or 30% of BCP’s regulatory capital, depending upon the level of government supervision of the institution and whether the institution is recognized by the Peruvian Central Bank as an international bank of prime credit quality. The limits on lending to non-Peruvian financial institutions increases to 50% of BCP’s regulatory capital if the amount by which such loans exceed the 5%, 10% or 30% limits is backed by certain letters of credit.
BCP’s loans to directors and employees and their relatives have a global limit of 7% of regulatory capital and an individual limit of 5% of such global limit.
Loans to non-Peruvian individuals or companies that are not financial institutions have a limit of 5% of BCP’s regulatory capital. However, this limit increases to 10% if the additional 5% is guaranteed by a mortgage or certain publicly-traded securities. The limit rises to 30% if the additional amount is guaranteed by certain banks or by cash deposits in BCP. Lending on an unsecured basis to individuals or companies residing in Peru that are not financial institutions is limited to 10% of BCP’s regulatory capital. This limit rises to 15% if the additional 5% is guaranteed by a mortgage, certain securities, equipment or other collateral, and to 20% if the additional amount is either backed by certain debt instruments guaranteed by other local banks or a foreign bank determined by the Peruvian Central Bank to be of prime credit quality, or by other highly liquid securities at market value. The single borrower lending limit for loans backed by a cash deposit at BCP or by debt obligations of the Peruvian Central Bank is 30% of BCP’s regulatory capital.
| 135 |
Including the regulatory capital of BCP Stand-alone, which amounted to S/16,398.3 million on December 31, 2017, BCP’s legal lending limits varied from S/819.9 million to S/8,199.2 million. Our consolidated lending limits, based on our regulatory capital on a consolidated basis of S/21,723.0 million on December 31, 2017, ranged from S/1,086.2 million to S/10,861.5 million. As of December 31, 2017, BCP was in compliance with the lending limits of Law 26702.
As of December 31, 2017, we complied with the applicable legal lending limits in each of the jurisdictions in which we operate. These limits are calculated quarterly based upon our consolidated equity plus reserves for impaired loans not specifically identified at quarter-end. We have also set internal lending limits, which are more restrictive than those imposed by law. A limited number of exceptions to our internal limits have been authorized by our board of directors based on the credit quality of the borrower, the term of the loan, and the amount and quality of collateral provided. We may, in appropriate and limited circumstances, increase or choose to exceed these internal limits as long as our credit exposure does not exceed the legal lending limits.
We may experience an adverse impact on our financial condition and results of operations if (i) customers to which we have significant credit exposure are not able to satisfy their obligations to us, and any related collateral is not sufficient to cover these obligations, or (ii) a reclassification of one or more of these loans or other off-balance sheet exposure results in an increase in provisions for loan losses.
| 136 |
10.3.4 Loan portfolio denomination
The following table presents our Sol and foreign currency-denominated loan portfolio at the dates indicated:
| At December 31, | ||||||||||||||||||||||||||||||||||||||||
| 2013 | 2014 | 2015 | 2016 | 2017 | ||||||||||||||||||||||||||||||||||||
| (Soles in thousands, except percentages) | ||||||||||||||||||||||||||||||||||||||||
| Total loan portfolio: | ||||||||||||||||||||||||||||||||||||||||
| LC-denominated | 30,383,551 | 47.21 | % | 39,604,255 | 49.81 | % | 54,103,965 | 59.90 | % | 56,007,585 | 59.10 | % | 59,552,110 | 59.27 | % | |||||||||||||||||||||||||
| FC-denominated | 33,978,376 | 52.79 | % | 39,905,105 | 50.19 | % | 36,224,534 | 40.10 | % | 38,761,316 | 40.90 | % | 40,925,665 | 40.73 | % | |||||||||||||||||||||||||
| Total loans (1) | 64,361,927 | 100.00 | % | 79,509,360 | 100.00 | % | 90,328,499 | 100.00 | % | 94,768,901 | 100.00 | % | 100,477,775 | 100.00 | % | |||||||||||||||||||||||||
| (1) | Includes unearned interest and accrued interest. |
10.3.5 Maturity composition of the performing loan portfolio
The following table sets forth an analysis of our performing loan portfolio on December 31, 2017, by type and by time remaining to maturity. Loans are stated before deduction of the allowance for loan losses.
| Maturing | ||||||||||||||||||||||||
|
Amount at
December 31, 2017 |
Within
3 months |
After 3 months
but within 12 months |
After 1 year
but within 3 years |
After 3 years
but within 5 years |
After 5 years | |||||||||||||||||||
| (Soles, except percentages) | ||||||||||||||||||||||||
| Loans | 84,592,203 | 16,143,635 | 16,222,226 | 17,575,981 | 10,445,102 | 24,205,259 | ||||||||||||||||||
| Leasing receivables | 7,401,018 | 548,027 | 1,479,803 | 2,369,988 | 1,455,069 | 1,548,131 | ||||||||||||||||||
| Discounted notes | 1,999,099 | 1,552,471 | 208,628 | 879 | - | 237,121 | ||||||||||||||||||
| Refinanced and restructured loans | 915,614 | 72,420 | 94,712 | 220,627 | 182,825 | 345,030 | ||||||||||||||||||
| Factoring receivables | 1,722,436 | 1,721,301 | 1,135 | - | - | - | ||||||||||||||||||
| Advances and overdrafts in current Account | 113,630 | 8,072 | - | - | - | 105,558 | ||||||||||||||||||
| Total | 96,744,000 | 20,045,926 | 18,006,504 | 20,167,475 | 12,082,996 | 26,441,099 | ||||||||||||||||||
| Internal overdue loans | 3,020,914 | |||||||||||||||||||||||
| Unearned interest | (66,823 | ) | ||||||||||||||||||||||
| Accrued interest | 779,684 | |||||||||||||||||||||||
| Total Loans (1) | 100,477,775 | |||||||||||||||||||||||
| % of total performing loan portfolio | 100.00 | % | 20.72 | % | 18.61 | % | 20.85 | % | 12.49 | % | 27.33 | % | ||||||||||||
| (1) | Included unearned interest and accrued interest. |
10.3.6 Loan portfolio by interest rate type
The following table sets forth the breakdown of our loan portfolio as of December 31, 2017 by interest rate type, currency, and remaining maturity:
|
Amount at December 31, 2017 |
Maturing After 1 year |
|||||||
| Soles in thousands | ||||||||
| Variable Rate | ||||||||
| Sol-denominated | 376,582 | 324,079 | ||||||
| Foreign Currency-denominated | 8,132,049 | 5,523,505 | ||||||
| Total | 8,508,631 | 5,847,584 | ||||||
| Fixed Rate | ||||||||
| Sol-denominated | 59,032,589 | 37,389,425 | ||||||
| Foreign Currency-denominated | 32,223,694 | 15,459,504 | ||||||
| Total | 91,256,283 | 52,848,929 | ||||||
| Sub total | 99,764,914 | 58,696,513 | ||||||
| Unearned interest | (66,823 | ) | ||||||
| Accrued interest | 779,684 | |||||||
| Total loans | 100,477,775 | |||||||
| 137 |
10.3.7 Classification of the loan portfolio
We classify BCP’s loan portfolio (which includes the loan portfolio of Mibanco and Solucion EAH) and ASB’s loan portfolio in accordance with internal practices. According to these criteria, all loans and other credits are classified into one of four categories based upon the purpose of the loan. These categories are.
| § | Commercial loans are generally those that finance the production and sale of goods and services, including commercial leases, as well as credit card debt on cards held by business entities. |
| § | Micro-business loans, which are exclusively targeted for the production and sale of goods and services, are made to individuals or companies with no more than S/300,000 in total loans received from the financial system (excluding mortgage loans). |
| § | Consumer loans are generally loans granted to individuals, including credit card transactions, overdrafts on personal demand deposit accounts, leases, and financing goods or services not related to a business activity. |
| § | Residential mortgage loans are all loans to individuals for the purchase, construction, remodeling, subdivision or improvement of the individual’s home, in each case backed by a mortgage. Mortgage loans made to directors and employees of a company are also considered residential mortgage loans. Mortgage-backed loans are considered commercial loans. The classification of the loan determines the amount to reserve should the borrower fail to make payments as they become due. |
The following table sets forth our loan portfolio by class at the dates indicated:
| At December 31, | ||||||||||||||||||||
| 2013 | 2014 | 2015 | 2016 | 2017 | ||||||||||||||||
| (Soles in thousands) | ||||||||||||||||||||
| Commercial loans | 36,746,804 | 43,535,399 | 53,852,207 | 54,133,871 | 58,455,548 | |||||||||||||||
| Residential mortgage loans | 10,730,628 | 12,498,191 | 13,258,992 | 14,495,454 | 15,452,087 | |||||||||||||||
| Micro-business loans | 7,875,318 | 11,285,782 | 8,786,318 | 12,951,628 | 13,927,557 | |||||||||||||||
| Consumer loans | 8,607,602 | 11,647,219 | 13,878,711 | 12,518,436 | 11,929,722 | |||||||||||||||
| Total | 63,960,352 | 78,966,591 | 89,776,228 | 94,099,389 | 99,764,914 | |||||||||||||||
| Accrued interest | 476,953 | 659,929 | 744,562 | 784,391 | 779,684 | |||||||||||||||
| Unearned interest | (75,378 | ) | (117,160 | ) | (192,381 | ) | (114,879 | ) | (66,823 | ) | ||||||||||
| Total loans | 64,361,927 | 79,509,360 | 90,328,409 | 94,768,901 | 100,477,775 | |||||||||||||||
| 138 |
We employ a range of policies and practices to mitigate credit risk. Our most traditional practice is taking security for fund advances. We implement guidelines on the acceptability of specific classes of collateral or credit risk mitigation. The principal collateral types for loans and advances are mortgages over residential properties, liens over business assets (such as premises, inventory and accounts receivable), and liens over financial instruments (such as debt securities and equities).
Long term finance and lending to corporate entities are generally secured, while revolving individual credit facilities are generally unsecured. In order to minimize credit loss, we seek additional collateral as soon as impairment indicators become apparent.
We determine the appropriate collateral to hold as security for financial assets (other than loans) according to the nature of the instrument. Debt securities, treasury and other eligible bills are generally unsecured, with the exception of asset-backed securities and other similar instruments, which are secured by portfolios of financial instruments.
Our management monitors the market value of collateral, requests additional collateral in accordance with the underlying agreement, and monitors the market value of the additional collateral obtained during its review of the allowance for impairment losses. Our policy is to dispose of repossessed properties in an orderly manner. We use the proceeds to reduce or repay the outstanding claim. In general, we do not use repossessed properties for our own business.
We review our loan portfolio on a continuing basis and we classify our loans based upon risk of nonpayment by assessing the following factors: (i) the payment history of the particular loans, (ii) the history of our dealings with the borrower, (iii) the borrower’s management, (iv) the borrower’s operating history, (v) the borrower’s repayment capability, (vi) the borrower’s availability of funds, (vii) the status of any collateral or guarantee, (viii) the borrower’s financial statements, (ix) the general risk of the sector in which the borrower operates, (x) the borrower’s risk classification made by other financial institutions and (xi) other relevant factors. The classification of the loan determines the amount of the required loan loss provision.
We classify our loan portfolio into one of five risk categories, depending upon the degree of risk of non-payment of each debtor. These categories are: (i) Normal -A, (ii) Potential problems -B, (iii) Substandard -C, (iv) Doubtful -D and (v) Loss -E. which have the following characteristics:
| 139 |
| Class | Category | Definition | ||
| A | Normal | Debtors that fall into this category have complied on a timely basis with their obligations and at the time of evaluation do not present any reason for doubt with respect to repayment of interest and principal on the agreed dates, and there is no reason to believe that the status will change before the next evaluation. | ||
| B | Potential problems |
Includes debtors who have demonstrated certain deficiencies, such as: - Delays in loan payments; - A general lack of information required to analyze the credit; - Out-of-date financial information; - Temporary economic or financial imbalances, which could affect its ability to repay the loan; and/or - Market conditions that could affect the economic sector in which the debtor is active. The aforementioned imply risks regarding recovery of the loan. |
||
| C | Substandard |
Debtors whose payment capacity has been diminished and their available income is not sufficient to cover their financial obligations. Additionally, the bank has considerable doubts about the debtors’ capacity to strengthen their financial capacity in the short term.
Debtors demonstrating the same deficiencies that warrant classification as Class B, warrant classification as Class C if those deficiencies are such that if not corrected in the near term, they could impede the recovery of principal and interest on the loan on the originally agreed-upon terms. |
||
| D | Doubtful |
Debtors whose ability of repayment is considered remote, but there is a reasonable possibility that the creditworthiness of the debtor might improve in the near future.
These loans are distinguished from Class E loans by the requirement that the debtor remain in operation, generate cash flow, and make payments on the loan, even if the payments are less than those required by the contract. |
||
| E | Loss | Includes debtors whose loans are considered unrecoverable or if there is any other reason why the loans should not appear on our books as an asset based on the originally contracted terms. |
| Number of days as internal past due | |||||||||
|
Type of loan / Classification |
Commercial loans | Micro-business loans | Consumer loans |
Residential mortgage
loans |
|||||
| A | Normal | Up to 30 days | Up to 8 days | Up to 8 days | Up to 30 days | ||||
| B | Potential Problem | Between 31 and 60 days | Between 9 and 30 days | Between 9 and 30 days | Between 31 and 60 days | ||||
| C | Substandard | Between 61 and 120 days | Between 31 and 60 days | Between 31 and 60 days | Between 61 and 120 days | ||||
| D | Doubtful | Between 121 and 365 days | Between 61 and 120 days | Between 61 and 120 days | Between 121 and 365 days | ||||
| E | Loss | More than 365 days | More than 120 days | More than 120 days | More than 365 days | ||||
We continually review our loan portfolio to assess the completion and accuracy of our loan classifications.
All loans considered impaired (those classified as substandard, doubtful or loss) are analyzed by management. Management will address the impairment in two areas, individually assessed allowances and collectively assessed allowances, as follows:
| 140 |
| (i) | Individually assessed allowance |
We determine the appropriate allowances for each individually significant loan or advance on an individual basis. In determining the allowance, we consider items such as (i) the sustainability of the counterparty’s business plan, (ii) its ability to improve performance once a financial difficulty has arisen, (iii) projected cash flow receipts and the expected dividend payout should bankruptcy ensue, (iv) the availability of other financial support and including realized value of collateral, and (v) the timing of expected cash flows. Impairment losses are evaluated at each reporting date, unless unforeseen circumstances require more attention.
| (ii) | Collectively assessed allowance |
We assess allowances collectively for (i) losses on loans and advances that are not individually significant (including consumer, micro-business and residential mortgages) and (ii) individually significant loans and advances where there is not yet objective evidence of individual impairment (the Class A and B loans). We evaluate allowances on each reporting date, and each portfolio receives a separate review.
Our collective assessment takes into account an impairment that is likely to be present in the portfolio even though there is no objective evidence of the impairment in an individual assessment. We estimate impairment losses by considering the following information: (i) historical losses on the portfolio (ii) current economic conditions (iii) the approximate delay between the time a loss is likely to have been incurred and the time it will be identified as requiring an individually assessed impairment allowance and (iv) expected receipts and recoveries once the impairment occurs. Management is responsible for deciding the appropriate length of this period, which can extend as long as one year. The impairment allowance is then reviewed by credit management to ensure it aligns with our overall policy.
We assess financial guarantees and letters of credit in the same way we assess loans.
When a borrower is located in a country where there is an increased risk of difficulty servicing external debt, we assess the political and economic conditions in that country, and factor additional country risk into our assessment.
When we determine that a loan is uncollectible, it is written off against the provision for loan impairment. We write off these loans after all necessary procedures have been completed and the amount of the loss is determined. Subsequent recoveries of amounts previously written off decrease the amount of the provision for loan impairment in our consolidated income statements.
| 141 |
The following table shows our direct loan portfolio at the dates indicated:
| At December 31, | ||||||||||||||||||||||||||||||||||||||||
| 2013 | 2014 | 2015 | 2016 | 2017 | ||||||||||||||||||||||||||||||||||||
| Level of Risk | (Soles in thousands, except percentages) | |||||||||||||||||||||||||||||||||||||||
| Classification | Amount | % Total | Amount | % Total | Amount | % Total | Amount | % Total | Amount | % Total | ||||||||||||||||||||||||||||||
| A: Normal | 60,559,195 | 94.6 | 74,255,334 | 94.1 | 83,863,952 | 93.4 | 87,972,245 | 93.5 | 93,483,605 | 93.7 | ||||||||||||||||||||||||||||||
| B: Potential Problems | 1,191,500 | 1.9 | 1,701,045 | 2.2 | 2,267,080 | 2.5 | 1,915,738 | 2.0 | 1,705,663 | 1.7 | ||||||||||||||||||||||||||||||
| C: Substandard | 673,075 | 1.1 | 736,088 | 0.9 | 866,764 | 1.0 | 1,059,315 | 1.1 | 1,165,318 | 1.2 | ||||||||||||||||||||||||||||||
| D: Doubtful | 779,020 | 1.2 | 1,054,541 | 1.3 | 1,252,320 | 1.4 | 1,276,464 | 1.4 | 1,278,544 | 1.3 | ||||||||||||||||||||||||||||||
| E: Loss | 757,562 | 1.2 | 1,219,583 | 1.5 | 1,526,112 | 1.7 | 1,875,627 | 2.0 | 2,131,784 | 2.1 | ||||||||||||||||||||||||||||||
| Total (1) | 63,960,352 | 100.0 | 78,966,591 | 100.0 | 89,776,228 | 100.0 | 94,099,389 | 100.0 | 99,764,914 | 100.0 | ||||||||||||||||||||||||||||||
| C+D+E | 2,209,657 | 3.5 | 3,010,212 | 3.8 | 3,645,196 | 4.1 | 4,211,406 | 4.5 | 4,575,646 | 4.6 | ||||||||||||||||||||||||||||||
| (1) | Without unearned and accrued interest |
All of our Class E loans and substantially all of our Class D loans are past-due. Class C loans, although generally not past-due, have demonstrated credit deterioration such that management has serious doubts as to the ability of the borrower to comply with the loan repayment terms. Our manufacturing sector loans are primarily secured by warrants and liens on goods or by mortgages and our agricultural loans tend to be secured by trade bills and marketable securities. The Class C loans reflect the financial weakness of the individual borrower rather than any trend in the Peruvian manufacturing or agricultural industries in general.
10.3.8 Classification of the loan portfolio based on the borrower’s payment performance
We classify a loan as internal overdue mainly based on three aspects: (i) number of days as internal past-due, based on the due date contractually agreed; (ii) the banking subsidiary; and (iii) the type of loan. In that sense:
| § | BCP and Mibanco consider loans as internal overdue: (i) after 15 days for corporate, large business and medium business loans; (ii) after 30 days for small and micro business loans and (iii) after 30 days for overdrafts. In the case of consumer, mortgage and leasing loans, the past-due installments are considered overdue after 30 to 90 days; after 90 days, the outstanding balance of the loan is considered internal overdue. |
| § | ASB considers all overdue loans past-due, except for consumer loans, which are considered internal overdue when the scheduled principal and/or interest payments are overdue for more than 90 days. |
| § | BCP Bolivia considers loans as internal overdue after 30 days. |
| 142 |
The entire loan balance under IFRS 7 is considered past-due when debtors have failed to make a payment on the due date contractually agreed. For more detail, see Note 32.1(c) to the Consolidated Financial Statements. All the aforementioned has been contractually agreed with clients. Therefore, Credicorp’s internal overdue policy is in accordance with IFRS 7.
Furthermore, with regards to refinanced loans, Credicorp’s policy categorizes a loan as” refinanced” when a debtor is experiencing payment problems and asks for a new payment schedule that will allow the debtor to comply with the installments. This policy is based on internal models and past experience as well as IFRS.
Finally, non-performing loans are composed of internal overdue, refinanced and restructured loans. For further detail, see Note 32.1(c) to the Consolidated Financial Statements.
Over the past five years, we have recognized interest income on these loans of S/65.1 million in 2013, S/93.4 million in 2014, S/157.9 million in 2015, S/125.6 million in 2016 and S/162.4 million in 2017.
The following table sets forth the repayment status of our loan portfolio as of the dates indicated:
| At December 31, | ||||||||||||||||||||
| 2013 | 2014 | 2015 | 2016 | 2017 | ||||||||||||||||
| (Soles in thousand, except percentages) | ||||||||||||||||||||
| Current | 62,523,099 | 76,957,263 | 87,464,986 | 91,478,978 | 96,744,000 | |||||||||||||||
| Internal overdue loans: | ||||||||||||||||||||
| Overdue up to 90 days (2) | 439,842 | 228,535 | 588,385 | 539,947 | 639,329 | |||||||||||||||
| Overdue 90 days or more | 997,411 | 1,780,793 | 1,722,857 | 2,080,464 | 2,381,585 | |||||||||||||||
| Subtotal | 1,437,253 | 2,009,328 | 2,311,242 | 2,620,411 | 3,020,914 | |||||||||||||||
| Total loans (1) | 63,960,352 | 78,966,591 | 89,776,228 | 94,099,389 | 99,764,914 | |||||||||||||||
| Internal overdue loans amounts as % of total loans | 2.25 | % | 2.54 | % | 2.57 | % | 2.78 | % | 3.03 | % | ||||||||||
| (1) | Without unearned interest and accrued interest. |
| (2) | The amount in 2017 would increase to S/965,387 thousand, approximately, if the outstanding balance of consumer, mortgage and leasing loans overdue to 90 days or less are included. |
With respect to consumer, mortgage and leasing loans, BCP recognizes payments as overdue installments if the loan is less than 90 days overdue. The entire amount of the loans is considered as internal overdue after 90 days. For IFRS 7 disclosure requirements on past-due loans, see Note 32.1 to the Consolidated Financial Statements.
| 143 |
10.3.9 Internal overdue loan portfolio
The following table analyzes our internal overdue loans portfolio by the type of loan at the dates indicated
| At December 31, | ||||||||||||||||||||
| 2013 | 2014 | 2015 | 2016 | 2017 | ||||||||||||||||
| (Soles in thousand) | ||||||||||||||||||||
| Internal overdue loan amounts: | ||||||||||||||||||||
| Loans | 1,255,583 | 1,716,823 | 1,942,958 | 2,231,198 | 2,563,755 | |||||||||||||||
| Discounted notes | 14,134 | 16,421 | 16,965 | 12,330 | 13,075 | |||||||||||||||
| Advances and overdrafts in demand deposits | 10,254 | 13,085 | 32,212 | 21,492 | 26,114 | |||||||||||||||
| Leasing transactions | 23,820 | 44,374 | 80,219 | 71,445 | 60,458 | |||||||||||||||
| Refinanced and restructured loans | 133,461 | 218,624 | 238,888 | 283,946 | 357,512 | |||||||||||||||
| Total internal overdue loans | 1,437,252 | 2,009,327 | 2,311,242 | 2,620,411 | 3,020,914 | |||||||||||||||
| Less: Allowance for loan losses (1) | (2,385,958 | ) | (3,102,096 | ) | (4,032,219 | ) | (4,416,692 | ) | (4,943,008 | ) | ||||||||||
| Total internal overdue loans portfolio net of allowance | (948,706 | ) | (1,092,769 | ) | (1,720,977 | ) | (1,796,281 | ) | (1,922,094 | ) | ||||||||||
(1) Includes allowance for indirect credits (see “Item 4. Information on the company – 4.B Business Overview - (10) Selected Statistical Information — 10.3 Loan portfolio—10.3.11 Allowance for loan losses”).
As of December 31, 2017, total internal overdue loans were S/3,020.9 million, which included S/357.5 million of refinanced and restructured loans.
10.3.10 Total Non-performing loans
Non-performing loans include internal overdue loans (S/3,020.9 million as of December 31, 2017), as well as current refinanced and restructured loans (S/916 million as of December 31, 2017). Therefore, non-performing loans amounted to S/3,936.5 million. As of December 31, 2017 our delinquency ratio (internal overdue-loan ratio) was 3.01% and our non-performing loan ratio (including internal overdue and refinanced and restructured loans) was 3.92%. See “Item 4, Information on the Company - 4.B Business Overview - (5) Review of 2017 – 5.2 Financial Performance”
10.3.11 Allowance for loan losses
The following table shows the changes in our allowance for loan losses and movements at the dates indicated:
| Year ended December 31, | ||||||||||||||||||||
| 2013 | 2014 | 2015 | 2016 | 2017 | ||||||||||||||||
| (Soles in thousands) | ||||||||||||||||||||
| Allowance for loan losses at the beginning of the year | 1,898,496 | 2,385,958 | 3,102,096 | 4,032,219 | 4,416,692 | |||||||||||||||
| Provision, net of recoveries | 1,230,371 | 1,715,809 | 1,880,898 | 1,785,495 | 1,789,165 | |||||||||||||||
| Recovery of written-off loans | 139,744 | 198,333 | 171,279 | 277,714 | 268,313 | |||||||||||||||
| Loan portfolio written-off | (990,147 | ) | (1,272,218 | ) | (1,471,322 | ) | (1,612,138 | ) | (1,426,201 | ) | ||||||||||
| Exchange difference and others (1) | 107,494 | 74,214 | 349,268 | (66,598 | ) | (104,961 | ) | |||||||||||||
| Total allowance for loan losses at the end of the year | 2,385,958 | 3,102,096 | 4,032,219 | 4,416,692 | 4,943,008 | |||||||||||||||
| (1) | Corresponds to the effect of fluctuation in the exchange rate for foreign currency loans. Considering that the functional currency is the Peruvian Sol, and that the main impact of foreign currency is the US Dollar; the effects presented in this account are primarily driven by changes in the Sol/U.S. dollar exchange rate. |
| 144 |
For a discussion of the risk elements in the loan portfolio and the factors considered in determining the amount of specific reserves, see “Item 4. Information on the Company – 4.B Business Overview - (10) Selected Statistical Information – 10.3 Loan Portfolio – 10.3.7 Classification of the Loan Portfolio”. The balance of the allowance for loan losses for the years 2015, 2016 and 2017 are included in Note 7(d) to the Consolidated Financial Statements.
Our allowance for loan losses, as of December 31, 2017, included S/4,500.5 million for credit losses and S/442.5 million for indirect or off-balance-sheet exposure losses as compared to S/4,207.1 million and S/209.6 million, respectively, in 2016. Our allowance for indirect loan losses is included in the “Other liabilities” caption of our consolidated balance sheet. See Notes 7(d) and 12(a) to the Consolidated Financial Statements.
The charge-off process is performed with prior approval of our board of directors and the SBS. Potential charge-offs are considered by the board of directors on a case-by-case basis.
10.3.12 Allocation of loan loss reserves
The following table sets forth the amounts of our allowance for loan losses attributable to commercial, consumer and residential mortgage loans at the dates indicated (see also Note 7(d) to the Consolidated Financial Statements):
| At December 31, | ||||||||||||||||||||
| 2013 | 2014 | 2015 | 2016 | 2017 | ||||||||||||||||
| (Soles in thousands) | ||||||||||||||||||||
| Commercial loans | 448,435 | 556,270 | 1,197,713 | 1,235,970 | 1,680,126 | |||||||||||||||
| Micro-business | 865,469 | 1,124,072 | 1,372,099 | 1,353,168 | 1,476,578 | |||||||||||||||
| Consumer loans | 927,482 | 1,256,616 | 1,288,528 | 1,634,169 | 1,558,017 | |||||||||||||||
| Residential mortgage loans | 144,572 | 165,138 | 173,879 | 193,385 | 228,287 | |||||||||||||||
| Total allowance | 2,385,958 | 3,102,096 | 4,032,219 | 4,416,692 | 4,943,008 | |||||||||||||||
| 145 |
10.4 Deposits
In 2017, the increase of 13.0% in total deposits reflects the higher level of time deposits in soles, mainly at BCP Stand-alone.
The following table presents the components of our deposit base at the dates indicated:
| At December 31, | ||||||||||||
| 2015 | 2016 | 2017 | ||||||||||
| (Soles in thousands) | ||||||||||||
| Demand deposits: | ||||||||||||
| Sol-denominated | 9,456,182 | 9,536,877 | 11,249,872 | |||||||||
| Foreign currency-denominated | 19,043,808 | 18,969,393 | 18,520,404 | |||||||||
| Total | 28,499,990 | 28,506,270 | 29,770,276 | |||||||||
| Savings deposits: | ||||||||||||
| Sol-denominated | 12,149,324 | 13,165,182 | 14,619,905 | |||||||||
| Foreign currency-denominated | 12,755,241 | 13,518,952 | 14,013,194 | |||||||||
| Total | 24,904,565 | 26,684,134 | 28,633,099 | |||||||||
| Time deposits: | ||||||||||||
| Sol-denominated | 9,935,654 | 10,134,070 | 12,444,449 | |||||||||
| Foreign currency-denominated | 16,063,532 | 12,397,235 | 17,739,865 | |||||||||
| Total | 25,999,186 | 22,531,305 | 30,184,314 | |||||||||
| Severance Indemnity Deposits | ||||||||||||
| Sol-denominated | 4,311,904 | 4,455,517 | 4,721,479 | |||||||||
| Foreign currency-denominated | 2,871,517 | 2,662,168 | 2,449,455 | |||||||||
| Total | 7,183,421 | 7,117,685 | 7,170,934 | |||||||||
| Bank’s negotiable certificates | ||||||||||||
| Sol-denominated | 19,626 | 50,850 | 120,501 | |||||||||
| Foreign currency-denominated | 1,701,174 | 692,876 | 838,550 | |||||||||
| Total | 1,720,800 | 743,726 | 959,051 | |||||||||
| Total deposits: | ||||||||||||
| Sol-denominated | 35,872,690 | 37,342,496 | 43,156,206 | |||||||||
| Foreign currency-denominated | 52,435,272 | 48,240,624 | 53,561,468 | |||||||||
| Total deposits and obligations without interest payable | 88,307,962 | 85,583,120 | 96,717,674 | |||||||||
The following table presents the non interest demand deposits and the interest demand deposits:
| At December 31, | ||||||||||||
| 2015 | 2016 | 2017 | ||||||||||
| (Soles in thousands) | ||||||||||||
| Sol-denominated Demand deposits: | ||||||||||||
| Non interest demand deposits | 9,424,834 | 9,502,708 | 11,205,129 | |||||||||
| Interest demand deposits | 31,348 | 34,169 | 44,743 | |||||||||
| Total | 9,456,182 | 9,536,877 | 11,249,872 | |||||||||
| Foreign currency-denominated Demand deposits: | ||||||||||||
| Non interest demand deposits | 18,624,236 | 18,581,983 | 18,177,780 | |||||||||
| Interest demand deposits | 419,572 | 387,410 | 342,624 | |||||||||
| Total | 19,043,808 | 18,969,393 | 18,520,404 | |||||||||
| 146 |
The following table sets forth information regarding the maturity of our certificates of deposit and time deposits in denominations of S/324,100 (US$100,000) or more on December 31, 2017:
| At December 31, 2017 | ||||
| (Soles in thousands) | ||||
| Certificates of deposit: | ||||
| Maturing within 30 days | 35,952 | |||
| Maturing after 30 but within 60 days | 10,367 | |||
| Maturing after 60 but within 90 days | 59,387 | |||
| Maturing after 90 but within 180 days | 304,973 | |||
| Maturing after 180 but within 360 days | 318,751 | |||
| Maturing after 360 days | 3,165,364 | |||
| Total certificates of deposits | 3,894,794 | |||
| Time deposits: | ||||
| Maturing within 30 days | 9,001,640 | |||
| Maturing after 30 but within 60 days | 2,630,527 | |||
| Maturing after 60 but within 90 days | 2,345,249 | |||
| Maturing after 90 but within 180 days | 3,181,084 | |||
| Maturing after 180 but within 360 days | 3,245,955 | |||
| Maturing after 360 days | 1,796,447 | |||
| Total time deposits | 22,200,902 | |||
| Total | 26,095,696 | |||
| 10.5 | Return on equity and assets |
| At December 31, | ||||||||||||
| 2015 | 2016 | 2017 | ||||||||||
| Return on average assets (1) | 2.13 | % | 2.25 | % | 2.50 | % | ||||||
| Return on average equity (2) | 20.54 | % | 19.64 | % | 19.76 | % | ||||||
| Dividend payout ratio (3) | 21.05 | % | 63.27 | % | 27.52 | % | ||||||
| Equity to assets ratio (4) | 10.65 | % | 11.63 | % | 13.00 | % | ||||||
| Shareholders’ equity to assets ratio (5) | 10.24 | % | 11.29 | % | 12.71 | % | ||||||
| (1) | Net income attributable to our equity holders as a percentage of average total assets, computed as the average of period beginning and period ending balances. |
| (2) | Net income attributable to our equity holders as a percentage of average net equity attributable to our equity holders, computed as the average of monthly balances. |
| (3) | Dividends declared per share divided by net income attributable to our equity holders per share. The 2016 ratio includes an additional dividend of S/1,252.3 million |
| (4) | Average equity attributable to our equity divided by average total assets, both averages computed as the average of month-ending balances. |
| (5) | Average equity attributable to our equity shareholders divided by average total assets, both averages computed as the average of month-ending balances. |
| 147 |
| 10.6 | Short-term borrowing |
Our short-term borrowing, other than deposits, equaled S/9,798.4 million, S/5,029 million and S/4,504 million, as of December 31, 2015, 2016 and 2017, respectively. Our average balances of borrowed amounts decreased in 2017 due to a reduction in working capital and interbank funds debts. For the years ended December 31, 2015, 2016 and 2017, the short-term borrowings also included repurchase transactions by the Peruvian Central Bank and interbank debts, which are presented separately in this Annual Report in the table set forth below.
| At December 31, | ||||||||||||
| 2015 | 2016 | 2017 | ||||||||||
| (Soles in thousands, except percentages) | ||||||||||||
| Year-end balance | 9,798,420 | 5,028,960 | 4,503,771 | |||||||||
| Average balance | 8,675,688 | 5,687,418 | 5,650,461 | |||||||||
| Maximum month-end balance | 9,798,420 | 9,350,545 | 7,810,071 | |||||||||
| Weighted-average nominal year-end interest rate | 3.07 | % | 2.93 | % | 2.94 | % | ||||||
| Weighted-average nominal interest rate | 2.72 | % | 2.85 | % | 2.89 | % | ||||||
| 4. C | Organizational structure |
(1) Credicorp
The following tables show our organizational structure and the organization of our principal subsidiaries as of December 31, 2017:

| (1) | Credicorp Ltd. directly holds an additional 3.73%. |
| (2) | Grupo Credito S.A. holds 33.59% |
| (3) | Credicorp Capital Holding Peru S.A. holds 85.02% of Credicorp Capital Peru S.A.A., Credicorp Capital Ltd holds an additional 12.795% of Credicorp Capital Peru SA.A. |
| (4) | Pacifico Compañia de Seguros y Reaseguros S.A. controls the entity. Inversiones Credicorp Bolivia S.A. holds in 51.95%. |
| (5) | Pacifico Compañia de Seguros y Reaseguros S.A. controls the entity. Inversiones Credicorp Bolivia S.A. holds in 51.87%. |
| 148 |
| (2) | BCP |
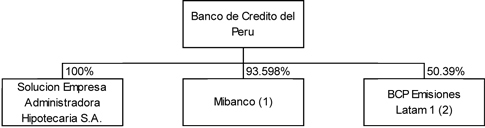
| (1) | Grupo Credito holds 1.757%. |
| (2) | Grupo Credito holds 49.56%. |
BCP and its principal subsidiaries as of December 31, 2017 are as follows:
| · | Mibanco, Banco de la Microempresa S.A., is a limited liability company that was chartered in Peru in March 1998. At the end of December 2017, BCP owns 93.598% of this entity’s shares and Grupo Credito, 1.757%. The corporate purpose of the bank is to engage in multiple banking services with a special emphasis on the micro and small business segments. The Bank’s operations are governed by the General Law of the Financial System and of Insurance and Organic System of the Superintendence of Banking, Insurance and AFP (herewith “Law of Banking, Insurance and AFP”) – Law N°26702. Mibanco S.A. is authorized by SBS to operate as a bank in accordance with the legal provisions in effect in Peru. |
| · | Solucion Empresa Administradora Hipotecaria S.A. is a company that specializes in offering mortgage loans. It was initially chartered as a financial company in 1979. After several modifications to the company’s structure, it became a mortgage loan company in 2010. BCP owns 100 percent of its shares. On September 1, 2017, Solucion Empresa Administradora Hipotecaria S.A. absorbed Edyficar Peru; of which Banco de Credito del Peru holds 99.95 percent, before the merger. |
| · | BCP Emisiones Latam 1 S.A. is a special purpose company is domiciled in Santiago, Chile. It was chartered in January 2009 and its sole purpose is to invest in all types of real estate securities and debt securities, which are financed through bond issuances in Chile. At the end of November 2015, this company absorbed Inversiones BCP SA, of which Banco de Credito del Peru holds 50.39 percent and Grupo Credito, 49.56 percent. |
| 149 |
| 4. D | Property, plants and equipment |
As of December 31, 2017, we owned 247 properties (244 in Peru, 1 in Bolivia and 2 in Chile) and rented 651 properties (629 in Peru, 19 in Colombia, 1 in Panama, 1 in Chile and 1 in UK), all of which we used for the operation of our network of branches and our business; we do not hold any lease agreements for these purposes. We own the buildings where our headquarters are located in Lima, Peru and La Paz, Bolivia. As of December 2017, we had 829 banking branches, of which 448 were branches of BCP and 326 of Mibanco in Peru. There are no material encumbrances on any of our properties.
| 150 |
| ITEM 4A. | UNRESOLVED STAFF COMMENTS |
None.
| ITEM 5. | OPERATING AND FINANCIAL REVIEW AND PROSPECTS |
| 5. A | Operating results |
(1) Critical accounting policies
1.1 Basis of presentation and use of estimates
The accompanying Consolidated Financial Statements have been prepared in accordance with IFRS as issued by the IASB. For further detail refer to Notes to the consolidated financial statements, 3. Significant Accounting Policies, a) Basis of presentation and use of estimates.
1.2 Consolidation
The Consolidated Financial Statements comprise the financial statements of Credicorp and its subsidiaries for all the years presented. Control is achieved when Credicorp is exposed, or has rights, to variable returns from its involvement with the investee and has the ability to affect those returns through its power over the investee. For further detail refer to Notes to the consolidated financial statements, 3. Significant Accounting Policies, b) Basis of Consolidation.
1.3 Foreign exchange
Functional and presentation currency
Credicorp considers the Sol as our functional and presentation currency because it reflects the nature of the economic events and relevant circumstances given the fact its major transactions and/operations (such as lending, borrowing, financial income, financial expenses) and a significant percentage of our purchases are transacted in Soles.
Transactions and balances in foreign currency
Foreign currency transactions are those entered into in a currency other than the functional currency. These transactions are initially stated by Group entities at the exchange rates of their corresponding currencies at the transaction date. For further detail refer to Notes to the consolidated financial statements, 3. Significant Accounting Policies, c) Foreign exchange.
| 151 |
1.4 Change in functional currency
Until December 31, 2013, Credicorp and its subsidiaries operating in Peru, except for private hospitals, determined that their functional and presentation currency would be the U.S. Dollar. Due to changes in the economic environment in Peru, where Credicorp’s main subsidiaries operate, and in accordance with IFRS, management conducted a review of the functional currency of Credicorp and its subsidiaries in Peru and decided to change Credicorp’s functional currency from the U.S. Dollar to the Sol, effective as of January 1, 2014.
In accordance with IAS 21, paragraphs 9 to 12, the main indicators that management considered were:
| • | Changes in the economic environment of the country where the main subsidiaries operate; |
| • | The gradual increase of loans and deposits, financial income and expenses denominated in Soles; |
| • | The regulatory and competitive factors presented in the Peruvian financial system; and, |
| • | General de-dollarization of the Peruvian economy. |
The principal changes in the economic environment that management considered were:
| a) | Inflation has remained within the target range set by the BCRP. In December 2013, inflation was 2.96%, which was within the target range set by the BCRP. |
| b) | The Peruvian economy has shown a sustained growth over the last 10 years with CAGR (cumulative annual growth rate) of 5.3% during the period 2005-2014. |
| c) | It should be noted that among major emerging economies, Peru is a country that shows low vulnerability to possible external financial turbulence, which is reflected in its international financial and fiscal solvency indicators, such as the level of international reserves that exceeded US$65 billion at the end of 2013, equivalent to 32% of GDP figure. The aforementioned allowed the Peruvian Government to reduce exchange rate volatility and mitigate the impact of lower capital inflows. |
| d) | The participation of foreign currency loans in the total loan book has maintained its downward trend. |
| e) | In the last two years BCRP and SBS have been focused on incentivizing financial institutions to de-dollarize their loan portfolios. Some of the measures taken are: |
| (i) | High reserve requirements for foreign currency deposits and obligations. |
| 152 |
| (ii) | Specific de-dollarization targets to reduce the participation of foreign currency loans not only for the total loan portfolio, but also in mortgages and car loans. |
| (iii) | Higher risk weights that increase capital requirement for mortgage and consumer lending granted in foreign currency. |
| f) | Development of capital markets in Soles as it is reflected in: |
| (i) | The highest issuances of long-term treasury bonds were denominated in Soles. |
| (ii) | Existence of longer maturities on debt issued by the Central Government and Peruvian companies. |
| (iii) | Increase of Peruvian companies’ issuances in Soles. |
Our Board of Directors discussed and approved the change in functional currency form the U.S. Dollar to Soles in its session held on January 22, 2014.
The change in functional currency was implemented prospectively on January 1, 2014. To give effect to this change, balances as of January 1, 2014 have been translated to Soles as follows in accordance with IAS 21 “The effect of changes in foreign exchange rates” following the methodology explained in Item 4. Information on the Company - 4.B Business overview - (10) Selected Statistical Information.
Credicorp Capital Holding Colombia, Credicorp Capital Holding Chile, ASB and BCP Bolivia each have maintained their functional currencies (Colombian Pesos, Chilean Pesos, U.S. Dollars and Bolivianos, respectively).
1.5 Recognition of income and expenses from banking activities
Interest income and expenses for all interest-bearing financial instruments, including those related to financial instruments classified as held for trading or designated at fair value through profit or loss, are recognized within “Interest and similar income” and “Interest and similar expenses” in the Consolidated Statements of Income using the effective interest rate method, which is the rate that discounts estimated future cash payments or receipts during the expected life of the financial instrument or a shorter period, where appropriate, to the net carrying amount of the financial asset or financial liability.
Interest income includes coupons earned on fixed income investment and trading securities and the accrued discount and premium on financial instruments. Dividends are recognized as income when they are declared.
| 153 |
Fees and commission income are recognized on an accrual basis. Fees related to off-balance sheet exposures that are likely to be drawn and other credit related fees are deferred (together with any direct incremental costs) and recognized as an adjustment to the effective interest rate on the loan.
All other revenues and expenses are recognized on an accrual basis.
1.6 Insurance activities
Insurance contracts are those contracts pursuant to which Credicorp (the insurer) has accepted significant insurance risk from another party (the policyholder) by agreeing to compensate the policyholder if a specified uncertain future event (the insured event) adversely affects the policyholder. This definition includes reinsurance contracts that Credicorp holds. As a general guideline, Credicorp determines whether it has significant insurance risk by comparing benefits paid with benefits payable if the insured event did not occur.
Once a contract has been classified as an insurance contract, it remains an insurance contract for the remainder of its lifetime, even if the insurance risk reduces significantly during this period, unless all rights and obligations are extinguished or expire.
Life insurance contracts offered by Credicorp include retirement, disability and survival insurance, annuities and individual life, which include unit-linked insurance contracts. The non-life insurance contracts mainly include automobile, fire and allied, technical lines and healthcare.
Credicorp cedes insurance risk in the normal course of operations for all of its businesses. Reinsurance assets represent balances due from reinsurance companies. Reinsurance ceded is placed on both a proportional and non–proportional basis.
Amounts recoverable from reinsurers are estimated in a manner consistent with the outstanding claims provision or settled claims and ceded premiums associated with the reinsurer’s policies and are in accordance with the related reinsurance contract.
Reinsurance assets are reviewed for impairment at each reporting date or more frequently when an indication of impairment arises during the reporting year. Impairment occurs when there is objective evidence as a result of an event that occurred after initial recognition of the reinsurance asset that Credicorp may not receive all outstanding amounts due under the terms of the contract and the event has a reliably measureable impact on the amounts that Credicorp will receive from the reinsurer. The impairment loss is recorded in the consolidated statements of income.
| 154 |
Ceded reinsurance arrangements do not relieve Credicorp from its obligations to a policyholder.
Credicorp also assumes reinsurance risk in the normal course of business for non-life insurance contracts when applicable. Premiums and claims on assumed reinsurance are recognized as revenue or expenses in the same manner as they would be if the reinsurance were considered direct business, taking into account the product classification of the reinsured insurance contract.
Reinsurance liabilities represent balances due to reinsurance companies. Amounts payable are estimated in a manner consistent with the related reinsurance contract.
1.7 Financial Instruments: Initial recognition and subsequent measurement
A financial instrument is any contract that gives rise to a financial asset of one entity and to a financial liability or equity instrument of another entity. For information about how we classify and measure financial instruments refer to Notes to the consolidated financial statements, 3. Significant Accounting Policies, f) Financial Instruments: Initial recognition and subsequent measurement.
1.8 De-recognition of financial assets and financial liabilities
1.8.1 Financial assets
A financial asset (or, where applicable a part of a financial asset or a part of a group of similar financial assets) is derecognized when: (i) the rights to receive cash flows from the asset have expired; or (ii) Credicorp has transferred its rights to receive cash flows from the asset or has assumed an obligation to pay the received cash flows in full without material delay to a third party under a “pass-through” arrangement; and either Credicorp has transferred substantially all the risks and rewards of the asset, or Credicorp has neither transferred nor retained substantially all the risks and rewards of the asset, but has transferred control of the asset.
1.8.2 Financial liabilities
A financial liability is derecognized when the obligation under the liability is discharged, cancelled or expires. When an existing financial liability is replaced by another from the same lender on substantially different terms, or the terms of an existing liability are substantially modified, such exchange or modification is treated as a de-recognition of the original liability and the recognition of a new liability; the difference between the carrying amount of the original financial liability and the consideration paid is recognized in the consolidated statements of income.
| 155 |
1.9 Offsetting financial instruments
Financial assets and liabilities are offset and the net amount is reported in the consolidated statements of financial position when there is a legally enforceable right to offset the recognized amounts and management has the intention to settle on a net basis, or realize the assets and settle the liability simultaneously.
1.10 Impairment of financial assets
Credicorp assesses at each date of the consolidated statements of financial position whether there is any objective evidence that a financial asset or a group of financial assets is impaired. An impairment exists if one or more events that has occurred since the initial recognition of the asset (an incurred “loss event”), has an impact on the estimated future cash flows of the financial asset or of Credicorp financial assets that can be reliably estimated. Evidence of impairment may include indications that the borrower or a group of borrowers is experiencing significant financial difficulty, default or delinquency in interest or principal payments; that the borrower or a group of borrowers has a greater probability of entering bankruptcy or another legal financial reorganization process and where observable data indicate that there is a measurable decrease in the estimated future cash flows, such as changes in arrears or economic conditions that correlate with defaults. For further detail refer to Notes to the consolidated financial statements, 3. Significant Accounting Policies, i) Impairment of financial assets.
1.11 Leases
The determination of whether an arrangement is, or contains, a lease is based on the substance of the arrangement at the inception date: whether fulfillment of the arrangement is dependent on the use of a specific asset or assets or the arrangement conveys a right to use the asset even if that right is not explicitly specified in an arrangement. For further detail refer to Notes to the consolidated financial statements, 3. Significant Accounting Policies, j) Leases.
1.12 Business combination
Business combinations are accounted for using the acquisition method. The cost of an acquisition is measured as the aggregate of the consideration transferred measured at acquisition date fair value and the amount of any non-controlling interest in the acquiree. For each business combination, Credicorp elects whether to measure the non-controlling interest in the acquiree at fair value or at the proportionate share of the acquiree’s identifiable net assets. Acquisition costs incurred are expensed and included in the caption “Administrative expenses” of the consolidated statements of income. For further detail refer to Notes to the consolidated financial statements, 3. Significant Accounting Policies, n ) Business combination .
| 156 |
1.13 Goodwill
Goodwill is initially measured at cost, being the excess of the aggregate of the consideration transferred and the amount recognized for non-controlling interests, and any previous interest held, over the net identifiable assets acquired and liabilities assumed. If the fair value of the net assets acquired is in excess of the aggregate consideration transferred, Credicorp re-assesses whether it has correctly identified all of the assets acquired and all of the liabilities assumed and reviews the procedures used to measure the amounts to be recognized at the acquisition date. If the re-assessment still results in an excess of the fair value of net assets acquired over the aggregate consideration transferred, then the gain is recognized in the consolidated financial income caption. For further detail refer to Notes to the consolidated financial statements, 3. Significant Accounting Policies, p ) Goodwill.
1.14 Impairment of non-financial assets
Credicorp assesses at each reporting date whether there is an indication that an asset may be impaired. If any indication exists, or when annual impairment testing for an asset is required, Credicorp estimates the asset’s recoverable amount. An asset’s recoverable amount is the higher of an asset’s or CGU’s fair value less costs to sell and its value in use. The recoverable amount is determined for an individual asset, unless the asset does not generate cash inflows that are largely independent of those from other assets or groups of assets. For further detail refer to Notes to the consolidated financial statements, 3. Significant Accounting Policies, q ) Impairment of non-financial assets.
1.15 Derivative financial instruments
Credicorp negotiates derivative financial instruments in order to satisfy clients’ needs. Credicorp may also take positions with the expectation of profiting from favorable movements in prices, rates or indexes. Credicorp also uses derivative instruments to manage exposures to interest rate and foreign currency. In order to manage particular risks, Credicorp applies hedge accounting for transactions which meet the specified criteria. For further detail about the accounting policies used for Derivative financial instruments refer to Notes to the consolidated financial statements, 3. Significant Accounting Policies, y ) Derivative financial instruments and hedge accounting.
| 157 |
1.16 Fair value measurement
Fair value is the price that would be received to sell an asset or paid to transfer a liability in an orderly transaction between market participants at the measurement date. The fair value measurement is based on the presumption that the transaction to sell the asset or transfer the liability takes place either:
| • | In the principal market for the asset or liability, or |
| • | In the absence of a principal market, in the most advantageous market for the asset or liability. |
The principal or the most advantageous market must be accessible to Credicorp. Also, the fair value of a liability reflects its non-performance risk.
When available, Credicorp measures the fair value of an instrument using the quoted price in an active market for that instrument. A market is regarded as active if transactions for the asset or liability take place with sufficient frequency and volume to provide pricing information on an ongoing basis.
If there is no quoted price in an active market, then Credicorp uses valuation techniques that maximize the use of relevant observable inputs and minimize the use of unobservable inputs.
The chosen valuation technique incorporates all of the factors that market participants would take into account in pricing a transaction.
All assets and liabilities for which fair value is measured or disclosed in the Consolidated Financial Statements are categorized within the fair value hierarchy, described as follows, based on the lowest level input that is significant to the fair value measurement as a whole:
| • | Level 1 - Quoted (unadjusted) market prices in active markets for identical assets or liabilities. |
| • | Level 2 - Valuation techniques for which the lowest level input that is significant to the fair value measurement is directly or indirectly observable. |
| • | Level 3 - Valuation techniques for which the lowest level input that is significant to the fair value measurement is unobservable. |
For assets and liabilities that are recognized at fair value in the Consolidated Financial Statements on a recurring basis, Credicorp determines whether transfers have occurred between levels in the hierarchy by re-assessing categorization at the end of each reporting period.
| 158 |
For the purpose of fair value disclosures, Credicorp has determined classes of assets and liabilities on the basis of the nature, characteristics and risks of the asset or liability and the level of the fair value hierarchy as explained above.
1.17 Segment reporting
Credicorp reports financial and descriptive information about its reportable segments. Reportable segments are operating segments or aggregations of operating segments that meet specified criteria. Operating segments are a component of an entity for which separate financial information is available that is evaluated regularly by the entity’s Chief Operating Decision Maker (“CODM”) in making decisions about how to allocate resources and in assessing performance. For Credicorp, the CODM is the Chief Operating Officer (“CEO”). Generally, financial information is required to be reported on the same basis as it is used internally for evaluating operating segment performance and deciding how to allocate resources to segments.
1.18 Fiduciary activities, management of funds and pension funds
The Group provides custody, trustee, investment management and advisory services to third parties that result in the holding of assets on their behalf. These assets and income arising thereon are excluded from these consolidated financial statements, as they are not assets of the Group.
Commissions generated for these activities are included in “Other income” of the consolidated statements of income.
1.19 Cash and cash equivalents
For the purpose of the consolidated statements of cash flows, cash and cash equivalents comprise balances of cash and non-restricted balances with central banks, overnight deposits, time deposits and amounts due from banks with original maturities of three months or less, excluding restricted balances.
Cash collateral pledged as a part of repurchase agreements is presented in “Cash collateral, reverse repurchase agreement and securities borrowings” in the consolidated statement of financial position.
| 159 |
Cash collateral pledged as a part of derivative financial instrument and others are presented in “Other assets” in the consolidated statement of financial position.
1.20 Incorporation of IFRS9
In July 2014, the IASB issued the complete version of IFRS 9, which combines the phases of classification and measurement, impairment and hedging accounting of the IASB project to replaces IAS 39 “Financial instruments: Measurement and Recognition”. The new requirements were applied adjusting Credicorp’s consolidated financial statements as of January 1st, 2018, the date of IFRS9 application, without re-stating the information for the year 2017.
With regards to the classification and measurement defined by IFRS 9, the requirements defined three categories of classification: Amortized cost, fair value through other comprehensive income and fair value through profit or loss. An instrument is classified depending on the objective of its business model, and if the contractual cash flows of the instrument only represent the payment of the principal and interest of the debt.
The combined application of the tests of the characteristics of the contractual cash flows and business models as of January 1st 2018 resulted in certain differences when comparing the financial assets classified under IAS 39 with the same financial assets classified under IFRS 9.
Approximately S/1,593.4 million of financial assets previously classified as available for sale under IAS 39 have been classified as fair value through profit or loss under IFRS 9. These assets had unrealized gains, which have been reclassified as retained earnings in the statement of changes in net equity.
IFRS 9 introduces a new model of impairment based on expected losses of the credit portfolio and other instruments which differ significantly from the current model under IAS 39 of credit losses incurred. In order to comply with the new model it is necessary to classify each asset in one of the following phases of expected credit losses:
• Phase 1: For financial assets of which the credit risk has not deteriorated significantly since its initial recognition, a reserve for losses will be recognized, equivalent to the credit losses which are expected to occur from defaults in the next 12 months.
• Phase 2: For financial assets which have presented a significant increase in their credit risk, a reserve for losses will be recognized, equivalent to the credit losses which are expected to occur during the remaining life of the asset.
| 160 |
• Phase 3: For financial assets with evidence of impairment at the reporting date a reserve for losses will be recognized, equivalent to the expected credit losses during the entire life of the asset. Interest income will be recognized based on the asset’s carrying amount, net of the loss reserve.
The measurement of expected credit loss is mainly based on the product of the probability of default (PD), the loss given default (LGD) and the exposure at the time of default (EAD), discounted at the reporting date.
Additionally, for the estimation of the parameters, the current macroeconomic condition is taken into account, as well as the expected macroeconomic conditions, base don three scenarios (base, optimistic and pessimistic), which are weighted to estimate the expected loss.
The application of the new model of impairment produced an increase in the reserve for credit losses. The most significant impacts that were recognized on January 1 st 2018 are the following:
• An increase of S/320.7 millions in the provision for credit losses and the correspondent deferred income tax of S/94.6 millions; resulting in a reduction in retained earnings of S/226.1 millions.
• An increase of S/68.0 millions in the provision for investments and the correspondent deferred income tax, which is considered non-material, resulting in a reduction in retained earnings.
The new model of hedging accounting according to IFRS 9 seeks to simplify hedging accounting, aligning the accounting of the hedging relationships more closely with the risk management activities of an entity.
For more detail of accounting policies see Note 3(ad)(i) to Consolidated Financial Statements .
(2) Historical Discussion and Analysis
Credicorp monitors the results of its operating segments separately for the purpose of making decisions about resource allocation and performance assessment. Regarding Credicorp’s segments, total revenues from the banking segment amounted to 78.6%, 77.9% and 79.4% of Credicorp’s total revenue in 2015, 2016 and 2017, respectively; therefore, the following historical discussion and analysis is presented principally for the banking segment, except when otherwise indicated, and is based upon information contained in our Consolidated Financial Statements and should be read in conjunction therewith. The discussion in this section regarding interest rates is based on nominal interest rates.
| 161 |
The financial information and the discussion and analysis presented below for 2015, 2016 and 2017 reflect the financial position and results of operations of our subsidiaries. See “Item 3. Key Information - 3.A Selected Financial Data.”
2.1 Results of operations for the three years ended December 31, 2015, 2016 and 2017
The following table sets forth, for the years 2015, 2016 and 2017, the principal components of our net income:
| Year ended December 31, | ||||||||||||
| 2015 | 2016 | 2017 | ||||||||||
| (Soles in thousands) | ||||||||||||
| Interest income | 9,784,089 | 10,773,055 | 11,030,683 | |||||||||
| Interest expense | (2,527,133 | ) | (2,914,714 | ) | (2,959,196 | ) | ||||||
| Net interest income | 7,256,956 | 7,858,341 | 8,071,487 | |||||||||
| Provision for loan losses | (1,880,898 | ) | (1,785,495 | ) | (1,789,165 | ) | ||||||
| Net interest income after Provision | 5,376,058 | 6,072,846 | 6,282,322 | |||||||||
| Non-interest income | 4,246,879 | 4,247,106 | 4,888,707 | |||||||||
| Insurance earned premiums net of claims on insurance activities | 702,319 | 700,210 | 690,036 | |||||||||
| Other expenses | (5,964,664 | ) | (6,128,734 | ) | (6,286,131 | ) | ||||||
| Income before income tax | 4,360,592 | 4,891,428 | 5,574,934 | |||||||||
| Income tax | (1,197,207 | ) | (1,281,448 | ) | (1,393,286 | ) | ||||||
| Net income | 3,163,385 | 3,609,980 | 4,181,648 | |||||||||
| Net income attributable to: | ||||||||||||
| Equity holders | 3,092,303 | 3,514,582 | 4,091,753 | |||||||||
| Non-controlling interest | 71,082 | 95,398 | 89,895 | |||||||||
In 2017, the net income attributable to our equity holders increased 16.4% compared to 2016. This increase was primarily due to an increase in net interest income and non-interest income. The aforementioned offset the increase in other expenses (salaries and social benefits and administrative expenses), and the increase in income tax. In 2016, the net income attributable to our equity holders increased 13.7% compared to 2015. This increase was primarily due to an increase in net interest income and the decrease in provision for loan losses. The aforementioned offset the increase in other expenses (salaries and social benefits and administrative expenses), and the increase in income tax. See Item 5. Operating and financial review and prospects - 5. A Operating Results - (2) Historical Discussion and Analysis - 2.1 Results of Operations for the Three Years Ended December 31, 2017 - 2.1.6 Exchange difference.
The increase in net interest income was mainly a result of an increase in income from interest on loans and interest on available-for-sale investments. The aforementioned were partially offset by an increase in interest expense, mainly due to interest on deposits and obligations and interest on bonds and notes issued.
| 162 |
On the other hand, the increase in non-interest income was due mainly to the higher income from commissions and fees, net gains on sales of securities and net gains on derivatives held for trading, which in turn offset the decrease in net gains on foreign exchange transactions.
2.1.1 Net interest income
The following table sets forth the components of net interest income:
| Year ended December 31, | ||||||||||||
| 2015 | 2016 | 2017 | ||||||||||
| (Soles in thousand) | ||||||||||||
| Interest and similar income: | ||||||||||||
| Interest on loans | 8,706,372 | 9,479,867 | 9,546,454 | |||||||||
| Interest on available-for-sale investments | 716,786 | 828,004 | 951,981 | |||||||||
| Interest on held-to-maturity investments | 136,579 | 190,466 | 234,380 | |||||||||
| Interest on trading securities | 68,538 | 86,568 | 113,484 | |||||||||
| Interest on due from banks | 32,818 | 48,626 | 88,359 | |||||||||
| Dividends from investments available-for-sale and trading securities | 55,594 | 51,831 | 52,906 | |||||||||
| Other interest and similar income | 67,402 | 87,693 | 43,119 | |||||||||
| Total interest income | 9,784,089 | 10,773,055 | 11,030,683 | |||||||||
| Interest and similar expenses: | ||||||||||||
| Interest on deposits and obligations | 859,797 | 1,062,751 | 1,132,041 | |||||||||
| Interest on bonds and notes issued | 753,174 | 805,351 | 835,255 | |||||||||
| Interest on due to banks and correspondents | 758,396 | 822,514 | 763,436 | |||||||||
| Other interest expenses and similar expense | 155,766 | 224,098 | 228,464 | |||||||||
| Total interest expense | 2,527,133 | 2,914,714 | 2,959,196 | |||||||||
| Net interest income | 7,256,956 | 7,858,341 | 8,071,487 | |||||||||
Our net interest income increased by 2.7% in 2017 compared to 2016, and increased by 8.3% in 2016 compared to 2015.
Interest and similar income increased by 2.4% in 2017 compared to 2016, after increasing by 10.1% in 2016 compared to 2015. The increase in 2017 was mainly due to higher income from interest on investments available-for-sale; and, to a lesser extent, higher income for interest on loans.
The average balance of our foreign currency denominated loan portfolio increased by 6.6% to S/39,379.4 million in 2017, as compared to S/36,942.5 million in 2016, which was a -0.1% decreased compared to S/36,987.5 million in 2015. The average balance of our Sol-denominated loan portfolio decreased by -0.04% to S/56,005.3 million in 2017, compared to S/56,028.0 million in 2016, which was a 15.8% increase from S/48,398.0 million in 2015. Credicorp’s loan portfolio expanded in connection with economic growth in Peru (2.5% and 4.0% real GDP growth in 2017 and 2016 respectively), due to growth in commercial loans.
| 163 |
Our average nominal interest rates earned on loans decreased from 10.2% in 2015 and 10.2% in 2016 and 10.0% in 2017. The average nominal interest rate for foreign currency-denominated loans increased from 6.3% in 2015, to 6.4% in 2016 and decreased to 5.2% in 2017. Average nominal interest rates for Sol-denominated loans decreased from 13.2% in 2015, then to 12.72% in 2016 and increased to 13.4% in 2017.
Interest and similar expense increased in 2017 by 1.5% to S/2,959.2 compared to an interest expense in 2016 of S/2,914.7 million, which was an increase of 15.3% compared to S/2,527.1 million in 2015. The increase in interest expense during 2017 was principally due to higher expenses for Interest on deposits and obligations, in line with (i) higher average volume of deposits, and (ii) the de-dollarization of deposits (in average balances for the year). Time deposits, which imply the highest costs, contracted. Nevertheless, as we explained in “Item 4. Information on the Company – 4.B Business Overview - (10) Selected Statistical Information - 10.4 Deposits”, the time deposits that posted a decrease were exclusively those denominated in foreign currency while those denominated in Soles expanded. The aforementioned put pressure on the interest expense and, consequently, on the funding cost given that lower cost deposits (foreign currency denominated) were replaced with higher rate deposits (Sol denominated).
Our average interest-bearing foreign currency denominated deposits decreased 1.0% to S/51,248 million from S/ 51,772 million in 2016. This followed an 8.8% increase in 2016 from S/47,590 million in 2015. Our average interest-bearing Sol-denominated deposits increased by 9.6% in 2017 to S/40,987 million from S/37,405 in 2016 and increased by 5.7% in 2016 from S/35,374 million in 2015.
Average nominal interest rates paid on foreign currency-denominated deposits was 0.70% in 2015 and 2016, and 0.8% and 2017. Average nominal interest paid on Sol-denominated deposits increased from 1.8% in 2015 to 2.2% in 2016 and decreased 2.1% in 2017.
Our net interest margin (net interest income divided by average interest-earning assets) was 5.40% in 2017, 5.36% in 2016 and 5.42% in 2015. See “Item 4. Information on the Company – 4.B Business Overview - (10) Selected Statistical Information”. The drop in net interest margin was associated with the increase in average interest earning assets, which was attributable to both an increase in loans and to growth in investments. The latter did not contribute to interest income to the same extent as loans, which meant that growth in net interest income was lower and diluted among higher levels of average interest earning assets.
| 164 |
2.1.2 Provision for loan losses
We classify all of our loans and other credits by risk category. We establish our allowance for loan losses based on criteria established by IAS 39 (see “Item 4. Information on the Company – 4.B Business Overview - (10) Selected Statistical Information – 10.3 Loan Portfolio – 10.3.7 Classification of the Loan Portfolio”).
The following table sets forth the changes in our allowance for loan losses:
| Year ended December 31, | ||||||||||||
| 2015 | 2016 | 2017 | ||||||||||
| (Soles in thousand) | ||||||||||||
| Allowance for loan losses at the beginning of the year | 3,102,096 | 4,032,219 | 4,416,692 | |||||||||
| Provision, net of recoveries | 1,880,898 | 1,785,495 | 1,789,165 | |||||||||
| Recovery of written-off loans | 171,279 | 277,714 | 268,313 | |||||||||
| Loan portfolio written-off | (1,471,322 | ) | (1,612,138 | ) | (1,426,201 | ) | ||||||
| Exchange difference and others (1) | 349,268 | (66,598 | ) | (104,961 | ) | |||||||
| Allowance for loan losses at the end of the year | 4,032,219 | 4,416,692 | 4,943,008 | |||||||||
(1) Corresponds to the effect of fluctuation in the exchange rate for foreign currency loans. Considering that the functional currency is the Sol, and that the main impact of foreign currency is the US Dollar; the effects presented in this account are primarily driven by changes in the Sol/U.S. Dollar exchange rate.
We recorded a provision (net of recoveries) for loan losses of S/1,789.2 million in 2017 and S/1,785.5 million in 2016. Total loan portfolio written-offs amounted to S/1,426.2 million in 2017 and S/1,612.1 million in 2016. Total recovery of written-off loans reached S/268.3 million in 2017 and S/277.7 million in 2016, constituting a 3.38% decrease in 2017. Loan loss provision expense in 2017 includes S/71.5 million required by BCP Bolivia (compared to S/59.5 million in 2016).
Total allowance for loan losses, which amounted to S/4,943.0 million in 2017, include the allowance for direct credits and indirect credits of approximately S/4,500.5 million and S/442.5 million, respectively.
| 165 |
2.1.3 Non-Interest Income
The following table reflects the components of our non-interest income:
| Year ended December 31, | ||||||||||||
| 2015 | 2016 | 2017 | ||||||||||
| (Soles in thousands) | ||||||||||||
| Commissions and fees | 2,644,191 | 2,771,561 | 2,911,408 | |||||||||
| Net gains on sales of securities | 248,723 | 336,759 | 741,781 | |||||||||
| Net gains on foreign exchange transactions | 773,798 | 698,159 | 650,228 | |||||||||
| Net gains on derivatives held for trading | 207,938 | 44,500 | 103,580 | |||||||||
| Net gains from exchange difference | 46,563 | - | 17,394 | |||||||||
| Net gains on financial assets designated at fair value through profit or loss | - | 51,667 | 67,633 | |||||||||
| Other | 325,666 | 344,460 | 396,683 | |||||||||
| Total non-interest income | 4,246,879 | 4,247,106 | 4,888,707 | |||||||||
The non-interest income, without including net premiums earned, increased by 15.1% to S/4,888.7 million in 2017 compared to S/4,247.1 million in 2016 and S/4.246.9 million in 2015. The increase in 2017 was primarily due to net gains from sales of securities and commissions and fees.
Commissions and fees increased by 5.0% to S/2,911.4 million in 2017 compared to S/2,771.6 million in 2016, which was an 4.8% increase from S/2,644.2 million in 2015. The increase in commissions and fees from 2016 to 2017 were primarily due to an increase in maintenance of accounts, transfers and credit and debit card services, and commissions for banking services.
Net gains on sales of securities increased 120.3% to S/741.8 million in 2017 compared to S/336.8 million in 2016, which was an increase of 35.4% from S/248.7 million in 2015. The increase from 2016 to 2017 was primarily due to the sale of shares that the Group held of Banco de Credito e Inversiones Chile (BCI) and of shares that the Group held of Enel Distribucion Peru (formerly Edelnor), which generated a profit, net of commissions, of approximately S/281.1 million and S/163.7 million, respectively. For further detail, please see Note 6(a)(x) to the Consolidated Financial Statements. The increase from 2015 to 2016 were primarily due to the increased volatility observed in capital markets, which caused the appreciation of stock prices in our investment portfolio
Net gains on foreign exchange transactions decreased 6.9% to S/650.2 million in 2017 compared to S/698.2 million in 2016, which was a decrease of 9.8% from S/773.8 million in 2015. Lower gains in 2017 compared to 2016 were primarily due to less spread in our currency exchange positions.
Other income increased by 15.2% to S/396.7 million in 2017, compared to S/344.5 million in 2016, which was an increase of 5.8% from S/325.7 million in 2015.
| 166 |
2.1.4 Insurance Premiums and Claims on Insurance Activities
The following table reflects the earned premiums and claims incurred in connection with our insurance activities:
| Year ended December 31, | ||||||||||||
| 2015 | 2016 | 2017 | ||||||||||
| (Soles in thousands) | ||||||||||||
| Gross premiums | 2,193,755 | 2,296,893 | 2,304,918 | |||||||||
| Premiums ceded to reinsurers, net | (470,112 | ) | (503,586 | ) | (499,803 | ) | ||||||
| Assumed from other companies | 10,335 | 5,808 | 3,225 | |||||||||
| Net premiums earned | 1,733,978 | 1,799,115 | 1,808,340 | |||||||||
| Net claims incurred for general insurance | (256,361 | ) | (244,777 | ) | (269,845 | ) | ||||||
| Net claims incurred for life insurance | (520,155 | ) | (590,146 | ) | (566,181 | ) | ||||||
| Net claims incurred for health insurance | (255,143 | ) | (263,982 | ) | (282,278 | ) | ||||||
| Total net premiums and claims | 702,319 | 700,210 | 690,036 | |||||||||
For further detail, please see Notes 23 and 24 to the Consolidated Financial Statements.
2.1.5 Operating Expenses
The following table reflects the components of our operating expenses:
| Year ended December 31, | ||||||||||||
| 2015 | 2016 | 2017 | ||||||||||
| (Soles in thousands) | ||||||||||||
| Salaries and employee benefits | 2,878,318 | 2,942,743 | 3,071,020 | |||||||||
| Administrative expenses | 1,995,802 | 2,094,678 | 2,158,823 | |||||||||
| Depreciation and amortization | 396,497 | 407,061 | 419,975 | |||||||||
| Net loss from exchange difference | - | 60,624 | - | |||||||||
| Impairment loss on goodwill | 82,374 | 94 | - | |||||||||
| Net impairment loss on available-for-sale investments | 43,801 | 14,459 | 766 | |||||||||
| Other | 567,872 | 609,075 | 635,547 | |||||||||
| Total operating expenses | 5,964,664 | 6,128,734 | 6,286,131 | |||||||||
Salaries and employee benefits increased 4.4% in 2017, after 2.2% increase in 2016. The number of our personnel increased to 33,636 employees in 2017 from 33,282 in 2016 and 33,658 in 2015.
Our administrative expenses (which include taxes other than income taxes) increased by 3.1% in 2017, and 5.0% in 2016. The increase in 2017 resulted primarily from higher expenses in consulting and professional fees and services provided by third parties.
Depreciation and amortization increased by 3.2% to S/420.0 million in 2017 from S/407.1 million in 2016.
| 167 |
Other expenses increased by 4.3% to S/635.6 million in 2017 compared to S/609.1 million in 2016, which was an increase of 7.3% from S/567.9 million in 2015. The increased in 2017 was mainly due to other technical expenses of insurance and losses due to operational risk which amounted to S/34.8 million in 2017. The increased in 2016 was mainly due commissions from insurance activities which amounted to S/273.0 million compared to S/231.5 million in 2015.
2.1.6 Exchange difference
The exchange difference reflects exposure to appreciation of net monetary positions in foreign currencies, principally U.S. Dollars in 2017, 2016 and 2015 and Soles in previous years. We recorded a gain exchange difference of S/17.4 million in 2017, loss exchange difference of S/60.6 million in 2016 and a gain exchange difference of S/46.6 million in 2015.
Credicorp manages foreign exchange risk by monitoring and controlling the position values due to changes in exchange rates. We measure our performance in Soles (since 2014, when we changed our functional currency from U.S. Dollars), so if the net foreign exchange position (e.g. U.S. Dollar) is an asset, any depreciation of Soles with respect to the relevant foreign currency would affect positively Credicorp’s consolidated statements of financial position. The current position in a foreign currency comprises exchange rate-linked assets and liabilities in that currency. An institution’s open position in individual currencies comprises assets, liabilities and off-balance sheet items denominated in the respective foreign currency for which the institution itself bears the risk; any appreciation/depreciation of the foreign exchange would affect the consolidated statements of income.
As of December 31, 2017, 2016 and 2015, Credicorp’s net foreign exchange balance is the sum of its positive open non-Soles positions (net long position) less the sum of its negative open non-Soles positions (net short position). As of December 31, 2013, Credicorp’s net foreign exchange balance was the sum of its positive open non-U.S. Dollar positions (net long position) less the sum of its negative open non-U.S. Dollar positions (net short position). Any depreciation/appreciation of the foreign exchange position would affect the consolidated statements of income. A currency mismatch would leave Credicorp’s consolidated statements of financial position vulnerable to a fluctuation of the foreign currency (exchange rate shock). "For further detail, see ITEM 11. Quantitative and qualitative disclosures about market risk - (10) Foreign Exchange Risk".
| 168 |
2.1.7 Income Taxes
We are not subject to income taxes, taxes on capital gains, capital transfers or equity or estate duty under Bermuda law. However, some of our subsidiaries are subject to income tax and taxes on dividends paid to us, depending on the legislation of the jurisdictions in which they generate income.
Our Peruvian subsidiaries, including BCP, are subject to corporate taxation on income under Peruvian tax law. At December 31, 2017, the Peruvian statutory income tax rate was 29.5% on taxable profit after calculating the workers’ profit sharing, which is determined using a 5% rate. At December 31, 2016, the Peruvian statutory income tax rate was 28%.
An additional 5.0% withholding tax is applied on dividends, which we register as income tax based on the liquid amount received from BCP, Grupo Credito and Pacifico Seguros. Through Legislative Decree N°1261, published on December 11, 2016, the withholding tax on dividends for the profits generated was increased according to the following terms:
|
Rate for the profits generated in the
years |
% | |||
| Until 2014 | 4.1 | |||
| 2015 and 2016 | 6.8 | |||
| From 2017 onward | 5.0 | |||
Peruvian tax legislation is applicable to legal entities established in Peru, and on an individual (not consolidated) basis. Our non-Peruvian subsidiaries are not subject to taxation in Peru and their assets are not included in the calculation of the Peruvian extraordinary tax on net assets.
The Bolivian statutory Income Tax rate is 25.0 percent. Financial entities have an additional rate if the ROE exceeds 6 percent. In that case, an additional 22.0 percent must be considered, with which the rate becomes 47 percent.
In the case of Chile, the first category income tax rate for domiciled legal entities who have opted for the attributed regime, is 25.0 percent for the year 2017 onwards, and for those under the partially integrated system, it is 25.5 percent for the year 2017 and 27.0 percent for the year 2018 onward. On the other hand, individuals or legal entities non-domiciled in Chile will be subject to an additional tax of 35.0 percent. Credicorp Capital Holding Chile, together with all of its subsidiaries opted for the partially integrated regime.
| 169 |
In the case of Colombia, the income tax rate for the year 2017 was 34.0 percent plus a surcharge of 6.0 percent and at December 31, 2016 it was 25.0 percent. In the year 2018, the rate will be 33.0 percent plus a surcharge of 4.0 percent and as from the year 2019, the rate will be only 33.0 percent.
ASHC and its subsidiaries are not subject to taxes in the Cayman Islands or Panama. For the years ended December 31, 2016, 2015 and 2014, no taxable income was generated from their operations in the United States of America.
Tax expenses paid by the subsidiaries increased to S/1,393.3 million in 2017 from S/1,281.4 million in 2016, which was an increase from S/1,197.2 million in 2015. Income tax growth in these periods reflects increases in our taxable income. Since 1994, we have paid the Peruvian income tax at the statutory rate. The effective tax rates in 2015, 2016 and 2017 were 27.46%, 26.20% and 24.99%, respectively. For further detail, see Note 18 to the Consolidated Financial Statements.
(3) Financial Position
3.1 Total Assets
The following table shows changes to the principal assets of Credicorp from 2015 through 2017:
| 2015 | 2016 | 2017 | 2017-2016 | 2016-2015 | ||||||||||||||||
| Soles in millions | % Change | % Change | ||||||||||||||||||
| Cash and due from banks | 22,392 | 16,646 | 23,222 | 39.5 | (25.7 | ) | ||||||||||||||
| Cash collateral, reverse repurchase agreements and securities borrowings | 11,027 | 10,920 | 7,480 | (31.5 | ) | (1.0 | ) | |||||||||||||
| Trading securities | 2,323 | 4,015 | 4,025 | 0.2 | 72.8 | |||||||||||||||
| Investments available-for-sale | 18,769 | 18,686 | 24,424 | 30.7 | (0.4 | ) | ||||||||||||||
| Investments held-to-maturity | 3,582 | 5,118 | 4,413 | (13.8 | ) | 42.9 | ||||||||||||||
| Net loans | 86,488 | 90,562 | 95,977 | 6.0 | 4.7 | |||||||||||||||
| Other assets (1) | 10,899 | 10,488 | 10,931 | 4.2 | (3.8 | ) | ||||||||||||||
| Total assets | 155,480 | 156,435 | 170,472 | 9.0 | 0.6 | |||||||||||||||
(1) Includes Financial assets designated at fair value through profit and loss, Premiums and other policies receivable, Accounts receivable from reinsurers and coinsurers, Property, furniture and equipment, Other assets.
As of December 31, 2017, Credicorp had total assets of S/170.5 billion, an increase of 9.0% compared to total assets of S/156.4 billion as of December 31, 2016. In 2015, total assets were S/155.5 billion. In 2017, net loans increased by 6.0%. Investments available-for-sale and investments held-to-maturity increased mainly due to an increase in governments’ treasury bonds, certificates of deposit BCRP and corporate, leasing and subordinated bonds.
| 170 |
As of December 31, 2017, our total loans, which correspond to direct loans including accrued interest and excluding unearned interest, were S/100,477.8 million that represented 58.9% of total assets. Loans net of allowance for loan losses, were S/95,977.3 million. As of December 31, 2016, our total loans were S/94,768.9 million, which represented 60.6% of total assets, and net of allowance for loan losses were S/90,561.8 million. From December 31, 2016 to December 31, 2017 our total loans and loans net of allowance for loan losses increased by 6.0%.
Our total deposits with the Peruvian Central Bank increased to S/15,136.2 million as of December 31, 2017 from S/8,642.7 million as of December 31, 2016 (our total deposits with the Peruvian Central Bank were S/13,953.8 million in 2015). Our securities holdings (which include trading securities, available-for-sale and held-to-maturity investments) increased by 18.1% to S/32,862.0 million as of December 31, 2017 from S/27,819.1 million as of December 31, 2016 as compared to S/24,674.1 million in 2015. The increase of the securities portfolio in 2017 was primarily due to higher investments in governments’ treasury bonds, certificates of deposit BCRP and corporate, leasing and subordinated bonds.
| (i) | Loan evolution |
The increase of 6.0% of Credicorp’s total loans from 2016 to 2017 was a result of the expansion of BCP’s total loans, mainly of retail banking segments, as well as a higher level of total loans in BCP Bolivia and Mibanco. The following table shows the composition of Credicorp’s total loan portfolio in year-end balances:
|
Total year-
end |
2015 | 2016 | 2017 | 2016 - 2015 | 2017- 2016 | 2017 - % | 2016-% | |||||||||||||||||||||||||||||
| balances | Soles in millions | % Change | LC | FC (1) | LC | FC (1) | ||||||||||||||||||||||||||||||
| BCP (2) | 75,793 | 79,102 | 83,044 | 4.4 | 5.0 | 61.7 | % | 38.3 | % | 62.0 | % | 38.0 | % | |||||||||||||||||||||||
| Mibanco | 7,911 | 8,712 | 9,471 | 10.1 | 8.7 | 98.8 | % | 1.2 | % | 98.0 | % | 2.0 | % | |||||||||||||||||||||||
| Bolivia | 4,732 | 5,486 | 6,309 | 15.9 | 15.0 | - | 100.0 | % | - | 100.0 | % | |||||||||||||||||||||||||
| ASB | 3,175 | 3,128 | 2,675 | (1.5 | ) | (14.5 | ) | - | 100.0 | % | - | 100.0 | % | |||||||||||||||||||||||
| Others (3) | (1,283 | ) | (1,659 | ) | (1,021 | ) | N/A | N/A | - | - | - | - | ||||||||||||||||||||||||
| Total loans | 90,328 | 94,769 | 100,478 | 4.9 | % | 6.0 | % | 59.3 | % | 40.7 | % | 59.1 | % | 40.9 | % | |||||||||||||||||||||
| (1) | Includes mainly US dollar currency and other foreign currencies (BOB, COP, CLP). |
| (2) | Includes BCP Panama, BCP Miami, do not include the loan of BCP to Credicorp for the sale of BCI shares. |
| (3) | Includes other banking and elimination for consolidation. |
| 171 |
Approximately 59.3% of Credicorp total loans are denominated in local currency, mainly as a result of BCRP’s de-dollarization program that set, among other points, goals for progressive de-dollarization by June 2015, December 2015, December 2016 and December 2017 for the following portfolios:
| § | the total foreign currency portfolio (excluding loans for foreign trade and loans issues for more than 3 years for amounts that exceed US$10 million); and |
| § | the mortgage and car portfolios as a whole. |
In 2017, BCP’s wholesale banking segment posted a decline of -1.1% in average daily balances. This was due to the decrease of -3.6% registered in the corporate banking segment, which was partially offset by growth in the middle-market segment of 3.9%. BCP’s retail banking loan book grew 3.1% in average daily balances due primarily to expansion in local currency loans across most of the portfolio’s segments. This growth was led by the SME-Pyme, mortgage, SME-Business and consumer segments. The variation in retail banking was due to:
| § | SME-Pyme loans grew 7.8% as a result of loan expansion in the LC portfolio. |
| § | Mortgage loans grew 1.7% in 2017. Since mid-2013, disbursements in mortgage loans have been made primarily in LC, even reaching a level of 100% of disbursement in LC in most months. |
| § | The SME-Business loans grew 4.2% in 2017. The increase was in both the LC and FC portfolio. Although approximately 53% of loans in this segment are denominated in foreign currency, the total SME-Business loans only represent approximately 5% of Credicorp’s total portfolio. |
| § | The Consumer segment posted growth of 1.6% in 2017, mainly due to expansion of the FC portfolio. This reflects the decision made to resume growth in the segment. |
| § | The Credit Card segment reported only a slight growth of 0.3%, due to the fact that the expansion in the FC portfolio was offset by the decrease posted by the LC portfolio. The FC loans in the credit card segment are associated with purchases in U.S. Dollars outside of Peru made over the internet or during trips by clients who pay in full at the payment date. |
Mibanco’s loan portfolio grew 8.6% in 2017 due to the recovery in loan origination started in 2016, after the acquisition of Mibanco and a subsequent clean-up process during 2015. The speed of origination is still below Mibanco’s expected potential, which reflects the bank’s focus on prioritizing portfolio quality over accelerating the pace of loan growth, in light of the current macroeconomic context.
BCP Bolivia and ASB loans accounted for 9.0% of Credicorp’s total loan portfolio. BCP Bolivia loan portfolio increased 15.5% and ASB loan portfolio decreased -11.1% in 2017. Both portfolios account for the depreciation of the Bolivian Pesos and the U.S. Dollar against the Sol. BCP Bolivia’s increase in loans is consistent with the expansion of its corporate segment and its mortgage segment. The latter was a result of higher volume posted for mortgage loans after the Bolivian Government set lower financing rates for the regulated portfolio (productive sector and social housing), which pursuant to Bolivian law must account for 60% of total loans at the end of 2018.
| 172 |
The following table shows the composition of Credicorp’s loan portfolio for loans issued in local currency in year-end balances:
| Local currency | 2015 | 2016 | 2017 | 2016 - 2015 | 2017 - 2016 | |||||||||||||||
| year-end balances | Soles in millions | % Change | ||||||||||||||||||
| BCP | 47,728 | 49,032 | 51,214 | 2.7 | 4.5 | |||||||||||||||
| Mibanco | 7,623 | 8,536 | 9,355 | 12.0 | 9.6 | |||||||||||||||
The following table shows the composition of Credicorp’s loan portfolio in foreign currency in year-end balances:
| Foreign currency | 2015 | 2016 | 2017 | 2016 - 2015 | 2017 - 2016 | |||||||||||||||
| year-end balances | U.S. Dollars in millions | % Change | ||||||||||||||||||
| BCP | 8,227 | 8,960 | 9,821 | 8.9 | 9.6 | |||||||||||||||
| Mibanco | 84 | 53 | 36 | (36.9 | ) | (32.1 | ) | |||||||||||||
| Bolivia | 1,387 | 1,635 | 1,947 | 17.9 | 19.1 | |||||||||||||||
| ASB | 931 | 932 | 825 | 0.1 | (11.5 | ) | ||||||||||||||
The following table shows the composition of BCP Stand-alone’s loan portfolio, measured in average daily balances. The table includes average daily balances for the following years:
| 2015 | 2016 | 2017 | 2016 - 2015 | 2017 - 2016 | ||||||||||||||||
| Soles in millions | % Change | % Change | ||||||||||||||||||
| Wholesale Banking | 38,520 | 41,215 | 40,743 | 7.0 | % | -1.1 | % | |||||||||||||
| Corporate | 25,239 | 27,584 | 26,586 | 9.3 | % | -3.6 | % | |||||||||||||
| Middle-Market | 13,281 | 13,631 | 14,157 | 2.6 | % | 3.9 | % | |||||||||||||
| Retail Banking | 32,519 | 35,216 | 36,321 | 8.3 | % | 3.1 | % | |||||||||||||
| SME-Pyme | 7,081 | 7,557 | 8,148 | 6.7 | % | 7.8 | % | |||||||||||||
| SME-Business | 3,607 | 4,429 | 4,615 | 22.8 | % | 4.2 | % | |||||||||||||
| Mortgage | 11,735 | 12,469 | 12,681 | 6.3 | % | 1.7 | % | |||||||||||||
| Consumer | 6,266 | 6,453 | 6,556 | 3.0 | % | 1.6 | % | |||||||||||||
| Credit card | 3,830 | 4,308 | 4,321 | 12.5 | % | 0.3 | % | |||||||||||||
| Others | 557 | 691 | 732 | 24.1 | % | 5.9 | % | |||||||||||||
| Total loans | 71,596 | 77,122 | 77,796 | 7.7 | % | 0.9 | % | |||||||||||||
| 173 |
3.2 Total Liabilities
| 2015 | 2016 | 2017 | 2017 - 2016 | 2016 - 2015 | ||||||||||||||||
| Soles in millions | % Change | |||||||||||||||||||
| Time deposits | 25,999 | 22,531 | 30,184 | 34.0 | (13.3 | ) | ||||||||||||||
| Demand deposits | 28,500 | 28,506 | 29,770 | 4.4 | - | |||||||||||||||
| Saving deposits | 24,905 | 26,684 | 28,633 | 7.3 | 7.1 | |||||||||||||||
| CTS | 7,183 | 7,118 | 7,171 | 0.7 | (0.9 | ) | ||||||||||||||
| Bank's negotiable certificates | 1,721 | 744 | 959 | 28.9 | (56.8 | ) | ||||||||||||||
| Interest payable | 299 | 333 | 453 | 36.0 | 11.4 | |||||||||||||||
| Total deposits | 88,607 | 85,916 | 97,170 | 13.1 | (3.0 | ) | ||||||||||||||
| Payables from to repurchase agreements and security lending | 14,600 | 15,128 | 13,416 | (11.3 | ) | 3.6 | ||||||||||||||
| Due to banks and correspondents | 7,762 | 7,494 | 7,997 | 6.7 | (3.5 | ) | ||||||||||||||
| Bonds and notes issued | 16,288 | 15,940 | 16,242 | 1.9 | (2.1 | ) | ||||||||||||||
| Other liabilities | 11,495 | 11,840 | 13,393 | 13.1 | 3.0 | |||||||||||||||
| Total liabilities | 138,752 | 136,318 | 148,218 | 8.7 | (1.8 | ) | ||||||||||||||
As of December 31, 2017, we had total liabilities of S/148.2 billion, a 8.7% increase from S/136.3 billion as of December 31, 2016, which was an decrease compared to S/138.3 billion in 2015. As of December 31, 2017, we had total deposits of S/97.2 billion, a 13.1% increase from S/85.9 billion on December 31, 2016 which was a 3.0% decrease compared to S/88.6 billion in 2015.
We have structured our funding strategy around maintaining a diversified deposit base. As of December 31, 2017, Credicorp accounted for 42.4% of all total savings deposits in the Peruvian banking system, 37.4% of all demand deposits in the Peruvian banking system, 33.0% of all time deposits in the Peruvian banking system and 36.4% of all total deposits in the Peruvian banking system, the highest of any Peruvian bank in all three types of deposits, according to the SBS. As of December 31, 2017, we had 46.3% of the entire Peruvian banking system’s CTS deposits, a decrease from 47.2% as of December 31, 2016 and 47.8% as of December 31, 2015, according to the SBS. We believe that we have traditionally attracted a high percentage of the savings, demand and time deposits market because of our reputation as a sound institution, our extensive branch network and the quality of our service.
For further discussion, see “Item 4. Information on the Company – 4.B Business Overview - (5) Review of 2016 – 5.2 financial performance – 5.2.2 Funding structure”.
| 174 |
3.3 Total Equity
| 2015 | 2016 | 2017 | 2017 - 2016 | 2016-2015 | ||||||||||||||||
| Soles in millions | % Change | |||||||||||||||||||
| Capital stock | 1,319 | 1,319 | 1,319 | - | - | |||||||||||||||
| Treasury stock | (209 | ) | (209 | ) | (209 | ) | - | - | ||||||||||||
| Capital surplus | 284 | 281 | 272 | (3.2 | ) | (1.1 | ) | |||||||||||||
| Reserves and put options(1) | 10,882 | 13,539 | 14,648 | 8.2 | 24.4 | |||||||||||||||
| Other reserves | 763 | 1,210 | 1,456 | 20.3 | 58.6 | |||||||||||||||
| Retained earnings | 3,089 | 3,517 | 4,271 | 21.4 | 13.9 | |||||||||||||||
| Equity before minority interest | 16,128 | 19,657 | 21,757 | 10.7 | 21.9 | |||||||||||||||
| Non-controlling interest | 600 | 460 | 497 | 8.0 | (23.3 | ) | ||||||||||||||
| Total equity | 16,728 | 20,117 | 22,254 | 10.6 | 20.3 | |||||||||||||||
| (1) | Regarding the put options, they refer to options we held related to the rights provided to non-controlling interest at Credicorp Capital, which were exercised in 2016. The options amounted to S/340.4 million as of December 31, 2015, and to S/ 0 as of December 31, 2016 and 2017. |
As of December 31, 2017, we had total equity of S/22.3 billion, a 10.6% increase from S/20.1 billion as of December 31, 2016, which was an 20.3% increase compared to S/16.7 billion in 2015.
During 2017, 2016 and 2015 the shares have been 94,382,317 at US$5.00 par value. As mention in Note 17 of Consolidated Financial Statements, at December 31, 2017 treasury stock comprises the par value of 14,902,008 shares of Credicorp, which include 14,620,846 corresponds to Credicorp’s shares held by ASHC, a subsidiary of Credicorp, as it is explained in ITEM 7. MAJOR SHAREHOLDERS AND RELATED PARTY TRANSACTIONS - 7. A Major Shareholders. The remaining 281,163 shares correspond to the Long-term compensation program of Credicorp for its key employees.
At the Board meetings held on February 22, 2017, February 24, 2016 and February 25, 2015, the decision was made to transfer from “Retained earnings” to “Reserves” S/2,355.0 million, S/2,316.4 million and S/1,820.5 million, respectively.
During 2017, 2016 and 2015, Credicorp paid cash dividends, net of the effect of treasury shares, of approximately US$298.1 million, US$184.7 million and US$174.4 million, respectively (equivalent to approximately S/980.0 million, S/653.3 million and S/540.0 million, respectively). In this sense, during the years 2017, 2016 and 2015, cash dividend payouts per share totaled US$3.7, US$2.3 and US$1.8, respectively in accordance with current Peruvian legislation; there is no restriction for overseas remittance of dividends or the repatriation of foreign investment. At December 31, 2017 dividends paid by the Peruvian subsidiaries to Credicorp are subject to a 5.0 percent withholding tax and at December 31, 2016 and 2015; the withholding rate was 6.8 percent.
| 175 |
| 5. B | Liquidity and Capital Resources |
(1) Capital Adequacy Requirements for Credicorp
SBS Resolution 11823-2010 established the methodologies for calculating the regulatory capital and capital requirements for financial and mixed conglomerates. Article 4 of SBS Resolution 11823-2010 identifies two consolidated groups: (i) the financial system consolidated group, and (ii) the insurance system consolidated group. The combined group of companies formed by these two categories of entities is called the financial group. The financial system consolidated group, the insurance system consolidated group, and the financial group are each required to hold regulatory capital that is greater than or equal to the capital requirements applicable to each respective group.
The capital requirements applicable to the financial group are the sum of the capital requirements applicable to the financial system consolidated group and to the insurance system consolidated group. The capital requirements applicable to the financial system consolidated group and to the insurance system consolidated group are the sum of the capital requirements applicable to the companies that belong to each respective group. For unsupervised companies, their regulatory capital is required to be the greater of: (i) 10% of third party assets and (ii) the ratio of third party assets over total assets multiplied by the sum of paid-in-capital, legal reserves, supplementary capital premiums, voluntary reserves distributable only with prior SBS approval, and retained earnings with capitalization agreements net of current and past years’ losses.
Article 6 of SBS resolution 11823-2010, provides that regulatory capital of the consolidated groups is comprised of the sum of basic capital and supplementary capital, and is calculated as follows:
| · | Basic Capital: Basic Capital or Tier 1 capital is comprised of: |
| (i) | paid-in-capital (which includes common stock and perpetual non-cumulative preferred stock), legal reserves, supplementary capital premiums, voluntary reserves distributable only with prior SBS approval, and retained earnings with capitalization agreements (i.e., earnings that the shareholders or the Board of Directors, as the case may be, have committed to capitalize as common stock); and |
| (ii) | other elements that have characteristics of permanence and loss absorption that are in compliance with regulations enacted by the SBS; |
| 176 |
Items deducted from Tier 1 capital include:
| (a) | current and past years’ losses; |
| (b) | deficits of loan loss provisions; |
| (c) | goodwill resulting from corporate reorganizations or acquisitions; and |
| (d) | half of the amount referred to in “Deductions” below. Absent any Tier 2 capital, 100% of the amount referred to in “Deductions” below must be deducted from Tier 1 capital. |
The elements referred to in item (ii) above should not exceed 17.65% of the amount resulting from adding components (i) and (ii) of Tier 1 capital net of the deductions in (a), (b) and (c) in this paragraph.
| · | Supplementary Capital: Supplementary capital is comprised of the sum of Tier 2 and Tier 3 capital. Tier 2 capital elements include: |
| (i) | paid-in-capital, legal reserves, supplementary capital premiums, and voluntary reserves that may be reduced without prior consent from the SBS; |
| (ii) | the eligible portion of the consolidated redeemable subordinated debt and of any other components that have characteristics of debt and equity as provided by the SBS; |
| (iii) | for banks using the SAM, the generic loan loss provision up to 1.25% of total credit risk-weighted assets; or, alternatively, for banks using the IRB, the generic loan loss provision up to 0.6% of total credit risk-weighted assets (pursuant to article 189 of the Law 26702); and |
| (iv) | half of the amount referred to in “Deductions” below. Tier 3 capital is comprised of consolidated redeemable subordinated debt that is incurred with the sole purpose of covering market risk. |
| · | Deductions: The following elements are deducted from Tier 1 and Tier 2 capital: |
| (i) | for the financial system consolidated group, all investments in shares and subordinated debt issued by other local or foreign financial institutions and insurance companies; for the insurance system consolidated group, all investments in shares and subordinated debt issued by other local or foreign insurance companies; |
| (ii) | all investments in shares and subordinated debt issued by entities that are part of the holding but do not belong to any of the consolidated groups; |
| 177 |
| (iii) | for the financial system group, the amount by which (a) an investment in shares issued by a real sector company which is neither part of the holding nor part of the negotiable portfolio exceeds 15% of the financial system consolidated group’s regulatory capital; and (b) the amount by which the aggregate amount of all investments in shares issued by real sector companies which are not part of the holding and which are not part of the financial system consolidated group’s negotiable portfolio exceeds 60% of the regulatory capital. |
Article 7 of SBS resolution 11823-2010 provides that the following limits apply when calculating regulatory capital: (i) the aggregate amount of supplementary capital must not exceed the aggregate amount of basic capital; (ii) the amount of redeemable Tier 2 subordinated instruments must be limited to 50% of the amount resulting from the sum of Tier 1 elements in “Basic Capital” above; and (iii) the amount of Tier 3 capital must be limited to 250% of the sum of Tier 1 elements.
Article 10 of SBS resolution 11823-2010, provides that regulatory capital of the financial group is comprised of the sum of basic capital and supplementary capital, and is calculated as follows:
| · | Basic Capital: Basic Capital or Tier 1 capital is comprised of: |
| (i) | paid-in-capital (which includes common stock and perpetual non-cumulative preferred stock), legal reserves, supplementary capital premiums, voluntary reserves distributable only with prior SBS approval, and retained earnings with capitalization agreements (i.e., earnings that the shareholders or the Board of Directors, as the case may be, have committed to capitalize as common stock); and, |
| (ii) | other elements that have characteristics of permanence and loss absorption that are in compliance with regulations enacted by the SBS. |
| (iii) | Items deducted from Tier 1 capital include: |
| (iv) | current and past years’ losses; |
| (v) | deficits of loan loss provisions; |
| (vi) | goodwill resulting from corporate reorganizations or acquisitions; and |
| (vii) | half of the amount referred to in “Deductions” below. Absent any Tier 2 capital, 100% of the amount referred to in “Deductions” below must be deducted from Tier 1 capital. |
| · | Supplementary Capital: Supplementary capital is comprised of the sum of Tier 2 and Tier 3 capital. Tier 2 capital elements include: |
| 178 |
| (i) | paid-in-capital, legal reserves, supplementary capital premiums, and voluntary reserves that may be reduced without prior consent from the SBS; |
| (ii) | the eligible portion of the consolidated redeemable subordinated debt and of any other components that have characteristics of debt and equity as provided by the SBS; |
| (iii) | the generic loan loss provision included in the supplementary capital of the financial consolidated group; and |
| (iv) | half of the amount referred to in “Deductions” below. Tier 3 capital is comprised of consolidated redeemable subordinated debt computed in the consolidated groups. |
| · | Deductions: The following elements are deducted from Tier 1 and Tier 2 capital: |
| (i) | all investments in shares and subordinated debt issued by other local or foreign financial institutions and insurance companies; |
| (ii) | all investments in shares and subordinated debt issued by entities that are part of the holding but do not belong to any of the consolidated groups; |
| (iii) | all investment in shares issued by real sector companies which are not part of the holding and the negotiable portfolio, computed as deductions in the financial system consolidated group. |
On October 2017, Credicorp’s Board approved the distribution of a special cash dividend of S/ 1,481.8 million for total outstanding shares, which was paid on November 14, 2017. The decision was based on its financial strength, the significant capital gains it has been making in recent years and its objective of optimizing the capital structure, and in accordance with the provisions set forth in the Company's By-Laws and Bermuda Law.
The following table shows regulatory capital and capital adequacy requirements applicable to the financial group under IFRS rules, as of December 31, 2015, 2016 and 2017:
| Regulatory Capital and Capital Adequacy Ratios | 2015 | 2016 | 2017 | |||||||||
| Soles in Thousands | ||||||||||||
| Capital stock | 1,318,993 | 1,318,993 | 1,318,993 | |||||||||
| Treasury Stocks | -208,978 | -209,322 | -208,937 | |||||||||
| Capital Surplus | 284,171 | 280,875 | 271,948 | |||||||||
| Legal and other capital reserves (1) | 11,222,405 | 13,539,091 | 14,647,709 | |||||||||
| Non-controlling interest | 376,318 | 324,474 | 348,646 | |||||||||
| Loan loss reserves | 1,293,802 | 1,337,942 | 1,394,135 | |||||||||
| Perpetual subordinated debt | 852,750 | 839,000 | 810,250 | |||||||||
| Subordinated debt | 5,037,176 | 5,108,527 | 4,439,741 | |||||||||
| Investments in equity and subordinated debt of financial and insurance companies | -928,018 | -728,626 | -663,528 | |||||||||
| Goodwill | -633,877 | -636,245 | -635,975 | |||||||||
| Deduction for subordinated debt limit (50% of Tier I excluding deductions) | - | - | - | |||||||||
| Deduction for Tier I Limit (50% of Regulatory capital) | - | - | - | |||||||||
| Total Regulatory Capital (A) | 18,614,742 | 21,174,709 | 21,722,982 | |||||||||
| Tier I | 10,843,057 | 12,121,151 | 12,644,124 | |||||||||
| Tier II + Tier III | 7,771,685 | 9,053,558 | 9,078,858 | |||||||||
| Financial Consolidated Group (FCG) Regulatory Capital Requirements | 15,562,251 | 16,495,175 | 17,385,609 | |||||||||
| Insurance Consolidated Group (ICG) Capital Requirements | 964,728 | 961,365 | 913,427 | |||||||||
| FCG Capital Requirements related to operations with ICG | -126,149 | -197,486 | -287,730 | |||||||||
| ICG Capital Requirements related to operations with FCG | - | - | - | |||||||||
| Total Regulatory Capital Requirements (B) | 16,400,830 | 17,259,054 | 18,011,306 | |||||||||
| Regulatory Capital Ratio (A) / (B) | 1.13 | 1.23 | 1.21 | |||||||||
| Required Regulatory Capital Ratio (2) | 1.00 | 1.00 | 1.00 | |||||||||
(1) Legal and other capital reserves include restricted capital reserves (PEN 11,071 million) and optional capital reserves (PEN 3,577 million).
(2) Regulatory Capital / Total Regulatory Capital Requirements (legal minimum = 1.00)
| 179 |
(2) Liquidity Risk
We manage our assets and liabilities to ensure that we have sufficient liquidity to meet our present and future financial obligations and to be able to take advantage of appropriate business opportunities as they arise. Liquidity risk represents the potential for loss as a result of limitations on our ability to adjust future cash flows to meet the needs of depositors and borrowers and to fund operations on a timely and cost-effective basis. Financial obligations arise from withdrawals of deposits, repayment on maturity of purchased funds, extensions of loans or other forms of credit, and working capital needs.
The growth of our deposit base over the years has enabled us to significantly increase our lending activity. BCP and Mibanco are subject to SBS Resolution No. 9075-2012, enacted in December 2012, which set responsibilities for liquidity management within the different committees and risk units, and by which minimum liquidity ratios were established. The ratio of liquid assets as a percentage of short-term liabilities, as strictly defined by the SBS, must exceed 8% for Soles-based transactions, and 20% for foreign exchange-based transactions. The aggregate average daily ratios of BCP and Mibanco during the month of December 2017 were 38.60% and 41.92% for Soles and foreign exchange-based transactions, respectively, demonstrating our excess liquidity. We have never defaulted on any of our debt or been forced to reschedule any of our obligations. Even during the early 1980s, when the government of Peru and many Peruvian companies and banks were forced to restructure their debt as a result of the Latin American debt crisis and government restrictions, BCP and Grupo Pacifico complied with all of their payment obligations.
The available sources of excess liquidity for Soles and foreign exchange-based transactions for BCP are as follows. Information with respect to BCP and Mibanco has been aggregated for December 2016 and 2017:
| 2013 | 2014 | 2015 | 2016 | 2017 | ||||||||||||||||
| SOLES RATIO |
Soles in
thousands |
Soles in
thousands |
Soles in
thousands |
Soles in thousands |
Soles in
thousands |
|||||||||||||||
| CURRENT ASSETS | ||||||||||||||||||||
| Cash | 2,007,983 | 2,550,062 | 2,233,768 | 2,131,788 | 2,422,969 | |||||||||||||||
| Deposits in BCRP and deposits in Peruvian banks | 3,208,205 | 831,326 | 657,023 | 948,842 | 760,889 | |||||||||||||||
| Peruvian Government treasury bonds and BCRP certificates of deposit | 5,066,398 | 3,363,310 | 6,686,175 | 8,634,453 | 12,931,240 | |||||||||||||||
| Others | 4,363 | 14,131 | 40,411 | |||||||||||||||||
| Total | 10,286,949 | 6,758,829 | 9,576,966 | 11,755,494 | 16,115,098 | |||||||||||||||
| CURRENT LIABILITIES | ||||||||||||||||||||
| Demand deposits | 9,235,497 | 10,006,248 | 9,493,236 | 10,233,993 | 12,820,189 | |||||||||||||||
| Saving deposits | 9,644,537 | 10,481,434 | 11,443,247 | 12,591,901 | 14,041,156 | |||||||||||||||
| Time deposits | 8,287,408 | 7,845,596 | 10,796,239 | 11,643,949 | 12,484,275 | |||||||||||||||
| Others | 1,839,144 | 608,878 | 2,180,340 | 2,582,533 | 2,408,699 | |||||||||||||||
| Total | 29,006,586 | 28,942,156 | 33,913,062 | 37,052,376 | 41,754,319 | |||||||||||||||
| Current ratio | 35.46 | 23.35 | 28.24 | 31.73 | 38.60 | |||||||||||||||
| 2013 | 2014 | 2015 | 2016 | 2017 | ||||||||||||||||
| FOREIGN EXCHANGE RATIO |
Soles in
thousands |
Soles in
thousands |
Soles in
thousands |
Soles in
thousands |
Soles in
thousands |
|||||||||||||||
| CURRENT ASSETS | ||||||||||||||||||||
| Cash | 266,038 | 312,437 | 318,747 | 413,027 | 583,988 | |||||||||||||||
| Deposits in BCRP and deposits in Peruvian banks | 4,721,062 | 4,881,605 | 4,193,257 | 3,578,883 | 4,623,916 | |||||||||||||||
| Peruvian Government treasury bonds and BCRP certificates of deposit | 83,155 | 26,927 | 123,156 | 0 | 171,122 | |||||||||||||||
| Others | 114,801 | 95,734 | 216,234 | 153,400 | 658 | |||||||||||||||
| Total | 5,185,056 | 5,316,703 | 4,851,394 | 4,415,310 | 5,379,684 | |||||||||||||||
| CURRENT LIABILITIES | ||||||||||||||||||||
| Demand deposits | 3,973,119 | 4,675,115 | 4,604,779 | 4,682,113 | 4,602,652 | |||||||||||||||
| Saving deposits | 2,298,928 | 2,629,064 | 3,135,044 | 3,399,034 | 3,689,212 | |||||||||||||||
| Time deposits | 3,059,009 | 2,212,701 | 3,528,667 | 2,252,924 | 3,191,678 | |||||||||||||||
| Others | 1,742,132 | 1,899,361 | 1,783,898 | 1,291,847 | 1,348,370 | |||||||||||||||
| Total | 11,073,188 | 11,416,241 | 13,052,388 | 11,625,918 | 12,831,912 | |||||||||||||||
| Current ratio | 46.83 | 46.57 | 37.17 | 35.66 | 41.92 | |||||||||||||||
| 180 |
The capability of replacing interest-bearing deposits at their maturity is a key factor in determining liquidity requirements, as well as the exposure to interest and exchange rate risks. Our principal source of funding is customer deposits with BCP’s retail banking group and ASB’s private banking group, and premiums and amounts earned on invested assets at Grupo Pacifico. We believe that funds from our deposit-taking operations generally will continue to meet our liquidity needs for the foreseeable future.
BCP’s retail banking group has developed a diversified and stable deposit base and its private banking group has developed a stable deposit base that, in each case, provides us with a low-cost source of funding. This deposit base has traditionally been one of our greatest strengths. The deposit gathering strategy has focused on products considered as BCP’s core deposits: demand deposits, savings, time deposits and CTS deposits. Other sources of funds and liquidity, which are mostly short- and long-term borrowings from correspondent banks and other financial institutions, issued bonds, and subordinated debt, are of a considerably lower significance compared to our core deposits.
Corporate policies have been implemented by the Group for liquidity risk management. These policies are consistent with the particular characteristics of each operating segment, in where each of the Group companies operates. Risk Management heads establish limits and autonomy models to determine the adequate liquidity indicators to be managed
Commercial banking: Liquidity risk exposure in BCP, BCP Bolivia, Mibanco and ASB is based on indicators such as the Internal Liquidity Coverage Ratio (ILCR) which measures the amount of liquid assets available to meet needs that would result from cash outflows within a given stress scenario for a period of 30 days, and the Internal Ratio of Stable Net Funding , which is intended to ensure that long-term assets are financed with a minimum number of stable liabilities within a prolonged liquidity crisis scenario; the latter indicator functions as a minimum compliance mechanism that supplements the ILCR. The core limits of these indicators are 100% and any excess is presented to the Credicorp Treasury and ALM Risk Committee, Credicorp Risk Management Committee and ALM Committee of the respective subsidiary. Furthermore, Credicorp has internal appetite risk limits that are monitored and informed to the Credicorp Treasury and ALM Risk Committee.
Insurance: Liquidity risk management in Grupo Pacifico follows a particular approach reflecting the nature of the business. For annually renewable businesses, mainly “Pacifico Seguros”, the focus of liquidity is the quick availability of resources in the event of a systemic event (e.g., an earthquake); for this purpose there are minimum investment indicators in place relating to local cash/time deposits and foreign fixed-income instruments of high quality and liquidity.
| 181 |
For long-term insurance businesses such as Pacifico Vida, given the nature of the products offered and the contractual relationship with customers, the liquidity risk is not material; rather, the focus is on maintaining a sufficient flow of assets and matching their maturities with the maturities of obligations (e.g., the mathematical technical reserve). For this purpose, there are indicators that measure the asset/liability sufficiency and adequacy, as well as calculations of economic capital subject to interest rate risk.
AFPs: Liquidity risk management in Prima AFP is differentiated between the fund administrator and the funds being managed. Liquidity management regarding the fund administrator is focused on meeting periodic operating expense needs, which are supported by the collection of commissions. Also, the fund administrator entity does not record unexpected outflows of liquidity, because main financial obligations are payroll payments, taxes, reserve requirements and other accounts payable to suppliers.
Investment banking: Liquidity risk in Credicorp Capital (Credicorp Capital Colombia, Credicorp Capital Chile and Credicorp Capital Peru) principally affects the security brokerage. In managing this risk, limits on the use of liquidity have been established as well as processed to promote matching maturities by dealing desk. Follow-up liquidity assessments are performed on a daily basis for a short-term horizon covering imminent settlements. If short-term unmatched maturities are observed, repos are used. On the other hand, structural risk of Credicorp Capital is not significant given the low levels of debt, which are monitored regularly using financial planning tools.
| 182 |
The following table presents our core deposits, other deposits and other sources of funds without accrued interest:
| At December 31, | ||||||||||||
| 2015 | 2016 | 2017 | ||||||||||
| (Soles in thousands, except percentages) | ||||||||||||
| Core Deposits: | ||||||||||||
| Demand deposits | 28,499,990 | 28,506,270 | 29,770,276 | |||||||||
| Savings deposits | 24,904,565 | 26,684,134 | 28,633,099 | |||||||||
| CTS | 7,183,421 | 7,117,685 | 7,170,934 | |||||||||
| Total core deposits | 60,587,976 | 62,308,089 | 65,574,309 | |||||||||
| Other Deposits: | ||||||||||||
| Time deposits | 25,999,186 | 22,531,305 | 30,184,314 | |||||||||
| Bank certificates | 1,720,800 | 743,726 | 959,051 | |||||||||
| Total deposits | 88,307,962 | 85,583,120 | 96,717,674 | |||||||||
| Payables from repurchase agreements and security lending | 14,599,750 | 15,127,999 | 13,415,843 | |||||||||
| Due to banks and correspondents | 7,736,738 | 7,455,184 | 7,954,271 | |||||||||
| Bonds and notes issued | 16,094,120 | 15,750,467 | 16,049,234 | |||||||||
| Total sources of funds | 126,738,570 | 123,916,770 | 134,137,022 | |||||||||
| Core deposits as a percent of total deposits | 68.6 | % | 72.8 | % | 67.8 | % | ||||||
| Core deposits as a percent of total sources of liquid funds | 47.8 | % | 50.3 | % | 48.9 | % | ||||||
BCP is required to keep deposits with the Peruvian Central Bank as legal reserves. The amount of required deposits with the Peruvian Central Bank is determined as a percentage of the deposits and other liabilities owed by BCP to its clients. The requirement is currently approximately 5.00% of BCP’s Soles-denominated deposits and approximately 32.40% of BCP’s U.S. Dollar-denominated deposits as of December 31, 2017. See “Item 4. Information on the Company – 4.B Business Overview - (9) Supervision and Regulation – 9.2 BCP and Mibanco– 9.2.7 The Peruvian Central Bank monetary and macro-prudential policy.” Legal reserves are intended to ensure availability of liquid funds to cover withdrawals of deposits. Additionally, we have significant investments of excess liquid funds in short-term Central Bank certificates of deposits.
The following table presents our deposits at the Peruvian Central Bank and our investments in Peruvian Central Bank certificates of deposits:
| At December 31, | ||||||||||||
| 2015 | 2016 | 2017 | ||||||||||
| (Soles in thousands, except percentages) | ||||||||||||
| Funds at Peruvian Central Bank | ||||||||||||
| Deposits | 13,953,839 | 8,642,656 | 15,136,245 | |||||||||
| Certificates of deposit | 6,006,110 | 7,062,505 | 10,026,038 | |||||||||
| Total funds at Peruvian Central Bank | 19,959,949 | 15,705,161 | 25,162,283 | |||||||||
| Total funds at BCRP as a percent of total deposits | 22.6 | % | 18.4 | % | 26.0 | % | ||||||
BCP at times has accessed Peru’s short-term interbank deposit market, although it is generally a lender in this market. The Peruvian Central Bank’s discount window, which makes short-term loans to banks at premium rates, is also available as a short-term funding source, but has been used infrequently by BCP.
| 183 |
As of December 31, 2017, we had uncommitted credit lines with various banks, including long-term facilities that are mainly used for project financing, of which no significant amount was drawn down. We have also received long term funding from Cofide, Corporacion Andina de Fomento (CAF), and other international lenders. The transactions relating to these credit lines include import and export transactions and average annual rates (including Libor) ranging from 0.5% to 9.04%. As of December 31, 2017, we maintain S/7,294.5 million in such credit lines, secured by the collection of BCP’s (including its foreign branches) instructing correspondent banks to make a payment of a certain amount to a beneficiary that is not a financial institution. See Notes 14(a) and (c) to the Consolidated Financial Statements. As of December 31, 2017, 2016 and 2015, borrowed funds due to banks and correspondents amounted to S/7,996.9 million, S/7,493.9 million and S/7,762.5 million, respectively.
A source of funds specific to leasing operations are leasing bonds issued by lease financing companies, the terms of which are specified in the Peruvian leasing regulations. As of December 31, 2017, 2016 and 2015, BCP had S/100 million of outstanding leasing bonds. These bonds have maturities of up to two years. See Note 16 to the Consolidated Financial Statements for a detailed breakdown of our issued bonds.
The following table presents our issued bonds:
| Years ended December 31, | ||||||||||||
| 2015 | 2016 | 2017 | ||||||||||
| (Soles in million) | ||||||||||||
| Issued bonds | ||||||||||||
| Senior notes | - | 1,007 | 2,000 | |||||||||
| Corporate bonds | 100 | 561 | 182 | |||||||||
| Subordinated bonds | 70 | 100 | 30 | |||||||||
| Total issuance | 170 | 1,668 | 2,212 | |||||||||
In January of 2017, BCP issued corporate bonds due in January of 2020 for S/182.4 million, with a fixed annual interest rates of 5.91% and in June 2017, Mibanco issued subordinated bonds due in June 2027 for S/30.0 million with a fixed annual interest rate of 7.22%.
Additionally, in October of 2017, BCP issued senior notes due in October of 2020 for S/2,000.0 million with a fixed annual interest rate of 4.85%.
In April, June and November of 2016, BCP issued corporate bonds due in April, June and November of 2019, respectively, for S/172.9 million, S/150.0 million and S/138.4 million, respectively, with a fixed annual interest rates of 6.41%, 5.59% and 5.63%, respectively; and in June 2016, Mibanco issued corporate bonds due in June 2019 for S/100.0 million with a fixed annual interest rate of 7.16%. Also, in May 2016, Mibanco issued subordinated bonds due in May 2026 for S/100 million with a fixed annual interest rate of 8.50%.
| 184 |
In July 2015, Mibanco issued corporate bonds due in July 2018 for S/100 million with fixed annual interest rates of 6.56%; also in 2015, BCP Bolivia issued subordinated bonds due in August 2022 for Bs137.2 million (equivalent to S/69.7 million as December 31, 2015) with a fixed annual interest rate of 5.25%.
The principal sources of funds for Pacifico Seguros’ insurance operations are premiums and amounts earned on invested assets. The major uses of these funds are the payment of policyholder claims, benefits and related expenses, reinsurance costs, commissions and other operating costs. In general, Pacifico Seguros’ insurance operations generate substantial cash flow because most premiums are received in advance of the time when claim payments are required. Positive operating cash flows, along with the portion of the investment portfolio that is held in cash and highly liquid securities, historically have met the liquidity requirements of insurance operations and is sufficient for the Company’s present requirements.
| 5. C | Research and Development, Patents and Licenses, Etc. |
Not applicable.
| 5. D | Trend Information |
We expect that 2018 will show an economic environment of relatively low growth for Peru. The Peruvian economy continues facing the challenge of recovering foreign private investment. This economic environment represents a challenging scenario mainly for Credicorp’s banking business.
In the middle of a scenario of still low loan growth, we will continue to roll out our strategy to strengthen risk management in Retail Banking segments. We will focus on improving our clients’ experience through different points of access and in particular, by improving and innovating our digital banking venue. As such, we will continue to seek an adequate balance between market share, profitability and operating efficiency.
In our microlending business, we will continue to consolidate and improve the profitability of the new Mibanco. We will review segmentation to fine-tune our value proposals and align them with the needs of each segment; optimizing commercial models, risk models and collections. Also, we will on strengthen the institutionalization of our organizational culture, which is the main pillar of our management model.
In the insurance business we expect to continue strengthening the bancassurance strategy to take advantage of synergies that can be developed in the group. In 2018, we will improve the efficiency with which we use our resources, thanks to the merger between Pacifico Vida and Pacífico Seguros Generales, to improve client capture and retention. To accomplish this, we will focus on deploying digital innovation through different channels and products.
| 185 |
In 2018, the strategy of the pension fund business will continue to focus on improving the public’s perception of this business and its credibility. Given that we won the third tender for new affiliates to the private pension system, we will need to improve operating efficiency to maintain the profitability levels that we have reported over the last few years. Our objective is to strengthen long-term sustainability and our strategy by optimizing risk management; rolling out innovation in our digital channels; and strengthening client retention levels.
On the investment banking front, we will continue to consolidate our position as the best financial advisory service in Peru, Chile and Colombia. We will strengthen our regional offer for equity management services and will complement our range of joint products, services and operations with ASB while continuing to develop our Corporate Finance businesses in Colombia and our alternative funds at the regional level.
For further detail, see “Item 4 Information on the Company - 4.B Business Overview – (2) Strategy”, and “Item 3. Key Information - 3.D Risk Factors” and the cautionary statement regarding forward looking information.
| 5. E | Off-Balance Sheet Arrangements |
We record various contractual obligations as liabilities in our financial statements. We do not recognize other contractual arrangements, such as off-balance-sheet exposures, as liabilities in our financial statements. These other contractual arrangements are required to be registered in off-balance-sheet accounts. We enter into these off-balance-sheet arrangements in the ordinary course of business to provide support to our clients and to hedge risks in our balance sheet, including through use of guarantees, letters of credit, derivatives and swaps.
The following table reflects our off-balance sheet arrangements as of December 31, 2015, 2016 and 2017:
| Year ended December 31, | ||||||||||||
| 2015 | 2016 | 2017 | ||||||||||
| (Soles in thousand) | ||||||||||||
| Off-balance-sheet exposure | ||||||||||||
| Guarantees and stand-by letters | 17,415,674 | 18,000,311 | 17,688,087 | |||||||||
| Import and export letters of credit | 1,589,006 | 1,831,674 | 1,681,472 | |||||||||
| Sub Total | 19,004,680 | 19,831,985 | 19,369,559 | |||||||||
| Responsibilities under credit line agreements | 23,002,691 | 25,812,963 | 23,553,406 | |||||||||
| Derivatives (notional amount) | ||||||||||||
| Forwards | 11,472,027 | 9,313,965 | 10,846,203 | |||||||||
| Currency swaps | 16,586,466 | 7,518,170 | 8,528,764 | |||||||||
| Options | 2,135,684 | 2,747,601 | 410,982 | |||||||||
| Interest rate swaps | 19,306,073 | 36,530,627 | 43,739,343 | |||||||||
| Cross currency swaps | 644,398 | 1,880,775 | 2,033,993 | |||||||||
| Cross currency swaps and interest rate swaps | 272,880 | 268,480 | 259,280 | |||||||||
| Sub Total | 50,417,528 | 58,259,618 | 65,818,565 | |||||||||
| Total | 92,424,899 | 103,904,566 | 108,741,530 | |||||||||
| 186 |
In the normal course of their business, our banking subsidiaries are parties to transactions with off-balance-sheet risk. These transactions expose them to additional credit risks relative to amounts recognized in the consolidated balance sheets.
Credit risk for off-balance sheet financial instruments is defined as the possibility of sustaining a loss because any other party to a financial instrument fails to perform in accordance with the terms of the contract. The exposures to losses are represented by the contractual amount specified in the related contracts. We apply the same credit policies in making commitments and conditional obligations as we do for on-balance sheet instruments (see Note 20 (a) of the Consolidated Financial Statements), including the requirement to obtain collateral when necessary. The collateral held varies, but may include deposits in financial institutions, securities or other assets. Many of the contingent transactions are expected to expire without any performance being required. Therefore the total committed amounts do not necessarily represent future cash requirements.
Credicorp has currency-forwards derivatives. Currency-forwards are commitments to buy or sell currency at a future date at a contracted price. Risk arises from the possibility that the counterparty to the transaction will not perform as agreed and from the changes in the prices of the underlying currencies. As of December 31, 2017 and 2016, the nominal amounts for forward currency purchase and sale agreements were approximately S/10,846.2 million and S/9,314.0 million, respectively, which in general have maturities of less than one year.
These agreements are entered into to satisfy client requirements and are recognized in the Consolidated Financial Statements at their fair value. As of December 31, 2017, the forward contracts net position is an over-bought of U.S. Dollars of approximately S/ 959.5 million compared to an over-sell of approximately S/1,183.3 million as of December 31, 2016.
| 187 |
Credicorp’s swap contracts include interest rate and currency swap contracts, as well as cross-currency swap contracts. Interest rate and currency swaps are derivatives contracts, where counterparties exchange variable interest rates for fixed interest rates or different currencies, respectively, in the terms and conditions established at the contract inception. The risk arises each time the projected level of the variable rate during the term of the contract is higher than the swap rate, as well as from non-compliance with contractual terms by one of the parties. As of December 31, 2017, the notional amount of open interest rate and currency swap contracts was approximately S/52,268.1 million, compared to approximately S/44,048.8 million as of December 31, 2016, see Note 12(b) to the Consolidated Financial Statements.
Cross-currency swap derivative contracts involve the exchange of interest payments based on two different currency principal balances and referenced interest rates. They generally also include the exchange of principal amounts at the start and end of the contract. As of December 31, 2017, the notional amount of cross-currency swap contracts were approximately S/2,293.3 million compared to approximately S/2,149.3 million as of December 31, 2016, see Note 12(b) to the Consolidated Financial Statements.
As of December 31, 2017, the fair values of the asset and liability forward-exchange contracts, options and interest rate and cross-currency swaps amounted approximately to S/701.8 million and S/636.8 million, respectively (compared to approximately S/942.6 million and S/673.0 million as of December 31, 2016) and are included under the caption “Other assets and other liabilities” of the consolidated balance sheets, respectively, see Note 12(b) to the Consolidated Financial Statements.
Responsibilities under credit line agreements include credit lines and other consumer loans facilities (credit card) and are cancelable upon notification to the client.
| 5. F | Tabular Disclosure of Contractual Obligations |
Credicorp enters into various contractual obligations that may require future cash payments. The following table summarizes our contractual obligations by remaining maturity as of December 31, 2017.
| Payments due by period | ||||||||||||||||||||
|
Total as of
December 31, 2017 |
Less than 1 year | 1–3 years | 3–5 years | More than 5 years | ||||||||||||||||
| (Soles in thousand) | ||||||||||||||||||||
| Borrowed funds | 5,264,545 | 3,375,294 | 1,359,725 | 111,297 | 418,229 | |||||||||||||||
| Promotional credit lines | 2,029,989 | 189,850 | 355,310 | 341,280 | 1,143,549 | |||||||||||||||
| Interbank funds | 659,737 | 659,737 | - | - | - | |||||||||||||||
| Time deposits | 30,184,314 | 23,888,537 | 3,478,314 | 702,962 | 2,114,501 | |||||||||||||||
| Operating lease obligations (1) | 682,681 | 145,256 | 227,957 | 159,833 | 149,635 | |||||||||||||||
| Total | 38,821,266 | 28,258,674 | 5,421,306 | 1,315,372 | 3,825,914 | |||||||||||||||
| (1) | Contractual obligations related to operating lease obligations include leasing of agencies, offices and ATM. |
| 188 |
Borrowed funds obtained include the obligation to comply with certain covenants which, in our management’s opinion, are being complied with as of the consolidated balance sheet dates. Some international funds and promotional credit lines include standard covenants related to the compliance with financial ratios, use of funds and other administrative matters. In our management’s opinion, these covenants do not limit our operations and we have fully complied with them as of the consolidated balance sheet dates. Our deposits and obligations are widely diversified and have no significant concentrations.
| ITEM 6. | DIRECTORS, SENIOR MANAGEMENT AND EMPLOYEES |
| 6. A | Directors and Senior Management |
(1) Board of Directors
The following table sets forth information about the persons that serve as our directors:
| Name | Position | Years served as a Director (1) | ||
| Dionisio Romero Paoletti | Chairman | 15 | ||
| Raimundo Morales Dasso | Vice Chairman | 10 | ||
| Fernando Fort Marie | Director | 36 | ||
| Juan Carlos Verme Giannonni | Director | 28 | ||
| Benedicto Cigüeñas Guevara | Director | 13 | ||
| Martin Perez Monteverde | Director | 4 | ||
| Luis Enrique Romero Belismelis | Director | 1 | ||
| Patricia Lizarraga Guthertz | Director | 1 |
(1) In Credicorp or BCP as of December 31, 2017.
Dionisio Romero Paoletti
Dionisio Romero Paoletti is the Chairman of the Board of Directors of Credicorp and Banco de Credito del Peru (BCP) since 2009. Also, he served as the Chief Executive Officer of Credicorp from 2009 until March 31 st 2018. Mr. Romero currently serves as the Executive Chairman of Credicorp. Mr. Romero has served as a board member of BCP since 2003 and was appointed Vice Chairman in 2008 and Chairman in 2009. He is also Chairman of the Board of other Credicorp’s subsidiaries such as Banco de Credito de Bolivia, Pacifico Compañia de Seguros y Reaseguros S.A., Credicorp Capital Ltd., and Grupo Credito S.A. Mr. Romero is Chairman of the Board of Alicorp S.A.A., (consumer products). Furthermore, he is member of the Board in other companies in different industries such as Ransa Comercial S.A. (Logistics), Trabajos Maritimos S.A.(port infrastructure), Palmas del Espino S.A. (palm oil) , Primax S.A. (energy), Agricola del Chira S.A. (sugar and ethanol), Inversiones Centenario S.A.A. (Real Estate), Hochschild Mining Inc. and, Sierra Metals Inc.(mining and exploration), among others. Mr. Romero P. has a Bachelor’s Degree in Economics from Brown University, USA and an MBA from Stanford University, USA.
| 189 |
Raimundo Morales Dasso – Independent Director
Mr. Morales has been the Vice-Chairman of the Board of Directors since 2009 and 2008, at Credicorp Ltd. and BCP, respectively, as well as of Pacifico Compañia de Seguros y Reaseguros. He joined BCP in 1980 and held different executive management positions, including Executive VP for Wholesale Banking and Credit and Risk Management. He became CEO of BCP in 1990 until 2008, when he retired. Mr. Morales was also Chairman of the Board and CEO of Atlantic Security Bank (subsidiary of Credicorp). He led the IPO for the listing of Credicorp’s shares on the NYSE in October 1995.
In addition to his vast knowledge of Credicorp, Mr. Morales brings his experience since 2008 as Director of companies in different industries, including food, cement, insurance and pension funds. He also has experience in a range of organizations, including the Association of Banks of Peru (ASBANC) and Association of AFPs, and was Vice-Chairman of the National Confederation of Private Business Institutions in Peru (CONFIEP).
Prior to joining Credicorp, Mr. Morales worked for 10 years at Wells Fargo Bank in its offices in San Francisco, Miami (USA), Sao Paulo in Brazil, Caracas (Venezuela), and Buenos Aires (Argentina). His last position at this organization was as Regional VP.
Mr. Morales has a bachelor’s degree in Economics and Administration from the Universidad del Pacifico (Peru) and holds an MBA from the Wharton Graduate School of Finance of the University of Pennsylvania (USA).
| 190 |
Fernando Fort Marie
Mr. Fort has been a Director of Credicorp Ltd. since 1999, and of BCP since 1979, with the exception of the years 1988 and 1989.
Mr. Fort is an attorney at law. A graduate of the Pontificia Universidad Catolica del Peru, he is a senior partner at Estudio Fort, Bertorini, Godoy & Pollari, which specializes in business advisory services. In the past he has given advice to firms with international presence such as Pepsico, Inc., International Finance Corporation (IFC), Alcatel, International Telephone & Telegraph (ITT), Sheraton Hotels, Volvo Corp., Sandvik, Procter & Gamble, Crown Cork, Chrysler Corp., etc.
He has been a member of the board of numerous private companies in Peru. He currently acts as Vice Chairman of the Board at ENEL Distribucion Peru S.A.A., a subsidiary of ENEL, Italy. He is also a board member of several other institutions.
Mr. Fort’s contribution to Credicorp and BCP is focused primarily on legal matters.
Juan Carlos Verme Giannonni – Independent Director
Mr. Verme is a private investor and entrepreneur. He has served on the Board of Directors of BCP since March 1990. Mr. Verme is Chairman of Inversiones Centenario, and a member of the Board of directors of other Peruvian companies in different sectors such as education, health and construction. He is the Chairman of the Board of Trustees of the Museo de Arte de Lima (MALI), and Trustee of Tate Americas Foundation from United Kingdom, as well as, Vice President of the Museo Reina Sofia Foundation from Madrid, Spain.
Benedicto Cigüeñas Guevara – Independent Director
Mr. Cigueñas has served as a Director of Credicorp Ltd, Banco de Credito del Peru – BCP and Mibanco from January 2014 to date, January 2005 to date and 2014 to date, respectively. From 1992 to 2004, Mr. Cigüeñas served as Chief Financial Officer at BCP and Credicorp. Previously, he was Peru’s Vice Minister of Economy and Finance from 1979 to 1981, and was also an executive at the Peruvian Central Bank- BCRP from 1966 to 1971. Mr. Cigüeñas was also CEO of Banco Continental (today BBVA Continental); Banco de la Nacion (State-owned banck); and Banco Exterior de los Andes y de España (Regional Office in Peru). Mr. Cigüeñas brings to the Board of Directors his deep knowledge of financial matters and macroeconomic policy as well as his extensive experience in Credicorp’s businesses.
Mr. Cigüeñas is an Economist from the Universidad Catolica del Peru and has a Master’s degree from Colegio de Mexico.
| 191 |
Martin Perez Monteverde
Mr. Perez has been a Director at Credicorp Ltd. since 2014 and of the Banco del Credito of Peru since 2014. He has more than 25 years of experience in the private sector as both General Manager and Director of leading financial and real estate companies in Peru, including Grupo Pacifico, Toyota, Mitsui & Co. Peru. Additionally, Mr. Perez has led institutions linked to the economic sector, including the Instituto Peruano de Economia (former Director), the Sociedad de Comercio Exterior del Peru (Director) and Asociacion inPeru (Director). He was also President of the Confederacion Nacional de Instituciones Empresariales Privadas, CONFIEP, from 2015-2017.
Mr. Perez has five years of experience in the public sector as a Congressman and Minister of Foreign Trade and Tourism (period 2006-2011). His contributions to the board reflect his rich experience in negotiation, advanced financial analysis, strategic planning and merger and acquisitions.
Mr. Perez has a degree in Business Administration, Marketing and Finance from the Universidad del Pacifico; a Diploma from the Programa de Alta Direccion of the Universidad de Piura; and has participated in the Wharton Management Congress USA at the University of Pennsylvania.
Luis Enrique Romero Belismelis
Mr. Romero B. has been a Director of Credicorp Ltd. since 2017 and of the Banco de Credito of Peru since 2009. He is also on the board of Pacifico Seguros and has been a loan officer at Atlantic Security Bank.
Mr. Romero has worked as Head of Finance and General Manager of different groups in Grupo Romero’s consumption and service segments. Currently, he is Chairman of the Board of the storage and logistics sector and port terminals and Vice Chairman of the Board of companies in the consumer, real estate, textile, industrial, commerce and service sectors.
Mr. Romero B. holds a Bachelor of Economics from Boston University (U.S.A.).
| 192 |
Patricia Lizarraga Guthertz - Independent Director
Ms. Patricia Lizarraga is director of Banco de Credito del Peru BCP y de Credicorp Ltd. Ms. Lizarraga is an experienced Wall Street executive with over 25 years working in international mergers & acquisitions, capital markets, private equity and valuation experience. She is the founder and Chief Executive Officer of Hypatia Capital Group, since 2007, and founder and major shareholder of family group Grupo del Ande. Ms. Lizarraga’s board experience includes serving as both President of the Board and Chair of the Audit Committee of non-profit organizations, as well as private company board experience. She served as President of the Privatization Committee of Toll Roads of Peru. Ms. Lizarraga received her Bachelor of Arts degree from Yale University and her Master’s of Business Administration from Harvard Business School.
Codan Services serves as Corporate Secretary. Ms. Miriam Böttger is the Deputy General Secretary.
(2) Senior Management
Credicorp believes that a unified financial group with a coordinated strategy is best able to take advantage of growth in the Peruvian economy and achieve synergies from cross-selling financial services and products (e.g., through BCP’s extensive branch network). Pursuant to Credicorp’s Bye-laws, the Board of Directors has the power to delegate its authority to oversee the day-to-day management of the company to one or more directors or officers.
The following table sets forth the name, position and term of service for each member of our Senior Management:
| Position (1) | Name | Entity | ||
| Executive Chairman | Dionisio Romero P. | Credicorp | ||
| Chief Executive Officer | Walter Bayly | Credicorp | ||
| Deputy CEO (LOB Universal Banking) | Gianfranco Ferrari | Credicorp | ||
| Deputy CEO (LOB Insurance & Pension Funds) | Alvaro Correa | Credicorp | ||
| Chief Risk Officer | Reynaldo Llosa | Credicorp | ||
| Chief Financial Officer | Cesar Rios | Credicorp | ||
| Head of Investment Banking & Wealth Management | Christian Laub | Credicorp | ||
| Head of Microfinance | Javier Ichazo | Credicorp | ||
| Head of Wholesale Banking at BCP | Diego Cavero | BCP | ||
| Head of Retail Banking at BCP | Percy Urteaga | BCP | ||
| CEO of Prima AFP | Renzo Ricci | Prima AFP | ||
| CEO of ASHC | Juan Inchaustegui | ASHC | ||
| CEO of BCP Bolivia | Marcelo Trigo | BCP Bolivia | ||
| Chief Corporate Audit Officer | Jose Esposito | Credicorp | ||
| Chief of Human Resources Officer | Bernardo Sambra | Credicorp | ||
| Chief Compliance Officer | Barbara Falero | Credicorp | ||
| Head of Legal | Guillermo Morales | Credicorp | ||
| Head of Talent Management | Ursula Alvarez | Credicorp | ||
| Head of Strategy and Business Development | Marco Roca | Credicorp | ||
| Head of Corporate Affairs | Enrique Pasquel | Credicorp |
| (1) | In Credicorp or in any subsidiary as of December 31, 2017. |
| 193 |
Walter Bayly
Mr. Bayly has been appointed as the CEO of Credicorp Ltd. since April 2018. Previously he was the CEO of BCP and COO of Credicorp Ltd. since April 2008. Currently he is the Chairman of the Board of Mibanco, Prima AFP, and Credicorp Capital. He is also a member of the Board of other Credicorp’s subsidiaries such as BCP Bolivia, Atlantic Security Bank and Pacifico Cia. de Seguros y Reaseguros.
Previously, Mr. Bayly was the CFO of BCP and held other management positions in Wholesale Banking, Investment Banking and Systems & Reengineering groups. Mr. Bayly joined BCP in 1993, after three years at Casa Bolsa Mexico where he was Partner and Managing Director in Corporate Finance. Prior to that, for ten years he worked at Citibank in Lima, New York, Mexico, and Caracas, primarily in corporate finance and loan syndications.
Mr. Bayly is currently member of the Board of Directors of The Institute of International Finance, Peruvian American Association, Inversiones Centenario, and the Fondo de Seguro de Depositos (Deposit Insurance Fund for the Peruvian Banking System), and Member of the Board of Advisors for Universidad del Pacifico and the Peruvian Chapter of Universidad Tecnologica de Monterrey.
Mr. Bayly received a Bachelor’s degree in Business Administration from Universidad del Pacifico in Lima, Peru, and an MBA from Arthur D. Little Management Education Institute in Cambridge, Massachusetts.
| 194 |
Gianfranco Ferrari
Mr. Ferrari has been appointed as Deputy CEO & Head of Universal Banking of Credicorp Ltd. and as CEO of BCP since April 2018. He has worked at Credicorp Ltd. since 1995. Mr. Ferrari has an extensive and diverse experience after holding strategic roles such as Head of Corporate Banking & Corporate Finance, Head of Retail Banking & Wealth Management at BCP, and CEO of BCP Bolivia from 2005 to 2008. He led the acquisition of Edyficar in 2009 and Mibanco in 2014. In 2015, he started leading the Digital Transformation Strategy. He has also been the Vice-Chairman of the Board of Directors at Mibanco, and member of the Board of BCP Bolivia.
Mr. Ferrari holds a degree in Business Administration from Universidad del Pacifico, and has an MBA from Kellogg Graduate School of Management, Northwestern University.
Alvaro Correa
Mr. Correa has been appointed as Deputy CEO of Credicorp Ltd. and the Head of Pension Funds since April 2018. Furthermore, Mr. Correa oversees the insurance, pension funds, investment banking, asset & wealth management businesses. Mr. Correa also serves as the CEO of Grupo Pacifico since 2013.
Mr. Correa joined BCP in 1997, where he held different management positions in Risk and IT at BCP, CEO of Atlantic Security Bank and BCP’s Miami Agency. From April 2008 to September 2013, Mr. Correa was the CFO of Credicorp Ltd. and BCP. Currently, he is member of the Board at Prima AFP and Credicorp Capital Ltd.
Mr. Correa holds an Industrial Engineering degree from the Pontificia Universidad Catolica del Peru and an MBA from Harvard Business School.
Reynaldo Llosa
Mr. Llosa is the Chief Risk Officer of Credicorp Ltd. and BCP since January 2012. Previously, Mr. Llosa held different positions at BCP as Head of Risk, Head of Middle-Market Banking and Head of Corporate Banking. Currently, he is member of the Board at Mibanco.
Mr. Llosa holds a Bachelor’s degree in Business Administration from St. Mary's University, San Antonio, Texas, USA, and an MBA with specialization in Finance from Northwestern University (J.L. Kellogg Graduate School of Management), Chicago, Illinois, USA.
| 195 |
Cesar Rios
Mr. Rios has been appointed as Chief Financial Officer of Credicorp and BCP since April 2018. He has worked at Credicorp since 1993, when he joined as an Associate in Corporate Finance. In 1997, he was appointed CFO and COO of Banco Capital in Salvador, after Credicorp acquired this institution. In 2003, Mr. Rios re-joined BCP, where he worked in strategic roles such as Head of Credit and Operating Risk in the Risk Management Unit; Head of Collections for Retail Banking; and Head of Corporate Strategy, which includes corporate strategy, internal consulting, M&A, and business incubation. In 2013, he became Head of Financial Planning and Control at BCP. Currently, he is member of the Board at Mibanco.
Mr. Rios holds a Bachelor’s Degree in Engineering from Pontificia Universidad Catolica in Peru; a Master´s Degree from ESAN Escuela de Administracion de Negocios para Graduados in Peru; and an MBA from the Massachusetts Institute of Technology Sloan Fellows Program in the United States.
Christian Laub
Mr. Laub is the Head of Investment Banking & Wealth Management of Credicorp Ltd. since April 2018, and the CEO of Credicorp Capital, Credicorp’s Regional Investment Bank. Previously, Mr. Laub was the Head of the Corporate and Investment Banking Division, Corporate Finance Area and Capital Markets Area at BCP. Mr. Laub has also been CEO of Credifondo SAF and was an Associate at Atlantic Security Bank’s Asset Management Group.
Additionally, Mr. Laub has been President of the Board of Directors at the Lima Stock Exchange from 2013 to 2016.
Mr. Laub holds an Economics degree from Universidad del Pacifico and an MBA from Harvard Business School.
Javier Ichazo
Mr. Ichazo has been the Head of Microfinance of Credicorp Ltd. since April 2018 and the CEO of Mibanco since October 2017. He began his career at BCP in 1996 and held different positions in various regions of Peru. In addition to his extensive knowledge in banking and finance. Mr. Ichazo brings his experience as a Business Manager from 2004 to 2017 at BCP. Mr. Ichazo is Chairman of the Board of Edyficar SAS (Encumbra) and Vice Chairman of the Board of ASOMIF (Association of microfinance institutions of Peru).
| 196 |
Mr. Ichazo has a bachelor’s degree in Economics and Administration from the University of Piura (Peru) and holds an MBA from the School of Management of the University of Piura.
Diego Cavero
Mr. Cavero has been the Head of Wholesale Banking at BCP since April 2018 and was the Head of the Efficiency, Administration and Processes Division from October 2016 to March 2018. He started working at Credicorp Ltd. since 1994. His extensive experience in the organization includes expertise in different strategic and business areas such as Corporate Banking, International Business, Cash Management Products and Services, Efficiency, Customer Service, Operations, Retail Banking and Procurement. Mr. Cavero has served in several executive positions such as Head of Corporate Banking which comprises the areas of Corporate Banking, International Businesses, Cash Management Services, and Leasing. He was also CEO of BCP Bolivia for almost four years. In 2013 he started leading from inception BCP’s Efficiency Programme. Furthermore, he has been a member of the Board at BCP Bolivia.
Mr. Cavero holds a Bachelor’s degree in Business Administration from Universidad de Lima, Peru, and an MBA from the University of Texas at Austin, in the United States.
Percy Urteaga
Mr. Urteaga has been the Head of Retail Banking at BCP since October 2017. Mr. Urteaga has worked at Credicorp Ltd. since 1998, holding various positions such as Head of Strategic Planning & Business Development of Wholesale Banking at BCP, CFO of BCP Bolivia, and Head of Strategic Planning of Retail Banking at BCP. In 2012 he was appointed as Vice-Chairman of Edyficar’s Board of Directors, and from 2014 to 2017 he was the CEO of Mibanco. Additionally, he serves as the Vice-Chairman of the Board of the Association of Microlending Companies of Peru (Asomif).
Mr. Urteaga holds a degree in Civil Engineering from Universidad Nacional de Ingenieria, and has an MBA from IESE Business School, Universidad de Navarra.
Renzo Ricci
Mr. Ricci has been the CEO of Prima AFP since May 2012. He has a wide experience in the Finance sector having worked in BCP as Financial Planning Manager, Manager of Consumer Banking and Manager of a Commercial Area. In 2008, he was appointed Chief Commercial Officer in Prima AFP
Mr. Ricci is an Industrial Engineer from Pontificia Universidad Catolica del Peru and has an MBA from ESAN Business School for Graduates. Mr. Ricci also holds a Master degree in Finance from the London Business School in United Kingdom.
| 197 |
Juan Inchaustegui
Mr. Inchaustegui has been the CEO of Atlantic Security Bank (ASB), a wholly owned subsidiary of Credicorp incorporated in the Cayman Islands, since 2012. Mr. Inchaustegui started working at BCP in 2000 holding various positions such as Vicepresident of Corporate Finance and Senior Vicepresident of Risk Management. Prior to joining Credicorp, Mr. Inchaustegui worked in Banco Internacional Del Peru - Interbank in various teams including Project Financing and Leasing and Investment Banking, and also in IBM Andean and Systems Engineer Peru International Mission.
Mr. Inchaustegui has a Bachelor of Science in Civil Engineering from Pontificia Universidad Catolica Del Peru and an MBA from The University of Texas.
Marcelo Trigo
Mr. Trigo has been the CEO of BCP Bolivia (BCB) since March 2015. He joined Credicorp Ltd. in 2002 and has served in different positions within BCB including Corporate Banking head in La Paz, Regional Manager of Sucre and Potosi, Wholesale Banking Risk Manager in Bolivia; and Head of the Risk Division in Bolivia. Additionally, he held a position as Consumer Risk manager in BCP.
Prior to joining Credicorp Ltd., he worked at Citigroup and CN Investments. Mr. Trigo is currently Vice President of the Bolivian Banking Association and member of different Boards including Credifondo, Credibolsa, Inversiones Credicorp and Crediseguro.
Mr. Trigo holds a BA in Economics from the University of Notre Dame in Indiana, USA and an MBA from McGill University in Montreal, Canada.
| 198 |
Jose Esposito
Mr. Esposito has been the Chief Corporate Audit Officer of Credicorp Ltd. since January 2010. He is Member of the Financial Services Guidance Committee Board of IIA Global. Mr. Esposito has served as Chairman of the Committee of Internal Auditors of the Latin American Federation of Banks (FELABAN) and Chairman of the Committee of Internal Auditors of the Peruvian Association of Banks (ASBANC). Lecturer in the Master of Finance program at the Universidad del Pacifico. Since 1996 he began working with Credicorp Ltd. through its different subsidiaries and his last position prior to leading the Audit Division at Credicorp Ltd. was at Pacifico Peruano Suiza Compania de Seguros y Reaseguros S.A., where he was CFO and the Controller’s Officer. Also, he was Vice Chairman of the Board of Directors of Pacifico Salud EPS S.A., Vice Chairman and Director of the Board of the Lima Stock Exchange, Director of Cavali ICLV S.A. and Chairman of the Board and General Manager of Credibolsa SAB S.A.
Mr. Esposito holds an Economics degree from Universidad del Pacifico, Lima; Master of Arts in Economics from the University of Wisconsin- Milwaukee; Certified Internal Auditor (CIA) and Certified in Risk Management Assurance (CRMA) by the Institute of Internal Auditors Global (IIA); Certified in Risk and Information Systems Control (CRISC) by ISACA; Anti- Money Laundering Certified Associate (AML/CA) from the Florida International Bankers Association and Florida International University.
Bernardo Sambra
Mr. Sambra has been the Chief Human Resources Officer of Credicorp Ltd. since April 2018 and Chief Human Resources Officer at BCP since August 2010. He joined BCP in April 1999 as Manager of Electronic Cash Management Solutions in the Wholesale Banking Division.
Prior to joining Credicorp Ltd., Mr. Sambra worked for 9 years at Royal Dutch Shell Group. His last position at this organization was Head of Business Framework Implementation.
In addition to his responsibilities Mr. Sambra has been acting as the President of the Human Resources Committee at Association of Banks of Peru (ASBANC), Director of the Peruvian Association of Human Resources (APERHU) and Director of Patronato BCP.
Mr. Sambra has a degree in Business Administration from Universidad de Lima, with a Master´s degree in Finance from Universidad del Pacifico and Human Resources specialization from Ross School of Business at the University of Michigan, as well as from Stanford University Business School, London Business School and Harvard Business School.
Barbara Falero
Ms. Falero has been the Chief Compliance and Ethics Officer at Credicorp Ltd. and BCP since February 2008 reporting directly to Credicorp Ltd. Board. Before coming to Peru, Ms. Falero was the Compliance Officer and Vice President of BCP Miami Agency and prior to that for six years, she worked as a regulator for the Federal Reserve Bank of Atlanta in supervision and regulation of international banks.
Ms. Falero has held various positions including being the community reinvestment Officer at BAC Florida Bank, Miami, Florida.
Ms. Falero has a Bachelor of Finance from Florida International University and a Master of Business Administration from St. Thomas University, Miami, FL. Ms. Falero has been president of the Committee of Compliance Officers of ASBANC (Association of Banks in Peru) and during a three-year period, was a Member of the Advisory Committee of the Florida International Bankers Association (FIBA).
| 199 |
Guillermo Morales
Mr. Morales has been the Head of Legal at Credicorp Ltd. since April 2018 and Head of Legal Division of BCP since January 2010. Previously, Mr. Morales was Manager of the Legal Advisory Area at BCP del Peru from September 2007 to December 2009, Legal Manager at Grupo Santander Peru SA from January 2003 to July 2007 and Legal Manager at Banco Santander Central Hispano Peru from April 2000 to December 2002. He has been Director of Edelnor SAA, Red Electrica del Sur (Redesur) and Universia Peru SA.
Mr. Morales holds a Lawyer degree from the Pontificia Universidad Catolica del Peru and a Master of Laws (LL.M) from the University of Texas at Austin.
Ursula Alvarez
Ms. Alvarez has been the Head of Talent Management since 2009. She began working at BCP in 2006 as Manager of Selection in Human Development Management. Ms. Alvarez has a Bachelor of Psychology from the University of Lima and a Master of Development from the Universidad de los Andes in Bogota.
Marco Roca
Mr. Roca is the Head of Strategy and Business Development for Credicorp Ltd., his responsibilities includes corporate strategy, internal consulting, M&A, and business incubation. Prior to joining Credicorp Ltd. in 2011, Mr. Roca spent over a decade working in the USA and Brazil for corporations such as McKinsey & Co, Unibanco (now Itau) and TAG (Consultancy boutique for Microsoft). Mr. Roca broad professional experience cut across consulting, corporate and line management roles.
Mr. Roca holds a B.S. in Computer Science Engineering from Pontifical Catholic University in Peru; an MBA from Marriott School, Brigham Young University in USA and M&A Certificates from Harvard and Wharton Business Schools.
| 200 |
Enrique Pasquel
Mr. Pasquel has been the Head of Corporate Affairs at Credicorp Ltd. since April 2018 and Head of Corporate Affairs of BCP since 2017. Previously, between 2011 and 2017, he worked at El Comercio newspaper, where he held the positions of Deputy Opinion Editor, Politics Editor and Deputy Editor in Chief.
Before his career as a journalist he worked as an attorney in Indecopi (the Peruvian antitrust agency), where he held the positions of Commissioner of the Bureaucratic Barriers Commission and Technical Secretary of the Competition Chamber.
Mr. Pasquel holds a lawyer degree from Pontificia Universidad Catolica del Peru and a Master of Laws degree from Yale Law School.
| 6. B | Compensation |
The following section contains disclosures of compensation to the members of the Board of Directors and to the members of Senior Management for 2015, 2016 and 2017. The table below shows a summary of the compensation to the members of the aforementioned governing bodies at the end of 2015, 2016 and 2017:
| At December 31, | ||||||||||||
| 2015 | 2016 | 2017 | ||||||||||
| (Soles in thousands) | ||||||||||||
| Director’s compensation | 6,692 | 7,351 | 7,105 | |||||||||
| Senior Management Compensation | ||||||||||||
| i) Remuneration | 37,255 | 43,177 | 41,211 | |||||||||
| ii) Stock awards vested (*) | 22,295 | 30,122 | 32,142 | |||||||||
| Total (**) | 66,242 | 80,650 | 80,458 | |||||||||
(*) Included the related income taxes assumed by the Group. The amounts correspond to the expenses accrued in the period for the services rendered.
(**)Revised figures for 2015 and 2016 reflect the expansion of positions considered to be part of Senior Management as of [2017] and the addition of compensation paid to individuals holding such positions in 2015 and 2016.
| 201 |
We do not disclose to our shareholders, or otherwise make available to the public, information as to the compensation on an individual basis of any member of the Board or of the Senior Management.
Director’s Compensation
At the General Shareholders’ Meeting on March 31, 2015; March 31, 2016 and March 28, 2017, the annual fixed amount of compensation each director receives in his capacity as a board member was approved. These fees are paid on a monthly basis according to the participation in each of the Board sessions.
For further detail about the compensation of Directors, see Item 6. Directors, Senior Management and Employees – 6.C Board Practices
Senior Management Compensation
Compensation to Senior Management can be classified into two different types:
| a) | Remuneration |
The remuneration scheme for members of our Senior Management comprises a fixed remuneration and a variable remuneration. In turn, Variable remuneration has two different components: i) a legal component, which all employees receive based on the Net Income of the company for each fiscal year according to Peruvian Law and ii) an incentive-based component, that is determined based on the achievement of objectives and goals established in the year. These remunerations are approved by the Corporate Compensation Committee.
| b) | Stock awards vested |
In March of each year, the Group grants its own shares to members of its Senior Management, as part of the long-term retention plan for these employees. The awarded shares are redeemed in the three following years for up to 33.3% of the shares granted in each of the three previous years. The Group assumes the payment of the related income-tax on behalf of its employees, which corresponds to 30% of the benefit.
During 2017, 2016 and 2015, Credicorp has granted approximately 46,638; 59,577 and 51,884 Credicorp shares, respectively, for the members of its Senior Management. As of December 31, 2017, 2016 and 2015 there were 103,651; 111,612 and 101,502 shares non-vested, respectively.
| 202 |
| 6. C | Board Practices |
Credicorp’s management is the responsibility of its Board of Directors, which, pursuant to Credicorp’s Bye-laws, is composed of eight members. Directors may be, but are not required to be, shareholders. Directors are elected, and their remuneration is determined, at the Annual General Meeting of Shareholders. Directors hold office for three-year terms. Shareholders elected Directors, in the Annual General Meeting of Shareholders held on March 31, 2017, who will hold office until the Annual General Meeting of Shareholders in 2020 (see section “Item 6. Directors, Senior Management and Employees - 6.A Directors and Senior Management”).
Our directors receive no benefits other than the remuneration authorized at the Annual General Meeting of Shareholders, and they do not have any benefits that could be enjoyed at the termination of their service terms. The conditions approved by the Annual General Meetings of Shareholders are presented below:
• To pay an annual remuneration of US$130,000 to each Director provided he/she is not also a director on the Board of Directors of Banco de Credito del Peru (BCP).
• To pay an additional annual remuneration of US$40,000 to each Director who is a member of the Audit Committee and to each Director of Credicorp’s subsidiaries who is appointed as an advisor to the Audit Committee of Credicorp.
• To pay a remuneration of US$1,500 for each session attended by each Director serving on the Executive Committee of Credicorp, provided that this additional compensation will not be paid to Directors who serve on the Executive Committee of BCP.
Pursuant to Credicorp’s Bye-laws, the required quorum for business to take place during a Board meeting shall be a simple majority of the directors of the Company.
The Board of Directors has the power to appoint any person as a director to fill a vacancy on the Board as a result of the death, disability, disqualification or resignation of any director for the remainder of such director’s term. A resolution in writing signed by all directors shall be as valid as if it had been passed at a meeting duly called and constituted.
Credicorp’s Board of Directors has established the following corporate Committees:
| 203 |

| (1) | The Executive Committee was created on March 28, 2012. |
| (2) | The Audit Committee was created on October 31, 2002. |
| (3) | The Corporate Governance Committee was created on June 23, 2010. |
| (4) | The Compensation Committee was created on January 25, 2012. |
| (5) | The Nominations Committee was created on March 28, 2012. |
| (6) | The Risk Committee was created on March 28, 2012. |
The Board of Directors, acting on the recommendation of the Chairman, shall decide on the appointment, ratification or removal of committee members. Directors who are members of committees are appointed to an initial term of up to three-years and maintain such appointments only while a member of the Board. Non-director members of the committees shall maintain such appointment only while he or she is an employee of the Company. Each committee shall have a charter approved by the committee itself and shall designate a chair among its members.
With effect from April 2017, the Peruvian Superintendencia de Banca y Seguros y Administradoras Privadas de Fondos de Pensiones, the Peruvian financial regulator, through its Resolution SBS No. 272-2017, requires that risk committees of institutions subject to the regulation must be composed of at least three members and its chairperson shall not chair any other committee, with which the risk committee could have a conflict of interest. In the spirit of Resolution SBS No. 272-2017, Mr. Benedicto Cigüenas was elected chairman of the Risk Committee, replacing Mr. Raimundo Morales who continues as chairman of the Audit Committee.
| 204 |
(1) Executive Committee
Credicorp’s Executive Committee is responsible for responding to management’s queries on business or operations that require guidance from the Board; making urgent decisions that correspond to the Board by submitting these decisions for ratification at its next session; and making decisions on other specific matters that the Board has delegated to it.
The Executive Committee is composed of six directors and its number may be modified by agreement of the Board. The Chairman and Vice Chairman of the Board must be members of the committee. The current members of the Executive Committee are: Dionisio Romero Paoletti (Chairman, non-independent), Raimundo Morales Dasso (Vice Chairman, independent), Fernando Fort Marie (non-independent), Martin Perez Monteverde (non-independent), Juan Carlos Verme Giannoni (independent) and Benedicto Cigüeñas Guevara (independent).
(2) Audit Committee
Credicorp’s Audit Committee is responsible for assisting in the recommendation of independent external auditors to be appointed at the Annual General Shareholders’ Meeting and reviewing the scope and results of internal and external audits, as well as any follow-up actions. The Audit Committee also (i) reviews compliance with our system of internal control and financial controls, (ii) reviews our annual financial statements before their presentation to regulatory bodies, (iii) oversees the integrity of financial statements and the integrity of the preparation of audits, (iv) oversees compliance with applicable law and regulations, and (v) establishes procedures for the receipt, retention and treatment of complaints regarding accounting, internal accounting controls, auditing matters, fraud and ethics, through Credicorp’s Complaint System. The current members of the Audit Committee are: Mr. Raimundo Morales Dasso (Chairman since July 2011), Ms. Patricia Lizarraga Guthertz (independent, member of the Audit Committee since May 2017 replacing Mr. Juan Carlos Verme Giannoni after finishing his term) and Mr. Benedicto Cigüeñas Guevara (financial expert, independent). In December 2016, according to new best practices, the Audit Committee appointed Mr. Ricardo Bustamante Gonzalez, former BCP´s Technological and Digital Strategy Manager, as his Information Technology Advisor.
The Board of Directors has also assigned the Audit Committee responsibility for overseeing the audit committee of all Credicorp subsidiaries, where permitted by local regulations. Credicorp’s Audit Committee therefore functions as the statutory audit committee of all Credicorp subsidiaries, except Credicorp Capital Holding Colombia (Colombia) and Credicorp Capital Holding Chile (Chile), which are in the process of adopting corporate policies and procedures that conform to their respective local regulations, and Banco de Credito de Bolivia, which has special audit committee requirements set by the local banking superintendent. Nevertheless, the Audit Committee receives periodic information from the chief audit executive of all Credicorp’s subsidiaries, including Credicorp Capital Holding Colombia, Credicorp Capital Holding Chile and Banco de Credito de Bolivia. Therefore, in practice, Credicorp’s Audit Committee oversees all of its subsidiaries´ systems of internal control. During 2017, Audit Committee held thirteen meetings.
| 205 |
(3) Corporate Governance Committee
Credicorp’s Corporate Governance Committee is responsible for (i) proposing to the Board of Directors good corporate governance practices to be implemented throughout the Company; (ii) assessing the adequacy of the corporate governance policies adopted by the Company and conforming these policies to current best practices; and (iii) deciding and/or resolving cases of serious misconduct in compliance with corporate governance policies and cases of conflicts of interest or ethics conflicts of Directors and senior executives.
The Committee is composed of four Directors of Credicorp or its subsidiaries. At least one member should be independent. The current members of the Corporate Governance Committee are: Dionisio Romero Paoletti (Chairman, non-independent); Juan Carlos Verme Giannoni (independent), Benedicto Cigüeñas Guevara (independent) and Eduardo Hochschild (independent Director of BCP).
(4) Compensation Committee
Credicorp’s Compensation Committee is responsible for establishing the remuneration policy for Credicorp and its subsidiaries; approving the remuneration and compensation of the principal executives and managers of Credicorp and its subsidiaries; and recommending to the Board of Directors, for submission to the General Shareholders’ Meeting, basic compensation guidelines and levels of compensation for the members of the board of directors and committees of Credicorp and its subsidiaries. It is also responsible for approving any service contracts between the directors and their companies, and Credicorp and its subsidiaries.
The committee consists of three directors of Credicorp or its subsidiaries and Credicorp’s COO (who is not a member of the Board of Directors). The current members of the Compensation Committee who are directors are: Dionisio Romero Paoletti (Chairman, non-independent), Raimundo Morales Dasso (independent) and Juan Carlos Verme Giannoni (independent).
| 206 |
Credicorp does not have a fully independent compensation (remuneration) committee. When the committee was created in January 2012, the Board of Directors determined that the most important criteria in selecting directors to serve on the committee were both deep knowledge of the organization and its people and also the leadership and continuity provided by senior management. The Board of Directors believes that each individual on the committee can and do make quality and independent judgments in the best interest of Credicorp on all relevant issues and that the existing membership will best accomplish the goals of the committee.
(5) Nominations Committee
Credicorp’s Nominations Committee is responsible for (i) proposing to the Board of Directors the selection criteria for director nominees; (ii) selecting and recommending nominees to the Board of Directors and to the shareholders at the Shareholders’ Annual General Meeting; and (iii) recommending nominees to fill vacancies in the Board of Directors. This applies for Credicorp and all of its subsidiaries.
The committee consists of three Directors. The current members of the Nominations Committee are: Dionisio Romero Paoletti (Chairman, non-independent), Raimundo Morales Dasso (independent) and Martin Perez Monteverde (non-independent).
(6) Risk Committee
Credicorp’s Risk Committee is responsible for establishing, periodically evaluating and reporting to the Board of Directors the guidelines and policies for the integrated risk management of Credicorp and its subsidiaries. It is also responsible for (i) proposing to the Board of Directors the risk appetite and exposure levels that Credicorp assumes in developing its business; (ii) approving all new strategic business and product initiatives that may alter the risk profile of Credicorp or its subsidiaries, consistent with the policies approved by the Company; and (iii) establishing specialized subcommittees to manage the different types of risks faced by Credicorp.
The committee consists of three Directors of Credicorp or its subsidiaries and four executive officers of Credicorp or its subsidiaries. The current members of the Risk Committee are: Benedicto Cigüeñas Guevara (Chairman, independent), Dionisio Romero Paoletti (Chairman of the Board of Directors, non-independent) and Raimundo Morales Dasso (independent).
| 207 |
| 6. D | Employees |
As of December 31, 2017, Credicorp had 33,636 employees, distributed as set forth in the following table:
| At December 31,(*) | ||||||||||||
| 2015 | 2016 | 2017 | ||||||||||
| BCP (1) | 17,068 | 16,518 | 16,839 | |||||||||
| ICBSA (2) | 1,708 | 1,772 | 1,794 | |||||||||
| Mibanco | 10,164 | 10,202 | 10,061 | |||||||||
| Grupo Pacifico (3) | 2,567 | 2,588 | 2,770 | |||||||||
| ASB | 116 | 113 | 129 | |||||||||
| Prima AFP | 666 | 697 | 651 | |||||||||
| Credicorp Capital Peru (4) | 1034 | 1,042 | 1,078 | |||||||||
| Credicorp Capital Securities | 12 | 11 | 11 | |||||||||
| Edyficar SAS (5) | 322 | 367 | 378 | |||||||||
| Total Credicorp | 33,657 | 33,310 | 33,711 | |||||||||
| * | Includes full-time and part-time employees. |
| (1) | BCP includes BCP Miami Agency, BCP Panamá Agency. |
| (2) | ICBSA includes BCP Bolivia, Credibolsa, Credifondo and Crediseguro. |
| (3) | Does not include the employees of the acquired of private hospitals. Pacifico EPS’s employees are not included since 2015. |
| (4) | Includes Credicorp Capital Bolsa, Credicorp Capital Fondos, Credicorp Capital Servicios Financieros, Credicorp Capital Colombia and Inversiones IMT. |
| (5) | Started operations in June 2013. Comercial name Encumbra. |
All bank employees in Peru are given the option of belonging to an employee union. In July 2013, we were informed of the establishment of the union of BCP employees, which represents 0.17% of the company´s employees. The last strike by union employees occurred in 1991 and did not interfere with our operations. Nowadays, the employee union represents 0.33% of the total employees of BCP.
| 6. E | Share Ownership |
The following governing bodies are beneficial owners of common shares of Credicorp Ltd. (as the term “beneficial owner” is defined in Form 20-F).
| i) | Board of Directors |
| Director | Share Ownership | Percentage | |||||||
| Dionisio Romero Paoletti | 13,230,530 | (1) | 14.02 | % | |||||
| Juan Carlos Verme G. | 1,420,977 | (2) | 1.51 | % | |||||
| Luis Enrique Romero B. | 9,456,940 | (3) | 10.02 | % | (3) | ||||
| Raimundo Morales D. | Less than 1 | % | |||||||
| Benedicto Cigüeñas G. | - | - | |||||||
| Fernando Fort M. | - | - | |||||||
| Martin Perez M. | - | - | |||||||
| Patricia Lizarraga G. | - | - | |||||||
(1) Includes shares beneficially owned by the Romero family (Mr. Dionisio Romero Paoletti and his family or companies owned or controlled by them)
(2) Includes shares beneficially owned by Mr. Juan Carlos Verme or entities owned or controlled by him.
(3) Shares owned by Mr. Luis Romero B. are also included under the Romero Family shares disclosed with respect to Mr. Dionisio Romero Paoletti, who votes the shares under power of attorney. See ITEM 7. Major Shareholders and related party transactions.
| 208 |
| ii) | Senior Management |
Excluding Mr. Dionisio Romero Paoletti, our Executive Chairman and whose share ownership is set forth above, members of our senior management, as defined in ITEM 6. DIRECTORS, SENIOR MANAGEMENT AND EMPLOYEES own 354,673 Credicorp shares, which represents 0.4% of our total outstanding shares. While each member of our senior management owns Credicorp shares, none (other than our Executive Chairman) owns more than 1% of our total outstanding shares."
| ITEM 7. | MAJOR SHAREHOLDERS AND RELATED PARTY TRANSACTIONS |
| 7. A | Major Shareholders |
As of December 31, 2017, Credicorp had issued 94,382,317 common shares, of which 14,620,846 were held by ASHC. Under Bermuda law, ASHC has the right to vote the common shares it owns. In order to restructure long term holdings, substantially all of our common shares held by BCP and Grupo Pacifico were transferred to ASHC in April 2004.
The table below provides details about the percentage of Credicorp’s common shares owned by holders of 5% or more of our total common shares, as of February 07, 2018.
| Owner | Common Shares |
Percent of
Class(1) |
||||||
| Atlantic Security Holding Corporation (2) | 14,620,846 | 15.49 | % | |||||
| Romero family (3) | 13,230,530 | 14.02 | % | |||||
| (1) | As a percentage of issued and outstanding shares (including shares held by ASHC). |
| (2) | As of February 7, 2018, Atlantic Security Bank (a subsidiary of ASHC) held 2,723,300 shares of Credicorp on behalf of clients as part of the Private Banking Services that ASB provides, and which shares are purchased or sold based on client instructions. ASB does not have the power to dispose of these shares. Because the shares are held by ASB on behalf of clients, which have the power to vote the shares, ASHC and ASB each disclaims beneficial ownership of the shares. |
| (3) | It includes common shares directly or indirectly owned by Dionisio Romero Paoletti and his family or companies owned or controlled by them. Mr. Romero P. is the Chairman of the Board. |
| 209 |
Voting rights of major shareholders are not different from voting rights of other shareholders. Each share has right to one vote, including the shares owned by Atlantic Security Holding Corporation.
Approximately 10.16% of Credicorp’s total issued and outstanding common shares are currently held in 2,795 individual accounts with Cavali, a Peruvian securities clearing company.
As of February 07, 2018, Credicorp had 79,761,471 floating common shares (excluding the 14,620,846 shares held by ASHC), of which approximately 74.35 % were held in the United States. There were approximately 51 registered holders of Credicorp’s common shares in the United States. Because many of these common shares were held by brokers or other nominees, and because of the impracticability of obtaining accurate residence information for all beneficial shareholders, the number of registered holders in the United States is not a representative figure of the beneficial holders or of the residence of beneficial holders. Credicorp is neither directly nor indirectly controlled by another corporation or by any foreign government.
| 7. B | Related Party Transactions |
Under Bermuda law, Credicorp is not subject to any restrictions on transactions with affiliates, other than such restrictions as are applicable to Bermuda companies generally. Credicorp’s Bye-laws provide that a director may not vote with respect to any contract or proposed contract or arrangement in which that director has an interest or a conflict of interest. Credicorp has not engaged in any transactions with related parties except through our subsidiaries.
Credicorp’s consolidated financial statements as of December 31, 2015, 2016 and 2017 include transactions with related parties. For its 2015, 2016 and 2017 consolidated financial statements, Credicorp defines related parties as (i) related companies, (ii) its board of directors, (iii) its Senior Management and (iv) enterprises that are controlled by these individuals or entities through majority shareholding or their role as chairman or principal executive officer in those companies.
| 210 |
The following table shows Credicorp’s main transactions with related companies as of December 31, 2015, 2016 and 2017:
| 2015 | 2016 | 2017 | ||||||||||
| (Soles in thousands) | ||||||||||||
| Statement of financial situation - | ||||||||||||
| Direct loans | 1,536,749 | 1,181,648 | 1,468,211 | |||||||||
| Investments available-for-sale and trading securities | 368,438 | 433,517 | 715,490 | |||||||||
| Deposits | (285,763 | ) | (264,564 | ) | (1,022,462 | ) | ||||||
| Derivatives at fair value | 2,499 | 1,074 | (2,674 | ) | ||||||||
| Statement of income - | ||||||||||||
| Interest income related to loans – income | 63,821 | 28,872 | 23,992 | |||||||||
| Interest expense related to deposits - expense | (11,649 | ) | (8,001 | ) | (8,342 | ) | ||||||
| Other income | 6,523 | 9,098 | 7,247 | |||||||||
| Off balance sheet | ||||||||||||
| Total performance bonds, stand-by and L/Cs. | 234,287 | 236,106 | 385,360 | |||||||||
Credicorp made these loans, contingent operations and derivative contracts with related parties in the ordinary course of business and in accordance with the normal market terms available to other customers. Outstanding loan balances at the year-end are guaranteed by the related party. The loans to related companies as of December 31, 2017 have maturity dates ranging between January 2018 and July 2028 and an accrued annual interest rate average of 6.01% (and as of December 31,2016 had a maturity dates between January 2017 and September 2026 and an average accrued annual interest rate of 7.15%).
As of December 31,2017, we recorded a S/7.2 million (US$2.2 million) allowance for loan losses for doubtful debt in connection with loans to related parties and as of December 31,2016 this provision amounted to S/6.4 million (US$1.9 million). The amount of this provision is established based on an assessment, performed on a continuous basis, of the financial position of each related party and the market in which it operates.
As of December 31, 2015, 2016 and 2017, Credicorp’s directors, officers and employees had been involved, directly and indirectly, in credit transactions with certain subsidiaries of the Group, as permitted by Peruvian Banking and Insurance Law No. 26702, which regulates and limits certain transactions with employees, directors and officers of a bank and insurance company. At December 31, 2015, 2016 and 2017, direct loans to employees, directors, key management of Credicorp and their family members amounted to S/1,037.5 million (US$304.2 million), S/1,015.9 million (US$302.7 million) and S/957.2 million (US$295.3 million), respectively. These loans have been granted in the ordinary course of business and on market terms as allowed by regulations promulgated under Section 402 of the Sarbanes-Oxley Act. Therefore, no privileged conditions have been granted on any type of loans to directors and executive officers. These loans are paid monthly and earn interest at rates that are similar to market rates for comparable loans.
| 211 |
| 7. C | Interests of Experts and Counsel |
Not applicable.
| ITEM 8. | FINANCIAL INFORMATION |
| 8. A | Consolidated Statements and Other Financial Information |
(1) Legal Proceedings
We, along with our subsidiaries, are involved in certain legal proceedings that arise in the normal course of conducting business. We do not believe that any liabilities that may result from such proceedings would have a material adverse effect on our financial condition or results of operations, or on the financial condition or results of operations of any of our subsidiaries.
The following is a description of material ongoing litigation as of the date of this Annual Report.
Madoff Trustee Litigation . On September 22, 2011, the Trustee for the liquidation of Bernard L. Madoff Investment Securities LLC (BLMIS), and the substantively consolidated estate of Bernard L. Madoff (the “Madoff Trustee”) filed a complaint against Credicorp’s subsidiary ASB (the “Madoff Complaint”) in the U.S. Bankruptcy Court for the Southern District of New York (the “Bankruptcy Court”), pending under adversary proceeding number 11-02730 (SMB). The Madoff Complaint seeks recovery of approximately US$120 million (equivalent to S/388.9 million). This amount is alleged to be equal to amount of funds that ASB managed in Atlantic US Blue Chip Fund that were invested in Fairfield Sentry Fund Limited (hereafter “Fairfield Sentry”) and redeemed, along with returns thereon between the end of 2004 and the beginning of 2005. The Madoff Complaint further alleges that Fairfield Sentry was a “feeder fund” that invested in BLMIS; that the Madoff Trustee filed an adversary proceeding against Fairfield Sentry, seeking to avoid and recover the initial transfers of monies from BLMIS to Fairfield Sentry; that on June 7 and 10, 2011, the Bankruptcy Court approved a settlement among the Madoff Trustee, Fairfield Sentry and others; and that the Madoff Trustee is entitled to recover the sums sought from ASB as “subsequent transfers” or “avoided transfers” from BLMIS to Fairfield Sentry that Fairfield Sentry in turn subsequently transferred to ASB. The Madoff Trustee has filed similar “clawback” actions against numerous other alleged “subsequent transferees” that invested in Fairfield Sentry and its sister entities which, in turn, invested and redeemed funds from BLMIS.
| 212 |
There has been significant briefing on issues related to these Madoff Trustee actions, and the U.S. District Court for the Southern District of New York previously entered several rulings on legal issues presented in motions briefed in common by various defendants against which the Madoff Trustee has asserted these “clawback” type claims. In particular, on July 7, 2014, the District Court issued an opinion on extraterritorially (the “Extraterritoriality Order”) and, among other things, held that Bankruptcy Code section 550(a) “does not apply extraterritorially to allow for the recovery of subsequent transfers received abroad by a foreign transferee from a foreign transferor.” The District Court remanded the cases to the Bankruptcy Court for further briefing on the Extraterritoriality Order. Litigation has been ongoing regarding the Extraterritoriality Order, and, on November 22, 2016, the Bankruptcy Court issued a Memorandum Decision Regarding Claims to Recover Foreign Subsequent Transfers (the “Memorandum Decision”), which Memorandum Decision addresses the Extraterritoriality Order. In this Memorandum Decision, the Bankruptcy Court provided that the recovery of certain subsequent foreign transfers under section 550 of the Bankruptcy Code arising from the avoidance of certain transfers made by BLMIS is barred under the doctrine of comity and/or extraterritoriality, and dismissed the claims brought by the Madoff Trustee against a number of parties, including ASB. The Bankruptcy Court directed the parties to the Memorandum Decision, which includes ASB, to confer with the Madoff Trustee for the purpose of submitting orders consistent with the Memorandum Opinion (the “Dismissal Order”). The Dismissal Order was entered by the Bankruptcy Court on March 3, 2017, which Dismissal Order dismissed the Madoff Complaint against ASB. On March 16, 2017, the Madoff Trustee filed an appeal (the “Appeal”) of the Memorandum Decision and Dismissal Order (which Appeal also seeks to appeal the Extraterritoriality Order) in the Bankruptcy Court, seeking to appeal the dismissal of claims against ASB (and other similarly situated foreign transferee defendants) directly to the United States Court of Appeals for the Second Circuit (the “Second Circuit”). On or around September 27, 2017, the Second Circuit granted permission for direct appeal. Briefing of the appeal before the Second Circuit is still at the early stages. The Madoff Trustee filed its appellant brief on January 10, 2018, and defendants-appellees (which includes ASB) had until April 18, 2018 to file their brief.
Management believes that ASB has substantial defenses against the Madoff Trustee’s claims alleged in the Madoff Complaint, including with respect to any appeal of the Dismissal Order, and intends to contest the appeal vigorously.
| 213 |
Fairfield Litigation. On April 13, 2012, Fairfield Sentry Limited (In Liquidation) and its representative, Kenneth Krys (the “Fairfield Liquidator”), filed a complaint against ASB (the “Fairfield Complaint”) in the Bankruptcy Court, styled as Fairfield Sentry Limited (In Liquidation) v. Atlantic Security Bank and Beneficial Owners of Accounts Held in the Name of Atlantic Security Bank 1-1000, Adv. Pro. No. 12-01550 (SMB) (the “Fairfield v. ASB Adversary Proceeding”). The Fairfield Complaint seeks to recover the amount of US$115.2 million, reflecting ASB’s redemptions of certain investments in Fairfield Sentry, together with investment returns thereon. These are essentially the same moneys that Madoff Trustee seeks to recover in the Madoff Trustee Litigation described above. Thereafter, the Fairfield v. ASB Adversary Proceeding was procedurally consolidated by the Bankruptcy Court with other adversary actions brought by the Fairfield Liquidator against former investors in Fairfield Sentry. Pursuant to that consolidation, and by stipulation of the parties, the Bankruptcy Court’s previously entered stay of all proceedings in the Fairfield Liquidator adversary actions (except for the filing of amended complaints) in light of pending litigation in the British Virgin Island courts (the “BVI Litigation”) challenging the Fairfield Liquidator’s ability in the ASB Adversary Proceeding to seek recovery of funds invested with and redeemed from Fairfield Sentry remained in effect, thereby extending ASB’s time to answer, move or otherwise respond to the Fairfield Complaint. On January 14, 2013, the Fairfield Liquidator filed an Amended Complaint in the Fairfield v. ASB Adversary Proceeding seeking the same amount of recovery as in the original Fairfield Complaint but adding additional allegations and causes of action.
On or about April 2014, the Judicial Committee of the Privy Council, which serves as the court of appeals for the British Virgin Islands (the “BVI Court”), upheld certain judicial rulings of the BVI Court, which rulings in a published opinion called into question the Fairfield Liquidator’s legal ability to seek recovery of certain funds invested with and redeemed from Fairfield Sentry (the “Privy Council Decision”). In light of the Privy Council Decision, certain former shareholders of Fairfield Sentry filed applications (“273 Applications”) pursuant to Section 273 of the Insolvency Act, 2003 (“Act”) in the Eastern Caribbean Supreme Court, British Virginia Islands (Commercial Division), seeking an order, requiring, among other things, the Fairfield Liquidator to withdraw the proceedings in the U.S. related to such redemption of investments in Fairfield Sentry. On March 11, 2016, the Court for the British Virginia Islands (Commercial Division) entered an order (the “273 Order”) denying the relief requested by the defendants in the 273 Applications. As a result of the 273 Order, on March 14, 2016, counsel for the Fairfield Liquidator submitted a letter to the Bankruptcy Court stating its position that the next step in the U.S. Fairfield litigation was for the Bankruptcy Court to consider how to proceed, and a status conference was held in the Bankruptcy Court on or about July 27, 2016. Following the status conference, on or about September 18, 2016, the Fairfield Liquidator filed proposed further amended complaints against a number of defendants, including against ASB (the “Second Amended Complaint”) in the Fairfield v. ASB Adversary Proceeding. In addition, a proposed case management order was filed with the Bankruptcy Court on or about October 18, 2016 (as supplemented and amended from time to time, the “CMO”) , which CMO set forth a proposed briefing schedule related to the Fairfield Liquidator’s request to amend certain complaints, including the request of the Fairfield Liquidator related to the filing of the Second Amended Complaint against ASB.
| 214 |
On or about October 21, 2016, pursuant to the CMO, the Fairfield Liquidator filed, among other things, a Motion for Leave to Amend (the “Motion for Leave”) various complaints, including against ASB in the Fairfield v. ASB Adversary Proceeding. On or about January 13, 2017, pursuant to the terms of the CMO, certain defendants, including ASB, filed a motion to dismiss (the “Motion to Dismiss”) and a consolidated memorandum of law (i) in opposition to the Motion for Leave and (ii) in support of the Motion to Dismiss. Reply briefing thereafter by the parties on the Motion for Leave and Motion to Dismiss continued under the terms of the CMO, and on January 8, 2018, the Bankruptcy Court entered an order scheduling oral argument on the Motion for Leave and the Motion to Dismiss for January 25, 2018. The Bankruptcy Court heard oral argument on January 25, 2018, but did not rule at the hearing and has not yet issued any opinion.
Management believes it has substantial defenses against the Fairfield Liquidator’s claims alleged in the Amended Complaint and Motion for Leave and intends to contest these claims vigorously.
(2) Government Investigations
Neither we, nor any of our subsidiaries, are involved in any government investigation.
(3) Dividend Policy
As its Dividend Policy, the Company intends to declare and pay dividends in cash of at least 25% of the Company’s consolidated net profits based on the last audited financial accounts. The Board of Directors shall take into consideration the following at the time of decision making to distribute dividends:
| · | The availability of dividends from the Company’s subsidiaries. |
| · | The declaration and payment of dividends should not cause the Company to breach any applicable laws or adversely impact the equity growth requirements of the Company or its subsidiaries. |
| · | Financial performance of the Company. |
| · | General business and economic-financial conditions affecting the Company. |
| · | Any other factors which the Board may deem relevant. |
Notwithstanding the foregoing, under Bermuda Law, any dividend may only be declared and paid if the Company is able to (i) pay its liabilities as they become due, and (ii) the market value of its assets is not less than the aggregate value of its liabilities, capital stock, and share premium accounts.
| 215 |
The Board of Directors may in its sole discretion declare and pay a dividend below 25%, if any of the above mentioned conditions are not met. Subject to the foregoing, it is expected that dividend payment shall be made once a year within ninety calendar days of the meeting held by the Board to approve the dividend declaration. No interim dividends shall be paid. This policy has been in force since the financial year 2016, and will continue to be applicable until amended or rescinded by the Board of Directors. For further detail about the risk associated with our ability to pay dividends, refer to Item 3. Key Information – 3.D Risk Factors (iii) Our ability to pay dividends to shareholders and to pay corporate expenses may be adversely affected by the ability of our subsidiaries to pay dividends to us.
The following table shows cash and stock dividends that we paid in the periods indicated:
| Year ended December 31, |
Number of Shares Entitled to Dividends |
Cash Dividends Per Share |
Stock Dividends Per Share |
|||||||||||
| 2001 | 94,382,317 | US$ | 0.10 | 0.00 | ||||||||||
| 2002 | 94,382,317 | US$ | 0.40 | 0.00 | ||||||||||
| 2003 | 94,382,317 | US$ | 0.30 | 0.00 | ||||||||||
| 2004 | 94,382,317 | US$ | 0.40 | 0.00 | ||||||||||
| 2005 | 94,382,317 | US$ | 0.80 | 0.00 | ||||||||||
| 2006 | 94,382,317 | US$ | 1.10 | 0.00 | ||||||||||
| 2007 | 94,382,317 | US$ | 1.30 | 0.00 | ||||||||||
| 2008 | 94,382,317 | US$ | 1.50 | 0.00 | ||||||||||
| 2009 | 94,382,317 | US$ | 1.70 | 0.00 | ||||||||||
| 2010 | 94,382,317 | US$ | 1.95 | 0.00 | ||||||||||
| 2011 | 94,382,317 | US$ | 2.30 | 0.00 | ||||||||||
| 2012 | 94,382,317 | US$ | 2.60 | 0.00 | ||||||||||
| 2013 | 94,382,317 | US$ | 1.90 | 0.00 | ||||||||||
| 2014 | 94,382,317 | US$ | 2.1873 | 0.00 | ||||||||||
| 2015 | 94,382,317 | US$ | 2.3160 | 0.00 | ||||||||||
| 2016 | 94,382,317 | S/ | 12.2865 | 0.00 | ||||||||||
| 2016 (1) | 94,382,317 | S/ | 15.7000 | 0.00 | ||||||||||
| 2017 (2) | 94,382,317 | S/ | 14.1726 | 0.00 | ||||||||||
| (1) | At a meeting held on October 25, 2017, the Board of Directors declared an extraordinary cash dividend of S/ 15.700 per common share. The cash dividend will be paid in U.S. Dollars using the weighted exchange rate registered by the Superintendent of Banks, Insurance and Pension Funds (Superintendencia de Banca, Seguros y AFP) for the transactions at the close of business on November 22, 2017. The U.S. Dollar dividend amount will be rounded up to four decimals. The aforementioned cash dividend will be paid on November 24, 2017 to those shareholders that are registered as shareholders of Credicorp as of the close of business on November 14, 2017. |
| (2) | At a meeting held on February 28, 2018, the Board of Directors declared a cash dividend of S/ 14.1726 per common share. The cash dividend will be paid in U.S. Dollars using the weighted exchange rate registered by the Superintendent of Banks, Insurance and Pension Funds (Superintendencia de Banca, Seguros y AFP) for the transactions at the close of business on May 09, 2018. The U.S. Dollar dividend amount will be rounded up to four decimals. The aforementioned cash dividend will be paid on May 11, 2018 to those shareholders that are registered as shareholders of Credicorp as of the close of business on April 18, 2018. |
| 216 |
| 8. B | Significant changes |
(1) Merger by absorption between El Pacifico Vida Compañia de Seguros y Reaseguros (Pacifico Vida) and El Pacifico Peruano-Suiza Compañia de Seguros y Reaseguros (PPS)
At the Obligatory Annual Shareholders’ Meeting of Pacifico Vida, held on February 23, 2017, the merger by absorption was approved between Pacifico Vida (absorbing entity) and PPS (absorbed entity), and the amendments to their corporate denomination and purpose. Furthermore, it was agreed that said merger would come into effect on the date of the approval of the Public Deed, subject to the prior authorization of the SBS.
In connection with the transaction on July 24, 2017, the SBS, by means of Resolution N° 2836-2017 authorized the following with regards to Pacifico Vida:
| · | The merger by absorption. |
| · | The increase in its share capital by the amount of S/571,009,670, thereby increasing its new share capital to the total of S/1,121,316,750. |
| · | The amendment in its corporate denomination to Pacifico Compañia de Seguros y Reaseguros S.A., being able to use the abbreviated name “Pacifico Seguros”; and to change its corporate purpose in order to be able to operate in the branches of life and general insurance. |
Subsequently, on August 1, 2017, the execution of the Public Deed of Fusion was formalized, with the merger by absorption becoming effective as from said date; consequently, Pacifico Vida absorbs the totality of the assets, liabilities, rights and obligations of PPS, with the latter becoming extinguished, without dissolution or liquidation.
(2) Acquisition of the non-controlling interest of Credicorp Capital Colombia S.A. (formerly Correval) and Inversiones IMT S.A.
In the Board Meetings of Credicorp held on February 24, and July 20 of 2016, capital contributions were approved in favor of Credicorp Capital Ltd. for an amount of US$15.4 million and US$106.3 million, respectively, for the purpose of acquiring all of the shares held by the minority shareholders of Credicorp Capital Colombia (49.0 percent) and Inversiones IMT (39.4 percent) at said date, exercising the sale option agreed with them amounting, at that time, to S/489.9 million (S/340.4 million at the time of the signing of the contract and S/149.5 million related to the appreciation of that option recorded in the period from 2013 until its execution date).
| 217 |
Subsequently, Credicorp Capital Ltd. made capital contributions in favor of its holding subsidiaries Credicorp Capital Holding Chile and Credicorp Capital Holding Colombia for approximately US$49.2 million and US$44.2 million, respectively, to enable said entities to execute directly the purchase and sale options (PUT) with the minority shareholders.
Accordingly, on May 20 and August 1 of 2016, Credicorp Capital Holding Chile executed the purchase option of Inversiones IMT S.A. purchasing the 39.4 percent share held by the minority shareholders, for approximately US$73.7 million (equivalent to S/241.4 million), with which, Credicorp Capital Holding Chile became the owner of 100 percent of the share capital of Inversiones IMT S.A.
The amount paid by Credicorp Capital Holding Chile was made up of: (i) US$49.2 million originating from the capital contribution of Credicorp Capital Ltd., (ii) US$20.0 million obtained through a financing from a local Chilean bank and own (iii) funds of approximately US$4.5 million.
Furthermore, on May 20, June 1 and August 1, of 2016, Credicorp Capital Holding Colombia executed the purchase option of Credicorp Capital Colombia, purchasing the 30.32 percent share held by the minority shareholders for approximately US$45.2 million (equivalent to S/152.4 million), with which, Credicorp Capital Holding Colombia became the owner of 81.32 percent of the share capital of Credicorp Capital Colombia.
The amount paid by Credicorp Capital Holding Colombia is made up of US$44.2 million originating from the capital contribution of Credicorp Capital Ltd. and the entity’s own funds for approximately US$1.0 million.
Finally, on September 30, 2016, Credicorp Capital Ltd. executed the remaining purchase option of Credicorp Capital Colombia, purchasing the 18.68 percent share held by the minority shareholders, by means of the purchase of the entities Coby Business Inc. and Artigas Global Corp, both Panamanian companies whose only asset are their shares of Credicorp Capital Colombia S.A. The total amount of the purchase was US$28.3 million (equivalent to S/96.1 millions), of which Credicorp Capital Ltd. paid US$26.7 million in cash (which originated from Credicorp´s capital contribution), leaving a balance payable of US$1.6 million at December 31, 2017.
The total contribution of Credicorp Ltd. in Credicorp Capital Ltd. Group was US$120.1 million and with the financing taken by Credicorp Capital Holding Chile, all of the purchase options were exercised, resulting in the achievement of a 100 percent share in Inversiones IMT and in Credicorp Capital Colombia S.A. In the same way, the process was concluded of establishing a regional investment bank which operates in the Integrated Latin American Market (MILA from Spanish acronym), involving the stock exchanges of Peru, Colombia and Chile.
| 218 |
The impacts of the operation on the financial statements of the Group are summarized below:
| Companies acquired | ||||||||||||||||
|
Inversiones
IMT S.A. |
Credicorp
Capital Holding Colombia S.A. |
Coby Business
Inc. y Artigas Global Corp. |
Total | |||||||||||||
| S/000 | S/000 | S/000 | S/000 | |||||||||||||
|
Assets and liabilities acquired /
Non-controlling interest |
103,630 | 69,482 | 43,261 | 216,373 | ||||||||||||
| Payment made / execution of sale option | (241,420 | ) | (152,379 | ) | (96,067 | ) | (489,866 | ) | ||||||||
| Effect on Retained Earnings | (137,790 | ) | (82,897 | ) | (52,806 | ) | (273,493 | ) | ||||||||
| (3) | Corporate reorganization of Inversiones Credicorp Bolivia in Credicorp. |
As part of the corporate reorganization of Credicorp, in a General Shareholders’ Meeting of Inversiones Credicorp Bolivia S.A. (hereinafter “ICBSA”), held on December 31, 2015, an increase in the share capital was approved in the form of a voluntary contribution of Grupo Credito S.A. (hereinafter “Grupo Credito”, a subsidiary of Credicorp Ltd.), which amounted to Bs. 1,134.5 million, equivalent to S/383.5 million, issuing in its favor 11,344,800 shares.
The contribution was made by Grupo Credito on March 30, 2016, as a result of which BCP lost control of ICBSA, and Grupo Credito is the new entity that has assumed control.
| (4) | Sale of shares of Banco de Credito de Bolivia. |
The Executive Committee of the Board of Directors of BCP, in its meeting held on December 30, 2015, approved the sale of all of the shares (14,121 units) which it held of Banco de Credito de Bolivia (hereinafter “BCB”) to ICBSA. Both companies form part of Credicorp.
It is worth mentioning that at December 31, 2015, said transaction was not recognized as an “asset classified as held-for-sale”, since it did not comply with all of the requirements of IFRS 5 “Non-current assets held for sale and discontinued operations” and it did not have the regulator’s approval.
| 219 |
Furthermore, in a General Shareholders’ Meeting of BCB held on March 10, 2016, the capitalization of reserves was approved for an amount of Bs. 607.5 million, equivalent to S/307.4 million, increasing proportionally the shareholding of all of the shareholders. As a result of the capitalization, BCP received 29,116 shares, obtaining a total holding of 43,237 shares.
The share sale operation by BCP was authorized by the Supervisory Authority of the Financial System (ASFI from the Spanish acronym) of Bolivia on May 12, 2016, after which, BCP carried out the sale of all of its shares at that date (43,237 shares) in favor of ICBSA, through the Bolivian Stock Exchange, at a price of Bs. 25,811.0 per share, representing a total amount of Bs.1,116.0 million, equivalent to S/541.1 million.
As a result of the sale of shares, ICBSA became the new entity which assumed control over BCB.
| (5) | Sale of 100% of shares of Banco de Credito e Inversiones (BCI) and Enel Distribucion Peru S.A.A. |
Between the years 2016 and 2017, the Group sold through Credicorp Capital Corredores de Bolsa, 100.0% of the shares that it held of Banco de Credito e Inversiones de Chile (hereinafter “BCI Chile”) and 100.0% of the shares that it held of Enel Distribucion Peru S.A.A. (formerly Edelnor S.A.A.) The sales made are described below:
On March 7, 2016, Credicorp signed a Memorandum of Understanding (MOU) with BCI Chile, in which, as a minority shareholder with a 4.06% participation in BCI Chile, it stated its intention to sell up to 50.0% of said shares.
Credicorp undertook not to sell the remaining 50.0% of its shares in BCI Chile during the period of 180 calendar days subsequent to the expiration date of the preferred option of BCI Chile which forms part of the applicable regulations in Chile. The preferred subscription period began on March 21, 2016.
Accordingly, on April 22, 2016, Credicorp sold 50.0% of the shares which it held in BCI Chile (2,248,593 shares), at a price of CLP 27,500 (US$41.6) per share, generating approximately US$94.0 million, equivalent to S/302 million in cash. Said sale generated a profit, net of commissions, of approximately S/124.7 million.
On September 15, 2017, Credicorp sold the remaining 50.0% of shares which it held in BCI Chile (2,286,328 shares), at a price of CLP 39,000 (US$62.3) per share, generating approximately US$142.4 million in cash, equivalent to S/462.8 million. Said sale generated a profit, net of commissions, of approximately S/281.1 million.
| 220 |
On October 4, 2017, Credicorp sold in the Lima Stock Exchange all of its position in the shares of Enel Distribucion Peru S.A.A. (43,554,445 shares), at a price of S/5.5 per share, generating cash for approximately S/239.5 million. The operation generated a profit, net of commissions, of approximately S/163.7 million.
| ITEM 9. | THE OFFER AND LISTING |
| 9. A | Offer and Listing Details |
(1) Price history of Credicorp’s stock
Our common shares have been traded on the New York Stock Exchange since October 25, 1995 under the symbol BAP. Our common shares also trade on the Lima Stock Exchange. They are quoted in U.S. Dollars on both exchanges. The table below sets forth, for the periods indicated, the reported high and low closing prices and average daily trading volume for our common shares on the New York Stock Exchange.
| High | Low |
Average Daily
Volume |
||||||||||||||
| 2013 | US$ | 163.33 | US$ | 113.50 | 354,841 | |||||||||||
| 2014 | US$ | 170.85 | US$ | 123.57 | 310,434 | |||||||||||
| 2015 | US$ | 160.60 | US$ | 81.78 | 351,495 | |||||||||||
| 2016 | US$ | 166.26 | US$ | 84.72 | 356,865 | |||||||||||
| 2017 | US$ | 215.69 | US$ | 150.71 | 282,644 | |||||||||||
| 2015 | ||||||||||||||||
| First quarter | US$ | 160.60 | US$ | 134.08 | 328,108 | |||||||||||
| Second quarter | US$ | 157.89 | US$ | 135.51 | 311,942 | |||||||||||
| Third quarter | US$ | 142.18 | US$ | 81.78 | 399,657 | |||||||||||
| Fourth quarter | US$ | 118.99 | US$ | 95.32 | 364,846 | |||||||||||
| 2016 | ||||||||||||||||
| First quarter | US$ | 134.89 | US$ | 84.72 | 438,839 | |||||||||||
| Second quarter | US$ | 156.89 | US$ | 121.38 | 409,928 | |||||||||||
| Third quarter | US$ | 166.26 | US$ | 147.79 | 266,898 | |||||||||||
| Fourth quarter | US$ | 165.00 | US$ | 144.23 | 317,586 | |||||||||||
| 2017 | ||||||||||||||||
| First quarter | US$ | 169.65 | US$ | 157.41 | 297,787 | |||||||||||
| Second quarter | US$ | 185.10 | US$ | 150.71 | 323,863 | |||||||||||
| Third quarter | US$ | 213.83 | US$ | 179.66 | 234,615 | |||||||||||
| Fourth quarter | US$ | 215.69 | US$ | 189.69 | 274,550 | |||||||||||
| 2018 | ||||||||||||||||
| First quarter | US$ | 237.99 | US$ | 207.03 | 252,317 | |||||||||||
| Second quarter(through April 20) | US$ | 239.54 | US$ | 220.86 | 306,983 | |||||||||||
Source: Bloomberg
| 221 |
The table below sets forth, for the periods indicated, the reported high and low closing prices and average daily trading volume for our common shares on the Lima Stock Exchange.
| High | Low |
Average Daily
Volume |
||||||||||
| (U.S. Dollars) | ||||||||||||
| 2013 | 161.66 | 111.94 | 4,699 | |||||||||
| 2014 | 169.67 | 124.60 | 4,862 | |||||||||
| 2015 | 157.99 | 84.00 | 4,503 | |||||||||
| 2016 | 165.30 | 85.00 | 6,365 | |||||||||
| 2017 | 214.70 | 150.50 | 7,495 | |||||||||
| 2015 | ||||||||||||
| First quarter | 157.99 | 135.00 | 7,022 | |||||||||
| Second quarter | 157.10 | 136.00 | 4,295 | |||||||||
| Third quarter | 142.05 | 84.00 | 4,476 | |||||||||
| Fourth quarter | 117.50 | 96.00 | 2,679 | |||||||||
| 2016 | ||||||||||||
| First quarter | 134.00 | 85.00 | 9,124 | |||||||||
| Second quarter | 155.65 | 121.55 | 6,483 | |||||||||
| Third quarter | 165.30 | 148.10 | 4,988 | |||||||||
| Fourth quarter | 164.75 | 144.99 | 4,879 | |||||||||
| 2017 | ||||||||||||
| First quarter | 168.31 | 152.88 | 16,978 | |||||||||
| Second quarter | 184.20 | 150.50 | 5,517 | |||||||||
| Third quarter | 213.14 | 180.60 | 3,992 | |||||||||
| Fourth quarter | 214.70 | 190.00 | 3,111 | |||||||||
| 2018 | ||||||||||||
| First quarter | 237.88 | 207.30 | 8,049 | |||||||||
| Second quarter(through April 20) | 239.10 | 225.62 | 6,393 | |||||||||
Source: Bloomberg
The table below sets forth, for the indicated months, the reported high and low closing prices for our common shares on the New York Stock Exchange.
| High | Low | |||||||
| (U.S. Dollars) | ||||||||
| 2017 | ||||||||
| October | 212.00 | 201.16 | ||||||
| November | 215.69 | 195.97 | ||||||
| December | 214.32 | 189.69 | ||||||
| 2018 | ||||||||
| January | 237.99 | 208.25 | ||||||
| February | 228.49 | 207.03 | ||||||
| March | 228.25 | 212.87 | ||||||
| April(through April 20) | 239.54 | 220.86 | ||||||
Source: Bloomberg
| 222 |
The table below sets forth, for the indicated months, the reported high and low closing prices for our common shares on the Lima Stock Exchange.
| High | Low | |||||||
| (U.S. Dollars) | ||||||||
| 2017 | ||||||||
| October | 211.56 | 201.30 | ||||||
| November | 214.70 | 199.65 | ||||||
| December | 212.59 | 190.00 | ||||||
| 2018 | ||||||||
| January | 237.88 | 207.50 | ||||||
| February | 231.80 | 207.30 | ||||||
| March | 225.00 | 212.00 | ||||||
| April(through April 20) | 239.10 | 225.62 | ||||||
Source: Bloomberg
On April 20, 2018, the last sale price of our common shares on the New York Stock Exchange was US$230.94 per share. On April 20, 2018, the closing price of our common shares on the Lima Stock Exchange was US$230.60.
| 9. B | Plan of Distribution |
Not applicable.
| 9. C | Markets |
(1) The Lima Stock Exchange
1.1 Trading
As of December 2017, there were 284 companies listed on the Lima Stock Exchange (BVL by its Spanish initials), which is Peru’s only securities exchange and was established in 1970. Trading on the Lima Stock Exchange is primarily done on an electronic trading system. Trading hours are Monday through Friday as follows:
| Opening session: | 08:20 a.m. | 08:30 a.m. | |||
| Trading I: | 08:30 a.m. | 02:22 p.m. | |||
| From the second Sunday of March through the first Sunday of November of each year: | Trading II | 02:22 p.m. | 02:52 p.m. | ||
| Closing session: | 02:52 p.m. | 03:00 p.m. | |||
| Closing Price publication | 03:00 p.m. | 03:02 p.m. | |||
| Trading at closing price: | 03:02 p.m. | 03:10 p.m. | |||
| Opening session: | 09:00 a.m. | 09:30 a.m. | |||
| Trading I: | 09:30 a.m. | 03:22 p.m. | |||
| From the first Sunday of November through the second Sunday of March of each year: | Trading II | 03:22 p.m. | 03:52 p.m. | ||
| Closing session: | 03:52 p.m. | 04:00 p.m. | |||
| Closing Price publication | 04:00 p.m. | 04:02 p.m. | |||
| Trading at closing price: | 04:02 p.m. | 04:10 p.m. |
| 223 |
Equity securities may also be traded in an open outcry auction floor session, which was the exclusive method of trading equity securities prior to the introduction of electronic trading. Nearly 100% of all transactions on the Lima Stock Exchange currently take place on the electronic system.
Transactions during both the open trading and the electronic sessions are executed through brokerage firms and stock brokers on behalf of their clients. Brokers submit their orders in strict accordance with written instructions, following the chronological order in which they were received. The orders specify the type of security ordered or offered as well as the amounts and the price of the sale or purchase. In general, share prices are permitted to increase or decrease up to 15% for Peruvian companies, and up to 30% for foreign companies, within a single trading day.
According to the Lima Stock Exchange, the first two quarters of 2017 started out unstable, product of adjustments in the mining papers, decline in industrial stocks, sharp losses of Graña y Montero shares (linked to Odebrecht case) and uncertainty surrounding U.S. monetary policy. As from July till the end of the third quarter, the Peruvian stock market, saw an upward trend mainly driven by higher international commodity prices in the mining sector, benefited from the persistent geopolitical tension between U.S.A and North Korea.
In December 2017, the BVL reported a highly volatile behavior due to effects of major political crisis, involving payments made by Odebrecht to firms tied to President Kuczynski, and a drastic tax reform in the U.S.A. This situation affected liquidity and caused setbacks in the trading figures. However, this instability was offset by investors who took advantage of falling prices to make opportunity purchases, amid the failure of President Kuczynski opposition to get the number of votes needed for impeachment, which lifted the pace during the second half of the month. Therefore, the two main indices closed December with positive variations.
The total amount traded on the BVL was US$3,516 million in 2015, US$4,566 million in 2016 and US$8,944 million in 2017. These figures are still far from the record level obtained in 2007, in which trading volume reached US$12,400 million. The Peruvian stock market capitalization amounted to US$162,355 million in 2017 compared to US$124,044 million in 2016 and US$90,657 million in 2015. The Indice General de la Bolsa de Valores de Lima (the General Index of the Lima Stock Exchange or IGBVL) closed at 19,974.38points in 2017 (an increase of 28.31% compared to 2016).
| 224 |
1.2 Market Regulation
The Securities Market Law (Legislative Decree 861) addresses matters such as transparency and disclosure, takeovers and corporate actions, capital market instruments and operations, the securities markets and broker-dealers, and risk rating agencies. The SMV, a governmental entity attached to Peru’s Ministry of Economy and Finance, was given additional responsibilities relating to the supervision, regulation, and development of the securities market, while the Lima Stock Exchange and its member firms were given the status of self-regulatory organizations. Additionally, a unified system of guarantees and capital requirements was established for the Lima Stock Exchange and its member firms.
SMV is governed by a five-member board, which includes an independent director and the Superintendent, who are appointed by the government. SMV has broad regulatory powers. These powers include studying, promoting, and making rules for the securities market, supervising its participants, and approving the registration of public offerings of securities.
SMV supervises the securities markets and the dissemination of information to investors. It also (i) governs the operations of the Public Registry of Securities and Brokers, (ii) regulates mutual funds and their management companies, (iii) monitors compliance with accounting regulations by companies under its supervision as well as the accuracy of financial statements and (iv) registers and supervises auditors who provide accounting services to those companies under SMV’s supervision.
On August 22, 1995, SMV approved regulations governing the public offering of securities in Peru by entities organized outside of Peru and, for the first time, authorized foreign companies to be listed on the Lima Stock Exchange. On October 25, 1995, we became the first non-Peruvian company to list our shares on the Lima Stock Exchange. See “Item 4. Information on the Company — 4.B Business Overview—(9) Supervision and Regulation”.
Pursuant to the Securities Market Law, the Lima Stock Exchange must maintain a guarantee fund that is funded by its member firms. The actual contributions to be made by the 24 member firms of the Lima Stock Exchange are based on volume traded over the exchange. In addition to the guarantee fund managed by the Lima Stock Exchange, each member firm is required to maintain a guarantee for operations carried on outside the exchange in favor of SMV. Such guarantees are generally established through bank guarantees issued by local banks.
| 9. D | Selling Shareholders |
Not applicable.
| 225 |
| 9. E | Dilution |
Not applicable.
| 9. F | Expenses of the issue |
Not applicable.
| ITEM 10. | ADDITIONAL INFORMATION |
| 10. A | Share Capital |
Not applicable.
| 10. B | Memorandum and Articles of Association |
“Item 10. Additional Information—Memorandum and Articles of Incorporation” from our Annual Report on Form 20-F dated June 27, 2003 is incorporated herein by reference.
At our Annual General Shareholders’ Meeting held on March 31, 2005, we adopted an amendment to our Bye-laws that increased the number of our directors from six to eight. In addition, we removed provisions that established a classified board structure with staggered terms, adopting instead fixed three-year terms to be served until the end of the Annual General Shareholders’ Meeting for the year in which the three-year period expires.
| 10. C | Material Contracts |
As of the date hereof, we have not, nor have our subsidiaries, entered into any material contracts.
| 10. D | Exchange Controls |
We have been designated as a non-resident for Bermuda exchange control purposes and, therefore, there are no restrictions on our ability to transfer non-Bermuda funds into and out of Bermuda or to pay dividends to United States residents who are holders of our common shares.
| 226 |
We rely almost exclusively on dividends from Grupo Credito, BCP, BCB, ASHC, Grupo Pacifico, Credicorp Capital and our other subsidiaries for the payment of dividends to holders of our common shares. To the extent our subsidiaries are restricted by law from paying us dividends, our ability to pay dividends on our common shares will be adversely affected.
Although substantially all of the clients of BCP, ASB and Pacifico are located in Peru, as of December 31, 2017, approximately 38.3% of BCP Stand-alone’s loan portfolio, 99.9% of ASB loan portfolio, and 50.2% of Pacifico’s written premiums were denominated in U.S. Dollars (38.0%, 99.9%, and 61.4% in 2016; and 36.7%, 100%, and 51.3% in 2015, respectively).
One circumstance that could lead to depreciation is a decline in Peruvian foreign reserves to inadequate levels. Although the current level of Peru’s foreign reserves (US$ 63,621 million or 30% of GDP at December 31, 2017) compares favorably with those of other Latin American countries, there can be no assurance that Peru will be able to maintain adequate foreign reserves to meet its foreign currency-denominated obligations or that Peru will not devalue its currency should its foreign reserves decline. See “Item 4. Information on the Company — 4.B Business Overview — (7) Peruvian Government and Economy”.
Since March 1991, there have been no exchange rate controls in Peru and all foreign exchange transactions are based on free market exchange rates. Current Peruvian regulations on foreign investment allow the foreign holders of equity shares of Peruvian companies to receive and repatriate 100% of the cash dividends distributed by the company. These investors are allowed to purchase foreign exchange at free market exchange rates through any member of the Peruvian banking system.
| 10. E | Taxation |
For details on Income tax review by the Tax Authorities on the jurisdictions in which we operate, please refer to note 18 (d) of the consolidated financial statements.
10.1 Bermuda regulation
As of the date of this report, there is no Bermuda income or profits tax, withholding tax, capital gains tax, capital transfer tax, estate duty, or inheritance tax that we must pay or our shareholders must pay with respect to their shares. We have obtained an assurance from the Minister of Finance of Bermuda under the Exempted Undertakings Tax Protection Act 1966 that, in the event that any legislation is enacted in Bermuda imposing any tax computed on profits or income, or computed on any capital asset, gain, or appreciation or any tax in the nature of estate duty or inheritance tax, such tax shall not, until March 31, 2035, be applicable to us or to any of our operations or to our shares, debentures, or other obligations. This assurance, however, does not cover any tax applicable to persons who ordinarily reside in Bermuda or to any taxes that we must pay with respect to real property that we own or lease in Bermuda.
| 227 |
As an exempted company, we are liable to pay in Bermuda an annual government fee based upon our authorized share capital and the premium on our issued common shares, which amounted to approximately US$18,670 (Bermuda annual government fee for 2017).
10.2 Peruvian regulation
On February 15, 2011, the Peruvian government enacted Law No. 29663, which was subsequently amended on July 21, 2011, by Law No. 29757. This law partially modifies the country’s income tax regime by (i) subjecting to taxation in Peru capital gains derived from an indirect transfer of shares and (ii) introducing more types of income that will qualify as Peruvian source income. Under the law, an indirect transfer of shares is deemed to exist and be subject to the Peruvian Income Tax (0%, 5% or 30%) when the shares of a non-domiciled entity, which in turn owns (directly or indirectly through other entities) shares issued by a domiciled entity, are transferred, provided that both of the following two conditions are met:
| a. | During the 12 months prior to the transfer, the fair market value (“FMV”) of the shares of the Peruvian entity owned by the foreign entity equals 50% or more of the FMV of the shares of the foreign entity. There exists a rebuttable presumption that this condition is met if the non-domiciled entity is a resident in a tax haven; and |
| b. | During any given 12-month period, shares representing 10% or more of the foreign entity’s share capital are transferred. |
The tax rate in this case will apply according to the following:
| Tax rate | ||
| Exempt (0%) | Law No. 30341 establishes that the income derived from the transfer of securities in the Lima Stock Exchange will be exempt from the Income Tax until December 31, 2019, as long as they have a stock market presence and; if in a period of 12 months, the tax-payer or its related parties, through a single or successive operations, do not transfer 10% or more of the total shares issued by the respective Company. | |
| 5% | If the aforementioned requirements are not met and the transfer of shares is realized through the Lima Stock Exchange by a non-domiciled subject. | |
| 30% | If the transfer of shares is not realized through the Lima Stock Exchange by a non-domiciled subject. |
| 228 |
The following two obligations were also imposed on Peruvian domiciled companies that have economic relationships with non-domiciled sellers:
| (2) | Reporting to the Peruvian Tax Administration (SUNAT) the transfer of its own shares or the transfer of shares owned by the non-domiciled seller; and |
| (3) | To the extent that shares of a Peruvian-domiciled company are being directly or indirectly transferred by a non-domiciled transferor, the Peruvian-domiciled company is jointly liable for the income tax that is not paid by the non-domiciled transferor when the seller and the Peruvian domiciled company are deemed to be economically related for Peruvian Income Tax purposes for any period of time, within 12 months prior to the transfer. However, the joint income tax liability does not apply when the purchaser or acquirer of the transferred shares is a Peruvian individual or entity. |
To provide greater clarity, Supreme Decree N° 275-2013-EF was enacted by the Peruvian Government on November 7, 2013 and further defined the concept of “economic relationship”. A Peruvian domiciled company is considered to be economically related to a non-domiciled transferor, if, for any time period within the 12-month period prior to the transfer, at least one of the following conditions is met:
| a. | The non-domiciled transferor owns more than 10% of the equity of the Peruvian-domiciled company, directly or through a third party; |
| b. | 10% or more of the equity of each of the Peruvian-domiciled company and the non-domiciled transferor is owned by common shareholders; |
| c. | The Peruvian-domiciled company and the non-domiciled transferor have one or more common directors, managers or administrators, with power of decision over financial, operative and commercial agreements; |
| d. | The Peruvian domiciled company and the non-domiciled transferor prepare joint consolidated financial statements; or |
| e. | The non-domiciled transferor has a dominant influence on the decisions of the administrative areas of the Peruvian domiciled company, or vice-versa. |
| 229 |
10.3 Reciprocal tax treaties
As of January 19, 2018, Peru has effective tax treaties with the following jurisdictions: Brazil, Canada, Chile, Mexico, Portugal, South Korea, Switzerland and the countries member of the Andean Pact (Bolivia, Colombia and Ecuador). There is no tax treaty with Bermuda or the US.
| 10. F | Dividends and Paying Agents |
Not applicable.
| 10. G | Statement by Experts |
Not applicable.
| 10. H | Documents on Display |
The documents referred to in this Annual Report are available for inspection at our registered office.
| 10. I | Subsidiary Information |
Not applicable.
| ITEM 11. | QUANTITATIVE AND QUALITATIVE DISCLOSURES ABOUT MARKET RISK |
Our activities involve principally the use of financial instruments, including derivatives. We accept deposits from customers at fixed rates, and invest these funds in high-quality assets. Additionally, we place these deposits that could be at fixed and variable rates with legal entities and individuals, considering the finance costs and expected profitability. It is important to mention that in 2017 the deposits we placed have been only at fixed rate.
We also seek to raise margins, through lending to commercial and retail borrowers with a range of financial products. Such exposures involve not just on-balance sheet loans and advances; we also enter into off-balance sheet facilities and other commitments such as letters of credit and performance bonds.
| 230 |
We also trade in financial instruments where we take positions in traded and over-the-counter instruments, including derivatives, to take advantage of market movements in equities, bonds, currencies and interest rates.
In this sense, risk is inherent to our activities but it is managed through a process of ongoing identification, measurement and monitoring, subject to risk limits and other controls. This process of risk management is critical to our continuing profitability and each individual within the Group is accountable for the risk exposures relating to his or her responsibilities. We are exposed, principally, to operating risk, credit risk, liquidity risk and market risk, strategic risk and insurance technical risk.
(1) Risk Management Structure
The Board of Directors of the Group and of each subsidiary is ultimately responsible for identifying and controlling risks; however, there are separate independent instances in the major subsidiaries responsible for managing and monitoring risks, as further explained below:
| a) | Board of Directors Credicorp - |
The Board of Directors is responsible for the overall risk management approach and for the approval of the levels of risk appetite that the Group is prepared to assume. Furthermore, it approves the guidelines and policies for Integral Risk Management. The Board also establishes an organizational culture which emphasizes the importance of risk management, oversees the internal control system and ensures the adequate performance of the compliance function.
Board of Group Companies –
The Board of each of the Group companies is responsible for aligning the risk management established by the Board of Credicorp with the context of each Group company. For that purpose, each Board establishes a framework for risk appetite, policies and guidelines.
| b) | Risk Committee - |
The Risk Committee represents the Board of Credicorp in risk management decision-making. This Committee defines the strategies used for the adequate management of the different types of risks and the supervision of risk appetite, in addition to establishing principles, policies and general limits.
| 231 |
The Risk Committee consists of two members of Credicorp’s Board of Directors, one of them holds the Chairman position, a member of the Board of BCP, BCP’s CEO, BCP’s CFO, BCP’s CRO and BCP’s Head of Risk Management. Furthermore, Credicorp’s Chief Corporate Audit Officer participates as an observer.
The Risk Committee is supported by the following committees, which report on a monthly basis all relevant changes or issues relating to the risks management:
Credit Risk Committee
The Credit Risk Committee is responsible for reviewing the tolerance level of the credit risk appetite and the limits of exposure of Credicorp. This Committee also proposes credit risk management norms and policies within the framework of governance and the organization for the integral management of credit risk. Furthermore, it proposes the approval of any changes to the functions described above and important findings to the Risk Committee.
Treasury and ALM (Asset & Liability Management) Risk Committee-
The Treasury and ALM Risk Committee is responsible for analyzing and proposing the risk appetite and Treasury’s level of exposure. It also proposes the guidelines and policies for the Treasury Risk Management and ALM, within the framework of governance and the organization structure for the integral management of market risks. Furthermore, it is responsible for proposing the approval of any changes in the functions described above and for reporting any finding to the Risk Committee.
Operational Risk Committee -
The Operational Risk Committee is responsible for reviewing the tolerance level, the appetite for operational risk and the limits of exposure of Credicorp. It also proposes the norms and policies for the management of operational risks and the mechanisms for the implementation of corrective actions within the governance framework. Furthermore, it proposes the approval of any changes to the functions described above and reports any finding to the Risk Committee.
| c) | Central Risk Management - |
The Central Risk Management is responsible for implementing policies, procedures, methodologies and actions to identify, measure, monitor, mitigate, report and control the different types of risks to which the Group is exposed. Also, it participates in the design and definition of the strategic plans of the business units to ensure that they are framed within the risk appetite metrics approved by the Board of Directors of Credicorp.
| 232 |
The Central Risk Management is divided into the following areas:
Credit Division -
The Credit Division is responsible for ensuring the quality of the wholesale banking portfolio in accordance with the Group’s risk strategy and appetite on the basis of an efficient management of the lending process relying on well-defined lending policies and highly trained personnel with best lending practices.
Risk Management Division -
The Risk Management Division is responsible for ensuring that policies and risk management policies established by the Board of Directors are complied with and monitored. The Risk Management Division also supervises the process of risk management and coordinates with the companies of Credicorp involved in the whole process. It also has the task of informing Senior Management of global exposure and type of risk, as well as the specific exposure of each of the Group’s companies.
The Risk Management Division consists of the following units: the Operational Risk and Insurance Risk Management Department, the Credit and Corporate Management Risk Department, the Market Risk Management Department, Global Risk Management, Internal Validation and Risk Management Methodology and Modelling.
Retail Banking Risk Division -
This division is responsible for ensuring the quality of the retail portfolio and the development of credit policies that are consistent with the overall guidelines and policies set by the Board of Credicorp.
Treasury Risk Management –
The Treasury Risk Management is responsible for planning, coordinating and monitoring the implementation of the Treasury Division with risk measurement methodologies and limits approved by the Risk Committee. Treasury Risk Management is also responsible for assessing the effectiveness of hedge derivatives and the valuation of investments.
| 233 |
| d) | Internal Audit Division and Compliance Division – |
The Internal Audit Division is in charge of monitoring on an ongoing basis the effectiveness of the risk management function of the Group, verifying compliance with laws and regulations, as well as the policies, objectives and guidelines set by the Board of Directors. The Audit Division also evaluates the sufficiency and level of integration of the Group’s information and database systems. Finally, it ensures that independence is maintained between the functions of the risk management and business units, for each of the Group’s companies.
The Compliance Division is responsible for ensuring compliance with applicable laws and regulations and the internal Code of Ethics.
(2) Risk Measurement and Reporting Systems
Credicorp has independent databases that are subsequently integrated through corporate reports. These reports enable it to monitor at an aggregate and detailed level, the different types of risks to which each company is exposed. The system provides it the ability to comply with the needs for revision of the risk appetite requested by the above-mentioned committees and areas; as well as also complying with regulatory requirements.
(3) Risk Mitigation
Depending on the type of risk, the Group uses mitigating instruments to reduce its exposure, such as guarantees, derivatives, controls, insurance, among others. Furthermore, it has policies linked to risk appetite and established procedures for each type of risk.
The Group actively uses guarantees to reduce its credit risks
(4) Risk appetite
In the different subsidiaries of the Group, the respective Boards approve the risk appetite framework to define the maximum level of risk that the organization is willing to take in seeking to accomplish its strategic and financial objectives. This Risk Appetite framework is based on primary and secondary objectives:
| 234 |
Primary objectives are intended to preserve the strategic pillars of the organization, defined as solvency, liquidity, profit and growth, stability of results and balance structure.
Secondary objectives are intended to monitor on a qualitative and quantitative basis the various risks to which the Group is exposed, as well as defining a tolerance threshold of each of those risks, so the risk profile set by the Board is preserved and any risk focus is anticipated on a more granular basis.
Risk appetite is instrumented through the following elements:
- A Risk appetite statement: making explicit the general principles and the qualitative declarations which complement the Bank’s risk strategy.
- A Metrics scorecard: used to define the levels of risk exposure in the different strategic pillars.
- Limits: Allows Credicorp to manage the risk-taking process within the tolerance established by the Board. They also provide accountability for the risk-taking process and define guidelines regarding the target risk profile.
- Government of the risk appetite process: Seeks to guarantee compliance of the framework through the different roles and responsibilities assigned to the units involved, including by monitoring risk exposure periodically to verify that it is within the established limits. If a limit is surpassed, an action plan is generated, which compliance is monitored periodically until risk exposure is within the limits again.
(5) Risk Concentration
Risk concentrations arise when a reduced and representative number of all of the counterparties of the Group are engaged in similar business activities, or activities in the same geographic region, or have similar economic, political or other conditions.
In order to avoid excessive concentrations of risk, the policies and procedures include specific guidelines to guarantee a diversified portfolio.
(6) Market Risk
The Group takes on exposure to market risks, which is the risk that the fair value or future cash flows of a financial instrument will fluctuate because of changes in market prices. Market risks arise from open positions in interest rates, currency, commodities and equity products; all of which are exposed to general and specific market movements and changes in the level of volatility of prices such as interest rates, credit spreads, foreign exchange rates and equity prices. Due to the nature of the Group’s current activities, commodity price risk is not applicable.
| 235 |
The Group separates exposures to market risk into two groups: (i) those that arise from value fluctuation of trading portfolios due to movements of market rates or prices (Trading Book) and (ii) those that arise from changes in the structural positions of non-trading portfolios due to movements of the interest rates, prices and foreign exchange ratios (Banking Book).
The risks that trading portfolios face are managed through Value at Risk (VaR) historical simulation techniques; while non-trading portfolios (Trading book) are managed using Asset and Liability Management (ALM).
(7) Trading Book
The trading book is characterized by having liquid positions in equities, bonds, foreign currencies and derivatives, arising from market-making transactions where the Group acts as a principal with the clients or with the market. This portfolio includes investments and derivatives classified by Management as held for trading.
7.1 Value at Risk (VaR)
Based upon a number of assumptions for various changes in market conditions, we apply VaR to our trading portfolios to estimate the market risk of our positions and our maximum losses.
Daily calculation of VaR is a statistically-based estimate of the potential loss on our current portfolio caused by adverse market movements.
It expresses the “maximum” amount the Group might lose, but only to a certain level of confidence (99 percent). There is therefore a specified statistical probability (1 percent) that actual loss could be greater than the VaR estimate. The VaR model assumes a certain “holding period” until positions can be closed (1 - 10 days).
The time horizon used to calculate VaR is one day; however, the one-day VAR is amplified to a 10-day time frame and calculated by multiplying the one-day VaR by the square root of 10. This adjustment will be exact only if the changes in the portfolio in the following days have a normal distribution identical and independent; otherwise, the 10-day VAR will be an approximation.
| 236 |
VaR limits and assumptions are set on the basis of risk appetite and trading strategy of each subsidiary. The assessment of past movements has been based on historical one-year data and 124 market risk factors, which are composed as follows: 25 market curves, 78 stock prices, 12 mutual funds values, 1 volatility series and 8 survival probability curves. Credicorp applies these historical changes in rates directly to its current positions (a method known as historical simulation). Management believes the market risk factors incorporated into its VaR model are adequate to measure the market risk to which Credicorp’s trading book is exposed.
The use of this approach does not prevent losses outside of these limits in the event of more significant market movements. Losses exceeding the VaR figure should occur, on average under normal market conditions, not more than once every hundred days. VaR limits have been established to control and keep track of our risks taken. These risks arise from the size of our positions and/or the volatility of the risk factors embedded in each financial instrument. Regular reports are prepared for the Treasury and ALM Risk Committee, our risk management committees and our senior officers.
VaR results are used to generate economic capital estimates by market risk, which are periodically monitored and are part of the overall risk appetite of each subsidiary. Furthermore, Credicorp has internal appetite risk limits for the Trading Book that are monitored and informed to the Credicorp Treasury and ALM Risk Committee. In VaR calculations, the foreign exchange effect is not included and as such the calculation is measured assuming a constant exchange rate (see Item 11. Quantitative and qualitative disclosures about market risk – (10) Foreign Exchange Risk).
During 2017, the Credicorp´s VaR showed a reduction compared to the level of 2016, due to lower exposure to the interest rates risk and prices risk because of the reduction of the position of the fixed income, equity and swaps portfolios. The VaR remained within the internal limits risk appetite limits set by the Risk Management Department of each subsidiary.
As of December 31, 2015, 2016 and 2017, our VaR by type of asset were as follows:
| 2015 | 2016 | 2017 | ||||||||||
| Soles in thousand | ||||||||||||
| Equity investments | 12,282 | 9,624 | 2,757 | |||||||||
| Debt investments | 7,088 | 19,371 | 4,504 | |||||||||
| Swaps | 13,769 | 13,045 | 7,661 | |||||||||
| Forwards | 102,967 | 2,470 | 2,111 | |||||||||
| Options | 12,708 | 1,160 | 251 | |||||||||
| Diversification effect | -27,997 | -19,748 | -9,884 | |||||||||
| Consolidated VaR by type of asset (1) | 120,817 | 25,922 | 7,400 | |||||||||
| (1) | Amplified to the Holding, 10 days period. |
| 237 |
As of December 31, 2015, 2016 and 2017, our VaR by risk type were as follows:
| 2015 | 2016 | 2017 | ||||||||||
| Soles in thousand | ||||||||||||
| Interest rate risk | 111,941 | 22,553 | 7,836 | |||||||||
| Price risk | 12,288 | 9,623 | 2,759 | |||||||||
| Volatility risk | 287 | 319 | - | |||||||||
| Diversification effect | -3,701 | -6,573 | -3,195 | |||||||||
| Consolidated VaR by risk type (1) | 120,815 | 25,922 | 7,400 | |||||||||
| (1) | Amplified to the Holding, 10 days period. |
The information disclosed in these charts addresses the VaR calculation for the entire consolidated Group. However, minimum, maximum and average VaR calculations are estimated only for BCP Stand-alone’s trading book. The reason for this is that, although there is a daily VaR calculation for all subsidiaries with trading book positions, the entire Group is consolidated once a month in order to calculate a VaR for reporting purposes and to monitor the economic capital limit. Therefore, since there is not a sufficient sample for the Group, minimum, maximum and average VaR are calculated only for the BCP subsidiary. Nonetheless, the Company believes it is relevant information considering that BCP’s trading risk is very close to the total trading risk of the Group’s portfolio.
For the years ended December 31, 2015, 2016 and 2017, the BCP Stand-alone’s VaR is as follows:
| 2015 | 2016 | 2017 | ||||||||||
| Soles in thousand | ||||||||||||
| Average daily | 57,357 | 50,486 | 14,834 | |||||||||
| Highest | 121,463 | 132,038 | 55,298 | |||||||||
| Lowest | 16,115 | 8,972 | 6,022 | |||||||||
| 238 |
7.2 Backtesting
Backtesting is performed on a trading book to verify the predictive power of the VaR calculations. Backtesting compares results of the positions considered for the calculation of VaR and the calculation of the VaR from the previous day.
Backtesting exceptions occur when real losses exceed the estimated VaR for the previous day. In order for a backtesting analysis to be considered valid, it should be based on a minimum of 252 observations.
Every month, back-testing exceptions are analyzed and reports are prepared to explain the results. These reports are presented to the Treasury and ALM Risk Committee and our Senior Officers.
Backtesting is also estimated only for BCP’s trading book, since it should be based on a minimum of 252 observations and the Group’s VaR is consolidated only once a month for reporting purposes and to monitor the economic capital limit.
VaR Backtesting – VaR (1-Day, 99% in millions of Soles) – 2017:

During 2017, BCP did not record any exception (no actual losses exceeded daily VaR).
| 239 |
7.3 Stress test
A stress test is calculated for the Group. The test calculates the maximum loss that the Group incurs in light of daily shocks to the market risk factors from March 18, 2008 until the effective date of the stress test. The maximum loss is considered the outcome for the Stress test.
The methodology for the stress test assumes a certain “holding period” until positions can be closed (1 - 10 days). The time horizon used to calculate the losses is one day; however, the final figures are amplified to a 10-day time frame and the final calculation is determined by multiplying the one-day losses times the square root of 10. This adjustment will be exact only if the changes in the portfolio in the following days follow a normal distribution that is identical and independent; otherwise, the worst loss of 10 days will be an approximation.
The results of our stress test as of December 31, 2015, 2016 and 2017, by type of asset, were as follows:
| 2015 | 2016 | 2017 | ||||||||||
| Soles in thousand | ||||||||||||
| Equity investments | 49,712 | 35,581 | 12,292 | |||||||||
| Debt investments | 18,067 | 47,259 | 27,840 | |||||||||
| Swaps | 38,029 | 23,469 | 23,835 | |||||||||
| Forwards | 163,876 | 13,200 | 13,395 | |||||||||
| Options | 17,439 | 8,616 | 1,836 | |||||||||
| Diversification effect | (123,582 | ) | (79,832 | ) | (18,937 | ) | ||||||
| Consolidated VaR by type of asset | 163,541 | 48,293 | 60,261 | |||||||||
The results of our stress test as of December 31, 2015, 2016, 2017, by risk type, were as follows:
| 2015 | 2016 | 2017 | ||||||||||
| Soles in thousand | ||||||||||||
| Interest rate risk | 174,491 | 45,453 | 28,487 | |||||||||
| Price risk | 49,730 | 35,603 | 12,301 | |||||||||
| Volatility risk | 370 | 852 | - | |||||||||
| Diversification effect | (61,051 | ) | (33,616 | ) | (5,112 | ) | ||||||
| Consolidated VaR by risk type | 163,540 | 48,292 | 35,676 | |||||||||
| 240 |
(8) Banking Book
The management of risks associated with long-term and structural positions is called ALM. Non-trading portfolios which comprise the Banking book are exposed to different sensitivities that can bring about deterioration in the value of the Group’s assets relative to its liabilities and hence can reduce the Group’s net worth.
Interest-Rate Risk
The ALM-related interest rate risk arises from changes in interest rates that may adversely affect the expected gains or market value of financial assets and liabilities reported on the balance sheet (fair value of financial instruments). The Group accepts the exposure to interest rate risk that may affect their fair value as well as the cash flow risk of future assets and liabilities.
The Risk Committee sets the guidelines regarding the level of unmatched repricing of interest rates that can be tolerated, which is periodically monitored through ALM.
Corporate policies include guidelines for the management of the Group’s exposure to interest rate risk. These guidelines are implemented considering the features of each segment of business in which the Group entities operate.
In this regard, Group companies that are exposed to the interest rate risk are those in which earnings are based on interest, such as credits, investments and technical reserves. Interest rate risk management at BCP, BCP Bolivia, MiBanco, Atlantic Security Bank and Grupo Pacifico is carried out by performing a repricing gap analysis, sensitivity analysis of the profit margin and sensitivity analysis of the net economic value. These calculations consider parallel rate shocks from +- 50 pbs to +-150 pbs and stress scenarios.
Re-pricing Gap
The re-pricing gap analysis consists of aggregating re-pricing timeframes into buckets and checking if each bucket nets to zero. Different bucketing schemes may be used. An interest rate gap is simply a positive or negative net re-pricing timeframe for any of the buckets. By this analysis, management can identify the tranches in which the interest rate variations may have a potential impact.
| 241 |
The tables below summarize our exposure to interest rate risks for the years 2015, 2016 and 2017. It includes our financial instruments at carrying amounts, categorized by the earlier of contractual re-pricing or maturity dates:
| As of December 31, 2015 | ||||||||||||||||||||||||||||
| Up to 1 | 1 to 3 | 3 to 12 | 1 to 5 | More than 5 | Non-interest | Total | ||||||||||||||||||||||
| month | months | months | years | years | bearing | |||||||||||||||||||||||
| Soles in thousands | ||||||||||||||||||||||||||||
| Assets | ||||||||||||||||||||||||||||
| Cash, due from banks, receivables from reverse repurchase agreements and security borrowing | 10,799,728 | 1,730,819 | 2,448,242 | 14,175,954 | 85,441 | 4,178,258 | 33,418,442 | |||||||||||||||||||||
| Investments | 995,468 | 1,808,027 | 2,618,982 | 7,004,151 | 7,018,588 | 2,905,834 | 22,351,050 | |||||||||||||||||||||
| Loans, net | 9,926,677 | 15,596,640 | 21,901,169 | 29,102,306 | 9,961,370 | 86,488,162 | ||||||||||||||||||||||
| Financial assets designated at fair value through profit and loss | - | - | - | - | - | 350,328 | 350,328 | |||||||||||||||||||||
| Premiums and other policies receivables | 552,802 | 72,447 | 22,768 | - | - | - | 648,017 | |||||||||||||||||||||
| Accounts receivable from re-insurers and co-insurers | 81,384 | 210,658 | 142,317 | 22,830 | - | - | 457,189 | |||||||||||||||||||||
| Other assets | - | - | - | - | - | 9,443,933 | 9,443,933 | |||||||||||||||||||||
| Total assets | 22,356,059 | 19,418,591 | 27,133,478 | 50,305,241 | 17,065,399 | 16,878,353 | 153,157,121 | |||||||||||||||||||||
| Liabilities | ||||||||||||||||||||||||||||
| Deposits and obligations | 26,822,026 | 6,712,587 | 11,968,763 | 36,154,007 | 3,811,820 | 3,137,430 | 88,606,633 | |||||||||||||||||||||
| Payables from repurchase agreements, security lending, due to banks and correspondents | 388,118 | 733,836 | 1,234,728 | 4,583,834 | 721,701 | 14,922,526 | 22,584,743 | |||||||||||||||||||||
| Financial Liabilities designated at fair value through profit or loss | - | - | - | - | - | 47,737 | 47,737 | |||||||||||||||||||||
| Accounts payable to reinsurers and coinsurers | 53,175 | 159,216 | 26,083 | 3,373 | - | - | 241,847 | |||||||||||||||||||||
| Technical, insurance claims reserves and reserves for unearned premiums | 61,112 | 359,162 | 5,187,653 | 753,700 | - | - | 6,361,627 | |||||||||||||||||||||
| Bonds and notes issued | 40,572 | 838,309 | 376,105 | 6,050,486 | 8,433,804 | 548,686 | 16,287,962 | |||||||||||||||||||||
| Other liabilities | 29,328 | 15,328 | 10,327 | 78,423 | 314,331 | 4,174,361 | 4,622,098 | |||||||||||||||||||||
| Equity | - | - | - | - | - | 16,727,570 | 16,727,570 | |||||||||||||||||||||
| Total liabilities and equity | 27,394,331 | 8,818,438 | 18,803,659 | 47,623,823 | 13,281,656 | 39,558,310 | 155,480,217 | |||||||||||||||||||||
| Off-Balance sheet items | ||||||||||||||||||||||||||||
| Derivatives assets | 230,741 | 2,077,128 | 390,901 | 3,247,496 | 5,753,166 | - | 11,699,432 | |||||||||||||||||||||
| Derivatives liabilities | 1,541,590 | 4,366,304 | 2,928,785 | 2,132,295 | 730,458 | - | 11,699,432 | |||||||||||||||||||||
| -1,310,849 | -2,289,176 | -2,537,884 | 1,115,201 | 5,022,708 | - | - | ||||||||||||||||||||||
| Marginal gap | -6,349,121 | 8,310,977 | 5,791,935 | 3,796,619 | 8,806,451 | -22,679,957 | -2,323,096 | |||||||||||||||||||||
| Accumulated gap | -6,349,121 | 1,961,856 | 7,753,791 | 11,550,410 | 20,356,861 | -2,323,096 | ||||||||||||||||||||||
| 242 |
The investments carried at fair value through profit or loss and trading derivatives are not considerate in the Re-pricing Gap because this instruments are include in the trading book; and VaR methodology it use to value this type of risk.
| As of December 31, 2016 | ||||||||||||||||||||||||||||
| Up to 1 | 1 to 3 | 3 to 12 | 1 to 5 | More than 5 | Non-interest | Total | ||||||||||||||||||||||
| month | months | months | years | years | bearing | |||||||||||||||||||||||
| Soles in thousands | ||||||||||||||||||||||||||||
| Assets | ||||||||||||||||||||||||||||
| Cash, due from banks, receivables from reverse repurchase agreements and security borrowing | 7,467,818 | 1,845,264 | 3,709,882 | 9,890,459 | 109,340 | 4,542,630 | 27,565,393 | |||||||||||||||||||||
| Investments | 1,574,831 | 465,421 | 3,913,328 | 6,261,652 | 8,908,298 | 2,680,557 | 23,804,087 | |||||||||||||||||||||
| Loans, net | 10,525,263 | 16,135,337 | 22,739,878 | 30,353,995 | 11,170,586 | -363,291 | 90,561,768 | |||||||||||||||||||||
| Financial assets designated at fair value through profit and loss | - | - | - | - | - | 459,099 | 459,099 | |||||||||||||||||||||
| Premiums and other policies receivables | 623,005 | 16,533 | 2,898 | 768 | - | - | 643,224 | |||||||||||||||||||||
| Accounts receivable from re-insurers and co-insurers | 110,263 | 202,610 | 120,159 | 21,155 | - | - | 454,187 | |||||||||||||||||||||
| Other assets | 373,946 | 5,590 | 12,537 | 7,024 | - | 8,533,348 | 8,932,445 | |||||||||||||||||||||
| Total assets | 20,675,126 | 18,670,755 | 30,498,682 | 46,535,054 | 20,188,224 | 15,852,343 | 152,420,203 | |||||||||||||||||||||
| Liabilities | ||||||||||||||||||||||||||||
| Deposits and obligations | 22,908,852 | 8,273,520 | 15,162,216 | 32,654,763 | 4,970,689 | 1,946,347 | 85,916,387 | |||||||||||||||||||||
| Payables from repurchase agreements, security lending, due to banks and correspondents | 2,765,720 | 2,031,097 | 5,747,611 | 10,146,210 | 1,825,048 | 106,229 | 22,621,915 | |||||||||||||||||||||
| Financial Liabilities designated at fair value through profit or loss | - | - | - | - | - | 209,520 | 209,520 | |||||||||||||||||||||
| Accounts payable to reinsurers and coinsurers | 32,963 | 158,957 | 36,633 | 5,339 | - | - | 233,892 | |||||||||||||||||||||
| Technical, insurance claims reserves and reserves for unearned premiums | 185,671 | 104,065 | 396,609 | 1,730,011 | 3,637,198 | 732,635 | 6,786,189 | |||||||||||||||||||||
| Bonds and notes issued | 52,366 | 40,792 | 639,238 | 8,492,272 | 6,226,773 | 488,162 | 15,939,603 | |||||||||||||||||||||
| Other liabilities | 446,131 | 1,577 | 218,539 | 190,300 | - | 3,754,658 | 4,611,205 | |||||||||||||||||||||
| Equity | - | - | - | - | - | 20,116,511 | 20,116,511 | |||||||||||||||||||||
| Total liabilities and equity | 26,391,703 | 10,610,008 | 22,200,846 | 53,218,895 | 16,659,708 | 27,354,062 | 156,435,222 | |||||||||||||||||||||
| Off-Balance sheet items | ||||||||||||||||||||||||||||
| Derivatives assets | 461,724 | 2,118,173 | 498,864 | 5,738,651 | 3,961,574 | - | 12,778,986 | |||||||||||||||||||||
| Derivatives liabilities | 1,682,988 | 4,308,673 | 2,609,747 | 3,461,322 | 716,256 | - | 12,778,986 | |||||||||||||||||||||
| Total Off-Balance Sheet items | -1,221,264 | -2,190,500 | -2,110,883 | 2,277,329 | 3,245,318 | - | - | |||||||||||||||||||||
| Marginal gap | -6,937,841 | 5,870,247 | 6,186,953 | -4,406,493 | 6,773,834 | -11,501,719 | -4,015,019 | |||||||||||||||||||||
| Accumulated gap | -6,937,841 | -1,067,594 | 5,119,359 | 712,866 | 7,486,700 | -4,015,019 | ||||||||||||||||||||||
| 243 |
The investments carried at fair value through profit or loss and trading derivatives are not considerate in the Re-pricing Gap because this instruments are include in the trading book; and VaR methodology it use to value this type of risk.
| As of December 31, 2017 | ||||||||||||||||||||||||||||
| Up to 1 | 1 to 3 | 3 to 12 | 1 to 5 | More than 5 | Non-interest | Total | ||||||||||||||||||||||
| month | months | months | years | years | bearing | |||||||||||||||||||||||
| Soles in thousands | ||||||||||||||||||||||||||||
| Assets | ||||||||||||||||||||||||||||
| Cash, due from banks, receivables from reverse repurchase agreements and security borrowing | 11,473,580 | 1,859,361 | 4,638,314 | 6,222,420 | 79,788 | 6,428,944 | 30,702,407 | |||||||||||||||||||||
| Investments | 1,642,823 | 3,789,292 | 4,013,113 | 6,208,053 | 11,072,700 | 2,111,283 | 28,837,264 | |||||||||||||||||||||
| Loans, net | 12,192,582 | 15,509,563 | 23,933,640 | 32,989,209 | 12,108,217 | -755,934 | 95,977,277 | |||||||||||||||||||||
| Financial assets designated at fair value through profit and loss | - | - | - | - | - | 537,685 | 537,685 | |||||||||||||||||||||
| Premiums and other policies receivables | 626,392 | 22,088 | 6,500 | 1,849 | - | - | 656,829 | |||||||||||||||||||||
| Accounts receivable from re-insurers and co-insurers | 163,425 | 309,669 | 208,531 | 34,070 | - | - | 715,695 | |||||||||||||||||||||
| Other assets | 180,725 | 24,927 | 9,736 | 5,946 | 577,129 | 8,221,926 | 9,020,389 | |||||||||||||||||||||
| Total assets | 26,279,527 | 21,514,900 | 32,809,834 | 45,461,547 | 23,837,834 | 16,543,904 | 166,447,546 | |||||||||||||||||||||
| Liabilities | ||||||||||||||||||||||||||||
| Deposits and obligations | 26,156,669 | 9,513,156 | 17,056,114 | 36,200,975 | 6,213,829 | 2,029,668 | 97,170,411 | |||||||||||||||||||||
| Payables from repurchase agreements, security lending, due to banks and correspondents | 4,070,558 | 1,949,926 | 6,931,824 | 6,056,395 | 2,153,396 | 250,633 | 21,412,732 | |||||||||||||||||||||
| Financial Liabilities designated at fair value through profit or loss | - | - | - | - | - | 168,089 | 168,089 | |||||||||||||||||||||
| Accounts payable to reinsurers and coinsurers | 51,814 | 141,708 | 31,726 | 9,937 | - | - | 235,185 | |||||||||||||||||||||
| Technical, insurance claims reserves and reserves for unearned premiums | 200,307 | 118,642 | 443,141 | 1,918,617 | 3,922,902 | 840,151 | 7,443,760 | |||||||||||||||||||||
| Bonds and notes issued | 791,247 | 1,656 | 395,125 | 11,998,887 | 2,973,831 | 81,511 | 16,242,257 | |||||||||||||||||||||
| Other liabilities | 155,851 | 211,103 | 2,434 | - | - | 5,176,758 | 5,546,146 | |||||||||||||||||||||
| Equity | - | - | - | - | - | 22,253,703 | 22,253,703 | |||||||||||||||||||||
| Total liabilities and equity | 31,426,446 | 11,936,191 | 24,860,364 | 56,184,811 | 15,263,958 | 30,800,513 | 170,472,283 | |||||||||||||||||||||
| Off-Balance sheet items | ||||||||||||||||||||||||||||
| Derivatives assets | 1,397,860 | 2,023,671 | 426,309 | 6,993,576 | 2,393,197 | - | 13,234,613 | |||||||||||||||||||||
| Derivatives liabilities | 4,153,574 | 4,460,947 | 181,534 | 3,944,123 | 494,435 | - | 13,234,613 | |||||||||||||||||||||
| Total Off-Balance Sheet items | -2,755,714 | -2,437,276 | 244,775 | 3,049,453 | 1,898,762 | - | - | |||||||||||||||||||||
| Marginal gap | -7,902,633 | 7,141,433 | 8,194,245 | -7,673,811 | 10,472,638 | -14,256,609 | -4,024,737 | |||||||||||||||||||||
| Accumulated gap | -7,902,633 | -761,200 | 7,433,045 | -240,766 | 10,231,872 | -4,024,737 | ||||||||||||||||||||||
The investments carried at fair value through profit or loss and trading derivatives are not considerate in the Re-pricing Gap because this instruments are include in the trading book; and VaR methodology it use to value this type of risk.
| 244 |
(9) Sensitivity to Changes in Interest Rates
The sensitivity analysis of a reasonable possible change in interest rates on the ALM book comprises an assessment of the sensibility of the financial margins, which seeks to measure the potential changes in interest accruals over a period of time and the expected parallel movement of the interest rate curves as well as the sensitivity of the net economic value, which is a long-term metric measured as the difference arising between the net book value of net assets and liabilities before and after a variation in interest rates.
The sensitivity of the consolidated statements of income is the effect of the assumed changes in interest rates on the net interest income before income tax and non-controlling interest for one year, based on the floating rate of non-trading financial assets and financial liabilities held at December 31, 2017, 2016 and 2015, including the effect of derivatives instruments. The sensitivity of net economic value is calculated by revaluing interest rates from available-for-sale fixed income and held to maturity financial assets, before income tax and non-controlling interest, including the effect of any associated hedges and derivatives instruments designated as cash flow hedges. In managing interest rate risk, no distinction is made by accounting category of the investments comprising the ALM Book, including instruments classified as available-for-sale and held to maturity investments.
The analysis includes the effect of any associated hedges and derivative instruments designated as cash flow hedges, as of December 31, 2015, 2016 and 2017:
| As of December 31, 2015 | ||||||||||||||||||
|
Interest Rates
Changes in |
Sensitivity of | Sensitivity of | ||||||||||||||||
| Currency | basis points | financial margin | Economic Value | |||||||||||||||
| Soles in thousands | ||||||||||||||||||
| Peruvian Currency | +/- | 50 | +/- | 5,344 | -/+ | 238,943 | ||||||||||||
| Peruvian Currency | +/- | 75 | +/- | 8,016 | -/+ | 358,415 | ||||||||||||
| Peruvian Currency | +/- | 100 | +/- | 10,688 | -/+ | 477,886 | ||||||||||||
| Peruvian Currency | +/- | 150 | +/- | 16,032 | -/+ | 716,829 | ||||||||||||
| U.S. Dollar | +/- | 50 | +/- | 4,978 | +/- | 50,217 | ||||||||||||
| U.S. Dollar | +/- | 75 | +/- | 7,467 | +/- | 75,326 | ||||||||||||
| U.S. Dollar | +/- | 100 | +/- | 9,956 | +/- | 100,435 | ||||||||||||
| U.S. Dollar | +/- | 150 | +/- | 14,934 | +/- | 150,652 | ||||||||||||
| 245 |
| As of December 31, 2016 | ||||||||||||||||||
|
Interest Rates
Changes in |
Sensitivity of | Sensitivity of | ||||||||||||||||
| Currency | basis points | financial margin | economic value | |||||||||||||||
| Soles in thousands | ||||||||||||||||||
| Peruvian Currency | +/- | 50 | -/+ | 8,851 | -/+ | 285,263 | ||||||||||||
| Peruvian Currency | +/- | 75 | -/+ | 13,276 | -/+ | 427,895 | ||||||||||||
| Peruvian Currency | +/- | 100 | -/+ | 17,701 | -/+ | 570,526 | ||||||||||||
| Peruvian Currency | +/- | 150 | -/+ | 26,552 | -/+ | 855,790 | ||||||||||||
| U.S. Dollar | +/- | 50 | +/- | 12,613 | -/+ | 146,292 | ||||||||||||
| U.S. Dollar | +/- | 75 | +/- | 18,919 | -/+ | 219,438 | ||||||||||||
| U.S. Dollar | +/- | 100 | +/- | 25,226 | -/+ | 292,584 | ||||||||||||
| U.S. Dollar | +/- | 150 | +/- | 37,838 | -/+ | 438,876 | ||||||||||||
| As of December 31, 2017 | ||||||||||||||||||
|
Interest Rates
Changes in |
Sensitivity of | Sensitivity of | ||||||||||||||||
| Currency | basis points | financial margin | economic value | |||||||||||||||
| Soles in thousands | ||||||||||||||||||
| Peruvian Currency | +/- | 50 | -/+ | 1,451 | -/+ | 354,899 | ||||||||||||
| Peruvian Currency | +/- | 75 | -/+ | 2,176 | -/+ | 532,348 | ||||||||||||
| Peruvian Currency | +/- | 100 | -/+ | 2,901 | -/+ | 709,798 | ||||||||||||
| Peruvian Currency | +/- | 150 | -/+ | 4,352 | -/+ | 1,064,696 | ||||||||||||
| U.S. Dollar | +/- | 50 | +/- | 8,068 | -/+ | 129,876 | ||||||||||||
| U.S. Dollar | +/- | 75 | +/- | 12,103 | -/+ | 194,813 | ||||||||||||
| U.S. Dollar | +/- | 100 | +/- | 16,137 | -/+ | 259,751 | ||||||||||||
| U.S. Dollar | +/- | 150 | +/- | 24,205 | -/+ | 389,627 | ||||||||||||
The interest rate sensitivities set out in the tables above are illustrative only and are based on simplified scenarios. The figures represent the effect of the pro-forma movements in the net interest income based on the projected yield curve scenarios and the Group’s current interest rate risk profile. This effect, however, does not incorporate actions that would be taken by Management to mitigate the impact of this interest rate risk. In addition, the Group seeks proactively to change the interest rate risk profile to minimize losses and optimize net revenues. The projections above also assume that interest rate of all maturities move by the same amount and, therefore, do not reflect the potential impact on net interest income of some rates changing while others remain unchanged. The projections make other simplifying assumptions too, including that all positions run to maturity.
| 246 |
Our positions held in equity securities, mutual funds and hedge funds are not considered part of investment securities for sensitivity calculation purposes; however, presented below is a table that demonstrates how our expected unrealized gain or loss (before income taxes) on equity securities, mutual funds, and hedge funds (as of December 31, 2017, 2016 and 2015) would correspond to changes in market prices of these securities at the 10%, 25% and 30% levels:
| Market price | Changes in | 2015 | 2016 | 2017 | ||||||||||||
| sensitivity | market prices % | Soles in thousands | ||||||||||||||
| Equity securities | +/- 10 | 149,449 | 130,750 | 81,664 | ||||||||||||
| Equity securities | +/- 25 | 363,023 | 326,875 | 204,161 | ||||||||||||
| Equity securities | +/- 30 | 436,348 | 392,250 | 244,993 | ||||||||||||
| Mutual funds | +/- 10 | 16,085 | 29,234 | 40,937 | ||||||||||||
| Mutual funds | +/- 25 | 40,212 | 73,085 | 102,343 | ||||||||||||
| Mutual funds | +/- 30 | 48,254 | 87,701 | 122,811 | ||||||||||||
| Hedge funds | +/- 10 | 13,319 | 110 | 106 | ||||||||||||
| Hedge funds | +/- 25 | 33,299 | 274 | 266 | ||||||||||||
| Hedge funds | +/- 30 | 39,958 | 329 | 319 | ||||||||||||
Commitments in liabilities at fair value (short sales) are related to fixed income and equity financial instruments, and have maturities of one month or less; therefore, the Group expects minimal price fluctuations. As a result, the Group is not subject to significant price risk on these financial liabilities.
(10) Foreign Exchange Risk
Our financial position and cash flows are exposed to foreign currency exchange rates. Our management sets limits on the level of total exposure to foreign currencies, which are monitored daily. Foreign currency transactions are executed using the free market exchange rates applicable in countries in which Credicorp’s subsidiaries operate. As of December 31, 2015, 2016 and 2017, the Group’s assets and liabilities by currencies were as follows:
| 247 |
| Peruvian | Other | |||||||||||||||
| 2015 | currency | U.S. Dollars | currencies | Total | ||||||||||||
| Soles in thousands | ||||||||||||||||
| Monetary assets - | ||||||||||||||||
| Cash and due from banks | 2,629,447 | 18,133,335 | 1,628,962 | 22,391,744 | ||||||||||||
| Receivables from reverse repurchase agreements and security borrowings | - | 10,080,794 | 945,904 | 11,026,698 | ||||||||||||
| Trading securities | 1,437,617 | 199,438 | 686,042 | 2,323,097 | ||||||||||||
| Available-for-sale investments | 7,835,615 | 8,924,280 | 629,409 | 17,389,304 | ||||||||||||
| Held-to-maturity investments | 2,872,865 | 709,264 | - | 3,582,129 | ||||||||||||
| Loans, net | 51,525,096 | 30,358,072 | 4,604,993 | 86,488,161 | ||||||||||||
| Financial assets designated to fair value through profit or loss | 52,369 | 297,959 | - | 350,328 | ||||||||||||
| Other assets | 1,626,686 | 2,059,415 | 509,557 | 4,195,658 | ||||||||||||
| 67,979,695 | 70,762,557 | 9,004,867 | 147,747,119 | |||||||||||||
| Monetary liabilities - | ||||||||||||||||
| Deposits and obligations | (36,446,886 | ) | (45,696,802 | ) | (6,462,945 | ) | (88,606,633 | ) | ||||||||
| Payables from repurchase agreements and security lending | (11,673,446 | ) | (1,503,347 | ) | (1,422,957 | ) | (14,599,750 | ) | ||||||||
| Due to bank and correspondents | (2,379,021 | ) | (5,184,659 | ) | (198,817 | ) | (7,762,497 | ) | ||||||||
| Financial liabilities designated at fair value through profit or loss | - | (47,737 | ) | - | (47,737 | ) | ||||||||||
| Insurance claims reserves and technical reserves | (2,699,351 | ) | (3,661,014 | ) | (1,263 | ) | (6,361,628 | ) | ||||||||
| Bonds and subordinated notes issued | (2,171,074 | ) | (14,010,489 | ) | (106,399 | ) | (16,287,962 | ) | ||||||||
| Other liabilities | (2,942,934 | ) | (1,510,666 | ) | (632,842 | ) | (5,086,442 | ) | ||||||||
| (58,312,712 | ) | (71,614,714 | ) | (8,825,223 | ) | (138,752,649 | ) | |||||||||
| 9,666,983 | (852,157 | ) | 179,644 | 8,994,470 | ||||||||||||
| Forwards position, net | 6,011,253 | (6,707,587 | ) | 696,334 | - | |||||||||||
| Currency swaps position, net | (9,997,505 | ) | 10,084,091 | (86,586 | ) | - | ||||||||||
| Cross-currency swaps position, net | - | - | - | |||||||||||||
| Options, net | 543,066 | (543,066 | ) | - | - | |||||||||||
| Net monetary position | 6,223,797 | 1,981,281 | 789,392 | 8,994,470 | ||||||||||||
| Peruvian | Other | |||||||||||||||
| 2016 | currency | U.S. Dollars | currencies | Total | ||||||||||||
| Soles in thousands | ||||||||||||||||
| Monetary assets - | ||||||||||||||||
| Cash and due from banks | 2,675,238 | 12,131,203 | 1,839,328 | 16,645,769 | ||||||||||||
| Receivables from reverse repurchase agreements and security borrowings | 4,021 | 10,621,045 | 294,558 | 10,919,624 | ||||||||||||
| Trading securities | 2,433,444 | 172,999 | 1,408,576 | 4,015,019 | ||||||||||||
| Available-for-sale investments | 8,326,735 | 7,301,306 | 367,248 | 15,995,289 | ||||||||||||
| Held-to-maturity investments | 4,102,739 | 1,015,681 | - | 5,118,420 | ||||||||||||
| Loans, net | 53,118,275 | 32,215,401 | 5,228,092 | 90,561,768 | ||||||||||||
| Financial assets designated to fair value through profit or loss | 85,333 | 373,766 | - | 459,099 | ||||||||||||
| Other assets | 1,456,407 | 1,993,385 | 538,039 | 3,987,831 | ||||||||||||
| 72,202,192 | 65,824,786 | 9,675,841 | 147,702,819 | |||||||||||||
| Monetary liabilities - | ||||||||||||||||
| Deposits and obligations | (37,468,123 | ) | (41,514,198 | ) | (6,934,066 | ) | (85,916,387 | ) | ||||||||
| Payables from repurchase agreements and security lending | (12,522,337 | ) | (1,313,163 | ) | (1,292,499 | ) | (15,127,999 | ) | ||||||||
| Due to bank and correspondents | (2,630,256 | ) | (4,644,838 | ) | (218,822 | ) | (7,493,916 | ) | ||||||||
| Financial liabilities designated at fair value through profit or loss | - | (6,052 | ) | (203,468 | ) | (209,520 | ) | |||||||||
| Insurance claims reserves and technical reserves | (3,134,680 | ) | (3,650,466 | ) | (1,043 | ) | (6,786,189 | ) | ||||||||
| Bonds and subordinated notes issued | (2,544,031 | ) | (13,291,371 | ) | (104,201 | ) | (15,939,603 | ) | ||||||||
| Other liabilities | (2,434,407 | ) | (1,492,911 | ) | (917,779 | ) | (4,845,097 | ) | ||||||||
| (60,733,834 | ) | (65,912,999 | ) | (9,671,878 | ) | (136,318,711 | ) | |||||||||
| 11,468,358 | (88,213 | ) | 3,963 | 11,384,108 | ||||||||||||
| Forwards position, net | 508,304 | (529,352 | ) | (93,844 | ) | (114,892 | ) | |||||||||
| Currency swaps position, net | 245,063 | (245,098 | ) | 35 | - | |||||||||||
| Cross-currency swaps position, net | (1,340,985 | ) | 1,433,012 | (92,027 | ) | - | ||||||||||
| Options, net | (86,059 | ) | 86,059 | - | - | |||||||||||
| Net monetary position | 10,794,681 | 656,408 | (181,873 | ) | 11,269,216 | |||||||||||
| 248 |
| Peruvian | Other | |||||||||||||||
| 2017 | currency | U.S. Dollars | currencies | Total | ||||||||||||
| Soles in thousands | ||||||||||||||||
| Monetary assets - | ||||||||||||||||
| Cash and due from banks | 3,149,300 | 18,578,798 | 1,493,889 | 23,221,987 | ||||||||||||
| Receivables from reverse repurchase agreements and security borrowings | 119,976 | 6,915,937 | 444,507 | 7,480,420 | ||||||||||||
| Trading securities | 2,222,061 | 209,543 | 1,593,133 | 4,024,737 | ||||||||||||
| Available-for-sale investments | 13,804,121 | 7,697,970 | 810,517 | 22,312,608 | ||||||||||||
| Held-to-maturity investments | 3,453,790 | 959,583 | - | 4,413,373 | ||||||||||||
| Loans, net | 56,226,385 | 33,580,636 | 6,170,256 | 95,977,277 | ||||||||||||
| Financial assets designated to fair value through profit or loss | 48,454 | 489,231 | - | 537,685 | ||||||||||||
| Other assets | 1,219,985 | 2,268,659 | 876,864 | 4,365,508 | ||||||||||||
| 80,244,072 | 70,700,357 | 11,389,166 | 162,333,595 | |||||||||||||
| Monetary liabilities - | ||||||||||||||||
| Deposits and obligations | (43,334,026 | ) | (45,875,469 | ) | (7,960,916 | ) | (97,170,411 | ) | ||||||||
| Payables from repurchase agreements and security lending | (10,155,790 | ) | (1,582,783 | ) | (1,677,270 | ) | (13,415,843 | ) | ||||||||
| Due to bank and correspondents | (3,229,753 | ) | (4,463,659 | ) | (303,477 | ) | (7,996,889 | ) | ||||||||
| Financial liabilities designated at fair value through profit or loss | (3,094 | ) | (26,057 | ) | (138,938 | ) | (168,089 | ) | ||||||||
| Insurance claims reserves and technical reserves | (3,632,896 | ) | (3,809,742 | ) | (1,122 | ) | (7,443,760 | ) | ||||||||
| Bonds and subordinated notes issued | (3,869,494 | ) | (12,271,451 | ) | (101,312 | ) | (16,242,257 | ) | ||||||||
| Other liabilities | (2,737,797 | ) | (2,030,093 | ) | (1,013,441 | ) | (5,781,331 | ) | ||||||||
| (66,962,850 | ) | (70,059,254 | ) | (11,196,476 | ) | (148,218,580 | ) | |||||||||
| 13,281,222 | 641,103 | 192,690 | 14,115,015 | |||||||||||||
| Forwards position, net | 859,439 | (824,434 | ) | (19,186 | ) | 15,819 | ||||||||||
| Currency swaps position, net | 370,697 | (371,301 | ) | 3,776 | 3,172 | |||||||||||
| Cross-currency swaps position, net | (1,725,567 | ) | 1,814,960 | (92,565 | ) | (3,172 | ) | |||||||||
| Options, net | 60,704 | (60,704 | ) | - | - | |||||||||||
| Net monetary position | 12,846,495 | 1,199,624 | 84,715 | 14,130,834 | ||||||||||||
We manage foreign exchange risk by monitoring and controlling the position values due to changes in exchange rates. We measure its performance in Soles (since 2014 considering its change in functional currency, before it was measure in U.S. Dollars), so if the net foreign exchange position (e.g. U.S. Dollar) is an asset, any depreciation of the Soles with respect to this currency would affect positively our consolidated statements of financial position. The current position in a foreign currency comprises exchange rate-linked assets and liabilities in that currency. An institution’s open position in individual currencies comprises assets, liabilities and off-balance sheet items denominated in the respective foreign currency for which the institution itself bears the risk; any appreciation/depreciation of the foreign exchange would affect the consolidated income statement.
As of December 31, 2017, Credicorp’s net foreign exchange balance is the sum of its positive open non-Soles positions (net long position) less the sum of its negative open non-Soles positions (net short position). A currency mismatch would leave Credicorp’s consolidated statements of financial position vulnerable to a fluctuation of the foreign currency (exchange rate shock).
| 249 |
The table below shows the sensitivity analysis of the U.S. Dollar, the currency to which the Group had significant exposure as of December 31, 2017 on its monetary assets and liabilities and its forecast cash flows. The analysis calculates the effect of a reasonably possible movement of the currency rate against Soles, with all other variables held constant on the consolidated statements of income, before income tax. A negative amount in the table reflects a potential net reduction in consolidated statements of income, while a positive amount reflects a net potential increase:
| Sensitivity Analysis | Change in Currency Rates | 2016 | 2017 | |||||||||
| % | Soles in thousands | Soles in thousands | ||||||||||
| Depreciation - | ||||||||||||
| U.S. Dollar | 5 | (31,257 | ) | (57,125 | ) | |||||||
| U.S. Dollar | 10 | (59,673 | ) | (109,057 | ) | |||||||
| Appreciation - | ||||||||||||
| U.S. Dollar | 5 | 34,548 | 63,138 | |||||||||
| U.S. Dollar | 10 | 72,934 | 133,292 | |||||||||
Risk in the Insurance Activity and the Operational Risk
Both the operational risk, which measures the probability of loss of the business operations, and the insurance activity, which measures the real cost of claims and benefit payments or the timing thereof, are important for the Group’s risk management. Also, the manner in which these risks are identified, evaluated, measured, treated and controlled definitions is defined and explained in the notes to the audited financial statements, 32.4 Operational Risk and 32.5 Risk of the insurance activity.
| ITEM 12. | DESCRIPTION OF SECURITIES OTHER THAN EQUITY SECURITIES |
Not applicable.
| 250 |
| ITEM 13. | DEFAULTS, DIVIDEND ARREARAGES AND DELINQUENCIES |
| 13. A | Material Defaults |
Neither we, nor any of our subsidiaries, have ever defaulted on any of our debt or have ever been forced to reschedule any of our obligations.
| 13. B | Dividend Arrearages and Delinquencies |
None.
| ITEM 14. | MATERIAL MODIFICATIONS TO THE RIGHTS OF SECURITY HOLDERS AND USE OF PROCEEDS |
None.
| ITEM 15. | CONTROLS AND PROCEDURES |
| 15. A | Disclosure Controls and Procedures |
Our management, with the participation of and under the supervision of our principal executive officer and principal financial officer, has evaluated the effectiveness of the design and operation of our disclosure controls and procedures (as defined in Exchange Act Rules 13a-15(e) and 15d-15(e)) as of December 31, 2017. Based on this evaluation, our management, principal executive officer, and principal financial officer have concluded that our disclosure controls and procedures are effective in ensuring that information that we are required to disclose in reports that we file or submit under the Exchange Act is recorded, processed, summarized, and reported within the time periods specified in SEC rules and forms.
| 15. B | Management’s Annual Report on Internal Control over Financial Reporting |
Our Board of Directors and management are responsible for establishing and maintaining adequate internal control over financial reporting. Our internal control over financial reporting is designed to provide reasonable assurance regarding the reliability of financial reporting and the preparation and fair presentation of published financial statements in accordance with International Financial Reporting Standards, or IFRS, as issued by the International Accounting Standards Board, the IASB.
| 251 |
Our internal control over financial reporting includes policies and procedures that:
• Pertain to the maintenance of records that, in reasonable detail, accurately and fairly reflect transactions and dispositions of assets;
• Provide reasonable assurance that transactions are recorded as necessary to permit preparation of financial statements, and our receipts and expenditures are being made only in accordance with authorizations of our management and IFRS; and
• Provide reasonable assurance regarding prevention or timely detection of unauthorized acquisition, use, or disposition of our assets that could have a material effect on our financial statements.
Because of inherent limitations, internal controls over financial reporting may not prevent or detect misstatements. Also, projections about the effectiveness of our internal controls are subject to the risk that controls will become inadequate because of changes in conditions or deterioration in compliance with policies or procedure.
Our management assessed the effectiveness of our internal control over financial reporting as of December 31, 2017 based on the framework set forth by the Committee of Sponsoring Organizations of the Treadway Commission, or COSO, in Internal Control-Integrated Framework version 2013. Based on this assessment, our management identified no material weakness in our internal control over financial reporting and concluded that, as of December 31, 2017, our internal control over financial reporting was effective, which means that each of the relevant components and seventeen principles are present and functioning and the five components operate together in an integrated manner. Our management also found no material weaknesses in our internal control over financial reporting and therefore no corrective actions were taken.
The effectiveness of our internal control over financial reporting as of December 31, 2017 has been audited by Gaveglio Aparicio y Asociados S. Civil de R.L (member firm of PricewaterhouseCoopers), our independent registered public accounting firm. As stated in their report included herein, Gaveglio Aparicio y Asociados S.Civil de R.L has expressed an unqualified opinion on the effectiveness of our internal control over financial reporting as of December 31, 2017.
| 252 |
| 15. C | Attestation Report of Independent Registered Public Accounting Firm |
To The Board of Directors and shareholders of Credicorp Ltd. and its subsidiaries
Opinions on the Financial Statements and Internal Control over Financial Reporting
We have audited the accompanying consolidated balance sheets of Credicorp Ltd. and its subsidiaries as of December 31, 2017 and 2016, and the related consolidated statements of income, comprehensive income, changes in equity and cash flows for each of the three years in the period ended December 31, 2017, including the related notes (collectively referred to as the “consolidated financial statements”). We also have audited the Company’s internal control over financial reporting as of December 31, 2017, based on criteria established in Internal Control – Integrated Framework (2013) issued by the Committee of Sponsoring Organizations of the Treadway Commission (COSO).
In our opinion, the consolidated financial statements referred to above present fairly, in all material respects, the financial position of the Company as of December 31, 2017 and 2016, and the results of their operations and their cash flows for each of the three years in the period ended December 31, 2017 in conformity with International Financial Reporting Standards issued by the International Accounting Standards Board. Also in our opinion, the Company maintained, in all material respects, effective internal control over financial reporting as of December 31, 2017, based on criteria established in Internal Control - Integrated Framework (2013) issued by the COSO.
Basis for Opinions
The Company's management is responsible for these consolidated financial statements, for maintaining effective internal control over financial reporting, and for its assessment of the effectiveness of internal control over financial reporting, included in the accompanying Management's Annual Report on Internal Control over Financial Reporting. Our responsibility is to express opinions on the Company’s consolidated financial statements and on the Company's internal control over financial reporting based on our audits. We are a public accounting firm registered with the Public Company Accounting Oversight Board (United States) ("PCAOB") and are required to be independent with respect to the Company in accordance with the U.S. federal securities laws and the applicable rules and regulations of the Securities and Exchange Commission and the PCAOB.
| 253 |
We conducted our audits in accordance with the standards of the PCAOB. Those standards require that we plan and perform the audits to obtain reasonable assurance about whether the consolidated financial statements are free of material misstatement, whether due to error or fraud, and whether effective internal control over financial reporting was maintained in all material respects.
Our audits of the consolidated financial statements included performing procedures to assess the risks of material misstatement of the consolidated financial statements, whether due to error or fraud, and performing procedures that respond to those risks. Such procedures included examining, on a test basis, evidence regarding the amounts and disclosures in the consolidated financial statements. Our audits also included evaluating the accounting principles used and significant estimates made by management, as well as evaluating the overall presentation of the consolidated financial statements. Our audit of internal control over financial reporting included obtaining an understanding of internal control over financial reporting, assessing the risk that a material weakness exists, and testing and evaluating the design and operating effectiveness of internal control based on the assessed risk. Our audits also included performing such other procedures as we considered necessary in the circumstances. We believe that our audits provide a reasonable basis for our opinions.
Definition and Limitations of Internal Control over Financial Reporting
A company’s internal control over financial reporting is a process designed to provide reasonable assurance regarding the reliability of financial reporting and the preparation of financial statements for external purposes in accordance with generally accepted accounting principles. A company’s internal control over financial reporting includes those policies and procedures that (i) pertain to the maintenance of records that, in reasonable detail, accurately and fairly reflect the transactions and dispositions of the assets of the company; (ii) provide reasonable assurance that transactions are recorded as necessary to permit preparation of financial statements in accordance with generally accepted accounting principles, and that receipts and expenditures of the company are being made only in accordance with authorizations of management and directors of the company; and (iii) provide reasonable assurance regarding prevention or timely detection of unauthorized acquisition, use, or disposition of the company’s assets that could have a material effect on the financial statements.
Because of its inherent limitations, internal control over financial reporting may not prevent or detect misstatements. Also, projections of any evaluation of effectiveness to future periods are subject to the risk that controls may become inadequate because of changes in conditions, or that the degree of compliance with the policies or procedures may deteriorate.
| 254 |
| Lima, Peru | |
| April 26, 2018 | |
| /S/ Gaveglio, Aparicio y Asociados S.C.R.L | |
| We have served as the Company’s auditor since 2015. | |
| Countersigned by | |
| —————————————— (partner) | |
| /S/Fernando Gaveglio | |
| Peruvian Certified Public Accountant | |
| Registration No. 01-019847 |
| 15. D | Changes in Internal Control over Financial Reporting |
During the period covered by this Annual Report, no changes were made to our internal control over financial reporting that have materially affected, or are likely to materially affect, internal control over financial reporting.
| ITEM 15T. | CONTROLS AND PROCEDURES |
Not applicable.
| 255 |
| ITEM 16A. | AUDIT COMMITTEE FINANCIAL EXPERT |
At the Annual General Meeting of Shareholders held on March 31, 2017, shareholders elected the new members of the Board of Directors of Credicorp as explained in Item 6. Directors, Senior Management and Employees - 6. A Directors and Senior Management. Furthermore, our Board of Directors, in its meeting held on April 26, 2017 appointed the following members to the Audit Committee: Mr. Raimundo Morales Dasso (Chairman since July 2011), Ms. Patricia Lizarraga Guthertz and Mr. Benedicto Cigüeñas Guevara (financial expert).
Mr. Morales, Ms. Lizarraga and Mr. Cigüeñas are “independent” as defined in Rule 10A-3 under the Exchange Act and in Section 303A.02 of the NYSE Listed Company Manual.
Mr. Cigüeñas, our Audit Committee Financial Expert, has been a Director of Credicorp Ltd, Banco de Credito del Peru – BCP and Mibanco from January 2014 to date, January 2005 to date and 2014 to date, respectively. From 1992 to 2004, Mr. Cigüeñas served as Chief Financial Officer at BCP and Credicorp. Previously, he was Peru’s Vice Minister of Economy and Finance from 1979 to 1981, and was also an executive at the Peruvian Central Bank- BCRP from 1966 to 1971. Mr. Cigüeñas also served as CEO of Banco Continental (today BBVA Continental); Banco de la Nacion (State-owned banck); and Banco Exterior de los Andes y de España (Regional Office in Peru). Mr. Cigüeñas brings to the Board of Directors his deep knowledge of financial matters and macroeconomic policy as well as his extensive experience in Credicorp’s businesses.
Mr. Cigüeñas is an Economist from the Universidad Catolica del Peru and has a Master’s degree from Colegio de Mexico.
| ITEM 16B. | CODE OF ETHICS |
We have adopted a code of ethics (Codigo de Etica) that applies to our board of directors, including our chief executive officer, chief financial officer, and our other principal executive officers, as well as to all other employees. In addition, we have adopted a code of ethics for professionals with financial responsibility (Codigo de Etica Para Profesionales con Responsibilidad Financiera) that applies to employees with financial management responsibilities. Our code of ethics and code of ethics for professionals with financial responsibility are available on the corporate governance section of our web site at www.credicorpnet.com .
| 256 |
| ITEM 16C. | PRINCIPAL ACCOUNTANT FEES AND SERVICES |
Audit Committee Pre-Approval Policies and Procedures
The Audit Committee must approve all of the services that the independent external auditor provides as part of its responsibility to supervise the internal auditor’s work. The Audit Committee provides two types of approvals as set forth below:
| (1) | The Audit Committee grants a “general approval” in advance for services that the independent external auditor may provide. After a general approval is given, further approval from the Audit Committee is required. A general approval is valid for 12 months from the date of approval unless the Audit Committee determines a different period shall apply. The Audit Committee is regularly informed of the services provided through the general approval process. |
| (2) | The Audit Committee also grants “specific approval” on case-by-case basis for services that do not have general approval. All of the services that are not granted general approval need specific approval from the Audit Committee before any agreement is signed with the independent external auditor to provide such services. Any service that exceeds approved costs or budgets will need specific approval from the Audit Committee. The Audit Committee has set a limit on all tax and other fees, which cannot be greater than 35% of total auditor’s fees during a fiscal year. The Audit Committee may change this limit based upon our corporate needs and the complexity of the service provided by the independent external auditor. When considering granting any type of approval, the Audit Committee takes into account whether the requested services are consistent with the SEC’s rules regarding the independence of the independent external auditor. |
As necessary, the Audit Committee supervises the execution of services provided by the independent external auditor. It approves, when necessary, any modification in the terms, conditions, fees, and extent of the audit services. The Audit Committee may give a general approval for other audit services where the independent external auditor is in the best position to provide those services. Such services typically include: audit services required by regulations, financial audits for our subsidiaries or affiliates, and services associated with the presentation of documents to the SEC or other documents published in connection with the trading of our shares.
| 257 |
The Audit Committee may award a general approval to audit-related services if the committee believes that these services will not negatively affect the integrity of the independent external auditor and are consistent with SEC rules.
Consistent with SEC rules, the Audit Committee requires that all tax services provided by the independent external auditor be subject to its approval. The Audit Committee may grant a specific approval for other services provided by the independent external auditor as long as they do not impair the independence of the independent external auditor and are permissible under SEC rules.
Furthermore, in accordance with a proposal made by the Audit Committee, in 2013, the Board of Directors of Credicorp engaged in a process to select and appoint the company that will act as our independent external auditor for a period of 5 years starting in 2015. The companies invited to participate in the selection process were the four most prominent auditors with operations in the countries where Credicorp’s subsidiaries operate: Ernst and Young (“EY”), PricewaterhouseCoopers, KPMG, and Deloitte. After analyzing the proposals, the Audit Committee agreed to recommend EY to serve as the independent external auditor of Credicorp and its subsidiaries for the fiscal year 2014 and Gaveglio, Aparicio y Asociados S. Civil de R.L, a member firm of PricewaterhouseCoopers for a period of 5 years starting on January 1, 2015 and ending on December 31, 2019. Our Board of Directors’ continued support for PricewaterhouseCoopers during its term as independent external auditor is subject to the firm’s performance, which will be evaluated at the end of each year during its appointment.
At the Annual General Meeting of Shareholders held on March 28, 2018, the shareholders of Credicorp approved the designation of Gaveglio, Aparicio y Asociados S. Civil de R.L, a member firm of PricewaterhouseCoopers, to act as independent external auditors of Credicorp for a period of 1 year in accordance with the proposal and recommendation of the Audit Committee to our Board of Directors and authorized our Board of Directors to delegate the approval of the independent external auditor’s annual fees to its Audit Committee.
The following table sets forth, for each of the years indicated, the fees agreed to our independent external auditors, Gaveglio, Aparicio y Asociados S.C.R.L., a member of PwC, for the audit of our financial statements for the years ended December 31, 2015, 2016 and 2017.
| 258 |
| Years ended December 31, | ||||||||||||
| 2015 | 2016 | 2017 | ||||||||||
| (Soles in thousands) | ||||||||||||
| Audit (*) | 13,390 | 13,902 | 15,907 | |||||||||
| Audit – Related | 675 | 702 | 600 | |||||||||
| Tax | 501 | 912 | 357 | |||||||||
| All Other | 260 | 215 | 314 | |||||||||
| Total | 14,826 | 15,731 | 17,178 | |||||||||
(*) In 2017, this concept includes the fees charged to the associate Entidad Prestadora de Salud, for approximately S/1.4 million (S/1.1 million and S/1.0 million for 2016 and 2015, respectively).
Audit Fees correspond to audit services performed (i) reviewing Credicorp’s Consolidated Financial Statements and its subsidiaries, (ii) establishing the procedures that the independent auditor needs to perform in order to form an opinion about Credicorp’s consolidated financial statements, and (iii) complying with the statutory requirements applicable to Credicorp’s subsidiaries. Audit fees also include the audit work in connection with reviews of interim financial information. The Audit Committee approved all fees.
The increase shown in the 2017 audit fees corresponds, mainly, to the audit fee related to the additional procedures to be performed with respect to the review of the implementation of International Financial Reporting Standard N° 9 "Financial Instruments" (IFRS 9).
Audit-Related Fees relate to services that are similar to the execution of an audit or a review of Credicorp’s financial statements and which are traditionally performed by the independent auditor. Such audit-related services include: issuance of comfort letter and other services related to filling documents with regulatory bodies or regarding public offerings, assistance in the understanding of new accounting and financial rules established by regulatory entities and audit related procedures on accounting matters. The Audit Committee approved all fees.
Tax Fees relate to tax services which include all services performed by Credicorp’s independent auditor’s tax personnel, except those services specifically related to the review and preparation of Credicorp’s financial statements, and which principally consist of tax compliance and advisory services approved by the Audit Committee.
| 259 |
In 2017, other fees are mainly related to training programs and evaluation of a sample of clients from BCP Bolivia´s credit portfolio. During 2016, other fees are mainly related to: (i) training programs; and (ii) assess the current structure of the Finance organization of one of the subsidiaries of Credicorp based on benchmarking and gap analysis. In 2015, other fees are mainly related to the tax-purpose valuation provided to one of the subsidiaries of Credicorp with no direct affect in the financial statements and training programs. Audit fees corresponding to “Taxes” and “All other” paid in 2017, 2016 and 2015 were subject to the aforementioned 35% limit and represented 4%, 7% and 8%, respectively, of the total auditor’s fees.
| ITEM 16D. | EXEMPTIONS FROM THE LISTING STANDARDS FOR AUDIT COMMITTEES |
Not applicable.
| ITEM 16E. | PURCHASES OF EQUITY SECURITIES BY THE ISSUER AND AFFILIATED PURCHASERS |
During 2017, as part of their core businesses, our affiliates, Prima AFP, Atlantic Security Bank, Credicorp Capital Sociedad Administradora de Fondos, Pacifico Seguros and Credicorp Capital Bolsa made purchases in open-market transactions on behalf of our clients. Furthermore, the following purchases were made for the 2017 long-term retention plan for certain employees, as explained in Notes 3 and 19 of the financial statements.
| Period |
(a)
Total Number of Shares
(or Units) Purchased (1) |
(b) Average
Price Paid per
Share (or Units) |
(c) Total
Number of Shares (or
Units) Purchased as Part of Publicly Announced Plans or Programs |
(d) Maximum
Number (or
Approximate Dollar Value) of Shares ( or Units) that May Yet Be Purchased Under the Plans or Programs |
||||||
| March 2017 | 140,812 | US$165.83 | ||||||||
| 260 |
| ITEM 16F. | CHANGE IN REGISTRANT’S CERTIFYING ACCOUNTANT |
Not applicable.
| ITEM 16G. | CORPORATE GOVERNANCE |
| 16G. A | The New York Stock Exchange – Corporate Governance |
The NYSE’s corporate governance rules, codified in Section 303A of the NYSE’s Listed Company Manual, apply, with certain exceptions for foreign private issuers like Credicorp, in full to companies listing common equity securities on the exchange. The chart below provides a brief description of the significant differences between our corporate governance practices and those followed by U.S. companies under NYSE listing standards:
|
Section of NYSE
Listed Company Manual |
NYSE Corporate Governance Rules for
U.S. Domestic Issuers |
Credicorp Corporate Governance Practices | ||
| 303A.01 | A majority of the members of the board of directors must be “independent directors”, as defined by the NYSE. | Credicorp is not required under Bermuda Law to maintain a board of directors with a majority being independent directors. As of April 26th, 2018, four Directors out of eight are independent. | ||
| 303A.02 |
A director cannot be “independent” unless the board of directors affirmatively determines that the director has no material relationship with the listed company. In addition, a director is not independent if the director:
· is, or has been within the last three years, an employee of the listed company, or an immediate family member is, or has been within the last three years, an executive officer, of the listed company
· has received, or has an immediate family member who has received, during any twelve-month period within the last three years, more than US$120,000 in direct compensation from the listed company, other than director and committee fees and pension or other forms of deferred compensation for prior service |
Credicorp has adopted an “independence” standard that is different than the standard established by the NYSE. Credicorp’s independence standard incorporates the SEC’s minimum independence requirements applicable to directors serving on audit committees. The definition of independence is included in Credicorp’s Corporate Governance Policy. There is no similar requirement under Bermuda law.
Under our definition, a director shall be deemed to be independent if he/she meets each of the following conditions:
• He/she has no material relationship (1) with Credicorp (2) .
• He/she is not and has not been an employee of Credicorp (2) during the last twelve months.
• He/she does not have an immediate family member (3) who is currently a senior executive (4) of Credicorp (2) . |
| 261 |
|
Section of NYSE
Listed Company Manual |
NYSE Corporate Governance Rules for
U.S. Domestic Issuers |
Credicorp Corporate Governance Practices | ||
|
· (a) is a current partner or employee of a firm that is the listed company's internal or external auditor; (b) has an immediate family member who is a current partner of such a firm; (c) has an immediate family member who is a current employee of such a firm and personally works on the listed company's audit; or (d) was, or an immediate family member was, within the last three years a partner or employee of such a firm and personally worked on the listed company's audit within that time
· is, or has been with the last three years, employed as an executive officer of another company where any of the listed company's present executive officers at the same time serves or served on that company’s compensation committee
· is a current employee, or an immediate family member is a current executive officer, of a company that has made payments to, or received payments from, the listed company for property or services in an amount which, in any of the last three fiscal years, exceeds the greater of US$1 million, or 2% of such other company's consolidated gross revenues. |
• He/she has not received during the last twelve months, more than US$150,000 from Credicorp (2) , as direct compensation, other than his/her compensation as director or as a member of a committee designated by the Board of Directors.
• He/she does not have an immediate family member (3) that has received during the last twelve months, more than US$150,000 from Credicorp (2) .
• He/she is not a current partner or employee of Credicorp’s (2) current external auditing firm.
• He/she does not have an immediate family member (3) who is a partner of Credicorp’s (2) current external auditing firm, or an employee of Credicorp’s (2) current external auditing firm and who is directly involved in the audit of Credicorp (2) .
• For the last twelve months, neither he/she nor any immediate family member (3) has been a partner or an employee of Credicorp’s (2) current external auditing firm and been directly involved in the audit of Credicorp (2) .
• Neither he/she nor any immediate family member (3) is, or has been within the last twelve months, a senior executive of any company not affiliated with Credicorp (2) where any current senior executive (4) of Credicorp (2) is or has been, at the same time, a member of the Compensation Committee of such company.
• He/she is not a current employee, and none of his/her immediate family members (3) is a current senior executive, of any company not affiliated with Credicorp (2) that has made payments to, or received from, Credicorp (2) for property or services in an amount which, in any of the last twelve months, totals over US$1 million in one year and which may represent 10% or more of the consolidated gross revenue of such company in one year. |
| 262 |
|
Section of NYSE
Listed Company Manual |
NYSE Corporate Governance Rules for
U.S. Domestic Issuers |
Credicorp Corporate Governance Practices | ||
|
• He/she does not, directly or indirectly, accept any consulting, advisory or other compensatory fee from Credicorp (2) (other than (i) in his or her capacity as a member or advisor of the Audit Committee, the Board of Directors, or any other board committee, ii) as approved by the Board of Directors and which is less than US$150,000 during the last twelve months or (iii) for any fixed amounts of compensation under a retirement plan for prior service with Credicorp (2) )
• He/she is not an affiliate (5) of Credicorp (2) , an executive officer of an affiliate, an employee of an affiliate, a general partner of an affiliate or a managing member of an affiliate.
(1) Material Relationship: A material relationship may occur if a person has a direct relationship with Credicorp or if a person is a partner or shareholder holding more than 4% of Credicorp’s capital stock, or officer of an organization that has a relationship with Credicorp.
(2) Credicorp: Includes Credicorp and its subsidiaries.
(3) Immediate Family Member: Up to the second degree of consanguinity or second degree of affinity.
(4) Senior Executive: An executive officer of Credicorp (holding), or COO or Central Manager of BCP, or COO of any of its other subsidiaries.
(5) Affiliate: A person or entity that directly, or indirectly through one or more intermediaries, controls, or is controlled by, or is under common control with Credicorp.
|
||||
| 303A.03 | Non-management directors of a listed company must meet at regularly scheduled executive sessions without management. | Credicorp is not required by Bermuda law to hold regular meetings of the board of directors at which only independent directors are present. |
| 263 |
|
Section of NYSE
Listed Company Manual |
NYSE Corporate Governance Rules for
U.S. Domestic Issuers |
Credicorp Corporate Governance Practices | ||
| 303A.04 | Listed companies must have a nominating/corporate governance committee composed entirely of independent directors, with a written charter that addresses specific minimum requirements. |
Credicorp has established a Nominations Committee and a Corporate Governance Committee. The minimum requirements and procedures to be followed by each committee are set forth in Credicorp’s Corporate Governance Policy. Credicorp has adopted a charter for the Corporate Governance Committee and for the Nominations Committee.
Although these committees are not required by law to be composed entirely of independent directors (as defined by the NYSE), under Credicorp’s current Corporate Governance Policy:
· the Nominations Committee must consist of at least three directors of Credicorp or its subsidiaries; and
· the Corporate Governance Committee must be composed of at least three directors of Credicorp or its subsidiaries, and at least one of them must be independent (as determined by Credicorp).
There is no similar requirement under Bermuda law. |
||
| 303A.05 | Listed companies must have a compensation committee composed entirely of independent directors, with a written charter that addresses specific minimum requirements. | Under Bermuda law, compensation of executive officers need not be determined by an independent committee. However, Credicorp has established a Compensation Committee that reviews and approves the compensation and benefits for Credicorp’s executive officers and other key executives of Credicorp and its subsidiaries. The Committee must consist of at least three directors of Credicorp or its subsidiaries and BCP’s CEO. Although the Compensation Committee does not currently have a separate charter, Credicorp’s Corporate Governance Policy establishes minimum requirements for the committee, and provides that the committee must consist of at least three directors of Credicorp or its subsidiaries and BCP’s CEO. | ||
| 303A.06 | Listed companies must have an audit committee that satisfies the requirements of Rule 10A-3 under the Exchange Act. | Credicorp has an audit committee that satisfies the requirements of Rule 10A-3 under the Exchange Act. There is no similar requirement under Bermuda law. |
| 264 |
|
Section of NYSE
Listed Company Manual |
NYSE Corporate Governance Rules for
U.S. Domestic Issuers |
Credicorp Corporate Governance Practices | ||
| 303A.07 | Listed companies must have an audit committee with at least three members, and all members of the committee must satisfy the “independence” requirements set forth in Section 303A.02 of the NYSE Listed Company Manual (described above). The audit committee must also have a written charter that addresses specific minimum requirements, and listed companies must have an internal audit function. | In accordance with NYSE rules, Credicorp has formed an Audit Committee responsible for advising the board regarding the selection of independent auditors and evaluating Credicorp’s internal controls. Credicorp’s Audit Committee has three members and the members comply with the NYSE’s standards of independence for domestic issuers. Credicorp’s board of directors has adopted an audit committee charter. There is no similar requirement under Bermuda law. | ||
| 303A.08 | Shareholders must be given the opportunity to vote on equity-compensation plans and material revisions thereto, with limited exemptions set forth in the NYSE rules. | Under Bermuda law, Credicorp is not required to obtain shareholder consent prior to adopting share compensation plans. | ||
| 303A.09 | Listed companies must adopt and disclose corporate governance guidelines addressing specific minimum requirements. | Credicorp has adopted a set of corporate governance guidelines. | ||
| 303A.10 | Listed companies must adopt and disclose a code of business conduct and ethics for directors, officers and employees, and promptly disclose any waivers of the code for directors or executive officers. | Credicorp has adopted and published a Code of Ethics for directors, officers and employees and has adopted a Code of Ethics for professionals with financial responsibility. Both Codes are published on Credicorp’s website (www.credicorpnet.com) |
| 265 |
|
Section of NYSE
Listed Company Manual |
NYSE Corporate Governance Rules for
U.S. Domestic Issuers |
Credicorp Corporate Governance Practices | ||
| 303A.12 | Each listed company must submit an executed written affirmation annually to the NYSE. Each listed company CEO must (i) certify to the NYSE each year that he or she is not aware of any violation by the listed company of NYSE corporate governance listing standards, qualifying the certification to the extent necessary and (ii) promptly notify the NYSE in writing after any executive officer of the listed company becomes aware of any non-compliance with any applicable provisions of Section 303A. | As a NYSE listed company, Credicorp must submit an executed written affirmation annually to the NYSE, and its CEO must promptly notify the NYSE in writing after any executive officer of Credicorp becomes aware of any non-compliance with any applicable provisions of Section 303A. There is no similar requirement under Bermuda law. |
| 16G. B | Bermuda Law – Corporate Governance |
We are a company incorporated under the laws of Bermuda and are subject to Bermuda laws related to corporate governance. Under Bermuda law, there are no statutory requirements with respect to the independence of our board of directors, meetings of non-management directors, the establishment and composition of certain committees or the adoption and disclosure of corporate governance guidelines or codes of business conduct and ethics. Certain Bermuda common law and statutory provisions, however, relate to duties and obligations of a company and its directors that are similar to some of the duties and obligations arising from the provisions of Section 303A.
(1) Fiduciary Duties and Duties of Skill and Care Under Bermuda Law
Under section 97(1) of the Companies Act 1981 of Bermuda, as amended (also referred to as the Companies Act), every director and officer of a company must act honestly and in good faith with a view to the best interests of the company (often referred to as a “fiduciary duty”) and must exercise the care, diligence and skill that a reasonably prudent person would exercise in comparable circumstances (often referred to as a “duty of skill and care”).
Fiduciary Duty
Under the common law, the fiduciary duty of directors has four aspects which may be briefly summarized as follows:
| 266 |
| · | A duty to act honestly and in good faith. A director has a duty to act honestly and in good faith in what he considers are the best interests of the company and not for any collateral purpose. The courts allow the director wide discretion in determining this, interfering only if no reasonable director could have believed that a course of action was in the best interests of the company. However, a director acting honestly, but not in the best interests of the company, is in breach of such duty. |
| · | A duty to exercise powers for a proper purpose. Directors must act within the powers set out in the company’s memorandum of association and Bye-laws and exercise their powers in the company’s interests and for the purposes for which those powers were conferred. Even if the directors are acting in good faith in the interests of the company as a whole, they must still use their powers for the purposes for which they were intended. For example, in general directors are not allowed to exercise their powers in such a way as to prevent a majority of the members from exercising their rights. |
| · | A duty to avoid conflicts of interest. A director must not put himself in a position where there is an actual or potential conflict between a personal interest and his duty to the company. However, a director may enter into a contract where a conflict of interest might arise if the Bye-laws allow it or the company gives its approval in a general meeting. Our Bye-laws do not prohibit a director from entering into a contract where a conflict of interest may arise, but they do prohibit a director from voting with respect to any contract or proposed contract or arrangement in which such director is interested or with which such director has a conflict of interest. In addition, section 97(4) of the Companies Act requires our directors and officers to disclose at the first opportunity any interest in a material contract, proposed material contract or person that is a party to a material contract or proposed material contract with us or any of our subsidiaries. |
| · | A duty not to appropriate, divert or personally profit from corporate opportunities. Unless the Bye-laws specifically provide otherwise, a director’s fiduciary position precludes him from appropriating, diverting or taking a personal profit from any opportunities that result from the directorship. Our Bye-laws do provide an exception to this rule. They provide that any director, any director’s firm or partner, or any company with which any director is associated may act for us in a professional capacity. Such director, firm, partner or company will be entitled to compensation for professional services as if the director were not a member of our board of directors. However, such director, firm, partner or company may not act as our auditor. |
Duty of Skill and Care
Under the common law, the duty of skill and care has three aspects which may be briefly summarized as follows:
| · | Degree of Skill. A director need not exhibit in the performance of his duties a greater degree of skill than may reasonably be expected from a person of like knowledge and experience. |
| 267 |
| · | A director is not expected to exercise a level of skill he does not have. The level of skill required of a director is subjective, in that the director is not expected, merely by virtue of the office, to possess any particular skills. Performance must be judged by the way the director applies any skills which he actually has. However, directors ought to acquire and maintain a sufficient knowledge and understanding of the company’s business to enable them to properly discharge their duties as directors. |
| · | Attention to the Business. A director must diligently attend to the affairs of the company. In the performance of this duty, a director must at a minimum display the reasonable care an ordinary person would be expected to take in the same circumstances on his own behalf. Mere errors of judgment have been held not to breach the duty of skill and care. A director, as such, is not bound to give continuous attention to the affairs of the company, as his or her duties are of an intermittent nature. |
| · | Reliance on Others. A director is not liable for the acts of co-directors or other company officers solely by virtue of the position. A director is entitled to rely on his co-directors or company officers as well as subordinates who are expressly put in charge of attending to the detail of management, provided such reliance is honest and reasonable (although a director cannot absolve himself entirely of responsibility by delegation to others). As a general rule, before delegating responsibility to others, the directors in question should satisfy themselves that the delegates have the requisite skills to discharge the functions delegated to them. In addition, the directors must ensure that there is set up an adequate system of monitoring such delegates (e.g., managers). The directors must, on a regular basis, ensure that their delegates have fulfilled their obligations. The directors should require a regular flow of information from the delegates to ensure that they are carrying out their duties satisfactorily. In addition, section 97(5A) of the Companies Act provides that a director shall not have breached the fiduciary duty or duty of skill and care required by section 97(1) if he relies in good faith upon financial statements of the company represented to him by another director or officer of the company or a report of an attorney, accountant, engineer, appraiser or other person whose profession lends credibility to a statement made by him. |
(2) Other Statutory Duties and Obligations
The Companies Act imposes certain specific duties and obligations on companies and directors, both directly and indirectly, including duties and obligations with respect to (i) loans to directors and related persons, (ii) limits on indemnities for directors and officers and (iii) the keeping of proper books of account.
Loans to Directors and Related Persons
It is not lawful for a company to make a loan or to enter into a guarantee or provide security in connection with a loan to a director or certain persons related to a director without the consent of the members of the company holding in the aggregate not less than 90% of the total voting rights of all the members having the right to vote at any meeting of the members of the company, except in certain specific circumstances.
| 268 |
Limits on Indemnity for Directors
Section 98 of the Companies Act provides generally that a Bermuda company may indemnify its directors, officers and auditors against any liability which, by virtue of any rule of law, would otherwise be imposed on them with respect to any negligence, default, breach of duty or breach of trust. However, this rule does not apply in cases where such liability arises from fraud or dishonesty of which such director, officer or auditor may be guilty in relation to the company or any of its subsidiaries. Any provision, whether contained in the Bye-laws of a company or in any contract or arrangement between the company and one of its directors which would exempt such director from, or indemnify him against, any liability that would otherwise attach to him with respect to his fraud or dishonesty in relation to the company will be void. Section 98 further provides that a Bermuda company may indemnify its directors, officers and auditors against any liability incurred by them in defending any proceedings, whether civil or criminal, in which judgment is awarded in their favor or in which they are acquitted or granted relief by the Supreme Court of Bermuda pursuant to section 281 of the Companies Act. In the event that an allegation of fraud or dishonesty is proven, the director is obligated to disgorge any money provided for his defense.
Books of Account
It is the duty of the directors to cause to be kept proper books of account with respect to all sums of money received and expended by the company and the matters with respect to which the receipts and expenditures take place, all sales and purchases by the company, and the assets and liabilities of the company.
| 16G. C | Peruvian Law – Corporate Governance |
Although we are a holding company whose principal subsidiaries (Grupo Credito, BCP, and Grupo Pacifico) are incorporated under and subject to the laws of Peru, we are registered in Peru as a foreign issuer and are consequently only subject to Peruvian regulations applicable to foreign issuers. There are no corporate governance provisions under Peruvian law applicable to us that are similar to the provisions of Section 303A of the NYSE’s Listed Company Manual.
| ITEM 16H. | MINE SAFETY DISCLOSURE |
Not applicable.
| 269 |
| ITEM 17. | FINANCIAL STATEMENTS |
Not applicable.
| ITEM 18. | FINANCIAL STATEMENTS |
Credicorp Consolidated Financial Statements and the report of the independent public accounting firm in connection therewith are filed as part of this Annual Report on Form 20-F, as noted below:
All supplementary schedules relating to the registrant are omitted because they are not required or because the required information, where material, is contained in the Consolidated Financial Statements or notes thereto.
Credicorp Ltd. and Subsidiaries
Consolidated financial statements as of December 31, 2017, 2016 and 2015 together with the Report of Independent Registered Public Accounting Firm
| 270 |
| ITEM 19. | EXHIBITS |
| (a) | Index to Exhibits |
| 271 |
SIGNATURES
The registrant hereby certifies that it meets all of the requirements for filing on Form 20-F and that it has duly caused and authorized the undersigned to sign this Annual Report on its behalf
| CREDICORP LTD. | |||
| By: | /S/ CESAR RIOS | ||
| Name: | Cesar Rios | ||
| Tittle: | Chief Financial Officer | ||
| Dated: April 26, 2018 | |||
| 272 |
EXHIBITS INDEX
| 273 |
CREDICORP LTD. AND SUBSIDIARIES
CONSOLIDATED FINANCIAL STATEMENTS
AS OF DECEMBER 31, 2017 AND 2016
CREDICORP LTD. AND SUBSIDIARIES
CONSOLIDATED FINANCIAL STATEMENTS
AS OF DECEMBER 31, 2017 AND 2016
| US$ | = | United States dollar |
| S/ | = | Sol |
Report of Independent Registered Public Accounting Firm
To the Board of Directors and Shareholders
April 26, 2018
Opinions on the Financial Statements and Internal Control over Financial Reporting
We have audited the accompanying consolidated balance sheets of Credicorp Ltd. and its subsidiaries as of December 31, 2017 and 2016, and the related consolidated statements of income, comprehensive income, changes in equity and cash flows for each of the three years in the period ended December 31, 2017, including the related notes (collectively referred to as the “consolidated financial statements”). We also have audited the Company’s internal control over financial reporting as of December 31, 2017, based on criteria established in Internal Control – Integrated Framework ( 2013) issued by the Committee of Sponsoring Organizations of the Treadway Commission (COSO).
In our opinion, the consolidated financial statements referred to above present fairly, in all material respects, the financial position of the Company as of December 31, 2017 and 2016, and the results of their operations and their cash flows for each of the three years in the period ended December 31, 2017 in conformity with International Financial Reporting Standards issued by the International Accounting Standards Board. Also in our opinion, the Company maintained, in all material respects, effective internal control over financial reporting as of December 31, 2017, based on criteria established in Internal Control - Integrated Framework (2013) issued by the COSO.
Basis for Opinions
The Company's management is responsible for these consolidated financial statements, for maintaining effective internal control over financial reporting, and for its assessment of the effectiveness of internal control over financial reporting, included in the accompanying Management's Annual Report on Internal Control over Financial Reporting. Our responsibility is to express opinions on the Company’s consolidated financial statements and on the Company's internal control over financial reporting based on our audits. We are a public accounting firm registered with the Public Company Accounting Oversight Board (United States) ("PCAOB") and are required to be independent with respect to the Company in accordance with the U.S. federal securities laws and the applicable rules and regulations of the Securities and Exchange Commission and the PCAOB.
We conducted our audits in accordance with the standards of the PCAOB. Those standards require that we plan and perform the audits to obtain reasonable assurance about whether the consolidated financial statements are free of material misstatement, whether due to error or fraud, and whether effective internal control over financial reporting was maintained in all material respects.
Our audits of the consolidated financial statements included performing procedures to assess the risks of material misstatement of the consolidated financial statements, whether due to error or fraud, and performing procedures that respond to those risks. Such procedures included examining, on a test basis, evidence regarding the amounts and disclosures in the consolidated financial statements. Our audits also included evaluating the accounting principles used and significant estimates made by management, as well as evaluating the overall presentation of the consolidated financial statements. Our audit of internal control over financial reporting included obtaining an understanding of internal control over financial reporting, assessing the risk that a material weakness exists, and testing and evaluating the design and operating effectiveness of internal control based on the assessed risk. Our audits also included performing such other procedures as we considered necessary in the circumstances. We believe that our audits provide a reasonable basis for our opinions.
F- 1
Definition and Limitations of Internal Control over Financial Reporting
A company’s internal control over financial reporting is a process designed to provide reasonable assurance regarding the reliability of financial reporting and the preparation of financial statements for external purposes in accordance with generally accepted accounting principles. A company’s internal control over financial reporting includes those policies and procedures that (i) pertain to the maintenance of records that, in reasonable detail, accurately and fairly reflect the transactions and dispositions of the assets of the company; (ii) provide reasonable assurance that transactions are recorded as necessary to permit preparation of financial statements in accordance with generally accepted accounting principles, and that receipts and expenditures of the company are being made only in accordance with authorizations of management and directors of the company; and (iii) provide reasonable assurance regarding prevention or timely detection of unauthorized acquisition, use, or disposition of the company’s assets that could have a material effect on the financial statements.
Because of its inherent limitations, internal control over financial reporting may not prevent or detect misstatements. Also, projections of any evaluation of effectiveness to future periods are subject to the risk that controls may become inadequate because of changes in conditions, or that the degree of compliance with the policies or procedures may deteriorate.
Lima, Perú
April 26, 2018
/S/ Gaveglio, Aparicio y Asociados S.C.R.L.
We have served as the Company’s auditor since 2015.
Countersigned by
___________________________________ (partner)
/S/Fernando Gaveglio
Peruvian Certified Public Accountant
Registration No. 01-019847
F- 2
CREDICORP LTD. AND SUBSIDIARIES
AT DECEMBER 31, 2017 AND 2016
| Note | 2017 | 2016 | ||||||||
| S/(000) | S/(000) | |||||||||
| Assets | ||||||||||
| Cash and due from banks: | 4 | |||||||||
| Non-interest-bearing | 6,019,776 | 5,568,657 | ||||||||
| Interest-bearing | 17,202,211 | 11,077,112 | ||||||||
| 23,221,987 | 16,645,769 | |||||||||
| Cash collateral, reverse repurchase agreements and securities borrowings | 5(a) | 7,480,420 | 10,919,624 | |||||||
| Investments: | ||||||||||
| Trading securities | 6(a) | 4,024,737 | 4,015,019 | |||||||
| Available-for-sale investments | 21,732,107 | 17,086,774 | ||||||||
| Available-for-sale investments pledged as collateral | 2,691,784 | 1,598,893 | ||||||||
| 6(a) | 24,423,891 | 18,685,667 | ||||||||
| Held-to-maturity investments | 1,826,394 | 2,867,755 | ||||||||
| Held-to-maturity investments pledged as collateral | 2,586,979 | 2,250,665 | ||||||||
| 6(b) | 4,413,373 | 5,118,420 | ||||||||
| 32,862,001 | 27,819,106 | |||||||||
| Loans, net: | 7 | |||||||||
| Loans, net of unearned income | 100,477,775 | 94,768,901 | ||||||||
| Allowance for loan losses | (4,500,498 | ) | (4,207,133 | ) | ||||||
| 95,977,277 | 90,561,768 | |||||||||
| Financial assets designated at fair value through profit or loss | 8 | 537,685 | 459,099 | |||||||
| Premiums and other policies receivable | 9(a) | 656,829 | 643,224 | |||||||
| Accounts receivable from reinsurers and coinsurers | 9(b) | 715,695 | 454,187 | |||||||
| Property, furniture and equipment, net | 10 | 1,509,492 | 1,551,703 | |||||||
| Due from customers on acceptances | 532,034 | 491,139 | ||||||||
| Intangible assets and goodwill, net | 11 | 1,978,865 | 1,960,690 | |||||||
| Other assets | 12 | 4,999,998 | 4,928,913 | |||||||
| Total assets | 170,472,283 | 156,435,222 | ||||||||
| Liabilities and Equity | ||||||||||
| Deposits and obligations: | 13 | |||||||||
| Non-interest-bearing | 29,382,909 | 28,084,691 | ||||||||
| Interest-bearing | 67,787,502 | 57,831,696 | ||||||||
| 97,170,411 | 85,916,387 | |||||||||
| Payables from repurchase agreements and security lending | 5(b) | 13,415,843 | 15,127,999 | |||||||
| Due to banks and correspondents | 14 | 7,996,889 | 7,493,916 | |||||||
| Banker’s acceptances outstanding | 532,034 | 491,139 | ||||||||
| Accounts payable to reinsurers | 9(b) | 235,185 | 233,892 | |||||||
| Financial liabilities at fair value through profit or loss | 3(f)(v) | 168,089 | 209,520 | |||||||
| Technical reserves, insurance claims reserves and unearned premiums | 15 | 7,443,760 | 6,786,189 | |||||||
| Bonds and notes issued | 16 | 16,242,257 | 15,939,603 | |||||||
| Other liabilities | 12 | 5,014,112 | 4,120,066 | |||||||
| Total liabilities | 148,218,580 | 136,318,711 | ||||||||
| Equity | 17 | |||||||||
| Equity attributable to Credicorp´s equity holders | ||||||||||
| Capital stock | 1,318,993 | 1,318,993 | ||||||||
| Treasury stock | (208,937 | ) | (209,322 | ) | ||||||
| Capital Surplus | 271,948 | 280,876 | ||||||||
| Reserves | 14,647,709 | 13,539,091 | ||||||||
| Other reserves | 1,455,594 | 1,209,731 | ||||||||
| Retained earnings | 4,271,260 | 3,516,766 | ||||||||
| 21,756,567 | 19,656,135 | |||||||||
| Non-controlling interest | 497,136 | 460,376 | ||||||||
| Total equity | 22,253,703 | 20,116,511 | ||||||||
| Total liabilities and equity | 170,472,283 | 156,435,222 | ||||||||
The accompanying Notes are an integral part of these consolidated financial statements.
F- 3
CREDICORP LTD. AND SUBSIDIARIES
CONSOLIDATED STATEMENT OF INCOME
FOR THE YEARS ENDED DECEMBER 31, 2017, 2016 AND 2015
| Note | 2017 | 2016 | 2015 | |||||||||||
| S/(000) | S/(000) | S/(000) | ||||||||||||
| Interest and similar income | 21 | 11,030,683 | 10,773,055 | 9,784,089 | ||||||||||
| Interest and similar expenses | 21 | (2,959,196 | ) | (2,914,714 | ) | (2,527,133 | ) | |||||||
| Net interest, similar income and expenses | 8,071,487 | 7,858,341 | 7,256,956 | |||||||||||
| Provision for loan losses, net of recoveries | 7(d) | (1,789,165 | ) | (1,785,495 | ) | (1,880,898 | ) | |||||||
| Net Interest, similar income after provision for loan losses | 6,282,322 | 6,072,846 | 5,376,058 | |||||||||||
| Other income | ||||||||||||||
| Commissions and fees | 22 | 2,911,408 | 2,771,561 | 2,644,191 | ||||||||||
| Net gains on foreign exchange transactions operaciones de cambio | 650,228 | 698,159 | 773,798 | |||||||||||
| Net gains on sales of securities | 741,781 | 336,759 | 248,723 | |||||||||||
| Net gains on derivatives held for trading | 103,580 | 44,500 | 207,938 | |||||||||||
| Net gains from exchange difference | 17,394 | – | 46,563 | |||||||||||
| Net gains on financial assets designated at fair value through profit or loss | 8 | 67,633 | 51,667 | – | ||||||||||
| Others | 27 | 396,683 | 344,460 | 325,666 | ||||||||||
| 4,888,707 | 4,247,106 | 4,246,879 | ||||||||||||
| Insurance premiums and claims | ||||||||||||||
| Net premiums earned | 23 | 1,808,340 | 1,799,115 | 1,733,978 | ||||||||||
| Net claims incurred for life, general and health insurance contracts | 24 | (1,118,304 | ) | (1,098,905 | ) | (1,031,659 | ) | |||||||
| Total premiums earned less claims | 690,036 | 700,210 | 702,319 | |||||||||||
| Other expenses | ||||||||||||||
| Salaries and employees benefits | 25 | (3,071,020 | ) | (2,942,743 | ) | (2,878,318 | ) | |||||||
| Administrative expenses | 26 | (2,158,823 | ) | (2,094,678 | ) | (1,995,802 | ) | |||||||
| Depreciation and amortization | 10(a) and 11(a) | (419,975 | ) | (407,061 | ) | (396,497 | ) | |||||||
| Net loss from exchange difference | – | (60,624 | ) | – | ||||||||||
| Impairment loss on goodwill | 11(b) | – | (94 | ) | (82,374 | ) | ||||||||
| Net impairment loss on available-for-sale investments | 6(a) | (766 | ) | (14,459 | ) | (43,801 | ) | |||||||
| Net loss on financial assets at fair value through profit or loss | 8 | – | – | (33,500 | ) | |||||||||
| Others | 27 | (635,547 | ) | (609,075 | ) | (534,372 | ) | |||||||
| Total other expenses | (6,286,131 | ) | (6,128,734 | ) | (5,964,664 | ) | ||||||||
The accompanying Notes are an integral part of these consolidated financial statements.
F- 4
CONSOLIDATED STATEMENT OF INCOME (CONTINUED)
| Note | 2017 | 2016 | 2015 | |||||||||||
| S/(000) | S/(000) | S/(000) | ||||||||||||
| Profit before income tax | 5,574,934 | 4,891,428 | 4,360,592 | |||||||||||
| Income tax | 18(b) | (1,393,286 | ) | (1,281,448 | ) | (1,197,207 | ) | |||||||
| Net profit | 4,181,648 | 3,609,980 | 3,163,385 | |||||||||||
| Attributable to: | ||||||||||||||
| Credicorp’s equity holders | 4,091,753 | 3,514,582 | 3,092,303 | |||||||||||
| Non-controlling interest | 89,895 | 95,398 | 71,082 | |||||||||||
| 4,181,648 | 3,609,980 | 3,163,385 | ||||||||||||
| Net basic and dilutive earnings per share attributable to equity holders of Credicorp Ltd. (in Soles): | ||||||||||||||
| Basic | 28 | 51.49 | 44.23 | 38.91 | ||||||||||
| Diluted | 28 | 51.35 | 44.15 | 38.84 | ||||||||||
The accompanying Notes are an integral part of these consolidated financial statements.
F- 5
CREDICORP LTD. AND SUBSIDIARIES
CONSOLIDATED STATEMENT OF COMPREHENSIVE INCOME
FOR THE YEARS ENDED DECEMBER 31, 2017, 2016 AND 2015
| Note | 2017 | 2016 | 2015 | |||||||||||
| S/000 | S/000 | S/000 | ||||||||||||
| Net profit for the year | 4,181,648 | 3,609,980 | 3,163,385 | |||||||||||
| Other comprehensive income | ||||||||||||||
| Other comprehensive income to be reclassified to profit or loss in subsequent periods: | ||||||||||||||
| Net (loss) gain on investments available for sale | 17(d) | 375,710 | 518,658 | (635,743 | ) | |||||||||
| Income tax | 17(d) | (13,962 | ) | (22,975 | ) | 18,503 | ||||||||
| 361,748 | 495,683 | (617,240 | ) | |||||||||||
| Net movement on cashflow hedges | 17(d) | (77,369 | ) | (22,109 | ) | 41,069 | ||||||||
| Income tax | 17(d) | 18,719 | 2,294 | (1,956 | ) | |||||||||
| (58,650 | ) | (19,815 | ) | 39,113 | ||||||||||
| Exchange differences on translation of foreign operations | 17(d) | (54,227 | ) | (26,571 | ) | 270,907 | ||||||||
| (54,227 | ) | (26,571 | ) | 270,907 | ||||||||||
| Other comprehensive (loss) income to be reclassified to profit or loss in subsequent periods, net of income tax | 248,871 | 449,297 | (307,220 | ) | ||||||||||
| Total comprehensive income for the year, net of income tax | 4,430,519 | 4,059,277 | 2,856,165 | |||||||||||
| Attributable to: | ||||||||||||||
| Equity holders of Credicorp Ltd. | 4,337,616 | 3,961,618 | 2,831,612 | |||||||||||
| Non-controlling interest | 92,903 | 97,659 | 24,553 | |||||||||||
| 4,430,519 | 4,059,277 | 2,856,165 | ||||||||||||
The accompanying Notes are an integral part of these consolidated consolidated financial statements.
F- 6
CREDICORP LTD. AND SUBSIDIARIES
CONSOLIDATED STATEMENT OF CHANGES IN EQUITY
FOR THE YEARS ENDED DECEMBER 31, 2017, 2016 AND 2015
| Attributable to equity holders of Credicorp Ltd. | ||||||||||||||||||||||||||||||||||||||||||||||||||||
| Other reserves | ||||||||||||||||||||||||||||||||||||||||||||||||||||
|
Number
of
Issued, Notes 17(a) and 28 |
Capital
stock |
Treasury Stock |
Capital
surplus |
Reserves | Put options |
Available-for-
sale investment reserve |
Cash
flow
hedge reserve |
Foreign
currency translation reserve |
Retained
earnings |
Total |
Non-
controlling interest |
Total equity |
||||||||||||||||||||||||||||||||||||||||
|
(In
thousands
of units) |
S/(000) | S/(000) | S/(000) | S/(000) | S/(000) | S/(000) | S/(000) | S/(000) | S/(000) | S/(000) | S/(000) | S/(000) | ||||||||||||||||||||||||||||||||||||||||
| Balances at January 1, 2015 | 94,382 | 1,318,994 | (208,184 | ) | 302,941 | 9,469,900 | (340,353 | ) | 1,223,615 | 5,937 | (206,166 | ) | 2,412,771 | 13,979,455 | 646,570 | 14,626,025 | ||||||||||||||||||||||||||||||||||||
| Changes in equity in 2015 - | ||||||||||||||||||||||||||||||||||||||||||||||||||||
| Net profit for the year | – | – | – | – | – | – | – | – | – | 3,092,303 | 3,092,303 | 71,082 | 3,163,385 | |||||||||||||||||||||||||||||||||||||||
| Other comprehensive income | – | – | – | – | – | – | (570,711 | ) | 39,113 | 270,907 | – | (260,691 | ) | (46,529 | ) | (307,220 | ) | |||||||||||||||||||||||||||||||||||
| Total comprehensive income | – | – | – | – | – | – | (570,711 | ) | 39,113 | 270,907 | 3,092,303 | 2,831,612 | 24,553 | 2,856,165 | ||||||||||||||||||||||||||||||||||||||
| Transfer of retained earnings to reserves, Note 17(c) | – | – | – | – | 1,820,483 | – | – | – | – | (1,820,483 | ) | – | – | – | ||||||||||||||||||||||||||||||||||||||
| Dividend distribution, Note 17(e) | – | – | – | – | – | – | – | – | – | (539,985 | ) | (539,985 | ) | – | (539,985 | ) | ||||||||||||||||||||||||||||||||||||
| Dividends of subsidiaries | – | – | – | – | – | – | – | – | – | – | – | (11,173 | ) | (11,173 | ) | |||||||||||||||||||||||||||||||||||||
| Purchase of treasury stock, Note 17(b) | – | – | (2,452 | ) | (70,516 | ) | – | – | – | – | – | – | (72,968 | ) | – | (72,968 | ) | |||||||||||||||||||||||||||||||||||
| Share-based payment transactions | – | – | 1,658 | 51,746 | 9,481 | – | – | – | – | – | 62,885 | – | 62,885 | |||||||||||||||||||||||||||||||||||||||
| Others | – | (1 | ) | – | – | (77,833 | ) | – | – | – | – | (55,149 | ) | (132,983 | ) | (60,396 | ) | (193,379 | ) | |||||||||||||||||||||||||||||||||
| Balances at December 31, 2015 | 94,382 | 1,318,993 | (208,978 | ) | 284,171 | 11,222,031 | (340,353 | ) | 652,904 | 45,050 | 64,741 | 3,089,457 | 16,128,016 | 599,554 | 16,727,570 | |||||||||||||||||||||||||||||||||||||
| Changes in equity in 2016 - | ||||||||||||||||||||||||||||||||||||||||||||||||||||
| Net profit for the year | – | – | – | – | – | – | – | – | – | 3,514,582 | 3,514,582 | 95,398 | 3,609,980 | |||||||||||||||||||||||||||||||||||||||
| Other comprehensive income | – | – | – | – | – | – | 493,884 | (20,400 | ) | (26,448 | ) | – | 447,036 | 2,261 | 449,297 | |||||||||||||||||||||||||||||||||||||
| Total comprehensive income | – | – | – | – | – | – | 493,884 | (20,400 | ) | (26,448 | ) | 3,514,582 | 3,961,618 | 97,659 | 4,059,277 | |||||||||||||||||||||||||||||||||||||
| Transfer of retained earnings to reserves, Note 17(c) | – | – | – | – | 2,316,370 | – | – | – | – | (2,316,370 | ) | – | – | – | ||||||||||||||||||||||||||||||||||||||
| Dividend distribution, Note 17(e) | – | – | – | – | – | – | – | – | – | (653,326 | ) | (653,326 | ) | – | (653,326 | ) | ||||||||||||||||||||||||||||||||||||
| Dividends of subsidiaries | – | – | – | – | – | – | – | – | – | – | – | (34,514 | ) | (34,514 | ) | |||||||||||||||||||||||||||||||||||||
| Purchase of treasury stock, Note 17(b) | – | – | (2,604 | ) | (63,924 | ) | – | – | – | – | – | – | (66,528 | ) | – | (66,528 | ) | |||||||||||||||||||||||||||||||||||
| Share-based payment transactions | – | – | 2,260 | 60,629 | 690 | – | – | – | – | – | 63,579 | – | 63,579 | |||||||||||||||||||||||||||||||||||||||
| Acquisition of non-controlling interest, Note 2(b) | – | – | – | – | – | 340,353 | – | – | – | (123,980 | ) | 216,373 | (216,373 | ) | – | |||||||||||||||||||||||||||||||||||||
| Others | – | – | – | – | – | – | – | – | – | 6,403 | 6,403 | 14,050 | 20,453 | |||||||||||||||||||||||||||||||||||||||
| Balances at December 31, 2016 | 94,382 | 1,318,993 | (209,322 | ) | 280,876 | 13,539,091 | – | 1,146,788 | 24,650 | 38,293 | 3,516,766 | 19,656,135 | 460,376 | 20,116,511 | ||||||||||||||||||||||||||||||||||||||
| Changes in equity in 2017 - | ||||||||||||||||||||||||||||||||||||||||||||||||||||
| Net profit for the year | – | – | – | – | – | – | – | – | – | 4,091,753 | 4,091,753 | 89,895 | 4,181,648 | |||||||||||||||||||||||||||||||||||||||
| Other comprehensive income | – | – | – | – | – | – | 357,628 | (57,431 | ) | (54,334 | ) | – | 245,863 | 3,008 | 248,871 | |||||||||||||||||||||||||||||||||||||
| Total comprehensive income | – | – | – | – | – | – | 357,628 | (57,431 | ) | (54,334 | ) | 4,091,753 | 4,337,616 | 92,903 | 4,430,519 | |||||||||||||||||||||||||||||||||||||
| Transfer of retained earnings to reserves, Note 17(c) | – | – | – | – | 2,354,954 | – | – | – | – | (2,354,954 | ) | – | – | – | ||||||||||||||||||||||||||||||||||||||
| Dividend distribution, Note 17(e) | – | – | – | – | – | – | – | – | – | (979,989 | ) | (979,989 | ) | – | (979,989 | ) | ||||||||||||||||||||||||||||||||||||
| Dividends of subsidiaries | – | – | – | – | – | – | – | – | – | – | – | (50,234 | ) | (50,234 | ) | |||||||||||||||||||||||||||||||||||||
| Additional dividends, Note 17(e) | – | – | – | – | (1,252,255 | ) | – | – | – | – | – | (1,252,255 | ) | – | (1,252,255 | ) | ||||||||||||||||||||||||||||||||||||
| Purchase of treasury stock, Note 17(b) | – | – | (2,141 | ) | (68,867 | ) | – | – | – | – | – | – | (71,008 | ) | – | (71,008 | ) | |||||||||||||||||||||||||||||||||||
| Share-based payment transactions | – | – | 2,526 | 59,939 | 5,919 | – | – | – | – | – | 68,384 | – | 68,384 | |||||||||||||||||||||||||||||||||||||||
| Others | – | – | – | – | – | – | – | – | – | (2,316 | ) | (2,316 | ) | (5,909 | ) | (8,225 | ) | |||||||||||||||||||||||||||||||||||
| Balances at December 31, 2017 | 94,382 | 1,318,993 | (208,937 | ) | 271,948 | 14,647,709 | – | 1,504,416 | (32,781 | ) | (16,041 | ) | 4,271,260 | 21,756,567 | 497,136 | 22,253,703 | ||||||||||||||||||||||||||||||||||||
The accompanying Notes are an integral part of these consolidated financial statements.
F- 7
CREDICORP LTD. AND SUBSIDIARIES
CONSOLIDATED STATEMENT OF CASH FLOWS
FOR THE YEARS ENDED DECEMBER 31, 2017, 2016 AND 2015
| Note | 2017 | 2016 | 2015 | |||||||||||
| S/(000) | S/(000) | S/(000) | ||||||||||||
| CASH FLOWS AND CASH EQUIVALENTS FROM OPERATING ACTIVITIES | ||||||||||||||
| Profit before income tax | 5,574,934 | 4,891,428 | 4,360,592 | |||||||||||
| Income tax | (1,393,286 | ) | (1,281,448 | ) | (1,197,207 | ) | ||||||||
| Net profit for the year | 4,181,648 | 3,609,980 | 3,163,385 | |||||||||||
| Adjustment to reconcile net profit with net cash arising from operating activities: | ||||||||||||||
| Provision for loan losses | 7(d) | 2,057,478 | 2,063,209 | 2,052,177 | ||||||||||
| Depreciation and amortization | 10(a) and 11(a) | 419,975 | 407,061 | 396,497 | ||||||||||
| Depreciation of investment properties | 12(f) | 6,440 | 4,369 | 4,409 | ||||||||||
| Deferred income tax | 18(b) | (3,556 | ) | 28,228 | (117,195 | ) | ||||||||
| Adjustment of technical reserves | 509,051 | 370,964 | 408,808 | |||||||||||
| Impairment loss on available for-sale investments | 6(a) | 766 | 14,459 | 43,801 | ||||||||||
| Net gain on sales of securities | (741,781 | ) | (336,759 | ) | (248,723 | ) | ||||||||
| Impairment loss on goodwill | 11(b) | – | 94 | 82,374 | ||||||||||
| Provision for sundry risks | 12(d) | 29,023 | 28,093 | 38,248 | ||||||||||
| Net loss (gain) on financial assets designated at fair value through profit and loss | 8 | (67,633 | ) | (51,667 | ) | 33,500 | ||||||||
| Net gain of trading derivatives | (103,580 | ) | (44,500 | ) | (207,938 | ) | ||||||||
| (Gain) loss on sales of property, furniture and equipment | (36,970 | ) | 45,076 | 17,159 | ||||||||||
| Net profit from sale of seized and recovered assets | 27 | (2,494 | ) | (1,377 | ) | (4,195 | ) | |||||||
| Expense on share-based compensation plan | 25 | 62,043 | 73,930 | 65,532 | ||||||||||
| Others | (17,394 | ) | 60,624 | (46,563 | ) | |||||||||
| Net changes in assets and liabilities: | ||||||||||||||
| Net (increase) decrease in assets | ||||||||||||||
| Loans | (8,387,767 | ) | (6,636,536 | ) | (7,754,794 | ) | ||||||||
| Trading securities | (16,400 | ) | (1,694,949 | ) | 232,293 | |||||||||
| Available for sale investments | (5,380,789 | ) | 562,679 | (3,163,304 | ) | |||||||||
| Cash collaterals, receivables from reverse repurchase agreements and securities borrowings | (78,950 | ) | (28,856 | ) | 364,837 | |||||||||
| Other assets | 425,245 | 1,502,444 | (676,176 | ) | ||||||||||
| Net increase (decrease) in liabilities | ||||||||||||||
| Deposits and obligations | 12,779,204 | (1,981,653 | ) | 6,105,203 | ||||||||||
| Due to Banks and correspondents | 661,747 | (188,720 | ) | (2,164,131 | ) | |||||||||
| Payables from repurchase agreements and security lending | 1,551,904 | 518,755 | 1,063,748 | |||||||||||
| Bonds and notes issued | 788,144 | 274,766 | (1,270,797 | ) | ||||||||||
| Other liabilities | 1,680,868 | 1,141,323 | 1,211,378 | |||||||||||
| Income tax paid | (1,014,907 | ) | (1,108,641 | ) | (945,178 | ) | ||||||||
| Net cash flow from operating activities | 9,301,315 | (1,367,604 | ) | (1,315,645 | ) | |||||||||
The accompanying notes are an integral part of these consolidated financial statements.
F- 8
| Note | 2017 | 2016 | 2015 | |||||||||||
| S/(000) | S/(000) | S/(000) | ||||||||||||
| NET CASH FLOWS FROM INVESTING ACTIVITIES | ||||||||||||||
| Revenue for sale of property, furniture and equipment | 44,137 | 47,044 | 44,524 | |||||||||||
| Revenue from sales of investment property | 115,705 | – | – | |||||||||||
| Additions of property, furniture and equipment | 10 | (143,851 | ) | (110,151 | ) | (148,426 | ) | |||||||
| Purchase of investment property | 12(f) | (9,217 | ) | (88,186 | ) | (66,237 | ) | |||||||
| Additions of intangible assets | 11 | (271,722 | ) | (277,346 | ) | (276,564 | ) | |||||||
| Held-to-maturity investments | 670,620 | (1,550,332 | ) | (1,135,744 | ) | |||||||||
| Net cash flows from investing activities | 405,672 | (1,978,971 | ) | (1,582,447 | ) | |||||||||
| NET CASH FLOWS FROM FINANCING ACTIVITIES | ||||||||||||||
| Dividends paid | 17(e) | (979,989 | ) | (653,326 | ) | (539,985 | ) | |||||||
| Additional dividends | 17(e) | (1,252,255 | ) | – | – | |||||||||
| Subordinated bonds and Notes issued | (40,049 | ) | (401,257 | ) | 666,805 | |||||||||
| Acquisition of Credicorp shares | 17(b) | (71,008 | ) | (66,528 | ) | (72,968 | ) | |||||||
| Acquisition of non-controlling interest | – | (489,866 | ) | – | ||||||||||
| Net cash flows from financing activities | (2,343,301 | ) | (1,610,977 | ) | 53,852 | |||||||||
| Net increase (decrease) of cash and cash equivalents before effect of changes in exchange rate | 7,363,686 | (4,957,552 | ) | (2,844,240 | ) | |||||||||
| Effect of changes in exchange rate of cash and cash equivalents | (784,685 | ) | (454,120 | ) | 3,199,642 | |||||||||
| Cash and cash equivalents at the beginning of the year | 16,633,196 | 22,044,868 | 21,689,466 | |||||||||||
| Cash and cash equivalents at the end of the year | 23,212,197 | 16,633,196 | 22,044,868 | |||||||||||
| Additional information from cash flows | ||||||||||||||
| Interest received | 10,935,640 | 10,640,157 | 9,748,822 | |||||||||||
| Interest paid | (2,885,989 | ) | (2,772,891 | ) | (2,318,724 | ) | ||||||||
Reconciliation of liabilities arising from financing activities:
| Changes that generate cash flows | Changes that do not generate cash flows | |||||||||||||||||||||||||||
|
At
1, 2017 |
New
issues |
Amortization
of principal |
Exchange
difference |
Changes
in fair value |
Others |
At
December 31, 2017 |
||||||||||||||||||||||
| S/(000) | S/(000) | S/(000) | S/(000) | S/(000) | S/(000) | S/(000) | ||||||||||||||||||||||
| Subordinated bonds: | ||||||||||||||||||||||||||||
| Amortized Cost | 616,020 | 29,953 | (70,002 | ) | (10,382 | ) | – | (140 | ) | 565,449 | ||||||||||||||||||
| Fair value | 4,881,989 | – | – | (166,645 | ) | (39,137 | ) | 5,733 | 4,681,940 | |||||||||||||||||||
| 5,498,009 | 29,953 | (70,002 | ) | (177,027 | ) | (39,137 | ) | 5,593 | 5,247,389 | |||||||||||||||||||
| Hedge of fair value | (77,508 | ) | – | – | 2,512 | 39,250 | 1,456 | (34,290 | ) | |||||||||||||||||||
The accompanying notes are an integral part of these consolidated financial statements.
F- 9
CREDICORP LTD. AND SUBSIDIARIES
NOTES TO THE CONSOLIDATED FINANCIAL STATEMENTS
AS OF DECEMBER 31, 2017 AND 2016
| 1 | OPERATIONS |
Credicorp Ltd. (hereinafter “Credicorp” or “the Group”) is a limited liability company incorporated in Bermuda in 1995 to act as a holding company and to coordinate the policies and administration of its subsidiaries. It is also engaged in investing activities.
Credicorp Ltd., through its banking and non-banking subsidiaries and its associate Entidad Prestadora de Salud, provides a wide range of financial, insurance and health services and products mainly throughout Peru and in certain other countries (See Note 3(b)). Its major subsidiary is Banco de Crédito del Perú (hereinafter “BCP” or the “Bank”), a Peruvian universal bank. Credicorp’s address is Clarendon House 2 Church Street Hamilton, Bermuda; likewise, administration offices of its representative in Peru are located in Calle Centenario Nº156, La Molina, Lima, Peru.
Credicorp is listed on the Lima and New York stock exchanges.
These consolidated financial statements were approved at the March 28, 2018 General Shareholder’s Meeting. The Company evaluated events or transactions that may have occurred between March 28, 2018 and April 24, 2018 for potential recognition or disclosures. No significant events or transactions were identified, except for the events indicated in: (i) Note 3(ad) on the impacts of IFRS 9, (ii) Note 17(e) on the agreement to declare a cash dividend, and (iii) Note 34 on subsequent events, which were approved by Management and in the Audit Committee held on April 24, 2018.
Further, there are no significant events or transactions between April 24 and 26, 2018 that were identified.
| 2 | ACQUISITIONS, TRANSFERS AND MERGER |
| a) | Merger by absorption between El Pacífico Vida Compañía de Seguros y Reaseguros (Pacífico Vida) and El Pacífico Peruano-Suiza Compañía de Seguros y Reaseguros (PPS) - |
At the Obligatory Annual Shareholders’ Meeting of Pacífico Vida, held on February 23, 2017, the merger by absorption was approved between Pacífico Vida (absorbing entity) and PPS (absorbed entity), and the amendments to their corporate denomination and purpose. Furthermore, it was agreed that said merger would come into effect on the date of the approval of the Public Deed, subject to the prior authorization of the SBS.
In this sense, on July 24, 2017, the SBS, by means of Resolution N° 2836-2017 authorized the following to Pacífico Vida:
| · | The merger by absorption. |
| · | The increase in its share capital by the amount of S/571,009,670, thereby increasing its new share capital to the total of S/1,121,316,750. |
| · | The amendment in its corporate denomination to Pacífico Compañía de Seguros y Reaseguros S.A., being able to use the abbreviated name “Pacífico Seguros”; and to change its corporate purpose in order to be able to operate in the branches of life and general insurance. |
Subsequently, on August 1, 2017, the signing of the Public Deed of Fusion was formalized, with the merger by absorption becoming effective as from said date; consequently, Pacífico Vida absorbs the totality of the assets, liabilities, rights and obligations of PPS, with the latter becoming extinguished, without dissolution or liquidation.
F- 10
| b) | Acquisition of the non-controlling interest of Credicorp Capital Colombia S.A. (formerly Correval) and Inversiones IMT S.A. - |
In the Board Meetings of Credicorp held on February 24, and July 20 of 2016, capital contributions were approved in favor of Credicorp Capital Ltd. for an amount of US$15.4 million and US$106.3 million, respectively, for the purpose of acquiring all of the shares held by the minority shareholders of Credicorp Capital Colombia S.A. (49.0 percent) and Inversiones IMT S.A. (39.4 percent) at said date, exercising the sale option agreed with them amounting, at that time, to S/489.9 million (S/340.4 million at the time of the signing of the contract and S/149.5 million related to the appreciation of that option recorded in the period from 2013 until its execution date).
It should be mentioned that in said Board meetings, a capital contribution in favor of Credicorp Capital was initially approved for a total amount of US$121.7 million; however, Management subsequently decided that the contribution would only be for US$120.1 million.
Credicorp Capital Ltd. made capital contributions in favor of Credicorp Capital Holding Chile and Credicorp Capital Holding Colombia for approximately US$49.2 million and US$44.2 million, respectively, to enable said entities to execute directly the purchase and sale options (PUT) of the minority shareholders.
Accordingly, on May 20 and August 1 of 2016, the minority shareholders of Credicorp Capital Holding Chile executed the purchase option of Inversiones IMT S.A. thus selling the 39.4 percent share that they held, for approximately US$73.7 million (equivalent to S/241.4 million), with which, Credicorp Capital Holding Chile became the owner of 100 percent of the share capital of Inversiones IMT S.A.
The amount paid by Credicorp Capital Holding Chile was made up of: (i) US$49.2 million originating from the capital contribution of Credicorp Capital Ltd., (ii) US$20.0 million obtained through a financing from a local Chilean bank and own (iii) funds of approximately US$4.5 million.
Furthermore, on May 20, June 1 and August 1, of 2016, Credicorp Capital Holding Colombia executed the purchase option of Credicorp Capital Colombia S.A., purchasing the 30.32 percent share held by the minority shareholders for approximately US$45.2 million (equivalent to S/152.4 million), with which, Credicorp Capital Holding Colombia became the owner of 81.32 percent of the share capital of Credicorp Capital Colombia S.A.
The amount paid by Credicorp Capital Holding Colombia is made up of US$44.2 million originating from the capital contribution of Credicorp Capital Ltd. and US$1.0 million of own funds.
Finally, on September 30, 2016, Credicorp Capital Ltd. executed the remaining purchase option of Credicorp Capital Colombia S.A., purchasing the 18.68 percent share held by the minority shareholders, by means of the purchase of the entities Coby Business Inc. and Artigas Global Corp, both Panamanian companies whose only asset are their shares of Credicorp Capital Colombia S.A. The total amount of the purchase was US$28.3 million (equivalent to S/96.1 million), of which Credicorp Capital Ltd. paid US$26.7 million in cash (which originated from Credicorp´s capital contribution), leaving a balance payable of US$1.6 million at December 31, 2017.
The total contribution of Credicorp Ltd. in Credicorp Capital Ltd. Group was US$120.1 million and with the financing taken by Credicorp Capital Holding Chile, all of the purchase options were exercised, resulting in the achievement of a 100 percent share in Inversiones IMT S.A. and in Credicorp Capital Colombia S.A. With this operation, the process was concluded of establishing a regional investment bank which operates in the Integrated Latin American Market (MILA from the Spanish acronym), involving the stock exchanges of Peru, Colombia and Chile.
F- 11
The impacts of the operation on the financial statements of the Group are summarized below:
| Companies acquired | ||||||||||||||||
|
Inversiones
IMT S.A. |
Credicorp
Capital Colombia S.A. |
Coby
Business Inc. y Artigas Global Corp. |
Total | |||||||||||||
| S/(000) | S/(000) | S/(000) | S/(000) | |||||||||||||
| Assets and liabilities acquired / Non controlling interest | 103,630 | 69,482 | 43,261 | 216,373 | ||||||||||||
| Payment made / execution of sale option | (241,420 | ) | (152,379 | ) | (96,067 | ) | (489,866 | ) | ||||||||
| Higher value paid | (137,790 | ) | (82,897 | ) | (52,806 | ) | (273,493 | ) | ||||||||
| c) | Corporate reorganization of Inversiones Credicorp Bolivia in the Group - |
As part of the corporate reorganization of Grupo Credicorp, in a General Shareholders’ Meeting of Inversiones Credicorp Bolivia S.A. (hereinafter “ICBSA”), held on December 31, 2015, an increase in the share capital was approved in the form of a voluntary contribution of Grupo Crédito S.A. (hereinafter “Grupo Crédito”, a subsidiary of Credicorp Ltd.) amounting to Bs.1,134.5 million, equivalent to S/383.5 million, issuing in its favor 11,344,800 shares.
The contribution was made by Grupo Crédito on March 30, 2016, as a result of which BCP lost control of ICBSA, and Grupo Crédito is the new entity that has assumed control.
This transaction had no significant impact on the consolidated financial statement.
| d) | Sale of shares of Banco de Crédito de Bolivia - |
The Executive Committee of the Board of Directors of BCP, in its meeting held on December 30, 2015, approved the sale of all of the shares (14,121 units) which it held of Banco de Crédito de Bolivia (hereinafter “BCB”) to ICBSA. Both companies form part of the Group.
It is worth mentioning that at December 31, 2015, said transaction was not recognized as an “asset classified as held-for-sale”, since it did not comply with all of the requirements of IFRS 5 “Non-current assets held for sale and discontinued operations” and it did not have the regulator’s approval.
Furthermore, in a General Shareholders’ Meeting of BCB held on March 10, 2016, the capitalization of reserves was approved for an amount of Bs.607.5 million, equivalent to S/307.4 million, increasing proportionally the shareholding of all of the shareholders. As a result of the capitalization, BCP received 29,116 shares, obtaining a total holding of 43,237 shares.
The share sale operation by BCP was authorized by the Supervisory Authority of the Financial System (ASFI from the Spanish acronym) of Bolivia on May 12, 2016, after which, BCP carried out the sale of all of its shares at that date (43,237 shares) in favor of ICBSA, through the Bolivian Stock Exchange, at a price of Bs.25,811.0 per share, representing a total amount of Bs.1,116.0 million, equivalent to S/541.1 million.
As a result of the sale of shares, ICBSA became the new entity which assumed control over BCB.
F- 12
| 3 | SIGNIFICANT ACCOUNTING POLICIES |
The significant accounting principles applied in the preparation of Credicorp’s consolidated financial statements are set out below:
| a) | Basis of presentation and use of estimates - |
The accompanying consolidated financial statements have been prepared in accordance with International Financial Reporting Standards (IFRS) as issued by the International Accounting Standards Board (IASB).
The accompanying consolidated financial statements have been prepared on a historical cost basis, except for trading securities, available-for-sale investments, financial assets at fair value through profit or loss, derivative financial instruments, share-based payments, bonds and notes associated with fair value hedges, and financial liabilities at fair value through profit or loss that have been measured at fair value.
The consolidated financial statements are presented in Soles (S/), see paragraph (c) below, and values are rounded to the nearest S/thousands, except when otherwise indicated.
The preparation of the consolidated financial statements in accordance with IFRS requires Management to make estimates and assumptions that affect the reported amounts of assets, liabilities, revenues and expenses and the disclosure of significant events in notes to the consolidated financial statements.
Estimates and judgments are continually evaluated and are based on historical experience and other factors, including expectations of future events that are believed to be reasonable under the current circumstances. The final results could differ from said estimates; however, management expects that the variations, if any, will not have a material impact on the consolidated financial statements.
The most significant estimates included in the accompanying consolidated financial statements are related to allowance for loan losses, the valuation of investments, the technical reserves for claims and premiums, goodwill impairment, the impairment of available-for-sale investments, the valuation of share-based payment transactions and the valuation of derivative financial instruments. Furthermore, other estimates exist, such as the estimated useful life of intangible assets, property, furniture and equipment and the deferred income tax assets and liabilities. The accounting criteria used for said estimates are described below.
The accounting policies adopted are consistent with those of the previous years, except that the Group has adopted the new revised IFRS and IAS which are mandatory for the periods beginning on or after January 1, 2017, as described below:
| - | Amendments to IAS 12 “Income Taxes”: Recognition of the deferred income tax asset for unrealized losses. |
The amendments clarify the accounting treatment of deferred taxes when an asset is measured at fair value and when said fair value is less than the tax base of the asset. The amendments specifically confirm that:
| · | A temporary difference exists when the carrying amount of an asset is less than its tax base at the end of the information presentation period. |
| · | An entity can assume that it will recover an amount greater than the carrying amount when estimating the taxable profit that it will obtain in future. |
F- 13
| · | When the tax law restricts the source of taxable profits against which the particular types of deferred tax assets can be recovered, the recoverability of deferred tax assets can only be evaluated together with other deferred tax assets of the same kind. |
| · | The tax deductions resulting from the reversal of deferred income tax assets are excluded from the estimated future taxable profit that is used to evaluate the recoverability of said assets. |
Due to the Group’s structure and operations, the adoption of this amendment did not have a significant impact on its consolidated financial position and consolidated results; therefore, it has not been necessary to modify the Group’s comparative consolidated financial statements.
| - | Amendments to IAS 7 “Statement of Cash Flows”: Disclosure initiatives. |
The amendments require entities to break down the changes in their liabilities originating from financing activities, including both those generated by cash flows as well as those which do not involve cash flows (such as gains and losses due to exchange difference).
The Group has disclosed in its consolidated statement of cash flows the information required in tabular format as a reconciliation of the opening and closing balances.
| b) | Basis of consolidation - |
Investment in subsidiaries –
The consolidated financial statements comprise the financial statements of Credicorp and its Subsidiaries for all the years presented.
Under IFRS 10 all entities over which the Group has control are subsidiaries. Control is achieved when the Group is exposed, or has rights, to variable returns from its involvement with the investee and has the ability to affect those returns through its power over the investee. Specifically, the Group controls an investee if and only if the Group has:
| - | Power over the investee (i.e. existing rights that give it the current ability to direct the relevant activities of the investee), |
| - | Exposure, or rights, to variable returns from its involvement with the investee, and |
| - | The ability to use its power over the investee to affect its returns. |
Generally, there is a presumption that a majority of voting rights results in control. To support this presumption and when the Group has less than a majority of the voting or similar rights of an investee, the Group considers all relevant facts and circumstances in assessing whether it has power over an investee, including:
| - | The contractual arrangement with the other vote holders of the investee. |
| - | Rights arising from other contractual arrangements. |
| - | The Group’s voting rights and potential voting rights. |
The Group assesses whether or not it controls an investee if the facts and circumstances indicate that there are changes in one or more of the three elements of control. Consolidation of a subsidiary begins when the Group obtains control over the subsidiary and ceases when the Group loses control of the subsidiary. The consolidated financial statements include assets, liabilities, income and expenses of Credicorp and its subsidiaries.
Profit or loss for the period and each component of other comprehensive income (OCI) are attributed to the equity holders of the parent of the Group and to the non-controlling interest, even if this results in the non-controlling interest with a negative balance. When necessary, adjustments are made to the financial statements of subsidiaries to bring their accounting policies into line with the Group’s accounting policies. All intra-group assets and liabilities, equity, income, expenses and cash flows relating to transactions between members of the Group are eliminated in full on consolidation.
F- 14
Assets in custody or managed by the Group, such as investment funds and private pension funds (AFP funds), are not part of the Group’s consolidated financial statements, Note 3(ab).
Transactions with non-controlling interest -
A change in the ownership interest of a subsidiary, without a loss of control, is accounted for as an equity transaction and any resulting difference between the price paid and the amount corresponding to non-controlling shareholders is recognized directly in the consolidated statement of changes in net equity.
Loss of control -
If the Group loses control over a subsidiary, it derecognizes the carrying amount of the related assets (including goodwill) and liabilities, non-controlling interest and other components of equity, while any resultant gain or loss is recognized in profit or loss. Any residual investment retained is recognized at fair value.
Investments in associates -
An associate is an entity over which the Group has significant influence. Significant influence is the power to participate in the financial and operating policy decisions of the entity, but without exercising control over said policies.
The Group’s investments in its associates are recognized initially at cost and are subsequently accounted for using the equity method. They are included in “Other assets” in the consolidated statement of financial position; gains resulting from the use of the equity method of accounting are included in “Other income” of the consolidated statement of income.
F- 15
At December 31, 2017 and 2016, the following entities comprise the Group (the individual or consolidated figures of their financial statements are presented in accordance with IFRS and before eliminations for consolidation purposes, except for the elimination of Credicorp’s treasury shares and its related dividends):
| Entity | Activity and country of incorporation |
Percentage
of
interest (direct and indirect) |
Assets | Liabilities | Equity | Net income (loss) | ||||||||||||||||||||||||||||||||||||
| 2017 | 2016 | 2017 | 2016 | 2017 | 2016 | 2017 | 2016 | 2017 | 2016 | |||||||||||||||||||||||||||||||||
| % | % | S/(000) | S/(000) | S/(000) | S/(000) | S/(000) | S/(000) | S/(000) | S/(000) | |||||||||||||||||||||||||||||||||
| Banco de Crédito del Perú S.A. and Subsidiaries (i) | Banking, Peru | 97.69 | 97.69 | 139,658,667 | 127,513,766 | 124,107,841 | 113,568,832 | 15,550,826 | 13,944,934 | 3,036,929 | 2,954,668 | |||||||||||||||||||||||||||||||
| Pacífico Compañía de Seguros y Reaseguros S.A. and Subsidiaries (ii), Note 2(a) | Insurance, Peru | 98.79 | 98.45 | 11,402,998 | 10,156,361 | 8,558,149 | 7,786,257 | 2,844,849 | 2,370,104 | 325,008 | 303,264 | |||||||||||||||||||||||||||||||
| Inversiones Credicorp Bolivia S.A. and Subsidiaries (iii) | Holding, Bolivia | 99.96 | 99.96 | 9,153,381 | 8,017,925 | 8,458,813 | 7,337,562 | 694,568 | 680,363 | 96,826 | 71,910 | |||||||||||||||||||||||||||||||
| Atlantic Security Holding Corporation and Subsidiaries (iv) | Capital Markets, Cayman | 100.00 | 100.00 | 7,034,717 | 7,056,980 | 6,206,861 | 5,961,796 | 827,856 | 1,095,184 | 187,132 | 143,238 | |||||||||||||||||||||||||||||||
| Credicorp Capital Ltd. and Subsidiaries (v) | Capital Markets, Bermuda | 100.00 | 100.00 | 3,731,930 | 3,230,080 | 2,943,210 | 2,440,496 | 788,720 | 789,584 | 77,963 | 89,654 | |||||||||||||||||||||||||||||||
| CCR Inc. (vi) | Special purpose Entity, Bahamas | 100.00 | 100.00 | 667,170 | 1,103,787 | 670,132 | 1,123,045 | (2,962 | ) | (19,258 | ) | 14,018 | (39 | ) | ||||||||||||||||||||||||||||
| Prima AFP S.A. (vii) | Private pension fund administrator, Peru | 100.00 | 100.00 | 882,917 | 883,893 | 263,717 | 277,899 | 619,200 | 605,994 | 140,082 | 155,813 | |||||||||||||||||||||||||||||||
| Grupo Crédito S.A (viii) | Holding, Peru | 100.00 | 100.00 | 208,049 | 167,397 | 241,237 | 534,552 | (33,188 | ) | (367,155 | ) | (31,089 | ) | (15,575 | ) | |||||||||||||||||||||||||||
F- 16
| (i) | BCP was incorporated in 1889 and its activities are regulated by the Superintendence of Banking, Insurance and AFP (the Peruvian banking, insurance and AFP regulator, hereinafter “the SBS” for its Spanish acronym). |
At December 31, 2017, and 2016, its main Subsidiary is Mibanco, Banco de la Microempresa S.A. (hereinafter “Mibanco”), a banking entity in Peru oriented towards the micro and small business sector. At December 31, 2017, the assets, liabilities, equity and net income of Mibanco amount to approximately S/12,363.0 million, S/10,666.5 million, S/1,696.5 million and S/399.1 million, respectively (S/11,234.9 million, S/9,658.3 million, S/1,576.6 million, and S/336.0 million, respectively at December 31, 2016).
| (ii) | Pacífico Seguros is an entity regulated by the SBS and its activities comprise the contracting and management of all types of general risk and life insurance, reinsurance and property investment and financial operations. |
Its Subsidiaries are Crediseguro Seguros Personales and Crediseguro Seguros Generales, and it has Pacífico EPS as an associate, which are dynamic participants in the business of multiple and health insurance, respectively.
| (iii) | ICBSA was established in February 2013 and its objective is to make capital investments for its own account or for account of third parties in companies and other entities providing financial services, exercising or determining the management, administration, control and representation thereof, both nationally and abroad, for which it can invest in capital markets, insurance, asset management, pension funds and other related financial and/or stock exchange products. |
At December 31, 2017 and 2016, its principal Subsidiary is BCB, a commercial bank which operates in Bolivia. At December 31, 2017, the assets, liabilities, equity and net profit of BCB were approximately S/9,118.4 million, S/8,481.7 million, S/636.7 million and S/75.4 million, respectively (S/7,949.2 million, S/7,238.5 million, S/620.7 million and S/80.7 million, respectively at December 31, 2016).
| (iv) | Its most important Subsidiary is Atlantic Security Bank (ASB), which is incorporated in the Cayman Islands and operates through branches and offices in Grand Cayman and the Republic of Panama; its main activities are private and institutional banking services and trustee administration, mainly for BCP’s Peruvian customers |
| (v) | Credicorp Capital Ltd. was formed in 2012, and its main subsidiaries are Credicorp Capital Holding Chile (owner of Inversiones IMT), Credicorp Capital Holding Colombia (owner of Credicorp Capital Colombia), and Credicorp Capital Holding Peru (owner of Credicorp Capital Peru S.A.A.), which develop their activities in Chile, Colombia and Peru, respectively. |
At December 31, 2017 and 2016, Credicorp Capital Ltd. directly and indirectly holds 100.00 percent of the share capital of Inversiones IMT and Credicorp Capital Colombia. At December 31, 2017, the assets, liabilities, equity and net profit of Inversiones IMT total approximately S/1,123.4 million, S/964.8 million, S/158.6 million and S/20.8 million, respectively (S/987.5 million, S/840.4 million, S/147.1 million and S/23.7 million, respectively at December 31, 2016); and those of Credicorp Capital Colombia total approximately S/1,667.0 million, S/1,522.2 million, S/144.8 million and S/18.8 million, respectively (S/1,496.5 million, S/1,346.2 million, S/150.3 million and S/24.2 million, respectively at December 31, 2016).
At December 31, 2017 and 2016, Credicorp Capital Ltd. directly holds 100.0 percent of the share capital of Credicorp Capital Holding Perú. At December 31, 2017, the assets, liabilities, equity and net profit of Credicorp Capital Holding Perú and Subsidiaries total approximately S/303.1 million, S/121.3 million, S/181.8 million and S/28.6 million, respectively (S/236.0 million, S/56.5 million, S/179.5 million and S/19.3 million, respectively, at December 31, 2016).
F- 17
Credicorp Capital Perú has the principal function of a holding company of shares, participations, and securities in general, provision of financial and corporate advisory services, and property investment. At December 31, 2017 and 2016, respectively, Credicorp Capital Peru holds as Subsidiaries, Credicorp Capital Sociedad Agente de Bolsa S.A., Credicorp Capital S.A. Sociedad Administradora de Fondos, Credicorp Capital Servicios Financieros S.A. and Credicorp Capital Sociedad Titulizadora S.A., member companies of the Investment Banking Group in Peru.
| (vi) | CCR Inc. was incorporated in 2000, its main activity is to manage loans granted to BCP by foreign financial entities, See Note 16(a)(iii). These loans are collateralized by transactions performed by BCP. At December 31, 2017 and 2016, the negative equity balance consists mainly of an accumulated loss of S/17.0 million and a profit for the period of S/14.0 million (an accumulated loss of S/17.0 million and an unrealized loss of S/2.3 million from cash flow hedge derivatives, at December 31, 2016). |
| (vii) | Prima AFP is a private pension fund and its activities are regulated by the SBS. |
| (viii) | Grupo Crédito is a company mainly engaged in shares listed in Peru and unlisted shares of Peruvian companies. It also holds the Group’s shares in BCP, and Inversiones Credicorp Bolivia, Prima AFP and Pacífico Seguros. Grupo Crédito’s balances are presented net of its investments in said entities. |
| c) | Foreign exchange - |
| (i) | Functional and presentation currency - |
Credicorp and its Subsidiaries which operate in Peru consider the sol as their functional and presentation currency since it reflects the nature of the economic events and relevant circumstances given the fact their major transactions and/operations, such as: lending, borrowing, finance income, finance costs and a significant percentage of their purchases are agreed in soles.
| (ii) | Transactions and balances in foreign currency - |
Foreign currency transactions are those entered into in currencies other than the functional currency. These transactions are initially stated by Group entities at the exchange rates of their functional currencies at the transaction dates. Monetary assets and liabilities denominated in foreign currency are adjusted at the exchange rate of the functional currency prevailing at the date of the statement of financial position.
The differences arising from the exchange rate prevailing at the date of each consolidated statement of financial position presented and the exchange rate initially used in recording transactions are recognized in the consolidated statement of income in the period in which they occur, in “Exchange differences”. Non-monetary assets and liabilities acquired in foreign currency are stated at the exchange rate prevailing at the initial transaction date and are not subsequently adjusted.
| (iii) | Group entities with functional currency other than the presentation currency - |
Given that the Group’s entities in Colombia, Chile, Cayman, Panama and Bolivia have a functional currency different from Soles, the balances were translated into Soles for consolidation purposes in accordance with IAS 21, “The Effects of Changes in Foreign Exchange Rates” as follows:
| - | Assets and liabilities, at the closing rate prevailing at the date of each consolidated statement of financial position. |
| - | Income and expense, at the average exchange rate for each month of the year. |
All resulting exchange differences were recognized within “Exchange differences” in the consolidated statement of comprehensive income.
F- 18
| d) | Recognition of income and expenses from banking activities - |
Interest income and expense for all interest-bearing financial instruments, including those related to financial instruments classified as held for trading or designated at fair value through profit or loss, are recognized within “Interest and similar income” and “Interest and similar expenses” in the consolidated statement of income using the Effective Interest Rate (EIR) method, which is the rate that discounts estimated future cash payments or receipts during the expected life of the financial instrument or a shorter period, where appropriate, to the net carrying amount of the financial asset or financial liability.
Interest income includes coupons earned on fixed income investment and trading securities and the discount and premium on financial instruments. Dividends are recognized as income when they are declared.
Fees and commission income are recognized on an accrual basis. Contingent credit fees for loans that are likely to be drawn down and other credit related fees are deferred (together with any direct incremental costs) and recognized as an adjustment to the effective interest rate on the loan.
All other revenues and expenses are recognized on an accrual basis.
| e) | Insurance activities - |
Product classification:
Insurance contracts are those contracts when the Group (the insurer) has accepted a significant insurance risk from another party (the policyholder) by agreeing to compensate the policyholder if a specified uncertain future event (the insured event) adversely affects the policyholder. This definition also includes reinsurance contracts that the Group holds.
Once a contract has been classified as an insurance contract, it remains an insurance contract for the remainder of its lifetime, even if the insurance risk reduces significantly during this period, unless all rights and obligations are extinguished or expire.
Life insurance contracts offered by the Group include retirement, disability and survival insurance, annuities and individual life which includes Investment Link insurance contracts. The non-life insurance contracts issued by the Group mainly include automobile, fire and allied lines, technical branches and healthcare.
Reinsurance:
The Group cedes insurance risk in the normal course of its operations for most of its businesses. Reinsurance assets represent balances due from reinsurance companies. Reinsurance ceded is placed on both a proportional and non-proportional basis.
Amounts recoverable from reinsurers are estimated in a manner consistent with the outstanding claims reserve or settled claims and ceded premiums associated with the ceded policies and are in accordance with the related reinsurance contracts.
Reinsurance assets are reviewed for impairment at each reporting date of the consolidated statement of financial position or more frequently when an indication of impairment arises during the reporting year. Impairment occurs when there is objective evidence as a result of an event that occurred after initial recognition of the reinsurance asset that the Group may not receive all outstanding amounts due under the terms of the contract and the event has a reliably measurable impact on the amounts that the Group will receive from the reinsurer. The impairment loss is recorded in the consolidated statement of income.
Ceded reinsurance arrangements do not relieve the Group from its obligations to policyholders.
F- 19
The Group also assumes reinsurance risk in the normal course of business for non-life insurance contracts when applicable. Premiums and claims on assumed reinsurance are recognized as revenue or expenses in the same manner as they would be if the reinsurance were considered direct business, taking into account the classification of the reinsured insurance contract.
Reinsurance liabilities represent balances due to reinsurance companies. Amounts payable are estimated in a manner consistent with the related reinsurance contract.
Premiums and claims are presented on a gross basis for both ceded and assumed reinsurance, see Notes 23 and 24. Reinsurance assets or liabilities are derecognized when the contractual rights are extinguished or expire or when the contract is transferred to another party. Reinsurance contracts that do not transfer significant insurance risk are not material to the insurance segment.
Insurance receivables:
Insurance receivables are recognized when due and measured on initial recognition at the fair value of the consideration received or receivable. Subsequent to initial recognition, insurance receivables are measured at amortized cost. As of December 31, 2017 and 2016 the carrying amount of the insurance receivables is similar to their fair value due to their short term. The carrying value of insurance receivables is reviewed for impairment whenever events or circumstances indicate that the carrying amount may not be recoverable. The impairment loss is recorded in the consolidated statement of income. Insurance receivables are derecognized when the de-recognition criteria for financial assets, as described in Note 3(g), have been met.
“Investment Link” assets:
“Investment Link” assets represent financial instruments held for purposes of funding a group of life insurance contracts and for which investment gains and losses accrue directly to the policyholders who bear the investment and reinvestment risk. Each account has specific characteristics and the assets are carried at fair value. The balances of each account are legally segregated and are not subject to claims that arise out of any other business of the Group. The liabilities linked to these accounts are equal to the account assets, net of the commissions that the Group charges for the management of these contracts.
Deferred acquisition costs (DAC):
These comprise the direct costs that originate with and are related to traditional life and Investment Link insurance contracts, which are deferred; all other acquisition costs are recognized as an expense when incurred. The direct acquisition costs comprise primarily agent commissions corresponding to the underwriting and policy issuance costs.
Subsequent to initial recognition, these costs are amortized on a straight line basis based on the average expiration period of the related insurance contracts. Amortization is recorded in the consolidated statement of income.
DAC for general insurance and health products are amortized over the period in which the related revenues are earned.
DAC are derecognized when the related contracts are either settled or disposed of.
An impairment review is performed at the date of the consolidated statement of financial position or more frequently when an indication of impairment arises. When the recoverable amounts are less than the carrying value an impairment loss is recognized in the consolidated statement of income. DAC is also considered in the liability adequacy test for each reporting period.
F- 20
Reinsurance commissions:
Commissions on reinsurance contracts for ceded premiums are amortized on a straight line basis over the term of the coverage of the related insurance contract.
Insurance contract liabilities:
| i) | Life insurance contract liabilities - |
Life insurance liabilities are recognized when contracts are entered into.
The technical reserves maintained by the Group include the reserves of all of the business lines, comprising both the mathematical reserves and those of ongoing risk, as well as the reserves for outstanding claims, settled claims, claim settlement costs, claims incurred but not reported, as applicable to each line.
Due to the nature of the business, the mathematical reserves of the pension lines represent the main part of the Group’s reserves, with the line of Life Annuities as the major source of reserves due to the important volume of premiums and as a result of having only single premiums. In order to determine the reserves of this business, the discounted present value of the expected future pensions, to be paid in a guaranteed and non-guaranteed period is taken into account, calculated on the basis of mortality tables and interest rates. Those are based on the asset portfolio which supports the liabilities. Additionally, the constituted reserves include the amount required to cover the maintenance expenses related to the administration of the payment of future pensions.
On the other hand, in the Individual Life business the Group offers some products which are only risk related and others of risk and savings, the latter being those which comprise the highest percentage of reserves of the line. Risk and savings products can be differentiated between those with a guaranteed interest rate and others without guaranteed interest, the reserve for the first group being equal to the balance of the policy accounts plus the unaccredited surplus interest, and for the second group it is equal to the balance of the policy accounts. Said accounts are established with the premiums collected, tax deductions, expenses and costs of insurance and the accreditation of interest based on the yield of the portfolio which supports said reserves.
Life insurance claims reserves include reserves for reported claims and the estimates of the incurred claims that have not been reported to the Group. At December 31, 2017 and 2016, reserves for claims occurred and not reported were determined on the basis of the Chain Ladder methodology (a generally accepted actuarial method), whereby the weighted average of past claim development is projected into the future; this projection is based on the ratios of occurrence of accumulated past claims. Adjustments to the liabilities at each reporting date of the consolidated statement of financial position are recorded in the consolidated statement of income. The liability is derecognized when the contract expires, is discharged or is cancelled.
At each reporting date, an evaluation is carried out as to whether the life insurance liabilities are adequate, net of the related DAC, by means of a liability adequacy test as established by IFRS 4. At December 31, of 2017 and 2016, the Group’s Management concluded that the liabilities are sufficient and, therefore, they have not recognized any additional liability for life insurance contracts.
| ii) | Non-life insurance contract liabilities (which comprise general and healthcare insurance) - |
Non-life insurance contract liabilities are recognized when contracts are entered into.
Claims reserves are based on the last estimated cost of all claims incurred but not settled at the date of the consolidated statement of financial position, whether reported or not, together with related claim handling costs and the expected reduction in value of salvage and other recoveries.
F- 21
Delays can be experienced in the notification and settlement of certain types of claims, therefore their ultimate cost cannot be known with certainty at the date of the consolidated statement of financial position. Claims occurred but not reported are estimated and included in the provision (liabilities). IBNR reserves are determined on the basis of the Bornhuetter - Ferguson methodology - BF (a generally accepted actuarial method), which considers a statistical analysis of the recorded loss history, the use of projection methods and, when appropriate, qualitative factors that reflect present conditions or trends that could affect the historical data. No provision for equalization or catastrophe reserves is recognized. The liabilities are derecognized when the contract expires, is discharged or is cancelled.
Technical reserves for non-life insurance contracts comprise the provision for unearned premiums which represents premiums received for risks that have not yet expired. Generally, the reserve is liberated during the term of the contract and is recognized as premium income.
At each reporting date the Group reviews the risk from outstanding claims and an existing liability adequacy test as laid out under IFRS 4, to determine whether there is any overall excess of expected claims over unearned premiums. If these estimates show that the carrying amount of the unearned premiums is inadequate, the deficiency is recognized in the consolidated statement of income by setting up a provision for liability adequacy. As of December 31, 2017 and 2016, Management determined that the liabilities were adequate; therefore, it has not recorded any additional liabilities for non-life insurance contracts.
Income recognition:
| (i) | Gross premiums - |
Life insurance contracts -
Gross premiums on life contracts are recognized as revenue when due from the policyholder. For single premium business, revenue is recognized on the date on which the policy is effective.
Non-life insurance contracts -
Gross non-life insurance direct and assumed premiums comprise the total premiums written and are recognized on the date of issue of the policy as a receivable. At the same time, a reserve is recorded for unearned premiums which represent premiums for risks that have not yet expired. Unearned premiums are recognized as income over the contract period which is also the coverage and risk period.
| (ii) | Fees and commission income - |
Investment Link insurance contract policyholders remunerate the Group for policy administration services, investment management services, surrenders and other contract fees. These fees are recognized as revenue in the consolidated statement of income in the period in which the services are provided.
Recognition of benefits, claims and expenses:
| (i) | Benefits and claims - |
The benefits and claims for life insurance contracts include the cost of all claims arising during the year including internal and external claim handling costs that are directly related to the processing and settlement of claims. Death, survival and disability claims are recorded on the basis of notifications received. Pension payments are recorded when they accrue.
F- 22
General and health insurance claims include all claims occurring during the year, whether reported or not, internal and external claim handling costs that are directly related to the processing and settlement of claims, a reduction for the value of salvage and other recoveries, and any adjustment to claims outstanding from previous years.
| (ii) | Reinsurance premiums - |
Comprise the total premiums payable for the coverage of the insurance contracts and are recognized on the date on which the validity of the insurance policy commences. Unearned ceded premiums are deferred over the term of the underlying insurance contract.
| (iii) | Reinsurance claims - |
Reinsurance claims are recognized when the related gross insurance claim is recognized according to the terms of the relevant contract.
| f) | Financial Instruments: Initial recognition and subsequent measurement - |
A financial instrument is any contract that gives rise to a financial asset of one entity and a financial liability or equity instrument or another entity.
The Group classifies its financial instruments in one of the categories defined by IAS 39: financial assets and financial liabilities at fair value through profit or loss; loans and receivables; available-for-sale financial investments; held-to-maturity financial investments and other financial liabilities. The Group determines the classification of its financial instruments at initial recognition.
The classification of financial instruments at initial recognition depends on the purpose and the Management intention for which the financial instruments were acquired and their characteristics. All financial instruments are measured initially at their fair value plus the incremental costs related to the transaction which are directly attributable to the acquisition or issue of the instrument, except in the case of financial assets and financial liabilities recorded at fair value through profit or loss.
Purchases or sales of financial assets that require delivery of assets within a time frame established according to market regulations or conventions (regular market trades) are recognized on the trade date, that is, the date on which the Group commits to purchase or sell the asset. Derivatives are recognized on a trade date basis.
| (i) | Financial assets and liabilities at fair value through profit or loss - |
Financial assets and liabilities at fair value through profit or loss include financial assets and liabilities held for trading and financial assets and liabilities designated at fair value through profit or loss, the designation of which is upon initial recognition and on an instrument by instrument basis. Derivative financial instruments are also categorized as held for trading unless they are designated as hedging instruments.
A financial asset or liability is classified as held for trading if it is acquired for the purpose of selling or repurchasing it in the short term, and is presented in “Trading securities” or “Financial liabilities at fair value through profit or loss” in the consolidated statement of financial position.
Management may only designate an instrument at fair value through profit or loss upon initial recognition when the following criteria are met:
| - | The designation eliminates or significantly reduces the inconsistent treatment that would otherwise arise from measuring assets or liabilities or recognizing gains or losses generated by them on a different basis; or |
F- 23
| - | The assets and liabilities are part of a group of financial assets, financial liabilities or both which are managed and evaluated based on the yield on their fair value, in accordance with a documented risk management or investment strategy; or |
| - | A contract contains one or more embedded derivatives which can significantly modify the cash flows that might otherwise be required by the contract and their separation is not prohibited by IAS 39. In this case, the entire contract is designated at fair value through profit or loss. |
Changes in fair value of a designated financial asset and liability through profit or loss are recorded in “Net gain (loss) on financial assets designated at fair value through profit or loss” of the consolidated statement of income. Interest earned or incurred is accrued in the consolidated statement of income in “Interest and similar income” or “interest and similar expenses”, according to the terms of the contract. Dividend income is recorded when the right to payment has been established.
| (ii) | Loans and receivables - |
Loans and receivables are non-derivative financial assets with fixed or determinable payments that are not quoted in an active market.
After initial recognition, loans and receivables are measured at amortized cost using the effective interest rate method, less any provision for impairment. Amortized cost is calculated by taking into account any discount or premium on acquisition and fees or costs that are an integral part of the effective interest rate. The effective interest rate amortization is recognized in the consolidated statement of income in “Interest and similar income”. Losses from impairment are recognized in the consolidated statement of income in “Provision for loan losses, net of recoveries”.
Direct loans are recorded when disbursement of funds to the clients are made. Indirect (off-balance sheet) loans are recorded when documents supporting such facilities are issued. Likewise, Credicorp considers as refinanced or restructured those loans that change their payment schedules due to difficulties in the debtor’s ability to repay the loan.
A provision for loan losses is established if there is objective evidence that the Group will not be able to collect all amounts due according to the original contractual terms of the loans. The provision for loan losses is established based on an internal risk classification and considering any guarantees and collaterals received, Note 3 (i) and 32.1.
| (iii) | Available-for-sale financial investments - |
Available-for-sale financial investments include equity investments and debt securities. Equity investments classified as available-for-sale are those that are neither classified as held for trading nor designated at fair value through profit or loss. Debt instruments in this category are those that are intended to be held for an indefinite period of time and that may be sold in response to needs for liquidity or in response to changes in market conditions.
After initial recognition, available-for-sale financial investments are subsequently measured at fair value with unrealized gains or losses recognized as other comprehensive income in the available-for-sale reserve, net of the corresponding deferred tax and non-controlling interest, until the investment is derecognized, at which time the cumulative gain or loss is recognized in the consolidated statement of income in “Net gain on the sale of securities”, or is determined to be impaired, at which time the impaired amount is recognized in the consolidated statement of income in “Impairment loss on available–for–sale investments” and removed from the reserve of investments available-for-sale.
F- 24
Interest and similar income earned are recognized in the consolidated statement of income in “Interest and similar income”. Interest earned is reported as interest income using the effective interest rate method and dividends earned are recognized when collection rights are established.
Estimated fair values are based primarily on quoted prices or, if quoted market prices are not available, discounted expected cash flows using market rates commensurate with the credit quality and maturity of the investment.
The Group evaluates whether its ability and intention to sell its available-for-sale financial assets in the near term is still appropriate. When, in rare circumstances, the Group is unable to trade these financial assets due to inactive markets, the Group may elect to reclassify these financial assets if Management has the ability and intention to hold such assets for the foreseeable future or until maturity.
For a financial asset reclassified from the available-for-sale category, the fair value carrying amount at the date of reclassification becomes its new amortized cost and any previous gain or loss on the asset that has been recognized in equity is amortized to profit or loss over the remaining life of the investment using the effective interest rate.
| (iv) | Held-to-maturity financial investments - |
Held-to-maturity financial investments are non–derivative financial assets with fixed or determinable payments and fixed maturities, which Credicorp has the intention and ability to hold to maturity. After initial measurement, held-to-maturity financial investments are subsequently measured at amortized cost using the effective interest rate less impairment. Amortized cost is calculated by taking into account any discount or premium on acquisition and fees that are an integral part of the effective interest rate. The amortization is included in “Interest and similar income” of the consolidated statement of income. The losses arising from impairment of these investments are recognized in the consolidated statement of income.
At December 31, 2017 and 2016 the Group has not recognized any impairment loss on held-to-maturity investments, see policy of impairment of financial assets carried at amortized cost in Note 3(i)(i).
If the Group were to sell or reclassify a more than insignificant amount of held-to-maturity investments before maturity (other than in certain specific circumstances), the entire category would be tainted and would have to be reclassified as available-for-sale. Furthermore, the Group would be prohibited from classifying any financial asset as held-to-maturity during the following two (2) years.
At December 31, 2017 and 2016 the Group did not sell or reclassify any of its held-to-maturity investments.
| (v) | Repurchase and reverse repurchase agreements and security lending and borrowing transactions - |
Securities sold under agreements to repurchase at a specified future date are not derecognized from the consolidated statement of financial position as the Group retains substantially all of the risks and rewards of ownership. The cash received is recognized as an asset with a corresponding obligation to return it, including accrued interest, as a liability in “Payables from repurchase agreements and security lendings”, reflecting the transaction’s economic substance as a loan to the Group. The difference between the sale and repurchase price is treated as interest expense and is accrued over the life of the agreement using the effective interest rate and is recognized in “Interest and similar expenses” of the consolidated statement of income.
F- 25
As part of this transaction the Group grants assets as collateral. When the counterparty receives securities and has the right to sell or re-pledge, the Group reclassifies those securities in “Available-for-sale investments pledged as collateral” or “Held-to-maturity investments pledged as collateral”, as appropriate, of the consolidated statement of financial position. Also, when the counterparty receives cash as collateral that will be restricted until the maturity of the contract, the Group reclassifies the cash in Cash collateral, reverse repurchase agreements and security borrowings” in the consolidated statement of financial position, which includes accrued interest that is calculated according to the method of the effective interest rate.
Conversely, securities purchased under agreements to resell at a specified future date are not recognized in the consolidated statement of financial position. The consideration paid, including accrued interest, is recorded in “Receivables from reverse repurchase agreements and security borrowings” of the consolidated statement of financial position, reflecting the transaction’s economic substance as a loan by the Group. The difference between the purchase and resale price is recorded in “Interest and similar income” of the consolidated statement of income and is accrued over the life of the agreement using the effective interest rate.
If securities purchased under agreement to resell are subsequently sold to third parties, the obligation to return the securities is recorded as a short sale in the consolidated statement of financial position heading “Financial liabilities at fair value through profit or loss” and measured at fair value, with any gains or losses included in the consolidated statement of income caption “Net gain on sale of securities”.
Security lending and borrowing transactions are usually collateralized by securities. The transfer of the securities to counterparties is only reflected in the consolidated statement of financial position if the risks and rewards of ownership are also transferred.
| (vi) | Other financial liabilities - |
After initial measurement other financial liabilities are subsequently measured at amortized cost using the effective interest rate method. Amortized cost includes any issuance discount or premium and directly attributable transaction costs that are an integral part of the effective interest rate.
| g) | De-recognition of financial assets and liabilities - |
Financial assets:
A financial asset (or, where applicable a part of a financial asset or a part of a group of similar financial assets) is derecognized when: (i) the rights to receive cash flows from the asset have expired; or (ii) the Group has transferred its rights to receive cash flows from the asset or has assumed an obligation to pay the received cash flows in full without material delay to a third party under a “pass-through” arrangement; and either the Group has transferred substantially all the risks and rewards of the asset, or the Group has neither transferred nor retained substantially all the risks and rewards of the asset, but has transferred control of the asset.
When the Group has transferred its right to receive cash flows from an asset or has entered into a pass-through arrangement, it evaluates if and to what extent it has retained the risks and rewards of ownership. When it has neither transferred nor retained substantially all of the risks and rewards of the asset, nor transferred control of the asset, the Group continues to recognize the transferred asset to the extent of the Group’s continuing involvement. In that case, the Group also recognizes the associated liability. The transferred asset and the associated liability are measured on a basis that reflects the rights and obligations that the Group has retained.
F- 26
Continuing involvement that takes the form of a guarantee over the transferred asset is measured at the lower of (i) the original carrying amount of the asset, and (ii) the maximum amount of consideration that the Group could be required to repay.
Financial liabilities:
A financial liability is derecognized when the obligation under the liability is discharged, cancelled or expires. When an existing financial liability is replaced by another from the same lender on substantially different terms, or the terms of an existing liability are substantially modified, such exchange or modification is treated as a de-recognition of the original liability and the recognition of a new liability; the difference between the carrying amount of the original financial liability and the consideration paid is recognized in the consolidated statement of income.
| h) | Offsetting financial instruments - |
Financial assets and liabilities are offset and the net amount is reported in the consolidated statement of financial position when there is a legally enforceable right to offset the recognized amounts and Management has the intention to settle on a net basis, or realize the assets and settle the liability simultaneously.
| i) | Impairment of financial assets - |
The Group assesses at the date of each consolidated statement of financial position whether there is any objective evidence that a financial asset or a group of financial assets is impaired. An impairment exists if one or more events that has occurred since the initial recognition of the asset (an incurred “loss event”), has an impact on the estimated future cash flows of the financial asset or the group of financial assets that can be reliably estimated. Evidence of impairment may include indications that the borrower or a group of borrowers is experiencing significant financial difficulty, default or delinquency in interest or principal payments, the probability that they will go bankrupt or other legal financial reorganization process and where observable data indicate that there is a measurable decrease in the estimated future cash flows, such as changes in arrears or economic conditions that correlate with defaults.
The criterion used for each category of financial assets is as follows:
| (i) | Financial assets carried at amortized cost - |
For loans, receivables and held-to-maturity investments that are carried at amortized cost, the Group first assesses whether impairment exists individually for financial assets that are individually significant, or collectively for financial assets that are not individually significant. If the Group determines that no objective evidence of impairment exists for an individually assessed financial asset, whether significant or not, it includes that asset in a group of financial assets with similar credit risk characteristics and collectively assesses them for impairment. Assets that are individually assessed for impairment and for which an impairment loss is, or continues to be, recognized are not included in a collective assessment of impairment.
The amount of any impairment loss identified is measured as the difference between the asset’s carrying amount and the present value of estimated future cash flows (excluding future expected credit losses that have not yet been incurred).
The carrying amount of the asset is reduced through the use of a provision account and the amount of the loss is recognized in the consolidated statement of income. A loan, together with the respective associated provision, is written off when classified as a loss and is fully provisioned and there is real and verifiable evidence that the loan is irrecoverable and collection efforts concluded without success, the impossibility of foreclosures or all collateral has been realized or has been transferred to the Group.
F- 27
If in any subsequent year, the amount of the estimated impairment loss increases or decreases because of an event occurring after the impairment was recognized, the previously recognized impairment loss is increased or reduced by adjusting the provision account. If in the future a written-off loan is later recovered, the recovery is recognized in the consolidated statement of income, as a credit to “Provision for loan losses, net of recoveries”.
The present value of the estimated future cash flows is discounted at the financial asset’s original effective interest rate. If a loan has a variable interest rate, the discount rate for measuring any impairment loss will be the current effective interest rate.
The calculation of the present value of the estimated future cash flows of a collateralized financial asset reflects the cash flows that may result from foreclosure less costs for obtaining and selling the collateral, whether or not foreclosure is probable.
For collective assessment of impairment, financial assets are grouped considering the Group’s internal credit grading system, which considers credit risk characteristics; for example: asset type, industry, geographical location, collateral type and past-due status and other relevant factors.
Future cash flows from a group of financial assets that are collectively evaluated for impairment are estimated on the basis of historical loss experience for assets with similar credit risk characteristics to those in the group. Historical loss experience is adjusted on the basis of current observable data to reflect the effects of current conditions that did not affect the years on which the historical loss experience is based and to remove the effects of conditions in the historical period that do not currently exist. The methodology and assumptions used are reviewed regularly to reduce any differences between loss estimates and actual loss experience.
| (ii) | Available-for-sale financial investments - |
For available-for-sale financial investments, the Group assesses at each date of the consolidated statement of financial position whether there is objective evidence that an investment or a group of investments is impaired.
In the case of equity investments, objective evidence would include a significant or prolonged decline in their fair value below cost. “Significant” is to be evaluated against the original cost of the investment and “prolonged” against the period in which the fair value has been below its original cost. The determination of what is “significant” or “prolonged” requires judgment. In making this judgment, the Group evaluates, among other factors, the duration or extent to which the fair value of an investment is less than its cost.
When there is evidence of impairment, the cumulative loss (measured as the difference between the acquisition cost and the current fair value, less any previously recognized impairment loss) is removed from available-for-sale investments reserve of the consolidated statement of changes in equity and recognized in the consolidated statement of income. Impairment losses on equity investments are not reversed through the consolidated statement of income; increases in their fair value after impairment are recognized directly in the consolidated statement of comprehensive income.
F- 28
In the case of debt instruments, impairment is assessed based on the same criteria as financial assets carried at amortized cost. However, the amount recorded for impairment is the cumulative loss measured as the difference between the amortized cost and the current fair value, less any impairment loss on that investment previously recognized in the consolidated statement of income. Future interest income is based on the reduced carrying amount and is accrued using the interest rate used to discount the future cash flows for the purpose of measuring the impairment loss. Interest income is recorded as part of “Interest and similar income” of the consolidated statement of income. If in a subsequent year, the fair value of a debt instrument increases and the increase can be objectively related to an event occurring after the impairment loss was recognized in the consolidated statements of income, the impairment loss is reversed through the consolidated statement of income.
| (iii) | Renegotiated loans - |
When a loan is modified, it is not considered as past due but it maintains its previous classification as impaired or not impaired. If the debtor complies with the new agreement during the following six months, and an analysis of its payment capacity supports a new improved risk classification, the loan is classified as not impaired. If, subsequent to the loan modification, the debtor fails to comply with the new agreement, it is considered as impaired and past due.
| j) | Leases - |
The determination of whether an arrangement is, or contains, a lease is based in the substance of the arrangement at the inception date: whether fulfillment of the arrangement is dependent on the use of a specific asset or assets and on whether the arrangement conveys a right to use the asset even if that right is not explicitly specified in an arrangement.
Operating leases:
Leases in which a significant portion of the risks and benefits of the asset are held by the lessor are classified as operating leases. Under this concept the Group has mainly leased premises used as offices and agencies of the Group’s subsidiaries.
When an operating lease is terminated before the lease period has expired, any penalty payment to the lessor is recognized as an expense in the period in which termination takes place.
Finance leases:
Finance leases are recognized as granted loans at the present value of the future lease collections. The difference between the gross receivable amount and the present value of the loan is recognized as unearned interest. Lease income is recognized over the term of the lease agreement using the effective interest rate method, which reflects a constant periodic rate of return.
| k) | Property, furniture and equipment - |
Property, furniture and equipment are stated at historical acquisition cost less accumulated depreciation and impairment losses, if applicable. Historical acquisition costs include expenditures that are directly attributable to the acquired property, furniture or equipment. Maintenance and repair costs are charged to the consolidated statement of income; significant renewals and improvements are capitalized when it is probable that future economic benefits, in excess of the originally assessed standard of performance, will flow from the use of the acquired property, furniture or equipment.
F- 29
Land is not depreciated. Depreciation is calculated using the straight-line method over the estimated useful lives, which are as follows:
| Years | |
| Buildings and other construction | 33 |
| Installations | 10 |
| Furniture and fixtures | 10 |
| Vehicles and equipment | 5 |
| Computer hardware | 4 |
An item of property, furniture and equipment and any significant part initially recognized is derecognized upon disposal or when no future economic benefits are expected from its use or disposal. Any gain or loss arising on de-recognition of the asset (calculated as the difference between the net disposal proceeds and the carrying amount of the asset) is included in the consolidated statement of income.
Assets’ residual value, and the selected useful life are periodically reviewed to ensure that they are consistent with current economic benefits and life expectancy.
| l) | Investment properties - |
Investment properties are held to earn rentals or for capital appreciation or both rather than for: (a) use in the production or supply or goods or services or for administrative purposes; or (b) sale in the ordinary course of business. Property that is being constructed or developed for future use as investment property is recognized at cost before completion.
Investment properties are initially measured at fair value, which is the purchase transaction price, unless otherwise indicated. Transaction costs are included in the initial measurement, which includes the purchase price and any other cost directly attributable to the transaction.
For subsequent recognition, an entity shall choose as its accounting policy either the fair value model or the cost model and shall apply that policy to all its investment property. At the date of the consolidated financial statements, the Group has opted for keeping the cost model. Accordingly, investment properties are accounted for at their acquisition cost less accumulated depreciation and the accumulated impairment losses, if any.
An entity can opt for recognizing and depreciating separately the components of an investment property or as a single unit for recording and depreciation purposes. The Group recognizes as a single unit each of its investment properties and has estimated a useful life of 33 years for purposes of determining depreciation under the straight-line method.
Rental income is recognized as rents that are accrued under the related rental agreement; depreciation expenses as well as maintenance expenses and other related expenses are accounted for as maintenance of the rented assets, net within “Other income” in the consolidated statement of income.
| m) | Seized assets - |
Seized assets are recorded at the lower of cost or estimated market value, which is obtained from valuations made by independent appraisers. Reductions in book values are recorded in the consolidated statement of income.
| n) | Business combination - |
Business combinations made are accounted for using the acquisition method in accordance with IFRS 3 “Business Combination”, regardless of whether they are equity instruments or other acquired assets.
F- 30
The acquisition cost is the sum of the consideration paid for the acquisition measured at fair value at the acquisition date and the amount of the share in the non-controlling interest acquired. For each business combination the Group decides whether to measure the non-controlling interest in the acquiree at fair value or at the proportional share in the identifiable net assets of the acquiree.
Acquisition-related costs are recognized as expense and are included within “Administrative expenses” in the consolidated statement of income. When the Group acquires a business, it assesses the financial assets and liabilities assumed for its own classification and denomination according to the contractual terms, economic circumstances and prevailing conditions at the date of acquisition. This includes the separation of embedded derivative contracts signed by the acquiree.
Any contingency transferred by the acquirer is recognized at fair value at the acquisition date. The contingency classified as an asset or liability that is a financial instrument and is within the scope of IAS 39 “Financial instruments: Recognition and measurement” is measured at fair value with changes recognized in the consolidated statement of income or consolidated statement of comprehensive income. If the contingency is not within the scope of IAS 39, it is measured in accordance with the applicable IFRS. A contingency that is classified as equity should not be measured again and its subsequent settlement is accounted for within equity.
The acquisition of a non-controlling interest is recorded directly in net equity, any difference between the amount paid and the acquired net assets is recorded as an equity transaction. Accordingly, the Group recognizes no additional goodwill after the acquisition of the non-controlling interest, nor does it recognize any profit or loss from the disposal of the non-controlling interest.
Equity attributable to the non-controlling interest is shown separately in the consolidated statement of financial position. Profit attributable to the non-controlling interest is shown separately in the consolidated statement of income and consolidated statement of comprehensive income.
In a business combination achieved in stages, the acquirer shall re-measure its ´previously held equity interest in the acquiree at fair value at the acquisition-date. The resulting gain or loss is recognized in profit or loss.
| o) | Intangible assets - |
Comprise internally developed and acquired software licenses used by the Group. Acquired software licenses are measured on initial recognition at cost and are amortized using the straight-line method over their estimated useful life (between 3 and 5 years).
Intangible assets identified as a consequence of the acquisition of subsidiaries are recognized in the consolidated statement of financial position at their fair values determined on the acquisition date and are amortized using the straight line method over their estimated useful life as follows:
F- 31
| Estimated useful | |
| life in years | |
| Client relationship - Prima AFP (AFP Unión Vida) | 20 |
| Client relationship - Inversiones IMT S.A. | 22 |
| Client relationship cash, fixed and variable income - Credicorp Capital Colombia | 5 |
| Client relationship APT - Credicorp Capital Colombia | 5 |
| Client relationship - Edyficar Peru | 10 |
| Client relationship – Mibanco | 7 |
| Brand - Mibanco | 25 |
| Brand - Credicorp Capital Colombia | 5 |
| Brand - Inversiones IMT S.A. | 5 |
| Fund manager contract - Credicorp Capital Colombia | 28 |
| Fund manager contract - Inversiones IMT S.A. | 11 |
| Core deposits - Mibanco | 6 |
| Right of use - BCP | 5 |
| Others | 5 |
The period and the amortization method, for intangible assets are reviewed at the end of each period. If the expected useful life differs from previous estimates, the amortization period will be changed to reflect this change. If there has been a change in the expected pattern of conduct of the future economic benefits embodied in the asset, the amortization method shall be amended to reflect these changes.
Gains or losses arising from de-recognition of an intangible asset are measured as the difference between the net disposal proceeds and the carrying amount of the asset and are recognized in the consolidated statement of income when the asset is derecognized.
| p) | Goodwill - |
Goodwill is the excess of the aggregate of the consideration transferred over the fair value recognized for the acquisition of the net value of the identifiable net assets acquired and liabilities assumed. If the fair value of the net assets acquired exceeds the aggregate consideration transferred, then the gain is recognized in the consolidated statement of income.
After initial recognition, goodwill is measured at cost less any accumulated impairment losses. For the purpose of impairment testing, goodwill acquired in a business combination is, from the acquisition date, allocated to each of the Group’s cash-generating units (CGU) that are expected to benefit from the combination, irrespective of whether other assets or liabilities of the acquiree are assigned to these units.
Where goodwill has been allocated to a CGU and part of the operation within that unit is disposed of, the goodwill and the assets disposed of are included in the carrying amount of the operation when determining the gain or loss on disposal. Goodwill disposed of in these circumstances is measured based on the relative values of the disposed operation and the portion of the cash-generating unit retained.
Impairment is determined for goodwill by assessing the recoverable amount of each CGU (or group of CGUs) to which the goodwill relates. Where the recoverable amount of the CGU is less than its carrying amount, an impairment loss is recognized. Impairment losses relating to goodwill cannot be reversed in future periods.
F- 32
| q) | Impairment of non-financial assets - |
The Group assesses, at each reporting date, whether there is an indicator that an asset may be impaired. If any indication exists, or when annual impairment testing for an asset is required, the Group estimates the asset’s recoverable amount. An asset’s recoverable amount is the higher of the value of the asset or the CGU less costs to sell and its value in use and is determined for each individual asset, unless the asset does not generate cash inflows that are largely independent of those from other assets or groups of assets.
When the carrying amount of an asset or CGU exceeds its recoverable amount, the asset is considered impaired and is written down to its recoverable amount. In assessing value in use, the estimated future cash flows are discounted to their present value using a pre-tax discount rate that reflects current market assessments of the time value of money and the risks specific to the asset. In determining fair value less costs to sell, recent market transactions are considered, if any. If this kind of transactions cannot be identified, an appropriate valuation model is used. These calculations are verified against valuation multiples, quoted share prices for publicly traded subsidiaries or other available fair value indicators.
For non-financial assets, excluding goodwill, an assessment is made at each reporting date whether there is an indication that previously recognized impairment losses may no longer exist or may have decreased. If such indication exists, the Group estimates the recoverable amount. A previously recognized impairment loss is reversed only if there has been a change in the estimates used to determine the asset’s recoverable amount since the last impairment loss was recognized.
The reversal is limited so that the carrying amount of the asset does not exceed its recoverable amount, nor exceed the carrying amount that would have been determined, net of depreciation, had no impairment loss been recognized for the asset in prior years. Such reversal is recognized in the consolidated statement of income.
| r) | Due from customers on acceptances - |
Due from customers on acceptances corresponds to accounts payable from customers for import and export transactions, whose obligations have been accepted by the Group. The obligations that must be assumed by the Group for such transactions are recorded as liabilities.
| s) | Financial guarantees - |
In the ordinary course of business, the Group issues financial guarantees, such as letters of credit, guarantees and acceptances. Financial guarantees are initially recognized at fair value (which is equivalent to the commission initially received) in “Other liabilities” of the consolidated statement of financial position. Subsequent to initial recognition, the Group’s liability under each guarantee is measured at the higher of the amount initially recognized less, when appropriate, cumulative amortization recognized in the consolidated statement of income, and the best estimate of expenditure required to settle any financial obligation arising as a result of the financial guarantee.
Any increase in the liability relating to a financial guarantee is included in the consolidated statement of income. The commission received is recognized in “Banking services commissions” of the consolidated statement of income on a straight line basis over the life of the granted financial guarantee.
| t) | Provisions - |
Provisions are recognized when the Group has a present obligation (legal or constructive) as a result of a past event, it is probable that an outflow or resources embodying economic benefits will be required to settle said obligation and a reliable estimate can be made of the amount.
F- 33
The expense relating to any provision is presented in the consolidated statement of income net of any reimbursement. If the effect of the time value of money is material, provisions are discounted using a current pre-tax rate that reflects, where appropriate, the specific risks of the liability. When discounting is used, the increase in the provision due to the passage of time is recognized as a finance cost.
| u) | Contingencies - |
Contingent liabilities are not recognized in the consolidated financial statements. They are disclosed in the Notes, unless the probability of an outflow of resources is remote. Contingent assets are not recorded in the financial statements; they are disclosed if it is probable that an inflow of economic benefits will be realized.
| v) | Income tax - |
Income tax is computed based on the individual financial statements of Credicorp and of each of its Subsidiaries.
Deferred income tax reflects the effects of temporary differences between the carrying amounts of assets and liabilities for accounting purposes and the amounts determined for tax purposes. Deferred assets and liabilities are measured using the tax rates expected to be applied to taxable income in the years in which temporary differences are expected to be recovered or eliminated. The measurement of deferred assets and deferred liabilities reflects the tax consequences that arise from the manner in which Credicorp and its Subsidiaries expect, at the date of the consolidated statement of financial position, to recover or settle the carrying amount of its assets and liabilities.
The carrying amount of deferred tax assets and liabilities may change, even though there is no change in the amount of the related temporary differences, due to a change in the income tax rate. In this case, the resulting change in deferred tax, corresponding to the change in rate, will be recognized in profit or loss, except to the extent that it relates to items previously recognized outside of the consolidated income statement (either in other comprehensive income or directly in equity).
Deferred tax assets and liabilities are recognized regardless of when the timing differences are likely to reverse. Deferred tax assets are recognized when it is more likely than not, that future taxable profit will be available against which the temporary difference can be utilized. At the date of the consolidated statement of financial position, Credicorp and its Subsidiaries assess unrecognized deferred assets and the carrying amount of recognized deferred assets.
Credicorp and its Subsidiaries determine their deferred income tax based on the tax rate applicable to their undistributed earnings; any additional tax on dividend distribution is recorded on the date a liability is recognized.
Deferred tax assets and liabilities are offset if there is a legal right of offset and the deferred taxes are related to the same taxpaying entity and the same tax authority.
| w) | Earnings per share - |
Basic earnings per share is calculated by dividing the net profit for the year attributable to Credicorp’s equity holders by the weighted average number of ordinary shares outstanding during the year, excluding the average number of ordinary shares purchased and held as treasury stock.
Diluted earnings per share is calculated by dividing the net profit attributable to Credicorp’s equity holders by the weighted average number of ordinary shares outstanding during the year, excluding the average number of ordinary shares purchased and held as treasury stock, plus the weighted average number of ordinary shares that would have been issued on the conversion of all the dilutive potential ordinary shares into ordinary shares.
F- 34
| x) | Share-based payment transactions - |
The cost of the Group’s remuneration plan is recognized, together with a corresponding increase in equity, over the period in which the service conditions are fulfilled, ending on the date on which the relevant employees become fully entitled to the award (‘the vesting date”).
The cumulative expense recognized for equity-settled liquidations at each reporting date until the vesting date reflects the extent to which the vesting period has expired and the Group’s best estimate of the number of equity instruments that will ultimately vest. The expense is recorded in “Salaries and employee benefits” of the consolidated statement of income.
When the terms of a share-based liquidation are modified, the minimum expense recognized is maintained as if the terms had not been modified. An additional expense is recognized for any modification which increases the total fair value of the share-based payment arrangement, or which is otherwise beneficial to the employee as measured at the date of modification.
The dilutive effect of the shares granted under this plan is reflected as a share dilution in the computation of diluted earnings per share, see paragraph (w) above.
| y) | Derivative financial instruments and hedge accounting - |
Trading -
The Group negotiates derivative financial instruments in order to meet its clients’ needs. The Group may also take positions with the expectation of profiting from favorable movements in prices, rates or indexes.
Part of the transactions with derivatives, which provide effective economic hedges under the Group’s risk management positions, do not qualify for hedge accounting under the specific rules of IAS 39 and are, therefore, treated as trading derivatives.
Derivative financial instruments are initially recognized at fair value in the consolidated statement of financial position and subsequently are re-measured at fair value. Fair values are estimated based on the market exchange and interest rates. All derivatives are carried as assets when fair value is positive and as liabilities when fair value is negative. Gain and losses for changes in their fair value are recorded in the consolidated statement of income.
Hedging -
The Group uses derivative instruments to manage exposures to interest rate and foreign currency. In order to manage particular risks, the Group applies hedge accounting for transactions which meet the specified criteria.
At inception of the hedge relationship, the Group formally documents the relationship between the hedged item and the hedging instrument, including the nature of the risk, the objective and strategy for undertaking the hedge and the method that will be used to assess the effectiveness of the hedging relationship.
Also, at the inception of the hedge relationship, a formal assessment is undertaken to ensure the hedging instrument is expected to be highly effective in offsetting the designated risk in the hedged item. Hedges are formally assessed at each reporting date.
A hedge is considered highly effective if the following conditions are met:
| - | At the inception of a hedge and in following years, the hedge is expected to be highly effective to offset changes in the fair value or cash flows attributable to the hedged risk over the designated period of the hedge; and |
F- 35
| - | The actual effectiveness of the hedge is within the range of 80-125 percent. |
The accounting treatment is determined on the basis of the nature of the hedged item and once the hedging qualifying criteria are met.
| i) | Cash flow hedges - |
The effective portion of the gain or loss on the hedging instrument is recognized directly as part of other comprehensive income in “Cash flow hedge reserve”, while any ineffective portion is recognized immediately in the consolidated statement of income.
Amounts recognized as other comprehensive income are transferred to the consolidated statement of income when the hedged transaction affects profit or loss; that is, when the hedge-related finance income or finance cost is recognized or when an expected sale occurs.
If the forecasted transaction or firm commitment is no longer expected to occur, the accumulated gain or loss previously recognized in the cash flow hedge reserve is transferred to the consolidated statement of income. If the hedging instrument expires or is sold, terminated or exercised without replacement or rollover, or if its designation as a hedge is revoked, any unrealized accumulated gain or loss previously in the cash flow hedge reserve remains in said reserve until the planned transaction or firm commitment affects profit or loss. At the same time, the derivative is recorded as a trading derivative.
| ii) | Fair value hedges - |
The change in the fair value of a fair value hedge is recognized in “Interest and similar income” or “Interest and similar expenses” of the consolidated statement of income. The change in the fair value of the hedged item attributable to the risk hedged is recorded as a part of the carrying value of the hedged item and is recognized in the consolidated statement of income.
For fair value hedges relating to items carried at amortized cost, any adjustment to the carrying amount of these items, as a result of discontinuation of the hedge, will be amortized through the consolidated statement of income over the remaining life of the hedge. Amortization may begin as soon as an adjustment exists and no later than when the hedged item ceases to be adjusted for changes in its fair value attributable to the risk being hedged.
If the hedged item is derecognized, the unamortized fair value is recognized immediately in the consolidated statement of income.
The hedge relationship is terminated when the hedging instrument expires or is sold, terminated or exercised, or where the hedge no longer meets the criteria for hedge accounting, the hedge relationship is terminated. For hedged items recorded at amortized cost, the difference between the carrying value of the hedged item on termination and the face value is amortized over the remaining term of the original hedge using the effective interest rate. If the hedged item is derecognized, the unamortized fair value adjustment is recognized immediately in the consolidated statement of income. At the same time, the derivative is recorded as a trading derivative.
| iii) | Embedded derivatives - |
Derivatives embedded in host contracts are accounted for as separate derivatives and recorded at fair value if their economic characteristics and risks are not closely related to those of the host contract, and said host contract is not held for trading or designated at fair value through profit or loss.
The Group has investments indexed to certain life insurance contracts liabilities, denominated “Investment Link”. These instruments have been classified at inception by the Group as “Financial instruments at fair value though profit or loss”, See Note 3(f)(i) and Note 8.
F- 36
| z) | Fair value measurement - |
Fair value is the price that would be received to sell an asset or paid to transfer a liability in an orderly transaction between market participants at the measurement date. The fair value measurement is based on the presumption that the transaction to sell the asset or transfer the liability takes place either:
| - | In the principal market for the asset or liability, or |
| - | In the absence of a principal market, in the most advantageous market for the asset or liability. |
The principal or the most advantageous market must be accessible by the Group. Also, the fair value of a liability reflects its non-performance risk.
When available, the Group measures the fair value of an instrument using the quoted price in an active market for that instrument. A market is regarded as active if transactions for the asset or liability take place with sufficient frequency and volume to provide pricing information on an ongoing basis.
If there is no quoted price in an active market, then the Group uses valuation techniques that maximize the use of relevant observable inputs and minimize the use of unobservable inputs.
The chosen valuation technique incorporates all of the factors that market participants would take into account in pricing a transaction.
All assets and liabilities for which fair value is measured or disclosed in the consolidated financial statements are categorized within the fair value hierarchy, described as follows, based on the lowest level of input used that is significant to the fair value measurement as a whole:
| - | Level 1 - Quoted (unadjusted) market prices in active markets for identical assets or liabilities. |
| - | Level 2 - Valuation techniques for which the lowest level input that is significant to the fair value measurement is directly or indirectly observable. |
| - | Level 3 - Valuation techniques for which the lowest level input that is significant to the fair value measurement is unobservable. |
For assets and liabilities that are recognized at fair value in the consolidated financial statements on a recurring basis, the Group determines whether transfers have occurred between levels in the hierarchy by re-assessing categorization at the end of each reporting period.
For the purpose of fair value disclosures, the Group has determined classes of assets and liabilities on the basis of the nature, characteristics and risks of the asset or liability and the level of the fair value hierarchy as explained above.
Also, fair values of financial instruments measured at amortized cost are disclosed in Note 32.7(b).
| aa) | Segment reporting - |
The Group reports financial and descriptive information about its reportable segments. Reportable segments are operating segments or aggregations of operating segments that meet specified criteria. Operating segments are a component of an entity for which separate financial information is available that is evaluated regularly by the entity’s Chief Operating Decision Maker (“CODM”) in making decisions about how to allocate resources and in assessing performance. Generally, financial information is required to be reported on the same basis as it is used internally for evaluating operating segments’ performance and deciding how to allocate resources to segments, Note 29.
F- 37
| ab) | Fiduciary activities, management of funds and pension funds – |
The Group provides custody, trustee, investment management and advisory services to third parties that result in the holding of assets on their behalf. These assets and income arising thereon are excluded from these consolidated financial statements, as they are not assets of the Group, Note 32.8.
Commissions generated for these activities are included in “Other income” of the consolidated statement of income.
| ac) | Cash and cash equivalents - |
For the purpose of the consolidated statement of cash flows, cash and cash equivalents comprise balances of cash and non-restricted balances with central banks, overnight deposits, time deposits and amounts due from banks with maturities of three months or less from the date of acquisition, excluding restricted balances See Note 4.
Cash collateral pledged as a part of a repurchase agreement is presented in “Cash collateral, reverse repurchase agreement and securities borrowings” in the consolidated statement of financial position, See Note 5(a).
Cash collateral pledged in the negotiation of derivative financial instrument and others are presented in “Other assets” in the consolidated statement of financial position, See Note 12.
| ad) | International Financial Reporting Standards issued but not yet effective - |
The Group decided not to early adopt the following standards and interpretations that were issued but are not effective as of December 31, 2017:
| (i) | IFRS 9 “Financial Instruments” - |
In July 2014, the IASB issued the complete version of IFRS 9, which combines the phases of classification and measurement, impairment and hedging accounting of the IASB project to replaces IAS 39 “Financial instruments: Measurement and Recognition”.
Classification and measurement:
IFRS 9 establishes three categories of classification: Amortized cost, fair value through other comprehensive income and fair value through profit or loss.
A debt instrument is classified and measured at amortized cost if: a) the objective of the business model is to maintain the financial asset, to collect the contractual cash flows, and b) the contractual cash flows of the instrument only represent the payment of the principal and interest of the debt.
Likewise, a debt instrument is classified and measured at fair value through other comprehensive income if: a) the objective of the business model is to maintain the financial asset, both to collect the contractual cash flows, as well as to sell them, and b) the contractual cash flows of the instrument only represent the payment of the principal and interest of the debt.
All other debt instruments that do not satisfy the above-mentioned conditions must be classified and measured at fair value through profit or loss.
An equity instrument is classified at fair value through profit or loss, unless it is not maintained for trading purposes, in which case, an entity may make an irrevocable choice at its initial recognition, to classify it at fair value through other comprehensive income, without subsequently having to reclassify it to profit or loss.
F- 38
The combined application of the tests on the characteristics of contractual cash flows and business models as of January 1, 2018, resulted in certain differences when comparing financial assets classified under IAS 39 with financial assets classified under IFRS 9.
Approximately S/1,593.4 million of financial assets previously classified as available for sale under IAS 39, have been classified as investments at fair value through profit or loss under IFRS 9. These financial assets held unrealized gains, which have been reclassified to the item retained earnings of the consolidated statement of changes in equity.
With regard to liabilities, most pre-existing requirements for classification and measurement previously included in IAS 39, have not changed in IFRS 9.
Impairment:
IFRS 9 introduces a new model of impairment based on expected losses of the credit portfolio and other instruments which differ significantly from the current model “under IAS 39 of credit losses incurred”, and it is expected to result in the early recognition of credit losses.
The financial assets classified or designated at fair value through profit or loss and the capital instruments designated at fair value through other comprehensive income, are not subject to impairment assessment.
Model of impairment of expected credit losses -
Under IFRS 9, provisions for credit losses will be measured at each reporting date, following a three phase model of expected credit losses:
| · | Phase 1: For financial assets of which the credit risk has not deteriorated significantly since its initial recognition, a reserve for losses will be recognized, equivalent to the credit losses which are expected to occur from defaults in the next 12 months. |
| · | Phase 2: For financial assets which have presented a significant increase in their credit risk, a reserve for losses will be recognized, equivalent to the credit losses which are expected to occur during the remaining life of the asset. |
| · | Phase 3: For financial assets with evidence of impairment at the reporting date a reserve for losses will be recognized, equivalent to the expected credit losses during the entire life of the asset. Interest income will be recognized based on the asset’s carrying amount, net of the loss reserve. |
The reserves for credit losses of Phase 1 and Phase 2 effectively replace the general reserve determined for loans not yet identified as impaired under IAS 39, although the reserves for credit losses of Phase 3 effectively replace the general reserves determined for impaired loans.
Measurement -
The measurement of expected credit loss is mainly based on the product of the probability of default (PD), the loss given default (LGD) and the exposure at the time of default (EAD), discounted at the reporting date and considering the expected macroeconomic effects, all according to the new regulation.
The fundamental difference between the credit loss considered as Phase 1 and Phase 2 is the horizon of PD. The estimates of Phase 1 use a 12-month horizon, while those in Phase 2 use an expected loss calculated with the remaining term of the asset and it considers the effect of the significant increase in the risk. Finally, in Phase 3, the expected loss will be estimated based on the best estimate (“ELBE” from its initials in English), given the situation of the collection process of each asset.
F- 39
The above method applies to all the portfolios, with the exception of some portfolios of reduced materiality and of which there is insufficient historical depth and/or loss experience.
In these cases, simplified approaches will be applied, based on the reality of each portfolio and with reasonable supported and documented criteria.
Changes from one phase to another -
The classification of an instrument as phase 1 or phase 2 depends on the concept of “significant impairment” on the reporting date in comparison with the origination date. In this sense, the definition used considers the following criteria:
| - | An account is classified in phase 2 if it has been more than N days in arrears. |
| - | Risk thresholds have been established based on the internal models and on relative thresholds of differences (by portfolio and risk level) in which the instrument originated. |
| - | The follow up, warning and monitoring systems of the risk portfolios which depend on the current risk policy in Wholesale and Retail Banking, are integrated. |
Additionally, all those accounts which are classified as in default at the reporting date are considered as phase 3. The evaluations of significant risk increase and credit impairment are carried out independently at each reporting date. Assets can move in both directions from one phase to another.
Prospective information -
The measurement of expected credit losses for each phase and the evaluation of significant increases in credit risk must consider information regarding previous events and current conditions, as well as forecasts of future economic events and conditions. For the estimation of the risk parameters (PD, LGD, EAD), used in the calculation of the provision in phases 1 and 2, macroeconomic variables were included which vary between portfolios. These forecasts are for a three-year period and, additionally, there is a long-term forecast.
The estimation of the expected loss for phases 1, 2 and 3 will be a weighted estimate which considers three future macroeconomic scenarios. The basic, optimistic and pessimistic scenarios are based on macroeconomic forecasts provided by the in-house economic studies team and approved by Senior Management. This same team also provides the probability of occurrence of each scenario. It should be pointed out that the scenario design is adjusted at least once a year and this can be done more frequently if the conditions of the environment require it.
Expected life -
For the instruments in Phase 2 or 3, the reserves for losses will cover the expected credit losses during the lifetime of the instrument. For most of the instruments, the expected lifetime is limited to the remaining life of the product, adjusted for expected future payments. In the case of revolving products, an analysis was made in order to determine what would be the expected period of life.
The application of the new impairment model generated increases in the reserve for credit losses under the new requirements. Below we present the most significant impacts that were recognized on January 1, 2018:
| - | Increase in the allowance for loan losses for S/320.7 million and its corresponding deferred income tax for S/94.6 million; resulting in a reduction in the retained earnings of S/226.1 million. |
F- 40
| - | Increase in the provision for investments for S/68.1 million and its corresponding deferred income tax, which was immaterial, resulting in a reduction in the retained earnings. |
Hedging accounting:
The new model of hedging accounting according to IFRS 9 seeks to simplify hedging accounting, align the accounting of the hedging relationships more closely with the risk management activities of an entity and permit hedging accounting to be applied more widely to a greater variety of hedging instruments and risks suitable for hedging accounting.
IFRS 9 is effective for accounting periods beginning on or after 1 January 2018. Early adoption is permitted.
The new classification, measurement and impairment requirements will be applied adjusting our consolidated statement of financial position at January 1, 2018, date of initial application, without restating the financial information of the comparative period.
| (ii) | IFRS 15 “Revenue from contracts with customer” - |
IFRS 15, which was published in May 2014 and amended in April 2016, will replace IAS 18 “Revenue”, and IAS 11 “Construction Contracts”.
The new standard is based on the principle that revenue is recognized when the control of a good or service is transferred to a client, so that the notion of control replaces the existing notion of risks and benefits.
The standard establishes a new five-step model that applies to the recording of revenue from contracts with clients:
| · | Identify the contracts with clients. |
| · | Identify the separate performance obligation. |
| · | Determine the price of the contractual transaction. |
| · | Assign the price of the transaction to each of the separate performance obligations, and |
| · | Recognize the revenue as each performance obligation is complied with. |
Key changes in current practice:
| · | All the grouped goods and services which are different must be recognized separately and, in general, the discounts or rebates in the contract price must be assigned to the separate elements. |
| · | Revenue can be recognized before it is done under the current standards if the consideration varies for any reason (for example, incentives, rebates, management commissions, royalties, success fee, etc.). If they are not at significant risk of reversal, the minimum amounts must be recognized. |
| · | The point at which revenue may be recognized can change: some revenue that is currently recognized at a given moment at the end of a contract may have to be recognized during the term of the contract and vice versa. |
| · | There are new specific standards regarding licenses, guarantees, non-reimbursable fee advances and consignment agreements, to name a few. |
| · | As with any new standard, there are also greater disclosure requirements. |
The Group assessed the impact of IFRS 15, concluding at the date of these financial statements, that there is no significant impact on the Group’s revenue recognition.
IFRS 15 is effective for annual periods beginning on or after January 1, 2018, with early adoption permitted.
F- 41
| (iii) | IFRS 16, “Leases” - |
IFRS 16, ‘Leases’ replaces the current standards related to the treatment of leases (IAS 17, ‘Leases’ and IFRIC 4, ‘Determining whether an arrangement contains a lease” and other related interpretations).
IFRS 16 will mainly affect the accounting treatment for lessees, and will result in the recognition of almost all lease contracts in the statement of financial position. The standard eliminates the current distinction between finance and operating leases, and requires the recognition of an asset (right of use of the leased asset) and of a financial liability to make the lease payments, for practically all of the lease contracts. There is an optional exemption for short term and low value leases.
The income statement will also be affected, since the total expense is normally higher in the initial years of the lease contract and lower in the final years. Furthermore, the operating costs will be replaced with interest and depreciation, therefore key metrics such as EBITDA will change.
Operating cash flows will be greater since cash payments for the principal portion of the lease debt are classified in financing obligations. Only the part of the payments that reflects interest can continue to be presented as operating cash flow.
During the year 2018, the Group will continue to evaluate the impact of IFRS 16; however, at the date of these financial statements, it concludes that the application of this standard will have no material effects on the financial statements.
IFRS 16 applies to annual periods beginning on or after January 1, 2019, with earlier application permitted but not before IFRS 15, Revenue from Contracts with Customers, is also early adopted.
| (iv) | Amendments to IFRS 2: “Share-based payment” “Income Taxes”: Recognition of the deferred income tax asset for unrealized losses. |
The amendments made by the IASB in July 2016 clarify the basis of measurement of the share-based payments in cash and the recording of the amendments which change benefits liquidated in cash into equity instruments.
Moreover, an exception is introduced to the principle of classification. When an employer is obliged to retain a certain amount for a tax obligation of the employee associated with a share-based payment, and he pays that amount to the tax authority, the total benefit will be treated as though it were liquidated in equity instruments, as long as it was liquidated in shares without the benefit of a net liquidation.
Entities with the following agreements may find themselves affected by these changes:
| · | Benefits liquidated in equity instruments which include net liquidations related to tax obligations |
| · | Share-based payments which include performance conditions, and |
| · | Cash liquidation agreements which are amended to share-based payments liquidated in equity instruments. |
The amendment to IFRS 2 applies to annual periods beginning on or after January 1, 2018, permitting its early adoption.
F- 42
| (v) | Annual improvements to the IFRS (2014 - 2016 Cycle) |
In December 2016, the following improvements were completed:
| · | IFRS 1 “First Time Adoption of IFRS”, which eliminates the short-term exemptions which cover the provisions for transition of IFRS 7, IAS 19 and IFRS 10 which are no longer relevant. |
| · | IAS 28 “Investments in Associates and Joint Ventures”. This clarifies that the choice by investment funds, mutual funds, investment trusts and similar entities to measure the investments in associates or joint ventures at fair value through profit or loss must be made separately for each associate or joint venture at initial recognition. |
Said improvements are applicable for financial periods from January 1, 2018.
| (vi) | IFRIC 22 “Foreign Currency Transactions and Advance Consideration” - |
This interpretation clarifies how to determine the transaction date for the exchange rate to use in the initial recognition of an asset, expense or income when an entity pays or receives advance consideration for contracts denominated in foreign currency.
For a single payment or collection, the transaction date must be the date on which the entity initially recognizes the non-monetary asset or liability which results from the advance consideration (the advance payment or deferred revenue).
If there are various payments or collections for an item, the transaction date must be determined as indicated above for each payment or collection.
Entities can opt for applying the interpretation:
| · | Retrospectively for each period presented. |
| · | Prospectively for items within the scope which is recognized for the first time at or after the start of the reporting period in which the interpretation is applied, or |
| · | Prospectively from the start of a prior reporting period presented as comparative information. |
| (vii) | Amendments to IAS 40: “Transfers of Investment Property” – |
The amendments clarify that transfers to or from, investment properties can only be made if there has been a change in the use of the property that is supported with evidence. A change in use occurs when the property complies with, or ceases to comply with, the definition of investment property.
A change of intention by itself is not sufficient to support a transfer.
The list of tests for a change of use in the standard is characterized as a non-exhaustive list of examples to help to illustrate the principal.
The IASB provided two examples for the transition:
| · | Prospectively, with any impact from the reclassification recognized as an adjustment to the initial retained earnings at the date of initial recognition, or |
| · | Retrospectively, only permitted without taking advantage of retrospective information. |
Additional disclosures are required if an entity adopts the requirements prospectively.
F- 43
The amendment to IAS 40 applies to annual periods beginning on or after January 1, 2018, with early adoption permitted.
| (viii) | IFRS 17 “Insurance Contracts” - |
IFRS 17 was issued in May 2017 in replacement of IFRS 4 “Insurance Contracts”. This standard requires a current measurement model in which the estimations are remeasured at each reporting period. The contracts are measured using the components of:
| · | Discounted probability-weighted cash flows. |
| · | An explicit risk adjustment, and |
| · | A contractual service margin which represents the unearned profit from the contract which is recognized as income during the period of coverage. |
The standard permits a choice between recognizing the changes in discount rates, either in the statement of income or directly in other comprehensive income. The choice probably reflects how insurers record their financial assets according to IFRS 9.
There is a modification of the general measurement model denominated “Variable commissions method” for certain contracts of insurers with life insurance in which the insured share the yields from the underlying elements. Upon applying the variable commissions method, the entity’s participation in changes in fair value of the underlying elements is included in the contractual service margin. Therefore, it is probable that the results of the insurers which use this model will be less volatile than under the general model.
The new standards will affect the financial statements and the key performance indicators of all of the entities that issue insurance contracts or investment contracts with discretionary participation characteristics.
IFRS 17 applies to annual periods beginning on or after January 1, 2021. Early adoption is permitted, as long as the Group also applies IFRS 9 and IFRS 15 on the date on which IFRS 17 is applied for the first time.
| (ix) | IFRIC 23 “Uncertainty over income tax treatments” - |
IFRIC 23 clarifies how to apply the requirements of recognition and measurement of IAS 12 “Income Taxes”, when there is uncertainty over income tax treatments. The IFRIC had previously clarified that IAS 12, and not IAS 37 “Provisions, Contingent Liabilities and Contingent Assets”, applies to the recording of uncertain income tax treatments.
IFRIC 23 explains how to recognize and measure deferred and current income tax assets and liabilities when there is uncertainty over a tax treatment. An uncertain tax treatment is any tax treatment applied by an entity regarding which there is uncertainty as to whether the treatment will be accepted by the tax authority. For example, a decision to claim a deduction for a specific expense or not to include a specific income element in a tax declaration is an uncertain tax treatment if its acceptability is uncertain based on the tax legislation. IFRIC 23 is applicable to all aspects of income tax accounting when there is uncertainty with regard to the treatment of an element, including tax profit or loss, the tax bases of assets and liabilities, tax losses and credits and tax rates.
IFRIC 23 applies to annual periods beginning on or after January 1, 2019.
| (x) | Annual improvements to the IFRS (2015 -17 Cycle) |
The improvements are presented below:
F- 44
| · | IFRS 3 “Business combinations”, clarifies the measurement of the interest held prior to obtaining control over a joint operation under IFRS 3. |
| · | IFRS 11 “Joint Arrangements”, clarifies the measurement of the interest held prior to obtaining control over a joint operation under IFRS 11. |
| · | IAS 12 “Income Taxes”, mentions the income tax consequences under IAS 12 of payments on financial instruments classified as equity. |
| · | IAS 23 “Borrowing costs”, establishes the borrowing costs eligible for capitalization. |
Said improvements are applicable for financial periods from January 1, 2019.
| (xi) | Amendments to IFRS 10 “Consolidated financial statements” and IAS 28 “Investments in Associates and Joint Ventures”: Sale or contribution of assets between an investor and his associate or joint venture. |
The IASB made limited scope amendments to IFRS 10 and IAS 28.
The amendments clarify the accounting treatment of the sales or contribution of assets between an investor and his associates or joint venture. These amendments confirm that the accounting treatment depends on whether the non-monetary assets sold or contributed to an associate or joint venture constitute “a business” (as defined in IFRS 3 “Business combinations”).
If the non-monetary assets constitute a business, the investor will recognize the total gain or loss on the sale or contribution of assets. If the assets do not comply with the definition of “business”, the investor will recognize the gain or loss only in proportion to the investor’s investment in the associate or joint venture. The amendments will apply prospectively.
The IASB decided to defer the application date of this amendment until it has completed its research project on the equity method. The Group will apply these modifications when they become effective.
There are no other standards or amendments to standards which have not yet become effective and are expected to have a significant impact on the Company, either in the current or future periods, as well as on expected future transactions.
| 4 | CASH AND CASH EQUIVALENTS |
This item consists in the following:
| 2017 | 2016 | |||||||
| S/(000) | S/(000) | |||||||
| Cash and clearing (a) | 5,034,569 | 4,061,766 | ||||||
| Deposits with Central Reserve Bank of Peru - BCRP (a) | 15,136,245 | 8,642,656 | ||||||
| Deposits with local and foreign banks (b) | 2,828,830 | 3,778,238 | ||||||
| Interbank funds | 207,559 | 147,713 | ||||||
| Accrued interest | 4,994 | 2,823 | ||||||
| Total cash and cash equivalents | 23,212,197 | 16,633,196 | ||||||
| Restricted funds | 9,790 | 12,573 | ||||||
| Total cash | 23,221,987 | 16,645,769 | ||||||
Cash and cash equivalents presented in the consolidated statement of cash flows excludes restricted funds, See Note 3(ac).
F- 45
| a) | Cash and clearing and deposits with Central Reserve Bank of Peru - |
These accounts mainly include the legal cash requirements that Credicorp and its Subsidiaries must keep to be able to honor their obligations with the public, which are within the limits established by current legislation. The composition of these funds is as follows:
| 2017 | 2016 | |||||||
| S/(000) | S/(000) | |||||||
| Legal cash requirements (i) | ||||||||
| Deposits with Central Reserve Bank of Peru | 11,768,476 | 8,625,876 | ||||||
| Cash in vaults of Bank | 4,425,384 | 3,158,153 | ||||||
| Total legal cash requirements | 16,193,860 | 11,784,029 | ||||||
| Additional funds | ||||||||
| Overnight deposits (ii) | 3,367,769 | 16,780 | ||||||
| Cash in vaults of Bank and others | 609,185 | 903,613 | ||||||
| Total additional funds | 3,976,954 | 920,393 | ||||||
| Total | 20,170,814 | 12,704,422 | ||||||
| (i) | At December 31, 2017 cash and deposits subject to legal cash requirements in local and foreign currency are subject to an implicit rate of 5.00 percent and 32.40 percent, respectively, on the total balance of obligations subject to legal cash requirements, as required by the BCRP (6.50 percent and 25.89 percent, respectively, at December 31, 2016). |
In the same way, at December 31, 2017, the increase in the balances of the legal cash requirement originated from the following factors: i) increase in the rates on the legal cash requirement; ii) increase in the volumes of the total of obligations subject to the legal cash requirement (TOSE from the Spanish acronym); and iii) increase in the volumes of cash due to changes in the banknote export policy.
| (ii) | At December 31, 2017, the Group maintains three “overnight” deposits with the BCRP, two of which are denominated in U.S Dollars for US$900.0 million (equivalent to S/2,916.9 million) and US$46.6 million (equivalent to S/150.9 million) and one in soles for S/300.0 million. The “overnight” deposits in dollars and soles earn interest at rates of 1.41 percent and 2.0 percent, respectively, and have maturities at 5 days. |
| b) | Deposits with local and foreign banks - |
Deposits with local and foreign banks mainly consist of balances in soles and U.S. dollars; are cash in hand and earn interest at market rates. At December 31, 2017 and 2016 Credicorp and its Subsidiaries do not maintain significant deposits with any bank in particular.
F- 46
| 5 | CASH COLLATERAL, REVERSE REPURCHASE AGREEMENTS AND SECURITIES BORROWINGS AND PAYABLES FROM REPURCHASE AGREEMENTS AND SECURITY LENDINGS |
| a) | This balance consists of the following: |
| 2017 | 2016 | |||||||
| S/(000) | S/(000) | |||||||
| Cash collateral on repurchase agreements and security lendings (i) | 6,962,421 | 10,621,045 | ||||||
| Cash collateral for short sales | 17,688 | – | ||||||
| Reverse repurchase agreement and security borrowings (ii) | 456,145 | 294,558 | ||||||
| Receivables for short sales | 44,166 | 4,021 | ||||||
| Total | 7,480,420 | 10,919,624 | ||||||
| (i) | At December 31, 2017, the balance mainly comprises cash collateral for approximately US$2,061.5 million (equivalent to S/6,681.2 million) delivered to BCRP to secure a borrowing in soles of approximately S/6,578.8 million obtained from the same entity (US$3,127.1 million, equivalent to S/10,494.7 million, and S/10,008.7 million, respectively at December 31, 2016). Cash collateral bears interest at an average annual effective interest rate according to market rates. The related liability is presented in “Payables from repurchase agreements and security lending” of the consolidated statement of financial position, see paragraph (c) below. |
F- 47
| (ii) | Credicorp, mainly through its subsidiaries Credicorp Capital Colombia and Inversiones IMT, provides financing to its customers through reverse repurchase agreements and security borrowings, in which a financial instrument serves as collateral. Details of said transactions are as follows : |
| At December 31, 2017 | At December 31, 2016 | |||||||||||||||||||||||||||||||||||||||||||||||||
| Currency |
Average
interest rate |
Up to 3 days |
From
3 to 30
days |
More
than
30 days |
Carrying
amount |
Fair
value of
underlying assets |
Average
interest rate |
Up to 3 days |
From
3 to 30
days |
More
than
30 days |
Carrying
amount |
Fair
value of
underlying assets |
||||||||||||||||||||||||||||||||||||||
| % | S/(000) | S/(000) | S/(000) | S/(000) | S/(000) | % | S/(000) | S/(000) | S/(000) | S/(000) | S/(000) | |||||||||||||||||||||||||||||||||||||||
| Instruments issued by the Colombian Government | Colombian pesos | 6.79 | – | 138,552 | 170,106 | 308,658 | 309,574 | 7.30 | 5,661 | 96,924 | 11,408 | 113,993 | 113,993 | |||||||||||||||||||||||||||||||||||||
| Instruments issued by the Chilean Government | Chilean pesos | 0.35 | 8,920 | 256 | – | 9,176 | 9,176 | 0.42 | – | 1,255 | – | 1,255 | 1,259 | |||||||||||||||||||||||||||||||||||||
| Other instruments | 2.62 | 23,337 | 70,809 | 44,165 | 138,311 | 137,815 | 4.54 | – | 166,826 | 12,484 | 179,310 | 179,809 | ||||||||||||||||||||||||||||||||||||||
| 32,257 | 209,617 | 214,271 | 456,145 | 456,565 | 5,661 | 265,005 | 23,892 | 294,558 | 295,061 | |||||||||||||||||||||||||||||||||||||||||
| b) | Credicorp, through its subsidiaries, obtains financing through “Payables from repurchase agreements and security lendings” by selling financial instruments and committing to repurchase them at future dates, including interest at a fixed rate. The details of said transactions are as follows: |
| At December 31, 2017 | At December 31, 2016 | |||||||||||||||||||||||||||||||||||||||||||||||||
| Currency |
Average
interest rate |
Up to 3 days |
From
3 to 30
days |
More
than
30 days |
Carrying
amount |
Fair
value of
underlying assets |
Average
interest rate |
Up
to 3
days |
From
3 to
30 days |
More
than
30 days |
Carrying
amount |
Fair
value of
underlying assets |
||||||||||||||||||||||||||||||||||||||
| % | S/(000) | S/(000) | S/(000) | S/(000) | S/(000) | % | S/(000) | S/(000) | S/(000) | S/(000) | S/(000) | |||||||||||||||||||||||||||||||||||||||
| Instruments issued by the Colombian Government | Colombian pesos | 6.62 | – | 1,291,621 | – | 1,291,621 | 1,292,272 | 7.60 | 63,267 | 864,071 | – | 927,338 | 927,865 | |||||||||||||||||||||||||||||||||||||
| Instruments issued by the Chilean Government | Chilean pesos | 0.23 | 249,186 | – | 236 | 249,422 | 249,422 | 0.34 | 231,667 | – | – | 231,667 | 233,108 | |||||||||||||||||||||||||||||||||||||
| Other instruments | – | – | – | – | – | – | 5.97 | – | 133,494 | – | 133,494 | 133,421 | ||||||||||||||||||||||||||||||||||||||
| Debt instruments (c) | 8,921 | 47,946 | 11,817,933 | 11,874,800 | 12,392,983 | – | – | 13,835,500 | 13,835,500 | 14,065,528 | ||||||||||||||||||||||||||||||||||||||||
| 258,107 | 1,339,567 | 11,818,169 | 13,415,843 | 13,934,677 | 294,934 | 997,565 | 13,835,500 | 15,127,999 | 15,359,922 | |||||||||||||||||||||||||||||||||||||||||
F- 48
| c) | At December 31, 2017, and 2016 the Group has repurchase agreements secured with: (i) cash, See Note 5(a), and (ii) available-for-sale investments and held-to-maturity investments, See Note 6(b). This item consists of the following: |
| At December 31, 2017 | At December 31, 2016 | |||||||||||||||||
| Counterparties | Currency | Maturity |
Carrying amount |
Collateral | Maturity |
Carrying amount |
Collateral | |||||||||||
| S/(000) | S/(000) | |||||||||||||||||
| BCRP, Note 5(a)(i) | Soles | January 2018 / October 2020 | 6,575,800 | Cash with BCRP | January 2017 / October 2020 | 10,008,700 | Cash with BCRP | |||||||||||
| BCRP | Soles | January 2018 / July 2020 | 2,710,232 | Available-for-sale investments and held-to-maturity investments | January 2017 / June 2017 | 1,256,706 | Available-for-sale investments | |||||||||||
| Natixis S.A. | Soles | August 2020 / August 2028 | 570,000 | Held-to-maturity investments | August 2017 / August 2020 | 600,000 | Held-to-maturity investments | |||||||||||
| Nomura International PLC (i) | U.S. dollar | March 2019 / December 2019 | 486,150 | Held-to-maturity investments and cash | March 2019 / December 2019 | 503,400 | Held-to-maturity investments and cash | |||||||||||
| Barclays PLC | U.S. dollar | January 2018 / Julio 2018 | 293,944 | Available-for-sale investments and held-to-maturity investments | – | – | – | |||||||||||
| Nomura International PLC (ii) | U.S. dollar | August 2020 | 259,280 | Held-to-maturity investments and cash | August 2020 | 268,480 | Held-to-maturity investments and cash | |||||||||||
| Nomura International PLC (iii) | U.S. dollar | August 2020 | 226,870 | Held-to-maturity investments and cash | August 2020 | 234,920 | Held-to-maturity investments and cash | |||||||||||
| Citigroup Global Markets Limited (iv) | U.S. dollar | August 2026 | 145,845 | Available-for-sale investments | August 2026 | 151,020 | Available-for-sale-investments | |||||||||||
| Citigroup Global Markets Limited | Soles | August 2020 | 100,000 | Held-to-maturity investments | August 2020 | 100,000 | Held-to-maturity investments | |||||||||||
| Banco Central de Bolivia | Bolivianos | January 2018 | 90,134 | Cash | – | – | – | |||||||||||
| UBS | U.S. dollar | January 2018 / March 2018 | 83,921 | Held-to-maturity investments | January 2017 | 68,808 | Held-to-maturity-investments | |||||||||||
| Natixis S.A. (v) | U.S. dollar | August 2026 | 81,025 | Available-for-sale investments | August 2026 | 83,900 | Available-for-sale investments | |||||||||||
| Credit Suisse Peru | Soles | – | – | – | August 2017 | 300,000 | Held-to-maturity investments and cash | |||||||||||
| Others below S/20 million | – | January 2018 / December 2032 | 46,069 | Investments | – | – | – | |||||||||||
| Yields | 205,530 | 259,566 | ||||||||||||||||
| 11,874,800 | 13,835,500 | |||||||||||||||||
At December 31, 2017, said operations accrue interest at fixed and variable rates between 1.00 percent and 7.20 percent and between Libor at 3M + 0.35 percent and Libor at 6M + 1.90 percent, respectively, (between 0.95 percent and 7.20 percent and between Libor at 3M + 0.35 percent and Libor at 6M + 1.90 percent, respectively, at December 31, 2016).
Certain repurchase agreements were hedged using interest rate swaps (IRS) and cross-currency swaps (CCS), as detailed below:
| (i) | At December 31, 2017, the Group holds IRS which were designated as cash flow hedges of certain repurchase agreements at variable rate for a nominal amount of US$150.0 million, equivalent to S/486.2 million (US$150.0 million, equivalent to S/503.4 million, at December 31, 2016). By using these IRS, those repurchase agreements were economically converted to fixed interest rate, See Note 12(b). |
| (ii) | At December 31, 2017, the Group maintains an IRS and a CCS, which were together designated as a cash flow hedge of a repurchase agreement in U.S. dollars at variable interest rate for a nominal amount of US$80.0 million, equivalent to S/259.3 million (approximately US$80.0 million, equivalent to S/268.5 million, at December 31, 2016). By means of the IRS and the CCS, said repurchase agreement was economically converted to soles at a fixed interest rate, See Note 12(b). |
| (iii) | At December 31, 2017, the Group maintains a CCS which was designated as a cash flow hedge for a repurchase agreement in U.S. dollars at variable rate for a nominal amount of US$70 million, equivalent to S/226.9 million (approximately US$70.0 million, equivalent to S/234.9 million, at December 31, 2016). By means of the CCS, this repurchase agreement was economically converted to a fixed interest rate in soles See Note 12(b). |
| (iv) | December 31, 2017, the Group maintains a CCS which was designated as a cash flow hedge of two repurchase agreements in U.S. dollars at variable rate for a nominal amount of US$45.0 million, equivalent to S/145.8 million (approximately US$45.0 million, equivalent to S/151.0 million, at December 31, 2016). By means of the CCS, said repurchase agreements were economically converted to soles, See Note 12(b). |
| (v) | At December 31, 2017, the Group maintains a CCS which was designated as a cash flow hedge of a repurchase agreement in U.S. dollars at variable rate for a nominal amount of US$25.0 million, equivalent to S/81.0 million (approximately US$25.0 million, equivalent to S/83.9 million, at December 31, 2016). By means of the CCS, said repurchase agreement was economically converted to soles, See Note 12(b). |
F- 49
| 6 | INVESTMENTS |
| a) | Investment at fair value through profit or loss and available-for-sale investments consist of the following: |
| 2017 | 2016 | |||||||||||||||||||||||||||||||
| Unrealized gross amount | Unrealized gross amount | |||||||||||||||||||||||||||||||
|
Amortized
cost |
Profits | Losses |
Estimated
fair value |
Amortized
cost |
Profits | Losses |
Estimated
fair value |
|||||||||||||||||||||||||
| S/(000) | S/(000) | S/(000) | S/(000) | S/(000) | S/(000) | S/(000) | S/(000) | |||||||||||||||||||||||||
| Investments at fair value through profit or loss (trading) (i) | – | – | – | 4,020,811 | – | – | – | 4,012,184 | ||||||||||||||||||||||||
| Interest accrued | – | – | – | 3,926 | – | – | – | 2,835 | ||||||||||||||||||||||||
| Total | – | – | – | 4,024,737 | 4,015,019 | |||||||||||||||||||||||||||
| Available-for-sale investments | ||||||||||||||||||||||||||||||||
| Corporate, leasing and subordinated bonds (ii) | 7,919,202 | 460,826 | (22,838 | ) | 8,357,190 | 7,902,688 | 268,421 | (121,748 | ) | 8,049,361 | ||||||||||||||||||||||
| Certificates of deposit BCRP (iii) | 7,906,747 | 16,960 | – | 7,923,707 | 4,796,142 | 6,466 | – | 4,802,608 | ||||||||||||||||||||||||
| Government Treasury Bonds (iv) | 4,308,507 | 336,561 | (4,520 | ) | 4,640,548 | 2,071,110 | 174,567 | (40,315 | ) | 2,205,362 | ||||||||||||||||||||||
| Participation in RAL Fund (v) | 527,405 | – | – | 527,405 | 650,803 | – | – | 650,803 | ||||||||||||||||||||||||
| Securitization instruments (vi) | 478,921 | 35,747 | (6,565 | ) | 508,103 | 523,135 | 19,136 | (6,785 | ) | 535,486 | ||||||||||||||||||||||
| Restricted mutual funds (vii) | 186,407 | 230,289 | – | 416,696 | 194,315 | 174,103 | – | 368,418 | ||||||||||||||||||||||||
| Participation in mutual funds | 398,308 | 11,458 | (200 | ) | 409,566 | 286,534 | 10,060 | (4,256 | ) | 292,338 | ||||||||||||||||||||||
| Negotiable certificates of deposit | 285,493 | 5,036 | (346 | ) | 290,183 | 57,523 | 2,889 | (8 | ) | 60,404 | ||||||||||||||||||||||
| Multilateral organization bonds | 165,830 | 13,897 | (224 | ) | 179,503 | 194,906 | 3,847 | (2,157 | ) | 196,596 | ||||||||||||||||||||||
| Certificates of Central Bank of Bolivia (viii) | 94,692 | 33 | – | 94,725 | 14,643 | – | – | 14,643 | ||||||||||||||||||||||||
| Investment funds | 34,703 | 25,013 | (95 | ) | 59,621 | 34,294 | 23,339 | – | 57,633 | |||||||||||||||||||||||
| Collateralized mortgage obligation (CMO) (ix) | 17,116 | 7,048 | (6 | ) | 24,158 | 21,628 | 7,618 | – | 29,246 | |||||||||||||||||||||||
| Commercial paper | 5,185 | – | – | 5,185 | 5,576 | 6 | (30 | ) | 5,552 | |||||||||||||||||||||||
| Hedge funds | 48 | 1,014 | – | 1,062 | 87 | 1,008 | – | 1,095 | ||||||||||||||||||||||||
| U.S. Federal agency bonds | 799 | 80 | – | 879 | 1,036 | 131 | – | 1,167 | ||||||||||||||||||||||||
| 22,329,363 | 1,143,962 | (34,794 | ) | 23,438,531 | 16,754,420 | 691,591 | (175,299 | ) | 17,270,712 | |||||||||||||||||||||||
| Shares - | ||||||||||||||||||||||||||||||||
| Listed (x) | 254,931 | 496,737 | (1,937 | ) | 749,731 | 541,969 | 711,597 | (3,101 | ) | 1,250,465 | ||||||||||||||||||||||
| Non-listed | 14,770 | 1,093 | – | 15,863 | 6,098 | 637 | – | 6,735 | ||||||||||||||||||||||||
| 269,701 | 497,830 | (1,937 | ) | 765,594 | 548,067 | 712,234 | (3,101 | ) | 1,257,200 | |||||||||||||||||||||||
| Balance before accrued interest | 22,599,064 | 1,641,792 | (36,731 | ) | 24,204,125 | 17,302,487 | 1,403,825 | (178,400 | ) | 18,527,912 | ||||||||||||||||||||||
| Accrued interest | 219,766 | 157,755 | ||||||||||||||||||||||||||||||
| Total | 24,423,891 | 18,685,667 | ||||||||||||||||||||||||||||||
F- 50
The Management of Credicorp has determined that the unrealized losses of available-for-sale investments at December 31, 2017 and 2016 are of a temporary nature, considering factors such as intended strategy in relation to the identified security or portfolio, its underlying collateral and credit rating of the issuers. During 2017, as a result of the impairment assessment of its available-for-sale investments, the Group recorded an impairment loss of S/0.8 million (S/14.5 million and S/43.8 million during 2016 and 2015, respectively), which is shown in “Impairment loss on available-for-sale investments” in the consolidated statement of income. Also, Management has decided and has the ability to hold each investment for a period of time sufficient to allow for an anticipated recovery in fair value, until the earlier of its anticipated recovery or maturity.
The movement of available-for-sale investments reserves, net of deferred income tax and non-controlling interest, is shown in Note 17(c).
During 2017, the Group has not reclassified instruments from the portfolio available-for-sale investments to investments held to maturity (During the years 2016 and 2015, the Group reclassified instruments from the portfolio available-for-sale investments to held-to-maturity investments which, at the time of the transfer maintained an unrealized profit amounting to S/6.0 million and an unrealized loss amounting to S/12.9 million recorded in equity, respectively). During the years 2017 and 2016, S/2.1 million and S/1.6 million, respectively, were amortized from unrealized results which were recorded in equity, and were transferred to the account “Net gain on sale of securities” of the consolidated statement of income. At December 31, 2017, unrealized profit amounting to S/0.02 million is held in equity, corresponding to the investments which were reclassified in category (unrealized gain amounting to S/2.1 million at December 31, 2016).
At December 31, 2017 and 2016, the maturities and annual market rates of available-for-sale investments are as follows:
| Maturities | Annual effective interest rate | |||||||||||||||||||||||||||||||||||||||||||||||||||
| 2017 | 2016 | 2017 | 2016 | |||||||||||||||||||||||||||||||||||||||||||||||||
| S/ | US$ |
Other
currencies |
S/ | US$ |
Other
currencies |
|||||||||||||||||||||||||||||||||||||||||||||||
| Min | Max | Min | Max | Min | Max | Min | Max | Min | Max | Min | Max | |||||||||||||||||||||||||||||||||||||||||
| % | % | % | % | % | % | % | % | % | % | % | % | |||||||||||||||||||||||||||||||||||||||||
| Corporate, leasing and Subordinated bonds | Jan-2018 / Feb-2065 | Jan-2017 / Feb-2065 | 1.37 | 9.20 | 0.24 | 7.55 | 0.17 | 7.83 | 2.88 | 10.21 | 0.16 | 13.46 | 0.14 | 9.06 | ||||||||||||||||||||||||||||||||||||||
| Certificates of deposit BCRP | Jan-2018 / Apr-2019 | Jan-2017 / May-2018 | 3.08 | 3.17 | – | – | – | – | 4.27 | 4.55 | – | – | – | – | ||||||||||||||||||||||||||||||||||||||
| Government Treasury bonds | Feb-2018 / Feb-2055 | Jan-2017 / Feb-2055 | 1.32 | 6.25 | 1.27 | 6.25 | – | – | 1.83 | 7.13 | 0.33 | 7.10 | – | – | ||||||||||||||||||||||||||||||||||||||
| Securitization instruments | Jan-2018 / Sep-2045 | Jan-2018 / Sep-2045 | 4.09 | 11.75 | 3.06 | 6.16 | 1.68 | 6.00 | 4.75 | 9.30 | 3.27 | 9.76 | 0.50 | 8.44 | ||||||||||||||||||||||||||||||||||||||
| Certificates of deposits Central Bank of Bolivia | Jan-2018 / Sep-2018 | Mar-2017 / Jun-2017 | – | – | – | – | 0.50 | 1.15 | – | – | – | – | 0.10 | 0.30 | ||||||||||||||||||||||||||||||||||||||
| Negotiable certificates of deposits | Jan-2018 / Mar-2033 | Jan-2017 / Feb-2026 | 0.49 | 4.33 | – | – | 1.18 | 4.90 | 2.10 | 6.54 | 0.95 | 1.98 | 1.30 | 6.25 | ||||||||||||||||||||||||||||||||||||||
| Multilateral organization bonds | Mar-2018 / Feb-2044 | Jan-2017 / Feb-2044 | 2.13 | 7.04 | 1.83 | 2.44 | – | – | 3.39 | 7.47 | 1.67 | 3.31 | – | – | ||||||||||||||||||||||||||||||||||||||
| Collateralized mortgage obligations (CMO) | Aug-2020 / Dic-2036 | Aug-2020 / Dec-2036 | – | – | 2.23 | 9.40 | – | – | – | – | 2.12 | 9.79 | – | – | ||||||||||||||||||||||||||||||||||||||
| U.S. Federal agency bonds | Aug-2035 | Aug-2035 | – | – | 1.66 | 1.66 | – | – | – | – | 1.47 | 1.47 | – | – | ||||||||||||||||||||||||||||||||||||||
F- 51
| (i) | At December 31, 2017 the balance includes mainly BCRP certificates of deposit (securities issued at discount through public auctions, negotiated in the Peruvian secondary market and settled in soles) amounting to S/2,102.3 million, government treasury bonds for an amount of S/1,142.0 million, and multilateral organization bonds for S/260.3 million, corporate and leasing bonds for S/238.4 million, listed shares for S/122.4 million and negotiable certificates of deposit for S/60.7 million (S/2,259.9 million, S/526.5 million, S/243.2 million, S/818.8 million, S/114.2 million and S/37.4 million, respectively, at December 31, 2016). |
| (ii) | At December 31, 2017 the most significant individual unrealized loss amounted to approximately S/2.2 million (S/17.7 million, at December 31, 2016). |
| (iii) | At December 31, 2017 the Group maintains 79,901 BCRP certificates of deposits (49,504 at December 31, 2016). |
| (iv) | At December 31, 2017 and 2016, the balance includes the following Government Treasury Bonds: |
| 2017 | 2016 | |||||||
| S/(000) | S/(000) | |||||||
| Peruvian sovereign bonds | 4,364,172 | 1,820,240 | ||||||
| Bolivian sovereign bonds | 106,461 | 52,462 | ||||||
| Colombian sovereign bonds | 58,381 | 212,756 | ||||||
| U.S. Federal agency bonds | 55,875 | 90,191 | ||||||
| Other | 55,659 | 29,713 | ||||||
| Total | 4,640,548 | 2,205,362 | ||||||
Certain treasury bonds were hedged through CCS and IRS, as detailed bellow:
| - | At December 31, 2017, the Group maintains CCS, which were designated as cash flow hedges of certain corporate bonds and foreign government bonds for nominal amounts totaling S/228.8 million and S/55.1 million, respectively (S/236.3 million and S/167.8 million, respectively, at December 31, 2016), See Note 12(b); by means of said CCS, the bonds were economically converted to soles at fixed rate. |
| - | At December 31, 2017, the Group maintains IRS, which have been designated as fair value hedges of certain Peruvian Government, corporate and international financial entity bonds denominated in U.S Dollars at fixed interest rate for a nominal amount of S/659.5 million (S/760.3 million at December 31, 2016), See Note 12(b); through said IRS these bonds were economically converted to variable interest rates. |
| (v) | At December 31, 2017, these funds total approximately S/146.2 million in bolivianos and S/381.2 million in U.S. dollars (S/168.4 million in bolivianos and S/482.4 million in U.S. dollars respectively at December 31, 2016) and comprise the investments made by the Group in the Central Bank of Bolivia as collateral for deposits received from the public. These funds have restrictions for their use and are required from all banks in Bolivia. |
F- 52
| (vi) | At December 31, 2017 and 2016, the balance of securitization instruments includes the following: |
| 2017 | 2016 | |||||||
| S/(000) | S/(000) | |||||||
| Inmuebles Panamericana | 156,186 | 94,478 | ||||||
| Abengoa Transmisión del Norte | 82,492 | 81,581 | ||||||
| Concesionaria La Chira S.A. | 30,182 | 30,661 | ||||||
| Hunt Oil Company | 23,244 | 175,282 | ||||||
| Others below of S/30 million | 215,999 | 153,484 | ||||||
| Total | 508,103 | 535,486 | ||||||
At those dates, the bonds have semiannual payments until the year 2025.
The pool of underlying assets, which is traded in the Peruvian secondary market, is mainly made up of accounts receivable from income, revenues for services and from maintenance and marketing contributions (Inmuebles Panamericana), accounts receivable for electrical transmission services from the Carhuamayo - Cajamarca line (Abengoa Transmisión Norte), accounts receivable for collection via banking channels of the charge for drinking water and sanitation service (Concesionaria La Chira) and accounts receivable for the sale of hydrocarbons in Peru (Hunt Oil Company).
| (vii) | The restricted mutual funds comprise the participation quotas in the private pension funds managed by the Group, and are maintained in compliance with the legal regulations in Peru. Their availability is restricted and the yield received is the same as that received by the private pension funds managed. |
| (viii) | At December 31, 2017 and 2016, certificates of deposit issued by the Central Bank of Bolivia are mainly denominated in Bolivianos. |
| (ix) | Collateralized mortgage obligations correspond to senior tranches (“Senior Tranches”) |
| (x) | Between the years 2016 and 2017, the Group sold through Credicorp Capital Corredores de Bolsa, 100.0 percent of the shares that it held of Banco de Crédito e Inversiones de Chile (hereinafter “BCI Chile”) and 100.0 percent of the shares that it held of Enel Distribución Perú S.A.A. (formerly Edelnor S.A.A.) We present below the sales made: |
| - | On March 7, 2016, Credicorp signed a Memorandum of Understanding (MOU) with BCI Chile, in which, as a minority shareholder with a 4.06 percent participation in BCI Chile, it stated its intention to sell up to 50.0 percent of said shares. |
Credicorp undertook not to sell the remaining 50.0 percent of its shares in BCI Chile during the period of 180 calendar days subsequent to the expiry date of the preferred option of BCI Chile which forms part of the applicable regulations in Chile. The preferred subscription period began on March 21, 2016.
Accordingly, on April 22, 2016, Credicorp sold 50.0 percent of the shares which it held in BCI Chile (2,248,593 shares), at a price of CLP 27,500 (US$41.6) per share, generating cash for approximately US$94.0 million, equivalent to S/302 million. Said sale generated a profit, net of commissions, of approximately S/124.7 million.
| - | On September 15, 2017, Credicorp sold the remaining 50.0 percent of shares which it held in BCI Chile (2,286,328 shares), at a price of CLP 39,000 (US$62.3) per share, generating cash for approximately US$142.4 million, equivalent to S/462.8 million. Said sale generated a profit, net of commissions, of approximately S/281.1 million. |
F- 53
| - | On October 4, 2017, Credicorp sold in the Lima Stock Exchange all of its position in the shares of Enel Distribución Perú S.A.A. (43,554,445 shares), at a price of S/5.5 per share, generating cash for approximately S/239.5 million. The operation generated a profit, net of commissions, of approximately S/163.7 million. |
At December 31, 2017 the unrealized gain on listed shares arises mainly from investment in Alicorp S.A.A. and Inversiones Centenario S.A.A. and totaled S/234.1 million, and S/226.5 million, respectively (S/109.4 million in Alicorp S.A.A., S/166.5 million in Inversiones Centenario S.A.A., S/141.6 million in Enel Distribución Perú S.A.A., and S/81.2 million in BCI Chile, at December 31, 2016).
| b) | Held-to-maturity investments consist of the following: |
| 2017 | ||||||||
|
Carrying
amount |
Fair value | |||||||
| S/(000) | S/(000) | |||||||
| Peruvian sovereign bonds | 3,378,046 | 3,700,535 | ||||||
| Bonds of foreign governments | 352,205 | 355,438 | ||||||
| Peruvian treasury bonds | 217,187 | 221,799 | ||||||
| Corporate bonds | 246,284 | 254,131 | ||||||
| Certificates of payment on work progress (CRPAO for its Spanish acronym) (*) | 129,443 | 134,238 | ||||||
| 4,323,165 | 4,666,141 | |||||||
| Accrued interest | 90,208 | 90,208 | ||||||
| Total | 4,413,373 | 4,756,349 | ||||||
| 2016 | ||||||||
|
Carrying
amount |
Fair value | |||||||
| S/(000) | S/(000) | |||||||
| Peruvian sovereign bonds | 4,016,340 | 4,099,001 | ||||||
| Bonds of foreign governments | 333,133 | 336,397 | ||||||
| Peruvian treasury bonds | 234,884 | 240,166 | ||||||
| Corporate bonds | 277,998 | 284,028 | ||||||
| Certificates of payment on work progress (CRPAO for its Spanish acronym) (*) | 154,449 | 154,496 | ||||||
| 5,016,804 | 5,114,088 | |||||||
| Accrued interest | 101,616 | 101,616 | ||||||
| Total | 5,118,420 | 5,215,704 | ||||||
At December 31, 2017, said bonds have maturities between January 2018 and February 2042, accruing interest at an annual effective interest rate between 3.19 percent and 6.09 percent on bonds denominated in soles and between 1.39 percent and 4.55 percent on bonds in U.S. dollar (at December 31, 2016 they show maturities between February 2017 and February 2042, bearing interest at an effective annual interest rate of 1.87 percent and 7.12 percent on bonds denominated in soles and between 0.47 percent and 6.03 percent per year on bonds in U.S. dollars).
F- 54
At December 31, 2017 and 2016, Credicorp Management has determined that the difference between amortized cost and fair value of held-to-maturity investment is temporary in nature and Credicorp has the intention and ability to hold each of these investments until its maturity.
At December 31, 2017 the Group has entered into repurchase agreements transactions over corporate bonds, multilateral organization bonds and foreign government bonds accounted for as available-for-sale investments for an estimated fair value of S/2,691.8 million (S/1,598.9 million at December 31, 2016), of which the related liability is presented in “Payables from repurchase agreements and security lending” of the consolidated statement of financial position, See Note 5(c).
Also, at December 31, 2017, the Group maintains repurchase agreements transactions over held-to-maturity investments for an estimated fair value of S/2,725.8 million (S/2,061.6 million at December 31, 2016), the related liability of which is presented in “Payables from repurchase agreements and security lendings” of the consolidated statement of financial position, See Note 5(c).
| (*) | At December 31, 2017 and 2016 there are, 217 and 249 certificates of Annual Recognition of Payment for Work Progress (CRPAO from Spanish acronym), respectively, issued by the Peruvian Government to finance projects and concessions are held, said issuance is a mechanism established in the concession agreement signed between the State and the concessionaire, which allows the latter to obtain financing to continue with the works undertaken. Said investment has maturities between January 2018 and April 2026, accruing interest at an annual effective rate between 3.90 percent and 5.38 percent. |
| c) | The table below shows the balance of investments, by maturity groupings, before accrued interest: |
| 2017 | ||||||||||||
| Trading |
Available for
sale |
Held to
maturity |
||||||||||
| S/(000) | S/(000) | S/(000) | ||||||||||
| Until 3 months | 1,476,174 | 4,987,080 | 334,791 | |||||||||
| From 3 months to 1 year | 1,096,855 | 3,785,935 | 68,690 | |||||||||
| From 1 to 3 years | 516,919 | 2,407,141 | 1,625,856 | |||||||||
| From 3 to 5 years | 180,739 | 1,516,653 | 110,746 | |||||||||
| Over 5 years | 574,293 | 9,327,327 | 2,183,082 | |||||||||
| Without maturity | 175,831 | 2,179,989 | – | |||||||||
| Total | 4,020,811 | 24,204,125 | 4,323,165 | |||||||||
| 2016 | ||||||||||||
| Trading |
Available for sale |
Held to
maturity |
||||||||||
| S/(000) | S/(000) | S/(000) | ||||||||||
| Up to 3 months | 341,995 | 1,260,163 | 17,655 | |||||||||
| From 3 months to 1 year | 1,723,578 | 2,835,467 | 807,319 | |||||||||
| From 1 to 3 years | 1,166,274 | 2,930,790 | 956,812 | |||||||||
| From 3 to 5 years | 329,590 | 1,361,623 | 1,082,244 | |||||||||
| Over 5 years | 324,417 | 7,519,715 | 2,152,774 | |||||||||
| Without maturity | 126,330 | 2,620,154 | – | |||||||||
| Total | 4,012,184 | 18,527,912 | 5,016,804 | |||||||||
F- 55
| 7 | LOANS, NET |
| a) | This item consists of the following: |
| 2017 | 2016 | |||||||
| S/(000) | S/(000) | |||||||
| Direct loans | ||||||||
| Loans | 77,712,186 | 71,792,562 | ||||||
| Leasing receivables | 7,401,018 | 8,302,898 | ||||||
| Credit cards | 6,880,017 | 7,036,975 | ||||||
| Discounted Notes | 1,999,099 | 1,921,403 | ||||||
| Factoring receivables | 1,722,436 | 1,428,571 | ||||||
| Advances and overdrafts in current account | 113,630 | 151,613 | ||||||
| Refinanced loans | 915,493 | 844,830 | ||||||
| Restructured loans | 121 | 126 | ||||||
| Total direct loans | 96,744,000 | 91,478,978 | ||||||
| Internal overdue loans and under legal collection loans | 3,020,914 | 2,620,411 | ||||||
| 99,764,914 | 94,099,389 | |||||||
| Add (less) - | ||||||||
| Accrued interest | 779,684 | 784,391 | ||||||
| Unearned interest | (66,823 | ) | (114,879 | ) | ||||
| Total direct loans | 100,477,775 | 94,768,901 | ||||||
| Allowance for loan losses (d) | (4,500,498 | ) | (4,207,133 | ) | ||||
| Total direct loans, net | 95,977,277 | 90,561,768 | ||||||
| Indirect loans, Note 20(a) | 19,369,559 | 19,831,985 | ||||||
| b) | Direct loans by class are as follows: |
| 2017 | 2016 | |||||||
| S/(000) | S/(000) | |||||||
| Commercial loans | 58,455,548 | 54,133,871 | ||||||
| Residential mortgage loans | 15,452,087 | 14,495,454 | ||||||
| Micro-business loans | 13,927,557 | 12,951,628 | ||||||
| Consumer loans | 11,929,722 | 12,518,436 | ||||||
| Total | 99,764,914 | 94,099,389 | ||||||
| c) | Interest rates on loans are set considering the rates prevailing in the markets where the Group’s subsidiaries operate. |
F- 56
| d) | The movement in the allowance for loan losses (direct and indirect loans) is shown below: |
| 2017 | ||||||||||||||||||||
| Commercial loans |
Residential
mortgage loans |
Micro-business
loans |
Consumer loans | Total | ||||||||||||||||
| S/(000) | S/(000) | S/(000) | S/(000) | S/(000) | ||||||||||||||||
| Balances at the beginning of the period | 1,235,970 | 193,385 | 1,353,168 | 1,634,169 | 4,416,692 | |||||||||||||||
| Provision, net of recoveries | 715,072 | 49,505 | 522,885 | 501,703 | 1,789,165 | |||||||||||||||
| Recovery of written-off loans | 22,857 | 1,158 | 54,046 | 190,252 | 268,313 | |||||||||||||||
| Loan portfolio written-off | (217,160 | ) | (10,662 | ) | (437,594 | ) | (760,785 | ) | (1,426,201 | ) | ||||||||||
| Exchange difference and others | (76,613 | ) | (5,099 | ) | (15,927 | ) | (7,322 | ) | (104,961 | ) | ||||||||||
| Balances at the end of the period (*) | 1,680,126 | 228,287 | 1,476,578 | 1,558,017 | 4,943,008 | |||||||||||||||
| 2016 | ||||||||||||||||||||
| Commercial loans |
Residential
mortgage loans |
Micro-business
loans |
Consumer loans | Total | ||||||||||||||||
| S/(000) | S/(000) | S/(000) | S/(000) | S/(000) | ||||||||||||||||
| Balances at the beginning of the period | 1,197,713 | 173,879 | 1,372,099 | 1,288,528 | 4,032,219 | |||||||||||||||
| Provision, net of recoveries | 25,567 | 26,845 | 538,233 | 1,194,850 | 1,785,495 | |||||||||||||||
| Recovery of written-off loans | 219,986 | 814 | 50,588 | 6,326 | 277,714 | |||||||||||||||
| Loan portfolio written-off | (143,871 | ) | (7,877 | ) | (606,546 | ) | (853,844 | ) | (1,612,138 | ) | ||||||||||
| Exchange difference and others | (63,425 | ) | (276 | ) | (1,206 | ) | (1,691 | ) | (66,598 | ) | ||||||||||
| Balances at the end of the period (*) | 1,235,970 | 193,385 | 1,353,168 | 1,634,169 | 4,416,692 | |||||||||||||||
| 2015 | ||||||||||||||||||||
| Commercial loans |
Residential
mortgage loans |
Micro-business
loans |
Consumer loans | Total | ||||||||||||||||
| S/(000) | S/(000) | S/(000) | S/(000) | S/(000) | ||||||||||||||||
| Balances at the beginning of the period | 556,270 | 165,138 | 1,124,072 | 1,256,616 | 3,102,096 | |||||||||||||||
| Provision, net of recoveries | 732,834 | (321 | ) | 512,052 | 636,333 | 1,880,898 | ||||||||||||||
| Recovery of written-off loans | 157,790 | 362 | 7,333 | 5,794 | 171,279 | |||||||||||||||
| Loan portfolio written-off | (341,067 | ) | (4,936 | ) | (403,993 | ) | (721,326 | ) | (1,471,322 | ) | ||||||||||
| Exchange difference and others | 91,886 | 13,636 | 132,635 | 111,111 | 349,268 | |||||||||||||||
| Balances at the end of the period (*) | 1,197,713 | 173,879 | 1,372,099 | 1,288,528 | 4,032,219 | |||||||||||||||
| (*) | The movement in the allowance for loan losses includes the allowance for direct and indirect loans for approximately S/4,500.5 million and S/442.5 million, respectively, at December 31, 2017 (approximately S/4,207.1 million and S/209.6 million, respectively, at December 31, 2016 and approximately S/3,840.3 million and S/191.9 million, respectively, at December 31, 2015). The allowance for indirect loan losses is included in “Other liabilities” of the consolidated statement of financial position, Note 12(a). In Management’s opinion, the allowance for loan losses recorded as of December 31, 2017, 2016 and 2015 has been established in accordance with IAS 39 and is sufficient to cover incurred losses on the loan portfolio. |
F- 57
| e) | Part of the loan portfolio is collateralized with guarantees received from clients, which mainly consist of mortgages, trust assignments, financial instruments and industrial and mercantile pledges. |
| f) | The table below shows the gross direct loan portfolio at December 31, 2017 and 2016 by maturity based on the remaining period to repayment due date: |
| 2017 | 2016 | |||||||
| S/(000) | S/(000) | |||||||
| Outstanding loans - | ||||||||
| Up to 1 year | 38,052,430 | 35,455,309 | ||||||
| From 1 to 3 years | 20,167,475 | 19,214,591 | ||||||
| From 3 to 5 years | 12,082,996 | 11,907,513 | ||||||
| Over 5 years | 26,441,099 | 24,901,565 | ||||||
| 96,744,000 | 91,478,978 | |||||||
| Internal overdue loans - | ||||||||
| Overdue 90 days | 639,329 | 539,947 | ||||||
| Over 90 days | 2,381,585 | 2,080,464 | ||||||
| 3,020,914 | 2,620,411 | |||||||
| 99,764,914 | 94,099,389 | |||||||
See credit risk analysis in Note 32.1.
| 8 | FINANCIAL ASSETS DESIGNATED AT FAIR VALUE THROUGH PROFIT OR LOSS |
The Group issues Investment Link life insurance contracts whereby the policyholder takes the investment risk on the assets held in the Investment Link funds as the policy benefits are directly linked to the value of the assets in the fund. The Group’s exposure to market risk is limited to the extent that income arising from asset management charges is based on the value of assets in the fund.
For the years 2017 and 2016, the profit resulting from the difference between cost and estimated fair value for these financial assets amounted to approximately S/67.6 million and S/51.7 million, respectively (loss of S/33.5 million for the year 2015) and is shown in “Net income on financial assets designated at fair value through profit or loss” of the consolidated statement of income (“net loss on financial assets designated at fair value through profit or loss” for the year 2015). The offsetting of this effect is included in gross premiums which are part of “Net premiums earned” of the consolidated statement of income, See Note 23.
| 9 | ACCOUNTS RECEIVABLE AND PAYABLE FROM INSURANCE CONTRACTS |
| a) | As of December 31, 2017 and 2016, “Premiums and other policies receivable” in the consolidated statement of financial position includes balances for approximately S/656.8 million and S/643.2 million, respectively, which are primarily of current maturity, have no specific collateral and present no material past due balances. |
F- 58
| b) | The movements of the captions “Accounts receivable and payable to reinsurers and coinsurers” are as follows: |
Accounts receivable:
| 2017 | 2016 | 2015 | ||||||||||
| S/(000) | S/(000) | S/(000) | ||||||||||
| Balances at the beginning of the period | 454,187 | 457,189 | 468,137 | |||||||||
| Reported claims of premiums ceded, Note 24 | 483,387 | 145,498 | 119,894 | |||||||||
| Premiums ceded unearned during the year, Note 23(a)(**) | 21,192 | (9,139 | ) | 6,835 | ||||||||
| Premiums assumed | 246,205 | 72,448 | 180,321 | |||||||||
| Settled claims of premiums ceded by facultative contracts | (231,298 | ) | (90,550 | ) | (125,156 | ) | ||||||
| Collections and others, net | (257,978 | ) | (121,259 | ) | (192,842 | ) | ||||||
| Balances at the end of the period | 715,695 | 454,187 | 457,189 | |||||||||
Accounts receivable as of December 31, 2017 and 2016, include S/151.6 million and S/139.4 million, respectively, which correspond to the unearned portion of the premiums ceded to the reinsurers.
Accounts Payable:
| 2017 | 2016 | 2015 | ||||||||||
| S/(000) | S/(000) | S/(000) | ||||||||||
| Balances at the beginning of the period | 233,892 | 241,847 | 220,910 | |||||||||
| Premiums ceded for automatic contracts (mainly excess of loss), Note 23(a)(**) | 257,617 | 201,892 | 145,618 | |||||||||
| Premiums ceded to reinsurers in facultative contracts, Note 23(a)(**) | 263,378 | 292,555 | 331,329 | |||||||||
| Coinsurance granted | 5,925 | 5,965 | 5,999 | |||||||||
| Payments and other, net | (525,627 | ) | (508,367 | ) | (462,009 | ) | ||||||
| Balances at the end of the period | 235,185 | 233,892 | 241,847 | |||||||||
Accounts payable to reinsurers are primarily related to proportional facultative contracts (on an individual basis) for ceded premiums, automatic non-proportional contracts (excess loss) and reinstallation premiums. For facultative contracts the Group transfers to the reinsurers a percentage or an amount of an insurance contract or individual risk, based on the premium and the period of coverage.
F- 59
| 10 | PROPERTY, FURNITURE AND EQUIPMENT, NET |
| a) | The movement of property, furniture and equipment and accumulated depreciation, for the years ended December 31, 2017, 2016, and 2015 was as follows: |
| Land |
Buildings
and
other constructions |
Installations |
Furniture
and fixtures |
Computer
hardware |
Vehicles
and equipment |
Work in progress |
2017 | 2016 | 2015 | |||||||||||||||||||||||||||||||
| S/(000) | S/(000) | S/(000) | S/(000) | S/(000) | S/(000) | S/(000) | S/(000) | S/(000) | S/(000) | |||||||||||||||||||||||||||||||
| Cost - | ||||||||||||||||||||||||||||||||||||||||
| Balance as of January 1 | 402,064 | 1,115,536 | 580,847 | 496,357 | 558,902 | 167,031 | 88,632 | 3,409,369 | 3,455,442 | 3,447,017 | ||||||||||||||||||||||||||||||
| Additions | 7,374 | 6,952 | 9,391 | 19,748 | 50,457 | 8,253 | 41,676 | 143,851 | 110,151 | 148,426 | ||||||||||||||||||||||||||||||
| Transfers | 56 | 4,685 | 37,758 | 3,368 | 13,839 | (9,379 | ) | (50,327 | ) | – | – | – | ||||||||||||||||||||||||||||
| Disposals and others | 12,145 | 12,743 | (36,547 | ) | (5,937 | ) | (8,139 | ) | (7,297 | ) | (15,962 | ) | (48,994 | ) | (156,224 | ) | (140,001 | ) | ||||||||||||||||||||||
| Balance as of December 31 | 421,639 | 1,139,916 | 591,449 | 513,536 | 615,059 | 158,608 | 64,019 | 3,504,226 | 3,409,369 | 3,455,442 | ||||||||||||||||||||||||||||||
| Accumulated depreciation - | ||||||||||||||||||||||||||||||||||||||||
| Balance as of January 1 | – | 577,458 | 397,485 | 311,356 | 465,600 | 105,767 | – | 1,857,666 | 1,784,001 | 1,671,575 | ||||||||||||||||||||||||||||||
| Depreciation for the year | – | 31,123 | 45,624 | 33,443 | 53,993 | 14,712 | – | 178,895 | 182,845 | 177,623 | ||||||||||||||||||||||||||||||
| Disposals and others | – | 7,144 | (18,110 | ) | (8,704 | ) | (9,886 | ) | (12,271 | ) | – | (41,827 | ) | (109,180 | ) | (65,197 | ) | |||||||||||||||||||||||
| Balance as of December 31 | – | 615,725 | 424,999 | 336,095 | 509,707 | 108,208 | – | 1,994,734 | 1,857,666 | 1,784,001 | ||||||||||||||||||||||||||||||
| Net carrying amount | 421,639 | 524,191 | 166,450 | 177,441 | 105,352 | 50,400 | 64,019 | 1,509,492 | 1,551,703 | 1,671,441 | ||||||||||||||||||||||||||||||
Banks, financial institutions and insurance entities operating in Peru are not allowed to pledge their fixed assets.
During 2017 and 2016 Credicorp and its Subsidiaries, as part of its annual infrastructure investing, has made cash disbursements related mainly to the acquisition, construction and implementation of new agencies for its banking segment, and the refurbishment and conditioning of several agencies and administrative offices. Credicorp’s subsidiaries hold insurance contracts over its main assets in accordance with the policies established by Management.
Management periodically reviews the residual value, useful life and method of depreciation of the Group’s property, furniture and equipment to ensure that they are consistent with their actual economic benefits and life expectations. In Management’s opinion, as of December 31, 2017 and 2016 there is no evidence of impairment of the Group’s property, furniture and equipment.
F- 60
| 11 | INTANGIBLE ASSETS AND GOODWILL, NET |
| a) | Intangible assets - |
The movement of intangible assets with limited useful life for the years ended December 31, 2017, 2016 and 2015 is as follows:
| Description |
Client
relationships (i) |
Rights
of
use |
Brand
name (ii) |
Fund
manager
contract (iii) |
Core
deposits intangible |
Software
and
developments |
Intangible
in progress |
Other | 2017 | 2016 | 2015 | |||||||||||||||||||||||||||||||||
| S/(000) | S/(000) | S/(000) | S/(000) | S/(000) | S/(000) | S/(000) | S/(000) | S/(000) | S/(000) | S/(000) | ||||||||||||||||||||||||||||||||||
| Cost - | ||||||||||||||||||||||||||||||||||||||||||||
| Balances at January 1 | 406,186 | 55,900 | 261,715 | 100,608 | 21,100 | 1,614,338 | 302,747 | 26,841 | 2,789,435 | 2,512,114 | 2,329,549 | |||||||||||||||||||||||||||||||||
| Additions | – | – | – | – | – | 88,466 | 182,984 | 272 | 271,722 | 277,346 | 276,564 | |||||||||||||||||||||||||||||||||
| Transfers | – | – | – | – | – | 180,129 | (180,129 | ) | – | – | – | (3,299 | ) | |||||||||||||||||||||||||||||||
| Disposals and others | 1,019 | – | 384 | 877 | – | 26,319 | 609 | – | 29,208 | (25 | ) | (90,700 | ) | |||||||||||||||||||||||||||||||
| Balances at December 31 | 407,205 | 55,900 | 262,099 | 101,485 | 21,100 | 1,909,252 | 306,211 | 27,113 | 3,090,365 | 2,789,435 | 2,512,114 | |||||||||||||||||||||||||||||||||
| Accumulated amortization - | ||||||||||||||||||||||||||||||||||||||||||||
| Balance at January 1 | 190,354 | 55,900 | 86,391 | 5,843 | 9,681 | 1,089,884 | – | 26,841 | 1,464,894 | 1,242,843 | 1,043,886 | |||||||||||||||||||||||||||||||||
| Amortization of the year | 30,310 | – | 14,792 | 2,049 | 3,516 | 190,413 | – | – | 241,080 | 224,216 | 218,874 | |||||||||||||||||||||||||||||||||
| Disposals and others | 10,888 | – | 10,470 | (5,153 | ) | (10 | ) | 25,306 | – | – | 41,501 | (2,165 | ) | (19,917 | ) | |||||||||||||||||||||||||||||
| Balance at December 31 | 231,552 | 55,900 | 111,653 | 2,739 | 13,187 | 1,305,603 | – | 26,841 | 1,747,475 | 1,464,894 | 1,242,843 | |||||||||||||||||||||||||||||||||
| Net carrying amount | 175,653 | – | 150,446 | 98,746 | 7,913 | 603,649 | 306,211 | 272 | 1,342,890 | 1,324,541 | 1,269,271 | |||||||||||||||||||||||||||||||||
During the year 2017 additions are mainly related to the implementation and development of various IT projects such as Nuevo HomeBanking Alta, opening of savings accounts in Kiosco, Yape, User IT, Retail Credits, Effectiveness in approval and Portal Via BCP (implementation of a technological platform, which is used for the administration of the insurance segment of the group, and to develop applications related to customer service channels, and implementation of treasury solutions during the year 2016).
F- 61
| (i) | Client relationships - |
This item consists of the following:
| 2017 | 2016 | |||||||
| S/(000) | S/(000) | |||||||
| Prima AFP - AFP Unión Vida | 107,018 | 119,367 | ||||||
| Mibanco | 39,093 | 51,121 | ||||||
| Inversiones IMT | 26,206 | 26,438 | ||||||
| Mibanco - Edyficar Perú | 3,336 | 5,155 | ||||||
| Credicorp Capital Colombia - Correval | – | 13,751 | ||||||
| Net carrying amount | 175,653 | 215,832 | ||||||
| (ii) | Brand name - |
This item consists of the following:
| 2017 | 2016 | |||||||
| S/(000) | S/(000) | |||||||
| Mibanco | 145,095 | 151,923 | ||||||
| Inversiones IMT | 5,351 | 9,941 | ||||||
| Credicorp Capital Colombia - Correval | – | 13,460 | ||||||
| Net carrying amount | 150,446 | 175,324 | ||||||
| (iii) | Fund manager contract - |
This item consists of the following:
| 2017 | 2016 | |||||||
| S/(000) | S/(000) | |||||||
| Credicorp Capital Colombia - Correval | 52,635 | 49,287 | ||||||
| Inversiones IMT | 46,111 | 45,478 | ||||||
| Net carrying amount | 98,746 | 94,765 | ||||||
Management has assessed at each reporting date that there was no indication that client relationships, rights of use, brand name, fund management contract and software and developments may be impaired.
F- 62
| b) | Goodwill - |
Goodwill acquired through business combinations has been allocated to each subsidiary or groups of them, which are also identified as a CGU for the purposes of impairment testing, as follows:
| 2017 | 2016 | |||||||
| S/(000) | S/(000) | |||||||
| Mibanco - Edyficar Perú | 273,694 | 273,694 | ||||||
| Prima AFP – AFP Unión Vida | 124,641 | 124,641 | ||||||
| Credicorp Capital Colombia | 77,746 | 80,022 | ||||||
| Banco de Crédito del Perú | 52,359 | 52,359 | ||||||
| Inversiones IMT | 41,290 | 39,284 | ||||||
| Pacífico Seguros | 36,354 | 36,354 | ||||||
| Atlantic Security Holding Corporation | 29,795 | 29,795 | ||||||
| Crediseguro Seguros Personales | 96 | – | ||||||
| Net carrying amount | 635,975 | 636,149 | ||||||
The recoverable amount of all of the CGUs has been determined based on the calculations of the fair value less selling costs, which is the present value of the discounted cash flows determined principally with assumptions of projection of revenue and expenses (based on efficiency ratios).
Balances of goodwill from Inversiones IMT and Credicorp Capital Colombia are impacted by the volatility of the exchange rate of the local currency of the countries in which they operate against the exchange rate of Grupo Credicorp’s functional currency.
The following table summarizes the key assumptions used for the calculation of fair value less selling costs in 2017 and 2016:
| At December 31, 2017 | ||||||
| Description |
Terminal
value growth rate |
Discount
rate |
||||
| % | % | |||||
| Mibanco - Edyficar Perú | 3.00 | 12.43 | ||||
| Prima AFP – AFP Unión Vida | 1.00 | 9.41 | ||||
| Credicorp Capital Colombia | 3.80 | 12.63 | ||||
| Banco de Crédito del Perú | 5.00 | 11.46 | ||||
| Inversiones IMT | 5.25 | 11.72 | ||||
| Pacífico Seguros (*) | 5.00 | 11.24 and 12.38 | ||||
| Atlantic Security Holding Corporation | 2.00 | 10.31 | ||||
| (*) | As of December 31, 2017, corresponds to the discount rates used by the Group to determine the recoverable value for the non-life and life insurance business lines cash flows that comprised this CGU as a result of the merger, See Note 2(a). |
F- 63
| At December 31, 2016 | ||||||
| Description |
Terminal
value growth rate |
Discount
rate |
||||
| % | % | |||||
| Mibanco - Edyficar Perú | 3.00 | 12.48 | ||||
| Prima AFP - AFP Unión Vida | 1.20 | 8.73 | ||||
| Credicorp Capital Colombia | 3.80 | 13.44 | ||||
| Banco de Crédito del Perú | 5.00 | 12.48 | ||||
| Inversiones IMT | 5.25 | 12.41 | ||||
| Pacífico Seguros | 5.00 | 11.66 | ||||
| Atlantic Security Holding Corporation | 2.00 | 11.17 | ||||
Five or ten years of cash flows, depending on the business maturity, were included in the discounted cash flow model. The growth rate estimates are based on past performance and management’s expectations of market development. A long-term growth rate to perpetuity has been determined taking into account forecasts included in industry reports.
Discount rates represent the current market assessment of the risks specific to each CGU. The discount rate is derived from the capital asset pricing model (CAPM). The cost of equity is derived from the expected return on investment by the Group’s investors, specific risk incorporated by applying individual comparable beta factors adjusted by the debt structure of each CGU and country and market risk specific premiums to each CGU. The beta factors are evaluated annually based on publicly available market data.
During the year 2015, the Group recorded a gross impairment loss amounting to S/82.4 million (S/0.1 million during the year 2016), as a result of the assessment of the recoverable amount of the CGU “Inversiones IMT”, amounting to S/234.3 million, decreasing in relation to prior years due to the lower revenues generated compared to those originally budgeted by Management and for the changes expected in the payment of taxes attributable to the parent company resulting from the tax law reform presented in Chile.
The key assumptions described above may change if the conditions of the economy and market change. At December 31, 2017, the Group estimates that reasonably possible changes in these assumptions would not cause the recoverable amount of all CGUs to decline below their carrying amount.
F- 64
| 12 | OTHER ASSETS AND OTHER LIABILITIES |
| a) | This item consists of the following: |
| 2017 | 2016 | |||||||
| S/(000) | S/(000) | |||||||
| Other assets - | ||||||||
| Financial instruments: | ||||||||
| Receivables | 1,676,583 | 1,240,632 | ||||||
| Derivatives receivable (b) | 701,826 | 942,602 | ||||||
| Operations in process (c) | 82,542 | 45,450 | ||||||
| 2,460,951 | 2,228,684 | |||||||
| Non-financial instruments: | ||||||||
| Deferred income tax asset, Note 18(c) | 480,057 | 506,044 | ||||||
| Investment in associates (e) | 708,873 | 699,724 | ||||||
| Investment properties, net (f) | 458,855 | 504,927 | ||||||
| Deferred fees | 431,598 | 504,445 | ||||||
| Income tax prepayments, net | 301,863 | 357,149 | ||||||
| Seized assets, net | 95,012 | 73,466 | ||||||
| VAT (IGV) tax credit | 50,138 | 41,140 | ||||||
| Others | 12,651 | 13,334 | ||||||
| 2,539,047 | 2,700,229 | |||||||
| Total | 4,999,998 | 4,928,913 | ||||||
| Other liabilities - | ||||||||
| Financial instruments: | ||||||||
| Accounts payable | 1,875,153 | 1,512,804 | ||||||
| Derivatives payable (b) | 636,762 | 673,015 | ||||||
| Salaries and other personnel expenses | 644,234 | 681,853 | ||||||
| Allowance for indirect loan losses, Note 7(d) | 442,510 | 209,559 | ||||||
| Operations in process (c) | 274,354 | 136,764 | ||||||
| 3,873,013 | 3,213,995 | |||||||
| Non-financial instruments: | ||||||||
| Taxes | 480,781 | 286,504 | ||||||
| Deferred income tax, Note 18(c) | 150,280 | 172,641 | ||||||
| Provision for sundry risks (d) | 275,841 | 296,339 | ||||||
| Others | 234,197 | 150,587 | ||||||
| 1,141,099 | 906,071 | |||||||
| Total | 5,014,112 | 4,120,066 | ||||||
F- 65
| b) | The risk in derivative contracts arises from the possibility of the counterparty failing to comply with the terms and conditions agreed and that the reference rates at which the transactions took place change. |
The table below shows at December 31, 2017 and 2016 the fair value of derivative financial instruments, recorded as an asset or a liability, together with their nominal amounts and maturities. The nominal amount, recorded gross, is the amount of a derivative’s underlying asset and is the basis upon which changes in the value of derivatives are measured.
| 2017 | 2016 | 2017 y 2016 | ||||||||||||||||||||||||||||||
| Note | Assets | Liabilities |
Notional
amount |
Maturity | Assets | Liabilities |
Notional
amount |
Maturity | Related instruments | |||||||||||||||||||||||
| S/(000) | S/(000) | S/(000) | S/(000) | S/(000) | S/(000) | |||||||||||||||||||||||||||
| Derivatives held for trading(i) - | ||||||||||||||||||||||||||||||||
| Forward foreign exchange contracts | 62,353 | 56,869 | 10,846,203 | Between January 2018 and June 2020 | 73,722 | 55,437 | 9,313,965 | Between January 2017 and June 2020 | – | |||||||||||||||||||||||
| Interest rate swaps | 101,765 | 94,238 | 33,057,283 | Between January 2018 and December 2031 | 87,872 | 55,927 | 25,900,896 | Between January 2017 and December 2031 | – | |||||||||||||||||||||||
| Currency swaps | 332,376 | 349,779 | 8,528,764 | Between January 2018 and December 2027 | 428,928 | 490,475 | 7,518,170 | Between January 2017 and December 2026 | – | |||||||||||||||||||||||
| Foreign exchange options | 2,692 | 980 | 410,982 | Between January 2018 and November 2018 | 21,490 | 17,202 | 2,747,601 | Between January 2017 and December 2017 | – | |||||||||||||||||||||||
| 499,186 | 501,866 | 52,843,232 | 612,012 | 619,041 | 45,480,632 | |||||||||||||||||||||||||||
| Derivatives held as hedges | ||||||||||||||||||||||||||||||||
| Cash flow hedges (ii) - | ||||||||||||||||||||||||||||||||
| Interest rate swaps (IRS) | 14(b)(i) | 2,491 | – | 486,150 | August 2019 | – | – | – | – | Debt to banks | ||||||||||||||||||||||
| Interest rate swaps (IRS) | 14(b)(ii) | 1,864 | – | 486,150 | Between September 2018 and November 2019 | 1,384 | – | 318,820 | Between April 2017 and September 2018 | Debt to banks | ||||||||||||||||||||||
| Interest rate swaps (IRS) | 14(b)(iv) | 112 | – | 324,100 | January 2018 | – | 218 | 335,600 | January 2018 | Debt to banks | ||||||||||||||||||||||
| Interest rate swaps (IRS) | 14(b)(v) | 658 | – | 324,100 | March 2018 | 1,614 | – | 335,600 | March 2018 | Debt to banks | ||||||||||||||||||||||
| Interest rate swaps (IRS) | 16(a)(iii) | – | – | – | – | – | 2,736 | 179,231 | October 2017 | Notes issued | ||||||||||||||||||||||
| Interest rate swaps (IRS) | 5(c)(i) | 4,626 | – | 486,150 | Between March 2019 and December 2019 | 3,140 | 294 | 503,400 | Between March 2019 and December 2019 | Repurchase agreements | ||||||||||||||||||||||
| Cross currency swaps (CCS) | 16(a)(xi) | – | 97,440 | 972,300 | October 2019 | – | 25,387 | 1,006,800 | October 2019 | Bonds issued | ||||||||||||||||||||||
| Cross currency swaps (CCS) | 5(c)(iii) | 18,889 | – | 226,870 | August 2020 | 35,158 | – | 234,920 | August 2020 | Repurchase agreements | ||||||||||||||||||||||
| Cross currency swaps (CCS) | 5(c)(iv) | – | 26,240 | 145,845 | August 2026 | – | 6,871 | 151,020 | August 2026 | Repurchase agreements | ||||||||||||||||||||||
| Cross currency swaps (CCS) | 5(c)(v) | – | 9,053 | 81,025 | August 2026 | 1,154 | – | 83,900 | August 2026 | Repurchase agreements | ||||||||||||||||||||||
| Cross currency swaps (CCS) | 6(a)(iv) | 24,263 | 1,386 | 228,756 | Between January 2018 and September 2024 | 16,537 | 9,483 | 236,335 | Between January 2017 and September 2024 | Available-for-sale investments | ||||||||||||||||||||||
| Cross currency swaps (CCS) | 6(a)(iv) | – | 151 | 55,097 | March 2019 | 1,289 | 7,588 | 167,800 | Between January 2017 and March 2019 | Available-for-sale investments | ||||||||||||||||||||||
| Cross currency swaps (CCS) | 14(b)(iii) | 73 | 79 | 324,100 | January 2020 | – | – | – | – | Debt to banks | ||||||||||||||||||||||
| Cross currency swaps and interest rate swaps (CCS and IRS) | 5(c)(ii) | 32,719 | – | 259,280 | August 2020 | 54,103 | – | 268,480 | August 2020 | Repurchase agreements | ||||||||||||||||||||||
| Fair value hedges - | ||||||||||||||||||||||||||||||||
| Interest rate swaps (IRS) | 16(a) | 110,808 | – | 7,915,886 | Between September 2020 and April 2023 | 212,162 | – | 8,196,765 | Between September 2020 and April 2023 | Bonds issued | ||||||||||||||||||||||
| Interest rate swaps (IRS) | 6(a)(iv) | 6,137 | 547 | 659,524 | Between April 2018 and October 2023 | 4,049 | 1,397 | 760,315 | Between January 2017 and October 2023 | Available-for-sale investments | ||||||||||||||||||||||
| 202,640 | 134,896 | 12,975,333 | 330,590 | 53,974 | 12,778,986 | |||||||||||||||||||||||||||
| 701,826 | 636,762 | 65,818,565 | 942,602 | 673,015 | 58,259,618 | |||||||||||||||||||||||||||
F- 66
| (i) | Held-for-trading derivatives are principally negotiated to satisfy clients’ needs. On the other hand, the Group may also take positions with the expectation of profiting from favorable movements in prices or rates. Also, this caption includes any derivatives which do not comply with IAS 39 hedging accounting requirements. Fair value of derivatives held for trading classified by contractual maturity is as follows: |
| At December 31, 2017 | At December 31, 2016 | |||||||||||||||||||||||||||||||||||||||||||||||
|
Up
to 3
months |
From
3
months to 1 year |
From
1 to 3
years |
From
3 to 5
years |
Over
5
years |
Total |
Up
to 3
months |
From
3
months to 1 year |
From
1 to 3
years |
From
3 to
5 years |
Over
5
years |
Total | |||||||||||||||||||||||||||||||||||||
| S/(000) | S/(000) | S/(000) | S/(000) | S/(000) | S/(000) | S/(000) | S/(000) | S/(000) | S/(000) | S/(000) | S/(000) | |||||||||||||||||||||||||||||||||||||
| Forward foreign exchange contracts | 41,995 | 19,238 | 1,120 | – | – | 62,353 | 58,168 | 12,737 | 2,040 | 777 | – | 73,722 | ||||||||||||||||||||||||||||||||||||
| Interest rate swaps | 5,487 | 16,971 | 22,705 | 18,464 | 38,138 | 101,765 | 6,763 | 9,480 | 18,550 | 9,591 | 43,488 | 87,872 | ||||||||||||||||||||||||||||||||||||
| Currency swaps | 12,190 | 7,803 | 142,370 | 58,391 | 111,622 | 332,376 | 751 | 20,029 | 87,300 | 212,990 | 107,858 | 428,928 | ||||||||||||||||||||||||||||||||||||
| Foreign exchange options | 2,468 | 224 | – | – | – | 2,692 | 9,827 | 11,663 | – | – | – | 21,490 | ||||||||||||||||||||||||||||||||||||
| Total assets | 62,140 | 44,236 | 166,195 | 76,855 | 149,760 | 499,186 | 75,509 | 53,909 | 107,890 | 223,358 | 151,346 | 612,012 | ||||||||||||||||||||||||||||||||||||
| At December 31, 2017 | At December 31, 2016 | |||||||||||||||||||||||||||||||||||||||||||||||
|
Up
to 3
months |
From
3
months to 1 year |
From
1 to 3
years |
From
3 to 5
years |
Over
5
years |
Total |
Up
to 3
months |
From
3
months to 1 year |
From
1 to 3
years |
From
3 to
5 years |
Over
5
years |
Total | |||||||||||||||||||||||||||||||||||||
| Forward foreign exchange contracts | 39,888 | 16,603 | 378 | – | – | 56,869 | 46,721 | 8,661 | 43 | 12 | – | 55,437 | ||||||||||||||||||||||||||||||||||||
| Interest rate swaps | 6,841 | 14,196 | 24,537 | 17,018 | 31,646 | 94,238 | 4,226 | 8,236 | 17,749 | 4,300 | 21,416 | 55,927 | ||||||||||||||||||||||||||||||||||||
| Currency swaps | 22,457 | 27,855 | 171,412 | 17,056 | 110,999 | 349,779 | 64,023 | 37,626 | 133,530 | 178,979 | 76,317 | 490,475 | ||||||||||||||||||||||||||||||||||||
| Foreign exchange options | 547 | 433 | – | – | – | 980 | 4,564 | 12,638 | – | – | – | 17,202 | ||||||||||||||||||||||||||||||||||||
| Total liabilities | 69,733 | 59,087 | 196,327 | 34,074 | 142,645 | 501,866 | 119,534 | 67,161 | 151,322 | 183,291 | 97,733 | 619,041 | ||||||||||||||||||||||||||||||||||||
F- 67
| (ii) | The Group is exposed to variability in future cash flows on assets and liabilities in foreign currency and/or which bear interest at variable rates. The Group uses derivative financial instruments as cash flow hedges to cover these risks. |
A schedule indicating the periods when the current cash flow hedges are expected to occur and affect the consolidated statement of income, net of deferred income tax is presented below:
| At December 31, 2017 | ||||||||||||||||||||
|
Up to 1
year |
From 1 to 3
years |
From 3 to 5
years |
Over 5
years |
Total | ||||||||||||||||
| S/(000) | S/(000) | S/(000) | S/(000) | S/(000) | ||||||||||||||||
| Cash inflows (assets) | 962,966 | 3,432,756 | 100,247 | 283,896 | 4,779,865 | |||||||||||||||
| Cash outflows (liabilities) | (1,016,748 | ) | (3,434,333 | ) | (110,355 | ) | (265,716 | ) | (4,827,152 | ) | ||||||||||
| Consolidated statement of income | (1,043 | ) | (26,534 | ) | 1,749 | (7,348 | ) | (33,176 | ) | |||||||||||
| At December 31, 2016 | ||||||||||||||||||||
|
Up to 1
year |
From 1 to 3
years |
From 3 to 5
years |
Over 5
years |
Total | ||||||||||||||||
| S/(000) | S/(000) | S/(000) | S/(000) | S/(000) | ||||||||||||||||
| Cash inflows (assets) | 524,775 | 2,549,873 | 836,116 | 294,889 | 4,205,653 | |||||||||||||||
| Cash outflows (liabilities) | (578,526 | ) | (2,575,723 | ) | (732,108 | ) | (255,205 | ) | (4,141,562 | ) | ||||||||||
| Consolidated statement of income | (1,437 | ) | 4,863 | 6,704 | 1,383 | 11,513 | ||||||||||||||
At December 31, 2017, the accumulated balance of the net unrealized loss from the cash flow hedges is included as other comprehensive income in “Cash flow hedge reserves” and results from the current hedges, which have an unrealized profit for approximately S/33.2 million, and from the revoked hedges, which have an unrealized profit for approximately S/7.4 million (unrealized profit for approximately S/11.5 million and S/13.1 million from current and revoked hedges, respectively at December 31, 2016), which is being recognized in the consolidated statement of income over the remaining term of the underlying financial instrument. Also, the transfer of the unrealized loss on cash flow hedges to the consolidated statement of income is shown in Note 17(c).
| c) | Operations in process include deposits received, loans disbursed, loans collected, funds transferred and other similar types of transactions, which are made in the final days of the month and not reclassified to their final accounts in the consolidated statement of financial position until the first days of the following month. These transactions do not affect the Group’s consolidated net income. |
F- 68
| d) | The movement of the provision for sundry risks for the years ended December 31, 2017, 2016 and 2015 was as follows: |
| 2017 | 2016 | 2015 | ||||||||||
| S/(000) | S/(000) | S/(000) | ||||||||||
| Balance at the beginning of the year | 296,339 | 196,261 | 158,013 | |||||||||
| Provision, Note 27 | 29,023 | 28,093 | 38,248 | |||||||||
| Increase (decrease), net | (49,521 | ) | 71,985 | – | ||||||||
| Balances | 275,841 | 296,339 | 196,261 | |||||||||
Due to the nature of its business, the Group has some pending legal claims for which it records a provision when, in the opinion of Management and its in-house legal advisors, they will result in an additional liability and such amount can be reliably estimated. Regarding legal claims against the Group which have not been provided for, in the opinion of Management and its in-house legal advisors, they will not have a material effect on the Group’s consolidated financial statements.
| e) | Credicorp’s principal associates are Pacífico EPS and Carlyle Peru, the balances of which amount to S/510.9 million and S/144.1 million, at December 31, 2017, respectively (S/490.1 million and S/145.8 million at December 31, 2016, respectively). |
| f) | Investment properties - |
The movement of cost and accumulated depreciation of investment properties is as follows:
| 2017 | 2016 | |||||||||||||||
| Own assets | ||||||||||||||||
| Land | Building | Total | Total | |||||||||||||
| S/(000) | S/(000) | S/(000) | S/(000) | |||||||||||||
| Cost | ||||||||||||||||
| Balance at January 1 | 289,432 | 261,174 | 550,606 | 462,440 | ||||||||||||
| Additions (i) | 4,637 | 4,580 | 9,217 | 88,186 | ||||||||||||
| Transfers (ii) | – | 66,856 | 66,856 | – | ||||||||||||
| Sales (iii) | (47,987 | ) | (41,910 | ) | (89,897 | ) | – | |||||||||
| Disposals and others | (27,419 | ) | (10,738 | ) | (38,157 | ) | (20 | ) | ||||||||
| Balance at December 31 | 218,663 | 279,962 | 498,625 | 550,606 | ||||||||||||
| Accumulated depreciation | ||||||||||||||||
| Balance at January 1 | – | 45,679 | 45,679 | 41,307 | ||||||||||||
| Depreciation for the year | – | 6,440 | 6,440 | 4,369 | ||||||||||||
| Sales (iii) | – | (6,277 | ) | (6,277 | ) | – | ||||||||||
| Disposals and others | – | (6,072 | ) | (6,072 | ) | 3 | ||||||||||
| Balance at December 31 | – | 39,770 | 39,770 | 45,679 | ||||||||||||
| Net carrying amount | 218,663 | 240,192 | 458,855 | 504,927 | ||||||||||||
Land and buildings are mainly used for rental of offices, which are free of all encumbrances.
| (i) | During the period 2016, subsidiary Pacífico Seguros carried out constructions and acquired a plot of land located at Nicolas Dueñas Avenue 475, Cercado de Lima for an amount of approximately S/21.9 million and another located in Ex-Fundo Marquez, in the vicinity of KM 14.6 of Coronel Nestor Gambeta Avenue, Callao for an amount of approximately S/60.9 million. |
F- 69
| (ii) | In order to consolidate the real estate projects, mainly of offices, during the year 2017, Pacífico Seguros liquidated the trust of the “Panorama” building located at Av. Juan de Arona N° 830 for a total amount of S/66.9 million. |
| (iii) | The balance of sales for the year 2017 mainly comprises the transfer by Pacífico Seguros of the building located at Av. Guardia Civil 337 – Urb. Corpac, San Borja, which was sold for S/95.7 million. The total net cost of the building amounting to S/68.5 million comprises S/34.5 million in land and S/34.0 million in building (cost of S/38.5 million and depreciation of S/4.5 million). |
The Group’s Management has determined that the recoverable value of it investment properties is greater than their net carrying amount.
| 13 | DEPOSITS AND OBLIGATIONS |
| a) | This item consists of the following: |
| 2017 | 2016 | |||||||
| S/(000) | S/(000) | |||||||
| Demand deposits | 29,770,276 | 28,506,270 | ||||||
| Time deposits (c) | 30,184,314 | 22,531,305 | ||||||
| Saving deposits | 28,633,099 | 26,684,134 | ||||||
| Severance indemnity deposits | 7,170,934 | 7,117,685 | ||||||
| Bank’s negotiable certificates | 959,051 | 743,726 | ||||||
| Total | 96,717,674 | 85,583,120 | ||||||
| Interest payable | 452,737 | 333,267 | ||||||
| Total | 97,170,411 | 85,916,387 | ||||||
The Group has established a policy to remunerate demand deposits and savings deposits according to an interest rate scale, based on the average balance maintained in those accounts; on the other hand, according to its policy, balances that are lower than a specified amount for each type of account do not bear interest. Also, time deposits earn interest at market rates.
Interest rates are determined by the Group considering the interest rates prevailing in the market in which each of the Group’s subsidiaries operates.
| b) | The amounts of non-interest-bearing and interest-bearing deposits and obligations are presented below: |
| 2017 | 2016 | |||||||
| S/(000) | S/(000) | |||||||
| Non-interest-bearing - | ||||||||
| In Peru | 26,786,474 | 24,718,582 | ||||||
| In other countries | 2,596,435 | 3,366,109 | ||||||
| 29,382,909 | 28,084,691 | |||||||
| Interest-bearing - | ||||||||
| In Peru | 60,372,602 | 52,472,191 | ||||||
| In other countries | 6,962,163 | 5,026,238 | ||||||
| 67,334,765 | 57,498,429 | |||||||
| Total | 96,717,674 | 85,583,120 | ||||||
F- 70
| c) | The balance of time deposits classified by maturity is as follows: |
| 2017 | 2016 | |||||||
| S/(000) | S/(000) | |||||||
| Up to 3 months | 15,152,619 | 11,017,649 | ||||||
| From 3 months to 1 year | 8,735,918 | 6,614,180 | ||||||
| From 1 to 3 years | 3,478,314 | 2,770,452 | ||||||
| From 3 to 5 years | 702,962 | 777,729 | ||||||
| Over 5 years | 2,114,501 | 1,351,295 | ||||||
| Total | 30,184,314 | 22,531,305 | ||||||
As of December 31, 2017 and 2016, Management considers the Group’s deposits and obligations are diversified with no significant concentrations.
At December 31, 2017 and 2016, of the total balance of deposits and obligations in Peru, approximately S/30,064.8 million and S/28,239.3 million are secured by the Peruvian “Fondo de Seguro de Depósitos” (Deposit Insurance Fund). At said dates, maximum coverage recognized by “Fondo de Seguro de Depósitos” totaled S/97,529 and S/97,644, respectively.
| 14 | DUE TO BANKS AND CORRESPONDENTS |
| a) | This item consists of the following: |
| 2017 | 2016 | |||||||
| S/(000) | S/(000) | |||||||
| International funds and others (b) | 5,264,545 | 5,253,826 | ||||||
| Promotional credit lines (c) | 2,029,989 | 1,793,205 | ||||||
| Inter-bank funds | 659,737 | 408,153 | ||||||
| 7,954,271 | 7,455,184 | |||||||
| Interest payable | 42,618 | 38,732 | ||||||
| Total | 7,996,889 | 7,493,916 | ||||||
F- 71
| b) | This item consists of the following: |
| 2017 | 2016 | |||||||
| S/(000) | S/(000) | |||||||
| Citibank N.A. (i) | 1,166,760 | 385,940 | ||||||
| Wells Fargo Bank (ii) | 810,250 | 788,660 | ||||||
| Corporación Financiera de Desarrollo (COFIDE) | 600,871 | 456,246 | ||||||
| Comunidad Andina de Fomento – (CAF) (iii) | 324,100 | 247,013 | ||||||
| Bank of America (iv) | 324,088 | 335,426 | ||||||
| JP Morgan Chase Bank, National Association (v) | 324,030 | 335,204 | ||||||
| Toronto Dominion Bank | 259,280 | – | ||||||
| Standard Chartered Bank | 194,460 | – | ||||||
| International Finance Corporation (IFC) | 190,337 | 214,600 | ||||||
| Banco del Estado de Chile | 162,195 | – | ||||||
| Bank of Montreal | 162,050 | 805,440 | ||||||
| Banco de la Nación | 125,000 | – | ||||||
| Scotiabank Perú S.A.A | 100,000 | 80,722 | ||||||
| Banco Consorcio | 94,157 | 103,969 | ||||||
| Deutsche Bank | 581 | 83,900 | ||||||
| HSBC Bank PLC | – | 295,328 | ||||||
| Bank of New York Mellon | – | 335,600 | ||||||
| Canadian Imperial Bank of Commerce Toronto | – | 335,600 | ||||||
| Others below S/80 million | 426,386 | 450,178 | ||||||
| Total | 5,264,545 | 5,253,826 | ||||||
At December 31, 2017, the loans have maturities between January 2018 and March 2032 (between January 2017 and December 2031 at December 31, 2016) and earn interest at rates that fluctuate between 0.5 percent and 9.04 percent (between 0.44 percent and 11.43 percent at December 31, 2016).
| (i) | At December 31, 2017, the balance includes two variable rate loans obtained in July of 2017, for a total of US$150.0 million, equivalent to S/486.2 million, the amounts of which are hedged by two IRS for a nominal amount with equal principal and maturity, See Note 12(b). By means of the IRS, the two loans were economically converted to a fixed rate loan. |
| (ii) | At December 31, 2017, the balance includes two variable rate loans obtained in June of 2016, and October of 2017 for a total of US$150.0 million, equivalent to S/486.2 million (two variable rate loans obtained in April and June of 2016 for a total of US$95.0 million, equivalent to S/318.8 million, at December 31, 2016) hedged with two interest rate swaps (IRS) for a nominal amount equal principal and the same maturity date, See Note12(b). By means of the IRS, said loans were economically converted to a fixed rate loan. |
The variable rate loan obtained in April 2016 for US$45.0 million, equivalent to S/151.0 million, matured in April 2017.
F- 72
| (iii) | At December 31, 2017, the balance corresponds to a variable rate loan in U.S. Dollars, obtained in December of 2017 for US$100.0 million, equivalent to S/324.1 million, the amount of which is hedged with a CCS for a nominal amount equal to the principal and the same maturity, See Note 12(b). By means of the CCS, said loan was economically converted to a fixed rate loan in soles. |
| (iv) | At December 31, 2017, the balance corresponds to a variable rate loan obtained in December 2015 for US$100.0 million, equivalent to S/324.1 million; which is hedged with an IRS for a nominal amount equal to the principal and same maturity date (US$100.0 million equivalent to S/335.6 million at December 31, 2016), See Note 12(b). By means of the IRS, said loan was economically converted to a fixed rate loan. |
| (v) | At December 31, 2017, the balance corresponds to a variable rate loan obtained in February 2016 for US$100.0 million, equivalent to S/324.1 million, hedged by an IRS for a nominal amount equal to the principal and with the same maturity date (US$100.0 million, equivalent to S/335.6 million, at December 31, 2016), See Note 12(b). By means of the IRS, said loan was economically converted to a fixed rate. |
| c) | Promotional credit lines represent loans granted by Corporación Financiera de Desarrollo and Fondo de Cooperación para el Desarrollo Social (COFIDE and FONCODES for their Spanish acronyms, respectively) to promote the development of Peru, they have maturities between January 2018 and January 2023 at annual interest rates varying between 6.00 percent and 7.75 percent at December 31, 2017 (between January 2017 and January 2022 and with annual interest rates ranging between 6.00 percent and 7.75 percent at December 31, 2016). These credit lines are secured by a loan portfolio totaling S/2,030.0 million and S/1,793.2 million at December 31, 2017 and December 31, 2016, respectively. |
| d) | The table below shows maturities of due to banks and correspondents at December 31, 2017 and 2016 based on the remaining period to the maturity date: |
| 2017 | 2016 | |||||||
| S/(000) | S/(000) | |||||||
| Up to 3 months | 2,169,022 | 2,801,499 | ||||||
| From 3 months to 1 year | 2,055,859 | 1,536,609 | ||||||
| From 1 to 3 years | 1,715,035 | 1,214,848 | ||||||
| From 3 to 5 years | 452,577 | 554,600 | ||||||
| Over 5 years | 1,561,778 | 1,347,628 | ||||||
| Total | 7,954,271 | 7,455,184 | ||||||
| e) | At December 31, 2017 and 2016, lines of credit granted by several local and foreign financial institutions, available for future operating activities total S/7,294.5 million and S/7,047.0 million, respectively. |
| f) | Some debts to banks and correspondents include standard “covenants” related to the compliance of financial ratios, the use of the funds and other administrative matters; which, in Management’s opinion, do not limit the Group’s operations and have been complied with at the date of the consolidated financial statements. |
F- 73
| 15 | TECHNICAL RESERVES, INSURANCE CLAIMS RESERVES AND UNEARNED PREMIUMS |
| a) | This item consists of the following: |
| 2017 | ||||||||||||
|
Claims reserves direct |
Technical
reserves (*) |
Total | ||||||||||
| S/(000) | S/(000) | S/(000) | ||||||||||
| Life insurance | 626,871 | 5,599,777 | 6,226,648 | |||||||||
| General insurance | 484,608 | 513,826 | 998,434 | |||||||||
| Health insurance | 69,373 | 149,305 | 218,678 | |||||||||
| Total | 1,180,852 | 6,262,908 | 7,443,760 | |||||||||
| 2016 | ||||||||||||
|
Claims reserves direct |
Technical
reserves (*) |
Total | ||||||||||
| S/(000) | S/(000) | S/(000) | ||||||||||
| Life insurance | 551,516 | 5,128,974 | 5,680,490 | |||||||||
| General insurance | 325,748 | 574,435 | 900,183 | |||||||||
| Health insurance | 60,733 | 144,783 | 205,516 | |||||||||
| Total | 937,997 | 5,848,192 | 6,786,189 | |||||||||
| (*) | At December 31, 2017, the life insurance technical reserves include the mathematical reserves of life annuities amounting to S/3,514.4 million (S/3,241.2 million at December 31, 2016). |
Insurance claims reserves represent reported claims and an estimation for incurred but non reported claims (IBNR). Reported claims are adjusted on the basis of technical reports received from independent adjusters .
Insurance claims and technical reserves corresponding to the reinsurers and coinsurers are shown as ceded claims, which are presented in “Accounts receivable from reinsurers and coinsurers” of the consolidated statement of financial position, See Note 9(b).
At December 31, 2017, the reserves for direct claims include reserves for IBNR for life, general and health insurance for an amount of S/282.4 million, S/11.3 million and S/47.6 million, respectively (S/231.4 million, S/9.1 million and S/41.4 million, respectively, at December 31, 2016).
At December 31, 2017 and in previous years, the differences between the estimations for the incurred and non-reported claims and the settled and pending liquidation claims have not been significant. In the case of general risks and health, retrospective analysis indicates that the amounts accrued are adequate and the Management believes that the estimated IBNR reserve is sufficient to cover any liability as of December 31, 2017 and 2016.
Technical reserves comprise reserves for future benefit obligation under its in-force life, annuities and accident insurance policies and the unearned premium reserves in respect of the portion of premiums written that is allocable to the unexpired portion of the related policy periods for general and health insurance products.
| b) | Movement of insurance claims reserves (direct and assumed), occurred during the years 2017 and 2016: |
F- 74
| 2017 | ||||||||||||||||
|
Life
insurance |
General
insurance |
Health
insurance |
Total | |||||||||||||
| S/(000) | S/(000) | S/(000) | S/(000) | |||||||||||||
| Beginning balance | 551,516 | 325,748 | 60,733 | 937,997 | ||||||||||||
| Claims, Note 24 | 646,026 | 661,108 | 294,557 | 1,601,691 | ||||||||||||
| Payments | (569,108 | ) | (491,108 | ) | (285,899 | ) | (1,346,115 | ) | ||||||||
| Exchange difference | (1,563 | ) | (11,140 | ) | (18 | ) | (12,721 | ) | ||||||||
| Ending balance | 626,871 | 484,608 | 69,373 | 1,180,852 | ||||||||||||
| 2016 | ||||||||||||||||
|
Life
insurance |
General
insurance |
Health
insurance |
Total | |||||||||||||
| S/(000) | S/(000) | S/(000) | S/(000) | |||||||||||||
| Beginning balance | 478,960 | 335,818 | 64,896 | 879,674 | ||||||||||||
| Claims, Note 24 | 618,274 | 351,227 | 274,902 | 1,244,403 | ||||||||||||
| Payments | (544,934 | ) | (385,621 | ) | (243,847 | ) | (1,174,402 | ) | ||||||||
| Exchange difference | (784 | ) | 24,324 | (35,218 | ) | (11,678 | ) | |||||||||
| Ending balance | 551,516 | 325,748 | 60,733 | 937,997 | ||||||||||||
| c) | Technical reserves occurred during the years 2017 and 2016: |
| 2017 | ||||||||||||||||
|
Life
insurance |
General
insurance |
Health
insurance |
Total | |||||||||||||
| S/(000) | S/(000) | S/(000) | S/(000) | |||||||||||||
| Beginning balance | 5,128,974 | 574,435 | 144,783 | 5,848,192 | ||||||||||||
| Time course expenses and others | 77,855 | – | – | 77,855 | ||||||||||||
| Unearned premium and other technical reserves variation, net | 127 | (28,992 | ) | 4,621 | (24,244 | ) | ||||||||||
| Insurance subscriptions | 491,519 | – | – | 491,519 | ||||||||||||
| Exchange difference and others | (98,698 | ) | (31,617 | ) | (99 | ) | (130,414 | ) | ||||||||
| Ending balance | 5,599,777 | 513,826 | 149,305 | 6,262,908 | ||||||||||||
F- 75
| 2016 | ||||||||||||||||
|
Life
insurance |
General
insurance |
Health
insurance |
Total | |||||||||||||
| S/(000) | S/(000) | S/(000) | S/(000) | |||||||||||||
| Beginning balance | 4,755,154 | 582,453 | 144,346 | 5,481,953 | ||||||||||||
| Time course expenses and others | 58,778 | – | – | 58,778 | ||||||||||||
| Unearned premium and other technical reserves variation, net | 365 | (11,578 | ) | 9,881 | (1,332 | ) | ||||||||||
| Insurance subscriptions | 361,966 | – | – | 361,966 | ||||||||||||
| Exchange difference and others | (47,289 | ) | 3,560 | (9,444 | ) | (53,173 | ) | |||||||||
| Ending balance | 5,128,974 | 574,435 | 144,783 | 5,848,192 | ||||||||||||
F- 76
At December 31, 2017 and 2016 no additional reserves were needed as a result of the liability adequacy test. The main assumptions used in estimation of retirement, disability and survival annuities and individual life (including Investment link insurance contracts) reserves as, of those dates, are the following:
| At December 31, 2017 | At December 31, 2016 | |||||||
| Mortality | Mortality table | Technical rates | Mortality table | Technical rates | ||||
| Annuities | SPP-S-2017 and SPP-I- 2017 | Between 2.90% - 7.93% / Between 2.50% - 5.25% | TAP 2012 and MI 2006 | Between 4.21% - 7.69% / Between 2.50% - 5.25% | ||||
| Pension insurance –Temporary Regime / SCTR (*) | B-85 and MI-85 | 3.00% soles VAC | B-85 and MI-85 | 3.00% soles VAC | ||||
| Pension insurance –Definitive Regime | B-85 and MI-85 | 3.31% soles VAC / 4.66% Nominal dollars | B-85 and MI-85 | 3.43% soles VAC / 4.65% Nominal dollars | ||||
| Pension insurance –Definitive Regime / SCTR | B-85 adjusted and MI-85 | Between 3.00%, 3.38% soles VAC / 4.66% Nominal dollars / 6.35% soles adjusted / 4.66% dollars adjusted | B-85 adjusted and MI-85 | Between 3.00%, 3.43% soles VAC / 4.65% Nominal dollars / 6.49% soles adjusted / 4.65% dollars adjusted | ||||
| Pension insurance –Temporary Regime /SCTR (Longevity) | SPP-S-2017- and SPP-I-2017 | Between 3.81%, 3.88% soles VAC | SPP-S-2017- and SPP-I-2017 | Between 3.74%, 3.88% soles VAC | ||||
| Individual life | CSO 80 adjusted | Between 4.00% - 5.00% | CSO 80 adjusted | Between 4.00% - 5.00% | ||||
| (*) | Complementary Work Risk Insurance (SCTR the Spanish acronym). |
The sensitivity of the estimates used by the Group to measure its insurance risks is represented primarily by the life insurance risks; the main variables as of December 31, 2017 and 2016, are the interest rates and the mortality tables used. The Group has evaluated the changes of the reserves related to its most significant life insurance contracts included in retirement, disability and survival annuities contracts of +/- 100 bps of the interest rates and of +/- 5 bps of the mortality factors, with the following results:
| At December 31, 2017 | At December 31, 2016 | |||||||||||||||||||||||
| Variation of the reserve | Variation of the reserve | |||||||||||||||||||||||
| Variables |
Amount of
the reserve |
Amount | Percentage |
Amount of
the reserve |
Amount | Percentage | ||||||||||||||||||
| S/(000) | S/(000) | % | S/(000) | S/(000) | % | |||||||||||||||||||
| Portfolio in S/- Base amount | 519,317 | – | – | 508,498 | – | – | ||||||||||||||||||
| Changes in interest rates: + 100 bps | 473,067 | (46,250 | ) | (8.91 | ) | 462,992 | (45,506 | ) | (8.95 | ) | ||||||||||||||
| Changes in interest rates: - 100 bps | 574,664 | 55,347 | 10.66 | 563,057 | 54,559 | 10.73 | ||||||||||||||||||
| Changes in Mortality tables to 105% | 514,091 | (5,226 | ) | (1.01 | ) | 503,253 | (5,245 | ) | (1.03 | ) | ||||||||||||||
| Changes in Mortality tables to 95% | 524,801 | 5,484 | 1.06 | 514,003 | 5,505 | 1.08 | ||||||||||||||||||
| Portfolio in US$- Base amount | 2,682,536 | – | – | 2,317,565 | – | – | ||||||||||||||||||
| Changes in interest rates: + 100 bps | 2,428,338 | (254,198 | ) | (9.48 | ) | 2,089,212 | (228,352 | ) | (9.85 | ) | ||||||||||||||
| Changes in interest rates: - 100 bps | 2,993,483 | 310,948 | 11.59 | 2,591,011 | 273,447 | 11.80 | ||||||||||||||||||
| Changes in Mortality tables to 105% | 2,660,474 | (22,062 | ) | (0.82 | ) | 2,293,403 | (24,161 | ) | (1.04 | ) | ||||||||||||||
| Changes in Mortality tables to 95% | 2,705,711 | 23,176 | 0.86 | 2,336,095 | 18,530 | 0.80 | ||||||||||||||||||
F- 77
| 16 | BONDS AND NOTES ISSUED |
| a) | This item consists of the following: |
| Annual interest rate | Interest payment | Maturity | Issued amount | 2017 | 2016 | |||||||||||||
| % | (000) | S/(000) | S/(000) | |||||||||||||||
| Senior notes - (i) | 5.38 | Semi-annual | September 2020 | US$800,000 | 2,612,379 | 2,755,382 | ||||||||||||
| Senior notes - (i)(x) | Between 2.75 and 4.25 | Semi-annual | Between January 2018 and April 2023 | US$596,455 | 1,948,082 | 2,082,913 | ||||||||||||
| Senior notes - (ii) | 4.25 | Semi-annual | April 2023 | US$350,000 | 1,066,904 | 1,086,997 | ||||||||||||
| Senior notes - (xi) | 2.25 | Semi-annual | October 2019 | US$300,000 | 954,131 | 1,005,955 | ||||||||||||
| Senior notes | 4.85 | Semi-annual | October 2020 | S/2,000,000 | 1,958,571 | – | ||||||||||||
| CCR Inc. MMT 100 - Secured Notes - (iii) | ||||||||||||||||||
| 2010 Series C Floating rate certificates | Libor 1M + 44.5 bp | Monthly | July 2017 | US$350,000 | – | 179,230 | ||||||||||||
| 2012 Series A and B Floating rate certificates | Libor 1M + 22.5 bp | Monthly | July 2017 | US$150,000 | – | 97,884 | ||||||||||||
| 2012 Series C Floating rate certificates | 4.75 | Monthly | July 2022 | US$315,000 | 670,132 | 843,195 | ||||||||||||
| 670,132 | 1,120,309 | |||||||||||||||||
| Corporate bonds - | ||||||||||||||||||
| Second program | ||||||||||||||||||
| Third issuance (Series A and B) – BCP | Between 7.47 and 8.50 | Quarterly | Between June and July 2018 | S/200,000 | 194,883 | 200,000 | ||||||||||||
| Third program | ||||||||||||||||||
| First issuance (Series A and B) - Mibanco | Between 5.38 and 5.41 | Semi-annual | Between May and July 2017 | S/98,800 | – | 20,766 | ||||||||||||
| Fourth issuance (Series A) - Mibanco | 4.78 | Semi-annual | December 2017 | S/100,000 | – | 91,505 | ||||||||||||
| Fifth issuance (Series A and B) - Mibanco | Between 6.59 and 6.97 | Semi-annual | Between January and March 2017 | S/84,660 | – | 78,815 | ||||||||||||
| Fourth program | ||||||||||||||||||
| Tenth issuance (Series A, B and C) - BCP | Between 5.31 and 7.25 | Semi-annual | Between December 2021 and November 2022 | S/550,000 | 530,034 | 549,400 | ||||||||||||
| First issuance (Series A) - Mibanco | 6.56 | Semi-annual | July 2018 | S/100,000 | 86,513 | 86,950 | ||||||||||||
| First issuance (Series B) - Mibanco | 7.16 | Semi-annual | June 2019 | S/100,000 | 89,087 | 85,000 | ||||||||||||
| Fifth program | ||||||||||||||||||
| First issuance (Series A) - BCP | 6.41 | Semi-annual | April 2019 | S/172,870 | 162,096 | 172,391 | ||||||||||||
| First issuance (Series B) - BCP | 5.59 | Semi-annual | June 2019 | S/150,000 | 136,311 | 150,000 | ||||||||||||
| First issuance (Series C) - BCP | 5.625 | Semi-annual | November 2019 | S/138,410 | 123,761 | 138,075 | ||||||||||||
| First issuance (Series D) - BCP | 5.91 | Semi-annual | January 2020 | S/182,410 | 167,500 | – | ||||||||||||
| Sixth program | ||||||||||||||||||
| Third issuance (Series A) - Mibanco | 5.16 | Semi-annual | May 2017 | S/50,000 | – | 46,165 | ||||||||||||
| 1,490,185 | 1,619,067 | |||||||||||||||||
F- 78
| Annual interest rate | Interest payment | Maturity | Issued amount | 2017 | 2016 | |||||||||||||
| % | S/(000) | S/(000) | ||||||||||||||||
| Subordinated bonds - BCP (iv) | 6.13 | Semi-annual | April 2027 | US$720,000 | 2,333,152 | 2,423,720 | ||||||||||||
| Subordinated bonds - BCP (v) | 6.88 | Semi-annual | September 2026 | US$350,000 | 1,135,050 | 1,194,773 | ||||||||||||
| Junior subordinated bonds - BCP (vi) | 9.75 | Semi-annual | November 2069 | US$250,000 | 813,695 | 851,423 | ||||||||||||
| Subordinated bonds - | ||||||||||||||||||
| First program | ||||||||||||||||||
| First issuance (Series A) - BCP | 6.22 | Semi-annual | May 2027 | S/15,000 | 15,000 | 15,000 | ||||||||||||
| First issuance (Series A) - Pacífico Seguros | 6.97 | Quarterly | November 2026 | US$60,000 | 193,900 | 200,655 | ||||||||||||
| Second program | ||||||||||||||||||
| First issuance (Series A) - Mibanco | 8.50 | Semi-annual | May 2026 | S/100,000 | 100,000 | 100,000 | ||||||||||||
| First issuance (Series B) - Mibanco | 7.22 | Semi-annual | June 2027 | S/30,000 | 29,953 | – | ||||||||||||
| Third program | ||||||||||||||||||
| First, second and fourth issuance (Series A) - Mibanco | Between 6.19 and 8.16 | Semi-annual | Between October 2021 and December 2022 | S/110,000 | 39,978 | 109,980 | ||||||||||||
| Fifth issuance (Series A and B) - Mibanco | 7.75 | Semi-annual | July 2024 | S/88,009 | 87,869 | 88,009 | ||||||||||||
| Issuance I - Banco de Crédito de Bolivia | 6.25 | Semi-annual | August 2028 | Bs70,000 | 33,072 | 34,196 | ||||||||||||
| Issuance II - Banco de Crédito de Bolivia | 5.25 | Semi-annual | August 2022 | Bs137,200 | 65,677 | 68,180 | ||||||||||||
| 565,449 | 616,020 | |||||||||||||||||
| Negotiable certificate of deposit - BCP (vii) | 7.17 | Semi-annual | October 2022 | S/483,280 | – | 478,837 | ||||||||||||
| Negotiable certificate of deposit - Mibanco | Between 1.8 and 5.9 | Annual | Between January 2017 and December 2019 | S/2,998 | 1,461 | 2,998 | ||||||||||||
| Subordinated negotiable certificates - BCP (viii) | 6.88 | Semi-annual | September 2026 | US$126,120 | 390,450 | 402,139 | ||||||||||||
| Subordinated negotiable certificates - BCP (viii) | Libor 3M+ 279 bp | Semi-annual | November 2021 | US$2,960 | 9,593 | 9,934 | ||||||||||||
| Leasing bonds | ||||||||||||||||||
| First program (ix) | ||||||||||||||||||
| Sixth issuance (Series A) – BCP | 8.72 | Quarterly | August 2018 | S/100,000 | 100,000 | 100,000 | ||||||||||||
| 16,049,234 | 15,750,467 | |||||||||||||||||
| Interest payable | 193,023 | 189,136 | ||||||||||||||||
| Total | 16,242,257 | 15,939,603 | ||||||||||||||||
F- 79
At December 31, 2017 the Group holds IRS for a nominal amount totaling US$2,442.4 million, equivalent to S/7,915.9 million (US$2,442.4 million, equivalent to S/8,196.8 million at December 31, 2016), See Note 12(b), which were designated as fair value hedges of certain corporate bonds, subordinated bonds and Notes denominated in U.S. Dollars at fixed rate; through said IRS, these bonds and Notes were economically converted to variable interest rate.
| (i) | The Group can redeem these notes in whole or in a part at any time, with the penalty of the payment of an interest rate equivalent to that of the American Treasury plus 40 basis points. Payment of principal will take place at the date of maturity or redemption of the notes. |
| (ii) | The Group can redeem these notes in whole or in part at any time, with the penalty of the payment of an interest rate equivalent to that of the American Treasury plus 50 basis points. Payment of principal will take place at the date of maturity or redemption. |
| (iii) | All issuances are secured by the collection of BCP’s (including its foreign branches) future inflows from electronic messages sent through the Society for Worldwide Interbank Financial Telecommunications (“SWIFT”) network and utilized within the network to instruct correspondent banks to make a payment of a certain amount to a beneficiary that is not a financial institution. |
At December 31, 2016, cash flows of issuances in 2010 with series “C”, which are subject to variable interest rates, have been hedged using an IRS designated as cash flows hedges for a nominal amount of S/179.2 million, See Note 12(b); through the IRS, said issuance was converted to a fixed interest rate. The issue matured in July 2017.
| (iv) | From 2022, the Bank will pay a floating interest rate of three month Libor plus 704.3 basis points. Between April 24, 2017 and April 24, 2022, the Bank may redeem all or part of the subordinated bonds with the penalty of the payment of an interest rate equivalent to that of the American Treasury plus 50 basis points. Additionally, from April 25, 2022 or at any later date of coupon payment, the Bank will be able to redeem all or part of the bonds without penalty. Payment of principal will take place at the date of maturity of bonds or upon redemption. |
In January 2014, the Bank, through its Panama Branch increased the issue of its subordinated bonds by an amount of US$200.0 million in the international market, as occurred in April 2013, when it carried out a first increase for an amount of US$170.0 million, with the same characteristics of the issue made in April 2012 for US$350.0 million.
| (v) | From September 16, 2021, the interest rate becomes a floating rate of three month Libor plus 770.8 basis points. Between September 16, 2016 and September 15, 2021, the Group may redeem all or part of the bonds, with the penalty of the payment of an interest equivalent to the American Treasury plus 50 basis points. Additionally, from September 16, 2021 or at any later date of coupon payment, the Group can redeem all or part of the bonds without penalty. Payment of principal will take place at the date of maturity of bonds or upon redemption. |
| (vi) | In November 2019, interest rate will become a variable rate of three month Libor plus 816.7 basis points. On that date and on any interest payment date the Bank can redeem 100 percent of the bonds without penalty. Payment of principal will take place at the date of maturity or upon redemption. |
This issuance, as authorized by the SBS, qualifies as “Tier 1” equity in the determination of the regulatory capital (“patrimonio efectivo”) and has no related guarantees.
F- 80
| (vii) | In October 2017, the interest rate became a variable rate, fixed as the average of at least three valuations of the internal rate of return for sovereign bonds issued by the Peruvian Government (with maturity in 2037), plus 150 basis points, with semiannual payments. The Group, using the powers conferred to it, on October 15, 2017, redeemed 100 percent of the negotiable certificates of deposit, without penalties. |
| (viii) | Until October 2016, said certificates bore interest at the fixed rate of 6.88 percent per annum. From November 2016, the interest rate will change to a floating interest rate, established as three month Libor plus 2.79 percent, with semiannual payments. Furthermore, from said date, the Group can redeem 100 percent of the debt, without penalties. Payment of principal will take place at the date of maturity of bonds or upon redemption. |
| (ix) | Leasing bonds are collateralized by the fixed assets financed by the Group. |
| (x) | In June 2014, the Group offered an exchange to the holders of senior notes, by which the notes were partially replaced with new notes, at market rate, with the same characteristics of the senior notes indicated in (i) above. |
| (xi) | The Group may redeem all or part of the notes at any time, subject to a penalty of a rate of interest equal to that of the U.S. Treasury plus 20 base points. The payment of principal will take place on the maturity date of the notes or when the Group redeems them. |
At December 31, 2017, the cash flows of the bond issued in U.S. dollars, subject to exchange rate risk have been hedged by means of three CCS designated as a cash flow hedge for a nominal amount of US$300.0 million, equivalent to S/972.3 million, (US$300.0 million, equivalent to S/1,006.8 million at December 31, 2016), See Note 12(b). By means of the CCS, the bond was economically converted to soles.
| b) | The table below shows the bonds and notes issued, classified by maturity: |
| 2017 | 2016 | |||||||
| S/(000) | S/(000) | |||||||
| Up to 3 months | 36,687 | 251,751 | ||||||
| From 3 months to 1 year | 1,236,046 | 407,200 | ||||||
| From 1 to 3 years | 6,508,352 | 3,009,004 | ||||||
| From 3 to 5 years | 760,102 | 3,271,925 | ||||||
| More than 5 years | 7,508,047 | 8,810,587 | ||||||
| Total | 16,049,234 | 15,750,467 | ||||||
F- 81
| 17 | EQUITY |
| a) | Share capital - |
At December 31, 2017, 2016 and 2015 a total of 94,382,317 shares have been issued at US$5 par value each.
| b) | Treasury stock - |
We present below the treasury stock owned by the Group entities at December 31, 2017, 2016 and 2015:
| 2017 | 2016 | 2015 | ||||||||||
| Atlantic Security Holding Corporation | 14,620,846 | 14,620,846 | 14,620,846 | |||||||||
| Share-based compensation plans, Note 19 | 276,011 | 277,436 | 269,832 | |||||||||
| Others | 5,151 | 17,255 | 13,155 | |||||||||
| 14,902,008 | 14,915,537 | 14,903,833 | ||||||||||
During 2017, 2016 and 2015, the Group bought 132,110, 156,603 and 145,871 shares of Credicorp Ltd., respectively, for a total of US$21.9 million (equivalent to S/71.0 million ), US$20.0 million (equivalent to S/66.5 million ) and US$21.7 million (equivalent to S/72.9 million), respectively.
F- 82
| c) | Reserves - |
Certain of the Group’s subsidiaries are required to keep a reserve that equals a percentage of paid-in capital (20, 30 or 50 percent, depending on its activities and country in which production takes place); this reserve must be constituted with annual transfers of not less than 10 percent of net profits. At December 31, 2017, 2016 and 2015, the balance of reserves amounts to approximately S/4,480.3, S/3,987.5 million and S/2,996.7 million, respectively.
At the Board meetings held on February 22, 2017, February 24, 2016 and February 25, 2015, the decision was made to transfer from “Retained earnings” to “Reserves” S/2,355.0 million, S/2,316.4 million and S/1,820.5 million, respectively.
“Other reserves” include unrealized gains (losses) on Available-for-sale investments and on cash flow hedges, net of deferred income tax and non-controlling interest. Movement was as follows:
| Net unrealized gains (losses): | ||||||||||||||||
|
Reserve for
available-for-sale investments |
Reserve for cash
flow hedges |
Foreign exchange
translation |
Total | |||||||||||||
| S/(000) | S/(000) | S/(000) | S/(000) | |||||||||||||
| Balances at January 1, 2015 | 1,223,615 | 5,937 | (206,166 | ) | 1,023,386 | |||||||||||
| Decrease in net unrealized gains on Available-for-sale investments | (323,348 | ) | – | – | (323,348 | ) | ||||||||||
| Transfer of net realized gains on Available-for-sale investments to profit or loss, net of realized loss | (191,716 | ) | – | – | (191,716 | ) | ||||||||||
| Transfer of the impairment loss on Available-for-sale investments to profit or loss, Note 6(a) | (55,647 | ) | – | – | (55,647 | ) | ||||||||||
| Change from net unrealized gains on cash flow hedges, Note 12(b)(ii) | – | 50,273 | – | 50,273 | ||||||||||||
| Transfer of net realized gains on cash flow hedges to profit or loss, Note 12(b)(ii) | – | (11,160 | ) | – | (11,160 | ) | ||||||||||
| Foreign exchange translation | – | – | 270,907 | 270,907 | ||||||||||||
| Balances at December 31, 2015 | 652,904 | 45,050 | 64,741 | 762,695 | ||||||||||||
| Increase in net unrealized gains on Available-for-sale investments | 554,869 | – | – | 554,869 | ||||||||||||
| Transfer of net realized gains on Available-for-sale investments to profit or loss, net of realized loss | (75,444 | ) | – | – | (75,444 | ) | ||||||||||
| Transfer of the impairment loss on Available-for-sale investments to profit or loss Note 6(a) | 14,459 | – | – | 14,459 | ||||||||||||
| Change in net unrealized gains on cash flow hedges, Note 12(b)(ii) | – | (16,724 | ) | – | (16,724 | ) | ||||||||||
| Transfer of net realized losses on cash flow hedges to profit or loss, Note 12(b)(ii) | – | (3,676 | ) | – | (3,676 | ) | ||||||||||
| Foreign exchange translation | – | – | (26,448 | ) | (26,448 | ) | ||||||||||
| Balance at December 31, 2016 | 1,146,788 | 24,650 | 38,293 | 1,209,731 | ||||||||||||
| Increase in net unrealized gains on Available-for-sale investments | 873,868 | – | – | 873,868 | ||||||||||||
| Transfer of net realized gains on Available-for-sale investments to profit or loss, net of realized loss | (517,006 | ) | – | – | (517,006 | ) | ||||||||||
| Transfer of the impairment loss on Available-for-sale investments to profit or loss Note 6(a) | 766 | – | – | 766 | ||||||||||||
| Change in net unrealized gains on cash flow hedges, Note 12(b)(ii) | – | (59,709 | ) | – | (59,709 | ) | ||||||||||
| Transfer of net realized losses on cash flow hedges to profit or loss, Note 12(b)(ii) | – | 2,278 | – | 2,278 | ||||||||||||
| Foreign exchange translation | – | – | (54,334 | ) | (54,334 | ) | ||||||||||
| Balance at December 31, 2017 | 1,504,416 | (32,781 | ) | (16,041 | ) | 1,455,594 | ||||||||||
F- 83
| d) | Components of other comprehensive income - |
The consolidated statement of comprehensive income includes other comprehensive income from available-for-sale investments and from derivative financial instruments used as cash flow hedges; their movements are as follows:
| 2017 | 2016 | 2015 | ||||||||||
| S/(000) | S/(000) | S/(000) | ||||||||||
| Available-for-sale investments: | ||||||||||||
| Unrealized gains (losses) on available-for-sale investments | 873,868 | 554,869 | (323,348 | ) | ||||||||
| Transfer of realized gains on available-for-sale investments to profit or loss, net of realized losses | (517,006 | ) | (75,444 | ) | (191,716 | ) | ||||||
| Transfer of impairment losses on available-for-sale investments to profit or loss | 766 | 14,459 | (55,647 | ) | ||||||||
| Sub total | 357,628 | 493,884 | (570,711 | ) | ||||||||
| Non-controlling interest | 4,120 | 1,799 | (46,529 | ) | ||||||||
| Income tax | 13,962 | 22,975 | (18,503 | ) | ||||||||
| 375,710 | 518,658 | (635,743 | ) | |||||||||
| Cash flow hedge: | ||||||||||||
| Net (loss) gains on cash flow hedges | (59,709 | ) | (16,724 | ) | 50,273 | |||||||
| Transfer of net realized losses (gains) on cash flow hedges to profit or loss | 2,278 | (3,676 | ) | (11,160 | ) | |||||||
| Sub total | (57,431 | ) | (20,400 | ) | 39,113 | |||||||
| Non-controlling interest | (1,219 | ) | 585 | – | ||||||||
| Income tax | (18,719 | ) | (2,294 | ) | 1,956 | |||||||
| (77,369 | ) | (22,109 | ) | 41,069 | ||||||||
| Foreign exchange translation: | ||||||||||||
| Exchange gains or losses | (54,334 | ) | (26,448 | ) | 270,907 | |||||||
| Non-controlling interest | 107 | (123 | ) | – | ||||||||
| (54,227 | ) | (26,571 | ) | 270,907 | ||||||||
| e) | Dividend distribution - |
At December 31, 2017, 2016 and 2015, Credicorp paid cash dividends, net of the effect of treasury shares, for approximately US$298.1, US$184.7 and US$174.4 million, respectively (equivalent to approximately S/980.0, S/653.3 and S/540.0 million, respectively). In this sense, at December 31, 2017, 2016 and 2015, cash dividend payouts per share totaled US$3.7, US$2.3 and US$1.8, respectively.
Furthermore, at the meeting of the Board of Directors held on October 25, 2017, agreed to pay additional dividends, net of the effect of treasury stock, for approximately US$386.5 million (equivalent to S/1,252.3 million) from the reserves. Said dividends were paid in November 2017.
The Board of Directors Meeting dated February 28, 2018, agreed to declare a cash dividend of S/14.1726 per common share, approximately S/1,337.6 million, corresponding to the 2017 results, which will be paid on May 11, 2018. The cash dividend will be paid in U.S. Dollars using the weighted exchange rate registered by the Superintendent of Banks, Insurance and Pension Funds (Superintendencia de Banca, Seguros y AFP) for the transactions at the close of business on May 9, 2018.
F- 84
In accordance with current Peruvian legislation, there is no restriction for overseas remittance of dividends or the repatriation of foreign investment. At December 31, 2017 dividends paid by the Peruvian subsidiaries to Credicorp are subject to a 5.0 percent withholding tax and at December 31, 2016 and 2015, the withholding rate was 6.8 percent.
| f) | Regulatory capital - |
At December 31, 2017 and 2016, the regulatory capital requirement (“patrimonio efectivo” in Peru) applicable to Credicorp subsidiaries engaged in financial services and insurance activities in Peru, determined under the provisions of the Peruvian banking and insurance regulator, SBS, totals approximately S/21,723.0 million and S/21,174.7 million, respectively. At those dates, the Group’s regulatory requirement exceeds by approximately S/3,710.3 million and S/3,915.7 million, respectively, the minimum regulatory capital required by the SBS.
| 18 | TAX SITUATION |
| a) | Credicorp is not subject to income tax or any taxes on capital gains, equity or property in Bermuda. Credicorp’s Peruvian subsidiaries are subject to the Peruvian tax regime. |
At December 31, 2017, Peruvian statutory Income Tax rate was 29.5 percent on taxable profit after calculating the workers’ profit sharing, which is determined using a 5 percent rate. At December 31, 2016, Peruvian statutory Income Tax rate was 28.0 percent.
The Bolivian statutory Income Tax rate is 25 percent. Financial entities have an additional rate if the ROE exceeds 6 percent. In that case, an additional 22 percent must be considered, with which the rate becomes 47 percent.
In the case of Chile, the first category income tax rate for domiciled legal entities who have opted for the attributed regime, is 25.0 percent for the year 2017 onwards, and for those under the partially integrated system, it is 25.5 percent for the year 2017 and 27.0 percent for the year 2018 onward. On the other hand, individuals or legal entities non-domiciled in Chile will be subject to an additional tax of 35.0 percent. Credicorp Capital Holding Chile, together with all of its subsidiaries opted for the partially integrated regime.
In the case of Colombia, the income tax rate for the year 2017 was 34.0 percent plus a surcharge of 6.0 percent and at December 31, 2016 it was 25.0 percent. In the year 2018, the rate will be 33.0 percent plus a surcharge of 4.0 percent, and as from the year 2019, the rate will be only 33.0 percent.
Atlantic Security Holding Corporation and its Subsidiaries are not subject to taxes in the Cayman Islands or Panama. For the years ended December 31, 2017, 2016 and 2015, no taxable income was generated from the operations in the United States of America.
F- 85
The reconciliation between the statutory income tax rate and the effective tax rate for the Group is as follows:
| 2017 | 2016 | 2015 | ||||||||||
| % | % | % | ||||||||||
| Peruvian statutory income tax rate | 29.50 | 28.00 | 28.00 | |||||||||
| Increase (decrease) in the statutory tax rate due to: | ||||||||||||
| (i) (Decrease) arising from net income of subsidiaries not domiciled in Peru | (1.82 | ) | (0.04 | ) | (0.37 | ) | ||||||
| (ii) Non-taxable income, net | (2.69 | ) | (1.23 | ) | (0.17 | ) | ||||||
| (iii) Effect of change in Peruvian tax rates | – | (0.53 | ) | – | ||||||||
| Effective income tax rate | 24.99 | 26.20 | 27.46 | |||||||||
| b) | Income tax expense for the years ended December 31, 2017, 2016 and 2015 comprises: |
| 2017 | 2016 | 2015 | ||||||||||
| S/(000) | S/(000) | S/(000) | ||||||||||
| Current - | ||||||||||||
| In Peru | 1,262,302 | 1,098,125 | 1,217,907 | |||||||||
| In other countries | 134,540 | 155,095 | 96,495 | |||||||||
| 1,396,842 | 1,253,220 | 1,314,402 | ||||||||||
| Deferred - | ||||||||||||
| In Peru | (18,264 | ) | 31,472 | 22,667 | ||||||||
| In other countries | 14,708 | 10,748 | (139,862 | ) | ||||||||
| Effect of change in Peruvian tax rates | – | (13,992 | ) | – | ||||||||
| (3,556 | ) | 28,228 | (117,195 | ) | ||||||||
| Total | 1,393,286 | 1,281,448 | 1,197,207 | |||||||||
The deferred income tax has been calculated on all temporary differences, considering the income tax rates effective where Credicorp’s subsidiaries are located.
F- 86
| c) | The following table presents a summary of the Group’s deferred income tax: |
| 2017 | 2016 | |||||||
| S/(000) | S/(000) | |||||||
| Deferred income tax asset, net | ||||||||
| Deferred asset | ||||||||
| Allowance for loan losses | 604,828 | 545,716 | ||||||
| Tax loss carry forward | 13,332 | 38,856 | ||||||
| Provision for sundry expenses | 44,885 | 38,326 | ||||||
| Unrealized loss due to valuation of cash flow hedge derivatives | 22,039 | 2,105 | ||||||
| Provision for sundry risks | 20,173 | 17,731 | ||||||
| Impairments in buildings for rent depreciation | 17,489 | 18,641 | ||||||
| Unrealized loss on hedged bonds | 3,047 | 43,252 | ||||||
| Unrealized loss due to valuation of available-for-sale investments | 2,563 | 6,001 | ||||||
| Others | 40,447 | 35,344 | ||||||
| Deferred liability | ||||||||
| Intangibles, net | (132,553 | ) | (86,746 | ) | ||||
| Buildings depreciation | (70,515 | ) | (73,322 | ) | ||||
| Adjustment for difference in exchange of SUNAT and SBS | (35,660 | ) | (40,096 | ) | ||||
| Unrealized gain due to valuation of derivative financial instruments for hedging purposes | (8,431 | ) | (7,216 | ) | ||||
| Unrealized gain due to valuation of available-for-sale investments | (8,095 | ) | (6,142 | ) | ||||
| Deferred acquisitions costs - DAC | (12,855 | ) | (8,597 | ) | ||||
| Buildings revaluation | (5,917 | ) | (6,589 | ) | ||||
| Others | (14,720 | ) | (11,220 | ) | ||||
| Total | 480,057 | 506,044 | ||||||
| Deferred income tax liability, net | ||||||||
| Deferred asset | ||||||||
| Carry forward tax losses | 14,039 | – | ||||||
| Provision for sundry risks, net | 8,750 | 4,560 | ||||||
| Defferred income due to commission - DIL | 8,326 | 8,829 | ||||||
| Others | 12,900 | 23,607 | ||||||
| Deferred liability | ||||||||
| Intangibles, net | (48,797 | ) | (74,975 | ) | ||||
| Unrealized gain due to valuation of investments available for sale. | (41,910 | ) | (36,721 | ) | ||||
| Gain generated in the reorganization of Pacífico EPS | (39,515 | ) | (39,515 | ) | ||||
| Deferred acquisitions costs - DAC | (30,322 | ) | (12,945 | ) | ||||
| Catastrophic insurance reserve | (9,561 | ) | (10,062 | ) | ||||
| Leasing operations related to loans | (5,063 | ) | (5,311 | ) | ||||
| Buildings revaluation | (2,578 | ) | (4,664 | ) | ||||
| Others | (16,549 | ) | (25,444 | ) | ||||
| Total | (150,280 | ) | (172,641 | ) | ||||
At December 31, 2017, 2016 and 2015, Credicorp and its Subsidiaries have recorded deferred income tax balance of S/33.8 million, S/42.0 million and S/30.9 million, respectively, resulting from unrealized gains and losses on available-for-sale investments and cash flow hedges.
F- 87
| d) | The Peruvian Tax Authority have the right to review and, if necessary, amend the annual income tax returns filed by Peruvian subsidiaries up to four years after their filing date. Income tax returns of the major subsidiaries open for examination by the tax authorities are as follows: |
| Banco de Crédito del Perú | 2012 to 2017 | |
| Mibanco | 2014 to 2017 | |
| Prima AFP | 2013 to 2017 | |
| Pacífico Compañía de Seguros y Reaseguros | 2013 to 2017 | |
| Pacífico Peruano Suiza | 2013 to 2017 |
On December 28, 2017 and January 18, 2018, the Peruvian Tax Authority notified the initial Presentation and Requirement Letters for the examination of the income tax returns of Banco de Crédito for fiscal years 2012 and 2013, respectively.
Furthermore, in December 2017, the Peruvian tax Authority notified Prima AFP of the examination of its income tax returns for fiscal 2015.
The Bolivian, Chilean and Colombian Tax Authorities have the power to review and, if applicable, make a new determination for the income tax calculated by the subsidiaries located in said countries in the previous 8 years, 3 years and 3 years, respectively, upon presentation of their Income Tax declarations. Additionally, in the case of Colombia, a period of 6 years was established for the taxpayers obliged to apply Transfer Prices or taxpayers who report tax losses. The annual income tax declarations pending examination by the overseas tax authorities are the following:
| Banco de Crédito de Bolivia | 2009 to 2017 | |
| Credicorp Capital Colombia | 2014 to 2017 | |
| Inversiones IMT S.A. | 2014 to 2017 |
Since tax regulations are subject to interpretation by the different Tax Authorities where Credicorp’s subsidiaries are located, it is not possible to determine at the present date whether any significant additional liabilities may arise from any eventual tax examinations of the Credicorp’s subsidiaries. Any resulting unpaid taxes, tax penalties or interest that may arise will be recognized as expenses in the year in which they are determined. However, Management of Credicorp and its Subsidiaries and their legal counsel consider that any additional tax assessments would not have a significant impact on the consolidated financial statements as of December 31, 2017 and 2016.
| 19 | SHARE-BASED COMPENSATION PLANS |
As indicated in Note 3(x), in March of each year, the Group grants its own shares to certain key employees. The awarded shares are liberated in the three following years for up to 33.3 percent of the shares granted in each of the three previous years. The Group assumes the payment of the related income tax on behalf of its employees, which corresponds to 30 percent of the benefit.
At December 31, 2017, 2016 and 2015, the Group has granted 140,812, 140,498 and 124,601, Credicorp shares, of which 276,011, 277,436 and 269,832 shares were pending delivery as of December 31, 2017, 2016 and 2015, respectively. During those years, the recorded expense amounted to approximately S/62.0 million, S/73.9 million and S/65.5 million, respectively.
F- 88
| 20 | OFF-BALANCE SHEET ACCOUNTS |
| a) | This item consists of the following: |
| 2017 | 2016 | |||||||
| S/(000) | S/(000) | |||||||
| Contingent credits – indirect loans (b), Note 7(a) | ||||||||
| Guarantees and standby letters | 17,688,087 | 18,000,311 | ||||||
| Import and export letters of credit | 1,681,472 | 1,831,674 | ||||||
| 19,369,559 | 19,831,985 | |||||||
| Responsibilities under credit line agreements (c) | 23,553,406 | 25,812,963 | ||||||
| Total | 42,922,965 | 45,644,948 | ||||||
Reference values of operations with derivatives are recorded in off-balance sheet accounts in the committed currency, as shown in Note 12(b).
| b) | In the normal course of their business, the Group’s banking subsidiaries are party to transactions with off-balance sheet risk. These transactions expose them to credit risk in addition to the amounts recognized in the consolidated statement of financial position. |
Credit risk for contingent credits is defined as the possibility of sustaining a loss because one of the parties to a financial instrument fails to comply with the terms of the contract. The risk of credit losses is represented by the contractual amounts specified in the related contracts. The Group applies the same credit policies in making contingent commitments and other obligations as it does for on-balance sheet instruments (Note 7(a)), including the requirement to obtain collateral when it is deemed necessary.
Collateral held varies, but may include deposits in financial institutions, securities or other assets. Many of the contingent transactions reach maturity without any performance being required; therefore, the total committed amounts do not necessarily represent future cash requirements.
| c) | Lines of credit conceded include consumer loans and other consumer loan facilities (credit card receivables) granted to clients and are cancelable upon related notice to the customer. |
F- 89
| 21 | INTEREST AND SIMILAR INCOME AND INTEREST AND SIMILAR EXPENSES |
This item consists of the following:
| 2017 | 2016 | 2015 | ||||||||||
| S/(000) | S/(000) | S/(000) | ||||||||||
| Interest and similar income | ||||||||||||
| Interest on loans | 9,546,454 | 9,479,867 | 8,706,372 | |||||||||
| Interest on available-for-sale investments | 951,981 | 828,004 | 716,786 | |||||||||
| Interest on held-to-maturity investments | 234,380 | 190,466 | 136,579 | |||||||||
| Interest on trading securities | 113,484 | 86,568 | 68,538 | |||||||||
| Interest on due from banks | 88,359 | 48,626 | 32,818 | |||||||||
| Dividends received | 52,906 | 51,831 | 55,594 | |||||||||
| Other interest and similar income | 43,119 | 87,693 | 67,402 | |||||||||
| Total | 11,030,683 | 10,773,055 | 9,784,089 | |||||||||
| Interest and similar expense | ||||||||||||
| Interest on deposits and obligations | (1,132,041 | ) | (1,062,751 | ) | (859,797 | ) | ||||||
| Interest on bonds and notes issued | (835,255 | ) | (805,351 | ) | (753,174 | ) | ||||||
| Interest on due to banks and correspondents | (763,436 | ) | (822,514 | ) | (758,396 | ) | ||||||
| Other interest and similar expense | (228,464 | ) | (224,098 | ) | (155,766 | ) | ||||||
| Total | (2,959,196 | ) | (2,914,714 | ) | (2,527,133 | ) | ||||||
| 22 | COMMISSIONS AND FEES |
This item consists of the following:
| 2017 | 2016 | 2015 | ||||||||||
| S/(000) | S/(000) | S/(000) | ||||||||||
| Maintenance of accounts, transfers and credit and debit card services | 1,251,935 | 1,146,082 | 1,128,067 | |||||||||
| Funds management | 505,215 | 467,558 | 476,277 | |||||||||
| Contingent loans and foreign trade fees | 279,211 | 260,704 | 214,501 | |||||||||
| Collection services | 235,369 | 331,885 | 344,375 | |||||||||
| Commissions for banking services | 290,855 | 202,863 | 215,478 | |||||||||
| Brokerage, securities and custody services | 142,288 | 166,581 | 70,437 | |||||||||
| Others | 206,535 | 195,888 | 195,056 | |||||||||
| Total | 2,911,408 |
2,771,561 |
2,644,191 |
|||||||||
F- 90
| 23 | NET PREMIUMS EARNED |
This item consists of the following:
| Gross premiums (*) |
Premiums ceded
to reinsurers, net (**) |
Assumed from
other companies, net |
Net premiums
earned |
Percentage of
assumed net premiums |
||||||||||||||||
| S/(000) | S/(000) | S/(000) | S/(000) | % | ||||||||||||||||
| 2017 | ||||||||||||||||||||
| Life insurance | 949,515 | (108,378 | ) | – | 841,137 | – | ||||||||||||||
| Health insurance | 434,808 | (13,568 | ) | – | 421,240 | – | ||||||||||||||
| General insurance | 920,595 | (377,857 | ) | 3,225 | 545,963 | 0.59 | ||||||||||||||
| Total | 2,304,918 | (499,803 | ) | 3,225 | 1,808,340 | 0.18 | ||||||||||||||
| 2016 | ||||||||||||||||||||
| Life insurance | 876,315 | (37,725 | ) | – | 838,590 | – | ||||||||||||||
| Health insurance | 415,152 | (10,011 | ) | 188 | 405,329 | 0.05 | ||||||||||||||
| General insurance | 1,005,426 | (455,850 | ) | 5,620 | 555,196 | 1.01 | ||||||||||||||
| Total | 2,296,893 | (503,586 | ) | 5,808 | 1,799,115 | 0.32 | ||||||||||||||
| 2015 | ||||||||||||||||||||
| Life insurance | 857,576 | (36,971 | ) | – | 820,605 | – | ||||||||||||||
| Health insurance | 388,002 | (9,186 | ) | 700 | 379,516 | 0.18 | ||||||||||||||
| General insurance | 948,177 | (423,955 | ) | 9,635 | 533,857 | 1.80 | ||||||||||||||
| Total | 2,193,755 | (470,112 | ) | 10,335 | 1,733,978 | 0.60 | ||||||||||||||
| (*) | Includes the annual variation of the unearned premiums and other technical reserves. |
F- 91
| (**) | “Premiums ceded to reinsurers, net” include: |
| 2017 | 2016 | 2015 | ||||||||||
| S/(000) | S/(000) | S/(000) | ||||||||||
| Premiums ceded for automatic contracts (mainly excess of loss), Note 9(b) | (257,617 | ) | (201,892 | ) | (145,618 | ) | ||||||
| Premiums ceded for facultative contracts, Note 9(b) | (263,378 | ) | (292,555 | ) | (331,329 | ) | ||||||
| Annual variation for unearned premiums ceded reserves, Note 9(b) | 21,192 | (9,139 | ) | 6,835 | ||||||||
| (499,803 | ) | (503,586 | ) | (470,112 | ) | |||||||
| b) | Gross premiums earned by insurance type and their participation in total gross premiums are described below: |
| 2017 | 2016 | 2015 | ||||||||||||||||||||||
| S/(000) | % | S/(000) | % | S/(000) | % | |||||||||||||||||||
| Life insurance (i) | 949,515 | 41.20 | 876,315 | 38.16 | 857,576 | 39.09 | ||||||||||||||||||
| Health insurance (ii) | 434,808 | 18.86 | 415,152 | 18.07 | 388,002 | 17.69 | ||||||||||||||||||
| General insurance (iii) | 920,595 | 39.94 | 1,005,426 | 43.77 | 948,177 | 43.22 | ||||||||||||||||||
| Total | 2,304,918 | 100.00 | 2,296,893 | 100.00 | 2,193,755 | 100.00 | ||||||||||||||||||
F- 92
| (i) | The breakdown of life insurance gross premiums earned is as follows: |
| 2017 | 2016 | 2015 | ||||||||||||||||||||||
| S/(000) | % | S/(000) | % | S/(000) | % | |||||||||||||||||||
| Credit life | 436,443 | 45.96 | 366,623 | 41.83 | 343,643 | 40.07 | ||||||||||||||||||
| Group life | 117,580 | 12.38 | 118,634 | 13.54 | 187,857 | 21.91 | ||||||||||||||||||
| Disability and survival (*) | 237,559 | 25.02 | 214,310 | 24.46 | 116,251 | 13.56 | ||||||||||||||||||
| Annuities | 26,093 | 2.75 | 28,799 | 3.29 | 16,853 | 1.96 | ||||||||||||||||||
| Individual life and personal accidents | 131,840 | 13.89 | 147,949 | 16.88 | 192,972 | 22.50 | ||||||||||||||||||
| Total life insurance gross premiums | 949,515 | 100.00 | 876,315 | 100.00 | 857,576 | 100.00 | ||||||||||||||||||
| (*) | This item includes Complementary Work Risk Insurance (“SCTR” from its Spanish acronym). |
| (ii) | Health insurance gross premium includes medical assistance which amounts to S/386.3 million at December 31, 2017, (S/371.2 and S/348.8 at December 31, 2016 and 2015, respectively) and represents 88.83 percent of this line of business at 2017 (89.42 and 89.9 percent at 2016 and 2015, respectively). |
F- 93
| (iii) | General insurance gross premiums consists of the following: |
| 2017 | 2016 | 2015 | ||||||||||||||||||||||
| S/(000) | % | S/(000) | % | S/(000) | % | |||||||||||||||||||
| Automobile | 308,910 | 33.56 | 335,790 | 33.39 | 319,130 | 33.66 | ||||||||||||||||||
| Fire and allied lines | 241,498 | 26.23 | 274,206 | 27.27 | 212,197 | 22.38 | ||||||||||||||||||
| Theft and robbery | 81,699 | 8.87 | 79,588 | 7.92 | 73,305 | 7.73 | ||||||||||||||||||
| Technical lines (*) | 62,724 | 6.81 | 70,640 | 7.03 | 74,182 | 7.82 | ||||||||||||||||||
| Transport | 46,534 | 5.05 | 51,697 | 5.14 | 61,424 | 6.48 | ||||||||||||||||||
| Third party liability | 44,536 | 4.84 | 42,968 | 4.27 | 41,815 | 4.41 | ||||||||||||||||||
| Marine Hull | 27,317 | 2.97 | 27,954 | 2.78 | 21,851 | 2.30 | ||||||||||||||||||
| Aviation | 25,185 | 2.74 | 55,149 | 5.49 | 64,380 | 6.79 | ||||||||||||||||||
| SOAT (Mandatory automobile line) | 24,573 | 2.67 | 20,830 | 2.07 | 23,608 | 2.49 | ||||||||||||||||||
| Others | 57,619 | 6.26 | 46,604 | 4.64 | 56,285 | 5.94 | ||||||||||||||||||
| Total life insurance gross premiums | 920,595 | 100.00 | 1,005,426 | 100.00 | 948,177 | 100.00 | ||||||||||||||||||
| (*) | Technical lines include Contractor’s All Risk (CAR), Machinery breakdown, All Risk (EAR), Electronic equipment (EE), All Risk Contractor’s Equipment (ARCE). |
F- 94
| 24 | NET CLAIMS INCURRED FOR LIFE, GENERAL AND HEALTH INSURANCE CONTRACTS |
This item consists of the following:
| 2017 | ||||||||||||||||
|
Life
insurance |
General
insurance |
Health
insurance |
Total | |||||||||||||
| S/(000) | S/(000) | S/(000) | S/(000) | |||||||||||||
| Gross claims, Note 15(b) | 646,026 | 661,108 | 294,557 | 1,601,691 | ||||||||||||
| Ceded claims, Note 9(b) | (79,845 | ) | (391,263 | ) | (12,279 | ) | (483,387 | ) | ||||||||
| Net insurance claims | 566,181 | 269,845 | 282,278 | 1,118,304 | ||||||||||||
| 2016 | ||||||||||||||||
|
Life
insurance |
General
insurance |
Health
insurance |
Total | |||||||||||||
| S/(000) | S/(000) | S/(000) | S/(000) | |||||||||||||
| Gross claims, Note 15(b) | 618,274 | 351,227 | 274,902 | 1,244,403 | ||||||||||||
| Ceded claims, Note 9(b) | (28,128 | ) | (106,450 | ) | (10,920 | ) | (145,498 | ) | ||||||||
| Net insurance claims | 590,146 | 244,777 | 263,982 | 1,098,905 | ||||||||||||
| 2015 | ||||||||||||||||
|
Life
insurance |
General
insurance |
Health
insurance |
Total | |||||||||||||
| S/(000) | S/(000) | S/(000) | S/(000) | |||||||||||||
| Gross claims | 546,645 | 341,470 | 263,438 | 1,151,553 | ||||||||||||
| Ceded claims, Note 9(b) | (26,490 | ) | (85,109 | ) | (8,295 | ) | (119,894 | ) | ||||||||
| Net insurance claims | 520,155 | 256,361 | 255,143 | 1,031,659 | ||||||||||||
| 25 | SALARIES AND EMPLOYEES BENEFITS |
This item consists of the following:
| 2017 | 2016 | 2015 | ||||||||||
| S/(000) | S/(000) | S/(000) | ||||||||||
| Salaries | 1,662,327 | 1,622,065 | 1,594,538 | |||||||||
| Vacations, medical assistance and others | 361,511 | 316,345 | 309,096 | |||||||||
| Bonuses | 237,192 | 233,163 | 221,654 | |||||||||
| Workers’ profit sharing | 220,967 | 194,851 | 230,701 | |||||||||
| Social security | 205,714 | 172,090 | 172,909 | |||||||||
| Additional Participation | 188,870 | 200,120 | 160,336 | |||||||||
| Severance indemnities | 132,396 | 130,179 | 123,552 | |||||||||
| Share-based payment plans | 62,043 | 73,930 | 65,532 | |||||||||
| Total | 3,071,020 | 2,942,743 | 2,878,318 | |||||||||
F- 95
| 26 | ADMINISTRATIVE EXPENSES |
This item consists of the following:
| 2017 | 2016 | 2015 | ||||||||||
| S/(000) | S/(000) | S/(000) | ||||||||||
| Repair and maintenance | 414,784 | 423,219 | 387,222 | |||||||||
| Publicity | 304,119 | 300,401 | 273,881 | |||||||||
| Taxes and contributions | 259,523 | 270,932 | 249,474 | |||||||||
| Rental | 230,257 | 226,301 | 214,012 | |||||||||
| Consulting and professional fees | 206,224 | 183,751 | 177,145 | |||||||||
| Transport and communications | 176,273 | 188,444 | 195,118 | |||||||||
| Sundry supplies | 49,935 | 45,878 | 46,027 | |||||||||
| Others (*) | 517,708 | 455,752 | 452,923 | |||||||||
| Total | 2,158,823 | 2,094,678 | 1,995,802 | |||||||||
| (*) | The balance is made up mainly of security and protection, cleaning service, representation expenses, light and water, insurance expenses, subscription expenses, Agentes BCP commission expenses. |
| 27 | OTHER INCOME AND EXPENSES |
This item consists of the following:
| 2017 | 2016 | 2015 | ||||||||||
| S/(000) | S/(000) | S/(000) | ||||||||||
| Other income | ||||||||||||
| Income from premiums comissions and technical insurance income | 127,729 | 136,919 | 133,828 | |||||||||
| Rental income | 43,118 | 37,324 | 26,357 | |||||||||
| Recoveries of other accounts receivable and other assets | 14,824 | 4,660 | 1,481 | |||||||||
| Net gain from sale of seized and recovered assets | 2,494 | 1,377 | 4,195 | |||||||||
| Others (*) | 208,518 | 164,180 | 159,805 | |||||||||
| Total other income | 396,683 | 344,460 | 325,666 | |||||||||
| Other expenses | ||||||||||||
| Commissions from insurance activities | 277,878 | 272,949 | 231,521 | |||||||||
| Sundry technical insurance expenses | 119,355 | 102,670 | 95,857 | |||||||||
| Losses due to operational risk | 55,477 | 37,407 | 21,439 | |||||||||
| Expenses on improvements in building for rent | 42,083 | 43,775 | 45,266 | |||||||||
| Provision for sundry risks, Note 12(d) | 29,023 | 28,093 | 38,248 | |||||||||
| Provision for other accounts receivable | 19,316 | 8,239 | 12,516 | |||||||||
| Administrative and tax penalties | 8,387 | 16,374 | 5,581 | |||||||||
| Put option write on non-controlling interests | – | 11,890 | 8,972 | |||||||||
| Loss from sale adjudicated assets | – | 1,426 | 783 | |||||||||
| Others | 84,028 | 86,252 | 74,189 | |||||||||
| Total other expenses | 635,547 | 609,075 | 534,372 | |||||||||
F- 96
| (*) | The balance mainly comprises property sales, liquidation for sale of shares of Credicorp, penalty for breach of contract, commissions for recovery in civil and judicial lawsuits of Personal Credits and Credit Card products; also, collection of commission for relocation, vehicle taxes, municipal property taxes, fines and penalties to clients related to the Leasing product. |
| 28 | EARNINGS PER SHARE |
The net earnings per ordinary share were determined based on the net income attributable to equity holders of the Group as follows:
| 2017 | 2016 | 2015 | ||||||||||
| S/000 | S/000 | S/000 | ||||||||||
| Net income attributable to equity holders of Credicorp (in thousands of soles) | 4,091,753 | 3,514,582 | 3,092,303 | |||||||||
| Number of stock | ||||||||||||
| Ordinary stock, Note 17(a) | 94,382,317 | 94,382,317 | 94,382,317 | |||||||||
| Less – beginning balance of treasury stock | (14,915,537 | ) | (14,903,833 | ) | (14,894,664 | ) | ||||||
| Acquisition of treasury stock, net | 3,088 | (8,778 | ) | (6,877 | ) | |||||||
| Weighted average number of ordinary shares for basic earnings | 79,469,868 | 79,469,706 | 79,480,776 | |||||||||
| Plus - dilution effect - stock awards | 220,296 | 143,903 | 128,373 | |||||||||
| Weighted average number of ordinary shares adjusted for the effect of dilution | 79,690,164 | 79,613,609 | 79,609,149 | |||||||||
| Basic earnings per share (in soles) | 51.49 | 44.23 | 38.91 | |||||||||
| Diluted earnings per share (in soles) | 51.35 | 44.15 | 38.84 | |||||||||
| 29 | OPERATING SEGMENTS |
For management purposes, the Group is organized into four reportable segments based on products and services as follows:
Banking -
Principally handling loans, credit facilities, deposits and current accounts.
Insurance -
Principally comprising the issue of insurance policies to cover losses in commercial property, transportation, marine vessels, automobile, life, health and pension funds.
Pension funds -
Providing services of private pension fund management to affiliated pensioners.
Investment banking -
Provide investment brokerage and management to a broad and diverse clientele, including corporations, institutional investors, governments and foundations. Also the structuring, and placement of issues in the primary market, as well as the execution and negotiation of operations in the secondary market. Additionally, it structures securitization processes for companies and manages mutual funds.
F- 97
The Group monitors the operating results of its business units separately for the purpose of making decisions about resource allocation and performance assessment. Segment performance is evaluated based on operating profit or loss and is measured consistently with operating profit or loss in the consolidated financial statements.
Transfer prices used between operating segments are on an arm’s length basis in a manner similar to transactions with third parties.
No revenue from transactions with a single external customer or counterparty amounted to 10 percent or more of the Group’s total revenue in the years 2017, 2016 and 2015.
F- 98
| (i) | The table below shows (in millions of soles) a breakdown of the Group’s total income, operating income and non-current assets; classified by location of customers and assets, respectively for the years ended December 31, 2017, 2016 and 2015: |
| 2017 |
Total
income (*) |
Operating
income (**) |
Allowance
for
loan losses, net of recoveries |
Depreciation
and amortization |
Impairment
of
available for sale assets |
Income
before
income tax |
Income tax | Net profit |
Capital
expenditures intangibles and goodwill |
Total
assets |
Total
liabilities |
|||||||||||||||||||||||||||||||||
| Banking | 14,071 | 8,154 | (1,789 | ) | (326 | ) | (8 | ) | 4,886 | (1,266 | ) | 3,620 | 339 | 145,999 | 128,324 | |||||||||||||||||||||||||||||
| Insurance | 2,474 | 619 | – | (49 | ) | – | 353 | (28 | ) | 325 | 59 | 10,988 | 8,409 | |||||||||||||||||||||||||||||||
| Pension funds | 392 | 1 | – | (23 | ) | – | 206 | (66 | ) | 140 | 10 | 798 | 243 | |||||||||||||||||||||||||||||||
| Investment banking | 791 | (12 | ) | – | (22 | ) | 7 | 130 | (33 | ) | 97 | 8 | 12,687 | 11,243 | ||||||||||||||||||||||||||||||
| Total consolidated | 17,728 | 8,762 | (1,789 | ) | (420 | ) | (1 | ) | 5,575 | (1,393 | ) | 4,182 | 416 | 170,472 | 148,219 | |||||||||||||||||||||||||||||
| 2016 |
Total
income (*) |
Operating
income (**) |
Allowance
for
loan losses, net of recoveries |
Depreciation
and amortization |
Impairment
of
available for sale assets |
Income
before
income tax |
Income tax | Net profit |
Capital
expenditures intangibles and goodwill |
Total
assets |
Total
liabilities |
|||||||||||||||||||||||||||||||||
| Banking | 13,059 | 7,890 | (1,785 | ) | (319 | ) | (16 | ) | 4,175 | (1,127 | ) | 3,048 | 326 | 142,775 | 125,998 | |||||||||||||||||||||||||||||
| Insurance | 2,577 | 666 | – | (45 | ) | 1 | 355 | (51 | ) | 304 | 44 | 9,789 | 7,646 | |||||||||||||||||||||||||||||||
| Pension funds | 411 | 1 | – | (21 | ) | – | 225 | (70 | ) | 155 | 8 | 757 | 245 | |||||||||||||||||||||||||||||||
| Investment banking | 712 | 2 | – | (22 | ) | 1 | 136 | (33 | ) | 103 | 9 | 3,114 | 2,430 | |||||||||||||||||||||||||||||||
| Total consolidated | 16,759 | 8,559 | (1,785 | ) | (407 | ) | (14 | ) | 4,891 | (1,281 | ) | 3,610 | 387 | 156,435 | 136,319 | |||||||||||||||||||||||||||||
| 2015 |
Total
income (*) |
Operating
income (**) |
Allowance
for
loan losses, net of recoveries |
Depreciation
and amortization |
Impairment
of
available for sale assets |
Income
before
income tax |
Income tax | Net profit |
Capital
expenditures intangibles and goodwill |
Total
assets |
Total
liabilities |
|||||||||||||||||||||||||||||||||
| Banking | 12,395 | 7,328 | (1,881 | ) | (232 | ) | (57 | ) | 3,692 | (1,032 | ) | 2,659 | 272 | 142,963 | 129,189 | |||||||||||||||||||||||||||||
| Insurance | 2,439 | 630 | – | (42 | ) | 13 | 424 | (74 | ) | 350 | 144 | 9,059 | 7,270 | |||||||||||||||||||||||||||||||
| Pension funds | 403 | (1 | ) | – | (19 | ) | – | 228 | (66 | ) | 162 | 2 | 766 | 247 | ||||||||||||||||||||||||||||||
| Investment banking | 528 | 2 | – | (103 | ) | – | 17 | (25 | ) | (8 | ) | 7 | 2,692 | 2,047 | ||||||||||||||||||||||||||||||
| Total consolidated | 15,765 | 7,959 | (1,881 | ) | (396 | ) | (44 | ) | 4,361 | (1,197 | ) | 3,163 | 425 | 155,480 | 138,753 | |||||||||||||||||||||||||||||
F- 99
| (ii) | The following table presents (in millions of soles) the distribution of the external revenue, operating revenue and non-current assets of the Group; all assigned based on the location of the clients and assets, respectively, at December 31, 2017, 2016 and 2015: |
| At December 31, 2017 | At December 31, 2016 | At December 31, 2015 | ||||||||||||||||||||||||||||||||||||||||||||||
|
Total
income (*) |
Operating
income (**) |
Total
non
current assets (***) |
Total
liabilities |
Total
income (*) |
Operating
income (**) |
Total
non
current assets (***) |
Total
liabilities |
Total
income (*) |
Operating
income (**) |
Total
non
current assets (***) |
Total
liabilities |
|||||||||||||||||||||||||||||||||||||
| Perú | 11,668 | 8,199 | 2,976 | 130,953 | 11,388 | 8,051 | 2,994 | 119,813 | 10,907 | 7,533 | 3,070 | 121,870 | ||||||||||||||||||||||||||||||||||||
| Panama | 4,274 | 37 | 121 | 933 | 3,791 | 27 | 124 | 1,254 | 3,491 | 23 | 104 | 2,233 | ||||||||||||||||||||||||||||||||||||
| Cayman Islands | 512 | 183 | 5 | 5,250 | 466 | 147 | 5 | 5,695 | 490 | 129 | 5 | 5,940 | ||||||||||||||||||||||||||||||||||||
| Bolivia | 813 | 338 | 102 | 8,490 | 682 | 321 | 79 | 7,246 | 507 | 267 | 79 | 6,672 | ||||||||||||||||||||||||||||||||||||
| Colombia | 286 | 10 | 145 | 1,573 | 264 | 17 | 172 | 1,396 | 233 | 12 | 172 | 1,500 | ||||||||||||||||||||||||||||||||||||
| United States of America | 8 | – | – | 2 | 8 | – | – | 2 | 5 | – | – | 3 | ||||||||||||||||||||||||||||||||||||
| Chile | 167 | (5 | ) | 139 | 1,018 | 160 | (4 | ) | 138 | 913 | 132 | (5 | ) | 142 | 535 | |||||||||||||||||||||||||||||||||
| Total Consolidated total | 17,728 | 8,762 | 3,488 | 148,219 | 16,759 | 8,559 | 3,512 | 136,319 | 15,765 | 7,959 | 3,572 | 138,753 | ||||||||||||||||||||||||||||||||||||
| (*) | Including total interest and similar income, other income and net premiums earned from insurance activities. |
| (**) | Operating income includes the net interest income from banking activities and the amount of the net premiums earned, less insurance claims. |
| (***) | Non-current assets consist of property, furniture and equipment, intangible assets, and goodwill, net. |
F- 100
| 30 | TRANSACTIONS WITH RELATED PARTIES |
| a) | The Group’s consolidated financial statements at December 31, 2017 and 2016 include transactions with related companies, the Board of Directors, the Group’s key executives (defined as the Management of Credicorp) and the companies which are controlled by these individuals through their majority shareholding or their role as Chairman or CEO. |
| b) | The table below shows the main transactions with related parties as of December 31, 2017 and 2016: |
| 2017 | 2016 | |||||||
| S/000 | S/000 | |||||||
| Statement of financial situation - | ||||||||
| Direct loans | 1,468,211 | 1,181,648 | ||||||
| Available-for-sale investments and trading securities | 715,490 | 433,517 | ||||||
| Deposits | (1,022,462 | ) | (264,564 | ) | ||||
| Trading derivatives | (2,674 | ) | 1,074 | |||||
| Statement of income | ||||||||
| Interest income related to loans – income | 23,992 | 28,872 | ||||||
| Interest expenses related to deposits – expense | (8,342 | ) | (8,001 | ) | ||||
| Other income | 7,247 | 9,098 | ||||||
| Off balance sheet | ||||||||
| Indirect loans | 385,360 | 236,106 | ||||||
| c) | All transactions with related parties are made in accordance with normal market conditions available to other customers. At December 31, 2017, direct loans to related companies are secured by collaterals, had maturities between January 2018 and July 2028 at an annual average interest rate of 6.01 percent (at December 31, 2016 they had maturities between January 2017 and September 2026 and bore an annual average interest rate of 7.15 percent). Also, at December 31, 2017 and 2016, the Group maintains an allowance for loan losses to related parties amounting to S/7.2 million and S/6.4 million, respectively. |
| d) | At December 31, 2017 and 2016, directors, officers and employees of the Group have been involved, directly and indirectly, in credit transactions with certain subsidiaries of the Group, as permitted by Peruvian Banking and Insurance Law Nº26702, which regulates and limits certain transactions with employees, directors and officers of a bank or an insurance company. At December 31, 2017 and 2016, direct loans to employees, directors, key management and family members amounted to S/957.2 million and S/1,015.9 million, respectively; they are repaid monthly and earn interest at market rates. |
| e) | The Group’s key executives’ compensation (including the related income taxes assumed by the Group) as of December 31, 2017, 2016 and 2015 was as follows: |
| 2017 | 2016 | 2015 | ||||||||||
| S/000 | S/000 | S/000 | ||||||||||
| Remunerations | 41,211 | 43,177 | 37,255 | |||||||||
| Director’s fees | 7,105 | 7,351 | 6,692 | |||||||||
| Total | 48,316 | 50,528 | 43,947 | |||||||||
F- 101
Additionally, approximately S/32.1 million of stock awards vested at December 31, 2017 (S/30.1 million and S/22.3 million at December 31, 2016 and 2015, respectively). The related income tax is assumed by the Group.
| f) | At December 31, 2017 and 2016 the Group holds interests in various mutual funds and hedge funds managed by certain of the Group’s Subsidiaries; those interests are classified as trading securities or available-for-sale investments. |
The details of the mutual funds classified as available-for-sale are presented below:
| 2017 | 2016 | |||||||
| S/000 | S/000 | |||||||
| Held-for-trading and available-for-sale investments | ||||||||
| Mutual funds – Soles | 125,056 | 2,741 | ||||||
| Mutual funds – Bolivianos | 77,804 | 88,838 | ||||||
| Mutual funds – U.S. Dollars | 40,588 | 38,436 | ||||||
| Mutual funds – Colombian pesos | 21,525 | 1,747 | ||||||
| Mutual funds – Chilean pesos | 14,267 | 13,501 | ||||||
|
Total |
279,240 | 145,263 | ||||||
| Restricted Mutual Funds | 416,696 | 368,418 | ||||||
F- 102
| 31 | FINANCIAL INSTRUMENTS CLASSIFICATION |
The table below shows the carrying amounts of the financial assets and liabilities captions in the consolidated statement of financial position, by categories as defined under IAS 39:
| At December 31, 2017 | At December 31, 2016 | |||||||||||||||||||||||||||||||||||||||||||||||||||||||
|
Financial assets and
liabilities measured at fair value |
Financial assets and
liabilities measured at fair value |
|||||||||||||||||||||||||||||||||||||||||||||||||||||||
|
Held
for
trading or hedging |
Designated
at inception |
Loans
and
receivables |
Investments
available for-sale |
Investments
held-to- maturity |
Liabilities
at
amortized cost |
Total |
Held
for
trading or hedging |
Designated
at inception |
Loans
and
receivables |
Investments
available for-sale |
Investments
held-to- maturity |
Liabilities
at
amortized cost |
Total | |||||||||||||||||||||||||||||||||||||||||||
| S/(000) | S/(000) | S/(000) | S/(000) | S/(000) | S/(000) | S/(000) | S/(000) | S/(000) | S/(000) | S/(000) | S/(000) | S/(000) | S/(000) | |||||||||||||||||||||||||||||||||||||||||||
| Assets | ||||||||||||||||||||||||||||||||||||||||||||||||||||||||
| Cash and due from banks | – | – | 23,221,987 | – | – | – | 23,221,987 | – | – | 16,645,769 | – | – | – | 16,645,769 | ||||||||||||||||||||||||||||||||||||||||||
| Cash collateral, reverse repurchase agreements and securities borrowings | – | – | 7,480,420 | – | – | – | 7,480,420 | – | – | 10,919,624 | – | – | – | 10,919,624 | ||||||||||||||||||||||||||||||||||||||||||
| Trading securities | 4,024,737 | – | – | – | – | – | 4,024,737 | 4,015,019 | – | – | – | – | – | 4,015,019 | ||||||||||||||||||||||||||||||||||||||||||
| Available-for-sale investments | – | – | – | 24,423,891 | – | – | 24,423,891 | – | – | – | 18,685,667 | – | – | 18,685,667 | ||||||||||||||||||||||||||||||||||||||||||
| Held-to-maturity Investments | – | – | – | – | 4,413,373 | – | 4,413,373 | – | – | – | – | 5,118,420 | – | 5,118,420 | ||||||||||||||||||||||||||||||||||||||||||
| Loans, net | – | – | 95,977,277 | – | – | – | 95,977,277 | – | – | 90,561,768 | – | – | – | 90,561,768 | ||||||||||||||||||||||||||||||||||||||||||
|
Financial assets designated at fair value
through profit or loss |
– | 537,685 | – | – | – | – | 537,685 | – | 459,099 | – | – | – | – | 459,099 | ||||||||||||||||||||||||||||||||||||||||||
| Premiums and other policies receivable | – | – | 656,829 | – | – | – | 656,829 | – | – | 643,224 | – | – | – | 643,224 | ||||||||||||||||||||||||||||||||||||||||||
|
Accounts receivable from reinsurers and
coinsurers |
– | – | 715,695 | – | – | – | 715,695 | – | – | 454,187 | – | – | – | 454,187 | ||||||||||||||||||||||||||||||||||||||||||
| Due from customers on acceptances | – | – | 532,034 | – | – | – | 532,034 | – | – | 491,139 | – | – | – | 491,139 | ||||||||||||||||||||||||||||||||||||||||||
| Other assets, Note 12 | 701,826 | – | 1,759,125 | – | – | – | 2,460,951 | 942,602 | – | 1,286,082 | – | – | – | 2,228,684 | ||||||||||||||||||||||||||||||||||||||||||
| 4,726,563 | 537,685 | 130,343,367 | 24,423,891 | 4,413,373 | – | 164,444,879 | 4,957,621 | 459,099 | 121,001,793 | 18,685,667 | 5,118,420 | – | 150,222,600 | |||||||||||||||||||||||||||||||||||||||||||
| Liabilities | ||||||||||||||||||||||||||||||||||||||||||||||||||||||||
| Deposits and obligations | – | – | – | – | – | 97,170,411 | 97,170,411 | – | – | – | – | – | 85,916,387 | 85,916,387 | ||||||||||||||||||||||||||||||||||||||||||
| Payables from repurchase agreements and security lendings | – | – | – | – | – | 13,415,843 | 13,415,843 | – | – | – | – | – | 15,127,999 | 15,127,999 | ||||||||||||||||||||||||||||||||||||||||||
| Due to banks and correspondents | – | – | – | – | – | 7,996,889 | 7,996,889 | – | – | – | – | – | 7,493,916 | 7,493,916 | ||||||||||||||||||||||||||||||||||||||||||
| Banker’s acceptances outstanding | – | – | – | – | – | 532,034 | 532,034 | – | – | – | – | – | 491,139 | 491,139 | ||||||||||||||||||||||||||||||||||||||||||
| Financial liabilities at fair value through profit or loss | 168,089 | – | – | – | – | – | 168,089 | 209,520 | – | – | – | – | – | 209,520 | ||||||||||||||||||||||||||||||||||||||||||
| Accounts payable to reinsurers and coinsurers | – | – | – | – | – | 235,185 | 235,185 | – | – | – | – | – | 233,892 | 233,892 | ||||||||||||||||||||||||||||||||||||||||||
| Bonds and Notes issued | 7,986,539 | – | – | – | – | 8,255,718 | 16,242,257 | 8,412,515 | – | – | – | – | 7,527,088 | 15,939,603 | ||||||||||||||||||||||||||||||||||||||||||
| Other liabilities, Note 12 | 636,762 | – | – | – | – | 3,236,251 | 3,873,013 | 673,015 | – | – | – | – | 2,540,980 | 3,213,995 | ||||||||||||||||||||||||||||||||||||||||||
| 8,791,390 | – | – | – | – | 130,842,331 | 139,633,721 | 9,295,050 | – | – | – | – | 119,331,401 | 128,626,451 | |||||||||||||||||||||||||||||||||||||||||||
F- 103
| 32 | FINANCIAL RISK MANAGEMENT |
The Group’s activities involve principally the use of financial instruments, including derivatives. The Group accepts deposits from customers at both fixed and floating rates, for various periods, and invests these funds in high-quality assets. Additionally, it places these deposits at fixed and variable rates with legal entities and individuals, considering the finance costs and expected profitability.
The Group also trades in financial instruments where it takes positions in traded and over-the-counter instruments, including derivatives, to take advantage of market movements in equities, bonds, currencies and interest rates.
Given the Group’s activities, it has a framework for risk appetite, a corner stone of our management. Our risk management processes involve continuous identification, measurement and monitoring. The Group is exposed, principally, to operating risk, credit risk, liquidity risk and market risk, strategic risk and insurance technical risk. Finally, we report on a consolidated basis the risks to which the Group is exposed.
| a) | Risk management structure - |
The Board of Directors of the Group and of each subsidiary is ultimately responsible for identifying and controlling risks; however, there are separate independent instances in the major subsidiaries responsible for managing and monitoring risks, as further explained below:
| (i) | Board of Directors Credicorp - |
The Board of Directors is responsible for the overall risk management approach and for the approval of the levels of risk appetite that the Group is prepared to assume. Furthermore, it approves the guidelines and policies for Integral Risk Management. On the other hand, the Board establishes an organizational culture which emphasizes the importance of risk management, oversees the internal control system and ensures the adequate performance of the compliance function.
Board of Group Companies –
The Board of each of the Group companies is responsible for aligning the risk management established by the Board of Credicorp with the context of each one of them. For that, it establishes a framework for risk appetite, policies and guidelines.
| (ii) | Risk Committee - |
It represents the Board of Credicorp in risk management decision-making. This Committee defines the strategies used for the adequate management of the different types of risks and the supervision of risk appetite. In addition to establishing principles, policies and general limits.
The Risk Committee is presided by a Board member of Credicorp, it is also consists of a second member of the Board of Credicorp, a Board member of BCP, the General Manager of BCP, the Central Manager of Planning and Finance of BCP, the Central Risk Manager of BCP and the Manager of Risk Management of BCP CFO.
In addition to effectively managing all the risks, the Risk Committee is supported by the following committees which report on a monthly basis all relevant changes or issues relating to the risks being managed:
F- 104
Credit Risk Committee -
The Credit Risk Committee is responsible for reviewing the tolerance level of the credit risk appetite and the limits of exposure. As well as also proposing credit risk management norms and policies within the framework of governance and the organization for the integral management of credit risk. Furthermore, it proposes the approval of any changes to the functions described above and important findings to the Risk Committee.
Treasury and ALM (Asset Liability Management) Risk Committee -
The Treasury and ALM Risk Committee is responsible for analyzing and proposing the risk appetite and exposure level of the Treasury. It also proposes the guidelines and policies for the Treasury Risk Management and ALM, within the framework of governance and organization for the integral management of market risks. Furthermore, it is responsible for proposing the approval of any changes in the functions described above and for reporting any finding to the Risk Committee.
Operational Risk Committee -
The Operational Risk Committee is responsible for reviewing the tolerance level, the appetite for operational risk and the limits of exposure. It also proposes the norms and policies for the management of operational risks and the mechanisms for the implementation of corrective actions within the governance framework. Furthermore, it proposes the approval of any changes to the functions described above and reports any finding to the Risk Committee.
| (iii) | Central Risk Management - |
The Central Risk Management is responsible for implementing policies, procedures, methodologies and actions to identify, measure, monitor, mitigate, report and control the different types of risks to which the Group is exposed. Also, it participates in the design and definition of the strategic plans of the business units to ensure that they are framed within the risk appetite metrics approved by the Group’s Board of Directors of Credicorp.
The Central Risk Management is divided into the following areas:
Credit Division -
The Credit Division is responsible for ensuring the quality of the wholesale banking portfolio in accordance with the Group’s risk strategy and appetite on the basis of an efficient management of the lending process relying on well-defined lending policies and highly trained personnel with best lending practices.
Risk Management Division -
The Risk Management Division is responsible for ensuring that policies and risk management policies established by the Board of Directors are complied with and monitored. Supervise the process of risk management and coordinate the risk response with the companies of Credicorp involved in the whole process. It also has the task of informing Senior Management regarding: global exposure and by type of risk, as well as the specific exposure of each of the Group’s companies.
The Risk Management Division consists of the following units: The Operational Risk and Insurance Risk Management Department, the Credit and Corporate Management Risk Department, Market Risk Management Department, Global Risk Management, Internal Validation and Risk Management Methodology and Modelling.
F- 105
Retail Banking Risk Division -
This division is responsible for ensuring the quality of the retail portfolio and the development of credit policies that are consistent with the overall guidelines and policies set by the Board of Credicorp.
Treasury Risk Management –
The Treasury Risk Management is responsible for planning, coordinating and monitoring the implementation of the Treasury Division with risk measurement methodologies and limits approved by the Risk Committee. Also, it is responsible for assessing the effectiveness of hedge derivatives and the valuation of investments.
| (iv) | Internal Audit Division and Compliance Division - |
The Internal Audit Division is in charge of monitoring on an ongoing basis the effectiveness of the risk management function of the Group, verifying compliance with laws and regulations, as well as the policies, objectives and guidelines set by the Board of Directors. On the other hand, it evaluates the sufficiency and level of integration of the Group’s information and database systems. Finally, it ensures that independence is maintained between the functions of the risk management and business units, for each of the Group’s companies.
The Compliance Division is responsible for ensuring applicable laws and regulations and the internal Code of Ethics are adhered to.
| b) | Risk measurement and reporting systems - |
Credicorp has independent databases that are subsequently integrated through corporate reports. These reports enable it to monitor at an aggregate and detailed level, the different types of risks to which each company is exposed. The system provides it the ability to comply with the needs for revision of the risk appetite requested by the above-mentioned committees and areas; as well as also complying with regulatory requirements.
| c) | Risk mitigation - |
Depending on the type of risk, the Group uses mitigating instruments to reduce its exposure, such as guarantees, derivatives, controls, insurance, among others. Furthermore, it has policies linked to risk appetite and established procedures for each type of risk.
The Group actively uses guarantees to reduce its credit risks.
| d) | Risk appetite - |
In the different subsidiaries of the Group, the respective Boards approve the risk appetite framework to define the maximum level of risk that the organization is willing to take in seeking to accomplish its strategic and financial objectives. This Risk Appetite framework is based on primary and secondary objectives:
Primary objectives are intended to preserve the strategic pillars of the organization, defined as solvency, liquidity, profit and growth, stability of results and balance structure.
Secondary objectives are intended to monitor on a qualitative and quantitative basis the various risks to which the Group is exposed, as well as defining a tolerance threshold of each of those risks, so the risk profile set by the Board is preserved and any risk focus is anticipated on a more granular basis.
F- 106
Risk appetite is instrumented through the following elements:
| - | Risk appetite statement: It makes explicit the general principles and the qualitative declarations which complement the Bank’s risk strategy. |
| - | Metrics scorecard: These are used to define the levels of risk exposure in the different strategic pillars. |
| - | Limits: Allows to take over the risk-taking process within the tolerance established by the Board. They also provide accountability for the risk-taking process and define guidelines regarding the target risk profile. |
| - | Government of the risk appetite process: Seeks to guarantee compliance of the framework through the different roles and responsibilities assigned to the units involved. |
| e) | Risk concentration - |
Concentrations arise when a reduced and representative number of all of the counterparties of the Group are engaged in similar business activities, or activities in the same geographic region, or have similar economic, political or other conditions.
In order to avoid excessive concentrations of risk, the policies and procedures include specific guidelines to guarantee a diversified portfolio.
| 32.1 | Credit risk - |
| a) | The Group takes on exposure to credit risk, which is the probability of suffering losses caused by debtors or counterparties failing to comply with payment obligations in on or off the balance sheet exposures. |
Credit risk is the most important risk for the Group’s business; therefore, Management carefully manages its exposure to credit risk. Credit exposures arise principally from lending activities that lead to direct loans; they also result from investment activities. There is also credit risk in off-balance sheet financial instruments, such as contingent credits (indirect loans), which expose Credicorp to similar risks to direct loans. Likewise, credit risk arises from derivative financial instruments showing positive fair values. Finally, all exposure to credit risk (direct or indirect) is mitigated by the control processes and policies.
As part of the management of this type of risk, Credicorp assigns impairment provisions for its loan portfolio at the date of the statement of financial position.
The Group defines the levels of credit risk assumed based on risk exposure limits, which are frequently monitored. Said limits are established in relation to one borrower or group of borrowers, geographical and industry segments. Furthermore, the risk limits by product, industry sector and by geographical segment are approved by the Risk Committee.
Exposure to credit risk is managed through regular analysis of the ability of debtors and potential debtors to meet interest and principal repayment obligations and by changing the credit limits when it is appropriate. Some other specific control measures are outlined below:
F- 107
| (i) | Collateral - |
The Group employs a range of policies and practices to mitigate credit risk. The most traditional of these is collaterize with guarantees part of the loan portfolio. The Group implements guidelines on the acceptability of specific classes of collateral or credit risk mitigation. The main types of collateral obtained are as follows:
| - | For loans and advances, collaterals include, among others, mortgages over residential properties; liens over business assets such as plant building, inventory and accounts receivable; and liens over financial instruments such as debt securities and equity securities. |
| - | Long-term loans and financing to corporate entities, are generally not guaranteed. Loans to micro business generally have no collateral. In order to minimize credit loss, the Group will seek additional collateral from the counterparty as soon as impairment indicators arise. |
| - | For repurchase agreements and securities lending, the collateral are represented by fixed income instruments and cash. |
Collateral held as security for financial assets other than loans is determined by the nature of the instrument. Debt securities, treasury and other eligible bills are generally unsecured, with the exception of assets backed securities and similar instruments, which are secured by portfolios of financial instruments.
Management monitors the market value of collateral, requests additional collateral in accordance with the underlying agreement, and monitors the market value of collateral obtained during its review of the adequacy of the allowance for impairment losses. It is the Group’s policy to dispose of seized assets in an orderly manner. The proceeds are used to reduce or repay the outstanding claim. In general, the Group does not use seized assets for its own business.
| (ii) | Derivatives - |
The amount subject to credit risk is limited to the current and potential fair value of instruments that are favorable to the Group (fair value is positive). In the case of derivatives this is only a small fraction of the contract, or notional values used to express the volume of instruments outstanding. This credit risk exposure is managed as part of the total credit limits with customers, together with potential exposures from market movements. Collateral or other security is not usually obtained for this type of risk exposure. With respect to derivatives agreed with non-financial customers, collaterals have been granted to secure the overall amount; with respect to financial counterparties, collaterals granted are those required under the clearing provisions issued by the International Swaps and Derivatives Association Inc. (ISDA) or the local framework agreement.
| (iii) | Credit-related commitments - |
The primary purpose of these instruments is to ensure that funds are available to a customer as required. Guarantees and letters of credit have the same credit risk as loans. Documentary and commercial letters of credit - which are written undertakings by the Group on behalf of a customer authorizing a third party to draw drafts on the Group up to a stipulated amount under specific terms and conditions - are collateralized by the underlying shipments of goods to which they relate and therefore have less risk than a direct loan. The Group has no mandatory commitments to extend credit.
F- 108
In order to manage credit risk, as part of the Group’s risk management structure, there is a Credit Risk Management Department, the major functions of which are implementing methodologies and statistical models for measuring credit risk exposures, developing and applying methodologies for the calculation of risk-ratings, both at the corporate and business unit levels, performing analysis of credit concentrations, verifying that credit exposures are within the established limits and suggesting global risk exposures by economic sector, among others.
For enhanced risk identification, the Group has internal credit scoring models, which have been prepared and implemented for the main business segments. Each model is related to a defined group of scoring bands. Clients who are inside a band are characterized by having a similar risk level (within the band); however, they are different compared to the other band. For retail clients, these scoring models are highly related to management (admission, follow-up, campaigns, etc.) from different portfolios. On the other hand, for non-retail clients, ratings mainly serve as support for making credit decisions in admission, follow-up and price allocation, etc.
The Group has a Credit Division, which establishes the overall credit policies for each of the businesses in which the Group decides to take part. These credit policies are set forth based on the guidelines established by the Board of Directors and keeping in mind the statutory financial laws and regulations. The main activities are to establish the client credit standards and guidelines (evaluation, authorization and control); follow the guidelines established by the Board of Directors and General Management, as well as those established by governmental regulatory bodies; review and authorize credit applications, up to the limit within the scope of its responsibilities and to submit to upper hierarchies those credit applications exceeding the established limits; monitor credit-granting activities within the different autonomous entities, among others.
| b) | The maximum exposure to credit risk at December 31, 2017 and 2016, before the effect of mitigation through any collateral, is the carrying amount of each class of financial assets indicated in note 32.7(a), 32.7(b) and the contingent credits detailed in note 20(a). |
The Management is confident of its ability to continue to controlling and maintaining minimal exposure of credit risk to the Group resulting from both its loan and securities portfolio.
| c) | Credit risk management for loans - |
Credit risk management is mainly based on the rating and scoring of the internal models of each of the Group companies. In Credicorp, a quantitative and qualitative analysis of each customer is carried out, its financial condition and the conditions of the market in which those customers operate; for that purpose it classifies its loan portfolio into one of five pre-defined risk categories, depending upon the degree of risk of default of each debtor.
The categories used are: (i) normal - A, (ii) potential problems - B, (iii) substandard - C, (iv) doubtful - D and (v) loss - E, which have the following characteristics:
Normal (Class A):
Debtors of commercial loans that fall into this category have complied on a timely basis with their obligations and at the time of evaluation do not present any reason for doubt with respect to repayment of interest and principal on the agreed dates, and there is no reason to believe that the status will change before the next evaluation. To place a loan in Class A, a clear understanding of the use to be made of the funds and the origin of the cash flows to be used by the debtor to repay the loan is required. Additionally, consumer and micro-business loans are categorized as Class A if payments are current or up to eight days past-due. Residential mortgage loans are classified as Class A, if payments are current or up to thirty days past-due.
F- 109
Potential problems (Class B):
Debtors of commercial loans included in this category are those that at the time of the evaluation demonstrate certain deficiencies, which, if not corrected in a timely manner, imply risks with respect to the recovery of the loan. Certain common characteristics of loans or credits in the category include: delays in loan payments which are promptly covered, a general lack of information required to analyze the credit, out-of-date financial information, temporary economic or financial imbalances on the part of the debtor which could affect its ability to repay the loan, and market conditions that could affect the economic sector in which the debtor is active. Consumer and micro-business loans are categorized as Class B if payments are between 9 and 30 days late. Residential mortgage loans are classified as Class B when payments are between 31 and 60 days late.
Substandard (Class C):
Debtors of commercial loans included in this category demonstrate serious financial weakness, often with operating results or available income insufficient to cover financial obligations on agreed upon terms, with no reasonable short-term prospects for a strengthening of their financial capacity. Debtors demonstrating the same deficiencies that warrant classification as category B warrant classification as Class C if those deficiencies are such that if they are not corrected in the near term, they could impede the recovery of principal and interest on the loan on the originally agreed terms. In addition, commercial loans are classified in this category when payments are between 61 and 120 days late. Consumer and micro-business loans are categorized as Class C if payments are between 31 and 60 days late. Residential mortgage loans are classified as Class C when payments are between 61 and 120 days late.
Doubtful (Class D):
Debtors of commercial loans included in this category present characteristics that make doubtful the recovery of the loan. Although the loan recovery is doubtful, if there is a reasonable possibility that in the near future the creditworthiness of the debtor might improve, a Class D categorization is appropriate. These credits are distinguished from Class E credits by the requirement that the debtor remains in operation, generates cash flow, and makes payments on the loan, although at a rate less than that specified in its contractual obligations. In addition, commercial loans are classified in this category when payments are between 121 and 365 days late. Consumer and micro-business loans are classified as Class D if payments are between 61 and 120 days late. Residential mortgage loans are Class D when payments are between 121 and 365 days late.
Loss (Class E):
Commercial loans which are considered unrecoverable or which for any other reason should not appear on the Group’s books as an asset based on the originally contracted terms fall into this category. In addition, commercial loans are classified in this category when payments are more than 365 days late. Consumer and micro-business loans are categorized as Class E if payments are more than 120 days late. Residential mortgage loans are classified as Class E when payments are more than 365 days late.
The Group constantly reviews the loan portfolio in order to assess the completion and accuracy of its classifications.
All loans considered impaired (the ones classified as substandard, doubtful or loss) are analyzed by the Group’s Management, which addresses impairment in two areas: individually assessed provisions and collectively assessed provisions, as follows:
| · | Individually assessed allowance - |
The methodology is applied to all of the impaired clients (classified as deficient, doubtful or loss) of Wholesale Banking and consists of estimating the loss generated by each client after deducting the present value of the future payments that he could pay and the recovery value of the guarantees, equally brought to present value.
F- 110
The methodology and assumptions used for estimating future cash flows are reviewed regularly by the Group in order to reduce any differences between loss estimates and actual loss experience.
| · | Collectively assessed allowance - |
The methodology is applied for the unimpaired clients of Wholesale Banking and for Retail Credits (Consumer Credits, Small and Medium Enterprise Credits and Mortgage Loans). Allowance requirements are assessed collectively for losses on loans and advances that are not individually significant (including consumer, micro-business and residential mortgages) and for individually significant loans and advances where there is not yet objective evidence of individual impairment (included in categories A and B).
Impairment losses are estimated by taking into consideration the following information: historical losses on the portfolio, and current economic conditions. The impairment allowance is then reviewed by Management to ensure alignment with the Group’s overall policy.
The methodology includes three estimation scenarios: base, upper threshold and lower threshold. These scenarios are generated by modifying some assumptions, such as collateral recovery values and the effects of changes in the economic environment.
The process to select the best estimate within the range is based on management´s best judgment, complemented by historical loss experience and the Company’s strategy (e.g. penetration in new segments).
Impairment losses are evaluated at each reporting date as soon as there is any objective evidence that a financial asset or group of assets is impaired.
Financial guarantees and letter of credit (indirect loans) are assessed and a provision estimated following a similar procedure as for loans.
In the case of borrowers in countries where there is an increased risk of difficulties in servicing external debt, an assessment of the political and economic situation is made, and an additional country risk provision is recorded, if necessary.
When a loan is uncollectible, it is written off against the related provision for loan impairment. Said loans are written off after all the necessary legal procedures have been completed.
The subsequent recovery of written off loans decreases the amount of the provision for loan losses, in the consolidated statement of income.
F- 111
The following is a summary of the direct credits classified into three important groups and their respective allowance for each of the types of loans:
| (i) | Loans neither past due nor impaired, comprising those direct loans having presently no delinquency characteristics and related to clients ranked as normal or potential problems; |
| (ii) | Past due but not impaired loans, comprising past due loans of clients classified as normal or with potential problems and |
| (iii) | Impaired loans, those past due loans of clients classified as substandard, doubtful or loss; |
| At December 31, 2017 | At December 31, 2016 | |||||||||||||||||||||||||||||||||||||||||||||||
|
Commercial
loans |
Residential
mortgage loans |
Micro-
business loans |
Consumer
loans |
Total | % |
Commercial
loans |
Residential
mortgage loans |
Micro-
business loans |
Consumer
loans |
Total | % | |||||||||||||||||||||||||||||||||||||
| S/(000) | S/(000) | S/(000) | S/(000) | S/(000) | S/(000) | S/(000) | S/(000) | S/(000) | S/(000) | |||||||||||||||||||||||||||||||||||||||
| Neither past due nor impaired impaired | ||||||||||||||||||||||||||||||||||||||||||||||||
| Normal | 55,043,920 | 14,003,445 | 12,048,576 | 10,685,098 | 91,781,039 | 96.34 | % | 50,984,455 | 13,052,249 | 11,292,194 | 11,105,796 | 86,434,694 | 96.15 | % | ||||||||||||||||||||||||||||||||||
| Potential problem | 1,081,497 | 61,482 | 240,063 | 104,359 | 1,487,401 | 1.56 | % | 1,367,997 | 76,585 | 182,425 | 90,498 | 1,717,505 | 1.91 | % | ||||||||||||||||||||||||||||||||||
| Past due but not impaired | ||||||||||||||||||||||||||||||||||||||||||||||||
| Normal | 714,511 | 411,309 | 341,422 | 235,324 | 1,702,566 | 1.79 | % | 329,448 | 503,168 | 274,003 | 430,932 | 1,537,551 | 1.71 | % | ||||||||||||||||||||||||||||||||||
| Potential problem | 43,041 | 110,241 | 37,861 | 27,119 | 218,262 | 0.23 | % | 38,703 | 101,805 | 40,711 | 17,014 | 198,233 | 0.22 | % | ||||||||||||||||||||||||||||||||||
| Impaired | ||||||||||||||||||||||||||||||||||||||||||||||||
| Substandard | 586,112 | 143,241 | 239,035 | 196,930 | 1,165,318 | 1.22 | % | 468,745 | 143,610 | 224,559 | 222,401 | 1,059,315 | 1.18 | % | ||||||||||||||||||||||||||||||||||
| Doubtful | 297,712 | 248,215 | 345,397 | 387,220 | 1,278,544 | 1.34 | % | 355,146 | 231,872 | 309,523 | 379,923 | 1,276,464 | 1.42 | % | ||||||||||||||||||||||||||||||||||
| Loss | 688,755 | 474,154 | 675,203 | 293,672 | 2,131,784 | 2.24 | % | 589,377 | 386,165 | 628,213 | 271,872 | 1,875,627 | 2.09 | % | ||||||||||||||||||||||||||||||||||
| Gross | 58,455,548 | 15,452,087 | 13,927,557 | 11,929,722 | 99,764,914 | 104.72 | % | 54,133,871 | 14,495,454 | 12,951,628 | 12,518,436 | 94,099,389 | 104.68 | % | ||||||||||||||||||||||||||||||||||
| Less | ||||||||||||||||||||||||||||||||||||||||||||||||
| Allowance for loan losses | 1,237,616 | 228,287 | 1,476,578 | 1,558,017 | 4,500,498 | 4.72 | % | 1,026,411 | 193,385 | 1,353,168 | 1,634,169 | 4,207,133 | 4.68 | % | ||||||||||||||||||||||||||||||||||
| Total, net | 57,217,932 | 15,223,800 | 12,450,979 | 10,371,705 | 95,264,416 | 100.00 | % | 53,107,460 | 14,302,069 | 11,598,460 | 10,884,267 | 89,892,256 | 100.00 | % | ||||||||||||||||||||||||||||||||||
In accordance with IFRS 7, the entire loan balance is considered past due when debtors have failed to make a payment when contractually due.
At December 31, 2017, the renegotiated credits amount to approximately S/915.6 million, of which S/339.6 million are classified as not past due nor impaired, S/165.3 million as past due but not impaired and S/410.7 million as impaired but not past due (S/845.0 million, S/304.5 million, S/201.2 million and S/339.3 million, respectively, at December 31, 2016).
| At December 31, 2017 | At December 31, 2016 | |||||||||||||||||||||||||||||||||||||||
|
Commercial
loans |
Residential
mortgage loans |
Micro-
business loans |
Consumer
loans |
Total |
Commercial
loans |
Residential
mortgage loans |
Micro-
business loans |
Consumer
loans |
Total | |||||||||||||||||||||||||||||||
| S/(000) | S/(000) | S/(000) | S/(000) | S/(000) | S/(000) | S/(000) | S/(000) | S/(000) | S/(000) | |||||||||||||||||||||||||||||||
| Impaired loans | 1,572,579 | 865,610 | 1,259,635 | 877,822 | 4,575,646 | 1,413,268 | 761,647 | 1,162,295 | 874,196 | 4,211,406 | ||||||||||||||||||||||||||||||
| Fair value of collateral | 1,692,544 | 734,397 | 34,702 | 118,472 | 2,580,115 | 1,542,874 | 639,186 | 69,503 | 93,232 | 2,344,795 | ||||||||||||||||||||||||||||||
| Allowance for loan losses | 835,786 | 119,945 | 1,045,694 | 468,342 | 2,469,767 | 813,844 | 116,796 | 1,018,242 | 456,047 | 2,404,929 | ||||||||||||||||||||||||||||||
F- 112
On the other hand, the breakdown of loans classified by maturity is shown below, according to the following criteria:
| (i) | Current loans comprise those loans with no current indicators of delinquency and related to customers ranked as normal and with potential problems. |
| (ii) | Loans current but impaired, comprising those direct loans with no current indicators of delinquency but related to customers ranked as substandard, doubtful or loss. |
| (iii) | Loans with delays in payment of one day or more but which are not past due under our internal policies, comprising those direct loans related to customers ranked as normal, with potential problems, substandard, doubtful or loss. |
| (iv) | Internally overdue loans that are past due under our internal policies related to customers ranked as normal, with potential problems, substandard, doubtful or loss |
| (v) | The sum of items: loans with delays in payment form first day and the internal past due loans reflect the entire amount of “past due” loans in accordance with IFRS 7. |
| As of December 31, 2017 | As of December 31, 2016 | |||||||||||||||||||||||||||||||||||||||||||||||
| Current loans |
Current
but
impaired |
Loans
with
delays in payments of one day or more but not internal overdue loans |
Internal
overdue loans |
Total |
Total
past
due under IFRS 7 |
Current
loans |
Current
but
impaired |
Loans
with
delays in payments of one day or more but not internal overdue loans |
Internal
overdue loans |
Total |
Total
past
due under IFRS 7 |
|||||||||||||||||||||||||||||||||||||
| S/(000) | S/(000) | S/(000) | S/(000) | S/(000) | S/(000) | S/(000) | S/(000) | S/(000) | S/(000) | S/(000) | S/(000) | |||||||||||||||||||||||||||||||||||||
| Neither past due nor impaired | ||||||||||||||||||||||||||||||||||||||||||||||||
| Normal | 91,781,038 | – | – | – | 91,781,038 | – | 86,434,694 | – | – | – | 86,434,694 | – | ||||||||||||||||||||||||||||||||||||
| Potential problems | 1,487,402 | – | – | – | 1,487,402 | – | 1,717,505 | – | – | – | 1,717,505 | – | ||||||||||||||||||||||||||||||||||||
| Past due but not impaired | ||||||||||||||||||||||||||||||||||||||||||||||||
| Normal | – | – | 1,662,913 | 39,653 | 1,702,566 | 1,702,566 | – | – | 1,512,321 | 25,230 | 1,537,551 | 1,537,551 | ||||||||||||||||||||||||||||||||||||
| Potential problems | – | – | 176,861 | 41,401 | 218,262 | 218,262 | – | – | 162,730 | 35,503 | 198,233 | 198,233 | ||||||||||||||||||||||||||||||||||||
| Impaired debt | ||||||||||||||||||||||||||||||||||||||||||||||||
| Substandard | – | 412,582 | 386,177 | 366,560 | 1,165,319 | 752,737 | – | 349,529 | 495,719 | 214,067 | 1,059,315 | 709,786 | ||||||||||||||||||||||||||||||||||||
| Doubtful | – | 203,952 | 393,463 | 681,128 | 1,278,543 | 1,074,591 | – | 299,196 | 294,905 | 682,363 | 1,276,464 | 977,268 | ||||||||||||||||||||||||||||||||||||
| Loss | – | 118,048 | 121,564 | 1,892,172 | 2,131,784 | 2,013,736 | – | 30,927 | 181,452 | 1,663,248 | 1,875,627 | 1,844,700 | ||||||||||||||||||||||||||||||||||||
| Total | 93,268,440 | 734,582 | 2,740,978 | 3,020,914 | 99,764,914 | 5,761,892 | 88,152,199 | 679,652 | 2,647,127 | 2,620,411 | 94,099,389 | 5,267,538 | ||||||||||||||||||||||||||||||||||||
The classification of loans by type of banking and maturity is as follows:
| As of December 31, 2017 | As of December 31, 2016 | |||||||||||||||||||||||||||||||||||||||
| Current loans |
Current
but
impaired |
Loans
with
delay in payments of one day or more but not internal overdue loans |
Internal
overdue loans |
Total |
Current
loans |
Current
but
impaired |
Loans
with
delay in payments of one day or more but not internal overdue loans |
Internal
overdue loans |
Total | |||||||||||||||||||||||||||||||
| S/(000) | S/(000) | S/(000) | S/(000) | S/(000) | S/(000) | S/(000) | S/(000) | S/(000) | S/(000) | |||||||||||||||||||||||||||||||
| Commercial loans | 56,125,417 | 211,918 | 790,739 | 1,327,475 | 58,455,548 | 51,108,503 | 230,366 | 1,317,893 | 1,477,109 | 54,133,871 | ||||||||||||||||||||||||||||||
| Residential mortgage loans | 14,064,927 | 185,853 | 693,482 | 507,825 | 15,452,087 | 13,266,248 | 193,819 | 626,045 | 409,342 | 14,495,454 | ||||||||||||||||||||||||||||||
| Micro-business loans y microempresa | 12,288,639 | 207,548 | 774,435 | 656,934 | 13,927,557 | 12,451,403 | 18,072 | 180,871 | 301,282 | 12,951,628 | ||||||||||||||||||||||||||||||
| Consumer loans | 10,789,457 | 129,262 | 482,323 | 528,680 | 11,929,722 | 11,326,045 | 237,395 | 522,318 | 432,678 | 12,518,436 | ||||||||||||||||||||||||||||||
| 93,268,440 | 734,581 | 2,740,979 | 3,020,914 | 99,764,914 | 88,152,199 | 679,652 | 2,647,127 | 2,620,411 | 94,099,389 | |||||||||||||||||||||||||||||||
F- 113
| d) | Credit risk management on reverse repurchase agreements and security borrowings - |
Most of these operations are performed by Credicorp Capital Colombia and Inversiones IMT. The Group has implemented credit limits for each counterparty and most of the transactions are collateralized with investment grade financial instruments issued by Colombian and Chilean entities and financial instruments issued by the Colombian and Chilean Governments.
| e) | Credit risk management on investments in trading securities, available-for-sale and held-to-maturity investments - |
The Group evaluates the credit risk identified of each of the financial instruments in these categories, considering the risk rating granted to them by a risk rating agency. For investments traded in Peru, the risk ratings used are those provided by the three most prestigious Peruvian rating agencies (authorized by the Peruvian government regulator) and for investments traded abroad, the risk-ratings used are those provided by the three most prestigious international rating agencies.
In the event that any subsidiary uses a risk-rating prepared by any other risk rating agency, said risk-ratings are standardized with those provided by the afore-mentioned institutions.
The following table shows the analysis of the risk-rating of trading, available-for-sale and held-to-maturity investments, provided by the institutions referred to above:
| At December 31, 2017 | At December 31, 2016 | |||||||||||||||
| S/(000) | % | S/(000) | % | |||||||||||||
| Instruments rated in Peru: | ||||||||||||||||
| AAA | 1,254,943 | 3.8 | 1,412,290 | 5.1 | ||||||||||||
| AA- to AA+ | 1,313,967 | 4.0 | 1,060,347 | 3.8 | ||||||||||||
| A- to A+ | 6,850,118 | 20.9 | 5,483,403 | 19.7 | ||||||||||||
| BBB- to BBB+ | 2,279,478 | 7.0 | 1,919,853 | 6.9 | ||||||||||||
| BB- to BB+ | 469,679 | 1.4 | 314,913 | 1.1 | ||||||||||||
| Lower than +B | 4,960 | – | 22,129 | 0.1 | ||||||||||||
| Unrated | ||||||||||||||||
| BCRP certificates of deposit | 10,026,038 | 30.5 | 7,066,653 | 25.4 | ||||||||||||
| Listed and unlisted securities | 702,384 | 2.1 | 796,961 | 2.9 | ||||||||||||
| Restricted mutual funds | 425,300 | 1.3 | 368,418 | 1.3 | ||||||||||||
| Mutual funds | 167,607 | 0.5 | 50,314 | 0.2 | ||||||||||||
| Other instruments | 29,181 | 0.1 | 90,407 | 0.3 | ||||||||||||
| Subtotal | 23,523,655 | 71.6 | 18,585,688 | 66.8 | ||||||||||||
F- 114
| At December 31, 2017 | At December 31, 2016 | |||||||||||||||
| S/(000) | % | S/(000) | % | |||||||||||||
| Instruments rated abroad: | ||||||||||||||||
| AAA | 467,654 | 1.4 | 1,385,911 | 5.0 | ||||||||||||
| AA- to AA+ | 1,040,411 | 3.2 | 677,042 | 2.4 | ||||||||||||
| A- to A+ | 1,434,598 | 4.4 | 1,298,815 | 4.8 | ||||||||||||
| BBB- to BBB+ | 4,179,102 | 12.7 | 3,069,547 | 11.0 | ||||||||||||
| BB- to BB+ | 1,258,752 | 3.8 | 1,011,463 | 3.6 | ||||||||||||
| Lower than B+ | 19,869 | 0.1 | 148,212 | 0.5 | ||||||||||||
| Unrated: | ||||||||||||||||
| Rated and unrated instruments | 211,487 | 0.6 | 586,953 | 2.1 | ||||||||||||
| Certificates of deposit of Bolivia Central Bank | 95,042 | 0.3 | 14,644 | 0.1 | ||||||||||||
| Participations of RAL funds | 527,729 | 1.6 | 650,804 | 2.3 | ||||||||||||
| Mutual funds | 98,911 | 0.3 | 245,730 | 0.9 | ||||||||||||
| Hedge funds | 1,062 | – | 1,095 | – | ||||||||||||
| Other instruments | 3,729 | – | 143,202 | 0.5 | ||||||||||||
| Subtotal | 9,338,346 | 28.4 | 9,233,418 | 33.2 | ||||||||||||
| Total | 32,862,001 | 100.0 | 27,819,106 | 100.0 | ||||||||||||
F- 115
| f) | Concentration of financial instruments exposed to credit risk - |
As of December 31, 2017 and 2016 financial instruments with exposure to credit risk were distributed considering the following economic sectors:
| 2017 | 2016 | |||||||||||||||||||||||||||||||||||||||||||||||
|
Designated
at fair value
through profit for loss |
Designated
at fair value
through profit for loss |
|||||||||||||||||||||||||||||||||||||||||||||||
|
Held
for
trading and hedging |
At inception |
Loans
and
receivables |
Investments
available- for-sale |
Investments
held-to- maturity |
Total |
Held
for
trading and hedging |
At
inception |
Loans
and
receivables |
Investments
available- for-sale |
Investments
held-to- maturity |
Total | |||||||||||||||||||||||||||||||||||||
| S/(000) | S/(000) | S/(000) | S/(000) | S/(000) | S/(000) | S/(000) | S/(000) | S/(000) | S/(000) | S/(000) | S/(000) | |||||||||||||||||||||||||||||||||||||
| Central Reserve Bank of Peru | 2,102,330 | – | 21,630,506 | 7,925,997 | – | 31,658,833 | 2,122,662 | – | 18,748,155 | 3,419,374 | – | 24,290,191 | ||||||||||||||||||||||||||||||||||||
| Financial services | 1,057,679 | 320,619 | 11,644,317 | 4,700,343 | 98,866 | 17,821,824 | 2,051,650 | 321,298 | 10,732,478 | 5,721,827 | 123,676 | 18,950,929 | ||||||||||||||||||||||||||||||||||||
| Manufacturing | 23,277 | 29,508 | 14,363,997 | 1,529,261 | 13,135 | 15,959,178 | 9,886 | 12,026 | 13,952,167 | 1,650,833 | 37,965 | 15,662,877 | ||||||||||||||||||||||||||||||||||||
| Mortgage loans | – | – | 14,638,363 | – | – | 14,638,363 | – | – | 13,283,126 | – | – | 13,283,126 | ||||||||||||||||||||||||||||||||||||
| Consumer loans | – | – | 10,816,588 | – | – | 10,816,588 | – | – | 11,410,640 | – | – | 11,410,640 | ||||||||||||||||||||||||||||||||||||
| Micro-business loans | – | – | 12,897,206 | – | – | 12,897,206 | – | – | 5,175,700 | – | – | 5,175,700 | ||||||||||||||||||||||||||||||||||||
| Commerce | 52,453 | 45,130 | 11,682,985 | 248,396 | 17,950 | 12,046,914 | 35,022 | 3,693 | 14,242,421 | 192,136 | 14,765 | 14,488,037 | ||||||||||||||||||||||||||||||||||||
| Government and public administration | 1,287,212 | 40,480 | 450,174 | 5,220,054 | 4,164,128 | 11,162,048 | 221,754 | 11,199 | 245,948 | 2,830,156 | 4,836,820 | 8,145,877 | ||||||||||||||||||||||||||||||||||||
| Electricity, gas and water | 79,825 | 52,521 | 4,148,658 | 1,918,317 | 56,331 | 6,255,652 | 26,068 | 41,877 | 4,562,433 | 1,903,494 | 44,640 | 6,578,512 | ||||||||||||||||||||||||||||||||||||
| Community services | – | – | 4,408,494 | 34,495 | – | 4,442,989 | – | – | 4,118,309 | 43,992 | – | 4,162,301 | ||||||||||||||||||||||||||||||||||||
| Communications, storage and transportation | 8,285 | – | 3,991,424 | 1,182,783 | 34,477 | 5,216,969 | 8,043 | 6,659 | 4,122,639 | 983,966 | 35,998 | 5,157,305 | ||||||||||||||||||||||||||||||||||||
| Mining | 7,728 | 29,249 | 3,031,376 | 329,773 | – | 3,398,126 | 40,441 | 32,380 | 2,318,702 | 285,571 | – | 2,677,094 | ||||||||||||||||||||||||||||||||||||
| Construction | 51,812 | 17,820 | 1,790,431 | 400,386 | 9,333 | 2,269,782 | 45,030 | 27,033 | 1,910,677 | 387,779 | 9,569 | 2,380,088 | ||||||||||||||||||||||||||||||||||||
| Agriculture | 3,342 | – | 2,272,312 | 5,447 | – | 2,281,101 | 14,992 | – | 2,222,398 | 5,100 | – | 2,242,490 | ||||||||||||||||||||||||||||||||||||
| Insurance | 6,664 | – | 404,691 | – | – | 411,355 | 24,376 | – | 1,288,212 | – | – | 1,312,588 | ||||||||||||||||||||||||||||||||||||
| Education, health and others services | 5,279 | 2,358 | 1,494,635 | 213,181 | – | 1,715,453 | 9,956 | 2,934 | 912,031 | 359,602 | 3,471 | 1,287,994 | ||||||||||||||||||||||||||||||||||||
| Real Estate and Leasing | 10,391 | – | 5,306,353 | 77,161 | – | 5,393,905 | 17,359 | – | 7,115,947 | 244,377 | – | 7,377,683 | ||||||||||||||||||||||||||||||||||||
| Fishing | 1,689 | – | 394,287 | – | – | 395,976 | 7,521 | – | 405,538 | – | – | 413,059 | ||||||||||||||||||||||||||||||||||||
| Others | 28,597 | – | 4,976,570 | 638,297 | 19,153 | 5,662,617 | 322,861 | – | 4,234,272 | 657,460 | 11,516 | 5,226,109 | ||||||||||||||||||||||||||||||||||||
| Total | 4,726,563 | 537,685 | 130,343,367 | 24,423,891 | 4,413,373 | 164,444,879 | 4,957,621 | 459,099 | 121,001,793 | 18,685,667 | 5,118,420 | 150,222,600 | ||||||||||||||||||||||||||||||||||||
F- 116
As of December 31, 2017 and 2016 financial instruments with exposure to credit risk were distributed by the following geographical areas:
| 2017 | 2016 | |||||||||||||||||||||||||||||||||||||||||||||||
|
Designated
at fair value
through profit for loss |
Designated
at fair value
through profit for loss |
|||||||||||||||||||||||||||||||||||||||||||||||
|
Held
for
trading and hedging |
At inception |
Loans
and
receivables |
Investments
available-for- sale |
Investments
held-to- maturity |
Total |
Held
for
trading and hedging |
At inception |
Loans
and
receivables |
Investments
available-for- sale |
Investments
held-to- maturity |
Total | |||||||||||||||||||||||||||||||||||||
| S/(000) | S/(000) | S/(000) | S/(000) | S/(000) | S/(000) | S/(000) | S/(000) | S/(000) | S/(000) | S/(000) | S/(000) | |||||||||||||||||||||||||||||||||||||
| Peru | 2,394,575 | 118,396 | 114,046,024 | 17,324,374 | 3,900,388 | 137,783,757 | 2,661,743 | 174,771 | 107,315,656 | 11,515,894 | 4,606,110 | 126,274,174 | ||||||||||||||||||||||||||||||||||||
| United States of America | 195,955 | 291,295 | 1,757,745 | 3,049,957 | 111,122 | 5,406,074 | 235,036 | 223,223 | 1,722,387 | 2,986,309 | 82,536 | 5,249,491 | ||||||||||||||||||||||||||||||||||||
| Bolivia | 13,372 | – | 7,516,991 | 1,213,397 | – | 8,743,760 | – | – | 6,992,985 | 885,013 | – | 7,877,998 | ||||||||||||||||||||||||||||||||||||
| Colombia | 1,324,999 | 28,510 | 1,619,679 | 590,387 | 138,941 | 3,702,516 | 1,245,998 | – | 1,157,154 | 780,468 | 150,667 | 3,334,287 | ||||||||||||||||||||||||||||||||||||
| Panama | 4,909 | – | 498,512 | 48,531 | – | 551,952 | 65 | – | 660,191 | 65,767 | – | 726,023 | ||||||||||||||||||||||||||||||||||||
| Chile | 411,276 | 22,154 | 1,906,346 | 379,465 | 72,004 | 2,791,245 | 342,613 | 29,315 | 1,597,426 | 838,702 | 69,839 | 2,877,895 | ||||||||||||||||||||||||||||||||||||
| Brazil | 22,476 | – | 193,120 | 44,062 | 111,168 | 370,826 | – | – | 283,056 | 98,022 | 121,794 | 502,872 | ||||||||||||||||||||||||||||||||||||
| México | 19,570 | 30,148 | 80,844 | 329,679 | 70,072 | 530,313 | – | 7,654 | 83,792 | 334,116 | 77,423 | 502,985 | ||||||||||||||||||||||||||||||||||||
| Canada | 14,804 | – | 39,477 | 74,533 | – | 128,814 | 5,819 | – | 28,295 | 72,102 | – | 106,216 | ||||||||||||||||||||||||||||||||||||
| Europe: | ||||||||||||||||||||||||||||||||||||||||||||||||
| United Kingdom | 231,336 | – | 112,869 | 172,932 | 3,132 | 520,269 | 364,433 | – | 111,019 | 129,960 | 3,218 | 608,630 | ||||||||||||||||||||||||||||||||||||
| Others in Europe | 2,215 | – | 131,983 | 269,958 | – | 404,156 | 1,605 | – | 133,373 | 154,668 | – | 289,646 | ||||||||||||||||||||||||||||||||||||
| France | 90,845 | – | 12,883 | 48,649 | 1,639 | 154,016 | 98,556 | – | 23,465 | 74,734 | 1,708 | 198,463 | ||||||||||||||||||||||||||||||||||||
| Spain | – | – | 204,100 | 5,048 | 3,269 | 212,417 | – | – | 205,334 | 6,119 | 3,414 | 214,867 | ||||||||||||||||||||||||||||||||||||
| Switzerland | 231 | – | 89,718 | 47,027 | – | 136,976 | – | – | 171,335 | 36,065 | – | 207,400 | ||||||||||||||||||||||||||||||||||||
| The Netherlands | – | – | – | 54,251 | – | 54,251 | – | – | – | 56,136 | – | 56,136 | ||||||||||||||||||||||||||||||||||||
| Others | – | 47,182 | 2,133,076 | 771,641 | 1,638 | 2,953,537 | 1,753 | 24,136 | 516,325 | 651,592 | 1,711 | 1,195,517 | ||||||||||||||||||||||||||||||||||||
| Total | 4,726,563 | 537,685 | 130,343,367 | 24,423,891 | 4,413,373 | 164,444,879 | 4,957,621 | 459,099 | 121,001,793 | 18,685,667 | 5,118,420 | 150,222,600 | ||||||||||||||||||||||||||||||||||||
F- 117
| g) | Offsetting financial assets and liabilities - |
The disclosures set out in the tables below include financial assets and liabilities that:
| - | Are offset in the Group’s consolidated statement of financial position; or |
| - | Are subject to an enforceable master netting arrangement or similar agreement that covers similar financial statements, irrespective of whether they are offset in the statement of financial position. |
The similar agreements include derivative clearing agreements, master repurchase agreements, and master securities lending agreements. Similar financial instruments include derivatives, Accounts receivable from reverse repurchase agreements and security borrowings, payables from repurchase agreements and security lendings and other financial assets and liabilities. Financial instruments such as loans and deposits are not disclosed in the tables below unless they are offset in the statement of financial position.
The offsetting framework agreement issued by the International Swaps and Derivatives Association Inc. (“ISDA”) and similar master netting arrangements do not meet the criteria for offsetting in the statement of financial position, because said agreements were created in order for both parties to have an enforceable offsetting right in cases of default, insolvency or bankruptcy of the Group or the counterparties or following other predetermined events. In addition, the Group and its counterparties do not intend to settle said instruments on a net basis or to realize the assets and settle the liabilities simultaneously.
The Group receives and gives collateral in the form of cash and marketable securities in respect of the following transactions:
| - | Derivatives; |
| - | Accounts receivable from reverse repurchase agreements and security borrowings; |
| - | Payables from repurchase agreements and security lendings; and |
| - | Other financial assets and liabilities |
Such collateral adheres to standard industry terms including, when appropriate, an ISDA Credit Support Annex. This means that securities received/given as collateral can be pledged or sold during the term of the transaction but have to be returned on maturity of the transaction. The terms also give each party the right to terminate the related transactions upon the counterparty’s failure to return the respective collateral.
F- 118
Financial assets subject to offsetting, enforceable master netting arrangements and similar agreements:
| As of December 31, 2017 | ||||||||||||||||||||||||
|
Related
amounts not offset in the
consolidated statement of financial position |
||||||||||||||||||||||||
| Description |
Gross
amounts
recognized financial assets |
Gross
amounts of
recognized financial liabilities and offset in the consolidated statement of financial positions |
Net
of financial
assets presented in the consolidated statements of financial position |
Financial
instruments |
Cash
collateral received |
Net amount | ||||||||||||||||||
| S/(000) | S/(000) | S/(000) | S/(000) | S/(000) | S/(000) | |||||||||||||||||||
| Receivables from derivatives | 701,826 | – | 701,826 | (86,292 | ) | (80,140 | ) | 535,394 | ||||||||||||||||
| Cash collateral, reverse repurchase agreements and securities borrowings | 7,480,420 | – | 7,480,420 | (19,485 | ) | (6,660,170 | ) | 800,765 | ||||||||||||||||
| Available-for-sale and held-to-maturity investments pledged as collateral | 5,278,763 | – | 5,278,763 | (4,387,330 | ) | – | 891,433 | |||||||||||||||||
| Total | 13,461,009 | – | 13,461,009 | (4,493,107 | ) | (6,740,310 | ) | 2,227,592 | ||||||||||||||||
| As of December 31, 2016 | ||||||||||||||||||||||||
|
Related
amounts not offset in the
consolidated statement of financial position |
||||||||||||||||||||||||
| Description |
Gross
amounts
recognized financial assets |
Gross
amounts of
recognized financial liabilities and offset in the consolidated statement of financial positions |
Net
of financial
assets presented in the consolidated statements of financial position |
Financial
instruments |
Cash
collateral received |
Net amount | ||||||||||||||||||
| S/(000) | S/(000) | S/(000) | S/(000) | S/(000) | S/(000) | |||||||||||||||||||
| Receivables from derivatives | 942,602 | – | 942,602 | (416,084 | ) | (30,573 | ) | 495,945 | ||||||||||||||||
| Cash collateral, reverse repurchase agreements and securities borrowings | 10,919,624 | – | 10,919,624 | (2,022,625 | ) | (7,642,111 | ) | 1,254,888 | ||||||||||||||||
| Available-for-sale and held-to-maturity investments pledged as collateral | 3,849,558 | – | 3,849,558 | (3,719,047 | ) | – | 130,511 | |||||||||||||||||
| Total | 15,711,784 | – | 15,711,784 | (6,157,756 | ) | (7,672,684 | ) | 1,881,344 | ||||||||||||||||
F- 119
Financial liabilities subject to offsetting, enforceable master agreements for offsetting and similar agreements:
| As of December 31, 2017 | ||||||||||||||||||||||||
|
Related
amounts not offset in the
consolidated statement of financial position |
||||||||||||||||||||||||
| Description |
Gross
amounts
recognized financial liabilities |
Gross
amounts of
recognized liabilities and offset in the consolidated statement of financial position |
Net
amounts of
financial liabilities presented in the consolidated statements of financial position |
Financial
instruments |
Cash
collateral pledged |
Net amount | ||||||||||||||||||
| S/(000) | S/(000) | S/(000) | S/(000) | S/(000) | S/(000) | |||||||||||||||||||
| Payables from derivatives | 636,762 | – | 636,762 | (86,292 | ) | (149,846 | ) | 400,624 | ||||||||||||||||
| Payables from repurchase agreements and security lendings | 13,415,843 | – | 13,415,843 | (5,900,903 | ) | (6,962,421 | ) | 552,519 | ||||||||||||||||
| Total | 14,052,605 | – | 14,052,605 | (5,987,195 | ) | (7,112,267 | ) | 953,143 | ||||||||||||||||
| As of December 31, 2016 | ||||||||||||||||||||||||
|
Related
amounts not offset in the
consolidated statement of financial position |
||||||||||||||||||||||||
| Description |
Gross
amounts
recognized financial liabilities |
Gross
amounts of
recognized liabilities and offset in the consolidated statement of financial position |
Net
amounts of
financial liabilities presented in the consolidated statements of financial position |
Financial
instruments |
Cash
collateral pledged |
Net amount | ||||||||||||||||||
| S/(000) | S/(000) | S/(000) | S/(000) | S/(000) | S/(000) | |||||||||||||||||||
| Payables from derivatives | 673,015 | – | 673,015 | (416,084 | ) | (175,788 | ) | 81,143 | ||||||||||||||||
| Payables from repurchase agreements and security lendings | 15,127,999 | – | 15,127,999 | (4,476,984 | ) | (10,621,045 | ) | 29,970 | ||||||||||||||||
| Total | 15,801,014 | – | 15,801,014 | (4,893,068 | ) | (10,796,833 | ) | 111,113 | ||||||||||||||||
The gross amounts of financial assets and liabilities and their net amounts disclosed in the above tables have been measured in the statement of financial position on the following basis:
| • | Derivative assets and liabilities are measured at fair value. |
| • | Cash collateral and reverse repurchase agreements and security borrowing and payables from repurchase agreements and security lendings are measured at amortized cost. |
| • | Financial liabilities are measured at fair value. |
The difference between the carrying amount in the consolidated statement of financial position and the amounts presented in the tables above for derivatives (presented in other assets Note 12(b)), cash collateral and reverse repurchase agreement and security borrowing and payables from repurchase agreements and security and financial liabilities measured at fair value through profit or loss are financial instruments outside of the scope of offsetting disclosure.
F- 120
| 32.2. | Market risk - |
The Group takes on exposure to market risks, which is the risk that the fair value or future cash flows of a financial instrument will fluctuate because of changes in market prices. Market risks arise from open positions in interest rates, currency, commodities and equity products; all of which are exposed to general and specific market movements and changes in the level of volatility of prices such as interest rates, credit spreads, foreign exchange rates and equity prices. Due to the nature of the Group’s current activities, commodity price risk is not applicable.
The Group separates exposures to market risk into two groups: (i) those that arise from value fluctuation of trading portfolios due to movements of market rates or prices (Trading Book) and (ii) those that arise from changes in the structural positions of non-trading portfolios due to movements of the interest rates, prices and foreign exchange ratios (Banking Book).
The risks that trading portfolios face are managed through Value at Risk (VaR) historical simulation techniques; while non-trading portfolios (Trading book) are managed using Asset and Liability Management (ALM).
| a) | Trading Book - |
The trading book is characterized for having liquid positions in equities, bonds, foreign currencies and derivatives, arising from market-making transactions where the Group acts as a principal with the clients or with the market. This portfolio includes investments and derivatives classified by Management as held for trading.
| (i) | Value at Risk (VaR) - |
The Group applies the VaR approach to its trading portfolio to estimate the market risk of the main positions held and the maximum losses that are expected, based upon a number of assumptions for various changes in market conditions and considering the risk appetite of the subsidiary.
Daily calculation of VaR is a statistically-based estimate of the maximum potential loss on the current portfolio from adverse market movements.
The VaR expresses the “maximum” amount the Group might lose, but only to a certain level of confidence (99 percent). There is therefore a specified statistical probability (1 percent) that actual loss could be greater than the VaR estimate. The VaR model assumes a certain “holding period” until positions can be closed (1 - 10 days).
The time horizon used to calculate VaR is one day; however, the one-day VAR is amplified to a 10-day time frame and calculated multiplying the one-day VaR by the square root of 10. This adjustment will be accurate only if the changes in the portfolio in the following days have a normal distribution identical and independent; because of that, the result is multiplied by a non-normality adjustment factor. The limits and consumptions of the VaR are established on the basis of the risk appetite and the trading strategies of each subsidiary.
The assessment of past movements has been based on historical one-year data and 124 market risk factors, which are composed as follows: 25 market curves, 78 stock prices, 12 mutual funds values, 1 volatility series and 8 survival probability curves. The Group applies these historical changes in rates directly to its current positions (a method known as historical simulation). The Management of the Group believes the market risk factors incorporated into its VaR model are adequate to measure the market risk to which the Group’s trading book is exposed.
F- 121
The use of this approach does not prevent losses outside of these limits in the event of more significant market movements. Losses exceeding the VaR figure may occur, on average under normal market conditions, not more than once every hundred days.
VaR limits have been established to control and keep track of all the risks taken. These risks arise from the size of the positions and/or the volatility of the risk factors embedded in each financial instrument. Regular reports are prepared for the Treasury and ALM Risk Committee, the Risk Management Committee and Senior Management.
VaR results are used to generate economic capital estimates by market risk, which are periodically monitored and are part of the overall risk appetite of each subsidiary. Furthermore, at Group level, there is also a limit to the risk appetite of the trading portfolio, which is monitored and informed to the Credicorp Treasury Risks and ALM Committee.
In VaR calculation, the effects of the exchange rate are not included because said effects are measured in the net monetary position, see note 32.2 (b)(ii).
The consolidated VaR showed a reduction during the year 2017, due to a lower exposure to the rate risk and price factor, as a result of the reduction in the positions of fixed income, variable income and swaps. The VaR was maintained within the risk appetite limits approved by the Risk Committee of each company of the group, as well as by the Corporate Risk Committee.
As of December 31, 2017 and 2016 the Group’s VaR by type of asset is as follows:
| 2017 | 2016 | |||||||
| S/(000) | S/(000) | |||||||
| Equity investments | 2,757 | 9,624 | ||||||
| Debt investments | 4,504 | 19,371 | ||||||
| Swaps | 7,661 | 13,045 | ||||||
| Forwards | 2,111 | 2,470 | ||||||
| Options | 251 | 1,160 | ||||||
| Diversification effect | (9,884 | ) | (19,748 | ) | ||||
| Consolidated VaR by type of asset | 7,400 | 25,922 | ||||||
As of December 31, 2017 and 2016, the Group’s VaR by risk type is as follows:
| 2017 | 2016 | |||||||
| S/(000) | S/(000) | |||||||
| Interest rate risk | 7,836 | 22,553 | ||||||
| Price risk | 2,759 | 9,623 | ||||||
| Volatility risk | – | 319 | ||||||
| Diversification effect | (3,195 | ) | (6,573 | ) | ||||
| Consolidated VaR by type of risk | 7,400 | 25,922 | ||||||
| b) | ALM Book - |
Non-trading portfolios which comprise the Banking Book are exposed to different sensitivities that can bring about a deterioration in the value of assets compared to liabilities and hence to a reduction of its net worth.
F- 122
| (i) | Interest rate risk - |
The Banking Book-related interest rate risk arises from eventual changes in interest rates that may adversely affect the expected gains (risk gains) or market value of financial assets and liabilities reported on the balance sheet (Net economic value). The Group assumes the exposure to the interest rate risk that may affect their fair value as well as the cash flow risk of future assets and liabilities.
The Risk Committee sets the guidelines regarding the level of unmatched repricing of interest rates that can be tolerated, which is periodically monitored through ALCO.
Corporate policies include guidelines for the management of the Group’s exposure to the interest rate risk. These guidelines are implemented considering the features of each segment of business in which the Group entities operate.
In this regard, Group companies that are exposed to the interest rate risk are those that have yields based on interest, such as credits, investments and technical reserves. Interest rate risk management in BCP Peru, BCP Bolivia, MiBanco, Atlantic Security Bank and Pacífico Grupo Asegurador is carried out by performing a repricing gap analysis, sensitivity analysis of the financial margin (GER) and sensitivity analysis of the net economic value (VEN). These calculations consider different rate shocks in stress scenarios.
Analysis of repricing gap -
The repricing gap analysis is intended to measure the interest rate risk exposure when the bank’s interest-sensitive liabilities exceed its interest-sensitive assets. By this analysis, management can identify the tranches in which the interest rate variations may have a potential impact.
F- 123
The table below summarizes the Group’s exposure to interest rate risks. It includes the Group’s financial instruments at carrying amounts, categorized by the earlier of contractual re-pricing or maturity dates:
| At December 31, 2017 | ||||||||||||||||||||||||||||
|
Up
to 1
month |
1
to 3
months |
3
to 12
months |
1
to 5
years |
More
than
5 years |
Non-interest
bearing |
Total | ||||||||||||||||||||||
| S/(000) | S/(000) | S/(000) | S/(000) | S/(000) | S/000 | S/(000) | ||||||||||||||||||||||
| Assets | ||||||||||||||||||||||||||||
| Cash and due from banks, Cash collateral, reverse repurchase agreements and securities borrowings | 11,473,580 | 1,859,361 | 4,638,314 | 6,222,420 | 79,788 | 6,428,944 | 30,702,407 | |||||||||||||||||||||
| Investments | 1,642,823 | 3,789,292 | 4,013,113 | 6,208,053 | 11,072,700 | 2,111,283 | 28,837,264 | |||||||||||||||||||||
| Loans, net | 12,192,582 | 15,509,563 | 23,933,640 | 32,989,209 | 12,108,217 | (755,934 | ) | 95,977,277 | ||||||||||||||||||||
| Financial assets designated at fair value through profit or loss | – | – | – | – | – | 537,685 | 537,685 | |||||||||||||||||||||
| Premiums and other policies Accounts receivable | 626,392 | 22,088 | 6,500 | 1,849 | – | – | 656,829 | |||||||||||||||||||||
| Accounts receivable from reinsurers and coinsurers | 163,425 | 309,669 | 208,531 | 34,070 | – | – | 715,695 | |||||||||||||||||||||
| Other assets (*) | 180,725 | 24,927 | 9,736 | 5,946 | 577,129 | 8,221,926 | 9,020,389 | |||||||||||||||||||||
| Total assets | 26,279,527 | 21,514,900 | 32,809,834 | 45,461,547 | 23,837,834 | 16,543,904 | 166,447,546 | |||||||||||||||||||||
| Liabilities | ||||||||||||||||||||||||||||
| Deposits and obligations | 26,156,669 | 9,513,156 | 17,056,114 | 36,200,975 | 6,213,829 | 2,029,668 | 97,170,411 | |||||||||||||||||||||
| Payables from repurchase agreements, security lending and due to banks and correspondents and banker’s acceptances outstanding | 4,070,558 | 1,949,926 | 6,931,824 | 6,056,395 | 2,153,396 | 250,633 | 21,412,732 | |||||||||||||||||||||
| Accounts payable to reinsurers | 51,814 | 141,708 | 31,726 | 9,937 | – | – | 235,185 | |||||||||||||||||||||
| Technical, insurance claims reserves and reserves for unearned premiums | 200,307 | 118,642 | 443,141 | 1,918,617 | 3,922,902 | 840,151 | 7,443,760 | |||||||||||||||||||||
| Financial liabilities at fair value through profit or loss | – | – | – | – | – | 168,089 | 168,089 | |||||||||||||||||||||
| Bonds and notes issued | 791,247 | 1,656 | 395,125 | 11,998,887 | 2,973,831 | 81,511 | 16,242,257 | |||||||||||||||||||||
| Other liabilities (**) | 155,851 | 211,103 | 2,434 | – | – | 5,176,758 | 5,546,146 | |||||||||||||||||||||
| Equity | – | – | – | – | – | 22,253,703 | 22,253,703 | |||||||||||||||||||||
| Total liabilities and equity | 31,426,446 | 11,936,191 | 24,860,364 | 56,184,811 | 15,263,958 | 30,800,513 | 170,472,283 | |||||||||||||||||||||
| Off-balance-sheet accounts | ||||||||||||||||||||||||||||
| Derivative financial assets | 1,397,860 | 2,023,671 | 426,309 | 6,993,576 | 2,393,197 | – | 13,234,613 | |||||||||||||||||||||
| Derivative financial liabilities | 4,153,574 | 4,460,947 | 181,534 | 3,944,123 | 494,435 | – | 13,234,613 | |||||||||||||||||||||
| (2,755,714 | ) | (2,437,276 | ) | 244,775 | 3,049,453 | 1,898,762 | – | – | ||||||||||||||||||||
| Marginal gap | (7,902,633 | ) | 7,141,433 | 8,194,245 | (7,673,811 | ) | 10,472,638 | (14,256,609 | ) | (4,024,737 | ) | |||||||||||||||||
| Accumulated gap | (7,902,633 | ) | (761,200 | ) | 7,433,045 | (240,766 | ) | 10,231,872 | (4,024,737 | ) | – | |||||||||||||||||
| (*) | Includes property, furniture and equipment, net, intangible and goodwill, net, due from customers on acceptances and other assets. |
| (**) | Includes banker’s acceptances outstanding and other liabilities. |
Investments accounted for at fair value through profit or loss and trading derivatives are not taken into account, due to the fact that these instrument are part of the trading book and the Value at Risk methodology is used to measure their market risks.
F- 124
| At December 31, 2016 | ||||||||||||||||||||||||||||
|
Up
to 1
month |
1
to 3
months |
3
to 12
months |
1
to 5
years |
More
than
5 years |
Non-interest
bearing |
Total | ||||||||||||||||||||||
| S/(000) | S/(000) | S/(000) | S/(000) | S/000 | S/000 | S/000 | ||||||||||||||||||||||
| Assets | ||||||||||||||||||||||||||||
| Cash and due from banks, Cash collateral, reverse repurchase agreements and securities borrowings | 7,467,818 | 1,845,264 | 3,709,882 | 9,890,459 | 109,340 | 4,542,630 | 27,565,393 | |||||||||||||||||||||
| Investments | 1,574,831 | 465,421 | 3,913,328 | 6,261,652 | 8,908,298 | 2,680,557 | 23,804,087 | |||||||||||||||||||||
| Loans, net | 10,525,263 | 16,135,337 | 22,739,878 | 30,353,995 | 11,170,586 | (363,291 | ) | 90,561,768 | ||||||||||||||||||||
| Financial assets designated at fair value through profit or loss | – | – | – | – | – | 459,099 | 459,099 | |||||||||||||||||||||
| Premiums and other policies Accounts receivable | 623,005 | 16,533 | 2,898 | 788 | – | – | 643,224 | |||||||||||||||||||||
| Accounts receivable from reinsurers and coinsurers | 110,263 | 202,610 | 120,159 | 21,155 | – | – | 454,187 | |||||||||||||||||||||
| Other assets (*) | 373,946 | 5,590 | 12,537 | 7,024 | – | 8,533,348 | 8,932,445 | |||||||||||||||||||||
| Total assets | 20,675,126 | 18,670,755 | 30,498,682 | 46,535,073 | 20,188,224 | 15,852,343 | 152,420,203 | |||||||||||||||||||||
| Liabilities | ||||||||||||||||||||||||||||
| Deposits and obligations | 22,908,852 | 8,273,520 | 15,162,216 | 32,654,763 | 4,970,689 | 1,946,347 | 85,916,387 | |||||||||||||||||||||
| Payables from repurchase agreements, security lending and due to banks and correspondents to banks and correspondents | 2,765,720 | 2,031,097 | 5,747,611 | 10,146,210 | 1,825,048 | 106,229 | 22,621,915 | |||||||||||||||||||||
| Accounts payable to reinsurers | 32,963 | 158,957 | 36,633 | 5,339 | – | – | 233,892 | |||||||||||||||||||||
| Technical, insurance claims reserves and reserves for unearned premiums | 185,671 | 104,065 | 396,609 | 1,730,011 | 3,637,198 | 732,635 | 6,786,189 | |||||||||||||||||||||
| Financial liabilities at fair value through profit or loss | – | – | – | – | – | 209,520 | 209,520 | |||||||||||||||||||||
| Bonds and notes issued | 52,366 | 40,792 | 639,238 | 8,492,272 | 6,226,773 | 488,162 | 15,939,603 | |||||||||||||||||||||
| Other liabilities (**) | 446,131 | 1,577 | 218,539 | 190,300 | – | 3,754,658 | 4,611,205 | |||||||||||||||||||||
| Equity | – | – | – | – | – | 20,116,511 | 20,116,511 | |||||||||||||||||||||
| Total liabilities and equity | 26,391,703 | 10,610,008 | 22,200,846 | 53,218,895 | 16,659,708 | 27,354,062 | 156,435,222 | |||||||||||||||||||||
| Off-balance-sheet accounts | ||||||||||||||||||||||||||||
| Derivative financial assets | 461,724 | 2,118,173 | 498,864 | 5,738,651 | 3,961,574 | – | 12,778,986 | |||||||||||||||||||||
| Derivative financial liabilities | 1,682,988 | 4,308,673 | 2,609,747 | 3,461,322 | 716,256 | – | 12,778,986 | |||||||||||||||||||||
| (1,221,264 | ) | (2,190,500 | ) | (2,110,883 | ) | 2,277,329 | 3,245,318 | – | – | |||||||||||||||||||
| Marginal gap | (6,937,841 | ) | 5,870,247 | 6,186,953 | (4,406,493 | ) | 6,773,834 | (11,501,719 | ) | (4,015,019 | ) | |||||||||||||||||
| Accumulated gap | (6,937,841 | ) | (1,067,594 | ) | 5,119,359 | 712,866 | 7,486,700 | (4,015,019 | ) | – | ||||||||||||||||||
| (*) | Includes property, furniture and equipment, net, intangible and goodwill, net, due from customers on acceptances and other assets. |
| (**) | Includes banker’s acceptances outstanding and other liabilities. |
Investments accounted for at fair value through profit or loss and trading derivatives are not taken into account, due to the fact that these instruments are part of the trading book and the Value at Risk methodology is used to measure their market risks.
F- 125
Sensitivity to changes in interest rates –
The sensitivity analysis of a reasonable possible change in interest rates on the Banking Book comprises an assessment of the sensibility of the financial margins that seeks to measure the potential changes in the interest accruals over a period of time and the expected movement of the interest rate curves as well as the sensibility of the net economic value, which is a long-term metric measured as the difference arising between the Net book value of net assets and liabilities before and after a variation in interest rates.
The sensitivity of the financial margin is the effect of the assumed changes in interest rates on the net interest income before income tax and non-controlling interest for one year, based on the floating rate of non-trading financial assets and financial liabilities held at December 31, 2017 and 2016, including the effect of derivative instruments. The sensitivity of Net Economic Value is calculated by revaluing interest rate from available-for-sale fixed income and held to maturity financial assets, before income tax and non-controlling interest, including the effect of any associated hedges, and derivative instruments designated as cash flow hedges. In managing the interest rate risk, no distinction is made by accounting category of the investments comprising the Banking Book, including instruments classified as available for sales and held to maturity investments.
The results of the sensitivity analysis regarding changes in interest rates at December 31, 2017 and 2016 are shown below:
| At December 31, 2017 | ||||||||||||||||||
| Currency |
Changes in basis points |
Sensitivity of net
profit |
Sensitivity of
economic value |
|||||||||||||||
| S/(000) | S/(000) | |||||||||||||||||
| At December 31, 2017 | ||||||||||||||||||
| Soles | +/- | 50 | -/+ | 1,451 | -/+ | 354,899 | ||||||||||||
| Soles | +/- | 75 | -/+ | 2,176 | -/+ | 532,348 | ||||||||||||
| Soles | +/- | 100 | -/+ | 2,901 | -/+ | 709,798 | ||||||||||||
| Soles | +/- | 150 | -/+ | 4,352 | -/+ | 1,064,696 | ||||||||||||
| U.S. Dollar | +/- | 50 | +/- | 8,068 | -/+ | 129,876 | ||||||||||||
| U.S. Dollar | +/- | 75 | +/- | 12,103 | -/+ | 194,813 | ||||||||||||
| U.S. Dollar | +/- | 100 | +/- | 16,137 | -/+ | 259,751 | ||||||||||||
| U.S. Dollar | +/- | 150 | +/- | 24,205 | -/+ | 389,627 | ||||||||||||
| At December 31, 2016 | ||||||||||||||||||
| Currency |
Changes in basis points |
Sensitivity of net
profit |
Sensitivity of
economic value |
|||||||||||||||
| S/(000) | S/(000) | |||||||||||||||||
| At December 31, 2016 | ||||||||||||||||||
| Soles | +/- | 50 | -/+ | 8,851 | -/+ | 285,263 | ||||||||||||
| Soles | +/- | 75 | -/+ | 13,276 | -/+ | 427,895 | ||||||||||||
| Soles | +/- | 100 | -/+ | 17,701 | -/+ | 570,526 | ||||||||||||
| Soles | +/- | 150 | -/+ | 26,552 | -/+ | 855,790 | ||||||||||||
| U.S. Dollar | +/- | 50 | +/- | 12,613 | +/- | 146,292 | ||||||||||||
| U.S. Dollar | +/- | 75 | +/- | 18,919 | +/- | 219,438 | ||||||||||||
| U.S. Dollar | +/- | 100 | +/- | 25,226 | +/- | 292,584 | ||||||||||||
| U.S. Dollar | +/- | 150 | +/- | 37,838 | +/- | 438,876 | ||||||||||||
F- 126
The interest rate sensitivities set out in the table above are only illustrative and are based on simplified scenarios. The figures represent the effect of the pro-forma movements in the net interest income based on the projected yield curve scenarios and the Group’s current interest rate risk profile. This effect, however, does not incorporate actions that would be taken by Management to mitigate the impact of this interest rate risk.
In addition, the Group seeks proactively to change the interest rate risk profile to minimize losses and optimize net revenues. The projections above also assume that the interest rate of all maturities moves by the same amount and, therefore, do not reflect the potential impact on net interest income of some rates changing while others remain unchanged. The projections make other simplifying assumptions too, including that all positions run to maturity.
Available-for-sale investments in equity securities, mutual funds and hedge funds are not considered as part of the investment securities for interest rate sensitivity calculation purposes; however, a 10, 25 and 30 percent of changes in market prices is conducted to these price-sensitivity securities and the effect on expected unrealized gain or loss in comprehensive income, before income tax, as of December 31, 2017 and 2016 is presented below.
| Market price sensitivity |
Change in market
prices |
2017 | 2016 | |||||||||
| % | S/(000) | S/(000) | ||||||||||
| Equity securities | +/-10 | 81,664 | 130,750 | |||||||||
| Equity securities | +/-25 | 204,161 | 326,875 | |||||||||
| Equity securities | +/-30 | 244,993 | 392,250 | |||||||||
| Mutual funds | +/-10 | 40,937 | 29,234 | |||||||||
| Mutual funds | +/-25 | 102,343 | 73,085 | |||||||||
| Mutual funds | +/-30 | 122,811 | 87,701 | |||||||||
| Hedge funds | +/-10 | 106 | 110 | |||||||||
| Hedge funds | +/-25 | 266 | 274 | |||||||||
| Hedge funds | +/-30 | 319 | 329 | |||||||||
| (ii) | Foreign exchange risk - |
The Group is exposed to foreign currency exchange rates on its financial position and cash flows. Management sets limits on the level of exposure by currency and in total for both overnight and intra-day positions, which are monitored daily.
At December 31, 2017, the free market exchange rate for buying and selling transactions for each United Stated Dollar, the main foreign currency held by the Group, was S/3.241 (S/3.356 at December 31, 2016).
F- 127
Foreign currency transactions are made at the free market exchange rates of the countries where Credicorp’s Subsidiaries are established. As of December 31, 2017 and 2016, the Group’s assets and liabilities by currencies were as follows:
| At December 31, 2017 | At December 31, 2016 | |||||||||||||||||||||||||||||||
| Soles | U.S. Dollar |
Other
currencies |
Total | Soles | U.S. Dollar |
Other
currencies |
Total | |||||||||||||||||||||||||
| S/(000) | S/(000) | S/(000) | S/(000) | S/(000) | S/(000) | S/(000) | S/(000) | |||||||||||||||||||||||||
| Monetary assets | ||||||||||||||||||||||||||||||||
| Cash and due from banks | 3,149,300 | 18,578,798 | 1,493,889 | 23,221,987 | 2,675,238 | 12,131,203 | 1,839,328 | 16,645,769 | ||||||||||||||||||||||||
| Cash collateral, reverse repurchase agreements and securities borrowings | 119,976 | 6,915,937 | 444,507 | 7,480,420 | 4,021 | 10,621,045 | 294,558 | 10,919,624 | ||||||||||||||||||||||||
| Trading securities | 2,222,061 | 209,543 | 1,593,133 | 4,024,737 | 2,433,444 | 172,999 | 1,408,576 | 4,015,019 | ||||||||||||||||||||||||
| Available-for-sale investments | 13,804,121 | 7,697,970 | 810,517 | 22,312,608 | 8,326,735 | 7,301,306 | 367,248 | 15,995,289 | ||||||||||||||||||||||||
| Held-to-maturity investments | 3,453,790 | 959,583 | – | 4,413,373 | 4,102,739 | 1,015,681 | – | 5,118,420 | ||||||||||||||||||||||||
| Loans, net | 56,226,385 | 33,580,636 | 6,170,256 | 95,977,277 | 53,118,275 | 32,215,401 | 5,228,092 | 90,561,768 | ||||||||||||||||||||||||
| Financial assets at fair value through profit or loss | 48,454 | 489,231 | – | 537,685 | 85,333 | 373,766 | – | 459,099 | ||||||||||||||||||||||||
| Other assets | 1,219,985 | 2,268,659 | 876,864 | 4,365,508 | 1,456,407 | 1,993,385 | 538,039 | 3,987,831 | ||||||||||||||||||||||||
| Total | 80,244,072 | 70,700,357 | 11,389,166 | 162,333,595 | 72,202,192 | 65,824,786 | 9,675,841 | 147,702,819 | ||||||||||||||||||||||||
| Monetary liabilities | ||||||||||||||||||||||||||||||||
| Deposits and obligations | (43,334,026 | ) | (45,875,469 | ) | (7,960,916 | ) | (97,170,411 | ) | (37,468,123 | ) | (41,514,198 | ) | (6,934,066 | ) | (85,916,387 | ) | ||||||||||||||||
| Payables from repurchase agreements and security Lendings | (10,155,790 | ) | (1,582,783 | ) | (1,677,270 | ) | (13,415,843 | ) | (12,522,337 | ) | (1,313,163 | ) | (1,292,499 | ) | (15,127,999 | ) | ||||||||||||||||
| Due to bank and correspondents | (3,229,753 | ) | (4,463,659 | ) | (303,477 | ) | (7,996,889 | ) | (2,630,256 | ) | (4,644,838 | ) | (218,822 | ) | (7,493,916 | ) | ||||||||||||||||
| Financial liabilities at fair value through profit or loss | (3,094 | ) | (26,057 | ) | (138,938 | ) | (168,089 | ) | – | (6,052 | ) | (203,468 | ) | (209,520 | ) | |||||||||||||||||
| Insurance claims reserves and technical reserves and unearned premiums | (3,632,896 | ) | (3,809,742 | ) | (1,122 | ) | (7,443,760 | ) | (3,134,680 | ) | (3,650,466 | ) | (1,043 | ) | (6,786,189 | ) | ||||||||||||||||
| Bonds and Notes issued | (3,869,494 | ) | (12,271,451 | ) | (101,312 | ) | (16,242,257 | ) | (2,544,031 | ) | (13,291,371 | ) | (104,201 | ) | (15,939,603 | ) | ||||||||||||||||
| Other liabilities | (2,737,797 | ) | (2,030,093 | ) | (1,013,441 | ) | (5,781,331 | ) | (2,434,407 | ) | (1,492,911 | ) | (917,779 | ) | (4,845,097 | ) | ||||||||||||||||
| Total | (66,962,850 | ) | (70,059,254 | ) | (11,196,476 | ) | (148,218,580 | ) | (60,733,834 | ) | (65,912,999 | ) | (9,671,878 | ) | (136,318,711 | ) | ||||||||||||||||
| 13,281,222 | 641,103 | 192,690 | 14,115,015 | 11,468,358 | (88,213 | ) | 3,963 | 11,384,108 | ||||||||||||||||||||||||
| Forwards position, net | 859,439 | (824,434 | ) | (19,186 | ) | 15,819 | 508,304 | (529,352 | ) | (93,844 | ) | (114,892 | ) | |||||||||||||||||||
| Currency swaps position, net | 370,697 | (371,301 | ) | 3,776 | 3,172 | 245,063 | (245,098 | ) | 35 | – | ||||||||||||||||||||||
| Cross currency swaps position, net | (1,725,567 | ) | 1,814,960 | (92,565 | ) | (3,172 | ) | (1,340,985 | ) | 1,433,012 | (92,027 | ) | – | |||||||||||||||||||
| Options, net | 60,704 | (60,704 | ) | – | – | (86,059 | ) | 86,059 | – | – | ||||||||||||||||||||||
| Net monetary position | 12,846,495 | 1,199,624 | 84,715 | 14,130,834 | 10,794,681 | 656,408 | (181,873 | ) | 11,269,216 | |||||||||||||||||||||||
F- 128
The Group manages foreign exchange risk by monitoring and controlling the currency position values exposed to changes in exchange rates. The Group measures its performance in soles. (since 2014 considering its change in functional currency, before it was measured in U.S. Dollars), so if the net foreign exchange position (U.S. Dollar) is an asset, any depreciation of soles with respect to this currency would positively affect the Group’s consolidated statement of financial position. The current position in a foreign currency comprises exchange rate-linked assets and liabilities in that currency. An institution’s open position in individual currencies comprises assets, liabilities and off-balance sheet items denominated in the respective foreign currency for which the institution itself bears the risk; any appreciation/depreciation of the foreign exchange would affect the consolidated statement of income.
The Group’s net foreign exchange position is the sum of its positive open non-soles positions (net long position) less the sum of its negative open non-soles positions (net short position). Any depreciation/appreciation of the foreign exchange position would affect the consolidated statement of income. A currency mismatch would leave the Group’s consolidated statement of financial position vulnerable to a fluctuation of the foreign currency (exchange rate shock).
The table below shows the sensitivity analysis of the U.S. Dollar, the currency to which the Group had significant exposure as of December 31, 2017 and 2016 in its non-trading monetary assets and liabilities and its forecast cash flows. The analysis calculates the effect of a reasonably possible movement of the currency rate against Soles with all other variables held constant on the consolidated statement of income, before income tax. A negative amount in the table reflects a potential net reduction in the consolidated statement of income, while a positive amount reflects a net potential increase:
| Currency rate sensitivity |
Change in
currency rates |
2017 | 2016 | |||||||||
| % | S/(000) | S/(000) | ||||||||||
| Depreciation - | ||||||||||||
| U.S. Dollar | 5 | (57,125 | ) | (31,257 | ) | |||||||
| U.S. Dollar | 10 | (109,057 | ) | (59,673 | ) | |||||||
| Appreciation - | ||||||||||||
| U.S. Dollar | 5 | 63,138 | 34,548 | |||||||||
| U.S. Dollar | 10 | 133,292 | 72,934 | |||||||||
| 32.3 | Liquidity risk |
Liquidity risk is the risk that the Group is unable to meet its payment obligations associated with its short-term financial liabilities when they fall due and to replace funds when they are withdrawn. The consequence may be the failure to meet obligations to repay depositors, fulfill commitments to lend or meet other operating cash needs.
The Group is exposed to daily calls on, among others, its available cash resources from overnight deposits, current accounts, maturing deposits, loan draw-downs, guarantees and other calls. The Management of the Group’s subsidiaries sets limits on the minimum proportion of funds available to meet such calls and on the minimum level of inter-bank and other borrowing facilities that should be in place to cover withdrawals at unexpected levels of demand. Sources of liquidity are regularly reviewed by the Market Risk Management Department to maintain a wide diversification by currency, geography, provider, product and term.
F- 129
The matching and controlled mismatching of the maturities and interest rates of assets and liabilities is fundamental to the management of the Group. It is unusual for banks to be completely matched, as transacted business is often based on uncertain terms and of different types. An unmatched position potentially enhances profitability, but also increases the risk of losses.
The maturities of assets and liabilities and the ability to replace, at an acceptable cost, interest-bearing liabilities as they mature are important factors in assessing the liquidity of the Group.
A mismatch, in the maturity of long-term illiquid assets against short-term liabilities, exposes the consolidated statement of financial position to risks related both to rollover and to interest rates. If liquid assets do not cover maturing debts, a consolidated statement of financial position is vulnerable to a rollover risk. Furthermore, a sharp increase in interest rates can dramatically increase the cost of rolling over short-term liabilities, leading to a rapid increase in debt service. The contractual-maturity gap report is useful in showing liquidity characteristics.
Corporate policies have been implemented for liquidity risk management by the Group. These policies are consistent with the particular characteristics of each operating segment in which each of the Group companies operate. Risk Management heads set up limits and autonomy models to determine the adequate liquidity indicators to be managed.
Commercial banking :
Liquidity risk exposure in BCP Peru, BCP Bolivia, Mibanco and Atlantic Security Bank is based on indicators such as the Internal Liquidity Coverage Ratio (RCLI, the Spanish acronym) which measures the amount of liquid assets available to meet cash outflows needs within a given stress scenario for a period of 30 days and the Internal Ratio of Stable Net Funding (RFNEI, the Spanish acronym), which is intended to guarantee that long-term assets are financed at least with a minimum number of stable liabilities within a prolonged liquidity crisis scenario; the latter works as a minimum compliance mechanism that supplements the RCLI. The core limits of these indicators are 100% and any excess is presented in the Credicorp Treasury Risk Committee, Credicorp Risk Committee and ALM of the respective subsidiary.
Insurance:
Liquidity risk management in Pacífico Grupo Asegurador follows a particular approach given the nature of the business. For annually renewable businesses, mainly “Pacífico Seguros”, the emphasis of liquidity is focused on the quick availability or resources in the event of a systemic event (e.g. earthquake); for this purpose, there are minimum investment indicators in place relating to local cash/time deposits and foreign fixed-income instruments of high quality and liquidity.
For long-term businesses such as Pacífico Seguros, given the nature of the products offered and the contractual relationship with customers (the liquidity risk is not material); the emphasis is on maintaining sufficient flow of assets and matching their maturities with maturities of obligations (mathematical technical reserves); for this purpose there are indicators that measure the asset/liability sufficiency and adequacy as well as calculations or economic capital subject to interest rate risk, a methodology of Credicorp.
AFPs:
Liquidity risk management in AFP Prima is carried out in a differentiated manner between the fund administrator and the funds being managed. Liquidity management regarding the fund administrator is focused on meeting periodic operating expense needs, which are supported with the collection of commissions. The fund administering entity does not record unexpected outflows of liquidity.
F- 130
Investment banking:
Liquidity risk in the Grupo Credicorp Capital (Credicorp Capital Colombia, IM Trust y Credicorp Capital Perú) principally affects the security brokerage. In managing this risk, limits of use of liquidity have been established as well as matching maturities by dealing desk; follow-up on liquidity is performed on a daily basis for a short-term horizon covering the coming settlements. If short-term unmatched maturities are identified, repos are used. On the other hand, structural liquidity risk of Credicorp Capital is not significant given the low levels of debt, which is monitored regularly using financial planning tools.
Companies perform a liquidity risk management using the liquidity Gap or contractual maturity Gap.
F- 131
The table below presents the cash flows payable by the Group by remaining contractual maturities (including future interest payments) at the date of the consolidated statement of financial position. The amounts disclosed in the table are the contractual undiscounted cash flows:
| As of December 31, 2017 | As of December 31, 2016 | |||||||||||||||||||||||||||||||||||||||||||||||
|
Up
to
a month |
From 1 to 3 months |
From 3 to 12 months |
From 1 to 5 years |
Over 5 Year |
Total |
Up
to
a month |
From 1 to 3 months |
From 3 to 12 months |
From 1 to 5 years |
Over 5 Year |
Total | |||||||||||||||||||||||||||||||||||||
| S/(000) | S/(000) | S/(000) | S/(000) | S/(000) | S/(000) | S/(000) | S/(000) | S/(000) | S/(000) | S/000 | S/000 | |||||||||||||||||||||||||||||||||||||
| Financial assets | 32,069,384 | 23,845,192 | 39,885,238 | 60,073,343 | 36,536,832 | 192,409,989 | 26,177,608 | 19,909,373 | 38,171,817 | 62,824,369 | 36,406,209 | 183,489,376 | ||||||||||||||||||||||||||||||||||||
| Financial liabilities by type - | ||||||||||||||||||||||||||||||||||||||||||||||||
| Deposits and obligations | 28,360,646 | 10,523,572 | 18,803,383 | 34,738,531 | 8,662,213 | 101,088,345 | 24,982,659 | 8,678,312 | 16,056,899 | 33,487,729 | 6,077,167 | 89,282,766 | ||||||||||||||||||||||||||||||||||||
| Payables from reverse purchase agreements and security lendings and due to banks and correspondents | 3,658,434 | 1,801,493 | 6,363,038 | 6,597,765 | 6,352,357 | 24,773,087 | 3,015,441 | 2,014,116 | 5,572,115 | 10,581,827 | 5,101,938 | 26,285,437 | ||||||||||||||||||||||||||||||||||||
| Accounts payable to reinsurers and and coinsurers | 51,426 | 140,648 | 31,489 | 9,862 | – | 233,425 | 38,678 | 157,686 | 35,453 | 5,166 | – | 236,983 | ||||||||||||||||||||||||||||||||||||
| Financial liabilities designated at fair value through profit or loss | 168,089 | – | – | – | – | 168,089 | 209,520 | – | – | – | – | 209,520 | ||||||||||||||||||||||||||||||||||||
| Bonds and Notes issued | 833,517 | 130,988 | 1,059,795 | 13,471,851 | 2,905,297 | 18,401,448 | 125,777 | 176,115 | 1,290,997 | 10,292,536 | 6,094,298 | 17,979,723 | ||||||||||||||||||||||||||||||||||||
| Other liabilities | 1,997,270 | 293,864 | 298,986 | 5,310 | 1,341,955 | 3,937,385 | 3,941,629 | 133,844 | 200,758 | 4,749 | 8,305 | 4,289,285 | ||||||||||||||||||||||||||||||||||||
| Total liabilities | 35,069,382 | 12,890,565 | 26,556,691 | 54,823,319 | 19,261,822 | 148,601,779 | 32,313,704 | 11,160,073 | 23,156,222 | 54,372,007 | 17,281,708 | 138,283,714 | ||||||||||||||||||||||||||||||||||||
| Derivative financial liabilities - | ||||||||||||||||||||||||||||||||||||||||||||||||
| Contractual amounts receivable (Inflows) | 150,149 | 123,114 | 464,466 | 1,770,499 | 790,843 | 3,299,071 | 576,992 | 150,223 | 550,989 | 1,765,538 | 522,802 | 3,566,544 | ||||||||||||||||||||||||||||||||||||
| Contractual amounts payable (outflows) | 1,117,375 | 362,073 | 628,800 | 1,791,667 | 862,514 | 4,762,429 | 301,709 | 305,279 | 588,079 | 1,714,861 | 552,438 | 3,462,366 | ||||||||||||||||||||||||||||||||||||
| Total liabilities | (967,226 | ) | (238,959 | ) | (164,334 | ) | (21,168 | ) | (71,671 | ) | (1,463,358 | ) | 275,283 | (155,056 | ) | (37,090 | ) | 50,677 | (29,636 | ) | 104,178 | |||||||||||||||||||||||||||
F- 132
32.4 Operational risk -
Operational risk is the possibility of the occurrence of losses arising from inadequate processes, human error, failure of information technology, relations with third parties or external events. Operational risks can, lead to financial losses and have legal or regulatory compliance consequences, but exclude strategic or reputational risk.
Operational Risks are grouped into internal fraud, external fraud, labor relations and job security, relations with clients, business products and practices, Damages to material assets, business and systems interruption, and Failures in process execution.
One of the Group’s pillars, is to develop an efficient risk culture, and to achieve this, it records operational risks and their respective process controls. The risk map permits their monitoring, prioritization and proposed treatment according to established governance. The group uses a decentralized management and a model based on the lines of defense (3LD in Spanish acronym)
32.5 Risk of the insurance activity -
The principal risk the Group faces under insurance contracts is that the actual claims and benefit payments or the timing thereof, differ from expectations. This is influenced by the frequency of claims, severity of claims, actual benefits paid and subsequent development of long-term claims. Therefore, the objective of the Group is to ensure that sufficient reserves are available to cover these liabilities.
The above risk exposure is mitigated by diversification across a large portfolio of insurance contracts. The variability of risks is also improved by careful selection and implementation of underwriting strategy guidelines, as well as the use of reinsurance arrangements. The Group’s placement of reinsurance is diversified so that it is neither dependent on a single reinsurer nor are the operations of the Group substantially dependent upon any single reinsurance contract.
Life insurance contracts -
The main risks that the Group is exposed to are mortality, morbidity, longevity, investment yield and flow, losses arising from policies due to the expense incurred being different than expected, and the policyholder decision; all of which, do not vary significantly in relation to the location of the risk insured by the Group, type of risk insured or industry.
The Group’s underwriting strategy is designed to ensure that risks are well diversified in terms of type of risk and level of insured benefits. This is achieved through diversification across insurable risks, the use of medical screening in order to ensure that pricing takes account of current health conditions and family medical history, regular review of actual claims experience and product pricing, as well as detailed claims handling procedures. Underwriting limits are in place to enforce appropriate risk selection criteria. For example, the Group has the right not to renew individual policies, it can impose deductibles and it has the right to reject the payment of fraudulent claims.
For contracts when death or disability is the insured risk, the significant factors that could increase the overall frequency of claims are epidemics, widespread changes in lifestyle and natural disasters, resulting in more claims than expected.
For retirement, survival and disability annuities contracts, the most significant factor is continuing improvement in medical science and social conditions that increase longevity.
Management has performed a sensitivity analysis of the technical reserve estimates, Note 15(c).
F- 133
Non-life insurance contracts (general insurance and healthcare) -
The Group mainly issues the following types of non-life general insurance contracts: automobile, home, business and healthcare insurances. Healthcare contracts provide medical expense cover to policyholders. Risks under non-life insurance policies usually cover 12 months.
For general insurance contracts the most significant risks arise from climate changes, natural disasters and other type of damages. For healthcare contracts the most significant risks arise from lifestyle changes, epidemics and medical science and technology improvements.
Most of these risks do not vary significantly in relation to the location of the risk insured by the Group, type of risk insured or industry.
The above risk exposures are mitigated by diversification across a large portfolio of insurance contracts. The variability of risk is improved by careful selection and implementation of underwriting strategies, which are designed to ensure that risks are diversified in terms of type of risks and level of insured benefits. This is achieved, in various cases, through diversification across industry sectors and geography. Furthermore, strict claim review policies to assess all new and ongoing claims, regular detailed review of claims handling procedures and frequent investigation of possible fraudulent claims are all policies and procedures put in place to reduce the Group’s risk exposure. Insurance contracts also entitle the Group to pursue third parties for payment of some or all costs. Also, the Group actively manages and promptly pursues claims, in order to reduce its exposure to unpredictable future developments that can negatively impact the Group.
The Group has also limited its exposure by imposing maximum claim amounts on certain contracts as well as the use of reinsurance arrangements in order to limit its exposure to catastrophic events.
Credit risk of the insurance activity –
Credit risk is the risk that one party to a financial instrument will cause a financial loss to the other party by failing to discharge an obligation at maturity.
The following policies and procedures are in place to mitigate the Group’s exposure to credit risk:
| - | The Group sets the maximum amounts and limits that may be granted to corporate counterparties according to their long- term credit ratings. |
| - | Credit risk from customer balances, will only persist during the grace period specified in the policy document or trust deed until the policy is paid up or terminated. Commissions paid to intermediaries are netted off against amounts receivable from them in order to reduce the risk of doubtful accounts. |
| - | Reinsurance is placed with counterparties that have a good credit rating and concentration of risk is avoided by following guidelines in respect of counterparties’ limits which are set each year by the Board of Directors and are subject to regular reviews. At each reporting date, Management performs an assessment of creditworthiness of reinsurers and updates the reinsurance purchase strategy, determining whether the need exists to establish an allowance for impairment. |
| - | A Group policy setting out the assessment and determination of what constitutes credit risk for the Group is in place, its compliance is monitored and exposures and breaches are reported to the Group risk committee. The policy is regularly reviewed for pertinence and for changes in the risk environment. |
| - | The Group issues Investment Link life insurance contracts whereby the policyholder bears the investment risk on the financial assets held in the Company’s investment portfolio as the policy benefits are directly linked to the value of the assets in the portfolio. Therefore, the Group has no material credit risk on Investment Link financial assets. |
F- 134
32.6 Capital management -
The Group maintains an actively managed capital base to cover risks inherent in its business. The adequacy of the Group’s capital is monitored using, among other measures, the rules and ratios established by the SBS, the supervising authority of its major subsidiaries and for consolidation purposes. Furthermore, capital management responds to market expectations in relation to the solvency of the Group and to support the growth of the businesses considered in the strategic planning. In this way, the capital maintained by the Group enables it to assume unexpected losses in normal conditions and conditions of severe stress.
The Group’s objectives when managing capital are: (i) to comply with the capital requirements set by the regulators of the markets where the entities within the Group operate; (ii) to safeguard the Group’s ability to continue as a going concern so that it can continue to provide returns for shareholders and benefits for other stakeholders; and (iii) to maintain a strong capital base to support the development of its business, in line with the limits and tolerances established in the declaration of Risk Appetite.
As of December 31, 2017 and 2016, the regulatory capital for the subsidiaries engaged in financial and insurance activities amounted to approximately S/21,723.0 million and S/21,174.7 million, respectively. The regulatory capital has been determined in accordance with SBS regulations in force as of said dates. Under the SBS regulations, the Group’s regulatory capital exceeds by approximately S/3,710.3 million the minimum regulatory capital required as of December 31, 2017 (approximately S/3,915.7 million as of December 31, 2016).
F- 135
32.7 Fair values -
| a) | Financial instruments recorded at fair value and fair value hierarchy - |
The following table analyses financial instruments measured at fair value at the reporting date, by the level in the fair value hierarchy into which the fair value measurement is categorized. The amounts are based on the values recognized in the consolidated statement of financial position:
| As of December 31, 2017 | As of December 31, 2016 | |||||||||||||||||||||||||||||||||
| Note | Level 1 | Level 2 | Level 3 | Total | Level 1 | Level 2 | Level 3 | Total | ||||||||||||||||||||||||||
| S/000 | S/000 | S/000 | S/000 | S/000 | S/000 | S/000 | S/000 | |||||||||||||||||||||||||||
| Financial assets | ||||||||||||||||||||||||||||||||||
| Derivative financial instruments: | ||||||||||||||||||||||||||||||||||
| Forward foreign exchange contracts | – | 62,353 | – | 62,353 | – | 73,722 | – | 73,722 | ||||||||||||||||||||||||||
| Interest rate swaps | – | 228,461 | – | 228,461 | – | 310,221 | – | 310,221 | ||||||||||||||||||||||||||
| Cross currency swaps | – | 75,944 | – | 75,944 | – | 108,241 | – | 108,241 | ||||||||||||||||||||||||||
| Currency swaps | – | 332,376 | – | 332,376 | – | 428,928 | – | 428,928 | ||||||||||||||||||||||||||
| Foreign exchange options | – | 2,692 | – | 2,692 | – | 21,490 | – | 21,490 | ||||||||||||||||||||||||||
| 12(b) | – | 701,826 | – | 701,826 | – | 942,602 | – | 942,602 | ||||||||||||||||||||||||||
| Trading securities | 1,611,952 | 2,410,315 | 2,470 | 4,024,737 | 843,939 | 3,162,322 | 8,758 | 4,015,019 | ||||||||||||||||||||||||||
| Financial assets at fair value through profit or loss | 8 | 484,930 | 52,755 | – | 537,685 | 377,552 | 79,988 | 1,559 | 459,099 | |||||||||||||||||||||||||
| Available-for-sale investments: | ||||||||||||||||||||||||||||||||||
| Debt instruments | ||||||||||||||||||||||||||||||||||
| Certificates of deposit BCRP | – | 7,923,706 | – | 7,923,706 | – | 4,802,608 | – | 4,802,608 | ||||||||||||||||||||||||||
| Corporate bonds, leases and subordinate | 3,988,785 | 4,489,275 | 1,461 | 8,479,521 | 3,830,740 | 4,209,173 | 109,493 | 8,149,406 | ||||||||||||||||||||||||||
| Government treasury bonds | 4,074,302 | 658,461 | – | 4,732,763 | 1,688,930 | 558,693 | – | 2,247,623 | ||||||||||||||||||||||||||
| Mutual funds | 745,546 | – | 79,533 | 825,079 | 55,052 | 466,574 | 139,140 | 660,766 | ||||||||||||||||||||||||||
| Other instruments | 105,787 | 1,002,557 | 537,065 | 1,645,409 | 26,571 | 804,192 | 36,613 | 867,376 | ||||||||||||||||||||||||||
| Equity instruments | 317,020 | 417,703 | 82,690 | 817,413 | 1,197,358 | 665,158 | 95,372 | 1,957,888 | ||||||||||||||||||||||||||
| 6(a) | 9,231,440 | 14,491,702 | 700,749 | 24,423,891 | 6,798,651 | 11,506,398 | 380,618 | 18,685,667 | ||||||||||||||||||||||||||
| Total financial assets | 11,328,322 | 17,656,598 | 703,219 | 29,688,139 | 8,020,142 | 15,691,310 | 390,935 | 24,102,387 | ||||||||||||||||||||||||||
| Financial liabilities | ||||||||||||||||||||||||||||||||||
| Derivatives financial instruments: | ||||||||||||||||||||||||||||||||||
| Interest rate swaps | – | 94,785 | – | 94,785 | – | 60,572 | – | 60,572 | ||||||||||||||||||||||||||
| Forward foreign exchange contracts | – | 56,869 | – | 56,869 | – | 55,437 | – | 55,437 | ||||||||||||||||||||||||||
| Cross currency swaps | – | 134,349 | – | 134,349 | – | 49,329 | – | 49,329 | ||||||||||||||||||||||||||
| Currency swaps | – | 349,779 | – | 349,779 | – | 490,475 | – | 490,475 | ||||||||||||||||||||||||||
| Foreign exchange options | – | 980 | – | 980 | – | 17,202 | – | 17,202 | ||||||||||||||||||||||||||
| 12(b) | – | 636,762 | – | 636,762 | – | 673,015 | – | 673,015 | ||||||||||||||||||||||||||
| Bonds and Notes issued at fair value | – | 7,986,539 | – | 7,986,539 | – | 8,412,515 | – | 8,412,515 | ||||||||||||||||||||||||||
| Financial liabilities at fair value through profit or loss | – | 168,089 | – | 168,089 | – | 209,520 | – | 209,520 | ||||||||||||||||||||||||||
| Total financial liabilities | – | 8,791,390 | – | 8,791,390 | – | 9,295,050 | – | 9,295,050 | ||||||||||||||||||||||||||
F- 136
Financial instruments included in the Level 1 category are those that are measured on the basis of quotations obtained in an active market. A financial instrument is regarded as quoted in an active market if quoted prices are readily and regularly available from an exchange, dealer, broker, industry group, pricing service or regulatory agency and those prices represent actual and regularly occurring market transactions on an arm’s length basis.
Financial instruments included in the Level 2 category are those that are measured on the basis of observable market factors. This category includes instruments valued using: quoted prices for similar instruments, either in active or less active markets and other valuation techniques (models) where all significant inputs are directly or indirectly observable based on market data.
Following is a description of how fair value is determined for the main Group’s financial instruments where valuation techniques were used with inputs based on market data which incorporate Credicorp’s estimates on the assumptions that market participants would use for measuring these financial instruments:
| - | Valuation of derivative financial instruments - |
Interest rate swaps, currency swaps and forward exchange contracts are measured by using valuation techniques where inputs are based on market data. The most frequently applied valuation techniques include forward pricing and swap models, using present value calculations. The models incorporate various inputs, including the credit quality of counterparties, foreign exchange, forward rates and interest rate curves. Options are valued using well-known, widely accepted valuation models.
A credit valuation adjustment (CVA) is applied to the “Over-The-Counter” derivative exposures to take into account the counterparty’s risk of default when measuring the fair value of the derivative. CVA is the mark-to market cost of protection required to hedge credit risk from counterparties in this type of derivatives portfolio. CVA is calculated by multiplying the probability of default (PD), the loss given default (LGD) and the expected exposure (EE) at the time of default.
A debit valuation adjustment (DVA) is applied to include the Group’s own credit risk in the fair value of derivatives (that is the risk that the Group might default on its contractual obligations), using the same methodology as for CVA.
As of December 31, 2017, the balance of receivables and payables corresponding to derivatives amounted to S/701.8 million and S/636.8 million, respectively, See Note 12(b), generating DVA and CVA adjustments for approximately S/12.6 million and S/16.3 million, respectively. The net impact of both items in the consolidated statement of income amounted to S/1.4 million. As of December 31, 2016, the balance of receivables and payables corresponding to derivatives amounted to S/942.6 million and S/673.0 million, respectively, See Note 12(b), generating DVA and CVA adjustments for approximately S/8.0 million and S/15.0 million, respectively. Also, the net impact of both items in the consolidated statement of income amounted to S/9.3 million.
| - | Valuation of debt securities available for sale classified in level 2 - |
Valuation of BCRP certificates of deposit, corporate, leasing, subordinated bonds and Government treasury bonds are measured calculating their Net Present Values (NPV) through discounted cash flows, using appropriate and relevant zero coupon rate curves to discount cash flows in the respective currency and considering observable current market transactions.
BCRP certificates of deposit (CD BCRP) are securities issued at a discount in order to regulate the liquidity of the financial system. They are placed mainly through public auction or direct placement, are freely negotiable by their holders in the Peruvian secondary market and may be used as collateral in Repurchase agreements transactions of securities with the BCRP. During 2017, the average daily placement of (CD BCRP) was S/205.0 million, with maturities between 1 and 18 months.
F- 137
Other debt instruments are measured using valuation techniques based on assumptions supported by prices from observable current market transactions, obtained via pricing services. Nevertheless, when prices have not been determined in an active market, fair values are based on broker quotes and assets that are valued using models whereby the majority of assumptions are market observable.
Financial instruments included in the Level 3 category are those that are measured using valuation techniques based on assumptions that are neither supported by prices from observable current market transactions in the same instrument nor are they based on available market data.
In this regard, no significant differences were noted between the estimated fair values and the respective carrying amounts.
As of December 31, 2017 and 2016, the net unrealized gain of Level 3 financial instruments amounted to S/39.1 million and S/40.6 million, respectively. During 2017 and 2016, changes in the carrying amount of Level 3 financial instruments have not been significant since there were no purchases, issuances, settlements or any other significant movements or transfers from level 3 to Level 1 or Level 2 or vice versa. Also, there have been no transfers between Level 1 and Level 2.
F- 138
| b) | Financial instruments not measured at fair value - |
Set out below is the disclosure of the comparison between the carrying amounts and fair values of the financial instruments, which are not measured at fair value, presented in the consolidated statement of financial position by level of the fair value hierarchy:
| As of December 31, 2017 | As of December 31, 2016 | |||||||||||||||||||||||||||||||||||||||
| Level 1 | Level 2 | Level 3 | Fair value | Book value | Level 1 | Level 2 | Level 3 | Fair value | Book value | |||||||||||||||||||||||||||||||
| S/000 | S/000 | S/000 | S/000 | S/000 | S/000 | S/000 | S/000 | S/000 | S/000 | |||||||||||||||||||||||||||||||
| Assets | ||||||||||||||||||||||||||||||||||||||||
| Cash and due from banks | – | 23,221,987 | – | 23,221,987 | 23,221,987 | – | 16,645,769 | – | 16,645,769 | 16,645,769 | ||||||||||||||||||||||||||||||
| Cash collateral, reverse repurchase | – | 7,480,420 | – | 7,480,420 | 7,480,420 | – | 10,919,624 | – | 10,919,624 | 10,919,624 | ||||||||||||||||||||||||||||||
| Held-to-maturity investments | 4,088,520 | 561,562 | – | 4,650,082 | 4,413,373 | 5,215,704 | – | – | 5,215,704 | 5,118,420 | ||||||||||||||||||||||||||||||
| Loans, net | – | 115,346,836 | – | 115,346,836 | 115,346,836 | – | 110,137,973 | – | 110,137,973 | 110,393,753 | ||||||||||||||||||||||||||||||
| Premiums and other policies receivable | – | 656,829 | – | 656,829 | 656,829 | – | 643,224 | – | 643,224 | 643,224 | ||||||||||||||||||||||||||||||
| Accounts receivable from reinsurers and coinsurers | – | 715,695 | – | 715,695 | 715,695 | – | 454,187 | – | 454,187 | 454,187 | ||||||||||||||||||||||||||||||
| Bank acceptances | – | 532,034 | – | 532,034 | 532,034 | – | 491,139 | – | 491,139 | 491,139 | ||||||||||||||||||||||||||||||
| Other assets | – | 1,759,125 | – | 1,759,125 | 1,759,125 | – | 1,286,082 | – | 1,286,082 | 1,286,082 | ||||||||||||||||||||||||||||||
| Total | 4,088,520 | 150,274,488 | – | 154,363,008 | 154,126,299 | 5,215,704 | 140,577,998 | – | 145,793,702 | 145,952,198 | ||||||||||||||||||||||||||||||
| Liabilities | ||||||||||||||||||||||||||||||||||||||||
| Deposits and obligations | – | 97,170,411 | – | 97,170,411 | 97,170,411 | – | 85,916,387 | – | 85,916,387 | 85,916,387 | ||||||||||||||||||||||||||||||
| Payables from repurchase agreements | – | 13,415,843 | – | 13,415,843 | 13,415,843 | – | 15,127,999 | – | 15,127,999 | 15,127,999 | ||||||||||||||||||||||||||||||
| Due to Banks and correspondents and other entities | – | 8,034,990 | – | 8,034,990 | 7,996,889 | – | 7,615,935 | – | 7,615,935 | 7,493,916 | ||||||||||||||||||||||||||||||
| Bank acceptances | – | 532,034 | – | 532,034 | 532,034 | – | 491,139 | – | 491,139 | 491,139 | ||||||||||||||||||||||||||||||
| Payable to reinsurers and coinsurers | – | 235,185 | – | 235,185 | 235,185 | – | 233,892 | – | 233,892 | 233,892 | ||||||||||||||||||||||||||||||
| Bond and Notes issued | – | 8,830,070 | – | 8,830,070 | 8,255,718 | – | 8,137,945 | – | 8,137,945 | 7,527,088 | ||||||||||||||||||||||||||||||
| Other liabilities | – | 3,270,714 | – | 3,270,714 | 3,270,714 | – | 2,540,980 | – | 2,540,980 | 2,540,980 | ||||||||||||||||||||||||||||||
| Total | – | 131,489,247 | – | 131,489,247 | 130,876,794 | – | 120,064,277 | – | 120,064,277 | 119,331,401 | ||||||||||||||||||||||||||||||
F- 139
The methodologies and assumptions used by the Group to determine fair values depend on the terms and risk characteristics of the various financial instruments and include the following:
| (i) | Long-term fixed-rate and variable-rate loans are evaluated by the Group based on parameters such as interest rates, specific country risk factors, and individual creditworthiness of the customer and the risk characteristics of the financed project. Based on this evaluation, allowances are taken into account for the incurred losses of these loans. As of December 31, 2017 and 2016, the carrying amounts of loans, net of allowances, were not materially different from their calculated fair values. |
| (ii) | Assets for which fair values approximate their carrying value - For financial assets and financial liabilities that are liquid or have a short term maturity (less than three months) it is assumed that the carrying amounts approximate to their fair values. This assumption is also applied to demand deposits, savings accounts without a specific maturity and variable rate financial instruments. |
| (iii) | Fixed rate financial instruments - The fair value of fixed rate financial assets and liabilities carried at amortized cost are estimated by comparing market interest rates when they were first recognized with current market rates offered for similar financial instruments. The estimated fair value of fixed interest bearing deposits is based on discounted cash flows using prevailing market interest rates for financial instruments with similar credit risk and maturity. For quoted debt issued the fair values are calculated based on quoted market prices. When quoted market prices are not available, a discounted cash flow model is used based on a current interest rate yield curve appropriate for the remaining term to maturity. |
32.8 Fiduciary activities, management of funds and pension funds -
The Group provides custody, trustee, investment management and advisory services to third parties; therefore, the Group makes allocations and purchase and sale decisions in relation to a wide range of financial instruments. Assets that are held in a fiduciary capacity are not included in these consolidated financial statements. These services give rise to the risk that the Group will be accused of mismanagement or under-performance.
As of December 31, 2017 and 2016, the assigned value of the financial assets under administration off the balance sheet (in millions of soles) is as follows:
| 2017 | 2016 | |||||||
| Pension funds | 48,868 | 42,871 | ||||||
| Investment funds | 37,567 | 51,484 | ||||||
| Equity managed | 12,874 | 12,417 | ||||||
| Bank trusts | 3,435 | 3,482 | ||||||
| Total | 102,744 | 110,254 | ||||||
F- 140
| 33 | COMMITMENTS AND CONTINGENCIES |
Legal claim contingencies –
| (i) | Madoff Trustee Litigations - |
On September 22, 2011, the Trustee for the liquidations of Bernard L. Madoff Investment Securities LLC (BLMIS), and the substantively consolidated state of Bernard L. Madoff (“the Madoff Trustee”) filed a complaint against Credicorp’s subsidiary Atlantic Security Bank (ASB) in U.S. Bankruptcy Court Southern District of New York, for an amount of approximately US$120.0 million (“the Complaint”), equivalent to approximately S/388.9 million, which corresponds to the funds that ASB managed in Atlantic US Blue Chip Fund and that were redeemed between the end of 2004 and the beginning of 2005 from Fairfield Sentry Limited Fund in Liquidation (hereafter “Fairfield”), a fund that invested in BLMIS.
The Complaint further alleges that the Madoff Trustee filed an adversary proceeding against Fairfield, seeking to avoid and recover the initial transfers of money from BLMIS to Fairfield; that on June 7 and 10, 2011, the Bankruptcy Court approved a settlement between the Madoff Trustee, Fairfield and others; and that the Madoff Trustee is entitled to recover the sums sought from ASB as “subsequent transfers” of “avoided transfers” from BLMIS to Fairfield that Fairfield subsequently transferred to ASB. The Madoff Trustee has filed similar actions against other alleged “subsequent transferees” that invested in Fairfield and its sister entities which, in turn, invested in and redeemed funds from BLMIS.
On July 7, 2014, the District Court of New York issued an opinion indicating that the Bankruptcy Laws of the United States are not applicable extraterritorially to permit the recovery of subsequent transfers made outside of the United States, between foreign entities. Furthermore, the District Court returned the case to the Bankruptcy Court, which, on November 22, 2016, issued a verdict establishing that certain subsequent transfers made overseas could not be recovered under the Bankruptcy Laws of the United States and rejected the demands presented by the Trustee of Madoff against the foreign entities; among them, the ASB. On March 16, 2017, the Trustee appealed this decision, additionally seeking that the appeal be heard be heard before the Second Circuit of the Court of Appeal of the United States. On September 27, 2017, the Court of Appeals admitted the hearing of the Trustee’s appeal directly before said Court. On January 10, 2018, the Trustee presented to the Court the written arguments that support his appeal.
Management believes that ASB has valid defense arguments against the Madoff Trustee’s claims alleged in the Complaint and intends to contest these claims vigorously. Management considers, among other substantial defenses, that the Complaint considers only the amounts withdrawn, without taking into account the amounts invested in Fairfield. Furthermore, ASB after redeeming said funds from Fairfield, re-invested them in BLMIS through another vehicle, resulting in a net loss in the funds that ASB managed on behalf of its clients for approximately US$78.0 million (equivalent to approximately S/252.8 million) as of December, 2008.
| (ii) | Fairfield Liquidator Litigation - |
On April 13, 2012, Fairfield and its representative, Kenneth Krys (the “Fairfield Liquidator”), filed an adversary proceeding against ASB pursuant to Chapter 15 of the U.S. Bankruptcy Code, in the U.S Bankruptcy Court for the Southern District of New York, styled as Fairfield Sentry Limited (In Liquidation) v. Atlantic Security Bank, Adv. Pro. N° 12-01550 (BRL) (Bankr. S.D.N.Y.) (“Fairfield v. ASB Adversary Proceeding”). The complaint sought to recover the amount of approximately US$115.0 million, reflecting ASB’s redemptions of certain investments in Fairfield Sentry Limited, together with investment returns thereon. These are essentially the same moneys that the Madoff Trustee seeks to recover in the Madoff Litigation described above.
F- 141
Thereafter, the Fairfield v. ASB Adversary Proceeding was procedurally consolidated by the Bankruptcy Court with other adversary actions by the Fairfield Liquidator against former investors in Fairfield Sentry. Pursuant to that consolidation, and by consent of the parties, the Bankruptcy Court decreed the suspension of all proceedings in the Fairfield Liquidator adversary actions (except for the filing of amended complaints) in the light of the pending litigation in the British Virgin Island courts (BVI litigation) calling into question the Fairfield Liquidator’s ability to seek recovery of funds invested with and redeemed from Fairfield Sentry. This suspension has been lifted, and on September 18, 2016, the Fairfield Liquidator filed a New Complaint (the modified original Complaint) against ASB. On January 13, 2017, ASB has presented, together with other defendants, a procedural motion/defense for the Complaint to be dismissed. On January 25, 2018, a hearing was held in which the parties have orally presented their arguments in support of each of their positions
Management considers that ASB has substantial defenses against the Fairfield Liquidator’s claims alleged in the Amended Complaint and intends to contest these claims vigorously.
| 34 | SUBSEQUENT EVENT |
| i) | Changes in the organization of Credicorp’s companies |
In order to optimize the management of the Companies of the Credicorp Group, at the Board of Directors’ of Credicorp held on December 20, 2017, it was agreed to organize the Credicorp companies in four business lines:
| - | Universal Banking, made up of BCP and BCP Bolivia. |
| - | Insurance and Pensions, made up of Pacífico Compañía de Seguros y Reaseguros and Prima AFP. |
| - | Microfinance, made up of Mibanco and Edyficar. |
| - | Investment Banking & Wealth Management, made up of Credicorp Capital Ltd., the Wealth Management team and ASB. |
Likewise, Mr. Gianfranco Ferrari was appointed Chief Executive Officer of BCP, replacing Mr. Walter Bayly; and Mr. Walter Bayly was appointed Chief Executive Officer of Credicorp Ltd., replacing Mr. Dionisio Romero.
These changes have been effective as of April 1, 2018.
| ii) | Acquisition of the non-controlling interest of Mibanco |
On April 18, 2018, Grupo Crédito and BCP acquired the 3.23 percent and 0.06 percent interest held by the minority shareholders of Mibanco, respectively, for approximately S/129.0 million and 2.4 million, respectively. After that, Grupo Crédito and BCP came to have 4.99 percent and 93.66 percent of the capital stock of Mibanco, respectively.
These non-controlling interest acquisitions were recorded as an equity transaction.
F- 142