As filed with the Securities and Exchange Commission on April 10, 2013
SECURITIES AND EXCHANGE COMMISSION
WASHINGTON, D.C. 20549
FORM 20-F
|
o
|
REGISTRATION STATEMENT PURSUANT TO SECTION 12(b) OR (g) OF THE SECURITIES EXCHANGE ACT OF 1934
|
OR
|
x
|
ANNUAL REPORT PURSUANT TO SECTION 13 OR 15(d) OF THE SECURITIES EXCHANGE ACT OF 1934
|
For the fiscal year ended December 31, 2012
OR
|
o
|
TRANSITION REPORT PURSUANT TO SECTION 13 OR 15(d) OF THE SECURITIES EXCHANGE ACT OF 1934
|
OR
|
o
|
SHELL COMPANY REPORT PURSUANT TO SECTION 13 OR 15(d) OF THE SECURITIES EXCHANGE ACT OF 1934
|
Commission file number: 001-12568
BBVA BANCO FRANCÉS S.A.
(Exact name of Registrant as specified in its charter)
BBVA FRENCH BANK
(Translation of Registrant’s name into English)
Republic of Argentina
(Jurisdiction of incorporation or organization)
Reconquista 199
Reconquista 199
(C1003ABB) Buenos Aires. Republic of Argentina
(Address of principal executive offices)
Adrián Bressani – 011-54-11-4346-4286 – abressani @bbvafrances.com.ar – Reconquista 281 3° (C1003ABE) Buenos Aires, Republic of Argentina
(Name, Telephone, E-mail and/or Facsimile number and Address of Company Contact Person)
Securities registered or to be registered pursuant to Section 12(b) of the Act:
|
Title of each class
|
Name of each exchange on which registered
|
|
|
American Depositary Shares, each representing the right to receive three ordinary shares, par value Ps.1.00 per share
|
New York Stock Exchange
|
|
|
Ordinary shares, par value Ps.1.00 per share
|
New York Stock Exchange*
|
|
*
|
The ordinary shares are not listed for trading, but are listed only in connection with the registration of the American Depositary Shares, pursuant to requirements of the New York Stock Exchange.
|
Securities registered or to be registered pursuant to Section 12(g) of the Act: None
Securities for which there is a reporting obligation pursuant to Section 15(d) of the Act: None
The number of outstanding shares of each of the classes of capital or common stock of the registrant
as of the close of the period covered by the annual report:
|
Title of class
|
Number of shares outstanding
|
|
|
Ordinary Shares, par value Ps.1.00 per share
|
536,877,850
|
Indicate by check mark if the registrant is a well-known seasoned issuer, as defined in Rule 405 of the
Securities Act
.
o
Yes
x
No
If this report is an annual or transition report, indicate by check mark if the registrant is not required to file reports pursuant to Section 13 or 15(d) of the Securities Exchange Act of 1934.
o
Yes
x
No
Indicate by check mark whether the registrant (1) has filed all reports required to be filed by Section 13 or 15(d) of the Securities Exchange Act of 1934 during the preceding 12 months (or for such shorter period that the registrant was required to file such reports)
,
and (2) has been subject to such filing requirements for the past 90 days:
x
Yes
o
No
Indicate by check mark whether the registrant has submitted electronically and posted on its corporate Web site, if any, every Interactive Data File required to be submitted and posted pursuant to Rule 405 of Regulation S-T (§232.405 of this chapter) during the preceding 12 months (or for such shorter period that the registrant was required to submit and post such files).
o
Yes
o
No
Indicate by check mark if the registrant is a large accelerated filer, an accelerated filer, or a non-accelerated filer. See definition of “accelerated filer and large accelerated filer” in Rule 12b-2 of the Exchange Act. (Check one):
Large accelerated filer
o
Accelerated filer
x
Non-accelerated filer
o
Indicate by check mark which basis of accounting the registrant has used to prepare the financial statements included in this filing:
|
U.S. GAAP
o
|
International Financial Reporting Standards
by the International Accounting Standards o Board as issued |
Other
x
|
If “Other” has been checked in response to the previous question, indicate by check mark which financial statement item the registrant has elected to follow.
o
Item 17
x
Item 18
If this is an annual report, indicate by check mark whether the registrant is a shell company (as defined in Rule 12b-2 of the Exchange Act).
o
Yes
x
No
|
|
Page
|
|
|
1
|
||
|
1
|
||
|
2
|
||
|
PART I
|
||
|
ITEM 1.
|
3
|
|
|
ITEM 2.
|
3
|
|
|
ITEM 3.
|
3
|
|
|
ITEM 4.
|
13
|
|
|
ITEM 4A.
|
104
|
|
|
ITEM 5.
|
105
|
|
|
ITEM 6.
|
134
|
|
|
ITEM 7.
|
146
|
|
|
ITEM 8.
|
148
|
|
|
ITEM 9.
|
148
|
|
|
ITEM 10.
|
152
|
|
|
ITEM 11.
|
162
|
|
|
ITEM 12.
|
167
|
|
|
PART II
|
||
|
ITEM 13.
|
169
|
|
|
ITEM 14.
|
169
|
|
|
ITEM 15.
|
169
|
|
|
ITEM 16A.
|
171
|
|
|
ITEM 16B.
|
171
|
|
|
ITEM 16C.
|
172
|
|
|
ITEM 16D.
|
172
|
|
|
ITEM 16E.
|
172
|
|
|
ITEM 16F.
|
172
|
|
|
ITEM 16G.
|
172
|
|
|
PART III
|
||
|
ITEM 17.
|
176
|
|
|
ITEM 18.
|
176
|
|
|
ITEM 19.
|
176
|
|
This Form 20-F contains words, such as “believe”
, “expect”, “estimate”, “intend”, “plan”, “may” and “anticipate” and similar expressions, that identify forward-looking statements, which reflect our views about future events and financial performance. Actual results could differ materially as a result of factors beyond our control, including but not limited to:
|
|
§
|
changes in general economic, business or political or other conditions in the Republic of Argentina (“Argentina”) or changes in general economic or business conditions in Latin America;
|
|
|
§
|
changes in capital markets in general that may affect policies or towards lending to Argentina or Argentine companies;
|
|
|
§
|
increased costs and decreased income related to macroeconomic variables such as exchange rates and the Consumer Price Index (“CPI”);
|
|
|
§
|
unanticipated increases in financing and other costs or the inability to obtain additional debt or equity financing on attractive terms; and
|
|
|
§
|
the factors discussed under
“Item 3. Key Information—D. Risk Factors”
.
|
Accordingly, readers are cautioned not to place undue reliance on these forward-looking statements, which speak only as of the date hereof. BBVA Francés undertakes no obligation to update or revise these forward-looking statements or to publicly release the results of any revisions to these forward-looking statements. The accompanying information in this annual report, including, without limitation, the information under
“Item 4. Information on the Company”
,
“Item 5. Operating and Financial Review and Prospects”
and
“Item 11. Quantitative and Qualitative Disclosures About Market Risk”
identifies important factors that could cause material differences between any forward-looking statements and actual results.
General
BBVA
Banco Francés S.A. (“BBVA Francés”)
is an Argentine bank and maintains its financial books and records in Argentine pesos and prepares its Consolidated Financial Statements in conformity with the accounting rules of the Banco Central de la República Argentina (the “Central Bank” or “BCRA”) related thereto (“Argentine Banking GAAP”), which differ in some respects from generally accepted accounting principles in Argentina (see Note 4 to our Consolidated Financial Statements) and the accounting principles in the United States (“U.S. GAAP”). See Note 22 to our Consolidated Financial Statements for a description of the principal differences between Argentine Banking GAAP and U.S. GAAP, as they relate to us, and a reconciliation to U.S. GAAP of net income and total stockholders’ equity. In this annual report, references to “$”, “U.S.$” and “dollars” are to United States dollars, references to “Ps.” or “pesos” are to Argentine pesos. Percentages and certain dollar and peso amounts have been rounded for ease of presentation. Unless otherwise stated, all market share and other industry information has been derived from information published by the Central Bank.
The Consolidated Financial Statements are presented in accordance with the guidelines of Technical Resolution Nr. 21 of the Argentine Federation of Economic Sciences Professional Association (Federación Argentina de Consejos Profesionales de Ciencias Económicas—“FACPCE”) and the disclosure standards set by the Central Bank.
The Bank presents its Consolidated Financial Statements in equivalents purchasing power. These Consolidated Financial Statements recognize the effects of the changes in the purchasing power of the currency through February 28, 2003, following the restatement method established by FACPCE Technical Resolution Nr. 6 (modified by Technical Resolution Nr. 19), using an adjustment rate derived from the Argentine internal Wholesale Price Index published by the National Institute of Statistics and Census (“INDEC”) of Argentina.
According to the above-mentioned method, the accounting measurements were restated by the purchasing power changes through August 31, 1995. As of that date, based on the prevailing economic stability conditions and according to the National Securities Commission (“CNV”) General Resolution Nr. 272 and Central Bank Communication “A” 2365, the accounting measures were not restated through December 31, 2001. In view of CNV General Resolution Nr. 415 and Central Bank Communication “A” 3702, the method was reinstated effective as of January 1, 2002, considering the previous accounting measures restated as of December 31, 2001.
By Communication “A” 3921 of the Central Bank and General Resolution Nr. 441/03 of the CNV, in compliance with Decree Nr. 664/03 of the Federal Executive, application of the restatement method to Consolidated Financial Statements in equivalent purchasing power has been suspended as of March 1, 2003. Accordingly, BBVA Banco Francés S.A. applied the mentioned restatement method until February 28, 2003.
Unless otherwise indicated, financial information contained in this annual report reflects the consolidation of the following subsidiaries at and for the fiscal years indicated below:
|
|
December 31,
|
||
|
Entity
|
2012
|
2011
|
2010
|
|
PSA Finance Argentina Compañía Financiera S.A.
|
X
|
X
|
X
|
|
Consolidar AFJP S.A. (undergoing liquidation proceedings)
|
X
|
X
|
X
|
|
Consolidar Cía. de Seguros de Retiro S.A.
(1)
|
X
|
||
|
BBVA Francés Valores Sociedad de Bolsa S.A.
|
X
|
X
|
X
|
|
BBVA Francés Asset Management S.A. Sociedad Gerente de Fondos Comunes de Inversión
|
X
|
X
|
X
|
|
(1)
|
See Note 1.4 to the Consolidated Financial Statements.
|
On January 7, 2002, Argentina abandoned the peso-dollar parity introduced in April 1991 under Law Nr. 23,928 (the “Convertibility Law”). Following the initial devaluation and the setting of an official rate exchange at Ps.1.4 per U.S.$1.00, the peso was allowed to float, and as of April 5, 2013 traded at approximately Ps.5.1370 per U.S.$1.00. See
“
Item 3. Key Information—
Exchange Rates”
for information regarding the evolution of rates of exchange since fiscal year 2008.
As used in this Form 20-F, “BBVA Francés”, the “Bank”, the “Company” and terms such as “we”, “us” and “our” mean BBVA Banco Francés S.A. and its consolidated subsidiaries unless the context otherwise requires.
- PART I -
Not applicable.
Not applicable.
Not applicable.
|
A.
|
Selected Financial Data
|
The information in this section has been selected from the Consolidated Financial Statements as of the dates and for the fiscal years indicated. This information should be read in conjunction with, and is qualified in its entirety by reference to,
“Risk Factors”
, the Consolidated Financial Statements and the related notes. The selected financial data for the fiscal years ended December 31, 2012, 2011, 2010, 2009 and 2008 are derived from the Consolidated Financial Statements. For information concerning the preparation and presentation of the Consolidated Financial Statements, see
“Presentation of Financial Information”
.
See
“D. Risk Factors—Factors Related to Argentina”
, and
“Risk Factors—Factors Related to BBVA Francés”
.
|
For the fiscal year ended December 31,
|
||||||||||||||||||||
|
2012
|
2011 (11) | 2010 | 2009 | 2008 | ||||||||||||||||
|
(in thousands of pesos)
(1)
|
||||||||||||||||||||
|
CONSOLIDATED INCOME STATEMENT
|
||||||||||||||||||||
|
Amounts in accordance with Argentine Banking GAAP
|
||||||||||||||||||||
|
Financial income
|
5,705,193 | 3,565,030 | 3,298,259 | 3,039,470 | 1,946,432 | |||||||||||||||
|
Financial expenses
|
(2,061,131 | ) | (1,355,698 | ) | (814,673 | ) | (975,431 | ) | (1,212,738 | ) | ||||||||||
|
Gross intermediation margin
|
3,644,062 | 2,209,332 | 2,483,586 | 2,064,039 | 733,694 | |||||||||||||||
|
Provision for loan losses
|
(256,259 | ) | (132,663 | ) | (179,353 | ) | (245,966 | ) | (36,708 | ) | ||||||||||
|
Service charge income
|
2,530,197 | 1,957,724 | 1,485,442 | 1,204,703 | 981,891 | |||||||||||||||
|
Service charge expenses
|
(683,730 | ) | (519,630 | ) | (406,347 | ) | (279,691 | ) | (234,328 | ) | ||||||||||
|
Operating expenses
|
(3,039,731 | ) | (2,279,500 | ) | (1,969,461 | ) | (1,562,326 | ) | (1,149,778 | ) | ||||||||||
|
Net other (expenses) / income
|
(26,400 | ) | 254,845 | 38,867 | (44,063 | ) | 67,776 | |||||||||||||
|
Income before income tax
|
2,168,139 | 1,490,108 | 1,452,734 | 1,136,696 | 362,547 | |||||||||||||||
|
Income tax
|
(864,625 | ) | (549,992 | ) | (272,923 | ) | (362,439 | ) | (23,695 | ) | ||||||||||
|
Net income
|
1,303,514 | 940,116 | 1,179,811 | 774,257 | 338,852 | |||||||||||||||
|
Net (loss) / income on minority interests in subsidiaries
|
(37,874 | ) | 6,783 | (16,538 | ) | (17,851 | ) | (8,589 | ) | |||||||||||
|
Final consolidated income from continued operations
|
1,265,640 | 946,899 | 1,163,273 | 756,406 | 330,263 | |||||||||||||||
|
Final consolidated (loss) / income from discontinued operations
|
(1,961 | ) | 58,678 | 34,906 | (37,944 | ) | (8,753 | ) | ||||||||||||
|
Final consolidated income
|
1,263,679 | 1,005,577 | 1,198,179 | 718,462 | 321,510 | |||||||||||||||
|
Net operating revenue
(3)
|
5,490,529 | 3,647,426 | 3,562,681 | 2,989,051 | 1,481,257 | |||||||||||||||
|
Net operating income
(4)
|
2,194,539 | 1,235,263 | 1,413,867 | 1,180,759 | 294,771 | |||||||||||||||
|
Net income per ordinary shares from continued operations
(2) (9)
|
2.36 | 1.76 | 2.17 | 1.55 | 0.70 | |||||||||||||||
|
Net income per ADS from continued operations
(2) (9)
|
7.08 | 5.28 | 6.51 | 4.65 | 2.10 | |||||||||||||||
|
Net income per ordinary shares
(2) (9)
|
2.35 | 1.87 | 2.23 | 1.47 | 0.68 | |||||||||||||||
|
Net income per ADS
(2) (9)
|
7.05 | 5.61 | 6.69 | 4.41 | 2.04 | |||||||||||||||
|
Declared dividends per ordinary share
(9) (10)
|
— | — | 1.49899 | 0.98439 | 0.21215 | |||||||||||||||
|
Declared dividends per ADS
(9) (10)
|
— | — | 4.49697 | 2.95317 | 0.63645 | |||||||||||||||
|
Net operating income per ordinary shares
(2) (9)
|
4.09 | 2.30 | 2.64 | 2.42 | 0.63 | |||||||||||||||
|
Net operating income per ADS
(2) (9)
|
12.27 | 6.90 | 7.92 | 7.26 | 1.89 | |||||||||||||||
|
Average ordinary shares outstanding (000s) primary
(9)
|
536,878 | 536,620 | 536,361 | 487,611 | 471,361 | |||||||||||||||
|
Amounts in accordance with U.S. GAAP:
|
||||||||||||||||||||
|
Net income
|
1,541,104 | 698,807 | 804,101 | 1,029,755 | 910,294 | |||||||||||||||
|
Net income per ordinary share
(2) (9)
|
2.87 | 1.30 | 1.50 | 2.11 | 1.87 | |||||||||||||||
|
Net income per ADS
(2) (9)
|
8.61 | 3.90 | 4.50 | 6.33 | 5.61 | |||||||||||||||
|
Average ordinary shares outstanding (000s) primary
(9)
|
536,878 | 536,620 | 536,361 | 487,611 | 487,611 | |||||||||||||||
|
CONSOLIDATED BALANCE SHEET
|
||||||||||||||||||||
|
Amounts in accordance with Argentine Banking GAAP
|
||||||||||||||||||||
|
Cash and due from banks
|
8,614,889 | 6,353,428 | 5,691,806 | 5,255,412 | 4,243,080 | |||||||||||||||
|
Government and private securities
|
4,101,846 | 5,565,029 | 7,495,382 | 7,214,232 | 5,233,660 | |||||||||||||||
|
Loans, net of allowances
|
28,493,431 | 22,697,031 | 16,699,852 | 11,751,889 | 12,507,489 | |||||||||||||||
|
Other assets
|
3,574,413 | 4,390,157 | 2,693,206 | 2,170,060 | 3,841,236 | |||||||||||||||
|
Total assets
|
44,784,579 | 39,005,645 | 32,580,246 | 26,391,593 | 25,825,465 | |||||||||||||||
|
Deposits
|
34,165,053 | 29,165,704 | 22,461,307 | 18,334,845 | 17,079,203 | |||||||||||||||
|
Other liabilities and minority interest in subsidiaries
|
5,487,590 | 5,971,684 | 6,372,024 | 5,130,276 | 6,670,238 | |||||||||||||||
|
Total liabilities and minority interest in subsidiaries
|
39,652,643 | 35,137,388 | 28,833,331 | 23,465,121 | 23,749,441 | |||||||||||||||
|
Capital stock
|
536,878 | 536,878 | 536,361 | 536,361 | 471,361 | |||||||||||||||
|
Issuance premiums
|
182,511 | 182,511 | 175,132 | 175,132 | 175,132 | |||||||||||||||
|
Adjustments to stockholders’ equity
|
312,979 | 312,979 | 312,979 | 312,979 | 312,979 | |||||||||||||||
|
Retained earnings
|
2,835,889 | 1,042,021 | 802,385 | 658,693 | 594,391 | |||||||||||||||
|
Unrealized valuation difference
|
— | — | 88,131 | (14,133 | ) | (181,119 | ) | |||||||||||||
|
Unappropriated earnings
|
1,263,679 | 1,793,868 | 1,831,927 | 1,257,440 | 703,280 | |||||||||||||||
|
Total stockholders’ equity
|
5,131,936 | 3,868,257 | 3,746,915 | 2,926,472 | 2,076,024 | |||||||||||||||
|
For the fiscal year ended December 31,
|
||||||||||||||||||||
|
2012
|
2011 (11) | 2010 | 2009 | 2008 | ||||||||||||||||
|
(in thousands of pesos)
(1)
|
||||||||||||||||||||
|
Amounts in accordance with U.S. GAAP
|
||||||||||||||||||||
|
Total assets
|
47,552,013 | 40,367,604 | 33,448,725 | 27,760,274 | 27,199,899 | |||||||||||||||
|
Total stockholders’ equity
|
5,535,611 | 4,003,440 | 4,500,072 | 3,696,499 | 2,225,579 | |||||||||||||||
|
SELECTED RATIOS IN ACCORDANCE WITH ARGENTINE BANKING GAAP
|
||||||||||||||||||||
|
Profitability and Performance
|
||||||||||||||||||||
|
Return on average total assets
(5)
|
3.27% | 2.65% | 3.95% | 2.90% | 1.38% | |||||||||||||||
|
Return on average stockholders’ equity
(6)
|
28.51% | 24.87% | 34.86% | 30.24% | 15.98% | |||||||||||||||
|
Services charge income as a percentage of operating expenses
|
83.24% | 85.88% | 75.42% | 77.11% | 85.40% | |||||||||||||||
|
Operating expenses as a percentage of average total assets
(7)
|
7.86% | 6.37% | 6.68% | 5.98% | 4.81% | |||||||||||||||
|
Capital
|
||||||||||||||||||||
|
Stockholders’ equity as a percentage of total assets
|
11.46% | 9.92% | 11.50% | 11.09% | 8.04% | |||||||||||||||
|
Total liabilities as a multiple of stockholders’ equity
|
7.73x | 9.08x | 7.70x | 8.02x | 11.44x | |||||||||||||||
|
Credit Quality
|
||||||||||||||||||||
|
Allowances for doubtful loans as a percentage of total loans
|
1.81% | 1.91% | 2.32% | 2.79% | 1.55% | |||||||||||||||
|
Non-performing loans as a percentage of gross loans
(8)
|
0.65% | 0.45% | 0.47% | 1.00% | 0.87% | |||||||||||||||
|
Allowances for doubtful loans as a percentage of non-performing loans
(8)
|
278.79% | 422.14% | 492.96% | 277.93% | 177.50% | |||||||||||||||
|
(1)
|
Except net income per-ordinary share and net income per-ADS data and financial ratios.
|
|
(2)
|
Assumes average ordinary shares outstanding in each period. The cash dividend amounts do not reflect any deduction for certain charges that are taken with regards to the “American Depositary Receipts”.
|
|
(3)
|
Includes: financial income, financial expenses, service charge income and service charge expenses.
|
|
(4)
|
Includes: financial income, financial expenses, provision for loan losses, services charge income, service charge expenses and operating expenses.
|
|
(5)
|
Net income as a percentage of average total assets, computed as the average of fiscal-year-beginning and fiscal-year-ending balances.
|
|
(6)
|
Net income as a percentage of average stockholders’ equity, computed as the average of fiscal-year-beginning and fiscal-year-ending balances.
|
|
(7)
|
Operating expenses as a percentage of average total assets, computed as the average of fiscal-year-beginning and fiscal-year-ending balances.
|
|
(8)
|
Non-performing loans include all loans to borrowers classified as “Problem”, “Medium Risk”, “High Risk of Insolvency”, “High Risk”, “Irrecoverable” and “Irrecoverable for Technical Decision” according to the Central Bank’s loan classification system as well as all loans contractually past due 90 days or more. See “
|
|
(9)
|
The average ordinary shares outstanding was computed as the average of the previous twelve months.
|
|
(10)
|
For the fiscal years ended December 31, 2012 and 2011, the Bank decided not to declare and distribute dividends as result of the issuance of Communications “A” 5272 and 5273 of the Central Bank (see
“Item 8. Financial Information—Dividends”)
. For the fiscal years ended December 31, 2010 and 2009, the dividends were paid totally in cash. For the fiscal year ended December 31, 2008 the dividends paid in 2009 were Ps.35 million in cash and Ps.65 million through the issue of new shares.
|
|
(11)
|
See Note 3.3 to our Consolidated Financial Statements.
|
Declared Dividends
The table below shows the declared dividends paid on each ordinary share and the equivalent of those dividends expressed in terms of dividends per American Depositary Share, each representing three ordinary shares (the “ADSs”), in each case adjusted for all stock dividends during the relevant periods. The Central Bank requires that we maintain 20% of our net income in legal reserves.
|
Decla
red
Dividends
Per Ordinary Share
(6)
|
Declared Dividends
Per ADS
(6)
|
|||||||||||||||
|
Ps.
(1)
|
U.S.$
|
Ps.
(1)
|
U.S.$
|
|||||||||||||
|
December 31, 2012
(2)
|
— | — | — | — | ||||||||||||
|
December 31, 2011
(2)
|
— | — | — | — | ||||||||||||
|
December 31, 2010
(2) (5)
|
1.49899 | 0.36994 | 4.49697 | 1.10981 | ||||||||||||
|
December 31, 2009
(2) (4)
|
0.89492 | 0.23054 | 2.68476 | 0.69163 | ||||||||||||
|
December 31, 2008
(2) (3)
|
0.21215 | 0.05747 | 0.63645 | 0.17240 | ||||||||||||
| ____________________ | ||||||||||||||||
|
|
(1)
|
Historical values.
|
|
|
(2)
|
On April 2002, the Central Bank suspended the payment of dividends by Argentine financial institutions. Since June 2, 2004 the Central Bank makes some exceptions to the suspension of profits distributions and may pre-authorize dividend payments under certain conditions. See
“Item 8. Financial Information—Dividends”
.
|
|
|
(3)
|
Based upon the reference exchange rate quoted by Central Bank at March 26, 2009.
|
|
|
(4)
|
Based upon the reference exchange rate quoted by Central Bank at April 29, 2010.
|
|
|
(5)
|
Based upon the reference exchange rate quoted by Central Bank at March 31, 2011.
|
|
|
(6)
|
For the fiscal years ended December 31, 2012 and 2011, the Bank decided not to declare and distribute dividends as result of the issuance of Communications “A” 5272 and 5273 of the Central Bank (see
“Item 8. Financial Information—Dividends”)
. For the fiscal years ended December 31, 2010 and 2009 the dividends were paid totally in cash. For the fiscal year ended December 31, 2008 the dividends paid in 2009 were Ps.35 million in cash and Ps.65 million through the issue of new shares. For the fiscal years ended December 31, 2010 and 2009 the number of outstanding shares were 536,361,306, respectively, and for the fiscal year ended December 31, 2008 the number of outstanding shares were 471,361,306. Declared dividends per ordinary share are calculated taking into account dividends paid over the outstanding shares at the end of each fiscal year.
|
Exchange Rates
The following table shows the annual high, low, average and year-end free exchange rate for U.S.$1.00 for the periods indicated. The Federal Reserve Bank of New York does not report a noon buying rate for pesos.
|
High
(1)
|
Low
(1)
|
Average
(2)
|
||||||||||
|
Year /Period
|
(in pesos per U.S.$1.00)
|
|||||||||||
|
March 2013
|
5.1223 | 5.0475 | 5.0840 | |||||||||
|
February 2013
|
5.0448 | 4.9825 | 5.0111 | |||||||||
|
January 2013
|
4.9768 | 4.9228 | 4.9486 | |||||||||
|
2012
|
4.9173 | 3.9715 | 4.5502 | |||||||||
|
December 2012
|
4.9173 | 4.8398 | 4.8800 | |||||||||
|
November 2012
|
4.8338 | 4.7700 | 4.7974 | |||||||||
|
October 2012
|
4.7655 | 4.6992 | 4.7299 | |||||||||
|
2011
|
4.3035 | 3.9715 | 4.1302 | |||||||||
|
2010
|
3.9857 | 3.7942 | 3.9127 | |||||||||
|
2009
|
3.8545 | 3.4497 | 3.7301 | |||||||||
|
2008
|
3.4537 | 3.0128 | 3.1614 | |||||||||
| ________________________ | ||||||||||||
|
|
(1)
|
Source: BCRA.
|
|
|
(2)
|
The average of monthly average rates during the period.
|
The exchange rate on April 5, 2013 was Ps.5.1370 = U.S.$1.00.
Fluctuations in the exchange rate between pesos and dollars affect the dollar equivalent of the peso price of the ordinary shares on the Buenos Aires Stock Exchange (Bolsa de Comercio de Buenos Aires — the “BCBA”) and as a result, would most likely affect the market price of the ADSs. Fluctuations in exchange rates also affect dividend income measured in dollars. The Bank of New York Mellon, as depositary for the ADSs is required, subject to the terms of the deposit agreement, to convert pesos to dollars at the prevailing exchange rate at the time of making any dividend payments or other distributions. The following table shows the rate of devaluation of the peso vis-à-vis the dollar, the rate of exchange (number of pesos per dollar prevailing in the Argentine foreign exchange market) and the rate of inflation for wholesale prices for fiscal year ended December 31, 2012 and for the four most recent
fiscal years. Since the repeal of the Convertibility Law in January 2002, the peso has devalued approximately 413.70% vis-à-vis the dollar.
|
December 31,
|
||||||||||||||||||||
|
2012
|
2011
|
2010
|
2009
|
2008
|
||||||||||||||||
|
Devaluation Rate
|
14.27% | 8.23% | 4.72% | 9.93% | 9.61% | |||||||||||||||
|
Exchange Rate
|
4.9173 | 4.3032 | 3.9758 | 3.7967 | 3.4537 | |||||||||||||||
|
Inflation Rate
(1)
|
13.13% | 12.67% | 14.56% | 10.26% | 8.98% | |||||||||||||||
| _____________________ | ||||||||||||||||||||
|
|
(1)
|
The inflation rate presented is the general WPI published by the INDEC.
|
|
B.
|
Capitalization and indebtedness
|
Not applicable.
|
C.
|
Reasons for the offer and use of proceeds
|
Not applicable.
|
D.
|
Risk Factors
|
Factors Related to Argentina
Overview
We are an Argentine corporation (sociedad anónima) and substantially all of our operations, properties and customers are located in Argentina. Accordingly, the quality of our assets, our financial condition and our results of operations depend primarily on macroeconomic and political conditions prevailing in Argentina. In 2001, the Argentine economy suffered a severe economic and political crisis (“the Argentine Crisis”), but was able to recover during Nestor Kirchner’s term as President, which ended in 2007. Kirchner was succeeded by Cristina Fernández de Kirchner, who was reelected for another four year term on October 23, 2011. The global financial crisis since 2008 (the “Global Financial Crisis”) led to lower growth and a moderate rise in unemployment, but did not affect the stability of Argentina’s financial system (see
Item 4. Information on the Company—Recent Political and Economic Developments in Argentina – Macroeconomic Environment
).
Although the economic policies implemented by the Kirchner administrations have succeeded in the short- and mid-term, there still remain issues to be resolved, such as:
|
|
§
|
contracts with privatized public utilities, and the elimination of subsidies to the energy and gas companies that could affect consumption levels;
|
|
|
§
|
increasing inflation affecting competiveness and economic growth;
|
|
|
§
|
availability of long-term fixed interest rate loans;
|
|
|
§
|
high commodity prices have had a favourable impact on economic activities in recent years, but are very volatile and out of the Government’s scope of control;
|
|
|
§
|
recent measures implemented by the Government to control imports led to the imposition of barriers to Argentine exports to trading parties and had a negative impact on economic activities during 2012;
|
|
|
§
|
the Government has issued several measures that have limited the access to the purchase of foreign currency, which has caused certain uncertainty especially to dollar-denominated deposit holders; and
|
|
|
§
|
a significant intervention by the Government in the private sector, including through the expropriation of YPF, the country’s largest oil and gas company.
|
High inflation rate expectations could negatively affect the Argentine economy in general, including access to the long-term financing market.
In the event of an acceleration of inflation rates, Argentine exports could lose competitiveness in international markets and private consumption could decline, causing a negative effect on economic activity and employment. Moreover, a high inflation rate could undermine confidence in the Argentine financial system in general, and this would negatively affect the business volume of banks, including BBVA Francés, and could potentially hinder the interest margin of long-term and fixed interest rates loans, although currently these loans are not a significant part of the Bank assets.
There exists a discrepancy between statistical data published by National Institute for Statistics and Census (“INDEC”) referring to the CPI (consumer price index) for the Greater Buenos Aires area (the “CPI-GBA”), CPI indexes corresponding to the different Argentine regions/provinces and private estimates. This generates uncertainty about the country’s actual inflation rate and does not contribute to anchor inflation expectations. It is to be noted that assets indexed by Coeficiente de Estabilización de Referencia (“CER”) are adjusted according to the CPI-GBA.
Impositions of sanctions on Argentina by international organizations such as the declaration of censure recently issued by the International Monetary Fund (IMF) against Argentina due to the inaccuracy of certain official data reported, could negatively affect Argentina’s access to international financial markets.
Following several warnings about the quality of the official data reported by Argentina to the IMF regarding the CPI-GBA, the gross domestic product (the “GDP”) and the non-implementation of remedial measures to produce accurate inflation and growth related statistics, the IMF issued on February 1, 2013 a declaration of censure against Argentina “in connection with its breach of obligations to the IMF under the Articles of Agreement”. This is the first sanction imposed by the IMF to Argentina, but this is not an economic fine. Argentina must adopt remedial measures to address the inaccuracy of the mentioned indices without further delay, and no later than September 29, 2013. After that, the Managing Director is required to report to the Executive Board by November 13, 2013 on the status of Argentina’s implementation of the above mentioned remedial measures. If the Managing Director considers that Argentina failed to implement any of the actions called for in the declaration of censure within the specified timeframe, the Managing Director may issue a complaint to the Executive Board and recommend that the Executive Board declare the member ineligible to use the general resources of the IMF. The Executive Board will again review this issue and will decide on this ineligibility, and it may inform that the member’s persistence in its failure to fulfill its obligations following the declaration of ineligibility may result in the issuance of a complaint for the suspension of the member’s voting and related rights.
The imposition of further sanctions could eventually result, in the long term, in Argentina’s exclusion from the IMF. Were Argentina excluded as a member of the IMF, Argentine companies such as BBVA Francés, could suffer adverse consequences, either by jeopardizing their access to international financial markets or by having to pay increasing interest rates in order to obtain financing. Furthermore, it could also negatively affect foreign investments in Argentina. These adverse effects, however, could be mitigated by the fact that Argentina has not requested to the IMF any kind of financings since 2005.
A considerable decrease in the public sector balance could negatively affect the Argentine economy, and access to international financial markets.
Commencing in 2005, public expenditure began to increase more than public revenues. Thus, the primary fiscal surplus of the central public non-financial sector fell from 3.9% of GDP in 2004 to 0.3% of GDP in 2011. During 2012 there was a primary fiscal deficit of Ps.4.37 billion, while the operational fiscal deficit was Ps.55.56 billion representing a 81.2% of increase as compared to the deficit of the prior year. Moreover, the primary fiscal balance could be negatively affected in the future if public expenditure continues to increase at a rate higher than revenues due to subsidies to lower-income sectors, social security benefits, financial assistance to provinces with financial problems, increased spending on public works and subsidies to the energy and transportation sectors.
A further deterioration in fiscal accounts could negatively affect the Government’s ability to access the long-term financial markets and could in turn result in more limited access to such markets by Argentine companies. BBVA Francés could therefore be adversely affected by such limitation.
A recent decision by a U.S. District Judge requiring Argentina to pay 100% of the principal and interest in arrears due to certain holders of bonds issued by Argentina and even subjecting the paying agent to injunction, could, if ratified by the NY Court of Appeals, result in Argentina’s default on its payment obligations, negatively affecting its access to international financial markets.
The plaintiffs in this case are holders of sovereign bonds issued by the Argentine Republic pursuant to a Fiscal Agency Agreement prior to Argentina’s default on its payments obligations (“FAA Bonds”). The plaintiffs bonds are in default, and are the subject of federal court judgements which are unsatisfied.
In 2005 and again in 2012, Argentina made exchange offers to the holders of FAA Bonds, pursuant to which bondholders who tendered their FAA Bonds received new Bonds (“Exchange Bonds”). As the result of the two exchange offers, approximately 91% of the FAA Bonds were tendered, and the Exchange Bonds are currently held by Argentina. The plaintiff’s FAA Bonds were not tendered in the exchange offer.
Argentina has stated that it does not intend to make further payments on the plaintiffs´ unexchanged FAA Bonds. Further, Argentina adopted legislation, referred to as the Lock Law, that prohibited the Argentine state from making any payment on pay the unexchanged FAA Bonds.
The plaintiffs applied to the United States District Court for the Southern District of New York for a determination that Argentina’s conduct in making full payment on the Exchange Bonds while making no payments on the FAA Bonds constituted a breach of the Pari Passu Clause (equal treatment of all bondholders) included in the FAA Bonds. The matter was referred to Judge Thomas Griesa, who has been assigned to hear all matters arising out of Argentina’s 2001 default. In a series of rulings running from December 2011 through October 2012, Judge Griesa held that Argentina breached the Pari Passu Clause by lowering the rank of the FAA Bonds in violation of the said clause, by making payments under the Exchange Bonds, while persisting on its refusal to satisfy its payment obligations currently due under the terms of the plaintiffs’ FAA Bonds.
The Second U.S. Circuit Court of Appeals initially ratified Griesa’s interpretation and asked the Judge to specify a formula for payments to the plaintiff. The formula, which was announced in November 2012, implied paying 100% of the capital and interest in arrears due on the bonds under litigation. Furthermore, it included the agent of payment Bank of New York Mellon (“BoNY”) in the injunction, meaning that funds paid to BoNY for payment to the exchange bondholders are potentially available for payment instead to the plaintiffs. This interpretation constituted the worst possible scenario for Argentina, and the market reacted with an extensive sale-off of Argentine sovereign bonds and a skyrocketing price for Argentine credit default swaps.
After an appeal by Argentina against the decision, the NY Appeals Court placed a stay on Griesa’s decision and is currently reviewing it. It should be noted, however, that “pari passu” provision (or equal treatment of all bondholders) is not subject to review and, thus, holdout bondholders have the right to eventually receive payments from Argentine under their bonds. Only the formula that results in 100% of such payments being required is subject to review.
On February 27, 2013 a hearing was held by the Second U.S. Circuit Court of Appeals where the parties exposed their arguments. After the hearing the Court requested Argentina to state in writing on or before March 29, 2013, the precise terms of any alternate payment formula and schedule to which it is willing to commit.
The legal process will therefore continue during the 2013, but a negative ruling for Argentina cannot be discarded, which could lead to a default in the payment of Argentina’s obligations currently being serviced. The macroeconomic impact of an unfavourable ruling could lead to a further financial isolation of Argentina, and companies, such as BBVA Francés, and a denial from accessing to international markets in order to obtain financing.
A series of restrictions in the foreign exchange markets recently imposed by the Argentine Government could have a material adverse effect on the results and the solvency of the financial system.
The Argentine Government has issued since October 2011 until the present date, a series of measures restricting the access of private sectors to the foreign exchange markets.
Decree Nr. 1722 was issued in October 2011 eliminating a prior exception for oil and mining companies and thus requiring these companies to settle in the foreign exchange market all their export receipts.
Moreover, the National Insurance Bureau, issued in October 2011, Resolution Nr. 36,162 imposing the obligation for insurance companies to have all their investments and liquid assets allocated in Argentina.
In addition, as from January 2012, the National Tax Bureau must be notified in advance and approve all import operations. This restriction contributed to a decrease in imports (with a negative impact on industrial activities using imports and spare parts) which led to a decrease in the volume of trade financing and negatively impacted our business. Limitations on foreign currency purchases resulted in a decrease in the volume of foreign trade commissions in foreign currency sales.
Finally, Communication “A” 5318, dated July 5, 2012, forbid the purchase of foreign currency by local individuals and companies, except for the purchase of foreign currency for tourism purposes.
The new regulations issued during 2012 regarding the access to foreign currencies led to a 46% withdrawal of dollar denominated deposits in of private sector as of December 31, 2012. A more detailed explanation of said measures is included in
“Item 10. Additional Information — Exchange Controls”.
These restrictions resulting in a withdrawal of dollar denominated deposits, led in turn to a contraction in dollar denominated loans related export finance (the lending capacity in foreign currencies are provided by Bank deposits in foreign currencies), which could have a material adverse effect on the Argentine financial system, including BBVA Francés, our result of operations and financial condition.
Government measures designed to exercise greater control over funds entering the country may disrupt our ability to access the international capital markets.
Argentina’s executive branch enacted Decree Nr. 616/05 to regulate funds coming into and flowing out of Argentina in order to maintain stability and support the economic recovery of the country. These measures require that 30% of the funds remitted to Argentina must be deposited in an account with a local financial institution as a U.S. dollar deposit for one year, without accruing interest. Financial sector and non-financial private sector inflows originated from foreign financial borrowings that are invested in non-financial assets and must be fully repaid (principal and interest) within 24 months from the date of the borrowing are not subject to the foregoing deposit requirement. These measures may adversely affect the Argentine entities’, including BBVA Francés, ability to access the international capital markets and to effectively invest the funds raised in any such financing, which could materially adversely affect Argentine entities’ financial condition and results of operations.
Conditions in the global financial markets and economy have yet to normalize and may materially adversely affect the Bank´s business and profitability.
The outlook for the global economy over the near- to medium-term remains challenging as the global financial system has yet to fully stabilize. Results of operations in the past have been, and in the future may continue to be, materially affected by many factors of a global nature, including political, economic and market conditions; the availability and cost of capital; the liquidity of global markets; the level and volatility of equity prices, commodity prices and interest rates; currency values and other market indexes; technological changes and events; the availability and cost of credit; inflation, the stability and solvency of financial institutions and other companies; investor sentiment and confidence in the financial markets; or a combination of these factors.
While there are additional signs of global recovery, it is not yet certain whether the global recovery will continue or reverse. The economic impact of a worsening global financial scenario in Argentina in general, and in the Bank, in particular, will be limited given the isolation of Argentina in the international capital markets and the low level of foreign investment in the country. If there is, however, a significant drop in commodity prices and a contraction in external demand which affects domestic economic growth and private consumption the Bank’s business could be adversely affected.
As a consequence of Financial Action Task Force’s (“FATF”) evaluation report on Anti-Money Laundering and Combating Financing of Terrorism, Argentina has to implement measures in order to comply with FATF´s recommendations. In the event these measures are not correctly addressed, Argentina could find difficulties in obtaining financing and attracting direct foreign investments.
In October 2010, FATF issued a report on Anti-Money Laundering and Combating the Financing of Terrorism in Argentina, stating that since the last evaluation, finalized in June 2004, Argentina has not made adequate progress in addressing a number of deficiencies identified at the time.
Moreover, in February 2011, Argentina, represented by the Minister of Justice, attended the FATF Plenary in Paris, in order to present a preliminary action plan. Notwithstanding that, FATF has granted an extension until June 2011 to work closely with Argentina and will consider its next steps in the context of the enhanced follow-up process.
During the last semester of 2011, Argentina issued a series of new laws regarding financial and economic crimes together with market manipulation, that were considered an important progress in Argentina’s action plan.
Despite Argentina having remediated five out of the six key material deficiencies identified by the report issued by FATF on Anti-Money Laundering and Combating the Financing of Terrorism, it still has a pending action plan for the total fulfilment of all recommendations set forth in such report. Non-compliance with such report could limit the Bank’s access to foreign financial markets.
Factors Related to BBVA Francés
The short term structure of the deposit base of the Argentine financial system, including the Bank, could lead to a reduction in liquidity levels and limit the long-term expansion of financial intermediation.
After the Argentine Crisis, the volume of financial activity regarding deposits and loans was severely reduced.
Between 2003 and 2007, a gradual and increasing recovery of deposits levels took place. But because of the Global Financial crisis, these levels were reduced during 2008 and further improved during the last semester of 2009, 2010, 2011 and 2012.
Such recovery resulted in an improvement of the liquidity of the financial system.
Notwithstanding that, liquidity problems are not totally overcome. Because most of the deposits in the Argentine financial system are demand deposits and time deposits (which have terms of less than 90 days), the financial system could be exposed to other risks, such as: (i) term mismatch for entities that decided to enter into long term loans; (ii) sudden interest rates increases; (iii) and certain limitations to the expansion of long term loans due to deposit volatility.
This could increase the risk of low liquidity levels and increased funding cost in the event of a withdrawal of significant portions of the deposit base of the financial system, including BBVA Francés.
The instability of the regulatory framework, in particular the regulatory framework affecting financial entities, could have a material adverse effect in financial entities activities, such as the Bank.
Since the beginning of Cristina Kirchner’s second term as President, a series of new regulations have been issued, mainly regulating the foreign exchange market and new capital requirements for financial institutions.
In this regard, Communications “A” 5272 and 5273 of the Central Bank, dated February 1, 2012, increased the capital requirements for financial institutions carrying out activities in Argentina. These Communications require certain minimum capital levels in order to support operational risks and the distribution of dividends, and an additional capital buffer equivalent to 75% of the total capital requirements.
The Central Bank has stated that these new requirements are based on the credit risk measure required by Basel II.
It must be stressed that the Bank, taking into consideration the new capital requirements for operational risks, still has an excess of capital as of December 31, 2012 with respect to the minimum capital requirements of the Communications, of Ps. 1,231 million. Not withstanding that, as a consequence of the additional 75% capital buffer requirement, the Bank will not distribute dividends to its shareholders during the present fiscal year. The amount of the shortfall that prohibits us from distributing dividends to ours shareholders, as required by the BCRA, amounts to Ps.1.3 billion. The Bank is legally entitled to pay dividends because there is no regulation that prohibits the payment of dividends. Not withstanding that, the Central Bank has recently imposed new capital requirements and an additional buffer, making impossible for us the payment of dividends in this fiscal year and the previous one. We cannot state what will happen in the future. For more information about dividends see
“Item 10. Additional Information — D. Exchange Controls — Transfer of Corporate Bonds”.
Moreover, a new law was approved by the Congress introducing amendments to the Central Bank ´s charter. The principal issues addressed by this bill are the use of Central Bank’s reserves for the cancellation of public debt together with the implementation of polices by the Central Bank in order to interfere in the fixing of interest rates, and terms of loans to financial institutions.
The Central Bank issued two Communications, “A” 5319 and “A” 5380 dated July 5, 2012 and December 21, 2012 respectively, whereby it is mandatory for banks to grant credit lines for productive purposes. The Government's intention is to increase investments, although it should be noted that an increase in the demand for these loans could in turn lower the demand of other types of loans. BBVA Francés used approximately Ps.1,300 million in 2012 for these type of loans; and for the first semester of 2013 there is a requirement to use approximately Ps.1,373 million.
On November 29, 2012, the Argentine Congress passed the new “Securities Law”, which modifies the public offer regime set forth by Law Nr.17, 811, as amended. One of the most significant amendments introduced by the Securities Law refers to the powers of the CNV. The incorporation of Section 20 raises concern in the market, especially among listed companies, since it entitles the
CNV to (i) appoint supervisors with powers of veto of the resolutions adopted by the board of directors of the companies and (ii) disqualify the board of directors of the companies for a period of 180 days when, as determined by the CNV, the interests of the minority shareholders and/or security holders are infringed.
The absence of a stable regulatory framework could result in significant limits to the financial institutions’ decisions, such as the Bank, regarding asset allocation, that could cause uncertainty with respect to the future financial activities and result of operations.
Argentine corporate disclosure, governance and accounting standards may require the Bank to provide different information than would be required under U.S. standards. This difference could influence foreign investors decisions to invest in Argentine securities and could therefore limit the Bank’s access to international markets.
The securities laws of Argentina that govern publicly listed companies such as the Bank impose disclosure requirements that are more limited than those in the United States. The Argentine securities markets are not as highly regulated and supervised as the U.S. securities markets. There are also important differences between accounting and financial reporting standards applicable to financial institutions in Argentina and to those in the U.S. As a result, financial statements and reported earnings of Argentine financial institutions generally differ from those reported based on U.S. accounting and reporting standards. See
“Item 5. Operating and Financial Review and Prospects—U.S. and Argentine Banking GAAP Reconciliation”
for a description of the principal differences between Argentine banking GAAP and U.S. GAAP and how they affect our financial statements and the reconciliation to U.S. GAAP of net income and total stockholders’ equity for the periods ended and as of the dates therein indicated.
Accordingly, the information available about the Bank will not be the same as the information available about a U.S. company. The difference in the disclosure requirements between Argentine corporate, governance and accounting standards and U.S. GAAP, could influence foreign investors decisions to invest in Argentine securities and could therefore limit the Bank’s access to international financial markets.
Lawsuits brought against us outside Argentina, the enforcement of foreign judgments and complaints based on foreign legal concepts may be unsuccessful.
We are a commercial bank organized under the laws of Argentina. Most of our shareholders, directors, members of the supervisory committee, and officers and certain experts named herein reside outside the United States (principally in Argentina). Substantially all of our assets are located outside the United States. If any shareholder were to bring a lawsuit against our directors, officers or experts in the United States, it may be difficult for them to effect service of legal process within the United States upon these persons or to enforce a judgment against them in the United States courts based upon the civil liability provisions of the United States federal securities laws, due to specific requirements of Argentine law regarding procedural law issues and principles of public policy.
Because we are a financial institution, any insolvency proceeding against us would be subject to the powers of and intervention by the Central Bank, which may limit remedies otherwise available and extend the duration of the proceedings.
Under Argentine law, the liquidation and commencement of bankruptcy proceedings against financial institutions, until their banking license has been revoked by the Central Bank, may only be commenced by the Central Bank. If BBVA Francés were unable to pay its debts as they come due, the Central Bank would intervene and revoke its banking license, and file a bankruptcy petition before a commercial court. If the Central Bank intervenes, the reorganization proceeding could take longer and it is likely that the shareholders’ remedies would be restricted. During any such process, the Central Bank would have to consider its interests as a regulator and could well prioritize the claims of other creditors and third parties against the Bank. As a result of any such intervention, the shareholders may realize substantially less on the claims than they would in a bankruptcy proceeding in Argentina, the United States or any other country.
The special rules that govern the priority of different stakeholders of financial institutions in Argentina, which give priority to depositors with respect to most other creditors, may negatively affect other stakeholders in case of judicial liquidation or bankruptcy of the Bank.
Argentine Law Nr. 24,485, in force since April 18, 1995 and as amended by Law Nr. 25,089, provides that in case of judicial liquidation or bankruptcy of the Bank, all depositors, irrespective of the type, amount or currency of their deposits, will have general and absolute preferential rights with respect to all other creditors, except for certain labor credits and credits secured with pledge or mortgage, to be paid with 100% of the funds deriving from the liquidation of the Bank’s assets. In addition, depositors of any kind of deposits have special preferential rights over the remaining creditors of the Bank, except for certain labor credits, to be paid with (i) any of the Bank’s funds which may be held by the Central Bank as total reserves, (ii) any remaining funds of the Bank in existence as
of the date on which the Bank’s license is revoked, or (iii) any funds derived from the compulsory transfer of certain assets of the Bank according to instructions of the Central Bank, in the following order of priority: (a) deposits made by legal entities up to Ps.5,000 per entity, or its equivalent in foreign currency, (b) deposits for terms exceeding 90 days and (c) all other deposits on a pro rata basis.
Volatility of credit ratings in Argentina could affect the volatility of the Bank’s credit ratings, and therefore limit the Bank’s access to international financial markets.
The Bank’s credit ratings are based on those of Argentina's sovereign rating, which has fluctuated considerably since the Argentine Crisis. As a result, the Bank’s ratings have also fluctuated in this period, although they have tended to be higher than the sovereign rating. These fluctuations impact our costs of funding and collateral obligations and our ability to access international markets. Continued volatility of, or a decrease in, Argentina’s sovereign rating could affect our business.
Factors Related to BBVA Francés’ Subsidiaries
|
§
|
Consolidar AFJP S.A.
|
As a consequence of the social security reform, the loss of its corporate purpose and its liquidation, labor lawsuits were filed against Consolidar AFJP claiming additional payment amounts. Adverse rulings for Consolidar AFJP´ in such lawsuits could result in severance payment obligations for considerable amounts, which could have a material adverse effect on the financial condition of the company.
Consolidar AFJP S.A. (“Consolidar AFJP” or “AFJP”) was a privately owned pension fund managing company whose purpose was the administration of retirement contributions from affiliates and the corresponding grant of old age, disability and death pensions. On December 4, 2008, the Federal Government enacted Law Nr. 26,425 to implement social security reform, by which the National State assumed once again the coverage of contingencies in cases of old age, disability and death. Certain matters deriving from Law Nr. 26,425 that remain pending, such as possible indemnity in favor of AFJP in the amount of its corporate capital arising from the loss of its corporate business purpose. Notwithstanding this, on December 7, 2010, Consolidar AFJP filed a claim against the Federal Government and the Ministry of Labor and Social Security, requesting compensation for the losses suffered by the company and its shareholders, as a result of the aforementioned social security reform.
Moreover, as a consequence of the social security reform and the loss of corporate business purpose, on December 28, 2009, in a Shareholders’ Extraordinary Meeting of AFJP, the shareholders decided to terminate the corporate existence of the company and liquidate it. Until the present date, the liquidation process is still pending.
During 2012, 22 legal labor actions were filed against AFJP claiming differences in severance payment amounts. AFJP has estimated this contingency and raised the corresponding allowances. Adverse rulings against Consolidar AFJP could result in severance payments by the company of considerable amounts, which could have a material adverse effect on the financial condition of the company, and therefore in the result of liquidation process for BBVA Francés as its shareholder which owns a 53.89% interest in the company.
RECENT POLITICAL AND ECONOMIC DEVELOPMENTS IN ARGENTINA
Macroeconomic Environment
Impaired by factors such as the draught, a lower growth in Brazil and the impact of increasing restrictions in the foreign exchange market, the Argentine economy underwent a strong deceleration in 2012, following the dynamic trends which had prevailed in 2011. After an 8.9% increase in 2011, the GDP grew only 1.9% in 2012. Such a low increase was mainly due to a poor performance in real terms of investment, which fell by 4.2% in 2012 with respect to 2011, as well as to a decrease in exports (-4.5%). Private consumption, instead, provided some support to the GDP with a 3.6% increase in 2012, favored by public consumption that showed a 6% increase in real terms. The braking effect on the GDP was somewhat softened by the decrease of imports, which fell by 2% in 2012.
This poor economic performance reflected itself on the labor market, negatively affecting the generation of employment. Thus, in 2012 the employment rate, and the total number of employees over total population, fell slightly to around 42.9% of the total population against the 43% of 2011, but the decrease in the labor supply (as the labor force participation rate fell to 46.2% of the total
population in 2012) prevented a rise in the unemployment rate, which remained at 7.2% for 2012 as compared to the 7.2% average rate for 2011. This less dynamic tendency in the labor market did not reflect itself on the behavior of salaries, which at December 2012 accumulated an increase of 24.8% over those at December 2011 for registered private workers and of 24.5% in the general index, which is an average of the total wages of the economy, including both private and public sector, as well informal workers. The salaries of public servant showed an accumulated rise of 17% for the year, whereas the accumulated increase for workers of the “informal” sector is estimated at 29%.
In spite of a less dynamic economic activity, inflation measured as per the CPI-GBA reached 10.8% in terms of year-over-year variation as at December 31, 2012, showing an acceleration as compared to the 9.5% rate of the previous year. Such increase was mainly due to the Food and Beverages chapter which increased from a 7.6% hike in December 2011 to 9.9% in December 2012. The Housing chapter also had a 10.5% increase (against 6.4% the previous year) after price adjustments in the power and gas rates, whereas the prices of Transport were accelerated by increases in bus, railway and subway fares due to the cancellation of public subsidies.
The fiscal policy remained expansive, and in 2012 there was a primary fiscal deficit of Ps.4,374 million, compared to a surplus of Ps.4,921 million in 2011 as a result of a 29% increase of primary public spending in the period, above the 26.6% increase in total income. Among the expenditures, the increases in remunerations (29%), social security benefits (39%) and other current expenditures (56%) stood out, whereas the items with increases under the average included transfers to the private sector (15%), capital spending (15.5%) and transfers to the provinces (3%). The income side was supported by the social security contributions which increased by 30.5% year over year in 2012 and the non-tax and capital income, including Central Bank transfers and income of the Argentine Social Security Administration (“ANSES”) which grew by 25% in the year. Total income tax increased by 25.9%, mainly due to an increase in the income tax collection (27.5%). VAT collection had a 23.5% increase and the foreign trade taxes grew a bare 13.3%, affected by the fall in exports and imports. If the payment of interest is taken into account, the Federal Government had an operating deficit of Ps.55,564 million in 2012, 81.2% higher than the Ps.30,663 million recorded the previous year.
The foreign exchange market and the foreign sector were affected by profound regulatory changes, by means of which the Government sought to ensure a level of foreign reserves large enough to face the payment of debt denominated in foreign currency and avoid a further depreciation of the peso. Restrictions to the movements in current accounts started with a requirement of prior authorization by the Commerce Secretariat/Federal Tax Authority (Administración General de Ingresos Públicos or “AFIP”) for imports, and a limitation of access to the purchase of foreign exchange by companies for the purpose of transferring profits and dividends abroad. In the case of banks, an “additional capital reserve buffer” was established, increasing the requirement in force from 30% to 75%.
Later on, limits were also imposed on tourist spending by establishing a system of prior information to the AFIP for the purchase of foreign currency when traveling abroad, plus increasingly stringent administrative hindrances and, finally, by applying a 15% surcharge (deductible from Income Tax) on all credit card purchases made abroad.
As a consequence, the foreign trade balance had a U.S.$12,690 billion surplus in 2012, around 26.7% higher than the previous year, but with a fall in trade volumes. The country’s exports, affected by the draught which reduced grain crops, amounted to U.S.$81,205 billion, which implies a decrease of 3.3%, since the 5% fall in volumes sold to the rest of the world was scarcely compensated by a 0.7% hike in prices. Imports, in the meantime, amounted to U.S.$68,205 billion and decreased 7.3% in the year, owing to a 6.7% reduction in the volumes imported and a variation of only 0.3% in prices.
In addition, throughout 2012, the control measures on capital movements, which had started at the end of October 2011 with the requirement of prior AFIP authorization for the purchase of foreign currency by residents, were intensified. The restrictions became more and more stringent up to a point in July when the purchase of foreign currency for hoarding purposes was totally prohibited. These measures succeeded in restricting the outflow of private capitals (Formation of Net External Assets) which amounted to U.S.$3,570 billion in the first nine months of the year as compared to U.S.$18,245 billion in the same period of 2011.
With private demand strongly limited by the new regulations, the Central Bank became the main actor in the foreign exchange market. It continued to apply its managed flotation policy in order to moderate exchange rate volatility, even if permitting an acceleration of the monthly rate of devaluation of the peso during the second half of the year. Over the last six months of 2012 the monthly devaluation reached an average rate of 1.4% as compared to 0.8% in the first half of the year and 0.6% in 2011. Thus the exchange rate increased to 4.92 pesos per U.S. dollar at the end of 2012 (a 14% increase for the year) reaching an average of 4.88 per U.S. dollar in December 2012 (a 14% increase from the average for December 2011).
Monetary Policy
The monetary policy remained expansionary in 2012, with a growth of Ps.84,430 billion in the monetary base over the year, which implies a 38% increase (as compared to 35% in 2011). This resulted from a high rate of monetization of the foreign currency originated in the foreign trade surplus (the Central Bank purchased U.S.$9,200 billion in the foreign exchange market during the year, totaling Ps.41,086 billion), and from the monetary expansion required for financing the public sector, which amounted to Ps.47,495 in the year. The international reserves as at December 31, 2012 amounted to U.S.$43,290 billion, with a net loss of U.S.$3,086 billion as compared to the balance at the end of 2011. This result was mainly due to the fact that the above-mentioned interventions of the BCRA on the foreign exchange market were more than compensated by the creation of the ‘Non-indebtedness’ Fund applied in order to cover the national public debt commitments in foreign currency.
During the first quarter of the year the Central Bank charter was changed to broaden its functions and ensure monetary and financial stability. The Central Bank must now promote employment and economic development with social equality. Following the implementation of this amendment, the board of directors of the BCRA will determine the level of reserves required for compliance with the foreign exchange policy, thus eliminating the requirement that such reserves must cover 100% of the monetary base and so expanding their availability to face payment commitments of the public debt in foreign currency. Moreover, an automatic mechanism was stipulated for the granting automatic advances of funds to the National Treasury and the limit for these loans was raised from 10% to 20% of all fiscal income. As regards specifically to the financial sector, changes were made to the scheme of integration of liquidity requirements, in the sense that such integration may only be constituted by sight deposits with the Central Bank. As compensation for such measure, a reduction was granted in the required cash reserve in pesos according to the proportion of credit to small and medium-sized companies with respect to the total loans granted to the private sector by each financial institution, applicable since December.
Meanwhile, the total “M2” monetary aggregate grew by 38% in the year-over-year variation, as compared to a 30% increase in December 2011 and with a 31% increase in the private “M2”, which excludes public sector deposits. In addition, the Badlar interest rate for private banks, which had increased to an average of 19% in December 2011 when the first foreign exchange restrictions were implemented, progressively decreased in the first half of 2012 to an average of 11.7% in May, and since then it reverted its tendency to achieve a level of 15% in the last quarter of the year, to close 2012 at a 15.4% rate.
The private sector’s deposits in pesos grew by 41% in 2012, whereas those denominated in dollars experienced a 35% decrease. As for the total deposits of the public sector, they had an expansion of 27% in the same period.
Consistent with a lower economic activity, the total of loans to the private sector in pesos increased by 41%, showing a deceleration with respect to the growth recorded in 2011 (48%). The loans in foreign currency showed the opposite behavior, with a fall of 42% as compared to an increase of 27% last year. This was a consequence of the restrictions imposed on the foreign exchange market, which caused an outflow of deposits in dollars and therefore a fall in foreign exchange loans, partially compensated by an increase of the lines in pesos.
In July 2012, making use of its powers to “orientate the credit” as detailed in the new charter, the Central Bank established the “line of credits for productive investment”, according to which the system’s largest financial entities and those which are financial agents of the State must devote a minimum of 5% of their deposits in pesos from the private sector as at that date to finance the purchase of capital goods or the construction of production installations. The line contemplates a maximum interest rate of 15% and a term of not less than 36 months for repayment, and on top of that stipulates that half of the total amount must be granted to Micro, Small and Medium-size Companies (“MiPyMES”). For 2013 the line was expanded by another 5% of the private sector’s deposits in pesos as of November 2012. Given this situation, corporate loans in pesos increased by 47% in the year-over-year variation for 2012, whereas the growth in consumer loans did not exceed 34%.
A.
HISTORY AND DEVELOPMENT OF THE COMPANY
BBVA Francés, an Argentine corporation (a “sociedad anónima” or “S.A.”), was duly incorporated under the name Banco Francés del Río de la Plata S.A. on October 14, 1886. We have our registered office in Argentina, Reconquista 199, C1003ABB, Buenos Aires, telephone number 54-11-4346-4000. Our agent in the United States for U.S. federal securities law purposes is CT Corporation System, currently with offices at 111 Eighth Avenue, New York, New York 10011.
Our original by-laws (“Estatutos”) were approved on November 20, 1886, by a decree recorded in the Public Registry of Commerce of Buenos Aires City on December 6, 1886, under Number 1065 on Folio 359, Book 5, Volume “A” of National By-laws. Our by-laws, including all amendments introduced to this date, were recorded in the Public Registry of Commerce (the Governmental regulatory agency of corporations). The last amendment was recorded on August 2, 2010, under N° 13.784 Book 50 of Corporations
(“sociedades anónimas”). Pursuant to current corporate by-laws, the Bank will terminate its activities on December 31, 2080, unless this term is extended by the shareholders. On March 5, 1998 the Public Registry of Commerce registered the change from Banco Francés del Río de la Plata S.A. to Banco Francés S.A. At the ordinary and extraordinary shareholders’ meeting held on April 27, 2000, a resolution was passed to change our name to BBVA Banco Francés S.A. On October 4, 2000, the Public Registry of Commerce registered the change from Banco Francés S.A. to BBVA Banco Francés S.A., and the amendment to our by-laws reflected the name change.
We are supervised by the Central Bank of Argentina, an entity that establishes valuation and accounting criteria, the rules on liquidity and capital requirements as well as the informative systems of Argentine financial institutions. We are also subject to inspections by the Central Bank, based on which we are assigned a “rating”. See
“Item 4. Information on the Company—The Argentine Banking System and its Regulatory Framework”
.
On August 11, 1997, we acquired 71.75% of the capital stock of Banco de Crédito Argentino S.A. (“Banco de Crédito”). We completed this merger of the two banks by final registration with the Public Registry of Commerce on March 5, 1998. To effect the merger, BBVA Francés issued 14,174,432 ordinary shares to the existing shareholders of Banco de Crédito through a capital increase.
As a result of the acquisition of Banco de Crédito, we gained control of Consolidar Compañía de Seguros de Retiro S.A., Consolidar Compañía de Seguros de Vida S.A. and Consolidar Administradora de Fondos de Jubilaciones y Pensiones S.A. (together the “Consolidar entities” or the “Consolidar Group”), and also acquired control of Crédito Argentino Sociedad de Bolsa S.A. which was liquidated in 2000.
On November 5, 1999, we and Banco Bilbao Vizcaya (today Banco Bilbao Vizcaya Argentaria S.A. or “BBVA”), executed a share purchase agreement, pursuant to which we acquired 99.99% of the shares of Corp Banca S.A., an Argentine bank, and 99.99% of Atuel Fideicomisos S.A., a trust company. On November 22, 1999, as part of a corporate reorganization, all assets and liabilities of Corp Banca S.A. were transferred to us, with full integration of operations and systems.
On March 29, 2000, our affiliate Rombo Compañía Financiera S.A. (“Rombo”) was registered with the Public Registry of Commerce. On April 24, 2000, the Central Bank by Communication “B” 6684 authorized Rombo to conduct business as a financial company.
On October 17, 2000, as part of BBVA group’s ( the “Group”) business reorganization plan, Banco Exterior de América S.A. (Uruguay) (wholly owned by BBVA) merged with and into Banco Francés Uruguay S.A. (wholly owned by us). As a result of such merger, Banco Francés Uruguay has changed its corporate name to Banco Bilbao Vizcaya Argentaria Uruguay S.A., or BBVA Banco Uruguay (“BBVA Uruguay”).
In November 2001, Credilogros Compañía Financiera S.A. (“Credilogros”) and Banque PSA Finance formed PSA Finance Argentina Cía. Financiera S.A. (“PSA Finance”). On February 21, 2002, the Central Bank by Communication “B” 7194 authorized PSA Finance to begin its activities as a financial company. On June 1, 2002 Finanzia Banco de Crédito S.A. sold 29.95% of its interest in Credilogros to BBVA. Such transaction was approved by the Central Bank on April 3, 2003, under Resolution Nr. 37. On October 31, 2003, subject to the approval of the Central Bank, we acquired 50% of the shares of PSA Finance from Credilogros. On December 16, 2004, the Central Bank issued Resolution Nr. 371, approving the transfer of 50% of PSA Finance capital stock from Credilogros to us.
On June 28, 2006, we sold our entire interest in Credilogros to Banco de Servicios y Transacciones and Grupo de Servicios y Transacciones S.A.
On February 4, 2010, we acquired all 131 shares of Atuel Fideicomisos S.A. from Inversora Otar S.A. becoming its sole shareholder. On February 11, 2010, we sold our 5% interest in BBVA Francés Asset Administradora de Inversiones S.A. to BBVA Francés Valores Sociedad de Bolsa S.A. for Ps.1,681,678.
On October 22, 2010 the merger of BBVA Francés with Atuel Fideicomisos S.A. was registered with the Public Registry of Commerce under Number 19,916 Book 51 of Corporations .
On March 31, 2011, BBVA Francés and BBVA, the shareholders of Consolidar Compañía de Seguros de Retiro S.A. (“Consolidar Retiro”) entered into a stock purchase agreement with Orígenes Compañía de Seguros de Retiro S.A. and other entities whereby both shareholders sold all their shares in Consolidar Retiro. The total price of this transaction was Ps.386.2 million, 66.21% of which belong to BBVA Francés because of its percentage of participation in Consolidar Retiro. This transaction was subject to the
prior approval of Argentine Insurance Bureau, which was obtained on May 13, 2011 through decision number 114,219. The transfer of shares was completed on June 10, 2011.
On September 14, 2011, the merger of BBVA Francés with Consolidar Comercializadora S.A. was registered with the Public Registry of Commerce. As a result of the merger BBVA Francés increased its capital in 516,544 ordinary shares issued to the existing shareholders of Consolidar Comercializadora.
On October 6, 2011 a stock purchase agreement, for the total amount of shares of Consolidar Aseguradora de Riesgos del Trabajo S.A. (“Consolidar ART”) was executed between BBVA Francés and BBVA, on the one hand, acting as selling shareholders; and Galeno Argentina S.A., on the other hand, in its capacity as buyer.
The price of the transaction was U.S.$62,857,775, of which 12.5% was paid to BBVA Francés and 87,5% to BBVA. This transaction was also subject to the prior approval of the Argentine Insurance Bureau, authorization that was issued on February 6, 2012. The transfer of the shares was completed on March 6, 2012.
On February 9, 2012 the board of directors of BBVA Francés and Inversora Otar S.A. approved the merger between both companies. On March 26, 2012, the Shareholders Meetings of both companies approved the merger, which is still subject to the prior approval of Central Bank, the Argentine Securities and Commission and the Buenos Aires Stock Exchange. As a result of the merger, as from April 1, 2012, BBVA Francés aquired all the shares of Inversora Otar S.A.. Once the merger is registered with the Public Registry of Comerce, BBVA Francés will issue the corresponding shares in favor of Inversora Otar´s shareholders (BBV América S.L., Corporación General Financiera S.A, and Sucesión Romero) and will cancel the shares received as result of the incorporation of Inversora Otar´s assets. Because if this simultaneous increase and cancelation of the shares, the total amount of the corporate capital of the Bank will remain the same, as result of the merger. Finally, once the shares are issued, the shareholders of Inversora Otar S.A. will have the following ownership of BBV Francés capital: BBV América S.L. 29.81%, Corporación General Financiera S.A. 0.47% and Sucesión Romero 0.0041%.
On April 1, 2012, as a result of the merger between BBVA Francés S.A. and Inversora Otar S.A, BBVA Francés S.A acquired all the shares of BBVA Francés Valores Sociedad de Bolsa S.A previously held by Inversora Otar S.A, becoming its sole shareholder. On June 29, 2012, BBVA Francés S.A. sold a 3.0047% interest in BBVA Francés Valores Sociedad de Bolsa S.A to BBV America SL for Ps.441,194.
Also, as a result of the aforementioned merger, BBVA Francés S.A. acquired from Inversora Otar S.A. 3,000 shares of Aplica Soluciones Argentina S.A. Aplica Soluciones Argentina S.A is a company currently under a liquidation process, but the registration of its final cancellation with the Public Registry of Commerce is still pending.
B.
BUSINESS OVERVIEW
BBVA Francés ended its fiscal year 2012 with Ps.44.8 billion in total assets, a total of Ps.34.2 billion in deposits, on a consolidated basis, and a market capitalization of Ps.6.2 billion. It is the third largest private bank in terms of private deposits in the Argentine financial system according to statistics published by the Central Bank, as of December 31, 2012.
Substantially all of its operations, property and customers are located in Argentina. The Bank has traditionally accepted deposits and made loans in pesos and in certain other currencies, primarily in U.S. dollars. Following the Argentine Crisis, U.S. dollar deposits were limited to granting U.S. dollar-denominated loans in relation to foreign trade transactions, which continued to be subject to Central Bank restrictions.
As part of its business, BBVA Francés conducts capital markets and securities operations directly in the over-the-counter market and indirectly in the Buenos Aires Stock Exchange. At the end of December 2012, the Bank had a 5% market share in the mutual fund portfolio management industry in Argentina through BBVA Francés Asset Management S.A (“Mutual Investment Funds Manager”), the eighth among the capital managing companies.
The Bank was one of the first companies listed on the Buenos Aires Stock Exchange, quoting since 1888. Its shares have been listed on the New York Stock Exchange since 1993 and on the Madrid-based LATIBEX (“Mercado de Valores Latinoamericanos”) since December 1999.
The following table presents financial information of our principal business for the year ended December 31, 2012.
|
As of December 31, 2012
|
|||||||||||||||||||
|
Continued operations
|
Discontinued
operations
(4)
|
Total
|
|||||||||||||||||
|
Banking Financial
|
Pension Fund
Manager
|
||||||||||||||||||
|
BBVA Francés
(3)
|
PSA Finance S.A.
|
Total
|
|||||||||||||||||
|
Total assets
|
42,761,978 | 1,916,525 | 44,678,503 | 106,076 | 44,784,579 | ||||||||||||||
|
Total income
(1)
|
8,158,870 | 479,124 | 8,637,994 | 15,128 | 8,653,122 | ||||||||||||||
|
Total expenses
(2)
|
(7,108,074 | ) | (226,406 | ) | (7,334,480 | ) | (18,768 | ) | (7,353,248 | ) | |||||||||
|
(Loss)/Gain on minority interest in subsidiaries
|
1,595 | (37,790 | ) | (36,195 | ) | — | (36,195 | ) | |||||||||||
|
Total net income
|
1,052,391 | 214,928 | 1,267,319 | (3,640 | ) | 1,263,679 | |||||||||||||
|
(1)
|
Includes financial income, service charge income and other income.
|
|
(2)
|
Includes financial expenses, allowances for doubtful loans, service charge expenses, operating expenses, other expenses and TOMPI.
|
|
(3)
|
Includes BBVA Francés Asset Management S.A. Sociedad Gerente de Fondos Comunes de Inversión and BBVA Francés Valores Sociedad de Bolsa S.A.
|
|
(4)
|
See Note 15 to the Consolidated Financial Statements.
|
The Bank has a large network of branches throughout Argentina: there are 273 branches, 244 of which are retail branches and 29 are specialized in the middle-market segment, while seven business units grouped by industry provide personalized attention to corporate and institutional clients. BBVA Francés also has eleven in-company branches and two points of sale complemented by other distribution channels, such as 655 automatic teller machines (“ATMs”), a telephone banking service and an Internet banking service called Francés Net, as of December 2012. Through this network the Bank provides attention to more than 1,760,000 individual clients, 17,340 companies and 821 large corporations. The Bank is member of Banelco S.A., a corporation owned by seven partner banks, that includes 16 participating banks, and our ATMs are part of the Banelco Network (Red Banelco – “Banelco”).
BBVA Francés – Background
Since 1886, we have been recognized as a leading provider of financial services to large corporations. In the early 1980s, we broadened our customer base to include medium and small companies as well as individual customers. In response to demands from the corporate market and following the structural changes brought about by the stabilization process in Argentina since 1991, we added to our traditional commercial banking products a full range of services, such as investment banking, capital market transactions and international banking.
In the 1980s and 1990s, in order to achieve a wider market penetration, we expanded our branch network by opening branches throughout Argentina.
In December 1996, when BBVA became our principal shareholder, we reaffirmed our universal banking strategy with the goal of increasing the most profitable business segment: medium- and low-income individuals and small- and medium-size businesses in the Middle Market. To this end, in August 1997, we acquired 71.752% of Banco de Crédito Argentino (the “Crédito acquisition”), a retail bank focused on the middle market and consumer banking sectors. This merger allowed us to maximize the strengths of each bank and to implement an ambitious leadership plan that included an expansion plan, starting with a strong initial positioning in each market.
The Argentine Crisis and the ensuing economic and political instability led to a deep contraction in the intermediation volume. In response, we changed our short-term commercial strategy towards the transactional business, adjusted our operating structure and implemented a strict cost control plan. Actions were also focused on recovering asset quality levels, which had been strongly affected by the Argentine Crisis. By mid-2003, the economy began to recover and we returned to offering the full range of financial services, including credit facilities, albeit restricted to short-term financing. Commencing in 2004, we gradually strengthened our credit activity in the midst of economic solvency, and consolidated our transactional business.
In 2009, we had an efficient management of assets and liabilities, which offset the lower volume of transactions. During 2010 and 2011, the Argentine economy showed a great expansion, mainly due to higher consumer spending. Within this context, BBVA Francés, always keeping focused on customers, has consolidated its leadership position in the Argentine financial system.
In March, 2011 a share purchase agreement was signed for all the shares of Consolidar Retiro between BBVA Francés, holder of 66.21% of the corporate capital, and BBVA, holder of the remaining 33.79% of the corporate capital. This agreement established a total price for the shares of Ps. 380 million, adjustable in accordance with the revenues obtained from the sale by Consolidar Retiro of its own property where the offices are located.
On October 6, 2011, a purchase and sale agreement was executed for the aggregate shares held by Consolidar ART between BBVA Francés, holder of 12.50% of the capital stock, and Banco Bilbao Vizcaya Argentaria S.A., holder of 87.50% of the capital stock, in their capacities as selling shareholders, and Galeno Argentina S.A. in its capacity as buyer. The purchase price for the shares was U.S.$59.4 million, adjustable on the basis of the net proceeds resulting from the sale of the interest held by Consolidar ART in the real estate where it had its offices. On October 6, 2011 BBVA Francés received from the buyer a down payment in the amount of Ps.18.8 million equal to 60% of the pro rata price of the transaction. On February 6, 2012, the transaction was approved by the National Superintendence of Insurance (SSN) and on March 6, 2012, the transfer of the stock ownership from Consolidar ART to Galeno Argentina S.A. was effected, together with the collection of the remaining of the purchase price.
It is also important to mention that in 2011 the Bank returned to the capital markets, successfully placing the first issuance of corporate bonds under its U.S.$500 million global program, aimed at funding business growth. The total amount issued exceeded Ps.185 million. In January 2012, the second issuance took place; also registering high demand, showing the investor support and allowing the Bank to increase the offering amount from Ps.125 million to Ps.150 million; ending in Ps.148.9 million. The market’s response demonstrates the confidence that BBVA Francés enjoys, together with the expectations for growth and development anticipated for the Bank.
In February, 2012 the board of directors of BBVA Francés and Inversora Otar S.A. approved the merger between both companies which was ratified by the shareholders of both companies in March. As a result of the merger, the Bank became the sole shareholder of BBVA Francés Valores Sociedad de Bolsa S.A. (but later sold a 3.0047% interest in such company to BBV America SL) and acquired from a number of shares in the capital of Aplica Soluciones Argentina S.A, currently under liquidation.
Banking and Financial Services
The Bank is focused on the brokering business, mainly in the private sector. The loan portfolio in this sector totalized Ps.29.0 billion. We increased our private portfolio by 25% compared to 2011; mainly due to more personal loans, credit cards and car loans in the retail sector, while in the middle market sector the products that lead the expansion were discounted notes, loans to finance foreign trade operations and leasing. The private loan market share reached a 7% level at the end of the year. In terms of liabilities, we have been working on the optimization of the funds structure, mainly attracting retailer and transactional funds. At the end of 2012, deposits were Ps.34.2 billion, 17% higher than last year, sight deposits increased by 23% and time deposits by 11%. After the regulations regarding the purchase of foreign exchange and foreign trade came into effect, the financial system suffered a significant loss on U.S. dollar denominated deposits. For this reason the Bank recorded a decrease of 34% in such deposits over the year, totaling Ps.3,459 billion (equivalent to U.S.$703 million) at December 2012, which represented 10% of the Bank’s total deposits.
The following table sets forth our estimates of the relative proportions of loans and deposits attributable to our principal markets.
|
Loans
|
||||||||||||||||||||
|
December 31, 2012
|
December 31, 2011
(1)
|
December 31, 2010
|
||||||||||||||||||
|
(in thousands of pesos, except percentages)
|
||||||||||||||||||||
|
Public Sector
|
35,067 | 0.12% | 46,027 | 0.20 | % | 1,297,642 | 7.77 | % | ||||||||||||
|
Corporate
|
7,755,847 | 27.21% | 6,378,971 | 28.10 | % | 4,586,166 | 27.46 | % | ||||||||||||
|
Middle market
|
7,014,829 | 24.62% | 5,676,856 | 25.01 | % | 3,667,723 | 21.97 | % | ||||||||||||
|
Retail
|
13,687,688 | 48.04% | 10,595,177 | 46.68 | % | 7,148,321 | 42.80 | % | ||||||||||||
|
Total
|
28,493,431 | 100.00% | 22,697,031 | 100.00 | % | 16,699,852 | 100.00 | % | ||||||||||||
_________________________
(1) See Note 3.3 to our Consolidated Financial Statements.
|
Deposits
|
|||||||||||||||||||||
|
December 31, 2012
|
December 31, 2011
|
December 31, 2010
|
|||||||||||||||||||
|
(in thousands of pesos, except percentages)
|
|||||||||||||||||||||
|
Corporate
|
6,213,292 | 18.19 | % | 4,774,471 | 16.37 | % | 2,807,584 | 12.50 | % | ||||||||||||
|
Middle market
|
4,092,888 | 11.98 | % | 3,843,486 | 13.18 | % | 2,753,632 | 12.26 | % | ||||||||||||
|
Retail
|
23,858,873 | 69.83 | % | 20,547,747 | 70.45 | % | 16,900,091 | 75.24 | % | ||||||||||||
|
Total
|
34,165,053 | 100.00 | % | 29,165,704 | 100.00 | % | 22,461,307 | 100.00 | % | ||||||||||||
BBVA x 3 Growth Plan
During 2012, the Group and the Bank continued to work with the ambitious goal of becoming the best universal bank of the world, the one that gives more benefits to its clients and makes their lives easier.
During 2012 we worked around this guideline, deepening the customer centric and quality vision, adapting the management and relationship model and modernizing and expanding the functionalities of the automated means and electronic banking network, in order to become a more efficient organization.
Customer centric and quality
The “Client Oriented” goal was reaffirmed in 2012, with the clear purpose of understanding that quality is the key element of the BBVA Francés differentiation plan.
We continued to promote the improvement plans devised in 2011, with the maximum goal of optimizing the client’s experience in each of his contacts with the Bank.
In relation to the pillars of the Quality Plan in force, advances were made during 2012 in:
|
|
§
|
Better understanding the client. New measurement architecture was implemented based on listening directly to the client’s voice (NPS). Starting from the identification of critical experiences and of greater impact on the client, surveys are conducted on a monthly basis whose indicators are used for detecting which “levers” exercise a positive or negative influence on satisfaction and recommendation.
|
|
|
§
|
Fostering a culture of service to the client. During the last quarter of 2012, the first quality workshop for managers took place. The program included awareness activities about the importance of quality as a factor of differentiation in the marketplace.
|
|
|
§
|
Improving processes with impact on quality. The First Contact Resolution (FCR) model was affirmed, under which nearly 31% of the customers’ complaints were resolved at the first contact and within a 72-hour deadline. Taking advantage of the new model’s thrust
;
, the implantation of electronic credit card account statements was accelerated, as it had been identified as one of the most relevant complaints.
|
|
|
§
|
Defining a governance model and a quality measurement methodology. A new governance model was installed in the different committees started during 2011, and the BBVA Quality Command Team was implanted, which integrates Operating Indicators to those corresponding to the Client’s Voice. The implementation of the Quality Operating Committee, contributed to the regular decision-making through the consensus that involved improvement in relation to the client.
|
Always focused on the relationship with clients, the Quality Plan includes different commercial and operational aspects which were defined along the year for the organization as a whole. Thanks to the expansion and communication of the plan to the remaining areas of the Bank, it was possible to get the whole organization involved in a comprehensive quality management where achievements and responsibilities are shared.
In an effort to enrich the “client’s perception” indicator, we worked to implement an Integrated Quality Management Command by incorporating management and business metrics which make it possible to find a relationship between their evolution and the client’s recommendation.
In line with the commitment assumed in 2011, to work on the concepts more demanded by the clients, such as “operational agility”, we sought to improve the experience in branches by reducing waiting times, through:
|
|
§
|
The implementation of improvements in queue management devices.
|
|
|
§
|
The incorporation of new office equipment which reduces operation times at the teller lines (bank-note counting machines).
|
|
|
§
|
The upgrading of the most used automated means and incorporation of equipment with new functionalities (online deposits).
|
Complaint Management Improvements
During 2012 we continued to consolidate the complaint centralization process in the Client Attention Service (CAS)which attends all claims received by telephone and e-mail.
Concurrently with the success of centralization, work was done in cooperation with the CAS in order to timely detect all incidents related to circuits, processes and products which have a direct impact on the relationship with the client. Through shared reports from the different forums in relation to these subjects, necessary changes were promoted on the best valued attributes for the purpose of ensuring greater agility in the resolution of problems.
Based on the FCR, through which 31% of the complaints received were solved online or within 72 hours, the commitment was strengthened to provide for agile management and resolve the complaints effectively, avoiding delays that generate foreseeable displeasure.
The improvement achieved resulted in a general reduction of complaint resolution mean times, which were lowered from 13.6 days average in 2011, to 8.1 in 2012.
This achievement will surely make it possible to continue with the development and implementation of new changes to the Complaint Attention and Resolution Model which will have an impact on the client’s perception and recommendation.
Management and Relationship Model
During 2012 the Bank continued to develop its Management and Relationship Model through the implementation of various types of actions which allowed it to grow in the knowledge of its clients, strengthening its channels and modernizing its branches network.
Projects linked to management tool improvements stood out in an effort to ensure better attention quality, intensify the multichannel approach and strengthen the different sales and attention channels.
The project of remodeling and redesigning of branches went on as planned, affecting 23 branches and allowing the new image of “BBVA Francés” to gain presence throughout the offices network. Four new branches were inaugurated, two of them retail (“Tres Cerritos” in Salta and “Tortugas Mall”), and two branches exclusively for the attention of companies (Middle Market) in Chivilcoy and Rafaela.
Area Management:
|
-
|
Corporate & Investment Banking
|
Corporate & Investment Banking is the area that manages the Markets and Corporate Banking sectors with a global vision that coordinates specialized management at product level, for the purpose of giving the Bank a general vision of the client, providing them with a more comprehensive and better quality service.
The model gives priority to the Bank’s relationship with the main economic groups at both worldwide and local levels, looking for a strategic plan for each client, so as to deepen in the relationship and adapt the service to the clients’ own requirements.
This plan, on the other hand, tends to continue improving the exploitation of the Group’s franchises in the region, with a significant transversal effort focused on team building and the origination of businesses.
|
-
|
Middle Market
|
The management scheme for the Middle Market segment allows the Bank to differentiate from the market, both regarding proximity to the client and specialized advice. These two pillars make it possible for the Bank to provide personalized attention to more than 17,000 clients through its own branches or with shared schemes with the retail network.
Middle Market department has the mission of establishing the strategy and managing the business of clients defined as members of the segment, so as to achieve the stipulated goals in terms of benefit, market share, income, costs and profitability, ensuring synergies with other areas of the Bank.
|
-
|
Small and Medium Business (SMB)
|
The strategy for the SMB segment during 2012 was based on improving the attention granted to different groups of clients, with a view to improving our reputation among clients by our product range and credit ratings.
Special emphasis was given to the development of the segment with the incorporation of specialized resources by two methodologies:
|
|
§
|
Management specialized in micro-company businesses for those offices with a significant critical potential clients mass; and
|
|
|
§
|
Pivot management of micro-companies with reference to clients belonging to branches which lack of specialization.
|
|
-
|
VIP Segment
|
The VIP segment is, for BBVA Francés, one of its main strategic targets, and during 2012 it achieved a significant development.
Intense work was done during the year to improve the value offered to the segment through the following lines of action:
|
|
§
|
Simplification and clarity in the segmentation processes, ensuring that all participants, including executives and clients alike, will know the conditions required for their access to and permanence in the segment.
|
|
|
§
|
Adjustments in the credit assistance processes, basically considering the region each client belongs to. The size of the territory and the differences between regional economies require a differential treatment of the clients. This regionalized credit assistance approach is valid for massive previously approved processes such as individual evaluations conducted at the request of clients.
|
|
|
§
|
Implementation of the first BBVA Francés VIP Spaces. These new spaces have been conceived especially to provide an exclusive environment with the privacy and personalized attention that the segment’s clients deserve, apart from maximizing the interaction between the client and its VIP executive. In order to achieve this special environment, all spaces have been modeled with details of design and high-level services that make a difference regarding attention and also show a difference between BBVA Francés and its competitors.
|
|
|
§
|
Creation of the attention protocol. It was started in mid-2011 with the purpose of installing the same methodology for each contact between a VIP executive and its client, either by phone, personal at the branch or at the clients’ workplace. The protocol is a written guide containing the guidelines established by the management of the segment for dealing with VIP clients. This set of guidelines and tools guides the VIP executive in his relationship with the client. It refers to the structure of its relationship regardless of, and in addition to, the day-to-day applicable procedures. Among the points detailed in the protocol it is worth mentioning those related to communication and management.
|
|
|
-
|
Communication of the segment’s benefits: in his interaction with the client it is important for the VIP executive to be aware of the benefits available to the former, especially those directly related to his profile and interests.
|
|
|
-
|
Client attention management: the manual includes guidelines to satisfy the client’s needs that originated the interaction with his VIP executive, based on a thorough knowledge of his profile and needs, as well as a list of actions to foster client’s fidelity.
|
|
|
§
|
From a communicational point of view, we continued with the strategy based on the development of high-level events with the presence of clients together with well-known personalities of artistic and gourmet circles. The Bank publicized these events in the media, in particular on the written press.
|
Core Management – 2012
|
-
|
Consumer financing
|
BBVA Francés continued with its “Simple Loans” campaign started in 2011, which was highly successful along the year thanks to innovative and attractive communication campaigns on television, radio and press media. The different sales channels attracted new clients through the use of commercial actions, direct marketing, newsletters, e-mail and other publicity instruments.
A significant number of clients with a good credit background continued to enjoy the benefit of pre-evaluated personal loans, with approved offers available at all times, which they can request at will and through any channel: Francés Net, Telemarketing, the Banelco ATM network or local branches.
The use of pre-approved ratings was intensified in 2012 with the implementation of a tool that makes it possible to balance a client’s rating between different products which may suit his interest or needs. Thus, from a rigid scheme where offers were resolved when the ratings were made, we moved to the possibility of adjusting the proposals interacting with the client, who was given the chance to select the card brand or the type of loan or agreement, including the use of limits between products with incorporated credit controls.
Car loans continued their upward trend, strengthening their position in the business through an ample offer of products that grant benefits to the associated concessionaries. To this we must add the financing of vehicles through financing companies structured in agreements with the brands Renault and Peugeot.
Regarding means of payment, the strategy in 2012 was oriented towards making the products more profitable, moving from discount and installment systems –a commodity between different entities– to the use of differential contents.
Our alliances with Boca, River, Peugeot and T4F, successful [and beloved] brands among the Argentine public, allowed the Bank, via long-term businesses and connections, to benefit from such popularity. It should be noted, however, that the benefits obtained from these alliances, especially those derived from the alliances with the two soccer teams, are very difficult to replicate in the future because it would require establishing very strong links and connections with the clubs’ activities. We also maintained during 2012 the system of discounts for domestic appliances through our alliance with Frávega, an alliance highly appreciated by the public and that involves a significant level of consumer spending and fidelity towards the Bank.
Francés Go, which was launched during the year 2010, continued to be an important tool for boosting consumption through the announcement of special discounts for the group of subscribed clients. There was also a migration of its administration platform in order to achieve greater flexibility and efficiency. A commercial re-launch is foreseen to 2013.
The alliance with LAN through a fidelity program based on the accumulation of kilometers represented a differential of excellent reception among the clients. As a consequence, the value of BBVA Francés’ credit card was increased, allowing also a growth increase in terms of links, retention and fidelity.
On the other hand, we continued launching seasonal campaigns, both with discounts and other benefits. The traditional “discount days” were repeated at Unicenter and other shopping malls, as well as at “Cerro Catedral” in the winter season, and along the coast during the summer.
|
-
|
Managed resources
|
BBVA Francés continued to offer diverse investment alternatives:
|
|
§
|
Fixed-term deposits
|
|
|
§
|
Mutual Funds, and
|
|
|
§
|
Corporate Bonds
|
Fixed-term deposits can be made through Francés Net, by telephone or at any branches of the network, from a minimum amount of Ps.1,000.
The LANPASS Advanced Fixed-term Deposit continued being an innovative product and an excellent alternative for clients to allowing them to use in advance the kilometers needed to travel as desired even without having completed the total number of accumulated kilometers required for such travel. During the second half of the year, different actions were implemented to stimulate the marketing of the product and strengthen its popularity by a higher level of exposure on the Bank’s website and on theBank’s Facebook page. Especially in December, a campaign was launched through Francés Go offering 10,000 extra kilometers for those clients who purchase the product and are subscribed to this communication tool.
In December also took place the re-launching of “Fondos Comunes de Inversión” (FCI), FBA Ahorro Pesos and FBA Total, for highly-valued clients. The communication included technical information about both mutual funds managed through “Francés Inversiones” and executives at the different branches.
Another investment alternative offered during the year was the purchase of corporate bonds, especially those issued by BBVA Francés, PSA, Rombo and YPF. The particularity of those placements was the possibility of receiving orders from the clients through Francés Net, by telephone through “Francés Inversiones” and personally at the branches.
|
-
|
Payroll management
|
The year 2012 witnessed a reinforcement of our orientation towards the development of transactionality and of payroll management agreements through new teams specialized in these type of transactions, which were trained along the preceding year, particularly focused on the attention and attraction of Corporate banking and Middle Market clients.
In view of the significance of payroll management for the Bank, an inter-directional working forum was established for dealing with critical issues of the product and its development through different management channels, both from the point of view of individuals and employers.
During the year, we also conducted pilot tests about attraction incentives for individuals and companies on a regional basis, so as to be able in 2013 to apply the resulting experience throughout the country.
The year 2012 proved to be one of great complexity in this are due to the Government’s decision to direct all crediting of funds dependent on public organisms of the National State to the Banco de la Nación Argentina.
For 2013, the Bank proposes a management strategy more focused on groups of clients of higher value, with attraction strategies especially adapted to the employer and his employees, in order to facilitate an employer’s decision concerning the migration of its payroll management.
|
-
|
Related Products:
|
Insurance
In 2012 the Bank maintained its insurance sales model consolidated during 2011 on all of its channels. We intensified the process of segmentation of our offer of value to the clients, so as to adequate the coverages to their present needs.
Among the most significant advances of the year the following stand out:
|
|
§
|
Launch of new campaigns to add customers by attracting new customers focused on cross-sell through Televentas.
|
|
|
§
|
Purchase of “Protected Handbag” insurance from the ATM.
|
|
|
§
|
Continuity of the process to adequate the amounts insured by upgrades to the policies in force.
|
|
|
§
|
Update of the minimum amounts insured for “Personal Accidents” and “Building Fire Coverage” in household insurance.
|
|
|
§
|
Launch of the new “Portables Protection” insurance with over 1,600 policies sold during the first month of application.
|
All these initiatives allowed us to grow uninterruptedly and sell nearly 365,000 new policies of the different types of insurance, with an outstanding sales performance on the alternative channels.
Development of channels:
Electronic banking in all its available forms continued to consolidate itself as the basic tool of Retail Banking.
Automatic media was the most important key in the Migration Plan, which included advertising and training materials. Besides, the customers were assisted at the branches through this process of change. At the end of 2012 we had a staff of 112 hostesses
assisting a total of 101 branches to support the migration plan and over 78% of transactions that used to be performed with bank tellers were referred to other channels (QDBs and ATMs).
ATMs, devices and new technologies:
During the year 2012 we continued with the plan to renew the ATMs and exclusive terminals network, improving the levels of availability for all of our clients. Furthermore, we continued to expand the “Plus” units of equipment for the recognition of banknotes, which allows making deposits into own or third parties’ accounts and with or without a Visa debit card with immediate crediting and with a 24-hour availability. A total of 73 units are already installed in 64 branches and for 2013 we foresee to raise the number to 188 units.
We also implemented in 2012 projects to improve the quality of our attention to customers, providing the branches with tools and technology to optimize management, attention times and reduce transactional costs. Among these advances we can mention the improvement reach in the 37 queue managers, which identify the clients and create new algorithms. We also optimized the operation of the teller announcers installed at all branches and the expanded such equipment to the commercial platform. Additionally, 239 new Francés Express units were created.
New devices were also installed to optimize teller times by accelerating money counting with units that recognize counterfeit notes. Our goal is to have at least one unit at each branch. More than 200 of these units are installed at present.
Self-service terminals:
During 2012 we made progress in the replacement of units loaded from the back. By October, 2012 168 units were installed. These strategic replacements increase the operating capacity of the Bank.
During 2012 we replaced self-service terminals and added equipment with new functionalities such as:
|
|
§
|
Single slot,
|
|
|
§
|
24-hour availability,
|
|
|
§
|
Recognition of banknotes and checks,
|
|
|
§
|
Operation on our own network,
|
|
|
§
|
No-envelopes branches.
|
During 2012, BBVA Francés continued to implement the optimization of transactions, giving preference to deposits and payments. The Bank currently operates 700 units of equipment distributed in all the branches as a basic support for teller operations.
In 2013 BBVA Francés will continue with the plan for derivation to self-management channels and will incorporate technology and new functionalities to them, so as to offer its clients the best possible treatment.
Metrics and servicing marketing:
During 2012 we continued to make progress in the design of self-service and ATM saturation switchboards, the analysis of saturation indices and the approval of new incorporations. We also had a new calculation method for the sizing of teller resources, which considers the waiting times of clients on the queue.
In line with the strategic plan, we also continued with the measuring of specific servicing goals on the retail network. On the other hand, we moved forward with the marketing of actions to improve communication with our clients by means of training campaigns, e-mailing actions, web communication, Francés Net, instructive manuals and others.
Internet banking:
With respect to Francés Net, during 2012 a series of adjustments were made to facilitate operations and improve the client’s capacity to visualize information for decision-making, such as:
|
|
§
|
Implementation of a Francés Net banner customizable to each particular client and context in order tailor communications to each client;
|
|
|
§
|
Digital Newsletter;
|
|
|
§
|
Incorporation of products such as leasing and other insurance;
|
|
|
§
|
Changes in visualizing account statements;
|
|
|
§
|
Incorporation of more information on custody accounts;
|
|
|
§
|
Possibility to opt for automatic credit card debits;
|
|
|
§
|
Option to receive card statements of account by e-mail; and
|
|
|
§
|
Monitor for fraud detection.
|
The channel also continued its expansion and achieved a volume of transactions above Ps.12,292 billion (accumulated at November 2012) nearly Ps.1,200 billion more than the preceding year. The number of the channel’s active clients amounted to 579 thousand, 10% more than the previous year. The channel negotiated 160 million transactions (accumulated at October 2012), 10% more the preceding year. The monthly average of transactions rose from 14.6 million in 2011 to 16.2 million in 2012.
Francés Line:
Nearly seven million calls were received on Francés Line along the year, and about ten million transactions were made via the telephone channel. Francés Line’s improvements in client attention, guaranteed response and specific response protocols resulted in post-sales services with successful attention ratios.
Branches Network:
It is worth mentioning the advances during 2012 in “Commercial Scenarios”, a tool oriented to improve the customer service in their contacts with promoters.
The Bank is also working to incorporate the multichannel concept, which allows promoters to know what is happening with the clients on other Bank’s channels, such as sales or servicing channels. It also allows to register transactions by the sales force through its devices, it improves reporting from the central areas and improves the allocation by the supervision lines.
Multichannel:
A new pilot scheme was implemented during 2012 by which offers are made to the clients through a number of interactive means, such as ATM or Francés Net, awaiting an immediate response from them, and producing a proactive management action for those who wish to be contacted. The goal is to communicate available offers through the channels used by the clients and identify potential interest in order to be available whenever the client requires our services.
Business Trends by area:
|
-
|
Retail
|
At the end of 2012, our retail banking had registered a volume of transactions greater than Ps.36,279 billion, including investment funds. During the 2012 fiscal year, credit investment grew by 29%, to Ps.12,325 billion, whereas the clients’ resources increased by 16% to an approximate total of Ps.23,954 billion.
Sight deposits grew by 15% in the year-over-year variation, while time deposits experience a 23 % increase in the same terms.
The growth in retail time deposits (lower than Ps.1 million), was 37.4%, higher than the system’s growth, and the portfolio reached a total of more than Ps.7.0 billion. The year witnessed a number of campaigns targeted to the clients and focused on simplicity
and availability through the several channels. These campaigns were reinforced by the training and updating plan that the executives receive through the Bank’s equity services area in order to provide the clients with higher value added services.
During 2012, retail banking worked on the following main lines of action:
|
|
§
|
Updating of segmentation criteria to generate new guidelines for access or permanence in the different segments.
|
|
|
§
|
Publication, training and spreading of the protocol for the attention of VIP and PREMIUM clients, for the purpose of promoting a more homogenous service standard for such segments.
|
|
|
§
|
Deepening of initiatives tending to direct the management and attention of the different client segments to the most suitable channel for each of them.
|
|
|
§
|
Implementation of functionalities for management tools in order to adjust pre-approved offers according to need, profile and type of client.
|
|
|
§
|
New linking methods between the different channels to identify interest and ensure that all offers reach the clients no matter what channel they use.
|
|
|
§
|
Expansion of retention policies and improved attention and post-sales quality as a fidelity tool.
|
|
-
|
Middle Market
|
In the first half of the year the active portfolio faced a period of foreign currency cancellations and lesser demand of credit in pesos. However, in the second half of the year the transactions involving checks, loans and cards resumed with force.
The variety of products within this segment made it possible to attend the different clients´ needs and enabled a rapid adjustment to the macroeconomic context without diverting the course of the Bank’s strategic plan.
The management of the financing line for investment projects addressed to MiPyMES, imposed by law, was a key element in the placement of loans and leasing agreements. The proposed Ps.600 million goal for 2012 was achieved, and this resulted in an increase in our market share and maintenance of the portfolio duration at levels closer to the average in the market.
The mentioned line deserves to be highlighted, as it was the big challenge of the year. The Bank reacted immediately to the legal requirements: an accurate analysis of the small and medium clients portfolio was made; it was possible to contact them on individual basis; the Risks Admission area was actively involved during the whole process assigning priorities; budgets were properly allocated; a campaign was launched and, one month before the deadline fixed by the BCRA, the regulation was complied with.
The implementation of this financing line was challenged for the Middle Market team, as rapidity of response was the fundamental factor to succeed. It was necessary to reach and add the bench-mark companies in the market to our customers portfolio before our competitors did in order to maintain the Bank’s credit quality. The speed of decision and execution was the key element, as time was the most critical variable against the competition. Hopefully, it was possible to act rapidly without losing sight of the target.
This way, the business maintained the constant growth it has shown in the past few years.
The Middle Market segment challenged all forecasts during 2012 and projected a market share of 10% on private banks and 7% on the financial system as a whole. Although private banks reduced their portfolio during the year, the public banks, on the contrary, registered growth in the same period, maintaining their tendency of the past few years.
The segment with the lowest levels of debt, which covers between Ps.1.5 million and Ps.3 million, is where BBVA Francés has the smallest participation, but is also the segment where the greatest advances were made in line with the new BCRA regulations about productive investment credits destined for MiPyMES.
As per the level of Non Performing Loans (“NPL”), in spite of a slight growth in the second half of 2012, the Bank keeps its good position as compared to the competition, finishing the year with 0.29% ratio of NPL.
Deposits grew by 30% in the year, and fixed-term deposits stood out with a 36% increase. This growth is remarkable in view of the foreign exchange controls imposed by the Government and the decrease of dollars deposits.
Mutual funds totaled Ps.619 million, as of December 31, 2012, representing a 91% growth in the year-over-year comparison and a 8% participation in the total of managed resources.
Total commissions had a favorable evolution thanks to insurance and credit card commissions, two products that were incorporated to the Middle Market products portfolio and that, even if not being the most relevant line items in the total commissions, have grown at a rate higher than 50%. Commissions totaled Ps.223 million, representing a 23% growth for the year.
One of the goals proposed for the year 2012 was to consolidate our sales management and achieve stronger links with the clients via transactional products. During 2012 the Bank significantly increased the number of clients operating Payment to Suppliers, Collection Accounts, Direct Debit, Cards and Uniform Federal Compensation (UFC) accounts. This process designed to gain fidelity from our clients will continue during 2013.
The gradual increase in the profitable investment portfolio and in the number of clients, the incorporation of new company officers and an increasing demand for specialized attention stimulated the need to have new Middle Market branches. That is why during the year two new branches were opened in Chivilcoy, province of Buenos Aires, and Rafaela, province of Santa Fe.
With this action we hope to multiply the contribution and productivity per officer, as well as amplify the geographic coverage area so as to increase our operational and commercial efficiency, focused on the growth of the segment.
For 2013 the new environment forces BBVA Francés to reformulate its strategy regarding this segment. The foreign exchange restrictions in place and the new orientation of credit legally imposed pose the challenge of converting these new rules into an opportunity to promote fidelity among the clients’ base, continue to earn market share, maintain the growth of a strategic sector and increase client profitability by strengthening links and transactionality.
This new stage will be accompanied by an updated capacity adjusted to the business,; the online Assets Quoter for a quick, simple and efficient quotation of active products that analyzes each client in a personalized manner; additional management tools, a telephone center for attention to companies and improved communication through specialized newsletters.
|
-
|
Corporate & Investment Banking (C&IB)
|
Even if during 2012 the country did not show an economic growth similar to previous years, the economic activity remained firm, based on three factors which continue unmovable as of now:
|
|
§
|
A firm demand of exports products.
|
|
|
§
|
Increased international prices for such products.
|
|
|
§
|
Maintenance of the high level of domestic consumption.
|
In this context, Corporate & Investment Banking segment continued with its financing policy to support the growth of its clients and satisfy their needs regarding working capital and fixed-asset investments.
Anticipating the economic reality, Corporate & Investment Banking management was based on two strategic pillars: leadership consolidation and increased client fidelity. To that effect, an intensive campaign was launched for the placement of a series of transactional products to satisfy clients’ requirements. The implementation of improvements to the Francés Net Cash tool made it possible to have a more competitive product on the market as well as to integrate the relationship with Global and Distribution Markets, multiplying the range of products being offered and generating synergies for other areas of the business, in particular Retail Businesses.
The growth of the investment portfolio was 14% as compared to the previous year with a total of Ps.8,848 billion, positioning the Bank, once again, at the top of the market in this segment (source: BBVA Francés’ figures).
Meanwhile, the clients’ resources reached a total balance of Ps.6,287 billion, 28% higher than the previous year, and maintained the volume of the transactional balance, indicating a strong evolution of the business as a whole.
Additionally, towards the end of the year loans were granted to clients for financing investment projects totaling Ps.293 million, thus complying with the C&IB portion of the quota imposed by the applicable regulations. This shows a clever sales management and a deeply rooted commercial relationship with the clients.
The strengthening of the relationship with clients has given us a better understanding of their businesses, to anticipate their needs and thus offer them a host of transactional products and services according to such needs. This was a key strategy for achieving a degree of fidelity which reflected in increases of 18% in the volume collected and of 17% in commissions.
Likewise, the Global Markets’ products have been very important as regards the liquidity needs due to its role in the placement of corporate debt issues, as it participated as the placement bank for 16 fixed-income issues. Also, as a complement to the investment banking business, an important structuring service was provided by the derivatives business service (IRSS), covering the clients’ rate risks.
All in all, the banking maintains its market share leadership both in loans to the private sector and in clients’ resources, with increases in transactional businesses, cross-selling and commercial relationship. This is proof of a rigorous working scheme for coordinating the management among C&IB, the local bank, global management and the companies.
Asset Management
During the fiscal year 2012, Asset Management, as responsible for the management of third parties’ resources, has continued to generate and manage investment alternatives, in particular through the management of cut-to-measure portfolios of significant resources which provide a specialized service to institutions and individuals. In particular and for the purpose of continuing to offer the quality that clients deserve and facing the challenges of the increasingly complex markets, actions have started to be taken to provide the management teams with more sophisticated technological tools.
In the coming fiscal year we will continue to work in that direction and in search of new alternatives that allow us to stay ahead of the clients’ needs.
Mutual Funds
The mutual funds industry in Argentina showed a significant increase in the volume of managed funds during 2012. According to provisional data prepared by the Argentine Mutual Investment Funds Chamber (“CAFCI”), at the end of 2012 the industry had managed funds amounting to Ps.45,139 billion, Ps.15,864 billion or54% more the level at December 2011.
Such equity increase was leaded by the market funds segment which totaled Ps.28,067 billion at the end of the year, Ps.10,477 billion or 60% more the previous year.
Within this category, the fixed-income funds stood out, which grew by Ps.8,046 billion, (a 66% increase), to reach a total of Ps.20,324 billion. The performance of the mixed-income funds was also positive, increasing Ps.2,596 billion (70%). The fixed-term deposit segment, on the other hand, totaled an equity of Ps.17,072 billion at the end of the year, Ps.5,386 billion more (46%) than in 2011.
At the end of 2011 the total equity of the different mutual funds authorized in the country amounted to Ps.29,275 billion, of which Ps.1,970 billion were managed by the Company. At December 31, 2012 the equity managed by the Bank amounted to Ps.2,305 billion, showing an increase of Ps.335 million (17%) over the previous year, representing a participation of 5% in the total mutual funds market, which placed the Company in the eighth position in the ranking of equities managed by the sector.
In the fixed-term funds category, FBA Renta Pesos ended the year with an equity of Ps.1,498 billion, an increase of Ps.269 million or 22% over the previous year.
As per the market funds, the Company’s managed equity increased by Ps.66 million, or 9% during the 2012 year. These funds ended the year with a managed total of Ps.807 million and a market share of 3% in this category.
Among the market funds managed by the Company, the best equity improvements corresponded to the following funds: FBA Ahorro Pesos, which increased its equity by Ps.22 million (5%) to a total of Ps.444 million; FBA EE.UU., which increased its equity by Ps.12 million (164%), to Ps.20 million; and FBA Calificado, which increased by Ps.10 million (14%) to Ps.83 million. FBA Horizonte, instead, suffered the greatest equity loss, 12%, ending the year with Ps.31 million, followed by FBA Acciones Globales down 5%, to total a managed equity of Ps.54 million.
It is important to underline the increase in commissions generated by the Company, which amounted to Ps.21 million, up 11% above the previous year. The source of commissions, by type of funds, showed an increase in those generated by fixed-term deposits, as compared to others, with almost 32% participation in the total, against 26% the previous year.
As of December 31, 2012, our mutual funds had the following equities:
|
Name of Mutual Fund
|
Thousands
of Pesos
|
|||
|
FBA Acciones Globales
|
53,791 | |||
|
FBA Total
|
19,087 | |||
|
FBA Renta
|
19,944 | |||
|
FBA Renta Pesos
|
1,497,666 | |||
|
FBA Renta Dólares
|
6,205 | |||
|
FBA Bonos Latinoamericanos
|
18,505 | |||
|
FBA Calificado
|
83,006 | |||
|
FBA International
|
947 | |||
|
FBA Ahorro Dólares
|
14,745 | |||
|
FBA Renta Fija
|
20,456 | |||
|
FBA Ahorro Pesos
|
444,287 | |||
|
FBA Renta Premium
|
10,805 | |||
|
FBA Europa
|
6,732 | |||
|
FBA Horizonte
|
31,008 | |||
|
FBA EE.UU.
|
19,801 | |||
|
FBA Renta Corto Plazo
|
471 | |||
|
FBA Acciones Latinoamericanas
|
24,116 | |||
|
FBA Bonos Argentina
|
7,648 | |||
|
FBA Brasil
|
25,131 | |||
|
FBA México
|
92 | |||
|
FBA Commodities
|
66 | |||
|
FBA Acciones Argentinas
|
265 | |||
|
FBA Bonos Globales
|
88 | |||
|
Total
|
2,304,862 | |||
|
Source: see Note 13.2 to our Consolidated Financial Statements. |
||||
Portfolio Management
As in previous years, the Company will pay special attention to the evolution of the international economic and financial situation, the behavior of the money market and the performance of the price for crude oil and other commodities. Regarding the domestic context, monitoring will be focused on the levels of activity, inflation and public spending.
For 2013, we expect a domestic context characterized by the improvement in economic growth levels, where the mutual funds constitute an efficient alternative for different types of investors. This industries’ evolution maintains thus favorable prospects.
In such scenario, the Company will continue to work in favor of expanding the offer of products and contributing to a better risk management.
Insurance
We provide advisory services to our customers in the selection of the adequate coverage of risks related to life, personal accidents as well as home and ATM robbery insurance, within a range of products offered by certain insurance companies.
Additionally, as part of our overall business, we have equity investment in an insurance company: 12.22% of the capital stock of BBVA Consolidar Seguros S.A., with BBVA holding the remaining shares of this company.
International Operations
Since the Argentine Crisis began at the end of 2001, access to international markets for Argentine companies has been quite limited. Notwithstanding this constraint, we have been able to assist our clients with traditional foreign trade services, including letters of credit, collections, bank drafts, fund transfers and foreign currency transactions.
Furthermore, in March 2007, we paid the outstanding Class 15 Floating Rate Notes due 2008, for an amount of Ps.121.5 million dollars. With this last payment we concluded the restructuring process of our foreign debt derived from the Argentine Crisis.
Cost Controls and Efficiency Improvements
The increase in administrative expenses above inflation is mainly related to a higher activity level together with higher payroll and advertising expenses in connection with a more aggressive advertising campaign.
The following table shows assets and income derived from the business areas described above for the fiscal years ended December 31, 2012, 2011 and 2010:
|
As of December 31, 2012
|
||||||||||||||||||||
|
Continued operations
|
Discontinued
operations
(5)
|
Total
|
||||||||||||||||||
|
Banking Financial
|
Pension Fund Manager
|
|||||||||||||||||||
|
BBVA Francés
(4)
|
PSA Finance S.A.
|
Total
|
||||||||||||||||||
|
Total assets
|
42,761,978 | 1,916,525 | 44,678,503 | 106,076 | 44,784,579 | |||||||||||||||
|
Financial income
|
5,423,751 | 281,442 | 5,705,193 | 9,728 | 5,714,921 | |||||||||||||||
|
Service charge income and other income
|
2,735,119 | 197,682 | 2,932,801 | 5,400 | 2,938,201 | |||||||||||||||
|
Total income
(1)
|
8,158,870 | 479,124 | 8,637,994 | 15,128 | 8,653,122 | |||||||||||||||
|
Financial expenses
|
(1,955,017 | ) | (106,114 | ) | (2,061,131 | ) | 3,260 | (2,057,871 | ) | |||||||||||
|
Allowances for doubtful loans
|
(242,753 | ) | (13,506 | ) | (256,259 | ) | — | (256,259 | ) | |||||||||||
|
Operating expenses
|
(3,014,278 | ) | (25,453 | ) | (3,039,731 | ) | (21,977 | ) | (3,061,708 | ) | ||||||||||
|
Other expenses
(2)
|
(1,896,026 | ) | (81,333 | ) | (1,977,359 | ) | (51 | ) | (1,977,410 | ) | ||||||||||
|
Total expenses
(3)
|
(7,108,074 | ) | (226,406 | ) | (7,334,480 | ) | (18,768 | ) | (7,353,248 | ) | ||||||||||
|
(Loss)/Gain on minority interest in subsidiaries
|
1,595 | (37,790 | ) | (36,195 | ) | — | (36,195 | ) | ||||||||||||
|
Total net income
|
1,052,391 | 214,928 | 1,267,319 | (3,640 | ) | 1,263,679 | ||||||||||||||
|
(1)
|
Includes: financial income, service charge income and other income.
|
|
(2)
|
Includes: service charge expense, other expense, income tax and TOMPI.
|
|
(3)
|
Includes: financial expenses, allowances for doubtful loans, operating expenses and other expenses.
|
|
(4)
|
Includes: BBVA Francés Asset Management S.A. Sociedad Gerente de Fondos Comunes de Inversión and BBVA Francés Valores Sociedad de Bolsa S.A.
|
|
(5)
|
See Note 15 to the Consolidated Financial Statements.
|
|
As of December 31, 2011
|
||||||||||||||||||||
|
Continued operations
|
Discontinued
operations
(5)
|
Total
|
||||||||||||||||||
|
Banking Financial
|
Pension Fund
Manager
/ Insurance
|
|||||||||||||||||||
|
BBVA Francés
(4)
|
PSA Finance S.A.
|
Total
|
||||||||||||||||||
|
Total assets
|
37,640,829 | 1,329,244 | 38,970,073 | 35,572 | 39,005,645 | |||||||||||||||
|
Financial income
|
3,412,422 | 152,608 | 3,565,030 | 249,655 | 3,814,685 | |||||||||||||||
|
Service charge income and other income
|
2,078,461 | 129,350 | 2,207,811 | 78,537 | 2,286,348 | |||||||||||||||
|
Total income
(1)
|
5,490,883 | 281,958 | 5,772,841 | 328,192 | 6,101,033 | |||||||||||||||
|
Financial expenses
|
(1,300,279 | ) | (55,419 | ) | (1,355,698 | ) | 10,295 | (1,345,403 | ) | |||||||||||
|
Allowances for doubtful loans
|
(122,066 | ) | (10,597 | ) | (132,663 | ) | — | (132,663 | ) | |||||||||||
|
Operating expenses
|
(2,263,288 | ) | (16,212 | ) | (2,279,500 | ) | (63,700 | ) | (2,343,200 | ) | ||||||||||
|
Other expenses
(2)
|
(1,006,203 | ) | (58,661 | ) | (1,064,864 | ) | (200,864 | ) | (1,265,728 | ) | ||||||||||
|
Total expenses
(3)
|
(4,691,836 | ) | (140,889 | ) | (4,832,725 | ) | (254,269 | ) | (5,086,994 | ) | ||||||||||
|
(Loss)/Gain on minority interest in subsidiaries
|
24,691 | (17,908 | ) | 6,783 | (15,245 | ) | (8,462 | ) | ||||||||||||
|
Total net income
|
823,738 | 123,161 | 946,899 | 58,678 | 1,005,577 | |||||||||||||||
|
(1)
|
Includes: financial income, service charge income and other income.
|
|
(2)
|
Includes: service charge expense, other expense, income tax and TOMPI.
|
|
(3)
|
Includes: financial expenses, allowances for doubtful loans, operating expenses and other expenses.
|
|
(4)
|
Includes: BBVA Francés Asset Management S.A. Sociedad Gerente de Fondos Comunes de Inversión and BBVA Francés Valores Sociedad de Bolsa S.A.
|
|
(5)
|
See Notes 1.4. and 15. to the Consolidated Financial Statements.
|
|
As of December 31, 2010
|
||||||||||||||||||||
|
Continued operations
|
Discontinued
operations
(5)
|
Total
|
||||||||||||||||||
|
Banking Financial
|
Pension Fund Manager
/ Insurance
|
|||||||||||||||||||
|
BBVA Francés
(4)
|
PSA Finance S.A.
|
Total
|
||||||||||||||||||
|
Total assets
|
28,445,498 | 751,810 | 29,197,308 | 3,382,938 | 32,580,246 | |||||||||||||||
|
Financial income
|
3,211,487 | 86,772 | 3,298,259 | 544,412 | 3,842,671 | |||||||||||||||
|
Service charge income and other income
|
1,550,974 | 81,872 | 1,632,846 | 57,389 | 1,690,235 | |||||||||||||||
|
Total income
(1)
|
4,762,461 | 168,644 | 4,931,105 | 601,801 | 5,532,906 | |||||||||||||||
|
Financial expenses
|
(800,182 | ) | (14,491 | ) | (814,673 | ) | (3,150 | ) | (817,823 | ) | ||||||||||
|
Allowances for doubtful loans
|
(172,452 | ) | (6,901 | ) | (179,353 | ) | — | (179,353 | ) | |||||||||||
|
Operating expenses
|
(1,957,154 | ) | (12,307 | ) | (1,969,461 | ) | (49,917 | ) | (2,019,378 | ) | ||||||||||
|
Other expenses
(2)
|
(750,674 | ) | (37,133 | ) | (787,807 | ) | (499,210 | ) | (1,287,017 | ) | ||||||||||
|
Total expenses
(3)
|
(3,680,462 | ) | (70,832 | ) | (3,751,294 | ) | (552,277 | ) | (4,303,571 | ) | ||||||||||
|
(Loss)/Gain on minority interest in subsidiaries
|
(219 | ) | (16,319 | ) | (16,538 | ) | (14,618 | ) | (31,156 | ) | ||||||||||
|
Total net income
|
1,081,780 | 81,493 | 1,163,273 | 34,906 | 1,198,179 | |||||||||||||||
|
(1)
|
Includes: financial income, service charge income and other income.
|
|
(2)
|
Includes: service charge expense, other expense, income tax and TOMPI.
|
|
(3)
|
Includes: financial expenses, allowances for doubtful loans, operating expenses and other expenses.
|
|
(4)
|
Includes: BBVA Francés Asset Management S.A. Sociedad Gerente de Fondos Comunes de Inversión and BBVA Francés Valores Sociedad de Bolsa S.A.
|
|
(5)
|
See Notes 1.4. and 15. to the Consolidated Financial Statements.
|
C.
ORGANIZATIONAL STRUCTURE
Banco Bilbao Vizcaya Argentaria S.A. (BBVA)
As of December 31, 2012, BBVA owned approximately 76% of our capital stock.
BBVA is the result of a merger by absorption of Argentaria, Caja Postal and Banco Hipotecario, S.A., formerly a Spanish retail banking, asset management and insurance provider, into Banco Bilbao Vizcaya, S.A. The merger was approved by the shareholders of both institutions on December 18, 1999. As of December 31, 2012, BBVA, through its subsidiaries, has a presence in 11 Latin American countries, United States, Mexico, China, several countries throughout Europe and Turquía.
BBVA is a global financial group, organized in five geographical business areas: (i) Spain, (ii) Mexico, (iii) South America, (iv) the United States and (v) Eurasia. In addition to these geographical business areas, BBVA have a separate “Corporate Activities” area. This area handles our general management functions. The benefits we receive from the BBVA Group are:
|
§
|
sharing of technology;
|
|
§
|
development of new banking products that have been customized for the Argentine market;
|
|
§
|
leveraging BBVA’s global client relationships to serve those clients operating in Argentina; and
|
|
§
|
BBVA’s participation in BBVA Francés as a shareholder is both long term and strategic.
|
Subsidiaries of BBVA Francés
We conduct our securities trading operations on the BCBA through our brokerage affiliate, BBVA Francés Valores Sociedad de Bolsa S.A.
Rombo Compañía Financiera S.A. (“Rombo”), grants loans in the retail market to finance the purchase of new and second-hand cars offered by the Renault dealership network. With the financing of 29,733 Renault vehicles, 53 Nissan vehicles and 4,556 second-
hand vehicles, Rombo registered 34,342 new credits in 2012, a 7% more the previous year. The total of car loans and leasing agreeements amounted to Ps1,998 million in 2012, compared to Ps.1,428 in 2011, which represented an increase of 40%. The portfolio quality and risk indicators have remained at low levels regarding the company’s historical values. Nevertheless, the tendency observed since December, 2012 shows a slight increase, as a result of a deceleration of the economy -the non-performing loan (“NPL”) level rose from 1.3% to 1.8% at the close of the year-. As for the company’s financing during 2012 there were six corporate bond issuances for a total of Ps.348 million. The program remained in an amount of Ps.700 million, with ratings of ”raAA” by FitchRatings and “raA“ by Standard & Poor’s. The result before taxes amounted to Ps.146 million, 107% above the previous year, resulting from a higher average portfolio level and a reduced impact in the negative accounting of commissions paid to the concessionaries network owing to a higher accrual of their contributions.
PSA Finance, located in Buenos Aires, is a financial entity organized in 2001 whose original shareholders were Credilogros Compañia Financiera S.A. (50%) and Banque PSA Finance (50%), a company owned by the PSA French group. Its main line of business is financing with car loans the purchase of new and used vehicles (for customers referred by official dealers) of Peugeot and Citroën brands, leasing agreements for cars, and other financial products and services associated with the purchase, maintenance and insurance of vehicles. PSA Finance maintained in 2012 the joint Peugeot/Citroën work strategy, especially in the development of exclusive and differentiated financial products for certain vehicles. This made it possible to achieve a market share of 25% of both brands registrations (measured on the basis of 0km car financing), representing 31,574 pledge-loan contracts for brand-new, second-hand and leasing vehicles, for a total of Ps.1.358 billion. The company thus ended the year with a 66,000-client portfolio valued at Ps.1.901 billion, a figure equivalent to 43% growth over the previous year. The net income totaled Ps. 76 million, 111% above the previous year.
The following chart reflects our subsidiaries as of December 31, 2012:
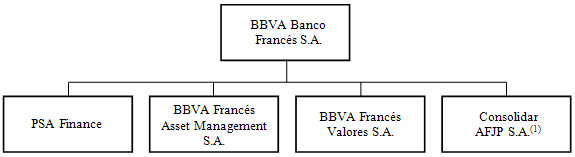
|
(1)
|
Undergoing liquidation proceedings.
|
The following information is related to our subsidiaries and affiliates as of December 31, 2012:
|
Subsidiary or Affiliates Company
|
Country of
Incorporation/
Residence
|
BBVA Francés
Ownership
and Voting Power
(in percentages)
|
Principal Activity |
Stockholders’
Equity
(in millions
of pesos)
(2) (3)
|
||||
|
BBVA Francés Asset Management S.A.
(1)
|
Argentina
|
95.00%
|
Investement fund manager
|
61.7
|
||||
|
BBVA Francés Valores Sociedad de Bolsa S.A.
(1)
|
Argentina
|
96.99%
|
Stock exchange brokerage
|
15.8
|
||||
|
Consolidar AFJP S.A. (undergoing liquidation proceedings)
(1)
|
Argentina
|
53.89%
|
Pension fund manager
|
16.7
|
||||
|
PSA Finance Argentina Cía. Financiera S.A.
(1)
|
Argentina
|
50.00%
|
Financial institution
|
219.5
|
||||
|
Rombo Compañía Financiera S.A.
(1)
|
Argentina
|
40.00%
|
Financial institution
|
243.2
|
||||
|
BBVA Consolidar Seguros S.A.
(1)
|
Argentina
|
12.22%
|
Insurance
|
163.5
|
|
(1)
|
For information regarding the number of shares we hold in such entities, see Note 2 to the Consolidated Financial Statements.
|
|
(2)
|
Total stockholders’ equity as of December 31, 2011.
|
|
(3)
|
Statutory Stockholders’ Equity, adjusted for purposes of consolidation so as to apply an accounting criterion being uniform with that of BBVA Francés, if applicable.
|
Grupo Consolidar
Grupo Consolidar consists of Consolidar AFJP S.A. (undergoing liquidation proceedings) and BBVA Consolidar Seguros S.A., in which BBVA Francés has participations of 53.89% and 12.22%, respectively.
Consolidar AFJP S.A. (undergoing liquidation proceedings)
Law Nr. 26,425- Dissolution and liquidation of Consolidar AFJP S.A.:
Law Nr. 26,425, which came into force on December 4, 2008, dictated that the capitalization system that used to be an integral part of the Integrated Retirement and Pension System was to be suppressed and replaced by a single pay-as-you-go system that is now known as the “Argentine Integrated Social Security System” (SIPA in Spanish). As a consequence, Consolidar AFJP S.A. ceased to manage the funds held in the individual capitalization accounts opened by the members and beneficiaries of the SIPA. These funds were transferred to the Fund to Guarantee the Sustainability of the State-run Social Security System in the same way as they had been invested and now the Argentine Social Security Authority (ANSES) is the only and sole holder of such assets and funds.
Besides, on October 29, 2009, ANSES issued its Resolution Nr. 290/2009 whereby it granted a term of 30 working days to the pension fund managers interested in re-converting their corporate purpose in order to manage the funds held as voluntary term deposits and as agreed-upon deposits in capitalization accounts, to express their interest in doing so.
Given that situation and the inability of Consolidar AFJP S.A. to attain the corporate purpose and conduct the business for which it had been constituted, its Extraordinary General Unanimous Shareholders’ Meeting adopted on December 28, 2009 the resolution to dissolve and subsequently liquidate Consolidar AFJP S.A. effective as of December 31, 2009. The decision was taken based on the argument that such will be the best alternative to safeguard the interests of both the creditors and the shareholders of the company. In accordance with the Argentine Companies Law, the shareholders’ meeting also decided to appoint accountants Mr. Gabriel Orden and Mr. Rubén Lamandia to act as liquidators of the company and they were designated as the company’s legal representatives as of December 31, 2009. The dissolution of Consolidar AFJP S.A. and the designated liquidators were registered with the Supervisory Board of Companies (IGJ) on January 28, 2010. As of December 31, 2012 the liquidators are still taking all the actions necessary to proceed with the liquidation of Consolidar AFJP S.A.
In addition, the Extraordinary General Shareholders’ Meeting of Consolidar AFJP S.A. approved a voluntary reduction of Ps.75 million of its share capital on October 19, 2009, which was later ratified by the IGJ on January 11, 2010. On January 19, 2010 the shareholders received back their capital contributions in conformity with the capital decrease.
BBVA Francés, in its capacity as shareholder requested that Consolidar AFJP S.A. (undergoing liquidation proceedings) should file a request with the Argentine Ministry of Economy and Public Finance and with the Argentine Social Security Authority to commence discussions within the framework of Law Nr. 26,425 in order to jointly identify alternative resolutions to the scenario resulted from the enactment of that Law Nr. 26,425. Such request was filed by Consolidar AFJP S.A. (undergoing liquidation proceedings) on June 11, 2010.
Consolidar AFJP S.A. (undergoing liquidation proceedings) filed a claim on December 7, 2010 for damages against the National State and the Ministry of Labor, Employment and Social Security with the court of original Federal Jurisdiction over Contentious Administrative Matters Nr. 4, Clerk of Court’s Office Nr. 7, case file Nr. 40,437/2010. The complaint was ratified by BBVA Francés on its capacity as majority shareholder of the company. On July 15, 2011, Consolidar AFJP S.A. (undergoing liquidation proceedings) and BBVA Francés filed with the same court an enhanced complaint for determining the amounts claimed as damages. On March 9, 2012, the Court ordered the service of process on the National State. On November 23, 2012, the Court issued a resolution demanding evidence within a term of forty days. The resolution is not yet final.
On April 12, 2011, the Supreme Court of Justice of Argentina ratified the ruling of the court of original Federal Jurisdiction over Contentious Administrative Matters in favour of Consolidar AFJP S.A. (undergoing liquidation proceedings) in connection with the claim for recovery asserted against the tax authorities (AFIP) for the amount of Ps.12,475 paid as additional income taxes for the fiscal year 2002 by the plaintiff by reason of not having applied the inflation adjustment for tax purposes. Because Consolidar AFJP S.A. is undergoing liquidation proceeding and could not otherwise collect the receivables arising from the court decision, it executed on June 29, 2011 an assignment for valuable consideration of all of its rights derived from this legal proceeding to BBVA Francés.
BBVA Consolidar Seguros S.A.
BBVA Consolidar Seguros operates in: fire, mixed family and comprehensive insurance, civil liability, theft, personal accidents, umbrella life and other insurance risks.
In 2012 it sold total premiums for Ps.564 million, 46% more than the prior year. This increase confirms the successful strategy chosen that combines a wide product offer with multiple distribution and service channels. The strategy is based on segmentation of our customers and prospects needs. Total claims paid out amounted Ps.88 million, 16% of the premiums issued. Net income was Ps.40 million, with a return on net equity of 24% at the end of the year. As of September 2012, the surplus of minimum capital was Ps.64 million, and the solvency ratio (cash & cash equivalents, investments and real estate and technical commitments and debts with insured parties) was 1.27.
For 2013, the plan of BBVA Consolidar Seguros will consist of maintaining the growth of its main lines, in particular life, personal accidents and mixed familiar and comprehensive insurance, based on offers that meet the needs of its main customers in a different way.
Sale of Consolidar Aseguradora de Riesgos del Trabajo S.A.
A stock purchase agreement was signed on October 6, 2011 for all the shares of Consolidar ART among BBVA Francés, holder of 12.50% of the share capital, and BBVA, holder of remaining 87.50%, as sellers and Galeno Argentina S.A., as purchaser.
This agreement established a total purchase price for the shares of U.S.$59,443,137, adjustable in accordance with the revenues obtained from the sale by Consolidar ART of its own property where the offices are located. On October 6, 2011 BBVA Francés received an advance of Ps.19 million corresponding to 60% of its pro rata purchase price. The transaction was approved by SSN on February 6, 2012. The transfer of the shares of Consolidar ART to Galeno Argentina S.A. and the collection of the pending purchase price was completed on March 6, 2012.
Equity Investments
The following are all positions that we hold in non-financial institutions where we own more than 2% of the invested companies’ equity as of December 31, 2012.
|
Investment
|
Country
|
% of Shares
Owned
(in percentages)
|
Principal Activity
|
Total
Stockholders’
Equity (in
millions of pesos)
|
||||||
|
Coelsa S.A.
(1)
|
Argentina
|
11.39%
|
Clearing house
|
2.6
|
||||||
|
Interbanking S.A.
(1)
|
Argentina
|
10.00%
|
Information services for financial markets
|
84.9
|
||||||
|
Argencontrol S.A.
(1)
|
Argentina
|
7.77%
|
Agent mandatory
|
1.2
|
||||||
|
Sedesa S.A.
(1)
|
Argentina
|
10.53%
|
Deposit guarantee fund
|
1.0
|
||||||
|
Banelco S.A.
(2)
|
Argentina
|
10.91%
|
Nationwide ATM network & credit card administration
|
69.1
|
||||||
|
Visa Argentina S.A.
(3)
|
Argentina
|
10.87%
|
Credit card issuer
|
231.2
|
||||||
|
(1)
|
Total Stockholders’ Equity as of December 31, 2011.
|
|
(2)
|
Total Stockholders’ Equity as of June 30, 2012.
|
|
(3)
|
Total Stockholders’ Equity as of May 31, 2012.
|
D.
PROPERTY, PLANTS AND EQUIPMENT
BBVA Francés is domiciled in Argentina and has its principal executive offices at Reconquista 199, C1003ABB Buenos Aires, Argentina. The principal executive offices, which we own, are approximately 16,000 square meters in area.
At December 31, 2012, our branch network consisted of 244 branches, of which 112 were located in properties that we own and 132 were located in properties leased to us. The branches are located throughout all of the 23 Argentine provinces as well as the City of Buenos Aires.
SELECTED STATISTICAL INFORMATION
The following information is included for analytical purposes and should be read in conjunction with the Consolidated Financial Statements as well as
“Operating and Financial Review and Prospects”
. This information has been prepared from our financial records, which are maintained in accordance with the regulations established by the Central Bank and do not reflect adjustments necessary to state the information in accordance with U.S. GAAP. See Note 22 to the Consolidated Financial Statements for a summary of the significant differences between Argentine Banking GAAP and U.S. GAAP.
The average balances of interest-earning assets and interest-bearing liabilities, including the related interest earned or paid, were calculated on a monthly basis in the case of the financial information of BBVA Francés and its subsidiaries. Average balances have been separated between those denominated in pesos and in dollars.
The nominal interest rate is the amount of interest earned or paid during the period divided by the related average balance.
The nominal average rates for each fiscal year were converted to average real rates as follows:
|
Rp =
|
1 + Np
|
- 1
|
Rd =
|
(1 + Nd)(1 + D)
|
- 1
|
|
1 + I
|
1 + I
|
Where:
Rp: real average rate for Argentine peso-denominated assets and liabilities of BBVA Francés;
Rd: real average rates for dollar-denominated assets and liabilities of BBVA Francés;
Np: nominal peso average rate in peso-denominated assets and liabilities for the fiscal year;
Nd: nominal dollar average rate in dollar-denominated assets and liabilities for the fiscal year;
D: devaluation rate of the Argentine peso to the dollar for the fiscal year; and
I: Argentine inflation rate (“WPI”).
The formula for the average real rates for dollar-denominated assets and liabilities (Rd), when compared with the corresponding nominal rates, reflects the loss, or gain, in purchasing power of the dollar caused by the difference between peso devaluation and inflation in Argentina for each fiscal year.
Included in interest earned are the net gains on our portfolio of Government securities and related differences in market quotations. We manage our trading activities in Government Securities as an integral part of our business. We do not, as a matter of practice, distinguish between interest income and gain or loss on our Government Securities portfolio. Non-accrual loans have been included in the related average loan calculation.
Negative interest rates in real terms occur in periods when the inflation rate in each country exceeds the nominal interest rate in pesos or exceeds the combination of the nominal interest rate on dollar-denominated assets or liabilities and the devaluation rate.
The following illustrates the calculation of the real interest rate in pesos for a dollar-denominated asset yielding a nominal annual interest rate of 20.0% (Nd=0.20) using different combinations of devaluation and inflation rates. If devaluation is 15.0% per annum (D=0.15) and inflation runs at a rate of 25.0% per annum (I=0.25), the result is as follows:
|
Rd =
|
(1+0.20)(1+0.15)
|
- 1
|
=
|
10.4% per annum
|
|
1+0.25
|
which in this case means that, because inflation exceeds devaluation, the real interest rate in pesos is less than the nominal interest rate in dollars. In this example, if the devaluation rate had been 30.0% per annum, and the other assumptions had remained the same, then the real interest rate in pesos would have been 24.8% per annum, which is more than the nominal interest rate in dollars. If the
inflation rate were to exceed 38.0% per annum, then the real interest rate in pesos on this dollar denominated asset would become negative.
Average Balance Sheets, Interest Earned on Interest-Earning Assets and Interest Paid on Interest-Bearing Liabilities
The following tables show average balances, interest amounts and real rates for our interest-earning assets and interest-bearing liabilities for the fiscal years ended December 31, 2012, 2011 and 2010.
|
December 31,
|
||||||||||||||||||||||||||||||||||||
|
2012
|
2011
|
2010
|
||||||||||||||||||||||||||||||||||
|
Average
balance
(1)
|
Interest
earned/
paid
|
Average
real rate
(2)
|
Average
balance
(1)
|
Interest
earned/
paid
|
Average
real rate
(2)
|
Average
balance
(1)
|
Interest
earned/
paid
|
Average
real rate
(2)
|
||||||||||||||||||||||||||||
|
(in thousands of pesos, except percentages)
|
||||||||||||||||||||||||||||||||||||
|
ASSETS
|
||||||||||||||||||||||||||||||||||||
|
Interest-earning assets
|
||||||||||||||||||||||||||||||||||||
|
Government securities
(3)
|
||||||||||||||||||||||||||||||||||||
|
Pesos
|
5,733,710 | 775,808 | 0.40 | % | 5,910,088 | 585,291 | (2.45 | )% | 4,965,474 | 1,219,068 | 8.72 | % | ||||||||||||||||||||||||
|
Dollars
|
114 | 83 | 74.41 | % | 164,044 | 714 | (3.51 | )% | 121,719 | 21,396 | 7.47 | % | ||||||||||||||||||||||||
|
Total
|
5,733,824 | 775,891 | 0.40 | % | 6,074,132 | 586,005 | (2.48 | )% | 5,087,193 | 1,240,464 | 8.69 | % | ||||||||||||||||||||||||
|
Loans
(4)
|
||||||||||||||||||||||||||||||||||||
|
Private Sector
|
||||||||||||||||||||||||||||||||||||
|
Pesos
|
21,784,022 | 4,258,681 | 5.72 | % | 15,665,675 | 2,634,984 | 3.69 | % | 10,200,276 | 1,680,850 | 1.67 | % | ||||||||||||||||||||||||
|
Dollars
|
2,994,902 | 135,684 | 5.63 | % | 3,417,049 | 73,626 | (1.86 | )% | 1,986,761 | 63,777 | (5.66 | )% | ||||||||||||||||||||||||
|
Total
|
24,778,924 | 4,394,365 | 5.71 | % | 19,082,724 | 2,708,610 | 2.70 | % | 12,187,037 | 1,744,627 | 0.48 | % | ||||||||||||||||||||||||
|
Public Sector
|
||||||||||||||||||||||||||||||||||||
|
Pesos
|
491,604 | — | — | 929,371 | 548 | (11.19 | )% | 509,538 | — | — | ||||||||||||||||||||||||||
|
Dollars
|
4 | — | — | — | — | — | — | — | — | |||||||||||||||||||||||||||
|
Total
|
491,608 | — | — | 929,371 | 548 | (11.19 | )% | 509,538 | — | — | ||||||||||||||||||||||||||
|
Deposits with the Central Bank
|
||||||||||||||||||||||||||||||||||||
|
Pesos
|
163,946 | — | — | 127,251 | — | — | 119,463 | — | — | |||||||||||||||||||||||||||
|
Dollars
|
1,860,749 | — | — | 2,537,075 | — | — | 3,336,469 | — | — | |||||||||||||||||||||||||||
|
Total
|
2,024,695 | — | — | 2,664,326 | — | — | 3,455,932 | — | — | |||||||||||||||||||||||||||
|
Other assets
|
||||||||||||||||||||||||||||||||||||
|
Pesos
|
2,170,203 | 341,302 | 2.34 | % | 1,867,995 | 296,536 | 2.85 | % | 1,125,585 | 120,308 | (3.38 | )% | ||||||||||||||||||||||||
|
Dollars
|
1,166 | 22 | 2.99 | % | 40,687 | 2,967 | 3.08 | % | 106,663 | 2,423 | (6.52 | )% | ||||||||||||||||||||||||
|
Total
|
2,171,369 | 341,324 | 2.34 | % | 1,908,682 | 299,503 | 2.86 | % | 1,232,248 | 122,731 | (3.65 | )% | ||||||||||||||||||||||||
|
Interest-earning assets from continued operations
|
||||||||||||||||||||||||||||||||||||
|
Pesos
|
30,343,485 | 5,375,791 | 4.10 | % | 24,500,380 | 3,517,359 | 1.51 | % | 16,920,336 | 3,020,226 | 2.87 | % | ||||||||||||||||||||||||
|
Dollars
|
4,856,935 | 135,789 | 3.88 | % | 6,158,855 | 77,307 | (2.72 | )% | 5,551,612 | 87,596 | (7.15 | )% | ||||||||||||||||||||||||
|
Total
|
35,200,420 | 5,511,580 | 4.07 | % | 30,659,235 | 3,594,666 | 0.66 | % | 22,471,948 | 3,107,822 | 0.39 | % | ||||||||||||||||||||||||
|
Interest-earning assets from discontinued operations
|
||||||||||||||||||||||||||||||||||||
|
Pesos
|
69,455 | 12,696 | — | 50,588 | 3,384 | (0.01 | )% | 2,394,782 | 507,053 | 0.36 | % | |||||||||||||||||||||||||
|
Dollars
|
2,284 | — | — | 7,718 | — | — | 741,154 | — | (0.17 | )% | ||||||||||||||||||||||||||
|
Total
|
71,739 | 12,696 | — | 58,306 | 3,384 | (0.01 | )% | 3,135,936 | 507,053 | 0.24 | % | |||||||||||||||||||||||||
|
Total interest-earning assets
|
||||||||||||||||||||||||||||||||||||
|
Pesos
|
30,412,940 | 5,388,487 | 4.10 | % | 24,550,968 | 3,520,743 | 1.49 | % | 19,315,118 | 3,527,279 | 3.23 | % | ||||||||||||||||||||||||
|
Dollars
|
4,859,219 | 135,789 | 3.88 | % | 6,166,573 | 77,307 | (2.72 | )% | 6,292,766 | 87,596 | (7.32 | )% | ||||||||||||||||||||||||
|
Total
|
35,272,159 | 5,524,276 | 4.07 | % | 30,717,541 | 3,598,050 | 0.65 | % | 25,607,884 | 3,614,875 | 0.64 | % | ||||||||||||||||||||||||
|
December 31,
|
||||||||||||||||||||||||||||||||||||
|
2012
|
2011
|
2010
|
||||||||||||||||||||||||||||||||||
|
Average
balance
(1)
|
Interest
earned/
paid
|
Average
real rate
(2)
|
Average
balance
(1)
|
Interest
earned/
paid
|
Average
real rate
(2)
|
Average
balance
(1)
|
Interest
earned/
paid
|
Average
real rate
(2)
|
||||||||||||||||||||||||||||
|
(in thousands of pesos, except percentages)
|
||||||||||||||||||||||||||||||||||||
|
Non-interest-earning assets
|
||||||||||||||||||||||||||||||||||||
|
Cash and due from banks
|
||||||||||||||||||||||||||||||||||||
|
Pesos
|
4,132,461 | — | — | 3,110,071 | — | — | 2,147,422 | — | — | |||||||||||||||||||||||||||
|
Dollars
|
613,787 | — | — | 776,237 | — | — | 618,364 | — | — | |||||||||||||||||||||||||||
|
Total
|
4,746,248 | — | — | 3,886,308 | — | — | 2,765,786 | — | — | |||||||||||||||||||||||||||
|
Investments in other companies
|
||||||||||||||||||||||||||||||||||||
|
Pesos
|
137,128 | — | — | 91,232 | — | — | 100,076 | — | — | |||||||||||||||||||||||||||
|
Dollars
|
1,209 | — | — | 1,095 | — | — | 1,037 | — | — | |||||||||||||||||||||||||||
|
Total
|
138,337 | — | — | 92,327 | — | — | 101,113 | — | — | |||||||||||||||||||||||||||
| Property and equipment and miscellaneous and intangible assets and items pending allocation | ||||||||||||||||||||||||||||||||||||
|
Pesos
|
707,605 | — | — | 652,799 | — | — | 604,962 | — | — | |||||||||||||||||||||||||||
|
Total
|
707,605 | — | — | 652,799 | — | — | 604,962 | — | — | |||||||||||||||||||||||||||
|
Allowance for loan losses
|
||||||||||||||||||||||||||||||||||||
|
Pesos
|
(673,167 | ) | — | — | (423,818 | ) | — | — | (545,349 | ) | — | — | ||||||||||||||||||||||||
|
Dollars
|
(67,308 | ) | — | — | (52,569 | ) | — | — | (34,497 | ) | — | — | ||||||||||||||||||||||||
|
Total
|
(740,475 | ) | — | — | (476,387 | ) | — | — | (579,846 | ) | — | — | ||||||||||||||||||||||||
|
Other assets
|
||||||||||||||||||||||||||||||||||||
|
Pesos
|
810,826 | — | — | 710,741 | — | — | 604,985 | — | — | |||||||||||||||||||||||||||
|
Dollars
|
264,328 | — | — | 284,003 | — | — | 271,725 | — | — | |||||||||||||||||||||||||||
|
Total
|
1,075,154 | — | — | 994,744 | — | — | 876,710 | — | — | |||||||||||||||||||||||||||
|
Non-interest-earning assets from continued operations
|
||||||||||||||||||||||||||||||||||||
|
Pesos
|
5,114,853 | — | — | 4,141,025 | — | — | 2,912,096 | — | — | |||||||||||||||||||||||||||
|
Dollars
|
812,016 | — | — | 1,008,766 | — | — | 856,629 | — | — | |||||||||||||||||||||||||||
|
Total
|
5,926,869 | — | — | 5,149,791 | — | — | 3,768,725 | — | — | |||||||||||||||||||||||||||
|
Non-interest-earning assets from discontinued operations
|
||||||||||||||||||||||||||||||||||||
|
Pesos
|
24,164 | — | — | 16,140 | — | — | 211,961 | — | — | |||||||||||||||||||||||||||
|
Dollars
|
264 | — | — | 268 | — | — | 30,333 | — | — | |||||||||||||||||||||||||||
|
Total
|
24,428 | — | — | 16,408 | — | — | 242,294 | — | — | |||||||||||||||||||||||||||
|
Total non-interest-earning assets
|
||||||||||||||||||||||||||||||||||||
|
Pesos
|
5,139,017 | — | — | 4,157,165 | — | — | 3,124,057 | — | — | |||||||||||||||||||||||||||
|
Dollars
|
812,280 | — | — | 1,009,034 | — | — | 886,962 | — | — | |||||||||||||||||||||||||||
|
Total
|
5,951,297 | — | — | 5,166,199 | — | — | 4,011,019 | — | — | |||||||||||||||||||||||||||
|
ASSETS FROM CONTINUED OPERATIONS
|
||||||||||||||||||||||||||||||||||||
|
Pesos
|
35,458,338 | — | — | 28,641,405 | — | — | 19,832,432 | — | — | |||||||||||||||||||||||||||
|
Dollars
|
5,668,951 | — | — | 7,167,621 | — | — | 6,408,241 | — | — | |||||||||||||||||||||||||||
|
Total
|
41,127,289 | — | — | 35,809,026 | — | — | 26,240,673 | — | — | |||||||||||||||||||||||||||
|
ASSETS FROM DISCONTINUED OPERATIONS
|
||||||||||||||||||||||||||||||||||||
|
Pesos
|
93,619 | — | — | 66,728 | — | — | 2,606,743 | — | — | |||||||||||||||||||||||||||
|
Dollars
|
2,548 | — | — | 7,986 | — | — | 771,487 | — | — | |||||||||||||||||||||||||||
|
Total
|
96,167 | — | — | 74,714 | — | — | 3,378,230 | — | — | |||||||||||||||||||||||||||
|
TOTAL ASSETS
|
||||||||||||||||||||||||||||||||||||
|
Pesos
|
35,551,957 | — | — | 28,708,133 | — | — | 22,439,175 | — | — | |||||||||||||||||||||||||||
|
Dollars
|
5,671,499 | — | — | 7,175,607 | — | — | 7,179,728 | — | — | |||||||||||||||||||||||||||
|
Total
|
41,223,456 | — | — | 35,883,740 | — | — | 29,618,903 | — | — | |||||||||||||||||||||||||||
|
(1)
|
Average balances are derived from month-end balances.
|
|
(2)
|
Annualized on a 360-day basis.
|
|
(3)
|
Includes trading gains and losses in all fiscal years. Unrealized gains and losses arising from changes in the market value of our trading portfolio of Government Securities and yield on our investment portfolio of Government Securities are included.
|
|
(4)
|
Loan amounts are stated before deduction of the allowance for loan losses. Non-accrual loans are included in loans as interest-earning assets.
|
|
|
December 31,
|
|||||||||||||||||||||||||||||||||||
|
2012
|
2011
|
2010
|
||||||||||||||||||||||||||||||||||
|
Average
balance
(1)
|
Interest
earned/
paid
|
Average
real rate
(2)
|
Average
balance
(1)
|
Interest
earned/
paid
|
Average
real rate
(2)
|
Average
balance
(1)
|
Interest
earned/
paid
|
Average
real rate
(2)
|
||||||||||||||||||||||||||||
|
(in thousands of pesos, except percentages)
|
||||||||||||||||||||||||||||||||||||
|
LIABILITIES
|
||||||||||||||||||||||||||||||||||||
|
Interest-bearing liabilities
|
||||||||||||||||||||||||||||||||||||
|
Savings accounts
|
||||||||||||||||||||||||||||||||||||
|
Pesos
|
6,186,969 | 9,367 | (11.43 | )% | 4,784,502 | 6,767 | (11.11 | )% | 3,881,058 | 5,026 | (12.60 | )% | ||||||||||||||||||||||||
|
Dollars
|
1,913,643 | 1,781 | 1.15 | % | 2,671,586 | 2,416 | (3.84 | )% | 2,273,514 | 1,637 | (8.53 | )% | ||||||||||||||||||||||||
|
Total
|
8,100,612 | 11,148 | (8.46 | )% | 7,456,088 | 9,183 | (8.51 | )% | 6,154,572 | 6,663 | (11.09 | )% | ||||||||||||||||||||||||
|
Time deposits
|
||||||||||||||||||||||||||||||||||||
|
Pesos
|
11,201,224 | 1,526,358 | 0.49 | % | 9,010,574 | 1,058,109 | (0.81 | )% | 6,335,859 | 611,786 | (4.28 | )% | ||||||||||||||||||||||||
|
Dollars
|
1,460,417 | 3,842 | 1.32 | % | 1,918,794 | 4,666 | (3.69 | )% | 1,789,633 | 8,019 | (8.18 | )% | ||||||||||||||||||||||||
|
Total
|
12,661,641 | 1,530,200 | 0.58 | % | 10,929,368 | 1,062,775 | (1.32 | )% | 8,125,492 | 619,805 | (5.14 | )% | ||||||||||||||||||||||||
|
Borrowings from the Central Bank
|
||||||||||||||||||||||||||||||||||||
|
Pesos
|
81,135 | 2,311 | (9.04 | )% | 53,083 | 558 | (10.30 | )% | 31,643 | — | — | |||||||||||||||||||||||||
|
Dollars
|
1,702 | 2 | 1.19 | % | 2,526 | 18 | (3.26 | )% | 2,023 | 10 | (8.16 | )% | ||||||||||||||||||||||||
|
Total
|
82,837 | 2,313 | (8.83 | )% | 55,609 | 576 | (9.98 | )% | 33,666 | 10 | (0.49 | )% | ||||||||||||||||||||||||
|
Borrowings from other financial institutions
|
||||||||||||||||||||||||||||||||||||
|
Pesos
|
11,031 | 215,348 | 1,714.81 | % | 29,736 | 38,961 | 105.06 | % | 7,428 | 72,087 | 834.40 | % | ||||||||||||||||||||||||
|
Dollars
|
501,100 | 17,881 | 4.66 | % | 265,254 | 3,259 | (2.75 | )% | 56,370 | 1,385 | (6.35 | )% | ||||||||||||||||||||||||
|
Total
|
512,131 | 233,229 | 41.50 | % | 294,990 | 42,220 | 8.12 | % | 63,798 | 73,472 | 91.54 | % | ||||||||||||||||||||||||
|
Corporate bonds
|
||||||||||||||||||||||||||||||||||||
|
Pesos
|
593,162 | 54,341 | (3.46 | )% | 63,056 | 11,149 | 4.46 | % | — | — | — | |||||||||||||||||||||||||
|
Total
|
593,162 | 54,341 | (3.46 | )% | 63,056 | 11,149 | 4.46 | % | — | — | — | |||||||||||||||||||||||||
|
Other liabilities
|
||||||||||||||||||||||||||||||||||||
|
Pesos
|
357,890 | (115,073 | ) | (40.00 | )% | 9,814 | 19,905 | 168.81 | % | 437,271 | (57,155 | ) | (24.12 | )% | ||||||||||||||||||||||
|
Dollars
|
66,303 | — | — | 108,675 | — | — | 690,246 | 13 | (8.59 | )% | ||||||||||||||||||||||||||
|
Total
|
424,193 | (115,073 | ) | (33.75 | )% | 118,489 | 19,905 | 13.98 | % | 1,127,517 | (57,142 | ) | (14.61 | )% | ||||||||||||||||||||||
|
Interest-bearing liabilities from continued operations
|
||||||||||||||||||||||||||||||||||||
|
Pesos
|
18,431,411 | 1,692,652 | (3.44 | )% | 13,950,765 | 1,135,449 | (4.01 | )% | 10,693,259 | 631,744 | (7.55 | )% | ||||||||||||||||||||||||
|
Dollars
|
3,943,165 | 23,506 | 1.66 | % | 4,966,835 | 10,359 | (3.73 | )% | 4,811,786 | 11,064 | (8.38 | )% | ||||||||||||||||||||||||
|
Total
|
22,374,576 | 1,716,158 | (2.54 | )% | 18,917,600 | 1,145,808 | (3.94 | )% | 15,505,045 | 642,808 | (7.81 | )% | ||||||||||||||||||||||||
|
Interest-bearing liabilities from discontinued operations
|
||||||||||||||||||||||||||||||||||||
|
Pesos
|
(11,923 | ) | 5 | — | (59,130 | ) | (9,602 | ) | (0.03 | )% | (27,599 | ) | 1,737 | 0.03 | % | |||||||||||||||||||||
|
Total
|
(11,923 | ) | 5 | — | (59,130 | ) | (9,602 | ) | (0.03 | )% | (27,599 | ) | 1,737 | 0.02 | % | |||||||||||||||||||||
|
Total interest-bearing liabilities
|
||||||||||||||||||||||||||||||||||||
|
Pesos
|
18,419,488 | 1,692,657 | (3.44 | )% | 13,891,635 | 1,125,847 | (4.04 | )% | 10,665,660 | 633,481 | (7.53 | )% | ||||||||||||||||||||||||
|
Dollars
|
3,943,165 | 23,506 | 1.66 | % | 4,966,835 | 10,359 | (3.73 | )% | 4,811,786 | 11,064 | (8.38 | )% | ||||||||||||||||||||||||
|
Total
|
22,362,653 | 1,716,163 | (2.54 | )% | 18,858,470 | 1,136,206 | (3.97 | )% | 15,477,446 | 644,545 | (7.79 | )% | ||||||||||||||||||||||||
|
December 31,
|
||||||||||||||||||||||||||||||||||||
|
2012
|
2011
|
2010
|
||||||||||||||||||||||||||||||||||
|
Average
balance
(1)
|
Interest
earned/
paid
|
Average
real rate
(2)
|
Average
balance
(1)
|
Interest
earned/
paid
|
Average
real rate
(2)
|
Average
balance
(1)
|
Interest
earned/
paid
|
Average
real rate
(2)
|
||||||||||||||||||||||||||||
|
(in thousands of pesos, except percentages)
|
||||||||||||||||||||||||||||||||||||
|
Non-interest bearing liabilities and stockholders’ equity
|
||||||||||||||||||||||||||||||||||||
|
Demand accounts
|
||||||||||||||||||||||||||||||||||||
|
Pesos
|
8,660,998 | — | — | 6,820,551 | — | — | 4,427,600 | — | — | |||||||||||||||||||||||||||
|
Dollars
|
803,844 | — | — | 1,017,747 | — | — | 542,521 | — | — | |||||||||||||||||||||||||||
|
Total
|
9,463,942 | — | — | 7,838,298 | — | — | 4,970,121 | — | — | |||||||||||||||||||||||||||
|
Other liabilities
|
||||||||||||||||||||||||||||||||||||
|
Pesos
|
4,102,444 | — | — | 4,764,021 | — | — | 2,107,020 | — | — | |||||||||||||||||||||||||||
|
Dollars
|
701,226 | — | — | 869,190 | — | — | 732,132 | — | — | |||||||||||||||||||||||||||
|
Total
|
4,803,670 | — | — | 5,633,211 | — | — | 2,839,152 | — | — | |||||||||||||||||||||||||||
|
Minority interest
|
||||||||||||||||||||||||||||||||||||
|
Pesos
|
— | — | — | — | — | — | 228,449 | — | — | |||||||||||||||||||||||||||
|
Total
|
— | — | — | — | — | — | 228,449 | — | — | |||||||||||||||||||||||||||
|
Stockholders’ equity
|
||||||||||||||||||||||||||||||||||||
|
Pesos
|
4,485,101 | — | — | 3,419,917 | — | — | 2,697,906 | — | — | |||||||||||||||||||||||||||
|
Total
|
4,485,101 | — | — | 3,419,917 | — | — | 2,697,906 | — | — | |||||||||||||||||||||||||||
|
Non–interest bearing liabilities and stockholders equity from continued operations
|
||||||||||||||||||||||||||||||||||||
|
Pesos
|
17,247,643 | — | — | 15,004,489 | — | — | 9,460,975 | — | — | |||||||||||||||||||||||||||
|
Dollars
|
1,505,070 | — | — | 1,886,937 | — | — | 1,274,653 | — | — | |||||||||||||||||||||||||||
|
Total
|
18,752,713 | — | — | 16,891,426 | — | — | 10,735,628 | — | — | |||||||||||||||||||||||||||
|
Non–interest bearing liabilities and stockholders equity from discontinued operations
|
||||||||||||||||||||||||||||||||||||
|
Pesos
|
108,090 | — | — | 133,845 | — | — | 3,390,038 | — | — | |||||||||||||||||||||||||||
|
Dollars
|
— | — | — | — | — | — | 15,791 | — | — | |||||||||||||||||||||||||||
|
Total
|
108,090 | — | — | 133,845 | — | — | 3,405,829 | — | — | |||||||||||||||||||||||||||
|
Total non–interest bearing liabilities and stockholders equity
|
||||||||||||||||||||||||||||||||||||
|
Pesos
|
17,355,733 | — | — | 15,138,333 | — | — | 12,851,013 | — | — | |||||||||||||||||||||||||||
|
Dollars
|
1,505,070 | — | — | 1,886,937 | — | — | 1,290,444 | — | — | |||||||||||||||||||||||||||
|
Total
|
18,860,803 | — | — | 17,025,270 | — | — | 14,141,457 | — | — | |||||||||||||||||||||||||||
|
LIABILITIES AND STOCKHOLDERS’ EQUITY FROM CONTINUED OPERATIONS
|
||||||||||||||||||||||||||||||||||||
|
Pesos
|
35,679,054 | — | — | 28,955,254 | — | — | 20,154,234 | — | — | |||||||||||||||||||||||||||
|
Dollars
|
5,448,235 | — | — | 6,853,772 | — | — | 6,086,439 | — | — | |||||||||||||||||||||||||||
|
Total
|
41,127,289 | — | — | 35,809,026 | — | — | 26,240,673 | — | — | |||||||||||||||||||||||||||
|
LIABILITIES AND STOCKHOLDERS’ EQUITY FROM DISCONTINUED OPERATIONS
|
||||||||||||||||||||||||||||||||||||
|
Pesos
|
96,167 | — | — | 74,715 | — | — | 3,362,439 | — | — | |||||||||||||||||||||||||||
|
Dollars
|
— | — | — | — | — | — | 15,791 | — | — | |||||||||||||||||||||||||||
|
Total
|
96,167 | — | — | 74,715 | — | — | 3,378,230 | — | — | |||||||||||||||||||||||||||
|
TOTAL LIABILITIES AND STOCKHOLDERS’ EQUITY
|
||||||||||||||||||||||||||||||||||||
|
Pesos
|
35,775,221 | — | — | 29,029,968 | — | — | 23,516,673 | — | — | |||||||||||||||||||||||||||
|
Dollars
|
5,448,235 | — | — | 6,853,772 | — | — | 6,102,230 | — | — | |||||||||||||||||||||||||||
|
Total
|
41,223,456 | — | — | 35,883,740 | — | — | 29,618,903 | — | — | |||||||||||||||||||||||||||
|
(1)
|
Average balances are derived from month-end balances.
|
|
(2)
|
Annualized on a 360-day basis.
|
The following tables show average balances, interest amounts and nominal rates for our interest-earning assets and interest-bearing liabilities for the fiscal years ended December 31, 2012, 2011 and 2010.
|
December 31,
|
||||||||||||||||||||||||||||||||||||
|
2012
|
2011
|
2010
|
||||||||||||||||||||||||||||||||||
|
Average
balance
(1)
|
Interest
earned/
paid
|
Average
nominal
rate
(2)
|
Average
balance
(1)
|
Interest
earned/
paid
|
Average
Nominal
rate
(2)
|
Average
balance
(1)
|
Interest
earned/
paid
|
Average
nominal
rate
(2)
|
||||||||||||||||||||||||||||
|
(in thousands of pesos, except percentages)
|
||||||||||||||||||||||||||||||||||||
|
ASSETS
|
||||||||||||||||||||||||||||||||||||
|
Interest-earning assets
|
||||||||||||||||||||||||||||||||||||
|
Government securities
(3)
|
||||||||||||||||||||||||||||||||||||
|
Pesos
|
5,733,710 | 775,808 | 13.53 | % | 5,910,088 | 585,291 | 9.90 | % | 4,965,474 | 1,219,068 | 24.55 | % | ||||||||||||||||||||||||
|
Dollars
|
114 | 83 | 72.59 | % | 164,044 | 714 | 0.44 | % | 121,719 | 21,396 | 17.58 | % | ||||||||||||||||||||||||
|
Total
|
5,733,824 | 775,891 | 13.53 | % | 6,074,132 | 586,005 | 9.65 | % | 5,087,193 | 1,240,464 | 24.38 | % | ||||||||||||||||||||||||
|
Loans
(4)
|
||||||||||||||||||||||||||||||||||||
|
Private Sector
|
||||||||||||||||||||||||||||||||||||
|
Pesos
|
21,784,022 | 4,258,681 | 19.55 | % | 15,665,675 | 2,634,984 | 16.82 | % | 10,200,276 | 1,680,850 | 16.48 | % | ||||||||||||||||||||||||
|
Dollars
|
2,994,902 | 135,684 | 4.53 | % | 3,417,049 | 73,626 | 2.15 | % | 1,986,761 | 63,777 | 3.21 | % | ||||||||||||||||||||||||
|
Total
|
24,778,924 | 4,394,365 | 17.73 | % | 19,082,724 | 2,708,610 | 14.19 | % | 12,187,037 | 1,744,627 | 14.32 | % | ||||||||||||||||||||||||
|
Public Sector
|
||||||||||||||||||||||||||||||||||||
|
Pesos
|
491,604 | — | — | 929,371 | 548 | 0.06 | % | 509,538 | — | — | ||||||||||||||||||||||||||
|
Dollars
|
4 | — | — | |||||||||||||||||||||||||||||||||
|
Total
|
491,608 | — | — | 929,371 | 548 | 0.06 | % | 509,538 | — | — | ||||||||||||||||||||||||||
|
Deposits with the Central Bank
|
||||||||||||||||||||||||||||||||||||
|
Pesos
|
163,946 | — | — | 127,251 | — | — | 119,463 | — | — | |||||||||||||||||||||||||||
|
Dollars
|
1,860,749 | — | — | 2,537,075 | — | — | 3,336,469 | — | — | |||||||||||||||||||||||||||
|
Total
|
2,024,695 | — | — | 2,664,326 | — | — | 3,455,932 | — | — | |||||||||||||||||||||||||||
|
Other assets
|
||||||||||||||||||||||||||||||||||||
|
Pesos
|
2,170,203 | 341,302 | 15.73 | % | 1,867,995 | 296,536 | 15.87 | % | 1,125,585 | 120,308 | 10.69 | % | ||||||||||||||||||||||||
|
Dollars
|
1,166 | 22 | 1.92 | % | 40,687 | 2,967 | 7.29 | % | 106,663 | 2,423 | 2.27 | % | ||||||||||||||||||||||||
|
Total
|
2,171,369 | 341,324 | 15.72 | % | 1,908,682 | 299,503 | 15.69 | % | 1,232,248 | 122,731 | 9.96 | % | ||||||||||||||||||||||||
|
Interest-earning assets from continued operations
|
||||||||||||||||||||||||||||||||||||
|
Pesos
|
30,343,485 | 5,375,791 | 17.72 | % | 24,500,380 | 3,517,359 | 14.36 | % | 16,920,336 | 3,020,226 | 17.85 | % | ||||||||||||||||||||||||
|
Dollars
|
4,856,935 | 135,789 | 2.80 | % | 6,158,855 | 77,307 | 1.26 | % | 5,551,612 | 87,596 | 1.58 | % | ||||||||||||||||||||||||
|
Total
|
35,200,420 | 5,511,580 | 15.66 | % | 30,659,235 | 3,594,666 | 11.72 | % | 22,471,948 | 3,107,822 | 13.83 | % | ||||||||||||||||||||||||
|
Interest-earning assets from discontinued operations
|
||||||||||||||||||||||||||||||||||||
|
Pesos
|
69,455 | 12,696 | — | 50,588 | 3,384 | (0.02 | )% | 2,394,782 | 507,053 | 0.41 | % | |||||||||||||||||||||||||
|
Dollars
|
2,284 | — | — | 7,718 | — | — | 741,154 | — | (0.19 | )% | ||||||||||||||||||||||||||
|
Total
|
71,739 | 12,696 | — | 58,306 | 3,384 | (0.01 | )% | 3,135,936 | 507,053 | 0.29 | % | |||||||||||||||||||||||||
|
Total interest-earning assets
|
||||||||||||||||||||||||||||||||||||
|
Pesos
|
30,412,940 | 5,388,487 | 17.72 | % | 24,550,968 | 3,520,743 | 14.34 | % | 19,315,118 | 3,527,279 | 18.26 | % | ||||||||||||||||||||||||
|
Dollars
|
4,859,219 | 135,789 | 2.79 | % | 6,166,573 | 77,307 | 1.25 | % | 6,292,766 | 87,596 | 1.39 | % | ||||||||||||||||||||||||
|
Total
|
35,272,159 | 5,524,276 | 15.66 | % | 30,717,541 | 3,598,050 | 11.71 | % | 25,607,884 | 3,614,875 | 14.12 | % | ||||||||||||||||||||||||
|
December 31,
|
||||||||||||||||||||||||||||||||||||
|
2012
|
2011
|
2010
|
||||||||||||||||||||||||||||||||||
|
Average
balance
(1)
|
Interest
earned/
paid
|
Average
nominal
rate
(2)
|
Average
balance
(1)
|
Interest
earned/
paid
|
Average
Nominal
rate
(2)
|
Average
balance
(1)
|
Interest
earned/
paid
|
Average
nominal
rate
(2)
|
||||||||||||||||||||||||||||
|
(in thousands of pesos, except percentages)
|
||||||||||||||||||||||||||||||||||||
|
Non-interest-earning assets
|
||||||||||||||||||||||||||||||||||||
|
Cash and due from banks
|
||||||||||||||||||||||||||||||||||||
|
Pesos
|
4,132,461 | — | — | 3,110,071 | — | — | 2,147,422 | — | — | |||||||||||||||||||||||||||
|
Dollars
|
613,787 | — | — | 776,237 | — | — | 618,364 | — | — | |||||||||||||||||||||||||||
|
Total
|
4,746,248 | — | — | 3,886,308 | — | — | 2,765,786 | — | — | |||||||||||||||||||||||||||
|
Investments in other companies
|
||||||||||||||||||||||||||||||||||||
|
Pesos
|
137,128 | — | — | 91,232 | — | — | 100,076 | — | — | |||||||||||||||||||||||||||
|
Dollars
|
1,209 | — | — | 1,095 | — | — | 1,037 | — | — | |||||||||||||||||||||||||||
|
Total
|
138,337 | — | — | 92,327 | — | — | 101,113 | — | — | |||||||||||||||||||||||||||
| Property and equipment and miscellaneous and intangible assets and items pending of allocation | ||||||||||||||||||||||||||||||||||||
|
Pesos
|
707,605 | — | — | 652,799 | — | — | 604,962 | — | — | |||||||||||||||||||||||||||
|
Total
|
707,605 | — | — | 652,799 | — | — | 604,962 | — | — | |||||||||||||||||||||||||||
|
Allowance for loan losses
|
||||||||||||||||||||||||||||||||||||
|
Pesos
|
(673,167 | ) | — | — | (423,818 | ) | — | — | (545,349 | ) | — | — | ||||||||||||||||||||||||
|
Dollars
|
(67,308 | ) | — | — | (52,569 | ) | — | — | (34,497 | ) | — | — | ||||||||||||||||||||||||
|
Total
|
(740,475 | ) | — | — | (476,387 | ) | — | — | (579,846 | ) | — | — | ||||||||||||||||||||||||
|
Other assets
|
||||||||||||||||||||||||||||||||||||
|
Pesos
|
810,826 | — | — | 710,741 | — | — | 604,985 | — | — | |||||||||||||||||||||||||||
|
Dollars
|
264,328 | — | — | 284,003 | — | — | 271,725 | — | — | |||||||||||||||||||||||||||
|
Total
|
1,075,154 | — | — | 994,744 | — | — | 876,710 | — | — | |||||||||||||||||||||||||||
|
Non-interest-earning assets from continued operations
|
||||||||||||||||||||||||||||||||||||
|
Pesos
|
5,114,853 | — | — | 4,141,025 | — | — | 2,912,096 | — | — | |||||||||||||||||||||||||||
|
Dollars
|
812,016 | — | — | 1,008,766 | — | — | 856,629 | — | — | |||||||||||||||||||||||||||
|
Total
|
5,926,869 | — | — | 5,149,791 | — | — | 3,768,725 | — | — | |||||||||||||||||||||||||||
|
Non-interest-earning assets from discontinued operations
|
||||||||||||||||||||||||||||||||||||
|
Pesos
|
24,164 | — | — | 16,140 | — | — | 211,961 | — | — | |||||||||||||||||||||||||||
|
Dollars
|
264 | — | — | 268 | — | — | 30,333 | — | — | |||||||||||||||||||||||||||
|
Total
|
24,428 | — | — | 16,408 | — | — | 242,294 | — | — | |||||||||||||||||||||||||||
|
Total non-interest-earning assets
|
||||||||||||||||||||||||||||||||||||
|
Pesos
|
5,139,017 | — | — | 4,157,165 | — | — | 3,124,057 | — | — | |||||||||||||||||||||||||||
|
Dollars
|
812,280 | — | — | 1,009,034 | — | — | 886,962 | — | — | |||||||||||||||||||||||||||
|
Total
|
5,951,297 | — | — | 5,166,199 | — | — | 4,011,019 | — | — | |||||||||||||||||||||||||||
|
ASSETS FROM CONTINUED OPERATIONS
|
||||||||||||||||||||||||||||||||||||
|
Pesos
|
35,458,338 | — | — | 28,641,405 | — | — | 19,832,432 | — | — | |||||||||||||||||||||||||||
|
Dollars
|
5,668,951 | — | — | 7,167,621 | — | — | 6,408,241 | — | — | |||||||||||||||||||||||||||
|
Total
|
41,127,289 | — | — | 35,809,026 | — | — | 26,240,673 | — | — | |||||||||||||||||||||||||||
|
ASSETS FROM DISCONTINUED OPERATIONS
|
||||||||||||||||||||||||||||||||||||
|
Pesos
|
93,619 | — | — | 66,728 | — | — | 2,606,743 | — | — | |||||||||||||||||||||||||||
|
Dollars
|
2,548 | — | — | 7,986 | — | — | 771,487 | — | — | |||||||||||||||||||||||||||
|
Total
|
96,167 | — | — | 74,714 | — | — | 3,378,230 | — | — | |||||||||||||||||||||||||||
|
TOTAL ASSETS
|
||||||||||||||||||||||||||||||||||||
|
Pesos
|
35,551,957 | — | — | 28,708,133 | — | — | 22,439,175 | — | — | |||||||||||||||||||||||||||
|
Dollars
|
5,671,499 | — | — | 7,175,607 | — | — | 7,179,728 | — | — | |||||||||||||||||||||||||||
|
Total
|
41,223,456 | — | — | 35,883,740 | — | — | 29,618,903 | — | — | |||||||||||||||||||||||||||
|
(1)
|
Average balances are derived from month-end balances.
|
|
(2)
|
Annualized on a 360-day basis.
|
|
(3)
|
Includes trading gains and losses in all fiscal years. Unrealized gains and losses arising from changes in the market value of our trading portfolio of Government Securities and yield on our investment portfolio of Government Securities are included.
|
|
(4)
|
Loan amounts are stated before deduction of the allowance for loan losses. Non-accrual loans are included in loans as interest-earning assets.
|
|
December 31,
|
||||||||||||||||||||||||||||||||||||
|
2012
|
2011
|
2010
|
||||||||||||||||||||||||||||||||||
|
Average
balance
(1)
|
Interest
earned/
paid
|
Average
nominal
rate
(2)
|
Average
balance
(1)
|
Interest
earned/
paid
|
Average
Nominal
rate
(2)
|
Average
balance
(1)
|
Interest
earned/
paid
|
Average
nominal
rate
(2)
|
||||||||||||||||||||||||||||
|
(in thousands of pesos, except percentages)
|
||||||||||||||||||||||||||||||||||||
|
LIABILITIES
|
||||||||||||||||||||||||||||||||||||
|
Interest-bearing liabilities
|
||||||||||||||||||||||||||||||||||||
|
Savings accounts
|
||||||||||||||||||||||||||||||||||||
|
Pesos
|
6,186,969 | 9,367 | 0.15 | % | 4,784,502 | 6,767 | 0.14 | % | 3,881,058 | 5,026 | 0.13 | % | ||||||||||||||||||||||||
|
Dollars
|
1,913,643 | 1,781 | 0.09 | % | 2,671,586 | 2,416 | 0.09 | % | 2,273,514 | 1,637 | 0.07 | % | ||||||||||||||||||||||||
|
Total
|
8,100,612 | 11,148 | 0.14 | % | 7,456,088 | 9,183 | 0.12 | % | 6,154,572 | 6,663 | 0.11 | % | ||||||||||||||||||||||||
|
Time deposits
|
||||||||||||||||||||||||||||||||||||
|
Pesos
|
11,201,224 | 1,526,358 | 13.63 | % | 9,010,574 | 1,058,109 | 11.74 | % | 6,335,859 | 611,786 | 9.66 | % | ||||||||||||||||||||||||
|
Dollars
|
1,460,417 | 3,842 | 0.26 | % | 1,918,794 | 4,666 | 0.24 | % | 1,789,633 | 8,019 | 0.45 | % | ||||||||||||||||||||||||
|
Total
|
12,661,641 | 1,530,200 | 12.09 | % | 10,929,368 | 1,062,775 | 9.72 | % | 8,125,492 | 619,805 | 7.63 | % | ||||||||||||||||||||||||
|
Borrowings from the Central Bank
|
||||||||||||||||||||||||||||||||||||
|
Pesos
|
81,135 | 2,311 | 2.85 | % | 53,083 | 558 | 1.05 | % | 31,643 | — | — | |||||||||||||||||||||||||
|
Dollars
|
1,702 | 2 | 0.13 | % | 2,526 | 18 | 0.69 | % | 2,023 | 10 | 0.47 | % | ||||||||||||||||||||||||
|
Total
|
82,837 | 2,313 | 2.79 | % | 55,609 | 576 | 1.04 | % | 33,666 | 10 | 0.03 | % | ||||||||||||||||||||||||
|
Borrowings from other financial institutions
|
||||||||||||||||||||||||||||||||||||
|
Pesos
|
11,031 | 215,348 | 1,952.12 | % | 29,736 | 38,961 | 131.02 | % | 7,428 | 72,087 | 970.47 | % | ||||||||||||||||||||||||
|
Dollars
|
501,100 | 17,881 | 3.57 | % | 265,254 | 3,259 | 1.23 | % | 56,370 | 1,385 | 2.46 | % | ||||||||||||||||||||||||
|
Total
|
512,131 | 233,229 | 45.54 | % | 294,990 | 42,220 | 14.31 | % | 63,798 | 73,472 | 115.16 | % | ||||||||||||||||||||||||
|
Corporate bonds
|
||||||||||||||||||||||||||||||||||||
|
Pesos
|
593,162 | 54,341 | 9.16 | % | 63,056 | 11,149 | 17.68 | % | — | — | — | |||||||||||||||||||||||||
|
Total
|
593,162 | 54,341 | 9.16 | % | 63,056 | 11,149 | 17.68 | % | — | — | — | |||||||||||||||||||||||||
|
Other liabilities
|
||||||||||||||||||||||||||||||||||||
|
Pesos
|
357,890 | (115,073 | ) | (32.15 | )% | 9,814 | 19,905 | 202.84 | % | 437,271 | (57,155 | ) | (13.07 | )% | ||||||||||||||||||||||
|
Dollars
|
66,303 | — | — | 108,675 | — | — | 690,246 | 13 | — | |||||||||||||||||||||||||||
|
Total
|
424,193 | (115,073 | ) | (27.13 | )% | 118,489 | 19,905 | 16.80 | % | 1,127,517 | (57,142 | ) | (5.07 | )% | ||||||||||||||||||||||
|
Interest-bearing liabilities from continued operations
|
||||||||||||||||||||||||||||||||||||
|
Pesos
|
18,431,411 | 1,692,652 | 9.18 | % | 13,950,765 | 1,135,449 | 8.14 | % | 10,693,259 | 631,744 | 5.91 | % | ||||||||||||||||||||||||
|
Dollars
|
3,943,165 | 23,506 | 0.60 | % | 4,966,835 | 10,359 | 0.21 | % | 4,811,786 | 11,064 | 0.23 | % | ||||||||||||||||||||||||
|
Total
|
22,374,576 | 1,716,158 | 7.67 | % | 18,917,600 | 1,145,808 | 6.06 | % | 15,505,045 | 642,808 | 4.15 | % | ||||||||||||||||||||||||
|
Interest-bearing liabilities from discontinued operations
|
||||||||||||||||||||||||||||||||||||
|
Pesos
|
(11,923 | ) | 5 | (0.01 | )% | (59,130 | ) | (9,602 | ) | (0.03 | )% | (27,599 | ) | 1,737 | (0.03 | )% | ||||||||||||||||||||
|
Total
|
(11,923 | ) | 5 | — | (59,130 | ) | (9,602 | ) | (0.03 | )% | (27,599 | ) | 1,737 | (0.02 | )% | |||||||||||||||||||||
|
Total interest-bearing liabilities
|
||||||||||||||||||||||||||||||||||||
|
Pesos
|
18,419,488 | 1,692,657 | 9.19 | % | 13,891,635 | 1,125,847 | 8.10 | % | 10,665,660 | 633,481 | 5.94 | % | ||||||||||||||||||||||||
|
Dollars
|
3,943,165 | 23,506 | 0.60 | % | 4,966,835 | 10,359 | 0.21 | % | 4,811,786 | 11,064 | 0.23 | % | ||||||||||||||||||||||||
|
Total
|
22,362,653 | 1,716,163 | 7.67 | % | 18,858,470 | 1,136,206 | 6.02 | % | 15,477,446 | 644,545 | 4.16 | % | ||||||||||||||||||||||||
|
December 31,
|
||||||||||||||||||||||||||||||||||||
|
2012
|
2011
|
2010
|
||||||||||||||||||||||||||||||||||
|
Average
balance
(1)
|
Interest
earned/
paid
|
Average
nominal
rate
(2)
|
Average
balance
(1)
|
Interest
earned/
paid
|
Average
Nominal
rate
(2)
|
Average
balance
(1)
|
Interest
earned/
paid
|
Average
nominal
rate
(2)
|
||||||||||||||||||||||||||||
|
(in thousands of pesos, except percentages)
|
||||||||||||||||||||||||||||||||||||
|
Non-interest-bearing liabilities and stockholders’ equity
|
||||||||||||||||||||||||||||||||||||
|
Demand deposits
|
||||||||||||||||||||||||||||||||||||
|
Pesos
|
8,660,998 | — | — | 6,820,551 | — | — | 4,427,600 | — | — | |||||||||||||||||||||||||||
|
Dollars
|
803,844 | — | — | 1,017,747 | — | — | 542,521 | — | — | |||||||||||||||||||||||||||
|
Total
|
9,463,942 | — | — | 7,838,298 | — | — | 4,970,121 | — | — | |||||||||||||||||||||||||||
|
Other liabilities
|
||||||||||||||||||||||||||||||||||||
|
Pesos
|
4,102,444 | — | — | 4,764,021 | — | — | 2,107,020 | — | — | |||||||||||||||||||||||||||
|
Dollars
|
701,226 | — | — | 869,190 | — | — | 732,132 | — | — | |||||||||||||||||||||||||||
|
Total
|
4,803,670 | — | — | 5,633,211 | — | — | 2,839,152 | — | — | |||||||||||||||||||||||||||
|
Minority interest
|
||||||||||||||||||||||||||||||||||||
|
Pesos
|
— | — | — | — | — | — | 228,449 | — | — | |||||||||||||||||||||||||||
|
Total
|
— | — | — | — | — | — | 228,449 | — | — | |||||||||||||||||||||||||||
|
Stockholders’ equity
|
||||||||||||||||||||||||||||||||||||
|
Pesos
|
4,485,101 | — | — | 3,419,917 | — | — | 2,697,906 | — | — | |||||||||||||||||||||||||||
|
Total
|
4,485,101 | — | — | 3,419,917 | — | — | 2,697,906 | — | — | |||||||||||||||||||||||||||
|
Non–interest-bearing liabilities and stockholders equity from continued operations
|
||||||||||||||||||||||||||||||||||||
|
Pesos
|
17,247,643 | — | — | 15,004,489 | — | — | 9,460,975 | — | — | |||||||||||||||||||||||||||
|
Dollars
|
1,505,070 | — | — | 1,886,937 | — | — | 1,274,653 | — | — | |||||||||||||||||||||||||||
|
Total
|
18,752,713 | — | — | 16,891,426 | — | — | 10,735,628 | — | — | |||||||||||||||||||||||||||
|
Non–interest-bearing liabilities and stockholders equity from discontinued operations
|
||||||||||||||||||||||||||||||||||||
|
Pesos
|
108,090 | — | — | 133,845 | — | — | 3,390,038 | — | — | |||||||||||||||||||||||||||
|
Dollars
|
— | — | — | — | — | — | 15,791 | — | — | |||||||||||||||||||||||||||
|
Total
|
108,090 | — | — | 133,845 | — | — | 3,405,829 | — | — | |||||||||||||||||||||||||||
|
Total non–interest-bearing liabilities and stockholders equity
|
||||||||||||||||||||||||||||||||||||
|
Pesos
|
17,355,733 | — | — | 15,138,333 | — | — | 12,851,013 | — | — | |||||||||||||||||||||||||||
|
Dollars
|
1,505,070 | — | — | 1,886,937 | — | — | 1,290,444 | — | — | |||||||||||||||||||||||||||
|
Total
|
18,860,803 | — | — | 17,025,270 | — | — | 14,141,457 | — | — | |||||||||||||||||||||||||||
|
LIABILITIES AND STOCKHOLDERS’ EQUITY FROM CONTINUED OPERATIONS
|
||||||||||||||||||||||||||||||||||||
|
Pesos
|
35,679,054 | — | — | 28,955,254 | — | — | 20,154,234 | — | — | |||||||||||||||||||||||||||
|
Dollars
|
5,448,235 | — | — | 6,853,772 | — | — | 6,086,439 | — | — | |||||||||||||||||||||||||||
|
Total
|
41,127,289 | — | — | 35,809,026 | — | — | 26,240,673 | — | — | |||||||||||||||||||||||||||
|
LIABILITIES AND STOCKHOLDERS’ EQUITY FROM DISCONTINUED OPERATIONS
|
||||||||||||||||||||||||||||||||||||
|
Pesos
|
96,167 | — | — | 74,715 | — | — | 3,362,439 | — | — | |||||||||||||||||||||||||||
|
Dollars
|
— | — | — | — | — | — | 15,791 | — | — | |||||||||||||||||||||||||||
|
Total
|
96,167 | — | — | 74,715 | — | — | 3,378,230 | — | — | |||||||||||||||||||||||||||
|
TOTAL LIABILITIES AND STOCKHOLDERS’ EQUITY
|
||||||||||||||||||||||||||||||||||||
|
Pesos
|
35,775,221 | — | — | 29,029,968 | — | — | 23,516,673 | — | — | |||||||||||||||||||||||||||
|
Dollars
|
5,448,235 | — | — | 6,853,772 | — | — | 6,102,230 | — | — | |||||||||||||||||||||||||||
|
Total
|
41,223,456 | — | — | 35,883,740 | — | — | 29,618,903 | — | — | |||||||||||||||||||||||||||
|
(1)
|
Average balances are derived from month-end balances.
|
|
(2)
|
Annualized on a 360-day basis.
|
Changes in Interest Income and Interest Expense; Volume and Rate Analysis
The following tables allocate, by currency of denomination, changes in our interest income and interest expense between changes in the average volume of interest-earning assets and interest-bearing liabilities and changes in their respective nominal interest rates for the fiscal year ended December 31, 2012 compared to the fiscal year ended December 31, 2011, for the fiscal year ended December 31, 2011 compared to the fiscal year ended December 31, 2010 and for the fiscal year ended December 31, 2010 compared to the fiscal year ended December 31, 2009. Volume and rate variances have been calculated based on movements in average balances over the period and changes in nominal interest rates on average interest-earning assets and average interest-bearing liabilities. The net change attributable to changes in both volume and rate has been allocated to volume. Trading and yield on Government trading and investment accounts results are included in the computation of interest income in all fiscal years.
|
December 2012/December 2011
Increase (Decrease) Due to
Changes in
|
December 2011/December 2010
Increase (Decrease) Due to
Changes in
|
December 2010/December 2009
Increase (Decrease) Due to
Changes in
|
||||||||||||||||||||||||||||||||||
|
Volume
|
Rate
|
Net
Change
|
Volume
|
Rate
|
Net
Change
|
Volume
|
Rate
|
Net
Change
|
||||||||||||||||||||||||||||
|
(in thousands of pesos)
|
||||||||||||||||||||||||||||||||||||
|
ASSETS
|
||||||||||||||||||||||||||||||||||||
|
Interest-earning assets
|
||||||||||||||||||||||||||||||||||||
|
Government securities
|
||||||||||||||||||||||||||||||||||||
|
Pesos
|
(23,864 | ) | 214,381 | 190,517 | 93,547 | (727,324 | ) | (633,777 | ) | 170,688 | 116,964 | 287,652 | ||||||||||||||||||||||||
|
Dollars
|
(118,989 | ) | 118,358 | (631 | ) | 185 | (20,867 | ) | (20,682 | ) | 15,323 | 447 | 15,770 | |||||||||||||||||||||||
|
Total
|
(142,853 | ) | 332,739 | 189,886 | 93,732 | (748,191 | ) | (654,459 | ) | 186,011 | 117,411 | 303,422 | ||||||||||||||||||||||||
|
Loans
|
||||||||||||||||||||||||||||||||||||
|
Private sector
|
||||||||||||||||||||||||||||||||||||
|
Pesos
|
1,196,110 | 427,587 | 1,623,697 | 919,286 | 34,848 | 954,134 | 371,775 | (259,709 | ) | 112,066 | ||||||||||||||||||||||||||
|
Dollars
|
(19,125 | ) | 81,183 | 62,058 | 30,818 | (20,969 | ) | 9,849 | 4,054 | (58,696 | ) | (54,642 | ) | |||||||||||||||||||||||
|
Total
|
1,176,985 | 508,770 | 1,685,755 | 950,104 | 13,879 | 963,983 | 375,829 | (318,405 | ) | 57,424 | ||||||||||||||||||||||||||
|
Public sector
|
||||||||||||||||||||||||||||||||||||
|
Pesos
|
— | (548 | ) | (548 | ) | 247 | 301 | 548 | — | (9,665 | ) | (9,665 | ) | |||||||||||||||||||||||
|
Total
|
— | (548 | ) | (548 | ) | 247 | 301 | 548 | — | (9,665 | ) | (9,665 | ) | |||||||||||||||||||||||
|
Deposits with the Central Bank
|
||||||||||||||||||||||||||||||||||||
|
Pesos
|
— | — | — | — | — | — | — | (7 | ) | (7 | ) | |||||||||||||||||||||||||
|
Dollars
|
— | — | — | — | — | — | — | (13 | ) | (13 | ) | |||||||||||||||||||||||||
|
Total
|
— | — | — | — | — | — | — | (20 | ) | (20 | ) | |||||||||||||||||||||||||
|
Other assets
|
||||||||||||||||||||||||||||||||||||
|
Pesos
|
47,527 | (2,761 | ) | 44,766 | 117,855 | 58,373 | 176,228 | (49,948 | ) | (64,938 | ) | (114,886 | ) | |||||||||||||||||||||||
|
Dollars
|
(758 | ) | (2,187 | ) | (2,945 | ) | (4,811 | ) | 5,355 | 544 | (3,838 | ) | 4,136 | 298 | ||||||||||||||||||||||
|
Total
|
46,769 | (4,948 | ) | 41,821 | 113,044 | 63,728 | 176,772 | (53,786 | ) | (60,802 | ) | (114,588 | ) | |||||||||||||||||||||||
|
Interest-earning assets from continued operations
|
||||||||||||||||||||||||||||||||||||
|
Pesos
|
1,219,773 | 638,659 | 1,858,432 | 1,130,935 | (633,802 | ) | 497,133 | 492,515 | (217,355 | ) | 275,160 | |||||||||||||||||||||||||
|
Dollars
|
(138,872 | ) | 197,354 | 58,482 | 26,192 | (36,481 | ) | (10,289 | ) | 15,539 | (54,126 | ) | (38,587 | ) | ||||||||||||||||||||||
|
Total
|
1,080,901 | 836,013 | 1,916,914 | 1,157,127 | (670,283 | ) | 486,844 | 508,054 | (271,481 | ) | 236,573 | |||||||||||||||||||||||||
|
Interest-earning assets from discontinued operations
|
||||||||||||||||||||||||||||||||||||
|
Pesos
|
2,771 | 6,541 | 9,312 | (207,972 | ) | (295,697 | ) | (503,669 | ) | (78,289 | ) | 99255 | 20,966 | |||||||||||||||||||||||
|
Dollars
|
113,119 | (113,119 | ) | — | (6,084 | ) | 6,084 | — | (2,059 | ) | 2059 | — | ||||||||||||||||||||||||
|
Total
|
115,890 | (106,578 | ) | 9,312 | (214,056 | ) | (289,613 | ) | (503,669 | ) | (80,348 | ) | 101314 | 20,966 | ||||||||||||||||||||||
|
Total interest-earning assets
|
||||||||||||||||||||||||||||||||||||
|
Pesos
|
1,222,544 | 645,200 | 1,867,744 | 922,963 | (929,499 | ) | (6,536 | ) | 414,226 | (118,100 | ) | 296,126 | ||||||||||||||||||||||||
|
Dollars
|
(25,753 | ) | 84,235 | 58,482 | 20,108 | (30,397 | ) | (10,289 | ) | 13,480 | (52,067 | ) | (38,587 | ) | ||||||||||||||||||||||
|
Total
|
1,196,791 | 729,435 | 1,926,226 | 943,071 | (959,896 | ) | (16,825 | ) | 427,706 | (170,167 | ) | 257,539 | ||||||||||||||||||||||||
|
December 2012/December 2011
Increase (Decrease) Due to
Changes in
|
December 2011/December 2010
Increase (Decrease) Due to
Changes in
|
December 2010/December 2009
Increase (Decrease) Due to
Changes in
|
||||||||||||||||||||||||||||||||||
|
Volume
|
Rate
|
Net
Change
|
Volume
|
Rate
|
Net
Change
|
Volume
|
Rate
|
Net
Change
|
||||||||||||||||||||||||||||
|
(in thousands of pesos)
|
||||||||||||||||||||||||||||||||||||
|
LIABILITIES
|
||||||||||||||||||||||||||||||||||||
|
Interest-bearing liabilities
|
||||||||||||||||||||||||||||||||||||
|
Savings accounts
|
||||||||||||||||||||||||||||||||||||
|
Pesos
|
2,123 | 477 | 2,600 | 1,278 | 463 | 1,741 | 670 | (4,394 | ) | (3,724 | ) | |||||||||||||||||||||||||
|
Dollars
|
(705 | ) | 70 | (635 | ) | 360 | 419 | 779 | 312 | 73 | 385 | |||||||||||||||||||||||||
|
Total
|
1,418 | 547 | 1,965 | 1,638 | 882 | 2,520 | 982 | (4,321 | ) | (3,339 | ) | |||||||||||||||||||||||||
|
Time deposits
|
||||||||||||||||||||||||||||||||||||
|
Pesos
|
298,513 | 169,736 | 468,249 | 314,091 | 132,232 | 446,323 | 65,551 | (170,367 | ) | (104,816 | ) | |||||||||||||||||||||||||
|
Dollars
|
(1,206 | ) | 382 | (824 | ) | 314 | (3,667 | ) | (3,353 | ) | (367 | ) | (23,134 | ) | (23,501 | ) | ||||||||||||||||||||
|
Total
|
297,307 | 170,118 | 467,425 | 314,405 | 128,565 | 442,970 | 65,184 | (193,501 | ) | (128,317 | ) | |||||||||||||||||||||||||
|
Borrowings from the Central Bank
|
||||||||||||||||||||||||||||||||||||
|
Pesos
|
799 | 954 | 1,753 | 225 | 333 | 558 | — | — | — | |||||||||||||||||||||||||||
|
Dollars
|
(2 | ) | (14 | ) | (16 | ) | 4 | 4 | 8 | 2 | (10 | ) | (8 | ) | ||||||||||||||||||||||
|
Total
|
797 | 940 | 1,737 | 229 | 337 | 566 | 2 | (10 | ) | (8 | ) | |||||||||||||||||||||||||
|
Borrowings from other financial institutions
|
||||||||||||||||||||||||||||||||||||
|
Pesos
|
(365,136 | ) | 541,523 | 176,387 | 29,228 | (62,354 | ) | (33,126 | ) | 63,516 | (55,645 | ) | 7,871 | |||||||||||||||||||||||
|
Dollars
|
8,416 | 6,206 | 14,622 | 2,566 | (692 | ) | 1,874 | (1,573 | ) | (3,580 | ) | (5,153 | ) | |||||||||||||||||||||||
|
Total
|
(356,720 | ) | 547,729 | 191,009 | 31,794 | (63,046 | ) | (31,252 | ) | 61,943 | (59,225 | ) | 2,718 | |||||||||||||||||||||||
|
Corporate bonds
|
||||||||||||||||||||||||||||||||||||
|
Pesos
|
48,565 | (5,373 | ) | 43,192 | 11,149 | — | 11,149 | — | — | — | ||||||||||||||||||||||||||
|
Total
|
48,565 | (5,373 | ) | 43,192 | 11,149 | — | 11,149 | — | — | — | ||||||||||||||||||||||||||
|
Other liabilities
|
||||||||||||||||||||||||||||||||||||
|
Pesos
|
(111,917 | ) | (23,062 | ) | (134,979 | ) | (867,040 | ) | 944,100 | 77,061 | 40,764 | (103,665 | ) | (62,901 | ) | |||||||||||||||||||||
|
Dollars
|
— | — | — | — | (13 | ) | (13 | ) | (8 | ) | — | (8 | ) | |||||||||||||||||||||||
|
Total
|
(111,917 | ) | (23,062 | ) | (134,979 | ) | (867,040 | ) | 944,087 | 77,048 | 40,756 | (103,665 | ) | (62,909 | ) | |||||||||||||||||||||
|
Interest-bearing liabilities from continued operations
|
||||||||||||||||||||||||||||||||||||
|
Pesos
|
(127,053 | ) | 684,255 | 557,202 | (511,069 | ) | 1,014,774 | 503,705 | 170,501 | (334,071 | ) | (163,570 | ) | |||||||||||||||||||||||
|
Dollars
|
6,503 | 6,644 | 13,147 | 3,244 | (3,949 | ) | (705 | ) | (1,634 | ) | (26,651 | ) | (28,285 | ) | ||||||||||||||||||||||
|
Total
|
(120,550 | ) | 690,899 | 570,349 | (507,825 | ) | 1,010,825 | 503,000 | 168,867 | (360,722 | ) | (191,855 | ) | |||||||||||||||||||||||
|
Interest-bearing liabilities from discontinued operations
|
||||||||||||||||||||||||||||||||||||
|
Pesos
|
20,876 | (11,269 | ) | 9,607 | (11,718 | ) | 379 | (11,339 | ) | (51,308 | ) | 7,721 | (43,587 | ) | ||||||||||||||||||||||
|
Total
|
20,876 | (11,269 | ) | 9,607 | (11,718 | ) | 379 | (11,339 | ) | (51,308 | ) | 7,721 | (43,587 | ) | ||||||||||||||||||||||
|
Total interest-bearing liabilities
|
||||||||||||||||||||||||||||||||||||
|
Pesos
|
(106,177 | ) | 672,986 | 566,809 | (522,786 | ) | 1,015,153 | 492,367 | 119,193 | (326,350 | ) | (207,157 | ) | |||||||||||||||||||||||
|
Dollars
|
6,503 | 6,644 | 13,147 | 3,244 | (3,949 | ) | (705 | ) | (1,634 | ) | (26,651 | ) | (28,285 | ) | ||||||||||||||||||||||
|
Total
|
(99,674 | ) | 679,630 | 579,956 | (519,542 | ) | 1,011,204 | 491,662 | 117,559 | (353,001 | ) | (235,442 | ) | |||||||||||||||||||||||
Interest-Earning Assets: Net Interest Margin and Spread
The following table analyzes, by currency of denomination, our levels of average interest-earning assets and net interest income, and illustrates the comparative margins and spreads for each of the fiscal years indicated.
|
December 31,
|
||||||||||||
|
2012
|
2011
|
2010
|
||||||||||
|
(in thousands of pesos, except percentages)
|
||||||||||||
|
Average interest-earning assets
|
||||||||||||
|
Pesos
|
30,412,940 | 24,550,968 | 19,315,118 | |||||||||
|
Dollars
|
4,859,219 | 6,166,573 | 6,292,766 | |||||||||
|
Total
|
35,272,159 | 30,717,541 | 25,607,884 | |||||||||
|
Net interest income
(1)
|
||||||||||||
|
Pesos
|
3,695,830 | 2,394,895 | 2,893,798 | |||||||||
|
Dollars
|
112,283 | 66,948 | 76,532 | |||||||||
|
Total
|
3,808,113 | 2,461,843 | 2,970,330 | |||||||||
|
Net interest margin
(2)
|
||||||||||||
|
Pesos
|
12.15 | % | 9.75 | % | 14.98 | % | ||||||
|
Dollars
|
2.31 | % | 1.09 | % | 1.22 | % | ||||||
|
Weighted average rate
|
10.80 | % | 8.01 | % | 11.60 | % | ||||||
|
Yield spread nominal basis
(3)
|
||||||||||||
|
Pesos
|
8.53 | % | 6.24 | % | 12.32 | % | ||||||
|
Dollars
|
2.20 | % | 1.05 | % | 1.16 | % | ||||||
|
Weighted average rate
|
7.99 | % | 5.69 | % | 9.95 | % | ||||||
|
(1)
|
Net interest income is defined as interest earned less interest paid. Trading results from our portfolio of Government Securities are included in interest.
|
|
(2)
|
Net interest margin is net interest income stated as a percentage of average interest-earning assets.
|
|
(3)
|
Yield spread nominal basis is defined as the difference between the average nominal rate on interest-earning assets and the average nominal rate on interest-bearing liabilities.
|
Investment Portfolio: Government and Private Securities
We own, manage and trade a portfolio of securities issued by the Argentine and other governments and private issuers. The following table sets out our investments in Argentine and other governments and private securities as of December 31, 2012, 2011 and 2010 by type and currency of denomination.
|
December 31,
|
||||||||||||
|
2012
|
2011
|
2010
|
||||||||||
|
(in thousands of pesos)
|
||||||||||||
|
Government securities
|
||||||||||||
|
In pesos:
|
||||||||||||
|
Holdings booked at fair value
|
||||||||||||
|
Debt consolidation bonds—Social security (BOCON)
|
— | 14,814 | 223,530 | |||||||||
|
Argentine bonds
|
1,829,927 | 2,063,719 | 3,404,169 | |||||||||
|
Other debt bonds
|
241 | 166 | 106 | |||||||||
|
Holdings booked at amortized cost
|
||||||||||||
|
Other debt bonds
|
164 | 164 | 164 | |||||||||
|
Tax credit certificates
|
— | — | 6 | |||||||||
|
Instruments issued by the Argentine Central Bank
|
||||||||||||
|
Argentine Central Bank bills (LEBAC)
|
2,201,676 | 2,352,026 | 1,650,748 | |||||||||
|
Argentine Central Bank notes (NOBAC)
|
— | 1,095,946 | 1,431,271 | |||||||||
|
Total government securities in pesos
|
4,032,008 | 5,526,835 | 6,709,994 | |||||||||
|
In foreign currency:
|
||||||||||||
|
Holdings booked at fair value
|
||||||||||||
|
Argentine bonds
|
1,911 | 9,823 | 458,483 | |||||||||
|
Other debt bonds
|
— | — | 223,479 | |||||||||
|
Holdings booked at amortized cost
|
||||||||||||
|
Other debt bonds
|
— | — | 11 | |||||||||
|
Total government securities in foreign currency
|
1,911 | 9,823 | 681,973 | |||||||||
|
Total government securities
|
4,033,919 | 5,536,658 | 7,391,967 | |||||||||
|
Investments in listed private securities
|
||||||||||||
|
Shares
|
69 | 157 | 56 | |||||||||
|
Corporate bonds—Listed
|
119 | 81 | 72,636 | |||||||||
|
Mutual funds
|
67,927 | 28,317 | 19,932 | |||||||||
|
Certificates of participation in financial trusts
|
— | — | 10,980 | |||||||||
|
Total private securities
|
68,115 | 28,555 | 103,604 | |||||||||
|
Subtotal government and private securities
|
4,102,034 | 5,565,213 | 7,495,571 | |||||||||
|
Allowances
|
(188 | ) | (184 | ) | (189 | ) | ||||||
|
Total government and private securities
|
4,101,846 | 5,565,029 | 7,495,382 | |||||||||
|
Corporate bonds—Unlisted
|
15,973 | 13,424 | 102,368 | |||||||||
The following table analyzes the remaining maturities of our investment portfolio as of December 31, 2012 in accordance with issuance terms.
|
Maturing
|
||||||||||||||||||||
|
Within 1 year
|
After 1 year
but within
5 years
|
After 5 years
but within
10 years
|
After 10 years
|
Total
|
||||||||||||||||
|
Book value
|
||||||||||||||||||||
|
(in thousands of pesos, except percentages)
|
||||||||||||||||||||
|
Government securities
|
||||||||||||||||||||
|
In Pesos:
|
||||||||||||||||||||
|
Holdings booked at fair value
|
||||||||||||||||||||
|
Argentine bonds (*)
|
148,345 | 1,325,083 | 342,159 | 14,340 | 1,829,927 | |||||||||||||||
|
Other debt bonds
|
— | 144 | 97 | — | 241 | |||||||||||||||
|
Holdings booked at amortized cost
|
||||||||||||||||||||
|
Other debt bonds
|
164 | — | — | — | 164 | |||||||||||||||
|
Instruments issued by the Argentine Central Bank
|
||||||||||||||||||||
|
Argentine Central Bank bills (LEBAC) (*)
|
2,201,676 | — | — | — | 2,201,676 | |||||||||||||||
|
Total government securities in pesos
|
2,350,185 | 1,325,227 | 342,256 | 14,340 | 4,032,008 | |||||||||||||||
|
In foreign currency:
|
||||||||||||||||||||
|
Holdings booked at fair value
|
||||||||||||||||||||
|
Argentine bonds (*)
|
— | 1,911 | — | — | 1,911 | |||||||||||||||
|
Total government securities in foreign currency
|
— | 1,911 | — | — | 1,911 | |||||||||||||||
|
Total government securities
|
2,350,185 | 1,327,138 | 342,256 | 14,340 | 4,033,919 | |||||||||||||||
|
Corporate bonds—Listed
|
119 | — | — | — | 119 | |||||||||||||||
|
Corporate bonds —Unlisted
|
12,888 | 3,085 | — | — | 15,973 | |||||||||||||||
|
Weighted average yield (for the securities indicated with *)
|
13.42 | % | 17.17 | % | 18.71 | % | 14.40 | % | ||||||||||||
Loan Portfolio
The following table analyzes our loan portfolio by types of loan at December 31, 2012, 2011 and 2010. Loans are stated before deduction of the allowance for loan losses.
|
December 31,
|
||||||||||||
|
2012
|
2011
(7)
|
2010
|
||||||||||
|
(in thousands of pesos)
|
||||||||||||
|
Principal
|
||||||||||||
|
Advances
(1)
|
5,097,179 | 2,881,496 | 2,366,957 | |||||||||
|
Notes discounted and purchased
(2)
|
4,240,993 | 3,412,091 | 2,086,979 | |||||||||
|
Secured with mortgages
|
877,775 | 736,900 | 840,841 | |||||||||
|
Consumer loans
(3)
|
11,981,439 | 8,861,911 | 5,763,202 | |||||||||
|
Financial loans
(4)
|
1,493,493 | 1,146,532 | 578,878 | |||||||||
|
Loans to governmental sector
(5)
|
35,067 | 46,027 | 1,297,642 | |||||||||
|
Other loans
|
4,921,690 | 5,829,606 | 4,010,249 | |||||||||
|
Less: Unaccrued interest and unused collections
(6)
|
(73,413 | ) | (89,332 | ) | (28,292 | ) | ||||||
|
Plus: Interest and exchange differences receivable
|
443,065 | 316,773 | 179,623 | |||||||||
|
Less: Allowance for loan losses
|
(523,857 | ) | (444,973 | ) | (396,227 | ) | ||||||
|
Total
|
28,493,431 | 22,697,031 | 16,699,852 | |||||||||
|
(1)
|
Advances include short and long-term loans to companies and overdraft lines of credit.
|
|
(2)
|
Notes discounted and purchased are endorsed promissory notes.
|
|
(3)
|
Consumer loans include credit card loans and other consumer loans. Overdrafts to individuals are included under “Advances”.
|
|
(4)
|
Financial loans are defined as loans to financial institutions.
|
|
(5)
|
Loans to governmental sector are secured by taxable rights.
|
|
(6)
|
Unaccrued interest is defined as the discount on notes and bills.
|
|
(7)
|
See Note 3.3. to our Consolidated Financial Statements.
|
Secured Loans
|
December 31,
|
||||||||||||
|
2012
|
2011
(1)
|
2010
|
||||||||||
|
(in thousands of pesos)
|
||||||||||||
|
Liquid guarantees
|
328,725 | 318,259 | 323,409 | |||||||||
|
Preferred guarantees
|
3,390,488 | 2,152,151 | 1,628,841 | |||||||||
|
Total
|
3,719,213 | 2,470,410 | 1,952,250 | |||||||||
|
(1)
|
See Note 3.3 to our Consolidated Financial Statements.
|
Credit Policy
Overview
The credit policy of the Bank aims to maintain adequate controls and consistent monitoring of credit risk. The Risks Department of BBVA Francés continues to improve its Comprehensive Risk Management Model through the incorporation or upgrading of its structures, policies and tools, aimed at facilitating optimum response times in connection with our clients’ requirements, the changes of environment and the enactment of new regulations.
The Comprehensive Risk Management Model makes it possible to comply in a satisfactory manner with the guidelines set forth by the Central Bank in its Communication “A” 5203, regarding the management of risks by financial entities.
The Coverage, NPL and risk premium ratios provide strong evidence about the quality of the credit risk portfolio, with coverages that in the past three years have remained over 240% and a NPL ratio of approximately 0.69%, both figures standing out as market leaders (source: BBVA Francés’ figures). The Bank’s risk premium calculated as the cost of arrears (bad-debt charge minus write-off collection) on the financial margin (net financial income), was the lowest in the Argentine financial system during 2012, with a ratio of 5.46% at December 31, 2012. This ratio reflects the cost of noncompliance in relation to net financial profit. This figures correspond only to the Bank.
Risk Management continued to participate as a member of the Risk Commission in the A.B.A., the Argentine Banking Association.
The Comprehensive Risk Management Model is oriented to the client, with special emphasis on not inducing over-indebtedness. It is a proactive model, oriented to provide commercial support while under permanent technological evolution and giving due priority to the observance of the relevant control, monitoring and tracking policies.
Risk is conceived in a global sense. Our Risk Department is responsible for credit risk, market risk and operational risk. Risk Management is carried out in the following areas: Retail Risks and Middle Market and Wholesale Risks (the three of them are responsible for the policies, the admission and follow-up of risk); Financial Risks and Reporting; Validation and Internal Control and Credit Recovery.
The Risks structure is organized as follows:
|
1
|
Retail Risk
|
|
1.1
|
Retail client applications
|
|
1.2
|
Central Retail Monitoring
|
|
1.3
|
Retail Policies and Tools
|
|
2
|
Companies and Wholesale Risk
|
|
2.1
|
Provincial Companies Admission
|
|
2.2
|
Metro Companies Admission
|
|
2.3
|
Corporate Admission
|
|
2.4
|
Companies and Wholesale Monitoring, Policies and Tools
|
|
3
|
Recoveries
|
|
3.1
|
Judicial Management
|
|
3.2
|
Extra-Judicial Management
|
|
3.3
|
Administration
|
|
4
|
Validation and Governance
|
|
4.1
|
Global Management and Technical Department
|
|
4.2
|
Operational Country Risk Management
|
|
4.3
|
Financial Information Governance
|
|
5
|
Financial Risks and Reporting
|
|
5.1
|
Financial Risks
|
|
5.2
|
Risks Information and Intelligence
|
The global risks information (such as data regarding credit risk, delay, arrears, risks premium, economic capital, investment distribution, etc.) is distributed on a monthly basis to the board of directors and all executive officers, for subsequent distribution to their respective areas. In addition, specific analysis is also sent to the managers on an ad hoc basis or as requested by them.
The following Committees are in place and meet with the indicated frequency:
|
-
|
Risk Management Committee
|
|
-
|
Members
: Executive Director, Risks Director, Validation and Governance Manager, Retail Risk Manager, Companies and Wholesale Risk Manager, Financial and Reporting Risk Manager, Recovery and Global Management and Technical Department Directors. Optional members may also be included for specific subjects.
|
|
-
|
Frequency
: Weekly.
|
|
-
|
Functions
: The Risk Management Committee is the collegiate body of the highest level for Risk management at BBVA Francés. This Committee defines and approves the strategy, practices and procedures and manages the functional structure of the Risks Department.
|
|
-
|
Credit Risk Committee
|
|
-
|
Members
: Executive Director, Risks Director, Validation and Governance Manager, Retail Risk Manager, Companies and Wholesale Risk Manager, Recovery and Global Management and Technical Department Directors.
|
|
-
|
Frequency
: Weekly.
|
|
-
|
Functions
: Its goals are the review of matters which exceed individual credit authorizations, and also those operations specifically delegated to it. All decisions are made by consensus of the Committee members.
|
|
-
|
Companies and Wholesale Banking Monitoring Committee
|
|
-
|
Members
: Risks Director, Companies and Wholesale Risk Manager, and those officers responsible for Admission, Risks Monitoring in Companies Banking and Monitoring, Policies and Risk Tools in Companies and Wholesale. The officers responsible and/or reports on Global Management and Risks Technical Department, Risks Information and Intelligence and Credit Recovery also participate in the Committee.
|
|
-
|
Frequency
: Fortnightly.
|
|
-
|
Functions
: To verify compliance with the general and specific action plans defined in the above Committees. To monitor the budget, ratios and the evolution of the figures.
|
|
-
|
Retail Banking Monitoring Committee
|
|
-
|
Members
: Risks Director, Retail Risks Manager, Recoveries Manager, officer responsible for Central Retail Monitoring, Network Coordinator, Global Management Director and Technical Department and Risk of I&I.
|
|
-
|
Frequency
: Weekly.
|
|
-
|
Functions
: To lay out policies and strategies for improving the portfolio’s risk quality and anticipate possible future scenarios. To set forth portfolio quality goals and monitor them.
|
|
-
|
Recoveries Committee
|
|
-
|
Members
: Risks Director, Repairs Manager, Judicial Matters Director, Extrajudicial Matters Director, Administration Director, Global Management Director and Technical Department.
|
|
-
|
Frequency
: Weekly.
|
|
-
|
Functions
: Its aim is to take decisions and make qualifications for all types of recovery. Laying out policies and strategies to optimize credit portfolio recovery.
|
Risk Management in 2012
Retail Risks
It undertakes the management of individuals and micro-enterprises banking. Its structure includes the admission by means of predictive/statistic tools of special cases and the follow-up and management of tools and policies.
With this configuration, we continued with the intensive development of methods and tools to multiply the management of risks by automated means. These methods and tools have involved a qualitative change in the proactive offer of risks, a situation of the utmost relevance for the Bank.
At present, a methodology per risk groups is been used, which permits a more personalized offer in admission and an improved management capacity for re-collection in non-performing cases. Regional differentiation has also been incorporated to this methodology.
In addition, during 2012, we have re-estimated the total of reactive and proactive scorings.
In the micro-enterprises segment, an intensive campaign was staged for qualifying clients by pre-approval methods, improving the offer and making it more flexible to the client.
As for risk follow-up and monitoring, some innovations were made in the management of clients, including fast-track mechanisms which identify those clients whose profile can be singled out in advance as highly prone to incur in arrears and are therefore subject to a differentiated monitoring policy.
Companies and Wholesale Risks
This area provides service to the commercial requirements of companies and corporate banking. It is structured according to business needs and subject to permanent adequacy to commercial changes, specific requirements or the environment.
In 2012 we intensified the process for regionalizing companies’ risks-related in order to bring risks decisions closer to the client. All of this was favored by procedures in place for a virtual documentation management scheme.
We also continued to optimize our attention to the clients of Corporate & Investment Banking circuits by merging commercial and risk management teams. That merge resulted in greater capacity of analysis, synergies and a reduction in waiting times for the clients.
In 2012 we were also successful in responding to demands originated in the line of loans for investment projects, whose volume exceeded Ps.1,180 billion.
The Bank also incorporated pre-approved campaigns and work teams in cooperation with the commercial areas.
The Follow-up, Policies and Tools unit was also improved based on a risk-adjusted profitability criterion, the “Profitability File by Client and by Segment” tool, which allows evaluating profitability/reciprocity at the time of considering credit lines.
Also, in compliance with Central Bank regulations, we are implementing a rating model monitoring tool which includes the re-estimation and re-calibration of its factors.
Recoveries
During 2012, we created the Strategies and Policies team, whose functions consist of analyzing the management of the different collection agents, the context and metrics, and developing collection campaigns or actions resulting in a reduction of severity, an improved management of the processes and the creation of a solid technological base.
Along the year, a number of special collection campaigns were devised and implemented, among which we must mention portfolio segmentation and the preparation of a more varied scheme of options for the cancellation/negotiation of debts.
We have also improved the handling of our portfolio and our management circuits by incorporating a model for a systematic study of each portfolio’s attributes and the optimization of the whole process. We continued to improve the computer platform by incorporating the Engage application with its modules for the treatment and management of judicial and extrajudicial cases.
Validation and Governance
The Risks Direction, in accordance with international standards and Central Bank regulations, operates the Validation and Governance area whose task is to ensure an updated, homogenous and appropriate control environment in all units of the Group in Argentina.
This area has, in turn, another unit in charge of the Risks Global Management, which is oriented, in accordance with the principles of the Basel II, towards the performance of expected loss and economic capital calculations. It also conducts control procedures on the granting of credits, graduation and fractioning of the risk, maximum assistance, provisioning, determining of risk market share by segment of economic activity and per type of financing.
The Riks Direction of the Bank exercised budgetary control on the direction, based on the assumptions contained in the Bank’s budget, their comparison with actual monthly values and their impact on the cost of arrears (bad-debt charge minus write-off collection). This management activity is essential to ensure the compliance with quality standards regarding credit risk, mandatory target and ultimate goal of all the risks-related units of BBVA Francés.
The Validation and Governance area also performs the tasks of a technical risk department, which involve the management of the Risks Committees, the analysis of standards and the revision and coordination of audits. All measurement, monitoring, validation and control activities are presented and analyzed at the Risks Committees which, depending on the subject matters, submit them to the board of directors and the Management Committee. This procedure closes the loop of information on the Management and information of the risks-related activity.
For the management of Operational Risk we have two units, Operational Risk Management and Internal Control of Financial Information, responsible for the Internal Control Model (“ICM”) and the Sarbanes-Oxley (“SOX”) certification, respectively.
The ICM identifies all of the Bank’s operating processes and the operational risks they are exposed to. By applying a methodology based on probable occurrence and economic impact, it evaluates each of these risks and establishes a base parameter or objective value for the desired operational risk. Through control procedures, the degree of adequacy to such objective values is measured on an annual basis.
In 2012, out of a total of 3,344 risks identified by the Bank, only 4% were under the desired mitigation threshold, which implies a remarkable operational strength. Notwithstanding this fact, work has begun on action plans to improve the mitigation level even more.
With ICM support, a reduction is applied on those processes that are critical for the preparation of our financial statements or for the financial reporting activity. These processes are separately, evaluated both based on the same criteria but with a different focus and more stringent requirements regarding the mitigation threshold. Also here we maintain a high quality standard with less than 3% of weakness found on a total of 255 analyzed risks. This explains why the Bank, for the seventh year in a row, presents a SOX certification without any remarkable flaws, a proof of strength on which the whole accounting information system is based.
Based on the above we may conclude that the Bank has in place a robust Comprehensive Risk Management Model, in compliance with international standards, modern and capable of adapting itself to internal environments or requirements.
The information above represents a fair summary of the characteristics of the Risks Direction of BBVA Francés..
Financial Risks and Reporting
The Structural Risks Unit is the unit that controls the management of financial risks (market and structural risks) and develops of stress scenarios.
The Structural Risks Unit takes charge of the identification, monitoring, control and measurement of liquidity and structural risks. Its methodology and tools are consistent with the best international practice such as the application of the Basel liquidity regulation, by complying with the two short- and long term liquidity ratios (the liquidity coverage ratio (“LCR”) and the structural funding ratio (“NSFR”)), as well as with the local regulations (i.e. Communication “A” 5203 of the Central Bank).
The Market Risks area identifies, measures, monitors, mitigates and controls the market and credit risks incurred by the Treasury (trading activity) of BBVA Francés. It is also responsible for capturing, validating and spreading among the different applications those market variables which act as valuation input for all financial instruments, either from our own or the clients’ portfolio.
During this fiscal year 2012, we intensified the development of scenarios involving the performance of comprehensive stress tests (credit, interest and market risks) and the action plans for each scenario so developed.
For the monitoring of all of the Direction’s activity we rely on the Risks Intelligence and Information Unit, in charge of all the reporting activities. This unit provides information, for purposes of monitoring and decision-making, to the Risk Areas, Retail Banking, Middle Market, Corporate & Investment Banking and to the Directors of the Bank.
Among the information at this unit, it is worth highlighting the reports on risk evolution, the special reports per product, the analyses of the behavior of temporary series for the monitoring units, NPL per client and product and sectorial analyses, among others.
Loans by Economic Activity
The table below analyzes our loan portfolio according to the borrowers’ main economic activity as of December 31, 2012, 2011 and 2010. Where appropriate, personal loans are allocated to the economic activity of the borrower. Loans are stated before deduction of the allowance for loan losses.
|
December 31,
|
||||||||||||||||||||||||
|
2012
|
2011
(1)
|
2010
|
||||||||||||||||||||||
|
Loan
Portfolio
|
% of Loan
Portfolio
|
Loan
Portfolio
|
% of Loan
Portfolio
|
Loan
Portfolio
|
% of Loan
Portfolio
|
|||||||||||||||||||
|
(in thousands of pesos, except percentages)
|
||||||||||||||||||||||||
|
Agricultural and livestock
|
1,591,185 | 5.48 | % | 986,984 | 4.26 | % | 474,384 | 2.77 | % | |||||||||||||||
|
Beverage
|
453,931 | 1.56 | % | 240,024 | 1.04 | % | 382,504 | 2.24 | % | |||||||||||||||
|
Chemicals
|
1,804,376 | 6.22 | % | 1,076,272 | 4.65 | % | — | — | ||||||||||||||||
|
Construction
|
186,295 | 0.64 | % | 171,680 | 0.74 | % | 137,591 | 0.80 | % | |||||||||||||||
|
Consumer
|
11,628,175 | 40.07 | % | 9,655,152 | 41.72 | % | 6,816,984 | 39.87 | % | |||||||||||||||
|
Electricity, oil, water and sanitary services
|
278,560 | 0.96 | % | 190,275 | 0.82 | % | 161,948 | 0.95 | % | |||||||||||||||
|
Financial sector
|
1,493,493 | 5.15 | % | 1,146,532 | 4.95 | % | 772,161 | 4.52 | % | |||||||||||||||
|
Foodstuff
|
1,263,087 | 4.35 | % | 732,311 | 3.16 | % | 395,994 | 2.32 | % | |||||||||||||||
|
Government services
|
35,067 | 0.12 | % | 46,027 | 0.20 | % | 1,297,642 | 7.59 | % | |||||||||||||||
|
Industrial metals
|
697,031 | 2.40 | % | 504,499 | 2.18 | % | 477,156 | 2.79 | % | |||||||||||||||
|
Leather and fur product
|
16,315 | 0.06 | % | 15,128 | 0.07 | % | 15,077 | 0.09 | % | |||||||||||||||
|
Mining products
|
922,630 | 3.18 | % | 640,413 | 2.77 | % | 396,875 | 2.32 | % | |||||||||||||||
|
Oil and carbon
|
288,784 | 1.00 | % | 207,747 | 0.90 | % | 107,730 | 0.63 | % | |||||||||||||||
|
Others
|
4,726,115 | 16.29 | % | 4,929,300 | 21.30 | % | 3,765,356 | 22.02 | % | |||||||||||||||
|
Other manufacturing
|
272,287 | 0.94 | % | 109,469 | 0.47 | % | 61,110 | 0.36 | % | |||||||||||||||
|
Paper products
|
— | — | — | — | 22,869 | 0.13 | % | |||||||||||||||||
|
Printers, Publishers and Related Industries
|
36,612 | 0.13 | % | — | — | — | — | |||||||||||||||||
|
Rubber products
|
279,394 | 0.96 | % | 117,929 | 0.51 | % | 80,849 | 0.47 | % | |||||||||||||||
|
Retail trade
|
988,538 | 3.41 | % | 942,691 | 4.07 | % | 722,860 | 4.23 | % | |||||||||||||||
|
Services
|
85,421 | 0.29 | % | 230,226 | 0.99 | % | 210,516 | 1.23 | % | |||||||||||||||
|
Shoes, apparel and other textile products
|
161,859 | 0.56 | % | 70,015 | 0.30 | % | 49,186 | 0.29 | % | |||||||||||||||
|
Textile
|
120,637 | 0.42 | % | 101,578 | 0.44 | % | 80,367 | 0.47 | % | |||||||||||||||
|
Tobacco
|
10,885 | 0.04 | % | 17,097 | 0.07 | % | 6,656 | 0.04 | % | |||||||||||||||
|
Transportation material
|
365,210 | 1.26 | % | 253,560 | 1.10 | % | 107,213 | 0.63 | % | |||||||||||||||
|
Wholesale trade
|
1,275,964 | 4.40 | % | 727,847 | 3.15 | % | 528,076 | 3.09 | % | |||||||||||||||
|
Wood products and cork
|
35,437 | 0.11 | % | 29,248 | 0.13 | % | 24,975 | 0.15 | % | |||||||||||||||
|
Total
|
29,017,288 | 100.00 | % | 23,142,004 | 100.00 | % | 17,096,079 | 100.00 | % | |||||||||||||||
|
(1)
|
See Note 3.3. to our Consolidated Financial Statements.
|
Maturity Composition of the Loan Portfolio
The following table analyzes our loan portfolio as of December 31, 2012 by type and by the time remaining to maturity. Loans are stated before deduction of the allowance for loan losses. We expect most loans to be repaid at maturity in cash or through refinancing at market terms.
|
Maturing
|
||||||||||||||||||||
|
Amount at
December 31,
2012
|
Within
3 months
|
After 3
months but
within 1 year
|
After 1 year
but within
5 years
|
After 5 years
|
||||||||||||||||
|
(in thousands of pesos, except percentages)
|
||||||||||||||||||||
|
To the non-financial public sector
|
35,067 | 457 | — | 34,610 | — | |||||||||||||||
|
To the financial sector
|
1,493,493 | 534,818 | 529,537 | 429,138 | ||||||||||||||||
|
To the non-financial private sector and residents abroad
|
27,488,728 | 12,073,382 | 7,917,662 | 7,287,217 | 210,467 | |||||||||||||||
|
Overdrafts
|
5,225,314 | 2,467,448 | 2,702,387 | 55,479 | — | |||||||||||||||
|
With privileged guarantees
|
3,406,536 | 388,624 | 987,923 | 1,831,171 | 198,818 | |||||||||||||||
|
Credit cards
|
4,746,312 | 4,746,312 | — | — | — | |||||||||||||||
|
Other
|
14,110,566 | 4,470,998 | 4,227,352 | 5,400,567 | 11,649 | |||||||||||||||
|
Total
|
29,017,288 | 12,608,657 | 8,447,199 | 7,750,965 | 210,467 | |||||||||||||||
|
Percentage of total loan portfolio
|
100.00 | % | 43.45 | % | 29.11 | % | 26.71 | % | 0.73 | % | ||||||||||
Foreign Country Outstanding Positions
The following table sets forth, as of December 31, 2012, 2011 and 2010, the aggregate amount of our “cross-border outstandings” exceeding 1% of total assets at each date. Cross-border outstandings are defined as loans (including accrued interest), acceptances, interest-bearing deposits with other banks, other interest-bearing investments and any other monetary assets which are denominated in dollars or other non-local currency. Our cross-border outstandings are denominated exclusively in dollars, converted into pesos in the chart below.
|
December 31,
|
||||||||||||
|
2012
|
2011
|
2010
|
||||||||||
|
(in thousands of pesos)
|
||||||||||||
|
Cross-border outstandings to Spanish borrowers
|
— | — | 193,283 | |||||||||
|
Total
|
— | — | 193,283 | |||||||||
Interest Rate Sensitivity of Outstanding Loans as of December 31, 2012
The following table analyzes, by currency of denomination, the interest rate sensitivity of our loan portfolio as of December 31, 2012. Loans are stated before deduction of the allowance for loan losses.
|
|
December 31, 2012
|
|||
|
|
(in thousands of pesos)
|
|||
|
Variable Rate
|
||||
|
Pesos — including adjustable loans
|
253,912 | |||
|
Foreign currency
|
— | |||
| 253,912 | ||||
|
Fixed Rate
|
||||
|
Pesos
|
26,068,632 | |||
|
Foreign currency
|
2,506,841 | |||
| 28,575,473 | ||||
|
Non-performing
(1)
|
||||
|
Pesos
|
184,509 | |||
|
Foreign currency
|
3,394 | |||
| 187,903 | ||||
|
Total
|
29,017,288 | |||
|
(1)
|
For additional information on non-performing loans see
“Item 4. Information on the Company—Selected Statistical Information—Non-performing and Restructured Loans
” below.
|
The following table sets forth a breakdown of our fixed and variable rate loans which have a maturity of one year or more at December 31, 2012.
|
Interest Sensitivity of
Outstanding Loans Maturing
in More Than One Year
|
||||||||
|
Fixed Rate
|
Variable Rate
|
|||||||
|
(in thousands of pesos)
|
||||||||
|
To the non-financial public sector
|
34,610 | — | ||||||
|
To the financial sector
|
429,138 | — | ||||||
|
To the non-financial private sector and residents abroad
|
7,495,508 | 2,176 | ||||||
|
Total
|
7,959,256 | 2,176 | ||||||
Allowance for Loan Losses and Loan Loss Experience
BBVA Francés classifies its borrowers in accordance with the regulations of the Central Bank, its primary bank regulator, and not in the manner established by the Securities and Exchange Commission (“SEC”). As a result, BBVA Francés does not keep records classifying loans as “non-accrual”, “past due”, “restructured” and “potential problem loans”, as those terms are defined by the SEC.
Classification System According to Central Bank Regulations
The Central Bank established requirements with respect to the classification of borrowers and the provisions for loan losses. The following is a summary of the Central Bank’s loan classification requirements up to the date of this annual report.
The loan classification system is a bifurcated system, which requires the application of one set of criteria to classify loans in a bank’s “consumer” portfolio, and another set of criteria to classify loans in a bank’s “commercial” portfolio.
The principal criterion applied to loans in the consumer portfolio is delinquency aging, legal situation and refinancing compliance, irrespective of the fact that, prior to the granting of financing, debtors’ payment capacity should be analyzed, evaluating:
|
§
|
The allocation of their periodic income in relation to the totality of credit commitments assumed; or
|
|
§
|
Through the use of the credit scoring and screening methods.
|
The principal criterion applied to loans in the commercial portfolio is the borrower’s ability to pay, as measured by such borrower’s future cash flow. We can opt to apply the consumer loan classification criteria to commercial loans of up to Ps. 1,500,000 (Ps.750,000 until May 2012 and Ps.500,000 until September 2009).
Under the regulations, consumer borrowers are classified as follows:
|
1.
|
“Normal” if all payments on its loans are current or less than 31 days overdue and, in checking account overdrafts, less than 61 days overdue;
|
|
2.
|
“Low Risk” if payments with respect to principal, interest or otherwise, on any of its loans, are overdue for more than 31 and up to 90 days;
|
|
3.
|
“Medium Risk” if payments on any of its loans are overdue for more than 90 and up to 180 days;
|
|
4.
|
“High Risk” if payments on any of its loans are overdue for more than 180 days and up to one year or if it is subject to judicial proceedings for default on any of those loans;
|
|
5.
|
“Irrecoverable” if payments on any of its loans are overdue for more than one year, if the borrower is in bankruptcy or liquidation proceedings or if it is insolvent; and
|
|
6.
|
“Irrecoverable for Technical Decision” if such borrower is:
|
|
(a)
|
In arrears for more than 180 days according to a list provided by the Central Bank, which includes:
|
|
§
|
Financial institutions liquidated by the Central Bank,
|
|
§
|
Entities created as a result of the privatization of public financial institutions and in the process of dissolution,
|
|
§
|
Financial institutions whose licenses have been revoked by the Central Bank and are under judicial liquidation or bankruptcy, and
|
|
§
|
Any trust in which Seguro de Depósitos S.A. (“SEDESA”) is the beneficiary.
|
|
(b)
|
A foreign borrower (including banks or other financial institutions) which is not classified as “investment grade” by any of the rating agencies admitted by the Central Bank pursuant to the Evaluation of Financial Entities standards, except for the following:
|
|
§
|
Foreign banks or other financial institutions controlling or controlled by the financial entity under the consolidated or other supervision systems approved by the Central Bank;
|
|
§
|
Financing that is:
|
|
o
|
Secured by foreign banks and classified as “Investment Grade” by any of the international rating agencies admitted by the Central Bank;
|
|
o
|
Related to the buying or selling of securities through custodian banks admitted by the Central Bank (Caja de Valores, Clearstream, Euroclear or The Depository Trust Company), arising from the usual business practices in the market in which they are made;
|
|
o
|
Related to foreign trade transactions;
|
|
o
|
Entailing swaps of dollars and domestic government bonds at market price, with sufficient margins, involving custodians admitted by the Central Bank;
|
|
o
|
Foreign banks or financial institutions subject to the consolidated supervision system which controls local financial institutions organized as corporations (sociedades anónimas);
|
|
o
|
Other foreign banks authorized to take part in reciprocal payment and credit regimes to which the Central Bank is a party, to the extent the controlling financial entity is subject to a consolidated supervision system;
|
|
§
|
Assistance provided through foreign subsidiaries or branches of local financial institutions under the consolidated supervision system, to the extent the financial assistance is not funded directly or indirectly by local financial institutions; and
|
|
§
|
Clients from the non-financial private sector whose debt (all items included) plus the requested financing amount at the time of granting exceeds the lesser of 2.5% of the RPC (Responsabilidad Patrimonial Computable or “RPC”) on the last day of the preceding month or the equivalent of Ps.2,000,000, and who have not submitted a sworn statement as to whether they are or are not linked to the respective financial broker or whether their relationship with the latter implies the existence of a controlling influence, or who have not updated their previous presentation, except for those debtors under bankruptcy proceedings or requested extrajudicial composition proceedings or under judicial administration who, during a period of up to 540 days after the filing of the bankruptcy proceedings or the request of extrajudicial composition proceedings or the start of judicial collection proceedings, as the case may be, shall have not submitted the documentation that would allow the transaction, provided that a lawyer’s report from the financial creditor entity shall have been issued regarding the reasonability of recovering the relevant credits.
|
Irrespective of the fact that the analyses that preceded the granting of financing should also take into account debtors’ payment capacity by evaluating the allocation of their periodical income in relation to the totality of credit commitments assumed, the classification of these clients shall be made (at the end of each month) exclusively considering objective patterns related to the degree of compliance of their obligations as they become due or their legal situation, as well as the information deriving from the “Financial System Debtors Department” provided they reflect quality levels lower than those assigned by the entity.
Payment capacity evaluation based on the borrower’s income will not be mandatory, as long as specific evaluation methods are used or the borrowers’ loans are for minimal amounts in terms of point 1.1.3.3, Section 1 of the “Credit Management” rules.
The specific evaluation methods mentioned above are those known as “Credit Scoring and Screening”.
The limits to take into account for applying these methods are as follows:
|
i)
|
Eligible borrowers:
|
Natural persons not related to the financial entity.
|
ii)
|
Individual limit:
|
The capital owed may not at any time exceed the following limits, per class of credit and per client:
Until June 2012:
|
§
|
Dwelling mortgage loans: Ps.200,000
|
|
§
|
Chattel mortgage car loans: Ps.75,000
|
|
§
|
Personal loans and financing by credit card: Ps.15,000
|
From June 2012:
|
§
|
Dwelling mortgage loans: Ps.300,000
|
|
§
|
Chattel mortgage car loans: Ps.100,000
|
|
§
|
Personal loans, financing by credit card and overdraft in checking accounts (altogether): Ps.25,000
|
On December 26, 2008, by Communication “A” 4891, Point 7.4 of the Debtors Classification Regulation was incorporated. It contemplates controlling the totality of our entity’s non-performing consumer portfolio (Categories 3, 4 and 5) in respect of the financial system. If the result from the formula below is greater than 5% on the last day of a calendar quarter or greater than 10% in a year, the financial institution must inform the origin of such circumstance to the Superintendency of Financial Institutions and Exchanges, providing such explanations as may be requested and, if applicable, the amendments to be introduced in its credit policy so as to improve the quality of its credit portfolio.
FICCT - FICCT-1 - Máx (FICCST - FICCST-1 ; 0)
Where:
FICC: a quotient, expressed as a percentage between the totality of financings corresponding to the consumer or household portfolio of the financial institution, classified as Category 3 through 5 according to the “Debtors Classification Regulations” and the total amount of their financings for the consumption or household portfolio.
FICCS: a quotient, expressed as a percentage between the total amount of financings of the consumer or household portfolio corresponding to the whole financial system, classified as Category 3 through 5, according to the “Debtors Classification Regulations”, and the total amount of their financings for the consumption or household portfolio, according to such information as may be published by the BCRA.
T: the last day of a calendar quarter for which the calculation of the quotient is applicable.
T-1: the last day of the immediately preceding calendar quarter and the last day of the same quarter corresponding to the prior year, as the case may be.
On November 26, 2007, by Communication “A” 4738, two significant points were incorporated into, or modified in, the Borrower Rating Standard and Minimum Bad Debt Risk Provisions:
|
1)
|
The treatment for refinancing in the Consumption Portfolio, depending on the refinanced borrower’s compliance record, according to the following criteria:
|
Criterion for an improving situation
In a normal situation, up to two refinancings are allowed for the last twelve months with arrears of less than 31 days. Counting starts as of the date of the last refinancing. For all other situations, the basic criterion is that the greatest penalty must be applied to the borrower who delays the refinancing, for which reason:
|
§
|
Once the Refinancing Agreement has been signed, the previous framework applies, unless the borrower partially amortizes his debt in advance.
|
|
§
|
The borrower must accumulate a greater number of down payments (as shown in table (i) below) or increase his percentage of cancellation (as shown in table (ii) below) in order to improve his situation. The BCRA regulations provide that those clients whose debts have been refinanced via obligations subject to regular payments (monthly or bi-monthly) may be reclassified at the immediately upper level if they have complied punctually (or with delays not exceeding 31 days) with the payment of the established installments (in the case of single, regular above bi-monthly or irregular payments) or who have cancelled at least a certain specified percentage of their refinanced principal obligations, plus the number of installments or the accumulated percentage which may be applicable, respectively, if the refinancing was granted to a debtor included in lower levels.
|
|
(i)
|
To improve a borrower’s situation through the payment of installments, the following table applies
(*)
:
|
|
Quantity of paymentes
|
||||||||
|
Change of category
|
from
Irrecoverable
|
from
High Risk
|
from
Medium Risk
|
from
Low Risk
|
||||
|
Change to High Risk
|
3 | — | — | — | ||||
|
Change to Medium Risk
|
6 | 3 | — | — | ||||
|
Change to Low Risk
|
8 | 5 | 2 | — | ||||
|
Change to Normal
|
9 | 6 | 3 | 1 | ||||
|
(*)
|
The refinancing requires a punctual payment or with delays of not more than 31 days according to the German or French Amortization System. Regularity may be monthly or bimonthly.
|
|
(ii)
|
To improve a borrower’s situation through the Percentage of Capital Cancellation, the following table applies (also applicable to Commercial Portfolio)
(**)
:
|
Until December 31, 2009:
|
Percentage of cancellation
|
||||||||
|
Change of category
|
from
Irrecoverable
|
from
High Risk
|
from
Medium Risk
|
from
Low Risk
|
||||
|
Change to High Risk
|
20%
|
—
|
—
|
—
|
||||
|
Change to Medium Risk
|
35%
|
15%
|
—
|
—
|
||||
|
Change to Low Risk
|
45%
|
25%
|
10%
|
—
|
||||
|
Change to Normal
|
55%
|
35%
|
20%
|
10%
|
||||
|
(**)
|
For amortization systems with periods greater than bimonthly or irregular.
|
From January 1, 2010:
|
Percentage of cancellation
|
||||||||
|
Change of category
|
from
Irrecoverable
|
from
High Risk
|
from
Medium Risk
|
from
Low Risk
|
||||
|
Change to High Risk
|
15%
|
—
|
—
|
—
|
||||
|
Change to Medium Risk
|
25%
|
10%
|
—
|
—
|
||||
|
Change to Low Risk
|
30%
|
15%
|
5%
|
—
|
||||
|
Change to Normal
|
35%
|
20%
|
10%
|
5%
|
||||
|
(**)
|
For amortization systems with periods greater than bimonthly or irregular.
|
Collections are not applied and rebates may not be counted in order to improve the situation (they belong to the debt preceding the signing of the Refinancing Agreement), so no quantification was made. Such treatment is consistent with U.S. GAAP.
Up-front payments may be computed as per their equivalent in installments or amortization percentage in order to improve borrower’s situation.
The choice must be for a single parameter depending on the refinancing mode:
|
§
|
Refinancings with regular monthly or bimonthly payments: by the timely payment of installments. This is the criterion adopted by BBVA Francés.
|
|
§
|
All other forms: by capital amortization.
|
Criterion for deteriorating the situation by noncompliance with the refinancing and for improving it once again at a later stage.
Arrears are considered to exist in refinancing if a delay exceeding 31 days occurs.
The criteria determining the situation of a refinanced client are as follows:
|
1.
|
Tranches of arrears are allocated in any applicable situation according to the table below:
|
|
Situation
|
Minimum delay time
(in days)
|
|
|
Normal
|
0
|
|
|
Low Risk
|
32
|
|
|
Medium Risk
|
91
|
|
|
High Risk
|
181
|
|
|
Irrecoverable
|
More than 1 year
|
|
2.
|
To the above must be added the refinancing arrears, and according to this the situation in which the refinanced client must be placed is determined:
|
|
2)
|
Procedure for constituting provisions above the minimum ones established by the regulations for a portfolio in normal situation.
|
The main criterion is based on the provisions of point 7.1, third paragraph of the Borrower Rating Standard and Minimum Bad Debt Provisions. More stringent criteria may be adopted on the basis of the objective guidelines mentioned in the first paragraph of the same point, provided this constitutes a generally applied policy which must be duly detailed in the “Rating and Provision Procedures Manual”, without this affecting the rating that must be allocated to eligible borrowers as provided hereunder, and provided this is duly grounded on objective criteria based on behavioral studies that give support to the higher provisions (be it for the active portfolio as a whole or by type of financing).
In accordance with the regulations in force, we apply provision percentages above the established minimum, under allowances policy that were approved by Risk Management Committee on March 19, 2012.
The reference framework of the policy in force for the management of provisions by BBVA Francés sets forth two control levels:
|
§
|
Regulatory and technical control
|
Two basic references when it comes to the management of provisions are, on the one hand, compliance with the regulatory requirements on minimum capitals and non-performance provisions; and, on the other hand, the Bank’s capital ratio. BBVA Francés will at all times comply with the regulatory requirements on minimum capital and non-performance provisions. Therefore, both values per se determine a lower limit for the management of provisions. Likewise, a second lower limit is established for the management of provisions, and that is the capital ratio. In this connection, it is established that any disablement of provisions may only take place if the capital ratio is 10.5% or higher, defined as the Computable Equity Liability (“CEL”) divided by the Risk-Weighted Assets (“RWA”).
|
§
|
Behavioral control of portfolio indicators.
|
In order to guarantee for the Bank an appropriate level of provisions, the behavior of the Bank’s main credit portfolio indicators will be monitored on a regular basis.
At least the following portfolio behavior indicators will be analyzed:
|
o
|
NLP ratio behavior
|
|
o
|
Cycle-adjusted expected loss behavior
|
|
o
|
Expected loss behavior without cycle adjustment
|
|
o
|
Coverage performance
|
Absolute variations (increases and decreases) for these indicators and their tendencies will be analyzed, considering the last 12 months prior to the lowest month under analysis.
This procedure also requires authorization by the same member officers who are responsible for approving the “Significant Financings” (those exceeding 2.5% of the entity’s RPC), for which reason it was discussed and confirmed by our Technical Committee of Operations (currently the Risk Management Committee) and validated by our board of directors.
Commercial borrowers are classified as follows:
1.
“Normal” if there is no doubt that the borrower can meet all of its financial obligations.
2.(a) “Special Tracking-Under Observation” if the borrower is able to meet all of its financial obligations but is sensitive to changes that could compromise such ability absent timely corrective measures.
2.(b) “Special Tracking-Under Negotiation or with Refinancing Agreements” if the borrower is unable to comply with its obligations as agreed and formally states, at least 60 days before the date on which the payment of its obligations is due, its intention to refinance such debts.
The borrower must enter into an agreement with the lender within 90 days (if up to two lenders are involved) or 180 days (if more than two lenders are involved) after the date on which the obligations become overdue. If no agreement has been reached within the established deadline, the borrower must be reclassified to the next category below according to the indicators established for each level.
3. “Problem” if the borrower has problems in meeting its ordinary financial obligations.
4. “High Risk of Insolvency” if the borrower is highly unlikely to meet its financial obligations.
5. “Irrecoverable” if it is clear, at the time of the classification, that the borrower will not meet its financial obligations to the classifying bank.
6. “Irrecoverable for Technical Decision” if such borrower meets the same criteria as described above for consumer borrowers.
In classifying a commercial borrower, banks must take into account other factors depending upon the classification category, such as the quality of the borrower’s management, the borrower’s operating history, its present and projected financial situation, the adequacy of its financial reporting, the general risks associated with the market in which the borrower operates, the borrower’s relative position within such market, its payment history and ability to service debt.
In the case of legal proceedings, whether these proceedings are initiated by us or at the instance of the borrower, commercial borrowers must be classified according to pre-determined circumstances, independently from the classification under which they would fall.
Under this classification system, all loans to a given borrower are grouped under the highest classification assigned to that borrower by the classifying bank. The classification of a given borrower must not differ by more than one higher category from a lower classification given to that borrower by at least two other banks whose aggregate loans outstanding to that borrower represent 40% or more of the total loans outstanding to that borrower in the Argentine financial system at the time of the classification.
Under the Central Bank regulation, banks must establish the following loan loss provisions based on the amount owed on the loan (including accrued but unpaid interest). As the table suggests, the presence of preferred guarantees reduces the level of required provisions.
|
Loan Loss Provision Required
Consumer and Commercial Borrowers
|
|||||
|
With
Preferred “A”
Guarantees
|
With
Preferred “B”
Guarantees
|
Without
Preferred “A”
or Preferred
“B” Guarantees
|
|||
|
Normal
|
1%
|
1%
|
1%
|
||
|
Low risk / Special tracking - under observation
|
1%
|
3%
|
5%
|
||
|
Special tracking - under negotiation or with refinancing agreements
(2)
|
1%
|
6%
|
12%
|
||
|
Medium risk / Problem
|
1%
|
12%
|
25%
|
||
|
High risk / High risk of insolvency
|
1%
|
25%
(3)
|
50%
(3)
|
||
|
Irrecoverable
|
1%
|
50%
|
100%
|
||
|
Irrecoverable for technical decision
|
1%
|
100%
(1)
|
100%
(1)
|
||
|
Additional loans
(3)
|
1%
|
1%
|
1%
|
||
|
(1)
|
The classification of a debtor under this category will require a loan loss provision of 100% of any financings, such as rollovers, extensions and express or implied waits, that may be granted after 90 days have elapsed since the day following the announcement by the Central Bank of the data base that includes the debtor. The presence of preferred guarantees does not affect this obligation.
|
|
(2)
|
The entity has not yet classified its debtors in the “Special tracking -under negotiation or with refinancing agreements” category.
|
|
(3)
|
Extensions of credit that do not surpass the result of applying the percentages indicated below over the balance of the existing debt on the day prior to the extension of the additional credit:
|
|
Irrecoverable
|
10%
|
|
Difficult recovery / High risk of insolvency
|
20%
|
|
Deficient servicing / Problem
|
30%
|
|
Inadequate servicing / Potential risk
|
40%
|
Non-compliance with the payments for the services corresponding to this additional assistance will determine the obligation to provide assistance consistent with the objective standards for overdue payments or legal requirements pursuant to the classification of debtors included in the consumer portfolio for consumption or housing. This also applies to borrowers in the commercial portfolio, in which case the additional financing will be considered independently of the rest of the client’s debt.
Furthermore, banks are required to establish provisions equal to 100% of any interest accrued on loans to borrowers classified as “Problem” or lower or “Medium Risk” or lower. The Bank chooses to interrupt interest accrual accounting as permitted by the regulation.
By Communication “A” 4683 the BCRA introduced the possibility for debtors of the Consumer and Consumer-like Portfolio to be assigned a percentage above the minimum estimate for the situation without having to be automatically reclassified to the next category. BBVA Francés has not used this possibility further supported by the regulations.
As a result of the regular revision of portfolio behaviors carried out by the Bank through back testing, it has been decided to modify the policy of allowances by adjusting the coverage percentages.
The main destination of these allowances is to generate coverage for expectations of arrears and an estimation of possible losses per portfolio and per type of financing in our entity.
Considering the applicable coverages and their regular revision and after a qualitative analysis of the environment, decisions are made as to whether the policy of allowances should be maintained or modified.
BBVA Francés has resolved to modify the allowance percentages applied for the Commercial, Consumer and Consumer-like Portfolios, as detailed below:
|
(i)
|
Percentages of allowance until June 29, 2011.
|
|
§
|
Commercial, Consumer and Consumer-like Portfolio Clients in a Normal Situation:
|
|
Product
|
Provision Percentage
|
|
|
Foreign Trade
|
2.00
|
|
|
Corporate Bonds
|
||
|
Personal
|
||
|
Loans to Companies
|
||
|
Financial Loans
|
||
|
Negotiated Securities
|
||
|
Pledges
|
||
|
Checks
|
||
|
Credit Accounts
|
||
|
Credit Cards
|
2.50
|
|
|
Overdrafts
|
||
|
Mortgages
|
1.00
|
|
|
Other provisionable products
|
1.25
|
|
§
|
Consumer Portfolio Clients (other than normal):
|
|
Situation
|
Category
|
Without Preferred Guarantees
|
With Preferred Guarantees B
|
With Preferred Guarantees A
|
||||
|
(in percentages)
|
||||||||
|
2
|
Low Risk
|
5
|
3
|
1
|
||||
|
3
|
Medium Risk
|
100
(*)
|
12
|
1
|
||||
|
4
|
High Risk
|
100
(*)
|
50
|
1
|
||||
|
5
|
Irrecoverable
|
100
|
50
|
1
|
||||
|
6
|
Irrecoverable for Technical Reasons
|
100
|
100
|
100
|
||||
|
(*)
|
In the event of clients classified under the current situations by the mandatory reclassification process, the applicable provision percentage will be 95%.
|
|
§
|
Consumer-like Portfolio Clients (other than normal):
|
|
Situation
|
Category
|
Without Preferred Guarantees
|
With Preferred Guarantees B
|
With Preferred Guarantees A
|
||||
|
(in percentages)
|
||||||||
|
2
|
Low Risk
|
5
|
3
|
1
|
||||
|
3
|
Medium Risk
|
100
(*)
|
12
|
1
|
||||
|
4
|
High Risk
|
100
(*)
|
50
|
1
|
||||
|
5
|
Irrecoverable
|
100
|
50
|
1
|
||||
|
6
|
Irrecoverable for Technical Reasons
|
100
|
100
|
100
|
||||
|
(*)
|
In the event of clients classified under the current situations by the mandatory reclassification process, the applicable provision percentage will be 95%.
|
This Policy will be applicable except as authorized by the Companies and Wholesale Banking Monitoring Committee.
|
§
|
Commercial Clients Portfolio (other than normal):
|
|
Situation
|
Category
|
Without Preferred Guarantees
|
With Preferred Guarantees B
|
With Preferred Guarantees A
|
||||
|
(in percentages)
|
||||||||
|
2.a.
|
Under Observation
|
5
|
3
|
1
|
||||
|
2.b.
|
Under Negotiation
|
12
|
6
|
1
|
||||
|
3
|
With Problems
|
25
|
12
|
1
|
||||
|
4
|
High Risk of Insolvency
|
50
|
25
|
1
|
||||
|
5
|
Irrecoverable
|
100
|
50
|
1
|
||||
|
6
|
Irrecoverable for Technical Reasons
|
100
|
100
|
100
|
||||
|
(ii)
|
As of June 21, 2011 the Technical Operations Committee approved the modification of the percentages of allowance for clients who were in Normal Situation. The changes became effective on June 30, 2011 and are summarized in the table below:
|
|
Product
|
Commercial
|
Consumer-like
|
Consumer
|
|||
|
Overdrafts
|
1.50
|
1.50
|
2.00
|
|||
|
Negotiated Securities
|
||||||
|
Pledges
|
||||||
|
Personal
|
||||||
|
Credit Accounts
|
||||||
|
Checks
|
||||||
|
Credit Cards
|
||||||
|
Corporate Bonds
|
||||||
|
Foreign Trade
|
||||||
|
Loans to Companies
|
||||||
|
Financial Loans
|
||||||
|
Mortgages
|
1.00
|
1.00
|
1.00
|
|||
|
Other provisionable products
|
1.25
|
1.25
|
1.25
|
|
(iii)
|
As of December 15, 2011 the Risk Management Committee (formerly Technical Operations Committee) approved the modification of the percentages of allowance for clients who were in Normal Situacion. The changes became effective on December 30, 2011 and are summarized in the table below:
|
|
Product
|
Commercial
|
Consumer-like
|
Consumer
|
|||
|
Overdrafts
|
1.25
|
1.25
|
2.00
|
|||
|
Negotiated Securities
|
||||||
|
Pledges
|
||||||
|
Personal
|
||||||
|
Credit Accounts
|
||||||
|
Checks
|
||||||
|
Credit Cards
|
||||||
|
Corporate Bonds
|
||||||
|
Foreign Trade
|
||||||
|
Loans to Companies
|
||||||
|
Financial Loans
|
||||||
|
Mortgages
|
1.00
|
1,00
|
1.00
|
|||
|
Other provisionable products
|
1.25
|
1.25
|
1.25
|
As of April 19, 2012 the Risk Management Committee (formerly Technical Operations Committee) approved the modification of the percentages of allowance for clients who were in a Normal Situacion. The changes became effective on April 30, 2012 and are summarized in the table below:
|
Product
|
Commercial
|
Consumer-like
|
Consumer
|
|||
|
Overdrafts
|
1.00
|
1.00
|
1.75
|
|||
|
Negotiated Securities
|
||||||
|
Pledges
|
||||||
|
Personal
|
||||||
|
Credit Accounts
|
||||||
|
Checks
|
||||||
|
Credit Cards
|
||||||
|
Corporate Bonds
|
||||||
|
Foreign Trade
|
||||||
|
Loans to Companies
|
||||||
|
Financial Loans
|
||||||
|
Mortgages
|
1.00
|
1.00
|
1.00
|
|||
|
Other provisionable products
|
1.00
|
1.00
|
1.00
|
The Central Bank regulations set requirements for the review by banks of their classification of borrowers. The classification given to borrowers whose outstanding loans represent at any given time more than 5% of the lending bank’s risk-hyphen weighted capital must be reviewed at least on a quarterly basis. The classification given to borrowers whose outstanding loans represent at any time between 1.00% and 5.00% of the lending bank’s risk-weighted capital, or are for an amount greater than Ps.4.0 million, must be reviewed at least every six months. The classification of all other types of borrowers must be reviewed at least once a year. In addition, banks must review the classification given to a borrower in any of the following situations:
|
§
|
Any time the Central Bank modifies the definition of its borrower classifications;
|
|
§
|
Any time another bank downgrades a borrower whose loan standings are greater than 10% of the total loans outstanding in the Argentine financial system;
|
|
§
|
Any time a credit rating agency downgrades by more than one category the rating assigned to bonds issued by such borrower;
|
|
§
|
If the Central Bank requires it as a result of an inspection; and
|
|
§
|
In case of discrepancy by more than one level between the rating given by the financial entity and those granted by at least another two financial entities or trusts in categories below that assigned by it, and whose credits as a whole represent at least 20% and are below 40% of the total amount informed by all creditors, as per the latest information available at the Debtors Department of the financial system”.
|
We are therefore fully compliant with the Central Bank requirements relating to borrower declassifications. We also fully complied with the provisioning requirements regarding all our normal loans; that is, we had established the full 1.0% provision for normal loans, as well as the 100% provision required for loans with preferred guarantees being twenty-five months in arrears and classified as “High Risk”, “High Risk of Insolvency” and “Irrecoverable”. In addition, we believe that we have adequate provisions to cover any known losses and any losses inherent in the loan portfolio. See Note 3.4.5 to the Consolidated Financial Statements.
The Bank stops accruing interest on a loan as soon as any scheduled payment is 90 days overdue, or earlier if the customer is classified as “With Problems”, “Medium Risk”, “High Risk of Insolvency”, “High Risk”, “Irrecoverable” or “Irrecoverable for Technical Reasons”.
The following table presents our loan portfolio, before the deduction for the allowance for loan losses, using the classification system of the Central Bank in effect at the end of each fiscal year:
|
December 31,
|
||||||||||||||||||||||||
|
2012
|
%
|
2011
(1)
|
%
|
2010
|
%
|
|||||||||||||||||||
|
(in thousands of pesos, except percentages)
|
||||||||||||||||||||||||
|
Loan Portfolio Categories
|
||||||||||||||||||||||||
|
Normal
|
28,660,468 | 98.77 | % | 22,937,081 | 99.11 | % | 16,940,541 | 99.09 | % | |||||||||||||||
|
Low risk / Special tracking
|
168,917 | 0.58 | % | 99,514 | 0.43 | % | 75,161 | 0.44 | % | |||||||||||||||
|
Medium risk / Problem
|
96,211 | 0.33 | % | 54,568 | 0.24 | % | 32,929 | 0.19 | % | |||||||||||||||
|
High risk / High risk of insolvency
|
72,974 | 0.25 | % | 39,981 | 0.17 | % | 35,114 | 0.21 | % | |||||||||||||||
|
Irrecoverable
|
18,556 | 0.06 | % | 10,694 | 0.05 | % | 12,152 | 0.07 | % | |||||||||||||||
|
Irrecoverable for technical decision
|
162 | — | 166 | — | 182 | — | ||||||||||||||||||
|
Total
|
29,017,288 | 100.00 | % | 23,142,004 | 100.00 | % | 17,096,079 | 100.00 | % | |||||||||||||||
|
(1)
|
See Note 3.3 to our Consolidated Financial Statements.
|
Classification of Loan Portfolio
The following table presents our consumer and commercial loan portfolio as of December 31, 2012, 2011, 2010, 2009 and 2008 under the classification system of the Central Bank, before the deduction of the allowance for loan losses:
|
December 31,
|
||||||||||||||||||||||||||||||||||||||||
|
2012
|
2011
(1)
|
2010
|
2009
|
2008
|
||||||||||||||||||||||||||||||||||||
|
Total
|
%
|
Total
|
%
|
Total
|
%
|
Total
|
%
|
Total
|
%
|
|||||||||||||||||||||||||||||||
|
(in thousands of pesos, except percentages)
(2)
|
||||||||||||||||||||||||||||||||||||||||
|
Normal (Consumer)
|
12,067,720 | 97.47 | % | 9,271,567 | 98.16 | % | 6,411,481 | 98.18 | % | 4,417,993 | 96.47 | % | 4,358,063 | 97.19 | % | |||||||||||||||||||||||||
|
Normal (Commercial)
|
16,592,748 | 99.73 | % | 13,665,514 | 99.77 | % | 10,529,060 | 99.65 | % | 7,460,075 | 99.33 | % | 8,169,520 | 99.39 | % | |||||||||||||||||||||||||
| 28,660,468 | 98.77 | % | 22,937,081 | 99.11 | % | 16,940,541 | 99.09 | % | 11,878,068 | 98.25 | % | 12,527,583 | 98.61 | % | ||||||||||||||||||||||||||
|
Low risk (Consumer)
|
151,296 | 1.22 | % | 81,563 | 0.86 | % | 50,854 | 0.78 | % | 54,838 | 1.20 | % | 55,071 | 1.23 | % | |||||||||||||||||||||||||
|
Special tracking (Commercial)
|
17,621 | 0.11 | % | 17,951 | 0.13 | % | 24,307 | 0.23 | % | 35,169 | 0.47 | % | 10,727 | 0.13 | % | |||||||||||||||||||||||||
| 168,917 | 0.58 | % | 99,514 | 0.43 | % | 75,161 | 0.44 | % | 90,007 | 0.74 | % | 65,798 | 0.52 | % | ||||||||||||||||||||||||||
|
Medium risk (Consumer)
|
90,692 | 0.73 | % | 51,628 | 0.55 | % | 31,016 | 0.47 | % | 42,503 | 0.93 | % | 33,008 | 0.74 | % | |||||||||||||||||||||||||
|
Problem (Commercial)
|
5,519 | 0.03 | % | 2,940 | 0.02 | % | 1,913 | 0.02 | % | 3,415 | 0.05 | % | 3,332 | 0.04 | % | |||||||||||||||||||||||||
| 96,211 | 0.33 | % | 54,568 | 0.24 | % | 32,929 | 0.19 | % | 45,918 | 0.38 | % | 36,340 | 0.29 | % | ||||||||||||||||||||||||||
|
High risk (Consumer)
|
55,616 | 0.45 | % | 32,389 | 0.34 | % | 27,252 | 0.42 | % | 58,605 | 1.28 | % | 35,076 | 0.78 | % | |||||||||||||||||||||||||
|
High risk of insolvency (Commercial)
|
17,358 | 0.10 | % | 7,592 | 0.06 | % | 7,862 | 0.07 | % | 6,328 | 0.08 | % | 32,736 | 0.40 | % | |||||||||||||||||||||||||
| 72,974 | 0.25 | % | 39,981 | 0.17 | % | 35,114 | 0.21 | % | 64,933 | 0.54 | % | 67,812 | 0.53 | % | ||||||||||||||||||||||||||
|
Irrecoverable (Consumer)
|
14,916 | 0.12 | % | 8,180 | 0.09 | % | 9,613 | 0.15 | % | 5,364 | 0.12 | % | 2,362 | 0.05 | % | |||||||||||||||||||||||||
|
Irrecoverable (Commercial)
|
3,640 | 0.02 | % | 2,514 | 0.02 | % | 2,539 | 0.02 | % | 5,028 | 0.07 | % | 3,458 | 0.03 | % | |||||||||||||||||||||||||
| 18,556 | 0.06 | % | 10,694 | 0.05 | % | 12,152 | 0.07 | % | 10,392 | 0.09 | % | 5,820 | 0.05 | % | ||||||||||||||||||||||||||
|
Irrecoverable for technical decision (Consumer)
|
162 | — | 165 | — | 120 | — | 98 | — | 480 | 0.01 | % | |||||||||||||||||||||||||||||
|
Irrecoverable for technical decision (Commercial)
|
— | — | 1 | — | 62 | — | 159 | — | 247 | 0.01 | % | |||||||||||||||||||||||||||||
| 162 | — | 166 | — | 182 | — | 257 | — | 727 | 0.01 | % | ||||||||||||||||||||||||||||||
|
Total consumer loans
|
12,380,402 | 100.00 | % | 9,445,492 | 100.00 | % | 6,530,336 | 100.00 | % | 4,579,401 | 100.00 | % | 4,484,060 | 100.00 | % | |||||||||||||||||||||||||
|
Total commercial loans
|
16,636,886 | 100.00 | % | 13,696,512 | 100.00 | % | 10,565,743 | 100.00 | % | 7,510,174 | 100.00 | % | 8,220,020 | 100.00 | % | |||||||||||||||||||||||||
|
Total
|
29,017,288 | 100.00 | % | 23,142,004 | 100.00 | % | 17,096,079 | 100.00 | % | 12,089,575 | 100.00 | % | 12,704,080 | 100.00 | % | |||||||||||||||||||||||||
|
(1)
|
See Note 3.3 to our Consolidated Financial Statements.
|
|
(2)
|
Percentages for each category are of total consumer, commercial or total loans, as the context requires.
|
Non-performing and Restructured Loans
Applying the Central Bank’s loan classification criteria described above, the following table analyzes at each of the dates indicated below our gross non-performing and restructured loan portfolio, and further breaks down the total into loans with preferred guarantees and those which are unsecured:
|
December 31,
|
||||||||||||||||||||
|
2012
|
2011
|
2010
|
2009
|
2008
|
||||||||||||||||
|
(in thousands of pesos)
|
||||||||||||||||||||
|
Non-performing loans
(1)
|
187,903 | 105,409 | 80,377 | 121,500 | 110,699 | |||||||||||||||
|
Total
|
187,903 | 105,409 | 80,377 | 121,500 | 110,699 | |||||||||||||||
|
With preferred guarantees
|
50,080 | 19,432 | 15,228 | 15,929 | 10,408 | |||||||||||||||
|
Unsecured
|
137,823 | 85,977 | 65,149 | 105,571 | 100,291 | |||||||||||||||
|
Total
|
187,903 | 105,409 | 80,377 | 121,500 | 110,699 | |||||||||||||||
|
(1)
|
Non-performing loans includes all loans to borrowers classified as “Medium Risk”, “Problem”, “High Risk”, “High Risk of Insolvency”, “Irrecoverable” and “Irrecoverable for Technical Decision” under the Central Bank loan classification system. Non-performing loans also include all loans contractually past due 90 days or more. At December 31, 2012, 2011, 2010, 2009 and 2008, non-performing loans include Ps.114,515 thousand, Ps.64,688 thousand, Ps.46,538 thousand, Ps.91,671 thousand and Ps.93,573 thousand, respectively, of non-accrual loans.
|
The table below sets forth non-performing loans by economic activity as of each of the dates indicated:
|
December 31,
|
||||||||||||||||||||||||||||||||||||||||
|
2012
|
2011
|
2010
|
2009
|
2008
|
||||||||||||||||||||||||||||||||||||
|
Total
|
%
|
Total
|
%
|
Total
|
%
|
Total
|
%
|
Total
|
%
|
|||||||||||||||||||||||||||||||
|
(in thousands of pesos, except percentages)
|
||||||||||||||||||||||||||||||||||||||||
|
Agricultural and livestock
|
10,557 | 5.62 | % | 3,425 | 3.25 | % | 78 | 0.10 | % | 61 | 0.05 | % | 156 | 0.14 | % | |||||||||||||||||||||||||
|
Beverage
|
1 | — | 19 | 0.02 | % | 1 | — | — | — | — | — | |||||||||||||||||||||||||||||
|
Chemicals
|
9 | — | 921 | 0.87 | % | — | — | — | — | — | — | |||||||||||||||||||||||||||||
|
Construction
|
1,058 | 0.56 | % | 401 | 0.38 | % | 862 | 1.07 | % | 1,498 | 1.23 | % | 1,980 | 1.79 | % | |||||||||||||||||||||||||
|
Consumer
|
162,742 | 86.61 | % | 92,372 | 87.63 | % | 34,909 | 43.43 | % | 41,814 | 34.41 | % | 34,780 | 31.42 | % | |||||||||||||||||||||||||
|
Electrical machinery
|
230 | 0.12 | % | — | — | 3 | — | 16 | 0.01 | % | — | — | ||||||||||||||||||||||||||||
|
Financial sector
|
1 | — | 7 | 0.01 | % | 5 | 0.01 | % | — | — | — | — | ||||||||||||||||||||||||||||
|
Foodstuff
|
168 | 0.09 | % | 372 | 0.35 | % | 2 | — | 16 | 0.01 | % | 35 | 0.03 | % | ||||||||||||||||||||||||||
|
Government services
|
— | — | — | — | 1 | — | 1 | — | — | — | ||||||||||||||||||||||||||||||
|
Industrial metals
|
5 | — | 954 | 0.91 | % | — | — | 9 | 0.01 | % | 1 | — | ||||||||||||||||||||||||||||
|
Leather and fur products
|
833 | 0.44 | % | 789 | 0.75 | % | — | — | 4 | — | 2 | — | ||||||||||||||||||||||||||||
|
Machinery and tools
|
9,462 | 5.04 | % | — | — | — | — | — | — | — | — | |||||||||||||||||||||||||||||
|
Mining products
|
4 | — | 8 | 0.01 | % | 2 | — | — | — | — | — | |||||||||||||||||||||||||||||
|
Oil and carbon
|
1 | — | — | — | 81 | 0.10 | % | — | — | — | — | |||||||||||||||||||||||||||||
|
Others
|
11 | 0.01 | % | 1,511 | 1.43 | % | 33,257 | 41.38 | % | 64,826 | 53.35 | % | 54,024 | 48.80 | % | |||||||||||||||||||||||||
|
Other manufacturing
|
40 | 0.02 | % | 45 | 0.04 | % | 56 | 0.07 | % | 1 | — | — | — | |||||||||||||||||||||||||||
|
Paper products
|
4 | — | 432 | 0.41 | % | — | — | — | — | — | — | |||||||||||||||||||||||||||||
|
Printer, publishers and related industries
|
231 | 0.12 | % | 229 | 0.22 | % | 3 | — | 8 | 0.01 | % | — | — | |||||||||||||||||||||||||||
|
Rubber products
|
— | — | — | — | — | — | 3 | — | — | — | ||||||||||||||||||||||||||||||
|
Retail trade
|
1,040 | 0.55 | % | 330 | 0.31 | % | 9,590 | 11.93 | % | 8,105 | 6.68 | % | 13,294 | 12.01 | % | |||||||||||||||||||||||||
|
Services
|
328 | 0.17 | % | 448 | 0.43 | % | 43 | 0.05 | % | 156 | 0.13 | % | 37 | 0.03 | % | |||||||||||||||||||||||||
|
Shoes, apparel and other textile products
|
— | — | — | — | 86 | 0.11 | % | 3 | — | — | — | |||||||||||||||||||||||||||||
|
Textile
|
342 | 0.18 | % | 2,126 | 2.02 | % | 4 | — | 1 | — | 9 | 0.01 | % | |||||||||||||||||||||||||||
|
Tobacco
|
— | — | — | — | — | — | 5 | — | — | — | ||||||||||||||||||||||||||||||
|
Transportation material
|
192 | 0.10 | % | 9 | 0.01 | % | 1 | — | 7 | 0.01 | % | 4 | — | |||||||||||||||||||||||||||
|
Wholesale trade
|
644 | 0.34 | % | 820 | 0.79 | % | 1,387 | 1.74 | % | 4,966 | 4.10 | % | 6,377 | 5.77 | % | |||||||||||||||||||||||||
|
Wood products and cork
|
— | — | 191 | 0.18 | % | 6 | 0.01 | % | — | — | — | — | ||||||||||||||||||||||||||||
|
Total
|
187,903 | 100.00 | % | 105,409 | 100.00 | % | 80,377 | 100.00 | % | 121,500 | 100.00 | % | 110,699 | 100.00 | % | |||||||||||||||||||||||||
As of December 31, 2012, the majority of our loan portfolio, and non-performing and restructured loan portfolio, consisted of loans to Argentine borrowers. At that date, approximately Ps.120.8 million, or 0.42% of our total loan portfolio, consisted of loans to foreign borrowers.
Gross interest income that would have been recorded on non-performing loans during the fiscal years ended December 31, 2012, 2011, 2010, 2009 and 2008 amounted to Ps.25.5 million, Ps.24.7 million, Ps.51.0 million, Ps.59.8 million and Ps.56.9 million, respectively.
The variation (decrease) in our non-performing loans classified as “Others” was due to the implementation of certain improvements that allowed us to identify each debtor’s economic activities and therefore classify his or her non-performing loan within the relevant economic activity (i.e., agricultural and livestock, beverage, etc.). Starting in 2011 we developed a technological application that allows us to obtain the economic activity of our clients from more complete and comprehensive database. Prior to that, the economic activities of certain clients were classified as “Others” because they did not have an specified economic activity assigned to them in the relevant database. The improvement, however, did not result in any material decrease in the amount of non-performing loans, just in a different classification of them by activities.
Analysis of the Allowance for Loan Losses
The table below sets forth the activity in the allowance for loan losses for the fiscal years ended December 31, 2012, 2011, 2010, 2009 and 2008. See Note 21.5 to the Consolidated Financial Statements. In conformity with Central Bank requirements, we charge-off non-performing loans when we believe that recovery is unlikely and, in any event, no later than seven months after a loan has been classified as “irrecoverable” without preferred guarantees. We continue to try to collect all amounts past due, even if they have been charged-off, if we believe that the likelihood of collecting such amounts justifies the commitment of resources to do so.
|
December 31,
|
||||||||||||||||||||
|
2012
|
2011
|
2010
|
2009
|
2008
|
||||||||||||||||
|
(in thousands of pesos, except percentages)
|
||||||||||||||||||||
|
Balance at the beginning of the year
|
444,973 | 396,227 | 337,686 | 196,489 | 198,728 | |||||||||||||||
|
Provisions for loan losses
|
259,181 | 134,199 | 178,800 | 244,800 | 38,124 | |||||||||||||||
|
Charge-offs
(1)
|
(180,297 | ) | (85,453 | ) | (120,259 | ) | (103,603 | ) | (40,363 | ) | ||||||||||
|
Advances
|
(37,869 | ) | (9,668 | ) | (23,977 | ) | (32,520 | ) | (1,767 | ) | ||||||||||
|
Consumer
|
(119,112 | ) | (48,248 | ) | (72,849 | ) | (24,645 | ) | (14,658 | ) | ||||||||||
|
Notes discounted and purchased
|
— | (21,230 | ) | (22,842 | ) | (26,451 | ) | (4,499 | ) | |||||||||||
|
Other
|
(23,316 | ) | (6,307 | ) | (590 | ) | (19,987 | ) | (19,439 | ) | ||||||||||
|
Balance at the end of year
|
523,857 | 444,973 | 396,227 | 337,686 | 196,489 | |||||||||||||||
|
Net charge-off / average loans
|
0.70 | % | 0.43 | % | 0.85 | % | 0.85 | % | 0.34 | % | ||||||||||
|
(1)
|
Charge-offs are not concentrated in any particular economic activity. Our management estimates that of the Ps.180.3 million charged-off in the fiscal year ended December 31, 2012, Ps.23.0. million or 12.76%, were related to corporate borrowers and Ps.157.3 million or 87.24%, were related to individual consumers. The variation between 2012 and 2011 is due to the increases in the ratio of arrears and doubtful loan portfolio. Of the Ps.85.5 million charged-off in the fiscal year ended December 31, 2011, Ps.45.6 million or 53.36%, were related to corporate borrowers and Ps.39.9 million or 46.64%, were related to individual consumers. The lower volume of charge-offs in 2011 was due to the improvement in the quality of our credit portfolio during the years 2010 and 2011 which resulted in better severity ratios and lower volumes of delinquent debtors. This in turn led to a reduction in the volume of irrecoverable loans during the year 2011 and therefore to an attenuated fall in the volume of charge-offs. Of the Ps.120.3 million charged-off in the fiscal year ended December 31, 2010, Ps.77.3 million or 64.25%, were related to corporate borrowers and Ps.43.0 million or 35.75%, were related to individual consumers. Of the Ps.103.6 million charged-off in the fiscal year ended December 31, 2009, Ps.28.4 million or 27.45%, were related to corporate borrowers and Ps.75.2 million or 72.55%, were related to individual consumers. Of the Ps.40.4 million charged-off in the fiscal year ended December 31, 2008, Ps.18.6 million or 46.06%, were related to corporate borrowers and Ps.21.8 million or 53.94%, were related to individual consumers. Charge-offs include reversal and applications.
|
Allocation of the Allowance for Loan Losses
The following table allocates the allowance for loan losses and sets forth the percentage distribution by each category of loans in the total loan portfolio (principals only) for each of the fiscal years ended December 31, 2012, 2011, 2010, 2009 and 2008.
|
December 31,
|
||||||||||||||||||||||||||||||||||||||||
|
2012
|
2011
|
2010
|
2009
|
2008
|
||||||||||||||||||||||||||||||||||||
|
Total
|
%
|
Total
|
%
|
Total
|
%
|
Total
|
%
|
Total
|
%
|
|||||||||||||||||||||||||||||||
|
(in thousands of pesos, except percentages)
|
||||||||||||||||||||||||||||||||||||||||
|
Advances
|
63,394 | 17.94 | % | 41,871 | 12.54 | % | 34,201 | 14.57 | % | 25,192 | 16.31 | % | 17,131 | 12.74 | % | |||||||||||||||||||||||||
|
Notes discounted and purchased
|
44,713 | 14.92 | % | 44,792 | 14.85 | % | 29,306 | 12.84 | % | 15,692 | 10.23 | % | 15,194 | 11.19 | % | |||||||||||||||||||||||||
|
Secured with mortgages
|
10,802 | 3.10 | % | 14,558 | 3.99 | % | 19,412 | 5.18 | % | 15,379 | 8.03 | % | 10,975 | 8.53 | % | |||||||||||||||||||||||||
|
Chattel mortgage
|
47,060 | 8.72 | % | 29,207 | 7.19 | % | 17,604 | 5.12 | % | 10,641 | 1.00 | % | 7,015 | 4.61 | % | |||||||||||||||||||||||||
|
Consumers loans
|
260,970 | 33.44 | % | 201,941 | 31.39 | % | 214,847 | 30.35 | % | 197,786 | 31.43 | % | 75,869 | 27.90 | % | |||||||||||||||||||||||||
|
Financial Loans
|
21,867 | 4.54 | % | 23,605 | 4.55 | % | 12,156 | 3.29 | % | 7,595 | 5.22 | % | 8,909 | 4.98 | % | |||||||||||||||||||||||||
|
Other loans to governmental sector
|
— | 0.03 | % | — | 0.11 | % | — | 3.97 | % | — | 1.12 | % | — | 8.67 | % | |||||||||||||||||||||||||
|
Other
|
75,051 | 17.31 | % | 88,999 | 25.38 | % | 68,701 | 24.68 | % | 65,402 | 26.66 | % | 61,396 | 21.38 | % | |||||||||||||||||||||||||
|
Total
|
523,857 | 100.00 | % | 444,973 | 100.00 | % | 396,227 | 100.00 | % | 337,686 | 100.00 | % | 196,489 | 100.00 | % | |||||||||||||||||||||||||
Composition of Deposits
The following table sets out the composition of each category of deposits that exceeded 10% of average total deposits in each of the fiscal years ended December 31, 2012, 2011 and 2010.
|
December 31,
|
||||||||||||
|
2012
|
2011
|
2010
|
||||||||||
|
(in thousands of pesos)
|
||||||||||||
|
Deposits in domestic Bank’s offices
|
||||||||||||
|
Non-interest-bearing demand deposits
|
||||||||||||
|
Average
|
||||||||||||
|
Pesos
|
8,659,885 | 6,820,551 | 4,427,600 | |||||||||
|
Dollars
|
803,844 | 1,017,747 | 542,521 | |||||||||
|
Total
|
9,463,729 | 7,838,298 | 4,970,121 | |||||||||
|
Saving accounts
|
||||||||||||
|
Average
|
||||||||||||
|
Pesos
|
6,186,969 | 4,784,502 | 3,881,058 | |||||||||
|
Dollars
|
1,913,643 | 2,671,586 | 2,273,514 | |||||||||
|
Total
|
8,100,612 | 7,456,088 | 6,154,572 | |||||||||
|
Average real rate
|
||||||||||||
|
Pesos
|
(11.43 | )% | (11.11 | )% | (12.60 | )% | ||||||
|
Dollars
|
1.15 | % | (3.84 | )% | (8.53 | )% | ||||||
|
Total
|
(8.46 | )% | (8.51 | )% | (11.09 | )% | ||||||
|
Time deposits
|
||||||||||||
|
Average
|
||||||||||||
|
Pesos
|
11,188,977 | 9,010,574 | 6,335,859 | |||||||||
|
Dollars
|
1,460,417 | 1,918,794 | 1,789,633 | |||||||||
|
Total
|
12,649,394 | 10,929,368 | 8,125,492 | |||||||||
|
Average real rate
|
||||||||||||
|
Pesos
|
0.50 | % | (0.81 | )% | (4.28 | )% | ||||||
|
Dollars
|
1.32 | % | (3.69 | )% | (8.18 | )% | ||||||
|
Total
|
0.59 | % | (1.32 | )% | (5.14 | )% | ||||||
Maturity of Deposits at December 31, 2012
The following table sets forth information regarding the maturity of our deposits at December 31, 2012.
|
Maturing
|
||||||||||||||||||||
|
Total
|
Within 3
months
|
After 3 but
within 6 months
|
After 6 but
within 12
months
|
After 12 months
|
||||||||||||||||
|
(in thousands of pesos)
|
||||||||||||||||||||
|
Checking
|
10,149,767 | 10,149,767 | — | — | — | |||||||||||||||
|
Savings
|
9,803,893 | 9,803,893 | — | — | — | |||||||||||||||
|
Time deposits
|
13,555,151 | 13,027,323 | 431,495 | 94,547 | 1,786 | |||||||||||||||
|
Investment accounts
|
6,929 | 3,322 | 3,575 | 32 | — | |||||||||||||||
|
Other
|
649,313 | 641,758 | 2,718 | 4,837 | — | |||||||||||||||
|
Total
|
34,165,053 | 33,626,063 | 437,788 | 99,416 | 1,786 | |||||||||||||||
The following table sets forth information regarding the maturity of our certificates of deposit and other time deposits in denominations of U.S.$100,000 or more at December 31, 2012.
|
Maturing,
|
||||||||||||||||||||
|
Total
|
Within 3
months
|
After 3 but
within 6 months
|
After 6 but
within 12
months
|
After 12 months
|
||||||||||||||||
|
(in thousands of pesos)
|
||||||||||||||||||||
|
Domestic offices
|
7,007,216 | 6,866,885 | 81,284 | 59,047 | — | |||||||||||||||
|
Total
|
7,007,216 | 6,866,885 | 81,284 | 59,047 | — | |||||||||||||||
Return on Equity and Assets
The following table presents certain selected financial information and ratios of BBVA Francés for the fiscal years indicated.
|
December 31,
|
||||||||||||
|
2012
|
2011
|
2010
|
||||||||||
|
(in thousands of pesos, except percentages)
|
||||||||||||
|
Net income
|
1,263,679 | 1,005,577 | 1,198,179 | |||||||||
|
Average total assets
(1)
|
41,895,112 | 35,792,946 | 29,485,920 | |||||||||
|
Average stockholders’ equity
(1)
|
4,500,097 | 3,807,586 | 3,336,694 | |||||||||
|
Stockholders’ equity at the end of the fiscal year
|
5,131,936 | 3,868,257 | 3,746,915 | |||||||||
|
Net income as a percentage of:
|
||||||||||||
|
Average total assets
|
3.02 | % | 2.81 | % | 4.06 | % | ||||||
|
Average stockholders’ equity
|
28.08 | % | 26.41 | % | 35.91 | % | ||||||
|
Declared dividends
(2)
|
— | — | 804,000 | |||||||||
|
Dividend payout ratio
(3)
|
— | — | 67.10 | % | ||||||||
|
Average stockholders’ equity as a percentage of average total assets
|
10.74 | % | 10.64 | % | 11.32 | % | ||||||
|
(1)
|
Computed as the average of fiscal year-beginning and fiscal year-ending balances.
|
|
(2)
|
For the fiscal year ended December 31, 2012 and 2011, the Bank decided not to declare and distribute dividends as result of the issuance of Comminications “A” 5272 and 5273 of the Central Bank (see
“Item 8. Financial Information—Dividends”)
. For the fiscal year ended December 31, 2010 the dividends were paid totally in cash.
|
|
(3)
|
Declared dividends stated as percentage of net income. Since April 2002, the Central Bank had suspended the payment of dividends. As of June 2, 2004, financial institutions that are allowed to make distributions will have no effect on the prior authorization of the Central Bank provided that certain conditions are met. See
“Item 8. Financial Information—Dividends”.
|
Short-Term Borrowings
Our short-term borrowings, which equaled or exceeded 30% of stockholders’ equity, totaled approximately Ps.3.1 billion, Ps.4.0 billion and Ps.1.9 billion for the fiscal years ended December 31, 2012, 2011 and 2010, respectively. The table below shows those amounts at the end of each fiscal year.
|
December 31,
|
||||||||||||||||||||||||
|
2012
|
2011
|
2010
|
||||||||||||||||||||||
|
Amount
|
Weighted Average
Interest
Rate
|
Amount
|
Weighted Average
Interest
Rate
|
Amount
|
Weighted Average
Interest
Rate
|
|||||||||||||||||||
|
(in thousands of pesos, except percentages)
|
||||||||||||||||||||||||
|
Total amount outstanding at the end of the reported period
|
3,133,360 | 5.6 | % | 3,998,286 | 4.0 | % | 1,930,388 | 1.1 | % | |||||||||||||||
|
Average during year
|
3,346,909 | 10.8 | % | 3,135,587 | 13.9 | % | 2,419,380 | 1.7 | % | |||||||||||||||
|
Maximum month-end balance
|
3,644,184 | 3,998,286 | 4,844,829 | |||||||||||||||||||||
THE ARGENTINE BANKING SYSTEM AND ITS REGULATORY FRAMEWORK
Argentine Banking System
On November 31, 2012, Argentina’s banking system consisted of 65 commercial banks, of which 12 were government-owned or government-related banks and 53 were privately owned banks. The principal regulators of financial institutions in Argentina are the Central Bank, the Superintendencia de Entidades Financieras y Cambiarias (the Superintendency of Financial Institutions and Exchanges, referred to as the “Superintendency”) and, in the case of financial institutions that publicly offer their own securities in Argentina or otherwise engage in the offering or trading of third parties’ securities in Argentina, the CNV.
Private Sector Banks
According to information published by the Central Bank, on November 31, 2012, the largest privately owned locally based commercial banks, in terms of total assets, were the following: Banco Santander Río S.A., Banco de Galicia y Buenos Aires S.A., Banco Macro S.A., BBVA Francés and HSBC Bank Argentina. Some of these banks, including BBVA Francés, have one or more significant foreign investors. Similarly, private financial institutions accounted for approximately 52.53% of deposits and approximately 59.13% of gross loans in the Argentine financial system. In addition, the ten largest private financial institutions accounted for 41.36% of all deposits and 47.32% of all loans in the Argentine financial system. Foreign banks compete under the same regulatory conditions as Argentine banks.
Public Sector Banks
The principal state owned banks are: Banco de la Nación Argentina, Banco de la Provincia de Buenos Aires and Banco de la Ciudad de Buenos Aires. As of November 31, 2012, based on the available data of the Central Bank, such entities accounted for approximately 42.22% of deposits and approximately 32.97% of gross loans in the Argentine banking system.
Under the provisions of the Argentine financial institutions Law Nr. 21,526 (the “Financial Institutions Law”), Government owned or government-related banks and private banks have comparable rights and obligations except that the former have the sole right and obligation to handle public revenues and promote regional development. Government-owned banks are required to meet the credit needs of public sector entities. Moreover, the by-laws of some government-owned banks, which include federal, provincial and locally owned banks, require that the principalities which own them guarantee their commitments.
Central Bank
The Financial Institutions Law regulates banking activities in Argentina and places the supervision and control of the Argentine banking system in the hands of the Central Bank, an autonomous institution. The Financial Institutions Law provides the Central Bank with broad access to the accounting systems, books, correspondence, documents and other papers of banking institutions. The Central Bank regulates the provision of credit and supervises the liquidity and the general operation of the Argentine financial markets. The Central Bank enforces the Financial Institutions Law and authorizes banks to operate in Argentina. Since an amendment to the final institutions Law of February 1994, there is no distinction between locally owned and foreign owned private financial institutions. The Central Bank does not have the authority to supervise the liquidation of financial institutions.
The Central Bank establishes “technical ratios” to limit the levels of indebtedness, liquidity, maximum credit that may be granted per customer and foreign exchange assets and liabilities positions, among others. The Central Bank carries out formal inspections from time to time of all banking institutions to monitor their compliance with legal and regulatory requirements. The Central Bank supervises banks on a consolidated basis. It has a supervision department of internal and external auditors of financial institutions that evaluate performance comprehensively in internal audit areas as well as firms and professionals working as external auditors of financial institutions. See
“Item 4. Information on the Company—The Argentine Banking System and its Regulatory Framework—BASIC System”
below. If a bank does not comply with the technical ratios, it must explain such noncompliance to the Central Bank. There are specific regulations governing reinstatement plans and other measures arising from the failure of these plans. Furthermore, the Central Bank has the power to impose sanctions for noncompliance, which vary from a strong reprimand to revocation of banking licenses.
The Central Bank requires banks to submit information to it on a daily, monthly, quarterly, semiannual and annual basis. These reports contain, among other important information, balance sheets and income statements, information relating to reserve funds, use of deposits and indicators on portfolio quality, including details on principal debtors and any loan-loss provisions established. The reports are designed to allow the Central Bank to monitor the banks’ business practices. If the Central Bank’s rules are breached, various sanctions may be imposed depending on the gravity of the violation, ranging from calling attention to the infraction to the
imposition of fines or even the revocation of a bank’s operating license. Moreover, noncompliance with certain rules may result in the obligatory presentation to the Central Bank of specific capital adequacy or regularization plans. These plans must be approved by the Central Bank for a bank to maintain its license.
Law Nr. 25,780 introduced amendments to the Financial Institutions Law Corporate and the Central Bank charter. Among the most significant of such modifications are the following:
|
§
|
Except by express provision to the contrary established by-law, the Central Bank will not be affected by any regulations of a general character which may have been or shall have been enacted with reference to Public Administration bodies and which may introduce limitations to the authority or powers of the Central Bank as set forth in its own charter.
|
|
§
|
The Central Bank is empowered to make temporary advances to the Government up to an amount equivalent to 12% of the monetary base, which for this purpose includes amounts constituted by the monetary circulation plus the sight deposits of the financial institutions with the Central Bank, in current account or in special accounts. It may also grant advances up to an amount not exceeding 10% of the cash resources obtained by the Government in the past twelve months. At no time may the amount granted as temporary advances, excluding those exclusively allocated to the payment of obligations with the multilateral credit institutions, exceed 12% of the monetary base. All advances so granted must be reimbursed within the next twelve months; should any of these advances remain unpaid after its due date, it will not be possible to use these powers again until all owed amounts shall have been reimbursed.
|
|
§
|
The validity of Articles 44, 46 paragraph (c), 47 and 48 of the Central Bank charter, regarding the powers and authority of the Superintendency, is reestablished in terms of the text approved as Article 1 of Law Nr. 24,144.
|
|
§
|
A temporary regulation was introduced, not applicable any longer, authorizing the Central Bank to: (i) provide assistance to financial institutions with liquidity and/or solvency problems, including those undergoing restructuring by resolution of the Central Bank in terms of Article 35 bis of the Financial Institutions Law; and (ii) authorize the integration of the reserve requirements for financial institutions with financial assets other than cash, in the form of sight deposits with the Central Bank or in foreign currency accounts as per Article 28 of the Central Bank charter.
|
|
§
|
Reserves exceeding 100% of the monetary base may be allocated to the payment of obligations assumed with international financial entities.
|
Amendments to the Central Bank’s Charter and the Convertibility Law
Law Nr. 26,739 amended the functions and powers of the Central Bank, and the ability of the Federal Government to obtain financing from the Central Bank.
On March 28, 2012, Law Nr. 26,739 was published in the Official Gazette amending the charter of the Central Bank (as amended, the “Charter”) of the Argentine Republic, which had been previously approved by Law Nr. 24,144 and the Convertibility Law.
The amendments introduced by Law Nr. 26,739 may be grouped in two main topics: (i) amendments to the functions and powers of the Central Bank as the regulatory and supervisory authority of the financial system; and (ii) expansion of the Federal Government’s access to financing from the Central Bank.
|
§
|
Functions and powers of the Central Bank
:
|
|
-
|
Purpose of the Central Bank. Until Law Nr. 26,739 was enacted, according to the Charter, the “primary and fundamental purpose” of the entity was to “preserve the value of the currency”. Following Law Nr. 26,739, the Central Bank will have multiple purposes, including “promoting currency stability, financial stability, employment and economic development with social equity”.
|
|
-
|
Relationship of the Central Bank with the Executive Branch and the Congress. Under the Charter, the Central Bank remains a “self-governed entity”, and it remain in effect that: (i) in the exercise of its powers and faculties, the Central Bank shall not be subject to the instructions of the Executive Branch, and (ii) the Central Bank may not enter into any obligation that implies a restriction or a delegation of its powers, without Congress’ express authorization. However, the Charter provides that the Central Bank’s purpose must be fulfilled “within the framework of the policies set by the Federal Government”.
|
|
-
|
Obligations and powers of the Central Bank related to economic information. The amendments to the Charter limit the ability of the Central Bank to supply economic information. In particular, (i) the requirement to report the expected rate of inflation for each year; (ii) the publication of statistics regarding the balances of payment and the national accounts of the Argentine Republic; and (iii) the requirement that the entity’s financial statements reflect the amount and composition of the reserves and of the monetary base have been removed from the Charter.
|
|
-
|
Functions and powers of the Central Bank. New powers have been vested in the Central Bank, including: (i) to regulate the amount of money and the interest rates, and direct credit policies; (ii) to regulate payment systems, liquidating and clearing houses, fund remittance entities, and transportation of value companies; and (iii) to protect the rights of consumers of financial services and fair competition within the financial system.
|
|
-
|
Powers of the Central Bank’s President. The amendments strengthen the powers of the President of the Central Bank’s board of directors. In this respect: (i) the Superintendency (which will no longer be a deconcentrated entity) is now under the President’s supervision; (ii) the President is empowered to operate directly in the currency and foreign exchange markets (formerly, these powers were vested in the Central Bank’s board of directors), and (iii) the President’s powers in emergency situations are increased.
|
|
-
|
Powers of the Central Bank’s board of directors. New regulatory powers are expressly conferred to the board, such as: (i) to establish the information and accounting regime for the entities subject to the Central Bank’s supervision; (ii) to regulate credit conditions and policies; (iii) to enact rules that preserve competition in the financial market, and (iv) to regulate the obtention (through negotiable instruments or otherwise) by financial institutions of foreign currency funds.
|
|
§
|
Financing of the Federal Government
:
|
|
-
|
“Temporary Advances”. The amendment of the Charter significantly increases the Central Bank’s ability to grant “temporary advances” to the Federal Government.
|
Pursuant to the Charter, the Central Bank may grant temporary advances to the Federal Government for a term of up to twelve months, with no specific allocation, for an amount equivalent to 12% of the monetary base (which includes, outstanding currency and demand deposits of financial institutions with the Central Bank, in checking or special accounts).
In addition, advances may be granted (also for a twelve-month term) for an amount equal to up to 10% of the resources in cash that the Federal Government has obtained in the last twelve months; but these “additional” advances have to be specifically allocated to the payment of obligations with international financial institutions and to the payment of obligations in foreign currency.
The amended Charter maintains the possibility of granting temporary advances within the limits described above, but the amendment also provides that, “exceptionally”, “additional” advances may be granted for up to another 10% of the resources in cash that the Federal Government has obtained in the last twelve months, for an eighteen-month term. In addition, the requirement of specific allocation mentioned before has been abrogated. As a result, all of the “temporary advances” that the Central Bank may grant may be allocated to the purpose that the Federal Government decides at its sole discretion.
|
-
|
Determination and application of the “freely available” reserves. The amendments to the Convertibility Law abrogated the requirement that the Central Bank’s reserves must underpin up to 100% of the monetary base.
|
Now the Central Bank’s board of directors shall determine the amount of reserves necessary to carry out the foreign exchange policy, taking into consideration the evolution of the external accounts.
Consequently, the “freely available” reserves will no longer be constituted by those that exceed the amount necessary to underpin up to 100% of the monetary base. The “freely available” reserves will now be those which exceed the amount determined by the board of directors in the manner contemplated above.
The amendments to the Convertibility Law also broaden the scope of application of “freely available” reserves. In addition to the payment of obligations with international financial institutions, pursuant to the reform approved by
Congress the “freely available” reserves may also be applied to the payment of “official bilateral external debt”. This last concept includes the debt that the Argentine Republic has with creditors grouped together in the “Paris Club”.
|
-
|
Argentine Fund for Indebtedness Reduction. This Fund was created through Decree Nr. 298/10 in order to apply “freely available” reserves of the Central Bank to the payment of sovereign debt held by private creditors. This Fund is composed by the “freely available” reserves allocated for each fiscal year (for 2012, it amounts to almost U.S.$5.7 billion). Law Nr. 26,739 provides that this Fund will continue to operate until the purpose for which it was created has been fulfilled.
|
Supervision on a Consolidated Basis
The Argentine financial entities are subject to supervision in consolidated form by the Central Bank (irrespective of the observance on an individual basis of the regulations applicable thereto). In other words, the financial statements and other information regarding them must reflect the transactions of their head office as well as those of their branches in the country and abroad, and those of any local and foreign “significant subsidiaries”. Consequently, the requirements as to liquidity, solvency, minimum capital, risk concentration, and provisions for loan losses, among others, must be calculated on a consolidated basis.
From the above-mentioned communication it is clear that the financial institutions must submit certain information to the Central Bank, including the following:
|
§
|
financial statements and other quarterly and annual reports reflecting in consolidated form the transactions of the financial entity, its local and foreign branches and its local and foreign “significant subsidiaries” (as defined below); and
|
|
§
|
financial statements and other quarterly and annual reports reflecting in consolidated form the transactions of the financial entity, its local and foreign branches, its local and foreign “significant subsidiaries” (as defined below) or entities or companies in the country and abroad where the financial entity has possession or control over more than 12.5% of the shares entitled to vote, in those cases determined by the Superintendency, and those companies not subject to consolidated supervision which the financial entity may have chosen to include with the prior approval of the Superintendency.
|
For the purposes of these regulations:
|
§
|
A “subsidiary” of a local financial entity is any local or foreign financial entity or company in any of the following positions:
|
|
(1)
|
the local financial entity has direct or indirect control of more than 50% of the total votes of any instrument with voting rights in such entity or company,
|
|
(2)
|
the local financial entity has direct or indirect control as to determining by itself the composition of most of the management bodies of such entity or company, or
|
|
(3)
|
a majority of the directors of the local financial entity is also a majority of the directors of such entity or company.
|
The possession or control by the financial entity is considered indirect if exercised through another legal person, its controlling shareholders or directors appointed by such controlling shareholders or persons linked to them, in control of more than 50% –measured as a whole– of the total votes of any instrument with voting rights in another entity or company. Also considered indirect is any other form of control or interest where, in the opinion of the Superintendency, and even if the shareholders’ interest does not exceed 50%, a situation of control, and therefore the subsidiary character of an entity or company is configured or can be inferred from the evidence collected.
|
§
|
A “significant subsidiary” is any subsidiary:
|
|
(1)
|
whose assets, possible commitments and other transactions recorded in memorandum accounts represent 10% or more of the RPC of the local financial entity and its subsidiaries abroad; or
|
|
(2)
|
whose results of operations corresponding to the current fiscal year represent 10% or more of the results of operations for the current fiscal year of the local financial entity and its subsidiaries abroad.
|
Legal Reserve
The Central Bank requires that on an annual basis banks allocate a certain percentage of their net income, set by the Central Bank, to a legal reserve which is currently set at 20%. This reserve can only be used during periods in which a bank has incurred losses and has exhausted all unappropriated retained earnings and other reserves on profit. Banks may not pay dividends if the legal reserve has been impaired. However when the Legal Reserve is used to absorb losses, profits may be distributed if the balance prior to absorption were greater than 20% of the corporate capital plus capital adjustment, once this last amount is achieved.
Reserve Requirements and Liquidity Requirements
The minimum cash system determines what portion of their deposits or obligations the entities must keep available, that is to say, not as part of their lending capacity. The minimum cash requirement is calculated on the monthly average of daily balances for comprised obligations as recorded at the close of each calendar month, and must be observed separately for each currency of denomination and/or Government securities and instruments issued by de BCRA of the comprised obligations. Compliance must take place in the same currency of the requirement, except in the event of sight obligations for transfers from abroad in foreign currencies other than the U.S. dollar which must be accounted for in this currency, making use of one of the following:
|
(i)
|
current accounts in Pesos of the financial entities with the Central Bank;
|
|
(ii)
|
minimum cash accounts of the financial entities with the Central Bank, denominated in U.S. dollars or other foreign currencies;
|
|
(iii)
|
special guarantee accounts in favor of electronic clearing houses;
|
|
(iv)
|
current accounts of non banking financial institutions;
|
|
(v)
|
special current accounts (opened in the Central Bank) in connection with the attention of pension benefits; and
|
|
(vi)
|
minimum cash account of public securities and instruments issued by the Central Bank, at market value and of the same type.
|
As of April 1, 2012, cash and cash equivalents in pesos and foreign currencies are not considered as minimum cash payments.
Cash and cash equivalents in pesos as of March 31, 2012 net of excess payments in that currency will be considered as a special deduction from the requirement according to the following schedule:
|
Period
|
admitted %
|
|
|
September 2012
|
100
|
|
|
October and November 2012
|
75
|
|
|
From December 2012 to February 2013
|
25
|
|
|
As of March 2013
|
0
|
Cash and cash equivalents in foreign currencies will be considered as a lesser shortfall in the application of resources in foreign currencies, without exceeding such shortfall.
The requirement will be reduced according to the participation of the financing in pesos granted to MiPyMES in the total financing in pesos for the non-financial private sector, as indicated in the table below:
|
Participation of the financing to
MiPyMES in the total financing granted by the entity to the non-financial private sector.
In %
|
Deduction (on the total of items included in pesos).
In %
|
|
|
Less than 4
|
0.00
|
|
|
Between 4 and less than 6
|
0.25
|
|
|
Between 6 and less than 8
|
0.50
|
|
|
Between 8 and less than 10
|
0.75
|
|
|
Between 10 and less than 12
|
1.00
|
|
|
Between 12 and less than 14
|
1.25
|
|
Participation of the financing to
MiPyMES in the total financing granted by the entity to the non-financial private sector.
In %
|
Deduction (on the total of items included in pesos).
In %
|
|
|
Between 14 and less than 16
|
1.50
|
|
|
Between 16 and less than 18
|
1.75
|
|
|
Between 18 and less than 20
|
2.00
|
|
|
Between 20 and less than 22
|
2.25
|
|
|
Between 22 and less than 24
|
2.50
|
|
|
Between 24 and less than 26
|
2.65
|
|
|
Between 26 and less than 28
|
2.80
|
|
|
Between 28 and less than 30
|
2.90
|
|
|
30 or more
|
3.00
|
Likewise, in case of an excessive concentration of liabilities (in holders and/or terms), which implies a significant risk on the financial entity’s liquidity and/or an important negative effect on the system’s liquidity, additional minimum cash requirements may be imposed on the affected liabilities of the financial entity and/or any other measures considered relevant.
The balances of cash accounts opened with the Central Bank as eligible for cash integrations were only compensated up to the amounts corresponding to the legal requirements for forward transactions with no remuneration for any reserve in excess of those requirements.
The Central Bank set forth the application of different requirements for deposits in pesos as opposed to foreign currencies.
The following schedule indicates the minimum cash requirements for each type of account. In the case of transactions in pesos, the minimum cash requirements will depend on the category assigned to the location of the operating office where the deposit was made:
|
Oct /12– Nov/12
|
Dec /12– Feb/13
|
From Mar /13
|
||||||||||||||||||||||
| I |
II to VI
|
I |
II to VI
|
I |
II to VI
|
|||||||||||||||||||
|
Current accounts and sight accounts open in Credit Unions
|
18 | % | 17 | % | 17.5 | % | 16 | % | 17 | % | 15 | % | ||||||||||||
|
Other demand deposits, basic account and universal free account
|
||||||||||||||||||||||||
|
In pesos
|
18 | % | 17 | % | 17.5 | % | 16 | % | 17 | % | 15 | % | ||||||||||||
|
In foreign currency
|
20 | % | 20 | % | 20 | % | 20 | % | 20 | % | 20 | % | ||||||||||||
|
Savings accounts
|
||||||||||||||||||||||||
|
In pesos
|
18 | % | 17 | % | 17.5 | % | 16 | % | 17 | % | 15 | % | ||||||||||||
|
In foreign currency
|
20 | % | 20 | % | 20 | % | 20 | % | 20 | % | 20 | % | ||||||||||||
|
Unused balances from current account advances effected
|
18 | % | 17 | % | 17.5 | % | 16 | % | 17 | % | 15 | % | ||||||||||||
|
Current accounts of financial institutions
(1)
|
100 | % | 100 | % | 100 | % | 100 | % | 100 | % | 100 | % | ||||||||||||
|
Fixed-term deposits, bonds for acceptances (including liabilities for the sale or assignment of credits to subjects other than financial institutions), reverse repurchases, bonds and stock-exchange reverse swaps, investments at constant term, with advanced cancellation or renewal option
(2)
:
|
||||||||||||||||||||||||
|
In pesos
|
||||||||||||||||||||||||
|
Up to 29 days
|
13.5 | % | 13 | % | 13.25 | % | 12.25 | % | 13 | % | 12 | % | ||||||||||||
|
From 30 to 59 days
|
10.5 | % | 10 | % | 10.25 | % | 9.5 | % | 10 | % | 9 | % | ||||||||||||
|
From 60 to 89 days
|
6.5 | % | 6 | % | 6.25 | % | 5.5 | % | 6 | % | 5 | % | ||||||||||||
|
From 90 to 179 days
|
1.5 | % | 1 | % | 1.25 | % | 0.5 | % | 1 | % | 0 | % | ||||||||||||
|
From 180 to 365 days
|
0 | % | 0 | % | 0 | % | 0 | % | 0 | % | 0 | % | ||||||||||||
|
In foreign currency
|
||||||||||||||||||||||||
|
Up to 29 days
|
20 | % | 20 | % | 20 | % | 20 | % | 20 | % | 20 | % | ||||||||||||
|
From 30 to 59 days
|
15 | % | 15 | % | 15 | % | 15 | % | 15 | % | 15 | % | ||||||||||||
|
From 60 to 89 days
|
10 | % | 10 | % | 10 | % | 10 | % | 10 | % | 10 | % | ||||||||||||
|
From 90 to 179 days
|
5 | % | 5 | % | 5 | % | 5 | % | 5 | % | 5 | % | ||||||||||||
|
From 180 to 365 days
|
2 | % | 2 | % | 2 | % | 2 | % | 2 | % | 2 | % | ||||||||||||
|
More than 365 days
|
0 | % | 0 | % | 0 | % | 0 | % | 0 | % | 0 | % | ||||||||||||
|
Bonds for foreign financial lines
|
0 | % | 0 | % | 0 | % | 0 | % | 0 | % | 0 | % | ||||||||||||
|
Debt securities (including corporate bonds)
|
||||||||||||||||||||||||
|
a) Debt issued as of January 1, 2002, including those from restructured bonds, as per their residual term:
|
||||||||||||||||||||||||
|
In pesos
|
||||||||||||||||||||||||
|
Up to 29 days
|
14 | % | 14 | % | 14 | % | 14 | % | 14 | % | 14 | % | ||||||||||||
|
From 30 to 59
|
11 | % | 11 | % | 11 | % | 11 | % | 11 | % | 11 | % | ||||||||||||
|
From 60 to 89 days
|
7 | % | 7 | % | 7 | % | 7 | % | 7 | % | 7 | % | ||||||||||||
|
Oct /12– Nov/12
|
Dec /12– Feb/13
|
From Mar /13
|
||||||||||||||||||||||
| I |
II to VI
|
I |
II to VI
|
I |
II to VI
|
|||||||||||||||||||
|
From 90 to 179 days
|
2 | % | 2 | % | 2 | % | 2 | % | 2 | % | 2 | % | ||||||||||||
|
From 180 to 365 days
|
0 | % | 0 | % | 0 | % | 0 | % | 0 | % | 0 | % | ||||||||||||
|
In foreign currency
|
||||||||||||||||||||||||
|
Up to 29 days
|
20 | % | 20 | % | 20 | % | 20 | % | 20 | % | 20 | % | ||||||||||||
|
From 30 to 59
|
15 | % | 15 | % | 15 | % | 15 | % | 15 | % | 15 | % | ||||||||||||
|
From 60 to 89 days
|
10 | % | 10 | % | 10 | % | 10 | % | 10 | % | 10 | % | ||||||||||||
|
From 90 to 179 days
|
5 | % | 5 | % | 5 | % | 5 | % | 5 | % | 5 | % | ||||||||||||
|
From 180 to 365 days
|
2 | % | 2 | % | 2 | % | 2 | % | 2 | % | 2 | % | ||||||||||||
|
More than 365 days
|
0 | % | 0 | % | 0 | % | 0 | % | 0 | % | 0 | % | ||||||||||||
|
b) Others
|
0 | % | 0 | % | 0 | % | 0 | % | 0 | % | 0 | % | ||||||||||||
|
Bonds with the Trust Fund for Assistance to Financial and Insurance Institutions
|
0 | % | 0 | % | 0 | % | 0 | % | 0 | % | 0 | % | ||||||||||||
|
Sight and term deposits made by judicial order with funds originated in legal actions currently under course and their immobilized balances
|
||||||||||||||||||||||||
|
In pesos
|
10 | % | 10 | % | 10 | % | 10 | % | 10 | % | 10 | % | ||||||||||||
|
In foreign currency
|
10 | % | 10 | % | 10 | % | 10 | % | 10 | % | 10 | % | ||||||||||||
|
Mutual Funds deposits (except mutual funds sight deposits made according to CNV rules)
|
||||||||||||||||||||||||
|
In pesos
|
19 | % | 19 | % | 19 | % | 19 | % | 19 | % | 19 | % | ||||||||||||
|
In foreign currency
|
20 | % | 20 | % | 20 | % | 20 | % | 20 | % | 20 | % | ||||||||||||
|
Special deposits related to funds revenues from abroad – Decree Nr. 616/05
|
100 | % | 100 | % | 100 | % | 100 | % | 100 | % | 100 | % | ||||||||||||
|
Deposits and other demand obligations in pesos, whose return exceeds 15% BADLAR rate of private financial institutions’ average
|
100 | % | 100 | % | 100 | % | 100 | % | — | — | ||||||||||||||
|
Term investments instrumented by nominative non-transferable certificates in pesos corresponding to public sector security holders, entitled to exercise the prepayment option within a term not greater than 30 days after constitution thereof
|
15.5 | % | 15 | % | 15.25 | % | 14. 5 | % | 15 | % | 14 | % | ||||||||||||
In addition to the above mentioned requirements, the following requirement must be observed:
|
§
|
100% reserve for any defect in the application of resources in foreign currency for the month in respect to which the calculation of the minimum cash requirement is made. See
“Item 4. Information on the Company—The Argentine Banking System and its Regulatory Framework—Lending Capacity Provided by Deposits in Foreign Currency”
.
|
Lending Capacity Provided by Deposits in Foreign Currency
The lending capacity provided by deposits denominated in foreign currency must be applied in the denomination of the currency of the deposits. This includes those deposits denominated in dollars and payable in pesos and applies to the following purposes:
|
(1)
|
Prefinancing and financing of exports, carried out directly or through agents, consignees or other proxies acting for the account and order of the owner of the goods. It also comprises operations to finance suppliers of services to be directly exported. This comprises those operations for the purpose of financing working capital and/or the acquisition of objects related to the production of goods to be exported, provided the flow of income in foreign currency deriving from such exports is sufficient to settle such transactions.
|
|
(2)
|
Financing transactions granted to goods, producers or processors, provided they have firm sale contracts for the goods to be produced for an exporter, with prices fixed or to be fixed in a foreign currency (regardless of the currency in which the transaction is settled) and involving fungible goods with a regular and customary quotation in foreign currency which is widely known and easily accessed by the public in local or international markets. In all cases of term purchase and sale agreements for a price to be fixed, such price must be in direct relation with the price of such products in local markets. It also comprises transactions to finance suppliers of services directly used in the process of exporting goods.
|
|
(3)
|
Financing transactions for producers of goods to be exported, either in the same condition or as part of other goods, by third-party purchasers, provided they have total pledges or guarantees in foreign currency from such third parties.
|
|
(4)
|
Financing of investment projects, working capital and/or the acquisition of any kind of goods, including temporary importation of commodities, which may increase or be related to the production of goods for exportation. Even though income from exporter companies does not totally derive from sales abroad, financing may only be allocated if the income flow deriving from exportation is sufficient.
|
It comprises those transactions where financing is granted via the Bank’s participation in “syndicated loans”, be they with local or foreign entities.
|
(5)
|
Financing to clients from the commercial portfolio and of a commercial nature who receive treatment for their consumption or housing credits –under the provisions of the “Debtors’ Classification” regulations–destined for the importation of capital goods (“BK” according to the Common Nomenclature for the MERCOSUR attached as Annex I to Decree Nr. 690/02 and other complementary provisions) which will result in an increase in the production of goods destined for domestic consumption. In order to grant such financing, the financial entities must verify that their clients have sufficient paying capacity considering at least two scenarios which contemplate significant exchange rate variations within a term of up to one year and which, in either case, exceed the latest estimate available resulting from the “Market Expectations Survey” published by this institution (in force since December 9, 2005 under Central Bank Communication “A” 4453, and supplementary regulations).
|
|
(6)
|
Debt securities or certificates of participation in financial trusts -including other collection rights specifically acknowledged in the trust agreement to be constituted within the within the framework of loans established by multilateral credit institutions of which Argentina is a party whose assets under management are loans originated by financial entities under the terms described in points (1) through (3) above and the first paragraph of point (4).
|
|
(7)
|
Debt securities or certificates of participation in financial trusts, issued in foreign currency and with public offer authorized by the CNV, whose assets under management are documents guaranteed by mutual guarantee companies or by provincial funds created for the same purpose, and admitted by the Central Bank, acquired by the trustee for the purpose of financing transactions under the terms and conditions described in points (1) through (3) above.
|
|
(8)
|
Financing transactions for purposes other than mentioned in points (1) to (3) above and the first paragraph of point (4), included in the credit program “IDB Loan Nr. 1192/OC-AR”, without exceeding 10% of the lending capacity.
|
|
(9)
|
Interfinancing loans (any interfinancing loans granted with such resources must be identified).
|
The lending capacity will result from the sum of all deposits in foreign currency plus all inter-financial loans received originated in the lending capacity for this type of deposit, after deduction of the minimum reserve requirements applicable to deposits.
Any deficiencies in the application of foreign currency lending capacity, net of a portion of: (i) cash balances, (ii) cash under custody in other financial entities, (iii) cash in transit and (iv) cash with armored car transport companies (not computed as integration of the minimum cash exigency for application of the existing limit), requires an equivalent increase in the minimum cash requirement.
Limitations on Types of Business
Argentine commercial banks may conduct all activities and operations that are not specifically prohibited by law or by regulations of the Central Bank. Banks are permitted, among other things, to:
|
§
|
make loans in pesos and foreign currency,
|
|
§
|
receive deposits in pesos and foreign currency,
|
|
§
|
issue guarantees,
|
|
§
|
underwrite, place and broker equity and debt securities in the over-the-counter market, subject to the prior approval of the CNV,
|
|
§
|
conduct transactions in foreign currency,
|
|
§
|
act as fiduciary, and
|
|
§
|
issue credit cards.
|
According to the Financial Institutions Law, banks in Argentina are prohibited from investing in commercial, industrial or agricultural entities, or other entities without the express authorization of the Central Bank. The Central Bank may then impose conditions and limits to guarantee the safety and soundness of the financial institutions.
These limitations include:
|
|
§
|
the prohibition of a bank from pledging its shares,
|
|
|
§
|
restriction on incurring any liens upon its properties without prior approval from the Central Bank, and
|
|
|
§
|
limitations on transactions with directors or officers, including any company or person related to such directors or officers, on terms more favorable than those normally provided to clients. See
“Item 4. Information on the Company—The Argentine Banking System and its Regulatory Framework—Lending and Investment Limits—Related Persons”
below in this section.
|
Notwithstanding the foregoing, banks may own shares in other financial institutions with prior approval of the Central Bank and in public service companies if necessary to obtain those services.
Capital Adequacy Requirements
Basel Accord
In July 1988, the Basel Committee on Banking Regulations and Supervisory Practices (the “Basel Committee” or “BCBS”), which includes the supervisory authorities of twelve major industrial countries, adopted an international framework (the “Basel Accord”) for capital measurement and capital standards of banking institutions.
In 2007 the Central Bank published its road map for the implementation of the capital adequacy requirements contained in the document “International Convergence of Capital Measurement and Capital Standards”, issued by the Basel Committee and known as Basel II. The first stages were carried out as planned: publication of best practices for risk management, seminars, review of supervision processes on the basis of the best practices being encouraged by the BCBS, analysis of the areas subject to “national discretion” in the calculation of regulatory capital, and publication of the text “Guidelines for Operational Risk Management in Financial Institutions”.
Following the sub-prime lending crisis that spread in 2008 and 2009, the BCBS published in December 2010 a set of measures known as Basel III, designed to increase the capacity of the system to absorb shocks from stress situations and improve risk management and the transparency of bank disclosures.
Basel III incorporates the terms of Basel II, contained in three “pillars”:
|
|
-
|
Pillar 1 provides supervisors with a number of options to quantify capital requirements for credit, operational and market risk, and define which components of an institution’s net worth are eligible to satisfy those requirements.
|
|
|
-
|
Pillar 2 describes the process to be followed by institutions to evaluate the sufficiency of their capital in relation to their risk profile.
|
|
|
-
|
Pillar 3 establishes minimum information requirements that financial institutions must provide on the adequacy of their capital.
|
|
|
§
|
Minimum Capital
|
Since the introduction of Basel I, financial institutions must keep an amount of total capital not less than 8% of their risk weighted assets. Items going towards compliance with this capital requirement are classified in two groups:
|
|
-
|
Core capital (Tier 1), and
|
|
|
-
|
Supplementary capital (Tier 2).
|
According to Basel II, at least half of the capital requirement should be composed of core capital, preferably common equity, a category that includes both common shares and retained earnings.
Had the Basel Accord been applied to us at December 31, 2012, our Total Capital would have been approximately 1.42 times the minimum required.
Basel III establishes more demanding requirements, as banks must comply with three minimum ratios in relation to their risk-weighted assets:
|
|
-
|
4.5% for common equity (for which the qualifying criteria are more restrictive than for Basel II),
|
|
|
-
|
6% for Tier 1 capital, and
|
|
|
-
|
8% for total capital.
|
These new capital composition requirements ensure that there will be greater capacity to absorb losses in stress situations. It should be noted that although international standards foresee a gradual implementation of these three requirements as from 2013, in Argentina the average current composition of financial institutions’ net worth ensures that the total capital could be met out of common shares and reserves.
|
|
§
|
Capital Conservation Buffer
|
The so-called capital conservation buffer imposes an additional capital requirement equivalent to 2.5% of risk-weighted assets that must be satisfied by common equity. Its purpose is to be able to count on sufficient reserves to absorb additional losses generated at times of economic and financial stress. In fiscal years in which the common equity is less than 7% of risk-weighted assets (the 4.5% base requirement plus the new conservation buffer), rising constraints are established for financial institutions, that will not be able to pay dividends, award discretionary bonuses or perform share buybacks.
In Argentina the financial system operates with a considerable capital excess. Furthermore, the current system for the retention of earnings leads to a capital integration excess.
|
|
§
|
Countercyclical Capital Buffer
|
The goal of the countercyclical capital buffer is to offset the procyclical nature of the financial system. In times of exceptional credit growth at aggregate level, financial institutions will be required to boost the level of their common equity by up to 2.5% of risk-weighted assets.
|
|
§
|
Leverage Ratio
|
Basel III complements risk weighted asset capital requirements with a limit on total leverage. This limit, known as the leverage ratio, is the ratio between core capital (Tier 1) and total assets without risk weighting, both on and off balance sheet, plus derivatives. At international level, this ratio has initially been set at 3%. In Argentina, financial institutions record a leverage lower than the proposed maximum. Although Basel II establishes a capital requirement for the market risk generated by foreign currency positions, no cap is placed on them. On the other hand, Basel III introduces a limit through the leverage ratio, set in relation to total exposure regardless of the currency in which the assets are stated. Argentine regulations limit direct exposure to currency risk. Furthermore, with the aim of preventing the indirect exposure generated by the granting of loans denominated in foreign currency to agents whose income is in pesos, regulations in Argentina only allow funds obtained from deposits in foreign currency to be lent to customers who generate income in the same currency.
|
|
§
|
Macroprudential Supervision
|
The reforms introduced by Basel III have two main objectives. One is; to ensure that individual banks can show resilience in periods of stress, known as “microprudential”; and the other one, complementary and broader, to discourage the building up of risks across the banking sector, as well as their procyclical amplification, known as “macroprudential”.
As part of its “macroprudential” policy, Argentina has introduced a mandatory 30% reserve requirement on short-term funds from abroad that are not intended for direct investment.
|
|
§
|
Liquidity Coverage Ratio
|
The LCR is based on the methodologies used by international banks. It will be calibrated so that financial institutions can tolerate stress scenarios over a thirty-day period. Once again, requirements in force for our own financial system are stricter than those established by the international standard.
|
|
§
|
Net Stable Funding Ratio
|
The NSFR will be calibrated on the basis of long-term liquidity and structural mismatching in the composition of sources of funding. The design of the NSFR is based on net liquid assets and liquid capital methodologies used by internationally active banks. Banks should hold sufficient stable sources of funding (net worth and long-term liabilities) to fund the proportion of their assets that they cannot monetize within a term of one year.
|
|
§
|
Intensive Supervision of Systemically Important Institutions
|
The Financial Stability Board (“FSB”) and the BCBS are working on the design of an appropriate regulatory framework for global systemically important financial institutions (G-SIFIs). Alternatives being evaluated include setting more demanding capital requirements than those foreseen by Basel III.
In line with the commitments assumed, the BCRA has been working on the implementation of the terms of Basel III, adapting them to take into account the particular conditions in emerging countries, experience gained from the financial and banking crises suffered by Argentina, the characteristics of our financial system and current legislation.
In May 2011 the BCRA resumed its preparatory work for the implementation of Basel II. The stages already completed were supplemented by Communication “A” 5203 containing the “Guidelines for Risk Management in Financial Institutions” and by systemic impact tests related to the adoption of standardised approaches for the calculation of credit and operational risk capital requirements.
Publication of Internal Adequacy Assessment Process standards and Supervisory Review and Evaluation Process pilot tests will take place as from 2013, the year in which the implementation of the Basel III will star unless the international agenda is modified. These activities will be additional to the observation and supervision of leverage and liquidity that should be carried out during the rest of this year and next year.
Central Bank Rules
Under the Financial Institutions Law, Argentine financial institutions must comply at all times with the minimum capital requirements described by the Central Bank. In July 1991, the Central Bank amended its minimum capital adequacy rules to follow those recommended by the Basel Committee more closely. However, the Central Bank’s capital adequacy rules remain stricter than the Basel Committee’s recommendations. Under rules issued by the Central Bank in July 1993 and its amendments, a commercial bank must maintain its “Minimum Capital” above a certain level.
“Minimum Capital” is equal to:
“Basic Net Worth”, which includes:
|
|
(1)
|
Capital stock,
|
|
|
(2)
|
Capital adjustments,
|
|
|
(3)
|
Reserves and irrevocable capital contributions,
|
|
|
(4)
|
Unappropriated earnings,
|
|
|
(5)
|
Representative instruments of debt, and
|
|
|
(6)
|
Third parties’ participations for those corporations subject to a supervision system on a consolidated basis;
|
Minus:
Balances favorable to the entity as registered in the assets, corresponding to the minimum presumed income tax for such portion as exceeds 10% of the basic net equity without computing this item, or 10% of the Bank’s RPC for the preceding period, whichever is smaller;
Plus:
“Complementary Net Worth”, which includes 50% of loan loss provisions for loans to borrowers classified as “Normal” under Central Bank rules, certain subordinated debt and certain unaudited net income, minus unaudited losses and certain items such as permanent investments in other financial institutions and intangible assets.
As of February 1, 2013, by Communication “A” 5369 of the BCRA, Minimum Capital shall be equal to Basic Net Equity plus Complementary Net Equity.
Basic Net Equity includes:
|
|
§
|
Ordinary Capital Level 1:
|
|
|
a)
|
Corporate capital (excepting preferred shares);
|
|
|
b)
|
Non-capitalized contributions (excepting share premiums);
|
|
|
c)
|
Equity adjustments;
|
|
|
d)
|
Reserve (excepting the special reserve for debt instruments);
|
|
|
e)
|
Retained earnings;
|
|
|
f)
|
Other results (either positive or negative);
|
|
|
g)
|
Share premiums for instruments included in Ordinary Capital Level 1; and
|
|
|
h)
|
Third-party participations for those companies subject to consolidated supervision systems.
|
|
|
§
|
Additional Capital Level 1:
|
|
|
a)
|
Instruments issued by the financial entity and not included in Ordinary Capital Level 1;
|
|
|
b)
|
Share premiums for instruments included in Additional Capital Level 1;
|
|
|
c)
|
Instruments issued by subsidiaries in the hands of third parties not included in Ordinary Capital Level 1 for those companies subject to consolidated supervision systems.
|
Less: certain deductible items.
“Complementary Net Equity” includes:
|
|
a)
|
Instruments issued by the financial entity and not included in the Basic Net Equity;
|
|
|
b)
|
Share premiums for instruments included in the Complementary Net Equity;
|
|
|
c)
|
Allowances for loan losses from the portfolio of debtors classified as in “normal” situation which do not exceed 1.25% of the credit-risk-weighted assets.
|
|
|
d)
|
Instruments issued by subsidiaries in the hands of third parties not included in the Basic Net Equity for those companies subject to consolidated supervision systems.
|
Less: certain deductible items.
Minimum limits are also established to be observed by the Ordinary Capital Level 1, the Basic Net Equity and the Minimum Capital. Those limits will be 4.5%, 6% and 8% of the risk-weighted assets, respectively. Noncompliance with these minimum levels will be considered as noncompliance with the minimum capital payment.
Minimum Capital must be, at least, the greater of:
|
|
§
|
Minimum basic capital, and
|
|
|
§
|
The sum of minimum capital required for credit risk, market risk, interest rate risk and operational risk.
|
Differential requirements were established for banks and other financial entities, mainly based on the area where their head offices are located, in order to benefit those areas with smaller banking coverage according to Central Bank criteria, which now enjoy less stringent requirements with respect to minimum basic capital. In addition, those banks which act as custodians and/or registration agents of securities representing the investments of the retirement and pension funds and/or as registration agents for registered mortgage letters must certify a minimum capital equal to or above the greater of Ps.400 million or the equivalent of 1% of the securities under custody (in the case of mortgage letters, considering the net value of any amortizations effected).
Minimum Capital Requirement for Credit Risk:
it is the sum of:
|
|
(a)
|
10% of the value of our fixed or illiquid assets;
|
|
|
(b)
|
8% of the value of certain categories of financial or liquid assets, net of certain allowances and reserves, multiplied by a coefficient based on the perceived risk of such assets; and
|
|
|
(c)
|
8% of certain assets of the non-financial public sector under special valuation criteria determined by the Central Bank.
|
The sum of (a), (b) and (c) shall then be multiplied by a second coefficient ranging from 0.970 to 1.15 based on the rating that the Superintendency grants to the bank based on the its net worth, asset quality, management, profitability and liquidity. To determine a bank’s risk-weighted assets, the Central Bank has assigned to each category of liquid asset a risk value based on the type of asset, borrower, collateral or guarantee, if any. For example, consider the risk values assigned to the following assets:
|
|
§
|
cash, gold, public securities subject to minimum capital requirements for market risk, and debt instruments issued by the Central Bank were assigned a 0% risk value;
|
|
|
§
|
correspondents’ accounts and other accounts at sight with banks of the country and abroad rated as “investment grade” and bonds issued by governments of member countries of the Organization of Economic Cooperation and Development (“OECD”), which are internationally rated “AA” or higher, were assigned a 20% risk value;
|
|
|
§
|
debt instruments issued by Argentine provinces, municipalities or other public sector agencies, which are not expressly guaranteed by the Federal Government were assigned a 100% risk value;
|
|
|
§
|
loans to the non-financial private sector with preferred guarantees in cash, gold or bonds on fixed-term deposit certificates issued by the creditor entity itself and with automatic reimbursements for export transactions corresponding to multilateral and bilateral foreign trade agreements were assigned a 0% risk value;
|
|
|
§
|
loans to the non-financial private sector with preferred guarantees granted by mutual guarantee companies registered with the Central Bank, export credit insurance policies and documentary credits in use were assigned a 50% risk value;
|
|
|
§
|
purchase money, home mortgage loans and automobile-backed loans were assigned a 50% risk value, provided they do not exceed 75% of their appraisal value;
|
|
|
§
|
the amount of a loan exceeding 75% of their appraisal value and most unsecured loans and debt instruments as well as holdings of listed stock were assigned a 100% risk value; and
|
|
|
§
|
loans to the non-financial public sector not guaranteed by the Federal Government were assigned a 100% risk value.
|
The Central Bank introduced by Communication “A” 3986, effective as of January 2004, the application of a correction coefficient (ALFA 1) for the purpose of temporarily reducing the minimum capital requirement for credit risk with respect to certain assets and financing transactions granted to the non-financial public sector until to May 31, 2003. The coefficient for the periods covered in this report is:
|
Period
|
ALFA1
|
|
January / December 2008
|
0.75
|
|
From January 2009
|
1.00
|
Any excesses incurred for noncompliance with other technical regulations must be added to the credit risk requirement calculated as indicated in the preceding paragraphs. Finally, commencing on February 1, 2007, the increase for extension of the global negative net position in foreign exchange must be added to the credit risk requirement. See
“Item 4. Information on the Company—The Argentine Banking System and its Regulatory Framework—Foreign Currency Position”.
As of January 1, 2013, by Communication “A” 5369 of the BCRA, the Minimum Capital Requirement for Credit Risk will be determined as the summation of:
|
|
(a)
|
8% of the summation of credit-risk-weighted asset transactions without delivery against payment;
|
The risk-weighters table is reformulated with new items and weighters, and with a new scheme. A summary of them will include, among others:
|
|
-
|
Within the “Cash and cash equivalents” item, the cash on hand, in transit (if the financial entity assumes the transportation risk and liability) and in automated teller machines (weighted at 0%); and the cash items in the process of being received (collectible cheques and drafts), cash in treasury transporting companies and cash in custody of financial entities (20%).
|
|
|
-
|
Exposure to governments and central banks (with weighters from 0% to 100%)
|
|
|
-
|
Exposure to Multilateral Development Banks (with weighters from 0% to 100%)
|
|
|
-
|
Exposure to financial entities in the country (with weighters from 20% to 100%)
|
|
|
-
|
Exposure to financial entities from abroad (100%).
|
|
|
-
|
Exposure to companies and other legal persons in the country and abroad –including foreign-exchange dealers, insurance companies, stock exchanges and local companies treated as part of the non-financial private sector (100%)
|
|
|
-
|
Exposures included in the retail portfolio (with weighters from 75% to 100%)
|
|
|
-
|
Mortgage-guaranteed financing, which, subject to certain conditions, has weighters between 35% and 100%
|
|
|
-
|
Loans more than 90 days in arrears (with weighters from 50% to 150%)
|
|
|
(b)
|
failed delivery-against-payment transactions; and
|
|
|
(c)
|
requirement for counterpart credit risk in transactions with over-the-counter derivatives
|
The sum of (a), (b) and (c) will be multiplied by a coefficient which varies from 1 to 1.19 based on the rating the entity is granted by the Superintendence.
Whatever excesses incurred by noncompliance with other technical regulations must be added to the credit risk requirement.
Likewise, any increase by expansion of the general limit for global negative net position in foreign currency must be added to the credit risk requirement.
It is resolved, effective until December 2013, that if by application of Communication “A” 5369, there should result a requirement that is lesser than that determined for its payment as at January 1, 2013, then the financial entity must compute the latter and apply the difference to the following month in which this situation is observed for the destinations detailed below, in succession and according to the indicated order of priorities:
|
|
(i)
|
Cancellation of franchises granted for payment of the credit risk requirement
|
|
|
(ii)
|
Payment of the proportion of operational risk requirement not carried out by application of the schedule established in clause 10.3.2. of Section 10 “Temporary Provisions” of the regulations about “Minimum capitals for financial entities”.
|
|
|
(iii)
|
Reduction of the credit risk requirement on financing transactions granted by the entity as of the said date whose destination, currency and terms are as foreseen in clauses 3.1. and 3.3. of the regulations on the “Credit line for productive investment” (provided they shall have not been charged as minimum application under such system) and/or mortgage loans for families’ only and permanently inhabited houses, for the term of the financing transactions.
|
Minimum Capital Requirement for Market Risk:
the Central Bank implemented, effective from September 1, 1996, additional minimum capital requirements in relation to market risk associated with positions held by financial institutions in “local assets”, “foreign assets”, “foreign currency” and “gold”, including derivatives bought or sold on such positions.
“Local Assets” include:
|
|
§
|
debt securities issued by the Federal Government and instruments of monetary regulation of the BCRA included in the list of volatilities recorded at fair value and quotas in common investment funds that invest in those securities; and
|
|
|
§
|
shares of capital stock of Argentine companies included in the Argentine stock market index (or “Merval Index”) and quotas in common investment funds that invest in those shares.
|
“Foreign Assets” are defined to include:
|
|
§
|
debt securities (including positions held in debt securities issued by foreign companies, sovereign securities issued by foreign governments and quotas in common investment funds; provided that, such securities and/or holdings are usually listed on a national securities exchange); and
|
|
|
§
|
shares (including positions held in shares of capital stock of foreign companies, quotas in common investment funds; provided that, such securities, holdings and/or indexes are usually listed on a national securities exchange). If any of the assets mentioned in this clause are listed in different stock markets in diverse foreign currencies, the listing price and foreign currency of the most representative stock market (in terms of the volume of transactions in the relevant asset) will be taken into consideration for purposes of these new capital requirements.
|
The positions under consideration must be separated according to the currency of issue of each instrument, regardless of the issuer’s residence. In the cases of assets expressed in foreign currency, the entity must consider the risk for two positions: that which corresponds to the assets and the position in foreign currency, the relevant capital requirement being determined on the basis of the latter. The value of all positions will be expressed in pesos by using the reference exchange rate published by the Central Bank for the U.S. dollar, after application of the swap rate corresponding to the other currencies.
“Foreign currency” includes the net positions for each foreign currency, considering the totality of assets and liabilities in such currencies, and the gold position. Those positions in foreign currency which, individually considered at the close of each day of transactions, are below the equivalent of Ps.300,000 may be excluded. This exclusion will not apply if the computable foreign currencies considered as a whole at the close of each day exceeds Ps.1,500,000. Purchase or sale of contracts that give the right to buy or sell local assets and foreign assets are taken into consideration in calculating minimum capital requirements. The swaps and other derivatives on assets not affected by these regulations will be excluded from the portfolios that are subject to risk value calculation, provided such transactions are for the purpose of covering financial intermediation risks.
The market risk-related capital requirements are determined by using specific risk methodologies and are based on the financial institution’s daily net positions in any of the above-mentioned assets. These requirements follow, in general, standards established by the Basel Committee and the European Union.
Minimum Capital Requirement for Rate Risk:
extends to all assets and liabilities for financial intermediation not included in the computation of market risk. It tries to capture the risk arising when sensitivity of the asset to changes in the interest rate does not match with that related with the liabilities.
The BCRA abrogated effective since January 1, 2013 the regulations on minimum capital for rate risk. Even so, the financial entities must continue to manage such risk, and will be subject to revision by the Superintendence, which may determine the need to pay a higher amount of capital.
Minimum Capital Requirement for Operational Risk:
it is defined as the risk of loss resulting from inadequate or failed internal processes, people and systems or from external events. The definition includes legal risk but excludes strategic and reputational risk. Financial entities must establish a system for the management of Operational Risk that includes policies, processes, procedures and the structure for their adequate management.
Seven operational risks event types are defined, according to internationally accepted criteria:
|
|
§
|
internal fraud;
|
|
|
§
|
external fraud;
|
|
|
§
|
employment practices and workplace safety;
|
|
|
§
|
clients, products and business practices;
|
|
|
§
|
damage to physical assets, resulting from acts of terrorism and vandalism, earthquakes, fire or flood;
|
|
|
§
|
business disruption and system failures; and
|
|
|
§
|
execution, delivery and process management.
|
The Operational Risk management process comprises the following stages:
|
1.
|
Identification and assessment: the identification process should consider both internal and external factors that could adversely affect the development of the processes and projections done according to the business strategies defined by the bank.
|
|
2.
|
Monitoring: an effective monitoring process is required, to quickly detect and correct deficiencies in the policies, processes and procedures for managing Operational Risk. In addition, the development of indicators should be analysed to detect deficiencies and undertake corrective actions.
|
|
3.
|
Control and mitigation: financial entities must have an appropriate control system to ensure compliance with internal policies, and they should re-examine control and operational risk reduction strategies with at least an
annual frequency in order to make the necessary adjustments.
|
Financial institutions should be able to count on contingency plans and business continuity programmes that are in accordance with the size and complexity of their operations, to ensure the continuity of their operating capacity and reduction of losses in the event of a business interruption.
The BCRA by Communication “A” 5282 established that the additional capital requirement for operational risk (which is added to the credit risk and market risk requirements) is equivalent to 15% of the average of positive gross income for the last three years.
This calculation will be made on a monthly basis by taking three periods of 12 consecutive months in which gross income was positive, considering the last 36 months preceding the month in which the calculation is made.
Gross Income is defined as the sum of:
|
|
(i)
|
financial and service income less financial and service charges, and
|
|
|
(ii)
|
other profits less other losses.
|
The following items, however, must be excluded, as applicable, from the accounting entries mentioned in (i) and (ii) above:
|
|
-
|
charges originated in the constitution of allowances, the cancellation of allowances from previous financial years and credits recovered in the financial year which were punished in previous years;
|
|
|
-
|
the result from participations in financial entities and in companies, to the extent that these may be items deductible from the computable equity liability;
|
|
|
-
|
extraordinary or irregular items –namely those originated in atypical and exceptional results occurred during the period, of infrequent occurrence in the past and not expected for the future–, including income from the collection or insurance (loss recoveries); and
|
|
|
-
|
results from the sale of items included in Section 2 of the regulations on “valuation of instruments of non-financial public sector debts and of monetary regulation issued by the BCRA".
|
According to the Central Bank regulations on minimum capital requirements, the financial entities must adjust to such regulations on an individual and consolidated basis.
The Bank fully complied on an individual and consolidated basis with the ratios for minimum capital. If a financial institution does not comply with all these minimum capital requirements, it must submit a regulatory and restructuring plan to the Central Bank, which may impose various penalties, including:
|
|
§
|
temporary limitation on the amount of deposits a bank may accept;
|
|
|
§
|
institutional restrictions as per expansion capacity and dividends distribution in cash;
|
|
|
§
|
revocation of the license of a bank to conduct foreign exchange transactions; and, in some extreme cases;
|
|
|
§
|
revocation of the license of a bank to operate.
|
The following table presents, at December 31, 2012, both the calculation of our ratio of capital to risk-weighted assets computed under the Basel Accord and our capital under the minimum capital rules of the Central Bank. In addition, see Note 21.12 to the Consolidated Financial Statements.
|
|
December 31, 2012
|
|
|
(in millions of Pesos, except percentages)
|
|
Basel Accord
|
|
|
Total capital
|
5,131.3
|
|
Risk-weighted assets
|
45,136.8
|
|
Ratio of total capital to risk-weighted assets
(1)
|
11.4%
|
|
Required capital
|
3,610.9
|
|
Excess capital
|
1,520.4
|
|
Central Bank’s Rules
(2)
|
|
|
Total capital
|
5,289.9
|
|
Risk and Fixed weighted assets
|
30,251.8
|
|
Ratio of total capital to risk-weighted assets
(3)
|
17.5%
|
|
Required capital
(4)
|
3,591.3
|
|
Excess capital
|
1,698.6
|
| _____________________ |
|
|
(1)
|
Under the risk-based capital requirements of the Basel Accord, the Bank would be required to maintain a minimum ratio of total capital to risk-weighted assets of 8%.
|
|
|
(2)
|
Calculated on a consolidated basis in accordance with Central Bank requirements.
|
|
|
(3)
|
Under the risk-based capital requirements of the Central Bank, we are required to maintain a minimum ratio of total capital to risk and fixed weighted assets of 10% and 8% (depending upon the nature of the asset) by application of an alpha correction factor equal to 0.05 over financing to the national public sector granted up to May 31, 2003.
|
|
|
(4)
|
The Bank must maintain a surplus of minimum paid-in capital amounting to at least Ps.106.9 million, equivalent to 0.25% of the amount of values under custody for securities representing investments from pension funds, as well as in connection with its function as register of mortgage-backed bonds, invested in national public securities and other destinations authorized by the BCRA and guaranteed in favor of the given entity.
|
Rule on valuation of public sector debt instruments and BCRA’s monetary regulation instruments
The holdings of Government securities and instruments issued by the Central Bank may be valued: (i) at fair value or (ii) at cost value increased according to their internal rate of return.
|
§
|
Fair value: includes government securities and monetary regulation instruments contemplated in the monthly list of volatilities or present value published by the BCRA, as well as debt instruments of trusts whose underlying assets are constituted by these assets.
|
They will be recorded at their market value or present value.
They will be used for trading unless the entities expressly choose to value at cost value increased according to their internal rate of return.
|
§
|
Cost value increased according to their internal rate of return: comprising (i) government bonds received under the provisions of Articles 28 and 29 of Decree Nr. 905/02 and in Chapter II of Law Nr. 25,796, unless at February 28, 2011 and subsequently the entity decides to value them at market value; (ii) federal governmental loans issued by the Government under Decree Nr. 1387/01 and notes with similar conditions to the issuance of government securities; (iii) debt instruments (which have not been acquired in the secondary market) signed by the entities as of January 1, 2009 through an exchange, or payment in exchange for other debt instruments expressly admitted, unless at February 28, 2011 and subsequently the entity decides to value them at market value; (iv) monetary regulation instruments of the BCRA which are not covered in the list of volatilities published by that institution; (v) securities which are not covered in the list of volatilities published by the BCRA, not included in point (iii) above; (vi) public sector financing existing at March 31, 2003 (except securities and guarantees loans); (vii) other public sector financing after March 31, 2003; (viii) debt instruments of trusts whose underlying assets are constituted by one of the instruments listed in the preceding points; and (ix) securities that can be valued at fair value and the entity decides to value at cost increased according to their internal rate of return.
|
They will be recorded at their incorporation value increased monthly by the internal rate of return.
CAMEL Quality Rating System
Under Law Nr. 24,144, the Central Bank established the “CAMEL” quality rating system which is based on weighting consistent and comparable criteria, creditworthiness, compliance with the Financial Institutions Law, its administrative order and the general operating solvency of the entity. Each letter of the CAMEL system corresponds to the following areas of the operations of each bank that is being rated: “C” represents capital, “A” represents assets, “M” represents management, “E” represents earnings and “L” represents liquidity. Each factor is evaluated and rated on a scale from 1 to 5, 1 being the highest rating an institution can receive. By combining the individual factors that are under evaluation, a combined index can be obtained which represents the final rating for the entity. The rating a bank receives from the CAMEL system can be used by the Central Bank in making decisions such as determining the levels of minimum capital or the amount of contributions a bank is required to contribute to the insurance guarantee system.
BASIC System
The Central Bank established a control system known as “BASIC” which requires that all financial institutions comply with a set of procedures affecting their transactions. The system allows public access to a higher level of information and security as regards its placements in the Argentine banking system. Each letter in the name of the BASIC system identifies one of the following procedures:
B (“Bonds”). By decision of the Central Bank’s board, banks were expected to issue bonds and other securities or obtain placements from international top-rated banks for an equivalent of 2% of their deposits in pesos and foreign currency. The placement of such bonds would make it possible for depositors to know the perception of the market on the equity situation of each financial entity. The requirement was abrogated by Communication “A” 3498 of the Central Bank, dated March 1, 2002.
A (“Audit”). The Central Bank requires a number of auditing procedures which include:
|
|
§
|
the creation of a registry of auditors;
|
|
|
§
|
the implementation of strict accounting procedures to be observed by auditors;
|
|
|
§
|
the payment of a guarantee of compliance by such auditors so as to induce them to fully comply with the procedures; and
|
|
|
§
|
the creation of a Central Bank division in charge of verifying the observance of the established regulations by the external auditors.
|
The purpose of this requirement is to ensure accurate representations by the financial institutions to both the Superintendency and to the public. It involves verifying the figures presented by the entity as well as an in-depth investigation into whether such figures appropriately reflect the activities of the bank in question.
S (“Supervision”). The supervision by the monetary authorities is not replaced but is naturally complemented and reinforced by the information from market sources and continues to be a basic element for controlling the financial system. In Argentina, as in most of the world, what is in use is a combination of remote analysis and inspections in the bank itself. The Argentine supervision system specifically applies an internationally recommended classification system, known as the above-mentioned CAMEL system. In summary, this requirement implies that the Central Bank reserves the right to regularly inspect all financial institutions.
I (“Information”). This is a fundamental element in banking supervision and also as regards the control exercised by the market. It is clear that no effective supervision is possible without relevant, reliable and timely information. No discipline can be imposed by the market on the banks and no control will be effective on the supervision if there is no access to such information. This is why the Central Bank requires that the financial institutions disclose certain statistical information on a daily, weekly, monthly and quarterly basis.
C (“Calificación” (Spanish for Rating)). The rating agencies play a significant role in banking supervision. The ratings serve to bring attention to the available guarantees and informs the less-specialized investors about the risk involved in the different securities. The investor’s information universe is thus expanded and this increases the efficiency of the information process. It would be economically inefficient for the smaller investors to conduct their own collection and analysis of information for each alternative present in the marketplace. This is the reason that justifies the existence of the rating agencies which appear in the marketplace to fulfill such role. The Central Bank established a system that requires that a credit evaluation be regularly performed by internationally recognized rating agencies.
Foreign Currency Position
General Exchange Position
As at the date of this report, the maximum limit for the general foreign exchange position that must be maintained on a daily basis by the financial institutions is the greater of:
|
|
§
|
15% of the equivalent in dollars of their Bank’s RPC, as registered at the close of the month that is two months prior to the relevant month plus the amount that results from multiplying 5% of the total amount transacted with clients in the purchase and sale of foreign currencies in the month that is two months prior to the relevant month, and 2% of the total deposits at sight and at term locally constituted and payable in foreign bank notes (excluding deposits under custody), as registered at the close of the calendar month that is two months prior to the relevant month; and
|
|
|
§
|
a minimum equivalent to U.S.$8,000,000, which may be increased according to the number of establishments devoted to foreign exchange transactions and by operations with holdings in foreign currencies other than the dollar or the Euro and other permitted transactions. BBVA Francés maintains the limit indicated in the immediately preceding bullet point.
|
The maximum limit is reduced by 50% if the financial entity has a debt on record for rediscounts and/or advances with the Central Bank for an amount exceeding 50% of the latest RPC recorded by the entity, excluding from that calculation debts with foreign creditors which the entity chose to refinance in terms of Communication “A” 3941 of the Central Bank.
To this effect, the Central Bank defined the general foreign-exchange position as the sum of the following items:
|
|
§
|
gold and foreign currency resources available in the country;
|
|
|
§
|
gold and foreign currency resources available abroad;
|
|
|
§
|
foreign public and private securities;
|
|
|
§
|
cash or future foreign-exchange purchases pending settlement;
|
|
|
§
|
cash or future public and private security purchases pending settlement;
|
|
|
§
|
cash or future foreign-exchange sales pending settlement;
|
|
|
§
|
cash or future public and private security sales pending settlement; and
|
|
|
§
|
foreign-exchange holdings in the form of deposits and investments at any term in banks from abroad and all kinds of liquid investments abroad.
|
The general foreign exchange position does not include foreign assets of third parties under custody, balances with correspondents of third parties pending settlement, purchases and sales of foreign currencies or securities at a term and direct investments abroad.
In addition to the limit described above, all funds from foreign currency deposits and received financial loans granted with funds from foreign currency deposits must be applied mainly to the financing of foreign trade transactions, any deficiencies in the application of foreign currency lending capacity, net of a portion of: (i) cash balances, (ii) cash under custody in other financial entities, (iii) cash in transit and (iv) cash with armored car transport companies, requires an equivalent increase in the minimum cash requirement. See
“Lending Capacity Provided by Deposits in Foreign Currency”
above.
Global Net Position
Global Net Position could not exceed the following limits:
|
|
§
|
Negative global net position (liabilities exceeding assets), may not exceed 15% of the RPC, with the possibility of an additional 15% to the extent that the entity at the same time has recorded: (a) medium and long term financings in pesos to non-financial private sector under certain conditions for an amount equivalent to the increase of such limit and (b) an increase in the minimum capital requirement equivalent to the increase of the general limit of the global negative net position in foreign currency.
|
|
|
§
|
Positive global net position (assets exceeding liabilities), is the lesser of the following:
|
|
|
(1)
|
30% of the RPC, and
|
|
|
(2)
|
Own liquid resources.
|
Own liquid resources means the excess of RPC with respect to immobilized assets and other concepts computed according to the rules on relationship of fixed assets and other items. See
“Item 4. Information on the Company—The Argentine Banking System and its Regulatory Framework—Fixed Assets and other items”
below.
The global net position in foreign currency will include all assets and liabilities from financial intermediation in foreign currency and securities in foreign currency (deriving from cash and term transactions) including those contracts for derivatives linked to these concepts, those items which must be included in the General Foreign Exchange Position, all deposits in such currency in accounts opened with the Central Bank, as well as the gold position, any Central Bank bills in U.S. dollars as well as foreign currency debt securities. Term transactions made within a framework agreement in the area of self-regulatory markets of the country based on liquidation by difference will be also computed, without delivery of the negotiated underlying asset. Furthermore, the pass-through certificates or debt securities issued by financial trusts as well as the credit rights regarding ordinary trusts, in the pertinent proportion, when their underlying asset is constituted by assets in foreign currency, will also be considered.
Any excess above the limits will be subject to a charge amounting to the greater of twice the annual rate at due date arising from the tendering of letters by the Central Bank in dollars or twice the LIBOR rate at thirty days for transactions in such currency.
The limits for the positive global net position are suspended since May 1, 2005.
For financial information regarding our net foreign currency exposure, see Note 21.11 to the Consolidated Financial Statements.
Fixed Assets and Other Items
The Central Bank determines that the fixed assets and other items maintained by the financial entities must not exceed 100% of the entity’s RPC. The BCRA has resolved to increase by 50 percentage points the specified limit to the extent that the immobilization of the assets is originated in the holding of national public securities and/or monetary regulation instruments of the BCRA appropriated as guarantee by financial institutions in favor of such entity according to the regulations in force for operations implemented by the ALADI Reciprocal Payments and Credits Agreement.
Such fixed assets and other items include the following:
|
|
§
|
Shares of local companies.
|
|
|
§
|
Various credits (including the net balance favorable to the given entity corresponding to the Tax on minimum presumed income or “TOMPI”).
|
|
|
§
|
Property for own use.
|
|
|
§
|
Various property items.
|
|
|
§
|
Organization and development expenses, undeductible of Basic Net Worth.
|
|
|
§
|
Goodwill.
|
|
|
§
|
Financing transactions for related clients.
|
Excluded from the above items are those assets deductible for calculating the entity’s RPC and assets affected as guarantee for certain operations mainly related to derivatives, as well as the financing transactions with certain related companies, provided the participation in the company exceeds 50% of the corporate capital and 50% of the votes.
The calculation of such assets will be effected according to the balances at the close of each month, net of depreciations, accumulated amortizations and bad debt risk allowances (except for 50% of the allowance on the portfolio in a normal situation). It will also be possible to deduct certain liabilities related to the assets being calculated. In the case of financing transactions with related clients, the calculation will be based on the balance at the close of each month or the largest assistance provided to each client during the period in question.
Any excesses in this relationship generate an equivalent increase of the minimum capitals. Furthermore, any entity incurring noncompliance violations in three consecutive or four non-consecutive months within a period of twelve consecutive months must submit a regularization and normalization program.
Lending and Investment Limits
Private sector
Central Bank rules limit the amount of credit, including guarantees, that a commercial bank may extend to, and the amount of equity that it may invest in, any entity at any time. These limits are based on the Bank’s RPC on the last day of the immediately preceding month.
According to Central Bank rules, a commercial bank may not extend credit to a single non-related client and its affiliates, or invest in that client’s equity, in an amount in excess of 15% of the bank’s RPC. However, we may extend additional credit to that client up to 25% of the Bank’s RPC if that additional credit is secured with certain senior preferred liquid assets, including public or private debt securities. Total loans or other extensions of credit that a commercial bank may grant to any particular borrower and its affiliates are also limited based on the borrower’s net worth. Total loans or other extensions of credit to any particular borrower and its affiliates may not exceed, in general, 100% of such borrower’s net worth, but such limit may be increased to 300% of the borrower’s net worth if such amount does not exceed 2.5% of the Bank’s RPC.
The Central Bank requires that extensions of credit in any form in excess of 2.5% of a Bank’s RPC must be approved by the relevant branch manager, regional manager, relevant first line administrative officer of the credit area, general manager and credit committee, if any, of the bank, as well as by its board of directors, administration council or similar corporate body.
In addition, an equity investment of a commercial bank in another company that does not provide services that are complementary to the services provided by a commercial bank may not exceed 12.5% of the stockholders’ equity of such company.
Related Persons
The Central Bank limits the amount a bank can lend to, and the amount of equity it may invest in, a “Related Person”. A Related Person is defined to include:
|
|
§
|
any individual or entity controlling a bank, controlled by a bank or affiliated with a bank, as defined by the Central Bank;
|
|
|
§
|
any entity that both controls the bank and has common directors to the extent such directors, voting together, will constitute a simple majority of the boards of directors of the bank and such entity; or
|
|
|
§
|
in certain exceptional cases, any individual or entity that the Central Bank has determined to be in a position to adversely affect the financial condition of the bank.
|
“Control” is defined as:
|
|
§
|
holding or controlling, directly or indirectly, 25% of the voting stock of the controlled entity;
|
|
|
§
|
having held 50% or more of the voting stock of the controlled entity at the time of the last election of such entity’s board of directors;
|
|
|
§
|
any type of equity holding that creates the ability to vote or direct the vote so as to prevail on any issue considered at the controlled entity’s general shareholders’ meeting or meeting of the board of directors; or
|
|
|
§
|
when a person is determined by the board of directors of the Central Bank to be exercising any influence, directly or indirectly, on the management or policies of the bank.
|
The Central Bank established that the total amount of financing to a company or related person may not exceed the following percentages of their computable equity as of the last day of the month prior to that to which they apply:
|
|
§
|
Entities with a CAMEL rating of 1 to 3:
|
|
|
(i)
|
For each related client:
|
|
|
1.
|
General:
|
|
|
a)
|
Transactions with guarantee: 10% RPC
|
|
|
b)
|
Transactions without guarantee: 5% RPC
|
|
|
2.
|
Complementary services entities or companies subject to consolidation:
|
|
Granting financial entity
|
Rating of the recipient
|
General
|
Additional
|
||
|
Tranche I
|
Tranche II
|
Tranche III
|
|||
|
with rating 1, 2 or 3
|
1
|
100%
|
25% earmarked by the financial institution acquiring assistance to finance transactions that comply with certain conditions.
|
25% in the event of financing transactions with guarantee or assignment of credit portfolio where assignor is responsible provided the requirements of Tranche I are met.
|
—
|
|
2
|
20%
|
25% earmarked by the financial institution acquiring assistance to finance transactions that comply with certain conditions.
|
25% if the financing transactions involve guarantee or assignment of credit portfolio where assignor is responsible provided the requirements of Tranche I are met.
|
55% for financing transactions for an agreed initial term of up to 180 days.
|
|
|
3
|
10%
|
20% earmarked by the financial institution acquiring assistance to finance transactions that comply with certain conditions.
|
20% if the financing transactions involve guarantee or assignment of credit portfolio where assignor is responsible provided the requirements of Tranche I are met.
|
—
|
|
|
4 or 5
|
10%
|
—
|
—
|
—
|
|
|
with rating 4 or 5
|
1 to 5
|
0%
|
—
|
—
|
—
|
|
Complementary services companies
|
Rating of granting entity
|
General
|
Additional
|
||
|
Tranche I
|
Tranche II
|
Tranche III
|
|||
|
stock exchange agent or other broker, leasing, factoring or temporary acquisition of participation in companies to sell the holdings afterwards
|
1
|
100%
|
—
|
—
|
—
|
|
2
|
10%
|
90% for financing transactions for an agreed initial term of up to 180 days.
|
—
|
—
|
|
|
3
|
10%
|
—
|
—
|
—
|
|
|
4 or 5
|
0%
|
—
|
—
|
—
|
|
|
credit card issuers
|
1
|
100%
|
25% earmarked by the financial institution acquiring assistance to finance transactions that comply with certain conditions.
|
25% in the event of financing transactions with guarantee or assignment of credit portfolio where assignor is responsible provided the requirements of Tranche I are met.
|
—
|
|
2
|
20%
|
25% earmarked by the financial institution acquiring assistance to finance transactions that comply with certain conditions.
|
25% in the event of financing transactions with guarantee or assignment of credit portfolio where assignor is responsible provided the requirements of Tranche I are met.
|
55% for financing transactions for an agreed initial term of up to 180 days.
|
|
|
3
|
10%
|
20% earmarked by the financial institution acquiring assistance to finance transactions that comply with certain conditions.
|
20% in the event of financing transactions with guarantee or assignment of credit portfolio where assignor is responsible provided the requirements of Tranche I are met.
|
—
|
|
|
4 or 5
|
0%
|
—
|
—
|
—
|
|
|
|
3.
|
Investment grade bank from abroad: 10% RPC.
|
|
|
(ii)
|
For all linked clients, excepting financial entities or complementary services companies, subject to consolidation: 20%.
|
|
|
(iii)
|
Total of financing transactions for linked clients plus total of frozen assets, excluding complementary leasing, factoring and credit card issuing services: 100%.
|
|
|
§
|
Entities with a CAMEL rating of 4 or 5: are prohibited from lending to or investing in Related Person, except in the following situations and under the following limitations:
|
|
|
(i)
|
foreign financial institutions which are subsidiaries of the domestic institution subject to oversight on a consolidated basis (Communication “A” 2829 of the Central Bank);
|
|
|
(ii)
|
foreign banks controlling domestic financial institutions or their branches or subsidiaries abroad (Communication “A” 2829 of the Central Bank);
|
|
|
(iii)
|
when the Related Person is a company that has been fully consolidated by the bank and is exclusively involved in certain activities that are complementary to financial intermediation; and
|
|
|
(iv)
|
foreign financial entities not subject to consolidated supervision or when the Related Person is a company expressly referred to as an exempted entity under the limitation establish by the Article 28 inc. a) of Law Nr. 21,726 and only in respect of equity investments.
|
In addition, with respect to Related Persons who are natural persons, the total amount of loans to those Related Persons cannot exceed Ps.50,000, which amount must be used exclusively for personal or family purposes. Failure to properly observe these requirements can result in an increase of the minimum capital requirements for credit risk in an amount equal to 100% of the daily excess amounts over the requirements beginning on the month when the excess amounts are not corrected and continuing while the excess amounts remain. In the case of information registered out of term, this increase will be applied beginning on the month when the information is registered and for as long as the default exists. Moreover, once the default has been corrected, the increase will be applied for a number of months equal to the period during which the Central Bank was not informed. For repeated defaults the increase can reach up to 130% of the excess amount.
At December 31, 2012, the aggregate of computable loans, other extensions of credit and equity investments by BBVA Francés on a consolidated basis to Related Persons totaled Ps.189.7 million, or 3.64% of BBVA Francés’ RPC.
Non-financial Public Sector
The non-financial public sector includes,
inter alia
:
|
|
§
|
the Federal Government;
|
|
|
§
|
provincial governments;
|
|
|
§
|
the city of Buenos Aires;
|
|
|
§
|
municipal governments;
|
|
|
§
|
central administration, ministries, departments and their decentralized and autonomous entities and other official bodies; and
|
|
|
§
|
trusts and trust funds whose final beneficiary or trustee, as determined by the respective contracts or applicable regulations, belongs to the non-financial public sector, including other trusts or trust funds where such sector is the final destination of the financed works.
|
The Central Bank may apply to public sector companies governed by Law Nr. 20,705 the general treatment foreseen for the non-financial private sector in connection with all effects of the rules applicable on the subject, provided they:
|
|
§
|
do not require resources from the state budget whether national, municipal, provincial or belonging to the Autonomous City of Buenos Aires for such items as transfers, capital contributions (excepting those corresponding to their incorporation) or
|
|
|
|
reimbursable financial assistance to be used for covering expenses and/or investments made in the course of their normal and customary businesses, except those which may have been contemplated in the 2001 and 2002 budgets;
|
|
|
§
|
maintain technical and professional independence of their managerial bodies for implementing corporate policies;
|
|
|
§
|
trade their goods and/or services at market prices;
|
|
|
§
|
possess fixed assets; the use of which in the activity is not subject to any condition from their shareholders; and
|
|
|
§
|
do not distribute of dividends among their shareholders.
|
Compliance with all the above conditions must have been verified continuously during at least the ten years immediately preceding the date of the granting of financial assistance.
The Central Bank may agree on the general treatment for persons of the non-financial private sector, to all effects of the rules applicable on the subject to public sector companies which are not incorporated under Law Nr. 20,705 and which also comply with the following requirements:
|
|
§
|
Their creation must have been ordered by a national law or decree by the Federal Executive;
|
|
|
§
|
They must create a stock corporation according to the rules of Chapter II, Sections V and VI of the Law of Corporations Number 19,550 (stock corporations and corporations with majority state participation);
|
|
|
§
|
They must have majority National State participation, be it direct or indirect, according to the provisions of said Law;
|
|
|
§
|
They must be the purpose of developing of activities for oil reservoirs, its transportation, distribution, commercialization and industrialization or the generation and/or sale of electric energy.
|
|
|
§
|
They must be subject to internal and external control by the National Public Sector in terms of the Financial Administration Law and the National Public Sector’s Control System Law Nr. 24,156.
|
Consequently, those corporations receiving the treatment set forth in this resolution will be exempted from the application of the provisions regarding financial assistance to the owners of entities in the non-financial public sector.
All financing granted to the above entities may not exceed the following limits with respect to the entity’s RPC as at the last day of the preceding month:
|
|
§
|
for transactions in the national public sector: 50%, which includes loans granted to governments from other jurisdictions guaranteed by their participation in the federal tax collection system;
|
|
|
§
|
for all transactions granted to each provincial jurisdiction and the City of Buenos Aires (excluding those comprised in the previous paragraph which must be guaranteed by the collection of local taxes or by pledge or implemented under leasing agreements): 10%. This limit includes financing operations granted to municipal governments in the respective jurisdiction and guaranteed by their participation in the collection of provincial taxes;
|
|
|
§
|
for all transactions with each municipal jurisdiction, which must be guaranteed by the collection of local taxes or by pledge, or implemented under leasing agreements: 3%. Total financing granted to the above-mentioned jurisdictions (excluding those mentioned in the previous paragraph): 15%; and
|
|
|
§
|
for all transactions referred to in the first three points above: 75%.
|
On the other hand, the Central Bank determined that any excesses to the above relations and to the limit mentioned in the last paragraph of this point, exclusively originated in the application of the new limits and conditions for computing financing transactions, will not be considered as non-compliances, provided that such excesses result:
|
|
a)
|
From transactions existing prior to March 31, 2003;
|
|
|
b)
|
From increases in the transactions mentioned in point a) above by the receipt of:
|
|
|
(i)
|
compensation bonds or promissory notes as per Articles 28 and 29 of Decree Nr. 905/02, or of those eventually received by application of other specific provisions after that date, and deriving from Law Nr. 25,561 of Public Emergency and Foreign Exchange Reform;
|
|
|
(ii)
|
bonds received within the framework of the Mortgage Refinancing System established by Law Nr. 25,798;
|
|
|
(iii)
|
bonds issued in terms of Decree Nr. 1735/04 which may be received within the framework of the Argentine debt restructuring, in exchange for eligible securities pre-existing as at March 31, 2003; or
|
|
|
(iv)
|
public debt instruments of the Argentine Government subscribed by financial entities through swap, payment or exchange since January 1, 2009, within the framework of specific regulations issued by the relevant authority; or
|
|
|
c)
|
From new transactions if excesses are registered in accordance with points a) and b) above, provided that they originate exclusively in the granting of financing to the non-financial public sector with funds originated in amortization services of the aforementioned debt. These transactions include the amounts that apply to the primary subscription of government securities with an anticipation of up to 180 days to their due date. This deadline was extended by 180 days to operations disposed as of January 1, 2009 under the specific provisions of the competent authority.
|
|
|
d)
|
In addition a margin has been admitted for those entities exceeding the observance of the limits (due to the above-mentioned preexisting operations) to carry out the purchase and sale of, or financial transactions with, national public securities responsible for applying minimum capital requirements for market risk, that is to say, with such volatility as informed by the Central Bank, provided it does not exceed the equivalent to 25% of the RPC. Such limit will be constituted with the allocation, as from the date referred to above, of any of the following: i) the realization of non-financial public sector assets in the portfolio which are computable for determining such limits, ii) the allocation at market value of national public securities holdings, and iii) funds received for amortization services corresponding to the public sector assets involved.
|
|
|
e)
|
From participations greater than 50% by the Government as trustee in financial trusts to finance the construction area as provided for in subsection i), paragraph 3.2.4 of the “Financing to Non Financial Public Sector” rules.
|
However, no financing will be granted in those cases where the ratio of transactions comprised with respect to the Bank’s RPC determined as of March 31, 2003 is exceeded owing to reductions in this last parameter and until such relationship is reestablished.
Apart from the above-mentioned limits, the guarantee provided by the collection of taxes (either federal or local) and/or by the collection of royalties by provincial or municipal jurisdictions may not exceed 40% of the total of such income at the time of evaluating the granting of new financing, and considering the new financing about to be granted. This requirement does not apply to transactions guaranteed by pledge or leasing agreements.
The amount of non-exempted credit to and equity stakes in a single client, whether related to us or not, of a given bank which individually exceeds 10% of that bank’s RPC may not exceed, in the aggregate, three or five times the bank’s RPC, excluding loans in domestic financial institutions and including equity stakes in domestic financial institutions. This last limit does not consider those guaranteed loans received in exchange for national public debt securities implemented through guaranteed loans (Communication “A” 3366).
Loan Loss Allowance
The Central Bank has established specific loan loss allowance requirements for loans to borrowers classified as “Problem”, “Medium Risk”, “High Risk of Insolvency”, “High Risk”, “Irrecoverable” and “Irrecoverable for Technical Decision”. In addition, the Central Bank established a mandatory general allowance requirement for all performing loans. See
“Item 4. Information on the Company—Selected Statistical Information—Allowance for Loan Losses and Loan Loss Experience
”.
Priority of Deposits
Law Nr. 24,485 as amended sets forth that in case of judicial liquidation or bankruptcy of a bank, all depositors, irrespective of the type, amount or currency of their deposits, would be senior to the other remaining creditors (such as the shareholders of the bank), with exceptions made for certain labor creditors (Article 53 paragraphs “a” and “b”) and for those creditors backed by a pledge or
mortgage, in the following order of priority: (a) deposits of up to 50,000 pesos per person (including any amount of said person deposited with a financial entity), or their equivalent in foreign currency; (b) any and all deposits higher than Ps.50,000, or their equivalent in foreign currency; and (c) the liabilities originated in commercial lines granted to the Bank and that directly affect international commerce.
Furthermore, pursuant to article 53 of Law Nr. 21,526, as amended, Central Bank credits will have absolute priority over the other credits, except for pledged or mortgaged credits, certain labor credits, the depositors' credits as per art. 49, paragraph e), points i) and ii), credits granted under Article 17, paragraphs (b), (c) and (f) of the Central Bank’s Charter (including discount granted by financial entities due to temporary lack of liquidity, advances in favor of financial entities with security interest, assignment of rights, pledge or special assignment of certain assets) and credits granted by the Banking Liquidity Fund backed by pledge or mortgage.
The amendment introduced to art. 35 bis of Law Nr. 21,526 of Financial Entities by Law Nr. 25,780, sets forth that if a bank is in a situation where the Central Bank may revoke its authorization to operate and become subject to dissolution or liquidation by judicial resolution, among the options that the Central Bank’s Board may decide by absolute majority, in case of excluding assets and liabilities for their transfer in favor of financial trusts or other financial entities, the Central Bank may totally or partially exclude the liabilities mentioned in article 49, paragraph e), as well as its credits defined in art. 53, observing the order of priority among its creditors. Regarding the partial exclusion, the order of priority of point e) art. 49 must be followed, without assigning, in any case, a differentiated treatment to liabilities of the same grade.
Capital Markets
Under the Financial Institutions Law, banks may underwrite and place both equity and debt securities. There are currently no statutory limitations on the size of a bank’s underwriting commitments. However, a bank’s underwriting commitment would be treated as an extension of credit subject to the limitations discussed under
“Item 4. Information on the Company—The Argentine Banking System and its Regulatory Framework—Lending and Investment Limits”
.
Commercial banks are authorized to trade public and private debt securities in the Argentine over-the-counter market if they are members of the Mercado Abierto Electrónico (“MAE”) and authorized to act as over-the-counter brokers (“agentes de mercado abierto”). In our capacity as an over-the-counter broker, we are subject to MAE rules and the supervision of the CNV as our primary regulator, and accordingly, we must comply with certain reporting requirements.
Since 1990, the Buenos Aires Stock Market (Mercado de Valores de Buenos Aires—“MERVAL”) has authorized brokerage firms or houses organized as sole purpose corporations to operate as securities brokers on the MERVAL. Commercial banks may freely own a Securities Brokerage Company, as there are no current restrictions on ownership, and most of the principal commercial banks operating in Argentina have already established their own Securities Brokerage Company. An agreement between the MERVAL and representatives of the MAE dealers provides that trading in shares and other equity securities will be conducted exclusively on the Buenos Aires Stock Exchange and that all debt securities listed on the MERVAL may also be traded on the MAE. Trading in Argentine Government securities, which are not covered by the agreement, is conducted mainly on the MAE. The agreement does not extend to other Argentine exchanges.
Commercial banks may operate as both managers and custodians of Argentine mutual funds; provided, however, that a bank may not act simultaneously as manager and custodian for the same fund.
We have been registered as an over-the-counter broker since 1989. In 1991, we created Francés Valores Sociedad de Bolsa S.A.
Financial Institutions with Economic Difficulties
Under the Financial Institutions Law, if a financial institution
|
|
§
|
evidences a cash reserve deficiency,
|
|
|
§
|
has not satisfied certain technical standards,
|
|
|
§
|
has not maintained minimum net worth standards, or
|
|
|
§
|
is deemed by the Central Bank to have impaired solvency or liquidity;
|
then such financial entity must submit a regularization and normalization plan under such terms and conditions as may be established by the Central Bank within a term that may not exceed thirty days. This notwithstanding, the Central Bank may appoint overseers with veto powers and/or demand the creation of guarantees and restrict or prohibit the distribution of remittances or profits. The lack of submission, the rejection of or any noncompliance with the regularization or normalization plans entitle the Central Bank to revoke the authorization to operate as a financial entity and to apply sanctions. If the plan is accepted, the Central Bank may grant a temporary exemption with respect to the observance of the technical regulations and excuse or postpone the payment of fines (if any).
Likewise, and prior to the revocation of the authorization to operate as a financial entity, the Central Bank may authorize the restructuring of the entity for the protection of its depositors, by applying any of the following decisions or a combination thereof in a sequential, gradual or direct manner: reduction, increase and assignment of the corporate capital, exclusion of assets and liabilities and their transfer to other financial institutions, judicial intervention, responsibility for and transfer of excluded assets or liabilities.
Dissolution and Liquidation of Financial Institutions
As provided in the Financial Institutions Law, the Central Bank must be notified of any decision adopted by a financial institution’s legal or corporate authorities concerning its dissolution. The Central Bank, in turn, must then submit such decision to a competent court, which should determine whether the corporate authorities or an appointed independent liquidator will liquidate the entity. The court’s decision will be based on whether or not there is sufficient assurance that the corporate authorities are capable of carrying out such liquidation properly.
Pursuant to the Financial Institutions Law, the Central Bank no longer acts as liquidator of financial institutions. However, if a restructuring plan has failed or is not deemed feasible, or violations of local laws and regulations have been incurred, or significant changes have occurred in the institution’s condition since the original authorization was granted, then the Central Bank may revoke a bank’s license to operate as a financial institution. In this event, the law allows for judicial or extra-judicial liquidation. During the liquidation process and once the license to operate as a financial institution has been revoked, a court of competent jurisdiction may adjudge the former financial institution in bankruptcy or a petition in bankruptcy may be filed by any creditor of the bank after a period of 60 calendar days has elapsed since the license was revoked.
Money Laundering
The concept of money laundering is generally used to denote transactions intended to introduce criminal proceeds into the institutional system and thus to transform profits from illegal activities into assets of a seemingly legitimate origin.
On April 13, 2000, the Argentine Congress enacted Law Nr. 25,246 (as amended by Laws Nr. 26,087, 26,119 and 26,268) which defines money laundering as a type of crime. Also, such law creates the so-called Financial Information Unit (“FIU”), which establishes an administrative criminal system and replaces several articles of the Criminal Code.
Law Nr. 26,087 grants the FIU the power to obtain secret or confidential information at its sole request, requiring no Judicial Power intervention and eliminating any absolutory excuses for asset-laundering crimes. Law Nr. 26,119 modifies the integration of the FIU and Law Nr. 26,268 incorporates into the Criminal Code the crimes of illegal terrorist association and financing terrorism.
Money laundering is defined in the Criminal Code as providing for criminal sanctions whenever a person converts, transfers, manages, sells, encumbers or in any other manner uses money or any other asset deriving from illegal activities, in which such person has not participated, with the possible result that the original or substitute assets may appear as deriving from a legitimate origin; provided, however that the value of the assets exceeds the amounts indicated in the regulation, irrespective of whether such amounts are the result of one or more transactions.
The main purpose of Law Nr. 25,246 is to prevent money laundering. In line with internationally accepted practice, it does not attribute responsibility for controlling these criminal transactions only to Government agencies, but also assigns certain duties to diverse private sector entities such as banks, stockbrokers, brokerage houses and insurance companies. These duties consist of information capturing functions. The Central Bank regulation requires banks to take certain minimum precautions to prevent money laundering.
Financial entities must also inform the Superintendence of any transaction that is suspicious or unusual, devoid of any economic or legal justification, or which is unnecessarily complex, whether occurring on isolated occasions or repeatedly.
The Bank believes that it is in compliance with all applicable regulations on money laundering pursuant to the provisions issued by the Ministry of Foreign Affairs, International Commerce and Culture on funds freezing and measures against presumed terrorists,
by the Central Bank and by the FIU, in particular Resolution Nr. 31 of the FIU dated February 8, 2011 which regulates Article 21, sections a) and b) of Law Nr. 25,246 providing for the gathering of information in respect of suspicious transactions and their notification to the authorities.
Law Nr. 26,476, published and in force since December 24, 2008 and declared a public policy rule, establishes a system of tax regularization, promotion and protection of registered employment with priority for small and medium-sized entities, and of declaration and repatriation of capital. Subjects who decide to adhere to the declaration and repatriation of capital must comply with the provisions of Law Nr. 25,246 on asset laundering prevention. The term in order to adhere to this repatriation has expired, but the term regarding the registration of employment and tax regularization is still in force. Excluded from its scope of application are the amounts deriving from conducts liable to be included in article 6 of Law Nr. 25,246, with the exception of tax evasion or attempted tax evasion situations. The Argentine Public Revenue Administration – the Argentine Tax Authority (“AFIP”) issued this regulation on February 2, 2009.
Moreover, Decree Nr. 1936/10 issued on December 9, 2010, introduced important changes into the Anti-Money Laundering Legislation. The principal dispositions of this Decree are to: (i) set forth the new role of the FIU, as the representative of the State to the FATF; and (ii) determine that each controlling entities must appoint a member of the board of directors as the maximum authority for Anti-Money Laundering Policies in charge of centralizing any information the Central Bank may require on its own initiative or at the request of any competent authority. In addition, this officer or other person will be responsible for the implementation, tracking, and control of internal procedures to ensure compliance with the regulations.
Finally, the Central Bank issued a resolution widening the concept of Politically Exposed Individuals, including any person which has a material economic relation with the subject. These people must be clearly identified and closely monitored according to the Anti-Money Laundering New Rules. Also, the FIU has recently issued over 20 new resolutions in order to regulate the activities of all private and public entities in charge of controlling Anti-Money Laundering activities, establishing different deadlines in order to implement procedures which require among other things, the filing of (i) sworn statement regarding the legal origin of funds; (ii) certain documentation in order to prove the origin of the funds involved in the execution of operations, in the event those funds are equal or more than Ps.20,000 in the case of credit card limits, or Ps.200,000 in case of regarding transactions involving securities, etc.
Deposit Guarantee Insurance System
Law Nr. 24,485, published on April 18, 1995 and Decree Nr. 540/95 of the same date provided for the organization of a Bank Deposit Guarantee Insurance System. This system is limited, mandatory, and for valuable consideration, designed to provide coverage for risks inherent in bank deposits, as a subsidiary and supplementary protection to that offered by the system of bank deposit privileges and protection created by the Financial Institutions Law.
That Law provided for the organization of the company “Seguros de Depósitos Sociedad Anónima” to manage the Deposit Guarantee Fund, whose shareholders, as amended by Decree Nr. 1292/96, will be the Central Bank, with one share, as a minimum, and the trust made up of the financial institutions in such proportion as may be determined by the Central Bank for each one, based on their contributions to the Deposit Guarantee Fund.
This guarantee system does not include:
|
|
§
|
deposits made by other financial institutions, including certificates of deposit acquired by secondary trading;
|
|
|
§
|
deposits made by persons directly or indirectly related to the financial institution;
|
|
|
§
|
deposits acquired by means of offering incentives, including deposits under the El Libretón program;
|
|
|
§
|
certificates of deposit of securities, acceptances or guarantees;
|
|
|
§
|
transferable certificates of deposit whose ownership has been acquired by way of endorsement.
|
|
|
§
|
fixed amounts from deposits and other excluded transactions.
|
We hold a 10.2394% equity interest in the company “Seguros de Depósitos Sociedad Anónima” as of December 31, 2012.
The amount covered by the deposit guarantee system is Ps.120.000. In the case of transactions in the name of two or more persons, the guarantee will be prorated among the respective holders. The total guarantee amount by persons may not exceed Ps.120,000, regardless of the number of accounts and/or deposits.
The deposits for amounts over Ps.120,000 are also included in the guarantee system up to the Ps.120,000 limit. The Central Bank may decide at any time to amend the guarantee system cover amount based on continued consolidation of the Argentine financial system or any other indicators.
The Argentine insurance system was financed by monthly contributions from all financial institutions operating in Argentina. These contributions are equivalent to 0.015% of average daily balances of demand deposits, time deposits, term investments, salary account of social security and fixed assets of previous concepts.
Furthermore, institutions must make an additional contribution which will depend on the rating assigned by the Central Bank, the excess recorded in the integration of the RPC and the portfolio quality. This additional contribution may not exceed the standard contribution once.
SEDESA may issue nominative non-endorsable securities to be offered to depositors as payment of the deposit guarantee whenever it did not have sufficient funds for such purpose. Such securities, whose conditions would be established for general purposes by the Central Bank, must be accepted by the financial entities in order to constitute deposits.
At December 31, 2012 and the date of the filing of this Form 20-F, the Bank complies with each regulatory requirement discussed in this section.
Credit Cards Law Nr. 25,065
Law Nr. 25,065, enacted in 1999, governs different aspects of the credit, purchase and debit card system. In its main aspects, this law: (i) creates an obligation to sign a contract between the bank and the holder of the credit card before the card is issued, (ii) fixes a maximum limit to financial interest charged on balances, which may not exceed by more than 25% of the rate applied to personal loan transactions, (iii) sets a maximum 3% fee to be charged by the banks to commercial establishments, and is not entitled to charged commercial establishments in the same line of business with different rates and (iv) prohibits providing information to financial background databases regarding particulars of credit card holders in delinquent payment situations.
Law Nr. 26,361, enacted in 2008, amended article 50 of Law Nr. 25,065, thus empowering the Secretariat of the Domestic Commerce, dependent on the Ministry of Economy and Production, in those commercial aspects deriving from its function as authority of application, to issue regulatory provisions and exercise its powers to control, survey and determine compliance. The City of Buenos Aires and the Provinces will act as local authorities of application, with powers which they may delegate, if applicable, to their dependent bodies or to municipalities. Irrespective of the above, the national authority of application may act concurrently, even if the presumed infringements occur only within the scope of the Autonomous City of Buenos Aires or the Provinces.
The Central Bank of the Argentine Republic, with the enforcement of Law Nr. 25,065, is the Authority of Application in matters concerning financial aspects unmodified to this date.
Disclosure of Iranian Activities under Section 13(r) of the Exchange Act
We are disclosing the following information pursuant to Section 13(r) of the Securities Exchange Act of 1934 (Exchange Act), which requires an issuer to disclose whether it or any of its affiliates knowingly engaged in certain activities, transactions or dealings relating to Iran or with natural persons or entities designated by the U.S. government under specified Executive Orders, including activities not prohibited by U.S. law and conducted outside the United States by non-U.S. affiliates in compliance with local law. In order to comply with this new requirement, we have requested relevant information from our affiliates globally.
BBVA Banco Francés S.A. has not knowingly engaged in activities, transactions or dealings relating to Iran or with natural persons or entities designated by the U.S. government under specified Executive Orders.
Because we are controlled by Banco Bilbao Vizcaya Argentaria, S.A. (BBVA), a Spanish corporation, our disclosure includes activities, transactions or dealings conducted outside the United States by non-U.S. affiliates of BBVA and its consolidated subsidiaries (the BBVA Group) which are not controlled by us. BBVA is subject to the disclosure requirements of Section 13(r) for its Form 20-F for the year ending December 31, 2012. In advance of that filing, we have requested that BBVA provide us a detailed description of reportable activity under Section 13(r) and have received the following information:
Legacy contractual obligations related to counter indemnities
. Before 2007, BBVA Group issued certain counter indemnities to its non-Iranian customers in Europe for various business activities relating to Iran in support of guarantees provided by Bank Melli, four of which remained outstanding as of January 1, 2012 (three as of December 31, 2012). Estimated gross revenue for 2012 from these counter indemnities, which includes fees and/or commissions, did not exceed €9,000 and was entirely derived from payments made by BBVA Group’s non-Iranian customers in Europe. BBVA Group does not allocate direct costs to fees and commissions and therefore has not disclosed a separate profits measure. In addition, in accordance with Council Regulation (EU) Nr. 267/2012 of March 23, payments of any amounts due to Bank Melli under these counter indemnities have been blocked. BBVA Group is committed to terminating these business relationships as soon as contractually possible and does not intend to enter into new business relationships involving Bank Melli.
Letters of credit
. During 2012, BBVA Group had credit exposure to Bank Mellat, Bank Tejarat and Bank Sepah arising from a total of four letters of credit issued by such Iranian banks (one by Bank Mellat, two by Bank Tejarat and one by Bank Sepah) to its non-Iranian clients in Europe. These letters of credit, all of which were granted before 2004, were used to secure BBVA Group‘s loans to its clients in order to finance certain Iran-related activities. These loans were supported by the Spanish export credit agency (CESCE). Three of these loans related to its clients’ exportation of goods to Iran (consisting of medical supplies, electrical equipment, air conditioning equipment and port infrastructures). The remaining loan, which matured in 2012, was granted to an Spanish customer in connection with its provision of engineering services and supply of equipment for the construction of a petrochemical plant in Iran.
As of December 31, 2012, only one of the letters of credit referred to above (issued by Bank Sepah) remained outstanding. Estimated gross revenue for 2012 from the loans underlying these letters of credit, which includes fees and/or commissions, did not exceed €250,000. BBVA Group does not allocate direct costs to fees and commissions and therefore has not disclosed a separate profits measure. Payments of any amounts due by Bank Mellat, Bank Tejarat or Bank Sepah in 2012 under these letters of credit were initially blocked and thereafter released upon authorization by the relevant Spanish authorities. BBVA Group is committed to terminating the outstanding business relationship with Bank Sepah as soon as contractually possible and does not intend to enter into new business relationships involving Bank Mellat, Bank Tejarat or Bank Sepah.
Bank Accounts
. In 2012, BBVA Group maintained one account (which was closed in March 2013) for a company that produces farm vehicles and tractors and a number of accounts for certain of its employees (some of whom have the Iranian nationality). BBVA Group believes that 51% of the share capital of such company is controlled by an Iranian company in which the Iranian Government might have an interest. Estimated gross revenue for 2012 from these accounts, which includes fees and/or commissions, did not exceed €5,000. BBVA Group does not allocate direct costs to fees and commissions and therefore has not disclosed a separate profits measure. BBVA Group is committed to terminating its business relationships with the employees of this company as soon as contractually possible and does not intend to enter into new business relationships involving this company or its employees.
Iranian embassy-related activity
. BBVA Group maintains bank accounts in Spain for three employees of the Iranian embassy in Spain. In addition, BBVA Group maintains bank accounts in Venezuela for seven employees of the Iranian embassy in Venezuela and has provided one employee with an insurance against theft at ATMs which will expire on November 6, 2013. Estimated gross revenue for 2012 from embassy-related activity, which includes fees and/or commissions, did not exceed €2,000. BBVA Group does not allocate direct costs to fees and commissions and therefore have not disclosed a separate profits measure. BBVA Group is committed to terminating these business relationships as soon as legally possible.
Activity related to U.S. Executive Order 13,224
. Until January 2, 2012 BBVA Group maintained two deposit accounts and three credit cards in Colombia for one individual designated by the U.S. under Executive Order 13,224 on December 29, 2011. On January 2, 2012 such deposit accounts and credit cards were closed and cancelled, respectively. Estimated gross revenue in 2012 for the activity referred to above, which includes fees and/or commissions, was nil.
Correspondent relationship with the Central Bank of Iran
. Until September 11, 2012, BBVA Group maintained a correspondent relationship with the Central Bank of Iran in connection with non-U.S. dollar payments made in connection with certain transactions described above. There were no transactions with the Central Bank of Iran during 2012. Accordingly, there was no related gross revenue or net profits recognized in 2012. On September 11, 2012, BBVA Group terminated its correspondent relationship with the Central Bank of Iran.
None.
Considerations on Politics and Economy in Argentina
The economic activity in Argentina was affected in 2008 by several national and international events that resulted in a slowdown of the Argentine GDP growth rate. During the first half of the year, confrontations of the Federal Government with the agriculture and livestock sector, due to the introduction of escalating export duties on grain, led to a rise of the country risk level and to a fall of consumer confidence. The impact of this phenomenon was partly cushioned by the large increase in the terms of trade during that period. However, during the last six months of 2008, the decline in global demand started to have an impact on the economy, the first sign of which was a fall of approximately 40% in agricultural raw materials prices. The worsening of the Global Financial Crisis and the reform of the social security system in Argentina increased risk aversion and the demand for dollarized assets. After five years of expansion rates of more than 8.5%, the rate of economy grew by 7% in 2008.
Unemployment had a slight decline in 2008, mainly due to a reduction in labor force participation since there was a certain stagnation in the creation of new jobs.
Public accounts benefited from pension fund reform as personal contributions from workers previously affiliated to private pension funds were transferred to the pay-as-you-go state-owned scheme at the end of 2008. Primary surplus reached Ps.32,529 million in 2008, which represented 3.15% of GDP.
The Argentine terms of trade increased by 12.9% on average during 2008, due to an increase in the international prices of raw materials. Exports increased by 26.5% as a result of the high prices of these exported products during most of 2008. On the other hand, imports grew by 28.4%, at the same rate as in 2007. During the last quarter of 2008, both exports and imports slowed down sharply as a consequence of the Global Financial Crisis.
Higher portfolio dollarization during May and October of 2008 resulted in higher volatility in the exchange rate as compared with previous years. In the last quarter of 2008, the worsening of the Global Financial Crisis caused severe currency depreciations within Argentina’s main trading partners, such as Brazil, Chile and Europe, and boosted the devaluation of the Argentine peso. The exchange rate (BCRA reference) increased by 9% in 2008, closing at an average rate of 3.42 pesos to the dollar at the end of 2008.
In 2009, economic activity in Argentina was also affected by the Global Financial Crisis, and, to a lesser extent by the swine flu, all of which led to a strong deceleration in GDP growth after six years of continuous increases. Preliminary data as provided by the EMAE showed that the economy grew by only 0.8% during 2009.
As a consequence of the slowdown and higher uncertainty, the unemployment rate increased from 7.3% in the fourth quarter of 2008 to 8.4% in the last quarter of 2009.
Tax collection increased by 13.2% as a result of social security contributions (up by 48.1%). Primary expenditure was up by 30.2% prompted mainly by capital expenditures and salaries. Primary surplus was Ps.17,286 million.
The CPI-GBA increased by 7.7% in 2009.
In terms of international trade, exports dropped by 20.4% year over year, while imports contracted even further by 32.5% year over year, which resulted in a record trade surplus of U.S.$16,980 million during the year.
The aftermath of the Global Financial Crisis continued to be felt in Argentina during the first half of 2009 and private capital outflows increased. As a consequence of a higher demand for U.S. dollars, the Argentine Central Bank intervened by selling international reserves, continuing to apply a “managed float” policy from January to June. The nominal foreign currency depreciated by 11% during that period and remained approximately constant for the rest of the year. The U.S. dollar closed at 3.797 to the Argentine Peso.
Economic activity reactivated in 2010, after it was affected by the previous year’s international crisis. GDP grew considerably, prompted mainly by important increases in consumption and investment. In the third quarter of the year the GDP grew 8.6% in annual terms, while the EMAE (Monthly Estimator of Economic Activity) augmented by 9.1% in 2010.
As a result of increased activity, unemployment rates decreased during the year to 7.3% in fourth quarter of 2010.
Private sector employees’ salaries improved by 28.8% as of November 2010 from November 2009. Salaries of workers in the informal and public sectors also increased but less than those of formal employees.
Tax collections increased 34.4% this year. This increase was mainly due to international trade taxes, which was the result of record crops production and the high prices of exported agricultural products from Argentina.
The CPI-GBA increased 10.9% in 2010, showing acceleration in connection to the same period of 2009. The main increases were for food and drinks, and clothing.
Argentine terms of trade showed a substantial increase. In accordance with trade balance information export prices were up 8% in 2010 and import prices increased by 5%. An excellent harvest, together with higher prices was positive for exports which increased 23.0% in yearly terms. However, imports increased even more by 45.5% during the same period, reinforced by the growing economic activity and the actual exchange rate appreciation. This caused deterioration in the trade balance of U.S.$12,056.8 million in 2010.
Despite the fact that throughout the year the international economic situation continued to be sensitive, mainly due to the financial problems in several peripheral European countries, there were no major capital flights in Argentina as it happened during the first part of 2009. A differentiating factor which favored Argentina was the re-opening of the negotiations related to the default debt exchange that had started in 2005. Over U.S.$12 billion in default public securities were exchanged, which accounted for 66% of eligible bonds. There was a global adhesion level in both exchanges of 92.4% of defaulted debt in 2002. Public debt /GDP ratio was 48.6 % after this exchange.
Economic activity was very dynamic in 2011 and the high growth rates of the previous year continued, in spite of the political cycle and despite the international financial tensions that continued to be on the high side. The economy grew on average by 8.8% year over year according to the Monthly Economic Activity Indicator (EMAE), which is a proxy for GDP.
Strong growth had a positive impact on employment as, similarly to 2010, more jobs were created. Unemployment rates in the fourth quarter were 6.7%. In 2011, formal private sector salaries increased by 35.8% while wages in the informal private sector rose by 32.8% year over year and by 9.7% year over year in the public sector.
In 2011, the primary fiscal surplus contracted due to a 32.1% year over year increase in public spending led by rising transfers to the private sector (up 36.9%) and a 37.4% increase in pensions and social security payments. Tax collections were up by 28% during de year, spurred by Income Tax, VAT and Social Security contributions.
The CPI-GBA increased 9.5% in 2011, slightly below 10.9% to December 2010. This was mainly due to more moderate increases in the prices of Food and Beverages.
The external trade sector continued to record positive results in 2011 due to an improvement in the terms of trade, as export prices were up 16% during this period, while import prices rose 10% year over year on average. In terms of volumes, however, exports only increased by 6% while imports were up by 19%, driven by a buoyant economy and real peso appreciation. As a result of this, nominal exports grew 24% during the year, and nominal imports increased 31% year over year, so the trade surplus fell by 11% compared to 2010.
In the foreign exchange market, the main characteristic of 2011 was strong portfolio dollarization. Net foreign assets of Argentine residents (mostly resulting from purchases of U.S. dollars) increased by U.S.$21.5 billion during 2011, practically doubling the outflows recorded in 2010.
Impaired by factors such as the draught, a lower growth in Brazil and the impact of increasing restrictions in the foreign exchange market, the Argentine economy underwent a strong deceleration in 2012, following the dynamic trends which had prevailed in 2011. After an 8.9% increase in 2011, the GDP grew only 1.9% in 2012.
This poor economic performance reflected itself on the labor market. Unemployment rate remained at 7.2% for 2012 as compared to the 7.2% average rate for 2011. This less dynamic tendency in the labor market, however, did have an impact on the salaries, which at December 2012 registered an increase in the General Index of 24.5% on a year-over-year basis.
In spite of a less dynamic economic activity, inflation measured as per the CPI-GBA reached 10.8% in terms of year-over-year variation as at December 2012, representing an acceleration as compared with the 9.5% rate at the end of the previous year.
The fiscal policy remained expansive and in 2012 there was a primary fiscal deficit of Ps.4,374 million, compared to a surplus of Ps.4,921 million in 2011. Total income tax increased by 25.9%, mainly due to an increase in the income tax collection (27.5%). VAT collection had a 23.5% increase and the foreign trade taxes grew a bare 13.3%, affected by the fall in exports and imports.
The foreign exchange market and the foreign sector were affected by profound regulatory changes. As a consequence, the foreign trade balance had a U.S.$12,690 billion surplus in 2012, approximately 26.7% higher than the previous year, but with a decline in trade volumes.
Effects of Recent Events on BBVA Francés
After 2002, the Argentine economy recovered significantly, maintaining a GDP growth of 8.2% on average until 2008. During the year 2009 the economic activity in Argentina was affected by the Global Financial Crisis, causing a reduction of the GDP of 2.1%.
However, during 2010, the Argentine economy reached again a very good level of growth (8.7% of GDP), prompted by consumption and investment, showing once more its capacity of adapting to the new economic environment. After the 2010 re-opening of the debt swap, 95% of sovereign bonds are now out of default and negotiations with Paris Club are underway, which helped to achieve a credit upgrading in 2010.
During the year 2012 the economic activity, affected by the draught, a low growth in Brazil and the impact of increasing restrictions on the foreign exchange market, underwent a strong deceleration as compared to its highly dynamic trend in 2011. Thus, after growing by 8.9% in 2011, the GDP increased a 1.8% in the first nine months of 2012 compared to the same period in the preceding year.
During the first quarter of the year the Central Bank charter was changed to broaden its functions and ensure monetary and financial stability. The Central Bank must now promote employment and economic development with social equality. As from implementation of this amendment, the board of directors of the BCRA will determine the level of reserves required for compliance with the foreign exchange policy, thus eliminating the requirement that such reserves must cover 100% of the monetary base and so expanding their availability to face payment commitments of the public debt in foreign currency. Moreover, an automatic mechanism was stipulated for the granting automatic advances of funds to the National Treasury and the limit for these loans was raised from 10% to 20% of all fiscal income. As regards specifically to the financial sector, changes were made to the scheme of integration of liquidity requirements, in the sense that such integration may only be constituted by sight deposits with the Central Bank. As compensation for such measure, a reduction was granted in the required cash reserve in pesos according to the proportion of credit to small and medium-sized companies with respect to the total loans granted to the private sector by each financial institution, applicable since December.
In addition, the control measures on capital movements, which had started at the end of October 2011 with the requirement of prior AFIP authorization for the purchase of foreign currency by residents, were intensified. The restrictions became more and more stringent and in July 2012 the purchase of foreign currency for hoarding purposes was totally prohibited. With private demand strongly limited by the new regulations, the Central Bank became the main actor in the foreign exchange market. It continued to apply its managed flotation policy in order to moderate the exchange rate volatility. However, the Central Bank permitted an acceleration of the monthly rate of devaluation of the peso during the second half of the year. Thus the exchange rate increased to 4.92 pesos per U.S. dollar at the end of 2012, representing a 14% increase for the year).
In July 2012, the Central Bank established the “Line of credits for productive investment”, according to which the system’s largest financial entities and those which are financial agents of the State must allocate a minimum of 5% of their deposits in pesos from the private sector at that date to finance the purchase of capital goods or the construction of production installations. The line contemplates a maximum interest rate of 15% and a minimum term of 36 months for repayment, and stipulates that half of the total amount must be granted to MiPyMES. For 2013 the line was expanded by another 5% of the private sector’s deposits in pesos existing as of November 2012.
The private sector deposits in pesos grew by 41% in 2012, whereas those denominated in dollars experienced a 35% decrease. Consistent with a lesser degree of economic activity, the total of loans to the private sector in pesos increased by 41%, showing a deceleration with respect to the growth recorded in 2011 (48%). The loans in foreign currency showed the opposite behavior, with a decrease of 42% as compared to an increase of 27% in 2011. This was a consequence of the restrictions imposed on the foreign exchange market, which caused an outflow of deposits in dollars and therefore a fall in foreign exchange loans, partially compensated by an increase of the lines in pesos.
In this constantly challenging context, during the year 2012, BBVA Francés achieved a return on equity (“ROE”) of 28% and a 3% return on assets (“ROA”). This shows its great capacity and flexibility to adapt to changing scenarios while maintaining a remarkable generation of results.
The private loan portfolio reached a total of Ps.28,982 billion, a 25% expansion over the previous year. As for the different segments, in Middle Market we have consolidated our share on assets by emphasizing the spread management. We have also
deepened our relationship with clients, focusing on the sale of transactional products. It is important to mention, the successful placement of loans for the financing of investment projects carried out in the framework of the Communication “A” 5319 issued by the Central Bank.
In Corporate & Investment Banking, we have been leaders with 16 corporate bond issuances, against seven in 2011, which allowed us to reach a market share of 17% in this product (source: BBVA Francés figures, based on public information available in the National Securities Commission -CNV- and the Open Electronic Market -MAE-).
In Retail Banking, we significantly strengthened our business position through profitable strategic alliances, which gave us a real competitive advantage over our main competitors. In addition, 2012 has been a record year in insurance sales, with a 45% increase in premiums invoiced as compared to 2011.
We must point out the prudent risk management that characterizes the Group, which made possible to remain as the best in the financial system in terms of asset quality, with a NPL ratio of 0.5% and coverage of 316%.
As for the clients’ resources, they totaled Ps.34,165 billion, a 17% growth during 2012, sight deposits increased by 23%, and term deposits only 11%. It is important to mention that after the regulations regarding the purchase of foreign exchange and foreign trade, the financial system suffered a significant loss on dollars deposits. For this reason the Bank recorded a decrease of 34% in such deposits over the year, totaling Ps.3,459 billion (equivalent to U.S.$703 million) at December 2012, which represented 10% of the Bank’s total deposits.
All this has been carried out with a significant improvement in satisfaction indices as regards to our clients and employees, proving once more BBVA Francés´ commitment to people.
Critical Accounting Policies
(amounts expressed in thousands)
Our Consolidated Financial Statements are prepared in accordance with the rules prescribed by the Central Bank, which differ in certain respects from generally accepted accounting principles in Argentina, as described in Notes 3 and 4 to the Consolidated Financial Statements. These rules require us and our subsidiaries to make estimates and assumptions. Some of these estimates require difficult, subjective or complex judgments about matters that are inherently uncertain, and as a result, actual results could differ from those estimates. Due to the estimation process involved, the following summarized accounting policies and their applications are considered to be critical to understanding the business operations, financial condition and results of operations of the Bank and its subsidiaries.
Allowance for Commercial Loan Losses
We provide for estimated possible losses on loans and the related accrued interest generally through the establishment of an allowance for loan losses. The allowance for commercial loan losses charged to expense is determined by management based on a periodic analysis of updated financial information provided by the debtor at our request. The basic assessment criterion is the future debt payment capacity or the collateral granted to us on the basis of the estimated cash flow. We also take into account other circumstances such as timely compliance with obligations, qualified and honest management, whether the company is engaged in economic activities with acceptable prospects and the competitiveness of the debtor within its industry.
On the basis of these conditions, the customer is placed in one of six categories established by the Central Bank that have been assigned minimum fixed allowance requirements. Based on our analysis, we book additional allowances for certain debtors, which does not require recategorizing the debtor under the rules of the Central Bank. The use of different estimates or assumptions could result in different allowances for commercial loan losses.
Contingent Liabilities
We are subject to proceedings, lawsuits and other claims related to labor, commercial, civil and other matters. We make determinations of the amount of reserves required, if any, for these contingencies after a careful analysis of each individual issue. The required reserves may change in the future due to new developments in each matter or changes in the settlement strategy.
We are a defendant in several actions in which the petitioner claims the Government measures taken with respect to their deposits during the Argentine Crisis was a violation of constitutional law. Several judges in these actions have issued injunctions against us ordering: 1) the reimbursement of deposits in amounts larger than those provided for under current legislation, 2) the release of rescheduled deposits or 3) inapplicability of the “emergency framework” legislation passed by the National Congress and the
measures issued by the Federal Executive or the Central Bank. Pursuant to the decisions handed down by Argentina’s Supreme Court of Justice (“Massa, Juan Agustín v. Argentine Executive Branch – Executive Order 1570/ et al over action for the protection of constitutional rights (amparo) Law Nr. 16,986” and “Kujarchuk v. Argentine Executive Branch”), a calculation method was established for the payment of bank deposits that was different from the one that had been instituted by the Argentine Executive Branch. As of December 31, 2012 and 2011, we estimated this contingency and it has raised allowances for the total amount.
At December 31, 2012, as described in Note 3.4.13 to the Consolidated Financial Statements, the Bank records as an intangible asset the difference in nominal terms between the deposit at the free market exchange rate at the moment of each payment compared to the book value of 1.40 pesos per dollar plus CER to that date. This asset has been amortized in 60 monthly installments from April 2003. As of December 31, 2012 these assets have been fully amortized, with the total accumulated amortization as of December 31, 2012 amounting to Ps.1,378,511. Moreover, we explain in that note to the Consolidated Financial Statements that the amortization described above is charged solely to comply with the regulations of the Central Bank and that it should not be interpreted as an implicit waiver of possible compensation or recovery of the exchange rate differences resulting from the compliance with court orders granted in actions seeking the protection of civil rights or other legal actions derived from the mandatory conversion of bank deposits into pesos.
Fair Value
We prepare our Consolidated Financial Statements in accordance with the rules of the Central Bank related thereto, which differ from U.S. GAAP in valuing financial instruments. U.S. GAAP requires financial instruments to be valued at fair value. We estimate the fair value as the amount at which a financial instrument could be exchanged in a current transaction between willing parties, other than in a forced sale or liquidation, and such value is best evidenced by a quoted market price, if one exists. In cases where quoted market prices are not available, fair value estimation is based on the quoted market price of a financial instrument with similar characteristics, the present value of expected future cash flows, or other valuation techniques, all of which are significantly affected by the assumptions used (see Note 22.14 to Consolidated Financial Statements).
Although we use our best judgment in estimating the fair value of these financial instruments, there are inherent weaknesses in any estimation technique. As a result, the fair value may not be indicative of the net realizable or liquidation value. Moreover, minor changes in the assumptions used could have a significant impact on the resulting estimated fair values.
For a detailed description of the applicable accounting principles, please see Note 3 to the Consolidated Financial Statements.
Differences Between Central Bank Rules and Generally Accepted Accounting Principles Effective in Argentina
The most significant valuation differences between the rules prescribed by the Central Bank and the professional accounting standards effective in Argentina are detailed below (see Note 4 to the Consolidated Financial Statements).
|
|
§
|
Valuation Criteria
|
|
|
(1)
|
Tax effects
|
As already indicated herein and in Note 5.1 to the Consolidated Financial Statements, the Bank has received various communications from the BCRA pursuant to which that BCRA indicates that the capitalization of items arising from the application of the deferred tax method is not allowed. In accordance with professional accounting standards currently in force in Argentina, a deferred tax asset should be recognized to the extent the reversal of temporary differences generates a future decrease in the tax effectively determined. As a result, the allowances set up by the Bank in this respect, for 256,900 and 109,600 as of December 31, 2012 and 2011, respectively, should be recovered.
|
|
(2)
|
Derivative financial instruments
|
As explained in Notes 3.4.14. and 12 to the Consolidated Financial Statements, as of December 31, 2012 and 2011, the Bank recorded the effects of interest rate swap agreements as established by the BCRA. Should the Bank had applied the professional accounting standards currently in force, the stockholders’ equity would have increased in 6,606 and would have decreased in 11,293, respectively. By contrast, the effect of the application of the professional accounting standards on the income statement for the fiscal years ended December 31, 2012, 2011 and 2010 would have been 17,899 (income), 13,887 (loss) and 2,470 (income), respectively.
|
|
(3)
|
Consolidar AFJP S.A. and Consolidar Retiro S.A. building acquisition
|
On September 25, 2009, the Bank acquired from Consolidar AFJP S.A. the latter’s undivided interest in the piece of real estate located in Avenida Independencia 169. The Bank booked a 20,109 write-down for the real estate in its stand-alone and consolidated balance sheet as of December 31, 2011 to reflect the result from the transaction attributable to the Bank’s ownership interest in the company. The professional accounting standards currently in force in Argentina do not require the mentioned adjustment.
On June 7, 2011, the Bank acquired from Consolidar Retiro S.A. the latter’s undivided interest in the piece of real estate located in Avenida Independencia 169. The Bank booked a 7,062 write-down for the real estate in its stand-alone and consolidated balance sheet as of December 31, 2011 to reflect the result from the transaction attributable to the Bank’s ownership interest in the company as of that date. The professional accounting standards currently in force in Argentina do not require the mentioned adjustment.
The entire undivided interest that the Bank owned in the property situated at Avenida Independencia 169 was sold on March 1, 2012.
In all other material respects, Central Bank rules are consistent with generally accepted accounting principles in Argentina.
Differences Between Other Regulatory Bodies and Accepted Accounting Principles Effective in Argentina
|
|
a)
|
Arising from the application of the accounting standards laid down by the SSN and the main differences with the professional accounting standards in force in Argentina:
|
The items included under the captions Other subsidiaries’ assets and Other subsidiaries’ liabilities were valued in accordance with the regulations of the SSN.
|
|
b)
|
Arising from the application of the accounting standards laid down by the BCRA and the professional accounting standards in force in Argentina:
|
|
|
(i)
|
The commissions paid by PSA Finance Argentina Cía. Financiera S.A. to dealers for granting financing to companies and to the public in general in connection with purchases and sales of automobiles, which in accordance with the rules established by the BCRA are charged to the Income Statement, should be accrued throughout the duration of the loans generated by said dealers in accordance with currently applicable professional accounting standards. Had this criterion been applied, shareholders’ equity would have been increased by 10,636 and 10,380 as of December 31, 2012 and 2011, respectively.
|
|
|
(ii)
|
The Bank has not made disclosures required by professional accounting standards in force in Argentina on discontinued operations or discontinuation in relation to the process of liquidating its subsidiary Consolidar AFJP S.A. (undergoing liquidation proceedings).
|
|
A.
|
Operating Results
|
The Bank presents its Consolidated Financial Statements in equivalent purchasing power, following the restatement method established by FACPCE Technical Resolution Nr. 6 (modified by Technical Resolution Nr. 19), using an adjustment rate derived from the internal inflation rate (WPI) published by the INDEC.
According to the above-mentioned method, the accounting measurements were restated according to the purchasing power changes of August 31, 1995. As of that date, based on the prevailing economic stability conditions and according to CNV General Resolution Nr. 272 and Central Bank Communication “A” 2365, the accounting measures were not restated through December 31, 2001. In light of CNV General Resolution Nr. 415 and Central Bank Communication “A” 3702, the method was reinstated effective as of January 1, 2002, considering the previous accounting measures restated as of December 31, 2001.
By means of Communication “A” 3921 of the Central Bank and CNV General Resolution Nr. 441/03 in compliance with Decree Nr. 664/03 of the Executive Branch, the application of the restatement method on financial statements in equivalent purchasing power was suspended as of March 1, 2003. Accordingly, we applied the restatement method only until February 28, 2003.
The following discussion is based upon information contained in the Consolidated Financial Statements and should be read in conjunction with them. The Consolidated Financial Statements have been prepared in accordance with the rules of the Central Bank
related thereto (Argentine Banking GAAP), which differ in certain respects from Argentine GAAP and U.S. GAAP. The principal differences between Argentine Banking GAAP and U.S. GAAP are discussed in Note 22 to the Consolidated Financial Statements as they relate to us, together with a reconciliation to U.S. GAAP of our net income and total stockholders’ equity. For a more detailed description of the accounting principles and considerations used in preparing the following discussion, see
“Presentation of Financial Information”
.
Results of Operations for the Fiscal Years Ended December 31, 2012, 2011 and 2010.
Overview
Our net income for the fiscal year ended December 31, 2012 was Ps.1,263.7 million (including a loss from discontinued operations of Ps.2.0 million). This income was mainly due to a 48.10% increase in Gross Intermediation Margin; 29.25% increase in Service Charge Income and a 24.10% increase in Other Income, partially offset by a 30.66% increase in Operating Expenses; a 56.54% increase in Income Tax; a 121.44% increase in Other Expenses; a 31.58% increase in Service Charge Expenses; a 93.17% increase in Allowances for Doubtful Loans and a 327.74% increase in Minority Interest in Subsidiaries (loss).
Our net income for the fiscal year ended December 31, 2011 was Ps.1,005.6 million (including an income from discontinued operations of Ps.58.7 million). This income was mainly due to a 31.84% increase in Service Charge Income; a 65.70% decrease in Other Expenses; a 60.07% increase in Other Income; a 26.03% decrease in Allowances for Doubtful Loans and a 72.84% decrease in Minority Interest in Subsidiaries, partially offset by a 18.37% decrease in Gross Intermediation Margin; a 16.04% increase in Operating Expenses; a 74.88% increase in Income Tax and a 27.87% increase in Service Charge Expenses;.
Financial Income
Our Financial Income increased 49.81% to Ps.5,714.9 million for the fiscal year ended December 31, 2012 from Ps.3,814.7 million for the fiscal year ended December 31, 2011 and decreased 0.73% from Ps.3,842.7 million for the fiscal year ended December 31, 2010.
The Financial Income discussed above includes income from discontinued operations of Ps.9.7 million, Ps.249.7 million and Ps.544.4 million for the fiscal years ended December 31, 2012, 2011 and 2010, respectively.
The components of our Financial Income are reflected in the following table.
|
December 31,
|
||||||||||||
|
2012
|
2011
|
2010
|
||||||||||
|
(in thousands of pesos)
|
||||||||||||
|
Interest on cash and due from banks
|
2 | 13 | ||||||||||
|
Interest on loans to the financial sector
|
256,597 | 136,903 | 99,820 | |||||||||
|
Interest on overdraft
|
725,890 | 420,127 | 301,832 | |||||||||
|
Interest on loans with privileged guarantees
|
524,182 | 318,584 | 216,412 | |||||||||
|
Interest on credit card loans
|
625,692 | 361,658 | 229,657 | |||||||||
|
Interest on other loans
|
2,187,274 | 1,455,611 | 1,153,528 | |||||||||
|
Net income from government and private securities
|
640,547 | 493,185 | 1,471,135 | |||||||||
|
Net income from options
|
255 | 404 | 4,494 | |||||||||
|
Interest from other receivables from financial transactions
|
36,376 | 31,725 | 13,249 | |||||||||
|
Indexation by benchmark stabilization coefficient (CER)
|
129,120 | 96,873 | 9,117 | |||||||||
|
Other
|
588,988 | 499,613 | 343,414 | |||||||||
|
Total
|
5,714,921 | 3,814,685 | 3,842,671 | |||||||||
The increase in Financial Income during the fiscal year ended December 31, 2012 was mainly due to an increase in interest on other loans, interest on overdraft, interest on credit card loans, interest on loans with privileged guarantees, interest on loans to the financial sector, net income from government and private securities, other financial income, indexation by benchmark stabilization coefficient (CER) and interest from other receivables from financial transactions. These increases were partially offset by a decrease in net income from options. This variation reflected an increase in nominal interest rate of interest earning assets and an increase in average volume of assets.
The decrease in Financial Income during the fiscal year ended December 31, 2011 was mainly due to a decrease in net income from government and private securities, net income from options and interest in cash and due from banks. These decreases were
partially offset by an increase in interest on other loans, other financial income, interest on credit card loans, interest on overdraft, interest on loans with privileged guarantees, indexation by benchmark stabilization coefficient (CER), interest on loans to the financial sector and interest from other receivables from financial transactions. This variation reflected a decrease in nominal interest rate of interest earning assets partially offset by an increase in average volume of assets.
The following table sets forth the changes in financial income due to increases or decreases in volume and increases or decreases in nominal rates of average interest-earning assets. Such financial income excludes exchange differences and premiums or forward sales of foreign exchange.
|
December 31, 2012
vs.
December 31, 2011
Increase (Decrease)
|
December 31, 2011
vs.
December 31, 2010
Increase (Decrease)
|
|||||||
|
Financial income due to change in:
|
(in thousands of pesos)
|
(in thousands of pesos)
|
||||||
|
the volume of interest-earning assets
|
713,253 | 598,341 | ||||||
|
average nominal rates of interest-earning assets
|
1,213,343 | (617,150 | ) | |||||
|
the volume and average nominal rates of interest-earning assets
|
(370 | ) | 1,984 | |||||
|
Net Change
|
1,926,226 | (16,825 | ) | |||||
Financial Expenses
Financial Expenses increased 52.96% to Ps.2,057.9 million in the fiscal year ended December 31, 2012 from Ps.1,345.5 million in the fiscal year ended December 31, 2011 and increased 64.51% from Ps.817.8 million in the fiscal year ended December 31, 2010.
The Financial Expenses discussed above include an income from discontinued operations of Ps.3.3 million and Ps.10.3 million for the fiscal years ended December 31, 2012 and 2011, respectively, and included a loss from discontinued operations of Ps.3.1 million for the fiscal year ended December 31, 2010.
The components of our Financial Expenses are reflected in the following table.
|
December 31,
|
||||||||||||
|
2012
|
2011
|
2010
|
||||||||||
|
(in thousands of pesos)
|
||||||||||||
|
Interest on checking accounts
|
— | — | 5,298 | |||||||||
|
Interest on savings deposits
|
11,148 | 9,183 | 6,670 | |||||||||
|
Interest on time deposit
(1)
|
1,526,967 | 1,045,268 | 610,376 | |||||||||
|
Interest from other liabilities from financial transactions
|
123,289 | 34,054 | 6,424 | |||||||||
|
Indexation by benchmark stabilization coefficient (CER)
|
157 | 168 | 240 | |||||||||
|
Other
|
396,310 | 256,730 | 188,815 | |||||||||
|
Total
|
2,057,871 | 1,345,403 | 817,823 | |||||||||
|
|
(1)
|
Includes interest on “CEDROS”.
|
Taxes on Financial Income and Contributions to the Bank Deposit Guarantee Insurance System, included in Financial Expense—Other, amounted to Ps.341.4 million, Ps.211.2 million and Ps.143.3 million as of December 31, 2012, 2011 and 2010, respectively.
Contributions to the Bank Deposit Guarantee Insurance System increased during fiscal years 2012, 2011 and 2010 due to increases in the volume of time deposit, checking accounts and savings deposits.
The following table sets forth the changes in Financial Expenses due to the increases in volume and increases in nominal rates of average interest-bearing liabilities. Such Financial Expense excludes exchange rate variations and premiums on forward purchases of foreign exchange, contributions to Bank Deposit Guarantee Insurance System, mandatory contributions and taxes on interest income.
|
December 31, 2012
vs.
December 31, 2011
Increase / (Decrease)
|
December 31, 2011
vs.
December 31, 2010
Increase / (Decrease)
|
|||||||
|
Financial expense due to changes in:
|
(in thousands of pesos)
|
(in thousands of pesos)
|
||||||
|
the volume of interest-bearing liabilities
|
268,771 | 203,538 | ||||||
|
average nominal rates of interest-bearing liabilities
|
311,165 | 287,880 | ||||||
|
the volume and average nominal rates of interest-bearing liabilities
|
21 | 244 | ||||||
|
Net Change
|
579,957 | 491,662 | ||||||
Our average interest-bearing liabilities increased 18.58% from Ps.18.9 billion in fiscal year 2011 to Ps.22.4 billion in the fiscal year ended December 31, 2012. This increase was mainly attributable to increases in savings accounts, time deposits, borrowing from the Central Bank, borrowings from other financial entities, corporate bonds and other liabilities. Average dollar-denominated savings accounts decreased 28.37% from Ps.2,671.6 million in the fiscal year ended December 31, 2011 to Ps.1,913 million in the fiscal year ended December 31, 2012 due to the new regulations and average peso-denominated savings accounts increased 29.31% from Ps.4,784.5 million in the fiscal year ended December 31, 2011 to Ps.6,187.0 million in the fiscal year ended December 31, 2012. Average dollar-denominated time deposits decreased 23.89% from Ps.1,918.8 million in the fiscal year ended December 31, 2011 to Ps.1,460.4 million in the fiscal year ended December 31, 2012 due to the new regulations and average peso-denominated time deposits increased 25.00% from Ps.8,951.3 million in the fiscal year ended December 31, 2011 to Ps.11,189.0 million in the fiscal year ended December 31, 2012.
Our average interest-bearing liabilities increased 21.84% from Ps.15.5 billion in fiscal year 2010 to Ps.18.9 billion in the fiscal year ended December 31, 2011. This increase was mainly attributable to increases in savings accounts, time deposits, borrowing from the Central Bank borrowings from other financial entities and corporate bonds, partially offset by a decrease in other liabilities. Average dollar-denominated and peso-denominated savings accounts increased 17.51% and 23.28% from Ps.2,273.5 million and Ps.3,881.0 million in the fiscal year ended December 31, 2010 to Ps.2.671.6 million and Ps.4,784.5 million in the fiscal year ended December 31, 2011, respectively. Average dollar-denominated time deposits increased 7.22% from Ps.1,789.6 million in the fiscal year ended December 31, 2010 to Ps.1,918.8 million in the fiscal year ended December 31, 2011 and average peso-denominated time deposits increased 42.03% from Ps.6,302.2 in the fiscal year ended December 31, 2010 to Ps.8,951.3 million in the fiscal year ended December 31, 2011.
See
“Item 4. Information on the Company—Selected Statistical Information—Changes in Interest Income and Interest Expense; Volume and Rate Analysis”.
Gross Intermediation Margin
Our Gross Intermediation Margin (defined as Financial Income minus Financial Expenses) of Ps.3,657.1 million in the fiscal year ended December 31, 2012 represented a 48.10% increase over our Gross Intermediation Margin of Ps.2,469.3 million in the fiscal year ended December 31, 2011 which in turn represented a 18.37% decreased over our Gross Intermediation Margin of Ps.3,024.8 million in the fiscal year ended December 31, 2010.
The Gross Intermediation Margin discussed above includes gains from discontinued operations of Ps.13.0 million, Ps.260.0 million and Ps.541.3 million for the fiscal years ended December 31, 2012, 2011 and 2010, respectively.
The following table sets forth the changes in our Gross Intermediation Margin:
|
|
December 31, 2012
vs.
December 31, 2011
Increase (Decrease)
|
December 31, 2011
vs.
December 31, 2010
Increase (Decrease)
|
||||||
|
Gross Intermediation Margin due to changes in:
|
(in thousands of pesos
)
|
(in thousands of pesos
)
|
||||||
|
the volume of interest-earning assets and interest-bearing liabilities
|
444,482 | 394,803 | ||||||
|
average nominal rates of interest-earning assets and interest-bearing liabilities
|
902,178 | (905,030 | ) | |||||
|
the volume and average nominal rates of interest-earning assets and interest-bearing liabilities
|
(391 | ) | 1,740 | |||||
|
Net Change
|
1,346,269 | (508,487 | ) | |||||
The increase in the Gross Intermediation Margin in the fiscal year ended December 31, 2012 was principally due to a increase in the yield spread (nominal basis) from 5.69% in the fiscal year ended December 2011 to 7.99% in the fiscal year ended December 31,
2012, an increase in the volume of interest-bearing liabilities and interest-earning assets and an increase of average nominal rates of interest-bearing liabilities and interest-earning assets.
The decrease in the Gross Intermediation Margin in the fiscal year ended December 31, 2011 was principally due to a decrease in the yield spread (nominal basis) from 9.95% in the fiscal year ended December 2010 to 5.69% in the fiscal year ended December 31, 2011, increase in the volume of interest-bearing liabilities, increase of average nominal rates of interest-bearing liabilities and decrease in average nominal rates of interest-earning assets partially offset by increase in the volume of interest-earning assets.
See
“Item 4. Information on the Company—Selected Statistical Information—Average Balance Sheets, Interest Earned on Interest-Earning Assets and Interest Paid on Interest-Bearing Liabilities”
and
“Item 4. Information on the Company—Selected Statistical Information—Interest-Earning Assets: Net Interest Margin and Spread”.
Allowance for Loan Losses
Loan loss provisions totaled Ps.256.3 million in the fiscal year ended December 31, 2012, a 93.17% increase over Ps. 132.7 million in the fiscal year ended December 31, 2011, which represents a 26.03% decrease over Ps.179.4 million in the fiscal year ended December 31, 2010. The increase in fiscal year ended December 31, 2012 was mainly due to an increase in the NPL rate. During 2012 the impact of the inflation rate along with the delay in the resolution of certain collective bargaining agreements caused an increase in the NPL ratio, resulting in an increase of the expected losses within the consumer portfolio. The decrease in fiscal year ended December 31, 2011 was mainly due to the continuous improvement of the quality of Bank’s portfolio as well as the change in allowances’ policy as a result of periodically monitoring performance of the portfolios and financing.
Our non-performing loan portfolio amounted to Ps.187.9 million at December 31, 2012 a 78.26% increase over Ps.105.4 million at December 31, 2011 which in turn represented a 31.14% increase over Ps.80.4 million at December 31, 2010.
The non-performing loan portfolio ratio increased to 0.65% at December 31, 2012 from 0.45% at December 31, 2011, which decreased from 0.47% at December 31, 2010.
The charts below show how during 2012 the probability of default increased within the consumer segment for the reason discussed above, while it remained stable within the commercial segment.


During 2011 and due to the evolution of out credit portfolios, it was decided to modify the allowance policy of the Bank by adjusting the coverage percentage to the arrears and loss expectations.
We reduced our allowance percentages during 2011 because of the higher quality of our credit portfolio during the year. The higher quality of our credit portfolio resulted in an improvement of our expected loss prospects, which resulted, in turn, in such percentual decrease. The graphics below show how historically there is usually a reduction of expected losses, both in consumer and commercial portfolios, in a favorable economic scenario such as the period from 2009 to 2011 in Argentina. On the contrary, in years of economic stress, the trend is for the expected loss prospects to increase. This explains why we decided to reduce our allowance percentages during the 2011 fiscal year.

In June 2011 the generic allowance for the credit card products, which fell within the range of 1% to 3% prescribed by the BCRA for loans in the normal situation), was reduced from 2.5% to 2% in order to make it consistent with the allowance rate applicable the rest of the retail portfolio. In the wholesale sector, in June and December 2011 the allowance percentage was reduced from 1.50% to 1.25% due to the improvement in the quality of the portfolio showed after a evaluation using the the expected loss method.
As a result, as of December 31, 2011 the percentages of allowances for the entire portfolio that fell within the range of 1% to 3% prescribed by the BCRA for loans in the normal situation were as follows:
|
Product
|
Commercial
|
Commercial-like consumer
|
Consumer
|
|
Overdraft
|
1.25%
|
1.25%
|
2.00%
|
|
Corporate bonds
|
|||
|
Pledges
|
|||
|
Personal
|
|||
|
Credit accounts
|
|||
|
Checks
|
|||
|
Credit cards
|
|||
|
Negotiated securities
|
|||
|
Foreign trade
|
|||
|
Loans to companies
|
|||
|
Financial loans
|
|||
|
Mortgages
|
1.00%
|
1.00%
|
1.00%
|
|
Remaining product allowances
|
1.25%
|
1.25%
|
1.25%
|
Below is a table presenting the expected loss analysis:
|
2011
|
Probability of default
|
Severity of loss
|
Expected loss
|
Variation 2011/2010
|
||||
|
Corporate
|
1.00%
|
22.94%
|
0.23%
|
(53.8)%
|
||||
|
Middle-market
|
3.01%
|
51.31%
|
1.55%
|
(5.2)%
|
As a result of these adjustments, loan loss allowances were reduced by Ps. 101 million in 2011.
Our management believes that our allowance for loan losses is adequate to cover any known losses and any losses inherent in its loan portfolio. For a discussion of our policy with respect to the establishment of our allowance for loan losses see
“Item 4. Information on the Company—Selected Statistical Information—Allowance for Loan Losses and Loan Loss Experience”.
Service Charge Income
Service Charge Income was Ps.2,530.2 million for the fiscal year ended December 31, 2012, Ps.1,957.6 million for the fiscal year ended December 31, 2011 and Ps.1,484.8 million for the fiscal year ended December 31, 2010. The fiscal year 2012 amount represented a 29.25% increase from the amount earned in fiscal year 2011. The fiscal year 2011 amount represented a 31.84% increase from the amount earned in fiscal year 2010.
The Service Charge Income discussed above includes a loss from discontinued operations of Ps.0.1 million and Ps.0.6 million for the fiscal years ended December 31, 2011 and 2010.
The following table provides a breakdown of our Service Charge Income by category.
|
December 31,
|
||||||||||||
|
2012
|
2011
|
2010
|
||||||||||
|
|
(in thousands of pesos)
|
|||||||||||
|
Service charges on deposit accounts
|
680,052 | 554,365 | 439,817 | |||||||||
|
Credit card operations
|
804,853 | 578,716 | 402,328 | |||||||||
|
Other fees related to foreign trade
|
87,923 | 87,604 | 71,174 | |||||||||
|
Credit-related fees
|
275,209 | 185,854 | 117,747 | |||||||||
|
Fund management fees
|
38,181 | 32,560 | 26,797 | |||||||||
|
Capital markets and securities activities
|
19,539 | 24,617 | 27,014 | |||||||||
|
Rental of safety deposit boxes
|
95,101 | 75,798 | 53,482 | |||||||||
|
Fees related to guarantees
|
1,181 | 1,394 | 1,214 | |||||||||
|
Insurance agency
|
250,370 | 138,524 | 133,843 | |||||||||
|
Other
|
277,788 | 278,157 | 211,430 | |||||||||
|
Total
|
2,530,197 | 1,957,589 | 1,484,846 | |||||||||
Service charges on deposit accounts are comprised principally of maintenance fees on checking and savings accounts and transaction fees on checking accounts. These fees increased 26.04% from Ps.439.8 million in the fiscal year ended December 31, 2010 to Ps.554.4 million in the fiscal year ended December 31, 2011 and increased 22.67% to Ps.680.1 million at December 31, 2012. The increases in the fiscal years 2012 and 2011 were mainly due to increases in the volume and number of transactions of such accounts. At December 31, 2012 we had 2,452,015 of such accounts compared to 2,253,532 of such accounts at December 31, 2011 and compared to 2,047,987 of such accounts at December 31, 2010.
Income from credit card operations, which consists of customer fees, retailer transaction fees, merchant processing fees and penalty charges, increased 39.08% to Ps.804.9 million in the fiscal year ended December 31, 2012 from Ps.578.7 million in the fiscal year ended December 31, 2011 which in turn increased 43.84% to Ps.402.3 million in fiscal year ended December 31, 2010. The increases in the fiscal years 2012 and 2011 were mainly due to increases in activity, in the use of credit cards and in the volume of credit cards issued. At December 31, 2012, the total number of credit cards we issued amounted to 2,368,605 compared to 2,024,038 at December 31, 2011 and 1,724,953 at December 31, 2010.
Other fees related to foreign trade increased 23.08% from Ps.71.2 million in the year ended December 31, 2010 to Ps.87.6 million in the year ended December 31, 2011 and increased 0.36% to Ps.87.9 million in the year ended December 31, 2012. The increase in the fiscal year 2011 were mainly due to increase in volume of foreign trade and for the fiscal year ended December 31, 2012 had not registered a significative variation.
Credit related fees increased 57.84% from Ps.117.7 million in the fiscal year ended December 31, 2010 to Ps.185.9 million in the year ended December 31, 2011 and increased 48.08% to Ps.275.2 million in the fiscal year ended December 31, 2012. These increases were mainly due to the increase in the granting of new loans by our subsidiary PSA Finance for the purchase of new and second-hand cars.
Fees related to fund management increased 21.51% from Ps.26.8 million in the fiscal year ended December 31, 2010 to Ps.32.6 million in the fiscal year ended December 31, 2011 and increased 17.26% to Ps.38.2 million in the fiscal year ended December 31, 2012, owed principally to the increase in volume of securities traded by the Bank and its subsidiary BBVA Francés Asset Management.
Income from capital markets and securities activities principally represents fees from underwriting and placement of corporate bonds, commercial paper and equity securities. It also reflects fees for our corporate advisory business, but excludes gains from trading Government Securities. Trading gains or loss are included in “Financial Income” or “Financial Expenses”, respectively, under “Net income / (expense) from Government and Private Securities”. Finally, income from capital markets and securities activities also includes brokerage commissions earned by BBVA Francés Valores, BBVA Francés’ securities brokerage subsidiary, but does not include similar income earned by BBVA Francés itself, which is recorded as “Financial Income” under “Net income from Government and Private Securities”. Income from capital markets and securities activities decreased 8.87% from Ps.27.0 million in the fiscal year ended December 31, 2010 to Ps.24.6 million in the fiscal year December 31, 2011 and decreased 20.63% to Ps.19.5 million in the fiscal year ended December 31, 2012, mainly due to the decrease in securities trading.
Rental of safety deposit boxes increased 41.73% from Ps.53.5 million in the fiscal year December 31, 2010 to Ps.75.8 million in the fiscal year ended December 31, 2011 and increased 25.47% to Ps.95.1 million in the fiscal year ended December 31, 2012. These increases were mainly due to the increase in the demand of this service and to increases in prices of the service.
Fees related to guarantees increased 14.83% from Ps.1.2 million in the fiscal year ended December 31, 2010 to Ps.1.4 million in the fiscal year ended December 31, 2011 and decreased 15.28% to Ps.1.2 million in the fiscal year ended December 31, 2012. The variations of this item reflect the activity in this line of products.
Fees related to insurance agency increased 3.50% from Ps.133.8 million in the fiscal year ended December 31, 2010 to Ps.138.5 million in the fiscal year ended December 31, 2011 and increased 80.74% to Ps.250.4 million in the fiscal year ended December 31, 2012. The increases of this item reflect more commission generated by the sale of assurance products.
Other service charge income increased 31.56% from Ps.211.4 million in the fiscal year ended December 31, 2010 to Ps.278.2 million in the fiscal year ended December 31, 2011 and increased 44.40% to Ps.401.6 million in the fiscal year ended December 31, 2012, mainly due to an increase in fees for use and transactions in ATMs.
Service Charge Expenses
Service charge expenses, which consist of fees related to credit and debit cards and taxes on service charge income, increased 31.58% to Ps.683.7 million at December 31, 2012 from Ps.519.6 million at December 31, 2011, which increased 27.87% from Ps.406.4 million in the fiscal year ended December 31, 2010, mainly as result of the increase in commissions paid for promotion with credit cards.
Operating Expenses
Our operating expenses increased 30.66% to Ps.3,061.7 million in the fiscal year ended December 31, 2012 to Ps.2,343.2 million in the fiscal year ended December 31, 2011, which increased 16.04% from Ps.2,019.4 million in the fiscal year ended December 31, 2010.
The Operating Expenses discussed above include a loss from discontinued operations of Ps.22.0 million, Ps.63.7 million and Ps.49.9 million for the fiscal years ended December 31, 2012, 2011 and 2010, respectively.
Operating expenses increased in fiscal year 2012 mainly because of increases in: (i) personnel expenses, (ii) other operating expenses, (iii) taxes, (iv) credit card advertising and issuance expenses, (v) fees and external administrative service, (vi) maintenance and repairs, (vii) advertising and promotion, (viii) depreciation of Bank premises and equipment, (ix) courier transportation, (x) rentals, (xi) utilities, (xii) staff welfare expenses, (xiii) amortization of organization and development expenses and (xiv) business travel and development expenses.
The components of our Operating Expenses are reflected in the following table:
|
December 31,
|
||||||||||||
|
2012
|
2011
|
2010
|
||||||||||
|
|
(in thousands of pesos)
|
|||||||||||
|
Personnel expenses
|
1,532,772 | 1,195,631 | 1,057,202 | |||||||||
|
Fees and external administrative services
|
127,367 | 83,213 | 126,703 | |||||||||
|
Taxes
|
229,227 | 176,353 | 130,768 | |||||||||
|
Utilities
|
58,458 | 41,221 | 34,940 | |||||||||
|
Depreciation of Bank property and equipment
|
86,813 | 65,070 | 57,737 | |||||||||
|
Credit card advertising and issuance expense
|
175,959 | 130,349 | 93,379 | |||||||||
|
Courier transportation
|
60,930 | 42,076 | 33,947 | |||||||||
|
Advertising and promotion (excluding credit card advertising)
|
133,642 | 108,965 | 90,215 | |||||||||
|
Maintenance and repairs
|
130,202 | 97,602 | 69,351 | |||||||||
|
Business travel and development
|
22,098 | 14,447 | 14,877 | |||||||||
|
Staff welfare
|
48,619 | 33,328 | 26,599 | |||||||||
|
Amortization of organization and development expenses
|
40,744 | 28,937 | 23,858 | |||||||||
|
Rentals
|
118,726 | 101,441 | 78,646 | |||||||||
|
Other
|
296,151 | 224,567 | 181,156 | |||||||||
|
Total
|
3,061,708 | 2,343,200 | 2,019,378 | |||||||||
The largest component of Operating Expenses in each of these years was personnel expenses, which increased 28.20% to Ps.1,532.8 million in the fiscal year ended December 31, 2012 from Ps.1,195.6 million in the fiscal year ended December 31, 2011, which in turn increased 13.09% from Ps.1,057.2 in the fiscal year ended December 31, 2010, principally as result of increases in salaries (which include payroll, termination payments and bonuses).
The number of our full-time employees increased from 4,576 in the fiscal year ended December 31, 2010 to 5,011 in the fiscal year ended December 31, 2011 which in turn increased to 5,146 in the fiscal year ended December 31, 2012 (not including 137 employees, 12 employees and 12 employees from non-banking subsidiaries at December 31, 2010, 2011 and 2012, respectively). The increase in fiscal year 2011 was mainly due to enlisting of staff who was working in call centers and those who was working in Consolidar Comercializadora S.A. (that merged by absorption into BBVA Francés in 2011).
Other operating expenses increased 31.88% to Ps.296.2 million in the fiscal year ended December 31, 2012 from Ps.224.6 million at December 31, 2011 which in turn increased 23.96% from Ps.181.2 million in the fiscal year ended December 31, 2010. The increase in fiscal years 2012 and 2011 was mainly due to the increases in costs related with ATM network administration, value carriers and the increase in activity.
Taxes, other than income tax, increased 29.98% to Ps.229.2 million in the fiscal year ended December 31, 2012 from Ps.176.4 million in the fiscal year ended December 31, 2011 which in turn increased 34.86% from Ps.130.8 million in the fiscal year ended December 31, 2010. The increases in fiscal years 2012 and 2011 were mainly due to an increase in activity.
Credit card advertising and issuance expenses increased 34.99% to Ps.176.0 million in the fiscal year ended December 31, 2012 from Ps.130.3 million in the fiscal year ended December 31, 2011 which in turn increased 39.59% from Ps.93.4 million in the fiscal year ended December 31, 2010. The increases in both fiscal years were mainly due to the launching of credit card products.
Fees and external administrative services increased 53.06% to Ps.127.4 million in the fiscal year ended December 31, 2012 from Ps.83.2 million at December 31, 2011 which in turn decreased 34.32% from Ps.126.7 million in the fiscal year ended December 31, 2010. The variations in this item during fiscal years 2012 and 2011 were related with the cost of services and fluctuations in the cost of hiring external resources.
Maintenance and repairs expenses increased 33.40% to Ps.130.2 million in the fiscal year ended December 31, 2012 to Ps.97.6 million in the fiscal year ended December 31, 2011 and increased 40.74% from Ps.69.4 million in the fiscal year ended December 31, 2010. The increases in fiscal years 2012 and 2011 were mainly due to the higher maintenance and repairs costs.
Advertising and promotion fees increased 22.65% to Ps.133.6 million in the fiscal year ended December 31, 2012 from Ps.109.0 million at December 31, 2011 and increased 20.78% from Ps.90.2 million in the fiscal year ended December 31, 2010. The variations in this item were mainly due to an increase of advertising expenses to credit products joined with the sponsoring in football during the fiscal years ended December 31, 2012 and 2011.
Depreciation of Bank property and equipment increased 33.41% to Ps.86.8 million in the fiscal year ended December 31, 2012 from Ps.65.1 million in the fiscal year ended December 31, 2011 which in turn increased 12.70% from Ps.57.7 million in the fiscal year ended December 31, 2010. The increases in fiscal years 2012 and 2011 were mainly due to increases in additions to the Bank’s properties and equipment.
Courier transportation increased 44.81% to Ps.60.9 million at December 31, 2012 from Ps.42.1 million in the fiscal year ended December 31, 2011 which in turn increased 23.95% from Ps.33.9 million in the fiscal year ended December 31, 2010. The increases in fiscal years 2012 and 2011 were mainly due to increases in the cost of the service.
Rentals expenses increased 17.04% to Ps.118.7 million in the fiscal year ended December 31, 2012 from Ps.101.4 million in the fiscal year ended December 31, 2011 which in turn increased 28.98% from Ps.78.6 million in the fiscal year ended December 31, 2010. The increases in fiscal years 2012 and 2011 were mainly due to the higher rental costs. At December 31, 2012 our branch network consisted of 244 branches, of which 112 were located in properties we own and 132 were located in properties we lease.
Utilities costs increased 41.82% to Ps.58.5 million in the fiscal year ended December 31, 2012 from Ps.41.2 million at December 31, 2011 which in turn increased 17.98% from Ps.34.9 million in the fiscal year ended December 31, 2010. The increases in fiscal years 2012 and 2011 were mainly due to an increase in the activity.
Staff welfare expenses increased 45.88% to Ps.48.6 million in the fiscal year ended December 31, 2012 from Ps.33.3 million in the fiscal year ended December 31, 2011 which in turn increased 25.30% from Ps.26.6 million in the fiscal year ended December 31, 2010. The variations in this item reflect the grant in other personnel benefits.
Amortization of organization and development expenses increased 40.80% to Ps.40.7 million in the fiscal year ended December 31, 2012 from Ps.28.9 million in the fiscal year ended December 31, 2011 which in turn increased 21.29% from Ps.23.8 million in the fiscal year ended December 31, 2010. The increases in fiscal years 2012 and 2011 were mainly due to a large number of additions.
Business travel and development increased 52.96% to Ps.22.1 million in the fiscal year ended December 31, 2012 from to Ps.14.4 million at December 31, 2011 which in turn decreased 2.89% from Ps.14.9 million in the fiscal year ended December 31, 2010. The increase in 2012 was due to an increase in travel and commissions sent abroad, however in 2011 these were reduced..
Other Income
Other Income increased 24.10% to Ps.408.0 million at December 31, 2012 from Ps.328.8 million at December 31, 2011 which in turn increased 60.07% from Ps.205.4 million at December 31, 2010.
The Other Income discussed above includes an income from discontinued operations of Ps.5.4 million, Ps.78.7 million and Ps.58 million for the fiscal years ended December 31, 2012, 2011 and 2010, respectively.
The increase in fiscal year 2012 was mainly due to a 211.42% increase in deferred income tax; a 1,926.88% increase in gain from the sale of premises and equipment and other assets due to the sale of the building of Consolidar AFJP and Consolidar Retiro on Independencia 169; and a 331.13% increase in adjustment and interest for other Receivables. These increses were partially offset by a 63.83% decrease in others income; a 35.60% decrease in long-term investments and a 17.63% decrease in loans recovered and reversals of allowances.
The increase in fiscal year 2011 was mainly due to a 422.73% increase for income from long-term investments and an increase in deferred income tax. These increases were partially offset by a 33.45% decrease in recoveries of charged-off loans and reversal of allowances and decrease in premiums of insurance companies.
Other Expenses
Other Expenses increased 121.44% to Ps.429.0 million at December 31, 2012 from Ps.193.7 million at December 31, 2011 and decreased 65.70% from Ps.564.8 million in the fiscal year ended December 31, 2010.
The Other Expenses discussed above include a loss from discontinued operations of Ps.198.5 million and Ps.456.7 million for the fiscal years ended December 31, 2011 and 2010, respectively.
The increase in the fiscal year ended December 31, 2012 was mainly due to a 174.37% increase in provisions for other receivables and other allowances (from Ps.128.1 million in fiscal year ended December 31, 2011 to Ps.351.5 million in fiscal year ended December 31, 2012); a 92.36% increase in other expenses (from Ps.20.8 million in the fiscal year ended December 31, 2011 to Ps.40.0 million in the fiscal year ended December 31, 2012); a 36.00% increase in sinisters (from Ps.4.6 million in the fiscal year ended December 31, 2011 to Ps.6.2 million in the fiscal year ended December 31, 2012) and 13.77% increase in donations (from Ps.10.2 million in the fiscal year ended December 31, 2011 to Ps.11.6 million in the fiscal year ended December 31, 2012), partially offset by a 32.26% decrease in depreciation on differences paid on constitutional protection action (from Ps.28.4 million in the fiscal year ended December 31, 2011 to Ps.19.3 million in the fiscal year ended December 31, 2012).
The decrease in the fiscal year ended December 31, 2011 was mainly due to a 95.57% decrease in other expenses, which mainly include mathematical reserve and life annuities of insurance companies (from Ps.468.8 million in the fiscal year ended December 31, 2010 to Ps.20.8 million in the fiscal year ended December 31, 2011), a 18.93% decrease in depreciation on differences paid on constitutional protection action (from Ps.35.1 million in the fiscal year ended December 31, 2010 to Ps.28.4 million in the fiscal year ended December 31, 2011) and a 49.73% decrease in depreciation of other assets (from Ps.0.7 million in fiscal year ended December 31, 2010 to Ps.0.4 million in fiscal year ended December 31, 2011), partially offset by a 156.67% increase in provisions for other receivables and other allowances (from Ps.49.9 million in fiscal year ended December 31, 2010 to Ps.128.1 million in fiscal year ended December 31, 2011) and a 36.32% increase in donations (from Ps.7.5 million in fiscal year ended December 31, 2010 to Ps.10.2 million in fiscal year ended December 31, 2011).
Income Tax
Income Tax expenses were Ps.864.7 million in the fiscal year ended December 31, 2012 a 56.54% increase from Ps.552.4 million in the fiscal year ended December 31, 2011 which in turn represented a 74.88% increase from Ps.315.8 million in the fiscal year ended December 31, 2010. The increase in fiscal year 2012 was mainly due to an increase in the fiscal valuation of certain government securities and the fiscal impact for the sale of the building of Consolidar AFJP and Consolidar Retiro and the sale of Consolidar ART. The increase in fiscal year 2011 was mainly due to fiscal impact of the sale of Consolidar Retiro and adjustment of the assessed value of government securities.
The following table illustrates, for each of the last three fiscal years, our income before tax, the income tax expense that would have been payable at the statutory rate, various adjustments and our actual income tax expense.
|
December 31,
|
||||||||||||
|
2012
|
2011
|
2010
|
||||||||||
|
(in thousands of pesos, except percentages)
|
||||||||||||
|
Net Income before income tax and minority interest
|
2,164,550 | 1,566,397 | 1,545,176 | |||||||||
|
Statutory tax rate
|
35% | 35% | 35% | |||||||||
|
Income tax (at statutory rate)
|
757,593 | 548,239 | 540,812 | |||||||||
|
Deferred tax
|
(51,555 | ) | (16,555 | ) | (87,990 | ) | ||||||
|
Tax-exempt income
|
(62,503 | ) | (66,222 | ) | (42,693 | ) | ||||||
|
Allowances on deferred tax assets
|
51,555 | 16,555 | 87,990 | |||||||||
|
Other
|
169,586 | 70,341 | (182,278 | ) | ||||||||
|
Income tax (gain) / loss
|
864,676 | 552,358 | 315,841 | |||||||||
|
(Allowances)
|
— | — | — | |||||||||
|
Income tax (gain) / loss, net
|
864,676 | 552,358 | 315,841 | |||||||||
|
Actual income tax
|
(864,676 | ) | (552,358 | ) | (315,841 | ) | ||||||
|
Deferred income tax
(1)
|
— | — | — | |||||||||
_______________
|
(1)
|
Included in Other Income and Income Tax.
|
Our effective income tax rates differ from the statutory income tax rate applicable to us. The difference between the statutory rate and the effective rate is principally due to the following factors. First, the income from local subsidiaries is tax exempt and depreciation of goodwill is not tax deductible. Second, the effective tax rate is affected by the different treatment of loan loss provisions for financial and tax reporting purposes. Additionally, the allowance made on public loans is not tax deductible. Finally, Government Securities are generally marked-to-market for tax reporting purposes, with unrealized gains and losses included in taxable income, even if such securities are carried on a cost-plus-yield basis for financial reporting purposes. See Note 22.1 to the Consolidated Financial Statements.
Minority interest in subsidiaries
Losses on minority interest were Ps.36.2 million, Ps.8.5 million and Ps.31.2 million for the fiscal years ended December 31, 2012, 2011 and 2010, respectively. These changes were mainly due to the changes in net income of Consolidar Group, for which we hold, for the fiscal years ended December 31, 2012 and 2011, a 53.89% interest in Consolidar AFJP
(
undergoing liquidation proceedings
)
and a 50% interest in PSA Compañía Financiera. And for the fiscal year ended December 31, 2010, a 53.89% interest in Consolidar AFJP
(
undergoing liquidation proceedings
)
, a 66.21% interest in Consolidar Seguros de Retiro and a 50% interest in PSA Compañía Financiera.
Financial Condition
Total Assets
At December 31, 2012 we had total assets of Ps.44,784.6 million, which represented a 14.82% increase from Ps.39,005.6 million as of December 31, 2011.
The increase was mainly due to a 24.56% increase in loans net of allowances (from Ps. 22,697.0
(1)
million at December 31, 2011 to Ps.28,493.4 million at December 31, 2012); a 35.59% increase in cash and due from banks (from Ps. 6,353.4 million at December 31, 2011 to Ps.8,614.9 million at December 31, 2012); a 22.40% increase in receivables from financial leases (from Ps.907.1 at December 31, 2011 to Ps.1,110.2 million at December 31, 2012); a 17.24% increase in other receivables (from Ps.711.9
(1)
million at December 31, 2011 to Ps.834.6 million at December 31, 2012); a 6.87% increase in bank premises and equipment (from Ps.580.1
million at December 31, 2011 to Ps.620.0 million at December 31, 2012); a 44.89% increase in intangible assets (from Ps.81.0 million at December 31, 2011 to Ps.117.3 million at December 31, 2012); a 15.61% increase in investments in other companies (from Ps.126.3 million at December 31, 2011 to Ps.146.0 million at December 31, 2012); a 18.81% increase in other assets (from Ps.28.7 million at December 31, 2011 to Ps.34.1 million at December 31, 2012) and a 69.80% increase in suspense items (from Ps.6.4 million at December 31, 2011 to Ps.10.8 million at December 31, 2012) partially offset by a 26.29% decrease in government and private securities (from Ps.5,565.0 at December 31, 2011 to Ps.4,101.8 million at December 31, 2012) and a 64.02% decrease in other receivables from financial transactions (from Ps.1,948.3 million at December 31, 2011 to Ps.700.9 million at December 31, 2012).
(1) See Note 3.3 to our Consolidated Financial Statements.
Total Liabilities and Stockholders’ Equity
At December 31, 2012, we had total liabilities and minority interests in subsidiaries of Ps.39,652.6 million representing a 12.85% increase from the Ps. 35,137.4 million at December 31, 2011.
The increase was mainly due to a 17.14% increase in deposits (from Ps. 29,165.7 million at December 31, 2011 to Ps.34,165.1 million at December 31, 2012); a 31.61% increase in other liabilities (from Ps. 1,078.3 million at December 31, 2011 to Ps.1,419.2 million at December 31, 2012); a 29.97% increase in allowances (from Ps.496.2 million at December 31, 2011 to Ps.645.0 million at December 31, 2012) and a 43.69% increase in minority interests in subsidiaries (from Ps.82.1 million at December 31, 2011 to Ps.118.0 million at December 31, 2012), partially offset by a 23.04% decrease in other liabilities from financial transactions (from Ps.4,268.5 million at December 31, 2011 to Ps.3,285.1 million at December 31, 2012) and a 56.66% decrease in suspense items (from Ps.46.2 million at December 31, 2011 to Ps.20.0 million at December 31, 2012).
Stockholders’ equity increased from Ps. 3,868.3 million at December 31, 2011 to Ps.5,131.9 million at December 31, 2012. The 32.67% increase reflected net income for the year (Ps.1,263.7 million) and the increases in Legal and Facultative reserves by Ps. 201.1 million and Ps.1,592.8 million, respectively, both of them with counterpart in retained earnings.
Significant changes in financial condition
During 2011 we experimented an increase in Cash and due from banks - Argentine Central Bank (BCRA), mainly due to a new regulation issued by BCRA (see “Item 4 – The Argentine Banking System and its Regulatory Framework – Reserve Requirements and Liquidity Requirements”). On September 2012, the BCRA through its Communication “A” 5356 eliminated the possibility of integrating reserves with cash balances. The new regulation is applied in three stages: in October banks were allowed to deduct 75% of their March cash balances, 25% in December and 0% in March. In addition, this effect was partially offset by a reduction of reserves according to each branch’s location and the mandatory assignment of loans to MiPyMES. The increase in the Argentine Central Bank’s current account with the Bank was partially offset by a decrease in the amount of government and private securities, instruments issued by the BCRA and a decrease in other receivables from financial transactions - repurchase agreements of government securities negotiated with the BCRA.
The private sector loan portfolio totaled Ps26,964.9 million at December 31, 2012, representing an increase of 24.4% compared to the prior twelve months. Both consumer loans and loans to small and medium-size companies showed an excellent performance during the year, growing 31.5% and 22.4%, respectively. Loans to large corporations decreased 9.3% mainly as a consequence of the fall in loans to finance foreign trade transactions. In July 2012, the BCRA issued a regulation (Communication “A” 5319), which requires certain financial institutions to allocate a minimum amount equal to 5% of total deposits to finance certain investment projects. At least 50% of such amount must be lent to MiPyMES at an annual interest rate of 15.01% with a minimum term of 36 months. The Bank complied with such requirements demonstrating a flexible retail management and deep business relationships with its customers. By the end of 2012, this line of credit was renewed through the BCRA Communication “A” 5380, extending the quota to 2013, at an interest rate of 15.25% with the minimum term of 36 months.
Our deposits grew during 2012 in line with the overall growth of the Argentine financial system. Both time deposits and checking and saving accounts registered significant growth during the fiscal year 2012. Pesos denominated deposits increased by 28% in the last twelve months and foreign currency denominated deposits fell 33.6% during the same period. The main reason for the fall of foreign currency denominated deposits was the introduction by the Argentine Government of several measures limiting the access to the purchase of foreign currency, which has caused certain uncertainty.
Other liabilities from financial transactions also decreased during 2012 as compared to the prior year because of the evolution in receivables from spot and forwards purchases and sales. These financial products are very volatile by nature because they include the balances from repurchase agreements of government securities, especially those negotiated with the BCRA. These types of transactions
are conducted on daily basis and on a very short-terms basis (1 to 5 days), with a view of investing our excess liquidity. For more information about the accounting recognition see Note 22.10 to the Consolidated Financial Statements. During January 2012, BBVA Francés placed the second issuance of its Series 2 corporate bond, which achieved a high level of demand and allowed the expansion of the initially planned issued amount of Ps.125 million to Ps.148.9 million. In addition our subsidiary PSA Finance Argentina Compañía Financiera S.A. issued during 2012 a corporate bond for to Ps.293.4 million.
|
B.
|
Liquidity and Capital Resources
|
Asset and Liability Management
The purpose of asset and liability management is to structure our consolidated balance sheet in light of interest rate, liquidity and foreign exchange risks, as well as market risk, public sector risk and capital structure. Our Asset and Liability Committee establishes specific limits with respect to risk exposure, sets policy with respect to pricing and approves commercial policies which may have a financial impact on our balance sheet. It is also responsible for the follow-up of monetary aggregates and financial variables, our liquidity position, regulations from the Central Bank and the competitive environment in assets, liabilities and interest rates.
Liquidity
Our asset and liability management policy attempts to ensure that sufficient liquidity is available to meet our funding requirements. As a measure of our liquidity, we had a ratio of liquidity assets to total deposits of 30.82%, 40.86% and 43.79% at December 31, 2012, 2011 and 2010, respectively. Liquid assets include cash, amounts due from banks and government and corporate securities (excluding holdings booked at amortized cost).
Our primary source of funds is our deposit base, which primarily consists of peso- and dollar-denominated deposits in checking accounts, savings accounts and time deposits from individuals and corporations, which deposits at December 31, 2012 totalled Ps.34,165.1 million.
Under a medium-term note program that expired in December 2005, we issued the first series of subordinated corporate bonds, on March 31, 1998.
On April 27, 2000, the general ordinary and extraordinary shareholders’ meeting approved the increase of the aggregate outstanding maximum amount of the corporate bonds to be issued under the medium-term note program to U.S.$1,000 million.
On February 9, 2007, the Bank’s board of directors adopted a resolution to repay in advance the total amount of Series 15 Corporate Bonds and delegated on the Bank’s officials the powers to determine the manner, terms and conditions for said repayment. On March 15, 2007 we paid the outstanding amount of this debt.
On July 15, 2003, an Extraordinary Stockholders’ Meeting approved the setting up of a Program for the issuance and re-issuance of ordinary non-convertible corporate bonds with ordinary guarantee, or such guarantees as may be decided by the board of directors, and unsecured subordinated corporate bonds, convertible or not into shares. During the life of the Program, which will be five years, it shall be possible to issue and re-issue any number of series and/or classes of corporate bonds as long as at all times the maximum amount in circulation after adding together all series and/or classes outstanding under the Program pending redemption does not exceed at any time U.S.$300,000,000.
On April 26, 2007, the Ordinary and Extraordinary Stockholders’ Meeting delegated to the board of directors the authority to make certain amendments to the existing Corporate Bonds Global Program such as: i) updating the Program so that it is governed by international terms and conditions, ii) existence of an international trustee in respect of one or more series representing the interests of investors, iii) drafting and execution of documentation in the English language and under foreign laws, including global and final securities, and payment agency, register, trust and underwriting agreements, as may be necessary, as well as the preparation of information documents for purposes of placement in international markets, including offering circulars and financial statements prepared in a foreign language.
The Ordinary and Extraordinary Stockholders’ Meeting held on March 28, 2008 decided to extend (i) for the term of five years the life of the Corporate Bonds Global Program approved by the Extraordinary Stockholders’ Meeting held on July 15, 2003 and by Resolution Nr. 14967 of the CNV issued on November 29, 2004 in accordance with the changes introduced by the Ordinary and Extraordinary Stockholders’ Meeting held on April 26, 2007 and (ii) for the term of two years the delegation to the board of directors
and the authority to sub-delegate the delegated powers in accordance with the applicable regulations approved by Ordinary and Extraordinary Stockholders’ Meeting held on April 26, 2007.
The Ordinary and Extraordinary Shareholders’ Meeting of BBVA Francés dated March 30, 2011 resolved that, considering the country’s favorable context in terms of national macroeconomics, as well as the conditions prevailing in international markets, and in particular, given the good growth prospects foreseen for the banking and financial industry, it would be advisable to raise the maximum amount of the global note program from U.S.$300,000,000 (or its equivalent in other currencies) to U.S.$500,000,000 (or its equivalent in other currencies) outstanding at any time and to renew the delegation to the Board of all of the powers related to the Program and to the Corporate Bonds allowed to be issued under the Program.
On July 21, 2011, the CNV approved the increase in the maximum amount of the Corporate Bonds Global Program pursuant to its Resolution Nr. 16,611.
As provided in the Corporate Bonds Law and BCRA’s regulations, the proceeds could be applied to: (i) investments in physical assets located in Argentina; (ii) working capital in Argentina; (iii) refinancing of liabilities; (iv) capital contributions into BBVA Francés’ subsidiaries or related companies in so far as the proceeds of such contributions is, in turn, applied to the above-mentioned uses; and/or (v) lending, in so far as the borrowers apply the proceeds of such loans to the uses referred to in the preceding numerals of this paragraph in accordance with the rules laid down to that end by the BCRA.
On June 23, 2011, the Board of BBVA Francés approved the issuance of Class 1 of its Corporate Bonds under the Program for a principal amount of up to Ps.250,000,000. On September 13, 2011, the Bank issued its Corporate Bonds, which were fully subscribed and paid in for Ps.185,193 thousands for a term of 18 months, to be fully amortized at maturity and subject to a variable interest rate equivalent to the private Badlar rate plus a spread of a nominal 2.8% per annum, with quarterly interest payments. As to the use of the proceeds obtained from the issuance of the above-mentioned Class, they were applied to the grant of personal loans.
On November 9, 2011, the Board of BBVA Francés approved the issuance of Class 2 of its Corporate Bonds under the Program for a principal amount of up to Ps.200,000,000. On January 16, 2012, the Bank issued its Corporate Bonds, which were fully subscribed and paid in for Ps.148,900 thousands for a term of 18 months, to be fully amortized at maturity and subject to a variable interest rate equivalent to the private Badlar rate plus a spread of a nominal 2.44% per annum, with quarterly interest payments. As to the use of the proceeds obtained from the issuance of the above-mentioned Class, they were applied to the reimbursement of time deposits.
In view of the liquidity prevailing in financial markets and the growth experienced by the Bank’s assets in recent years, on March 26, 2012, BBVA Francés’ Ordinary and Extraordinary General Shareholders’ Meeting resolved to increase the maximum amount of the Corporate Bonds Program from U.S.$500,000,000 (or its equivalent in other currencies) to U.S.$750,000,000 (or its equivalent in other currencies) outstanding at any time.
On April 18, 2012, the board of directors of BBVA Francés approved the issuance of Class 3 of its Corporate bonds under the Program for a principal amount not in excess of Ps.300,000,000. On September 7, 2012, placement of such Class 3 Corporate bonds was declared vacant.
On December 11, 2012, the board of directors of BBVA Francés approved the issuance of Class 4 of its Corporate bonds under the Program for a principal amount not in excess of Ps.200,000,000.
As of December 31, 2012, the outstanding principal and accrued interest amounts to Ps.341,395 thousands, in connection with Class 1 and 2 of the corporate bonds.
Dividends and other payments from our Argentine non-banking subsidiaries also provide an additional potential source of liquidity, even though relatively insignificant in amount. Each Argentine non-banking subsidiary is required to allocate 5% of its annual net income to a legal reserve until such reserve equals 20% of the subsidiary’s capital stock. This reserve cannot be used to pay us dividends.
In addition, our subsidiary PSA Finance, has a program to issue Corporate Bonds. At December 31, 2012 the outstanding principal and accrued interest amounted to Ps.322,566.
Capital Resources
The capital stock of the Bank as of December 31, 2007 consisted of 471,361,306 Ordinary Shares, par value Ps.1.00 each, all of which were issued and available to stockholders.
Our General Annual Shareholders Meeting on March 27, 2009, resolved,
ad referendum
of BCRA approval, to pay dividends in an aggregate amount of Ps.100,000, to be distributed as follows: Ps.35,000 cash and Ps.65,000 by the issuance of 65,000,000 new shares. On September 4, 2009, the BCRA by Resolution Nr. 313/47/09 approved such distribution of dividends. On October 5, 2009, the new shares were inscribed in the Public Registry of Commerce. The CNV, by Issuers Management Certificate Nr. 354 dated September 11, 2009, authorized the issuance of new shares. The stock-exchange listing was authorized by the Buenos Aires Stock Exchange on September 16, 2009.
On March 30, 2011, the Ordinary and Extraordinary Shareholders’ Meeting of BBVA Francés and the Extraordinary Shareholders’ Meeting of Consolidar Comercializadora S.A., approved a preliminary merger agreement, as well as the consolidated merging balance sheet as of December 31, 2010 and the shares’ exchange ratio.
In addition, the Shareholders’ Meeting of BBVA Francés above mentioned, approved the increase in capital stock of BBVA Francés by issuing 516,544 book-entry, ordinary shares with a par value of Ps.1.00 each and 1 vote per share, that were listed for public offering at the Buenos Aires Stock Exchange and delivered to the shareholders of Consolidar Comercializadora S.A.
On July 5, 2011, the CNV approved the merger and the listing of the shares pertaining to the capital increase. On September 14, 2011, the merger was registered with the Public Registry of Commerce. As a result, the Bank’s capital stock increased by Ps.516,544.
As at December 31, 2012 the Bank’s stock capital consists of 536,877,850 ordinary shares.
Interest Rate Sensitivity
A key component of our asset and liability policy is the management of interest rate sensitivity. Interest rate sensitivity is the exposure and the measure of sensitivity to interest rate variations. The interest rate sensitivity measures the impact on the gross intermediation margin in response to a change in market interest rates. For any given period, the pricing structure is matched when an equal amount of assets and liabilities reprice. Any mismatch of interest-earning assets and interest-bearing liabilities is known as a gap position and is shown in the following tables. A negative gap denotes liability sensitivity and normally means that a decline in interest rates would have a positive effect on net interest income while an increase in interest rates would have a negative effect on interest income.
Our interest rate sensitivity strategy takes into account not only the rates of return and their underlying degree of risk, but also liquidity requirements, including minimum regulatory cash reserves, mandatory liquidity ratios, withdrawal and maturity of deposits and additional demands for funds. Our gap limits are established and subsequently monitored by the Asset and Liability Management Committee.
The following table shows the interest rate sensitivity of our interest-earning assets and interest-bearing liabilities. Variations in interest rate sensitivity may also arise within the repricing periods presented.
During 2012, the gap generated by the mismatch form assets accrued by CER and Liabilities accrued al a fixed rate in pesos declined considerable. Bank’s risk assets, mainly Public sector loans and bonds, accrue CER adjustment plus an annual interest rate, while most liabilities accrue interest at a fixed rate. Fixed rate assets and liabilities with a maturity of no more than three months and total adjusted assets and liabilities, are included in the following chart, in the 0-3 months interval, given that CER adjustment changes on a monthly basis. The chart shows our exposure to a positive interest rate gap, but it is important to bear in mind that CER behavior may differ from interest rate behavior.
|
Remaining Maturity or Earliest Repricing Intervals at December 31, 2012
|
||||||||||||||||||||||||
|
0-3 months
|
3 Months-
One Year
|
1-5 Years
|
5-10 Years
|
Over 10 Years
|
Total
|
|||||||||||||||||||
|
(in thousands of pesos, except percentages)
|
||||||||||||||||||||||||
|
Interest-earning assets
|
||||||||||||||||||||||||
|
Interest earning deposits in banks
|
7,316,345 | — | — | — | — | 7,316,345 | ||||||||||||||||||
|
Government securities
|
1,810,713 | 1,233,050 | 556,170 | 426,432 | 7,957 | 4,034,322 | ||||||||||||||||||
|
Corporate bonds
|
3,972 | 12,120 | — | — | — | 16,092 | ||||||||||||||||||
|
Loans
(1)
|
12,608,793 | 8,447,200 | 7,750,828 | 121,156 | 89,311 | 29,017,288 | ||||||||||||||||||
|
Total
|
21,739,823 | 9,692,370 | 8,306,998 | 547,588 | 97,268 | 40,384,047 | ||||||||||||||||||
|
Interest-bearing liabilities
|
||||||||||||||||||||||||
|
Deposits
|
21,835,562 | 514,234 | 1,569 | — | — | 22,351,365 | ||||||||||||||||||
|
Corporate bonds
|
635,297 | 14,696 | — | — | — | 649,993 | ||||||||||||||||||
|
Due to other banks
|
1,712,447 | 429,854 | 452,544 | — | — | 2,594,845 | ||||||||||||||||||
|
Total
|
24,183,306 | 958,784 | 454,113 | — | — | 25,596,203 | ||||||||||||||||||
|
Asset/liability gap
|
(2,443,483 | ) | 8,733,586 | 7,852,885 | 547,588 | 97,268 | 14,787,844 | |||||||||||||||||
|
Cumulative sensitivity gap
|
(2,443,483 | ) | 6,290,103 | 14,142,988 | 14,690,576 | 14,787,844 | ||||||||||||||||||
|
Cumulative sensitivity gap as a percentage of total interest-earning assets
|
(6.05)% | 15.58% | 35.02% | 36.38% | 36.62% | |||||||||||||||||||
________________
|
(1)
|
Loan amounts are stated before deducting the allowance for loan losses. Non-accrual loans are included with loans as interest-earning assets.
|
The following table shows the interest rate sensitivity of our peso-denominated interest-earning assets and interest-bearing liabilities.
|
Remaining Maturity or Earliest Repricing Intervals at December 31, 2012
|
||||||||||||||||||||||||
|
0-3 months
|
3 Months-
One Year
|
1-5 Years
|
5-10 Years
|
Over 10 Years
|
Total
|
|||||||||||||||||||
|
(in thousands of pesos, except percentages)
|
||||||||||||||||||||||||
|
Interest-earning assets:
|
|
|
|
|
|
|||||||||||||||||||
|
Interest earning deposits in banks
|
5,804,416 | — | — | — | — | 5,804,416 | ||||||||||||||||||
|
Government securities
|
1,810,713 | 1,233,050 | 554,018 | 426,432 | 7,957 | 4,032,170 | ||||||||||||||||||
|
Corporate bonds
|
3,923 | 12,001 | — | — | — | 15,924 | ||||||||||||||||||
|
Loans
(1)
|
11,112,077 | 7,455,892 | 7,728,631 | 121,156 | 89,311 | 26,507,067 | ||||||||||||||||||
|
Total
|
18,731,129 | 8,700,943 | 8,282,649 | 547,588 | 97,268 | 36,359,577 | ||||||||||||||||||
|
Interest-bearing liabilities:
|
||||||||||||||||||||||||
|
Deposits
|
19,166,670 | 376,779 | 1,212 | — | — | 19,544,661 | ||||||||||||||||||
|
Corporate bonds
|
635,297 | 14,696 | — | — | — | 649,993 | ||||||||||||||||||
|
Due to other banks
|
1,291,912 | 429,600 | 452,544 | — | — | 2,174,056 | ||||||||||||||||||
|
Total
|
21,093,879 | 821,075 | 453,756 | — | — | 22,368,710 | ||||||||||||||||||
|
Asset/liability gap
|
(2,362,750 | ) | 7,879,868 | 7,828,893 | 547,588 | 97,268 | 13,990,867 | |||||||||||||||||
|
Cumulative sensitivity gap
|
(2,362,750 | ) | 5,517,118 | 13,346,011 | 13,893,599 | 13,990,867 | ||||||||||||||||||
|
Cumulative sensitivity gap as a percentage of total interest-earning assets
|
(6.50)% | 15.17% | 36.71% | 38.21% | 38.48% | |||||||||||||||||||
_______________
|
(1)
|
Loan amounts are stated before deducting the allowance for loan losses. Non-accrual loans are included with loans as interest-earning assets.
|
The following table shows the interest rate sensitivity of our foreign currency denominated interest-earning assets and interest-bearing liabilities. Variations in interest rate sensitivity may also arise within the repricing periods presented.
|
Remaining Maturity or Earliest Reprising Intervals at December 31, 2012
|
||||||||||||||||||||||||
|
0-3 months
|
3 Months-
One Year
|
1-5 Years
|
5-10 Years
|
Over 10 Years
|
Total
|
|||||||||||||||||||
|
(in thousands of pesos, except percentages)
|
||||||||||||||||||||||||
|
Interest-earning assets:
|
||||||||||||||||||||||||
|
Interest earning deposits in banks
|
1,511,929 | — | — | — | — | 1,511,929 | ||||||||||||||||||
|
Government securities
|
— | — | 2,152 | — | — | 2,152 | ||||||||||||||||||
|
Corporate bonds
|
49 | 119 | — | — | — | 168 | ||||||||||||||||||
|
Loans
(1)
|
1,496,716 | 991,308 | 22,197 | — | — | 2,510,221 | ||||||||||||||||||
|
Total
|
3,008,694 | 991,427 | 24,349 | — | — | 4,024,470 | ||||||||||||||||||
|
Interest-bearing liabilities:
|
||||||||||||||||||||||||
|
Deposits
|
2,668,892 | 137,455 | 357 | — | — | 2,806,704 | ||||||||||||||||||
|
Due to other banks
|
420,535 | 254 | — | — | — | 420,789 | ||||||||||||||||||
|
Total
|
3,089,427 | 137,709 | 357 | — | — | 3,227,493 | ||||||||||||||||||
|
Asset/liability gap
|
(80,733 | ) | 853,718 | 23,992 | — | — | 796,977 | |||||||||||||||||
|
Cumulative sensitivity gap
|
(80,733 | ) | 772,985 | 796,977 | 796,977 | 796,977 | ||||||||||||||||||
|
Cumulative sensitivity gap as a percentage of total interest-earning assets
|
(2.01)% | 19.21% | 19.80% | 19.80% | 19.80% | |||||||||||||||||||
_______________
|
(1)
|
Loan amounts are stated before deducting the allowance for loan losses. Non-accrual loans are included with loans as interest-earning assets.
|
Exchange Rate Sensitivity
At December 31, 2012, our total foreign exchange-denominated asset position was Ps.4,778.4 million and our total foreign exchange-denominated liability position was Ps.4,273.3 million, resulting in a net asset currency position of Ps.505.1 million.
For a description of the changes in the exchange rates since December 2007, see
“Item 4. Information on the Company—Recent Political and Economic Developments in Argentina”
and Note 21.11 to the Consolidated Financial Statements. For a description of foreign exchange risk, see
“Item 11. Quantitative and Qualitative Disclosures About Market Risk—Foreign Exchange Risk”
.
Capital Requirements
As of December 31, 2012, we had consolidated excess capital of Ps.1,698.6 million pursuant to the Central Bank’s rules. At such date, “Basic Net Worth” and “Complementary Net Worth”, subject to applicable deductions, amounted to Ps.5,289.9 million under the Argentine risk-based capital guidelines, which are based on the Basel Committee.
As of December 31, 2011, we had consolidated excess capital of Ps.1,251.3 million pursuant to the Central Bank’s rules. At such date, “Basic Net Worth” and “Complementary Net Worth”, subject to applicable deductions, amounted to Ps.3,684.1 million under the Argentine risk-based capital guidelines, which are based on the Basel Committee.
As of December 31, 2012, we complied with the Central Bank’s capital requirements on a consolidated basis and our capital resources were sufficient for our capital requirements. See a description of the minimum capital requirements currently in effect in
“Item 4. Information on the Company—The Argentine Banking System and its Regulatory Framework”
.
As of December 31, 2012, 2011 and 2010, our stockholders’ equity was Ps.5,131.9 million, Ps.3,868.3 million and Ps.3,746.9 million, respectively. At such dates, our ratio of average stockholders’ equity/average total assets was 10.74%, 10.64% and 11.32%, respectively. See
“Item 4. Information on the Company—Selected Statistical Information—Return on Equity and Assets”
.
In our opinion, our capital resources are sufficient for the Bank’s present requirements on an individual and a consolidated basis.
We are not aware of any legal or economic restrictions on the ability of our subsidiaries to transfer funds to us in the form of dividends, loans, advances
—
subject to the regulations of each industry
—
or by other means. However, there can be no assurance that in the future such restrictions will not be adopted and that, if adopted, they will not negatively affect our liquidity.
As of December 31, 2012, the Bank had no material commitments for capital expenditures.
The following table sets forth, for the dates indicated, the calculation of our excess capital under the Central Bank’s rules and certain capital and liquidity ratios.
|
December 31,
|
||||||||||||
|
2012
(4)
|
2011
(4)
|
2010
(4)
|
||||||||||
|
(in thousands of pesos, except ratios and percentages)
|
||||||||||||
|
Calculation of excess capital
(1)
|
||||||||||||
|
Allocated to assets at risk
|
2,197,281 | 1,768,090 | 1,293,189 | |||||||||
|
Allocated to Bank premises and equipment, intangible assets and equity investment assets
|
187,326 | 144,648 | 101,939 | |||||||||
|
Interest rate risk
|
430,744 | 373,642 | 227,840 | |||||||||
|
Public sector and securities in investment account
|
73,005 | 73,534 | 286,391 | |||||||||
|
A- Minimal exigency by adds up risks
|
2,888,356 | 2,359,914 | 1,909,359 | |||||||||
|
B- Basic exigency for custody of titles of the AFJP and / or agent of record of hypothecary letters
|
423,923 | 400,000 | 1,858,458 | |||||||||
|
Maximum between A and B
|
2,888,356 | 2,359,914 | 1,909,359 | |||||||||
|
Market risk
|
37,238 | 72,925 | 127,025 | |||||||||
|
Operational risk
|
665,751 | — | — | |||||||||
|
Required minimum capital under Central Bank rules
|
3,591,345 | 2,432,839 | 2,036,384 | |||||||||
|
Basic net worth
|
3,868,256 | 2,862,679 | 2,460,605 | |||||||||
|
Complementary net worth
|
1,288,507 | 880,599 | 1,169,871 | |||||||||
|
Deductions
|
(130,741 | (141,290 | (119,186 | |||||||||
|
Minority interest
|
263,884 | 82,111 | 179,192 | |||||||||
|
Total capital under Central Bank rules
|
5,289,906 | 3,684,099 | 3,690,482 | |||||||||
|
Excess capital
|
1,698,561 | 1,251,260 | 1,654,098 | |||||||||
|
Selected capital and liquidity ratios
|
||||||||||||
|
Average stockholders’ equity as a percentage of average total assets
(1)(2)
|
10.74% | 10.64% | 11.32% | |||||||||
|
Total liabilities as a multiple of total stockholders’ equity
|
7.70x | 9.08x | 7.70x | |||||||||
|
Cash and due from banks as a percentage of total deposits
|
25.22% | 21.78% | 25.34% | |||||||||
|
Liquid assets as a percentage of total deposits
(1)(3)
|
37.22% | 40.86% | 58.71% | |||||||||
|
Loans as a percentage of total assets
|
63.62% | 58.65% | 51.26% | |||||||||
________________
|
(1)
|
See
“Item 4. Information on the Company—The Argentine Banking System and Its Regulatory Framework—Capital Adequacy Requirements
” for a discussion of the Central Bank’s capital requirements.
|
|
(2)
|
Average stockholders’ equity and average total assets computed as the average of period-beginning and period-ending balances.
|
|
(3)
|
At December 31, 2012, 2011 and 2010, “Liquid Assets” includes cash and due from banks and government and private securities.
|
|
(4)
|
The Bank had to maintain a surplus of minimum paid-in capital amounting to at least 105,981, 90,689 and 92,923 as at December 31, 2012, 2011 and 2010, respectively, equivalent to 0.25% of the amount of values under custody for securities representing investments from pension funds, as well as in connection with its function as registrar of mortgage-backed bonds, invested in national public securities and other destinations authorized by the BCRA and guaranteed in favor of the said entity.
|
U.S. and Argentine Banking GAAP Reconciliation
We prepare our Consolidated Financial Statements in accordance with the rules of the Central Bank related thereto, which differ from U.S. GAAP in certain respects, as discussed in Note 22 to the Consolidated Financial Statements. The differences and the most significant effects on our net income and Stockholders’ Equity over the fiscal years ended December 31, 2012, 2011 and 2010 are described below.
Under accounting rule ASC 740-10, Income Taxes: Overall, deferred tax assets or liabilities are recorded for temporary differences between the financial reporting basis and the tax basis of assets and liabilities at statutory tax rates expected to be in effect when such amounts will be realized. Deferred tax assets are recognized if it is more likely than not that such assets will be realized. As explained in Note 5.1 to the Consolidated Financial Statements, we applied this method during 2012 to determine the charge for income tax. The adjustments required in order to reconcile assets and liabilities with U.S. GAAP, as detailed in the following paragraph, are shown without considering their effect on income tax. The effect over continued operations of reflecting such adjustments on the Bank’s net assets is increased by Ps.271.4 million and Ps.128.9 million as of December 31, 2012 and 2011,
respectively, and would have them decreased by Ps.25.0 million as of December 31, 2010. In addition, income over continued operations would have increased by Ps.137.7 million and Ps.9.9 million as of December 31, 2012 and 2010, respectively, and would have decreased by Ps.61.1 million at December 31, 2011. The effect over discontinued operations of reflecting such adjustments on the Bank’s net assets causes them to increase by Ps.17.4 million and Ps.19.7 million as of December 31, 2012 and 2011, respectively, and would have decreased by Ps.42.1 million as of December 31, 2010. On the other hand, income over discontinued operations would have decreased by Ps.2.3 million and Ps.32.5 million as of December 31, 2012 and 2010, respectively, and would have increased by Ps.61.8 million as of December 31, 2011.
Under Argentine Banking GAAP, loan origination and credit card issuance fees are recognized when collected. Under accounting rule ASC 310-20, Receivables: Nonrefundable Fees and Other Costs, these fees are recognized over the life of the related loan as an adjustment to yield. The effect of applying U.S. GAAP to continued operations would be to decrease our net income by Ps.36.1 million, Ps.30.5 million and Ps.22.4 million for the fiscal years ended December 31, 2012, 2011 and 2010, respectively. The effect of U.S. GAAP treatment would have been to decrease the principal balance of outstanding loans to our Consolidated Financial Statements over continued operations by Ps.144.6 million, Ps.108.5 million and Ps.78.0 million for the fiscal years ended December 31, 2012, 2011 and 2010, respectively. These adjustments do not have effects over discontinued operations.
Under Argentine Banking GAAP, certain software development expenses are amortized over the estimated useful life of the software, for up to a maximum of 60 months. Under Argentine Banking GAAP, the Consolidar Group capitalized expenses incurred in connection with the launching of certain activities. The Pension Fund Manager Superintendency (the agency overseeing Consolidar AFJP) authorized the capitalization of disbursements made through September 25, 1994, for “salaries, advertising, software, agent’s commissions, fees, brochures, forms, printing and leases and rentals”. Under U.S. GAAP, these expenses are charged-off to income when incurred.
According to U.S. GAAP, the Bank decided to classify Government Securities as available for sale and carried at fair value (market value if available) with unrealized gains and losses reported as a net amount, net of income tax within the stockholder’s equity accounts. However, ASC 320-10, Investments-Debt and Equity Securities: Overall, requires that if the decline in fair value is judged to be other than temporary, the cost of the security shall be written down to fair value, and the amount of the write-down shall be included in earnings. Had U.S. GAAP been applied, our assets over continued operations would have decreased by Ps.3.4 million, Ps.5.8 million and Ps.1.9 million as of December 31, 2012, 2011 and 2010, respectively. Our net income over continued operations would have increased by Ps.16.1 million and Ps.213.0 million for the fiscal years ended December 31, 2012 and 2011, respectively and would had decreased by Ps.403.8 million for the fiscal year ended December 31, 2010. In addition had U.S. GAAP been applied over discontinued operations, the Bank’s assets would had increased by Ps.207.8 million at December 31, 2010. On the other hand, the income over discontinued operation at December 31, 2011 would had increased by Ps.101.6 million and for the fiscal year ended December 31, 2010 would had decreased by Ps.76.9 million.
Under Argentine Banking GAAP, the allowance for loans has been calculated based on the Bank’s estimated loan loss risk in light of debtor compliance and the collateral supporting the respective transactions, as provided by Communication “A” 2950 and supplemented by the Central Bank. ASC 310-10, Receivables: Overall, requires a creditor to measure impairment of a loan based on the present value of expected future cash flows discounted at the loan’s effective interest rate, or at the loan’s observable market price or the fair value of the collateral if the loan is collateral dependent. This statement is applicable to all loans (including those restructured in a troubled debt restructuring involving a modification of terms), except large groups of smaller-balance homogenous loans that are collectively evaluated for impairment. Had U.S. GAAP been applied over continued operations the Bank’s assets would have increased by Ps.198.0 million, Ps.180.9 million and Ps.215.5 million at December 31, 2012, 2011 and 2010, respectively. On the other hand, our income would have increased by Ps.17.0 million and Ps.10.6 million for the years ended December 31, 2012 and 2010, respectively and would had decreased by Ps.34.6 million at December 31, 2011. These adjustments do not have effects over discontinued operations.
During the fiscal year ended December 31, 2001, under Argentine Banking GAAP, BBVA Francés and its subsidiaries swapped Federal State Securities, bonds, treasury bills and unsecured loans at face value for Federal Government secured loans. The initial value of the certificates matched that of the prior book value as of the date of the swap. According to U.S. GAAP, non-temporary impairment affects the swapped obligations and therefore requires that, in the event that such obligations have been classified as “held to maturity”, a loss be recorded for the difference between the book value of the obligation swapped and its quotation at the date of the swap, as such quotation is considered the best measure for recognizing the above mentioned impairment. The effects over discontinued operations would had decreased assets by Ps.78.0 million at December 31, 2010. On the other hand, income over discontinued operations would had increased by Ps.78.0 million for the fiscal year ended December 31, 2011 and would had decreased by Ps.6.0 million at December 31, 2010.
On January 28, 2009 and February 25, 2009, the board of directors of Consolidar Cía. de Seguros de Retiro S.A. exercised the exchange option to exchange certain bonds for Argentine Government notes in pesos. The debt swap was subject to the provisions of ASC 310-30 Restructured or Refinanced Loans. According to ASC 310-30, if an investor subsequently refinances or restructures the loan, other than through a troubled debt restructuring, the refinanced or restructured loan shall not be accounted for as a new loan. According to ASC 310-20, Receivables: Nonrefundable Fees and Other Costs, the Bank recognizes income for each fiscal year using the accretion interest method. Under U.S. GAAP the effects of adjustments over discontinued operations would had decreased assets by Ps.21.6 million at December 31, 2010 and the income over discontinued operation for the fiscal years ended December 31, 2011 and 2010 would have increased by Ps.21.6 million and Ps.9.9 million, respectively.
Pursuant to Argentine Banking GAAP, at December 31, 2003 the
Bank
recorded as assets
the difference between the paid amounts for constitutional protection actions and the deposit
amounts
registered in accordance with the existing regulations. The
Government has not indicated that it will compensate
the Bank for the difference between the amounts paid for constitutional protection actions and the deposit amounts registered in accordance with the existing regulations.
ASC 450-30, Contingencies: Gain Contingencies, requires that contingencies that might result in gains
should
not
be
reflected in the accounts since to do so might be to recognize revenue prior to its realization. Had U.S. GAAP been applied, our assets over continued operations would have decreased by Ps.29.8 million, Ps.23.7 million and Ps.23.5 million at December 31, 2012, 2011 and 2010, respectively. On the other hand net income over continued operations would have decreased by Ps.6.1 million, Ps.0.2 million and Ps.0.9 million at December 31, 2012, 2011 and 2010, respectively. These adjustments do not have effects over discontinued operations.
Under Argentine Banking GAAP the Bank accounted for its investment in the Buenos Aires Stock Exchange at market value. Under U.S. GAAP, such investments would have been valued at cost or at a lesser amount where there is a non-temporary impairment in value. Additionally, the companies
that
are under 20% were valued by the equity method in accordance with Central Bank rules. Under
U.S.
GAAP, those investments
that
are non-marketable securities would have been valued at cost. Had
U.S.
GAAP been applied, the Bank’s assets over continued operations would have decreased by Ps.38.2 million, Ps.51.9 million and Ps.43.8 million at December 31, 2012, 2011 and 2010, respectively. On the other hand, the income over continued operations would had increased by Ps.13.7 million at December 31, 2012 and would have decreased by Ps.8.1 million at December 31, 2011 and 2010, respectively. These adjustments do not have effects over discontinued operations.
Pursuant to Argentine Banking GAAP, we generally record the cost of vacation payments earned by employees when paid, U.S. GAAP requires that this expense be recorded on an accrual basis as the vacations are earned. If U.S. GAAP had been applied, our liabilities over continued operations would have increased by Ps.0.4 million, Ps.36.7 million and Ps.0.3 million for the fiscal years ended December 31, 2012, 2011 and 2010, respectively. Net income over continued operations would had increased by Ps.36.3 million at December 31, 2012 and would had decreased by Ps.36.4 million at December 31, 2011. These adjustments do not have effects over discontinued operations.
Pursuant to Argentine Banking GAAP, we
do
not give accounting recognition to checks drawn against the Bank or other
banks
or other items to be collected, until such time as the related item clears or is accepted. Such items are recorded by the Bank in
memorandum
accounts. U.S. banks, however, account for such items through balance sheet clearing accounts at the time the items are presented. Had U.S. GAAP been applied, the Bank’s assets and liabilities would have increased by approximately Ps.2,415.0 million and Ps.1,374.4 million at December 31, 2012 and 2011, respectively.
Under Argentine Banking GAAP, the Bank recognizes forward and unsettled spot transactions as receivable and payable at the time of the agreement, which reflect the amount of cash, currency or securities to be exchanged at the closing date. The receivable or payable representing the receipt or delivery of securities or currency is stated at the quoted market value of such securities or currency. Under U.S. GAAP, in general entities would not recognize a receivable or payable but would recognize the differences arising from changes in the market price of securities or currency to be received or delivered if the transaction did not qualify as a hedge. Had U.S. GAAP been applied, the Bank’s assets and liabilities would have decreased by approximately Ps.0.9 million and Ps.191.0 million at December 31, 2012 and 2011, respectively.
Under Argentine Banking GAAP, foreign trade acceptances are not recorded on the balance sheet by the Bank. In accordance with Regulation S-X, acceptances and related customer liabilities should be recorded on the balance sheet.
The effect of the adjustment
required to state balance sheets in accordance with Regulation S-X would be to increase assets (due from customers on acceptances) and increase liabilities (bank acceptances outstanding) by Ps.76.5 million and Ps.98.8 million at December 31, 2012 and 2011, respectively.
For the fiscal years ended December 31, 2010 and 2009, Consolidar Cía. de Seguros de Retiro S.A. maintain reserves accounted in Other Liabilities from Subsidiaries valued in accordance with accounting standards established by the Superintendence of Pension Fund Administrators and the National Superintendence of Insurance. Had U.S. GAAP been applied over discontinued operations,
liabilities would had decreased by Ps.267.9 million at December 31, 2010. On the other hand, income over discontinued operations for the fiscal year ended at December 31, 2011 would had decreased by Ps.267.9 million and for the fiscal year ended December 31, 2010 would had increased by Ps.42.5 million.
On May 4, 1998, our shareholders approved the reversal of the shares issuance premium related to the capital increase paid on December 19, 1997 and relating to the business goodwill from the acquisition of 71.754% of the capital stock of Banco de Crédito Argentino. Under Argentine Banking GAAP, we recognize the issuance premium under “Issuance premiums” and capitalize the related amount under Intangible assets. The effect of adjustments required to state such amounts in accordance with U.S. GAAP would have been to increase assets over continued operations by Ps.254.9 million for the fiscal years ended December 31, 2012, 2011 and 2010. On May 13, 1999, BBVA acquired Corp Banca S.A. and Atuel Fideicomisos S.A. and on September 13, 1999, BBVA sold its interests in both companies to BBVA Francés. For the difference between the definitive price of the transaction and the incorporation value of both companies, the Bank recognized a goodwill and amortized it in proportion to the months of estimated useful life (120-month period). Under U.S. GAAP, we would be required to account for the acquisition of the mentioned companies at BBVA’s book balance. Had U.S. GAAP been applied over continued operations, the Bank’s assets would have increased by Ps.54.7 at December 31, 2012, 2011 and 2010. ASC 350-20, Intangibles-Goodwill and Other: Goodwill requires, effective January 1, 2002, that goodwill no longer be amortized, but now be subject to an impairment test annually or more frequently if events or changes in circumstances indicate that the asset may be impaired. Accordingly, we have recognized an impairment loss. Had U.S. GAAP been applied over continued operations our assets would have decreased by Ps.309.6 million as of December 31, 2012, 2011 and 2010. These adjustments do not have effects over discontinued operations.
ASC 815, Derivatives and Hedging, establishes accounting and reporting standards for derivative instruments, including certain derivative instruments embedded in other contracts (collectively referred to as derivatives) and for hedging activities. Had U.S. GAAP been applied, the assets and liabilities over continued operations would have increased by Ps.7.8 million and Ps.1.8 million, respectively, at December 31, 2012. At December 31, 2011 the assets and liabilities over continued operations would have increased by Ps.0.9 million and Ps.12.2 million, respectively. And at December 31, 2010 the assets over continued operations would had increased by Ps.2.6 million. On the other hand, income over continued operations would have increased by Ps.17.3 million and Ps.2.5 million for the fiscal years ended December 31, 2012 and 2010, respectively, and would had decreased by Ps.13.9 million for the fiscal year ended December 31, 2011. Income over discontinued operations would had decreased by Ps.0.2 million for the fiscal year ended December 31, 2010.
The bank maintains reserves accounted in Allowance for other contingencies valued in accordance with the accounting standards established by BCRA (see Note 3.4.18 to our Consolidated Financial Statements). Had U.S. GAAP been applied over continued operations, allowance for other contingencies would had decreased by Ps.34.8 million at December 31, 2010. On the other hand, income over continued operations would had decreased by Ps.34.8 million at December 31, 2011 and would had increased by Ps.5.7 million at December 31, 2010. These adjustments do not have effects over discontinued operations.
The Bank acquired Consolidar AFJP S.A. and Consolidar Cía. de Seguros de Retiro S.A.’s undivided interest in a piece of real estate (see Note 4.1.c to our Consolidated Financial Statement). Accounting rule ASC 810-10, Consolidation: Overall, established that any intercompany profit or loss on assets remaining within the Group should be eliminated. Had U.S. GAAP been applied over continued operations, the Bank’s assets would have decreased by Ps.48.6 million and Ps.37.9 million at December 31, 2011 and 2010, respectively. On the other hand income over continued operations would have increased by Ps.48.6 million and Ps.0.2 million at December 31, 2012 and 2010, respectively and would have decreased by Ps.10.7 million at December 31, 2011. These adjustments do not have effects over discontinued operations.
The Bank discloses its non-controlling interests in consolidated subsidiaries like a caption outside its equity. In accordance with accounting rule ASC 810-10, Consolidation: Overall, non-controlling interests in consolidated subsidiaries shall be reported in the consolidated balance sheets within equity and separately from the parent’s equity. Had U.S. GAAP been applied over continued operations, the Bank’s stockholders’ equity would have increased by Ps.119.5 million, Ps.82.7 million and Ps.74.6 million at December 31, 2012, 2011 and 2010, respectively. In addition, income over continued operations for the fiscal years ended at December 31, 2012 and 2011 would have increased by Ps.36.8 millon and Ps.8.1 million, respectively and would have decreased by Ps.15.0 million at December 31, 2010. Had U.S. GAAP been applied over discontinued operations, the Bank’s stockholders’ equity would have increased by Ps.7.7 million, Ps.9.4 million and Ps.302.1 million at December 31, 2012, 2011 and 2010, respectively. In addition, income over discontinued operations for the fiscal years ended at December 31, 2012 and 2011 would have decreased by Ps.1.7 million and Ps.292.7 million, respectively, and would have increased by Ps.90.3 million at December 31, 2010.
Calculated in accordance with U.S. GAAP, our net income over continued operations for the fiscal years ended December 31, 2012, 2011 and 2010 would have been Ps.1,228.2 million, Ps.937.7 million and Ps.742.0 million, respectively. Under Argentine Banking GAAP, our net income over continued operations was Ps.1,265.6 million, Ps.946.9 million and Ps.1,163.3 million for the
same respective periods. In addition our net income over discontinued operations applying U.S. GAAP for the fiscal years ended December 31, 2012, 2011 and 2010 would have been Ps.312.8 million, Ps.(238.9) million and Ps.62.1 million, respectively. Under Argentine Banking GAAP, our net income over discontinued operations was Ps.(2.0) million, Ps.58.7 million and Ps.34.9 million for the same respective periods.
Credit Ratings
As a consequence of the Argentine Crisis and the downgrade of the sovereign ceiling, the international rating agencies downgraded our ratings in 2001 and 2002. Standard & Poor’s rated our counterparty credit risk rating “SD” (selective default) and our senior debt rating “CC”, while Moody’s Investors Service rated our financial strength credit rating “E” and our senior debt rating “Ca”.
In light of the deep crisis in Argentina and in the financial system, on June 15, 2002, we asked the international rating agencies to temporarily suspend the ratings of BBVA Francés. The decision was made as a measure to reduce costs, and because we believed that our ratings would not improve in the medium term.
As of June 1, 2005, with the restructuring of the sovereign debt, Standard & Poor’s upgraded the new sovereign debt to rating “B-”, with stable outlook. During the year 2006, Standard & Poor’s once again upgraded its rating and the debt received a rating of “B+”. In view of that, at the end of that year our senior debt achieved the rating “AA”.
On August 11, 2008, the foreign and local currency long-term credit ratings on the Republic of Argentina was downgraded by Standard & Poor’s from “B+” to “B”, and maintained the stable outlook. The sovereign’s weaker financial profile, combined with a deteriorating political environment, makes Argentina's creditworthiness more consistent with a “B” rating. Additionally, Standard & Poor’s lowered its national scale rating of Argentina to “AA-” from “AA”. Therefore, it rated our local counterparty credit risk “AA-” and our senior debt, with stable outlook.
On October 31, 2008, Standard & Poor’s lowered again its foreign and local currency long-term credit ratings on Argentina to “B-”. The downgrade reflects heightened concerns about the deteriorating economic, political environment in Argentina and the resulting increased fiscal stress. A weaker global economy could hurt the prices of agricultural commodities, the exports of which greatly support the sovereign’s fiscal and external accounts. Besides, Standard & Poor’s lowered its national scale rating on Argentina to “A+”. Accordingly, it rated our local counterparty credit risk and senior debt “A+”, with stable outlook.
During 2010, after the completion of the second defaulted debt swap with a 67% participation rate, Fitch Ratings and Standard & Poor’s raised its foreign and local currency long-term credit ratings on the Republic of Argentina. The ratings are supportive by comparatively high per capita income levels, high economic growth in recent years, a relatively favourable public debt composition and eight consecutive years of current account surpluses. In line with this, Standard & Poor’s improved BBVA Francés’ ratings to “raAA”, with stable outlook. The rating has been maintained during the year 2011.
On November 2, 2012, Standard & Poor’s downgraded the ratings of 15 financial institutions that operate in Argentina after downgrading the sovereign rating of the State, which, in a global scale was modified to “B-“ from “B” and in a local scale to “raA” from “raAA”. As a consequence, the Bank´s rating was changed to “raA” with negative outlook, being the highest rate that an Argentine bank currently has. In addition, on November 30, Fitch Ratings downgraded the rating of the Bank´s shares from 1 with stable outlook to 1 with negative outlook and its senior long term debt from AA+ (arg) to AA (arg) with negative outlook.
|
C.
|
Research and Development, Patents and Licenses
|
We incur research and development expenses in connection with technology information systems. We hold no material patents and do not license to others any of our intellectual property. We plan infrastructure development (processing, telecommunications, Internet, information security) based upon present and projected future demand of such services. We acquire the necessary technology, and equipment from third parties.
|
D.
|
Trend Information
|
During 2013, the financial system will continue to be focused on further expanding the private sector lending activity, with emphasis in the middle-market and retail segment. However, no assurance can be given that credit demand will remain strong. For a description of recent changes in our business strategy and a summary of the main consequences of the current economic scenario on our business and future prospects see
“Item 4. Information on the Company—Business Overview”
.
|
E.
|
Off-Balance Sheet Arrangements
|
We enter into various transactions involving off-balance sheet financial instruments (see Note 21.17 to the Consolidated Financial Statements). We use these instruments to meet the risk management, trading and financing needs of clients or for our proprietary trading and asset and liability management purposes. These instruments are subject to varying degrees of credit and market risk. We monitor credit risk and market risk associated with on- and off-balance sheet financial instruments on an aggregate basis.
We use the same credit policies in determining whether to enter or extend call and put option contracts, commitments, conditional obligations and guarantees as we do for granting loans. Our management believes that the outstanding off-balance sheet items do not represent an unusual credit risk.
Derivatives
The market risk of derivatives arises from the potential for changes in value due to fluctuations in market prices. We reduce our exposure to market risk, if necessary, by entering into offsetting transactions in accordance with the hedging global policy defined by BBVA Group for its subsidiaries. The credit risk of derivatives arises from the potential of a counterparty to default on its contractual obligations. The effect of such a default varies as the market value of derivative contracts changes. Credit exposure exists at a particular point in time when a derivative has a positive market value. We attempt to limit our credit risk by dealing with creditworthy counterparties and obtaining collateral where appropriate. Our activities related to hedging and derivatives transactions in 2012 are explained in Notes 12 and 21.17 to the Consolidated Financial Statements.
Credit Commitments
Commitments to extend credit are agreements to lend to a customer at a future date, subject to compliance with contractual terms. Commitments generally have fixed expiration dates or other termination clauses and may require the payment of a fee. Since many of the commitments are expected to expire without being drawn upon, the total commitment amounts do not necessarily represent actual future cash requirements for the Bank. The Bank evaluates each customer’s creditworthiness on a case-by-case basis. Foreign trade acceptances represent Bank customers’ liabilities on outstanding drafts or bills of exchange that have been accepted by the Bank and the Bank’s liability to remit payment upon the presentation of the accepted drafts or bills of exchange. The credit risk involved in foreign trade acceptances and guarantees granted is essentially the same as that involved in extending loan facilities to customers.
Financial Trusts
We act as trustee in several financial trusts established for various purposes. We are in no case personally liable for the liabilities assumed in the performance of the trust obligations. Any liabilities resulting from the trust are satisfied with and up to the full amount of the trust assets or their proceeds. See Note 10.1 to the Consolidated Financial Statements.
Non-Financial Trusts
In addition, we act as trustee in 22 non-financial trusts. We are in no case personally liable for the liabilities assumed in the performance of the contract obligations. Any liabilities are satisfied with and up to the full amount of the trust assets and their proceeds. The non-financial trusts at issue were set up to secure the receivables of several creditors (beneficiaries) and the trustee was entrusted with the management, care, preservation and custody of the trust assets. The trust assets represent about Ps.105.8 million and consist mainly of cash, creditors’ rights, real estate and shares. See Note 10.2 to the Consolidated Financial Statements.
|
F.
|
Tabular Disclosure of Contractual Obligations
|
The following table represents our contractual obligations and commercial commitments as of December 31, 2012:
|
Payments due by Period
(in thousands of pesos)
|
||||||||||||||||||||
|
Total
|
Less than
1 year
|
1-3
years
|
4-5
years
|
After 5
years
|
||||||||||||||||
|
Contractual obligations
|
||||||||||||||||||||
|
Long-term debt
|
3,285,123 | 3,133,360 | 151,252 | 511 | — | |||||||||||||||
|
Operating leases
|
555,605 | 97,455 | 176,777 | 128,370 | 153,003 | |||||||||||||||
|
Total
|
3,840,728 | 3,230,815 | 328,029 | 128,881 | 153,003 | |||||||||||||||
|
Commercial commitments
|
||||||||||||||||||||
|
Lines of credit
|
322,959 | 322,959 | — | — | — | |||||||||||||||
|
Foreign trade acceptances
|
76,515 | 76,515 | — | — | — | |||||||||||||||
|
Guarantees
|
365,601 | 203,791 | 75,405 | 35,715 | 50,690 | |||||||||||||||
|
Total
|
765,075 | 603,265 | 75,405 | 35,715 | 50,690 |
|
A.
|
Directors and Senior Management
|
Directors
The corporate by-laws of BBVA Francés state that the Bank’s management is led by a board of directors consisting of a minimum of three and a maximum of nine directors, who are elected by the shareholders to hold such office for a period of three years and may be re-elected (the “Board”). The by-laws also provide the appointment of alternate directors. According to the by-laws, the Board meets at least once per month.
The table below indicates the names of the members of our Board, their present position in the company, their business background and the date of expiration of the period for which they were elected.
|
Name
|
Current
Term Ends (***)
|
Position as of
December 31, 2012
|
Date of Birth
|
Present principal occupations outside BBVA Francés
and business experience
|
||||
|
Jorge Carlos Bledel
(*)
|
December 2014
|
Chairman
|
04/19/1954
|
Present principal occupations:
Director, Rombo Compañía Financiera S.A. (“Rombo Compañía Financiera”);
Business experience:
Vice Chairman, BBVA Francés Valores Sociedad de Bolsa S.A. (“Francés Valores”); Director, Credilogros Compañía Financiera S.A. (“Credilogros”); Credit Manager, Banco del Interior y Buenos Aires; Business Manager, Corporación Metropolitana de Finanzas; Financial Manager, BBVA Francés; Wholesale Banking Director, BBVA Banco Francés and Retail Banking Director, BBVA Francés.
Mr. Bledel joined the staff of BBVA Francés in 1986 and was first elected to the Board in March 2003.
|
||||
|
José Manuel Tamayo Pérez
(**)
|
December 2012
|
Vice Chairman
|
05/22/1950
|
Present principal occupation:
Director, BBVA Francés.
Business experience:
Retail Banking Director, BBVA Francés; Marketing Director España and Portugal, BBVA S.A.
Mr. Tamayo Pérez was elected Director in April 2007.
|
||||
|
Marcelo Gustavo Canestri
(**)
|
December 2012
|
Director
|
04/23/1953
|
Present principal occupations:
Director, Francés Valores; Director, PSA Finance; Alternate Director, Rombo Compañía Financiera.
Business experience:
Corporate Assistant Manager, BBVA Francés; Wholesale Banking Assistant Manager, BBVA Francés; Asset Management Director, BBVA Francés and Financial Director, BBVA Francés; Director,
Mr. Canestri joined the Bank in 1973 and was first elected to the Board in September 2001.
|
|
Name
|
Current
Term Ends (***)
|
Position as of
December 31, 2012
|
Date of Birth
|
Present principal occupations outside BBVA Francés
and business experience
|
||||
|
Mario Luis Vicens
(**)
|
December 2012
|
Director
|
07/14/1951
|
Present principal occupation:
Director, BBVA Banco Francés S.A.
Business experience:
Executive President CEO, Asociación de Bancos de la Argentina (ABA); Director, Seguros de Depósitos S.A (SEDESA); Director, Federación Latinoamericana de Bancos Felaban; Director, Banco Sudameris; Director, Argentine Central Bank; Assitant Manager of the Planning and Financial Area and Assitant General Manager, Banco Crédito Argentino S.A; Chief Economist; Argentine Central Bank.
Mr. Vicens was elected Director in 2012.
|
||||
|
Oscar Miguel Castro
(**)
|
December 2014
|
Director
|
12/04/1945
|
Present principal occupations:
Independent Director, BBVA Francés, Zurich Argentina Cia. de Seguros S.A., Zurich Argentina Cia. de Seguros de Retiro S.A. and Zurich Argentina Cia. de Reaeguros S.A.
Independent Consultant.
Business experience:
Executive member of the Committee of Financial Services member, Arthur Andersen Worldwide; Partner in charge of Financial Services Division, Arthur Andersen Latin America and Argentina; International Partner, Arthur Andersen.
Mr. Castro was elected Director in 2003.
|
||||
|
Luis Bernardo Daniel Juango Fitero
(**)
|
December 2013
|
Director
|
08/24/1949
|
Present principal occupation:
Director, BBVA Francés S.A.
Business experience:
President, BBVA Colombia S.A.; Regional Director, BBVA S.A.
Mr. Juango Fitero was elected in 2008.
|
____________________
|
(*)
|
According to the provisions of General Resolution Nr. 368 (New Text 2001), as amended by General Resolution Nr. 400 of the CNV, Mr. Jorge Carlos Bledel does not qualify as independent director, as he is a former employee of the Bank.
|
|
(**)
|
Mr. Tamayo Peréz, Mr. Vicens, Mr. Castro, Mr. Canestri and Mr. Juango Fitero qualify as independent directors according to the independence criteria set forth by General Resolution Nr. 368 (New Text 2001), as amended by General Resolution Nr. 400 of the CNV.
|
|
(***)
|
The terms of the directors Mr. Tamayo Pérez, Mr. Canestri and Mr. Vicens have been subsequently extended are still members of the Board.
|
The Ordinary and Extraordinary Shareholders Meeting dated April 9, 2013 re-elected (i) Mr. José Manuel Tamayo Pérez and Mr. Marcelo Gustavo Canestri for a one year period; and (ii) Mr. Mario Luis Vicens for a two year period, according to the last amendment of section 10 of BBVA Francés Bay-law. For a detailed explanation of said section, please find
“Item 10. Additional Information - Memorandum and Articles of Association”
.
Executive Officers
The table below shows the names of the members of the management committee who have been our executive officers during 2012, and the year of their appointment to such position, as well as their business background. The chief executives are appointed for an indefinite period.
|
Name
|
First Appointed
|
Current Position
|
Date of Birth
|
Background and Work Experience
|
||||
|
Ricardo Enrique Moreno
|
2009
|
Executive Director
|
07/15/1963
|
Consultant, specialized in financial branch and capital markets, Andersen Consulting; Systems Manager, Banco de Crédito; Director of Media, CEO of Unofirst Latin America, COO Global, BBVA; Director of Transformation an Productivity BBVA.
Mr. Moreno joined the Bank in 1994.
|
||||
|
Ignacio Sanz y Arcelus
|
2012
|
Director, Planning and Financial Area
|
01/13/1966
|
Financial Technology and Operations Director, BBVA; Asset and Liability for Latin America Director, BBVA; Management Control and Investment Banking (Treasury, Capital Markets, Brokerage, Corporate, Structured Finance) Director, BBVA; Corporate Director, BBVA; Treasury, Capital Markets and International Network, Director, BEX Argentaria BBVA; Market Risk Audit, Director, BEX Argentaria BBVA; Audit Director Central Services, BEX; Planning Director, Intervention and Control SERFINBEX; Director, BEX Argentaria BBVA; Team Leader, Arthur Andersen Auditors S.A.
Mr. Sanz y Arcelus joined the Bank in 2012.
|
||||
|
Juan Alberto
Estrada
|
2008
|
Director,
Corporate and Investment Banking
|
07/12/1972
|
Asset Management Area; Head of the Trading Area.
Mr. Estrada joined the Bank in 1992.
|
||||
|
Martín Ezequiel Zarich
|
2010
|
Director, Innovation and Development
|
04/09/1964
|
Other positions currently held:
Director, Francés Valores, Alternate Director BBVA Francés
Work Experience:
Director BBVA Seguros; Economist, Banco de Crédito Argentino; Management Control and Budget Manager, Banco de Crédito Argentino; Planning Director, Banco de Crédito Argentino; Merger Director, BBVA Banco Francés; Planning Director, BBVA Francés; Financial Director, BBVA Francés; Retail Banking Director, BBVA Francés; Director, Credilogros; Director, BBVA Banco Francés Uruguay; Director, BBVA Banco Francés Cayman Ltd.; Deputy General Director, Business Development BBVA Group.
Mr. Zarich joined the Bank in 1987.
|
||||
|
Gabriel Milstein
|
2002
|
Director, Human Resources, Procurement, Real Estate, General Services and Safety
|
08/14/1958
|
Organization Manager, BBVA Francés.
Mr. Milstein joined the Bank in 1995.
|
||||
|
Jorge Gustavo Allen
|
2007
|
Director, Companies Banking
|
12/07/1956
|
Goods and Services Manager, Banco Francés del Río de la Plata; Logistics Director, BBVA Francés; President, BBVA Seguros; Territorial Director, BBVA Francés.
Mr. Allen joined the Bank in 1994.
|
|
Name
|
First Appointed
|
Current Position
|
Date of Birth
|
Background and Work Experience
|
|
Jorge Delfín Luna
|
2010
|
Director, Retail Banking
|
11/17/1958
|
Regional Manager, Sucursal Citibank, Citicorp; Regional Manager of Local Branches, Banco de Crédito Argentino; General Manager, Easy-Bank (BBVA Francés); General Manager and Vicepresident, BBVA Banco Uruguay; Companies Banking Manager, BBVA Francés.
Mr. Luna joined the Bank in 1996.
|
||||
|
Gustavo Osvaldo Fernández
|
2010
|
Director, Technology and Operations
|
01/22/1964
|
Coordinator, Systems and Organizations, Banca Nazionale del Lavoro; Systems Coordinator, Banco Galicia; Manager of Organization and Systems Development, Banco de Crédito Argentino; Design and Development Manager, Banco Francés; Media Director, Banco Francés; Director of Design and Development América, BBVA; Business Partner America, BBVA.
Mr. Fernandez joined the Bank in 1995.
|
|
Adriana Fernández de Melero
|
2010
|
Director, Corporate Development and Transformation
|
04/02/1961
|
Credits Recovery Analyst, Banco Español; Financial Analyst, Banco Español; Financial Profitability and Planning Analyst, Banco Español; Planning and Management Control Analyst, Banco de Crédito Argentino; Head of Budget, Planning and Management Control, Banco de Crédito Argentino; Leader of Reengineering Project, Banco de Crédito Argentino; Human Resources Development and Planning Manager, Banco de Crédito Argentino; Manager of Human Resources Management, BBVA Banco Francés; Manager of Structures and Projects, BBVA Francés; Organization Manager, BBVA Francés; Commercial Development and Channels Manager, BBVA Francés.
Mrs. Fernandez de Melero joined the Bank in 1987.
|
||||
|
Juan Eugenio Rogero González
|
2010
|
Director, Risks
|
06/20/1956
|
Mr. Rogero González joined BBVA in 1973. His background includes: Branch Director Corporate Banking, Bilbao BBVA; Risks and Corporate Director, BBVA Puerto Rico; Insurances Development Director, BBVA America and Global Director of Corporate Risks Control, BBVA; Risks Director, BBVA Francés; Corporate Polices and Wholesale Portfolios Director, BBVA.
Mr. Rogero González first joined the Bank in 2005.
|
The service contracts of the directors and the executive officers do not provide for benefits upon termination of employment, except as described in
“Directors, Senior Management and Employees—B. Compensation”
.
Supervisory Committee
At the General Ordinary and Extraordinary Shareholders Meeting of BBVA Francés held on March 26, 2012, the following members of the Supervisory Committee were appointed:
|
Expiration of term
|
||
|
Regular
|
Mario Rafael Biscardi
|
December 31, 2012
|
|
|
Marcelino Agustín Cornejo
|
December 31, 2012
|
|
|
Alejandro Mosquera
|
December 31, 2012
|
|
Alternate
|
Julieta Paula Pariso
|
December 31, 2012
|
|
|
Agustín Isola
|
December 31, 2012
|
|
|
Daniel Oscar Celentano
|
December 31, 2012
|
As of December 31, 2012, both the regular and alternate members of the Bank’s Supervisory Committee, in their capacity as lawyers, have represented to the Bank that: (a) they perform or are prepared to perform the function of legal advisors with the professional independence required by Technical Resolution Nr. 15 of the Argentine Federation of Professional Councils in Economic Sciences; (b) they are members of Biscardi & Asociados S.R.L. and qualify as “independent” according to General Resolution Nr. 368 (New Text 2001), as amended by General Resolution Nr. 400 of the CNV; and (c) they have filed all the information required by the mentioned dispositions of the CNV, regarding their professional relations with the Bank.
At the General Ordinary and Extraordinary Shareholders Meeting of BBVA Francés held on April 9, 2013, the above mentioned members of the Supervisory Committee were appointed for a new period, which expires on December 31, 2013.
Background information
|
-
|
Mario Rafael Biscardi: Lawyer, member of Biscardi & Asociados S.R.L., member of the Supervisory Committee of Consultatio Asset Management Gerente De Fondos Comunes De Inversión S.A.; PSA Finance Compañía Financiera S.A.; Rombo Compañía Financiera S.A.; Sociedad Comercial Del Plata S.A.; Aplica Soluciones Argentina S.A. (undergoing liquidation proceedings); BBVA Consolidar Seguros S.A.; Bridgestone Argentina S.A.I.C.; Centro Automotores S.A.; Centro del Norte S.A.; Compañía General De Combustibles S.A.; Consolidar AFJP S.A. (undergoing liquidation proceedings); Cormasa S.A.; Courtage S.A.; Duke Energy Cerros Colorados S.A.; Duke Energy Generating S.A.; Duke Energy International Southern Cone S.R.L.; BBVA Francés Valores Sociedad De Bolsa S.A.; Industrial Valores Sociedad De Bolsa S.A.; Inversora Otar S.A.; Laboratorios Essex S.A.; Metalúrgica Tandil S.A.; Plan Rombo S.A. De Ahorro Para Fines Determinados; Renault Argentina S.A.; Rombo Ahorro S.A. De Ahorro Para Fines Determinados; Schering Plough S.A.; Tango Jet S.A.; Satex S.A.F.S.A.; Tavex Argentina S.A.; V.T.V. Norte S.A., Walmont S.A., Banco de Servicios Financieros S.A.; Contigo Microfinanzas S.A.; Valentín Bianchi S.A.C.I.F.; Banco Finansur S.A.; Industrial Asset Management Sociedad Gerente de Fondos Comunes de Inversión S.A. He serves as an alternate member of the supervisory committee in: Carboclor S.A.; Compañía de Alimentos Fargo S.A., Procter & Gamble Argentina S.R.L.; Fresh Food S.A., Tinocam S.A.; La Preferida de Olavarría S.A., Panificación Argentina S.A.I. y C.; Petrouruguay S.A.; Capital Foods S.A. y Establecimiento Elaborador de Alimentos SACAAN de Argentina S.A..
|
|
-
|
Alejandro Mosquera: Lawyer, member of Biscardi & Asociados S.R.L., member of the Supervisory Committee of Consultatio Asset Management Gerente De Fondos Comunes De Inversión S.A.; PSA Finance Compañía Financiera S.A.; Rombo Compañía Financiera S.A.; Aplica Soluciones Argentina S.A. (undergoing liquidation proceedings); BBVA Consolidar Seguros S.A.; Centro Automotores S.A.; Centro del Norte S.A.; Compañía General De Combustibles S.A.; Consolidar AFJP S.A. (undergoing liquidation proceedings); Cormasa S.A.; Compañía de Alimentos Fargo S.A. Courtage S.A.; Duke Energy Cerros Colorados S.A.; Duke Energy Generating S.A.; Duke Energy International Southern Cone S.R.L.; BBVA Francés Valores Sociedad De Bolsa S.A.; Fresh Food S.A.; Industrial Valores Sociedad De Bolsa S.A.; Inversora Otar S.A.; Metalúrgica Tandil S.A.; Plan Rombo S.A. De Ahorro Para Fines Determinados; Procter & Gamble Argentina S.R.L.; Renault Argentina S.A.; Rombo Ahorro S.A. De Ahorro Para Fines Determinados; Satex S.A.F.S.A.; Tango Jet S.A.; Tavex Argentina S.A.; Walmont S.A.; Panificación Argentina S.A.I. y C.; Capital Foods S.A.; Banco de Servicios Financieros S.A.; Banco Finansur S.A.; Establecimiento Elaborador de Alimentos SACAAN de Argentina S.A. e Industrial Asset Management Sociedad Gerente de Fondos Comunes de Inversión S.A. He serves as an alternate member of the supervisory committee in: Carboclor S.A.; Sociedad Comercial del Plata S.A.; Laboratorios Essex S.A.; Schering Plough S.A.; Tinocam S.A.; La Preferida de Olavarría S.A.; Petrouruguay S.A. y Contigo Microfinanzas S.A.
|
|
-
|
Marcelino Agustín Cornejo: Lawyer, member of Biscardi & Asociados S.R.L., member of the Supervisory Committee of Rombo Compañía Financiera S.A.; Aplica Soluciones Argentina S.A. (undergoing liquidation proceedings); BBVA Consolidar Seguros S.A.; Bimbo de Argentina S.A.; Centro Automotores S.A.; Centro del Norte S.A.; Consolidar AFJP S.A. (undergoing liquidation proceedings); Cormasa S.A.; Courtage S.A.; Duke Energy Generating S.A.; Duke Energy International Southern Cone S.R.L.; BBVA Francés Valores Sociedad De Bolsa S.A.; Industrial Valores Sociedad De Bolsa S.A.; Inversora Otar S.A.; Metalúrgica Tandil S.A.; Plan Rombo S.A. De Ahorro Para Fines Determinados; Renault Argentina S.A.; Rombo Ahorro S.A. De Ahorro Para Fines Determinados; Tavex Argentina S.A.; Tubos Argentinos S.A.; V.T.V. Norte S.A.; Banco Finansur S.A. He serves as an alternate member of the supervisory committee in: Carboclor S.A.; Consultatio Asset Management Gerente De Fondos Comunes De Inversión S.A.; Compañía General de Combustibles S.A.; Duke Energy Cerros Colorados S.A.; Tinocam S.A.; Petrouruguay S.A.; Banco de Servicios Financieros S.A. e Industrial Asset Management Sociedad Gerente de Fondos Comunes de Inversión S.A.
|
|
-
|
Julieta Paula Pariso: Lawyer, member of Biscardi & Asociados S.R.L., alternate member of the Supervisory Committee of Consultatio Asset Management Gerente De Fondos Comunes De Inversión S.A.; Rombo Compañía Financiera S.A.; Aplica Soluciones Argentina S.A. (undergoing liquidation proceedings); BBVA Consolidar Seguros S.A.; Centro Automotores S.A.; Centro del Norte S.A.; Compañía General De Combustibles S.A.; Consolidar AFJP S.A. (undergoing liquidation proceedings); Cormasa S.A.; Courtage S.A.; Duke Energy Cerros Colorados S.A.; Duke Energy Generating S.A.; Duke Energy International
|
|
|
Southern Cone S.R.L.; BBVA Francés Valores Sociedad De Bolsa S.A.; Industrial Valores Sociedad De Bolsa S.A.; Inversora Otar S.A.; Metalúrgica Tandil S.A.; Plan Rombo S.A. De Ahorro Para Fines Determinados; Renault Argentina S.A.; Rombo Ahorro S.A. De Ahorro Para Fines Determinados; Tavex Argentina S.A.; V.T.V. Norte S.A.; Banco de Servicios Financieros S.A.; Banco Finansur S.A. e Industrial Asset Management Sociedad Gerente de Fondos Comunes de Inversión S.A.
|
|
-
|
Agustín Isola: Lawyer, member of Biscardi & Asociados S.R.L., alternate member of the Supervisory Committee of Aplica Soluciones Argentina S.A.(undergoing liquidation proceedings); Rombo Compañía Financiera S.A.; BBVA Consolidar Seguros S.A.; Bimbo de Argentina S.A.; Courtage S.A.; Centro Automotores S.A.; Centro del Norte S.A.; Consolidar AFJP S.A. (undergoing liquidation proceedings); Cormasa S.A.; Duke Energy Generating S.A.; Duke Energy International Southern Cone S.R.L.; BBVA Francés Valores Sociedad De Bolsa S.A.; Industrial Valores Sociedad De Bolsa S.A.; Inversora Otar S.A.; Metalúrgica Tandil S.A.; Plan Rombo S.A. De Ahorro Para Fines Determinados; Renault Argentina S.A.; Tavex Argentina S.A.; Tubos Argentinos S.A.; V.T.V. Norte S.A.; Banco de Servicios Financieros S.A. y Banco Finansur S.A.
|
|
-
|
Daniel Oscar Celentano: Lawyer, member of Biscardi & Asociados S.R.L., alternate member of the Supervisory Committee of Aplica Soluciones Argentina S.A. (undergoing liquidation proceedings); Rombo Compañía Financiera S.A; BBVA Francés Valores Sociedad De Bolsa S.A.; Industrial Valores Sociedad De Bolsa S.A.; Inversora Otar S.A.; Consolidar AFJP S.A. (undergoing liquidation proceedings); BBVA Consolidar Seguros S.A.; Metalúrgica Tandil S.A.; Courtage S.A.; Centro del Norte S.A.; Centro Automotores S.A.; Renault Argentina S.A.; Cormasa S.A.; Plan Rombo S.A. de Ahorro para Fines Determinados; Tavex Argentina S.A. y Banco Finansur S.A.
|
There are no agreements between the Bank and its directors, members of the Supervisory Committee or main executives, as a consequence of which the directors, members of the Supervisory Committee or main executives might have interests in opposition to those of the Bank, according to the provisions of Article 272 of the Business Companies Law (“LC”).
Advisors
All legal advice is provided to the Bank by its own Legal Services Department.
The Bank has no financial advisors.
External Auditors
As of October 1, 2002, Deloitte & Co. S.R.L. (currently, Deloitte & Co. S.A.) acts as the Bank’s external auditor. The last appointment was approved by the Ordinary and Extraordinary Shareholders Meetings held on April 9, 2013.
According to the provisions of General Resolution Nr. 368 of the CNV (New Text 2001): the auditor of the financial statements for the fiscal year closing on December 31, 2012 was Roxana Mabel Fiasche, National Public Accountant (Buenos Aires University) who is registered with the Professional Council of Economic Sciences of the City of Buenos Aires, Volume 274, Page 40. Roxana Mabel Fiasche was re-elected for the fiscal year closing on December 31, 2013.
The firm Deloitte & Co. S.A. has its domicile at Florida 234, 5th floor (C1005AAF), City of Buenos Aires, Argentina and is registered with the Professional Council in Economic Sciences of the City of Buenos Aires, under Volume 1, Page 3.
Audit Committee (I)
BBVA Francés established the Audit Committee (I) as described in the minutes of the Board of Directors Nr. 4989 to comply with the provisions set out by the Central Bank in its Communication “A” 2525, as supplemented, dated April 1997.
As of this date, the Audit Committee (I) is comprised of:
|
|
a)
|
Oscar Miguel Castro
|
|
|
b)
|
Mario Luis Vicens
|
|
|
c)
|
Esther Dafauce
|
Permanent Assistants to the Committee
: Jorge Luna; Jorge Allen; Ignacio Sanz y Arcelus; Adrián Bressani .
The Audit Committee (I) meets once a month. In each of these meetings, the Internal Audit Director presents the projects undertaken by the Internal Audit Department. The minutes of the meeting are then drawn up detailing the issues discussed as well as those items requiring further discussion. The minutes are transcribed into an internal control book which is sent to the Board of directors for their information.
The Audit Committee (I)’s duties are to:
|
|
§
|
supervise the appropriate implementation of the internal control systems defined in the Bank through a regular evaluation;
|
|
|
§
|
provide assistance to improve the effectiveness of the internal controls;
|
|
|
§
|
inquire about external audit planning and comment as necessary on the nature, scope and time for the performance of the audit proceedings;
|
|
|
§
|
revise and approve the annual work program of the Bank’s internal audit area (“Internal Audit Planning Memorandum” or “Annual Planning”) to be carried out under said Annual Planning, as well as the level of compliance with such program;
|
|
|
§
|
revise the reports issued by the internal auditors pursuant to the provisions set forth in these rules;
|
|
|
§
|
consider the observations made by the external and the internal auditors regarding the internal control weaknesses found during the performance of their duties, as well as the corrective measures implemented by the general management to minimize or cure such weaknesses;
|
|
|
§
|
review the results obtained by the Supervisory Committee of the Bank during the performance of its duties, as informed in the applicable reports;
|
|
|
§
|
maintain a permanent communication with the officers of the Superintendency of Financial and Exchange Institutions in charge of the control of the Bank, so as to learn about their concerns, and the problems identified during the inspections conducted in the Bank, and control the actions adopted to solve such problems;
|
|
|
§
|
keep informed of the annual financial statements and the financial statements for the respective three-month periods as well as the external auditors’ report issued with respect to the former, and any other applicable accounting information; and
|
|
|
§
|
regularly control compliance with the independence rules applicable to external auditors.
|
Audit Committee (II) (as per Law Nr.26,831 which complies with NYSE Listing Standards)
BBVA Francés has an Audit Committee (II) with the following current composition, according to Board’s resolution dated May 18, 2010:
|
Members:
|
José Manuel Tamayo Pérez
Oscar Miguel Castro
Marcelo Gustavo Canestri
|
According to Section 303A.07(b) of the NYSE Listed Company Manual, all of the members of this Audit Committee must be “independent”. Moreover, according to Decree Law Nr. 26,831 the Audit Committee (II) must consist of at least three members of the Board, the majority of whom should be independent directors. All the members of the Audit Committee (II) qualify as an independent director according to the independence criteria set forth by General Resolution Nr. 368 of the CNV, The powers and duties of the Audit Committee (II) are as follows:
|
|
§
|
to render an opinion on the Board’s proposal to appoint the external auditors to be retained by the company, and ensure their independence.
|
|
|
§
|
to supervise the operation of internal control and administrative accounting systems, as well as ensure the reliability of the latter and of all financial information or other significant facts submitted to the CNV and the self-regulated bodies in compliance with the applicable information regulations.
|
|
|
§
|
to supervise the application of policies regarding the information about the company’s risk management.
|
|
|
§
|
to furnish the market with comprehensive information in respect of operations which may involve conflicts of interest with members of the corporate bodies or controlling shareholders.
|
|
|
§
|
to render an opinion on the reasonableness of proposals concerning fees and share option plans for the company’s directors and managers as submitted by the administration body.
|
|
|
§
|
to render an opinion on the observance of legal requirements and the reasonableness of the conditions for the issuance of shares or securities convertible into shares in the event of a capital increase, with exclusion or limitation of preference rights.
|
|
|
§
|
to verify the observance of the applicable standards of behavior.
|
|
|
§
|
to issue a duly grounded opinion with regard to operations with related parties in those cases contemplated by Law Nr. 26,831.
|
|
|
§
|
to issue a duly grounded opinion and forward it to the self-regulated entities as determined by the CNV whenever there is a conflict of interests or the possibility of such a conflict in the company.
|
|
|
§
|
to prepare annually an action plan to be submitted to the Board and the Supervisory Committee.
|
|
|
§
|
to examine the plans prepared by the external and internal auditors, evaluate their performance and issue an opinion on the matter on occasions of the presentation and publication of the annual financial statements.
|
All directors, members of the Supervisory Committee, managers and external auditors must, at the request of the Audit Committee, attend its sessions and cooperate with it, facilitating its access to such information as may be available to them. In order to ensure a more appropriate exercise of the powers and duties contemplated herein, the committee may request the advice of lawyers and other independent professionals and retain their services for the account of the company within the budget allocated for such purposes by the shareholders meeting. The Audit Committee shall have access to such information and documentation as it may deem necessary in order to comply with its obligations.
Nomination and Compensations Committee
|
Members:
|
José Manuel Tamayo Pérez
Oscar Miguel Castro
Marcelo Gustavo Canestri
|
The Nominations and Compensation Committee was created on Dicember 17, 2008. Its main purpose is to provide information and advise regarding the nomination and compensations of Directors and Executive Officers. Its main functions are to:
|
|
§
|
establish the requirements for their appointments;
|
|
|
§
|
approve their training programs;
|
|
|
§
|
approve policies and criteria for the evaluation of their performances;
|
|
|
§
|
annually inform the Board of Directors of the criteria enforced to determine their compensation; and
|
|
|
§
|
state the policies for their promotion, layoff, suspension and retirement.
|
|
B.
|
Compensation
|
The Bank has a Nominations and Compensation Committee which was created on March 30, 2009. Its members must be Directors with no executive functions, and the majority of its members must be “independent”. Its main functions are to provide assistance to the Board of directors in all issues regarding compensation policies and other benefits. Moreover, it is also in charge of stating the terms and conditions for the selection and hiring of the key principal executives of the company. As of December 31, 2012
it consisted of: (i) Oscar Miguel Castro; (ii) Marcelo Gustavo Canestri; (iii) José Manuel Tamayo Pérez; (iv) Gabriel Milstein and (v) Adrián Bressani.
The aggregate amount of compensation paid by the Bank and its subsidiaries during the fiscal year ended December 31, 2012, to all directors and officers for services in all capacities, including salaries and bonuses, was Ps.43.5 million. This amount also includes compensation accrued during 2011 and paid in 2012. Compensation in the amount of Ps.13.6 million accrued during 2012 and was fully paid in 2013. We hereby confirm that disclosure of the Directors individual compensations is not required under the Argentine law. Moreover, Argentine legislation requires approval of a total amount of Director’s compensation in the Annual Ordinary Shareholders’ Meeting.
During the fiscal year ended December 31, 2012, the Bank was required to set aside Ps.2.2 million to provide defined contribution pension plans (see Note 21.14 to our Consolidated Financial Statements).
Special Committees
The Bank has the following special committees (i) Management, (ii) Computer Technology (iii) Disclosure; (iv) Asset Laundering and Terrorism Financing Prevention Committee; (iv) Internal Control Evaluation Committee, among others.
|
|
§
|
Management Committee
|
As of December 31, 2012 the Management Committee consisted of: (i) Ricardo Enrique Moreno, (ii) Martín Ezequiel Zarich, (iii) Jorge Luna, (iv) Gabriel Milstein, (v) Gustavo Fernández, (vi) Ignacio Sanz y Arcelus (vii) Juan Eugenio Rogero González, (viii) Jorge Allen, (ix) Adriana Melero and (x) Juan Alberto Estrada.
The obligations of the Management Committee are to: (i) fix the business and investment strategies, the general risks policies, the human resources policies and cooperate with the General Manager; (ii) delegate powers to other officers; (iii) analyze and approve the general annual budget; (iv) monitor its evolution and determine corrective measures according to internal and market variables and (v) create business synergies with other companies of the group.
The Management Committee meets monthly.
|
|
§
|
Computer Technology Committee
|
The Computer Technology Committee is responsible for the institutional treatment of the policies, goals and planning of the information systems area, and currently and as of December 31, 2012, consists of: (i) Gustavo Fernández, (ii) Rubén Stempellato, (iii) Marcelo Gustavo Canestri, (iv) Daniel Neme, (v) Guillermo de la Plaza and (vi) Gustavo Siciliano.
The Computer Technology Committee meets quarterly.
|
|
§
|
Disclosure Committee
|
As of December 31, 2012, the Disclosure Committee consists of: (i) the Financial Planning Director Ignacio Sanz y Arcelus; (ii) Independent Director, Oscar Miguel Castro; (iii) the Legal Services Director, Adrián Bressani; (iv) the Audit Director, Esther Dafauce; (v) the Accounting Manager, Mónica Etcheverry; (vi) the Planning and Eficiency Manager, Jaquelina Kuscich; and (vii) the Secretary for Investors Relations, Vanesa Bories;
The general functions of the Disclosure Committee are to make sure that all information supplied to the Bank’s shareholders, the markets where its shares are listed and the regulatory bodies of such markets is true and complete, adequately represents its financial situation and the results of its operations and is communicated in compliance with the terms and other requirements of the applicable regulations and with general market operation and good corporate governance principles. It must therefore ensure the existence and maintenance by the Bank of procedures and controls regarding the preparation and content of all information included in the financial statements as well as of any accounting or financial information which must be registered with the CNV and other regulatory bodies and agents of the stock exchanges where the shares of BBVA Francés are listed.
The Disclosure Committee meets quarterly.
|
|
§
|
Asset Laundering and Terrorism Financing Prevention Committee
|
As of December 31, 2012, the Asset Laundering and Terrorism Financing Prevention Committee consisted of: Two Directors, Mario Luis Vicens and Marcelo Gustavo Canestri and the Manager in charge of the Money Laundering Prevention area, Christian Mozetic.
In order to comply with its control and prevention purposes, the Terrorism Assets and Money Laundering Prevention Committee assumes the following responsibilities:
|
|
-
|
to deal with all matters related to the prevention of terrorism assets laundering and financing.
|
|
|
-
|
to define operational policies and continuously monitor their degree of advancement.
|
|
|
-
|
to assign duties to the different areas involved.
|
Each member assumes the following functions:
|
|
-
|
to render his or her area of activity more sensitive as to the importance of preventing terrorism assets laundering and financing.
|
|
|
-
|
to detect any relevant situation which may occur in his or her area in this connection.
|
|
|
-
|
to analyze any new product or service and evaluate potential asset laundering risks.
|
|
|
-
|
to assume the necessary commitments in his or her area in order to implement prevention systems in coordination with the officer responsible for Asset Laundering Prevention.
|
The Terrorism Asset Laundering and Financing Committee has delegated some of its powers in order to optimize the treatment of reports received. To this effect a Prevention Subcommittee has been created with powers to receive, analyze and report any unusual or suspicious operations according to the procedure determined by the Bank’s internal regulations.
The Terrorism Asset Laundering and Financing Committee meets every three months, or extraordinarily whenever the coordinator should deem it convenient due to the existence of relevant matters to be discussed.
Not fewer than five business days in advance of the meeting shall the Regulatory Compliance Director discuss with the secretary the subjects to be treated at the quarterly meeting, and the Secretary will submit the agenda to the members of the Committee.
|
|
§
|
Internal Control Evaluation Committee
|
As of December 31, 2012, the Internal Control Evaluation Committee consists of: the Regulations Compliance Manager (who acts as coordinator), the Internal Control Supervisor (who acts as vice-coordinator and secretary), , the Chief of Internal Control and New Products, the Human Resources Director, the Internal Audit Director, the Accounting Manager, the Legal Services Director and the Financial Information Internal Control Manager.
The Internal Control Evaluation Committee is the last step in the “Pyramidal Certification” process established in compliance with section 404 of the SOX Act.
In order to fulfill its goals, the Committee assumes the following responsibilities:
|
|
-
|
to discuss the issues related to the internal control model.
|
|
|
-
|
to evaluate control weaknesses evidenced in the work performed in compliance with section 404 of the SOX Act and the group’s internal control model.
|
|
|
-
|
to decide on possible discrepancies occurred in the internal certification procedures.
|
|
|
-
|
to analyze, if applicable, the internal control report proposal in compliance with the requirements of section 404 of the SOX Act and the group’s internal control model.
|
|
|
-
|
to approve the internal control report that will support the internal control certification to be included in the 20-F documentation to be filed with the SEC.
|
The Internal Control Evaluation Committee meets once per year, or at the request of the Committee’s coordinator or vice-coordinator, or when the person responsible for their coordination deems appropriate due to the existence of some relevant issue.
|
|
§
|
Corporate Integrity Committee.
|
As of December 31, 2012, the Corporate Integrity Committee consists of: the Planning and Financial Areas Director, the Corporate Development and Transformation Director, the Legal Services Director, the Audit Director, the CIS and Security and Human Resources Director, the Corporate & Investment Banking Director, the Retail Banking Director, the Technology and Operations Director, and the Compliance Manager.
The main functions of this committee are:
|
|
-
|
to authorize specific exemptions regarding the compliance of the rules set forth in the Code of Conduct.
|
|
|
-
|
to implement the necessary measures to deal with any ethically questionable matter known by any of its members as a result of their activity or as a consequence of the reception of communications referred to in Section 6.28 of the Code of Conduct.
|
|
|
-
|
regarding those circumstances which may give rise to significant risks for the BBVA Group in Argentina, the Corporate Integrity Committee shall promptly inform the Board of directors, the Audit Committee, the Planning and Financial Direction, in order to ensure that such financial statements accurately reflect appropriate results.
|
|
|
§
|
Risks Management Committee.
|
The Risks Management Committee is the highest committee for the management of risks in BBVA Francés and as December 31, 2012, its member are the Executive President CEO, the Risks Director, Validation and Internal Control Manager, Retail Risk Manager, Risks Company and Wholesale Manager, Risk Financial and Reporting Manager, Recuperation Manager and the Person in charged of the issue being addresses in the meeting.
Its main function is making decisions regarding risks in Argentina, for financial groups or clients regarding amounts beyond the credit powers granted to Risks Units. It also approves policies and recovery and monitoring actions, refinancing operations, etc.
|
|
§
|
Human Resources Committee
|
As of December 31, 2012, the Human Resources Committee consists of: the Executive President or CEO, Human Resources Director, Security and CIS, Corporate Development and Transformation Director.
The main functions of this committee are:
|
|
-
|
to define the organization chart.
|
|
|
-
|
to approve promotions at management level.
|
|
|
-
|
to establish the guidelines for the Human Resources Policies
|
|
|
-
|
to establish salaries and incentives criteria.
|
|
|
-
|
to validate skills assessments and positions.
|
|
|
-
|
to evaluate staff benefits.
|
|
|
-
|
to set career and training plans.
|
Also in compliance with resolutions of the Central Bank or other controlling bodies, the Bank has appointed different offices responsible for specific subjects, as detailed below:
|
|
-
|
Responsible for Foreign Exchange Positions (Communication “A” 4246 BCRA)
|
Main Officer Responsible: Mr. Manuel Mansilla
Alternate Officer Responsible: Mr. Gustavo Viturro
|
|
-
|
Responsible for Foreign Exchange Control (Communication “A” 4246 BCRA)
|
Main Officer Responsible: Mr. Alejandro Chiaradia
Alternate Officer Responsible: Mr. José Luis Frete
|
|
-
|
Responsible for costumer services in compliance with Communication “A” N° 5388 of the Central Bank.
|
Main Responsible: Vivianan Bertolami
Alternate Responsible: María Alejandra García de la Paz
|
|
-
|
Responsible for the Liquidity Policy (Communication “A” 2879 BCRA):
|
Mr. Diego Cesarini
|
|
-
|
Responsible for Information Systems (Communication “A” 2593 BCRA)
|
Main Officer Responsible: Mr. Ignacio Sanz y Arcelus
Alternate Officer Responsible: Mr. Martín Ezequiel Zarich
|
|
-
|
Responsible for Market Relations (Decree Nr. 677/01)
|
Main Officer Responsible: Ignacio Sanz y Arcelus
Alternate Officers Responsible: Mr. Martín Ezequiel Zarich, Mr. Adrián Bresssani
|
|
-
|
Compliance Officer on Money Laundering Prevention (Communication “A” 5004 BCRA):
|
Mr. Mario Luis Vicens
|
C.
|
Employees
|
The following table shows the breakdown of our full-time payroll employees as of December 31, 2012, 2011 and 2010:
|
|
December 31,
|
|||||||||||
|
2012
(1)
|
2011
(1)
|
2010
(1)
|
||||||||||
|
Main office
|
2,393 | 2,324 | 1,951 | |||||||||
|
Branches
|
2,753 | 2,687 | 2,625 | |||||||||
|
Total
|
5,146 | 5,011 | 4,576 | |||||||||
|
(1)
|
Excludes 12, 12 and 137 employees from non-banking subsidiaries as of December 31, 2012, 2011 and 2010, respectively.
|
Our employees are represented by a national bank union with optional membership. As of December 31, 2012, 1,368 employees were unionized. The union negotiates a collective bargaining agreement to establish minimum salaries for all of its members. We have not experienced any conflicts with the union for over 20 years and we consider relations with our employees to be satisfactory.
We have a personnel Training and Development Department, which is in charge of the training of all of the Bank’s employees. This includes in-house training courses and seminars in all the areas: Operations, Technology and Business (Branches, Corporate Banking). We provide bonuses to individual employees throughout the bank on a discretionary basis, taking into consideration individual merit and overall profit levels. We do not have a formal profit-sharing plan.
|
D.
|
Share Ownership
|
As of February 28, 2013, Jorge Carlos Bledel (Chairman of the Board), Marcelo Gustavo Canestri (Director), Gabriel Milstein (Human Resources, Procurement, Real Estate, General Services and Safety Director), Martín Ezequiel Zarich (Innovation and Development Director) and Gustavo Osvaldo Fernández (Technology and Operations Director) own shares in BBVA Francés. The ownership of each of them represented less than 1% of the capital stock of the Bank. The shares owned by these persons do not have different voting rights.
None of our directors or our remaining senior executives own shares or options on shares of BBVA Francés.
|
A.
|
Major Shareholders
|
The following table sets forth certain information regarding the beneficial ownership of our ordinary shares as of December 31, 2012, by each person who, to our knowledge, beneficially own more than 5% of our ordinary shares. These persons do not have different voting rights.
|
|
Ordinary Shares Beneficially Owned At December 31, 2012
|
|||||||
|
Beneficial Owner
|
Number of Shares
|
Percentage of Shares
Outstandings
|
||||||
|
Banco Bilbao Vizcaya Argentaria S.A.
|
244,870,968 | 45.61 | ||||||
|
BBV América SL
(1)
|
160,061,858 | 29.81 | ||||||
|
The Bank of New York Mellon
(2)
|
42,640,950 | 7.94 | ||||||
|
Administración Nacional de Seguridad Social
|
42,439,494 | 7.90 | ||||||
|
(1)
|
BBV América SL is controlled by BBVA. It has an effective 20.90% ownership interest in the capital stock of BBVA Francés and has an indirect 8.91% ownership interest in Inversora Otar S.A. following its merger by absorption.
|
|
(2)
|
As holder agent of ADSs.
|
As of October 2009 the total number of authorized and issued ordinary shares, par value Ps.1.00 per share, increased by 65,000,000 as a result of the distribution of share dividends approved by the Stockholders’ Meeting on March 27, 2009. On July 1, 2011 as result by the merger by absorption of Consolidar Comercializadora into BBVA Francés, the capital stock increased by 516,544 ordinary shares, par value Ps.1.00 per share. On September 14, 2011, the merger was registered with the Public Registry of Commerce. Accordingly, our capital stock increased to 536,877,850 shares and BBVA maintained its equity interest in the Bank at 76.00%.
On January 4, 2012 BBVA Francés was notified of the registration in the Public Registry of Commerce of Madrid of the merger between Bilbao Vizcaya América B.V and BBV América SL, in its capacity as successor company. The merger has been carried out as part of a corporate reorganization plan of the Group. Also for a description of the merger between BBVA Francés and Inversora Otar S.A. see
“Item 4. Information on the Company –History and Development of the Company”
.
We are a corporation registered under Argentine law whose shareholders restrict their liability to the shares they have subscribed and paid-in under the Business Companies Law. Therefore, and in terms of Law Nr. 25,738, no shareholder of the Bank, whether foreign or local, is liable beyond such paid-in shares for obligations deriving from transactions made by the Bank.
Except as described above, we are unaware of any arrangements the operation of which may, at a subsequent date, result in a change of control of BBVA Francés.
As of December 31, 2012, according to our records 17 holders of ordinary shares and 36 registered holders of ADSs (in accordance with the records of BoNY, as depositary for the ADSs) have an address in the United States representing 8.02% of our issued and outstanding ordinary shares.
|
B.
|
Related Parties Transactions
|
The following table presents the loans granted, guarantees given and extensions of credit granted (unused portions) to related parties for the fiscal years ended December 31, 2012 and 2011. Related parties include controlled companies, controlling shareholders and entities under common control, key management and directors and associated entities.
The loans described below (a) were made in the ordinary course of business, (b) were made on substantially the same terms, including interest rates and collateral, as those prevailing at the time for comparable transactions with other persons, and (c) did not involve more than the normal risk of collectibility or present other unfavorable features.
|
December 31, 2012
|
December 31, 2011
|
|||||||||||||||||||
|
Related Party
|
Largest
Outstanding
Amount
(1)(2)
|
Interest
Rates
|
Amount
Outstanding
(2)
|
Interest
Rates
|
Nature
|
Largest
Outstanding
Amount
(1)(2)
|
Interest
Rates
|
Amount
Outstanding
(2)
|
Interest
Rates
|
Nature
|
||||||||||
|
Controlled, Controlling and Under Common Control Entities
|
||||||||||||||||||||
|
BBVA and subsidiaries
|
162,448
|
—
|
151,921
|
—
|
Guarantees given and correspondents
|
261,456
|
—
|
115,906
|
—
|
Guarantees given, other loans and correspondents
|
||||||||||
|
BBVA Francés Valores Sociedad de Bolsa S.A.
|
19,554
|
—
|
16,395
|
—
|
Other loans and equity investment
|
16,074
|
—
|
14,599
|
—
|
Other loans and equity investment
|
||||||||||
|
BBVA Francés Asset Management S.A.
|
58,854
|
—
|
58,854
|
—
|
Other loans and equity investment
|
46,266
|
32.73%
|
46,266
|
32.73%
|
Credit card loans, other loans and equity investment
|
||||||||||
|
Consolidar AFJP S.A. (undergoing liquidation proceedings)
|
12,271
|
45.00%
|
11,507
|
—
|
Advances, other loans, guarantees given and equity investment
|
15,545
|
44.53%
|
11,897
|
0.12%
|
Advances, other loans, guarantees given and equity investment
|
||||||||||
|
Consolidar Seguros de Retiro S.A.
|
—
|
—
|
—
|
—
|
Advances and equity investment
|
12,956
|
32.73%
|
—
|
—
|
Advances and equity investment
|
||||||||||
|
Consolidar ART S.A.
|
4,744
|
32.73%
|
Advances, credit cards loans and equity investment
|
20,098
|
32.73%
|
20,098
|
32.73%
|
Advances, credit cards loans and equity investment
|
||||||||||||
|
PSA Finance
|
1,121,598
|
24.41%
|
1,040,737
|
24.39%
|
Advances, call money, other loans, guarantees given and equity investment
|
883,573
|
22.71%
|
883,573
|
22.71%
|
Advances, call money, other loans, guarantees given and equity investment
|
||||||||||
|
BBVA Consolidar Seguros S.A.
|
38,434
|
85.80%
|
34,363
|
32.73%
|
Advances, credit cards loans, other loans and equity investment
|
27,338
|
85.77%
|
27,338
|
85.77%
|
Advances, credit cards loans, other loans and equity investment
|
||||||||||
|
Consolidar Comercializadora S.A.
|
—
|
—
|
—
|
—
|
Advances
|
65
|
24.00%
|
—
|
—
|
Advances
|
||||||||||
|
Associated Entities
|
||||||||||||||||||||
|
Rombo Cia Financiera S.A.
|
861,703
|
27.01%
|
861,703
|
27.01%
|
Call money, other loans, guarantees given and equity investment
|
625,638
|
23.44%
|
625,638
|
23.44%
|
Call money, other loans, guarantees given and equity investment
|
||||||||||
|
Key Management Personnel
(3)
|
5,330
|
17.90%
|
5,330
|
17.90%
|
Advances, credit card loans, personal loans, other loans and real state mortgage
|
4,110
|
16.00%
|
3,778
|
20.50%
|
Advances, credit card loans, personal loans, other loans and real state mortgage
|
||||||||||
|
(1)
|
Largest amount during the period indicated.
|
|
(2)
|
In thousands of pesos.
|
|
(3)
|
Includes directors, senior managers, members of the audit committee and managers with relevant authority
.
|
The transactions included in this section (a) were made in the ordinary course of business, (b) were made on substantially the same terms, including interest rates and collateral, as those prevailing at the time for comparable transactions with other persons, and (c) did not involve more than the normal risk of collectibility or present other unfavorable features.
As of December 31, 2012, the Bank did not have outstanding any financial assistance from BBVA.
|
C.
|
Interest of Experts and Counsel
|
Not applicable.
|
A.
|
Financial Statements and Other Financial Information
|
See
“Item 3. Key information—A. Selected Financial Data”
and
“Item 18. Financial Statements”
and other financial information filed with this annual report
.
Dividends
The Bank has in place an earnings distribution policy in line with the Bank’s vocation for sustained stockholder value, that at the same time allows the Bank’s financial condition to perform favorably so as to strive for business growth and the maintenance of consistently high liquidity and solvency standards in compliance with currently applicable rules and regulations. According to Communication “A” 5072 dated May 6, 2010 of the Central Bank, such distribution must have the prior authorization of the Central Bank and any of the following situations may not have occurred during the month immediately preceding the request for authorization made to the Superintendence:
|
1.
|
The Bank falls under the provisions of Articles 34 “Regularization and restructuring” and 35 bis “Restructuring of the entity for the protection of credit and bank deposits” of the Financial Entities Law;
|
|
2.
|
The Bank has received financial assistance from the Central Bank, other than assistance received for lack of liquidity in terms of Decree Nr. 739/03 and its regulatory provisions (Communication “A” 3941 and complementary provisions), within the framework of article 17 of this Bank’s Charter, and in terms of the transactions foreseen by Communication “A” 4268;
|
|
3.
|
The Bank incurs delays or noncompliance with respect to the information system set forth by the BCRA; or
|
|
4.
|
The Bank shows deficiencies as to the payment of its minimum capital, either individually or on a consolidated basis (without computing for such purpose the effects of individual franchises granted by the Superintendent of Financial and Foreign Exchange Entities) or as regards its average minimum cash requirements in pesos or foreign currencies.
|
Communications “A” 5272 and “A” 5273 of the Central Bank dated February 1, 2012, increased the capital requirements for financial institutions that carry out activities in Argentina. These Communications require certain capital levels in order to support operational risks, and require for the distribution of dividends an additional conservation buffer equivalent to 75% of the total capital requirements. Because of these new requirements, the Bank is not able to distribute dividends for the 2012 fiscal year.
For a description of the declared dividends that we have paid on our ordinary shares and ADSs for the years 2008 to 2012, see
“Item 3. Key Information–Declared Dividends”
.
|
B.
|
Significant Changes
|
None.
We were one of the first companies listed on the Buenos Aires Stock Exchange (“BCBA”). Since 1993 our shares have also been listed on the New York Stock Exchange (“NYSE”) in the form of American Depositary Shares (“ADSs”) and, since December 1999, our shares have also been listed on the Madrid Stock Exchange. Before 1993, there was no public market for our shares outside of Argentina. The ordinary shares are currently traded on the BCBA under the symbol “FRAN” and the ADSs are currently traded on the NYSE under the symbol “BFR”. We cannot give assurance that a public market in the United States for the ADSs will continue to exist.
The table below shows the quarterly high and low closing prices of the ordinary shares in pesos on BCBA for the periods indicated. The following prices have not been adjusted for any stock dividends.
|
Pesos Per
Ordinary Share
(1)
|
||||||||
|
High
|
Low
|
|||||||
|
March 2013
|
12.50 | 11.25 | ||||||
|
February 2013
|
12.60 | 11.00 | ||||||
|
January 2013
|
12.60 | 11.55 | ||||||
|
Fiscal year ended December 31, 2012
|
11.50 | 7.00 | ||||||
|
Fourth quarter
|
11.50 | 8.00 | ||||||
|
December, 2012
|
11.50 | 9.30 | ||||||
|
November, 2012
|
9.30 | 8.00 | ||||||
|
October, 2012
|
9.10 | 8.07 | ||||||
|
Third quarter
|
9.20 | 7.28 | ||||||
|
Second quarter
|
10.55 | 7.00 | ||||||
|
First quarter
|
10.65 | 8.25 | ||||||
|
Fiscal year ended December 31, 2011
|
16.60 | 7.60 | ||||||
|
Fourth quarter
|
11.35 | 7.60 | ||||||
|
Third quarter
|
14.70 | 9.00 | ||||||
|
Second quarter
|
16.50 | 12.15 | ||||||
|
First quarter
|
16.60 | 14.85 | ||||||
|
Fiscal year ended December 31, 2010
|
17.80 | 7.28 | ||||||
|
Fiscal year ended December 31, 2009
|
8.73 | 2.50 | ||||||
|
Fiscal year ended December 31, 2008
|
8.55 | 2.42 | ||||||
|
(1)
|
Pesos per ordinary share data reflect nominal prices at trading date.
|
Source: BCBA.
The ordinary shares trade on the NYSE in the form of ADSs issued by The Bank of New York Mellon, as depositary. Each ADS represents three ordinary shares. The table below shows the quarterly high and low closing prices of the ADSs in dollars on the NYSE for the periods indicated.
|
U.S.$ Per ADS
(1)
|
|||||||
|
High
|
Low
|
||||||
|
March 2013
|
4
|
9/
20
|
4
|
3/
20
|
|||
|
February 2013
|
4
|
22/
25
|
4
|
1/
25
|
|||
|
January 2013
|
5
|
6/
25
|
4
|
46/
63
|
|||
|
Fiscal year ended December 31, 2012
|
6
|
44/
83
|
3
|
8/
89
|
|||
|
Fourth quarter
|
5
|
13/
50
|
3
|
17/
27
|
|||
|
December, 2012
|
5
|
13/
50
|
4
|
1/
5
|
|||
|
November, 2012
|
4
|
13/
50
|
3
|
17/
27
|
|||
|
October, 2012
|
4
|
23/
59
|
3
|
13/
20
|
|||
|
Third quarter
|
4
|
19/
25
|
3
|
3/
20
|
|||
|
Second quarter
|
6
|
1/
9
|
3
|
8/
89
|
|||
|
First quarter
|
6
|
44/
83
|
5
|
4/
21
|
|||
|
Fiscal year ended December 31, 2011
|
12
|
19/
50
|
4
|
10/
13
|
|||
|
Fourth quarter
|
7
|
1/
10
|
4
|
10/
13
|
|||
|
Third quarter
|
10
|
26/
51
|
5
|
1/
2
|
|||
|
Second quarter
|
11
|
2/
3
|
8
|
20/
69
|
|||
|
First quarter
|
12
|
19/
50
|
10
|
8/
17
|
|||
|
Fiscal year ended December 31, 2010
|
13
|
33/
50
|
5
|
9/
20
|
|||
|
Fiscal year ended December 31, 2009
|
7
|
16
/
39
|
1
|
4
/
5
|
|||
|
Fiscal year ended December 31, 2008
|
8
|
21
/
50
|
1
|
4
/
7
|
|||
|
(1)
|
Source: BNY Mellon Depositary.
|
Trading on the BCBA
There are nine exchanges in Argentina, of which five have affiliated stock markets and, accordingly, are authorized to quote publicly offered securities: Buenos Aires, Rosario, Córdoba, Mendoza and Santa Fe. The oldest and largest of these exchanges is the BCBA, which was founded in 1854. Usually, the overwhelming majority of all Argentine equity trades take place on the BCBA. As of December 31, 2012, the shares of 79 Argentine companies, excluding mutual funds, were listed on the BCBA. During the year 2012, the total volume traded on the exchange raised 17% in comparison with the volume of previous year. All publicly offered securities may be traded on authorized securities exchanges and, except for equity securities, in the Argentine over-the-counter market or MAE. See
“Item 4. Information on the Company—The Argentine Banking System and its Regulatory Framework—Capital Markets”
.
The MERVAL, which is affiliated with the BCBA, is the largest stock market in Argentina. The MERVAL is a corporation which regulates its members (all of whom are stockholders of the corporation) and transactions conducted on that market. Only stockholders of the MERVAL are allowed to effect transactions either as principal or as agent in that stock market. In 1990, brokerage houses, including bank subsidiaries, were allowed to enter as full members of the market. Trading in the MERVAL is conducted through three different trading systems:
|
§
|
the “Floor”;
|
|
§
|
the “SINAC”; and
|
|
§
|
the “Continuous”.
|
The operations at the traditional auction system (“the Floor”) start from 11:00 A.M. and end at 5:00 P.M. each business day. Also available is an electronic auction system called “SINAC” where each broker inputs both its buys and sells while the system matches the operations. Since July 1998, both auction systems (the Floor and SINAC) have been considered to be a single market. Both systems allow for the trade of securities, public bonds, private bonds, futures and derivatives. Additionally, the Buenos Aires Stock Market’s trades are made through an electronic Continuous Market System (the “Continuous”) that operates from 11:00 A.M. to 5:00 P.M. each business day. The Continuous is a system that registers and makes public trades that were privately arranged by registered brokers and brokerage companies on behalf of their clients. In this system only public and private bonds may be traded. Such trades are reported on the “Mercado Abierto”, an electronic reporting system similar to, but different from, the Continuous Market System. To control price volatility, the BCBA operates a system which suspends dealing in shares and bonds of a particular issuer for 30 minutes or less when changes in the price of such shares exceed or fall more than 10% of the preceding day’s closing share price. From then on, the BCBA suspends trading for a few minutes when prices rise or fall an additional 5% or more in the same day. In both markets, the operations can be executed in pesos or dollars from local accounts or foreign accounts.
As of December 31, 2012, the market capitalization of the 107 companies listed on the BCBA was approximately U.S.$472.06 billion. At the same time, the market capitalization of the domestic companies totalled U.S.$34.35 billion.
The following table summarizes certain historical information about the BCBA.
|
December 31,
|
||||||||||||
|
2012
|
2011
|
2010
|
||||||||||
|
Market capitalization (U.S.$ billion)
|
472.1 | 375.2 | 477.4 | |||||||||
|
Number of companies listed
|
107 | 105 | 107 | |||||||||
|
Rate of return in dollars
(1)
|
1.60 | % | (35.40 | )% | 45.81 | % | ||||||
|
Market/book ratio
(2)
|
1.03 | 1.48 | 2.65 | |||||||||
|
(1)
|
Based on the Merval Index
|
|
(2)
|
Estimated
|
Source: BCBA and Instituto Argentino de Mercados de Capitales (IAMC).
Market Regulation
Both the CNV and BCBA oversee the regulation of the Argentine capital markets. The CNV is responsible for authorizing public offerings of securities and supervising stockbrokers, including those which are subsidiaries of banking institutions. Generally, Argentine securities markets are regulated by Law Nr. 17,811, which created the CNV and which regulates securities exchanges, stockbrokers, market operations and the public offering of securities.
Under Law Nr. 17,811, public trading of securities on exchanges must be made with stock markets organized as stock corporations, which must be affiliated with a stock exchange.
Each stock market has the operating responsibility for all transactions performed by stockbrokers and has disciplinary power over them. Each stock market guarantees the proper settlement or clearance of transactions entered into by stockbrokers. The effect of such a guarantee is to provide brokers assurances that transactions will be consummated in a timely manner.
The CNV has passed a set of resolutions establishing a system of self-regulatory entities, under which each self-regulatory entity (which currently includes each exchange and the MAE) is responsible for developing and implementing regulations governing its respective securities market, subject to the approval and oversight of the CNV. Internal rules of each exchange for its affiliated stock market establish conditions for listing securities, admitting brokers, conducting trades and controlling the truthfulness of any information which is required to be reported.
In recent years, changes to the legal framework have been introduced permitting the issuance and trading of new financial products in the Argentine capital markets, including commercial paper, new types of corporate bonds, trust bonds, other credit instruments and futures and options over shares, bonds, indexes and the U.S. dollar. In 1991, brokerage fees were deregulated and transfer taxes and stamp taxes on publicly offered securities were eliminated.
In compliance with the provisions of Law Nr. 20,643, most debt and equity securities traded on the exchanges and on the MAE must, unless otherwise instructed by the stockholders, be deposited by the stockbrokers or over-the-counter dealers in the Caja de Valores, which is a corporation owned by the BCBA, the MERVAL and certain provincial exchanges. The Caja de Valores provides central depository facilities for securities and acts as a transfer and paying agent. In September 2000, the Caja de Valores started Argenclear S.A. (“Argenclear”), a clearing house owned by the most important private and public banks of Argentina, MERVAL and BCBA. Argenclear provides services to the brokers for the settlement of public bond trades registered in the MAE. It also handles settlement of securities transactions carried out by the BCBA and operates the computerized “Exchange Information System”.
On May 17, 2001, by means of General Resolution Nr. 368 the CNV approved a new restated text for a number of regulations in force in order to unify, harmonize and simplify the different requirements established by them. The new text incorporates the changes implemented by all general resolutions issued after General Resolution Nr. 290. On May 28, 2001, the Official Bulletin published the text of Decree Nr. 677/01 which created a regulatory framework to ensure Public Offer Transparency.
In order to offer securities to the public in Argentina, an issuer must meet certain requirements of the CNV regarding assets, operating history, management and other matters, and only securities for which an application for a public offering has been approved by the CNV may be listed on the BCBA. This approval does not imply any kind of certification or assurance related to the merits or the quality of the securities, or the solvency of the issuer. Issuers of listed securities are required to file with the CNV and the BCBA quarterly financial statements and audited annual financial statements, as well as various other periodic reports.
Although participation by foreign investors in BCBA has historically been low, it has increased since 1991 as a consequence of the economic reform programs implemented by the Argentine Government and the liberalization of restrictions to the access by foreign investors to securities in the Argentine securities market. Currently, an important amount of floating capital and public bonds is held by foreign investors, but since 2002 a decrease in the flow of foreign capital has been evident due to the economic crisis and the BCRA regulations.
In 2002, through Decree Nr. 216/02, the Mercado Unico y Libre de Cambios (“MULC”) was created and a series of other BCRA regulations that fixed limits to capitals flows were adopted. In 2005, the BCRA regulated the currency for the transactions in the regulated markets. Since 2005, all transactions can be converted in Pesos or U.S. dollars in local accounts and foreign accounts.
In December 2012, a new law was issued, which foresees significant changes in the regulation of listed entities and securities. This law became effective on January 28, 2013, and the CNV has until the June 30, 2013 to issue the corresponding regulations implementing such law. On January 21, 2013, the CNV issued General Resolution N° 615 establishing that entities, markets, stock exchanges and agents will continue to perform their activities in accordance with prior applicable law until the new set of regulations is approved.
It is important to note that the above mentioned law has clear and specific goals, such as (i) promoting the involvement in the capital markets of small investors, trade unions, associations and chambers of commerce, professional organizations and all public savings institutions; (ii) strengthening protection mechanisms and prevention of abuses against small investors; (iii) to promote access to capital markets of medium-sized companies; and (iv) promoting the creation of a federally integrated capital market and simplifying trading settlement for users.
|
A.
|
Share Capital
|
Not applicable
|
B.
|
Memorandum and Articles of Association
|
The following summarizes certain material provisions of our by-laws and Argentine law, the main regulatory bodies governing BBVA Francés. This summary is qualified in its entirety by reference to the Business Companies Law, the Financial Institution Law and our by-laws. Copies of our by-laws have been filed as exhibits to our 2010 annual report on Form 20-F.
At our Ordinary and Extraordinary Stockholders’ Meeting held on April 28, 2005, our stockholders voted to amend section 11 of the by-laws in order to comply with Resolution Nr. 20/04 of the Office of Corporations – Public Registry of Commerce (“Inspección General de Justicia”), and its amendments. This amendment will require each of our Directors to (i) pledge an amount of at least Ps.10,000 as a guarantee of the Director’s performance and (ii) maintain a special domicile within the Argentine Republic. This amendment has been filed with the Public Registry of Commerce, which was approved as of the filing of this annual report, on December 12, 2005, under Number 16,335, Book 30.
At the Ordinary and Extraordinary Stockholders’ Meeting held on March 27, 2009, our shareholders agreed and authorized to amend sections 10 and 13 of the corporate by-laws that will make it possible for the company to replace its Board of directors either partially or in stages through the appointment or re-election of its members, as well as to hold its meetings with the attendance of non-resident directors by video-teleconference. This amendment was registered with the Public Registry of Commerce on April 21, 2010, under Number 7.192, Book 49.
At the Ordinary and Extraordinary Stockholders´ Meeting held on April 30, 2010, our shareholders agreed and authorized to: (i) the amendment of section 10 of the corporate by-law regarding the different denominations that could be used by the company’s CEO, and (ii) to the amendment of section 21 and to eliminate section 17, regarding the Executive Committee which was no longer in use. These amendments were registered with the Public Registry of Commerce on August 2, 2010, under Number 13.784, Book 50.
At the Ordinary an Extraordinary Stockholders´ Meeting held on March 26, 2012, our shareholders agreed and authorized to amend section 10 of the corporate by-laws and included a transitional provision to allow the appointment of Directors for a less-than-three-year period, so that the appointment or renewal of their mandates is always carried out at least by three candidates, therefore ensuring the rights of minority shareholders to exercise their cumulative votes. The amendments were registered with the Public Registry of Commerce on October 19, 2012, under Number 15.848, Book 61.
Registry and Company’s Objects and Purposes
BBVA Francés is registered with the Public Registry of Commerce of the Argentina (Registro Público de Comercio) under company number 1,065, Page 359, Book 5, Volume “A” of Local Corporate By-laws. Section 3 of our by-laws provides that the object of BBVA Francés is to engage in the commercial banking business, including financial brokerage, whether in Argentina or abroad. Under our by-laws, BBVA Francés is authorized to perform the following activities:
|
§
|
accept term and demand deposits;
|
|
§
|
grant short-term bullet and other amortizable loans;
|
|
§
|
discount, purchase and sell bills of exchange, promissory notes, pledges, checks, drafts and other negotiable instruments;
|
|
§
|
grant guarantees, bonds or other forms of collateral; accept bills of exchange, drafts and other orders of payment, transfer funds and issue and accept letters of credit;
|
|
§
|
grant advances on credits from property sales, acquire the same and undertake the risks resulting therefrom, take steps to collect them and offer technical and administrative assistance;
|
|
§
|
invest in government securities;
|
|
§
|
make temporary investments in liquid assets;
|
|
§
|
invest in new stock or securities issues, in pursuance of such regulations as may be set forth to that purpose;
|
|
§
|
accept securities in custody and provide other services related to the banking business;
|
|
§
|
manage, on account of third parties, the purchase and sale of securities, and act as paying agents in relation to dividends, redemption and interest;
|
|
§
|
engage in brokerage activities in the over-the-counter securities market;
|
|
§
|
perform foreign exchange transactions;
|
|
§
|
comply with agencies related to its operations;
|
|
§
|
receive deposits of participation in mortgage loans and in special accounts;
|
|
§
|
issue mortgage obligations;
|
|
§
|
grant loans for the acquisition, construction, enlargement, repair, improvement and maintenance of urban or rural real estate, and for the substitution of mortgages taken out for that same purpose;
|
|
§
|
receive loans from abroad and act as intermediary in local or foreign currency-denominated loans;
|
|
§
|
issue private bonds, and
|
|
§
|
carry out such lending, borrowing and service-related operations as are not forbidden under the Financial Institutions Law.
|
Directors
Under Section 18 of our by-laws, the Board of Directors receives an annual fee established by the shareholders. This fee is subject to the restrictions of Section 261 of the Business Companies Law, which provides that the aggregate compensation of the directors may not exceed 25% of the income of the company, or 5% of the income if no dividends were distributed to the shareholders.
The compensation of the members of the Board is previously approved by the Nominations and Compensation Committee and the Audit Committee (II) of the Bank, taking into consideration the reasonability and legality of the amount proposed. The decision of these two Committees regarding the compensation amount will then be submitted to the approval of the Board of directors and the Annual Shareholders Meeting.
Under Section 272 of the Business Companies Law, a director may not vote in respect of any proposal in which he, or any person connected to him, has an interest contrary to the interests of BBVA Francés. Moreover, Directors are not entitled to carry out personal transactions with the company or its affiliates, other than the banking common operations, unless they are approved by a special procedure that guarantees the transparency of proposed transaction.
Directors need not hold shares in BBVA Francés or any of our subsidiaries to qualify and be appointed as directors of BBVA Francés.
The bank has no policies regarding age limits or retirement age.
Rights Attaching to Shares
As of the date of the filing of this annual report, our capital is formed by a single class of shares, all of which are ordinary shares and have the same voting and economic rights. Shareholders participate in the distribution of dividends pro rata of the paid-in capital. Furthermore, shareholders are entitled to participate in the distribution resulting from the liquidation of BBVA Francés in proportion to the paid-in capital.
Shareholders are entitled to vote cumulatively one-third of the vacancies of the Board of directors. The board may not be partially reelected if it impairs or prevents the exercise by shareholders of their cumulative voting rights.
Shareholders may no longer claim the payment of dividends from BBVA Francés once three years have elapsed from the date on which the relevant dividend was made available to such shareholder.
Our by-laws do not contain any provisions related to sinking funds or potential liability of shareholders of BBVA Francés to make additional contributions.
Communication “A” 5072, from May 6, 2010, provides that financial entities can distribute retained profits, with the corresponding authorization from the Central Bank, which must verify the following regarding such financial entity:
|
§
|
the Bank falls under the provisions of articles 34 “Regularization and restructuring” and 35 bis “Restructuring of the entity for the protection of credit and bank deposits” of the Financial Entities Law;
|
|
§
|
the Bank has received financial assistance from the Central Bank, other than assistance received for lack of liquidity in terms of Decree Nr. 739/03 and its regulatory provisions (Communication “A” 3941 and complementary ones), within the framework of article 17 of this Bank’s Charter, and in terms of the transactions foreseen by Communication A 4268;
|
|
§
|
the Bank incurs delays or noncompliance with respect to the information system set forth by the BCRA; or
|
|
§
|
the Bank shows deficiencies as to the payment of its minimum capital, either individually or on a consolidated basis (without computing for such purpose the effects of individual franchises granted by the Superintendence of Financial and Foreign Exchange Entities) or as regards its average minimum cash requirements in pesos or foreign currencies.
|
Communications “A” 5272 and “A” 5273 of the Central Bank dated February 1, 2012, increased the capital requirements for financial institutions that carry out activities in Argentina. These Communications require certain capital levels in order to support operational risks, and require for the distribution of dividends an additional conservation buffer equivalent to 75% of the total capital requirements.
Shareholders Meetings
All general meetings apart from annual regular meetings are called regular or special meetings. Ordinary and Extraordinary shareholders’ meetings are to be convened by the Board of Directors of the Bank or by the Supervisory Committee in such instances as set forth by law, or whenever they may deem it necessary, or upon requisition of shareholders representing at least 5% of our stock capital, as provided by Section 236 of the Business Companies Law.
Shareholders’ meetings are called by publication for five days, at least 20 and not more than 45 days before the date of the meeting, in the Official Gazette and in one of the most widely circulated newspapers in Argentina. The notice must include the nature, the date, time and place of the meeting, the agenda, and any special requirements in our by-laws for the shareholders to attend.
In case of adjournment of a regular shareholders meeting, the meeting on second call may be held on the same date, at least one hour after the time set for the meeting on first call, in compliance with Section 237 of the Business Companies Law. In case of adjournment of a special shareholders’ meeting, the meeting on second call must be held within the following thirty days, and the publication must appear for three days at least eight days before the date set for that meeting.
In order to attend and vote at any shareholders’ meeting, shareholders must deposit with us their shares or a share certificate or a statement of account representing book-entry shares, as the case may be, issued by us, a securities depository or any other authorized institution, to be recorded in the record book of attendance, at least three business days before the date of the meeting.
Holders of registered or book-entry shares, the record of which we keep, are only required to notify us to register their names in the record book of attendance, at least three business days before the date of the meeting. We must provide such shareholders with certificates authorizing them to attend the meeting.
Shareholders may be present at meetings by power-of-attorney or proxy. In the latter case, the principal’s signature shall be certified by a court, notary public or bank. Directors, statutory auditors, managers or any other of our employees may not act as agents for these purposes.
A quorum must be present at any regular shareholders’ meetings on first call upon the attendance of shareholders representing the majority of voting stock. On second call, there is a quorum with the attendance of any number of shares present. A quorum is present at any special shareholders’ meeting on first call upon the attendance of shareholders representing 60% of the voting stock. Shareholders representing 30% of our voting stock shall constitute a quorum at a special shareholders’ meeting on second call. In any case, resolutions require the absolute majority of the voting stock present.
Restrictions on Voting and Shareholding
There are no restrictions imposed by Argentine law or our by-laws or other organizational documents regarding the rights of non-residents or foreign persons to hold or vote our ordinary shares or ADSs of the Bank.
Change of Control
There are no provisions in our articles of incorporation or by-laws that would have the effect of delaying, deferring or preventing a change of control of BBVA Francés and that would operate only with respect to a merger, acquisition, corporate restructuring involving BBVA Francés or any of its subsidiaries.
Ownership Disclosure
There are no provisions in our by-laws governing the ownership threshold above which shareholder ownership must be disclosed.
Change in the Capital
Our by-laws do not establish conditions for the changes in the capital of BBVA Francés more stringent than those conditions imposed by the Business Companies Law.
|
C.
|
Material Contracts
|
No material contracts outside the ordinary course of business have been entered into during the last two years.
|
D.
|
Exchange Controls
|
On January 7, 2002, Congress approved the Public Emergency Law that introduced dramatic changes to the country’s economic model and amended the currency board that pegged the peso at parity with the dollar which had been in effect since April 1, 1991 pursuant to the Convertibility Law. The law empowers the Executive Branch to implement, among other things, additional monetary, financial and exchange measures to overcome the economic crisis in the medium term, including the power to establish a system to determine the exchange rate applicable to the peso. The Central Bank, among other restrictive measures, restricted the transfer of U.S. dollars abroad without its prior approval. In 2003 and 2004, the Government substantially eased these restrictions. However, on June 26, 2003, the Government set restrictions on capital flows into Argentina, which mainly consisted of a prohibition against the transfer abroad of any funds until 180 days after their entry into the country. Furthermore, on June 10, 2005 the Government issued Decree Nr. 616/05 establishing further restrictions on capital flows into Argentina, with the following provisions:
|
(i)
|
all incoming and outgoing funds from the Argentine Exchange market, and any debt operation with non-residents which could demand future payments in foreign currency to non-residents, are subject to registration with the Central Bank for informative purposes;
|
|
(ii)
|
any debt entered into between non-governmental persons or entities and non-residents must be agreed for a term of at least 365 days, except for the financing of import and export operations and the primary placements of public debt listed in an authorized stock exchange; and
|
|
(iii)
|
all incoming funds relating to foreign private debt, and all incoming funds of non-residents, excluding foreign direct investments and certain types of portfolio investments (purchases in the primary market of debt instruments and equity, listed in authorized stock exchanges, etc) regardless of the agreed payment procedure, must be agreed for at least 365 days, and 30% of incoming funds must be deposited with a bank in Argentina in a non-interest bearing account, known as “encaje” (legal reserve).
|
Decree Nr. 616/05 also states certain exceptions for the “encaje” such as settlements in foreign currency of resident loans granted by a local financial entity, certain capital contributions in local corporations, etc.
As a general rule, transfer of funds abroad required prior Central Bank approval. However, this general principle was eased by numerous exceptions introduced since December 2002. Currently, in order to purchase and/or transfer foreign currency abroad, the transaction should be specifically admitted among the list of “items” (authorizing the purchase and/or transfer of foreign currency) that is published by the Central Bank. Certain items are, however, still subject to restrictions.
Cross Border Transfers of Funds, Foreign Debts
Under the Central Bank’s exchange regulations, proceeds of new financing must be transferred into Argentina and converted into pesos in the local exchange market within 30 days as from the relevant disbursement.
Repayment of principal of, and interest on, foreign indebtedness, was initially subject to the Central Bank’s prior authorization. Currently, due to the changes introduced by the Central Bank, local companies (with the exception of financial institutions), must follow certain requirements,:
|
§
|
Pay abroad interest on foreign debt on its due date or up to 5 business days in advance. Access to the local foreign exchange market in connection with the servicing of foreign indebtedness is available only if and after the date the original proceeds from the financing have been transferred into Argentina and the foreign currencies liquidated as explained before. In case interests are due, access to foreign exchange may be available at any time. If the principal amount has been paid off access to the local market to pay interests shall be denied.
|
|
§
|
The exchange rate for the purchase of foreign currency must be fixed no later than 15 calendar days prior to the due date of each interest payment, or for accrued interests at any time of the period.
|
|
§
|
Repay principal of foreign debt at maturity (or 30 days in advance, to the extent that the amounts so prepaid were brought into the local market and exchanged for pesos, and repayment takes place at least 365 days thereof) without prior Central Bank authorization. Communication “A” 4177 (as amended) also allows prepayment of principal with an anticipation of more than 30 days, but subject to the following conditions:
|
|
(1)
|
If prepayment of principal is not made in the context of a debt restructuring process, then the amount prepaid should not exceed the present value of such amount, calculated according to the formula provided by the Central Bank.
|
|
(2)
|
If the prepayment is made within the context of a debt restructuring process, then the new terms and conditions of the debt after the restructuring, including the amount prepaid, shall not result in an increase of the present value of the whole debt (according to the formula of the Central Bank).
|
Regulations Regarding Exports, Imports, and Services.
The Central Bank established under Communication “A” 3473, as amended, an obligation to transfer from abroad to Argentina the foreign currency obtained from the collection of exports and to settle the foreign currency in the single free exchange market. This is a general obligation applicable to all export transactions. By virtue of a Disposition of the Ministry of Economy, enacted in 2012, all collections by exporters must be collected within 90 calendar days from the date of the export, depending on the product being exported, for the exporter to negotiate the foreign currency in the domestic exchange market; for exports carried out by affiliated companies payments derived thereof must be collected within 30 calendar days.
In respect to imports, advanced or at sight payments of any goods are allowed, upon condition that the clearance of the imported goods (nationalization) is credited within 365 and 90 days, respectively. Deferred import of goods may be paid up to 5 days in advance without the Bank’s prior authorization. The AFIP Regulation 3252 published on January 5, 2012 set forth that importers must file an import prior sworn statement.
Regarding the payment of services, when the service rendered has no direct connection with the activity of the person paying for such service, a legalized copy of the underlying contracts and an external auditor’s report must be filed with the entity performing the foreign exchange transaction. Communication “A” 5295 (and amendments) prescribed that the Central Bank’s prior authorization to purchase foreign currency will be required to pay for services if (a) the payee is “related” (directly or indirectly) with the local debtor; or when the payee resides or is domiciled in “tax heaven” countries, or when the payment is made to an account of a “tax heaven” jurisdiction; and (b) the service agreements generate payments or debts higher than U.S.$ 100.000 during a calendar year. Foreign currency which is received by residents in connection to the collection of services must be introduced into the foreign exchange market in order to be exchanged into pesos within 15 days from the date of collection.
Purchase of Foreign Currency
|
A.
|
Local individuals and companies
|
Communication “A” 5318 prohibits the purchase of foreign currency for local individuals and companies, except for the case of purchase of foreign currency for truism purposes.
|
B.
|
Non-residents
|
Notwithstanding the above, Communications “A” 4662, “A” 4692, “A” 4940 and “A” 5237 (as amended) state that no authorization from the Central Bank will be required with regard to the repatriation of direct and portfolio investments of non-residents (except in case of non residents domiciled at “tax heaven” countries). There are still mandatory requirements though a minimum term of permanence of the funds of one year and the inflows of foreign currency in the local foreign exchange market.
For the scenarios listed below, no authorization will be required except for transfers arising from “tax heaven” countries.
|
§
|
Transfers abroad arising out of:
|
|
(1)
|
Residents foreign indebtedness of residents related to Argentine imports of goods and services;
|
|
(2)
|
Domestic collections of:
|
|
-
|
Services, rents and other current transfers abroad of financial debts originated in non-residents foreign loans;
|
|
-
|
Inheritances according to the Declaration of a Decedent’s Heirs;
|
|
-
|
Federal Government Bonds and Guaranteed Loans Income issued in local currency;
|
|
-
|
Benefits or services or sale of values received, granted by the Federal Government as per Laws Nr. 24,043, 24,411 and 25.914.
|
|
-
|
Recoveries under local bankruptcy proceedings as long as the foreign creditor has been admitted as such by the Bankruptcy Court;
|
|
(3)
|
Sales proceeds from direct investments in local non-financial companies; and
|
|
(4)
|
The proceeds from final liquidation of direct investments in local non-financial companies;
|
|
(5)
|
Capital reduction; and
|
|
(6)
|
Restitution of irrevocable contributions made by the local company.
|
|
§
|
Transfers abroad of an aggregate equivalent of up to U.S.$500,000 per month arising out of:
|
|
(1)
|
Proceeds of sales of other portfolio investments and their revenues, such as investments in shares of local companies, investment funds and local trusts;
|
Also excepted from the approval of the Central Bank are the transactions effected by:
|
§
|
International bodies or entities that operate as official export credit agencies.
|
|
§
|
Diplomatic and consular representations as well as diplomatic staff accredited in the country for transfers made in exercise of their duties.
|
Legal representations in the country of Courts, Authorities or Offices, Special Missions, Commissions or Bilateral Bodies established by International Treaties or Agreements, to which the Argentine Republic is a party, for as long as the transfers are made in exercise of their duties.
Transfer of Corporate Bonds
According to Communications “A” 3859 and “A” 5264 (as amended), Argentine companies in general, may transfer corporate profits and dividends corresponding to audited financial statements certified by external public accountants. Under the AFIP Regulation 3417, published on December 19, 2012, a sworn prior statement to pay dividends shall be required. For information regarding the payment of dividends for Financial Entities please “
Item 8
–
Financial Information
”.
Direct Investments
On March 4, 2005, the Argentine Central Bank issued Communication “A” 4305 that regulates the reporting system of direct investments and real estate investments carried out by non-residents in Argentina and by Argentine residents abroad, which had been implemented through Communication “A” 4237 dated November 10, 2004.
|
§
|
Direct investments in Argentina of non-Argentine residents
|
Non-Argentine residents are compelled to comply with the reporting regime if the value of their investments in Argentina reaches or surpasses the equivalent of U.S.$500,000 – measured in terms of the net worth of the company in which they participate or fiscal value of the real estate owned. If the investments do not reach such amount, the compliance with such regime is optional.
According to Communication “A” 4237, companies in which non-Argentine residents participate in and administrators of real estate pertaining to non-Argentine residents are those obliged to comply with the reporting regime.
|
§
|
Direct investments made abroad by Argentine residents
|
Argentine investors are compelled to comply with the reporting regime if the value of their investments abroad reaches or surpasses the equivalent of U.S.$1,000,000 – measured in terms of net worth of the company in which they participate or the fiscal value of the real estate they own.
If the value of those investments abroad does not exceed the equivalent of U.S.$5,000,000, the declaration could be carried out annually instead of semi-annually. If the investments do not reach the equivalent of U.S.$1,000,000, the compliance with such regime is optional.
Future and Forward Operations
Communication “A” 4049 dated November 11, 2003, as amended, and Communication “A” 4805 (and additional ones) dated May 15, 2008, eased restrictions on foreign currency transactions by revoking the requirement of prior approval by the Central Bank so as to effect certain Future and Forward operations and have access to the exchange market for their cancellation. These transactions include agreements on foreign currency hedging interest rates and product prices, as well as foreign exchange REPO transactions.
|
E.
|
Taxation
|
The following is a summary of certain Argentine and United States federal income tax consequences of the ownership and disposition of our ADSs or ordinary shares by a U.S. Holder (as defined below). This summary is not a complete analysis or listing of all possible tax considerations that may be relevant to a holder of our ADSs or ordinary shares. Holders of our ADSs or ordinary shares should consult their own tax advisers as to the United States, Argentine and other tax consequences of the ownership and disposition of ADSs or ordinary shares.
|
1.
|
Argentine Taxes
|
General
The following is a summary of certain Argentine tax matters that may be relevant with respect to the ownership and disposition of ADSs or ordinary shares by U.S. Holders. Such summary is based upon the tax laws of Argentina, and regulations thereunder, in effect as of the date of this annual report and is subject to any subsequent change in Argentine laws and regulations which may come into effect after such date. Investors in ADSs or ordinary shares should consult their own tax advisers as to the United States, Argentine and other tax consequences of the ownership and disposition of ADSs or ordinary shares.
Taxation of Dividends
Pursuant to Law Nr. 25,063, as enacted into law on December 30, 1998, dividend payments on the ordinary shares (and ADSs), whether in the form of cash, stock, or other types of consideration, are subject to Argentine withholding taxes at a rate of 35% to the extent the aggregate amount distributed exceeds the sum, for the previous year, of: (i) our accumulated taxable earnings and (ii) certain tax-exempt income (such as dividend payments from other corporations).
Cash and stock dividends distributed in 2011 were not subject to income tax withholding.
Taxation of Capital Gains
To the extent the ADSs or ordinary shares are listed on a local or foreign stock exchange market, capital gains derived by non-resident individuals or foreign companies from the sale, exchange or other disposition of ADSs or ordinary shares are not currently subject to income tax.
In the event that capital gains should become subject to income tax in the future, the payment of tax would be the responsibility of the beneficial owners of ADSs and not the responsibility of “Euroclear” or “Cedel”, as the case may be.
Value Added Tax (“VAT”)
Neither the sale, exchange or other disposition of ADSs or ordinary shares nor the payment of dividends thereunder is subject to VAT.
Transfer Taxes
The sale or transfer of ADSs or ordinary shares is not subject to transfer tax.
Personal Property Tax
According to Law Nr. 23,966, as amended, and Decrees Nr. 127/96 and 812/96, all individuals and undivided estates are subject in Argentina to a personal property tax on all assets held at December 31 of each fiscal year (the “Personal Property Tax”). This tax applies to our ADSs and ordinary shares held by U.S. Holders. In the case of individuals and undivided estates domiciled or located in Argentina, an exemption is available to taxpayers whose assets included in the tax base for purposes of the Personal Property Tax do not exceed Ps.305,000. Corporations and other legal entities domiciled or located in Argentina are not subject to the Personal Property Tax. Individuals and undivided estates domiciled or located in a foreign country are subject to the Personal Property Tax only with respect to assets located in Argentina.
Pursuant to Law Nr. 25,585, it is presumed — without the right to rebut such presumption — that shares of stock corporations, such as ADSs (held in book-entry form or evidenced by ADRs), shares of common stock and equity interests in entities governed by the Business Companies Law Nr. 19,550, as amended, whose holders are corporations or any other entities, companies, permanent establishments or trusts, domiciled, settled or located in a foreign country, belong indirectly to individuals or undivided estates domiciled in a foreign country.
Pursuant to Law Nr. 25,585, published in the Official Gazette on May 15, 2002, BBVA Francés is responsible for paying the Personal Property Tax on our ADSs or ordinary shares held by individuals or undivided estates domiciled in Argentina or a foreign country, or corporations or any other entities located in a foreign country. The tax rate to be applied is 0.50% and the taxable base is the value of the shareholders’ equity arising from the last balance sheet of the company at December 31. The minimum exempted amount of Ps.305,000 is not applicable. The tax so paid is considered a definitive payment.
Companies responsible for the tax payment, such as BBVA Francés, are entitled to obtain refunds of the amounts paid from holders of ADSs or ordinary shares and may retain or foreclose on the property included in the tax base for purposes of the Personal Property Tax that originated the payment.
In May 2012, BBVA Francés paid Ps 6.759.495,06 to the Argentine authorities on account of its shareholders in connection with Personal Property Tax due with respect to assets held as of December 31, 2010.
In 2013 the Bank expects to make payments on account of its shareholders in connection of personal property tax due with respect to assets held as of December 31, 2011. The tax may be withheld from future dividends.
Other Taxes
There are no Argentine inheritance, succession or gift taxes applicable to the ownership, transfer or disposition of ADSs or ordinary shares. There are no Argentine stamp, issue, registration or similar taxes or duties payable by holders of ADSs or ordinary shares.
Deposit and Withdrawal of Ordinary Shares in Exchange for ADSs
No Argentine tax is imposed on the deposit or withdrawal of ordinary shares in exchange for ADSs.
Income Tax Treaty
There is currently no income tax treaty or convention in effect between Argentina and the United States.
|
2.
|
U.S. Federal Income Tax Considerations
|
The following summary describes the material U.S. federal income tax consequences to U.S. Holders of owning and disposing of ADSs or ordinary shares, but it does not purport to be a comprehensive description of all of the tax considerations that may be relevant to a particular person’s decision to hold such securities. The discussion applies only to U.S. Holders (as described below) that hold ADSs or ordinary shares as capital assets for U.S. federal income tax purposes and it does not describe all of the tax consequences that may be relevant in light of the U.S. Holder’s particular circumstances, including alternative minimum tax consequences, the potential application of the provisions of the Code known as the Medicare contribution tax and tax consequences applicable to U.S. Holders subject to special rules, such as:
|
§
|
certain financial institutions;
|
|
§
|
dealers and traders in securities who use a mark-to-market method of tax accounting;
|
|
§
|
persons holding ADSs or ordinary shares as part of a hedging transaction, straddle, wash sale, conversion transaction or integrated transaction or persons entering into a constructive sale with respect to ADSs or the ordinary shares;
|
|
§
|
persons whose functional currency for U.S. federal income tax purposes is not the U.S. dollar;
|
|
§
|
entities classified as partnerships for U.S. federal income tax purposes;
|
|
§
|
tax-exempt entities, including “individual retirement accounts” or “Roth IRAs”;
|
|
§
|
persons that own or are deemed to own ten percent or more of our voting stock; or
|
|
§
|
persons who acquired ADSs or ordinary shares pursuant to the exercise of an employee stock option or otherwise as compensation.
|
If an entity that is classified as a partnership for U.S. federal income tax purposes holds ADSs or ordinary shares, the U.S. federal income tax treatment of a partner will generally depend on the status of the partner and upon the activities of the partnership. Partnerships holding ADSs or ordinary shares and partners in such partnerships should consult their tax advisers as to the particular U.S. federal income tax consequences of holding and disposing of the ADSs or ordinary shares.
This discussion is based on the Internal Revenue Code of 1986, as amended (the “Code”), administrative pronouncements, judicial decisions and final, temporary and proposed Treasury regulations, all as of the date hereof. These laws are subject to change, possibly on a retroactive basis, which may affect the tax consequences described herein. It is also based in part on representations by the depositary and assumes that each obligation under the deposit agreement and any related agreement will be performed in accordance with its terms. Holders of the ADSs or ordinary shares are urged to consult their own tax advisers as to the United States, Argentine and other tax consequences of the ownership and disposition of ADSs or ordinary shares in their particular circumstances, including the effect of any U.S. state or local tax laws.
As used herein, a “U.S. Holder” is a beneficial owner of ADSs or ordinary shares that is, for U.S. federal income tax purposes:
|
§
|
a citizen or individual resident of the United States;
|
|
§
|
a corporation, or other entity taxable as a corporation, created or organized in or under the laws of the United States, any state therein or the District of Columbia; or
|
|
§
|
an estate or trust the income of which is subject to U.S. federal income taxation regardless of its source.
|
In general, a U.S. Holder who owns ADSs will be treated as the owner of the underlying shares represented by those ADSs for U.S. federal income tax purposes. Accordingly, no gain or loss will be recognized if a U.S. Holder exchanges ADSs for the underlying shares represented by those ADSs.
The U.S. Treasury has expressed concerns that parties to whom American depositary shares are released before shares are delivered to the depositary (“pre-release”), or intermediaries in the chain of ownership between U.S. Holders and the issuer of the security underlying the American depositary shares, may be taking actions that are inconsistent with the claiming of foreign tax credits for U.S. Holders of American depositary shares. Such actions would also be inconsistent with the claiming of the reduced rate of tax, described below, applicable to dividends received by certain non-corporate holders. Accordingly, the creditability of Argentine taxes, and the availability of the reduced tax rate for dividends received by certain non-corporate holders, each described below, could be affected by actions taken by such parties or intermediaries.
U.S. Holders should consult their tax advisers concerning the U.S. federal, state, local and foreign tax consequences of owning and disposing of ADSs or ordinary shares in their own particular circumstances.
This discussion assumes that the Company is not, and will not become, a passive foreign investment company (“PFIC”), as described below.
Taxation of Distributions
Distributions paid on ADSs or ordinary shares, other than certain pro rata distributions of ordinary shares, will generally be treated as dividends to the extent paid out of current or accumulated earnings and profits (as determined under U.S. federal income tax principles). Because the Company does not maintain calculations of its earnings and profits under U.S. federal income tax principles, it is expected that distributions will be reported to U.S. Holders as dividends. Subject to applicable limitations, dividends paid by qualified foreign corporations to certain non-corporate U.S. Holders are taxable at rates applicable to long-term capital gains. A foreign corporation is treated as a qualified foreign corporation with respect to dividends paid on stock that is readily tradable on a securities market in the United States, such as the New York Stock Exchange where our ADSs are traded. U.S. Holders should consult their tax advisers to determine whether the favorable rate will apply to dividends they receive and whether they are subject to any special rules that limit their ability to be taxed at this favorable rate. The amount of a dividend will include any amounts withheld in respect of Argentine taxes. The amount of the dividend generally will be treated as foreign-source dividend income to U.S. Holders and will not be eligible for the dividends-received deduction generally allowed to U.S. corporations under the Code. Dividends generally will be included in a U.S. Holder’s income on the date of such holder’s (or in the case of ADSs, the depositary’s) receipt of the dividend. The amount of any dividend income paid in Argentine Pesos will be the U.S. dollar amount calculated by reference to the exchange rate in effect on the date of such receipt regardless of whether the payment is in fact converted into U.S. dollars. If the dividend is converted into U.S. dollars on the date of receipt, U.S. Holders should not be required to recognize foreign currency gain or loss in respect of the dividend income. U.S. Holders may have foreign currency gain or loss if they do not convert the amount of such dividend into U.S. dollars on the date of its receipt.
Subject to applicable limitations, some of which vary depending upon the U.S. Holder’s circumstances, Argentine income taxes, if any, withheld from payments of dividends on ADSs or ordinary shares generally will be creditable against a U.S. Holder’s U.S. federal income tax liability. Amounts paid on account of the Argentine Personal Property Tax, if any, will not be eligible for credit against the U.S. Holder’s U.S. federal income tax liability. U.S. Holders should consult their tax advisers to determine the tax consequences applicable to them as result of amounts paid on account of the Argentine Personal Property Tax, including whether such amounts are includible in income or deductible for U.S. federal income tax purposes. The rules governing foreign tax credits are complex and, therefore, U.S. Holders should consult their tax advisers regarding the availability of foreign tax credits in their particular circumstances. Instead of claiming a foreign tax credit, a U.S. Holder may, at its election, deduct such otherwise creditable Argentine taxes in computing its taxable income, subject to generally applicable limitations under U.S. law.
Sale or Other Disposition of ADSs or Ordinary Shares
For U.S. federal income tax purposes, gain or loss a U.S. Holder realizes on the sale or other disposition of ADSs or ordinary shares will be capital gain or loss, and will be long-term capital gain or loss if the U.S. Holder held the ADSs or ordinary shares for more than one year. The amount of a U.S. Holder’s gain or loss will equal the difference between its tax basis in the ADSs or ordinary shares disposed of and the amount realized on the disposition, in each case as determined in U.S. dollars. Such gain or loss will generally be U.S.-source gain or loss for foreign tax credit purposes.
Passive Foreign Investment Company Rules
We believe that we were not a PFIC for U.S. federal income tax purposes for the taxable year 2012. However, because our PFIC status depends upon the composition of our income and assets and the market value of our assets (including, among others, less than 25-percent-owned equity investments) from time to time, and because our analysis of our PFIC status is based upon certain proposed Treasury regulations that are not yet in effect but are generally proposed to become effective for taxable years after December 31, 1994, there can be no assurance that we will not be considered a PFIC for any taxable year. If we are treated as a PFIC for any taxable year during which a U.S. Holder held ADSs or ordinary shares, gain recognized by such U.S. Holder on a sale or other disposition
(including certain pledges) of ADSs or ordinary shares would be allocated ratably over the U.S. Holder’s holding period for the ADSs or ordinary shares. The amounts allocated to the taxable year of the sale or other disposition and to any year before we became a PFIC would be taxed as ordinary income. The amount allocated to each other taxable year would be subject to tax at the highest rate in effect for individuals or corporations, as appropriate, for such taxable year and an interest charge would be imposed on the resulting tax liability for each such taxable year. Further, any distribution in respect of ADSs or ordinary shares in excess of 125 percent of the average of the annual distributions on ADSs or ordinary shares received by the U.S. Holder during the preceding three years or the U.S. Holder’s holding period, whichever is shorter, would be subject to taxation in the same manner. Certain elections (including a mark-to-market election) may be available to U.S. Holders that may mitigate the adverse consequences resulting from PFIC status. U.S. Holders should consult their tax advisers to determine whether any of these elections would be available and, if so, what the consequences of the alternative treatments would be in their particular circumstances.
In addition, if we were a PFIC or, with respect to a particular U.S. Holder, were treated as a PFIC for a taxable year in which we pay a dividend or the prior taxable year, the favorable tax rates discussed above with respect to dividends paid to certain non-corporate holders would not apply
If we were a PFIC for any taxable year during which a U.S. Holder held ADSs or ordinary shares, such U.S. Holder may be required to file a report containing such information as the U.S. Treasury may require.
Information Reporting and Backup Withholding
Payments of dividends and sales proceeds that are made within the United States or through certain U.S.-related financial intermediaries generally are subject to information reporting, and may be subject to backup withholding, unless (i) the U.S. Holder is an exempt recipient or (ii) in the case of backup withholding, the U.S. Holder provides a correct taxpayer identification number and certifies that it is not subject to backup withholding.
The amount of any backup withholding from a payment to a U.S. Holder will be allowed as a credit against the U.S. Holder’s U.S. federal income tax liability and may entitle the U.S. Holder to a refund, provided that the required information is timely furnished to the Internal Revenue Service.
|
F.
|
Dividends and paying agents
|
Not applicable.
|
G.
|
Statement by experts
|
Not applicable.
|
H.
|
Documents on Display
|
This annual report and the exhibits thereto and any periodic reports or other information filed pursuant to the Exchange Act may be inspected without charge and copied at prescribed rates at the SEC’s public reference room located at 100F Street, N.E., Washington, D.C. 25049. In addition, the SEC maintains a website that contains information filed electronically with the SEC, which can be accessed over the internet at
www.sec.gov
. The documents concerning BBVA Francés which are referred to in this annual report may also be inspected at our office at Reconquista 199, C1003ABB Buenos Aires, Republic of Argentina.
|
I.
|
Subsidiary information
|
Not applicable.
Market Risk
Our business model is focused on the costumer and the exposition to own activities is reduced reflecting BBVA Francés risk appetite.
In order to manage the market risk involved in every position of BBVA Francés, we use the VaR (Value at Risk) tool. This is the basic measure to control risks as it estimates the maximum loss, within a given confidence interval, in the fair or market value of a certain instrument or portfolio during a determined horizon. At BBVA Francés, the VaR is calculated within a confidence interval of
99% and one day horizon. It uses a historical period of two years (504 observations).The graph below shows the evolution of market risk measured by VaR during 2012:

During the last year, VaR has fluctuated from Ps.0.90 million to Ps.2.90 million. The average was Ps.1.73 million (-21% against 2011). The interest risk measured by VaR reduced by 22% in 2012 compared to the 2011 average. However, exchange risk increased by 11% on average. In general, we observe that the VaR ranges between Ps.1.50 million and Ps.2.00 million according to the frequency of days in 2012.

Daily Trading VaR at BBVA Francés (in millions of pesos)
|
2012
|
2011
|
|||
|
Average
|
1.73
|
2.21
|
||
|
Minimum
|
0.95
|
0.60
|
||
|
Maximum
|
2.90
|
3.86
|
||
|
Dec. 31
|
1.76
|
2.59
|
Daily Trading VaR – Categories
(in millions of pesos)
|
Interest Risk VaR
|
2012
|
2011
|
||
|
Average
|
1.64
|
2.10
|
||
|
Minimum
|
0.85
|
0.55
|
||
|
Maximum
|
2.78
|
3.67
|
||
|
Dec. 31
|
1.66
|
2.49
|
|
Currency Risk VaR
|
2012
|
2011
|
||
|
Average
|
0.60
|
0.54
|
||
|
Minimum
|
0.16
|
0.00
|
||
|
Maximum
|
1.33
|
2.47
|
||
|
Dec. 31
|
0.68
|
0.30
|

Additionally, the market risk unit develops daily stress tests. This allows us estimating the maximum expected loss when the market portfolio is subject to the volatility of historical crisis scenarios or economic stress. In the economic stress tests, apart from measuring the maximum expected loss, the unit also controls limits in order to anticipate and mitigate any excess.

Also, risk market unit performs tests to validate models. The area elaborates a monthly backtesting analysis to control that daily result during the month is inside the bands determined by VaR identifying the exceptions produced in that period.

Apart from this, the risk market unit is responsible for prices. This means that it assumes the daily capturing and diffusion of every price that have an impact not only in trading portfolio but also in ALCO portfolio as well as the rest of BBVA Francés areas through automatic tools and process. Also, the area generates the valuation of all the financial assets in custody.
Finally, Market risks carry on the control and monitoring of credit risk involved in every operation of the trading desk. Using different tools, the risk assumed with each counterpart is verified and analyze in order to avoid concentration and promote diversification of potential risk factors.
Non-Trading Risk
None.
Interest Rate Risk
The discussion that follows relates to interest risk in 2012 and bears no relation to our current or future interest rate risk.
Interest rate sensitivity is the relationship between market interest rates and net portfolio value, on the one hand, and net interest income on the other, due to the repricing of assets and liabilities. Our interest rate sensitivity analysis measures the sensitivity of the net portfolio value and net interest income to parallel changes in interest rates and to changes in the yield curve.
For the purpose of calculating net present value, when the rate of interest is fixed, future cash flows of financial assets and liabilities are calculated on a contractual basis. When the interest rate is variable, cash flows are included that have a maturity during the repricing interval. Such amounts are added to the remaining balance of the asset or the liability at the end of the interval.
Net interest income is calculated as the difference between interest income earned on interest-earning assets and interest expense from interest-bearing liabilities for each month of the fiscal year immediately following the fiscal year ended December 31, 2012.
In general, the usefulness of this calculation is limited to its assumption of a permanent increase or decrease in interest rates and that all of such rates change at the same rate. Accordingly, actual results could differ materially from those projected.
For any given period, the pricing structure is matched when an equal amount of assets and liabilities reprice. Any mismatch of interest-earning assets and interest-bearing liabilities is known as a gap. A positive gap denotes asset sensitivity and normally means that an increase in interest rates would have a negative effect on net portfolio value and a positive effect on interest income, while a decline in interest rates would have a positive effect on net portfolio value and a negative effect on net interest income.
Changes in interest rates affect our profitability as a result of timing differences on the repricing of the assets and liabilities. One measure of the effect of a change in interest rates is to measure the change in net portfolio value (defined as the net present value of interest-earning assets and interest-bearing liabilities) and the effect on net interest income from a given change in interest rates. In the table below, interest rates are assumed to change immediately, while the consistency and levels of interest-earning assets and interest-bearing liabilities, including the effects of derivative financial instruments, remain constant. The table measures the net portfolio value and net interest income under various interest rate scenarios and the percentage changes from amounts generated under a stable interest rate environment.
The following chart includes adjusted assets and liabilities in the 0-3 months interval assuming 16.7% annual adjustment. In order to measure the effect of a change in interest rates in net portfolio value and net interest income, we are assuming the same change in interest rate as in the adjustment rate. However, as this may not be the case, we are including another column showing the impact of a variation in the adjustment rate with no variation in interest rate.
|
December 31, 2012
|
|||||||||||||||||||||||||
|
Change in base
interest rates
(basis points)
|
Net portfolio
value
|
Percentage
change
|
Net interest and
adjust income
|
Percentage
change
|
Net income of
adjustable
portfolio
|
Percentage
change
|
|||||||||||||||||||
|
(in millions of pesos, except percentages)
|
|||||||||||||||||||||||||
| 100 | 10,144.2 | (0.52 | )% | 4,300.5 | 1.04 | % | (59.5 | ) | 18.97 | % | |||||||||||||||
| 50 | 10,170.9 | (0.26 | )% | 4,278.3 | 0.52 | % | (54.7 | ) | 9.50 | % | |||||||||||||||
| 0 | 10,197.4 | 0.00 | % | 4,256.1 | 0.00 | % | (50.0 | ) | 0.00 | % | |||||||||||||||
| (50) | 10,223.8 | 0.26 | % | 4,233.9 | (0.52 | )% | (45.2 | ) | (9.54 | )% | |||||||||||||||
| (100) | 10,250.0 | 0.52 | % | 4,211.7 | (1.04 | )% | (40.4 | ) | (19.12 | )% | |||||||||||||||
Based on our position at December 31, 2012, and assuming a hypothetical, immediate 50 basis points increase in interests rates affecting all interest rate sensitive assets and liabilities as of January 1, 2013, net portfolio value would be reduced by Ps. 26.5 million and net interest income over 2013 would be increased by approximately Ps. 22.2 million.
Foreign Exchange Risk
As of December 31, 2012, as part of our asset and liability management, we aimed to minimize the impact on results of foreign exchange rate fluctuations by maintaining excess balances of assets over liabilities denominated in dollars.
|
Peso against all other currencies
|
Effect on net income based on our position as of December 31, 2012
|
Effect on net income based on our position as of December 31, 2011
|
||||||||
|
(in millions of pesos, except percentages)
|
||||||||||
| 5% | (25) | (6) | ||||||||
| (5)% | 25 | 6 | ||||||||
For a description of the changes in the exchange rates, see
“Item 3. Key Information—Exchange Rates”
.
Equity and Commodity Price Risk
Equity and commodity risk are the risks associated with adverse movements in the value of equity securities and commodities or related indexes. We do not have any material exposure to either of them.
|
A.
|
Debt securities
|
Not applicable.
|
B.
|
Warrants and rights
|
Not applicable.
|
C.
|
Other securities
|
Not applicable.
|
D.
|
American Depositary Shares
|
Fees and charges for holders of American Depositary Receipts
The depositary for our American Depositary Receipts (“ADRs”) is the Bank of New York Mellon (“BoNY”).
Holders of our ADRs are generally expected to pay fees to BoNY according to the schedule below:
|
Persons depositing or withdrawing shares must pay:
|
For:
|
|
|
U.S.$5.00 (or less) per 100 ADRs (or portion of 100 ADRs)
|
§
Issuance of ADRs, including issuances resulting from a distribution, sale or exercise of shares or rights or other property
§
Cancellation of ADRs for the purpose of withdrawal including if the deposit agreement terminates
|
|
|
A fee equivalent to the fee that would be payable if securities distributed to you had been shares and the shares had been deposited for issuance of ADRs
|
§
Distribution of securities distributed to holders of deposited securities which are distributed by the depositary to ADR registered holders
|
|
|
Registration or transfer fees
|
§
Transfer and registration of shares on the Company’s share register to or from the name of the depositary or its agent when you deposit or withdraw shares
|
|
|
Expenses of the depositary
|
§
Cable, telex and facsimile transmissions (when
|
|
expressly provided in the deposit agreement
|
|
§
Converting foreign currency to U.S. dollars
|
||
|
Taxes and other governmental charges the depositary or the custodian have to pay on any ADR or share underlying an ADR, for example, stock transfer taxes, stamp duty or withholding taxes
|
§
As necessary
|
|
|
Any charges incurred by the depositary or its agents for servicing the deposited securities
|
§
As necessary
|
BoNY collects its fees for delivery and surrender of ADRs directly from investors depositing shares or surrendering ADRs for the purpose of withdrawal or from intermediaries acting for them. BoNY also collects fees for making distributions to investors by deducting those fees from the amounts distributed or by selling a portion of distributable property to pay the fees. BoNY may collect its annual fee for depositary services by deductions from cash distributions or by directly billing investors or by charging the book-entry system accounts of participants acting for them. BoNY may generally refuse to provide fee-attracting services until its fees for those services are paid.
The Bank in currently negotiating with BoNY an amendment to the deposit agreement, by which additional fees may be charged to the ADRs holders, such as a fee not in excess of U.S.$5.00 or less per 100 ADS (or portion thereof) for any cash distribution made pursuant to the deposit agreement, and an additional fee of U.S.$5,00 or less per 100 ADS (or portion thereof) per annum for depositary services.
This amendment will be executed in the context of a re-load of our ADRs Program, extending it up to an amount of U.S.$50 million of ADRs. Accordingly, Form F-6 will be filed with the SEC once the agreement has been executed by the parties.
Fees Paid by Depositary to the Company
There are no fees or other direct and indirect payments made by BoNY to the foreign issuer of the deposited securities.
- PART II -
None.
None.
Conclusion Regarding the Effectiveness of Disclosure Controls and Procedures
As of December 31, 2012, the Bank, under the supervision and with the participation of our management, including our Chief Executive Officer and Chief Financial Officer, performed an evaluation of the effectiveness of the design and operation of our disclosure controls and procedures (as defined in Rule 13a-15(f) under the Exchange Act). There are, as described below, inherent limitations to the effectiveness of any control system, including disclosure controls and procedures. Accordingly, even effective disclosure controls and procedures can provide only reasonable assurance of achieving their control objectives.
Based on such evaluation, the Bank’s Chief Executive Officer and Chief Financial Officer concluded that the Bank’s disclosure controls and procedures were effective for gathering, analyzing and disclosing the information the Bank is required to disclose in the reports it files under the Exchange Act, within the time periods specified in the SEC’s rules and forms.
Management’s Annual Report on Internal Control Over Financial Reporting
The management of the Bank is responsible for establishing and maintaining adequate internal control over financial reporting as defined in Rule 13a-15 (f) under the Exchange Act. The Bank’s internal control over financial reporting is a process designed to provide reasonable assurance regarding the reliability of financial reporting and the preparation of financial statements for external purposes in accordance with generally accepted accounting principles and includes those policies and procedures that:
|
§
|
pertain to the maintenance of records that, in reasonable detail, accurately and fairly reflect the transactions and dispositions of the assets of the Bank;
|
|
§
|
provide reasonable assurance that transactions are recorded as necessary to permit preparation of financial statements in accordance with generally accepted accounting principles, and that our receipts and expenditures are being made only in accordance with authorizations of the Bank’s management and directors; and
|
|
§
|
provide reasonable assurance regarding prevention or timely detection of unauthorized acquisition, use or disposition of our assets that could have a material effect on the financial statements.
|
Because of its inherent limitations, internal control over financial reporting may not prevent or detect misstatements. Also, projections of any evaluation of effectiveness to future periods are subject to the risk that controls may become inadequate because of changes in conditions, or that the degree of compliance with the policies or procedures may deteriorate.
Under the supervision and with the participation of the Bank’s management, including our Chief Executive Officer, and the Chief Financial Officer, we conducted an evaluation of the effectiveness of our internal control over financial reporting based on the criteria established in Internal Control—Integrated Framework issued by the Committee of Sponsoring Organizations of the Treadway Commission (“COSO”). Based on this assessment, our management concluded that, as of December 31, 2012, our internal control over financial reporting was effective based on those criteria.
Our internal control over financial reporting as of December 31, 2012 has been audited by Deloitte & Co. S.A., an independent registered public accounting firm, as stated in their report which follows below.
Report of Independent Registered Public Accounting Firm
To the President and Board of Directors of
BBVA BANCO FRANCÉS S.A.
Reconquista 199
Buenos Aires, Argentina
We have audited the internal control over financial reporting of BBVA BANCO FRANCÉS S.A. and subsidiaries composing the BBVA BANCO FRANCÉS Group (the “Bank” – Note 2.1 to the Consolidated Financial Statements) as of December 31, 2012, based on the criteria established in the Internal Control - Integrated Framework issued by the Committee of Sponsoring Organizations of the Treadway Commission. The Bank’s management is responsible for maintaining effective internal control over financial reporting and for its assessment of the effectiveness of internal control over financial reporting, included in the accompanying
Management’s Annual Report on Internal Control over Financial Reporting
. Our responsibility is to express an opinion on the Bank’s internal control over financial reporting based on our audit.
We conducted our audit in accordance with the standards of the Public Company Accounting Oversight Board (United States of America). Those standards require that we plan and perform the audit to obtain reasonable assurance about whether effective internal control over financial reporting was maintained in all material respects. Our audit included obtaining an understanding of internal control over financial reporting, assessing the risk that a material weakness exists, testing and evaluating the design and operating effectiveness of internal control based on the assessed risk, and performing such other procedures as we considered necessary in the circumstances. We believe that our audit provides a reasonable basis for our opinion.
A company’s internal control over financial reporting is a process designed by, or under the supervision of, the Company’s principal executive and principal financial officers, or persons performing similar functions, and effected by the Company’s board of directors, management, and other personnel to provide reasonable assurance regarding the reliability of financial reporting and the preparation of financial statements for external purposes in accordance with generally accepted accounting principles. A company’s internal control over financial reporting includes those policies and procedures that (1) pertain to the maintenance of records that, in reasonable detail, accurately and fairly reflect the transactions and dispositions of the assets of the company; (2) provide reasonable assurance that transactions are recorded as necessary to permit preparation of financial statements in accordance with generally accepted accounting principles, and that receipts and expenditures of the company are being made only in accordance with authorizations of management and directors of the company; and (3) provide reasonable assurance regarding prevention or timely detection of unauthorized acquisition, use, or disposition of the company’s assets that could have a material effect on the financial statements.
Because of the inherent limitations of internal control over financial reporting, including the possibility of collusion or improper management override of controls, material misstatements due to error or fraud may not be prevented or detected on a timely basis. Also, projections of any evaluation of the effectiveness of the internal control over financial reporting to future periods are subject to the risk that the controls may become inadequate because of changes in conditions, or that the degree of compliance with the policies or procedures may deteriorate.
In our opinion, the Bank maintained, in all material respects, effective internal control over financial reporting as of December 31, 2012, based on the criteria established in the
Internal Control—Integrated Framework
issued by the Committee of Sponsoring Organizations of the Treadway Commission.
We have also audited, in accordance with the standards of the Public Company Accounting Oversight Board (United States of America), the consolidated financial statements as of and for the fiscal year ended December 31, 2012 of the Bank, and our report dated April 9, 2013 expressed an unqualified opinion on those consolidated financial statements and included an explanatory paragraph stating that the accounting rules established by the Argentine Central Bank (“BCRA”, for its Spanish acronym) vary in certain significant respects from accounting principles generally accepted in the United States of America (“U.S. GAAP”) and that the information relating to the nature and effect of such differences is presented in Note 22 to the consolidated financial statements of the Bank.
/s/ DELOITTE & Co. S.A.
Buenos Aires – Argentina
April 9, 2013
Changes in Internal Control Over Financial Reporting
There has been no change in the Bank’s internal control over financial reporting (as defined in Rule 13a-15(f) under the Exchange Act) that occurred during the period covered by this annual report that has materially affected, or is reasonably likely to materially affect, internal control over financial reporting.
The Bank’s Board of directors has appointed Mr. Oscar Miguel Castro to serve on its Audit Committees (I and II) and Disclosure Committees. The Bank’s Board of directors has concluded that Mr. Castro is an audit committee financial expert as defined by the SEC based on his extensive audit experience, having been a partner of an international accounting firm for twenty years. Mr. Castro qualifies as an independent director according to the independence criteria established by General Resolution Nr. 368 (New Text 2001), as amended by General Resolution Nr. 400 of the CNV.
The standards of ethical conduct that BBVA Francés expects from its employees are found within the “Code of Conduct of BBVA Francés and its group of companies in Argentina”, or the Code of Conduct, approved by the Board of directors on December 18, 2003.
The Code of Conduct is applicable to all our management and employees, including the Executive Chairman, the Financial Director and other senior financial officers of the Bank. All officers and employees are accountable for adhering to the Code of Conduct. Suspected violations of the Code of Conduct may be reported in accordance with procedures designed to address the reported situation and to protect the reporting employee. The failure to comply with criteria and rules of the Code of Conduct may result in disciplinary action in accordance with applicable Argentine employment laws.
The Code of Conduct is accessible via BBVA Francés’ corporate website at
https://www.bancofrances.com.ar/fbin/Codigo_Conducta_BBVA_Frances_tcm235-341959.pdf
(the information found at this website is not incorporated by reference into this report).
A copy of our Code of Conduct is also available on request, free of charge, by writing or telephoning us at:
BBVA Banco Francés S.A.
Attention: Investor Relations Department
Reconquista 40
C1003ABB Buenos Aires
Republic of Argentina
Telephone number: (54 11) 4341 5036
e-mail address:
v.bories@bbvafrances.com.ar
cecilia.acuna@bbvafrances.com.ar
During fiscal year 2012, there have been no amendments to any provisions of the Code of Conduct .
No waivers from any provisions of the Code of Conduct were expressly or implicitly granted to the Executive Chairman, the Financial Director and any other senior financial officer of the Bank in the fiscal year 2012.
Following is a summary of the fees to our independent external auditors for the years ended December 31, 2012 and 2011:
|
2012
|
2011
|
|||||||
|
(in millions of pesos)
|
||||||||
|
Audit fees
|
8.06 | 6.45 | ||||||
|
Audit-related fees
|
— | — | ||||||
|
Tax fees
|
0.49 | 0.40 | ||||||
|
All other fees
|
— | — | ||||||
|
Total fees
|
8.55 | 6.85 | ||||||
Audit fees
are fees for professional services performed by Deloitte & Co. S.A. for the audit and limited review of the Bank’s annual and quarterly financial statements and services that are normally provided in connection with statutory and regulatory filings.
Audit-related fees
consist of fees for assurance and related services performed by Deloitte & Co. S.A. that are reasonably related to the performance of the audit or review of the Bank’s financial statements and are not reported as Audit fees.
Tax fees
consist of tax compliance, tax advice and tax planning services and assistance and advice related to tax audits and appeals.
The Audit Committee has approved policies and procedures for pre-approving all non-audit work that would be performed by Deloitte & Co. S.A. Specifically, the policies and procedures prohibit Deloitte & Co. S.A. from performing any services for the Bank or its subsidiaries without the prior approval of the Audit Committee. All of the services provided by Deloitte & Co. S.A. in 2012 were approved by the Audit Committee pursuant to these approval policies. None of the hours expended on the principal accountant’s engagement to audit our financial statements for 2012 were attributed to work performed by persons other than the principal accountant’s full-time, permanent employees. The Audit Committee meets once a month. In each of these meetings, the Internal Audit Director presents the projects undertaken by the Internal Audit Department. The minutes of the meeting are then drawn up detailing the issues discussed as well as those items requiring further discussion. The minutes are transcribed into an internal control book which is sent to the Board of directors for their information. See
“Item 6. Directors, Senior Management and Employees—Directors and Senior Management—Special Committees—Audit Committee (I)”
.
Not applicable.
None.
Not applicable.
BBVA Francés’ corporate governance practices are governed by the applicable Argentine law (particularly, the Business Companies Law, Law Nr. 26,831 and the Standards of the CNV), as well as by its by-laws. BBVA Francés has securities that are registered with the SEC and are listed on the NYSE, and is therefore subject to corporate governance requirements applicable to NYSE-listed non-U.S. companies.
NYSE-listed non-U.S. companies may, in general, follow their home country corporate governance practices in lieu of most of the new NYSE corporate governance requirements codified in Section 303A of the NYSE’s Listed Company Manual. However, NYSE-listed non-U.S. companies must comply with NYSE Sections 303A.06, 303A.11 and 303A.12(b) and (c).
NYSE Section 303A.11 requires that non-U.S. companies disclose any significant ways in which their corporate governance practices differ from U.S. companies under NYSE listing standards. In accordance with NYSE Section 303A.11, we describe below the relevant differences between BBVA Francés’ corporate governance practices and NYSE standards for listed companies.
On the other hand, the CNV passed in May 2012 General Resolution Nr. 606/12 (“GR 606/12”) providing for the corporate governance requirements which companies that publicly offer shares representing their capital stock in Argentina must adopt. Moreover, since December 2012, the Bank has a new corporate governance code (“Código de Gobierno Societario”, hereinafter the “CGS”) in accordance with Communication “A” 5106 of the Central Bank and GR 606/12 from CNV.
Director Independence
Under NYSE Section 303A.01, a NYSE-listed company must have a majority of independent directors on its Board of directors.
Under Argentine law, the board is not required to consist of a majority of independent directors. Notwithstanding, when directors are appointed, each shareholder that nominates a director is required to report at the meeting whether or not such director is independent. As of May 28, 2004, Argentine companies are required to have at least two independent directors to appoint the Audit Committee (I and II). Since December 31, 2012 BBVA Francés has five independent directors among the six members of its current Board of directors.
Standards for Evaluating Director Independence
NYSE Section 303A.02 establishes general standards to evaluate directors’ independence (no director qualifies as “independent” unless the Board of directors affirmatively determines that the director has no material relationship with the listed company (either directly or as a partner, shareholder or officer of an organization that has a relationship with the company)), and emphasizes that the concern is independence from management. The board is also required, on a case by case basis, to express an opinion with regard to the independence or lack of independence, of each individual director.
To qualify as an “independent” or “non-independent” director, CNV standards (General Resolution Nr. 400) are substantially similar to NYSE standards. CNV standards provide that independence is required with respect to the Bank, and to its controlling shareholders or to shareholders with material holdings (35% or more), and that, for any person to be appointed as an independent director, such person must not perform executive functions within the Bank. Close relatives of any persons who would not qualify as “independent directors” would also not be considered “independent”.
Non-management Directors Meetings
Under NYSE Section 303A.03, non-management directors must meet at regularly scheduled executive meetings not attended by management. Neither Argentine law nor BBVA Francés’ by-laws require that any such meetings be held.
Nominations Corporate Governance Committee
Under NYSE Section 303A.04, listed companies shall have a “nominations/corporate governance committee” comprised entirely of independent directors. GR 606/12 requires for companies which publicly offer their securities to have a Nomination Committee. Moreover, pursuant to CNV Standards, the person who nominates a director shall report at the shareholders’ meeting whether or not the nominee is an “independent person”, based on criteria established by CNV (which are substantially similar to NYSE standards).
Compensation Committee
Under NYSE Section 303A.05(a), listed companies had to have a “Compensations Committee” comprised entirely of independent directors. Under NYSE Section 303A.05(b), the “Compensations Committee” shall have a written charter establishing certain minimum responsibilities as set forth in NYSE Section 303A.05(b)(i). In addition, amendments approved by the NYSE in January 2013 require the charter to specify the rights and responsibilities of the compensation committee regarding the authority to retain advisers and to provide funding for such advisers. Certain specified factors must be considered regarding such advisers’ independence from management. GR 606/12 also requires for companies which publicly offer their securities to have a Compensation Committee.
The CGS sets forth the creation of a Nominations and Compensations Committee, composed of three non-executive directors, most of them independent, whose duties, among others, are to fix the rules and procedures for the selection of key executives and senior staff, to determine the level of remuneration for directors and key executives, to fix policies and practices regarding remunerations and benefits and to approve any relevant changes.
Audit Committee (II)
Under NYSE Section 303A.06, listed companies must have an “audit committee” that complies with SEC requirements. Foreign private issuers shall have this audit committee in place prior to July 31, 2005. Law Nr. 26,831 and CNV’s standards require BBVA Francés to have its audit committee in place on or prior to May 28, 2004. The Audit Committee (II) of BBVA Francés currently complies with the standards of Law Nr. 26,831.
Under NYSE Section 303A.07(a), the audit committee shall consist of at least three members. All of its members shall be financially literate or must acquire such financial knowledge within a reasonable period and at least one of its members shall have experience in accounting or financial administration. Argentine law also requires the Audit Committee to be comprised of at least three members. Pursuant to CNV’s standards, audit committee members are required to be conversant in business, financial, or accounting issues. CNV’s rules provide for the training of its members to carry out their duties and BBVA Francés engages in this training.
Under NYSE Section 303A.07(a), if a member of the audit committee is simultaneously a member of the audit committee of more than three public companies, and the listed company does not limit the number of audit committees on which its members may serve, then, in each case the board shall determine whether the simultaneous service would prevent such member from effectively serving on the listed company’s audit committee, and shall report its decision in the annual proxy statement of the company or in the company’s annual report filed with the SEC. No such provision regarding an audit committee member’s simultaneous membership on public companies exists under Argentine law or BBVA Banco Francés’ by-laws.
Under NYSE Section 303A.07(a), all members of the audit committee are required to be “independent”. In accordance with Law Nr. 26,831, a majority of the members of Audit Committee (II) are “independent”.
Under NYSE Section 303A.07(b), the audit committee shall have a charter establishing the duties and responsibilities of its members, including, at a minimum, some of the duties and responsibilities required by Rule 10A-3 of the Securities Exchange Act of 1934 (the “Exchange Act”) and as set forth in NYSE Section 303A.7(b) of the NYSE Manual. The functions and responsibilities of the audit committee in Argentina, established by Law Nr. 26,831 and CNV’s standards, are essentially the same as provided for under Rule 10A-3 of the Exchange Act.
NYSE Sections 303A.07(b)(iii) A), (B) and (C) establish the duties and responsibilities of the audit committee, among others: (i) to discuss the annual audited financial statements and the quarterly financial statements of the company with management and the independent auditor, including the information disclosed under the heading “Management’s Discussion and Analysis of Financial Conditions and Results of Operations” and (ii) to discuss the company’s press releases relating to its earnings, as well as the financial information and guidelines relating to its earnings that are supplied to equity researchers and rating agencies. No such provision is contained in the Argentine law or BBVA Banco Francés’ by-laws. However, CNV standards establish similar functions for the audit committee, namely, “to verify the reliability of the administrative-accounting system, and of all financial data, or of any significant data submitted to CNV and to self-regulated exchanges, in compliance with the applicable reporting regime”.
NYSE Section 303A.07(b)(iii)(G) provides that the audit committee shall establish clear policies for hiring external auditors’ employees. No such provision regarding hiring external auditors’ employees is contained in Argentine law or BBVA Banco Francés’ by-laws.
NYSE Section 303A.07(c) provides that each company must have an internal audit function in order to provide to the management and to the audit committee permanent assessments on the company’s risk management processes and internal control system. No such provision regarding an internal audit function is required by Argentine law or BBVA Francés’ by-laws. However, BBVA Francés has an Audit Committee according to Central Bank’s rules, which provides to the management permanent assessments about management and operating processes, and risks of the company.
Disclosure of Corporate Governance Guidelines
NYSE Section 303A.09 provides that companies must adopt and disclose corporate governance guidelines, including several issues for which such reporting is mandatory, and include such information on the company’s website, which should also include the charters of the Audit Committee, the Nominations Committee and the Compensation Committee.
Law Nr. 26,831 required additional information that companies must include in their annual reports, including information relating to the decision-making organization (corporate governance), the company’s internal controls system, norms for director and
manager compensation, stock-options, and any other compensation system applicable to Board members and managers. Law Nr. 26,831 does not address the remaining issues included in NYSE Section 303A.09. However, all relevant information sent by the Bank to the CNV is forwarded to the CNV through the CNV’s Financial Reporting Highway and may be viewed on the CNV’s website.
Evaluation of Board Performance
Under NYSE Section 303A.09, the Board of directors must make a self-assessment of its performance at least once a year to determine if it or its committees function effectively and report thereon. Under Argentine law, the board’s performance is evaluated at the annual shareholders’ meeting.
Code of Ethics
NYSE Section 303A.10 provides for the adoption of a Code of Business Conduct and Ethics and sets out the topics that such code must contain. BBVA Francés’ Board approved in December 18, 2003 a “Code of Conduct of BBVA Francés and its group of companies in Argentina”, which applies to all management and employees, with no exceptions, the English translation of which is available to the public on BBVA Francés’ website. See
“Item 16B. Code of Ethics”
. BBVA Francés believes that its Code of Conduct complies with the NYSE requirements.
Certifications by the CEO
NYSE Section 303A.12(a) provides that the CEO shall on a yearly basis certify to NYSE that he/she knows of no violation by the company of NYSE Sections relating to corporate governance. No such certification is required by Argentine law or by BBVA Francés’ by-laws.
Notification of Non-fulfillment
Under NYSE Section 303A.12(b), the CEO shall notify the NYSE in writing whenever any executive officer of the company becomes aware of any substantial non-fulfilment of any applicable provision under NYSE Section 303A.
No such provision regarding notification of non-fulfilment of NYSE Section 303A is contained in Argentine law or BBVA Francés’ by-laws, but BBVA Francés’ CEO will comply with the notice provisions as set forth under NYSE Section 303A.12(b).
- PART III -
We have responded to Item 18 in lieu of this item.
Reference is made to Item 19 for a list of the financial statements filed as a part of this annual report.
|
§
|
Index to Consolidated Financial Statements:
|
|
|
Page
|
|
|
Report of Independent Registered Public Accounting Firm
|
F-2
|
|
|
Consolidated Balance Sheets as of December 31, 2012 and 2011
|
F-3
|
|
|
Consolidated Statements of Operations for the fiscal years ended December 31, 2012, 2011 and 2010
|
F-7
|
|
|
Consolidated Statements of Cash and Cash Equivalents Flows for the fiscal years ended December 31, 2012, 2011 and 2010
|
F-9
|
|
|
Consolidated Statements of Changes in Stockholders’ Equity for the fiscal years ended December 31, 2012, 2011 and 2010
|
F-12
|
|
|
Notes to the Consolidated Financial Statements
|
F-13
|
|
§
|
Index to Exhibits:
|
|
Exhibit
Number
|
Description
|
||
|
1.1
|
Amended and Restated By-Laws (Estatutos) of BBVA Francés
|
||
|
1.2
|
English translation of the Amended and Restated By-Laws (Estatutos) of BBVA Francés
|
||
|
8.1
|
Subsidiaries of the Company
|
||
|
12.1
|
Section 302 Certification of Chief Executive Officer
|
||
|
12.2
|
Section 302 Certification of Chief Financial Officer
|
||
|
13.1
|
Section 906 Certification pursuant to 18 U.S.C. Section 1350
|
||
We will furnish to the SEC, upon request, copies of any unfiled instruments that define the rights of holders of long-term debt of BBVA Francés.
SIGNATURES
The registrant hereby certifies that it meets all of the requirements for filing on Form 20-F and that it has duly caused and authorized the undersigned to sign this annual report on its behalf.
|
BBVA BANCO FRANCÉS S.A.
|
||
|
By:
|
/s/ Ignacio Sanz y Arcelus
|
|
|
|
Name: Ignacio Sanz y Arcelus
|
|
|
|
Title: Chief Financial Officer
|
|
Date: April 9, 2013
177
BBVA BANCO FRANCÉS S.A. AND SUBSIDIARIES
INDEX TO CONSOLIDATED FINANCIAL STATEMENTS
|
|
Page
|
|
F-2
|
|
|
F-3
|
|
|
F-7
|
|
|
F-9
|
|
|
F-12
|
|
|
F-13
|
F-1
PUBLIC ACCOUNTING FIRM
To the President and Board of Directors of
BBVA BANCO FRANCÉS S.A.
Reconquista 199
Buenos Aires, Argentina
We have audited the accompanying consolidated balance sheets of BBVA BANCO FRANCÉS S.A. and subsidiaries composing the BBVA BANCO FRANCÉS Group (the “Bank” – Note 2.1. to the Consolidated Financial Statements) as of December 31, 2012 and 2011, and the related consolidated statements of operations, changes in stockholders’ equity, and cash and cash equivalents flows for each of the three fiscal years in the period ended December 31, 2012 (all stated in thousands of Argentine Pesos). These consolidated financial statements are the responsibility of the Bank’s management. Our responsibility is to express an opinion on these consolidated financial statements based on our audits.
We conducted our audits in accordance with the standards of the Public Company Accounting Oversight Board (United States of America). Those standards require that we plan and perform the audit to obtain reasonable assurance about whether the consolidated financial statements are free of material misstatement. An audit includes examining, on a test basis, evidence supporting the amounts and disclosures in the financial statements. An audit also includes assessing the accounting principles used and significant estimates made by management, as well as evaluating the overall financial statements presentation. We believe that our audits provide a reasonable basis for our opinion.
In our opinion, the consolidated financial statements referred to in paragraph 1 present fairly, in all material respects, the financial position of BBVA BANCO FRANCÉS S.A. and subsidiaries as of December 31, 2012 and 2011 and the results of their operations, changes in stockholders’ equity, and cash and cash equivalents flows for each of the three fiscal years in the period ended December 31, 2012, in conformity with the accounting rules established by the Argentine Central Bank (“BCRA”, for its Spanish acronym) applicable to consolidated financial statements.
Accounting rules established by the BCRA vary in certain significant respects from accounting principles generally accepted in the United States of America (“U.S. GAAP”). Information relating to the nature and effect of such differences is presented in Note 22 to the consolidated financial statements.
We have also audited, in accordance with the standards of the Public Company Accounting Oversight Board (United States of America), the Bank’s internal control over financial reporting as of December 31, 2012, based on the criteria established in
Internal Control—Integrated Framework
issued by the Committee of Sponsoring Organizations of the Treadway Commission and our report dated April 9, 2013 expressed an unqualified opinion on the Bank’s internal control over financial reporting.
/s/ DELOITTE & Co. S.A.
Buenos Aires – Argentina
April 9, 2013
F-2
CONSOLIDATED BALANCE SHEETS
As of December 31, 2012 and 2011
Stated in thousands of Pesos
|
December 31,
|
||||||||
|
2012
|
2011
(1)
|
|||||||
|
ASSETS
|
||||||||
|
CASH AND DUE FROM BANKS
|
8,614,889 | 6,353,428 | ||||||
|
Cash
|
1,879,436 | 2,515,861 | ||||||
|
Due from banks and correspondents
|
6,735,453 | 3,837,567 | ||||||
|
Argentine Central Bank (BCRA)
|
6,597,330 | 3,651,375 | ||||||
|
Other local
|
746 | 2,412 | ||||||
|
Foreign
|
137,377 | 183,780 | ||||||
|
GOVERNMENT AND PRIVATE SECURITIES
(Note 6.a)
|
4,101,846 | 5,565,029 | ||||||
|
Holdings booked at fair value
|
1,832,079 | 2,088,522 | ||||||
|
Holdings booked at amortized cost
|
164 | 164 | ||||||
|
Instruments issued by the BCRA
|
2,201,676 | 3,447,972 | ||||||
|
Investments in listed private securities
|
68,115 | 28,555 | ||||||
|
Less: Allowances
|
188 | 184 | ||||||
|
LOANS
|
28,493,431 | 22,697,031 | ||||||
|
To governmental sector
|
35,067 | 46,027 | ||||||
|
To financial sector
|
1,493,493 | 1,146,532 | ||||||
|
Inter-financial – (Calls granted)
|
162,000 | 49,000 | ||||||
|
Other financing to local financial institutions
|
1,127,298 | 996,641 | ||||||
|
Interest and listed-price differences accrued and pending of collection
|
204,195 | 100,891 | ||||||
|
To non-financial private sector and residents abroad:
|
27,488,728 | 21,949,445 | ||||||
|
Overdraft
|
5,097,179 | 2,881,496 | ||||||
|
Discounted instruments
|
4,240,993 | 3,412,091 | ||||||
|
Real estate mortgage
|
877,775 | 736,600 | ||||||
|
Collateral loans
|
2,479,398 | 1,651,776 | ||||||
|
Consumer
|
4,772,798 | 3,761,698 | ||||||
|
Credit cards
|
4,729,243 | 3,448,437 | ||||||
|
Other (Note 6.b)
|
4,921,690 | 5,829,606 | ||||||
|
Interest and listed-price differences accrued and pending of collection
|
443,065 | 316,773 | ||||||
|
Less: Interest documented together with main obligation
|
73,413 | 89,332 | ||||||
|
Less: Allowances
|
523,857 | 444,973 | ||||||
|
Carried forward
|
41,210,166 | 34,615,488 | ||||||
|
(1)
|
See Note 3.3.
|
The accompanying Notes 1 to 22 are an integral part of these Consolidated Financial Statements.
F-3
BBVA BANCO FRANCÉS S.A. AND SUBSIDIARIES
CONSOLIDATED BALANCE SHEETS—(Continued)
As of December 31, 2012 and 2011
Stated in thousands of Pesos
|
December 31,
|
||||||||
|
2012
|
2011
(1)
|
|||||||
|
Brought forward
|
41,210,166 | 34,615,488 | ||||||
|
OTHER RECEIVABLES FROM FINANCIAL TRANSACTIONS
|
700,925 | 1,948,285 | ||||||
|
Argentine Central Bank (BCRA)
|
537,997 | 417,836 | ||||||
|
Amounts receivable for spot and forward sales to be settled
|
931 | 1,181,974 | ||||||
|
Instruments to be received for spot and forward purchases to be settled
|
18 | 187,057 | ||||||
|
Premiums for options bought
|
— | 2,431 | ||||||
|
Unlisted corporate bonds
|
15,973 | 13,424 | ||||||
|
Non-deliverable forward transactions balances to be settled
|
8,834 | 34,249 | ||||||
|
Other receivables not covered by debtor classification regulations
|
404 | 6,198 | ||||||
|
Other receivables covered by debtor classification regulations (Note 6.c)
|
140,218 | 108,885 | ||||||
|
Less: Allowances
|
3,450 | 3,769 | ||||||
|
RECEIVABLES FROM FINANCIAL LEASES
|
1,110,234 | 907,087 | ||||||
|
Receivables from financial leases
|
1,108,152 | 906,896 | ||||||
|
Interest accrued pending of collection
|
15,316 | 12,470 | ||||||
|
Less: Allowances
|
13,234 | 12,279 | ||||||
|
INVESTMENTS IN OTHER COMPANIES
|
146,001 | 126,288 | ||||||
|
In Financial institutions
|
98,506 | 55,815 | ||||||
|
Other (Note 6.d)
|
47,495 | 70,473 | ||||||
|
OTHER RECEIVABLES
|
834,585 | 711,884 | ||||||
|
Other (Note 6.e)
|
1,135,000 | 861,662 | ||||||
|
Other interest accrued and pending collection
|
6,114 | 1,820 | ||||||
|
Less: Allowances
|
306,529 | 151,598 | ||||||
|
PREMISES AND EQUIPMENT
|
619,981 | 580,121 | ||||||
|
OTHER ASSETS
|
34,095 | 28,697 | ||||||
|
INTANGIBLE ASSETS
|
117,331 | 80,978 | ||||||
|
Organization and development expenses
|
117,331 | 80,978 | ||||||
|
SUSPENSE ITEMS
|
10,811 | 6,367 | ||||||
|
OTHER SUBSIDIARIES’ ASSETS
(Note 6.f)
|
450 | 450 | ||||||
|
TOTAL ASSETS
|
44,784,579 | 39,005,645 | ||||||
|
(1)
|
See Note 3.3.
|
The accompanying Notes 1 to 22 are an integral part of these Consolidated Financial Statements.
F-4
BBVA BANCO FRANCÉS S.A. AND SUBSIDIARIES
CONSOLIDATED BALANCE SHEETS—(Continued)
As of December 31, 2012 and 2011
Stated in thousands of Pesos
|
December 31,
|
||||||||
|
2012
|
2011
(1)
|
|||||||
|
LIABILITIES
|
||||||||
|
DEPOSITS
|
34,165,053 | 29,165,704 | ||||||
|
Governmental sector
|
2,122,608 | 1,141,024 | ||||||
|
Financial sector
|
18,787 | 43,882 | ||||||
|
Non-financial private sector and residents abroad:
|
32,023,658 | 27,980,798 | ||||||
|
Checking accounts
|
8,791,731 | 6,369,212 | ||||||
|
Savings deposits
|
9,803,777 | 9,489,576 | ||||||
|
Time deposits
|
12,653,990 | 11,224,571 | ||||||
|
Investments accounts
|
6,929 | 219,366 | ||||||
|
Other
|
639,281 | 553,286 | ||||||
|
Interest and listed—price differences accrued payable
|
127,950 | 124,787 | ||||||
|
OTHER LIABILITIES FROM FINANCIAL TRANSACTIONS
|
3,285,123 | 4,268,519 | ||||||
|
Argentine Central Bank — Other
|
51,936 | 18,450 | ||||||
|
Banks and International Institutions
|
262,770 | 563,338 | ||||||
|
Non — subordinated corporate bonds
|
649,993 | 294,393 | ||||||
|
Amounts payable for spot and forward purchases to be settled
|
18 | 187,166 | ||||||
|
Instruments to be delivered for spot and forward sales to be settled
|
926 | 1,181,355 | ||||||
|
Premiums for options written
|
— | 779 | ||||||
|
Financing received from Argentine financial institutions
|
344,683 | 339,883 | ||||||
|
Inter-financial - (Calls received)
|
20,000 | 114,200 | ||||||
|
Other financing from local financial institutions
|
324,655 | 225,343 | ||||||
|
Interest accrued payable
|
28 | 340 | ||||||
|
Non-deliverable forward transactions balances to be settled
|
928 | 5,885 | ||||||
|
Other (Note 6.g)
|
1,939,689 | 1,654,957 | ||||||
|
Interest and listed—Price differences accrued payable
|
34,180 | 22,313 | ||||||
|
OTHER LIABILITIES
|
1,419,180 | 1,078,329 | ||||||
|
Fees payable
|
103 | 98 | ||||||
|
Other (Note 6.h)
|
1,419,077 | 1,078,231 | ||||||
|
ALLOWANCES
|
644,962 | 496,233 | ||||||
|
SUSPENSE ITEMS
|
20,007 | 46,158 | ||||||
|
OTHER SUBSIDIARIES’ LIABILITIES
(Note 6.i)
|
337 | 336 | ||||||
|
TOTAL LIABILITIES
|
39,534,662 | 35,055,279 | ||||||
|
MINORITY INTEREST IN SUBSIDIARIES
(Note 16)
|
117,981 | 82,109 | ||||||
|
STOCKHOLDERS’ EQUITY
|
5,131,936 | 3,868,257 | ||||||
|
TOTAL LIABILITIES AND STOCKHOLDERS’ EQUITY
|
44,784,579 | 39,005,645 | ||||||
|
(1)
|
See Note 3.3.
|
The accompanying Notes 1 to 22 are an integral part of these Consolidated Financial Statements.
F-5
BBVA BANCO FRANCÉS S.A. AND SUBSIDIARIES
CONSOLIDATED BALANCE SHEETS—(Continued)
As of December 31, 2012 and 2011
Stated in thousands of Pesos
|
December 31,
|
||||||||
|
2012
|
2011
|
|||||||
|
MEMORANDUM ACCOUNTS
|
||||||||
|
DEBIT ACCOUNTS
|
||||||||
|
Contingent
|
8,699,746 | 5,760,212 | ||||||
|
Borrowings (unused balances)
|
43,950 | — | ||||||
|
Guarantees received
|
7,759,627 | 5,259,465 | ||||||
|
Contra contingent debit accounts
|
896,169 | 500,747 | ||||||
|
Control
|
67,942,089 | 56,453,765 | ||||||
|
Receivables classified as non-recoverable
|
371,935 | 319,098 | ||||||
|
Other (Note 6.j)
|
65,927,867 | 55,130,192 | ||||||
|
Contra control debit accounts
|
1,642,287 | 1,004,475 | ||||||
|
Derivatives
|
7,197,154 | 7,624,184 | ||||||
|
“Notional” amount of call options bought
|
— | 30,032 | ||||||
|
“Notional” amount of non-deliverable forward transactions
|
3,452,819 | 3,588,570 | ||||||
|
Interest rate SWAP
|
878,657 | 551,836 | ||||||
|
Contra derivatives debit accounts
|
2,865,678 | 3,453,746 | ||||||
|
For trustee activities
|
6,585 | 7,117 | ||||||
|
Funds in trust
|
6,585 | 7,117 | ||||||
|
TOTAL
|
83,845,574 | 69,845,278 | ||||||
|
CREDIT ACCOUNTS
|
||||||||
|
Contingent
|
8,699,746 | 5,760,212 | ||||||
|
Credit lines granted (unused portion) covered by debtor classification regulations
|
322,959 | 21,996 | ||||||
|
Guarantees provided to the BCRA
|
131,094 | 134,235 | ||||||
|
Other guarantees given covered by debtor classification regulations
|
188,521 | 175,081 | ||||||
|
Other guarantees given non-covered by debtor classification regulations
|
177,080 | 70,649 | ||||||
|
Other covered by debtor classification regulations
|
76,515 | 98,786 | ||||||
|
Contra contingent credit accounts
|
7,803,577 | 5,259,465 | ||||||
|
Control
|
67,942,089 | 56,453,765 | ||||||
|
Items to be credited
|
1,404,173 | 720,011 | ||||||
|
Other
|
238,114 | 284,464 | ||||||
|
Contra control credit accounts
|
66,299,802 | 55,449,290 | ||||||
|
Derivatives
|
7,197,154 | 7,624,184 | ||||||
|
“Notional” amount of call options written
|
— | 34,505 | ||||||
|
“Notional” amount of non-deliverable forward transactions
|
2,865,678 | 3,419,241 | ||||||
|
Contra derivatives credit accounts
|
4,331,476 | 4,170,438 | ||||||
|
For trustee activities
|
6,585 | 7,117 | ||||||
|
Contra credit accounts for trustee activities
|
6,585 | 7,117 | ||||||
|
TOTAL
|
83,845,574 | 69,845,278 | ||||||
The accompanying Notes 1 to 22 are an integral part of these Consolidated Financial Statements.
F-6
CONSOLIDATED STATEMENTS OF OPERATIONS
As of December 31, 2012 and 2011
Stated in thousands of Pesos
|
Fiscal year ended December 31,
|
||||||||||||
|
2012
|
2011
|
2010
|
||||||||||
|
FINANCIAL INCOME
|
5,714,921 | 3,814,685 | 3,842,671 | |||||||||
|
Interest cash and due from banks
|
— | 2 | 13 | |||||||||
|
Interest on loans to the financial sector
|
256,597 | 136,903 | 99,820 | |||||||||
|
Interest on overdraft
|
725,890 | 420,127 | 301,832 | |||||||||
|
Interest on discounted instruments
|
543,602 | 318,039 | 168,201 | |||||||||
|
Interest on real estate mortgage
|
119,883 | 126,164 | 111,507 | |||||||||
|
Interest on collateral loans
|
404,299 | 192,420 | 104,905 | |||||||||
|
Interest on credit card loans
|
625,692 | 361,658 | 229,657 | |||||||||
|
Interest on other loans
|
1,637,284 | 1,097,407 | 713,363 | |||||||||
|
Interest on other receivables from financial transactions
|
36,376 | 31,725 | 13,249 | |||||||||
|
Interest on financial leases
|
161,775 | 116,659 | 64,999 | |||||||||
|
Income from Federal Government secured loans—Decree Nr. 1387/01
|
6,388 | 40,165 | 271,964 | |||||||||
|
Net income from governmental and private securities
|
640,547 | 493,185 | 1,471,135 | |||||||||
|
Net income from options
|
255 | 404 | 4,494 | |||||||||
|
Indexation by Benchmark Stabilization Coefficient (CER)
|
129,120 | 96,873 | 9,117 | |||||||||
|
Gold and foreign currency exchange difference
|
190,309 | 218,622 | 197,821 | |||||||||
|
Other
|
236,904 | 164,332 | 80,594 | |||||||||
|
FINANCIAL EXPENSES
|
2,057,871 | 1,345,403 | 817,823 | |||||||||
|
Interest on checking accounts
|
— | — | 5,298 | |||||||||
|
Interest on savings deposits
|
11,148 | 9,183 | 6,670 | |||||||||
|
Interest on time deposits
|
1,526,725 | 1,044,929 | 609,454 | |||||||||
|
Interest on inter-financial financing - (Calls received)
|
2,191 | 2,763 | 1,665 | |||||||||
|
Interest on other financing from financial institutions
|
44,330 | 31,969 | 7,205 | |||||||||
|
Interest on other liabilities from financial transactions
|
123,289 | 34,054 | 6,424 | |||||||||
|
Other interest
|
5,885 | 6,552 | 11,029 | |||||||||
|
Indexation by CER
|
157 | 168 | 240 | |||||||||
|
Contribution to the deposit guarantee fund
|
52,629 | 44,205 | 35,001 | |||||||||
|
Other
|
291,517 | 171,580 | 134,837 | |||||||||
|
GROSS INTERMEDIATION MARGIN—GAIN
|
3,657,050 | 2,469,282 | 3,024,848 | |||||||||
|
ALLOWANCES FOR DOUBTFUL LOANS
|
256,259 | 132,663 | 179,353 | |||||||||
|
SERVICE CHARGE INCOME
|
2,530,197 | 1,957,589 | 1,484,846 | |||||||||
|
Related to lending transactions
|
962,601 | 690,426 | 475,047 | |||||||||
|
Related to liability transactions
|
909,719 | 736,550 | 590,998 | |||||||||
|
Other commissions
|
109,874 | 107,934 | 86,234 | |||||||||
|
Other (Note 6.k)
|
548,003 | 422,679 | 332,567 | |||||||||
|
Carried forward
|
5,930,988 | 4,294,208 | 4,330,341 | |||||||||
The accompanying Notes 1 to 22 are an integral part of these Consolidated Financial Statements.
F-7
BBVA BANCO FRANCÉS S.A. AND SUBSIDIARIES
CONSOLIDATED STATEMENTS OF OPERATIONS—(Continued)
For the fiscal years ended December 31, 2012, 2011 and 2010
Stated in thousands of Pesos
|
Fiscal year ended December 31,
|
||||||||||||
|
2012
|
2011
|
2010
|
||||||||||
|
Brought forward
|
5,930,988 | 4,294,208 | 4,330,341 | |||||||||
|
SERVICE CHARGE EXPENSE
|
683,730 | 519,635 | 406,376 | |||||||||
|
Commissions
|
468,422 | 366,352 | 304,320 | |||||||||
|
Other (Note 6.l)
|
215,308 | 153,283 | 102,056 | |||||||||
|
OPERATING EXPENSES
|
3,061,708 | 2,343,200 | 2,019,378 | |||||||||
|
Payroll expenses
|
1,767,658 | 1,350,439 | 1,245,082 | |||||||||
|
Fees to Bank Directors and Supervisory Committee
|
2,856 | 2,398 | 1,489 | |||||||||
|
Other professional fees
|
48,463 | 41,209 | 42,782 | |||||||||
|
Advertising and publicity
|
146,287 | 122,412 | 101,134 | |||||||||
|
Taxes
|
229,249 | 176,381 | 130,783 | |||||||||
|
Fixed assets depreciation
|
86,813 | 65,070 | 57,737 | |||||||||
|
Organizational expenses amortization
|
40,744 | 28,937 | 23,858 | |||||||||
|
Other operating expenses
|
420,847 | 328,371 | 251,051 | |||||||||
|
Other
|
318,791 | 227,983 | 165,462 | |||||||||
|
NET GAIN FROM FINANCIAL TRANSACTIONS
|
2,185,550 | 1,431,373 | 1,904,587 | |||||||||
|
NET LOSS ON MINORITY INTEREST IN SUBSIDIARIES
|
(36,195 | ) | (8,462 | ) | (31,156 | ) | ||||||
|
OTHER INCOME
|
408,004 | 328,759 | 205,389 | |||||||||
|
Income from long-term investments
|
71,779 | 111,461 | 21,323 | |||||||||
|
Punitive interests
|
9,392 | 4,585 | 3,471 | |||||||||
|
Loans recovered and reversals of allowances
|
64,603 | 78,430 | 117,858 | |||||||||
|
Other (Note 6.m)
|
262,230 | 134,283 | 62,737 | |||||||||
|
OTHER EXPENSES
|
429,004 | 193,735 | 564,800 | |||||||||
|
Punitive interests and charges paid to BCRA
|
33 | 332 | 222 | |||||||||
|
Charge for uncollectibility of other receivables and other allowances
|
351,450 | 128,095 | 49,906 | |||||||||
|
Amortization of difference arising from judicial resolutions
|
19,251 | 28,419 | 35,057 | |||||||||
|
Depreciation and losses from miscellaneous assets
|
376 | 369 | 734 | |||||||||
|
Other
|
57,894 | 36,520 | 478,881 | |||||||||
|
NET GAIN BEFORE INCOME TAX AND TAX ON MINIMUM PRESUMED INCOME
|
2,128,355 | 1,557,935 | 1,514,020 | |||||||||
|
INCOME TAX AND TAX ON MINIMUM PRESUME INCOME
|
864,676 | 552,358 | 315,841 | |||||||||
|
NET INCOME FOR THE FISCAL YEAR
|
1,263,679 | 1,005,577 | 1,198,179 | |||||||||
|
NET INCOME PER ORDINARY SHARE
(1) (2)
|
2.35 | 1.87 | 2.23 | |||||||||
|
(1)
|
See Note 21.13.
|
|
(2)
|
Stated in pesos.
|
The accompanying Notes 1 to 22 are an integral part of these Consolidated Financial Statements.
F-8
CONSOLIDATED STATEMENTS OF CASH AND CASH EQUIVALENTS FLOWS
For the fiscal years ended December 31, 2012, 2011 and 2010
Stated in thousands of Pesos
|
Fiscal year ended December 31,
|
||||||||||||
|
2012
|
2011
(2)
|
2010
(2)
|
||||||||||
|
CHANGES IN CASH AND ITS EQUIVALENTS
|
||||||||||||
|
Cash and its equivalents at the beginning of fiscal year
|
6,618,270 | (1) | 6,251,784 | (1) | 5,818,088 | |||||||
|
Cash and its equivalents at the end of the fiscal year
|
9,048,450 | (1) | 6,618,270 | (1) | 6,251,784 | (1) | ||||||
|
Net increase in cash and its equivalents
|
2,430,180 | 366,486 | 433,696 | |||||||||
|
REASONS FOR CHANGES IN CASH AND ITS EQUIVALENTS
|
||||||||||||
|
Operating activities
|
||||||||||||
|
Net collections/ (payments) from:
|
||||||||||||
|
- Governmental and private securities
|
2,120,841 | 2,066,402 | 1,144,287 | |||||||||
|
- Loans
|
(683,307 | ) | (2,931,804 | ) | (2,685,054 | ) | ||||||
|
to financial sector
|
(91,157 | ) | (449,005 | ) | (141,269 | ) | ||||||
|
to non-financial public sector
|
16,089 | 620,337 | 112,729 | |||||||||
|
to non-financial private sector and residents abroad
|
(608,239 | ) | (3,103,136 | ) | (2,656,514 | ) | ||||||
|
- Other receivables from financial transactions
|
(74,709 | ) | 18,171 | (1,365,353 | ) | |||||||
|
- Receivables from financial leases
|
(203,147 | ) | (372,630 | ) | (206,059 | ) | ||||||
|
- Deposits
|
3,076,345 | 5,409,329 | 3,320,375 | |||||||||
|
to financial sector
|
(25,095 | ) | 33,476 | (179,708 | ) | |||||||
|
to non-financial public sector
|
1,013,503 | 342,097 | (230,812 | ) | ||||||||
|
to non-financial private sector and residents abroad
|
2,087,937 | 5,033,756 | 3,730,895 | |||||||||
|
- Other liabilities from financial transactions
|
185,939 | 545,834 | 1,784,095 | |||||||||
|
Financing from financial or inter-financial sector (calls received)
|
(94,200 | ) | 109,100 | 5,100 | ||||||||
|
Others (except liabilities included in Financing Activities)
|
280,139 | 436,734 | 1,778,995 | |||||||||
|
Collections related to service charge income
|
2,520,560 | 1,951,823 | 1,480,733 | |||||||||
|
Payments related to service charge expense
|
(684,368 | ) | (515,003 | ) | (406,210 | ) | ||||||
|
Operating expenses paid
|
(2,870,089 | ) | (2,195,913 | ) | (1,924,775 | ) | ||||||
|
Organizational and development expenses paid
|
(36,188 | ) | (18,302 | ) | (13,540 | ) | ||||||
|
Net collections from punitive interest
|
8,290 | 4,253 | 2,891 | |||||||||
|
Differences from judicial resolutions paid
|
(19,251 | ) | (28,419 | ) | (35,057 | ) | ||||||
|
Collections of dividends from other companies
|
37,264 | 8,494 | 11,018 | |||||||||
|
Other collections / (payments) related to other income and expenses
|
325,554 | 273,653 | (337,363 | ) | ||||||||
|
Net cash flows provided by operating activities
|
3,703,734 | 4,215,888 | 769,898 | |||||||||
|
Investment activities
|
||||||||||||
|
Net payments from premises and equipment
|
(126,673 | ) | (121,583 | ) | (94,862 | ) | ||||||
|
Net payments from other assets
|
(5,774 | ) | (1,313 | ) | (2,022 | ) | ||||||
|
Collections from sales of ownership interests in other companies
|
15,174 | 255,757 | — | |||||||||
|
Other payments from investment activities
|
(574,700 | ) | (538,031 | ) | (165,373 | ) | ||||||
|
Net cash flows used in investment activities
|
(691,973 | ) | (405,170 | ) | (262,257 | ) | ||||||
F-9
BBVA BANCO FRANCÉS S.A. AND SUBSIDIARIES
CONSOLIDATED STATEMENTS OF CASH AND CASH EQUIVALENTS FLOWS—(Continued)
For the fiscal years ended December 31, 2012, 2011 and 2010
Stated in thousands of Pesos
|
Fiscal year ended December 31,
|
||||||||||||
|
2012
|
2011
(2)
|
2010
(2)
|
||||||||||
|
Financing activities
|
||||||||||||
|
Net collections/ (payments) from:
|
||||||||||||
|
- Non-subordinated corporate bonds
|
355,600 | 224,393 | 70,000 | |||||||||
|
- BCRA
|
33,463 | 15,570 | 46 | |||||||||
|
Others
|
33,463 | 15,570 | 46 | |||||||||
|
- Banks and international agencies
|
(300,568 | ) | 474,802 | 33,013 | ||||||||
|
- Financing received from local financial institutions
|
99,312 | 109,100 | 77,996 | |||||||||
|
Capital contributions
|
— | 7,896 | — | |||||||||
|
Dividends paid in cash
|
— | (818,258 | ) | (480,000 | ) | |||||||
|
Other (payments) / collections from financing activities
|
(769,388 | ) | (3,457,737 | ) | 224,897 | |||||||
|
Net cash flows used in financing activities
|
(581,581 | ) | (3,444,234 | ) | (74,048 | ) | ||||||
|
Financial results and results from holdings of cash and its equivalents (including interest)
|
— | 2 | 13 | |||||||||
|
Net increase in cash and its equivalents
|
2,430,180 | 366,486 | 433,696 | |||||||||
|
(1)
|
See Note 3.4.21.
|
|
(2)
|
See Note 3.3.
|
The accompanying Notes 1 to 22 are an integral part of these Consolidated Financial Statements.
F-10
BBVA BANCO FRANCÉS S.A. AND SUBSIDIARIES
CONSOLIDATED STATEMENTS OF CASH AND CASH EQUIVALENTS FLOWS—(Continued)
For the fiscal years ended December 31, 2012, 2011 and 2010
Stated in thousands of Pesos
SUPPLEMENTAL INFORMATION OF NON-CASH INVESTING AND FINANCING ACTIVITIES
At December 31, 2012, 2011 and 2010 the Bank entered into forward, unsettled spot and repurchase contracts to buy or sell foreign currencies, listed Government and other securities at future dates, exchanging non-cash assets or liabilities for other non-cash assets or liabilities (see Note 21.6).
SUPPLEMENTAL INFORMATION OF CERTAIN CASH MOVEMENTS
At December 31, 2012, 2011 and 2010, taxes paid amounted to 1,410,798, 904,079 and 491,039, respectively. At such dates, interest-paid amounted to 1,896,100, 1,167,471 and 722,297, respectively.
The accompanying Notes 1 to 22 are an integral part of these Consolidated Financial Statements.
F-11
CONSOLIDATED STATEMENTS OF CHANGES IN STOCKHOLDERS
’
EQUITY
For the fiscal years ended December 31, 2012, 2011 and 2010
Stated in thousands of Pesos
|
Non-capitalized contributions
|
Retained earnings
|
|||||||||||||||||||||||||||||||
|
Movements
|
Capital
Stock
(1)
|
Issuance
premiums
(1)
|
Adjustments to
stockholders’
equity
(1)
|
Legal
|
Other
|
Unrealized
valuation
difference
|
Unappropriated
earnings
|
Total
|
||||||||||||||||||||||||
|
Balances at December 31, 2009
|
536,361 | 175,132 | 312,979 | 658,693 | — | (14,133 | ) | 1,257,440 | 2,926,472 | |||||||||||||||||||||||
|
Decisions of Stockholders’ Meeting of April 30, 2010:
|
||||||||||||||||||||||||||||||||
|
- Dividends paid in cash
|
— | — | — | — | — | — | (480,000 | ) | (480,000 | ) | ||||||||||||||||||||||
|
- Legal Reserve
|
— | — | — | 143,692 | — | — | (143,692 | ) | — | |||||||||||||||||||||||
|
Unrealized valuation difference
|
— | — | — | — | — | 102,264 | — | 102,264 | ||||||||||||||||||||||||
|
Net income for the fiscal year
|
— | — | — | — | — | — | 1,198,179 | 1,198,179 | ||||||||||||||||||||||||
|
Balances at December 31, 2010
|
536,361 | 175,132 | 312,979 | 802,385 | — | 88,131 | 1,831,927 | 3,746,915 | ||||||||||||||||||||||||
|
Decisions of Stockholders’ Meeting of March 30, 2011:
|
||||||||||||||||||||||||||||||||
|
- Dividends paid in cash
|
— | — | — | — | — | — | (804,000 | ) | (804,000 | ) | ||||||||||||||||||||||
|
- Legal Reserve
|
— | — | — | 239,636 | — | — | (239,636 | ) | — | |||||||||||||||||||||||
|
Subscription of shares approved by Stockholders´ Meeting held on March 30, 2011
|
517 | 7,379 | — | — | — | — | — | 7,896 | ||||||||||||||||||||||||
|
Unrealized valuation difference
|
— | — | — | — | — | (88,131 | ) | — | (88,131 | ) | ||||||||||||||||||||||
|
Net income for the fiscal year
|
— | — | — | — | — | — | 1,005,577 | 1,005,577 | ||||||||||||||||||||||||
|
Balances at December 31, 2011
|
536,878 | 182,511 | 312,979 | 1,042,021 | — | — | 1,793,868 | 3,868,257 | ||||||||||||||||||||||||
|
Decisions of Stockholders’ Meeting of March 26, 2012:
|
||||||||||||||||||||||||||||||||
|
- Legal Reserve
|
— | — | — | 201,115 | — | — | (201,115 | ) | — | |||||||||||||||||||||||
|
- Voluntary reserve for future
distributions of income
|
— | — | — | — | 1,592,753 | — | (1,592,753 | ) | — | |||||||||||||||||||||||
|
Net income for the fiscal year
|
— | — | — | — | — | — | 1,263,679 | 1,263,679 | ||||||||||||||||||||||||
|
Balances at December 31, 2012
|
536,878 | 182,511 | 312,979 | 1,243,136 | 1,592,753 | — | 1,263,679 | 5,131,936 | ||||||||||||||||||||||||
|
(1)
|
See Note 1.2.
|
The accompanying Notes 1 to 22 are an integral part of these Consolidated Financial Statements.
F-12
NOTES TO THE CONSOLIDATED FINANCIAL STATEMENTS
For the fiscal years ended December 31, 2012, 2011 and 2010
Stated in thousands of Pesos
|
1.1.
|
Corporate situation
|
BBVA Banco Francés S.A. (hereinafter indistinctly referred to as either “BBVA Francés” or the “Bank”) has its main place of business in Buenos Aires, Argentina, and operates a 244-branch network.
As from December, 1996, BBVA Francés is part of Banco Bilbao Vizcaya Argentaria S.A. (BBVA) global strategy, which controls the Bank, direct and indirectly, with 75.96% of the corporate stock as of December 31, 2012.
Part of the Bank’s corporate stock is publicly traded and has been registered with the Buenos Aires Stock Exchange, New York Stock Exchange and Madrid Stock Exchange.
|
1.2.
|
Stockholders’ Equity
|
|
1.2.1.
|
Capital stock
|
Changes in the Bank’s capital stock during the last 5 fiscal years are as follows:
|
Date of
|
||||||||||||||||||
|
Stockholders’ Meeting deciding on the issuance
|
Registration with the Public Registry of Commerce
|
Form of
placement
|
Amount
(in thousands)
|
Total
|
||||||||||||||
|
Capital Stock as of December 31, 2007:
|
471,361 | |||||||||||||||||
| 03-27-2009 | 10-05-2009 | (1) | 65,000 | 536,361 | ||||||||||||||
| 03-30-2011 | 09-14-2011 | (2) | 517 | 536,878 | (3) | |||||||||||||
| 03-26-2012 | (4) | 50,410 | ||||||||||||||||
| 03-26-2012 | (4) | (50,410 | ) | 536,878 | ||||||||||||||
|
|
(1)
|
For payment of share dividend.
|
|
|
(2)
|
Due to the merger of Consolidar Comercializadora S.A. into BBVA Francés.
|
|
|
(3)
|
The amount of Capital Stock is fully paid in and authorized for public offering by National Securities Commission (CNV).
|
|
|
(4)
|
Due to the merger of Inversora Otar S.A. into BBVA Francés. The issuance of 50,410,182 shares will take place as soon as the merger has been registered with the Public Registry of Commerce and immediately afterwards, BBVA Francés will cancel the 50,410,182 shares that it owns (see Note 1.6).
|
|
1.2.2.
|
Authorized and issued shares
|
In October 2009 the total number of authorized and issued ordinary shares, par value 1.00 each, increased by 65,000,000 as a result of the distribution of share dividends approved by the Stockholders’ Meeting on March 27, 2009.
In September 2011 the total number of authorized and issued ordinary shares, par value 1.00 each, increased by 516,544 as a result of the merger by absorption of Consolidar Comercializadora S.A. into BBVA Francés.
As of December 31, 2012 the capital stock of the Bank consists of 536,877,850 Ordinary Shares, par value 1.00 each, all of which are issued and available to stockholders.
F-13
BBVA BANCO FRANCÉS S.A. AND SUBSIDIARIES
NOTES TO THE CONSOLIDATED FINANCIAL STATEMENTS
For the fiscal years ended December 31, 2012, 2011 and 2010
Stated in thousands of Pesos
|
1.2.3.
|
Adjustments to stockholders’ equity
|
The “Adjustments to stockholders’ equity” caption in the Consolidated Statement of Changes in Stockholders’ Equity represents:
|
a)
|
The balance of the surplus of the technical valuation on the Bank’s properties made in year 1981, which is available to absorb losses on the disposal or devaluation of such properties restated by inflation as mentioned in Note 3.2
|
|
b)
|
The inflation adjustment related to capital stock at the beginning of each year, restated as mentioned in Note 3.2.; capital stock maintains its nominal (par) value at each balance sheet date.
|
|
c)
|
The inflation adjustment related to the increase in capital stock restated as mentioned in Note 3.2. This adjustment represents the effect of inflation from the date on which the capital stock was increased to the end of each fiscal year.
|
The composition of “Adjustments to stockholders’ equity” is as follows:
|
|
December 31,
2012 and 2011
|
|||
|
Adjustment to equity fund appraisal revaluation
|
41,285 | |||
|
Adjustments to capital stock (including Issuance Premiums)
|
728,619 | |||
|
Cumulative losses absorption
|
(456,925 | ) | ||
|
Total
|
312,979 | |||
|
1.2.4.
|
Issuance Premiums
|
In August 2002, due to the issuance of 158,496,540 shares subscription (value 1 per share), at 3.59 each, the Bank received 590,996 over the nominal value of the shares that had been recorded under the “Issuance Premiums” account, totalizing 934,211 at December 31, 2003. In April 2004, due to the issuance of 103,232,874 shares subscription (value 1 per share) at 3.53 each, the Bank received 261,179 over the nominal value of the shares that had been recorded under the “Issuance Premiums” account. The Stockholders’ Meeting held on April 28, 2005 resolved the absorption of cumulative losses by 1,020,258, totalizing 175,132 at December 31, 2010. Finally, in September 2011, due to the issuance of 516,544 shares subscription (value 1 per share) according to the merger by absorption of Consolidar Comercializadora S.A. into BBVA Francés, the Bank received 7,379 over the nominal value of the shares that had been recorded under the “Issuance Premiums” account, totalizing 182,511 at December 31, 2012.
|
1.3.
|
Responsibility of stockholders
|
BBVA Francés is a corporation established under the laws of the Argentine Republic, and the responsibility of its stockholders is limited to the value of the paid - in shares, in accordance with Law Nr. 19,550. As a result, in compliance with Law Nr. 25,738, it is hereby informed that neither the foreign capital majority stockholders nor the local or foreign stockholders will respond, in excess of the mentioned paid-in stockholding, for the liabilities arising out of the transactions performed by the financial institution.
|
1.4.
|
Sale of Consolidar Compañía de Seguros de Retiro S.A.
|
On March 31, 2011, a purchase and sale agreement was executed for the aggregate shares held by Consolidar Compañía de Seguros de Retiro S.A. (Consolidar Retiro) between BBVA Francés, holder of 66.21% of the capital stock, and Banco Bilbao Vizcaya Argentaria S.A., holder of 33.79% of the capital stock, in their capacities as selling
F-14
BBVA BANCO FRANCÉS S.A. AND SUBSIDIARIES
NOTES TO THE CONSOLIDATED FINANCIAL STATEMENTS
For the fiscal years ended December 31, 2012, 2011 and 2010
Stated in thousands of Pesos
shareholders, and Orígenes Compañía de Seguros de Retiro S.A., C.M.S. de Argentina S.A. and Grupo Dolphin Holding S.A., in their capacities as buying shareholders.
Pursuant to said agreement, a price was established for the shares, at 380,000, adjustable on the basis of the proceeds resulting from the sale of the interest held by Consolidar Retiro in the real estate for own use where it has its offices. The price was paid pro rata of the shareholding of each one of the sellers in Consolidar Retiro. In addition, the closing of the transaction was subject to the satisfactory fulfillment of certain conditions precedent, which included the authorization of the National Superintendence of Insurance (S.S.N.).
On May 13, 2011, the transaction was approved by the S.S.N., with the stock purchase agreement having been closed and the transfer of shares consummated on June 10, 2011.
|
1.5.
|
Sale of Consolidar Aseguradora de Riesgos del Trabajo S.A.
|
On October 6, 2011, a purchase and sale agreement was executed for the aggregate shares held by Consolidar Aseguradora de Riesgos del Trabajo S.A. (Consolidar ART) between BBVA Francés, holder of 12.50% of the capital stock, and Banco Bilbao Vizcaya Argentaria S.A., holder of 87.50% of the capital stock, in their capacities as selling shareholders, and Galeno Argentina S.A. in its capacity as buyer.
Pursuant to said agreement, a price was established for the shares, at U.S.$59,443,137, adjustable on the basis of the net proceeds resulting from the sale of the interest held by Consolidar ART in the real estate for own use where it had its offices. On October 6, 2011 BBVA Francés received from the buyer a down payment in the amount of 18,750 equal to 60% of the pro rata price of the transaction. On February 6, 2012, the transaction was approved by the National Superintendence of Insurance (S.S.N.) and on March 6, 2012, the transfer of the stock ownership from Consolidar ART to Galeno Argentina S.A. was perfected, together with the collection of the transaction price balance.
|
1.6.
|
Inversora Otar S.A. merged by absorption into BBVA Francés
|
As of the end of the previous fiscal year, Inversora Otar S.A. (Otar) held in its name 50,410,182 book-entry, ordinary shares, with a par value of $1 each and right to 1 vote each in the capital stock of BBVA Francés.
On February 9, 2012, the Boards of Directors of BBVA Francés and Otar entered into a “Preliminary Merger Agreement” whereby BBVA Francés incorporates Otar on the basis of these companies’ financial statements as of December 31, 2011 and Otar goes through dissolution without liquidation process.
On March 26, 2012, the Ordinary and Extraordinary General Shareholders’ Meetings of BBVA Francés and Otar approved the above mentioned preliminary merger agreement, the consolidated financial statements for merging purposes as of December 31, 2011 and the shares’ exchange ratio.
The Shareholders’ Meeting of BBVA Francés above mentioned, approved the increase in capital stock of BBVA Francés by issuing 50,410,182 book-entry, ordinary shares with a par value of $ 1 each and 1 vote per share, to be listed for public offering at the Buenos Aires Stock Exchange in order to be delivered to the shareholders of Otar. These shares will be issued as soon as the merger is registered with the Public Registry of Commerce.
In addition, immediately after the above-mentioned capital increase, BBVA Francés will cancel the 50,410,182 book-entry, ordinary shares, with a par value of $1 each and right to 1 vote each that it owns subject to the previous capital stock reduction stemming from the merger.
The parties have agreed to fix April 1, 2012 as the effective date for the merger as that was the date when all the assets and liabilities of the merged company were transferred, for 390.971 and 5.668, respectively.
F-15
BBVA BANCO FRANCÉS S.A. AND SUBSIDIARIES
NOTES TO THE CONSOLIDATED FINANCIAL STATEMENTS
For the fiscal years ended December 31, 2012, 2011 and 2010
Stated in thousands of Pesos
As of the date of issuance of these financial statements, the decisions adopted shall be subject to the approval of the competent authorities.
Additionally, and as a result of the above-mentioned merger by absorption, BBVA Francés took over Aplica Soluciones Argentina S.A. Following this company’s liquidation proceedings, on December 21, 2012, BBVA Francés received 2,602 representative of its ownership interest in the referred company. As of the date of issuance of these financial statements, the company’s de-registration from the Public Registry of Commerce was still pending.
|
1.7.
|
PSA Finance Argentina Cía. Financiera S.A.
|
According to the provisions in Section Three of its By-laws and with the authorization granted by Argentine Central Bank (“BCRA”), the Entity is authorized to carry out all the transactions and activities covered by Section 24 of the Law of Financial Institutions and other expressly authorized by B.C.R.A. On April 22, 2009, the Entity started to receive deposits and therefore, it participates in the Deposit Guarantee Fund created by Law Nr. 24,485.
|
2.1.
|
In controlled majority-owned subsidiaries
|
The following summarizes the investment in, and related information of, controlled majority-owned subsidiaries which are consolidated.
|
Shares
|
Percentage participation
|
|||||||||||||||||||||||||
|
Principal Activity
|
Type
|
Quantity
|
Capital
|
Votes
|
||||||||||||||||||||||
|
December 31,
|
December 31,
|
December 31,
|
||||||||||||||||||||||||
|
Companies
|
2012
|
2011
|
2012
|
2011
|
2012
|
2011
|
||||||||||||||||||||
|
BBVA Francés Valores Sociedad de Bolsa S.A.
|
Stockbroker
|
Common
|
12,396 | 12,137 | 96.9953 | 94.9687 | 99.9953 | 94.9687 | ||||||||||||||||||
|
Consolidar AFJP S.A. (
undergoing liquidation proceedings
)
|
Pensions fund manager
|
Common
|
35,425,947 | 35,425,947 | 53.8892 | 53.8892 | 53.8892 | 53.8892 | ||||||||||||||||||
|
PSA Finance Argentina Cía. Financiera S.A.
|
Financial institution
|
Common
|
26,089 | 26,089 | 50.000 | 50.0000 | 50.0000 | 50.0000 | ||||||||||||||||||
|
BBVA Francés Asset Management S.A. Sociedad Gerente de Fondos Comunes de Inversión
|
Fund Manager
|
Common
|
230,398 | 230,398 | 95.000 | 95.0000 | 95.0000 | 95.0000 | ||||||||||||||||||
|
2.2.
|
Non-controlling equity investments
|
The following are all positions that the Bank holds in financial and non-financial institutions wherever such a position represented an ownership in excess of 2% of the invested companies’ capital stock as of December 31, 2012.
|
Investment
|
Country
|
% of Shares
Owned
|
Principal Activity
|
Investment in Other Subsidiaries
(in thousands of pesos)
|
|
Rombo Compañía Financiera S.A.
|
Argentina
|
40.00%
|
Financial institution
|
97,268.2
|
|
BBVA Consolidar Seguros S.A.
|
Argentina
|
12.22%
|
Insurance company
|
19,983.4
|
|
Coelsa S.A.
|
Argentina
|
11.39%
|
Clearing house
|
97.5
|
|
Interbanking S.A.
|
Argentina
|
10.00%
|
Information services for financial markets
|
2,931.2
|
|
Argencontrol S.A.
|
Argentina
|
7.77%
|
Agent mandatory
|
54.0
|
|
Sedesa S.A.
|
Argentina
|
10.53%
|
Deposit guarantee fund
|
105.3
|
|
Banelco S.A.
|
Argentina
|
10.91%
|
Nationwide ATM network & credit card administrating
|
7,178.9
|
|
Visa Argentina S.A.
|
Argentina
|
10.87%
|
Credit card issuer
|
6,666.8
|
F-16
BBVA BANCO FRANCÉS S.A. AND SUBSIDIARIES
NOTES TO THE CONSOLIDATED FINANCIAL STATEMENTS
For the fiscal years ended December 31, 2012, 2011 and 2010
Stated in thousands of Pesos
|
3.1.
|
Basis of presentation
|
In accordance with the procedures set forth in BCRA’s regulations and Technical Pronouncement Nr. 21 of the Argentine Federation of Professional Councils in Economic Sciences (FACPCE for its Spanish accronym), the Bank has consolidated - line by line - its balance sheets, statements of operations and cash and cash equivalents flows as of December 31, 2012, 2011 and 2010, as per the following detail:
|
-
|
As of December 31, 2012:
|
|
a)
|
With the financial statements of BBVA Francés Valores Sociedad de Bolsa S.A., PSA Finance Argentina Cía. Financiera S.A. and BBVA Francés Asset Management S.A. Sociedad Gerente de Fondos Comunes de Inversión for the fiscal years ended December 31, 2012.
|
|
b)
|
With the financial statements of Consolidar Administradora de Fondos de Jubilaciones y Pensiones S.A. (undergoing liquidation proceedings) for the six month period ended December 31, 2012.
|
The results and cash and cash equivalents flows of Consolidar Administradora de Fondos de Jubilaciones y Pensiones S.A. (undergoing liquidation proceedings) has been adjusted for purposes of comparison of the fiscal years of companies consolidating on the basis of the twelve-month period ended on December 31, 2012.
|
-
|
As of December 31, 2011:
|
|
a)
|
With the financial statements of BBVA Francés Valores Sociedad de Bolsa S.A., PSA Finance Argentina Cía. Financiera S.A. and BBVA Francés Asset Management S.A. Sociedad Gerente de Fondos Comunes de Inversión for the fiscal year ended December 31, 2011.
|
|
b)
|
With the financial statements of Consolidar Administradora de Fondos de Jubilaciones y Pensiones S.A. (undergoing liquidation proceedings) for the six month period ended December 31, 2011.
|
The results and cash and cash equivalents flows of Consolidar Administradora de Fondos de Jubilaciones y Pensiones S.A. (undergoing liquidation proceedings) has been adjusted for purposes of comparison of the fiscal years of companies consolidating on the basis of the twelve-month period ended on December 31, 2011.
|
-
|
As of December 31, 2010:
|
|
a)
|
With the financial statements of BBVA Francés Valores Sociedad de Bolsa S.A., BBVA Francés Asset Management S.A. Sociedad Gerente de Fondos Comunes de Inversión and PSA Finance Argentina Cía. Financiera S.A., for the fiscal year ended December 31, 2010.
|
|
b)
|
With the financial statements of Consolidar Administradora de Fondos de Jubilaciones y Pensiones S.A. (undergoing liquidation proceedings) and Consolidar Cía. de Seguros de Retiro S.A., for the six month period ended December 31, 2010.
|
The results and cash and cash equivalents flows of Consolidar Administradora de Fondos de Jubilaciones y Pensiones S.A. (undergoing liquidation proceedings), and Consolidar Cía. de Seguros de Retiro S.A. have been adjusted for purposes of comparison of the fiscal years of companies consolidating on the basis of the twelve-month period ended on December 31, 2010.
Interests in subsidiaries are listed in Note 2.
F-17
BBVA BANCO FRANCÉS S.A. AND SUBSIDIARIES
NOTES TO THE CONSOLIDATED FINANCIAL STATEMENTS
For the fiscal years ended December 31, 2012, 2011 and 2010
Stated in thousands of Pesos
|
3.2.
|
Restatement of the Financial Statements in equivalent purchasing power
|
The Consolidated Financial Statements have been taken from the Bank’s books of account in conformity with the standards of the BCRA.
These Consolidated Financial Statements recognize the effects of the changes in the purchasing power of the currency through February 28, 2003, following the restatement method established by FACPCE’s Technical Pronouncement Nr. 6 (modified by Technical Pronouncement Nr.19), using adjustment rates derived from the Internal Wholesale Price Index published by the National Institute of Statistics and Census (“INDEC” for its Spanish acronym).
Accordingly to the above mentioned method, the accounting figures were restated due to the purchasing power changes through August 31, 1995. As from that date, based in the prevailing economic stability conditions and accordingly with CNV General Resolution Nr. 272 and BCRA Communication “A” 2365, the accounting figures were not restated through December 31, 2001. In view of CNV General Resolution Nr. 415 and BCRA Communication “A” 3702, the method was reinstated effective as from January 1, 2002, considering the previous accounting figures as restated as of December 31, 2001.
By Communication “A” 3921 of the BCRA and General Resolution Nr. 441/03 of the CNV, in compliance with Decree Nr. 664/03 of the Federal Executive, application of the restatement method on financial statements in equivalent purchasing power has been suspended as from March 1, 2003. Accordingly, BBVA Banco Francés S.A. applied the mentioned restatement until February 28, 2003.
|
3.3.
|
Comparative information
|
The Consolidated Financial Statements as of December 31, 2012 include comparative information with the Consolidated Financial Statements as of December 31, 2011 and 2010.
On January 1, 2012, the Bank reclassified its loans to personnel within the scope of Communication “A” 1250 from the Loans caption to the Other receivables caption.
As a result, for comparative purposes, the Bank adapted the balances of such assets in the Balance Sheet as of December 31, 2011 and in the Statement of Cash and cash equivalents flow as of December 31, 2011 and 2010.
It must be clarified that these changes do not have a significant impact on the presentation of the financial statements as of such date considered as a whole
.
|
3.4.
|
Valuation methods
|
The main valuation methods used in the preparation of the Consolidated Financial Statements have been as follows:
|
3.4.1.
|
Foreign currency assets and liabilities
|
As of December 31, 2012 and 2011, such amounts were translated into Pesos at the benchmark exchange rate of the BCRA as of the closing date of transactions on the last business day of each fiscal year. The exchange differences were charged to income (loss) for each fiscal year.
|
3.4.2.
|
Governmental and private securities
|
|
§
|
Holdings booked at fair value and instruments issued by the BCRA at fair value: they were valued based on current listed prices or the prevailing present value for each security as of December 31, 2012 and 2011. Differences in listed prices were credited/charged to income for each fiscal year.
|
F-18
BBVA BANCO FRANCÉS S.A. AND SUBSIDIARIES
NOTES TO THE CONSOLIDATED FINANCIAL STATEMENTS
For the fiscal years ended December 31, 2012, 2011 and 2010
Stated in thousands of Pesos
|
§
|
Holdings booked at amortized cost and instruments issued by the BCRA at amortized cost: as of December 31, 2012 and 2011, these were valued using the amount of initial recognition, rose on the basis of the interest accrued as per the internal rate of return.
|
|
§
|
Investments in listed private securities, equity and debt instruments: they were valued based on current listed prices as of December 31, 2012 and 2011. Differences in listed prices were charged to income for each fiscal year.
|
|
3.4.3.
|
Governmental loans
|
Federal Government secured loans – Decree Nr. 1387/01:
As of December 31, 2012 and 2011, the secured loans were valued at the highest amount resulting from a comparison between the present value as estimated by BCRA and the book value in accordance with the provisions under BCRA’s Communication “A” 5180. In addition, the amount required to take their book values to their fair realization values is recorded in a balancing account.
|
3.4.4.
|
Benchmark stabilization coefficient (CER)
|
As of December 31, 2012 and 2011, receivables and payables have been adjusted to the CER as follows:
|
§
|
Federal government secured loans have been adjusted under Resolution Nr. 50/2002 of the Ministry of Economy, which resolved that the CER business 10 (ten) days prior to the maturity date of the related service will be considered for yield and repayments of the loans.
|
|
§
|
Federal Government Secured Bonds due in 2020: have been adjusted under Resolution Nr. 539/2002 of the Ministry of Economy, which resolved that the CER business 5 (five) days prior to the maturity date of the related service will be considered for yield and repayment of the bonds.
|
|
§
|
Deposits and other assets and liabilities: have been adjusted considering the CER prevailing as of December 31, 2012 and 2011.
|
|
3.4.5.
|
Allowance for loans losses and contingent commitments
|
For loans, other receivables from financial transactions, receivables from financial leases, receivables from sale of property assets and contingent commitments: the allowances have been calculated based on the Bank’s estimated loan loss risk in light of debtor compliance and the collaterals supporting the respective transactions, as provided by Communication "A" 2950 and supplemented of the BCRA.
|
3.4.6.
|
Interest income recognition
|
Interest has been accrued according to a compound interest formula in the periods in which it was generated, except interest on transactions in foreign currency, those whose maturity does not exceed 92 days, and adjustable assets and liabilities and loans to financial sector which were apportioned on a linear basis.
The Bank suspends the accrual of interest generally when the related loan is non-performing and the collection of interest and principal is in doubt. Accrued interest remains on the Bank’s books and is considered a part of the loan balance when determining the allowances for doubtful loans. Interest is then recognized on a cash basis after reducing the balance of accrued interest, if applicable.
F-19
BBVA BANCO FRANCÉS S.A. AND SUBSIDIARIES
NOTES TO THE CONSOLIDATED FINANCIAL STATEMENTS
For the fiscal years ended December 31, 2012, 2011 and 2010
Stated in thousands of Pesos
|
3.4.7.
|
Unlisted Corporate Bonds
|
They were valued at acquisition cost plus income accrued but not collected as of December 31, 2012 and 2011.
|
3.4.8.
|
Instruments to be received and to be delivered for spot and forward transactions to be settled
|
The Bank enters into forward contracts to buy or sell foreign currencies, listed Governmental securities and other securities at future dates. Both a receivable and a payable are recognized at the time of the agreement, which reflects the amounts of cash, currency or listed securities to be exchanged at the closing date. The difference between the receivable and payable at the original transaction date (premiums) is deferred and amortized over the contract’s life.
The Bank purchases and sells foreign currencies, listed Governmental and other securities on behalf of its customers which settle another day. An asset or liability is reflected for the amount due from or to the customer and a corresponding asset or liability is reflected for the currency or listed securities to be exchanged.
The Bank’s receivables or payables representing the future receipt or delivery of currencies or securities are adjusted to reflect the current market price of such currencies or securities. The amount of such market price differences is recorded in income for the fiscal year.
Forward sales and purchases of securities associated with repurchase agreements were valued as follows:
|
§
|
In foreign currency: they were valued according to the benchmark exchange rate of the BCRA for each currency determined on the last business day of the end of each fiscal year.
|
|
§
|
Securities: with Holdings booked at fair value and Instruments issued by B.C.R.A at fair value: they were valued according to the method described in Note 3.4.2.
|
|
3.4.9.
|
Amounts receivable and payable for spot and forward transactions pending settlement
|
They were valued based on the prices agreed upon for each transaction, plus related premiums accrued as of December 31, 2012 and 2011.
|
3.4.10.
|
Receivables from financial leases
|
As of December 31, 2012 and 2011, they were valued at the present value of the sum of the periodical instalments and the agreed-upon residual value, calculated as per the conditions agreed upon in the respective leases, applying the imputed interest rate thereto.
|
3.4.11.
|
Investments in other companies
|
They have been valued according to the following methods:
|
§
|
Banelco S.A., Visa Argentina S.A., Rombo Cía. Financiera S.A., BBVA Consolidar Seguros S.A. and Interbanking S.A.: as of December 31, 2012 and 2011 were valued by the equity method at the end of each fiscal year.
|
Although the Entity has a 40% interest ownership in the capital stock and votes of Rombo Cía. Financiera S.A., operational and financial decisions at Rombo Cía. Financiera S.A. are taken together with this company’s majority shareholder on a joint basis.
F-20
BBVA BANCO FRANCÉS S.A. AND SUBSIDIARIES
NOTES TO THE CONSOLIDATED FINANCIAL STATEMENTS
For the fiscal years ended December 31, 2012, 2011 and 2010
Stated in thousands of Pesos
|
§
|
Bladex S.A.: was valued at acquisition cost in foreign currency plus the nominal value of stock dividends received, converted into pesos based on the method described in Note 3.4.1.
|
|
§
|
Consolidar ART (see Note 1.5): was valued by applying the equity method at December 31, 2011.
|
|
§
|
Other: as of December 31, 2012 and 2011 were valued at acquisition cost, without exceeding their recoverable value.
|
|
3.4.12.
|
Premises and equipment and Other assets
|
They have been valued at acquisition cost plus increases from prior-year appraisal revaluations, restated as explained in Note 3.2, less related accumulated depreciation calculated in proportion to the months of estimated useful life of items concerned.
|
3.4.13.
|
Intangible assets
|
They have been valued at acquisition cost less related accumulated amortization calculated in proportion to the months of estimated useful life of the items concerned.
This caption included the differences arising from compliance with court-ordered measures arising from cases challenging the current rules and regulations applicable to deposits with the financial system in the framework of the provisions of Law Nr. 25,561, Decree Nr. 214/02 and supplementary provisions. The assets mentioned (calculated on the basis of the nominal difference between the exchange rate freely determined in the market and applied to the value of the deposit recorded in the books at that date) was amortized within the 60 monthly instalments starting in April 2003 in accordance with Communication “A” 3916 of the BCRA.
As of December 31, 2012 and 2011 these assets have been fully amortized, with the total accumulated amortization as of those dates amounting to 1,378,511 and 1,359,260, respectively.
The Bank, however, notifies that such amortization was solely calculated to comply with the regulations of the BCRA and that by no means does it imply a waiver to possible compensation or recovery of the exchange difference resulting from compliance with court orders corresponding to petitions for protection of civil rights or other court action derived from the mandatory conversion of bank deposits into pesos.
Pursuant to the decisions handed down by Argentina’s Supreme Court of Justice (“Massa, Juan Agustín v. Argentine Executive Branch – Executive Order 1570/ et al over action for the protection of constitutional rights (amparo) Law Nr. 16,986” and “Kujarchuk v. Argentine Executive Branch”), a calculation method was established for the payment of bank deposits that was different from the one that had been instituted by the Argentine Executive Branch.
As of December 31, 2012 and 2011, the Bank has estimated this contingency and it has raised allowances for the total amount.
The Bank’s Board of Directors expects that the Argentine State remedies the significant damage resulting from compliance with court-ordered measures on petitions for protection of civil rights and actions for relief, particularly due to the impact of differences in compensation or recovery as per the rulings in the abovementioned actions and according to the law in relation to the “pesification” of the underlying deposits. In this regard, the Bank has informed of such financial damages to the relevant authorities, with reservation of rights.
F-21
BBVA BANCO FRANCÉS S.A. AND SUBSIDIARIES
NOTES TO THE CONSOLIDATED FINANCIAL STATEMENTS
For the fiscal years ended December 31, 2012, 2011 and 2010
Stated in thousands of Pesos
|
3.4.14.
|
Derivative transactions
|
Interest rate swaps and Forward transactions:
|
(i)
|
Interest rate swaps are recorded at the value resulting from the application of rates differences to residual notional amounts at the end of each fiscal year.
|
|
(ii)
|
Forward transactions receivable/payable in Pesos without delivery of the underlying asset are recorded for the amount receivable or payable, as appropriate, arising from the difference between the agreed exchange rate and the exchange rate at the end of each fiscal year as applied to stated notional amounts.
|
Call options bought and written:
As of December 31, 2011, these were valued based on their intrinsic value, which represents the difference between the market value of the underlying asset and the strike price. The exchange differences were charged to income (loss) for each fiscal year.
Repo and Reverse Repo transactions
As of December 31, 2011, the repos whose underlying assets are not subject to the volatilities published by BCRA were valued as per the cost of each transaction and the repos whose underlying assets are subject to volatility were recorded at their quoted value. Accrued premiums were charged to income (loss) for each fiscal year.
|
3.4.15.
|
Term investments yielding variable income - Communication “A” 2482 and supplemented
|
At the end of the previous fiscal year, the variable income yielded by these investments, agreed for terms equal to or in excess of 180 days, was accrued on the basis of the change in the price of the assets or the indicators contained in the provision and the terms and conditions of the respective transactions were also considered. Any said change was restricted to a given range of contractually agreed values.
|
3.4.16.
|
Employee termination pay
|
The Bank expenses employee termination pay as disbursed.
|
3.4.17.
|
Other liabilities
|
They include liabilities non arising out of transactions relating to the supply and demand of financial resources, plus the adjustments and interest payable accrued as of December 31, 2012 and 2011.
|
3.4.18.
|
Allowance for other contingencies
|
It includes the estimated amounts to meet contingencies of probable occurrence that, if occurred, would give rise to a loss for the Bank.
|
3.4.19.
|
Stockholders’ equity accounts
|
They are restated as explained in Note 3.2., except for the "Capital Stock" and “Non capitalized contributions” accounts which have been kept at original value. The adjustment resulting from the restatement is included in the "Adjustment to Stockholders´ Equity – Adjustment to Capital Stock" account.
F-22
BBVA BANCO FRANCÉS S.A. AND SUBSIDIARIES
NOTES TO THE CONSOLIDATED FINANCIAL STATEMENTS
For the fiscal years ended December 31, 2012, 2011 and 2010
Stated in thousands of Pesos
|
3.4.20.
|
Statements of Operations Accounts
|
|
§
|
As of December 31, 2012, 2011 and 2010, accounts accruing monetary transactions [(financial income (expense), service charge income (expense), provision for loan losses, administrative expenses, etc.)] were computed on the basis of their monthly accrual at historical rates.
|
|
§
|
Accounts reflecting the effect on income resulting from the sale, write-off, or use of non-monetary assets were computed based on the value of such assets, as mentioned in Note 3.2.
|
|
§
|
Income from investments in subsidiaries was computed based on such companies’ income adjusted as explained in Note 3.2.
|
|
3.4.21.
|
Consolidated Statements of Cash and Cash Equivalents Flows
|
The Consolidated Statements of Cash and Cash Equivalents Flows as of December 31, 2012, 2011 and 2010 explain the changes in cash and its equivalents. For such purpose, a detail is supplied of the items that the Bank considers to be cash and its equivalents:
|
December 31,
|
||||||||||||
|
2012
|
2011
|
2010
|
||||||||||
|
a) Cash and due from banks
|
8,613,997 | 6,353,428 | 5,691,806 | |||||||||
|
b) Government securities held for trading or financial transactions
|
102,453 | 85,342 | 442,478 | |||||||||
|
c) Loans to financial sector, calls granted maturity date less than three months as from the end of each fiscal year
|
332,000 | 179,500 | 117,500 | |||||||||
|
CASH AND ITS EQUIVALENTS
|
9,048,450 | 6,618,270 | 6,251,784 | |||||||||
Items b) and c) are considered to be cash equivalents because they are held in order to meet short-term commitments, they are easily convertible in known cash amounts, they are subject to negligible changes in value and their maturity is less than three months as from each fiscal year date.
|
3.4.22.
|
Other assets and other liabilities from subsidiaries (Consolidar Group)
|
They have been valued in accordance with the accounting standards established by the S.S.N. and National Superintendence of Pension Funds Managers.
|
3.4.23.
|
Use of estimates
|
The preparation of the Consolidated Financial Statements in accordance with the standards set forth by the BCRA require the Bank’s Board of Directors and Management to use assumptions and estimates that affect certain assets such as allowances for doubtful loan and certain liabilities such as provisions for other contingencies as well as the income/loss generated during the fiscal years being reported. Final income/loss may differ from such estimates.
The Bank has prepared these Consolidated Financial Statements by applying the regulations of the BCRA, which do not contemplate some of the valuation criteria incorporated to the accounting principles generally accepted in Argentina.
F-23
BBVA BANCO FRANCÉS S.A. AND SUBSIDIARIES
NOTES TO THE CONSOLIDATED FINANCIAL STATEMENTS
For the fiscal years ended December 31, 2012, 2011 and 2010
Stated in thousands of Pesos
The main differences between the regulations of the BCRA and the accounting principles generally accepted in Argentina are detailed below:
|
4.1.
|
Valuation criteria
|
|
a)
|
Tax effects
|
As already indicated hereinbelow, in Note 5.1., the Bank has received various communications from the BCRA pursuant to which that BCRA indicates that the capitalization of items arising from the application of the deferred tax method is not allowed. In accordance with professional accounting standards currently in force in Argentina, a deferred tax asset should be recognized to the extent the reversal of temporary differences generates a future decrease in the tax effectively determined. As a result, the allowances set up by the Bank in this respect, for 256,900 and 109,600 as of December 31, 2012 and 2011, respectively, should be recovered.
|
b)
|
Derivative financial instruments
|
As explained in Notes 3.4.14. and 12, as of December 31, 2012 and 2011, the Bank recorded the effects of interest rate swap agreements as established by the BCRA. Should the Bank had applied the professional accounting standards currently in force, the stockholders’ equity would have increased in 6,606 and would have decreased in 11,293, respectively. By contrast, the effect of the application of the professional accounting standards on the income statement for the fiscal years ended December 31, 2012, 2011 and 2010 would have been 17,899 (income), 13,887 (loss) and 2,470 (income), respectively.
|
c)
|
Consolidar A.F.J.P. S.A. and Consolidar Retiro S.A. building acquisition
|
On September 25, 2009, the Bank acquired from Consolidar A.F.J.P. S.A. the latter’s undivided interest in the piece of real estate located in Avenida Independencia 169. The Bank booked a 20,109 write-down for the real estate in its stand-alone and Consolidated Balance Sheet as of December 31, 2011 to reflect the result from the transaction attributable to the Bank’s ownership interest in the company. The professional accounting standards currently in force in Argentina do not require the mentioned adjustment.
On June 7, 2011, the Bank acquired from Consolidar Retiro S.A. the latter’s undivided interest in the piece of real estate located in Avenida Independencia 169. The Bank booked a 7,062 write-down for the real estate in its stand-alone and Consolidated Balance Sheet as of December 31, 2011 to reflect the result from the transaction attributable to the Bank’s ownership interest in the company as of that date. The professional accounting standards currently in force in Argentina do not require the mentioned adjustment.
The entire undivided interest that the Bank owned in the property situated at Avenida Independencia 169 was sold on March 1, 2012.
|
4.2.
|
Other differences with respect to generally accepted accounting principles effective in Argentina, related to subsidiaries
|
|
a)
|
Arising from the application of the accounting standards laid down by the S.S.N. and the main differences with the professional accounting standards in force in Argentina:
|
The items included under the captions Other subsidiaries’ assets and Other subsidiaries’ liabilities were valued in accordance with the regulations of the S.S.N.
|
b)
|
Arising from the application of the accounting standards laid down by the BCRA and the professional accounting standards in force in Argentina:
|
F-24
BBVA BANCO FRANCÉS S.A. AND SUBSIDIARIES
NOTES TO THE CONSOLIDATED FINANCIAL STATEMENTS
For the fiscal years ended December 31, 2012, 2011 and 2010
Stated in thousands of Pesos
|
|
(i)
|
The commissions paid by PSA Finance Argentina Cía. Financiera S.A. to dealers for granting financing to companies and to the public in general in connection with purchases and sales of automobiles, which in accordance with the rules established by the BCRA are charged to the Income Statement, should be accrued throughout the duration of the loans generated by said dealers in accordance with currently applicable professional accounting standards. Had this criterion been applied, shareholders’ equity would have been increased by 10,636 and 10,380 as of December 31, 2012 and 2011, respectively.
|
|
|
(ii)
|
The Bank has not made disclosures required by professional accounting standards in force in Argentina on discontinued operations or discontinuation in relation to the process of liquidating its subsidiary Consolidar A.F.J.P. S.A. (undergoing liquidation proceedings).
|
|
5.1.
|
Income tax
|
The Bank determined the charge for income tax by applying the effective 35% rate to taxable income estimated for fiscal year considering the effect of temporary differences between valuation of assets and liabilities for accounting purposes and their taxable bases. The Bank considered as temporary differences those that have a definitive reversal date in subsequent years.
As of December 31, 2012, 2011 and 2010, the Bank recorded 864,676, 552,358 and 315,841, respectively, in the Income tax caption as the estimate of the income tax charge payable to the tax authorities for the relevant fiscal years.
As of December 31, 2012 and 2011, the Bank has booked 439,077 and 341,579, respectively, in the caption Other liabilities – Other – Accrued Taxes as a result of having netted the income tax withholdings and other withholdings applied to the Bank until such dates.
Besides, on June 19, 2003, the Bank received a note from the BCRA indicating that the capitalization of items arising from the application of the deferred tax method is not allowed.
On June 26, 2003, the Bank’s Board of Directors, based on the opinion of its legal counsel, responded the above mentioned note, indicating that in their opinion the rules of the BCRA do not prohibit the application of the deferred tax method generated by the recognition of temporary differences between the accounting and tax result. Subsequently, Resolution 118/03 of the Superintendent of Financial and Exchange Institutions received on October 7, 2003 confirmed the terms of the note dated June 19, 2003. Consequently, as from that date the Bank set up an allowance for the net balance between the deferred tax assets and liabilities.
As of December 31, 2012 and 2011, the Bank records under Other Receivables (in the line Tax Prepayments) a taxable deferred asset amounting 256,900 and 109,600, respectively. Such amounts are made up as follows (under individual basis):
|
December 31,
|
||||||||
|
2012
|
2011
|
|||||||
|
Deferred tax assets
|
453,500 | 333,200 | ||||||
|
Deferred tax liabilities
|
(196,600 | ) | (223,600 | ) | ||||
|
Net deferred assets
|
256,900 | 109,600 | ||||||
|
Allowance
|
(256,900 | ) | (109,600 | ) | ||||
F-25
BBVA BANCO FRANCÉS S.A. AND SUBSIDIARIES
NOTES TO THE CONSOLIDATED FINANCIAL STATEMENTS
For the fiscal years ended December 31, 2012, 2011 and 2010
Stated in thousands of Pesos
|
5.2.
|
Tax on minimum presumed income
|
Tax on minimum presumed income (TOMPI) was established by Law Nr. 25,063 in the year ended December 31, 1998, for a ten-year term. On December 19, 2008 Law Nr. 26,426 established a one-year extension in TOMPI until December 30, 2009. In turn, Law Nr. 26,545, published in the Official Gazette on December 2, 2009 extended TOMPI for an additional ten-year period. This tax is supplementary to income tax: while the latter is levied on the taxable income for the year, TOMPI is a minimum levy determined by applying the current 1% rate on the potential income of certain productive assets. Therefore, the Bank’s tax obligation for each year will coincide with the highest of these taxes. The above Law provides that institutions governed by Financial Institutions Law must consider as a tax base 20% of their taxable assets, after deducting non-computable ones. However, if TOMPI exceeds income tax in a given year, the excess thereof may be computed as a payment on account of any income tax in excess of TOMPI that may occur in any of the following ten years.
In every year that net operating losses are offset, the tax benefit (the benefit of the effective rate on the net operating loss used) will be realized to the extent that income tax (net of the offsetting) equals or exceeds tax on minimum presumed income, but will reduced by any excess of the latter over former.
On February 11, 2005, the Argentine Central Bank issued Communication “A” 4295 whereby it enabled, under certain rules, the accounting record of credits on Tax on Minimum Presumed Income.
As of December 31, 2012 and 2011, the Income tax assessed was higher than the TOMPI. Therefore, a provision was raised for Income tax.
|
5.3.
|
Other tax issues
|
|
a)
|
On December 3, 1998, the Bank was notified of a tax assessment performed at the initiative of the Federal Administration of Public Revenue (AFIP), concerning income tax for the fiscal year 1992.
|
An appeal against said assessment was lodged with the Argentine Tax Court the Bank’s objections against said period were partially dismissed. Against this dismissal resolution, the Bank lodged yet another appeal with the Court of Appeals with jurisdiction over federal contentious and administrative matters. On September 4, 2009 the Bank was notified of the judgment rendered by the Appellate Court. The judgment annuls the judgment entered in due time by one of the Argentine Tax Court panels and remands the case file to the Tax Court for it to have another panel render a decision. Panel B of the Tax Court handed down a new judgment declaring the assessment to be null and void. The Tax Authorities lodged an appeal against this judgment and on August 16, 2011. Panel III of the Appellate Court ruled that the appeal had been abandoned. Against this rejection, the Tax Authorities lodged an extraordinary appeal that the Appellate Court dismissed and then a further appeal was lodged with the Supreme Court of Justice of Argentina, which refused to admit it on April 17, 2012, with the judgment favorable to the Entity becoming final.
|
b)
|
On October 24, 2007, the Bank was notified by the Tax Bureau of the City of Buenos Aires of the commencement of a sua sponte tax assessment on a certain basis and partial in nature of the taxable income as regards turnover tax for the fiscal years 2002 and 2003.
|
On November 14, 2007, the Bank filed its defenses to the notice mentioned.
Then, on October 6, 2008, the Bank was given notice of Resolution Nr. 3631-DGR 2008 containing the sua sponte tax assessment for the fiscal years 2002 and 2003. On October 28, 2008, the Bank filed an appeal for review against this resolution, which was rejected on November 7, 2008.
F-26
BBVA BANCO FRANCÉS S.A. AND SUBSIDIARIES
NOTES TO THE CONSOLIDATED FINANCIAL STATEMENTS
For the fiscal years ended December 31, 2012, 2011 and 2010
Stated in thousands of Pesos
In response to said rejection, on November 28, 2008 an appeal was lodged with a higher administrative authority by the Ministry of Economy of the Government of the City of Buenos Aires, which was also dismissed on April 24, 2009.
On April 28, 2009, the Court of Appeals with Federal Jurisdiction over Contentious Administrative Matters, Panel 3 handed down a judgment favourable to a petition filed by the Bank for the judge to suspend the effect of the decision made by administrative authorities until the appeal is decided. The judgment thus ordered that “….subject to a sworn promise to comply … a) the Tax Bureau of the City of Buenos Aires must suspend the sua sponte assessment that has objected to the treatment afforded by BBVA Francés to the bonds received from the National Government in the terms of Decree Nr. 905-02 and the related foreign exchange gains/losses in all matters related to taxation for turnover tax purposes for the fiscal period 2002; b) therefore, the Tax Bureau of the City of Buenos Aires must abstain from demanding that the Bank should pay any amount due that may have arisen from the items above detailed”.
Also in this respect, on May 13, 2009, an action for a declaratory judgment was commenced by the Bank against the Tax Bureau of the City of Buenos Aires, currently being heard by the court with original Federal Jurisdiction over Contentious Administrative Matters Nr. 1, to procure a judgment ascertaining that a) the bonds received by the Bank from the National Government as compensation for the asymmetric re-denomination into Pesos of assets and liabilities imposed by the Executive Order Nr. 905/2002 may not be levied with Turnover Tax in the Autonomous City of Buenos Aires; b) the foreign exchange gains/losses are a direct effect of the modification of the monetary system and therefore should not be levied with Turnover Tax in the Autonomous City of Buenos Aires. On December 29, 2010, the Judge presiding over the court with original Federal Jurisdiction over Contentious Administrative Matters Nr. 1 handed down a new precautionary measure ordering the Tax Bureau of the City of Buenos Aires to refrain from demanding that BBVA Francés should pay any debt originating in the tax treatment that should be afforded to the bonds received from the National Government as compensation for the asymmetric re-denomination into Pesos under Executive Order Nr. 905/02 and the foreign exchange gains/losses for purposes of Turnover Tax for the fiscal period 2002 in issue until a final judgment has been rendered on the proceedings whereby the action for a declaratory judgment is still pending.
The Bank’s Management and tax and legal counsel estimate that the Bank made a reasonable interpretation of effective regulations regarding the observed periods and does not expect an adverse financial impact in these respects.
As regards the balance of the amount claimed, the Entity adhered to a scheme of payment in instalments that was cancelled on October 4, 2010.
|
c)
|
On December 23, 2011, the Tax Bureau of the City of Buenos Aires (AGIP) passed its Resolution Nr. 3088-DGR-2011 and notified the Bank of the commencement of a sua sponte tax assessment thereunder alleging presumptive differences owed to the Tax Bureau in the payment of turnover tax for the fiscal years 2004 through 2010. On January 27, 2012, BBVA Francés filed its defense with the Tax Bureau.
|
Afterwards, on December 28, 2012, the Bank was notified of Resolution Nr. 3253-DRG-2012 whereby the Tax Bureau of the City of Buenos Aires proceeded with a sua sponte assessment based on facts concerning the taxable basis for purposes of turnover tax for the fiscal years 2004 through 2010.
On February 4, 2013, the Bank lodged an appeal for reconsideration against Resolution Nr. 3253-DRG-2012 moving for the annulment of the tax adjustments contained in the sua sponte tax assessment and for an immediate order to archive the case file.
Bank’s Management as well as its legal and tax advisors estimate that the Bank relied on a reasonable interpretation of currently applicable rules and regulations concerning the fiscal periods objected to by the Tax Bureau of the City of Buenos Aires and do not expect an adverse financial impact in these respects.
F-27
BBVA BANCO FRANCÉS S.A. AND SUBSIDIARIES
NOTES TO THE CONSOLIDATED FINANCIAL STATEMENTS
For the fiscal years ended December 31, 2012, 2011 and 2010
Stated in thousands of Pesos
Detailed below are the balances of those accounts:
|
December 31,
|
||||||||
|
2012
|
2011
|
|||||||
|
a) GOVERNMENT AND PRIVATE SECURITIES
|
||||||||
|
Holdings booked at fair value
|
||||||||
|
Secured Bonds due in 2020
|
932,463 | 828,433 | ||||||
|
Federal Government Bonds in Pesos BADLAR plus 275 bp due in 2014
|
731,702 | 1,017,471 | ||||||
|
Secured Bonds due in 2018
|
151,422 | 178,727 | ||||||
|
Discount Bonds in pesos
|
10,560 | 23,377 | ||||||
|
Federal Government Bocon PRO 12
|
— | 14,814 | ||||||
|
Federal Government Bonds in Pesos BADLAR plus 350 bp due in 2013
|
— | 12,795 | ||||||
|
Other
|
5,932 | 12,905 | ||||||
|
Total
|
1,832,079 | 2,088,522 | ||||||
|
Holdings booked at amortized cost
|
||||||||
|
Other
|
164 | 164 | ||||||
|
Total
|
164 | 164 | ||||||
|
Instruments issued by the BCRA
|
||||||||
|
BCRA Bills (LEBAC)
|
2,201,676 | 2,352,026 | ||||||
|
BCRA Notes (NOBAC)
|
— | 1,095,946 | ||||||
|
Total
|
2,201,676 | 3,447,972 | ||||||
|
Investments in listed private securities
|
||||||||
|
FBA Ahorro Pesos Investment Fund
|
55,329 | 24,619 | ||||||
|
HF Pesos Plus - Clase I Investment Fund
|
6,751 | — | ||||||
|
FBA Renta Pesos Investment Fund
|
4,583 | 3,039 | ||||||
|
Other
|
1,452 | 897 | ||||||
|
Sub-Total
|
68,115 | 28,555 | ||||||
|
Allowances
|
(188 | ) | (184 | ) | ||||
|
Total
|
4,101,846 | 5,565,029 | ||||||
|
b) LOANS – Other
|
||||||||
|
Fixed-rate financial loans
|
2,665,151 | 2,640,216 | ||||||
|
Loans granted to pre-finance and finance exports
|
1,756,680 | 3,003,322 | ||||||
|
Loans for productive investments
|
212,396 | — | ||||||
|
Financial loans to foreign institutions
|
113,279 | 70,704 | ||||||
|
Other
|
174,184 | 115,364 | ||||||
|
Total
|
4,921,690 | 5,829,606 | ||||||
F-28
BBVA BANCO FRANCÉS S.A. AND SUBSIDIARIES
NOTES TO THE CONSOLIDATED FINANCIAL STATEMENTS
For the fiscal years ended December 31, 2012, 2011 and 2010
Stated in thousands of Pesos
|
December 31,
|
||||||||
|
2012
|
2011
|
|||||||
|
c) OTHER RECEIVABLES FROM FINANCIAL TRANSACTIONS – Other receivables covered by debtor classification regulations
|
||||||||
|
Fees receivable
|
122,346 | 96,159 | ||||||
|
Other
|
17,872 | 12,726 | ||||||
|
Total
|
140,218 | 108,885 | ||||||
|
d) INVESTMENTS IN OTHER COMPANIES – Other
|
||||||||
|
In non-controlled companies-supplementary activities
|
27,450 | 24,597 | ||||||
|
In other non-controlled companies- unlisted
|
20,045 | 45,876 | ||||||
|
Total
|
47,495 | 70,473 | ||||||
|
e) OTHER RECEIVABLES – Other
|
||||||||
|
Guarantee deposits
|
290,105 | 201,904 | ||||||
|
Tax prepayments
|
272,860 | 121,481 | ||||||
|
Miscellaneous receivables
|
211,222 | 234,533 | ||||||
|
Loans to personnel
|
188,260 | 178,256 | ||||||
|
Prepayments
|
163,941 | 110,886 | ||||||
|
Other
|
8,612 | 14,602 | ||||||
|
Total
|
1,135,000 | 861,662 | ||||||
|
f) OTHER SUBSIDIARIES’ ASSETS
|
||||||||
|
Others related to pension fund management business
|
450 | 450 | ||||||
|
Total
|
450 | 450 | ||||||
|
g) OTHER LIABILITIES FROM FINANCIAL
|
||||||||
|
TRANSACTIONS – Other
|
||||||||
|
Accounts payable for consumption
|
757,046 | 547,354 | ||||||
|
Other withholdings and collections at source
|
418,198 | 261,986 | ||||||
|
Collections and other operations for the account of third parties
|
258,616 | 473,628 | ||||||
|
Money orders payable
|
197,243 | 174,928 | ||||||
|
Pending Banelco debit transactions
|
105,288 | 36,505 | ||||||
|
Loans received from Argentine Technological Fund (FONTAR and Banco de Inversión y Comercio Exterior (“BICE”))
|
46,520 | 49,324 | ||||||
|
Loans received from Interamerican Development Bank (IDB)
|
8,204 | 15,945 | ||||||
|
Social security payment orders pending settlement
|
7,547 | 4,987 | ||||||
|
Other
|
141,027 | 90,300 | ||||||
|
Total
|
1,939,689 | 1,654,957 | ||||||
F-29
BBVA BANCO FRANCÉS S.A. AND SUBSIDIARIES
NOTES TO THE CONSOLIDATED FINANCIAL STATEMENTS
For the fiscal years ended December 31, 2012, 2011 and 2010
Stated in thousands of Pesos
|
h) OTHER LIABILITIES – Other
|
||||||||
|
Accrued taxes
|
562,448 | 431,534 | ||||||
|
Miscellaneous payables
|
476,876 | 324,307 | ||||||
|
Accrued salaries and payroll taxes
|
304,845 | 240,783 | ||||||
|
Amounts collected in advance
|
73,173 | 79,470 | ||||||
|
Other
|
1,735 | 2,137 | ||||||
|
Total
|
1,419,077 | 1,078,231 | ||||||
|
i) OTHER
SUBSIDIARIES’ LIABILITIES
|
||||||||
|
Others related to pension fund management business
|
337 | 336 | ||||||
|
Total
|
337 | 336 | ||||||
|
j) MEMORANDUM ACCOUNTS – DEBIT – CONTROL – Other
|
||||||||
|
Securities representative of investment in escrow on behalf of the Guarantee Fund for the Sustainability of the Pay-as-you-go System managed by the Argentine Republic
|
41,951,890 | 35,717,602 | ||||||
|
Items in safekeeping
|
20,096,342 | 16,094,866 | ||||||
|
Checks not yet credited
|
2,756,890 | 2,567,258 | ||||||
|
Checks drawn on the Bank pending clearing
|
515,628 | 254,125 | ||||||
|
Collections items
|
495,183 | 400,241 | ||||||
|
Other
|
111,934 | 96,100 | ||||||
|
Total
|
65,927,867 | 55,130,192 |
F-30
BBVA BANCO FRANCÉS S.A. AND SUBSIDIARIES
NOTES TO THE CONSOLIDATED FINANCIAL STATEMENTS
For the fiscal years ended December 31, 2012, 2011 and 2010
Stated in thousands of Pesos
|
December 31,
|
||||||||||||
|
2012
|
2011
|
2010
|
||||||||||
|
k) SERVICE CHARGE INCOME - Other
|
||||||||||||
|
Commissions for hiring of insurances
|
250,370 | 176,920 | 133,843 | |||||||||
|
Rental of safe-deposit boxes
|
95,095 | 75,798 | 53,482 | |||||||||
|
Commissions for loans and guaranties
|
82,044 | 59,365 | 40,100 | |||||||||
|
Commissions for transportations of values
|
17,250 | 14,807 | 11,145 | |||||||||
|
Commissions for escrow
|
10,348 | 10,880 | 6,855 | |||||||||
|
Commissions for salary payment
|
9,475 | 8,759 | 7,694 | |||||||||
|
Commissions for capital market transactions
|
7,622 | 16,580 | 20,421 | |||||||||
|
Commissions for trust management
|
1,378 | 1,527 | 1,844 | |||||||||
|
Other
|
74,421 | 58,043 | 57,183 | |||||||||
|
Total
|
548,003 | 422,679 | 332,567 | |||||||||
|
l) SERVICE CHARGE EXPENSE - Other
|
||||||||||||
|
Turn-over tax
|
158,976 | 119,349 | 81,489 | |||||||||
|
Insurance paid on lease transactions
|
35,614 | 21,042 | 15,215 | |||||||||
|
Other
|
20,718 | 12,892 | 5,352 | |||||||||
|
Total
|
215,308 | 153,283 | 102,056 | |||||||||
|
m) OTHER INCOME - Other
|
||||||||||||
|
Deferred income tax
(1)
|
147,300 | 47,300 | — | |||||||||
|
Income from the sale of fixed and miscellaneous assets
|
43,578 | 2,150 | 2,259 | |||||||||
|
Related parties expenses recovery
|
17,451 | 13,620 | 8,638 | |||||||||
|
Income from the Credit Card Guarantee Fund
|
16,559 | 9,996 | 5,255 | |||||||||
|
Rent
|
1,432 | 677 | 565 | |||||||||
|
Tax recovery
|
— | 18,166 | 12,800 | |||||||||
|
Premiums – Insurance companies
|
— | — | 17,648 | |||||||||
|
Other
|
35,910 | 42,374 | 15,572 | |||||||||
|
Total
|
262,230 | 134,283 | 62,737 | |||||||||
|
(1)
Offset by a charge for the same amount in the line Charge for uncollectibility of other receivables and other allowances under the caption Other expense.
|
||||||||||||
In March 2010, the Bank was notified of the commencement of two summary proceedings instituted by the Financial Information Unit (UIF) against BBVA Francés and its Regulatory Compliance Officer arising from two wire transfers received by two customers in their respective sight accounts on November 22, 2007 and respectively amounting to 39,393 and 9,174.
It has been the UIF’s understanding that the profile of the customers, as defined, and the supporting documentation submitted by the Bank do not coincide with the possibility of receiving such wire transfers.
In due time, the Bank filed its defences, offered evidence and petitioned for an acquittal. In addition, the Bank called for the enforcement in this case of the same guarantees available in court proceedings, argued that the statute of limitations applicable to punishable offenses had run out and further claimed that Law Nr. 25,246 is unconstitutional when it comes to the scale of penalties imposed.
F-31
BBVA BANCO FRANCÉS S.A. AND SUBSIDIARIES
NOTES TO THE CONSOLIDATED FINANCIAL STATEMENTS
For the fiscal years ended December 31, 2012, 2011 and 2010
Stated in thousands of Pesos
As regards the Regulatory Compliance Officer, the Bank focused on the nature of the penalties that could be imposed on him and petitioned for the enforcement of the general principles of the law in his respect as these prescribe that this officer should not be deemed liable on grounds of occupying the position of regulatory compliance officer at the Bank.
In September and October 2010, the Bank was served with the resolutions adopted by the UIF whereby BBVA Francés and the Regulatory Compliance Officer were each ordered to pay a fine for an amount equivalent to one time the transactions objected.
On the basis of its legal advisors’ opinion, on October 28 and November 25, 2010, the Bank lodged with the Court of Appeals with Federal Jurisdiction over Contentious Administrative Matters a direct appeal against the UIF’s Resolutions in connection with the wire transfers for 9,174 and 39,393, respectively, in accordance with the provisions under Section 25 of Law Nr. 25,246.
Both the Bank’s Management and its legal advisors understand that these cases have been assessed on the basis of a duly timed analysis, following the internal procedures in place for these situations. Further, they understand that the Bank has duly applied in these two cases all current rules and regulations and that no adverse impact on the Bank’s financial position is expected in this respect.
As of December 31, 2012 and 2011, there are Bank assets, which are restricted as follows:
|
|
a)
|
The Government and Private Securities account includes 131,081 and 132,500, respectively, in bonds issued by the Argentine Government maturing in 2014, allocated to the guarantee required to act as custodian of investment securities related to Guarantee Fund for the Sustainability of the Pay-as-you-go System managed by the Argentine Republic.
|
|
|
b)
|
The Bank appropriated 37,122 and 37,524, respectively, in bonds issued by the Argentine Government maturing in 2014, to secure loans arranged under the Credit Global Program given by the Interamerican Development Bank (IDB).
|
|
|
c)
|
The Bank appropriated 139,895 and 33,063, respectively, in Guaranteed Bonds maturing in 2020, to secure loans granted by the so-called “Bicentennial Fund”.
|
|
|
d)
|
The Bank has also appropriated accounts, deposits and trusts for 652,822 and 441,836, respectively, as security for activities related to credit card operations, automated clearing houses, non-deliverable forwards and lawsuits.
|
|
|
e)
|
As of December 31, 2011, the Bank appropriated loan funds of its active portfolio in an amount of 1,722 to secure debts with the BCRA.
|
|
|
f)
|
BBVA Francés Valores Sociedad de Bolsa S.A. holds two shares of Mercado de Valores de Buenos Aires S.A, booked in the amount of 10,300 and 9,600 as of December 31, 2012 and 2011, respectively. These shares have been pledged in favor of “CHUBB Argentina de Seguros S.A.” in security of the contract this insurance company executed with Mercado de Valores de Buenos Aires S.A. to cover the latter’s guaranteeing any noncompliance of stock broking companies with their obligations.
|
The Bank is included in the Deposit Guarantee System established by Law 24,485, Regulatory Decrees Nr. 540/95, Nr. 1,292/96 and 1,127/98 and Communication “A” 2337 and BCRA's complementary regulations.
F-32
BBVA BANCO FRANCÉS S.A. AND SUBSIDIARIES
NOTES TO THE CONSOLIDATED FINANCIAL STATEMENTS
For the fiscal years ended December 31, 2012, 2011 and 2010
Stated in thousands of Pesos
Such law provided for the creation of the Company Seguros de Depósitos Sociedad Anónima (SEDESA) for purposes of managing the Deposit Guarantee Fund (DGF), whose shareholders, in accordance with the changes introduced by Decree Nr. 1,292/96, shall be the BCRA with one share as a minimum and the trustees of the trust created by the financial institutions in the proportion to be determined for each by the BCRA according to their contributions to the DGF.
That Company was incorporated in August 1995 and the Bank has a 10.5337% interest in its capital stock.
The Deposit Guarantee System, which is limited, compulsory and onerous, has been created for purposes of covering the bank deposit risks subsidiarily and complementarily to the deposit protection and privilege system established by the Financial Institutions Law.
The guarantee shall cover the repayment of principal disbursed plus interest accrued through the date of revoking of the authorization to operate or through the date of suspension of the institution through application of section 49 of the BCRA’s Charter provided that the latter had been adopted earlier than the former without exceeding the amount of pesos a hundred and twenty thousand. Regarding operations in the name of two or more people, the guarantee shall be prorated between the holders. In no event shall the total guarantee per person exceed the abovementioned amount, whatever the number of accounts and/or deposits.
|
10.1.
|
Financial Trusts
|
On January 5, 2001, the BCRA’s Board of Directors issued Resolution Nr. 19/01, providing for the exclusion of Mercobank S.A.’s senior liabilities under the terms of Section 35 bis of the Financial Institutions Law, the authorization to transfer the excluded assets to the Bank as trustee of the Diagonal Trust, and the authorization to transfer the excluded liabilities to beneficiary banks. Also, on the mentioned date, the agreement to set up the Diagonal Trust was subscribed by Mercobank S.A. as settle and the Bank as trustee in relation to the exclusion of assets as provided in the resolution abovementioned. As of December 31, 2012 and 2011, the assets of Diagonal Trust amount to 2,409 and 2,411, respectively, considering its recoverable value.
Besides, as of December 31, 2011 the Bank recorded the assets of Maginot Trust, whose book value amounts to 533. In addition, the Bank recorded the selected assets on account of the redemptions in kind of the Fideicomiso Corp Banca participation certificates for 4,176 and 4,173 as of December 31, 2012 and 2011, respectively.
Such amounts are recorded in memorandum debit accounts “For trustee activities – Funds in trust”.
|
10.2.
|
Non-Financial Trusts
|
The Bank acts as trustee in 22 non-financial trusts, and in no case being personally liable for the liabilities assumed in the performance of the contract obligations; such liabilities will be satisfied with and up to the full amount of the corpus assets and the proceeds therefrom. The non financial trusts concerned were set up to secure the receivables of several creditors (beneficiaries) and the trustee was entrusted the management, care, preservation and custody of the corpus assets until (i) the requirements to show the noncompliance with the obligations by the debtor (settler) vis-à-vis the creditors (beneficiaries) are met, moment at which such assets will be sold and the proceeds therefrom will be distributed (net of expenses) among all beneficiaries, the remainder (if any) being delivered to the settler, or (ii) all contract terms and conditions are complied with, in which case all the corpus assets will be returned to the settler or to whom it may indicate. The trust assets represent about 105,824 and 180,673 as of December 31, 2012 and 2011, respectively, consist of cash, creditors' rights, real estate and shares.
F-33
BBVA BANCO FRANCÉS S.A. AND SUBSIDIARIES
NOTES TO THE CONSOLIDATED FINANCIAL STATEMENTS
For the fiscal years ended December 31, 2012, 2011 and 2010
Stated in thousands of Pesos
On July 15, 2003, an Extraordinary Stockholders’ Meeting approved the setting up of a Program for the issuance and re-issuance of ordinary non-convertible Negotiable Obligations with ordinary guarantee, or such guarantees as may be decided by the Board of Directors, and unsecured Subordinated Negotiable Obligations, convertible or not into shares. During the life of the Program, which was 5 (five) years, it was be possible to issue and re-issue any number of series and/or classes of Negotiable Obligations as long as at all times the maximum amount in circulation after adding together all series and/or classes outstanding under the Program pending redemption does not exceed at any time US$ 300,000,000.
On April 26, 2007, the Ordinary and Extraordinary Stockholders’ Meeting delegated to the Board of Directors the authority to make certain amendments to the existing Negotiable Obligations Global Program such as: i) updating the Program so that it is governed by international terms and conditions, ii) existence of an international trustee in respect of one or more series representing the interests of investors, iii) drafting and execution of documentation in the English language and under foreign laws, including global and final securities, and payment agency, registrar, trust and underwriting agreements, as may be necessary, as well as the preparation of information documents for purposes of placement in international markets, including offering circulars and financial statements prepared in a foreign language.
In turn, the Ordinary and Extraordinary Stockholders’ Meeting held on March 28, 2008 decided to extend (i) for the term of 5 years the life of the Negotiable Obligations Global Program approved by the Extraordinary Stockholders’ Meeting held on July 15, 2003 and by Resolution Nr. 14967 of the CNV issued on November 29, 2004 in accordance with the changes introduced by the Ordinary and Extraordinary Stockholders’ Meeting held on April 26, 2007 and (ii) for the term of 2 years the delegation to the Board of Directors and the authority to sub-delegate the delegated powers in accordance with the applicable regulations approved by Ordinary and Extraordinary Stockholders’ Meeting held on April 26, 2007.
The Ordinary and Extraordinary Shareholders’ Meeting of BBVA Francés dated March 30, 2011 resolved that, considering the country’s favourable context in terms of national macroeconomics, as well as the conditions prevailing in international markets, and in particular, given the good growth prospects foreseen for the banking and financial industry, it was advisable to raise the maximum amount of the global note program from US$ 300,000,000 (or its equivalent in other currencies) to US$ 500,000,000 (or its equivalent in other currencies) outstanding at any time and to renew the delegation to the Board of all of the powers related to the Program and to the Corporate Bonds allowed to be issued under the Program.
On July 21, 2011, the CNV approved the increase in the maximum amount of the Negotiable Obligations Global Program pursuant to its Resolution Nr. 16,611.
As provided in the Negotiable Obligations Law and B.C.R.A.’s regulations, the proceeds could be applied to: (i) investments in physical assets located in Argentina; (ii) working capital in Argentina; (iii) refinancing of liabilities; (iv) capital contributions into BBVA Francés’ subsidiaries or related companies in so far as the proceeds of such contributions is, in turn, applied to the above-mentioned uses; and/or (v) lending, in so far as the borrowers apply the proceeds of such loans to the uses referred to in the preceding numerals of this paragraph in accordance with the rules laid down to that end by the B.C.R.A.
On June 23, 2011, the Board of BBVA Francés approved the issuance of Class 1 of its Corporate Bonds under the Program for a principal amount of up to $250,000,000. On September 13, 2011, the Bank issued its Corporate Bonds, which were fully subscribed and paid in for 185,193 for a term of 18 months, to be fully amortized at maturity and subject to a variable interest rate equivalent to the private Badlar rate plus a spread of a nominal 2.8% per annum, with quarterly interest payments. As to the use of the proceeds obtained from the issuance of the above-mentioned Class, they were applied to the grant of personal loans.
F-34
BBVA BANCO FRANCÉS S.A. AND SUBSIDIARIES
NOTES TO THE CONSOLIDATED FINANCIAL STATEMENTS
For the fiscal years ended December 31, 2012, 2011 and 2010
Stated in thousands of Pesos
On November 9, 2011, the Board of BBVA Francés approved the issuance of Class 2 of its Corporate Bonds under the Program for a principal amount of up to $200,000,000. On January 16, 2012, the Bank issued its Corporate Bonds, which were fully subscribed and paid in for 148,900 for a term of 18 months, to be fully amortized at maturity and subject to a variable interest rate equivalent to the private Badlar rate plus a spread of a nominal 2.44% per annum, with quarterly interest payments. As to the use of the proceeds obtained from the issuance of the above-mentioned Class, they were applied to the reimbursement of time deposits.
In view of the liquidity prevailing in financial markets and the growth experienced by the Bank’s assets in recent years, on March 26, 2012, BBVA Francés’s Ordinary and Extraordinary General Shareholders’ Meeting resolved to increase the maximum amount of the Corporate Bonds Program from US$ 500,000,000 (or its equivalent in other currencies) to US$ 750,000,000 (or its equivalent in other currencies) outstanding at any time.
On April 18, 2012, the Board of Directors of BBVA Francés approved the issuance of Class 3 of its Corporate bonds under the Program for a principal amount not in excess of $300,000,000. On September 7, 2012, placement of such Class 3 Corporate bonds was declared vacant.
On December 11, 2012, the Board of Directors of BBVA Francés approved the issuance of Class 4 of its Corporate bonds under the Program for a principal amount not in excess of $ 200,000,000.
As of December 31, 2012 and 2011, the outstanding principal and accrued interest amounts to 341,395 (in connection with Class 1 and 2 of the Negotiable Obligations) and 187,273 (in connection with Class 1 of the Negotiable Obligations), respectively.
|
|
§
|
Transactions as of December 31, 2012:
|
|
-
|
Interest rate swaps for 829,652 (Fixed Rate versus Badlar), maturing within a period not exceeding 2 years for which the Bank pays a variable amount in accordance with changes in the Badlar, Encuesta rate, and receives a fixed amount based on stated notional amounts.
|
These transactions have been valued in accordance with the mechanism described in Note 3.4.14.(i) generating the amount of 17,572 as income for the fiscal year.
The estimated market value of said instruments amounts to 8,546 (Asset). For market value estimation purposes, the variable and fixed as yet not matured future flows are discounted, with the swap value being the difference between the current value of the future flows receivable and the current value of the future flows payable.
As of the end of the fiscal year, the above transactions were recorded under “Memorandum Accounts - Debit Accounts – Derivatives – Interest rate swap” for 829,652.
|
-
|
Interest rate swap for 49,006 (Fixed Rate versus Badlar), with final maturity in September 2019, for which the Bank pays a variable amount in accordance with changes in the Badlar, Encuesta rate, and receives a fixed amount based on stated notional amounts.
|
Said transaction was consummated as hedge for potential volatility in the cash flows arising from certain financing deals attributable to changes in the designated benchmark interest rates and it has proven to be effective hedge for the risk mentioned.
The aim pursued by risk management consists in reducing exposure to changes in cash flows arising from financing deals. Thanks to the hedge established, changes in the cash flows arising from the underlying
F-35
BBVA BANCO FRANCÉS S.A. AND SUBSIDIARIES
NOTES TO THE CONSOLIDATED FINANCIAL STATEMENTS
For the fiscal years ended December 31, 2012, 2011 and 2010
Stated in thousands of Pesos
instrument caused by changes in the benchmark interest rate would decrease as a result of having been offset with the changes in the cash flows arising from the hedge instrument.
As of the end of the fiscal year the above transaction was recorded under “Memorandum Accounts - Debit Accounts –Derivatives – Interest rate SWAP” for 49,006.
|
-
|
Non-deliverable forward purchase and sale transactions in foreign currency and ratios payable in Pesos, maturing within a period not exceeding 1 year, for 3,452,819 and 2,865,678, which are recorded under “Memorandum Accounts - Debit Accounts - Derivatives – “Notional” amount of non-deliverable forward transactions”, and “Memorandum Accounts - Credit Accounts - Derivatives – “Notional” amount of non-deliverable forward transactions”, respectively.
|
These transactions have been valued in accordance with the mechanism described in Note 3.4.14.(ii), generating the amount of 58,806 as income for the fiscal year.
|
-
|
The Bank does not carry balances from transactions involving options outstanding as of December 31, 2012. However, the transactions conducted as of December 31, 2012 generating the amount of 255 as income for the fiscal year.
|
|
-
|
The Bank does not carry any balances associated to repos or reverse repos in force at December 31, 2012. However, the transactions conducted at December 31, 2012 have yielded a 68,782 income and a 1,485 loss, respectively, at the end of the fiscal year.
|
|
§
|
Transactions as of December 31, 2011:
|
|
-
|
Interest rate swaps for 467,600 (Fixed Rate versus Badlar), maturing within a period not exceeding 3 years for which the Bank pays a variable amount in accordance with changes in the Badlar, Encuesta rate, and receives a fixed amount based on stated notional amounts; and interest rate swaps for 29,000 (Badlar versus Fixed Rate), maturing within a period not exceeding 1 year for which the Bank pays a fixed amount, and receives a variable amount in accordance with changes in the Badlar.
|
These transactions have been valued in accordance with the mechanism described in Note 3.4.14.(i) generating the amount of 1,307 as income for the fiscal year.
The estimated market value of said instruments amounts to 13,712 (Liability). For market value estimation purposes, the variable and fixed as yet not matured future flows are discounted, with the swap value being the difference between the current value of the future flows receivable and the current value of the future flows payable.
As of the end of the fiscal year, the above transactions were recorded under “Memorandum Accounts - Debit Accounts – Derivatives – Interest rate swap” for 496,600.
|
-
|
Interest rate swap for 55,236 (Fixed Rate versus Badlar), with final maturity in September 2019, for which the Bank pays a variable amount in accordance with changes in the Badlar, Encuesta rate, and receives a fixed amount based on stated notional amounts.
|
Said transaction was consummated as hedge for potential volatility in the cash flows arising from certain financing deals attributable to changes in the designated benchmark interest rates and it has proven to be effective hedge for the risk mentioned.
The aim pursued by risk management consists in reducing exposure to changes in cash flows arising from financing deals. Thanks to the hedge established, changes in the cash flows arising from the underlying
F-36
BBVA BANCO FRANCÉS S.A. AND SUBSIDIARIES
NOTES TO THE CONSOLIDATED FINANCIAL STATEMENTS
For the fiscal years ended December 31, 2012, 2011 and 2010
Stated in thousands of Pesos
instrument caused by changes in the benchmark interest rate would decrease as a result of having been offset with the changes in the cash flows arising from the hedge instrument.
As of the end of the fiscal year the above transaction was recorded under “Memorandum Accounts - Debit Accounts –Derivatives – Interest rate SWAP” for 55,236.
|
-
|
Non-deliverable forward purchase and sale transactions in foreign currency and ratios payable in Pesos, maturing within a period not exceeding 1 year, for 3,588,570 and 3,419,241, which are recorded under “Memorandum Accounts - Debit Accounts - Derivatives – “Notional” amount of non-deliverable forward transactions”, and “Memorandum Accounts - Credit Accounts - Derivatives – “Notional” amount of non-deliverable forward transactions”, respectively.
|
These transactions have been valued in accordance with the mechanism described in Note 3.4.14.(ii.), generating the amount of 51,506 as income for the fiscal year.
|
-
|
Call options bought for 30,032 and call options written for 34,505 agreed as hedging for the Bank’s borrowing position in connection with term investments yielding variable income conducted by customers. Said transactions were recorded under “Memorandum Accounts - Debit Accounts – Derivatives – “Notional” amount of call options bought” for 30,032 and under “Memorandum Accounts - Credit Accounts - Derivatives – “Notional” amount of call options written” for 34,505.
|
These transactions have been valued in accordance with the description in Note 3.4.14. generating the amount of 458 as income for the fiscal year.
The Bank does not carry balances from put options in force as of the end of the fiscal year. This notwithstanding, the transactions conducted during the fiscal year have yielded 54 in loss.
|
-
|
Forward sales due to BCRA Bills repurchase agreements for 1,076,058, which are recorded under “Other liabilities from financial transactions – Instruments to be delivered for spot and forward sales to be settled”.
|
These transactions have been valued in accordance with the description in Note 3.4.8. generating the amount of 53,561 as income for the fiscal year.
|
-
|
Forward purchases due to BCRA Bills reverse repurchase agreements for 99,490, which are recorded under “Other receivables from financial transactions – Instruments to be received for spot and forward purchases to be settled”.
|
These transactions have been valued in accordance with the description in Note 3.4.8. generating 4,579 as loss for the fiscal year.
|
13.1.
|
Compliance with the requirements to act as agent in the over-the-counter market
|
As of December 31, 2012 and 2011, the Bank’s Stockholders’ Equity exceeds the minimum requested to act as agent in the over-the-counter market, according to Resolutions Nr. 368/01 and 489/06 of the CNV.
|
13.2.
|
Investment Funds custodian
|
As of December 31, 2012 and 2011, in its capacity of Investment Funds custodian of “FBA Acciones Globales”, “FBA Total”, “FBA Renta”, “FBA Renta Pesos”, “FBA Renta Dólares”, “FBA Bonos Latinoamericanos”, “FBA Calificado”, “FBA Internacional”, “FBA Ahorro Dólares”, “FBA Renta Fija”, “FBA Ahorro Pesos”, “FBA Renta Premium”, “FBA
F-37
BBVA BANCO FRANCÉS S.A. AND SUBSIDIARIES
NOTES TO THE CONSOLIDATED FINANCIAL STATEMENTS
For the fiscal years ended December 31, 2012, 2011 and 2010
Stated in thousands of Pesos
Europa”, “FBA Horizonte”, “FBA EEUU”, “FBA Renta Corto Plazo”, “FBA Acciones Latinoamericanas”, “FBA Bonos Argentina”, “FBA Brasil”, “FBA México”, “FBA Commodities”, “FBA Acciones Argentinas” and “FBA Bonos Globales” administrated by BBVA Francés Asset Management S.A. Sociedad Gerente de Fondos Comunes de Inversión, the Bank holds certificates of deposits, deferred payment checks, shares, corporate bonds, government securities, indexes, securities issued by the Argentine Central Bank, Cedears, ADRS and shares in mutual funds in safekeeping in the amount of 1,461,374 and 1,374,204, respectively, all of which making up the Fund’s portfolio and booked in “Memorandum Accounts - Debit Accounts -Control - Other”.
The Investment Funds’ equities are as follows:
|
December 31,
|
||||||||
|
Name of Mutual Fund
|
2012
|
2011
|
||||||
|
FBA Acciones Globales
|
53,791 | 56,616 | ||||||
|
FBA Total
|
19,087 | 16,017 | ||||||
|
FBA Renta
|
19,944 | 17,435 | ||||||
|
FBA Renta Pesos
|
1,497,666 | 1,228,914 | ||||||
|
FBA Renta Dólares
|
6,205 | 4,613 | ||||||
|
FBA Bonos Latinoamericanos
|
18,505 | 12,977 | ||||||
|
FBA Calificado
|
83,006 | 72,591 | ||||||
|
FBA Internacional
|
947 | 645 | ||||||
|
FBA Ahorro Dólares
|
14,745 | 11,671 | ||||||
|
FBA Renta Fija
|
20,456 | 18,566 | ||||||
|
FBA Ahorro Pesos
|
444,287 | 422,678 | ||||||
|
FBA Renta Premium
|
10,805 | 10,056 | ||||||
|
FBA Europa
|
6,732 | 2,926 | ||||||
|
FBA Horizonte
|
31,008 | 35,230 | ||||||
|
FBA EEUU
|
19,801 | 7,501 | ||||||
|
FBA Renta Corto Plazo
|
471 | 443 | ||||||
|
FBA Acciones Latinoamericanas
|
24,116 | 19,948 | ||||||
|
FBA Bonos Argentina
|
7,648 | 4,922 | ||||||
|
FBA Brasil
|
25,131 | 25,998 | ||||||
|
FBA México
|
92 | 62 | ||||||
|
FBA Commodities
|
66 | 58 | ||||||
|
FBA Acciones Argentinas
|
265 | 260 | ||||||
|
FBA Bonos Globales
|
88 | 79 | ||||||
|
Total
|
2,304,862 | 1,970,206 | ||||||
The Bank has in place an earnings distribution policy in line with the Bank’s vocation for sustained stockholder value, which at the same time allows the Bank’s financial condition to perform favourably so as to strive for business growth and the maintenance of consistently high liquidity and solvency standards in compliance with currently applicable rules and regulations.
Restriction on earnings distributions:
|
|
a)
|
In accordance with the provisions of BCRA, on April 9, 2013 the Bank’s Ordinary and Extraordinary Shareholders’ Meeting appropriated the amount of 252,736 currently included under Unappropriated earnings to the Legal Reserve.
|
|
|
b)
|
In accordance with Communications “A” 5072 and 5273, issued on May 6, 2010 and January 27, 2012, respectively, as amended and supplemented, of “Distribution of Income” of the BCRA, for purposes of calculating
|
F-38
BBVA BANCO FRANCÉS S.A. AND SUBSIDIARIES
NOTES TO THE CONSOLIDATED FINANCIAL STATEMENTS
For the fiscal years ended December 31, 2012, 2011 and 2010
Stated in thousands of Pesos
|
|
|
the earnings subject to distribution, off-balance sheet deductions must be performed from the sum of the balances recorded in the account Unappropriated retained earnings and in the Voluntary reserve for future distributions of income as set forth in point 2.1 of such Communication. In addition, the authorization of the Superintendent of Financial and Exchange Institutions shall be required in order to verify that the procedure established in said resolution for earnings distribution has been properly applied.
|
Law Nr. 26,425- Dissolution and liquidation of Consolidar A.F.J.P. S.A.:
Law Nro. 26,425, which came into force on December 4, 2008, mandated that the capitalization system that used to be an integral part of the Integrated Retirement and Pension System was to be suppressed and replaced by a single pay-as-you-go system that is now known as the Argentine Integrated Social Security System (SIPA in Spanish). As a consequence, Consolidar A.F.J.P. S.A. ceased to manage the funds held in the individual capitalization accounts opened by the members and beneficiaries of the Integrated Retirement and Pension System. Said funds were transferred to the Fund to Guarantee the Sustainability of the State-run Social Security System exactly as they had been invested and it is now the Argentine Social Security Authority (ANSES) the only and sole holder of said assets and funds.
Besides, on October 29, 2009, ANSES issued its Resolution Nr. 290/2009 whereby it granted a term of 30 working days to the pension fund managers that could be interested in re-converting their corporate purpose in order to manage the funds held as voluntary term deposits and as agreed-upon deposits in capitalization accounts for them to express their decision to do so.
Given the above situation and the inability of Consolidar A.F.J.P. S.A. to attain the corporate purpose and conduct the business for which it had been formed, on December 28, 2009, its Extraordinary General Unanimous Shareholders’ Meeting adopted the resolution to dissolve and subsequently liquidate Consolidar A.F.J.P. S.A. effective as of December 31, 2009 on the understanding that such will be the best alternative to safeguard the interests of both the creditors and the shareholders of the Company. In addition, as set forth in the Argentine Companies Law, the Shareholders’ Meeting decided to appoint Accountant Mr. Gabriel Orden and Mr. Rubén Lamandia to act as liquidators for of Consolidar A.F.J.P. S.A. As of December 31, 2009 these gentlemen have been designated as the Company’s legal representatives. As of the date of issuance of these consolidated financial statements, they are moving forward with all the actions necessary to proceed with the liquidation of Consolidar A.F.J.P. S.A.
On January 28, 2010, the dissolution of Consolidar A.F.J.P. S.A. as well as the list of designated liquidators were registered with the Supervisory Board of Companies (I.G.J.)
In addition, the Extraordinary General Shareholders’ Meeting of Consolidar A.F.J.P. S.A. approved a voluntary reduction in capital stock for 75,000 on October 19, 2009. In turn, the I.G.J. conferred its approval to the capital reduction mentioned on January 11, 2010. In this respect, on January 19, 2010 the shareholders were transferred their capital contributions in conformity with the above-mentioned reduction.
BBVA Francés, in its capacity as shareholder requested that Consolidar A.F.J.P. S.A. (undergoing liquidation proceedings) should file a note with the Argentine Ministry of Economy and Public Finance and with the Argentine Social Security Authority to commence discussions within the framework of Law Nr. 26,425 in order to identify one or more resolution alternatives in connection with the consequences resulting from the events caused by the enactment of that Law. This note was filed by Consolidar A.F.J.P. S.A. (undergoing liquidation proceedings) on June 11, 2010.
In turn, on December 7, 2010, Consolidar A.F.J.P. S.A. (undergoing liquidation proceedings) filed an action for damages against the National State and the Ministry of Labor, Employment and Social Security with the court of original Federal Jurisdiction over Contentious Administrative Matters Nr. 4, Clerk of Court’s Office Nr. 7, case file Nr. 40,437/2010. The complaint was ratified by BBVA Francés in its capacity as majority shareholder in that Company. On July 15, 2011, Consolidar A.F.J.P. S.A. (undergoing liquidation proceedings) and BBVA Francés filed with the same
F-39
BBVA BANCO FRANCÉS S.A. AND SUBSIDIARIES
NOTES TO THE CONSOLIDATED FINANCIAL STATEMENTS
For the fiscal years ended December 31, 2012, 2011 and 2010
Stated in thousands of Pesos
court an enhanced complaint for determining the amounts claimed as damages. On March 9, 2012, the Court ordered the service of process on the National State. On November 23, 2012, the Court handed down a resolution demanding the production of evidence within a term of forty days, although this ruling is not yet final.
In addition, on April 12, 2011, the Supreme Court of Justice of Argentina affirmed the judgment passed by the court of original Federal Jurisdiction over Contentious Administrative Matters in favour of Consolidar A.F.J.P. S.A. (undergoing liquidation proceedings) in connection with the claim for recovery asserted against the tax authorities (AFIP) for the 12,475 in excess of the income tax charge for fiscal 2002 paid by the plaintiff by reason of not having applied the inflation adjustment for tax purposes. As Consolidar A.F.J.P. S.A. (undergoing liquidation proceedings) is undergoing liquidation proceedings, in order to advance the collection of the receivable arising from the judgment, on June 29, 2011 Consolidar A.F.J.P. S.A. (undergoing liquidation proceedings) executed an assignment for valuable consideration of all of the rights to which Consolidar A.F.J.P. S.A. (undergoing liquidation proceedings) was entitled in the framework of this legal action to BBVA Francés.
The breakdown of balances in the “Minority interest in subsidiaries” account is as follow:
|
December 31,
|
||||||||
|
2012
|
2011
|
|||||||
|
Consolidar Administradora de Fondos de Jubilaciones y Pensiones S.A. (undergoing liquidation proceedings)
|
7,677 | 9,356 | ||||||
|
BBVA Francés Valores Sociedad de Bolsa S.A.
|
475 | 686 | ||||||
|
PSA Finance Argentina Cía. Financiera S.A.
|
109,736 | 71,946 | ||||||
|
BBVA Francés Asset Management S.A. Sociedad Gerente de Fondos Comunes de Inversión
|
93 | 121 | ||||||
| 117,981 | 82,109 | |||||||
The following are the items computed for compliance with Minimum Cash Requirements according to the regulations of the BCRA, with their corresponding balances as of December 31, 2012:
|
COMPUTABLE COMPLIANCE IN PESOS
|
||||
|
Special Guarantee Accounts
|
196,569 | |||
|
BCRA Checking Account
|
5,088,865 | |||
|
Franchises
|
115,436 | |||
|
TOTAL
|
5,400,870 | |||
|
COMPUTABLE COMPLIANCE IN US DOLLARS (Stated in thousands of Pesos)
|
||||
|
Special Guarantee Accounts
|
19,942 | |||
|
BCRA Checking Account
|
1,459,120 | |||
|
TOTAL
|
1,479,062 | |||
F-40
BBVA BANCO FRANCÉS S.A. AND SUBSIDIARIES
NOTES TO THE CONSOLIDATED FINANCIAL STATEMENTS
For the fiscal years ended December 31, 2012, 2011 and 2010
Stated in thousands of Pesos
|
COMPUTABLE COMPLIANCE IN EUROS (Stated in thousands of Pesos)
|
||||
|
BCRA Checking Account
|
32,813 | |||
|
TOTAL
|
32,813 | |||
The Risk Department comprises units specializing in each class of risk (credit, financial and operational risk) that work alongside cross-sectional control units: Global Management and Technical area and Internal Control.
The following is a description of the comprehensive policies and processes for identifying, assessing, controlling and mitigating all risks: credit, financial and operational.
|
|
a)
|
Credit Risk
|
The Risk Department is made up by the following divisions: Retail Banking, Enterprise and Wholesale Banking and Recoveries. Within the purview of the Retail Banking and the Enterprise and Wholesale Banking divisions, there are the areas in charge of Admission, Follow-Up, Policies and Tools. In turn, the Recoveries division includes areas specializing in severity mitigation, further split into judicial recovery and non-judicial recovery.
Approvals are processed by virtue of the loan-granting powers conferred upon the positions responsible for Admission and the Risk Management Committee. In addition, the commercial areas rely on a smaller number of delegated loan-granting powers in order to streamline minor transactions. These powers are also arranged by ratings and amounts.
Any exceptions to the policies currently in force are dealt with by the Risk Management Committee.
The assessment methodology is based on internally designed scoring and rating models applied to the Retail Banking and Enterprise and Wholesale Banking portfolios management, respectively. The application of this methodology leads to the calculation of the likelihood of default and in addition, to a historical control over expected losses and over the degree of severity of such losses in each portfolio. The scoring and rating tools are re-estimated periodically.
The following are some of the aspects taken into account upon subjecting customers to a credit assessment:
|
|
-
|
Verify the client sufficient income-generation sources and an adequate financial structure to face the commitments to repay principal and interest of the owned receivables within the terms agreed.
|
|
|
-
|
Adequate and sufficient guarantees must to allow the loans recovery.
|
|
|
-
|
Adequate knowledge of the client so that the decision-making officials are sufficiently confident and secure when they decide to grant the loan.
|
|
|
-
|
Balance and correlation between the use of the proceeds, the amount, the term and the manner to repay the loan based on the client´s generation of resources and the guarantees.
|
|
|
-
|
The activities carried on by the client must be identified so that the client can be assigned to the appropriate classification of sectors of the economy assessing its positioning and growth expectations.
|
|
|
-
|
Permanent consulting for hints of junctures in the policies currently in force in each sector for an adequate response in line with the general investment or divestiture guidelines in a sector or sub-sector of the economy, amongst others.
|
F-41
BBVA BANCO FRANCÉS S.A. AND SUBSIDIARIES
NOTES TO THE CONSOLIDATED FINANCIAL STATEMENTS
For the fiscal years ended December 31, 2012, 2011 and 2010
Stated in thousands of Pesos
|
|
b)
|
Financial Risk
|
The Financial Risk Area which reports to the Risk Division, is the unit responsible for identifying, assessing and controlling the market, structural and liquidity risks.
Market Risks is in charge of the following:
|
|
-
|
Identifying the business units within the Bank that carry out transactions entailing market risks, which should thus be included in the corporate applications of measurement and control risk.
|
|
|
-
|
Monitor on a daily basis compliance with the risk limits and policies of the business units.
|
|
|
-
|
Determine, on a daily basis, the market variables that will be used in the valuation of the Treasury positions and by the Committee of Assets and Liabilities (COAP).
|
|
|
-
|
Determine the calculation of the credit exposure of the Treasury client counterparts (Credit Risk in the Market Desk).
|
The most complex approach, adopted as a standard measurement tool, is the Value at Risk (VaR) which provides a 99% confidence level at 1-day and 10-day parameters.
Policies are implemented through a limit structure, in terms of daily, monthly and annual VaR and Stop Loss measures.
On an annual basis, a proposal is prepared for the authorization of market risk limits together with the Treasury Department. This standard sets forth the identity of the officials who have the maximum control responsibilities and decision-making attributes concerning the limits and contingency plans to be implemented if such limits were surpassed.
The utility of the VaR model is fine-tuned through backtesting and stresstesting techniques.
Although the Financial Division is responsible for managing the structural risks at the Bank, which risks also include the liquidity risk, the Market Risk Area, in its position as independent business unit and responsible for management actions, is empowered to approve, follow up (measure) and control the methodologies, the limits and the alerts that the areas involved may propose and consume in order to adequately manage the structural and liquidity risk.
Both the structural risk and the liquidity risk are monitored through a number of specific quantitative and qualitative limits and alerts, which are followed up on a daily basis by the Market Risk Area.
As regards liquidity risk, crisis are identified by the three areas of the Technical Liquidity Group (GTL, with the areas in charge of following up on crises being the Market Risk Area, Financial Management and Markets) and as soon as any of these areas detects a crisis, it must report it to the other management areas above mentioned.
The Market Risk Area obtains the flows of collections and payments, prepares the daily liquidity map, proposes the limits and alert alarms and prepares and distributes the appropriate reports for the evolution of liquidity to the internal areas of the Risk Division and to the top executives of BBVA Francés.
Liquidity risks are monitored using three models: Short-term liquidity, Medium-term liquidity and Stress-liquidity. This model is based on the study of past crisis and it is used as a basis to generate the contingency plan.
The aim of the Contingency Plan is no other than to be in the best position to face liquidity problems, to foresee potential crisis situations, both at the Bank level and in the markets which may arise for the Bank in the future.
F-42
BBVA BANCO FRANCÉS S.A. AND SUBSIDIARIES
NOTES TO THE CONSOLIDATED FINANCIAL STATEMENTS
For the fiscal years ended December 31, 2012, 2011 and 2010
Stated in thousands of Pesos
As regards structural risk, defined as any alteration sustained by the financial margin and/or the equity value of an entity arising from variations in interest rates, an analysis of five sensitivities is used to monitor these two risks:
|
|
-
|
SMF: Sensitivity to the Financial Margin in the event of +/-100bps variations in interest rates;
|
|
|
-
|
SVE: Sensitivity to the Equity Value in the event of +/-100bps variations in interest rates;
|
|
|
-
|
SVE COAP: Sensitivity to the Equity Value of the COAP portfolio in the event of +/-100bps variations in interest rates;
|
|
|
-
|
MeR: Margin at Risk, understood as the maximum unfavourable departure from the financial margin projected for a pre-determined level of confidence; and
|
|
|
-
|
CE: calculation of the Equity Capital of the Bank, consisting in an estimate of the unexpected losses that could be incurred in the various risk activities carried out, in other words, the maximum losses that could be sustained with a given level of confidence.
|
|
|
c)
|
Operational Risk
|
The Validation and Internal Control area, which reports to the Internal Control and New Products division, is charged with the implementation and maintenance of a model to identify, value, follow up on, check and mitigate operational risk. This model revolves around a methodology based on BCRA’s provisions currently in force (Communications “A” 4793 and “A” 5203) and on international standards (COSO and Basel) and specific computerized tools that support the model.
Operational risk is identified and quantified by the Ev-Ro tool. To support the follow-up function and the dynamical controls over the efficacy of the mitigation measures in place, the Trans-VaR tool is used. There is also a loss history database segmented by business areas and class of risk known as SIRO database. All these tools are working properly and the degree of implementation is optimum.
Through the Internal Control and Operational Risk model, the Bank is able to:
|
|
-
|
Assess the degree of mitigation activity implemented in the various areas
|
|
|
-
|
Verify that the measures have been adopted in accordance with priority criteria for the mitigation of risk factors.
|
|
|
-
|
Ensure that the contingency plans and service continuity defined by the various business units or supporting areas have been properly implemented and updated to reduce the risk of certain high-impact risk factors.
|
F-43
BBVA BANCO FRANCÉS S.A. AND SUBSIDIARIES
NOTES TO THE CONSOLIDATED FINANCIAL STATEMENTS
For the fiscal years ended December 31, 2012, 2011 and 2010
Stated in thousands of Pesos
The balances as of December 31, 2012 and 2011 for transactions performed with parents and affiliates are as follows:
|
Balance Sheet
|
||||||||||||||||||||||||
|
Assets
|
Liabilities
|
Memorandum Accounts
(1)
|
||||||||||||||||||||||
|
Company
|
2012
|
2011
|
2012
|
2011
|
2012
|
2011
|
||||||||||||||||||
|
BBVA S.A.
|
41,904 | 12,537 | 27,174 | 16,327 | 103,742 | 252,634 | ||||||||||||||||||
|
Consolidar A.R.T. S.A.
(2)
|
— | 140 | — | 257,765 | — | 23,424 | ||||||||||||||||||
|
BBVA Consolidar Seguros S.A.
|
14,380 | 12,238 | 25,996 | 3,721 | — | — | ||||||||||||||||||
|
Rombo Cía. Financiera S.A.
|
735,300 | 564,341 | 1,623 | 30,803 | 330,725 | 224,000 | ||||||||||||||||||
|
Inversora Otar S.A.
(3)
|
— | 5,235 | — | 910 | — | 400,761 | ||||||||||||||||||
|
(1)
|
Includes items in safekeeping, Credit lines granted (unused portion) covered by debtor classification regulations, Guaranties given covered by debtor classification regulations and derivates transactions.
|
|
(2)
|
See Note 1.5.
|
|
(3)
|
See Note 1.6.
|
Additionally loans were granted to Key Management Personnel
by 5,330 and 3,778 as of December 31, 2012 and 2011, respectively.
The net income as of December 31, 2012, 2011 and 2010, for transactions performed with parents, subsidiaries and affiliates are as follows:
|
Net income
(1)
|
||||||||||||
|
2012
|
2011
|
2010
|
||||||||||
|
Income
|
262,671 | 177,134 | 121,613 | |||||||||
|
Expenses
|
(46,104 | ) | (18,775 | ) | (18,851 | ) | ||||||
| 216,567 | 158,359 | 102,762 | ||||||||||
| ___________________ | ||||||||||||
|
(1)
All the concerted operations have been contracted according with market’s conditions.
|
||||||||||||
|
|
§
|
THE BOARD OF DIRECTORS
|
The By-laws of BBVA Francés prescribe that the Bank shall be managed by a Board of Directors made up by a minimum number of three and a maximum number of nine directors, as established by the Ordinary General Shareholders’ Meeting when appropriate. Directors shall serve on the Board for three-year terms and they may be re-elected (the “Board of Directors”). The Bank’s Shareholders’ Meeting may designate alternate directors in an equal or lower number. The Board of Directors must meet at least once a month.
The proposed board membership shall be subject to a previous evaluation by the Nominations and Remunerations Committee.
The table below indicates the names of the members of our Board of Directors, their present position in the company and their business background.
F-44
BBVA BANCO FRANCÉS S.A. AND SUBSIDIARIES
NOTES TO THE CONSOLIDATED FINANCIAL STATEMENTS
For the fiscal years ended December 31, 2012, 2011 and 2010
Stated in thousands of Pesos
|
Name
|
Current Position
|
Background and Work Experience
|
||
|
Jorge Carlos Bledel
|
Chairman
|
Business experience:
Vice Chairman, BBVA Francés Valores Sociedad de Bolsa S.A. (“Francés Valores”); Director, Credilogros Compañía Financiera S.A.; Credit Manager, Banco del Interior y Buenos Aires; Business Manager, Corporación Metropolitana de Finanzas; Financial Manager, BBVA Francés; Wholesale Banking Director, BBVA Francés and Retail Banking Director, BBVA Francés.
Jorge Carlos Bledel is not an independent director in the terms of General Resolution Nr. 368 (as per its new wording dating back to 2001).
|
||
|
José Manuel Tamayo Pérez
|
Vice Chairman
|
Business experience:
Retail Banking Director, BBVA Francés; Marketing Director for Spain and Portugal, BBVA.
José Manuel Tamayo Pérez meets the independence criteria to be considered as an independent director within the meaning of General Resolution Nr. 368 (as per its new wording dating back to 2001).
|
||
|
Marcelo Gustavo Canestri
|
Regular Director
|
Business experience:
Corporate Assistant Manager, BBVA Francés; Wholesale Banking Assistant Manager, BBVA Francés; Asset Management Director, BBVA Francés and Financial Director, BBVA Francés.
Marcelo Gustavo Canestri is an independent director in the terms of General Resolution Nr. 368 (as per its new wording dating back to 2001).
|
||
|
Mario Luis Vicens
|
Regular Director
|
Business experience
: Executive Chairman, Asociación de Bancos de la Argentina ABA; Regular Director, Seguros de Depósitos S.A. SEDESA; Regular Director, Federación Latinoamericana de Bancos Felaban; Regular Director, Banco Sudameris S.A.; Regular Director, Banco Central de la República Argentina; Planning Assistant Manager and Deputy General Manager, Banco de Crédito Argentino S.A.; Chief Economist – Head of Department, Banco Central de la República Argentina.
Mario Vicens is an independent director in the terms of General Resolution Nr. 368 (as per its new wording dating back to 2001).
|
||
|
Oscar Miguel Castro
|
Regular Director
|
Business experience
: Executive member of the Committee of Financial Services, Arthur Andersen Worldwide; Partner in charge of Financial Services Division, Arthur Andersen Latin America and Argentina; International Partner, Arthur Andersen.
Oscar Miguel Castro is an independent director in the terms of General Resolution Nr. 368 (as per its new wording dating back to 2001).
|
|
Luis Bernardo Juango Fitero
|
Regular Director
|
Business experience:
President, BBVA S.A. Colombia; Regional Director, BBVA.
Luis Bernardo Juango Fitero is an independent director in the terms of General Resolution Nr. 368 (as per its new wording dating back to 2001).
|
|
|
§
|
SENIOR MANAGEMENT
|
Senior Management is made up by the General Manager and by those executive officers who have decision-making powers and who report directly to the General Manager.
The officers in Senior Management positions must have the skills and experience required by the financial industry to run the business with which they are entrusted and to oversee as appropriate the personnel in the various areas.
F-45
BBVA BANCO FRANCÉS S.A. AND SUBSIDIARIES
NOTES TO THE CONSOLIDATED FINANCIAL STATEMENTS
For the fiscal years ended December 31, 2012, 2011 and 2010
Stated in thousands of Pesos
|
|
§
|
MANAGEMENT COMMITTEE - MEMBERSHIP
|
The main members of Senior Management make up the Management Committee. The Committee is chaired by the Executive Director or General Manager.
Prospective Management Committee members shall first be evaluated by the Nominations and Remunerations Committee for subsequent consideration by the Board.
Powers
The Management Committee shall have the following powers, and, when appropriate, it shall be required to submit matters to consideration by the Board for final decision.
|
|
-
|
Implement the strategies and policies approved by the Board.
|
|
|
-
|
Evaluate and propose business and investment strategies and general risk policies.
|
|
|
-
|
Develop the processes necessary to identify, assess, monitor and mitigate the risks to which the Bank is exposed to.
|
|
|
-
|
Implement appropriate internal control systems and monitor their effectiveness, periodically reporting to the Board on the attainment of objectives. Establish business synergies with the remaining Group companies.
|
|
|
-
|
Propose the delegation of powers to the Entity’s officers. Supervise the managers in the various areas to make sure that they comply with the policies and procedures set forth by the Board.
|
|
|
-
|
Evaluate and propose Entity-wide policies, strategies and guidelines and then oversee and follow up on model implementation.
|
The following table identifies the members of the Management Committee and provides certain details about their business experience. The highest-ranking officers are designated for unlimited periods.
|
Name
|
Current Position
|
Background and Work Experience
|
||
|
Ricardo Enrique Moreno
|
Executive Director
|
Consultant, specialized in financial branch and capital markets, Andersen Consulting; Systems Manager, Banco de Crédito; Director of Media, CEO of Unofirst Latin America, COO Global, BBVA; Director of Transformation and Productivity BBVA.
|
||
|
Ignacio Sanz y Arcelus
|
Director, Finance and Planning.
|
Finance Area – Technology and Operations, BBVA; Director of the Department of Assets and Liabilities Management for Latin America, BBVA; Director of the Investment Banking Comptroller’s Office (Treasury, Capital Markets, Intermediation, Corporate, Structured Financing), BBVA; Corporate Director, BBVA; Director of the Treasury, Capital Markets and International Network area, BEX Argentaria BBVA; Director of the Market Risk Audit Unit, BEX Argentaria BBVA; Director of Central Services Audit, BEX; Director of Planning, Intervention and Control, SERFINBEX; Director, BEX Argentaria BBVA; Team Leader at Arthur Andersen Auditores S.A.
|
||
|
Juan Alberto
Estrada
|
Director,
Corporate and Investment Banking
|
Assets Management Area, BBVA Francés; Head of the Trading Area, BBVA Francés; Director of Global Markets, BBVA Francés; Director of Wholesale Banking and Asset Management, BBVA Francés.
|
F-46
BBVA BANCO FRANCÉS S.A. AND SUBSIDIARIES
NOTES TO THE CONSOLIDATED FINANCIAL STATEMENTS
For the fiscal years ended December 31, 2012, 2011 and 2010
Stated in thousands of Pesos
|
Name
|
Current Position
|
Background and Work Experience
|
||
|
Martín
Ezequiel Zarich
|
Director, Innovation and Development
|
Alternate Director, BBVA Francés; Regular Director, BBVA Seguros; Economist, Banco de Crédito Argentino; Management Control and Budget Manager, Banco de Crédito Argentino; Planning Director, Banco de Crédito Argentino; Merger Director, BBVA Banco Francés; Planning Director, BBVA Francés; Financial Director, BBVA Francés; Retail Banking Director, BBVA Francés; Director, Credilogros; Director, BBVA Banco Francés Uruguay; Director, BBVA Banco Francés Cayman Ltd.; Deputy General Director, Business Development BBVA Group.
|
||
|
Gabriel
Milstein
|
Director, Human Resources, Procurement, Real Estate, General Services and Safety
|
Organization Manager, BBVA Francés.
|
||
|
Jorge Gustavo Allen
|
Director, Enterprise Banking
|
Goods and Services Manager, BBVA Francés; Logistics Director, BBVA Francés; President, BBVA Consolidar Seguros S.A.; Territorial Director, BBVA Francés.
|
||
|
Jorge Delfín Luna
|
Director, Retail Banking
|
Regional Manager, Citibank Branch, Citicorp; Regional Manager of Local Branches, Banco de Crédito Argentino; General Manager, Easy-Bank (BBVA Francés); General Manager and Vicepresident, BBVA Banco Uruguay; Companies Banking Manager, BBVA Francés.
|
||
|
Gustavo Osvaldo Fernández
|
Director, Technology and Operations
|
Coordinator, Systems and Organizations, Banca Nazionale del Lavoro; Systems Coordinator, Banco Galicia; Manager of Organization and Systems Development, Banco de Crédito Argentino; Design and Development Manager, BBVA Francés; Media Director, BBVA Francés; Director of Design and Development América, BBVA; Business Partner America, BBVA.
|
||
|
Adriana Fernández de Melero
|
Director, Corporate Development and Transformation
|
Credits Recovery Analyst, Banco Español; Financial Analyst, Banco Español; Financial Profitability and Planning Analyst, Banco Español; Planning and Management Control Analyst, Banco de Crédito Argentino; Head of Budget, Planning and Management Control, Banco de Crédito Argentino; Leader of Reengineering Project, Banco de Crédito Argentino; Human Resources Development and Planning Manager, Banco de Crédito Argentino; Manager of Human Resources Management, BBVA Francés; Manager of Structures and Projects, BBVA Francés; Organization Manager, BBVA Francés; Commercial Development and Channels Manager, BBVA Francés.
|
||
|
Juan Eugenio Rogero González
|
Director, Risks
|
Branch Director Corporate Banking, BBVA; Risks and Corporate Director, BBVA Puerto Rico; Insurances Development Director, BBVA America and Global Director of Corporate Risks Control, BBVA; Risks Director, BBVA Francés; Corporate Polices and Wholesale Portfolios Director, BBVA.
|
|
|
§
|
BBVA FRANCES’s OWNERSHIP STRUCTURE
|
Major Shareholders
The following table sets forth certain information regarding the beneficial ownership of our ordinary shares as of December 31, 2012, by each person who, to our knowledge, owns beneficially more than 5% of our ordinary shares. These persons do not have different voting rights.
F-47
BBVA BANCO FRANCÉS S.A. AND SUBSIDIARIES
NOTES TO THE CONSOLIDATED FINANCIAL STATEMENTS
For the fiscal years ended December 31, 2012, 2011 and 2010
Stated in thousands of Pesos
|
Ordinary Shares Beneficially Owned At December 31, 2012
|
||||||||
|
Beneficial Owner
|
Number of Shares
|
Percentage of Shares Outstandings
|
||||||
|
Banco Bilbao Vizcaya Argentaria
|
244,870,968 | 45.61 | ||||||
|
BBV America SL
(1)
|
160,061,858 | 29.81 | ||||||
|
The Bank of New York Mellon
(2)
|
42,640,950 | 7.94 | ||||||
|
Administración Nacional de Seguridad Social
|
42,439,494 | 7.90 | ||||||
________________
|
|
(1)
|
BBV América S.L. is under the control of BBVA. It has an effective 20.90% ownership interest in the capital stock of BBVA Francés and has an indirect 8.91% ownership interest in Inversora Otar S.A. following the merger by absorption mentioned in Note 1.6.
|
|
|
(2)
|
As holder agent of ADSs.
|
|
|
§
|
ORGANIZATIONAL STRUCTURE
|

F-48
BBVA BANCO FRANCÉS S.A. AND SUBSIDIARIES
NOTES TO THE CONSOLIDATED FINANCIAL STATEMENTS
For the fiscal years ended December 31, 2012, 2011 and 2010
Stated in thousands of Pesos
|
|
§
|
COMITTEES OF THE BOARD OF DIRECTORS
|
|
|
a)
|
AUDIT COMITEE – DECREE 677/01 (C.N.V./S.E.C.)
|
BBVA Francés’s Audit Committee (C.N.V./S.E.C.) is a multiple-member body, with a majority of directors who meet the independence criteria of Decree 677/01. Its purpose is to assist the Board of Directors in the assessment of the External Auditor’s function and independence and to perform the internal control function at the Bank.
|
|
b)
|
NOMINATIONS AND REMUNERATIONS COMMITTEE
|
BBVA Francés’ Nominations and Remunerations Committee is a non-executive body whose purpose consists in assisting the Board on matters concerning the Bank’s remuneration and benefit policies. Furthermore, the Nominations and Remunerations Committee is the body entrusted with the establishment of the standards and procedures governing the recruitment and training of Board members, Executive and other officers, and top-ranked personnel.
The Nominations and Remunerations Committee is made up by three non-executive directors, the majority of whom are independent, designated by the Board of Directors.
|
|
c)
|
INTERNAL AUDIT COMMITTEE (B.C.R.A.)
|
BBVA Francés’s Internal Audit Committee is made up by the officers appointed by the Board of Directors. This committee must have at least two members and at least one member must be an independent director. The operation of this committee shall be governed by the rules of the B.C.R.A. and by internal regulations.
The Board must use the conclusions of the internal audit timely and efficaciously and foster the internal auditor’s independence vis-à-vis the areas and processes controlled by said audit.
|
|
d)
|
COMMITTEE FOR THE PREVENTION OF ASSET LAUNDERING AND TERRORISM FINANCING
|
This Committee is made up by two Regular Directors and the officer in charge of the Anti-Money Laundering area.
The functions of the Committee consist mainly in:
|
|
-
|
Establishing guidelines and continuously reviewing the degree of progress with each action.
|
|
|
-
|
Filing reports with the competent authorities concerning the so-called “unusual or suspicious” transactions, or, either, deciding to disregard them when appropriate.
|
|
|
-
|
Evaluating the potential risk of asset laundering in the new products and/or services.
|
|
|
-
|
Raising awareness in their areas about the importance of preventing asset laundering and terrorism financing.
|
|
|
e)
|
COMPUTER TECHNOLOGY COMMITTEE
|
This Committee is made up by the Director of Technology and Operations and other executives of the Technology and Operations, Innovation and Development area.
The main duties of the IT Committee are:
F-49
BBVA BANCO FRANCÉS S.A. AND SUBSIDIARIES
NOTES TO THE CONSOLIDATED FINANCIAL STATEMENTS
For the fiscal years ended December 31, 2012, 2011 and 2010
Stated in thousands of Pesos
|
|
-
|
To oversee the proper operation of the IT environment and to contribute to an improvement in its efficiency.
|
|
|
-
|
To approve the Information Technology and Systems Plan and to assess it from time to time to review degree of completion.
|
|
|
§
|
OTHER COMMITTEES
|
|
|
a)
|
Risk Management Committee
|
This Committee is made up by the Executive Director, the Risk Director and various officers from the office of the Risk Director.
This Committee is the highest-ranking executive authority when it comes to decisions about risks in Argentina. The main functions of the Risk Committee are to rate customers or conglomerates when the amounts at stake exceed the loan-granting powers delegated to the Risk Units.
This Committee shall be principally entrusted with making the decisions and/or evaluations that exceed individual lending powers for the amounts established as well as those transactions that are specifically delegated to the Committee by reason of their exposure to risk.
|
|
b)
|
Corporate Assurance Committee
|
At its meeting held on January 25, 2013, the Bank’s Board of Directors approved the creation of the Corporate Assurance Committee and the establishment of its duties. This Committee shall begin sessions in 2013.
The Corporate Assurance Committee is made up by the Internal Audit Director and the Management Committee members.
The Corporate Assurance Committee has been entrusted with furthering an attitude of comprehensive risk management vis-à-vis the Group’s most relevant risks by structuring and prioritizing any identified weaknesses and allocating responsibility for defining and deploying mitigation plans as necessary. The aim pursued by the Committee is continuous improvement in the Group’s control environment.
|
|
c)
|
Disclosure Committee
|
This Committee is made up by an Independent Director, the Finance and Planning Director, the Legal Services Director and other officers from the Finance area.
It is basically entrusted with ensuring that the information relayed to the Bank’s shareholders, the markets where the Bank’s shares are listed and such markets’ regulatory authorities should be truthful and complete, reflect fairly the Bank’s financial condition and the results of operations and that it should be communicated with the formalities and within the terms mandated by applicable laws, the general principles governing market operation and good corporate governance.
|
|
d)
|
Human Resources Committee
|
It is made up by the Executive Director or General Manager and by the Directors of Human Resources, Procurement, Real Estate, General Services and Safety, Corporate Development and Transformation and the Finance and Planning Area.
The main functions of the Human Resources Committee are to:
F-50
BBVA BANCO FRANCÉS S.A. AND SUBSIDIARIES
NOTES TO THE CONSOLIDATED FINANCIAL STATEMENTS
For the fiscal years ended December 31, 2012, 2011 and 2010
Stated in thousands of Pesos
|
|
-
|
establish the structure of the organizational chart.
|
|
|
-
|
approve promotions to managerial positions.
|
|
|
-
|
define the guidelines governing human resources policies.
|
|
|
-
|
establish remuneration and incentive criteria.
|
|
|
-
|
evaluate benefits to personnel.
|
|
|
-
|
establish career and training plans.
|
|
|
e)
|
Corporate Integrity Committee
|
This Committee is made up by the following directors: Corporate Development and Transformation, Legal Services, Audit, Human Resources, Procurement, Real Estate, General Services and Safety directors, together with the directors of the different business areas and with the Technology and Operations director.
The Corporate Integrity Committee is basically entrusted with:
|
|
-
|
Fostering the adoption of the measures necessary to hand down decisions concerning all those ethically objectionable actions of which any of the members of the Corporate Integrity Committee may become aware in the discharge of his duties or by reason of having received notice.
|
|
|
-
|
Settling those situations in which the interests of BBVA Francés and Group companies in Argentina conflict with those of their clients.
|
|
|
§
|
THE SUBSIDIARIES OF BBVA FRANCÉS
|
The main subsidiaries and affiliates of BBVA Francés are:
|
|
1)
|
BBVA Francés Valores Sociedad de Bolsa S.A. engaged in securities trading at the Buenos Aires Stock Exchange.
|
|
|
2)
|
BBVA Francés Asset Management S.A. Sociedad Gerente de Fondos Comunes de Inversión: the corporate purpose of this mutual fund manager is to run and manage Mutual Funds in accordance with Section 3 of Law Nr. 24,083 as subsequently amended by Laws Nr. 24,441 and 24,781.
|
|
|
3)
|
PSA Finance Argentina Compañía Financiera S.A. whose corporate purpose consists in financing the acquisition of new and second-hand Peugeot and Citroën vehicles through pledge loans, leasing agreements and other financial products and in supplying services associated to the purchase, maintenance and insurance coverage of motor vehicles.
|
|
|
4)
|
Consolidar AFJP S.A. (undergoing liquidation proceedings), see Note 4 to the Consolidated Financial Statements of BBVA Francés as of December 31, 2012.
|
|
|
5)
|
Rombo Compañía Financiera S.A. whose corporate purpose is to finance the acquisition of new and second-hand Renault and Nissan through pledge loans, leasing agreements and other financial products and in supplying services associated to the purchase, maintenance and insurance coverage of motor vehicles.
|
F-51
BBVA BANCO FRANCÉS S.A. AND SUBSIDIARIES
NOTES TO THE CONSOLIDATED FINANCIAL STATEMENTS
For the fiscal years ended December 31, 2012, 2011 and 2010
Stated in thousands of Pesos
|
|
6)
|
BBVA Consolidar Seguros S.A.. This insurance carrier operates in the following lines of business: fire, comprehensive household insurance, civil liability, theft, personal accidents, group life insurance and other coverage.
|
|
|
§
|
NETWORK OF BRANCHES AND RETAIL OFFICES
|
BBVA Francés operates a network of 244 branches distributed as follows: Autonomous City of Buenos Aires, 82 branches; Greater Buenos Aires, 52 branches, with the remaining 110 branches being situated in the Argentine provinces.
|
|
§
|
INFORMATION ON BUSINESS LINES
|
The most relevant business lines are: Retail Banking, whose strategy relies on building a comprehensive relationship with customers and strengthening the credit card segment; Enterprise Banking, which aims at aiding companies through both short- and long-term financing and Corporate & Investment Banking, an area concerned with Foreign Trade transactions as much as with advice in mergers and acquisitions and in capital market transactions.
|
|
§
|
PERSONNEL INCENTIVES
|
The Bank has in place a system of market-attuned fixed and variable remunerations that applies to its entire payroll and ensures internal consistency.
As concerns fixed remuneration, the focus is on offering salaries that are competitive in the market. And in the case of variable remuneration, the focus is on the definition of the benchmark bonus and the attainment of the objectives established for the year. Objective accomplishment is analyzed through performance assessments, depending on the employee’s position. These amounts are paid in arrears per calendar year and.
|
|
§
|
CODE OF CONDUCT
|
The Bank has a Code of Conduct that binds all of BBVA Francés’ employees and officers.
The Code of Conduct defines the ethical behavior that the Board of BBVA Francés considers applicable to the businesses and activities conducted by BBVA Francés and the Group companies in Argentina, builds on their foundations and lays down the guidelines required for corporate integrity to be outwardly expressed in (i) relationships with clients, employees and officers, suppliers and third parties; (ii) acting in the various markets as issuers or operators; (iii) individual actions by employees and officers; and (iv) establishing specific bodies and functions endowed with the responsibility for enforcing the Code and fostering the actions necessary to effectively safeguard corporate integrity as a whole.
|
|
§
|
CONFLICTS OF INTEREST
|
On December 18, 2012, the Board of Directors approved the most recent version of the Rules for Preventing and Handling Conflicts of Interest at BBVA Francés and other affiliates in Argentina.
The Rule contains the following principal guidelines: (i) it determines the scope of application; (ii) it identifies conflicts of interest; (iii) it establishes the measures for preventing and handling conflicts of interest; and (iv) it provides a procedure for conflict resolution.
In addition, Section 12 “Standards for discharging directorship duties” of the Code of Corporate Governance regulates, among other matters, transactions between Directors and the Entity or other group companies.
F-52
BBVA BANCO FRANCÉS S.A. AND SUBSIDIARIES
NOTES TO THE CONSOLIDATED FINANCIAL STATEMENTS
For the fiscal years ended December 31, 2012, 2011 and 2010
Stated in thousands of Pesos
Basically, it mandates that any director involved shall not be in attendance when the relevant corporate bodies in which he is a member are in session to discuss the matters in which he or she might have a direct or indirect interest or which might affect persons related to him or her in the terms defined by the laws.
It also prescribes that the director involved shall be enjoined from entering, either directly or indirectly, into personal, professional or commercial transactions with the Entity or companies in its group, unless these transactions are subject to a procurement process that ensures transparency, with competing bids and in arm’s length conditions.
|
|
21.1.
|
Minimum cash balances and restricted deposit
|
In accordance with BCRA and foreign central banks’ regulations, the Bank is required to maintain daily average minimum cash balances for each month in cash, in its account with the BCRA. The required daily averages calculated for the month ending on each balance sheet date are as follows:
|
|
December 31,
|
|||||||
|
2012
|
2011
|
|||||||
|
Peso and Foreign Currency Balances
|
4,654,479 | 4,453,004 | ||||||
|
|
21.2.
|
Interest-bearing deposits with other banks
|
|
|
a)
|
Included in “Cash and Due from Banks” there are: (1) interest-bearing deposits with the BCRA totalling 6,597,330 and 3,651,375 as of December 31, 2012 and 2011, respectively; (2) interest-bearing deposits in foreign banks totalling 54 and 34 as of December 31, 2012 and 2011, respectively, and (3) interest-bearing deposits in local banks totalling 34 and 2 as of December 31, 2012 and 2011, respectively.
|
|
|
b)
|
Included in “Loans” there are: overnight foreign bank interest-bearing deposits totalling 113,279 and 70,704 as of December 31, 2012 and 2011, respectively.
|
|
|
c)
|
Included in “Other Receivables from Financial Transactions” there are other interest-bearing deposits with the BCRA totalling 196,569 and 147,406 as of December 31, 2012 and 2011, respectively.
|
|
|
21.3.
|
Instruments issued by the BCRA at amortized cost
|
The book value and fair value of instruments issued by the BCRA at amortized cost at December 31, 2012 and 2011 were as follows:
|
December 31,
|
||||||||||||||||||||||||
|
2012
|
2011
|
2012
|
2011
|
2012
|
2011
|
|||||||||||||||||||
|
Book value
|
Gross unrealized
losses
|
Fair value
|
||||||||||||||||||||||
|
BCRA Bills
|
2,186,062 | 1,275,218 | 3,443 | 11,461 | 2,182,619 | 1,263,757 | ||||||||||||||||||
|
BCRA Notes
|
— | 677,698 | — | 5,158 | — | 672,540 | ||||||||||||||||||
|
Total
|
2,186,062 | 1,952,916 | 3,443 | 16,619 | 2,182,619 | 1,936,297 | ||||||||||||||||||
F-53
BBVA BANCO FRANCÉS S.A. AND SUBSIDIARIES
NOTES TO THE CONSOLIDATED FINANCIAL STATEMENTS
For the fiscal years ended December 31, 2012, 2011 and 2010
Stated in thousands of Pesos
The amortized cost and the fair value of instruments issued by the BCRA at amortized cost under BCRA’s rules at December 31, 2012, by contractual maturity, were as follows:
|
December 31, 2012
|
||||||||
|
Amortized cost
|
Fair value
|
|||||||
|
Due in one year or less
|
2,186,062 | 2,182,619 | ||||||
|
Total
|
2,186,062 | 2,182,619 | ||||||
|
|
21.4.
|
Loans
|
A description of certain categories of loans on the accompanying Consolidated Balance Sheets is as follows:
To governmental sector: loans to public sector, excluding public financial institutions.
To the financial sector: loans to local financial institutions.
To the non-financial private sector and residents abroad: loans given to the private sector (excluding local financial institutions) and residents abroad from Argentina. Include the following types of lending:
|
|
-
|
Overdraft: basically short-term loans to companies and overdraft lines of credit.
|
|
|
-
|
Discounted instruments: includes promissory notes, discounted documents and instruments acquired under factoring agreements.
|
|
|
-
|
Real estate mortgage: loans to purchase or improve real estate and collateralized by such real estate or commercial loans secured by real estate
|
|
|
-
|
Collateral loans (real estate mortgage and security agreements): loans secured by privileged guarantees.
|
|
|
-
|
Consumer: loans granted to individuals to acquired consumer goods.
|
|
|
-
|
Credit cards: consists mainly of credit card loans.
|
|
|
-
|
Others: includes mainly short-term placements in foreign banks.
|
Under BCRA’s rules, the Bank must disclose the type of collateral pledged on loans to non-financial private sector and residents abroad. The classification of the loan portfolio in this regard is as follows:
F-54
BBVA BANCO FRANCÉS S.A. AND SUBSIDIARIES
NOTES TO THE CONSOLIDATED FINANCIAL STATEMENTS
For the fiscal years ended December 31, 2012, 2011 and 2010
Stated in thousands of Pesos
|
December 31,
|
||||||||
|
2012
|
2011
(1)
|
|||||||
|
Government sector
|
35,067 | 46,027 | ||||||
|
Financial sector
|
1,493,493 | 1,146,532 | ||||||
|
Non-financial private sector and residents abroad
|
27,488,728 | 21,949,445 | ||||||
|
—Commercial portfolio
|
||||||||
|
With self-liquidating preferred guarantees
|
313,541 | 309,735 | ||||||
|
With other preferred guarantees
|
336,113 | 307,231 | ||||||
|
Without preferred guarantees
|
12,427,813 | 10,781,439 | ||||||
|
—Consumer portfolio
|
||||||||
|
With self-liquidating preferred guarantees
|
15,184 | 8,524 | ||||||
|
With other preferred guarantees
|
3,054,375 | 1,844,920 | ||||||
|
Without preferred guarantees
|
11,341,702 | 8,697,596 | ||||||
|
Less: Allowances for doubtful loans
|
(523,857 | ) | (444,973 | ) | ||||
|
Total
|
28,493,431 | 22,697,031 | ||||||
________________
(1) See Note 3.3.
Commercial loans: encompasses all financing facilities, other than those not reaching an amount equivalent to 1,500 with or without preferred guarantees.
Consumer loans: encompasses all financing facilities related to consumption (whether personal, professional or family consumption, loans for purchasing of consumer goods and financing credit cards) or housing loans (for buying, building or refurbishing) and financing (credits and guarantees) of a commercial nature up to an amount equivalent to 1,500 with or without preferred guarantees.
“Self - liquidating preferred guarantees” consist mainly of cash guarantees, gold guarantees, warrants over primary products and other forms of collateral of self-liquidation.
“Other preferred guarantees” consist, in general, of real estate mortgages and other forms of collateral pledged to secure the loan amount. The entire principal amount of loan is included under the heading “preferred guarantees” regardless of the current market value of the collateral.
“Without preferred guarantees” consist, in general, of unsecured third-party guarantees.
The following table analyzes our loan portfolio as of December 31, 2012 by type and by the time remaining to maturity. Loans are stated before deduction of the allowance for loan losses. We expect most loans to be repaid at maturity in cash or through refinancing at market terms.
F-55
BBVA BANCO FRANCÉS S.A. AND SUBSIDIARIES
NOTES TO THE CONSOLIDATED FINANCIAL STATEMENTS
For the fiscal years ended December 31, 2012, 2011 and 2010
Stated in thousands of Pesos
|
Maturing
|
||||||||||||||||||||
|
Amount at December 31,
2012
|
Within
3 months
|
After 3
months but
within 1 year
|
After 1 year
but within
5 years
|
After 5 years
|
||||||||||||||||
|
(in thousands of pesos, except percentages)
|
||||||||||||||||||||
|
To the non-financial public sector
|
35,067 | 457 | — | 34,610 | — | |||||||||||||||
|
To the financial sector
|
1,493,493 | 534,818 | 529,537 | 429,138 | — | |||||||||||||||
|
To the non-financial private sector and residents abroad
|
27,488,728 | 12,075,764 | 7,906,088 | 7,296,397 | 210,479 | |||||||||||||||
|
Overdrafts
|
5,225,314 | 2,467,448 | 2,702,387 | 55,479 | — | |||||||||||||||
|
With privileged guarantees
|
3,406,535 | 390,829 | 977,206 | 1,839,671 | 198,829 | |||||||||||||||
|
Credit cards
|
4,746,312 | 4,746,312 | — | — | — | |||||||||||||||
|
Other
|
14,110,567 | 4,471,175 | 4,226,495 | 5,401,247 | 11,650 | |||||||||||||||
|
Total
|
29,017,288 | 12,611,039 | 8,435,625 | 7,760,145 | 210,479 | |||||||||||||||
|
Percentage of total loan portfolio
|
100.00 | % | 43.46 | % | 29.07 | % | 26.74 | % | 0.73 | % | ||||||||||
The Bank also tracks its loan portfolio by industry segment. At December 31, 2012, the following industry segments represented the loan concentrations:
|
Industry Segment
|
Percentage of
Total Loans
|
|
|
Consumer
|
40.07%
|
|
|
Other
|
21.52%
|
|
|
Chemicals
|
6.22%
|
|
|
Agricultural and livestock
|
5.48%
|
|
|
Financial sector
|
5.15%
|
|
|
Wholesale trade
|
4.40%
|
|
|
Food stuff
|
4.35%
|
|
|
Retail trade
|
3.41%
|
|
|
Mining products
|
3.18%
|
|
|
Industrial metals
|
2.40%
|
|
|
Beverage
|
1.56%
|
|
|
Transportation material
|
1.26%
|
|
|
Oil and Carbon
|
1.00%
|
|
|
Total
|
100.00%
|
Substantially most of Bank’s operations, property and customers are located in Argentina. Therefore, the performance of Bank’s loan portfolio, financial condition and the results of its operations depend primarily on the macroeconomic and political conditions prevailing in Argentina.
During 2012 certain “related-parties” of the Bank were loan customers of the Bank. As defined under BCRA’s rules, related-parties include the associated companies in which the Bank has some sort of important influence (as stated by said rules) and related persons such as any director or member of the Supervisory Committee of the Bank within the previous three years, senior management of the Bank, members of the immediate families of any such persons, and companies with which they are associated. The historical activity in principal amounts of loans to related-parties during the fiscal years ended December 31, 2012 and 2011 are as follows:
F-56
BBVA BANCO FRANCÉS S.A. AND SUBSIDIARIES
NOTES TO THE CONSOLIDATED FINANCIAL STATEMENTS
For the fiscal years ended December 31, 2012, 2011 and 2010
Stated in thousands of Pesos
|
December 31,
|
||||||||
|
2012
|
2011
|
|||||||
|
Balance at the beginning of the fiscal year
|
528,260 | 250,257 | ||||||
|
New Loans
|
88,917 | 288,830 | ||||||
|
Repayments
|
(21,024 | ) | (10,827 | ) | ||||
|
Balance at the end of the fiscal year
|
596,153 | 528,260 | ||||||
Total loans outstanding to these related parties at December 31, 2012 and 2011 including accrued interest, amounted to 753,648 and 594,238, respectively. Such loans are made in the ordinary course of business at normal credit terms, including interest rate and collateral requirements, and, in the opinion of management, do not represent more than normal credit risk.
At December 31, 2012 and 2011, approximately 120,775 and 84,870 or 0.42% and 0.38% of the Bank’s portfolio, respectively, consisted of loans to foreign borrowers.
Certain loan customers of the Bank are under court order or have entered into agreements with the Bank to satisfy their debt on basis different from the original loan terms. The Bank eliminates any differences between the principal and accrued interest due under the original loan and the new loan amount through a charge to the allowance for loan losses at the time of the restructuring.
At December 31, 2012 and 2011, non-performing loans amounted to 187,903 and 105,409, respectively. Past due loans included in the abovementioned amounts reach to 117,595 and 63,748 at December 31, 2012 and 2011, respectively.
|
|
21.5.
|
Allowance for loan losses
|
The activity in the allowance for loan losses for the fiscal years presented is as follows:
|
December 31,
|
||||||||||||
|
2012
|
2011
|
2010
|
||||||||||
|
Balance at the beginning of the fiscal year
|
444,973 | 396,227 | 337,686 | |||||||||
|
Provision for loan losses
|
259,181 | 134,199 | 178,800 | |||||||||
|
Charge-offs
|
(180,297 | ) | (85,453 | ) | (120,259 | ) | ||||||
|
Balance at the end of the fiscal year
|
523,857 | 444,973 | 396,227 | |||||||||
|
|
21.6.
|
Other receivables from financial transactions
|
The composition of other banking receivables by type of guarantee is as follows:
|
December 31,
|
||||||||
|
Description
|
2012
|
2011
|
||||||
|
With preferred guarantees
|
537,997 | 417,836 | ||||||
|
Without preferred guarantees
|
166,378 | 1,534,218 | ||||||
|
Allowances
|
(3,450 | ) | (3,769 | ) | ||||
| 700,925 | 1,948,285 | |||||||
F-57
BBVA BANCO FRANCÉS S.A. AND SUBSIDIARIES
NOTES TO THE CONSOLIDATED FINANCIAL STATEMENTS
For the fiscal years ended December 31, 2012, 2011 and 2010
Stated in thousands of Pesos
The Bank enters into spot, forward, repurchase agreements and reverse repurchase agreements, to buy or sell foreign currency (principally U.S. dollars) and Government securities. The Bank recognizes the cash, currency or security amount to be exchanged in the future as a receivable and payable, at the initial transaction date.
The assets and corresponding liabilities related to such transactions are as follows:
|
December 31,
|
||||||||
|
Description
|
2012
|
2011
|
||||||
|
Forward Purchases and Sales
|
||||||||
|
“Notional” amount of non-deliverable forward purchases
|
3,452,819 | 3,588,570 | ||||||
|
“Notional” amount of non-deliverable forward sales
|
2,865,678 | 3,419,241 | ||||||
|
Interest rate SWAP
|
878,657 | 551,836 | ||||||
|
Call options bought
|
— | 30,032 | ||||||
|
Call options written
|
— | 34,505 | ||||||
|
Contra credit derivatives accounts
|
(4,331,476 | ) | (4,170,438 | ) | ||||
|
Contra debit derivatives accounts
|
(2,865,678 | ) | (3,453,746 | ) | ||||
|
Non-deliverable forward transactions balances pending settlement-Receivables
|
8,834 | 34,249 | ||||||
|
Non-deliverable forward transactions balances pending settlement-Liability
|
928 | 5,885 | ||||||
|
Repurchase and reverse repurchase agreements with government securities
|
||||||||
|
Forward sales under reverse repurchase agreements
|
— | 1,076,589 | ||||||
|
Debtors under reverse repurchase agreements with the BCRA
|
— | 1,077,218 | ||||||
|
Forward purchases of instruments issued by the BCRA under reverse repurchase agreements
|
— | 100,754 | ||||||
|
Financial creditors of instruments issued by the BCRA under reverse repurchase agreements
|
— | 100,886 | ||||||
|
Spot transactions with pending settlement
|
||||||||
|
Unsettled spot securities purchases
|
— | 1 | ||||||
|
Unsettled spot foreign exchange purchases
|
18 | |||||||
|
Creditors under unsettled spot foreign exchange purchases
|
18 | |||||||
|
Creditors under unsettled spot securities purchases
|
— | 86,280 | ||||||
|
Debtors under unsettled spot securities sales
|
— | 86,294 | ||||||
|
Unsettled spot securities sales
|
— | 1 | ||||||
|
Debtors under unsettled spot foreign exchange sales
|
931 | 1,546 | ||||||
|
Unsettled spot foreign exchange sales
|
926 | 1,538 | ||||||
|
Unsettled spot Government securities purchases
|
— | 86,302 | ||||||
|
Debtors under unsettled spot Government securities sales
|
— | 16,916 | ||||||
|
Unsettled spot Government securities sales
|
— | 103,227 | ||||||
F-58
BBVA BANCO FRANCÉS S.A. AND SUBSIDIARIES
NOTES TO THE CONSOLIDATED FINANCIAL STATEMENTS
For the fiscal years ended December 31, 2012, 2011 and 2010
Stated in thousands of Pesos
|
21.7.
|
Premises and equipment and other assets
|
|
21.7.1.
|
Premises and equipment
|
The major categories of the Bank’s premises and equipment, and accumulated depreciation related thereto are presented in the following table:
|
|
Estimated useful life (years) |
December 31,
|
||||||||||
| Description |
2012
|
2011
|
||||||||||
|
Land and buildings
|
50 | 581,726 | 570,994 | |||||||||
|
Furniture and facilities
|
10 | 213,573 | 163,300 | |||||||||
|
Machinery and equipment
|
5 | 187,904 | 175,612 | |||||||||
|
Vehicles
|
5 | 5,723 | 5,015 | |||||||||
|
Accumulated depreciation
|
(368,945 | ) | (334,800 | ) | ||||||||
|
Total
|
619,981 | 580,121 | ||||||||||
Depreciation expense was 86,813, 65,070 and 57,737 at December 31, 2012, 2011 and 2010, respectively.
|
21.7.2.
|
Other assets
|
Other assets consisted of the following at December 31, 2012 and 2011:
|
|
Estimated useful life (years) |
December 31,
|
||||||||||
| Description |
2012
|
2011
|
||||||||||
|
Advances to suppliers of goods
|
4,356 | 3,744 | ||||||||||
|
Construction in progress
|
7,801 | — | ||||||||||
|
Rent assets
|
50 | 2,342 | 3,898 | |||||||||
|
Works of art
|
— | 992 | 983 | |||||||||
|
Assets acquired for secure loans
|
50 | 1,912 | 2,128 | |||||||||
|
Stationery and office supplies
|
— | 8,244 | 5,916 | |||||||||
|
Land and buildings not affected by banking activities
|
50 | 8,448 | 8,635 | |||||||||
|
Vehicles to delivering for financial leases
|
— | 3,393 | ||||||||||
|
Total
|
34,095 | 28,697 | ||||||||||
Depreciation expense was 376, 369 and 734 at December 31, 2012, 2011 and 2010, respectively.
F-59
BBVA BANCO FRANCÉS S.A. AND SUBSIDIARIES
NOTES TO THE CONSOLIDATED FINANCIAL STATEMENTS
For the fiscal years ended December 31, 2012, 2011 and 2010
Stated in thousands of Pesos
|
|
21.8.
|
Intangible assets
|
Organization and development expenses
The breakdown of organization and development account as of December 31, 2012 and 2011, is as follows:
|
Estimated
useful
life (years)
|
December 31,
|
||||||||
|
Description
|
2012
|
2011
|
|||||||
|
Computer software acquisition expenses and computer programs
development expenses
|
up to 5
|
51,982 | 30,573 | ||||||
|
Other intangible assets
|
up to 5
|
65,349 | 50,405 | ||||||
|
Total
|
117,331 | 80,978 | |||||||
The 2012 and 2011’s variations in intangible asset accounts were as follows:
|
December 31,
|
||||||||
|
2012
|
2011
|
|||||||
|
Balance at the beginning of the fiscal year
|
80,978 | 66,547 | ||||||
|
—Additions
|
96,410 | 75,258 | ||||||
|
—Decreases
|
(62 | ) | (3,471 | ) | ||||
|
—Period amortization
|
(59,995 | ) | (57,356 | ) | ||||
|
Balance at the end of the fiscal year
|
117,331 | 80,978 | ||||||
|
|
21.9.
|
Other liabilities from financial transactions – BCRA
|
The Bank borrows funds under various credit facilities obtained from the BCRA for specific purposes, as follows:
|
December 31,
|
||||||||
|
Description
|
2012
|
2011
|
||||||
|
Short-term liabilities
|
51,936 | 18,450 | ||||||
|
Total
|
51,936 | 18,450 | ||||||
At December 31, 2012 and 2011, accrued interests and other differences included on the above liabilities amounted to 369 and 346, respectively.
|
21.10.
|
Other liabilities from financial transactions – Banks and international institutions and financing received from financial institutions
|
The Bank borrows funds under different credit arrangements from local and foreign banks and international lending agencies, as follows:
F-60
BBVA BANCO FRANCÉS S.A. AND SUBSIDIARIES
NOTES TO THE CONSOLIDATED FINANCIAL STATEMENTS
For the fiscal years ended December 31, 2012, 2011 and 2010
Stated in thousands of Pesos
|
December 31,
|
||||||||
|
Description
|
2012
|
2011
|
||||||
|
Short-term liabilities
|
||||||||
|
Other lines of credit from local and foreign banks
|
585,483 | 805,535 | ||||||
|
Total short-term liabilities
|
585,483 | 805,535 | ||||||
|
Long-term liabilities
|
||||||||
|
Other lines of credit from local and foreign banks
|
42,182 | 114,699 | ||||||
|
Total long-term liabilities
|
42,182 | 114,699 | ||||||
|
Total
|
627,665 | 920,234 | ||||||
Accrued interests included on the above liabilities are 20,240 and 17,013, at December 31, 2012 and 2011, respectively, and are included in the “Interest and listed-price differences accrued payable” account in the accompanying Consolidated Balance Sheets. Interest rates for long-ter m liabilities vary from 25.88% to 28.49% per annum.
Maturities of the long-term liabilities in the table above for each of the following fiscal years are as follows:
|
Fiscal year
|
|
|
2014
|
42,182
|
|
Total
|
42,182
|
The funds mentioned under the caption “Long-term liabilities: Other lines of credit from local and foreign banks” are applied mainly to loans to companies involved in foreign trade transactions.
|
21.11.
|
Balances in foreign currency
|
The balances of assets and liabilities denominated in foreign currency are as follows:
|
|
December 31,
|
|||||||
|
Description
|
2012
|
2011
|
||||||
|
Assets
|
||||||||
|
Cash and due from banks
|
2,020,589 | 2,685,417 | ||||||
|
Government and private securities
|
2,315 | 10,116 | ||||||
|
Loans
|
2,480,545 | 3,808,480 | ||||||
|
Other receivables from financial transactions
|
22,827 | 190,427 | ||||||
|
Receivables from financial leases
|
385 | 1,285 | ||||||
|
Investments in other companies
|
1,300 | 1,137 | ||||||
|
Other receivables
|
249,791 | 129,223 | ||||||
|
Suspense items
|
634 | 616 | ||||||
|
Total
|
4,778,386 | 6,826,701 | ||||||
|
Liabilities
|
||||||||
|
Deposits
|
3,514,335 | 5,294,936 | ||||||
|
Other liabilities from financial transactions
|
690,412 | 1,361,203 | ||||||
|
Other liabilities
|
67,643 | 52,417 | ||||||
|
Suspense items
|
869 | 332 | ||||||
|
Total
|
4,273,259 | 6,708,888 | ||||||
F-61
BBVA BANCO FRANCÉS S.A. AND SUBSIDIARIES
NOTES TO THE CONSOLIDATED FINANCIAL STATEMENTS
For the fiscal years ended December 31, 2012, 2011 and 2010
Stated in thousands of Pesos
|
21.12.
|
Minimum capital requirements
|
Under BCRA’s regulations, the Bank is required to maintain individual and consolidated minimum levels of equity capital (“minimum capital”). At December 31, 2012 and 2011 the consolidated minimum capital is based upon risk-weighted assets and also considers interest rate risk and market risk. The required consolidated minimum capital and the consolidated Bank’s capital calculated under the BCRA’s regulations are as follows:
|
|
Required
Minimum
Capital
|
Computable
Capital
|
Excess of actual
Minimum Capital
over Required
Minimum Capital
(1)
|
||
|
December 31, 2012
|
3,591,345
|
5,289,906
|
1,698,561
|
||
|
December 31, 2011
|
2,432,839
|
3,684,099
|
1,251,260
|
|
(1)
|
The Bank must maintain a surplus of minimum paid-in capitals amounting to at least 105,981 and 90,689 as at December 31, 2012 and 2011, respectively, equivalent to 0.25% of the amount of values under custody for securities representing investments from pension funds, as well as in connection with its function as registrar of mortgage-backed bonds, invested in national public securities and other destinations authorized by the BCRA and guaranteed in favour of the said Entity.
|
|
|
21.13.
|
Earnings per share
|
Earnings per share for the fiscal years ended December 31, 2012, 2011 and 2010, were computed by dividing net income by the weighted-average number of Ordinary Shares outstanding during each fiscal year.
|
|
21.14.
|
Employee benefit plans
|
The Bank does not maintain pension plans for its employees; nevertheless, since 2005 the BBVA Francés gives to certain executives, with a role at corporate level, the possibility to access into defined contribution pension plan that it is subject to ASC 962-10, Plan Accounting-Defined Contribution Pension Plans: Overall. This pension plan consists in a percentage calculated over determinate recompensing concepts. At December 31, 2012, 2011 and 2010 the Bank has been accruing 2,245, 1,416 and 1,805 in “Operating Expenses - Payroll expenses”, respectively. This concept has not had impact under U.S. GAAP.
Additionally, following a proposal from the Appointments and Salaries Committee the Board of Directors of BBVA Francés, approved incentive
s
plan
s
which included the delivery of BBVA shares to certain executives. At December 31, 2012 the Bank recognized 7,848 for this concept. It had not impact under U.S. GAAP.
In addition, the Bank is obligated to pay employer contributions to the Argentine Integrated Social Security System, determined on the basis of total monthly payroll. These expenses aggregated 168,804, 121,430 and 94,791 for the fiscal years ended December 31, 2012, 2011 and 2010, respectively, and are included in the “Operating Expenses—Payroll expenses” account in the Consolidated Statements of Operations.
F-62
BBVA BANCO FRANCÉS S.A. AND SUBSIDIARIES
NOTES TO THE CONSOLIDATED FINANCIAL STATEMENTS
For the fiscal years ended December 31, 2012, 2011 and 2010
Stated in thousands of Pesos
|
|
21.15.
|
Business segment consolidated information
|
ASC 280-10, Segment Reporting: Overall requires that a public business enterprise report financial and descriptive information about its reportable operating segments. Operating segments are components of an enterprise about which separate financial information is available that is evaluated regularly by the chief operating decision maker in deciding how to allocate resources and assess performance. Generally, financial information is required to be reported on the basis that it is used internally for evaluating segment performance and deciding how to allocate resources to segments.
The Bank is mainly concentrated on the financial sector, especially through its activities related to banking/financial, pension fund manager and insurance.
During the fiscal year ended December 31, 2011 the Bank decided to sold its interest in Consolidar Retiro S.A. (see Note 1.4.). As consequence of this, the Bank discontinued this segment of business.
The following information shows total assets, financial income, service charge income and other income, total income, financial expenses, allowances for doubtful loans, operating expenses, other expenses, total expenses, loss / gain on minority interest in subsidiaries and total net income for each of the business segment identified by the Bank’s management.
F-63
BBVA BANCO FRANCÉS S.A. AND SUBSIDIARIES
NOTES TO THE CONSOLIDATED FINANCIAL STATEMENTS
For the fiscal years ended December 31, 2012, 2011 and 2010
Stated in thousands of Pesos
|
As of December 31, 2012
|
|||||||||||||||||||
|
Continued operations
|
Discontinued
operations
(5)
|
Total
|
|||||||||||||||||
|
Banking Financial
|
Pension Fund Manager
|
||||||||||||||||||
|
BBVA Banco
Francés S.A.
(4)
|
PSA Finance S.A.
|
Total
|
|||||||||||||||||
|
Total assets
|
42,761,978 | 1,916,525 | 44,678,503 | 106,076 | 44,784,579 | ||||||||||||||
|
Financial income
|
5,423,751 | 281,442 | 5,705,193 | 9,728 | 5,714,921 | ||||||||||||||
|
Service charge income and other income
|
2,735,119 | 197,682 | 2,932,801 | 5,400 | 2,938,201 | ||||||||||||||
|
Total income
(1)
|
8,158,870 | 479,124 | 8,637,994 | 15,128 | 8,653,122 | ||||||||||||||
|
Financial expenses
|
(1,955,017 | ) | (106,114 | ) | (2,061,131 | ) | 3,260 | (2,057,871 | ) | ||||||||||
|
Allowances for doubtful loans
|
(242,753 | ) | (13,506 | ) | (256,259 | ) | — | (256,259 | ) | ||||||||||
|
Operating expenses
|
(3,014,278 | ) | (25,453 | ) | (3,039,731 | ) | (21,977 | ) | (3,061,708 | ) | |||||||||
|
Other expenses
(2)
|
(1,896,026 | ) | (81,333 | ) | (1,977,359 | ) | (51 | ) | (1,977,410 | ) | |||||||||
|
Total expenses
(3)
|
(7,108,074 | ) | (226,406 | ) | (7,334,480 | ) | (18,768 | ) | (7,353,248 | ) | |||||||||
|
Gain/(Loss) on minority interest in subsidiaries
|
1,595 | (37,790 | ) | (36,195 | ) | — | (36,195 | ) | |||||||||||
|
Total net income
|
1,052,391 | 214,928 | 1,267,319 | (3,640 | ) | 1,263,679 | |||||||||||||
|
(1)
|
Includes: financial income, service charge income and other income.
|
|
(2)
|
Includes: service charge expense, other expense, income tax and TOMPI.
|
|
(3)
|
Includes: financial expenses, allowances for doubtful loans, operating expenses and other expenses.
|
|
(4)
|
Includes: BBVA Francés Asset Management S.A. Sociedad Gerente de Fondos Comunes de Inversión and BBVA Francés Valores Sociedad de Bolsa S.A.
|
|
(5)
|
See Note 15.
|
|
As of December 31, 2011
|
|||||||||||||||||||
|
Continued operations
|
Discontinued
operations
(5)
|
Total
|
|||||||||||||||||
|
Banking Financial
|
Pension Fund Manager / Insurance
|
||||||||||||||||||
|
BBVA Banco
Francés S.A.
(4)
|
PSA Finance S.A.
|
Total
|
|||||||||||||||||
|
Total assets
|
37,640,829 | 1,329,244 | 38,970,073 | 35,572 | 39,005,645 | ||||||||||||||
|
Financial income
|
3,412,422 | 152,608 | 3,565,030 | 249,655 | 3,814,685 | ||||||||||||||
|
Service charge income and other income
|
2,078,461 | 129,350 | 2,207,811 | 78,537 | 2,286,348 | ||||||||||||||
|
Total income
(1)
|
5,490,883 | 281,958 | 5,772,841 | 328,192 | 6,101,033 | ||||||||||||||
|
Financial expenses
|
(1,300,279 | ) | (55,419 | ) | (1,355,698 | ) | 10,295 | (1,345,403 | ) | ||||||||||
|
Allowances for doubtful loans
|
(122,066 | ) | (10,597 | ) | (132,663 | ) | — | (132,663 | ) | ||||||||||
|
Operating expenses
|
(2,263,288 | ) | (16,212 | ) | (2,279,500 | ) | (63,700 | ) | (2,343,200 | ) | |||||||||
|
Other expenses
(2)
|
(1,006,203 | ) | (58,661 | ) | (1,064,864 | ) | (200,864 | ) | (1,265,728 | ) | |||||||||
|
Total expenses
(3)
|
(4,691,836 | ) | (140,889 | ) | (4,832,725 | ) | (254,269 | ) | (5,086,994 | ) | |||||||||
|
Gain/(Loss) on minority interest in subsidiaries
|
24,691 | (17,908 | ) | 6,783 | (15,245 | ) | (8,462 | ) | |||||||||||
|
Total net income
|
823,738 | 123,161 | 946,899 | 58,678 | 1,005,577 | ||||||||||||||
|
(1)
|
Includes: financial income, service charge income and other income.
|
|
(2)
|
Includes: service charge expense, other expense, income tax and TOMPI.
|
|
(3)
|
Includes: financial expenses, allowances for doubtful loans, operating expenses and other expenses.
|
|
(4)
|
Includes: BBVA Francés Asset Management S.A. Sociedad Gerente de Fondos Comunes de Inversión and BBVA Francés Valores Sociedad de Bolsa S.A.
|
|
(5)
|
See Notes 1.4. and 15.
|
F-64
BBVA BANCO FRANCÉS S.A. AND SUBSIDIARIES
NOTES TO THE CONSOLIDATED FINANCIAL STATEMENTS
For the fiscal years ended December 31, 2012, 2011 and 2010
Stated in thousands of Pesos
|
As of December 31, 2010
|
|||||||||||||||||||
|
Continued operations
|
Discontinued
operations
(5)
|
Total
|
|||||||||||||||||
|
Banking Financial
|
Pension Fund Manager / Insurance
|
||||||||||||||||||
|
BBVA Banco
Francés S.A.
(4)
|
PSA Finance S.A.
|
Total
|
|||||||||||||||||
|
Total assets
|
28,445,498 | 751,810 | 29,197,308 | 3,382,938 | 32,580,246 | ||||||||||||||
|
Financial income
|
3,211,487 | 86,772 | 3,298,259 | 544,412 | 3,842,671 | ||||||||||||||
|
Service charge income and other income
|
1,550,974 | 81,872 | 1,632,846 | 57,389 | 1,690,235 | ||||||||||||||
|
Total income
(1)
|
4,762,461 | 168,644 | 4,931,105 | 601,801 | 5,532,906 | ||||||||||||||
|
Financial expenses
|
(800,182 | ) | (14,491 | ) | (814,673 | ) | (3,150 | ) | (817,823 | ) | |||||||||
|
Allowances for doubtful loans
|
(172,452 | ) | (6,901 | ) | (179,353 | ) | — | (179,353 | ) | ||||||||||
|
Operating expenses
|
(1,957,154 | ) | (12,307 | ) | (1,969,461 | ) | (49,917 | ) | (2,019,378 | ) | |||||||||
|
Other expenses
(2)
|
(750,674 | ) | (37,133 | ) | (787,807 | ) | (499,210 | ) | (1,287,017 | ) | |||||||||
|
Total expenses
(3)
|
(3,680,462 | ) | (70,832 | ) | (3,751,294 | ) | (552,277 | ) | (4,303,571 | ) | |||||||||
|
(Loss)/Gain on minority interest in subsidiaries
|
(219 | ) | (16,319 | ) | (16,538 | ) | (14,618 | ) | (31,156 | ) | |||||||||
|
Total net income
|
1,081,780 | 81,493 | 1,163,273 | 34,906 | 1,198,179 | ||||||||||||||
|
(1)
|
Includes: financial income, service charge income and other income.
|
|
(2)
|
Includes: service charge expense, other expense, income tax and TOMPI
|
|
(3)
|
Includes: financial expenses, allowances for doubtful loans, operating expenses and other expenses.
|
|
(4)
|
Includes: BBVA Francés Asset Management S.A. Sociedad Gerente de Fondos Comunes de Inversión and BBVA Francés Valores Sociedad de Bolsa S.A.
|
|
(5)
|
See Notes 1.4. and 15.
|
The Bank’s reportable segments are strategic business units that offer different products and services. They are managed separately because each segment appeals to different markets and, accordingly, requires different technology and marketing strategies.
The Pension Fund Manager segment has been affected by the reform of the integrated retirement and pension system, as mentioned in Notes 1.4. and 15.
The accounting policies of the segments are the same as those described in the summary of significant accounting policies. The Bank evaluates performance based on profit or loss from operations before income taxes not including non-recurring gains or losses.
The Bank does not have a single external private customer from whom it derives 10 percent or more of its revenues and operates in one geographical area. Nevertheless, the Bank has significant exposure to the Argentine Federal Government in form of instruments issued by the BCRA, other debt obligations and Federal Government secured loans. For the fiscal years ended December 31, 2012, 2011 and 2010 the Bank recorded net income from government securities for 641,438, 485,497 and 1,429,638, respectively. In addition, for the fiscal years ended December 31, 2012, 2011 and 2010, the Bank recorded, under BCRA rules, income from Federal Government secured loans (Decree Nr. 1387/01), including CER accrual for 6,388, 40,508 and 271,964, respectively.
|
|
21.16.
|
Consolidated income statements and balance sheets
|
The presentation of Consolidated Financial Statements according to BCRA’s rules differs significantly from the format required by the US. Securities and Exchange Commission (US SEC) under Rules 9-03 and 9-04 of Regulation S-X (“Article 9”). These Consolidated Financial Statements were prepared using the measurement methods prescribed by the BCRA, but in accordance with the presentation requirements of the US SEC.
F-65
BBVA BANCO FRANCÉS S.A. AND SUBSIDIARIES
NOTES TO THE CONSOLIDATED FINANCIAL STATEMENTS
For the fiscal years ended December 31, 2012, 2011 and 2010
Stated in thousands of Pesos
The Consolidated Statements of Operations presented below discloses the categories required by Article 9:
|
December 31,
|
||||||||||||
|
2012
|
2011
|
2010
|
||||||||||
|
Consolidated Income Statements
|
||||||||||||
|
Interest and fees on loans
|
4,050,719 | 2,589,599 | 1,952,059 | |||||||||
|
Interest on investment securities
|
— | — | 189,858 | |||||||||
|
Trading account interest
|
769,498 | 589,491 | 1,281,277 | |||||||||
|
Total interest income
|
4,820,217 | 3,179,090 | 3,423,194 | |||||||||
|
Interest on deposits
|
1,541,589 | 1,060,235 | 632,593 | |||||||||
|
Interest on short-tern borrowings
|
173,620 | 71,340 | 15,408 | |||||||||
|
Interest on long-term debt
|
1 | 17 | 48 | |||||||||
|
Total interest expense
|
1,715,210 | 1,131,592 | 648,049 | |||||||||
|
Net interest income
|
3,105,007 | 2,047,498 | 2,775,145 | |||||||||
|
Provision for loan losses
|
256,259 | 132,663 | 179,353 | |||||||||
|
Net interest income after provision for loan losses
|
2,848,748 | 1,914,835 | 2,595,792 | |||||||||
|
Service charges on deposit accounts
|
377,430 | 317,059 | 261,722 | |||||||||
|
Credit card service charges and fees
|
1,308,886 | 859,032 | 571,592 | |||||||||
|
Fees on securities activities
|
11,067 | 19,119 | 13,019 | |||||||||
|
Other commissions
|
1,300,305 | 1,015,020 | 779,575 | |||||||||
|
Income from investment in equity securities
|
71,779 | 111,461 | 21,323 | |||||||||
|
Foreign currency gains, net
|
190,309 | 218,622 | 197,821 | |||||||||
|
Gains on disposal of fixed and other assets
|
43,578 | 2,150 | 2,245 | |||||||||
|
Others
|
529,551 | 379,480 | 262,405 | |||||||||
|
Total other income
|
3,832,905 | 2,921,943 | 2,109,702 | |||||||||
|
Consolidated Expenses Statements
|
||||||||||||
|
Commissions
|
468,422 | 366,352 | 304,320 | |||||||||
|
Personnel expenses
|
1,581,391 | 1,228,959 | 1,083,801 | |||||||||
|
Fees and external administrative services
|
215,488 | 150,640 | 190,675 | |||||||||
|
Depreciation of bank premises and equipment and other fixed assets
|
87,189 | 65,439 | 58,471 | |||||||||
|
Business travel and development
|
22,098 | 14,447 | 14,877 | |||||||||
|
Utilities
|
60,393 | 42,289 | 36,539 | |||||||||
|
Advertising and promotion
|
146,287 | 122,412 | 101,134 | |||||||||
|
Contributions and taxes
|
729,595 | 506,914 | 355,575 | |||||||||
|
Maintenance and repairs
|
130,202 | 97,602 | 69,351 | |||||||||
|
Provision for loss contingencies
|
351,450 | 128,095 | 49,906 | |||||||||
|
Others
|
760,783 | 555,694 | 926,825 | |||||||||
|
Total other expenses
|
4,553,298 | 3,278,843 | 3,191,474 | |||||||||
|
Income before income tax and tax on minimum presumed income expenses
|
2,128,355 | 1,557,935 | 1,514,020 | |||||||||
|
Income tax and tax on minimum presumed income expenses
|
864,676 | 552,358 | 315,841 | |||||||||
|
Net income
|
1,263,679 | 1,005,577 | 1,198,179 | |||||||||
|
Net loss attributable to the non-controlling interest
|
(36,195 | ) | (8,462 | ) | (31,156 | ) | ||||||
|
Net income attributable to the controlling interest
|
1,299,874 | 1,014,039 | 1,229,335 | |||||||||
|
Net income per Ordinary Share
(1)
|
2.35 | 1.87 | 2.23 | |||||||||
__________________________
(1)
Stated in pesos.
Certain categories of income and expense maintained by the Bank have been presented in the above Article 9 Consolidated Statement of Operations in a manner which warrants further discussion:
F-66
BBVA BANCO FRANCÉS S.A. AND SUBSIDIARIES
NOTES TO THE CONSOLIDATED FINANCIAL STATEMENTS
For the fiscal years ended December 31, 2012, 2011 and 2010
Stated in thousands of Pesos
- “Foreign currency gain, net”: this item relates primarily to the differences in exchange rates on the Bank’s investments, loans and deposits denominated in foreign currency. The Bank does not maintain foreign currency gains or losses in separate categories of assets and liabilities, respectively, and, therefore, since such gains or losses cannot be separately identified by type of activity.
BCRA’s rules also required certain classifications of assets and liabilities which are different from those required by Article 9. The following balance sheets depict the Bank’s Consolidated Balance Sheets at December 31, 2012 and 2011 as if the Bank followed the balance sheets disclosure requirements under Article 9:
|
December 31,
|
||||||||
|
2012
|
2011
(1)
|
|||||||
|
Assets
|
||||||||
|
Cash and due from banks
|
2,017,559 | 2,702,053 | ||||||
|
Interest bearing deposits in other banks
|
6,793,899 | 3,798,781 | ||||||
|
Unsettled spot purchases
|
18 | 86,303 | ||||||
|
Forward purchases and under reverse repurchase agreements
|
— | 100,754 | ||||||
|
Debtors under forward sales and under reverse repurchase agreements
|
— | 1,077,218 | ||||||
|
Debtors under unsettled spot sales
|
931 | 104,756 | ||||||
|
Trading account assets
|
4,101,682 | 5,564,865 | ||||||
|
Investments securities available for sale
|
— | 41,200 | ||||||
|
Investments securities
|
146,001 | 85,088 | ||||||
|
Loans
|
29,017,288 | 23,142,004 | ||||||
|
Allowance for loan losses
|
(523,857 | ) | (444,973 | ) | ||||
|
Premises and equipment
|
619,981 | 580,121 | ||||||
|
Intangible assets
|
117,331 | 80,978 | ||||||
|
Other assets
|
2,493,746 | 2,086,497 | ||||||
|
Total assets
|
44,784,579 | 39,005,645 | ||||||
|
Liabilities and Stockholders’ Equity
|
||||||||
|
Interest bearing deposits
|
22,351,365 | 20,389,096 | ||||||
|
Non interest bearing deposits
|
11,813,688 | 8,776,608 | ||||||
|
Creditors under forward purchases and under reverse repurchase agreements
|
928 | 5,885 | ||||||
|
Creditors under unsettled spot purchases
|
18 | 187,166 | ||||||
|
Forward sales and under repurchase agreements
|
— | 1,076,589 | ||||||
|
Unsettled spot sales
|
926 | 104,766 | ||||||
|
Other short-term borrowings
|
3,131,488 | 2,513,791 | ||||||
|
Other liabilities
|
1,439,524 | 1,125,602 | ||||||
|
Long-term debt
|
151,763 | 379,543 | ||||||
|
Commitments and contingent liabilities
|
644,962 | 496,233 | ||||||
|
Common Stock
|
536,878 | 536,878 | ||||||
|
Other stockholders’ equity
|
4,595,058 | 3,331,379 | ||||||
|
Non-controlling interests in consolidated subsidiaries
|
117,981 | 82,109 | ||||||
|
Total liabilities and stockholders’ equity
|
44,784,579 | 39,005,645 | ||||||
_________________
(1) See Note 3.3.
The following balance sheets depict the Bank’s Consolidated Balance Sheets at December 31, 2012 and 2011 from discontinued operations as if the Bank followed the balance sheets disclosure requirements under Article 9:
F-67
BBVA BANCO FRANCÉS S.A. AND SUBSIDIARIES
NOTES TO THE CONSOLIDATED FINANCIAL STATEMENTS
For the fiscal years ended December 31, 2012, 2011 and 2010
Stated in thousands of Pesos
|
December 31,
|
||||||||
|
2012
|
2011
|
|||||||
|
Assets
|
||||||||
|
Cash and due from banks
|
88 | 36 | ||||||
|
Trading account assets
|
44,942 | 17,274 | ||||||
|
Loans
|
26,233 | (2 | ) | |||||
|
Other assets
|
34,813 | 18,264 | ||||||
|
Total assets
|
106,076 | 35,572 | ||||||
|
Liabilities
|
||||||||
|
Interest bearing deposits
|
— | (79,301 | ) | |||||
|
Non interest bearing deposits
|
(305 | ) | (10,763 | ) | ||||
|
Other short-term borrowings
|
— | 191 | ||||||
|
Other liabilities
|
3,374 | 3,922 | ||||||
|
Commitments and contingent liabilities
|
86,357 | 101,233 | ||||||
|
Total liabilities
|
89,426 | 15,282 | ||||||
|
|
21.17.
|
Off-Balance sheet financial instrument
|
The Bank enters into various transactions involving off-balance-sheet financial instruments. These instruments could be used to meet the risk management, trading and financing needs of clients or for the Bank’s proprietary trading and asset and liability management purposes, and could be subject to varying degrees of credit and market risk. Credit risk and market risk associated with on- and off-balance-sheet financial instruments are monitored on an aggregate basis.
The Bank uses the same credit policies in determining whether to enter or extend call and put option contracts, commitments, conditional obligations and guarantees as it does for granting loans. In the opinion of management, the Bank’s outstanding off-balance-sheet items do not represent unusual credit risk.
|
a)
|
Derivatives
|
In the normal course of its business, the Bank enters into a variety transactions principally in the foreign exchange and stock markets. The majority of the counterparties in the derivative transactions are banks and other financial institutions.
These instruments include:
|
|
§
|
Options: they confer the right on the buyer, but no obligation, to receive or pay a specific quantity of an asset or financial instrument for specified price at or before a specified date. Options may be exchange traded or Over the Counter (OTC) agreements. The Bank principally buys and sells interest options on an index.
|
|
|
§
|
Futures and Forwards: they are agreements to deliver or take delivery of a specified rate, price or index applied against the underlying asset or financial instrument, at a specific date. Futures are exchange traded at standardized amounts of the underlying asset or financial instrument. Forward contracts are OTC agreements and are principally dealt in by the Bank in securities/foreign exchange as forward agreements.
|
Forward transactions are effected by the Bank in order to comply with the limits set forth by the BCRA in relation to the technical ratio of the Net Global Position in foreign currency and to reduce fluctuations risks in the rates of exchange. However, such transactions do not qualify as foreign exchange hedge in terms of ASC 815-20, Derivatives and Hedging: Hedging-General.
F-68
BBVA BANCO FRANCÉS S.A. AND SUBSIDIARIES
NOTES TO THE CONSOLIDATED FINANCIAL STATEMENTS
For the fiscal years ended December 31, 2012, 2011 and 2010
Stated in thousands of Pesos
|
|
§
|
Swaps: they are agreements between two parts with the intention to exchange cash flows and risks at a specific date and for a period in the future. Swaps may be exchange traded or OTC agreements. In addition see Note 12.
|
Pursuant to BCRA’s regulations, future and forward transactions must be recorded under “Other Receivables from Financial Transactions” and “Other Liabilities from Financial Transactions” in the accompanying Consolidated Balance Sheets and they have been valued as mentioned in Notes 3.4.8. and 3.4.9. In addition, future and forward transactions without delivery of underlying asset and the interest rate swaps have been valued as mentioned in Note 3.4.14. and have been registered into Memorandum Accounts’ caption.
The notional contractual amount of these instruments represents the volume of outstanding transactions and does not represent the potential gain or loss associated with the market or credit risk of such transactions. The market risk of derivatives arises from the potential for changes in value due to fluctuations in market prices. The Bank reduces its exposure to market risk, if necessary, by entering into offsetting transactions in accordance with the global policy of hedging defined by BBVA for its subsidiaries. The credit risk of derivatives arises from the potential of a counterparty defaulting on its contractual obligations. The effect of such a default varies as the market value of derivative contracts changes. Credit exposure exists at a particular point in time when a derivative has a positive market value. The Bank attempts to limit its credit risk by dealing with creditworthy counterparties and obtaining collateral where appropriate. At December 31, 2012 and 2011 the Bank entered into forward contracts, interest rate swaps and options for trading purposes. The notional amount of outstanding forward contracts as of the mentioned dates, are included in Note 21.6. The following table shows at December 31, 2012 and 2011 the notional value forward transactions, SWAP and options that fall within trading classification:
|
December 31,
|
||||||||
|
2012
|
2011
|
|||||||
|
Forward sales and purchases of foreign exchange
|
6,318,497 | 7,007,811 | ||||||
|
Forward sales / purchases under reverse repurchase agreements
|
— | 1,175,548 | ||||||
|
Interest rate SWAP
|
878,657 | 551,836 | ||||||
|
Call options bought
(*)
|
— | 30,032 | ||||||
|
Call options written
(*)
|
— | 34,505 | ||||||
_________________
(*)
These instruments classified as hedges under BCRA’s rules but not for USGAAP.
|
b)
|
Credit-related financial instruments
|
The Bank’s exposure to credit loss in the event of non-performance by counterparties to commitments to extend credit, guarantees granted and foreign trade acceptances is represented by the contractual notional amount of those investments.
A summary of credit exposure related to these items is shown below
(*)
:
|
December 31,
|
||||||||
|
2012
|
2011
|
|||||||
|
Credit lines granted (unused portion) cover by debtor classification regulations
|
322,959 | 21,996 | ||||||
|
Foreign trade acceptances and standby letters of credit
|
76,515 | 98,786 | ||||||
|
Guarantees granted
|
365,601 | 245,730 | ||||||
_________________
(*)
A significant portion of the Bank’s guarantees as of December 31, 2012 and 2011 has a remaining maturity of less than one year.
Commitments to extend credit are agreements to lend to a customer at a future date, subject to compliance with contractual terms. Commitments generally have fixed expiration dates or other termination clauses and may require the payment of a fee. Since many of the commitments are expected to expire without being drawn upon, the total
F-69
BBVA BANCO FRANCÉS S.A. AND SUBSIDIARIES
NOTES TO THE CONSOLIDATED FINANCIAL STATEMENTS
For the fiscal years ended December 31, 2012, 2011 and 2010
Stated in thousands of Pesos
commitment amounts do not necessarily represent actual future cash requirements for the Bank. The Bank evaluates each customer’s creditworthiness on a case-by-case basis.
Foreign trade acceptances represent Bank customers’ liabilities on outstanding drafts or bills of exchange that have been accepted by the Bank and the Bank’s liability to remit payment upon the presentation of the accepted drafts or bills of exchange.
The credit risk involved in foreign trade acceptances and guarantees granted is essentially the same as that involved in extending loan facilities to customers. In order to grant guarantees to its customers, the Bank may require counter guarantees. Such financial instruments are classified, by type of guarantee, as follows:
|
December 31,
|
||||||||
|
2012
|
2011
|
|||||||
|
Self-liquidating counter guarantees
|
6,533 | 9,882 | ||||||
|
Preferred counter guarantees
|
27,246 | 9,309 | ||||||
|
Without guarantees
|
554,216 | 276,672 | ||||||
The Bank accounts for checks against it and other banks, as well as other items in process of collection, such as notes, bills and miscellaneous items, in memorandum accounts until such time as the related item clears or is accepted. In the opinion of management, no significant risk of loss exists on these clearing transactions. The amounts of clearing items in process are as follows:
|
December 31,
|
||||||||
|
2012
|
2011
|
|||||||
|
Checks drawn on the Bank pending clearing
|
515,628 | 254,125 | ||||||
|
Checks drawn against other Banks
|
1,404,173 | 720,011 | ||||||
|
Drafts and notes for collection
|
495,183 | 400,241 | ||||||
F-70
BBVA BANCO FRANCÉS S.A. AND SUBSIDIARIES
NOTES TO THE CONSOLIDATED FINANCIAL STATEMENTS—(Continued)
For the fiscal years ended December 31, 2012, 2011 and 2010
Stated in thousands of Pesos
|
|
c)
|
Trust activities
|
See Note 10.
|
NOTE 22—
|
SUMMARY OF SIGNIFICANT DIFFERENCES BETWEEN THE ARGENTINE CENTRAL BANK RULES AND UNITED STATES GENERALLY ACCEPTED ACCOUNTING PRINCIPLES
|
The following is a description of the significant differences between BCRA’s rules followed in the preparation of the Bank’s Consolidated Financial Statements and those applicable in the United States under generally accepted accounting principles (“U.S. GAAP”). References below to “ASC” are to Accounting Standards Codification. Pursuant to the BCRA’s rules, the Bank’s Consolidated Financial Statements recognize the effects of inflation until August 31, 1995 and since January 1, 2002 to February 28, 2003, as mentioned in Note 3.2. As allowed by the U.S. Securities and Exchange Commission under item 18 of Form 20-F, the effect of inflation accounting under BCRA’s rules has not been reversed in the reconciliation to U.S. GAAP.
|
|
22.1.
|
Income taxes
|
As explained in Note 5.1. the Bank determined the charge for income tax applying the effective rate to taxable income estimated for each year considering the effect of temporary differences between book and taxable income. The criterion is in accordance with U.S. GAAP, based on ASC 740-10, Income Taxes: Overall.
Under ASC 740-10, Income Taxes: Overall, deferred tax assets or liabilities are recorded for temporary differences between the financial and tax basis of assets and liabilities. A valuation allowance is provided for the deferred tax assets to the extent that it is more likely than not that they will not be realized.
The following table accounts for the difference between the actual tax provision and the amounts obtained by applying the statutory income tax rate in Argentina to income before income tax in accordance with US. GAAP:
|
December 31,
|
||||||||||||
|
Description
|
2012
|
2011
|
2010
|
|||||||||
|
Income before income tax in accordance with US GAAP
|
2,270,399 | 1,047,051 | 1,393,203 | |||||||||
|
Statutory income tax rate
|
35.00 | % | 35.00 | % | 35.00 | % | ||||||
|
Income tax provision computed at statutory rate
|
794,640 | 366,468 | 487,621 | |||||||||
|
Tax exempt income
|
(48,412 | ) | (79,862 | ) | 56,840 | |||||||
|
Recover / (Charge) of allowances on deferred tax assets
|
— | (16,797 | ) | 253 | ||||||||
|
Other, net
|
(16,933 | ) | 78,435 | 44,388 | ||||||||
|
Income tax computed in accordance with U.S. GAAP
|
729,295 | 348,244 | 589,102 | |||||||||
|
Income tax computed in accordance with BCRA’s rules
|
864,676 | 505,058 | 567,241 | |||||||||
|
Adjustments to reconcile income tax (benefit) to U.S. GAAP
|
(135,381 | ) | (156,814 | ) | 21,861 | |||||||
The “Tax exempt income” adjustment noted above principally relates to gains generated by equity investments, which were not subject to income tax (19,270, 51,437 and 30,358 for the fiscal years ended December 31, 2012, 2011 and 2010, respectively), to the
exempt
ion established during the public debt swap transaction, by which the income generated by the Federal Government secured loans received were exempt in the income tax (1,812, and 330 for the fiscal years ended December 31, 2012, and 2011, respectively).
“Other, net” includes other net effects, and tax exempt income and non-deductible items.
F-71
BBVA BANCO FRANCÉS S.A. AND SUBSIDIARIES
NOTES TO THE CONSOLIDATED FINANCIAL STATEMENTS—(Continued)
For the fiscal years ended December 31, 2012, 2011 and 2010
Stated in thousands of Pesos
The principal components of “Other, net” are explained in the table below:
|
December 31,
|
||||||||||||
|
Concept
|
2012
|
2011
|
2010
|
|||||||||
|
Federal Government secured loans – Decree Nr. 1387/01
|
— | 25,353 | 25,267 | |||||||||
|
Equity method
|
— | 2,362 | (2,112 | ) | ||||||||
|
Real property sales result
|
(25,986 | ) | 2,691 | 2,648 | ||||||||
|
Other expenses
|
5,696 | — | — | |||||||||
|
Fiscal credits recovery
|
— | 4,366 | — | |||||||||
|
Fees to Bank Directors
|
43 | 848 | 774 | |||||||||
|
Non-deductible charges
|
— | 6,741 | 6,621 | |||||||||
|
Portfolio sale
|
(692 | ) | — | — | ||||||||
|
Donations
|
4,076 | 7,517 | 7,431 | |||||||||
|
Retirement insurances
|
— | 419 | 375 | |||||||||
|
Business travel and development non-deductible
|
243 | 557 | 352 | |||||||||
|
Tax fines
|
1 | 3,051 | 3,032 | |||||||||
|
Dividends not computable
|
(350 | ) | — | — | ||||||||
|
Law Nr. 19,640 result
|
— | 10,206 | — | |||||||||
|
Other
|
36 | 14,324 | — | |||||||||
|
Other, net
|
(16,933 | ) | 78,435 | 44,388 | ||||||||
As mentioned in Note 5.2 to the Consolidated Financial Statements, tax on minimum presumed income (“TOMPI”) is a complementary tax to the income tax. The Bank’s tax obligation for each year will coincide with the highest of two taxes, the BCRA income tax and TOMPI. However, if TOMPI exceeds the income tax in a given year, the excess thereof may be computed as a payment on account of any income tax in excess of TOMPI that may occur in any of the following ten years. Since TOMPI is calculated on different basis than income tax (under tax legislation is based on taxable assets and it is not based in income for fiscal years and has no relation with income), it is not included in the line “Income tax computed in accordance with BCRA’s rules”.
As mentioned in Note 5.1 to the Consolidated Financial Statements, “Income tax computed in accordance with BCRA’s rules” corresponds to the Argentine GAAP income tax determined as the estimate of the income tax charge payable to the tax authorities for the relevant fiscal years. Under BCRA’s rules, income / (losses) related to deferred tax method must be classified in the “Other Income / Expenses” line items. Therefore, the deferred income tax amounting to 147,300 and 47,300 for the fiscal years 2012 and 2011, respectively, were classified in the “Other Income” line item of the Consolidated Statement of Operations (see Note 6.m) with the breakdown of Other Income and Other Expense accounts in accordance with BCRA’s rules).
These “BCRA income tax amounts” are not the same as the “income tax and tax on minimum presunted income – TOMPI-” line item in the Argentine GAAP Consolidated Statement of Operations on Page F-9. Under BCRA’s rules, this account should include the current income tax and TOMPI while income (losses) related to deferred tax method must be classified in the “Other Income / Expenses” line item. In the years 2012, 2011 and 2010 and “income tax and TOMPI” account includes income tax 864,676, 552,358 and 315,841, respectively.
Through the deferred tax method, assets and liabilities are recognized for deferred taxes calculated on the temporary differences, to the extent that they have a probability of recovery. As of December 31, 2011, there existed a high degree of recoverability of the recognized net assets of 47,991. As a consequence of the analysis and the change in the evaluation of the recoverability of deferred taxes, we have released the entire provision recorded under US GAAP at December 31, 2010.
Detailed below is the accounting evolution of the allowance and its fiscal impact.
F-72
BBVA BANCO FRANCÉS S.A. AND SUBSIDIARIES
NOTES TO THE CONSOLIDATED FINANCIAL STATEMENTS—(Continued)
For the fiscal years ended December 31, 2012, 2011 and 2010
Stated in thousands of Pesos
The allowances on deferred tax assets in accordance with US GAAP are shown below:
|
December 31,
|
||||||||||||
|
Description
|
2012
|
2011
|
2010
|
|||||||||
|
Accounting evolution
|
||||||||||||
|
Initial Balance
|
— | 47,991 | 47,267 | |||||||||
|
Increase / (loss)
|
— | (47,991 | ) | 724 | ||||||||
|
Final Balance
|
— | — | 47,991 | |||||||||
|
Income Tax
|
||||||||||||
|
Income Tax accounting result
|
— | 47,991 | (724 | ) | ||||||||
|
Allowances on deferred tax assets inicial balance
|
— | (47,991 | ) | (47,267 | ) | |||||||
|
Allowances on deferred tax assets final balance
|
— | — | 47,991 | |||||||||
|
Tax Result
|
— | — | — | |||||||||
The following table accounts for the difference between the actual tax provision under Argentine Central Bank regulations and the income tax computed in accordance with US GAAP:
|
December 31,
|
||||||||||||
|
2012
|
2011
|
2010
|
||||||||||
|
Income tax computed in accordance with BCRA’s rules
|
864,676 | 505,058 | 567,241 | |||||||||
|
Net current Tax adjustment U.S. GAAP
|
(135,381 | ) | (156,814 | ) | 21,861 | |||||||
|
Income tax computed in accordance with US GAAP
|
729,295 | 348,244 | 589,102 | |||||||||
Explained below are the calculations made in order to reconcile the tax determined under BCRA regulations and with the tax determined under US GAAP for the fiscal year ended December 31, 2012.
|
|
1.
|
Adjustments to reconcile income tax (benefit) to U.S. GAAP: Reconciling items between Local GAAP Income Tax and Income Tax in accordance with US GAAP are included in this adjustment.
|
|
|
2.
|
Adjustment in Deferred tax under BCRA: The adjustment includes 147,300 corresponding to the variation between the initial balance and the final balance of the “Deferred tax asset under BCRA”.
|
|
|
3.
|
Adjustment in Deferred tax asset allowance: Existing BCRA regulations do not allow accounting for deferred tax assets. As such, we credit that valuation allowance for the same amount to offset the effect. The impact of this is therefore null on the income statement. Under US GAAP, however, there is an impact on the results because under US GAAP it is possible to account for deferred tax assets based on the argument that such amount will eventually be recovered in the future.
|
Detailed below is a numeric reconciliation for a better comprehension of the above:
F-73
BBVA BANCO FRANCÉS S.A. AND SUBSIDIARIES
NOTES TO THE CONSOLIDATED FINANCIAL STATEMENTS—(Continued)
For the fiscal years ended December 31, 2012, 2011 and 2010
Stated in thousands of Pesos
|
December 31, 2012
|
||||||||
|
Income tax computed in accordance with BCRA´s rules
|
864,676 | |||||||
|
1. Adjustments to reconcile income tax (benefit) to U.S. GAAP
|
(135,381 | ) | ||||||
|
Income tax computed in accordance with US GAAP
|
729,295 | |||||||
|
2.
Deferred tax under BCRA
|
||||||||
|
Deferred tax asset under BCRA (initial Balance)
|
109,600 | |||||||
|
Deferred tax asset under BCRA (final Balance)
|
256,900 | |||||||
|
Adjustment to reconcile net deferred tax asset under U.S. GAAP
|
147,300 | 147,300 | ||||||
|
3.
Deferred tax asset allowance
|
||||||||
|
Deferred tax asset under BCRA (initial Balance)
|
(109,600 | ) | ||||||
|
Deferred tax asset under BCRA (final Balance)
|
(256,900 | ) | ||||||
|
Adjustment to reconcile net deferred tax asset allowance under U.S. GAAP
|
(147,300 | ) | (147,300 | ) | ||||
|
Total Income tax expense in accordance with U.S. GAAP
|
729,295 | |||||||
Explained below are the calculations made in order to reconcile the tax determined under BCRA regulations and with the tax determined under US GAAP for the fiscal year ended December 31, 2011.
|
|
-
|
Net deferred tax asset under BCRA: The adjustment includes the result corresponding to the variation between the initial balance of deferred liabilities and the final balance of deferred assets under BCRA regulations, which is reclassified under BCRA as “Deferred Assets” with conterpart in the “Other income” item. This is so because under BCRA standards the profit / (loss) related to the deferred tax method must be reclassified among the “Other income / expenses”.
|
|
|
-
|
Unrealized losses on securities: The adjustment originates in considering the tax effect included in “Other comprenhensive income” for 215,026.
|
|
|
-
|
Deferred tax under US GAAP: The adjustment includes 371,840 corresponding to the variation between the initial balance and the final balance of the “Net deferred tax asset under US GAAP” and “Net deferred tax asset under BCRA” (net of applications).
|
Detailed below is the numeric reconciliation for a better comprehension of the above:
F-74
BBVA BANCO FRANCÉS S.A. AND SUBSIDIARIES
NOTES TO THE CONSOLIDATED FINANCIAL STATEMENTS—(Continued)
For the fiscal years ended December 31, 2012, 2011 and 2010
Stated in thousands of Pesos
|
December 31, 2011
|
||||||||
|
Income tax (Income tax and TOMPI line item - page F-8)
|
552,358 | |||||||
|
1. Income tax computed in accordance with BCRA´s rules
|
||||||||
|
Deferred tax assets under BCRA (initial balance)
|
62,300 | |||||||
|
Deferred tax assets under BCRA (final balance)
|
109,600 | |||||||
|
Net deferred tax assets under BCRA
|
47,300 | (47,300 | ) | |||||
|
Subtotal - Income tax plus TOMPI
|
505,058 | |||||||
|
2. Unrealized losses on securities
|
215,026 | |||||||
|
3. Deferred tax under U.S. GAAP – Initial balance
|
||||||||
|
Deferred tax assets under US GAAP
|
19,097 | |||||||
|
Deferred tax assets under BCRA
|
62,300 | |||||||
|
Non-deductible application
|
215,400 | |||||||
|
Adjustment to reconcile net deferred tax asset under U.S. GAAP (a)
|
332,797 | |||||||
|
Deferred tax assets under US GAAP – Final balance
|
||||||||
|
Deferred tax assets under US GAAP
|
148,643 | |||||||
|
Deferred tax assets under BCRA
|
109,600 | |||||||
|
Adjustment to reconcile net deferred tax asset under U.S. GAAP (b)
|
39,043 | |||||||
|
Adjustment in Deferred tax (a-b)
|
(371,840 | ) | ||||||
|
Determined tax on US GAAP
|
348,244 | |||||||
ASC 740-10, Income Taxes: Overall requires that an allowance for deferred tax assets is needed when, based on the weight of available evidence, it is more likely than not that some portion of the deferred tax assets will not be realized. The valuation allowance should be sufficient to reduce the deferred tax assets to the amount that is more likely than not to be realized.
Accordingly, the Bank has assessed all available evidence to determine the amount of valuation allowance needed, including financial and tax projections. As a result, based on the weight of that evidence, the Bank reduced the valuation allowance in 256,900, 109,600 and 265,709 as of December 31, 2012, 2011 and 2010, respectively.
Deferred tax assets (liabilities) are summarized as follows:
F-75
BBVA BANCO FRANCÉS S.A. AND SUBSIDIARIES
NOTES TO THE CONSOLIDATED FINANCIAL STATEMENTS—(Continued)
For the fiscal years ended December 31, 2012, 2011 and 2010
Stated in thousands of Pesos
|
December 31,
|
||||||||||||
|
Description
|
2012
|
2011
|
2010
|
|||||||||
|
Deferred tax assets:
|
||||||||||||
|
Loans
|
58,653 | 15,546 | — | |||||||||
|
Loan origination and issuance credit card’s fees
|
50,620 | 41,611 | 29,383 | |||||||||
|
Property, equipment and miscellaneous assets
|
38,589 | 31,776 | 27,437 | |||||||||
|
Other liabilities
|
52,170 | 39,844 | 44,289 | |||||||||
|
Allowance for loss contingencies
|
250,792 | 191,769 | 209,387 | |||||||||
|
Other
|
28,009 | — | 5,007 | |||||||||
| 478,833 | 320,546 | 315,503 | ||||||||||
|
Deferred tax liabilities:
|
||||||||||||
|
Government and private securities valuation
|
(111,799 | ) | (138,089 | ) | (200,923 | ) | ||||||
|
Loans
|
— | — | (15,707 | ) | ||||||||
|
Foreign exchange difference
|
(13,576 | ) | (22,728 | ) | (23,540 | ) | ||||||
|
Intangible assets
|
(18,086 | ) | (5,073 | ) | — | |||||||
|
Others
|
(46,538 | ) | (6,013 | ) | — | |||||||
|
Reserves from insurance activities
|
— | — | (94,430 | ) | ||||||||
| (189,999 | ) | (171,903 | ) | (334,600 | ) | |||||||
|
Net deferred tax asset / (liability) under U.S. GAAP
|
288,834 | 148,643 | (19,097 | ) | ||||||||
|
Net deferred tax asset in accordance with BCRA’s rules
|
256,900 | 109,600 | 62,300 | |||||||||
|
Adjustment to reconcile net deferred tax assets / (liability) to U.S. GAAP
|
31,934 | 39,043 | (81,397 | ) | ||||||||
|
Allowances on deferred tax assets in accordance with BCRA’s rules
|
(256,900 | ) | (109,600 | ) | (62,300 | ) | ||||||
|
Allowances on deferred tax assets in accordance with US GAAP
|
— | — | (47,991 | ) | ||||||||
|
Adjustment to reconcile Allowances on deferred tax assets to U.S. GAAP
|
256,900 | 109,600 | 14,309 | |||||||||
|
Net deferred tax asset / (liability) under U.S. GAAP – Net of allowances
|
288,834 | 148,643 | (67,088 | ) |
The natures of the most significant components of the deferred tax asset or liability are described as follows:
|
|
§
|
Government and private securities valuation: as mentioned in Note 22.5. all unlisted government and private securities and those with non-representative valuation, were adjusted at fair value, thus causing a increase/decrease in their accounting value, which does not comply with the conditions required for them to be taxable in the fiscal years ended December 31, 2012, 2011 and 2010.
|
|
|
§
|
Loans: as regards deduction of uncollectible accounts, effective Argentine tax rules require the existence of certain uncollectibility indicators defined in the Income Tax Law (i.e.: to begin court proceedings or bankruptcy adjudication), whereas under accounting criteria uncollectibility charges are recorded on the basis of assessing the debtor’s payment capacity. This difference principally relates to the accounting registration of the impairment that took place in the loans to the provincial governmental sector and to other public sector agencies (see Note 22.4.4.), which, as mentioned above, does not comply with the indicators required to be tax-deductible. In addition, it includes the difference between account and tax recognition of income of Federal Government secured loans.
|
|
|
§
|
Loan origination and issuance credit card’s fees: deferred assets result from differences in the U.S. GAAP accounting and tax criteria used to assess expense accruals of them (Note 22.2.).
|
|
|
§
|
Property, equipment and miscellaneous assets: under tax criteria, PP&E depreciation is determined on values equivalent to the acquisition cost of the respective PP&E items and by the full-year-of-addition depreciation method. Under accounting criteria, depreciation is determined on values equivalent to the acquisition cost restated
|
F-76
BBVA BANCO FRANCÉS S.A. AND SUBSIDIARIES
NOTES TO THE CONSOLIDATED FINANCIAL STATEMENTS—(Continued)
For the fiscal years ended December 31, 2012, 2011 and 2010
Stated in thousands of Pesos
|
|
|
by inflation as explained in Note 3.2. and on the basis of the months of useful life elapsed from addition date through valuation date.
|
|
|
§
|
Other liabilities: deferred assets/liabilities result from differences in the accounting and tax criteria used to assess expense accruals such as accrual for dismissals calculation.
|
|
|
§
|
Allowance for loss contingencies: as regards deduction of loss contingencies, effective Argentine tax rules require the existence of certain indicators defined in the Income Tax Law (i.e. final judgment), whereas under accounting criteria, loss contingencies charges are recorded on the basis of the estimated amounts necessary to meet contingencies of probable occurrence.
|
|
|
§
|
Reserves from insurance activities: deferred assets result from differences between the U.S. GAAP accounting and the accounting standards established by the Superintendence of Pension Fund Administrators and the National Superintendence of Assurance.
|
As of December 31, 2012, 2011 and 2010 the Bank (on individual basis) does not carry accumulated tax loss carry-forwards.
The adjustments required in order reconciling assets and liabilities with the U.S. GAAP, as detailed in the following notes, are shown considering their effect on the income tax. The effect over continued operations of reflecting such adjustments on the Bank’s net assets causes them to increase by 271,401 and 128,900 as of December 31, 2012 and 2011, respectively and decrease by 25,003 as of December 31, 2010. In addition, income would have increased by 137,691 and 9,920 as of December 31, 2012 and 2010, respectively, and would have decreased by 61,123 as of December 31, 2011.
The effect over discontinued operations of reflecting such adjustments on the Bank’s net assets causes them to increase by 17,433 and 19,743 as of December 31, 2012 and 2011, respectively, and would have decreased by 42,085 as of December 31, 2010. On the other hand, income would have decreased by 2,310 and 32,505 as of December 31, 2012 and 2010, respectively, and would have increased by 61,828 as of December 31, 2011.
The Bank understands that there is not significant uncertainty related to income tax benefits.
Tax on minimum presumed income
As of December 31, 2012, 2011 and 2010, the Income tax assessed was higher than the TOMPI. Therefore, a provision was raised for Income tax for such fiscal years.
|
|
22.2.
|
Loan origination and issuance credit card’s fees
|
The Bank recognizes fees on credit card products, consumer loans and acceptances when collected and charges direct origination costs when incurred. In accordance with U.S. GAAP, particularly under ASC 310-20, Receivables: Nonrefundable Fees and Other Costs, loan origination fees and certain direct loan origination costs should be recognized over the life of the related loan as an adjustment of yield.
The effects of adjustments over continued operations required to state such amounts in accordance with US. GAAP would be decreased assets by 144,628, 108,509 and 77,978 at December 31, 2012, 2011 and 2010, respectively. On the other hand, income over continued operations for the fiscal years ended December 31, 2012, 2011 and 2010 would have decreased by 36,119, 30,531 and 22,413, respectively.
These adjustments do not have effects over discontinued operations.
F-77
BBVA BANCO FRANCÉS S.A. AND SUBSIDIARIES
NOTES TO THE CONSOLIDATED FINANCIAL STATEMENTS—(Continued)
For the fiscal years ended December 31, 2012, 2011 and 2010
Stated in thousands of Pesos
|
22.3.
|
Intangible assets
|
The Bank amortizes software development expenses (included in organization and development expenses) over their estimated useful life, up to a maximum of 60 months. US. GAAP, in accordance with the ASC 350-40, Intangibles-Goodwill and Other: Internal-Use Software, requires that part of such expenses be written off to income when incurred, depending on their characteristics.
Regulations established by the Pension Fund Manager Superintendency, the agency overseeing Consolidar AFJP S.A., authorized the capitalization of disbursements made through September 25, 1994, for “salaries, advertising, software, agent’s commissions, fees, brochures, forms printing and leases and rentals”, as the most significant items. Consolidar AFJP S.A. capitalized expenses incurred in connection with the launch of new activities. Under U.S. GAAP, the above mentioned expenses are to be considered as expenses for the fiscal year in which they are incurred.
The effects of adjustments over continued operations required to state such amounts in accordance with US. GAAP would have decreased income by 6 at December 31, 2010.
The effects of adjustments over discontinued operations required to state such amounts in accordance with US. GAAP would have increased income by 3 at December 31, 2010.
|
|
22.4.
|
Loan loss reserve
|
The Bank provides for losses on loans generally through specific allocations on a loan-by-loan basis, once the loan becomes classified in a category which indicates that collectibility may be impaired, and also through mandatory general provisions on performing loans, which serves to cover inherent loan losses for which specific provisions have not been made (see Note 3.4.5.).
ASC 310-10, Receivables: Overall, requires that an allowance for loan losses be maintained to cover estimated losses inherent in the loan portfolio. Under this concept, the specific allowances identified for individual loans or pools of loans are supplemented by an amount provided for inherent loan losses estimated to have been incurred but which are not identified based on individual loan reviews. The amount of inherent loss for loans not specifically provided is estimated based upon evaluation of historical write-off experience, mix of loans and other factors. BBVA Francés writes-off loans when believe that recovery is unlikely and, in any event, no later than seven months after a loan has been classified as “irrecoverable” without preferred guarantees and after 100% allowances have been recognized.
The Bank’s accounting for its loan loss reserve differs in some respects with practices of U.S.-based banks, as discussed below in Notes 22.4.1, 22.4.2, 22.4.3 and 22.4.4.
The following table discloses the amounts required by ASC 310-10, Receivables: Overall, as of December 31, 2012, 2011 and 2010:
|
|
December 31,
|
|||||||||||
|
2012
|
2011
|
2010
|
||||||||||
|
—Total amount of loans considered as impaired
|
373,013 | 212,653 | 162,784 | |||||||||
|
Amount of loans considered as impaired for which there is a related allowance for credit losses
|
373,013 | 212,653 | 162,784 | |||||||||
|
—Reserves allocated to impaired loans
|
172,664 | 105,457 | 93,834 | |||||||||
|
—Average balance of impaired loans during the fiscal year
|
323,276 | 188,253 | 183,083 | |||||||||
F-78
BBVA BANCO FRANCÉS S.A. AND SUBSIDIARIES
NOTES TO THE CONSOLIDATED FINANCIAL STATEMENTS—(Continued)
For the fiscal years ended December 31, 2012, 2011 and 2010
Stated in thousands of Pesos
Under U.S. GAAP, the activity in the allowance for loan losses for the fiscal years presented is as follows:
|
December 31,
|
||||||||||||
|
2012
|
2011
|
2010
|
||||||||||
|
Balance at the beginning of the fiscal year
|
264,041 | 180,695 | 132,754 | |||||||||
|
Provision for loan losses
|
242,143 | 168,799 | 168,200 | |||||||||
|
Charge-offs
|
(180,297 | ) | (85,453 | ) | (120,259 | ) | ||||||
|
Balance at the end of the fiscal year
|
325,887 | 264,041 | 180,695 | |||||||||
|
22.4.1.
|
Interest recognition—non-accrual loans
|
The method applied to recognize income on loans is described in Note 3.4.6.
Additionally, the Bank has made use of the option granted by the BCRA authorizing financial entities to interrupt the accrual of interest for clients in the following categories:
|
|
-
|
“With problems”; “With high risk of insolvency” and “Irrecoverable” in the commercial portfolio.
|
|
|
-
|
“Medium risk”; “High risk” and “Irrecoverable” in the consumer portfolio.
|
According to the above, the threshold for suspending the accrual of interest is as from 91 days of arrears. Resumption of interest accrual takes place when the client improves its situation passing to situation:
|
|
-
|
“Normal” or “With special tracking – Under observation” in the commercial portfolio.
|
|
|
-
|
“Normal” or “Low risk” in the consumer portfolio.
|
Accrued interest remains on the Banks books and is considered a part of the loan balance. It allowances in its whole when the Bank determined the reserve for credit losses.
The Bank recognizes interest income on a cash basis for non-accrual loans. ASC 310-10, Receivables: Overall, requires that if the collectibility of the principal of the non-accrual loan is in doubt, cash payments should be applied to reduce the principal to the extent necessary to remove such doubt. Management believes that the effect of this difference in interest recognition is not material to the Bank’s Consolidated Statements of Operations taken as a whole.
|
22.4.2.
|
Impaired loans—Non-Financial Private Sector and residents abroad
|
ASC 310-10, Receivables: Overall, requires a creditor to measure impairment of a loan based on the present value of expected future cash flows discounted at the loan’s effective interest rate, or at the loan’s observable market price or the fair value of the collateral if the loan is collateral dependent. This Standard is applicable to all loans (including those restructured in a troubled debt restructuring involving a modification of terms), except large groups of smaller-balance homogenous loans that are collectively evaluated for impairment. The Bank considers commercial loans over 1,500 for individual impairment evaluations. Loans are considered impaired when, based on management’s evaluation, a borrower will not be able to fulfill its obligation under the original terms of the loan.
In classifying its clients, the Bank follows the guidelines set forth by the BCRA, which establishes a number of objective guidelines both for determining portfolios and for classification levels within them. Doubtful clients are those classified as “With problem”, “High Risk of Insolvency” and “Irrecoverable” for Commercial loans, and “Medium Risk”, “High Risk” and “Irrecoverable” for Consumer loans.
|
|
-
|
Consumer / Commercial-like consumer portfolio: the main criterion for classifying a client is the number of days past due (more than 90 days is considered as doubtful), and the Bank also considers refinancing transactions, present payment agreements resulting from judicial or extrajudicial proceedings, requests for composition
|
F-79
BBVA BANCO FRANCÉS S.A. AND SUBSIDIARIES
NOTES TO THE CONSOLIDATED FINANCIAL STATEMENTS—(Continued)
For the fiscal years ended December 31, 2012, 2011 and 2010
Stated in thousands of Pesos
|
|
|
proceedings or preventive extrajudicial agreement not yet homologated and bankruptcy among others. To calculate the allowance required for smaller-balance impaired loans, in accordance with US GAAP, historical loss ratios are determined by analyzing historical losses. Loss estimates are analyzed by loan type for homogeneous groups of clients. Such historical ratios are updated to incorporate the most recent data reflecting current economic conditions, trends and any other pertinent information that may affect the estimation of the allowance for loan losses.
|
|
|
-
|
Commercial portfolio: the objective basis is the repayment capacity according to the client’s projected funds flow. The classification of a client may also be influenced by: the existence of refinancing transactions, present payment agreements resulting from judicial or extrajudicial proceedings, requests for composition proceedings or extrajudicial preventive agreement not yet homologated and bankruptcy among others. Such treatment is consistent with US GAAP.
|
Had U.S. GAAP been applied over continued operations, the Bank’s assets would have increased by 197,970, 180,932 and 215,532 at December 31, 2012, 2011 and 2010, respectively. On the other hand, the income would have increased by 17,038 and 10,600 at December 31, 2012 and 2010, respectively, and would have decreased by 34,600 at December 31, 2011.
These adjustments do not have effects over discontinued operations.
The Bank recalculates its allowances for loan losses considering the criteria set forth by the US GAAP and makes the necessary adjustments as indicated in the table below (which shows the impact on the shareholders’ equity of BBVA Francés):
|
2012
|
2011
|
2010
|
||||||||||||||||||||||||||||||||||
|
BCRA
|
US GAAP
|
Diff.
|
BCRA
|
US GAAP
|
Diff.
|
BCRA
|
US GAAP
|
Diff.
|
||||||||||||||||||||||||||||
|
Commercial-like consumer
|
30,622 | 60,772 | (30,150 | ) | 21,697 | 61,028 | (39,331 | ) | 18,668 | 28,074 | (9,406 | ) | ||||||||||||||||||||||||
|
Consumer
|
315,528 | 106,859 | 208,669 | 238,475 | 73,507 | 164,968 | 238,835 | 47,738 | 191,097 | |||||||||||||||||||||||||||
|
Commercial
(sit 2-6)
|
12,372 | 12,372 | — | 5,811 | 5,811 | — | 9,854 | 9,854 | — | |||||||||||||||||||||||||||
|
Commercial (sit 1)
|
165,335 | 145,884 | 19,451 | 178,990 | 123,695 | 55,295 | 115,949 | 95,029 | 20,920 | |||||||||||||||||||||||||||
|
Non specific
|
— | — | — | — | — | — | 12,921 | — | 12,921 | |||||||||||||||||||||||||||
|
Total
|
523,857 | 325,887 | 197,970 | 444,973 | 264,041 | 180,932 | 396,227 | 180,695 | 215,532 | |||||||||||||||||||||||||||
|
|
-
|
Refinancing, restructuring and renegotiation programs
|
According to BCRA regulations, a refinancing is considered to exist whenever any of the original contractually agreed conditions for a financing transaction (term, capital, interest or rate) are modified. The Central Bank does not define such terms as “restructuring” and “renegotiation”, which we understand to be included in the above-mentioned refinancing definition.
The amount of refinanced transactions as of December 31, 2012 and 2011 were 124,661 and 100,072, respectively.
The total of refinancing transactions granted during 2012 amounted to 89,413, of which 72.82% was in the performing portfolio (which are less than 90 days in arrears) as of December 31, 2012.
The total of refinancing transactions granted during 2011 amounted to 42,089, of which 57% were in the performing portfolio (which are less than 90 days in arrears) as of August 31, 2012.
The table below shows the number of restructured loans by portfolio segment, their outstanding amounts and their correspondent allowance for loan losses (i) at the time the restructuring was effected, (ii) one month before the
F-80
BBVA BANCO FRANCÉS S.A. AND SUBSIDIARIES
NOTES TO THE CONSOLIDATED FINANCIAL STATEMENTS—(Continued)
For the fiscal years ended December 31, 2012, 2011 and 2010
Stated in thousands of Pesos
restructuring, (iii) twelve months before the restructuring, and (iv) twelve months after the restructuring. It also includes the variation in the amount of allowances for loan losses between such periods.
Even when the information is at December 31, 2012, the loans which were restructured during the last months of the year have been outstanding less than 12 months and therefore the information shows partial values.
It is possible to observe in the table the variation of the allowances for loan losses during 2012 and 2011, which was similar in both years, and the positive impact of the restructuring. In particular, the table shows how the amount of allowances for loan losses decreased as the level of restructurings loans increased.
|
2012
|
2011
|
||||||||||||||||||||||||
|
-12 months
|
-12 months
|
||||||||||||||||||||||||
| Q |
Outstanding amount
|
Allowance
|
Q |
Outstanding amount
|
Allowance
|
||||||||||||||||||||
|
Restructured loans
|
Restructured loans
|
||||||||||||||||||||||||
|
Consumer
|
5,221 | 60,783 | 1,838 |
Consumer
|
4,038 | 32,630 | 2,503 | ||||||||||||||||||
|
Commercial
|
2 | 5,766 | 72 |
Commercial
|
— | — | — | ||||||||||||||||||
| 5,223 | 66,549 | 1,910 | 4,038 | 32,630 | 2,503 | ||||||||||||||||||||
|
-1 months
|
-1 months
|
||||||||||||||||||||||||
| Q |
Outstanding amount
|
Allowance
|
Q |
Outstanding amount
|
Allowance
|
||||||||||||||||||||
|
Restructured loans
|
Restructured loans
|
||||||||||||||||||||||||
|
Consumer
|
5,221 | 86,448 | 34,918 |
Consumer
|
4,038 | 42,096 | 23,135 | ||||||||||||||||||
|
Commercial
|
2 | 6,652 | 592 |
Commercial
|
— | — | — | ||||||||||||||||||
| 5,223 | 93,100 | 35,510 | 4,038 | 42,096 | 23,135 | ||||||||||||||||||||
|
Current month
|
Current month
|
||||||||||||||||||||||||
| Q |
Outstanding amount
|
Allowance
|
Q |
Outstanding amount
|
Allowance
|
||||||||||||||||||||
|
Restructured loans
|
Restructured
Loans
|
||||||||||||||||||||||||
|
Consumer
|
5,221 | 85,555 | 31,294 |
Consumer
|
4,038 | 42,089 | 20,213 | ||||||||||||||||||
|
Commercial
|
2 | 3,848 | 38 |
Commercial
|
— | — | — | ||||||||||||||||||
| 5,223 | 89,413 | 31,332 | 4,038 | 42,089 | 20,213 | ||||||||||||||||||||
|
+12 months
|
+12 months
|
||||||||||||||||||||||||
| Q |
Outstanding amount
|
Allowance
|
Q |
Outstanding amount
|
Allowance
|
||||||||||||||||||||
|
Restructured loans
|
Restructured loans
|
||||||||||||||||||||||||
|
Consumer
|
5,221 | 72,243 | 16,606 |
Consumer
|
4,038 | 21,557 | 2,387 | ||||||||||||||||||
|
Commercial
|
2 | 3,471 | 99 |
Commercial
|
— | — | — | ||||||||||||||||||
| 5,223 | 75,714 | 16,705 | 4,038 | 21,557 | 2,387 | ||||||||||||||||||||
|
Variation -12 months vs Current month
|
1,540.1% |
Variation -12 months vs Current month
|
707.4% | ||||||||||||||||||||||
|
Variation -1 months vs Current month
|
(11.8)% |
Variation -1 months vs Current month
|
(12.6)% | ||||||||||||||||||||||
|
Variation +12 months vs Current month
|
(46.7)% |
Variation +12 months vs Current month
|
(88.2)% | ||||||||||||||||||||||
F-81
BBVA BANCO FRANCÉS S.A. AND SUBSIDIARIES
NOTES TO THE CONSOLIDATED FINANCIAL STATEMENTS—(Continued)
For the fiscal years ended December 31, 2012, 2011 and 2010
Stated in thousands of Pesos
During 2011, no loan was restructured in our commercial segment. In 2012 there were only two restructuring transactions affecting debtors whose financial situation had deteriorated. In one case additional guarantees of the loan were provided as part of the restructuring; in the other case, the existing guarantees were maintained. As of the date of issuance of these Consolidated Financial Statements, none of these debtors are in default of their payment obligations.
As for the consumer segment, all the restructuring transactions effected during 2012 and 2011 had the following characteristics: (i) the debtor had paid, at a minimum, one installment in advance in order to qualify to the restructuring of its debt; (ii) we made sure before the restructuring that the debtor’s monthly payment capacity would be able to absorb the new monthly paying obligation resulting from the restructuring; (iii) the guarantees in force were in all cases maintained or, in the case of loans without guarantees, the execution capacity for the loan was improved; and (iv) all the restructurings currently in force are arranged in consecutive monthly payments, with a minimum of six months and a maximum of 60 months.
|
|
-
|
Troubled debt restructurings loans (“TDR”)
|
We concluded that all our refinanced loans comply with the conditions for considering them as troubled debt restructuring (“TDR”) as defined under US GAAP. In accordance with ASC 310-40 a restructured loan is considered a TDR if the debtor is experiencing financial difficulties and the Bank grants a concession to the debtor that would not otherwise be considered. Concessions granted could include: reduction in interest rate to rates that are considered below market, extension of repayment schedules and maturity dates beyond original contractual terms.
Loans considered TDR for the years ended December 31, 2012 and 2011 were as follows:
|
2012
|
||||
|
Troubled debt restructuring
|
Number of contracts
|
Post-modification outstanding recorded investment
|
||
|
Commercial
|
||||
|
Others
|
3
|
16,320
|
||
|
Consumer
|
||||
|
Personal Loans
|
8,265
|
94,140
|
||
|
Mortgage
|
210
|
6,754
|
||
|
Others
|
47
|
7,447
|
||
|
8,525
|
124,661
|
|||
|
2011
|
||||
|
Troubled debt restructuring
|
Number of contracts
|
Post-modification outstanding recorded investment
|
||
|
Commercial
|
||||
|
Others
|
14
|
30,133
|
||
|
Consumer
|
||||
|
Personal Loans
|
10,764
|
68,618
|
||
|
Mortgage
|
21
|
502
|
||
|
Others
|
43
|
819
|
||
|
10,842
|
100,072
|
|||
F-82
BBVA BANCO FRANCÉS S.A. AND SUBSIDIARIES
NOTES TO THE CONSOLIDATED FINANCIAL STATEMENTS—(Continued)
For the fiscal years ended December 31, 2012, 2011 and 2010
Stated in thousands of Pesos
We consider a TDR that have subsequently defaulted if the borrower has failed to make payments of either principal, interest or both for a period of 90 days or more from contractual due date. Loans considered TDR that have defaulted during the year ended December 31, 2012 and 2011 were as follows:
|
2012
|
||||
|
Troubled debt restructuring that subsequently defaulted
|
Number of contracts
|
Recorded investment
|
||
|
Consumer
|
||||
|
Personal Loans
|
1,378
|
17,749
|
||
|
Mortgage
|
1
|
63
|
||
|
Others
|
3
|
198
|
||
|
1,382
|
18,010
|
|||
|
2011
|
||||
|
Troubled debt restructuring that subsequently defaulted
|
Number of contracts
|
Recorded investment
|
||
|
Commercial
|
||||
|
Others
|
2
|
1
|
||
|
Consumer
|
||||
|
Personal Loans
|
1,914
|
11,159
|
||
|
1,916
|
11,160
|
|||
|
|
-
|
Past due loans
|
The tables below disclose an aging analysis of our past due loans for December 31, 2012 and 2011:
|
Past due loans
|
||||||||||||||||
|
30 – 59 days
|
60 – 89 days
|
More than 90 days
|
Total
December 31, 2012
|
|||||||||||||
|
To non-financial private sector and residents abroad:
|
6,541 | 4,398 | 106,656 | 117,595 | ||||||||||||
|
Discounted instruments
|
— | — | 1,531 | 1,531 | ||||||||||||
|
Real estate mortgage
|
24 | 148 | 2,650 | 2,822 | ||||||||||||
|
Collateral loans
|
1,249 | 406 | 37,725 | 39,380 | ||||||||||||
|
Consumer
|
4,344 | 2,369 | 32,300 | 39,013 | ||||||||||||
|
Credit cards
|
648 | 631 | 11,019 | 12,298 | ||||||||||||
|
Other
|
276 | 844 | 21,431 | 22,551 | ||||||||||||
|
Total
|
6,541 | 4,398 | 106,656 | 117,595 | ||||||||||||
|
Past due loans
|
||||||||||||||||
|
30 – 59 days
|
60 – 89 days
|
More than 90 days
|
Total
December 31, 2011
|
|||||||||||||
|
To non-financial private sector and residents abroad:
|
1,488 | 1,239 | 61,021 | 63,748 | ||||||||||||
|
Overdraft
|
52 | 157 | 9,290 | 9,499 | ||||||||||||
|
Discounted instruments
|
7 | 17 | 3,152 | 3,176 | ||||||||||||
|
Real estate mortgage
|
63 | 272 | 2,415 | 2,750 | ||||||||||||
|
Collateral loans
|
872 | 33 | 15,029 | 15,934 | ||||||||||||
|
Consumer
|
287 | 594 | 23,274 | 24,155 | ||||||||||||
|
Credit cards
|
207 | 166 | 6,941 | 7,314 | ||||||||||||
|
Other
|
— | — | 920 | 920 | ||||||||||||
|
Total
|
1,488 | 1,239 | 61,021 | 63,748 | ||||||||||||
F-83
BBVA BANCO FRANCÉS S.A. AND SUBSIDIARIES
NOTES TO THE CONSOLIDATED FINANCIAL STATEMENTS—(Continued)
For the fiscal years ended December 31, 2012, 2011 and 2010
Stated in thousands of Pesos
|
22.4.3.
|
Federal Government Secured Loans
|
During the fiscal year ended December 31, 2001, and pursuant to Decrees Nr. 1387/01 and 1646/01, the Bank and its subsidiaries swapped a portion of their holdings in federal government securities outstanding as of November 6, 2001, for a face value of U.S.$3,291,795 thousands, for Federal Government secured loans amounting to U.S.$3,360,403 thousands.
As provided for in BCRA’s Communications “A” 3366 and “A” 3385, the initial value of the certificates matched that of the prior book value as of the date of the swap. BCRA rules determined that these securities had to be recorded at their amortized cost which was significantly higher than the market value. No impairment was recorded as these assets are not subject to impairment under Argentine banking GAAP.
As of December 31, 2001, the above mentioned debt swap was subject to the provisions of ASC 320-10, Investments-Debt and Equity Securities: Overall. According to ASC 320-10
an “other than temporary impairment” affects the swapped obligations and therefore requires that, in the event of such obligations having been classified as “held to maturity”, a loss be recorded for the difference between the book value of the obligation so swapped and its quotation at the date of the swap, as such quotation is understood to be the best measure for recognizing the above-mentioned impairment. In this case, the listed value of the securities was much lower than the accounting value under BCRA’s standards. Once this impairment was recognized under US GAAP in fiscal year 2001, the new book value of the obligations to be swapped will constitute the initial value of the new loans received. As from such date, the Bank recorded these loans considering the mentioned value plus the related CER adjustment and the interest accretion.
According to ASC 310-20, Receivables: Nonrefundable Fees and Other Costs, the Bank recognizes income for each fiscal year using the accretion interest method.
For subsequent periods, management evaluates the collection of these loans on a regular basis, and considers that such loans are not impaired in accordance with ASC 310-10, Receivables: Overall. In addition, the carrying amount under US GAAP is significantly lower than the principal of such loans and the discounted cash flows expected to be received from these loans. Therefore, the Bank has not recorded an allowance for such loans.
In the fiscal years for 2012, 2011 and 2010 the Bank’s equity was adjusted according to the difference between the valuation of the holdings of these assets at the close of each year under both US and Argentine Banking GAAP, as detailed below:
|
December 31,
|
||||||||||||
|
2012
|
2011
|
2010
|
||||||||||
|
Guaranteed loan portfolio under BCRA
|
34,672 | 30,305 | 656,906 | |||||||||
|
Guaranteed loan portfolio under USGAAP
|
34,672 | 30,305 | 578,878 | |||||||||
|
Difference – Reconciliation adjustment
|
— | — | 78,028 | |||||||||
The variation in the guaranteed loan portfolio during the fiscal year ended at December 31, 2011 was mainly due to the sale of our subsidiary Consolidar Retiro and the totally amortization of the guaranteed loan Global 2008 that was registered by BBVA Francés.
The effects of adjustments over discontinued operations required to state such amounts in accordance with U.S. GAAP would have decreased assets by 78,028 at December 31, 2010. On the other hand, the income would had increased by 78,028 as of December 31, 2011 and would have decreased by 5,971 for the fiscal year ended December 31, 2010.
|
22.4.4.
|
Argentine Government Notes
|
On January 28, 2009 and February 25, 2009 the Board of Directors of Consolidar Cía. de Seguros de Retiro S.A. exercised the exchange option provided by Resolution Nr. 5 of the Secretariat of Finance in connection with its
F-84
BBVA BANCO FRANCÉS S.A. AND SUBSIDIARIES
NOTES TO THE CONSOLIDATED FINANCIAL STATEMENTS—(Continued)
For the fiscal years ended December 31, 2012, 2011 and 2010
Stated in thousands of Pesos
holdings of Federal Government secured loans ex-Bonte 2006 and Global 2008 and those received from the financial trusts made up by said loans. Their face values were 131,017 and 3,233 respectively, receiving in exchange 413,653 in face value of Argentine Government notes in Pesos, accruing the private BADLAR rate plus 275 basis points and maturing in 2014 (
“Pagaré de la Nación Argentina en Pesos BADLAR Privada plus 275 pbs Vto 2014”
).
As provided for National Superintendence of Insurance (SSN), the initial value of the notes matched that of the prior book value as of the date of the swap. SSN rules determined that these loans had to be recorded at their amortized cost. No impairment was recorded as these assets are not subject to impairment under Argentine banking GAAP.
As of December 31, 2010 the above mentioned debt swap was subject to the provisions of ASC 310-30 Restructured or Refinanced Loans. According to ASC 310-30, if an investor subsequently refinances or restructures the loan, other than through a troubled debt restructuring, the refinanced or restructured loan shall not be accounted for as a new loan.
According to ASC 310-20, Receivables: Nonrefundable Fees and Other Costs, the Bank recognizes income for each fiscal year using the accretion interest method.
Management evaluates the collection of these notes on a regular basis, and considers that such notes are not impaired in accordance with ASC 310-10, Receivables: Overall. In addition, the carrying amount under US GAAP is significantly lower than the principal of such notes and the discounted cash flows expected to be received from these notes. Therefore, the Bank has not recorded an allowance for such notes.
The effects of adjustments over discontinued operations required to state these amounts in accordance with U.S. GAAP would have decreased assets by 21,644 at December 31, 2010. On the other hand, the income for the fiscal years ended December 31, 2011 and 2010 would have increased by 21,664 and 9,908, respectively.
|
22.5.
|
Government and other debt securities—Available for sale
|
During the fiscal year 2005, as a result of the Government’s debt restructuring, the Bank received for the defaulted portfolio Dollar-denominated Discount bonds that amounted to U.S.$26,083, and Peso-denominated Discount bonds that amounted to Ps.146,818. During the fiscal year 2006, the Bank swapped Provincial Development Trust Fund Corporate Bonds into BOGAR 2020, the face value of the corporate bonds swapped amounted to 551,230,672.
On January 30, 2009 the Bank exchanged Global 2008 secured loans at variable interest rate and maturing in 2011 for a nominal value of 321,340 (whose technical value on the date of the exchange was 1,018,447) for bonds issued by the Argentine Government, denominated in pesos and accruing interest at the private BADLAR rate plus 275 basis points and maturing in 2014.
According to U.S. GAAP, the Bank decided to classify these Government Securities as available for sale and carried at fair value (market value if available), with unrealized gains and losses reported as a net amount, net of income tax, within the stockholder’s equity accounts. However, ASC 320-10, Investments-Debt and Equity Securities: Overall, requires that if the decline in fair value is judged to be other than temporary, the cost of the security shall be written down to fair value, and the amount of the write down shall be included in earnings /(losses). This valuation criteria differ from BCRA’s rules, as described in Note 3.4.2.
Had U.S. GAAP been applied over continued operations, the Bank’s assets would have decreased by 3,360, 5,752 and 1,930 at December 31, 2012, 2011 and 2010, respectively. On the other hand, the income for the fiscal years ended December 31, 2012 and 2011 would have increased by 16,135 and 213,026, respectively, and for the fiscal year ended December 31, 2010 would had decreased by 403,774.
Had U.S. GAAP been applied over discontinued operations, the Bank’s assets would have increased by 207,797 at December 31, 2010. On the other hand, the income for the fiscal year ended December 31, 2011 would have increased by 101,585 and for the fiscal year ended December 31, 2010 would have decreased by 76,868.
F-85
BBVA BANCO FRANCÉS S.A. AND SUBSIDIARIES
NOTES TO THE CONSOLIDATED FINANCIAL STATEMENTS—(Continued)
For the fiscal years ended December 31, 2012, 2011 and 2010
Stated in thousands of Pesos
At December 31, 2012 and 2011 and under BCRA regulations, the securities included in this classification are carried at fair values with changes in fair value reflected in net income (see Note 3.4.2). As explained, the losses or (gains) recognized under US GAAP for securities classified as available for sale are mainly related to gains (or losses) for securities at fair value under BCRA regulations (whose results are reflected as losses / gains for the fiscal year).
Under US GAAP, the difference between fair value and amortized cost is reflected in Other Comprehensive Income (OCI). Therefore the results of continued operations under US GAAP mainly correspond to losses recorded under BCRA regulations.
In accordance with net income from discontinued operations, they are due to the reversal of adjustments corresponding to Consolidar Retiro SA as of December 31, 2010 under US GAAP, as a consequence of the sale of the company (see Note 1.4). At December 31, 2011 they amounted to 101,585 (207,797 loss and 309,382 gain corresponding to results recorded under OCI).
To such effects, the following adjustments were made:
|
US GAAP stockholder equity
|
Result (a)
|
Gross unrealized (Loss) / Gains (b)
|
Net income
(a – b)
|
|||||||||||||||||||||||||||||||||||||||||||||
|
December 31,
|
December 31,
|
December 31,
|
December 31,
|
|||||||||||||||||||||||||||||||||||||||||||||
|
2012
|
2011
|
2010
|
2012
|
2011
|
2010
|
2012
|
2011
|
2010
|
2012
|
2011
|
2010
|
|||||||||||||||||||||||||||||||||||||
|
Continued operations
|
(3,360 | ) | (5,752 | ) | (1,930 | ) | 2,392 | (3,822 | ) | (264 | ) | (13,743 | ) | (216,848 | ) | 403,510 | 16,135 | 213,026 | (403,774 | ) | ||||||||||||||||||||||||||||
|
Discontinued operations
|
— | — | 207,797 | — | (207,797 | ) | 159,367 | — | (309,382 | ) | 236,235 | — | 101,585 | (76,868 | ) | |||||||||||||||||||||||||||||||||
|
Total
|
(3,360 | ) | (5,752 | ) | 205,867 | 2,392 | (211,619 | ) | 159,103 | (13,743 | ) | (526,230 | ) | 639,745 | 16,135 | 314,611 | (480,642 | ) | ||||||||||||||||||||||||||||||
In accordance with U.S. GAAP, the amortized cost and fair value of Government securities available for sale as of December 31, 2012 and 2011 are as follows:
|
Government securities
|
||||||||
|
December 31,
|
||||||||
|
2012
|
2011
|
|||||||
|
Amortized cost
|
4,280,598 | 4,794,894 | ||||||
|
Gross Unrealized Loss
|
(172,017 | ) | (225,670 | ) | ||||
|
Gross Unrealized Gains
|
48,468 | 115,864 | ||||||
|
Fair Value
|
4,157,049 | 4,685,088 | ||||||
|
Number of Positions
|
18 | 31 | ||||||
The following table shows the disclosures about investments as of December 31, 2012 in an unrealized loss position that are not other than temporary impaired:
|
Less than 12 months
|
12 months or greater
|
Total
|
||||||||||||||||||||||
|
Fair value
|
Unrealized losses
|
Fair value
|
Unrealized losses
|
Fair value
|
Unrealized losses
|
|||||||||||||||||||
|
Government securities
|
4,157,049 | (172,017 | ) | — | — | 4,157,049 | (172,017 | ) | ||||||||||||||||
We have evaluated this decline in fair value to determine whether it is other than temporary and we have not recognized any other than temporary impairment for these securities for the fiscal year ended December 31, 2012 related to the following reasons:
|
|
§
|
The decline is attributable solely to adverse interest rate movements, and has not connection with a credit event;
|
|
|
§
|
The principal and interest payments have been made as scheduled, and there is no evidence that the debtor will not continue to do so;
|
|
|
§
|
The future principal payments will be sufficient to recover the current amortized cost of the security;
|
F-86
BBVA BANCO FRANCÉS S.A. AND SUBSIDIARIES
NOTES TO THE CONSOLIDATED FINANCIAL STATEMENTS—(Continued)
For the fiscal years ended December 31, 2012, 2011 and 2010
Stated in thousands of Pesos
|
|
§
|
We have the intent to hold the security at least until the fair value of the security recovers to a level that exceeds the security’s amortized costs; and
|
|
|
§
|
They have mainly arisen in a period shorter than one year.
|
|
|
22.6.
|
Gain contingencies
|
Constitutional protection actions:
At December 31, 2003 the Bank recorded an asset for the difference in nominal terms between the deposits at the free market exchange rate at the moment of each payment compared to the book value of 1.40 pesos per dollar plus CER to that date. This asset was amortized in 60 monthly instalments as from April 2003 (see Note 3.4.13.). At December 31, 2012 the Bank cancelled this type of operations and the only ones that we had were related with the demand stood in a way by the holders of mutual funds shares.
ASC 450-30, Contingencies: Gain Contingencies requires that contingencies that might result in gains are not reflected in the accounts since to do so might be to recognize revenue prior to its realization. Had U.S. GAAP been applied over continued operations, the Bank’s assets would have decreased by 29,771, 23,670 and 23,463 at December 31, 2012, 2011 and 2010, respectively. On the other hand the income would have decreased by 6,101, 207 and 883 at December 31, 2012, 2011 and 2010, respectively.
These adjustments do not have effects over discontinued operations.
|
|
22.7.
|
Investment in other companies
|
At December 31, 2012, 2011 and 2010, the Bank accounted for the investment in the Buenos Aires Stock Exchange at the market value at that date. Under ASC 940-340, Financial Services – Broker and Dealers: Other Assets and Deferred Cost, such investments would have been valued at cost or at a lesser amount where there is an-other-than-temporary impairment in value. Had U.S. GAAP been applied over continued operations, the Bank’s assets would have decreased by 7,038, 6,226 and 6,226 at December 31, 2012, 2011 and 2010, respectively.
In addition, there are a number of companies which are under 20% and they were valued by the equity method in accordance with BCRA’s rules. Under ASC 323-10, Investments – Equity Method and Joint Venture: Overall and ASC 325-20, Investments – Other: Cost Method Investments, such investments, which are non-marketable securities, would have been valued at cost. Had U.S. GAAP been applied over continued operations, the Bank’s assets would have decreased by 31,129, 45,664 and 37,573 at December 31, 2012, 2011 and 2010, respectively.
On the other hand, the income over continued operations would have increased by 13,723 for the fiscal year ended December 31, 2012 and for the fiscal years ended December 31, 2011 and 2010 would have decreased by 8,091 and 8,061, respectively due to the effect of the differences mentioned in the preceding paragraphs.
These adjustments do not have effects over discontinued operations.
|
|
22.8.
|
Vacation expense
|
The cost of vacations earned by employees is generally recorded by the Bank when paid. ASC 710-10, Compensation-General: Overall requires that this expense be recorded on an accrual basis as the vacations are earned.
Had U.S. GAAP been applied over continued operations, the Bank’s liabilities would have increased by 389, 36,682 and 332 at December 31, 2012, 2011 and 2010, respectively. In addition, the income for the fiscal years ended at December 31, 2012 and 2010 would have increased by 36,293 and 5, respectively, and for the fiscal year ended at December 31, 2011 would had decreased by 36,350.
F-87
BBVA BANCO FRANCÉS S.A. AND SUBSIDIARIES
NOTES TO THE CONSOLIDATED FINANCIAL STATEMENTS—(Continued)
For the fiscal years ended December 31, 2012, 2011 and 2010
Stated in thousands of Pesos
These adjustments do not have effects over discontinued operations.
|
|
22.9.
|
Items in process of collection
|
The Bank does not give accounting recognition to checks drawn against the Bank or other Banks or other items to be collected, until such time as the related item clears or is accepted. Such items are recorded by the Bank in Memorandum accounts. U.S. banks, however, account for such items through balance sheet clearing accounts at the time the items are presented.
Had U.S. GAAP been applied, the Bank’s assets and liabilities would have increased by approximately 2,414,984 and 1,374,377 at December 31, 2012 and 2011, respectively.
The same effect would be displayed in the Balance Sheet disclosure requirements in accordance with Regulation S-X (see Note 21.16.).
|
|
22.10.
|
Forward and unsettled spot transactions
|
The Bank enters into forward and unsettled spot contracts with delivery of the underlying asset for trading purposes.
The Bank accounts for such forward and unsettled spot contracts on a basis different from that required by U.S. GAAP.
For such forward and unsettled spot transactions, the Bank recognizes both a receivable and a payable at the time of the agreement, which reflect the amount of cash, currency or securities to be exchanged at the closing date. The receivable or payable representing the receipt or delivery of securities or currency is stated at the quoted market value of such securities or currency (see Note 3.4.8.). In the United States, accounting for forward foreign exchange contracts and futures contracts are governed by ASC 815-10, Derivatives and Hedging: Overall, (see Note 22.16.). Under this standard, in general entities would not recognize a receivable or payable but would recognize the differences arising from changes in the market price of securities or currency to be received or delivered if the transaction did not qualify as a hedge.
Had U.S. GAAP been applied, the Bank’s assets and liabilities would have decreased by approximately 944 and 191,046 at December 31, 2012 and 2011, respectively.
The same effect would be displayed in the Balance Sheet disclosure requirements in accordance with Regulation S-X (see Note 21.16.).
|
|
22.11.
|
Technical Valuation – Inflation adjustments
|
A technical revaluation (inflation adjustments) of the Bank’s properties was made in 1981 to eliminate relative price distortions generated by the hyper inflation then prevailing in Argentina. This revaluation was recorded in the “Adjustments to stockholders’ equity” caption. Under BCRA’s rules, when an asset which had been revalued is sold at a loss, the loss is recorded directly to “Adjustments to stockholders’ equity” to the extent of the original revaluation. Under ASC 830-30, Foreign Currency Matters: Translation of Financial Statements, the technical valuation (inflation adjustments) is considered to be a permanent addition to equity and, accordingly, any loss on the sale of an asset which was revalued would be reflected in net income. There has been no sale of revalued assets during the fiscal years ended December 31, 2012, 2011 and 2010. Consequently, the balance related to the previously mentioned revaluation included in the “Adjustments to Stockholders’ Equity” caption has not been modified.
|
|
22.12.
|
Acceptances
|
Foreign trade acceptances are not recorded on the balance sheet by the Bank. In accordance with Regulation S-X, acceptances and related customer liabilities should be recorded on the balance sheet. The adjustment required to state the Bank’s balance sheets in accordance with Regulation S-X would be to increase assets (due from customers on
F-88
BBVA BANCO FRANCÉS S.A. AND SUBSIDIARIES
NOTES TO THE CONSOLIDATED FINANCIAL STATEMENTS—(Continued)
For the fiscal years ended December 31, 2012, 2011 and 2010
Stated in thousands of Pesos
acceptances) and increase liabilities (bank acceptances outstanding) by 76,515 and 98,786 at December 31, 2012 and 2011, respectively.
The same effect would be displayed in the Balance Sheet disclosure requirements in accordance with Regulation S-X (see Note 21.16.).
|
|
22.13.
|
Technical commitments related to insurance activities
|
For the fiscal year ended December 31, 2010 Consolidar Cía. de Seguros de Retiro S.A. maintained reserves accounted in Other subsidiaries’ liabilities valued in accordance with the accounting standards established by the National Superintendence of Insurance.
The effects of adjustments over discontinued operations required to state such amounts in accordance with US. GAAP, under ASC 944-40, Financial Services-Insurance: Claim Costs and Liabilities for Future Policy Benefits, would had decreased liabilities by 267,939 at December 31, 2010. On the other hand, income for the fiscal year ended at December 31, 2011 would have decreased by 267,939 and at December 31, 2010 would have increased by 42,526.
|
|
22.14.
|
Fair Value of Financial Instruments
|
|
|
(i)
|
The ASC 820-10, Fair Value Measurement and Disclosures: Overall, defines that fair value is the price that would be received to sell an asset or paid to transfer a liability in an orderly transaction between market participants at the measurement date. Such standard also establishes a scheme for determining fair values. In accordance with this pronouncement, BBVA Francés has categorized its financial instruments based on the priority of the inputs to the valuation technique, into same of the three-level fair value hierarchy. The fair value hierarchy gives the highest priority to quoted prices in active markets for identical assets or liabilities (Level 1) and the lowest priority to unobservable inputs (Level 3). If the inputs used to measure the financial instruments fall within different levels of the hierarchy, the categorization is based on the lowest level input that is significant to the fair value measurement of the instrument.
|
Financial assets and liabilities recorded on the Consolidated Financial Statements are categorized based on the inputs to the valuation techniques as follows:
|
Level 1
|
Financial assets and liabilities whose values are based on unadjusted quoted prices for identical assets or liabilities in an active market that BBVA Francés has the ability to access.
|
|
|
Level 2
|
They are inputs other tan quoted prices included within Level 1 that are observable for the asset or liability, either directly or indirectly. Level 2 inputs include the following:
a) Quoted prices for similar assets or liabilities in active markets;
b) Quoted prices for identical or similar assets or liabilities in non-active markets;
c) Pricing models whose inputs are observable for substantially the full term of the asset or liability; and
d) Pricing models whose inputs are derived principally from or corroborated by observable market data through correlation or other means for substantially the full term of the asset or liability.
|
|
|
Level 3
|
Financial assets and liabilities whose values are based on prices or valuation techniques that require inputs that are both unobservable and significant to the overall fair value measurement. These inputs reflect management’s own assumptions about the assumptions a market participant would use in pricing the asset or liability.
|
F-89
BBVA BANCO FRANCÉS S.A. AND SUBSIDIARIES
NOTES TO THE CONSOLIDATED FINANCIAL STATEMENTS—(Continued)
For the fiscal years ended December 31, 2012, 2011 and 2010
Stated in thousands of Pesos
Assets and liabilities valued at their fair recurrent value as of December 31, 2012 are as follows:
|
Fair value measurements on a recurring basis as of
December 31, 2012
|
||||||||||||||||
|
Description
|
Level 1
|
Level 2
|
Level 3
|
Total
|
||||||||||||
|
Assets
|
||||||||||||||||
|
Government and private securities
|
979,565 | 3,122,305 | — | 4,101,870 | ||||||||||||
|
-Holding booked at fair value
|
895,836 | 936,243 | — | 1,832,079 | ||||||||||||
|
-Instruments issued by the BCRA
|
15,614 | 2,186,062 | — | 2,201,676 | ||||||||||||
|
-Investments in listed private securities
|
68,115 | — | — | 68,115 | ||||||||||||
|
Other receivables from financial transactions
|
8,852 | 15,973 | — | 24,825 | ||||||||||||
|
-Instruments to be received for spot and forward purchases to be settled
|
18 | — | — | 18 | ||||||||||||
|
-Unlisted corporate bonds
|
— | 15,973 | — | 15,973 | ||||||||||||
|
-Non-deliverable forward transactions balances to be settled
|
8,834 | — | — | 8,834 | ||||||||||||
|
Liabilities
|
||||||||||||||||
|
Other liabilities from financial transactions
|
1,854 | 649,993 | — | 651,847 | ||||||||||||
|
-Unsubordinated corporate bonds
|
— | 649,993 | — | 649,993 | ||||||||||||
|
-Instruments to be delivered for spot and forward sales to be settled
|
926 | — | — | 926 | ||||||||||||
|
-Non-deliverable forward transactions balances to be settled
|
928 | — | — | 928 | ||||||||||||
|
|
(ii)
|
ASC 825-10, Financial Instruments: Overall requires disclosure of fair value information about financial instruments, whether or not recognized on the balance sheet, for which it is practicable to estimate fair value.
|
ASC 825-10, Financial Instruments: Overall, defines a financial instrument as cash, evidence of an ownership in an entity, or a contract that either conveys or imposes on an entity the contractual right or obligation to either receive or deliver cash or another financial instrument.
In cases where quoted market prices are not available, fair value estimation are based on the quoted market price of a financial instrument with similar characteristics, the present value of expected future cash flow, or other valuation techniques, all of which are significantly affected by the assumptions used. Although management uses its best judgment in estimating the fair value of these financial instruments, there are inherent weaknesses in any estimation technique. As a result, the fair value may not be indicative of the net realizable or liquidation value. Furthermore, minor changes in the assumptions used could have a significant impact on the resulting estimated fair values.
In addition, disclosure of fair values is not required for non-financial assets and liabilities such as property and equipment, sundry assets and intangible assets and anticipated future business. As a result, the following fair values do not reflect the underlying value of the Bank.
A significant portion of the Bank’s assets and liabilities are in short-term financial instruments, with a remaining maturity of under one year, and/or with variable rates. These short-term and variable-rate financial instruments are considered to have a fair value equivalent to their carrying value at the balance sheet date.
For financial instruments with remaining maturity over one year and with fixed-rates, and therefore not included above, the following methods and assumptions were used to estimate their fair value:
F-90
BBVA BANCO FRANCÉS S.A. AND SUBSIDIARIES
NOTES TO THE CONSOLIDATED FINANCIAL STATEMENTS—(Continued)
For the fiscal years ended December 31, 2012, 2011 and 2010
Stated in thousands of Pesos
Government and private securities
|
§
|
Holdings booked at amortized cost: fair value for these securities was taken to be equal to the present value of future cash flows discounted at the average year-end market interest rates for securities of similar interest rate, credit risk and maturity at December 31, 2012.
|
Loans and receivables from financial leases
Fair value is estimated by discounting future cash flows using the current rates at which loans would be made to borrowers with similar credit ratings and for the same remaining maturities, considering the contractual terms in effect as of December 31, 2012 and 2011.
Other receivables from financial transactions
|
§
|
Unlisted corporate bonds: the majority of these operations have a variable interest rate so the Bank considers that the fair value is the same that the carrying value at the balance sheet dates.
|
Deposits
As a significant portion of the Bank’s deposits as of December 31, 2012 and 2011 (more than 99% considering the contractual terms in effect as of such date) have a remaining maturity less than one year, they were considered to have a fair value equivalent to their carrying value at the balance sheet date.
Other liabilities from financial transactions
As of December 31, 2012 and 2011, the majority of these operations have a variable interest rate or a maturity less than a year; in these cases the Bank considers that the fair value is the same that the carrying value at the balance sheet dates.
Off-Balance sheet
Commitments to extend credit, standby letter of credit, guarantees granted and foreign trade acceptances (see Note 21.17.).
It is estimated that the differential, if any, between the fee charged, which is equivalent to the carrying amount, by the Bank for these transactions and the average December 31, 2012 and 2011 market fee would not give rise to a material variance from the carrying amount.
F-91
BBVA BANCO FRANCÉS S.A. AND SUBSIDIARIES
NOTES TO THE CONSOLIDATED FINANCIAL STATEMENTS—(Continued)
For the fiscal years ended December 31, 2012, 2011 and 2010
Stated in thousands of Pesos
The following is a summary of carrying amounts and estimated fair values of financial instruments at December 31, 2012 and 2011:
|
December 31,
|
||||||||||||||||
|
2012
|
2011
|
|||||||||||||||
|
Carrying
Amount
(4)
|
Estimated
Fair Value
|
Carrying
Amount
(4) (5)
|
Estimated
Fair Value
|
|||||||||||||
|
Financial assets
|
||||||||||||||||
|
Cash and due from banks
|
8,614,889 | 8,614,889 | 6,353,428 | 6,353,428 | ||||||||||||
|
Government and private securities
(1)
|
4,101,846 | 4,098,427 | 5,565,029 | 5,548,430 | ||||||||||||
|
Loans
(2)
|
28,493,431 | 26,567,815 | 22,697,031 | 21,029,898 | ||||||||||||
|
Other receivables from financial transactions
(3)
|
700,925 | 708,589 | 1,948,285 | 1,949,169 | ||||||||||||
|
Receivables from financial leases
|
1,110,234 | 1,110,234 | 907,087 | 907,087 | ||||||||||||
|
Investments in other companies
|
146,001 | 146,001 | 126,288 | 126,288 | ||||||||||||
| 43,167,326 | 41,245,955 | 37,597,148 | 35,914,300 | |||||||||||||
|
Financial liabilities
|
||||||||||||||||
|
Deposits
|
34,165,053 | 34,165,053 | 29,165,704 | 29,165,704 | ||||||||||||
|
Other liabilities from financial transactions
(3)
|
3,285,123 | 2,878,455 | 4,268,519 | 3,804,315 | ||||||||||||
| 37,450,176 | 37,043,508 | 33,434,223 | 32,970,019 | |||||||||||||
|
|
(1)
|
Includes the effect described in Note 22.5.
|
|
|
(2)
|
Includes the effects described in Notes 22.4.2., 22.4.3. and 22.4.4.
|
|
|
(3)
|
Includes the effects described in Note 22.16.
|
|
|
(4)
|
Under BCRA’s rules.
|
|
|
(5)
|
See Note 3.3.
|
|
|
22.15.
|
Goodwill
|
|
|
§
|
On May 4, 1998 the General and Special Stockholder’s Meeting approved (to be effective on April 30, 1998) the reversal of the shares issuance premium in the amount of 428,661 related to the capital increase with face value 25,000 thousand paid in on December 19, 1997, and bearing up to 428,661 of the Business Goodwill from the acquisition of 71.754% of the capital stock of Banco de Crédito Argentino S.A. The mentioned reversal is not allowed in accordance with US. GAAP. Under US. GAAP, the Bank should recognize the issuance premium under “Issuance premiums” and capitalize the related amount under Intangible Assets.
|
The effect of adjustments over continued operations required to state such amounts in accordance with U.S. GAAP would have increased assets by 254,882 at December 31, 2012, 2011 and 2010.
|
|
§
|
On May 13, 1999, BBVA (majority owner of BBVA Francés) acquired Corp Banca and Atuel Fideicomisos S.A. and on September, 13, 1999, BBVA sold its interests in both companies to BBVA Francés. For the difference between the definitive price of the transaction and the incorporation value of both companies, the Bank recognized goodwill and amortized it in proportion to the months of estimated useful life (120-month period). Under U.S. GAAP, the Bank would be required to account for the acquisition of the mentioned companies at BBVA’s book balance. Had U.S. GAAP been applied over continued operations, the Bank’s assets would have increased by 54,695 at December 31, 2012, 2011 and 2010.
|
|
|
§
|
ASC 350-20, Intangibles-Goodwill and Other: Goodwill requires that goodwill is no longer amortized, but is subject to impairment test annually or more frequently if events or changes in circumstances indicate that the asset may be impaired. In 2001 the Bank had recognized an impairment loss and wrote off the entire balance of the U.S. GAAP goodwill. Had U.S. GAAP been applied over continued operations, the Bank’s assets would have decreased by 309,577 as of December 31, 2012, 2011 and 2010.
|
These adjustments do not have effects over discontinued operations.
F-92
BBVA BANCO FRANCÉS S.A. AND SUBSIDIARIES
NOTES TO THE CONSOLIDATED FINANCIAL STATEMENTS—(Continued)
For the fiscal years ended December 31, 2012, 2011 and 2010
Stated in thousands of Pesos
|
|
22.16.
|
Accounting for Derivative Instruments and Hedging Activities
|
ASC 815, Derivatives and Hedging establishes accounting and reporting standards for derivative instruments, including certain derivative instruments embedded in other contracts (collectively referred to as derivatives) and for hedging activities. It requires that an entity recognize all derivatives as either assets or liabilities in the statement of financial position and measure those instruments at fair value. If certain conditions are met, a derivative may be specifically designated as (a) a hedge of the exposure to changes in the fair value of a recognized asset or liability or an unrecognized firm commitment, (b) a hedge of the exposure to variable cash flows of a forecasted transaction, or (c) a hedge of the foreign currency exposure of a net investment in a foreign operation, an unrecognized firm commitment, an available for sale security, or a foreign currency denominated forecasted transaction.
Had US GAAP been applied, the assets and liabilities over continued operations would have increased by 7,813 and 1,812, respectively at December 31, 2012. At December 31, 2011 the assets and liabilities over continued operations would have increased by 884 and 12,177, respectively. At December 31, 2010 the assets over continued operations would be increased by 2,594. On the other hand, income over continued operations would have increased by 17,294 and 2,470 for the fiscal years ended December 31, 2012 and 2010, respectively, and would have decreased by 13,887 for the fiscal year ended December 31, 2011.
Had US GAAP been applied, income over discontinued operations would have decreased by 246 for the fiscal year ended December 31, 2010.
In Note 21.17.a), it is explained in detail the derivate instruments used by the Bank and the valuation methods of these instruments were explained in Notes 3.4.8. and 3.4.14.
|
|
22.17.
|
Allowance for other contingencies
|
The Bank maintained reserves accounted in Allowance for other contingencies valued in accordance with the accounting standards established by BCRA (see Note 3.4.18.).
The effects of adjustments over continued operations required to state such amounts in accordance with ASC 450-20, Contingencies: Loss Contingencies would have decreased allowances for other contingencies by 34,772 at December 31, 2010. On the other hand, income would have increased by 5,719 at December 31, 2010 and for the fiscal year ended December 31, 2011 would have decreased by 34,772.
|
|
22.18.
|
Premises and equipment
|
As we explained in Notes 4.1.c) the Bank acquired from Consolidar AFJP S.A. and Consolidar Retiro S.A, respectively, the latter’s undivided in the piece of real estate. ASC 810-10, Consolidation: Overall, established that any intercompany profit or loss on assets remaining within the Group should be eliminated.
Had U.S. GAAP been applied over continued operations, the Bank’s assets would have decreased by 48,619 and 37,915 at December 31, 2011 and 2010, respectively. In addition, the income for the fiscal years ended at December 31, 2012 and 2010 would have increased by 48,619 and 221, respectively, and would have decreased by 10,704 for the fiscal year ended at December 31, 2011.
This adjustment does not have effects over discontinued operations.
F-93
BBVA BANCO FRANCÉS S.A. AND SUBSIDIARIES
NOTES TO THE CONSOLIDATED FINANCIAL STATEMENTS—(Continued)
For the fiscal years ended December 31, 2012, 2011 and 2010
Stated in thousands of Pesos
|
|
22.19.
|
Non-controlling interests in consolidated subsidiaries
|
The Bank exhibits its non-controlling interests in consolidated subsidiaries like a caption outside its equity. In accordance with ASC 810-10, Consolidation: Overall, non-controlling interests in consolidated subsidiaries shall be reported in the Consolidated Balance Sheets within equity, separately from the parent’s equity.
Had U.S. GAAP been applied over continued operations, the Bank’s Stockholders’ Equity would have increased by 119,508, 82,667 and
74,600
at December 31, 2012, 2011 and 2010, respectively. In addition, income for the fiscal years ended at December 31, 2012 and 2011 would have increased by 36,841 and
8,067
, respectively and would have decreased by 15,027 at December 31, 2010.
Had U.S. GAAP been applied over discontinued operations, the Bank’s Stockholders’ Equity would have increased by 7,677, 9,356 and 302,100 at December 31, 2012, 2011 and 2010, respectively. In addition, income for the fiscal year ended at December 31, 2012 and 2011 would have decreased by 1,679 and 292,744, respectively, and would have increased by 90,304 at December 31, 2010.
F-94
BBVA BANCO FRANCÉS S.A. AND SUBSIDIARIES
NOTES TO THE CONSOLIDATED FINANCIAL STATEMENTS—(Continued)
For the fiscal years ended December 31, 2012, 2011 and 2010
Stated in thousands of Pesos
|
|
22.20.
|
Set forth below are the significant adjustments to consolidated net income and consolidated stockholders’ equity which would have been required if U.S. GAAP had been applied instead of BCRA’s rules:
|
|
Consolidated Net Income December 31,
|
|||||||||||||||||||||||||||||||||||||||
|
Ref
|
2012
|
2011
|
2010
|
||||||||||||||||||||||||||||||||||||
|
Continued operations
|
Discontinued operations
|
Total
|
Continued operations
|
Discontinued operations
|
Total
|
Continued operations
|
Discontinued operations
|
Total
|
|||||||||||||||||||||||||||||||
|
Net income as stated
|
946,899 | 316,780 | 1,263,679 | 946,899 | 58,678 | 1,005,577 | 1,163,273 | 34,906 | 1,198,179 | ||||||||||||||||||||||||||||||
|
Deferred taxes
|
22.1 | (9,609 | ) | (2,310 | ) | (11,919 | ) | 94,986 | 61,828 | 156,814 | 10,644 | (32,505 | ) | (21,861 | ) | ||||||||||||||||||||||||
|
Allowances on deferred tax assets
|
22.1 | 147,300 | — | 147,300 | (156,109 | ) | — | (156,109 | ) | (724 | ) | — | (724 | ) | |||||||||||||||||||||||||
|
Loan origination and issuance credit card’s fees
|
22.2 | (36,119 | ) | — | (36,119 | ) | (30,531 | ) | — | (30,531 | ) | (22,413 | ) | — | (22,413 | ) | |||||||||||||||||||||||
|
Intangible assets
|
22.3 | — | — | — | — | — | — | (6 | ) | 3 | (3 | ) | |||||||||||||||||||||||||||
|
Impaired loans-Non Financial Private Sector and residents abroad loans
|
22.4.2 | 17,038 | — | 17,038 | (34,600 | ) | — | (34,600 | ) | 10,600 | — | 10,600 | |||||||||||||||||||||||||||
|
Federal Government secured loans
|
22.4.3 | — | — | — | — | 78,028 | 78,028 | — | (5,971 | ) | (5,971 | ) | |||||||||||||||||||||||||||
|
Argentine Government Notes
|
22.4.4 | — | — | — | — | 21,644 | 21,644 | — | 9,908 | 9,908 | |||||||||||||||||||||||||||||
|
Government and other debt securities valuation
|
22.5 | 16,135 | — | 16,135 | 213,026 | 101,585 | 314,611 | (403,774 | ) | (76,868 | ) | (480,642 | ) | ||||||||||||||||||||||||||
|
Gain contingencies
|
22.6 | (6,101 | ) | — | (6,101 | ) | (207 | ) | — | (207 | ) | (883 | ) | — | (883 | ) | |||||||||||||||||||||||
|
Investment in other companies
|
22.7 | 13,723 | — | 13,723 | (8,091 | ) | — | (8,091 | ) | (8,061 | ) | — | (8,061 | ) | |||||||||||||||||||||||||
|
Vacation expense
|
22.8 | 36,293 | — | 36,293 | (36,350 | ) | — | (36,350 | ) | 5 | — | 5 | |||||||||||||||||||||||||||
|
Technical Commitments related to insurance activities
|
22.13 | — | — | — | — | (267,939 | ) | (267,939 | ) | — | 42,526 | 42,526 | |||||||||||||||||||||||||||
|
Accounting for Derivative Instruments and Hedging Activities
|
22.16 | 17,294 | — | 17,294 | (13,887 | ) | — | (13,887 | ) | 2,470 | (246 | ) | 2,224 | ||||||||||||||||||||||||||
|
Allowance for other contingencies
|
22.17 | — | — | — | (34,772 | ) | — | (34,772 | ) | 5,719 | — | 5,719 | |||||||||||||||||||||||||||
|
Premises and equipment
|
22.18 | 48,619 | — | 48,619 | (10,704 | ) | — | (10,704 | ) | 221 | — | 221 | |||||||||||||||||||||||||||
|
Non-controlling interests in consolidated subsidiaries
|
22.19 | 36,841 | (1,679 | ) | 35,162 | 8,067 | (292,744 | ) | (284,677 | ) | (15,027 | ) | 90,304 | 75,277 | |||||||||||||||||||||||||
|
Net income in accordance with U.S. GAAP
|
1,228,313 | 312,791 | 1,541,104 | 937,727 | (238,920 | ) | 698,807 | 742,044 | 62,057 | 804,101 | |||||||||||||||||||||||||||||
|
Net income per share in accordance with U.S. GAAP attributable to controlling interests
|
2.22 | 0.59 | 2.81 | 1.73 | 0.10 | 1.83 | 1.41 | (0.05 | ) | 1.36 | |||||||||||||||||||||||||||||
|
Net income per share in accordance with U.S. GAAP attributable to non-controlling interests
|
2.29 | 0.58 | 2.87 | 1.75 | (0.45 | ) | 1.30 | 1.38 | 0.12 | 1.50 | |||||||||||||||||||||||||||||
|
Weighted average number of shares outstanding (in thousands)
|
536,878 | 536,878 | 536,878 | 536,620 | 536,620 | 536,620 | 536,361 | 536,361 | 536,361 | ||||||||||||||||||||||||||||||
F-95
BBVA BANCO FRANCÉS S.A. AND SUBSIDIARIES
NOTES TO THE CONSOLIDATED FINANCIAL STATEMENTS—(Continued)
For the fiscal years ended December 31, 2012, 2011 and 2010
Stated in thousands of Pesos
|
Consolidated Stockholders’ Equity December 31,
|
|||||||||||||||||||||||||||||||||||||||
|
Ref
|
2012
|
2011
|
2010
|
||||||||||||||||||||||||||||||||||||
|
Continued operations
|
Discontinued operations
|
Total
|
Continued operations
|
Discontinued operations
|
Total
|
Continued operations
|
Discontinued operations
|
Total
|
|||||||||||||||||||||||||||||||
|
Stockholders’ equity as stated
|
5,122,963 | 8,973 | 5,131,936 | 3,857,323 | 10,934 | 3,868,257 | 3,545,964 | 200,951 | 3,746,915 | ||||||||||||||||||||||||||||||
|
Deferred taxes
|
22.1 | 14,501 | 17,433 | 31,934 | 19,300 | 19,743 | 39,043 | (290,712 | ) | (42,085 | ) | (332,797 | ) | ||||||||||||||||||||||||||
|
Allowances on deferred tax assets
|
22.1 | 256,900 | — | 256,900 | 109,600 | — | 109,600 | 265,709 | — | 265,709 | |||||||||||||||||||||||||||||
|
Loan origination and issuance credit card’s fees
|
22.2 | (144,628 | ) | — | (144,628 | ) | (108,509 | ) | — | (108,509 | ) | (77,978 | ) | — | (77,978 | ) | |||||||||||||||||||||||
|
Impaired loans-Non Financial Private Sector and residents abroad loans
|
22.4.2 | 197,970 | — | 197,970 | 180,932 | — | 180,932 | 215,532 | — | 215,532 | |||||||||||||||||||||||||||||
|
Federal Government secured loans
|
22.4.3 | — | — | — | — | — | — | — | (78,028 | ) | (78,028 | ) | |||||||||||||||||||||||||||
|
Argentine Government Notes
|
22.4.4 | — | — | — | — | — | — | — | (21,644 | ) | (21,644 | ) | |||||||||||||||||||||||||||
|
Government and other debt securities valuation
|
22.5 | (3,360 | ) | — | (3,360 | ) | (5,752 | ) | — | (5,752 | ) | (1,930 | ) | 207,797 | 205,867 | ||||||||||||||||||||||||
|
Gain contingencies
|
22.6 | (29,771 | ) | — | (29,771 | ) | (23,670 | ) | — | (23,670 | ) | (23,463 | ) | — | (23,463 | ) | |||||||||||||||||||||||
|
Investment in other companies
|
22.7 | (38,167 | ) | — | (38,167 | ) | (51,890 | ) | — | (51,890 | ) | (43,799 | ) | — | (43,799 | ) | |||||||||||||||||||||||
|
Vacation expense
|
22.8 | (389 | ) | — | (389 | ) | (36,682 | ) | — | (36,682 | ) | (332 | ) | — | (332 | ) | |||||||||||||||||||||||
|
Technical Commitments related to insurance activities
|
22.13 | — | — | — | — | — | — | — | 267,939 | 267,939 | |||||||||||||||||||||||||||||
|
Accounting for Derivative Instruments and Hedging Activities
|
22.16 | 6,001 | — | 6,001 | (11,293 | ) | — | (11,293 | ) | 2,594 | — | 2,594 | |||||||||||||||||||||||||||
|
Allowance for other contingencies
|
22.17 | — | — | — | — | — | — | 34,772 | — | 34,772 | |||||||||||||||||||||||||||||
|
Premises and equipment
|
22.18 | — | — | — | (48,619 | ) | — | (48,619 | ) | (37,915 | ) | — | (37,915 | ) | |||||||||||||||||||||||||
|
Non-controlling interests in consolidated subsidiaries
|
22.19 | 119,508 | 7,677 | 127,185 | 82,667 | 9,356 | 92,023 | 74,600 | 302,100 | 376,700 | |||||||||||||||||||||||||||||
|
Consolidated Stockholders’ equity in accordance with U.S. GAAP
|
5,501,528 | 34,083 | 5,535,611 | 3,963,407 | 40,033 | 4,003,440 | 3,663,042 | 837,030 | 4,500,072 | ||||||||||||||||||||||||||||||
Had U.S. GAAP been applied, the amounts of the assets and liabilities would have been as follows:
|
December 31,
|
||||||||||||
|
2012
|
2011
|
2010
|
||||||||||
|
Assets
|
47,552,013 | 40,367,604 | 33,448,725 | |||||||||
|
Liabilities
|
42,016,402 | 36,364,164 | 28,948,653 | |||||||||
F-96
BBVA BANCO FRANCÉS S.A. AND SUBSIDIARIES
NOTES TO THE CONSOLIDATED FINANCIAL STATEMENTS—(Continued)
For the fiscal years ended December 31, 2012, 2011 and 2010
Stated in thousands of Pesos
|
22.21.
|
The following presents the consolidated statement of operations adjusted to reflect the application of U.S. GAAP using the BCRA’s format:
|
|
Consolidated Net Income December 31,
|
||||||||||||||||||||||||||||||||||||
|
2012
|
2011
|
2010
|
||||||||||||||||||||||||||||||||||
|
Continued operations
|
Discontinued operations
|
Total
|
Continued operations
|
Discontinued operations
|
Total
|
Continued operations
|
Discontinued operations
|
Total
|
||||||||||||||||||||||||||||
|
Financial income
|
5,721,328 | 9,728 | 5,731,056 | 3,535,265 | 83,301 | 3,618,566 | 2,997,522 | 510,070 | 3,507,592 | |||||||||||||||||||||||||||
|
Financial expenses
|
(2,044,983 | ) | 3,260 | (2,041,723 | ) | (1,369,585 | ) | 10,295 | (1,359,290 | ) | (812,574 | ) | (3,150 | ) | (815,724 | ) | ||||||||||||||||||||
|
Allowances for doubtful loans
|
(239,221 | ) | — | (239,221 | ) | (188,907 | ) | 21,644 | (167,263 | ) | (178,661 | ) | 9,908 | (168,753 | ) | |||||||||||||||||||||
|
Service charge income
|
2,494,334 | — | 2,494,334 | 1,931,600 | (135 | ) | 1,931,465 | 1,464,731 | (596 | ) | 1,464,135 | |||||||||||||||||||||||||
|
Service charge expenses
|
(683,730 | ) | — | (683,730 | ) | (519,630 | ) | (5 | ) | (519,635 | ) | (406,347 | ) | (29 | ) | (406,376 | ) | |||||||||||||||||||
|
Operating expenses
|
(2,954,755 | ) | (21,977 | ) | (2,976,732 | ) | (2,326,630 | ) | (63,700 | ) | (2,390,330 | ) | (1,969,250 | ) | (49,914 | ) | (2,019,164 | ) | ||||||||||||||||||
|
Loss on minority interest in subsidiaries
|
(323 | ) | — | (323 | ) | 202,444 | (307,989 | ) | (105,545 | ) | (137,998 | ) | 75,686 | (62,312 | ) | |||||||||||||||||||||
|
Other income
|
269,139 | 5,400 | 274,539 | 267,207 | 156,700 | 423,907 | 151,099 | 52,014 | 203,113 | |||||||||||||||||||||||||||
|
Other expenses
|
(287,801 | ) | — | (287,801 | ) | (186,331 | ) | (198,493 | ) | (384,824 | ) | 147,201 | (456,509 | ) | (309,308 | ) | ||||||||||||||||||||
|
Income before income tax
|
2,273,988 | (3,589 | ) | 2,270,399 | 1,345,433 | (298,382 | ) | 1,047,051 | 1,255,723 | 137,480 | 1,393,203 | |||||||||||||||||||||||||
|
Income Tax
|
(726,934 | ) | (2,361 | ) | (729,295 | ) | (407,706 | ) | 59,462 | (348,244 | ) | (513,679 | ) | (75,423 | ) | (589,102 | ) | |||||||||||||||||||
|
Total consolidated income
|
1,547,054 | (5,950 | ) | 1,541,104 | 937,727 | (238,920 | ) | 698,807 | 742,044 | 62,057 | 804,101 | |||||||||||||||||||||||||
|
Comprehensive income
|
||||||||||||||||||||||||||||||||||||
|
Net income in accordance with U.S. GAAP
|
1,541,104 | 698,807 | 804,101 | |||||||||||||||||||||||||||||||||
|
Other comprehensive (loss) / income, net of tax
(1) (2)
|
(8,933 | ) | (399,335 | ) | 482,306 | |||||||||||||||||||||||||||||||
|
Comprehensive net income in accordance with U.S. GAAP
|
1,532,171 | 299,472 | 1,286,407 | |||||||||||||||||||||||||||||||||
___________________
(1) See Note 22.22.
(2) The minority interest represents the effect of the U.S. GAAP adjustments in the Group's consolidated subsidiaries (see Note 2.1.).
F-97
BBVA BANCO FRANCÉS S.A. AND SUBSIDIARIES
NOTES TO THE CONSOLIDATED FINANCIAL STATEMENTS—(Continued)
For the fiscal years ended December 31, 2012, 2011 and 2010
Stated in thousands of Pesos
|
|
22.22.
|
Set forth below are the related tax effects allocated to each component of other comprehensive income (loss) and the accumulated other comprehensive income (loss) balances, as of December 31, 2012, 2011 and 2010:
|
Tax effects on Other Comprehensive (Loss) / Income
|
December 31, 2012
|
December 31, 2011
|
December 31, 2010
|
||||||||||||||||||||||||||||||||||
|
Before Tax
Amount
|
Tax
(Expense)
or Benefit
|
Net of Tax Amount
|
Before Tax
Amount
|
Tax
(Expense)
or Benefit
|
Net of Tax Amount
|
Before Tax
Amount
|
Tax
(Expense)
or Benefit
|
Net of Tax Amount
|
||||||||||||||||||||||||||||
|
Unrealized (losses)/gains on securities
|
(13,743 | ) | 4,810 | (8,933 | ) | (614,361 | ) | 215,026 | (399,335 | ) | 742,009 | (259,703 | ) | 482,306 | ||||||||||||||||||||||
|
Other comprehensive income (loss)/gain
|
(13,743 | ) | 4,810 | (8,933 | ) | (614,361 | ) | 215,026 | (399,335 | ) | 742,009 | (259,703 | ) | 482,306 | ||||||||||||||||||||||
Accumulated Other Comprehensive Income / (Loss) balances
|
December 31, 2012
|
December 31, 2011
|
December 31, 2010
|
||||||||||||||||||||||||||||||||||
|
Foreign Currency
Items
|
Unrealized
Gains/
(Losses) on securities
|
Accumulated Other Comprehensive Income/(Loss)
|
Foreign Currency
Items
|
Unrealized
Gains/
(Losses) on securities
|
Accumulated Other Comprehensive Income/(Loss)
|
Foreign Currency
Items
|
Unrealized
Gains/
(Losses) on securities
|
Accumulated Other Comprehensive Income/(Loss)
|
||||||||||||||||||||||||||||
|
Beginning balance
|
— | (71,374 | ) | (71,374 | ) | — | 327,961 | 327,961 | — | (154,345 | ) | (154,345 | ) | |||||||||||||||||||||||
|
Current-fiscal year change
|
— | (8,933 | ) | (8,933 | ) | — | (399,335 | ) | (399,335 | ) | — | 482,306 | 482,306 | |||||||||||||||||||||||
|
Ending balance
|
— | (80,307 | ) | (80,307 | ) | — | (71,374 | ) | (71,374 | ) | — | 327,961 | 327,961 | |||||||||||||||||||||||
|
|
22.23.
|
Cash flows information
|
As explained in Note 3.4.21., under BCRA’s rules, the Bank considers certain investments securities held for trading or financial transactions and loans to financial sector as cash equivalents. These cash equivalents include some investments with original maturities greater than three months which would not qualify as cash equivalents under ASC 230-10, Statements of Cash Flows: Overall as they were acquired when they had maturities over three months. In any case, all investments that would qualify as cash equivalents are required to be treated as cash equivalents under US GAAP. In this respect, for US GAAP purpose, the Bank has always considered that highly liquid investments are treated as investments rather than cash equivalents as permitted ASC 230-10.
For purposes of the accompanying statement of cash flows the Bank considers, under ASC 230-10, cash and due from banks to be cash and cash equivalents.
F-98
BBVA BANCO FRANCÉS S.A. AND SUBSIDIARIES
NOTES TO THE CONSOLIDATED FINANCIAL STATEMENTS—(Continued)
For the fiscal years ended December 31, 2012, 2011 and 2010
Stated in thousands of Pesos
The following supplemental cash flow information separately presents the effect of exchange rate changes on cash:
|
December 31,
|
||||||||||||
|
2012
|
2011
|
2010
|
||||||||||
|
Cash and cash equivalents at the end of the fiscal year
|
8,613,997 | 6,353,428 | 5,691,806 | |||||||||
|
Cash and cash equivalents at beginning of the fiscal year
|
6,353,428 | 5,691,806 | 5,255,412 | |||||||||
|
Increase in cash and cash equivalents
|
2,260,569 | 661,622 | 436,394 | |||||||||
|
CAUSES OF CHANGES IN CASH AND CASH EQUIVALENTS
|
||||||||||||
|
Cash provided by operating activities
|
3,534,123 | 4,485,799 | 783,036 | |||||||||
|
Cash used in investing activities
|
(619,624 | ) | (341,372 | ) | (120,868 | ) | ||||||
|
Cash used in financing activities
|
(581,581 | ) | (3,444,234 | ) | (74,048 | ) | ||||||
|
Effect of exchange rate changes on cash
|
(72,349 | ) | (38,571 | ) | (151,726 | ) | ||||||
|
Increase in cash and cash equivalents
|
2,260,569 | 661,622 | 436,394 | |||||||||
The following cash flow information presents the effect of exchange rate changes on cash over continued operations:
|
December 31,
|
||||||||||||
|
2012
|
2011
|
2010
|
||||||||||
|
CAUSES OF CHANGES IN CASH AND CASH EQUIVALENTS OVER CONTINUED OPERATIONS
|
||||||||||||
|
Cash provided by operating activities
|
3,502,355 | 1,238,259 | 858,408 | |||||||||
|
Cash used by investing activities
|
(607,683 | ) | (214,259 | ) | (18,467 | ) | ||||||
|
Cash used in financing activities
|
(566,414 | ) | (325,488 | ) | (263,882 | ) | ||||||
|
Effect of exchange rate changes on cash
|
(67,741 | ) | (36,115 | ) | (51,185 | ) | ||||||
|
Increase in cash and cash equivalents
|
2,260,517 | 662,397 | 524,874 | |||||||||
Set forth below is the reconciliation of net income to net cash flow from operating activities, as required by ASC 230-10, Statements of Cash Flows: Overall, including the adjustments in Note 22.20 (instead of including the cash flow statement under US GAAP):
F-99
BBVA BANCO FRANCÉS S.A. AND SUBSIDIARIES
NOTES TO THE CONSOLIDATED FINANCIAL STATEMENTS—(Continued)
For the fiscal years ended December 31, 2012, 2011 and 2010
Stated in thousands of Pesos
|
December 31, 2012
|
||||||||||||||||||||||||||||||||||||||||
|
BCRA GAAP
|
Adjustments
|
US GAAP
|
||||||||||||||||||||||||||||||||||||||
|
Cont
|
Disc
|
Total
|
Cont
|
Disc
|
Total
|
Cont
|
Disc
|
Total
|
||||||||||||||||||||||||||||||||
|
Net income attributable to the controlling interest
|
1,303,514 | (3,640 | ) | 1,299,874 | 217,944 | (3,690 | ) | 214,254 | 1,521,458 | (7,330 | ) | 1,514,128 | ||||||||||||||||||||||||||||
|
Adjustments to reconcile net income to net cash from operating activities:
|
||||||||||||||||||||||||||||||||||||||||
|
Amortization and depreciation
|
127,933 | — | 127,933 | (3,025 | ) | — | (3,025 | ) | (1) | 124,908 | — | 124,908 | ||||||||||||||||||||||||||||
|
Allowances for doubtful loans and special reserves, net of reversals
|
340,109 | — | 340,109 | (17,038 | ) | — | (17,038 | ) | (2) | 323,071 | — | 323,071 | ||||||||||||||||||||||||||||
|
Income tax and TOMPI
|
864,625 | 51 | 864,676 | (111,062 | ) | 3,690 | (107,372 | ) | (3) | 753,563 | 3,741 | 757,304 | ||||||||||||||||||||||||||||
|
Equity loss / (gains) of unconsolidated subsidiaries
|
37,264 | — | 37,264 | (13,723 | ) | — | (13,723 | ) | (4) | 23,541 | — | 23,541 | ||||||||||||||||||||||||||||
|
Net decrease / (increase) in interest receivable and payable and other accrued income and expenses
|
828,910 | 35,357 | 864,267 | (73,096 | ) | — | (73,096 | ) | (5) | 755,814 | 35,357 | 791,171 | ||||||||||||||||||||||||||||
|
Net cash provided by operating activities
|
3,502,355 | 31,768 | 3,534,123 | 3,502,355 | 31,768 | 3,534,123 | ||||||||||||||||||||||||||||||||||
____________________
|
(1)
|
Adjustment to Note 22.18 (portion corresponding to amortization)
|
|
(2)
|
Adjustment to Note 22.4.2
|
|
(3)
|
Adjustment to Note 22.1
|
|
(4)
|
Adjustment to Note 22.7
|
|
(5)
|
Others
|
|
December 31, 2011
|
||||||||||||||||||||||||||||||||||||||||
|
BCRA GAAP
|
Adjustments
|
US GAAP
|
||||||||||||||||||||||||||||||||||||||
|
Cont
|
Disc
|
Total
|
Cont
|
Disc
|
Total
|
Cont
|
Disc
|
Total
|
||||||||||||||||||||||||||||||||
|
Net income attributable to the controlling interest
|
940,116 | 73,923 | 1,014,039 | (17,239 | ) | (4,854 | ) | (22,093 | ) | 922,877 | 69,069 | 991,946 | ||||||||||||||||||||||||||||
|
Adjustments to reconcile net income to net cash from operating activities:
|
||||||||||||||||||||||||||||||||||||||||
|
Amortization and depreciation
|
93,643 | 733 | 94,376 | 20,608 | — | 20,608 | (1) | 114,251 | 733 | 114,984 | ||||||||||||||||||||||||||||||
|
Allowances for doubtful loans and special reserves, net of reversals
|
112,513 | — | 112,513 | 34,600 | — | 34,600 | (2) | 147,113 | — | 147,113 | ||||||||||||||||||||||||||||||
|
Income tax and TOMPI
|
549,992 | 2,366 | 552,358 | 61,123 | (61,828 | ) | (705 | ) | (3) | 611,115 | (59,462 | ) | 551,653 | |||||||||||||||||||||||||||
|
Equity loss / (gains) of unconsolidated subsidiaries
|
29,764 | (21,270 | ) | 8,494 | 8,091 | — | 8,091 | (4) | 37,855 | (21,270 | ) | 16,585 | ||||||||||||||||||||||||||||
|
Net decrease / (increase) in interest receivable and payable and other accrued income and expenses
|
(487,769 | ) | 3,191,788 | 2,704,019 | (107,183 | ) | 66,682 | (40,501 | ) | (5) | (594,952 | ) | 3,258,470 | 2,663,518 | ||||||||||||||||||||||||||
|
Net cash provided by operating activities
|
1,238,259 | 3,247,540 | 4,485,799 | 1,238,259 | 3,247,540 | 4,485,799 | ||||||||||||||||||||||||||||||||||
____________________
|
(1)
|
Adjustment to Note 22.18 (portion corresponding to amortization)
|
|
(2)
|
Adjustment to Note 22.4.2
|
|
(3)
|
Adjustment to Note 22.1
|
|
(4)
|
Adjustment to Note 22.7
|
|
(5)
|
Others
|
F-100
BBVA BANCO FRANCÉS S.A. AND SUBSIDIARIES
NOTES TO THE CONSOLIDATED FINANCIAL STATEMENTS—(Continued)
For the fiscal years ended December 31, 2012, 2011 and 2010
Stated in thousands of Pesos
|
December 31, 2010
|
||||||||||||||||||||||||||||||||||||||||
|
BCRA GAAP
|
Adjustments
|
US GAAP
|
||||||||||||||||||||||||||||||||||||||
|
Cont
|
Disc
|
Total
|
Cont
|
Disc
|
Total
|
Cont
|
Disc
|
Total
|
||||||||||||||||||||||||||||||||
|
Net income attributable to the controlling interest
|
1,179,811 | 49,524 | 1,229,335 | (406,202 | ) | (63,153 | ) | (469,355 | ) | 773,609 | (13,629 | ) | 759,980 | |||||||||||||||||||||||||||
|
Adjustments to reconcile net income to net cash from operating activities:
|
||||||||||||||||||||||||||||||||||||||||
|
Amortization and depreciation
|
80,116 | 2,223 | 82,339 | (220 | ) | — | (220 | ) | (1) | 79,896 | 2,223 | 82,119 | ||||||||||||||||||||||||||||
|
Allowances for doubtful loans and special reserves, net of reversals
|
(12,955 | ) | 2,343 | (10,612 | ) | (10,600 | ) | — | (10,600 | ) | (2) | (23,555 | ) | 2,343 | (21,212 | ) | ||||||||||||||||||||||||
|
Income tax and TOMPI
|
272,923 | 42,918 | 315,841 | (9,920 | ) | 32,505 | 22,585 | (3) | 263,003 | 75,423 | 338,426 | |||||||||||||||||||||||||||||
|
Equity loss / (gains) of unconsolidated subsidiaries
|
11,018 | — | 11,018 | 8,061 | — | 8,061 | (4) | 19,079 | — | 19,079 | ||||||||||||||||||||||||||||||
|
Net decrease / (increase) in interest receivable and payable and other accrued income and expenses
|
(672,505 | ) | (172,380 | ) | (844,885 | ) | 418,881 | 30,648 | 449,529 | (5) | (253,624 | ) | (141,732 | ) | (395,356 | ) | ||||||||||||||||||||||||
|
Net cash provided by operating activities
|
858,408 | (75,372 | ) | 783,036 | 858,408 | (75,372 | ) | 783,036 | ||||||||||||||||||||||||||||||||
____________________
|
(1)
|
Adjustment to Note 22.18 (portion corresponding to amortization)
|
|
(2)
|
Adjustment to Note 22.4.2
|
|
(3)
|
Adjustment to Note 22.1
|
|
(4)
|
Adjustment to Note 22.7
|
|
(5)
|
Others
|
F-101
BBVA BANCO FRANCÉS S.A. AND SUBSIDIARIES
NOTES TO THE CONSOLIDATED FINANCIAL STATEMENTS—(Continued)
For the fiscal years ended December 31, 2012, 2011 and 2010
Stated in thousands of Pesos
|
|
22.24.
|
New accounting pronouncements (U.S. GAAP)
|
|
|
a)
|
ASU 2012-02, Testing Indefinite-Lived Intangible Assets for Impairment
|
In July 2012, the FASB provides amendments to Topic 350 (Intangibles—Goodwill and Other) by which an entity has the option first to assess qualitative factors to determine whether the existence of events and circumstances indicates that it is more likely than not that the indefinite-lived intangible asset is impaired. If, after assessing the totality of events and circumstances, an entity concludes that it is not more likely than not that the indefinite-lived intangible asset is impaired, then the entity is not required to take further action. However, if an entity concludes otherwise, then it is required to determine the fair value of the indefinite-lived intangible asset and perform the quantitative impairment test by comparing the fair value with the carrying amount.
The amendments are effective for annual and interim impairment tests performed for fiscal years beginning after September 15, 2012. Early adoption is permitted, including for annual and interim impairment tests performed as of a date before July 27, 2012, if a public entity’s financial statements for the most recent annual or interim period have not yet been issued or, for non-public entities, have not yet been made available for issuance.
The Bank does not anticipate that the adoption of this new statement at the required effective date will have a significant effect in its results of operations, financial position or cash flows.
|
|
b)
|
ASU 2012-06, Subsequent Accounting for an Indemnification Asset Recognized at the Acquisition Date as a Result of a Government-Assisted Acquisition of a Financial Institution
|
In October 2012, the FASB provides amendments to Topic 805 (Business Combinations) by which a reporting entity recognizes an indemnification asset as a result of a government-assisted acquisition of a financial institution and subsequently a change in the cash flows expected to be collected on the indemnification asset occurs (as a result of a change in cash flows expected to be collected on the assets subject to indemnification), the reporting entity should subsequently account for the change in the measurement of the indemnification asset on the same basis as the change in the assets subject to indemnification. Any amortization of changes in value should be limited to the contractual term of the indemnification agreement (that is, the lesser of the term of the indemnification agreement and the remaining life of the indemnified assets).
The amendments are effective for fiscal years, and interim periods within those years, beginning on or after December 15, 2012. Early adoption is permitted. The amendments should be applied prospectively to any new indemnification assets acquired after the date of adoption and to indemnification assets existing as of the date of adoption arising from a government-assisted acquisition of a financial institution.
The Bank does not anticipate that the adoption of this new statement at the required effective date will have a significant effect in its results of operations, financial position or cash flows.
F-102
|
Exhibit
Number
|
Description
|
|
|
1.1
|
Amended and Restated By-Laws (Estatutos) of BBVA Banco Francés S.A.
|
|
|
1.2
|
English translation of the Amended and Restated By-Laws (Estatutos) of BBVA Banco Francés S.A.
|
|
|
8.1
|
Subsidiaries of the Company
|
|
|
12.1
|
Section 302 Certification of Chief Executive Officer
|
|
|
12.2
|
Section 302 Certification of Chief Financial Officer
|
|
|
13.1
|
Section 906 Certification by CEO and CFO pursuant to Section 1350, as adapted pursuant to Section 906 of the Sarbanes – Oxley Act of 2002
|
|
TABLE OF CONTENTS
Item 3. Key InformationItem 1. Identity Of Directors, Senior Management and AdvisersItem 2. Offer Statistics and Expected TimetableItem 4. Information on The Company Selected Statistical Information Allowance For Loan Losses and Loan Loss ExperienceItem 4. Information on The Company Recent Political and Economic Developments in Argentina Macroeconomic EnvironmentItem 4. Information on The CompanyItem 4A. Unresolved Staff CommentsItem 5. Operating and Financial Review and ProspectsItem 6. Directors, Senior Management and EmployeesItem 7. Major Shareholders and Related Party TransactionsItem 8. Financial InformationItem 9. The Offer and ListingItem 10. Additional InformationItem 11. Quantitative and Qualitative Disclosures About Market RiskItem 12. Description Of Securities Other Than Equity SecuritiesItem 13. Defaults, Dividend Arrearages and DelinquenciesItem 14. Material Modifications To The Rights Of Security Holders and Use Of ProceedsItem 15. Controls and ProceduresItem 16A. Audit Committee Financial ExpertItem 16B. Code Of EthicsItem 16C. Principal Accountant Fees and ServicesItem 16D. Exemptions From Listing Requirements For Audit CommitteesItem 16E. Purchases Of Equity Securities By One Issuer and Affiliated PersonsItem 16F. Change in Registrant S Certifying AccountantItem 16G. Corporate GovernanceItem 17. Financial StatementsItem 18. Financial StatementsItem 19. ExhibitsNote 1 Corporate Situation and Bank S ActivitiesNote 2 Equity InvestmentsNote 3 Significant Accounting PoliciesNote 4 Differences Between Bcra Accounting Standards and Accounting Principles Generally Accepted in ArgentinaNote 5 Tax MattersNote 6 Breakdown Of Main Items and AccountsNote 7 Financial Information Unit: Summary ProceedingsNote 8 Restrictions on AssetsNote 9 Bank Deposit Guarantee Insurance SystemNote 10 Trust ActivitiesNote 11 Corporate BondsNote 12 Derivative Financial InstrumentsNote 13 Compliance with Cnv RequirementsNote 14 Earnings DistributionsNote 15 Reform Of The Integrated Retirement and Pension SystemNote 16 Minority Interest in SubsidiariesNote 17 Accounts Reflecting Compliance with Minimum CashNote 18 Risk Management PoliciesNote 19 Transactions with Related PartiesNote 20 Transparent Corporate Governance PolicyNote 21 Other Required Disclosures in Accordance with The Sec S Requirements