BED BATH & BEYOND INC
10-Ks and 10-Qs
|
|
|
|
|
|
|
|
|
|
|
|
|
|
|
|
|
|
|
|
|
|
|
|
|
|
|
|
|
|
|
|
|
|
|
|
|
|
|
|
|
|
|
|
|
|
|
UNITED STATES
SECURITIES AND EXCHANGE COMMISSION
Washington, D.C. 20549
FORM 10-K
Annual Report Pursuant to Section 13 or 15(d)
of the Securities Exchange Act of 1934
For the fiscal year ended February 28, 2015
Commission File Number 0-20214
BED BATH & BEYOND INC.
(Exact name of registrant as specified in its charter)
| New York | 11-2250488 |
| (State or other jurisdiction of | (IRS Employer |
| incorporation or organization) | Identification No.) |
650 Liberty Avenue, Union, New Jersey 07083
(Address of principal executive offices) (Zip Code)
Registrant’s telephone number, including area code:
908/688-0888
Securities registered pursuant to Section 12(b) of the Act:
| Title of each class | Name of each exchange on which registered |
|
Common stock, $.01 par value
|
The NASDAQ Stock Market LLC
|
| (NASDAQ Global Select Market) |
Securities registered pursuant to Section 12(g) of the Act:
None
Indicate by check mark if the registrant is a well-known seasoned issuer, as defined in Rule 405 of the Securities Act.
Yes
X
No
Indicate by check mark if the registrant is not required to file reports pursuant to Section 13 or Section 15(d) of the Act.
Yes
No
X
Indicate by check mark whether the registrant (1) has filed all reports required to be filed by Section 13 or 15(d) of the Securities Exchange Act of 1934 during the preceding 12 months (or for such shorter period that the registrant was required to file such reports), and (2) has been subject to such filing requirements for the past 90 days. Yes
X
No
____
Indicate by check mark whether the registrant has submitted electronically and posted on its corporate Web site, if any, every Interactive Data File required to be submitted and posted pursuant to Rule 405 of Regulation S-T (§ 232.405 of this chapter) during the preceding 12 months (or for such shorter period that the registrant was required to submit and post such files). Yes
X
No
____
Indicate by check mark if disclosure of delinquent filers pursuant to Item 405 of Regulation S-K (§ 229.405 of this chapter) is not contained herein, and will not be contained, to the best of registrant’s knowledge, in definitive proxy or information statements incorporated by reference in Part III of this Form 10-K or any amendment to this Form 10-K. [ ]
Indicate by check mark whether the registrant is a large accelerated filer, an accelerated filer, a non-accelerated filer, or a smaller reporting company. See the definitions of “large accelerated filer,” “accelerated filer” and “smaller reporting company” in Rule 12b-2 of the Exchange Act.
Large accelerated filer
X
Accelerated filer
____
Non-accelerated filer
____
Smaller reporting company
Indicate by check mark whether the registrant is a shell company (as defined in Rule 12b-2 of the Exchange Act). Yes No X
As of August 30, 2014, the aggregate market value of the common stock held by non-affiliates (which was computed by reference to the closing price on such date of such stock on the NASDAQ National Market) was $11,352,301,919
.*
The number of shares outstanding of the registrant’s common stock (par value $0.01 per share) at March 28, 2015: 173,182,037.
Documents Incorporated by Reference
Portions of the Registrant’s definitive proxy statement for the 2015 Annual Meeting of Shareholders to be filed pursuant to Regulation 14A are incorporated by reference in Part III hereof.
|
*
|
For purposes of this calculation, all outstanding shares of common stock have been considered held by non-affiliates other than the 8,576,767 shares beneficially owned by directors and executive officers, including in the case of the Co-Chairmen trusts and foundations affiliated with them. In making such calculation, the Registrant does not determine the affiliate or non-affiliate status of any shares for any other purpose.
|
2
TABLE OF CONTENTS
Form 10-K
|
Item No.
|
Name of Item
|
|
3
Unless otherwise indicated, the term "Company" refers collectively to Bed Bath & Beyond Inc. and subsidiaries as of February 28, 2015. The Company’s fiscal year is comprised of the 52 or 53 week period ending on the Saturday nearest February 28. Accordingly, fiscal 2014 and fiscal 2013 represented 52 weeks and ended on February 28, 2015 and March 1, 2014, respectively. Fiscal 2012 represented 53 weeks and ended on March 2, 2013. Unless otherwise indicated, all references herein to periods of time (e.g., quarters and years) are to fiscal periods.
Introduction
Bed Bath & Beyond Inc. and subsidiaries (the “Company”) is a retailer which operates under the names Bed Bath & Beyond (“BBB”), Christmas Tree Shops, Christmas Tree Shops andThat! or andThat! (collectively, “CTS”), Harmon or Harmon Face Values (collectively, “Harmon”), buybuy BABY (“Baby”) and World Market, Cost Plus World Market or Cost Plus (collectively, “Cost Plus World Market”). Customers can purchase products from the Company either in-store, online or through a mobile device. The Company has the developing ability to have customer purchases picked up in-store or shipped direct to the customer from the Company’s distribution facilities, stores or vendors. The Company also operates Linen Holdings, a provider of a variety of textile products, amenities and other goods to institutional customers in the hospitality, cruise line, healthcare and other industries. Additionally, the Company is a partner in a joint venture which operates five retail stores in Mexico under the name Bed Bath & Beyond.
The Company sells a wide assortment of domestics merchandise and home furnishings. Domestics merchandise includes categories such as bed linens and related items, bath items and kitchen textiles. Home furnishings include categories such as kitchen and tabletop items, fine tabletop, basic housewares, general home furnishings, consumables and certain juvenile products.
The Company’s strategy begins and ends with an intense focus on its customers:
|
·
|
To do more for and with its customers;
|
|
·
|
To continue to broaden its customer base; and
|
|
·
|
To engage with its customers wherever, whenever and however they prefer whether it be in-store, online, through a mobile device, or in any combination of these methods.
|
The Company’s objective is to be its customers’ first choice for products and services in the categories offered, in the markets, channels and countries in which the Company operates, as those customers express their life interests and travel through their various life stages. The Company strives to accomplish this objective through excellent customer service, including new service ideas and solutions, and by offering an extensive breadth, depth and differentiated assortment of merchandise at the right value. The Company is also enhancing its ability to achieve this objective through an ongoing commitment to world class information and interactive technology, comprehensive analytics and targeted marketing and communications.
History
The Company was founded in 1971 by Leonard Feinstein and Warren Eisenberg, the Co-Chairmen of the Company. Each has more than 50 years of experience in the retail industry.
The Company commenced operations in 1971 with the opening of two stores, which primarily sold bed linens and bath accessories. In 1985, the Company introduced its first store carrying a full line of domestics merchandise and home furnishings. The Company began using the name "Bed Bath & Beyond" in 1987 in order to reflect the expanded product line offered by its stores and to distinguish its stores from conventional specialty retail stores offering only domestics merchandise or home furnishings. In 2002, the Company acquired Harmon, a health and beauty care retailer, which operated 27 stores at the time located in three states. In 2003, the Company acquired CTS, a retailer of giftware and household items, which operated 23 stores at the time located in six states. In 2007, the Company acquired Baby, a retailer of infant and toddler merchandise, which operated eight stores at the time located in four states. In 2007, the Company opened its first international BBB store in Ontario, Canada. In 2008, the Company became a partner in a joint venture which operated two stores at the time in the Mexico City market under the name “Home & More,” which were rebranded as Bed Bath & Beyond in fiscal 2012. In June 2012, the Company acquired Linen Holdings, LLC (“Linen Holdings”), a provider of a variety of textile products, amenities and other goods to institutional customers in the hospitality, cruise line, healthcare and other industries, and Cost Plus, Inc. (“Cost Plus World Market”), a retailer selling a wide range of home decorating items, furniture, gifts, holiday and other seasonal items, and specialty food and beverages, which operated 258 stores at the time located in 30 states under the names of World Market, Cost Plus World Market or Cost Plus. In 2014, the Company opened its first international Baby store in Alberta, Canada.
4
The Company accounts for its operations as two operating segments: North American Retail and Institutional Sales. The Institutional Sales operating segment, which is comprised of Linen Holdings, does not meet the quantitative thresholds under U.S. generally accepted accounting principles and therefore is not a reportable segment. Net sales outside of the U.S. were not material for fiscal 2014, 2013 and 2012.
Operations
The Company strives to do more for and with its customers by: offering an extensive breadth, depth and differentiated assortment of merchandise at the right value; presenting merchandise in a distinctive manner designed to maximize customer convenience and reinforce customer perception of a wide selection; and providing excellent customer service, including new ideas and solutions. The Company continues to grow, differentiate and leverage its assortment across all channels, concepts and countries in which it operates, to better engage with its customers wherever, whenever and however they express their life interests and travel through their life stages. Through its growing analytic capabilities and omnichannel marketing approaches, the Company strives to more efficiently and effectively understand and satisfy its customers’ needs.
Pricing.
The Company believes in
providing great service with a great selection at the right price
. The Company regularly monitors price levels at its competitors in order to ensure that its prices are in accordance with its pricing philosophy. The Company believes that the application of its pricing philosophy is an important factor in establishing its reputation among customers.
Merchandise Assortment.
The Company sells a wide assortment of domestics merchandise and home furnishings.
Domestics merchandise includes categories such as bed linens and related items, bath items and kitchen textiles. Home furnishings include categories such as kitchen and tabletop items, fine tabletop, basic housewares, general home furnishings, consumables and certain juvenile products. The Company strives to tailor its merchandise mix as appropriate to respond to changing trends and conditions and extend the Company’s ability to satisfy its customers’ life interests as they travel through their life stages. The Company, on an ongoing basis, tests new merchandise categories and adjusts the categories of merchandise carried in-store, online or available for order in-store and may add new product categories or expand its merchandise assortment as appropriate. Additionally, the Company continues to integrate the merchandise assortments among its concepts. The Company believes that the process of adding new product categories, integrating the Company’s merchandise within concepts, and expanding or reducing the size of various product categories in response to changing conditions is an important part of its merchandising strategy.
Merchandise Presentation.
The Company has developed a style of merchandise presentation where groups of related product lines are presented together. The Company believes that this approach to merchandise presentation makes it easy for customers to locate products and reinforces customer perception of a wide selection.
Advertising.
In general, the Company relies on “word of mouth advertising,” its reputation for offering a wide assortment of quality merchandise at competitive prices and the use of paid advertising. Primary vehicles of paid advertising used by the Company include full-color circulars and other advertising communications distributed via direct mail or inserts, as well as digital media including email, mobile, social, search, digital display and online affiliate advertising. The Company also utilizes its data to develop marketing communications across all platforms communicating content and product offerings to customers through increasingly personalized messaging linked to individual interests and life stages.
Customer Service.
The Company’s longstanding culture of customer service encourages its associates to create a noticeably better shopping experience for each and every customer. Through its customer centric policies and emphasis on life interests and life stage events, the Company stresses the importance of each personalized customer relationship. The Company continues to focus its efforts and investments on ensuring that it constantly improves every customer experience at every touch point and in every channel.
5
Suppliers
In fiscal 2014, the Company purchased its merchandise from approximately 8,600 suppliers with the Company’s largest supplier accounting for approximately 4% of the Company’s merchandise purchases and the Company’s 10 largest suppliers accounting for approximately 17% of such purchases. The Company purchases substantially all of its merchandise in the United States, the majority from domestic sources and the balance from importers. The Company purchases a small amount of its merchandise directly from overseas sources. The Company has no long term contracts for the purchase of merchandise. The Company believes that most merchandise, other than brand name goods, is available from a variety of sources and that most brand name goods can be replaced with comparable merchandise.
Distribution of Merchandise
A substantial portion of the Company’s merchandise is shipped to stores or customers through a combination of third party or Company operated distribution facilities which are primarily located throughout the United States. The remaining merchandise is shipped directly from vendors. Shipments are made by contract carriers on a regular basis depending upon location.
See Item 2 – Properties for additional information regarding the Company’s distribution facilities.
Employees
As of February 28, 2015, the Company employed approximately 60,000 persons in full-time and part-time positions. The Company believes that its relations with its employees are very good and that the labor turnover rate among its management employees is lower than that generally experienced within the industry.
Seasonality
The Company’s sales exhibit seasonality with sales levels generally higher in the calendar months of August, November and December, and generally lower in February.
Growth
The Company is effecting its growth through the evolution of its omnichannel shopping environment, the optimization of its store operations and market coverage by expanding, downsizing, renovating, opening, closing and relocating stores; the growth of its complimentary institutional business and the continuous review of strategic acquisitions.
In the 23-year period from the beginning of fiscal 1992 to the end of fiscal 2014, the chain has grown from 34 stores to 1,513 stores plus its various websites, other interactive platforms and distribution facilities. The Company’s 1,513 stores operate in all 50 states, the District of Columbia, Puerto Rico and Canada, including: 1,019 BBB stores operating in all 50 states, the District of Columbia, Puerto Rico and Canada and through bedbathandbeyond.com and bedbathandbeyond.ca; 270 Cost Plus World Market stores operating in 32 states and the District of Columbia and through worldmarket.com; 96 Baby stores operating in 32 states and Canada and through buybuybaby.com; 78 CTS stores operating in 21 states and through christmastreeshops.com and andthat.com; and 50 Harmon stores operating in five states and through harmondiscount.com and facevalues.com. Total store square footage, net of openings and closings, grew from approximately 0.9 million square feet at the beginning of fiscal 1992 to approximately 43.0 million square feet at the end of fiscal 2014. In addition, the Company has distribution facilities totaling 6.0 million square feet. During fiscal 2014, the Company opened a total of 22 new stores, including nine BBB stores and six Baby stores throughout the United States and Canada and six Cost Plus World Market stores and one CTS store throughout the United States. In addition, the Company continued to optimize its operations in a number of trade areas through renovating and repositioning stores in various markets, which included the closing of four BBB stores and one Cost Plus World Market store. In fiscal 2014, consolidated store space, net of openings and closings for all concepts, increased by 0.4 million square feet. Additionally, the Company is a partner in a joint venture which opened one store during fiscal 2014 and as of February 28, 2015, operated a total of five retail stores in Mexico under the name Bed Bath & Beyond.
6
The Company plans to continue to expand its operations and invest in its infrastructure to reach its long term objectives. Additionally, in connection with leveraging its merchandise offerings and optimizing its operations, the Company continues to expand, across selected stores, the number of specialty departments such as health and beauty care, baby, specialty food, and beverage. Also, the Company is
committed to the continued growth of its merchandise categories and channels and is
growing the number of items it is able to have shipped directly to customers from a vendor.
The Company has built its management structure with a view toward its growth and believes that, as a result, it has the necessary management depth.
Competition
The Company operates in the fragmented and highly competitive retail industry. The Company competes with many different types of retailers, including omnichannel retailers, that sell many or most of the same products. Such competitors include, but are not limited to, department stores, specialty retailers, discount and mass merchandise retailers, national chains and online only retailers. In addition, the Company competes, to a more limited extent, with factory outlet stores. Other entities continue to introduce new concepts that include many of the product lines offered by the Company. There can be no assurance that the operation of competitors will not have a material adverse effect on the Company.
Tradenames and Service Marks
The Company uses the service marks “Bed Bath & Beyond,” “buybuy BABY,” “Christmas Tree Shops,” “andThat!,” “Harmon,” “Face Values,” “Cost Plus,” “World Market” and “Cost Plus World Market” in connection with its retail services. The Company has registered trademarks and service marks or is seeking registrations for these and other trademarks and service marks with the United States Patent and Trademark Office. In addition, the Company has registered or has applications pending with the trademark registries of several foreign countries, including having registered the “Bed Bath & Beyond” name and logo in Canada and Mexico. The Company also files patent applications and seeks copyright registrations where it deems such to be advantageous to the business. Management believes that its name recognition and service marks are important elements of the Company’s merchandising strategy.
Available Information
The Company makes available as soon as reasonably practicable after filing with the Securities and Exchange Commission (“SEC”), free of charge, through its website, www.bedbathandbeyond.com, the Company’s annual reports on Form 10-K, quarterly reports on Form 10-Q, current reports on Form 8-K, and amendments to those reports, electronically filed or furnished pursuant to Section 13(a) or 15(d) of the Securities Exchange Act of 1934.
7
Executive Officers of the Registrant
The following table sets forth the name, age and business experience of the Executive Officers of the Registrant:
|
Name
|
Age
|
Positions
|
|
Warren Eisenberg
|
84
|
Co-Chairman and Director
|
|
Leonard Feinstein
|
78
|
Co-Chairman and Director
|
|
Steven H. Temares
|
56
|
Chief Executive Officer and Director
|
|
Arthur Stark
|
60
|
President and Chief Merchandising Officer
|
|
Matthew Fiorilli
|
58
|
Senior Vice President – Stores
|
|
Eugene A. Castagna
|
49
|
Chief Operating Officer
|
|
Susan E. Lattmann
|
47
|
Chief Financial Officer and Treasurer
|
Warren Eisenberg
is a Co-Founder of the Company and has served as Co-Chairman since 1999. He has served as a Director since 1971. Mr. Eisenberg served as Chairman from 1992 to 1999, and served as Co-Chief Executive Officer from 1971 to 2003.
Leonard Feinstein
is a Co-Founder of the Company and has served as Co-Chairman since 1999. He has served as a Director since 1971. Mr. Feinstein served as President from 1992 to 1999, and served as Co-Chief Executive Officer from 1971 to 2003.
Steven H. Temares
has been Chief Executive Officer since 2003 and has served as a Director since 1999. Mr. Temares was President and Chief Executive Officer from 2003 to 2006, President and Chief Operating Officer from 1999 to 2003 and Executive Vice President and Chief Operating Officer from 1997 to 1999. Mr. Temares joined the Company in 1992.
Arthur Stark
has been President and Chief Merchandising Officer since 2006. Mr. Stark has served as Chief Merchandising Officer since 1999 and was a Senior Vice President from 1999 to 2006. Mr. Stark joined the Company in 1977.
Matthew Fiorilli
has been Senior Vice President - Stores since 1999. Mr. Fiorilli joined the Company in 1973.
Eugene
A.
Castagna
has been Chief Operating Officer since February 2014. Mr. Castagna served as Chief Financial Officer and Treasurer from 2006 to 2014, Assistant Treasurer from 2002 to 2006 and as Vice President - Finance from 2000 to 2006. Mr. Castagna is a certified public accountant and joined the Company in 1994.
Susan E. Lattmann
has been Chief Financial Officer and Treasurer since February 2014. Ms. Lattmann served as Vice President – Finance from 2006 to 2014, Vice President - Controller from 2001 to 2006 and Controller from 2000 to 2001. Ms. Lattmann is a certified public accountant and joined the Company in 1996.
The Company’s executive officers are elected by the Board of Directors for one-year terms and serve at the discretion of the Board of Directors. No family relationships exist between any of the executive officers or directors of the Company.
8
FORWARD-LOOKING STATEMENTS
This Form 10-K contains forward-looking statements within the meaning of Section 21E of the Securities Exchange Act of 1934, as amended. The Company’s actual results and future financial condition may differ materially from those expressed in any such forward-looking statements as a result of many factors. Such factors include the following:
General economic factors beyond the Company’s control and changes in the economic climate could adversely affect the Company’s performance.
General economic factors that are beyond the Company’s control could impact the Company’s forecasts and actual performance. These factors include housing markets, recession, inflation, deflation, consumer credit availability, consumer debt levels, fuel and energy costs, interest rates, tax rates and policy, unemployment trends, the impact of natural disasters, civil disturbances and terrorist activities, foreign currency exchange rate fluctuations, conditions affecting the retail environment for products sold by the Company and other matters that influence consumer spending. Changes in the economic climate could adversely affect the Company’s performance.
The Company operates in the highly competitive retail business where the use of emerging technologies as well as unanticipated changes in the pricing and other practices of competitors may adversely affect the Company’s performance.
The retail business is highly competitive. The Company competes for customers, employees, locations, merchandise, technology, services and other important aspects of the business with many other local, regional and national retailers. Those competitors range from specialty retailers to department stores and discounters as well as online and multichannel retailers. Specifically, rapidly evolving technologies are altering the manner in which the Company and its competitors communicate and transact with customers; the Company’s execution of its own omnichannel strategy to adapt to these changes, in relation to its competitors’ actions as well as to its customers adoption of new technology, presents a specific risk. Further, unanticipated changes in the pricing and other practices of the Company’s competitors, including promotional activity and rapid price fluctuation enabled by technology, may adversely affect the Company’s performance.
The Company’s failure to anticipate and respond in a timely fashion to changes in consumer preferences and demographic factors may adversely affect the Company’s financial condition and results of operations.
The Company’s success depends on its ability to anticipate and respond in a timely manner to changing merchandise trends, customer demands and demographics. The Company’s failure to anticipate, identify or react appropriately to changes in customer tastes, preferences, shopping and spending patterns and other life interest decisions could lead to, among other things, excess inventories or a shortage of products and may adversely affect the Company’s financial condition and results of operations.
Unusual weather patterns could adversely affect the Company’s performance.
The Company’s operating results could be negatively impacted by unusual weather patterns. Frequent or unusually heavy snow, ice or rain storms, hurricanes, floods, tornados or extended periods of unseasonable temperatures could adversely affect the Company’s performance.
9
A major disruption of the Company’s information technology systems could negatively impact operating results.
The Company’s operating results could be negatively impacted by a major disruption of the Company’s information technology systems. The Company relies heavily on these systems to process transactions, manage inventory replenishment, summarize results and control distribution of products. Despite numerous safeguards and careful contingency planning, these systems are still subject to power outages, computer viruses, telecommunication failures, security breaches and other catastrophic events. A major disruption of the systems and their backup mechanisms may cause the Company to incur significant costs to repair the systems, experience a critical loss of data and/or result in business interruptions.
A breach of the Company's data security systems or those of its third party service providers could have a negative impact on the Company's operating results and financial performance due to possible loss of consumer confidence, as well as potential government penalties and private litigation.
The Company processes, transmits, stores and maintains certain information about its customers and employees in the ordinary course of business. In connection with certain activities, including without limitation credit card processing, website hosting, data encryption and software support, the Company utilizes third party service providers, and the Company believes it takes appropriate steps to require such providers to secure such information and to assess their ability to do so. The Company invests considerable resources in protecting this sensitive information but is still subject to a possible security event, including but not limited to cybercrimes or cybersecurity attacks which may not be detected for a period of time. A breach of its security systems or those of its third party service providers resulting in unauthorized access to stored personal information could negatively impact the Company’s operating results and financial performance. Certain aspects of the business, particularly the Company’s websites, heavily depend on consumers entrusting personal financial information to be transmitted securely over public networks. A loss of consumer confidence from such a breach could result in lost future sales and have a material adverse effect on the Company’s reputation. In addition, a breach could cause the Company to incur significant costs to restore the integrity of its systems, could require the devotion of significant management resources, and could result in significant costs in government penalties and private litigation.
A failure of the Company’s suppliers to adhere to appropriate laws, regulations or standards could negatively impact its reputation.
The Company purchases substantially all of its merchandise in the United States, the majority from domestic sources and the balance from importers. The Company purchases a small amount of its merchandise directly from overseas sources. The failure of one of the Company’s domestic or foreign suppliers to adhere to labor, environmental, privacy, health and safety laws, regulations and standards could negatively impact the Company’s reputation and have an adverse effect on the Company’s results of operations.
A failure to protect the reputation of the Company in any aspect of its operations could potentially impact its operating and financial results.
The Company’s reputation is based, in part, on perceptions of subjective qualities, so incidents involving the Company, its products or the retail industry in general that erode customer trust or confidence could adversely affect the Company’s reputation and its business. As the Company increases the number of items it is able to have shipped directly from a vendor to a customer for home delivery or in home assembly, any deficiencies in the performance of these third party merchandise vendors and service providers could also have an adverse effect on the Company’s reputation, despite the Company’s monitoring controls and procedures. In addition, challenges to the Company’s compliance with a variety of social, product, labor and environmental standards could also jeopardize its reputation and lead to adverse publicity, especially in social media outlets. Damage to the reputation of the Company in any aspect of its operations could potentially impact its operating and financial results as well as require additional resources to rebuild its reputation.
10
Changes in statutory, regulatory, and other legal requirements at a local, state or provincial and national level could potentially impact the Company’s operating and financial results.
The Company is subject to numerous statutory, regulatory and legal requirements at a local, state or provincial and national level. The Company’s operating results could be negatively impacted by developments in these areas due to the costs of compliance in addition to possible government penalties and litigation in the event of deemed noncompliance. Changes in the regulatory environment in the area of product safety, environmental protection, privacy and information security, wage and hour laws, among others, could potentially impact the Company’s operations and financial results.
New, or developments in existing, litigation, claims or assessments could potentially impact the Company’s operating and financial results.
The Company is involved in litigation, claims and assessments incidental to the Company’s business, the disposition of which is not expected to have a material effect on the Company’s financial position or results of operations. It is possible, however, that future results of operations for any particular quarterly or annual period could be materially affected by changes in the Company’s assumptions related to these matters. While outcomes of such actions vary, any such claim or assessment against the Company could potentially impact the Company’s operations and financial results.
Changes to accounting rules, regulations and tax laws, or new interpretations of existing accounting standards or tax laws could negatively impact the Company’s operating results and financial position.
The Company’s operating results and financial position could be negatively impacted by changes to accounting rules and regulations or new interpretations of existing accounting standards. These changes may include, without limitation, changes to lease accounting standards. The Company’s effective income tax rate could be impacted by changes in accounting standards as well as changes in tax laws or the interpretations of these tax laws by courts and taxing authorities which could negatively impact the Company’s financial results.
The success of the Company is dependent, in part, on managing costs of labor, merchandise and other expenses that are subject to factors beyond the Company’s control.
The Company’s success depends, in part, on its ability to manage operating costs and to look for opportunities to reduce costs. The Company’s ability to meet its labor needs while controlling costs is subject to external factors such as unemployment levels, prevailing wage rates, minimum wage legislation, labor organizing activities and changing demographics. The Company’s ability to find qualified merchandise vendors and service providers and obtain access to products in a timely and efficient manner can be adversely affected by political instability, the financial instability of suppliers, suppliers’ noncompliance with applicable laws, transportation costs, disruptions to its supply chain network serving the Company’s stores, distribution facilities and customers due to labor disturbances and other items, and other factors beyond the Company’s control.
The success of the Company is dependent, in part, on the ability of its employees in all areas of the organization to execute its business plan and, ultimately, to satisfy its customers.
The Company’s ability to attract and retain qualified employees in all areas of the organization may be affected by a number of factors, including geographic relocation of employees, operations or facilities and the highly competitive markets in which the Company operates, including the markets for the types of skilled individuals needed to support the Company's continued success domestically, interactively and, over the longer term, internationally.
The success of the Company is dependent, in part, on its ability to establish and profitably maintain the appropriate mix of virtual and physical presence in the markets it serves.
The Company’s success depends, in part, on its ability to develop its omnichannel capabilities in conjunction with optimizing its physical store operations and market coverage, while maintaining profitability. The Company’s ability to develop its omnichannel capabilities will depend on a number of factors, including its assessment and implementation of emerging technologies. The Company’s ability to optimize its store operations and market coverage requires active management of its real estate portfolio in a manner that permits store sizes, layouts, locations and offerings to evolve over time, which to the extent it involves the relocation of existing stores or the opening of additional stores will depend on a number of factors, including its identification and availability of suitable locations; its success in negotiating leases on acceptable terms; its hiring and training of skilled store operating personnel, especially management; and its timely development of new stores, including the availability of construction materials and labor and the absence of significant construction and other delays based on weather or other events. These factors could potentially increase the cost of doing business and the risk that the Company’s business practices could result in liabilities that may adversely affect its performance, despite the exercise of reasonable care.
11
Disruptions in the financial markets could have an adverse effect on the Company’s ability to access its cash and cash equivalents.
The Company may have amounts of cash and cash equivalents at financial institutions that are in excess of federally insured limits. While the Company closely manages its cash and cash equivalents balances to minimize risk, if there were disruptions in the financial markets, the Company cannot be assured that it will not experience losses on its deposits.
The Company’s business would be adversely affected if the Company is unable to service its debt obligations.
The Company has incurred indebtedness under senior unsecured notes and has entered into a senior unsecured revolving credit facility. The Company’s ability to pay interest and principal when due, comply with debt covenants or repurchase the senior unsecured notes if a change of control occurs, will depend upon, among other things, sales and cash flow levels and other factors that affect its future financial and operating performance, including prevailing economic conditions and financial and business factors, many of which are beyond the Company’s control.
If the Company becomes unable in the future to generate sufficient cash flow to meet its debt service requirements, it may be forced to take remedial actions such as restructuring or refinancing its debt; seeking additional debt or equity capital; reducing or delaying its business activities, or selling assets. There can be no assurance that any such measures would be successful.
The Company has acquired several businesses and continues to evaluate potential business initiatives, including acquisitions, any of which could adversely impact the Company’s performance.
The Company believes it carefully evaluates and plans for the integration of newly acquired businesses, as well as carefully prepares for and executes on other business combinations and strategic initiatives that are part of the success of its business. However, such activities involve certain inherent risks, including the failure to retain key personnel from an acquired business; undisclosed or subsequently arising liabilities; challenges in the successful integration of operations, aligning standards, policies and systems; and the potential diversion of management resources from existing operations to respond to unforeseen issues arising in the context of the integration of a new business or initiative.
None.
12
Most of the Company’s stores are located in suburban areas of medium and large-sized cities. These stores are situated in strip and power strip shopping centers, as well as in major off-price and conventional malls, and in free standing buildings.
The Company’s 1,513 stores are located in all 50 states, the District of Columbia, Puerto Rico and Canada and range in size from approximately 5,000 to 100,000 square feet, but are predominantly between 18,000 and 50,000 square feet. Approximately 85% to 90% of store space is used for selling areas.
The table below sets forth the locations of the Company’s stores as of February 28, 2015:
|
Alabama
|
22
|
New York
|
96
|
||
|
Alaska
|
2
|
North Carolina
|
45
|
||
|
Arizona
|
42
|
North Dakota
|
2
|
||
|
Arkansas
|
7
|
Ohio
|
51
|
||
|
California
|
186
|
Oklahoma
|
9
|
||
|
Colorado
|
34
|
Oregon
|
17
|
||
|
Connecticut
|
24
|
Pennsylvania
|
43
|
||
|
Delaware
|
4
|
Rhode Island
|
5
|
||
|
Florida
|
97
|
South Carolina
|
24
|
||
|
Georgia
|
37
|
South Dakota
|
3
|
||
|
Hawaii
|
2
|
Tennessee
|
27
|
||
|
Idaho
|
9
|
Texas
|
115
|
||
|
Illinois
|
57
|
Utah
|
15
|
||
|
Indiana
|
24
|
Vermont
|
3
|
||
|
Iowa
|
10
|
Virginia
|
47
|
||
|
Kansas
|
11
|
Washington
|
37
|
||
|
Kentucky
|
11
|
West Virginia
|
3
|
||
|
Louisiana
|
20
|
Wisconsin
|
16
|
||
|
Maine
|
8
|
Wyoming
|
2
|
||
|
Maryland
|
23
|
District of Columbia
|
3
|
||
|
Massachusetts
|
43
|
Puerto Rico
|
3
|
||
|
Michigan
|
44
|
Alberta, Canada
|
10
|
||
|
Minnesota
|
15
|
British Columbia, Canada
|
7
|
||
|
Mississippi
|
7
|
Manitoba, Canada
|
1
|
||
|
Missouri
|
24
|
New Brunswick, Canada
|
2
|
||
|
Montana
|
9
|
Newfoundland, Canada
|
1
|
||
|
Nebraska
|
6
|
Novia Scotia, Canada
|
1
|
||
|
Nevada
|
13
|
Ontario, Canada
|
20
|
||
|
New Hampshire
|
14
|
Prince Edward Island, Canada
|
1
|
||
|
New Jersey
|
89
|
Saskatchewan, Canada
|
1
|
||
|
New Mexico
|
9
|
Total
|
1,513
|
The Company leases substantially all of its existing stores. The leases provide for original lease terms that generally range from 10 to 15 years and most leases provide for renewal options, often at increased rents. The Company evaluates leases on an ongoing basis which may lead to renegotiated lease terms, including rents during renewal options, or the possible relocation of stores. Certain leases provide for scheduled rent increases (which, in the case of fixed increases, the Company accounts for on a straight-line basis over the committed lease term, beginning when the Company obtains possession of the premises) and/or for contingent rent (based upon store sales exceeding stipulated amounts).
13
The Company has distribution facilities, which ship merchandise to stores or customers, totaling approximately 6.0 million square feet consisting of three owned and 15 leased facilities.
As of February 28, 2015, the Company has approximately 787,000 square feet within 15 leased and owned facilities for procurement and corporate office functions. In addition, the Company has seven locations, totaling approximately 14,000 square feet, which are utilized primarily for institutional sales related functions.
The Company is party to various legal proceedings arising in the ordinary course of business, which the Company does not believe to be material to the Company’s business or financial condition.
Not Applicable.
14
SHAREHOLDER MATTERS AND ISSUER PURCHASES OF EQUITY
SECURITIES
The following table sets forth the high and low reported closing prices of the Company’s common stock on the NASDAQ National Market System for the periods indicated.
|
High
|
Low
|
|||||||
|
Fiscal 2014:
|
||||||||
|
1st Quarter
|
$ | 69.80 | $ | 60.51 | ||||
|
2nd Quarter
|
64.53 | 56.70 | ||||||
|
3rd Quarter
|
73.69 | 62.40 | ||||||
|
4th Quarter
|
79.45 | 71.12 | ||||||
|
High
|
Low
|
|||||||
|
Fiscal 2013:
|
||||||||
|
1st Quarter
|
$ | 70.07 | $ | 56.75 | ||||
|
2nd Quarter
|
78.18 | 66.98 | ||||||
|
3rd Quarter
|
78.58 | 71.78 | ||||||
|
4th Quarter
|
80.48 | 62.68 | ||||||
The common stock is quoted through the NASDAQ National Market System under the symbol BBBY. On March 28, 2015, there were approximately 5,800 shareholders of record of the common stock (without including individual participants in nominee security position listings). On March 28, 2015, the last reported sale price of the common stock was $75.46.
The Company has not paid cash dividends on its common stock since its 1992 initial public offering and does not currently plan to pay dividends on its common stock. The payment of any future dividends will be determined by the Board of Directors in light of conditions then existing, including the Company’s earnings, financial condition and requirements, business conditions and other factors. See Item 8 - Financial Statements and Supplementary Data.
15
Since 2004 through the end of fiscal 2014, the Company has repurchased approximately $8.6 billion of its common stock through share repurchase programs, which include repurchases made under the accelerated share repurchase agreement which was entered into and completed in fiscal 2014. The Company’s purchases of its common stock during the fourth quarter of fiscal 2014 were as follows:
|
Period
|
Total Number of
Shares Purchased (1)
|
Average Price
Paid per Share (2)
|
Total Number of
Shares Purchased as
Part of Publicly
|
Approximate Dollar
Value of Shares
|
||||||||||||
|
November 30, 2014 - December 27, 2014 (3)
|
3,369,500 | $ | 69.98 | 3,369,500 | $ | 1,524,756,411 | ||||||||||
|
December 28, 2014 - January 24, 2015
|
5,097,500 | $ | 75.47 | 5,097,500 | $ | 1,140,034,871 | ||||||||||
|
January 25, 2015 - February 28, 2015
|
3,347,000 | $ | 76.53 | 3,347,000 | $ | 883,878,947 | ||||||||||
|
Total
|
11,814,000 | $ | 74.21 | 11,814,000 | $ | 883,878,947 | ||||||||||
|
(1) Between December 2004 and July 2014, the Company's Board of Directors authorized, through several share repurchase programs, the repurchase of $9.450 billion of its shares of common stock. The Company has authorization to make repurchases from time to time in the open market or through other parameters approved by the Board of Directors pursuant to existing rules and regulations. Shares purchased indicated in this table also include the withholding of a portion of restricted shares to cover taxes on vested restricted shares.
|
|
(2) Excludes brokerage commissions paid by the Company.
|
|
(3) In the second quarter of fiscal 2014, the Company paid $1.1 billion under an accelerated share repurchase agreement ("ASR") and received an initial delivery of approximately 15.4 million shares. The initial delivery of shares was reflected in the activity shown in the second quarter of fiscal 2014. In December 2014, the ASR was completed and the Company received an additional 1.5 million shares, which is reflected in the activity shown above. The additional 1.5 million shares are reflected at the Average Price Paid per share of $65.41, which is the Company's volume weighted average price per common share over the ASR period less a discount.
|
Stock Price Performance Graph
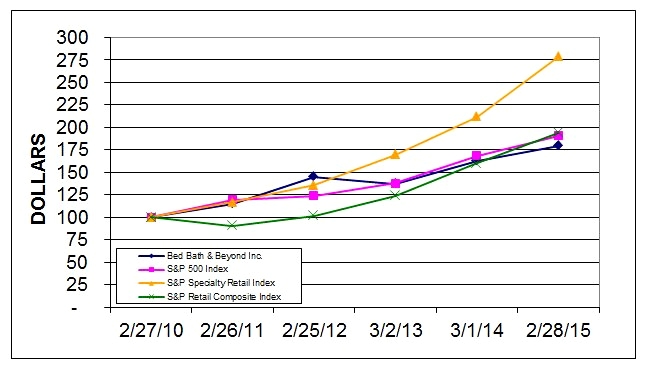
The graph shown below compares the performance of the Company’s common stock with that of the S&P 500 Index, the S&P Specialty Retail Index and the S&P Retail Composite Index over the same period (assuming the investment of $100 in the Company’s common stock and each of the three Indexes on February 27, 2010, and the reinvestment of dividends, if any).
16
|
Consolidated Selected Financial Data
|
Fiscal Year Ended (1)
|
|||||||||||||||||||
|
(in thousands, except per share
and selected operating data)
|
February 28,
2015
|
March 1,
2014
|
March 2,
2013 (2)
|
February 25,
2012
|
February 26,
2011
|
|||||||||||||||
|
Statement of Earnings Data:
|
||||||||||||||||||||
|
Net sales
|
$ | 11,881,176 | $ | 11,503,963 | $ | 10,914,585 | $ | 9,499,890 | $ | 8,758,503 | ||||||||||
|
Gross profit
|
4,619,779 | 4,565,582 | 4,388,755 | 3,930,933 | 3,622,929 | |||||||||||||||
|
Operating profit
|
1,554,293 | 1,614,587 | 1,638,218 | 1,568,369 | 1,288,458 | |||||||||||||||
|
Net earnings
|
957,474 | 1,022,290 | 1,037,788 | 989,537 | 791,333 | |||||||||||||||
|
Net earnings per share - Diluted
|
$ | 5.07 | $ | 4.79 | $ | 4.56 | $ | 4.06 | $ | 3.07 | ||||||||||
|
Selected Operating Data:
|
||||||||||||||||||||
|
Number of stores open (at period end)
|
1,513 | 1,496 | 1,471 | 1,173 | 1,139 | |||||||||||||||
|
Total square feet
of store space (at period end)
|
43,041,000 | 42,619,000 | 42,030,000 | 36,125,000 | 35,055,000 | |||||||||||||||
|
Percentage increase in comparable sales
|
2.4 | % | 2.4 | % | 2.7 | % | 5.9 | % | 7.8 | % | ||||||||||
|
Comparable sales (in 000's) (3)
|
$ | 11,517,454 | $ | 10,660,573 | $ | 9,819,904 | $ | 9,157,183 | $ | 8,339,112 | ||||||||||
|
Balance Sheet Data (at period end):
|
||||||||||||||||||||
|
Working capital
|
$ | 2,140,922 | $ | 1,953,851 | $ | 2,216,323 | $ | 2,760,619 | $ | 2,748,763 | ||||||||||
|
Total assets
|
6,758,993 | 6,356,033 | 6,279,952 | 5,724,546 | 5,646,193 | |||||||||||||||
|
Long-term sale/leaseback and capital lease
obligations (4)
|
106,948 | 108,046 | 108,364 | - | - | |||||||||||||||
|
Long-term debt (5)
|
1,500,000 | - | - | - | - | |||||||||||||||
|
Shareholders' equity (6) (7)
|
$ | 2,743,190 | $ | 3,941,287 | $ | 4,079,730 | $ | 3,922,528 | $ | 3,931,659 | ||||||||||
|
(1) Each fiscal year represents 52 weeks, except for fiscal 2012 (ended March 2, 2013) which represents 53 weeks.
|
|
(2) The Company acquired Linen Holdings, LLC. on June 1, 2012 and Cost Plus, Inc. on June 29, 2012.
|
|
(3) Comparable sales include sales
consummated
through all retail channels which have been operating for twelve full months following the opening period (typically four to six weeks).
Linen Holdings is excluded from the comparable sales calculations and will continue to be excluded on an ongoing basis as it represents non-retail activity.
|
|
(4) As a result of the Cost Plus, Inc. acquisition, the Company assumed two sale/leaseback and various capital lease obligations.
|
|
(5) On July 17, 2014, the Company issued $300 million aggregate principal amount of 3.749% senior unsecured notes due August 1, 2024, $300 million aggregate principal amount of 4.915% senior unsecured notes due August 1, 2034 and $900 million aggregate principal amount of 5.165% senior unsecured notes due August 1, 2044.
|
|
(6) The Company has not declared any cash dividends in any of the fiscal years noted above.
|
|
(7) In fiscal 2014, 2013, 2012, 2011 and 2010, the Company repurchased approximately $2.251 billion, $1.284 billion, $1.001 billion, $1.218 billion and $688 million of its common stock, respectively.
|
17
CONDITION AND RESULTS OF OPERATIONS
OVERVIEW
Bed Bath & Beyond Inc. and subsidiaries (the “Company”) is a retailer which operates under the names Bed Bath & Beyond (“BBB”), Christmas Tree Shops, Christmas Tree Shops andThat! or andThat! (collectively, “CTS”), Harmon or Harmon Face Values (collectively, “Harmon”), buybuy BABY (“Baby”) and World Market, Cost Plus World Market and Cost Plus (collectively, “Cost Plus World Market”). Customers can purchase products from the Company either in-store, online or through a mobile device. The Company has the developing ability to have customer purchases picked up in-store or shipped direct to the customer from the Company’s distribution facilities, stores or vendors. The Company also operates Linen Holdings, a provider of a variety of textile products, amenities and other goods to institutional customers in the hospitality, cruise line, healthcare and other industries. (See “Acquisitions,” Note 2 in the consolidated financial statements for information regarding the acquisitions of Cost Plus World Market and Linen Holdings). Additionally, the Company is a partner in a joint venture which operates five retail stores in Mexico under the name Bed Bath & Beyond.
The Company accounts for its operations as two operating segments: North American Retail and Institutional Sales. The Institutional Sales operating segment, which is comprised of Linen Holdings, does not meet the quantitative thresholds under U.S. generally accepted accounting principles and therefore is not a reportable segment.
The Company sells a wide assortment of domestics merchandise and home furnishings. Domestics merchandise includes categories such as bed linens and related items, bath items and kitchen textiles. Home furnishings include categories such as kitchen and tabletop items, fine tabletop, basic housewares, general home furnishings, consumables and certain juvenile products.
The Company’s strategy begins and ends with an intense focus on its customers:
|
·
|
To do more for and with its customers;
|
|
·
|
To continue to broaden its customer base; and
|
|
·
|
To engage with its customers wherever, whenever and however they prefer whether it be in-store, online, through a mobile device, or in any combination of these methods.
|
The Company’s objective is to be its customers’ first choice for products and services in the categories offered, in the markets, channels and countries in which the Company operates, as those customers express their life interests and travel through their various life stages. The Company strives to accomplish this objective through excellent customer service, including new service ideas and solutions, and by offering an extensive breadth, depth and differentiated assortment of merchandise at the right value. The Company is also enhancing its ability to achieve this objective through its ongoing commitment to world class information and interactive technology, comprehensive analytics and targeted marketing and communications.
Operating in the highly competitive retail industry, the Company, along with other retail companies, is influenced by a number of factors including, but not limited to, general economic conditions including the housing market, unemployment levels and commodity prices; the overall macroeconomic environment and related changes in the retailing environment; consumer preferences and spending habits; unusual weather patterns and natural disasters; competition from existing and potential competitors; evolving technology; and the ability to find suitable locations at acceptable occupancy costs and other terms to support the Company’s growth. The Company cannot predict whether, when or the manner in which these factors could affect the Company’s operating results.
For fiscal 2014 and 2013, the results of operations include Linen Holdings and Cost Plus World Market from the beginning of the fiscal year. For fiscal 2012, the results of operations include Linen Holdings since the date of acquisition on June 1, 2012 and Cost Plus World Market since the date of acquisition on June 29, 2012.
18
The following represents an overview of the Company’s financial performance for the periods indicated:
|
·
|
Net sales in fiscal 2014 (fifty-two weeks) increased approximately 3.3% to $11.881 billion; net sales in fiscal 2013 (fifty-two weeks) increased approximately 5.4% to $11.504 billion over net sales of $10.915 billion in fiscal 2012 (fifty-three weeks).
|
|
·
|
Comparable sales for both fiscal 2014 and fiscal 2013 increased by approximately 2.4% as compared with an increase of approximately 2.7% in fiscal 2012. For fiscal 2014, comparable sales consummated through customer facing online websites and mobile applications increased in excess of 50%, over the corresponding period in the prior year, while comparable sales consummated in-store were relatively flat to the corresponding period in the prior year. Comparable sales percentages are calculated based on an equivalent number of weeks for each annual period.
|
Comparable sales include sales consummated through all retail channels which have been operating for twelve full months following the opening period (typically four to six weeks). The Company is an omnichannel retailer with capabilities that allow a customer to use more than one channel when making a purchase, including in-store, online and mobile channels, and have it fulfilled, in most cases, either through in-store customer pickup or by direct shipment to the customer from one of the Company’s distribution facilities, stores or vendors.
Sales consummated on a mobile device while physically in a store location are recorded as customer facing online websites and mobile applications sales. Customer orders reserved online and picked up in a store are recorded as an in-store sale. In-store sales are reduced by sales originally consummated from customer facing online websites and mobile applications and subsequently returned in-store.
Stores relocated or expanded are excluded from comparable sales if the change in square footage would cause meaningful disparity in sales over the prior period. In the case of a store to be closed, such store’s sales are not considered comparable once the store closing process has commenced. Linen Holdings is excluded from the comparable sales calculations and will continue to be excluded on an ongoing basis as it represents non-retail activity. Cost Plus World Market was excluded from the comparable sales calculations through the end of the fiscal first half of 2013, and is included beginning with the fiscal third quarter of 2013.
|
·
|
Gross profit for fiscal 2014 was $4.620 billion or 38.9% of net sales compared with $4.566 billion or 39.7% of net sales for fiscal 2013 and $4.389 billion or 40.2% of net sales for fiscal 2012.
|
|
·
|
Selling, general and administrative expenses (“SG&A”) for fiscal 2014 were $3.065 billion or 25.8% of net sales compared with $2.951 billion or 25.7% of net sales for fiscal 2013 and $2.751 billion or 25.2% of net sales for fiscal 2012.
|
|
·
|
Interest expense was $50.5 million, $1.1 million and $4.2 million in fiscal 2014, 2013 and 2012, respectively.
|
|
·
|
The effective tax rate was 36.3%, 36.6% and 36.5% for fiscal years 2014, 2013 and 2012, respectively. The tax rate included discrete tax items resulting in net benefits of approximately $20.0 million, $20.0 million and $26.7 million, respectively, for fiscal 2014, 2013 and 2012.
|
|
·
|
For the fiscal year ended February 28, 2015 (fifty-two weeks), net earnings per diluted share were $5.07 ($957.5 million), an increase of approximately 6%, as compared with net earnings per diluted share of $4.79 ($1.022 billion) for fiscal 2013 (fifty-two weeks), which was an increase of approximately 5% from net earnings per diluted share of $4.56 ($1.038 billion) for fiscal 2012 (fifty-three weeks). For the fiscal year ended February 28, 2015, the increase in net earnings per diluted share is the result of the impact of the Company’s repurchases of its common stock, partially offset by the decrease in net earnings as a result of the items described above. Included in net earnings for the fiscal year ended February 28, 2015 is a net benefit of approximately $0.04 per diluted share for certain non-recurring items, including a credit card fee litigation settlement. For the fiscal year ended March 1, 2014, the increase in net earnings per diluted share is the result of the items described above and the impact of the Company’s repurchases of its common stock, partially offset by a reduction of approximately $0.06 to $0.07 per diluted share as a result of the disruptive weather in the fiscal fourth quarter.
|
19
Capital expenditures for fiscal 2014, 2013 and 2012 were $330.6 million, $320.8 million and $315.9 million, respectively. Slightly more than half of the current year capital expenditures were for technology enhancements with the remaining balance being used primarily for new stores, existing store improvements and other projects important to the Company’s future. The Company remains committed to making the required investments in its infrastructure to help position the Company for continued growth and success. The Company continues to review and prioritize its capital needs while continuing to make investments, principally for information technology enhancements, including omnichannel capabilities, new stores, existing store improvements, and other projects whose impact is considered important to its future.
Several of the Company’s key initiatives include: continuing to add new functionality and assortment to its selling websites, mobile sites and applications; continuing the deployment of systems, equipment and increased bandwidth in the Company’s stores, which enables store associates to lower the Company’s shipping costs for home deliveries, improves inventory ordering, optimizes work force management and enables customer Wi-Fi and new multi-function devices for store associates; improving customer data integration and customer relations management capabilities; continuing to strengthen and deepen its information technology, analytics, marketing and e-commerce groups; furthering the development work necessary for a new and more robust point of sale system; and opening an additional distribution facility to support the growth of the online direct to customer channel and for health and beauty care offerings. These and other investments are expected to, among other things, provide a seamless and compelling customer experience across the Company’s in-store, online and mobile shopping environments.
During fiscal 2014, the Company opened a total of 22 new stores and closed five stores. The Company plans to continue to optimize its store operations and market coverage by expanding, downsizing, renovating, opening, closing and relocating stores. In fiscal 2015, the Company expects to open approximately 30 new stores company-wide and a new customer service contact center. Additionally, during fiscal 2015, the Company expects to continue to enhance its omnichannel capabilities, through, among other things, continuing its deployment of systems, equipment and increased bandwidth to the Company’s stores and continuing its investment in information technology and analytics.
On July 17, 2014, the Company issued $300 million aggregate principal amount of 3.749% senior unsecured notes due August 1, 2024 (the “2024 Notes”), $300 million aggregate principal amount of 4.915% senior unsecured notes due August 1, 2034 (the “2034 Notes”) and $900 million aggregate principal amount of 5.165% senior unsecured notes due August 1, 2044 (the “2044 Notes” and, together with the 2024 Notes and the 2034 Notes, the “Notes”). The aggregate net proceeds from the Notes were approximately $1.5 billion, which was used for share repurchases of the Company’s common stock and for general corporate purposes. Interest on the Notes is payable semi-annually on February 1 and August 1 of each year, beginning on February 1, 2015.
On July 17, 2014, the Company entered into an accelerated share repurchase agreement (“ASR”) with an investment bank to repurchase an aggregate $1.1 billion of the Company’s common stock. The ASR was completed in December 2014. The total number of shares repurchased under the ASR was 16.8 million shares at a weighted average share price of $65.41.
On August 6, 2014, the Company entered into a $250 million five year senior unsecured revolving credit facility agreement (“Revolver”) with various lenders. During the period from August 6, 2014 through February 28, 2015, the Company did not have any borrowings under the Revolver.
20
During fiscal 2014, 2013 and 2012, including the shares repurchased under the ASR, the Company repurchased 33.0 million, 18.3 million and 16.1 million shares, respectively, of its common stock at a total cost of approximately $2.251 billion, $1.284 billion and $1.001 billion, respectively. The Company’s share repurchase program could change, and would be influenced by several factors, including business and market conditions. In addition, the Company reviews its alternatives with respect to its capital structure on an ongoing basis.
RESULTS OF OPERATIONS
The following table sets forth for the periods indicated (i) selected statement of earnings data of the Company expressed as a percentage of net sales and (ii) the percentage change in dollar amounts from the prior year in selected statement of earnings data:
|
Fiscal Year Ended
|
||||||||||||||||||||
|
Percentage
of Net Sales
|
Percentage Change
from Prior Year
|
|||||||||||||||||||
|
February 28,
2015
|
March 1,
2014
|
March 2,
2013
|
February 28,
2015
|
March 1,
2014
|
||||||||||||||||
|
Net sales
|
100.0 | % | 100.0 | % | 100.0 | % | 3.3 | % | 5.4 | % | ||||||||||
|
Cost of sales
|
61.1 | 60.3 | 59.8 | 4.7 | 6.3 | |||||||||||||||
|
Gross profit
|
38.9 | 39.7 | 40.2 | 1.2 | 4.0 | |||||||||||||||
|
Selling, general and administrative
expenses
|
25.8 | 25.7 | 25.2 | 3.9 | 7.3 | |||||||||||||||
|
Operating profit
|
13.1 | 14.0 | 15.0 | (3.7 | ) | (1.4 | ) | |||||||||||||
|
Interest expense, net
|
0.4 | 0.0 | 0.0 | 4,326.1 | (72.6 | ) | ||||||||||||||
|
Earnings before provision for income
taxes
|
12.7 | 14.0 | 15.0 | (6.8 | ) | (1.3 | ) | |||||||||||||
|
Provision for income taxes
|
4.6 | 5.1 | 5.5 | (7.6 | ) | (0.9 | ) | |||||||||||||
|
Net earnings
|
8.1 | 8.9 | 9.5 | (6.3 | ) | (1.5 | ) | |||||||||||||
Net Sales
Net sales in fiscal 2014 (fifty-two weeks) increased $377.2 million to $11.881 billion, representing an increase of 3.3% over $11.504 billion of net sales in fiscal 2013 (fifty-two weeks), which increased $589.4 million or 5.4% over the $10.915 billion of net sales in fiscal 2012 (fifty-three weeks). For fiscal 2014, approximately 71% of the increase was attributable to an increase in comparable sales and the remainder was primarily attributable to an increase in the Company’s new store sales.
For fiscal 2013, approximately 62% of the increase in net sales was attributable to the inclusion of Cost Plus World Market prior to its inclusion in comparable sales and Linen Holdings prior to the anniversary of its acquisition, approximately 42% of the increase was attributable to an increase in comparable sales and 26% of the increase was primarily attributable to an increase in the Company’s new store sales and the post-acquisition period for Linen Holdings, partially offset by a decrease of approximately 30% as a result of the non-comparable additional week in fiscal 2012.
The increase in comparable sales for both fiscal 2014 and fiscal 2013 was approximately 2.4%. The increase in comparable sales for fiscal 2014 was due to increases in both the average transaction amount and the number of transactions. The increase in comparable sales for fiscal 2013 was due to an increase in the average transaction amount and a slight increase in the number of transactions. Comparable sales are calculated based on an equivalent number of weeks for each annual period.
21
The Company’s comparable sales metric considers sales consummated through all retail channels – in-store, online and through a mobile device. Customers today may take advantage of the Company’s omnichannel environment by using more than one channel when making a purchase. The Company believes an integrated experience must exist among these channels to provide a seamless customer experience. A few examples are: a customer may be assisted by an in-store associate to create a wedding or baby registry, while the guests may ultimately purchase a gift from the Company’s websites; or, a customer may research a particular item, and read other customer reviews on the Company’s websites before visiting a store to consummate the actual purchase; or a customer may reserve an item online for in-store pick up; or while in a store, a customer may make the purchase on a mobile device for in home delivery from either a distribution facility, a store or directly from a vendor. In addition, the Company accepts returns in-store without regard to the channel in which the purchase was consummated, therefore resulting in reducing store sales by sales originally consummated through customer facing online websites and mobile applications. As the Company’s retail operations are integrated and it cannot reasonably track the channel in which the ultimate sale is initiated, the Company can however provide directional information on where the sale was consummated.
For fiscal 2014, comparable sales consummated through customer facing online websites and mobile applications increased in excess of 50%, over the corresponding period in the prior year, while comparable sales consummated in-store were relatively flat to the corresponding period in the prior year.
Comparable sales represented $11.517 billion, $10.661 billion and $9.820 billion of net sales for fiscal 2014, 2013 and 2012, respectively.
Sales of domestics merchandise accounted for approximately 36%, 36% and 39% of net sales in fiscal 2014, 2013 and 2012, respectively, of which the Company estimates that bed linens accounted for approximately 12% of net sales in fiscal 2014, 2013 and 2012, respectively. The remaining net sales in fiscal 2014, 2013 and 2012 of 64%, 64% and 61%, respectively, represented sales of home furnishings. No other individual product category accounted for 10% or more of net sales during fiscal 2014, 2013 or 2012.
Gross Profit
Gross profit in fiscal 2014, 2013 and 2012 was $4.620 billion or 38.9% of net sales, $4.566 billion or 39.7% of net sales and $4.389 billion or 40.2% of net sales, respectively. The decrease in the gross profit margin as a percentage of net sales between fiscal 2014 and 2013 was primarily attributed to an increase in coupon expense resulting from an increase in redemptions, partially offset by a slight decrease in the average coupon amount, and an increase in net direct to customer shipping expense, which was impacted by a reduction in the bedbathandbeyond.com free shipping threshold. The one year anniversary of the bedbathandbeyond.com free shipping threshold occurred in February 2015. The decrease in the gross profit margin as a percentage of net sales between fiscal 2013 and 2012 was primarily attributed to an increase in coupons, due to increases in both redemptions and the average coupon amount, and a shift in the mix of merchandise sold to lower margin categories.
Selling, General and Administrative Expenses
SG&A was $3.065 billion or 25.8% of net sales in fiscal 2014, $2.951 billion or 25.7% of net sales in fiscal 2013 and $2.751 billion or 25.2% of net sales in fiscal 2012. The percentage of net sales increase in SG&A between fiscal 2014 and 2013 was primarily due to increased technology expenses and related depreciation and increased advertising expenses, partially offset by relative decreases in payroll and payroll related items (including salaries), occupancy expenses (including rent) and the year over year net benefits of certain non-recurring items, primarily relating to credit card fee litigation in the fiscal third quarter of 2014. The increase in technology expenses and related depreciation, as a percentage of net sales, represented approximately 30 basis points for fiscal 2014 as compared to the same period in the prior year. The increase in SG&A between fiscal 2013 and 2012 as a percentage of net sales was primarily due to higher technology expenses and depreciation and a relative increase in payroll and payroll-related items (including salaries, workers’ compensation and medical insurance). The inclusion of the financial results of the acquisitions for the periods prior to each of their one year anniversaries, which occurred in the first half of fiscal 2013, also contributed to the increase in SG&A as a percentage of net sales.
22
Operating Profit
Operating profit for fiscal 2014 was $1.554 billion or 13.1% of net sales, $1.615 billion or 14.0% of net sales in fiscal 2013 and $1.638 billion or 15.0% of net sales in fiscal 2012. The changes in operating profit as a percentage of net sales between fiscal 2014 and 2013 and between fiscal 2013 and 2012 were the result of the changes in gross profit margin and SG&A as a percentage of net sales as described above.
The Company believes operating margin compression is likely to continue in fiscal 2015 as a result of several items, including increases in, as a percentage of net sales, coupon expense, net direct to customer shipping expense, technology expenses related to the Company’s ongoing investments
, a planned unfavorable Canadian currency exchange rate and investments in compensation and benefits beyond those historically planned. In addition, the operating margin compression will be impacted by the non-recurring benefit relating to the credit card litigation settlement in fiscal 2014.
Interest Expense, net
Interest expense was $50.5 million, $1.1 million and $4.2 million in fiscal 2014, 2013 and 2012, respectively. The increase in interest expense for fiscal 2014 was primarily a result of the interest related to the Notes issued in July 2014.
Income Taxes
The effective tax rate was 36.3% for fiscal 2014, 36.6% for fiscal 2013 and 36.5% for fiscal 2012. For fiscal 2014, the tax rate included net benefits of approximately $20.0 million, primarily due to the recognition of favorable discrete federal and state tax items. For fiscal 2013 and fiscal 2012, the tax rate included a net benefit of approximately $20.0 million and $26.7 million, respectively, primarily due to the recognition of favorable discrete state tax items.
Potential volatility in the effective tax rate from year to year may occur as the Company is required each year to determine whether new information changes the assessment of both the probability that a tax position will effectively be sustained and the appropriateness of the amount of recognized benefit.
GROWTH
The Company is effecting its growth through the evolution of its omnichannel shopping environment, the optimization of its store operations and market coverage by expanding, downsizing, renovating, opening, closing and relocating stores; the growth of its complementary institutional business and the continuous review of strategic acquisitions.
In the 23-year period from the beginning of fiscal 1992 to the end of fiscal 2014, the chain has grown from 34 to 1,513 stores plus its various websites, other interactive platforms and distribution facilities. Total store square footage grew from approximately 0.9 million square feet at the beginning of fiscal 1992 to approximately 43.0 million square feet at the end of fiscal 2014. In addition, the Company has distribution facilities totaling 6.0 million square feet. During fiscal 2014, the Company opened a total of 22 new stores and closed five stores. In fiscal 2014, consolidated store space, net of openings and closings for all concepts, increased by 0.4 million square feet. Additionally, the Company is a partner in a joint venture which opened one store during fiscal 2014 and as of February 28, 2015, operated a total of five retail stores in Mexico under the name Bed Bath & Beyond.
The Company plans to continue to expand its operations and invest in its infrastructure to reach its long term objectives. In fiscal 2015, the Company expects to open approximately 30 new stores company-wide and open a new customer service contact center to support the anticipated growth across all channels and concepts and provide a seamless customer service experience. Additionally, in connection with leveraging its merchandise offerings and optimizing its operations, the Company continues to expand, across selected stores, the number of specialty departments such as health and beauty care, baby, specialty food, and beverage. Also, the Company is
committed to the continued growth of its merchandise categories and channels and is growing
the number of items it is able to have shipped directly to customers from a vendor. The continued growth of the Company is dependent, in part, upon the Company’s ability to execute these items successfully.
23
Additionally, during fiscal 2015, the Company plans to add new functionality and assortment to its selling websites, mobile sites and applications; continue the deployment of systems, equipment and increased bandwidth in its stores to develop a more dynamic shopping experience and improve the productivity and working environment of its associates through improvements in inventory ordering, optimizing work force management and lowering the Company’s shipping costs for home deliveries; continue to strengthen and deepen its information technology, analytics, marketing and e-commerce groups; improve customer data integration and customer relations management capabilities; further the development work necessary for a new and more robust point of sale system; and open an additional distribution facility to support the growth of the online direct to customer channel and health and beauty care offerings.
LIQUIDITY AND CAPITAL RESOURCES
The Company has been able to finance its operations, including its growth, through internally generated funds and supplemented by borrowings through the Notes. For fiscal 2015, the Company believes that it can continue to finance its operations, including its growth, share repurchases, planned capital expenditures and debt service obligations, through existing and internally generated funds. In addition, if necessary, the Company could borrow under the Revolver. Capital expenditures for fiscal 2015 are planned to be approximately $375 million to $400 million, with nearly half for information technology enhancements, including omnichannel capabilities, and the remainder for new stores, existing store improvements, and other projects. These planned capital expenditures are subject to the timing and composition of the projects. In addition, the Company reviews its alternatives with respect to its capital structure on an ongoing basis.
On July 17, 2014, the Company issued the Notes. The aggregate net proceeds from the Notes were approximately $1.5 billion, which was used for share repurchases of the Company’s common stock and for general corporate purposes. Interest on the Notes is payable semi-annually on February 1 and August 1 of each year, beginning on February 1, 2015.
On July 17, 2014, the Company entered into an accelerated share repurchase agreement (“ASR”) with an investment bank to repurchase an aggregate $1.1 billion of the Company’s common stock. The ASR was completed in December 2014. The total number of shares repurchased under the ASR was 16.8 million shares at a weighted average share price of $65.41.
On August 6, 2014, the Company entered into the Revolver with various lenders. During the period from August 6, 2014 through February 28, 2015, the Company did not have any borrowings under the Revolver.
Fiscal 2014 compared to Fiscal 2013
Net cash provided by operating activities in fiscal 2014 was $1.186 billion, compared with $1.394 billion in fiscal 2013. Year over year, the Company experienced an increase in cash used by the net components of working capital (primarily accounts payable and merchandise inventories, partially offset by other current assets
and accrued expenses and other current liabilities) and a decrease in net earnings, as adjusted for non-cash expenses (primarily deferred income taxes and depreciation).
Retail inventory at cost per square foot was $62.58 as of February 28, 2015, as compared to $59.68 as of March 1, 2014.
Net cash provided by investing activities in fiscal 2014 was $48.8 million, compared with net cash used in investing activities of $363.4 million in fiscal 2013. In fiscal 2014, net cash provided by investing activities was primarily due to $379.4 million of redemptions of investment securities, net of purchases, partially offset by $330.6 million of capital expenditures
.
In fiscal 2013, net cash used in investing activities was primarily due to $320.8 million of capital expenditures and $39.1 million of purchases of investment securities, net of redemptions.
24
Net cash used in financing activities for fiscal 2014 was $712.3 million, compared with $1.222 billion in fiscal 2013. The decrease in net cash used was primarily due to proceeds from the issuance of the Notes of $1.5 billion, partially offset by an increase in common stock repurchases of $966.6 million, which includes the shares repurchased under the ASR.
Fiscal 2013 compared to Fiscal 2012
Net cash provided by operating activities in fiscal 2013 was $1.394 billion, compared with $1.196 billion in fiscal 2012. Year over year, the Company experienced an increase in cash provided by the net components of working capital (primarily merchandise inventories, accounts payable and other current assets) and an increase in net earnings, as adjusted for non-cash expenses (primarily depreciation).
Retail inventory at cost per square foot was $59.68 as of March 1, 2014, as compared to $58.12 as of March 2, 2013.
Net cash used in investing activities in fiscal 2013 was $363.4 million, compared with $667.0 million in fiscal 2012. In fiscal 2013, net cash used in investing activities was primarily due to $320.8 million of capital expenditures and $39.1 million of purchases of investment securities, net of redemptions. In fiscal 2012, net cash used in investing activities was due to payments, net of cash acquired, of $643.1 million related to the Cost Plus World Market and Linen Holdings acquisitions, $315.9 million for capital expenditures and $40.0 million for the acquisition of trademarks, partially offset by redemptions of $332.0 million of investment securities, net of purchases.
Net cash used in financing activities for fiscal 2013 was $1.222 billion, compared with $965.4 million in fiscal 2012. The increase in net cash used was primarily due to an increase in common stock repurchases of $282.7 million, partially offset by a $25.5 million payment in the prior year for a credit facility assumed in connection with an acquisition.
Other Fiscal 2014 Information
At February 28, 2015, the Company maintained two uncommitted lines of credit of $100 million each, with expiration dates of September 1, 2015 and February 28, 2016, respectively. These uncommitted lines of credit are currently and are expected to be used for letters of credit in the ordinary course of business. During fiscal 2014, the Company did not have any direct borrowings under the uncommitted lines of credit. As of February 28, 2015, there was approximately $11.1 million of outstanding letters of credit. Although no assurances can be provided, the Company intends to renew both uncommitted lines of credit before the respective expiration dates. In addition, as of February 28, 2015, the Company maintained unsecured standby letters of credit of $71.7 million, primarily for certain insurance programs.
The Company has authorization to make repurchases from time to time in the open market or through other parameters approved by the Board of Directors pursuant to existing rules and regulations.
Between December 2004 and July 2014, the Company’s Board of Directors authorized, through several share repurchase programs, the repurchase of $9.450 billion of the Company’s common stock.
Since 2004 through the end of fiscal 2014, the Company has repurchased approximately $8.6 billion of its common stock through share repurchase programs, which include the shares repurchased under the ASR. The Company has approximately $884 million remaining of authorized share repurchases as of February 28, 2015. The Company’s share repurchase program could change, and would be influenced by several factors, including business and market conditions.
25
The Company has contractual obligations consisting mainly of principal and interest related to the Notes, operating leases for stores, offices, distribution facilities and equipment, purchase obligations, long-term sale/leaseback and capital lease obligations and other long-term liabilities which the Company is obligated to pay as of February 28, 2015 as follows:
|
(in thousands)
|
Total
|
Less than 1 year
|
1-3 years
|
4-5 years
|
After 5
years
|
|||||||||||||||
|
Senior unsecured notes
(1)
|
$ | 1,500,000 | $ | - | $ | - | $ | - | $ | 1,500,000 | ||||||||||
|
Interest on senior unsecured notes
(1)
|
1,765,682 | 72,477 | 144,954 | 144,954 | 1,403,297 | |||||||||||||||
|
Operating lease obligations
(2)
|
3,260,167 | 573,802 | 996,624 | 733,564 | 956,177 | |||||||||||||||
|
Purchase obligations
(3)
|
1,209,051 | 1,209,051 | - | - | - | |||||||||||||||
|
Long-term sale/leaseback and capital lease obligations
(4)
|
332,559 | 9,863 | 19,921 | 20,164 | 282,611 | |||||||||||||||
|
Other long-term liabilities
(5)
|
466,174 | - | - | - | - | |||||||||||||||
|
Total Contractual Obligations
|
$ | 8,533,633 | $ | 1,865,193 | $ | 1,161,499 | $ | 898,682 | $ | 4,142,085 | ||||||||||
|
(1) On July 17, 2014, the Company issued $300 million aggregate principal amount of 3.749% senior unsecured notes
due August 1, 2024, $300 million aggregate principal amount of 4.915% senior unsecured notes due August 1, 2034 and
$900 million aggregate principal amount of 5.165% senior unsecured notes due August 1, 2044.
|
|
(2) The amounts presented represent the future minimum lease payments under non-cancelable operating leases. In
addition to minimum rent, certain of the Company's leases require the payment of additional costs for insurance,
maintenance and other costs. These additional amounts are not included in the table of contractual commitments as the
timing and/or amounts of such payments are not known. As of February 28, 2015, the Company has leased sites for 43
new or relocated locations planned for opening in fiscal 2015 or 2016, for which aggregate minimum rental payments over
the term of the leases are approximately $199.5 million and are included in the table above.
|
|
(3) Purchase obligations primarily consist of purchase orders for merchandise.
|
|
(4) Long-term sale/leaseback and capital lease obligations represent future minimum lease payments under the
sale/leaseback agreements and capital lease agreements.
|
|
(5) Other long-term liabilities are primarily comprised of income taxes payable, deferred rent, workers' compensation and
general liability reserves and various other accruals and are recorded as Deferred Rent and Other Liabilities and Income
Taxes Payable in the Consolidated Balance Sheet as of February 28, 2015. The amounts associated with these other
long-term liabilities have been reflected only in the Total Column in the table above as the timing and / or amount of any
cash payment is uncertain.
|
SEASONALITY
The Company’s sales exhibit seasonality with sales levels generally higher in the calendar months of August, November and December, and generally lower in February.
INFLATION
The Company does not believe that its operating results have been materially affected by inflation during the past year. There can be no assurance, however, that the Company’s operating results will not be affected by inflation in the future.
26
CRITICAL ACCOUNTING POLICIES
The preparation of consolidated financial statements in conformity with U.S. generally accepted accounting principles requires the Company to establish accounting policies and to make estimates and judgments that affect the reported amounts of assets and liabilities and disclosure of contingent assets and liabilities as of the date of the consolidated financial statements and the reported amounts of revenues and expenses during the reporting period. The Company bases its estimates on historical experience and on other assumptions that it believes to be relevant under the circumstances, the results of which form the basis for making judgments about the carrying value of assets and liabilities that are not readily apparent from other sources. In particular, judgment is used in areas such as inventory valuation, impairment of long-lived assets, goodwill and other indefinite lived intangible assets, accruals for self insurance, litigation, store opening, expansion, relocation and closing costs, stock-based compensation and income and certain other taxes. Actual results could differ from these estimates.
Inventory Valuation
: Merchandise inventories are stated at the lower of cost or market. Inventory costs are primarily calculated using the weighted average retail inventory method.
Under the retail inventory method, the valuation of inventories at cost and the resulting gross margins are calculated by applying a cost-to-retail ratio to the retail values of inventories. The cost associated with determining the cost-to-retail ratio includes: merchandise purchases, net of returns to vendors, discounts and volume and incentive rebates; inbound freight expenses; duty, insurance and commissions.
At any one time, inventories include items that have been written down to the Company’s best estimate of their realizable value. Judgment is required in estimating realizable value and factors considered are the age of merchandise and anticipated demand. Actual realizable value could differ materially from this estimate based upon future customer demand or economic conditions.
The Company estimates its reserve for shrinkage throughout the year based on historical shrinkage and any current trends, if applicable. Actual shrinkage is recorded at year end based upon the results of the Company’s physical inventory counts for locations at which counts were conducted. For locations where physical inventory counts were not conducted in the fiscal year, an estimated shrink reserve is recorded based on historical shrinkage and any current trends, if applicable. Historically, the Company’s shrinkage has not been volatile.
The Company accrues for merchandise in transit once it takes legal ownership and title to the merchandise; as such, an estimate for merchandise in transit is included in the Company’s merchandise inventories.
Impairment of Long-Lived Assets
: The Company reviews long-lived assets for impairment when events or changes in circumstances indicate the carrying value of these assets may exceed their current fair values. Recoverability of assets to be held and used is measured by a comparison of the carrying amount of an asset to the estimated undiscounted future cash flows expected to be generated by the asset. If the carrying amount of an asset exceeds its estimated future cash flows, an impairment charge is recognized for the amount by which the carrying amount of the asset exceeds the fair value of the assets. Assets to be disposed of would be separately presented in the balance sheet and reported at the lower of the carrying amount or fair value less costs to sell, and are no longer depreciated. The assets and liabilities of a disposal group classified as held for sale would be presented separately in the appropriate asset and liability sections of the balance sheet. The Company has not historically recorded any material impairment to its long-lived assets. In the future, if events or market conditions affect the estimated fair value to the extent that a long-lived asset is impaired, the Company will adjust the carrying value of these long-lived assets in the period in which the impairment occurs.
Goodwill and Other Indefinite Lived Intangible Assets
: The Company reviews goodwill and other intangibles that have indefinite lives for impairment annually or when events or changes in circumstances indicate the carrying value of these assets might exceed their current fair values. Impairment testing is based upon the best information available including estimates of fair value which incorporate assumptions marketplace participants would use in making their estimates of fair value. The Company has not historically recorded an impairment to its goodwill and other indefinite lived intangible assets. As of February 28, 2015, for goodwill related to the North American Retail operating segment and the Institutional Sales operating segment and certain other indefinite lived intangible assets, the Company assessed qualitative factors in order to determine whether any events and circumstances existed which indicated that it was more likely than not that the fair value of these indefinite lived intangible assets did not exceed its carrying value and concluded no such events or circumstances existed which would require an impairment test being performed. In the future, if events or market conditions affect the estimated fair value to the extent that an asset is impaired, the Company will adjust the carrying value of these assets in the period in which the impairment occurs
.
27
Self Insurance
: The Company utilizes a combination of insurance and self insurance for a number of risks including workers’ compensation, general liability, automobile liability and employee related health care benefits (a portion of which is paid by its employees). Liabilities associated with the risks that the Company retains are estimated by considering historical claims experience, demographic factors, severity factors and other actuarial assumptions. Although the Company’s claims experience has not displayed substantial volatility in the past, actual experience could materially vary from its historical experience in the future. Factors that affect these estimates include but are not limited to: inflation, the number and severity of claims and regulatory changes. In the future, if the Company concludes an adjustment to self insurance accruals is required, the liability will be adjusted accordingly.
Litigation
: The Company records an estimated liability related to its various claims and legal actions arising in the ordinary course of business when and to the extent that it concludes a liability is probable and the amount of the loss can be reasonably estimated. Such estimated loss is based on available information and advice from outside counsel, where appropriate. As additional information becomes available, the Company reassesses the potential liability related to claims and legal actions and revises its estimated liabilities, as appropriate. The Company expects the ultimate disposition of these matters will not have a material adverse effect on the Company’s consolidated financial position, results of operations or liquidity. The Company also cannot predict the nature and validity of claims which could be asserted in the future, and future claims could have a material impact on its earnings.
Store Opening, Expansion, Relocation and Closing Costs
: Store opening, expansion, relocation and closing costs, including markdowns, asset residual values and projected occupancy costs, are charged to earnings as incurred.
Stock-Based Compensation:
The Company uses a Black-Scholes option-pricing model to determine the fair value of its stock options. The Black-Scholes model includes various assumptions, including the expected life of stock options, the expected risk free interest rate and the expected volatility. These assumptions reflect the Company’s best estimates, but they involve inherent uncertainties based on market conditions generally outside the control of the Company. As a result, if other assumptions had been used, total stock-based compensation cost could have been materially impacted. Furthermore, if the Company uses different assumptions for future grants, stock-based compensation cost could be materially impacted in future periods.
The Company determines its assumptions for the Black-Scholes option-pricing model in accordance with the accounting guidance related to stock compensation.
|
·
|
The expected life of stock options is estimated based on historical experience.
|
|
·
|
The expected risk free interest rate is based on the U.S. Treasury constant maturity interest rate whose term is consistent with the expected life of the stock options.
|
|
·
|
Expected volatility is based on the average of historical and implied volatility. The historical volatility is determined by observing actual prices of the Company’s stock over a period commensurate with the expected life of the awards. The implied volatility represents the implied volatility of the Company’s call options, which are actively traded on multiple exchanges, had remaining maturities in excess of twelve months, had market prices close to the exercise prices of the employee stock options and were measured on the stock option grant date.
|
28
The Company is required to record stock-based compensation expense net of estimated forfeitures. The Company’s forfeiture rate assumption used in determining its stock-based compensation expense is estimated based on historical data. The actual forfeiture rate could differ from these estimates.
Taxes
: The Company accounts for its income taxes using the asset and liability method. Deferred tax assets and liabilities are recognized for the future tax consequences attributable to the differences between the financial statement carrying amounts of existing assets and liabilities and their respective tax bases and operating loss and tax credit carry-forwards. Deferred tax assets and liabilities are measured using enacted tax rates expected to apply to taxable income in the year in which those temporary differences are expected to be recovered or settled. The effect on deferred tax assets and liabilities of a change in tax rates is recognized in earnings in the period that includes the enactment date.
The Company intends to reinvest the unremitted earnings of its Canadian subsidiary. Accordingly, no provision has been made for U.S. or additional non-U.S. taxes with respect to these earnings. In the event of repatriation to the U.S., in most cases such earnings would be subject to U.S. income taxes.
The Company recognizes the tax benefit from an uncertain tax position only if it is at least more likely than not that the tax position will be sustained on examination by the taxing authorities based on the technical merits of the position. The tax benefits recognized in the financial statements from such a position are measured based on the largest benefit that has a greater than fifty percent likelihood of being realized upon settlement with the taxing authorities.
Potential volatility in the effective tax rate from year to year may occur as the Company is required each year to determine whether new information changes the assessment of both the probability that a tax position will effectively be sustained and the appropriateness of the amount of recognized benefit.
The Company also accrues for certain other taxes as required by their operations.
Judgment is required in determining the provision for income and other taxes and related accruals, deferred tax assets and liabilities. In the ordinary course of business, there are transactions and calculations where the ultimate tax outcome is uncertain. Additionally, the Company’s various tax returns are subject to audit by various tax authorities. Although the Company believes that its estimates are reasonable, actual results could differ from these estimates.
FORWARD-LOOKING STATEMENTS
This Form 10-K and Management’s Discussion and Analysis of Financial Condition and Results of Operations contain forward-looking statements within the meaning of Section 21E of the Securities Exchange Act of 1934, as amended. The Company’s actual results and future financial condition may differ materially from those expressed in any such forward-looking statements as a result of many factors. Such factors include, without limitation: general economic conditions including the housing market, a challenging overall macroeconomic environment and related changes in the retailing environment; consumer preferences, spending habits and adoption of new technologies; demographics and other macroeconomic factors that may impact the level of spending for the types of merchandise sold by the Company; civil disturbances and terrorist acts; unusual weather patterns and natural disasters; competition from existing and potential competitors; competition from other channels of distribution; pricing pressures; liquidity; the ability to attract and retain qualified employees in all areas of the organization; the cost of labor, merchandise and other costs and expenses; the ability to find suitable locations at acceptable occupancy costs and other terms to support the Company’s growth; the ability to assess and implement technologies in support of the Company’s development of its omnichannel capabilities; uncertainty in financial markets; disruptions to the Company’s information technology systems including but not limited to security breaches of systems protecting consumer and employee information; reputational risk arising from challenges to the Company’s or a third party supplier’s compliance with various laws, regulations or standards, including those related to labor, health, safety, privacy or the environment; changes to statutory, regulatory and legal requirements; new, or developments in existing, litigation, claims or assessments; changes to, or new, tax laws or interpretation of existing tax laws; changes to, or new, accounting standards including, without limitation, changes to lease accounting standards; foreign currency exchange rate fluctuations; and the integration of acquired businesses. The Company does not undertake any obligation to update its forward-looking statements.
29
As of February 28, 2015, the Company’s investments include cash and cash equivalents of approximately $875.6 million, short term investment securities of approximately $110.0 million and long term investment securities of approximately $97.2 million at weighted average interest rates of 0.01%, 0.03% and 0.11%, respectively.
30
The following are included herein:
|
1)
|
Consolidated Balance Sheets as of February 28, 2015 and March 1, 2014
|
|
2)
|
Consolidated Statements of Earnings for the fiscal years ended February 28, 2015, March 1, 2014 and March 2, 2013
|
|
3)
|
Consolidated Statements of Comprehensive Income for the fiscal years ended February 28, 2015, March 1, 2014 and March 2, 2013
|
|
4)
|
Consolidated Statements of Shareholders’ Equity for the fiscal years ended February 28, 2015, March 1, 2014 and March 2, 2013
|
|
5)
|
Consolidated Statements of Cash Flows for the fiscal years ended February 28, 2015, March 1, 2014 and March 2, 2013
|
|
6)
|
Notes to Consolidated Financial Statements
|
|
7)
|
Reports of Independent Registered Public Accounting Firm
|
31
BED BATH & BEYOND INC. AND SUBSIDIARIES
(in thousands, except per share data)
|
February 28,
2015
|
March 1,
2014
|
|||||||
|
Assets
|
||||||||
|
Current assets:
|
||||||||
|
Cash and cash equivalents
|
$ | 875,574 | $ | 366,516 | ||||
|
Short term investment securities
|
109,992 | 489,331 | ||||||
|
Merchandise inventories
|
2,731,881 | 2,578,956 | ||||||
|
Other current assets
|
366,156 | 354,184 | ||||||
|
Total current assets
|
4,083,603 | 3,788,987 | ||||||
|
Long term investment securities
|
97,160 | 87,393 | ||||||
|
Property and equipment, net
|
1,676,700 | 1,579,804 | ||||||
|
Goodwill
|
486,279 | 486,279 | ||||||
|
Other assets
|
415,251 | 413,570 | ||||||
|
Total assets
|
$ | 6,758,993 | $ | 6,356,033 | ||||
|
Liabilities and Shareholders' Equity
|
||||||||
|
Current liabilities:
|
||||||||
|
Accounts payable
|
$ | 1,156,368 | $ | 1,104,668 | ||||
|
Accrued expenses and other current liabilities
|
403,547 | 385,954 | ||||||
|
Merchandise credit and gift card liabilities
|
306,160 | 284,216 | ||||||
|
Current income taxes payable
|
76,606 | 60,298 | ||||||
|
Total current liabilities
|
1,942,681 | 1,835,136 | ||||||
|
Deferred rent and other liabilities
|
493,137 | 486,996 | ||||||
|
Income taxes payable
|
79,985 | 92,614 | ||||||
|
Long term debt
|
1,500,000 | - | ||||||
|
Total liabilities
|
4,015,803 | 2,414,746 | ||||||
|
Commitments and contingencies
|
||||||||
|
Shareholders' equity:
|
||||||||
|
Preferred stock - $0.01 par value; authorized - 1,000
shares; no shares issued or outstanding
|
- | - | ||||||
|
Common stock - $0.01 par value; authorized -
900,000 shares; issued 336,667 and 334,941 shares, respectively;
outstanding 174,178 and 205,405 shares, respectively
|
3,367 | 3,350 | ||||||
|
Additional paid-in capital
|
1,796,692 | 1,673,217 | ||||||
|
Retained earnings
|
9,553,376 | 8,595,902 | ||||||
|
Treasury stock, at cost
|
(8,567,932 | ) | (6,317,335 | ) | ||||
|
Accumulated other comprehensive loss
|
(42,313 | ) | (13,847 | ) | ||||
|
Total shareholders' equity
|
2,743,190 | 3,941,287 | ||||||
|
Total liabilities and shareholders' equity
|
$ | 6,758,993 | $ | 6,356,033 | ||||
See accompanying Notes to Consolidated Financial Statements.
32
Bed Bath & Beyond Inc. and Subsidiaries
|
FISCAL YEAR ENDED
|
||||||||||||
|
(in thousands, except per share data)
|
February 28,
2015
|
March 1,
2014
|
March 2,
2013
|
|||||||||
|
Net sales
|
$ | 11,881,176 | $ | 11,503,963 | $ | 10,914,585 | ||||||
|
Cost of sales
|
7,261,397 | 6,938,381 | 6,525,830 | |||||||||
|
Gross profit
|
4,619,779 | 4,565,582 | 4,388,755 | |||||||||
|
Selling, general and administrative expenses
|
3,065,486 | 2,950,995 | 2,750,537 | |||||||||
|
Operating profit
|
1,554,293 | 1,614,587 | 1,638,218 | |||||||||
|
Interest expense, net
|
50,458 | 1,140 | 4,159 | |||||||||
|
Earnings before provision for income taxes
|
1,503,835 | 1,613,447 | 1,634,059 | |||||||||
|
Provision for income taxes
|
546,361 | 591,157 | 596,271 | |||||||||
|
Net earnings
|
$ | 957,474 | $ | 1,022,290 | $ | 1,037,788 | ||||||
|
Net earnings per share - Basic
|
$ | 5.13 | $ | 4.85 | $ | 4.62 | ||||||
|
Net earnings per share - Diluted
|
$ | 5.07 | $ | 4.79 | $ | 4.56 | ||||||
|
Weighted average shares outstanding - Basic
|
186,659 | 210,710 | 224,623 | |||||||||
|
Weighted average shares outstanding - Diluted
|
188,880 | 213,363 | 227,723 | |||||||||
See accompanying Notes to Consolidated Financial Statements.
33
Consolidated Statements of Comprehensive Income
Bed Bath & Beyond Inc. and Subsidiaries
|
FISCAL YEAR ENDED
|
||||||||||||
|
(in thousands)
|
February 28,
2015
|
March 1,
2014
|
March 2,
2013
|
|||||||||
|
Net earnings
|
$ | 957,474 | $ | 1,022,290 | $ | 1,037,788 | ||||||
|
Other comprehensive (loss) income:
|
||||||||||||
|
Change in temporary valuation adjustment of
auction rate securities, net of taxes
|
143 | (792 | ) | 1,017 | ||||||||
|
Pension adjustment, net of taxes
|
(5,552 | ) | 3,249 | 146 | ||||||||
|
Currency translation adjustment
|
(23,057 | ) | (11,984 | ) | (3,604 | ) | ||||||
|
Other comprehensive loss
|
(28,466 | ) | (9,527 | ) | (2,441 | ) | ||||||
|
Comprehensive income
|
$ | 929,008 | $ | 1,012,763 | $ | 1,035,347 | ||||||
See accompanying Notes to Consolidated Financial Statements.
34
Consolidated Statements of Shareholders' Equity
Bed Bath & Beyond Inc. and Subsidiaries
|
Common Stock
|
Additional Paid-
|
Retained
|
Treasury Stock
|
Accumulated Other
Comprehensive
|
||||||||||||||||||||||||||||
|
(in thousands)
|
Shares
|
Amount
|
in Capital
|
Earnings
|
Shares
|
Amount
|
Loss
|
Total
|
||||||||||||||||||||||||
|
Balance at February 25, 2012
|
330,576 | $ | 3,306 | $ | 1,417,337 | $ | 6,535,824 | (95,061 | ) | $ | (4,032,060 | ) | $ | (1,879 | ) | $ | 3,922,528 | |||||||||||||||
|
Net earnings
|
1,037,788 | 1,037,788 | ||||||||||||||||||||||||||||||
|
Other comprehensive loss
|
(2,441 | ) | (2,441 | ) | ||||||||||||||||||||||||||||
|
Shares sold under employee stock option plans, net of taxes
|
1,489 | 15 | 74,323 | 74,338 | ||||||||||||||||||||||||||||
|
Issuance of restricted shares, net
|
626 | 6 | (6 | ) | - | |||||||||||||||||||||||||||
|
Stock-based compensation expense, net
|
48,520 | 48,520 | ||||||||||||||||||||||||||||||
|
Director fees paid in stock
|
5 | 277 | 277 | |||||||||||||||||||||||||||||
|
Repurchase of common stock, including fees
|
(16,146 | ) | (1,001,280 | ) | (1,001,280 | ) | ||||||||||||||||||||||||||
|
Balance at March 2, 2013
|
332,696 | 3,327 | 1,540,451 | 7,573,612 | (111,207 | ) | (5,033,340 | ) | (4,320 | ) | 4,079,730 | |||||||||||||||||||||
|
Net earnings
|
1,022,290 | 1,022,290 | ||||||||||||||||||||||||||||||
|
Other comprehensive loss
|
(9,527 | ) | (9,527 | ) | ||||||||||||||||||||||||||||
|
Shares sold under employee stock option plans, net of taxes
|
1,375 | 14 | 74,766 | 74,780 | ||||||||||||||||||||||||||||
|
Issuance of restricted shares, net
|
868 | 9 | (9 | ) | - | |||||||||||||||||||||||||||
|
Stock-based compensation expense, net
|
57,842 | 57,842 | ||||||||||||||||||||||||||||||
|
Director fees paid in stock
|
2 | 167 | 167 | |||||||||||||||||||||||||||||
|
Repurchase of common stock, including fees
|
(18,329 | ) | (1,283,995 | ) | (1,283,995 | ) | ||||||||||||||||||||||||||
|
Balance at March 1, 2014
|
334,941 | 3,350 | 1,673,217 | 8,595,902 | (129,536 | ) | (6,317,335 | ) | (13,847 | ) | 3,941,287 | |||||||||||||||||||||
|
Net earnings
|
957,474 | 957,474 | ||||||||||||||||||||||||||||||
|
Other comprehensive loss
|
(28,466 | ) | (28,466 | ) | ||||||||||||||||||||||||||||
|
Shares sold under employee stock option plans, net of taxes
|
1,033 | 10 | 54,907 | 54,917 | ||||||||||||||||||||||||||||
|
Issuance of restricted shares, net
|
691 | 7 | (7 | ) | - | |||||||||||||||||||||||||||
|
Stock-based compensation expense, net
|
68,408 | 68,408 | ||||||||||||||||||||||||||||||
|
Director fees paid in stock
|
2 | 167 | 167 | |||||||||||||||||||||||||||||
|
Repurchase of common stock, including fees
|
(32,953 | ) | (2,250,597 | ) | (2,250,597 | ) | ||||||||||||||||||||||||||
|
Balance at February 28, 2015
|
336,667 | $ | 3,367 | $ | 1,796,692 | $ | 9,553,376 | (162,489 | ) | $ | (8,567,932 | ) | $ | (42,313 | ) | $ | 2,743,190 | |||||||||||||||
See accompanying Notes to Consolidated Financial Statements.
35
Bed Bath & Beyond Inc. and Subsidiaries
|
FISCAL YEAR ENDED
|
||||||||||||
|
(in thousands)
|
February 28,
2015
|
March 1,
2014
|
March 2,
2013
|
|||||||||
|
Cash Flows from Operating Activities:
|
||||||||||||
|
Net earnings
|
$ | 957,474 | $ | 1,022,290 | $ | 1,037,788 | ||||||
|
Adjustments to reconcile net earnings to net cash
provided by operating activities:
|
||||||||||||
|
Depreciation and amortization
|
239,193 | 220,116 | 195,117 | |||||||||
|
Stock-based compensation
|
66,539 | 56,244 | 47,163 | |||||||||
|
Tax benefit from stock-based compensation
|
6,686 | 12,846 | 13,217 | |||||||||
|
Deferred income taxes
|
(22,295 | ) | 11,729 | 17,567 | ||||||||
|
Other
|
(2,244 | ) | (1,784 | ) | 702 | |||||||
|
(Increase) decrease in assets, net of effect of acquisitions:
|
||||||||||||
|
Merchandise inventories
|
(161,506 | ) | (117,926 | ) | (200,197 | ) | ||||||
|
Trading investment securities
|
(9,530 | ) | (11,382 | ) | (6,206 | ) | ||||||
|
Other current assets
|
19,012 | (5,287 | ) | (43,703 | ) | |||||||
|
Other assets
|
(254 | ) | (3,812 | ) | (9,690 | ) | ||||||
|
Increase (decrease) in liabilities, net of effect of acquisitions:
|
||||||||||||
|
Accounts payable
|
44,563 | 179,522 | 105,434 | |||||||||
|
Accrued expenses and other current liabilities
|
18,494 | (1,336 | ) | (22,167 | ) | |||||||
|
Merchandise credit and gift card liabilities
|
22,520 | 33,014 | 36,972 | |||||||||
|
Income taxes payable
|
3,768 | (4,406 | ) | 6,588 | ||||||||
|
Deferred rent and other liabilities
|
3,428 | 3,735 | 17,640 | |||||||||
|
Net cash provided by operating activities
|
1,185,848 | 1,393,563 | 1,196,225 | |||||||||
|
Cash Flows from Investing Activities:
|
||||||||||||
|
Purchase of held-to-maturity investment securities
|
(298,094 | ) | (1,156,634 | ) | (730,976 | ) | ||||||
|
Redemption of held-to-maturity investment securities
|
677,500 | 1,117,500 | 1,031,249 | |||||||||
|
Redemption of available-for-sale investment securities
|
- | - | 31,715 | |||||||||
|
Capital expenditures
|
(330,637 | ) | (320,812 | ) | (315,937 | ) | ||||||
|
Investment in unconsolidated joint venture
|
- | (3,436 | ) | - | ||||||||
|
Payment for acquisitions, net of cash acquired
|
- | - | (643,098 | ) | ||||||||
|
Payment for acquisition of trademarks
|
- | - | (40,000 | ) | ||||||||
|
Net cash provided by (used in) investing activities
|
48,769 | (363,382 | ) | (667,047 | ) | |||||||
|
Cash Flows from Financing Activities:
|
||||||||||||
|
Proceeds from exercise of stock options
|
41,197 | 54,815 | 56,377 | |||||||||
|
Proceeds from issuance of senior unsecured notes
|
1,500,000 | - | - | |||||||||
|
Payment of deferred financing costs
|
(10,092 | ) | - | - | ||||||||
|
Excess tax benefit from stock-based compensation
|
7,202 | 7,289 | 5,021 | |||||||||
|
Payment for credit facility assumed in acquisition
|
- | - | (25,511 | ) | ||||||||
|
Repurchase of common stock, including fees
|
(2,250,597 | ) | (1,283,995 | ) | (1,001,280 | ) | ||||||
|
Net cash used in financing activities
|
(712,290 | ) | (1,221,891 | ) | (965,393 | ) | ||||||
|
Effect of exchange rate changes on cash and cash equivalents
|
(13,269 | ) | (6,745 | ) | (1,980 | ) | ||||||
|
Net increase (decrease) in cash and cash equivalents
|
509,058 | (198,455 | ) | (438,195 | ) | |||||||
|
Cash and cash equivalents:
|
||||||||||||
|
Beginning of period
|
366,516 | 564,971 | 1,003,166 | |||||||||
|
End of period
|
$ | 875,574 | $ | 366,516 | $ | 564,971 | ||||||
See accompanying Notes to Consolidated Financial Statements.
36
Notes to Consolidated Financial Statements
Bed Bath & Beyond Inc. and Subsidiaries
1.
SUMMARY OF SIGNIFICANT ACCOUNTING POLICIES AND RELATED MATTERS
|
A.
|
Nature of Operations
|
|
Bed Bath & Beyond Inc. and subsidiaries (the “Company”) is a retailer which operates under the names Bed Bath & Beyond (“BBB”), Christmas Tree Shops, Christmas Tree Shops andThat! or andThat! (collectively, “CTS”), Harmon or Harmon Face Values (collectively, “Harmon”), buybuy BABY and World Market, Cost Plus World Market or Cost Plus (collectively, “Cost Plus World Market”). Customers can purchase products from the Company either in-store, online or through a mobile device. The Company has the developing ability to have customer purchases picked up in-store or shipped direct to the customer from the Company’s distribution facilities, stores or vendors. The Company also operates Linen Holdings, a provider of a variety of textile products, amenities and other goods to institutional customers in the hospitality, cruise line, healthcare and other industries. Additionally, the Company is a partner in a joint venture which operates five retail stores in Mexico under the name Bed Bath & Beyond. The Company sells a wide assortment of domestics merchandise and home furnishings. Domestics merchandise includes categories such as bed linens and related items, bath items and kitchen textiles. Home furnishings include categories such as kitchen and tabletop items, fine tabletop, basic housewares, general home furnishings, consumables and certain juvenile products. As the Company operates in the retail industry, its results of operations are affected by general economic conditions and consumer spending habits.
|
The Company accounts for its operations as two operating segments: North American Retail and Institutional Sales. The Institutional Sales operating segment, which is comprised of Linen Holdings, does not meet the quantitative thresholds under U.S. generally accepted accounting principles and therefore is not a reportable segment.
|
B.
|
Fiscal Year
|
The Company’s fiscal year is comprised of the 52 or 53 week period ending on the Saturday nearest February 28. Accordingly, fiscal 2014 and fiscal 2013 represented 52 weeks and ended on February 28, 2015 and March 1, 2014, respectively. Fiscal 2012 represented 53 weeks and ended on March 2, 2013.
|
C.
|
Principles of Consolidation
|
The accompanying consolidated financial statements include the accounts of the Company and its wholly owned subsidiaries. The Company accounts for its investment in the joint venture under the equity method.
Certain reclassifications have been made to the fiscal 2013 consolidated balance sheet and the fiscal 2013 and 2012 consolidated statements of cash flows to conform to the fiscal 2014 consolidated balance sheet and consolidated statement of cash flows presentation.
All significant intercompany balances and transactions have been eliminated in consolidation.
|
D.
|
Use of Estimates
|
The preparation of consolidated financial statements in conformity with U.S. generally accepted accounting principles requires the Company to establish accounting policies and to make estimates and judgments that affect the reported amounts of assets and liabilities and disclosure of contingent assets and liabilities as of the date of the consolidated financial statements and the reported amounts of revenues and expenses during the reporting period. The Company bases its estimates on historical experience and on other assumptions that it believes to be relevant under the circumstances, the results of which form the basis for making judgments about the carrying value of assets and liabilities that are not readily apparent from other sources. In particular, judgment is used in areas such as inventory valuation, impairment of long-lived assets, impairment of auction rate securities, goodwill and other indefinite lived intangible assets, accruals for self insurance, litigation, store opening, expansion, relocation and closing costs, the provision for sales returns, vendor allowances, stock-based compensation and income and certain other taxes. Actual results could differ from these estimates.
37
|
E.
|
Cash and Cash Equivalents
|
The Company considers all highly liquid instruments purchased with original maturities of three months or less to be cash equivalents. Included in cash and cash equivalents are credit and debit card receivables from banks, which typically settle within 5 business days, of $90.3 million and $87.4 million as of February 28, 2015 and March 1, 2014, respectively.
|
F.
|
Investment Securities
|
Investment securities consist primarily of U.S. Treasury Bills with remaining maturities of less than one year and auction rate securities, which are securities with interest rates that reset periodically through an auction process. The U.S. Treasury Bills are classified as short term held-to-maturity securities and are stated at their amortized cost which approximates fair value. Auction rate securities are classified as available-for-sale and are stated at fair value, which had historically been consistent with cost or par value due to interest rates which reset periodically, typically every 7, 28 or 35 days. As a result, there generally were no cumulative gross unrealized holding gains or losses relating to these auction rate securities. However, beginning in mid-February 2008 due to market conditions, the auction process for the Company’s auction rate securities failed and continues to fail. These failed auctions result in a lack of liquidity in the securities, and affect their estimated fair values at February 28, 2015 and March 1, 2014, but do not affect the underlying collateral of the securities. (See “Fair Value Measurements,” Note 3 and “Investment Securities,” Note 4). All income from these investments is recorded as interest income.
Those investment securities which the Company has the ability and intent to hold until maturity are classified as held-to-maturity investments and are stated at amortized cost. Those investment securities which are bought and held principally for the purpose of selling them in the near term are classified as trading securities and are stated at fair market value.
Premiums are amortized and discounts are accreted over the life of the security as adjustments to interest income using the effective interest method. Dividend and interest income are recognized when earned.
|
G.
|
Inventory Valuation
|
Merchandise inventories are stated at the lower of cost or market. Inventory costs are primarily calculated using the weighted average retail inventory method.
Under the retail inventory method, the valuation of inventories at cost and the resulting gross margins are calculated by applying a cost-to-retail ratio to the retail values of inventories. The cost associated with determining the cost-to-retail ratio includes: merchandise purchases, net of returns to vendors, discounts and volume and incentive rebates; inbound freight expenses; duty, insurance and commissions.
At any one time, inventories include items that have been written down to the Company’s best estimate of their realizable value. Judgment is required in estimating realizable value and factors considered are the age of merchandise and anticipated demand. Actual realizable value could differ materially from this estimate based upon future customer demand or economic conditions.
The Company estimates its reserve for shrinkage throughout the year based on historical shrinkage and any current trends, if applicable. Actual shrinkage is recorded at year end based upon the results of the Company’s physical inventory counts for locations at which counts were conducted. For locations where physical inventory counts were not conducted in the fiscal year, an estimated shrink reserve is recorded based on historical shrinkage and any current trends, if applicable. Historically, the Company’s shrinkage has not been volatile.
38
The Company accrues for merchandise in transit once it takes legal ownership and title to the merchandise; as such, an estimate for merchandise in transit is included in the Company’s merchandise inventories.
|
H.
|
Property and Equipment
|
Property and equipment are stated at cost. Depreciation is computed primarily using the straight-line method over the estimated useful lives of the assets (forty years for buildings; five to twenty years for furniture, fixtures and equipment; and three to seven years for computer equipment and software). Leasehold improvements are amortized using the straight-line method over the lesser of their estimated useful life or the life of the lease. Depreciation expense is primarily included within selling, general and administrative expenses.
The cost of maintenance and repairs is charged to earnings as incurred; significant renewals and betterments are capitalized. Maintenance and repairs amounted to $120.3 million, $111.9 million and $106.1 million for fiscal 2014, 2013 and 2012, respectively.
|
I.
|
Impairment of Long-Lived Assets
|
The Company reviews long-lived assets for impairment when events or changes in circumstances indicate the carrying value of these assets may exceed their current fair values. Recoverability of assets to be held and used is measured by a comparison of the carrying amount of an asset to the estimated undiscounted future cash flows expected to be generated by the asset. If the carrying amount of an asset exceeds its estimated future cash flows, an impairment charge is recognized for the amount by which the carrying amount of the asset exceeds the fair value of the assets. Assets to be disposed of would be separately presented in the balance sheet and reported at the lower of the carrying amount or fair value less costs to sell, and are no longer depreciated. The assets and liabilities of a disposal group classified as held for sale would be presented separately in the appropriate asset and liability sections of the balance sheet. The Company has not historically recorded any material impairment to its long-lived assets. In the future, if events or market conditions affect the estimated fair value to the extent that a long-lived asset is impaired, the Company will adjust the carrying value of these long-lived assets in the period in which the impairment occurs.
|
J.
|
Goodwill and Other Indefinite Lived Intangible Assets
|
The Company reviews goodwill and other intangibles that have indefinite lives for impairment annually or when events or changes in circumstances indicate the carrying value of these assets might exceed their current fair values. Impairment testing is based upon the best information available, including estimates of fair value which incorporate assumptions marketplace participants would use in making their estimates of fair value. The Company has not historically recorded an impairment to its goodwill and other indefinite lived intangible assets. As of February 28, 2015, for goodwill related to the North American Retail operating segment and the Institutional Sales operating segment and certain other indefinite lived intangible assets, the Company assessed qualitative factors in order to determine whether any events and circumstances existed which indicated that it was more likely than not that the fair value of these indefinite lived intangible assets did not exceed its carrying value and concluded no such events or circumstances existed which would require an impairment test being performed. In the future, if events or market conditions affect the estimated fair value to the extent that an asset is impaired, the Company will adjust the carrying value of these assets in the period in which the impairment occurs.
Included within other assets in the accompanying consolidated balance sheets as of February 28, 2015 and March 1, 2014, respectively, are $291.4 million for indefinite lived tradenames and trademarks.
39
|
K.
|
Self Insurance
|
The Company utilizes a combination of insurance and self insurance for a number of risks including workers’ compensation, general liability, automobile liability and employee related health care benefits (a portion of which is paid by its employees). Liabilities associated with the risks that the Company retains are estimated by considering historical claims experience, demographic factors, severity factors and other actuarial assumptions. Although the Company’s claims experience has not displayed substantial volatility in the past, actual experience could materially vary from its historical experience in the future. Factors that affect these estimates include but are not limited to: inflation, the number and severity of claims and regulatory changes. In the future, if the Company concludes an adjustment to self insurance accruals is required, the liability will be adjusted accordingly.
|
L.
|
Deferred Rent
|
The Company accounts for scheduled rent increases contained in its leases on a straight-line basis over the term of the lease beginning as of the date the Company obtained possession of the leased premises. Deferred rent amounted to $77.8 million and $79.0 million as of February 28, 2015 and March 1, 2014, respectively.
Cash or lease incentives (“tenant allowances”) received pursuant to certain store leases are recognized on a straight-line basis as a reduction to rent over the lease term. The unamortized portion of tenant allowances is included in deferred rent and other liabilities. The unamortized portion of tenant allowances amounted to $121.0 million and $124.1 million as of February 28, 2015 and March 1, 2014, respectively.
|
M.
|
Treasury Stock
|
The Company has authorization to make repurchases from time to time in the open market or through other parameters approved by the Board of Directors pursuant to existing rules and regulations.
Between December 2004 and July 2014, the Company’s Board of Directors authorized, through share repurchase programs, the repurchase of $9.450 billion of the Company’s common stock. On July 17, 2014, the Company entered into an accelerated share repurchase agreement (“ASR”) with an investment bank to repurchase an aggregate $1.1 billion of the Company’s common stock. The ASR was completed in December 2014. The total number of shares repurchased under the ASR was 16.8 million shares at a weighted average share price of $65.41.
Since 2004 through the end of fiscal 2014, the Company has repurchased approximately $8.6 billion of its common stock through share repurchase programs, which include the shares repurchased under the ASR.
During fiscal 2014, including the shares repurchased under the ASR, the Company repurchased approximately 33.0 million shares of its common stock at a total cost of approximately $2.251 billion. During fiscal 2013, the Company repurchased approximately 18.3 million shares of its common stock at a total cost of approximately $1.284 billion. During fiscal 2012, the Company repurchased approximately 16.1 million shares of its common stock at a total cost of approximately $1.001 billion. The Company has approximately $0.9 billion remaining of authorized share repurchases as of February 28, 2015.
|
N.
|
Fair Value of Financial Instruments
|
The Company’s financial instruments include cash and cash equivalents, investment securities, accounts payable, long term debt and certain other liabilities. The Company’s investment securities consist primarily of U.S. Treasury securities, which are stated at amortized cost, and auction rate securities, which are stated at their approximate fair value. The book value of the financial instruments, excluding the Company’s long term debt, is representative of their fair values (See “Fair Value Measurements,” Note 3). The fair value of the Company’s long term debt is approximately $1.616 billion, which is based on quoted prices in active markets for identical instruments (i.e., Level 1 valuation), compared to the carrying value of approximately $1.500 billion.
40
|
O.
|
Revenue Recognition
|
Sales are recognized upon purchase by customers at the Company’s retail stores or upon delivery for products purchased from its websites. The value of point-of-sale coupons and point-of-sale rebates that result in a reduction of the price paid by the customer are recorded as a reduction of sales. Shipping and handling fees that are billed to a customer in a sale transaction are recorded in sales. Taxes, such as sales tax, use tax and value added tax, are not included in sales.
Revenues from gift cards, gift certificates and merchandise credits are recognized when redeemed. Gift cards have no provisions for reduction in the value of unused card balances over defined time periods and have no expiration dates.
Sales returns are provided for in the period that the related sales are recorded based on historical experience. Although the estimate for sales returns has not varied materially from historical provisions, actual experience could vary from historical experience in the future if the level of sales return activity changes materially. In the future, if the Company concludes that an adjustment to the sales return accrual is required due to material changes in the returns activity, the reserve will be adjusted accordingly.
|
P.
|
Cost of Sales
|
Cost of sales includes the cost of merchandise, buying costs and costs of the Company’s distribution network including inbound freight charges, distribution facility costs, receiving costs, internal transfer costs and shipping and handling costs.
|
Q.
|
Vendor Allowances
|
The Company receives allowances from vendors in the normal course of business for various reasons including direct cooperative advertising, purchase volume and reimbursement for other expenses. Annual terms for each allowance include the basis for earning the allowance and payment terms, which vary by agreement. All vendor allowances are recorded as a reduction of inventory cost, except for direct cooperative advertising allowances which are specific, incremental and identifiable. The Company recognizes purchase volume allowances as a reduction of the cost of inventory in the quarter in which milestones are achieved. Advertising costs were reduced by direct cooperative allowances of $25.6 million, $24.0 million and $19.8 million for fiscal 2014, 2013 and 2012, respectively.
|
R.
|
Store Opening, Expansion, Relocation and Closing Costs
|
Store opening, expansion, relocation and closing costs, including markdowns, asset residual values and projected occupancy costs, are charged to earnings as incurred.
|
S.
|
Advertising Costs
|
Expenses associated with direct response advertising are expensed over the period during which the sales are expected to occur, generally four to seven weeks, and all other expenses associated with store advertising are charged to earnings as incurred. Net advertising costs amounted to $308.4 million, $280.5 million and $250.6 million for fiscal 2014, 2013 and 2012, respectively.
|
T.
|
Stock-Based Compensation
|
The Company measures all employee stock-based compensation awards using a fair value method and records such expense in its consolidated financial statements. The Company adopted the accounting guidance related to stock compensation on August 28, 2005 (the “date of adoption”) under the modified prospective application. Under this application, the Company records stock-based compensation expense for all awards granted on or after the date of adoption and for the portion of previously granted awards that remained unvested at the date of adoption. Currently, the Company’s stock-based compensation relates to restricted stock awards, stock options and performance share units. The Company’s restricted stock awards are considered nonvested share awards.
41
U. Income Taxes
The Company files a consolidated Federal income tax return. Income tax returns are also filed with each taxable jurisdiction in which the Company conducts business.
The Company accounts for its income taxes using the asset and liability method. Deferred tax assets and liabilities are recognized for the future tax consequences attributable to the differences between the financial statement carrying amounts of existing assets and liabilities and their respective tax bases and operating loss and tax credit carry-forwards. Deferred tax assets and liabilities are measured using enacted tax rates expected to apply to taxable income in the year in which those temporary differences are expected to be recovered or settled. The effect on deferred tax assets and liabilities of a change in tax rates is recognized in earnings in the period that includes the enactment date.
The Company intends to reinvest the unremitted earnings of its Canadian subsidiary. Accordingly, no provision has been made for U.S. or additional non-U.S. taxes with respect to these earnings. In the event of repatriation to the U.S., in most cases such earnings would be subject to U.S. income taxes.
The Company recognizes the tax benefit from an uncertain tax position only if it is at least more likely than not that the tax position will be sustained on examination by the taxing authorities, based on the technical merits of the position. The tax benefits recognized in the financial statements from such a position are measured based on the largest benefit that has a greater than fifty percent likelihood of being realized upon settlement with the taxing authorities.
Judgment is required in determining the provision for income taxes and related accruals, deferred tax assets and liabilities. In the ordinary course of business, there are transactions and calculations where the ultimate tax outcome is uncertain. Additionally, the Company’s tax returns are subject to audit by various tax authorities. Although the Company believes that its estimates are reasonable, actual results could differ from these estimates.
|
V.
|
Earnings per Share
|
The Company presents earnings per share on a basic and diluted basis. Basic earnings per share has been computed by dividing net earnings by the weighted average number of shares outstanding. Diluted earnings per share has been computed by dividing net earnings by the weighted average number of shares outstanding including the dilutive effect of stock-based awards as calculated under the treasury stock method.
Stock-based awards of approximately 1.7 million, 1.2 million and 1.2 million shares were excluded from the computation of diluted earnings per share as the effect would be anti-dilutive for fiscal 2014, 2013 and 2012, respectively.
|
W.
|
Recent Accounting Pronouncements
|
In May 2014, Financial Accounting Standards Board issued Accounting Standards Update (“ASU”) 2014-09,
Revenue from Contracts with Customers
. This guidance requires an entity to recognize revenue in a manner that depicts the transfer of promised goods or services to customers in an amount that reflects the consideration to which the entity expects to be entitled in exchange for those goods or services. The new standard also will result in enhanced disclosures about the nature, amount, timing and uncertainty of revenue and cash flows arising from contracts with customers. ASU 2014-09 is effective for annual reporting periods beginning after December 15, 2016, including interim periods within that reporting period, with earlier adoption not permitted. ASU 2014-09 can be adopted either retrospectively to each prior reporting period presented or as a cumulative-effect adjustment as of the date of adoption. The adoption of this guidance is not expected to have a significant effect on our consolidated financial position, results of operations, or cash flows.
42
2.
ACQUISITIONS
On June 1, 2012, the Company acquired Linen Holdings, LLC (“Linen Holdings”), a provider of a variety of textile products, amenities and other goods to institutional customers in the hospitality, cruise line, healthcare and other industries, for an aggregate purchase price of approximately $108.1 million. The purchase price includes approximately $24.0 million for tradenames and approximately $40.2 million for goodwill. Linen Holdings is included within the Institutional Sales operating segment. In the first quarter of fiscal 2013, the Company finalized the valuation of assets acquired and liabilities assumed.
Since the date of acquisition, the results of Linen Holdings’ operations, which are not material, have been included in the Company’s results of operations.
On June 29, 2012, the Company acquired Cost Plus, Inc. (“Cost Plus World Market”), a retailer selling a wide range of home decorating items, furniture, gifts, holiday and other seasonal items, and specialty food and beverages, for an aggregate purchase price of approximately $560.5 million, including the payment of assumed borrowings of $25.5 million under a credit facility. The acquisition was consummated by a wholly owned subsidiary of the Company through a tender offer and merger, pursuant to which the Company acquired all of the outstanding shares of common stock of Cost Plus World Market. Cost Plus World Market is included within the North American Retail operating segment. In the first quarter of fiscal 2013, the Company finalized the valuation of assets acquired and liabilities assumed.
Since the date of acquisition, the results of Cost Plus World Market’s operations, which are not material, have been included in the Company’s results of operations and no proforma disclosure of financial information has been presented.
3.
FAIR VALUE MEASUREMENTS
Fair value is defined as the price that would be received to sell an asset or paid to transfer a liability (i.e., “the exit price”) in an orderly transaction between market participants at the measurement date. In determining fair value, the Company uses various valuation approaches, including quoted market prices and discounted cash flows. The hierarchy for inputs used in measuring fair value maximizes the use of observable inputs and minimizes the use of unobservable inputs by requiring that the most observable inputs be used when available. Observable inputs are inputs that market participants would use in pricing the asset or liability developed based on market data obtained from independent sources. Unobservable inputs are inputs that reflect a company’s judgment concerning the assumptions that market participants would use in pricing the asset or liability developed based on the best information available under the circumstances. In certain cases, the inputs used to measure fair value may fall into different levels of the fair value hierarchy. In such cases, an asset or liability must be classified in its entirety based on the lowest level of input that is significant to the measurement of fair value. The fair value hierarchy is broken down into three levels based on the reliability of inputs as follows:
• Level 1 – Valuations based on quoted prices in active markets for identical instruments that the Company is able to access. Since valuations are based on quoted prices that are readily and regularly available in an active market, valuation of these products does not entail a significant degree of judgment.
• Level 2 – Valuations based on quoted prices in active markets for instruments that are similar, or quoted prices in markets that are not active for identical or similar instruments, and model-derived valuations in which all significant inputs and significant value drivers are observable in active markets.
43
• Level 3 – Valuations based on inputs that are unobservable and significant to the overall fair value measurement.
As of February 28, 2015, the Company’s financial assets utilizing Level 1 inputs include long term trading investment securities traded on active securities exchanges. The Company did not have any financial assets utilizing Level 2 inputs. Financial assets utilizing Level 3 inputs included long term investments in auction rate securities consisting of preferred shares of closed end municipal bond funds (See “Investment Securities,” Note 4).
4.
INVESTMENT SECURITIES
The Company’s investment securities as of February 28, 2015 and March 1, 2014 are as follows:
|
(in millions)
|
February 28,
2015
|
March 1,
2014
|
||||||
|
Available-for-sale securities:
|
||||||||
|
Long term
|
$ | 47.9 | $ | 47.7 | ||||
|
Trading securities:
|
||||||||
|
Long term
|
49.2 | 39.7 | ||||||
|
Held-to-maturity securities:
|
||||||||
|
Short term
|
110.0 | 489.3 | ||||||
|
Total investment securities
|
$ | 207.1 | $ | 576.7 | ||||
Auction Rate Securities
As of February 28, 2015 and March 1, 2014, the Company’s available-for-sale investment securities represented approximately $51.0 million par value of auction rate securities, consisting of preferred shares of closed end municipal bond funds, less temporary valuation adjustments of approximately $3.1 million and $3.3 million, respectively. Since these valuation adjustments are deemed to be temporary, they are recorded in accumulated other comprehensive loss, net of a related tax benefit, and did not affect the Company’s net earnings.
U.S. Treasury Securities
As of February 28, 2015 and March 1, 2014, the Company’s short term held-to-maturity securities included approximately $110.0 million and approximately $489.3 million, respectively, of U.S. Treasury Bills with remaining maturities of less than one year. These securities are stated at their amortized cost which approximates fair value, which is based on quoted prices in active markets for identical instruments (i.e., Level 1 valuation).
Long Term Trading Investment Securities
The Company’s long term trading investment securities, which are provided as investment options to the participants of the nonqualified deferred compensation plan, are stated at fair market value. The values of these trading investment securities included in the table above are approximately $49.2 million and $39.7 million as of February 28, 2015 and March 1, 2014, respectively.
44
5.
PROPERTY AND EQUIPMENT
Property and equipment consist of the following:
|
(in thousands)
|
February 28,
2015
|
March 1,
2014
|
||||||
|
Land and buildings
|
$ | 557,538 | $ | 538,422 | ||||
|
Furniture, fixtures and equipment
|
1,179,073 | 1,120,330 | ||||||
|
Leasehold improvements
|
1,258,916 | 1,187,793 | ||||||
|
Computer equipment and software
|
940,754 | 755,867 | ||||||
| 3,936,281 | 3,602,412 | |||||||
|
Less: Accumulated depreciation
|
(2,259,581 | ) | (2,022,608 | ) | ||||
|
Property and equipment, net
|
$ | 1,676,700 | $ | 1,579,804 | ||||
Senior Unsecured Notes
On July 17, 2014, the Company issued $300 million aggregate principal amount of 3.749% senior unsecured notes due August 1, 2024 (the “2024 Notes”), $300 million aggregate principal amount of 4.915% senior unsecured notes due August 1, 2034 (the “2034 Notes”) and $900 million aggregate principal amount of 5.165% senior unsecured notes due August 1, 2044 (the “2044 Notes” and, together with the 2024 Notes and the 2034 Notes, the “Notes”). The aggregate net proceeds from the Notes were approximately $1.5 billion, which was used for share repurchases of the Company’s common stock and for general corporate purposes. Interest on the Notes is payable semi-annually on February 1 and August 1 of each year, beginning on February 1, 2015.
The Notes were issued under an indenture (the “Base Indenture”), as supplemented by a first supplemental indenture (together, with the Base Indenture, the “Indenture”), which contains various restrictive covenants, which are subject to important limitations and exceptions that are described in the Indenture. The Company was in compliance with all covenants related to the Notes as of February 28, 2015.
The Notes are unsecured, senior obligations and rank equal in right of payment to any of the Company’s existing and future senior unsecured indebtedness. The Company may redeem the Notes at any time, in whole or in part, at the redemption prices described in the Indenture plus accrued and unpaid interest to the redemption date. If a change in control triggering event, as defined by the Indenture governing the Notes, occurs unless the Company has exercised its right to redeem the Notes, the Company will be required to make an offer to the holders of the Notes to purchase the Notes at 101% of their principal amount, plus accrued and unpaid interest.
Revolving Credit Agreement
On August 6, 2014, the Company entered into a $250 million five year senior unsecured revolving credit facility agreement (“Revolver”) with various lenders. During the period from August 6, 2014 through February 28, 2015, the Company did not have any borrowings under the Revolver.
Borrowings under the Revolver accrue interest at either (1) a fluctuating rate equal to the greater of the prime rate, as defined in the Revolver, the Federal Funds Rate plus 0.50%, or one-month LIBOR plus 1.0% and, in each case, plus an applicable margin based upon the Company’s leverage ratio which is calculated quarterly, (2) a periodic fixed rate equal to LIBOR plus an applicable margin based upon the Company’s leverage ratio which is calculated quarterly or (3) an agreed upon fixed rate. In addition, a commitment fee is assessed, which is included in interest expense, net in the Consolidated Statement of Earnings. The Revolver contains customary affirmative and negative covenants and also requires the Company to maintain a minimum leverage ratio. The Company was in compliance with all covenants related to the Revolver as of February 28, 2015.
45
Deferred financing costs associated with the Notes and the Revolver of approximately $10.1 million were capitalized and are included in other assets in the accompanying Consolidated Balance Sheets. These deferred financing costs are being amortized over the term of each of the Notes and the term of the Revolver and such amortization is included in interest expense, net in the Consolidated Statement of Earnings. Interest expense related to the Notes and the Revolver, including the commitment fee and the amortization of the deferred financing costs, was approximately $44.9 million for the period from July 17, 2014 through February 28, 2015.
Lines of Credit
At February 28, 2015, the Company maintained two uncommitted lines of credit of $100 million each, with expiration dates of September 1, 2015 and February 28, 2016, respectively. These uncommitted lines of credit are currently and are expected to be used for letters of credit in the ordinary course of business. During fiscal 2014 and 2013, the Company did not have any direct borrowings under the uncommitted lines of credit. As of February 28, 2015, there was approximately $11.1 million of outstanding letters of credit. Although no assurances can be provided, the Company intends to renew both uncommitted lines of credit before the respective expiration dates. In addition, as of February 28, 2015, the Company maintained unsecured standby letters of credit of $71.7 million, primarily for certain insurance programs. As of March 1, 2014, there was approximately $4.5 million of outstanding letters of credit and approximately $74.3 million of outstanding unsecured standby letters of credit, primarily for certain insurance programs.
7.
PROVISION FOR INCOME TAXES
The components of the provision for income taxes are as follows:
|
FISCAL YEAR ENDED
|
||||||||||||
|
(in thousands)
|
February 28,
2015
|
March 1,
2014
|
March 2,
2013
|
|||||||||
|
Current:
|
||||||||||||
|
Federal
|
$ | 504,154 | $ | 514,818 | $ | 522,812 | ||||||
|
State and local
|
64,486 | 64,581 | 55,889 | |||||||||
| 568,640 | 579,399 | 578,701 | ||||||||||
|
Deferred:
|
||||||||||||
|
Federal
|
(18,245 | ) | 11,221 | 15,710 | ||||||||
|
State and local
|
(4,034 | ) | 537 | 1,860 | ||||||||
| (22,279 | ) | 11,758 | 17,570 | |||||||||
| $ | 546,361 | $ | 591,157 | $ | 596,271 | |||||||
46
At February 28, 2015 and March 1, 2014, included in other current assets is a net current deferred income tax asset of $207.3 million and $175.6 million, respectively, and included in other assets is a net noncurrent deferred income tax asset of $49.7 million and $55.8 million, respectively. These amounts represent the net tax effects of temporary differences between the carrying amounts of assets and liabilities for financial reporting purposes and the amounts used for income tax purposes. The significant components of the Company’s deferred tax assets and liabilities consist of the following:
|
(in thousands)
|
February 28,
2015
|
March 1,
2014
|
||||||
|
Deferred tax assets:
|
||||||||
|
Inventories
|
$ | 35,169 | $ | 28,947 | ||||
|
Deferred rent and
other rent credits
|
77,878 | 79,681 | ||||||
|
Insurance
|
62,668 | 58,860 | ||||||
|
Stock-based compensation
|
35,591 | 33,780 | ||||||
|
Merchandise credits and
gift card liabilities
|
65,055 | 42,413 | ||||||
|
Accrued expenses
|
42,328 | 42,643 | ||||||
|
Obligations on
distribution centers
|
41,175 | 41,454 | ||||||
|
Net operating loss carryforwards
and other tax credits
|
30,453 | 32,389 | ||||||
|
Other
|
89,933 | 84,610 | ||||||
|
Deferred tax liabilities:
|
||||||||
|
Depreciation
|
(74,051 | ) | (73,106 | ) | ||||
|
Goodwill
|
(55,888 | ) | (49,278 | ) | ||||
|
Intangibles
|
(80,515 | ) | (79,471 | ) | ||||
|
Other
|
(12,780 | ) | (11,480 | ) | ||||
| $ | 257,016 | $ | 231,442 | |||||
At February 28, 2015, as a result of the Cost Plus World Market acquisition (See “Acquisitions,” Note 2), the Company has federal net operating loss carryforwards of $13.7 million (tax effected), which will begin expiring in 2025, state net operating loss carryforwards of $9.1 million (tax effected), which will expire between 2014 and 2031, California state enterprise zone credit carryforwards of $6.6 million (tax effected), which will expire in 2023, but require taxable income in the enterprise zone to be realizable and other tax credits of $1.0 million (tax effected).
The Company has not established a valuation allowance for the net deferred tax asset as it is considered more likely than not that it is realizable through a combination of future taxable income and the deductibility of future net deferred tax liabilities.
The following table summarizes the activity related to the gross unrecognized tax benefits from uncertain tax positions:
|
(in thousands)
|
February 28,
2015
|
March 1,
2014
|
||||||
|
Balance at beginning of year
|
$ | 92,614 | $ | 97,892 | ||||
|
Increase related to current year positions
|
17,333 | 19,844 | ||||||
|
Increase related to prior year positions
|
6,549 | 2,292 | ||||||
|
Decrease related to prior year positions
|
(20,082 | ) | (9,316 | ) | ||||
|
Settlements
|
(11,762 | ) | (782 | ) | ||||
|
Lapse of statute of limitations
|
(4,667 | ) | (17,316 | ) | ||||
|
Balance at end of year
|
$ | 79,985 | $ | 92,614 | ||||
47
At February 28, 2015, the Company has recorded approximately $80.0 million of gross unrecognized tax benefits in non-current income taxes payable on the consolidated balance sheet of which approximately $79.9 million would impact the Company’s effective tax rate. At March 1, 2014, the Company has recorded approximately $92.6 million of gross unrecognized tax benefits in non-current income taxes payable on the consolidated balance sheet of which approximately $92.5 million would impact the Company’s effective tax rate. As of February 28, 2015 and March 1, 2014, the liability for gross unrecognized tax benefits included approximately $13.0 million and $16.9 million, respectively, of accrued interest. The Company recorded a decrease of interest of approximately $3.9 million and $2.0 million, respectively, for the years ended February 28, 2015 and March 1, 2014 for gross unrecognized tax benefits in the consolidated statement of earnings.
The Company anticipates that any adjustments to gross unrecognized tax benefits which will impact income tax expense, due to the expiration of statutes of limitations, could be approximately $5.0 to $6.0 million in the next twelve months. However, actual results could differ from those currently anticipated.
As of February 28, 2015, the Company operated in all 50 states, the District of Columbia, Puerto Rico, Canada and several other international countries and files income tax returns in the United States and various state, local and international jurisdictions. The Company is open to examination for state and local jurisdictions with varying statutes of limitations, generally ranging from three to five years.
For fiscal 2014, the effective tax rate is comprised of the Federal statutory income tax rate of 35.00%, the State income tax rate, net of Federal benefit, of 3.01%, provision for uncertain tax positions of 0.04% and other income tax benefits of 1.72%. For fiscal 2013, the effective tax rate is comprised of the Federal statutory income tax rate of 35.00%, the State income tax rate, net of Federal benefit, of 3.07%, benefit for uncertain tax positions of 0.05% and other income tax benefits of 1.42%. For fiscal 2012, the effective tax rate is comprised of the Federal statutory income tax rate of 35.00%, the State income tax rate, net of Federal benefit, of 2.93%, provision for uncertain tax positions of 0.07% and other income tax benefits of 1.50%.
8.
TRANSACTIONS AND BALANCES WITH RELATED PARTIES
In fiscal 2002, the Company had an interest in certain life insurance policies on the lives of its Co-Chairmen and their spouses. The Company’s interest in these policies was equivalent to the net premiums paid by the Company. The agreements relating to the Company’s interest in the life insurance policies on the lives of its Co-Chairmen and their spouses were terminated in fiscal 2003. Upon termination in fiscal 2003, the Co-Chairmen paid to the Company $5.4 million, representing the total amount of premiums paid by the Company under the agreements and the Company was released from its contractual obligation to make substantial future premium payments. In order to confer a benefit to its Co-Chairmen in substitution for the aforementioned terminated agreements, the Company has agreed to pay to the Co-Chairmen, at a future date, an aggregate amount of $4.2 million, which is included in accrued expenses and other current liabilities as of February 28, 2015 and March 1, 2014.
9.
LEASES
The Company leases retail stores, as well as distribution facilities, offices and equipment, under agreements expiring at various dates through 2042. Certain leases provide for contingent rents (which are based upon store sales exceeding stipulated amounts and are immaterial in fiscal 2014, 2013 and 2012), scheduled rent increases and renewal options. The Company is obligated under a majority of the leases to pay for taxes, insurance and common area maintenance charges.
48
As of February 28, 2015, future minimum lease payments under non-cancelable operating leases were as follows:
|
(in thousands)
|
Operating
Leases
|
|||
|
Fiscal Year:
|
||||
|
2015
|
$ | 573,802 | ||
|
2016
|
530,107 | |||
|
2017
|
466,517 | |||
|
2018
|
399,947 | |||
|
2019
|
333,617 | |||
|
Thereafter
|
956,177 | |||
|
Total future minimum lease payments
|
$ | 3,260,167 | ||
Expenses for all operating leases were $566.0 million, $559.8 million and $536.1 million for fiscal 2014, 2013 and 2012, respectively.
As a result of the Cost Plus World Market acquisition on June 29, 2012 and in addition to the amounts disclosed above, the Company assumed various capital lease obligations. As of February 28, 2015 and March 1, 2014, the capital lease obligations were approximately $3.5 million and $3.9 million, respectively, for which the current and long-term portions are included within accrued expenses and other current liabilities and deferred rent and other liabilities, respectively, in the consolidated balance sheet. Monthly minimum lease payments are accounted for as principal and interest payments. Interest expense for all capital leases was $0.5 million, $0.5 million and $0.4 million for fiscal 2014, 2013 and 2012, respectively.
The minimum capital lease payments, including interest, by fiscal year are: $0.8 million in fiscal 2015, $0.8 million in fiscal 2016, $0.7 million in fiscal 2017, $0.6 million in fiscal 2018, $0.6 million in fiscal 2019 and $2.0 million thereafter.
As a result of the Cost Plus World Market acquisition on June 29, 2012 and in addition to the amounts disclosed above, the Company assumed two sale/leaseback agreements and recorded financing obligations, which approximated the discounted fair value of the minimum lease payments, had a residual fair value at the end of the lease term and are being amortized over the term of the respective agreements, including option periods, of 32 and 35 years. As of February 28, 2015 and March 1, 2014, the sale/leaseback financing obligations were approximately $104.6 million and $105.3 million, respectively, for which the current and long-term portions are included within accrued expenses and other current liabilities and deferred rent and other liabilities, respectively, in the consolidated balance sheet. Monthly lease payments are accounted for as principal and interest payments (at approximate annual interest rates of 7.2% and 10.6%). These sale/leaseback financing obligations, excluding the residual fair value at the end of the lease term, mature as follows: $0.7 million in fiscal 2015, $0.7 million in fiscal 2016, $0.8 million in fiscal 2017, $0.8 million in fiscal 2018, $0.8 million in fiscal 2019 and $77.2 million thereafter.
10.
EMPLOYEE BENEFIT PLANS
Defined Contribution Plans
The Company has five defined contribution savings plans covering all eligible employees of the Company (“the Plans”). Participants of the Plans may defer annual pre-tax compensation subject to statutory and Plan limitations. In addition, a certain percentage of an employee’s contributions are matched by the Company and vest over a specified period of time, subject to certain statutory and Plan limitations. The Company’s match was approximately $13.2 million, $12.5 million and $10.9 million for fiscal 2014, 2013 and 2012, respectively, which was expensed as incurred.
49
Nonqualified Deferred Compensation Plan
The Company has a nonqualified deferred compensation plan (“NQDC”) for the benefit of employees who are defined by the Internal Revenue Service as highly compensated. Participants of the NQDC may defer annual pre-tax compensation subject to statutory and plan limitations. In addition, a certain percentage of an employee’s contributions may be matched by the Company and vest over a specified period of time, subject to certain plan limitations. The Company’s match was approximately $0.7 million, $0.5 million and $0.5 million in fiscal 2014, 2013 and 2012, respectively, which was expensed as incurred.
Changes in the fair value of the trading securities related to the NQDC and the corresponding change in the associated liability are included within interest income and selling, general and administrative expenses respectively, in the consolidated statements of earnings. Historically, these changes have resulted in no net impact to the consolidated statements of earnings.
Defined Benefit Plan
The Company has a non-contributory defined benefit pension plan for the CTS employees, hired on or before July 31, 2003, who meet specified age and length-of-service requirements. The benefits are based on years of service and the employee’s compensation up until retirement. The Company recognizes the overfunded or underfunded status of the pension plan as an asset or liability in its statement of financial position and recognizes changes in the funded status in the year in which the changes occur. For the years ended February 28, 2015, March 1, 2014 and March 2, 2013, the net periodic pension cost was not material to the Company’s results of operations. The Company has a $18.4 million and $9.2 million liability, which is included in deferred rent and other liabilities as of February 28, 2015 and March 1, 2014, respectively. In addition, as of February 28, 2015 and March 1, 2014, the Company recognized a loss of $6.1 million, net of taxes of $4.0 million, and a loss of $0.5 million, net of taxes of $0.4 million, respectively, within accumulated other comprehensive loss.
11.
COMMITMENTS AND CONTINGENCIES
The Company maintains employment agreements with its Co-Chairmen, which extend through February 25, 2017. The agreements provide for a base salary (which may be increased by the Board of Directors), termination payments, postretirement benefits and other terms and conditions of employment. In addition, the Company maintains employment agreements with other executives which provide for severance pay and, in some instances, certain other supplemental retirement benefits.
The Company records an estimated liability related to its various claims and legal actions arising in the ordinary course of business when and to the extent that it concludes a liability is probable and the amount of the loss can be reasonably estimated. Such estimated loss is based on available information and advice from outside counsel, where appropriate. As additional information becomes available, the Company reassesses the potential liability related to claims and legal actions and revises its estimated liabilities, as appropriate. The Company expects the ultimate disposition of these matters will not have a material adverse effect on the Company’s consolidated financial position, results of operations or liquidity. The Company also cannot predict the nature and validity of claims which could be asserted in the future, and future claims could have a material impact on its earnings.
12.
SUPPLEMENTAL CASH FLOW INFORMATION
The Company paid income taxes of $554.4 million, $562.4 million and $550.6 million in fiscal 2014, 2013 and 2012, respectively. In addition, the Company had interest payments of approximately $48.2 million, $9.2 million and $6.0 million in fiscal 2014, 2013 and 2012, respectively.
The Company recorded an accrual for capital expenditures of $57.8 million, $50.2 million and $37.0 million as of February 28, 2015, March 1, 2014 and March 2, 2013, respectively.
50
13.
STOCK-BASED COMPENSATION
The Company measures all employee stock-based compensation awards using a fair value method and records such expense, net of estimated forfeitures, in its consolidated financial statements. Currently, the Company’s stock-based compensation relates to restricted stock awards, stock options and performance share units. The Company’s restricted stock awards are considered nonvested share awards.
Stock-based compensation expense for the fiscal year ended February 28, 2015, March 1, 2014 and March 2, 2013 was approximately $66.5 million ($42.4 million after tax or $0.22 per diluted share), $56.2 million ($35.6 million after tax or $0.17 per diluted share) and approximately $47.2 million ($30.0 million after tax or $0.13 per diluted share), respectively. In addition, the amount of stock-based compensation cost capitalized for the years ended February 28, 2015 and March 1, 2014 was approximately $1.9 million and $1.6 million, respectively.
Incentive Compensation Plans
The Company currently grants awards under the Bed Bath & Beyond 2012 Incentive Compensation Plan (the “2012 Plan”), which amended and restated the Bed Bath & Beyond 2004 Incentive Compensation Plan (the “2004 Plan”). The 2012 Plan includes an aggregate of 43.2 million common shares authorized for issuance and the ability to grant incentive stock options. Outstanding awards that were covered by the 2004 Plan continue to be in effect under the 2012 Plan.
The 2012 Plan is a flexible compensation plan that enables the Company to offer incentive compensation through stock options (whether nonqualified stock options or incentive stock options), restricted stock awards, stock appreciation rights, performance awards and other stock based awards, including cash awards. Under the 2012 Plan, grants are determined by the Compensation Committee for those awards granted to executive officers and by an appropriate committee for all other awards granted. Awards of stock options and restricted stock generally vest in five equal annual installments beginning one to three years from the date of grant. Awards of performance share units generally vest over a period of four years from the date of grant dependent on the Company’s achievement of performance-based tests and subject, in general, to the executive remaining in the Company’s service on specified vesting dates.
The Company generally issues new shares for stock option exercises, restricted stock awards and vesting of performance share units. As of February 28, 2015, unrecognized compensation expense related to the unvested portion of the Company’s stock options, restricted stock awards and performance share units was $24.8 million, $127.3 million and $15.1 million, respectively, which is expected to be recognized over a weighted average period of 2.6 years, 3.5 years and 2.5 years, respectively.
Stock Options
Stock option grants are issued at fair market value on the date of grant and generally become exercisable in either three or five equal annual installments beginning one year from the date of grant for options issued since May 10, 2010, and beginning one to three years from the date of grant for options issued prior to May 10, 2010, in each case, subject, in general to the recipient remaining in the Company’s service on specified vesting dates. Option grants expire eight years after the date of grant for stock options issued since May 10, 2004, and expire ten years after the date of grant for stock options issued prior to May 10, 2004. All option grants are nonqualified.
51
The fair value of the stock options granted was estimated on the date of the grant using a Black-Scholes option-pricing model that uses the assumptions noted in the following table.
|
FISCAL YEAR ENDED
|
||||||||||||
|
Black-Scholes Valuation Assumptions
(1)
|
February 28, 2015
|
March 1,
2014
|
March 2,
2013
|
|||||||||
|
Weighted Average Expected Life (in years)
(2)
|
6.6 | 6.6 | 6.5 | |||||||||
|
Weighted Average Expected Volatility
(3)
|
28.31 | % | 29.27 | % | 31.07 | % | ||||||
|
Weighted Average Risk Free Interest Rates
(4)
|
2.11 | % | 1.11 | % | 1.14 | % | ||||||
|
Expected Dividend Yield
|
- | - | - | |||||||||
(1) Forfeitures are estimated based on historical experience.
(2) The expected life of stock options is estimated based on historical experience.
(3) Expected volatility is based on the average of historical and implied volatility. The historical volatility is determined by observing actual prices of the Company’s stock over a period commensurate with the expected life of the awards. The implied volatility represents the implied volatility of the Company’s call options, which are actively traded on multiple exchanges, had remaining maturities in excess of twelve months, had market prices close to the exercise prices of the employee stock options and were measured on the stock option grant date.
(4) Based on the U.S. Treasury constant maturity interest rate whose term is consistent with the expected life of the stock options.
Changes in the Company’s stock options for the fiscal year ended February 28, 2015 were as follows:
|
(Shares in thousands)
|
Number of Stock
Options
|
Weighted Average
Exercise Price
|
||||||
|
Options outstanding, beginning of period
|
4,192 | $ | 46.85 | |||||
|
Granted
|
523 | 62.34 | ||||||
|
Exercised
|
(1,033 | ) | 39.73 | |||||
|
Forfeited or expired
|
- | - | ||||||
|
Options outstanding, end of period
|
3,682 | $ | 51.05 | |||||
|
Options exercisable, end of period
|
1,989 | $ | 42.69 | |||||
The weighted average fair value for the stock options granted in fiscal 2014, 2013 and 2012 was $20.96, $22.28 and $22.95, respectively. The weighted average remaining contractual term and the aggregate intrinsic value for options outstanding as of February 28, 2015 was 4.1 years and $87.2 million, respectively. The weighted average remaining contractual term and the aggregate intrinsic value for options exercisable as of February 28, 2015 was 2.9 years and $63.6 million, respectively. The total intrinsic value for stock options exercised during fiscal 2014, 2013 and 2012 was $33.5 million, $44.6 million and $38.8 million, respectively.
Net cash proceeds from the exercise of stock options for fiscal 2014 were $41.2 million and the net associated income tax benefit was $13.9 million.
Restricted Stock
Restricted stock awards are issued and measured at fair market value on the date of grant and generally become vested in five equal annual installments beginning one to three years from the date of grant, subject, in general, to the recipient remaining in the Company’s service on specified vesting dates. Vesting of restricted stock awarded to certain of the Company’s executives is dependent on the Company’s achievement of a performance-based test for the fiscal year of grant and, assuming achievement of the performance-based test, time vesting, subject, in general, to the executive remaining in the Company’s service on specified vesting dates. The Company recognizes compensation expense related to these awards based on the assumption that the performance-based test will be achieved. Vesting of restricted stock awarded to the Company’s other employees is based solely on time vesting.
52
Changes in the Company’s restricted stock for the fiscal year ended February 28, 2015 were as follows:
|
(Shares in thousands)
|
Number of Restricted
Shares
|
Weighted Average
Grant-Date Fair
Value
|
||||||
|
Unvested restricted stock, beginning of period
|
3,943 | $ | 53.66 | |||||
|
Granted
|
852 | 62.72 | ||||||
|
Vested
|
(1,042 | ) | 45.36 | |||||
|
Forfeited
|
(161 | ) | 60.68 | |||||
|
Unvested restricted stock, end of period
|
3,592 | $ | 57.90 | |||||
Performance Share Units
Performance share units (“PSUs”) are issued and measured at fair market value on the date of grant. Vesting of PSUs awarded to certain of the Company’s executives is dependent on the Company’s achievement of a performance-based test during a one-year period from the date of grant and during a three-year period from the date of grant and, assuming achievement of the performance-based test, time vesting, subject, in general, to the executive remaining in the Company’s service on specified vesting dates. Performance during the one-year period will be based on Earnings Before Income Tax (“EBIT”) margin relative to a peer group of the Company comprising 50 companies selected within the first 90 days of the performance period. Upon achievement of the one-year performance-based test, the corresponding PSUs will vest annually in substantially equal installments over a three year period starting one year from the date of grant. Performance during the three-year period will be based on Return on Invested Capital (“ROIC”) relative to such peer group. Upon achievement of the three-year performance-based test, the corresponding PSUs will vest on the fourth anniversary date of grant. The awards based on EBIT margin and ROIC are capped at 150% of target achievement, with a floor of zero. PSUs are converted into shares of common stock upon payment following vesting. Upon grant of the PSUs, the Company recognizes compensation expense related to these awards based on the assumption that 100% of the target award will be achieved. The Company evaluates the target assumption on a quarterly basis and adjusts compensation expense related to these awards, as appropriate. Prior to the first quarter of fiscal 2014, the Company had not granted any PSUs. For fiscal 2014, the Company granted 390,803 PSUs with a weighted average grant date fair value of $62.34.
14.
SUMMARY OF QUARTERLY RESULTS (UNAUDITED)
|
FISCAL 2014 QUARTER ENDED
|
FISCAL 2013 QUARTER ENDED
|
|||||||||||||||||||||||||||||||
|
(in thousands, except per share data)
|
May 31, 2014
|
August 30, 2014
|
November 29, 2014
|
February 28, 2015
|
June 1, 2013
|
August 31, 2013
|
November 30, 2013
|
March 1, 2014
|
||||||||||||||||||||||||
|
Net sales
|
$ | 2,656,698 | $ | 2,944,905 | $ | 2,942,980 | $ | 3,336,593 | $ | 2,612,140 | $ | 2,823,672 | $ | 2,864,837 | $ | 3,203,314 | ||||||||||||||||
|
Gross profit
|
1,030,885 | 1,134,045 | 1,128,974 | 1,325,875 | 1,032,971 | 1,113,484 | 1,121,690 | 1,297,437 | ||||||||||||||||||||||||
|
Operating profit
|
300,701 | 368,741 | 352,683 | 532,168 | 323,101 | 389,766 | 374,647 | 527,073 | ||||||||||||||||||||||||
|
Earnings before provision
for income taxes
|
298,607 | 359,213 | 333,114 | 512,901 | 322,876 | 388,091 | 375,961 | 526,519 | ||||||||||||||||||||||||
|
Provision for
income taxes
|
111,555 | 135,260 | 107,706 | 191,840 | 120,386 | 138,787 | 138,764 | 193,220 | ||||||||||||||||||||||||
|
Net earnings
|
$ | 187,052 | $ | 223,953 | $ | 225,408 | $ | 321,061 | $ | 202,490 | $ | 249,304 | $ | 237,197 | $ | 333,299 | ||||||||||||||||
|
EPS-Basic (1)
|
$ | 0.94 | $ | 1.18 | $ | 1.24 | $ | 1.83 | $ | 0.94 | $ | 1.18 | $ | 1.13 | $ | 1.62 | ||||||||||||||||
|
EPS-Diluted (1)
|
$ | 0.93 | $ | 1.17 | $ | 1.23 | $ | 1.80 | $ | 0.93 | $ | 1.16 | $ | 1.12 | $ | 1.60 | ||||||||||||||||
(1) Net earnings per share ("EPS") amounts for each quarter are required to be computed independently and may not equal the amount computed for the total year.
53
REPORT OF INDEPENDENT REGISTERED PUBLIC ACCOUNTING FIRM
The Board of Directors and Shareholders
Bed Bath & Beyond Inc.:
We have audited the accompanying consolidated balance sheets of Bed Bath & Beyond Inc. and subsidiaries as of February 28, 2015 and March 1, 2014, and the related consolidated statements of earnings, comprehensive income, shareholders’ equity, and cash flows for each of the fiscal years in the three-year period ended February 28, 2015. In connection with our audits of the consolidated financial statements, we also have audited the consolidated financial statement schedule. These consolidated financial statements and financial statement schedule are the responsibility of the Company’s management. Our responsibility is to express an opinion on these consolidated financial statements and financial statement schedule based on our audits.
We conducted our audits in accordance with the standards of the Public Company Accounting Oversight Board (United States). Those standards require that we plan and perform the audit to obtain reasonable assurance about whether the financial statements are free of material misstatement. An audit includes examining, on a test basis, evidence supporting the amounts and disclosures in the financial statements. An audit also includes assessing the accounting principles used and significant estimates made by management, as well as evaluating the overall financial statement presentation. We believe that our audits provide a reasonable basis for our opinion.
In our opinion, the consolidated financial statements referred to above present fairly, in all material respects, the financial position of Bed Bath & Beyond Inc. and subsidiaries as of February 28, 2015 and March 1, 2014, and the results of their operations and their cash flows for each of the fiscal years in the three-year period ended February 28, 2015, in conformity with U.S. generally accepted accounting principles. Also in our opinion, the related financial statement schedule, when considered in relation to the basic consolidated financial statements taken as a whole, presents fairly, in all material respects, the information set forth therein.
We also have audited, in accordance with the standards of the Public Company Accounting Oversight Board (United States), the Company’s internal control over financial reporting as of February 28, 2015, based on criteria established in Internal Control – Integrated Framework (2013) issued by the Committee of Sponsoring Organizations of the Treadway Commission, and our report dated April 28, 2015 expressed an unqualified opinion on the effectiveness of the Company’s internal control over financial reporting.
/s/ KPMG LLP
Short Hills, New Jersey
April 28, 2015
54
REPORT OF INDEPENDENT REGISTERED PUBLIC ACCOUNTING FIRM ON INTERNAL
CONTROL OVER FINANCIAL REPORTING
The Board of Directors and Shareholders
Bed Bath & Beyond Inc.:
We have audited Bed Bath & Beyond Inc. and subsidiaries’ (the “Company”) internal control over financial reporting as of February 28, 2015, based on criteria established in Internal Control – Integrated Framework (2013) issued by the Committee of Sponsoring Organizations of the Treadway Commission. The Company’s management is responsible for maintaining effective internal control over financial reporting and for its assessment of the effectiveness of internal control over financial reporting, included in “Management’s Report on Internal Control Over Financial Reporting,” appearing in Item 9A, Controls and Procedures. Our responsibility is to express an opinion on the Company’s internal control over financial reporting based on our audit.
We conducted our audit in accordance with the standards of the Public Company Accounting Oversight Board (United States). Those standards require that we plan and perform the audit to obtain reasonable assurance about whether effective internal control over financial reporting was maintained in all material respects. Our audit included obtaining an understanding of internal control over financial reporting, assessing the risk that a material weakness exists, and testing and evaluating the design and operating effectiveness of internal control based on the assessed risk. Our audit also included performing such other procedures as we considered necessary in the circumstances. We believe that our audit provides a reasonable basis for our opinion.
A company’s internal control over financial reporting is a process designed to provide reasonable assurance regarding the reliability of financial reporting and the preparation of financial statements for external purposes in accordance with generally accepted accounting principles. A company’s internal control over financial reporting includes those policies and procedures that (1) pertain to the maintenance of records that, in reasonable detail, accurately and fairly reflect the transactions and dispositions of the assets of the company; (2) provide reasonable assurance that transactions are recorded as necessary to permit preparation of financial statements in accordance with generally accepted accounting principles, and that receipts and expenditures of the company are being made only in accordance with authorizations of management and directors of the company; and (3) provide reasonable assurance regarding prevention or timely detection of unauthorized acquisition, use, or disposition of the company’s assets that could have a material effect on the financial statements.
Because of its inherent limitations, internal control over financial reporting may not prevent or detect misstatements. Also, projections of any evaluation of effectiveness to future periods are subject to the risk that controls may become inadequate because of changes in conditions, or that the degree of compliance with the policies or procedures may deteriorate.
In our opinion, the Company maintained, in all material respects, effective internal control over financial reporting as of February 28, 2015, based on criteria established in Internal Control – Integrated Framework (2013) issued by the Committee of Sponsoring Organizations of the Treadway Commission.
We also have audited, in accordance with the standards of the Public Company Accounting Oversight Board (United States), the consolidated balance sheets of Bed Bath & Beyond Inc. and subsidiaries as of February 28, 2015, and March 1, 2014, and the related consolidated statements of earnings, comprehensive income, shareholders’ equity and cash flows for each of the fiscal years in the three-year period ended February 28, 2015, and our report dated April 28, 2015 expressed an unqualified opinion on those consolidated financial statements.
/s/ KPMG LLP
Short Hills, New Jersey
April 28, 2015
55
ACCOUNTING AND FINANCIAL DISCLOSURE
None.
(a) Disclosure Controls and Procedures
Based on their evaluation as of February 28, 2015, our Principal Executive Officer and Principal Financial Officer have concluded that our disclosure controls and procedures (as defined in Rules 13a-15(e) and 15d-15(e) under the Securities Exchange Act of 1934, as amended) were effective to ensure that the information required to be disclosed by our management in the reports that it files or submits under the Securities Exchange Act of 1934 is (i) recorded, processed, summarized and reported within the time periods specified in the SEC’s rules and forms and (ii) accumulated and communicated to our management, including our Principal Executive Officer and Principal Financial Officer, to allow timely decisions regarding required disclosure.
(b) Management’s Report on Internal Control over Financial Reporting
Our management is responsible for establishing and maintaining adequate internal control over financial reporting (as defined in Rule 13a-15(f) under the Securities Exchange Act of 1934, as amended). Our management assessed the effectiveness of our internal control over financial reporting as of February 28, 2015. In making this assessment, our management used the criteria set forth by the Committee of Sponsoring Organizations of the Treadway Commission (“COSO”), released in 2013, in Internal Control-Integrated Framework.
Our management has concluded that, as of February 28, 2015, our internal control over financial reporting is effective based on these criteria.
(c) Attestation Report of the Independent Registered Public Accounting Firm
KPMG LLP issued an audit report on the effectiveness of our internal control over financial reporting, which is included herein.
(d) Changes in Internal Control over Financial Reporting
There were no changes in our internal controls over financial reporting during the quarter ended February 28, 2015 that have materially affected, or are reasonably likely to materially affect, our internal controls over financial reporting.
Our management, including our Principal Executive Officer and Principal Financial Officer, does not expect that our disclosure controls and procedures or our internal controls will prevent all error and all fraud. Further, the design of a control system must reflect the fact that there are resource constraints, and the benefits of controls must be considered relative to their costs. A control system, no matter how well conceived and operated, can provide only reasonable, not absolute, assurance that the objectives of the control system are met. The Company’s disclosure controls and procedures are designed to provide such reasonable assurance of achieving their objectives, and the Company’s Principal Executive Officer and Principal Financial Officer have concluded that the Company’s disclosure controls and procedures are effective at that reasonable assurance level.
None.
56
GOVERNANCE
|
(a)
|
Directors of the Company
|
Information relative to Directors of the Company is set forth under the section captioned “Election of Directors” in the registrant’s definitive Proxy Statement for the 2015 Annual Meeting of Shareholders (“the Proxy Statement”) and is incorporated herein by reference.
|
(b)
|
Executive Officers of the Company
|
Information with respect to Executive Officers of the Company is set forth in Part I, Item 1.
(c)
Information with respect to compliance with Section 16(a) of the Securities Exchange Act of 1934 is set forth under the section captioned “Section 16(a) Beneficial Ownership Reporting Compliance” in the Proxy Statement and is incorporated herein by reference.
(d)
Information on our audit committee and the audit committee financial expert is set forth under the section captioned “Audit Committee” in the Proxy Statement and is incorporated herein by reference.
(e) The Company has adopted a code of ethics entitled “Policy Of Ethical Standards For Business Conduct” that applies to all of its employees, including Executive Officers, and the Board of Directors, the complete text of which is available through the Investor Relations section of the Company’s website, www.bedbathandbeyond.com.
The information required by this item is set forth under the section captioned “Executive Compensation” in the Proxy Statement and is incorporated herein by reference.
57
MANAGEMENT AND RELATED SHAREHOLDER MATTERS
The Equity Plan Compensation Information required by this item is included below; all other information required by this item is in the Proxy Statement and is incorporated herein by reference.
The following table provides certain information as of February 28, 2015 with respect to the Company’s equity compensation plans:
|
Plan Category
|
Number of securities to
be issued upon exercise
of outstanding options,
warrants and rights
(a)
|
Weighted-average
exercise price of
outstanding options,
warrants and rights
(b)
|
Number of securities
remaining available for
future issuance under
equity compensation plans
(excluding securities
reflected in column (a))
(c)
|
|
Equity compensation plans approved by shareholders (1)
|
4,151,181 (2)
|
$51.05 (3)
|
22,213,111
|
|
Equity compensation plans not approved by shareholders
|
-
|
-
|
-
|
|
Total (4)
|
4,151,181 (2)
|
$51.05 (3)
|
22,213,111
|
|
(1)
|
These plans consist of the Company’s 2004 Incentive Compensation Plan and the 2012 Incentive Compensation Plan, which amended and restated the 2004 Incentive Compensation Plan.
|
|
(2)
|
This amount includes 468,966 shares that may be issued upon the vesting of performance share units granted under the 2012 Incentive Compensation Plan, which represents the estimated maximum number of shares that may be issued upon the vesting of the performance share units. This amount also includes 3,682,215 of stock options outstanding.
|
|
(3)
|
The weighted-average exercise price solely takes into account outstanding stock options as other outstanding awards under the 2004 Incentive Compensation Plan and the 2012 Incentive Compensation Plan do not have an exercise price.
|
|
(4)
|
Any shares of common stock that are subject to awards of options or stock appreciation rights under the 2012 Incentive Compensation Plan shall be counted against the aggregate number of shares of common stock that may be issued as one share for every share issued. Any shares of common stock that are subject to awards other than options or stock appreciation rights, including restricted stock awards and performance stock units, shall be counted against this limit as 2.20 shares for every share granted.
|
DIRECTOR INDEPENDENCE
The information required by this item is set forth under the sections captioned “Director Independence” and “Certain Relationships and Related Transactions” in the Proxy Statement and is incorporated herein by reference.
The information required by this item is in the Proxy Statement and is incorporated herein by reference from the Proxy Statement.
58
|
(a) (1)
|
Consolidated Financial Statements of Bed Bath & Beyond Inc. and subsidiaries are incorporated under Item 8 of this Form 10-K.
|
|
(a) (2)
|
Financial Statement Schedules
|
For the Fiscal Years Ended February 28, 2015, March 1, 2014 and March 2, 2013.
Schedule II – Valuation and Qualifying Accounts
|
(a) (3)
|
Exhibits
|
The exhibits to this Report are listed in the Exhibit Index included elsewhere herein.
59
SIGNATURES
Pursuant to the requirements of Section 13 or 15(d) of the Securities Exchange Act of 1934, the registrant has duly caused this report to be signed on its behalf by the undersigned, thereunto duly authorized.
| BED BATH & BEYOND INC. | |||
| By: | /s/ Steven H. Temares | ||
|
Steven H. Temares
Chief Executive Officer
April 28, 2015
|
|||
Pursuant to the requirements of the Securities Exchange Act of 1934, this report has been signed below by the following persons on behalf of the registrant and in the capacities and on the dates indicated.
|
Signature
|
Capacity
|
Date
|
|||
|
/s/ Warren Eisenberg
|
Co-Chairman and Director
|
April 28, 2015
|
|||
|
Warren Eisenberg
|
|||||
|
/s/ Leonard Feinstein
|
Co-Chairman and Director
|
April 28, 2015
|
|||
|
Leonard Feinstein
|
|||||
|
/s/ Steven H. Temares
|
Chief Executive Officer
|
April 28, 2015
|
|||
|
Steven H. Temares
|
and Director
|
||||
|
/s/ Susan E. Lattmann
|
Chief Financial Officer and Treasurer
|
April 28, 2015
|
|||
|
Susan E. Lattmann
|
(Principal Financial and Accounting
|
||||
|
Officer)
|
|||||
|
/s/ Dean S. Adler
|
Director
|
April 28, 2015
|
|||
|
Dean S. Adler
|
|||||
|
/s/ Stanley Barshay
|
Director
|
April 28, 2015
|
|||
|
Stanley Barshay
|
|||||
|
/s/ Geraldine Elliott
|
Director
|
April 28, 2015
|
|||
|
Geraldine Elliott
|
|||||
|
/s/ Klaus Eppler
|
Director
|
April 28, 2015
|
|||
|
Klaus Eppler
|
|||||
|
/s/ Patrick R. Gaston
|
Director
|
April 28, 2015
|
|||
|
Patrick R. Gaston
|
|||||
|
/s/ Jordan Heller
|
Director
|
April 28, 2015
|
|||
|
Jordan Heller
|
|||||
|
/s/ Victoria A. Morrison
|
Director
|
April 28, 2015
|
|||
|
Victoria A. Morrison
|
60
Bed Bath & Beyond Inc. and Subsidiaries
Schedule II - Valuation and Qualifying Accounts
Fiscal Years Ended February 28, 2015, March 1, 2014 and March 2, 2013
(amounts in millions)
|
Column A
|
Column B
|
Column C
|
Column C
|
Column D
|
Column E
|
|||||||||||||||
|
Description
|
Balance at
Beginning of
|
Additions
Charged to
|
Additions
Charged to
|
Adjustments
and/or
|
Balance at
End of
|
|||||||||||||||
|
Sales Returns and Allowance
|
||||||||||||||||||||
|
Year Ended:
|
||||||||||||||||||||
|
February 28, 2015
|
$ | 45.0 | $ | 715.7 | $ | - | $ | 715.7 | $ | 45.0 | ||||||||||
|
March 1, 2014
|
40.0 | 706.6 | - | 701.6 | 45.0 | |||||||||||||||
|
March 2, 2013
|
37.6 | 625.1 | - | 622.7 | 40.0 | |||||||||||||||
61
EXHIBIT INDEX
Unless otherwise indicated, exhibits are incorporated by reference to the correspondingly numbered exhibits to the Company’s Registration Statement on Form S-1 (Commission File No. 33-47250).
Exhibit
|
No.
|
Exhibit
|
|
3.1
|
Restated Certificate of Incorporation
|
|
3.2
|
Certificate of Amendment to the Company’s Certificate of Incorporation (incorporated by reference to Exhibit 3 to the Company’s Quarterly Report on Form 10-Q/A for the quarter ended August 25, 1996)
|
|
3.3
|
Certificate of Amendment to the Company’s Certificate of Incorporation (incorporated by reference to Exhibit 3.1 to the Company’s Quarterly Report on Form 10-Q for the quarter ended August 30, 1997)
|
|
3.4
|
Certificate of Change of Bed Bath & Beyond Inc. under Section 805-A of the Business Corporation Law (incorporated by reference to Exhibit 3.2 to the Company’s Quarterly Report on Form 10-Q for the quarter ended August 30, 1997)
|
|
3.5
|
Certificate of Amendment of Certificate of Incorporation (incorporated by reference to Exhibit 3.6 to the Company’s Form 10-K for the year ended February 27, 1999)
|
|
3.6
|
Certificate of Amendment of Certificate of Incorporation of the Company (incorporated by reference to Exhibit 10.1 to the Company’s Quarterly Report on Form 10-Q for the quarter ended September 1, 2001)
|
|
3.7
|
Certificate of Amendment of Certificate of Incorporation of the Company (incorporated by reference to Exhibit 3.1 to the Company’s Form 8-K dated July 1, 2009)
|
|
3.8
|
Amended By-Laws of Bed Bath & Beyond Inc. (as amended effective as of September 23, 2009) (incorporated by reference to Exhibit 3.1 to the Company’s Form 8-K dated September 29, 2009)
|
|
4.1
|
Indenture, dated as of July 17, 2014, relating to the 3.749% senior unsecured notes due 2024, the 4.915% senior unsecured notes due 2034 and the 5.165% senior unsecured notes due 2044, between the Company and The Bank of New York Mellon, as trustee (incorporated by reference to Exhibit 4.1 to the Company’s Form 8-K filed with the Commission on July 17, 2014)
|
|
4.2
|
First Supplemental Indenture, dated as of July 17, 2014, relating to the 3.749% senior unsecured notes due 2024, the 4.915% senior unsecured notes due 2034 and the 5.165% senior unsecured notes due 2044, between the Company and The Bank of New York Mellon, as trustee (incorporated by reference to Exhibit 4.2 to the Company’s Form 8-K filed with the Commission on July 17, 2014)
|
|
4.3
|
Form of 3.749% senior unsecured notes due 2024 (incorporated by reference to Exhibit 4.3 to the Company’s Form 8-K filed with the Commission on July 17, 2014)
|
|
4.4
|
Form of 4.915% senior unsecured notes due 2034 (incorporated by reference to Exhibit 4.4 to the Company’s Form 8-K filed with the Commission on July 17, 2014)
|
62
|
4.5
|
Form of 5.165% senior unsecured notes due 2044 (incorporated by reference to Exhibit 4.5 to the Company’s Form 8-K filed with the Commission on July 17, 2014)
|
|
10.1*
|
Stock Option Agreement between the Company and Warren Eisenberg, dated as of August 26, 1997 (incorporated by reference to Exhibit 10.3 to the Company’s Quarterly Report on Form 10-Q for the quarter ended August 30, 1997)
|
|
10.2*
|
Stock Option Agreement between the Company and Leonard Feinstein, dated as of August 26, 1997 (incorporated by reference to Exhibit 10.4 to the Company’s Quarterly Report on Form 10-Q for the quarter ended August 30, 1997)
|
|
10.3*
|
Company’s 1992 Stock Option Plan, as amended through August 26, 1997 (incorporated by reference to Exhibit 10.5 to the Company’s Quarterly Report on Form 10-Q for the quarter ended August 30, 1997)
|
|
10.4*
|
Company’s 1996 Stock Option Plan, as amended through August 26, 1997 (incorporated by reference to Exhibit 10.6 to the Company’s Quarterly Report on Form 10-Q for the quarter ended August 30, 1997)
|
|
10.5*
|
Employment Agreement between the Company and Steven H. Temares (dated as of December 1, 1994) (incorporated by reference to Exhibit 10.16 to the Company’s Form 10-K for the year ended February 28, 1998)
|
|
10.6*
|
Form of Employment Agreement between the Company and the Chief Merchandising Officer and Senior Vice President and Senior Vice President – Stores (dated as of December 1, 1994) (incorporated by reference to Exhibit 10.17 to the Company’s Form 10-K for the year ended February 28, 1998)
|
|
10.7*
|
Company’s 1998 Stock Option Plan (incorporated by reference to Exhibit 10 to the Company’s Quarterly Report on Form 10-Q for the quarter ended May 30, 1998)
|
|
10.8*
|
Stock Option Agreement between the Company and Warren Eisenberg, dated as of August 13, 1999 (incorporated by reference to Exhibit 10.1 to the Company’s Quarterly Report on Form 10-Q for the quarter ended November 27, 1999)
|
|
10.9*
|
Stock Option Agreement between the Company and Leonard Feinstein, dated as of August 13, 1999 (incorporated by reference to Exhibit 10.2 to the Company’s Quarterly Report on Form 10-Q for the quarter ended November 27, 1999)
|
|
10.10*
|
Form of Standard Stock Option Agreement (incorporated by reference to Exhibit 10.3 to the Company’s Quarterly Report on Form 10-Q for the quarter ended November 27, 1999)
|
|
10.11*
|
Company’s 2000 Stock Option Plan (incorporated by reference to Exhibit 10 to the Company’s Quarterly Report on Form 10-Q for the quarter ended May 27, 2000 which is incorporated by reference to Exhibit A to the Registrant’s Proxy Statement dated May 22, 2000)
|
|
10.12*
|
Form of Standard Stock Option Agreement (incorporated by reference to Exhibit 10.1 to the Company’s Quarterly Report on Form 10-Q for the quarter ended August 26, 2000)
|
|
10.13*
|
Company’s 2001 Stock Option Plan (incorporated by reference to Exhibit 10.29 to the Company’s Form 10-K for the year ended March 3, 2001)
|
|
10.14*
|
Form of Standard Stock Option Agreement (incorporated by reference to Exhibit 10.1 to the Company’s Quarterly Report on Form 10-Q for the quarter ended May 1, 2002)
|
63
|
10.15*
|
Form of Standard Stock Option Agreement (incorporated by reference to Exhibit 10.1 to the Company’s Quarterly Report on Form 10-Q for the quarter ended August 31, 2002)
|
|
10.16*
|
Agreement Terminating Agreements concerning “Split Dollar” Life Insurance Plan, dated May 9, 1994 and June 16, 1995, among the Company, Jay D. Waxenberg, as trustee of the Warren Eisenberg Life Insurance Trust, Warren Eisenberg and Maxine Eisenberg (incorporated by reference to Exhibit 10.1 to the Company’s Form 10-Q for the quarter ended November 29, 2003)
|
|
10.17*
|
Agreement Terminating Agreements concerning “Split Dollar” Life Insurance Plan, dated May 9, 1994 and June 16, 1995, among the Company, Jay D. Waxenberg, as trustee of the Leonard Joseph Feinstein Life Insurance Trust and Leonard Feinstein (incorporated by reference to Exhibit 10.2 to the Company’s Form 10-Q for the quarter ended November 29, 2003)
|
|
10.18*
|
Compensation Agreement concerning Substitute Benefit Payments upon Termination of “Split Dollar” Life Insurance Plan between the Company and Warren Eisenberg, dated as of February 27, 2004 (incorporated by reference to Exhibit 10.20 to the Company’s Form 10-K for the year ended February 28, 2004)
|
|
10.19*
|
Compensation Agreement concerning Substitute Benefit Payments upon Termination of “Split Dollar” Life Insurance Plan between the Company and Leonard Feinstein, dated as of February 27, 2004 (incorporated by reference to Exhibit 10.21 to the Company’s Form 10-K for the year ended February 28, 2004)
|
|
10.20*
|
Employment Agreement between the Company and Eugene A. Castagna (dated as of March 1, 2000) (incorporated by reference to Exhibit 10.22 to the Company’s Form 10-K for the year ended February 28, 2004)
|
|
10.21*
|
Company’s 2004 Incentive Compensation Plan (incorporated by reference to Exhibit B to the Registrant’s Proxy Statement dated May 28, 2004)
|
|
10.22*
|
Form of Standard Stock Option Agreement dated as of May 10, 2004 (incorporated by reference to Exhibit 10.1 to the Company’s Form 10-Q for the quarter ended May 29, 2004)
|
|
10.23*
|
Form of Stock Option Agreement under 2004 Incentive Compensation Plan (incorporated by reference to Exhibit 10.1 to the Company’s Form 10-Q for the quarter ended August 28, 2004)
|
|
10.24*
|
Form of Restricted Stock Agreement under 2004 Stock Incentive Plan (incorporated by reference to Exhibit 10.1 to the Company’s Form 10-Q for the quarter ended May 28, 2005)
|
|
10.25*
|
Performance-Based Form of Restricted Stock Agreement under 2004 Stock Incentive Plan (incorporated by reference to Exhibit 10.2 to the Company’s Form 10-Q for the quarter ended May 28, 2005)
|
|
10.26*
|
Form of Stock Option Agreement under 2004 Stock Option Plan (incorporated by reference to Exhibit 10.1 to the Company’s Form 10-Q for the quarter ended August 27, 2005)
|
64
|
10.27*
|
Company’s Nonqualified Deferred Compensation Plan (effective January 1, 2006) (incorporated by reference to Exhibit 10.1 to the Company’s Form 8-K dated January 5, 2006)
|
|
10.28*
|
Addendum to Stock Option Agreements for Warren Eisenberg, Leonard Feinstein and Steven H. Temares, dated as of December 27, 2006 (incorporated by reference to Exhibit 10.31 to the Company’s Form 10-K for the year ended March 3, 2007)
|
|
10.29*
|
Addendum to Stock Option Agreements for Eugene A. Castagna, Matthew Fiorilli and Arthur Stark dated December 28, 2006 (incorporated by reference to Exhibit 10.32 to the Company’s Form 10-K for the year ended March 3, 2007)
|
|
10.30*
|
Amended and Restated Employment Agreement between the Company and Warren Eisenberg, dated as of December 31, 2008 (incorporated by reference to Exhibit 10.1 to the Company’s Form 10-Q for the quarter ended November 29, 2008)
|
|
10.31*
|
Amended and Restated Employment Agreement between the Company and Leonard Feinstein, dated as of December 31, 2008 (incorporated by reference to Exhibit 10.2 to the Company’s Form 10-Q for the quarter ended November 29, 2008)
|
|
10.32*
|
Bed Bath & Beyond Inc. Policy on Recovery of Incentive Compensation (incorporated by reference to Exhibit 10.1 to the Company’s Form 10-Q for the quarter ended May 30, 2009)
|
|
10.33*
|
Performance-Based Form of Restricted Stock Agreement under 2004 Stock Incentive Plan (incorporated by reference to Exhibit 10.2 to the Company’s Form 10-Q for the quarter ended May 30, 2009)
|
|
10.34*
|
Form of Amendment to Employment Agreement of Steven H. Temares, Eugene A. Castagna, Matthew Fiorilli and Arthur Stark, dated May, 2007 in the case of Messrs. Temares, Fiorilli and Stark, and July, 2007 in the case of Mr. Castagna (incorporated by reference to Exhibit 10.1 to the Company’s Form 10-Q for the quarter ended August 29, 2009)
|
|
10.35*
|
Amended and Restated Supplemental Executive Retirement Benefit Agreement between the Company and Steven H. Temares, dated November 16, 2009 (incorporated by reference to Exhibit 10.1 to the Company’s Form 8-K dated November 19, 2009)
|
|
10.36*
|
Escrow Agreement with Respect to Supplemental Executive Retirement Benefit Agreement between the Company and Steven H. Temares, dated November 16, 2009 (incorporated by reference to Exhibit 10.2 to the Company’s Form 8-K dated November 19, 2009)
|
|
10.37*
|
Amendment dated as of August 13, 2010 to Amended and Restated Employment Agreement between the Company and Warren Eisenberg, dated as of December 31, 2008 (incorporated by reference to Exhibit 10.1 to the Company’s Form 10-Q for the quarter ended August 28, 2010)
|
|
10.38*
|
Amendment dated as of August 13, 2010 to Amended and Restated Employment Agreement between the Company and Leonard Feinstein, dated as of December 31, 2008 (incorporated by reference to Exhibit 10.2 to the Company’s Form 10-Q for the quarter ended August 28, 2010)
|
|
10.39*
|
Bed Bath & Beyond Inc. 2012 Incentive Compensation Plan (incorporated by reference to Exhibit 10.1 to the Company’s Form 8-K filed with the Commission on June 26, 2012)
|
65
|
10.40*
|
Performance-Based Form of Restricted Stock Agreement under 2012 Stock Incentive Plan (incorporated by reference to Exhibit 10.39 to the Company’s Form 10-K for the year ended March 1, 2013)
|
|
10.41*
|
Form of Stock Option Agreement under 2012 Stock Option Plan (incorporated by reference to Exhibit 10.40 to the Company’s Form 10-K for the year ended March 1, 2013)
|
|
10.42*
|
Notice of Amendment to Restricted Stock Agreements, dated on or before June 11, 2012 (incorporated by reference to Exhibit 10.41 to the Company’s Form 10-K for the year ended March 1, 2013)
|
|
10.43*
|
Letter agreement dated as of June 28, 2013 between the Company and Warren Eisenberg (incorporated by reference to Exhibit 10.1 to the Company’s Form 8-K filed with the Commission on July 2, 2013)
|
|
10.44*
|
Letter agreement dated as of June 28, 2013 between the Company and Leonard Feinstein (incorporated by reference to Exhibit 10.2 to the Company’s Form 8-K filed with the Commission on July 2, 2013)
|
|
10.45*
|
Amendment dated as of February 26, 2014 to Amended and Restated Employment
Agreement between the Company and Warren Eisenberg, dated as of December 31, 2008, as previously amended as of June 29, 2010 and August 13, 2010 (incorporated by reference to Exhibit 10.1 to the Company’s Form 8-K filed with the Commission on February 28, 2014)
|
|
10.46*
|
Amendment dated as of February 26, 2014 to Amended and Restated Employment Agreement between the Company and Leonard Feinstein, dated as of December 31, 2008, as previously amended as of June 29, 2010 and August 13, 2010 (incorporated by reference to Exhibit 10.2 to the Company’s Form 8-K filed with the Commission on February 28, 2014)
|
|
10.47*
|
Form of Standard Performance Unit Agreement under 2012 Stock Incentive Plan (incorporated by reference to Exhibit 10.1 to the Company’s Form 8-K filed with the Commission on May 9, 2014)
|
|
10.48*
|
Employment Agreement between the Company and Susan E. Lattmann (dated as of October 6, 2014) (incorporated by reference to Exhibit 10.1 to the Company’s Form 10-Q filed with the Commission on October 8, 2014)
|
|
12.1
|
Ratio of Earnings to Fixed Charges
|
|
21**
|
Subsidiaries of the Company
|
|
|
Commission File No. 33-1
|
|
23**
|
Consent of Independent Registered Public Accounting Firm
|
|
31.1**
|
Certification of Principal Executive Officer Pursuant to Section 302 of the Sarbanes - Oxley Act of 2002
|
|
31.2**
|
Certification of Principal Financial Officer Pursuant to Section 302 of the Sarbanes - Oxley Act of 2002
|
66
|
32**
|
Certification of Principal Executive Officer and Principal Financial Officer Pursuant to 18 U.S.C. Section 1350, as Adopted Pursuant to Section 906 of the Sarbanes - Oxley Act of 2002
|
|
101.INS
|
XBRL Instance Document
|
|
101.SCH
|
XBRL Taxonomy Extension Schema Document
|
|
101.CAL
|
XBRL Taxonomy Extension Calculation Linkbase Document
|
|
101.LAB
|
XBRL Taxonomy Extension Label Linkbase Document
|
|
101.PRE
|
XBRL Taxonomy Extension Presentation Linkbase Document
|
|
101.DEF
|
XBRL Taxonomy Extension Definition Linkbase Document
|
__________________________________
|
*
|
This is a management contract or compensatory plan or arrangement.
|
|
**
|
Filed herewith.
|
67
TABLE OF CONTENTS
Part IItem 1 BusinessItem 1A Risk FactorsItem 1B Unresolved Staff CommentsItem 2 PropertiesItem 3 Legal ProceedingsItem 4 Mine Safety DisclosuresPart IIItem 5 Market For Registrant S Common Equity, RelatedItem 6 Selected Financial DataItem 7 Management S Discussion and Analysis Of FinancialItem 7A Quantitative and Qualitative Disclosures About Market RiskItem 8 Financial Statements and Supplementary DataItem 9 Changes in and Disagreements with Accountants onItem 9A Controls and ProceduresItem 9B Other InformationPart IIIItem 10 Directors, Executive Officers and CorporateItem 11 Executive CompensationItem 12 Security Ownership Of Certain Beneficial Owners andItem 13 Certain Relationships and Related Transactions, andItem 14 Principal Accounting Fees and ServicesPart IVItem 15 Exhibits, Financial Statement Schedules