BERKSHIRE HILLS BANCORP INC
10-Ks and 10-Qs
|
|
|
|
|
|
|
|
|
|
|
|
|
|
|
|
|
|
|
|
|
|
|
|
|
|
|
|
|
|
|
|
|
|
|
|
|
|
|
|
|
|
|
|
|
|
|
|
|
|
UNITED STATES
SECURITIES AND EXCHANGE COMMISSION
WASHINGTON, D.C. 20549
FORM 10-Q
|
ý
|
QUARTERLY REPORT PURSUANT TO SECTION 13 OR 15(d) OF THE SECURITIES EXCHANGE ACT OF 1934
|
For the quarterly period ended:
September 30, 2015
|
o
|
TRANSITION REPORT PURSUANT TO SECTION 13 OR 15(d) OF THE SECURITIES EXCHANGE ACT OF 1934
|
For the transition period from to
Commission File Number:
001-15781

BERKSHIRE HILLS BANCORP, INC.
(Exact name of registrant as specified in its charter)
|
Delaware
|
|
04-3510455
|
|
(State or other jurisdiction of incorporation or organization)
|
|
(I.R.S. Employer Identification No.)
|
|
|
|
|
|
24 North Street, Pittsfield, Massachusetts
|
|
01201
|
|
(Address of principal executive offices)
|
|
(Zip Code)
|
Registrant’s telephone number, including area code:
(413) 443-5601
Indicate by check mark whether the registrant (1) has filed all reports required to be filed by Section 13 or 15(d) of the Securities Exchange Act of 1934 during the preceding 12 months (or for such shorter period that the registrant was required to file such reports), and (2) has been subject to such filing requirements for the past 90 days. Yes
ý
No
o
Indicate by check mark whether the registrant has submitted electronically and posted on its corporate Web site, if any, every Interactive Data File required to be submitted and posted pursuant to Rule 405 of Regulation S-T (§232.405 of this chapter) during the preceding 12 months (or for such shorter period that the registrant was required to submit and post such files). Yes
ý
No
o
Indicate by check mark whether the registrant is a large accelerated filer, an accelerated filer, a non-accelerated filer, or a smaller reporting company. See the definition of “large accelerated filer,” “accelerated filer” and “smaller reporting company” in Rule 12b-2 of the Exchange Act. (Check one)
Large Accelerated Filer
o
Accelerated Filer
ý
Non-Accelerated Filer
o
Smaller Reporting Company
o
Indicate by check mark whether the registrant is a shell company (as defined in Rule 12b-2 of the Exchange Act) Yes
o
No
ý
The Registrant had 30,982,398 shares of common stock, par value $0.01 per share, outstanding as of November 4, 2015.
BERKSHIRE HILLS BANCORP, INC.
FORM 10-Q
INDEX
|
|
|
Page
|
||
|
|
|
|
||
|
|
||||
|
|
|
|
||
|
|
||||
|
|
|
|
||
|
|
||||
|
|
|
|
||
|
|
||||
|
|
|
|
||
|
|
||||
|
|
|
|
||
|
|
||||
|
|
|
|
||
|
|
||||
|
|
|
|
||
|
|
Notes to Consolidated Financial Statements
|
|
||
|
|
|
|||
|
|
|
|||
|
|
|
|||
|
|
|
|||
|
|
|
|||
|
|
|
|||
|
|
|
|||
|
|
|
|||
|
|
|
|||
|
|
|
|||
|
|
|
|||
|
|
|
|||
|
|
|
|||
|
|
|
|||
|
|
|
|
||
|
|
|
|
||
|
|
||||
|
|
|
|
||
|
|
||||
|
|
|
|
||
|
|
||||
|
|
|
|
||
|
|
|
|
||
2
3
BERKSHIRE HILLS BANCORP, INC.
|
|
September 30,
2015 |
December 31,
2014 |
||||||
|
(In thousands, except share data)
|
||||||||
|
Assets
|
|
|
|
|
||||
|
Cash and due from banks
|
$
|
50,716
|
|
$
|
54,179
|
|
||
|
Short-term investments
|
42,855
|
|
17,575
|
|
||||
|
Total cash and cash equivalents
|
93,571
|
|
71,754
|
|
||||
|
Trading security, at fair value
|
14,587
|
|
14,909
|
|
||||
|
Securities available for sale, at fair value
|
1,175,630
|
|
1,091,818
|
|
||||
|
Securities held to maturity (fair values of $136,102 and $44,997)
|
133,165
|
|
43,347
|
|
||||
|
Federal Home Loan Bank stock and other restricted securities
|
73,069
|
|
55,720
|
|
||||
|
Total securities
|
1,396,451
|
|
1,205,794
|
|
||||
|
Loans held for sale
|
25,472
|
|
19,493
|
|
||||
|
Residential mortgages
|
1,769,271
|
|
1,496,204
|
|
||||
|
Commercial real estate
|
2,021,300
|
|
1,611,567
|
|
||||
|
Commercial and industrial loans
|
1,065,325
|
|
804,366
|
|
||||
|
Consumer loans
|
809,034
|
|
768,463
|
|
||||
|
Total loans
|
5,664,930
|
|
4,680,600
|
|
||||
|
Less: Allowance for loan losses
|
(38,180
|
)
|
(35,662
|
)
|
||||
|
Net loans
|
5,626,750
|
|
4,644,938
|
|
||||
|
Premises and equipment, net
|
86,809
|
|
87,279
|
|
||||
|
Other real estate owned
|
2,487
|
|
2,049
|
|
||||
|
Goodwill
|
324,958
|
|
264,742
|
|
||||
|
Other intangible assets
|
11,586
|
|
11,528
|
|
||||
|
Cash surrender value of bank-owned life insurance policies
|
124,278
|
|
104,588
|
|
||||
|
Deferred tax assets, net
|
42,198
|
|
28,776
|
|
||||
|
Other assets
|
69,928
|
|
61,090
|
|
||||
|
Total assets
|
$
|
7,804,488
|
|
$
|
6,502,031
|
|
||
|
Liabilities
|
|
|
|
|
||||
|
Demand deposits
|
$
|
1,001,777
|
|
$
|
869,302
|
|
||
|
NOW deposits
|
476,351
|
|
426,108
|
|
||||
|
Money market deposits
|
1,485,392
|
|
1,407,179
|
|
||||
|
Savings deposits
|
603,596
|
|
496,344
|
|
||||
|
Time deposits
|
1,940,213
|
|
1,455,746
|
|
||||
|
Total deposits
|
5,507,329
|
|
4,654,679
|
|
||||
|
Short-term debt
|
1,095,300
|
|
900,900
|
|
||||
|
Long-term Federal Home Loan Bank advances
|
116,513
|
|
61,676
|
|
||||
|
Subordinated borrowings
|
89,798
|
|
89,747
|
|
||||
|
Total borrowings
|
1,301,611
|
|
1,052,323
|
|
||||
|
Other liabilities
|
113,980
|
|
85,742
|
|
||||
|
Total liabilities
|
$
|
6,922,920
|
|
$
|
5,792,744
|
|
||
|
Stockholders’ equity
|
|
|
|
|
||||
|
Common stock ($.01 par value; 50,000,000 shares authorized and 32,321,962 shares issued and 30,949,168 shares outstanding in 2015; 26,525,466 shares issued and 25,182,566 shares outstanding in 2014)
|
322
|
|
265
|
|
||||
|
Additional paid-in capital
|
742,334
|
|
585,289
|
|
||||
|
Unearned compensation
|
(7,094
|
)
|
(6,147
|
)
|
||||
|
Retained earnings
|
173,769
|
|
156,446
|
|
||||
|
Accumulated other comprehensive income
|
2,055
|
|
6,579
|
|
||||
|
Treasury stock, at cost (1,203,863 shares in 2015 and 1,342,900 shares in 2014)
|
(29,818
|
)
|
(33,145
|
)
|
||||
|
Total stockholders’ equity
|
881,568
|
|
709,287
|
|
||||
|
Total liabilities and stockholders’ equity
|
$
|
7,804,488
|
|
$
|
6,502,031
|
|
||
The accompanying notes are an integral part of these consolidated financial statements.
4
BERKSHIRE HILLS BANCORP, INC.
|
Three Months Ended
September 30, |
Nine Months Ended
September 30, |
|||||||||||||||
|
(In thousands, except per share data)
|
2015
|
2014
|
2015
|
2014
|
||||||||||||
|
Interest and dividend income
|
|
|
|
|
|
|
|
|
||||||||
|
Loans
|
$
|
56,343
|
|
$
|
43,958
|
|
$
|
152,292
|
|
$
|
128,761
|
|
||||
|
Securities and other
|
9,109
|
|
8,098
|
|
26,314
|
|
24,265
|
|
||||||||
|
Total interest and dividend income
|
65,452
|
|
52,056
|
|
178,606
|
|
153,026
|
|
||||||||
|
Interest expense
|
|
|
|
|
|
|
|
|
||||||||
|
Deposits
|
6,046
|
|
4,877
|
|
16,287
|
|
14,076
|
|
||||||||
|
Borrowings
|
2,435
|
|
2,230
|
|
7,218
|
|
6,906
|
|
||||||||
|
Total interest expense
|
8,481
|
|
7,107
|
|
23,505
|
|
20,982
|
|
||||||||
|
Net interest income
|
56,971
|
|
44,949
|
|
155,101
|
|
132,044
|
|
||||||||
|
Non-interest income
|
|
|
|
|
|
|
|
|
||||||||
|
Loan related income
|
1,537
|
|
1,471
|
|
5,603
|
|
4,565
|
|
||||||||
|
Mortgage banking income
|
693
|
|
994
|
|
3,492
|
|
2,057
|
|
||||||||
|
Deposit related fees
|
6,549
|
|
6,449
|
|
18,668
|
|
18,498
|
|
||||||||
|
Insurance commissions and fees
|
2,544
|
|
2,632
|
|
7,997
|
|
8,141
|
|
||||||||
|
Wealth management fees
|
2,376
|
|
2,330
|
|
7,376
|
|
7,173
|
|
||||||||
|
Total fee income
|
13,699
|
|
13,876
|
|
43,136
|
|
40,434
|
|
||||||||
|
Other
|
(1,050
|
)
|
520
|
|
(3,563
|
)
|
1,446
|
|
||||||||
|
Gain on sale of securities, net
|
49
|
|
245
|
|
2,467
|
|
482
|
|
||||||||
|
Loss on termination of hedges
|
—
|
|
—
|
|
—
|
|
(8,792
|
)
|
||||||||
|
Total non-interest income
|
12,698
|
|
14,641
|
|
42,040
|
|
33,570
|
|
||||||||
|
Total net revenue
|
69,669
|
|
59,590
|
|
197,141
|
|
165,614
|
|
||||||||
|
Provision for loan losses
|
4,240
|
|
3,685
|
|
12,295
|
|
11,070
|
|
||||||||
|
Non-interest expense
|
|
|
|
|
|
|
|
|
||||||||
|
Compensation and benefits
|
25,237
|
|
20,665
|
|
71,551
|
|
60,803
|
|
||||||||
|
Occupancy and equipment
|
6,827
|
|
6,780
|
|
21,178
|
|
20,250
|
|
||||||||
|
Technology and communications
|
4,645
|
|
3,484
|
|
12,328
|
|
11,062
|
|
||||||||
|
Marketing and promotion
|
781
|
|
659
|
|
2,294
|
|
1,801
|
|
||||||||
|
Professional services
|
1,053
|
|
830
|
|
3,700
|
|
3,006
|
|
||||||||
|
FDIC premiums and assessments
|
1,157
|
|
1,163
|
|
3,429
|
|
3,201
|
|
||||||||
|
Other real estate owned and foreclosures
|
298
|
|
13
|
|
800
|
|
569
|
|
||||||||
|
Amortization of intangible assets
|
887
|
|
1,236
|
|
2,722
|
|
3,816
|
|
||||||||
|
Acquisition, restructuring and conversion related expenses
|
3,361
|
|
238
|
|
16,493
|
|
6,729
|
|
||||||||
|
Other
|
5,132
|
|
4,619
|
|
14,056
|
|
13,072
|
|
||||||||
|
Total non-interest expense
|
49,378
|
|
39,687
|
|
148,551
|
|
124,309
|
|
||||||||
|
Income before income taxes
|
16,051
|
|
16,218
|
|
36,295
|
|
30,235
|
|
||||||||
|
Income tax expense
|
1,350
|
|
4,230
|
|
2,791
|
|
7,888
|
|
||||||||
|
Net income
|
$
|
14,701
|
|
$
|
11,988
|
|
$
|
33,504
|
|
$
|
22,347
|
|
||||
|
Earnings per share:
|
|
|
|
|
|
|
|
|
||||||||
|
Basic
|
$
|
0.49
|
|
$
|
0.48
|
|
$
|
1.21
|
|
$
|
0.90
|
|
||||
|
Diluted
|
$
|
0.49
|
|
$
|
0.48
|
|
$
|
1.20
|
|
$
|
0.90
|
|
||||
|
Weighted average common shares outstanding:
|
|
|
|
|
|
|
|
|
||||||||
|
Basic
|
29,893
|
|
24,747
|
|
27,685
|
|
24,721
|
|
||||||||
|
Diluted
|
30,069
|
|
24,861
|
|
27,847
|
|
24,835
|
|
||||||||
The accompanying notes are an integral part of these consolidated financial statements.
5
BERKSHIRE HILLS BANCORP, INC.
CONSOLIDATED STATEMENTS OF COMPREHENSIVE INCOME
|
Three Months Ended
September 30, |
Nine Months Ended
September 30, |
|||||||||||||||
|
(In thousands)
|
2015
|
2014
|
2015
|
2014
|
||||||||||||
|
Net income
|
$
|
14,701
|
|
$
|
11,988
|
|
$
|
33,504
|
|
$
|
22,347
|
|
||||
|
Other comprehensive income, before tax:
|
|
|
|
|
|
|
|
|
||||||||
|
Changes in unrealized gain on securities available-for-sale
|
8,207
|
|
(3,858
|
)
|
1,474
|
|
13,275
|
|
||||||||
|
Changes in unrealized loss on derivative hedges
|
(4,369
|
)
|
980
|
|
(7,486
|
)
|
2,246
|
|
||||||||
|
Changes in unrealized gain on terminated swaps
|
—
|
|
—
|
|
—
|
|
3,237
|
|
||||||||
|
Changes in unrealized loss on pension
|
65
|
|
(455
|
)
|
(1,402
|
)
|
(455
|
)
|
||||||||
|
Income taxes related to other comprehensive income:
|
|
|
|
|
|
|
||||||||||
|
Changes in unrealized gain on securities available-for-sale
|
(3,186
|
)
|
1,477
|
|
(692
|
)
|
(5,004
|
)
|
||||||||
|
Changes in unrealized loss on derivative hedges
|
1,761
|
|
(396
|
)
|
3,017
|
|
(906
|
)
|
||||||||
|
Changes in unrealized gain on terminated swaps
|
—
|
|
—
|
|
—
|
|
(1,312
|
)
|
||||||||
|
Changes in unrealized loss on pension
|
(26
|
)
|
184
|
|
565
|
|
184
|
|
||||||||
|
Total other comprehensive income (loss)
|
2,452
|
|
(2,068
|
)
|
(4,524
|
)
|
11,265
|
|
||||||||
|
Total comprehensive income
|
$
|
17,153
|
|
$
|
9,920
|
|
$
|
28,980
|
|
$
|
33,612
|
|
||||
The accompanying notes are an integral part of these consolidated financial statements.
6
BERKSHIRE HILLS BANCORP, INC.
CONSOLIDATED STATEMENTS OF CHANGES IN STOCKHOLDERS’ EQUITY
|
Additional
|
Accumulated
other |
||||||||||||||||||||||||||||||
|
|
Common stock
|
paid-in
|
Unearned
|
Retained
|
comprehensive
|
Treasury
|
|
||||||||||||||||||||||||
|
(In thousands)
|
Shares
|
Amount
|
capital
|
compensation
|
earnings
|
(loss) income
|
stock
|
Total
|
|||||||||||||||||||||||
|
Balance at December 31, 2013
|
25,036
|
|
$
|
265
|
|
$
|
587,247
|
|
$
|
(5,563
|
)
|
$
|
141,958
|
|
$
|
(9,057
|
)
|
$
|
(36,788
|
)
|
$
|
678,062
|
|
||||||||
|
Comprehensive income:
|
|
|
|
|
|
|
|
|
|
|
|
|
|
|
|
|
|||||||||||||||
|
Net income
|
—
|
|
—
|
|
—
|
|
—
|
|
22,347
|
|
—
|
|
—
|
|
22,347
|
|
|||||||||||||||
|
Other comprehensive income
|
—
|
|
—
|
|
—
|
|
—
|
|
—
|
|
11,265
|
|
—
|
|
11,265
|
|
|||||||||||||||
|
Total comprehensive income
|
|
|
|
|
|
|
|
|
|
|
|
|
|
|
33,612
|
|
|||||||||||||||
|
Cash dividends declared ($0.54 per share)
|
—
|
|
—
|
|
—
|
|
—
|
|
(13,694
|
)
|
—
|
|
—
|
|
(13,694
|
)
|
|||||||||||||||
|
Treasury stock purchased
|
(100
|
)
|
—
|
|
—
|
|
—
|
|
—
|
|
—
|
|
(2,468
|
)
|
(2,468
|
)
|
|||||||||||||||
|
Forfeited shares
|
(7
|
)
|
—
|
|
(6
|
)
|
176
|
|
—
|
|
—
|
|
(170
|
)
|
—
|
|
|||||||||||||||
|
Exercise of stock options
|
89
|
|
—
|
|
—
|
|
—
|
|
(1,163
|
)
|
—
|
|
2,215
|
|
1,052
|
|
|||||||||||||||
|
Restricted stock grants
|
175
|
|
—
|
|
(3
|
)
|
(4,319
|
)
|
—
|
|
—
|
|
4,322
|
|
—
|
|
|||||||||||||||
|
Stock-based compensation
|
—
|
|
—
|
|
41
|
|
2,816
|
|
—
|
|
—
|
|
—
|
|
2,857
|
|
|||||||||||||||
|
Net tax benefit related to stock-based compensation
|
—
|
|
—
|
|
(1,973
|
)
|
—
|
|
—
|
|
—
|
|
—
|
|
(1,973
|
)
|
|||||||||||||||
|
Other, net
|
(20
|
)
|
—
|
|
(6
|
)
|
—
|
|
—
|
|
—
|
|
(505
|
)
|
(511
|
)
|
|||||||||||||||
|
Balance at September 30, 2014
|
25,173
|
|
$
|
265
|
|
$
|
585,300
|
|
$
|
(6,890
|
)
|
$
|
149,448
|
|
$
|
2,208
|
|
$
|
(33,394
|
)
|
$
|
696,937
|
|
||||||||
|
Balance at December 31, 2014
|
25,183
|
|
$
|
265
|
|
$
|
585,289
|
|
$
|
(6,147
|
)
|
$
|
156,446
|
|
$
|
6,579
|
|
$
|
(33,145
|
)
|
$
|
709,287
|
|
||||||||
|
Comprehensive income:
|
|
|
|
|
|
|
|
|
|
|
|
|
|
|
|
|
|||||||||||||||
|
Net income
|
—
|
|
—
|
|
—
|
|
—
|
|
33,504
|
|
—
|
|
—
|
|
33,504
|
|
|||||||||||||||
|
Other comprehensive loss
|
—
|
|
—
|
|
—
|
|
—
|
|
—
|
|
(4,524
|
)
|
—
|
|
(4,524
|
)
|
|||||||||||||||
|
Total comprehensive income
|
|
|
|
|
|
|
|
|
|
|
|
|
|
|
28,980
|
|
|||||||||||||||
|
Acquisition of Hampden Bancorp, Inc. (1)
|
4,186
|
|
42
|
|
114,562
|
|
—
|
|
—
|
|
114,604
|
|
|||||||||||||||||||
|
Acquisition of Firestone Financial
|
1,442
|
|
15
|
|
42,092
|
|
—
|
|
—
|
|
42,107
|
|
|||||||||||||||||||
|
Cash dividends declared ($0.57 per share)
|
—
|
|
—
|
|
—
|
|
—
|
|
(16,016
|
)
|
—
|
|
—
|
|
(16,016
|
)
|
|||||||||||||||
|
Treasury stock purchased
|
—
|
|
—
|
|
—
|
|
—
|
|
—
|
|
—
|
|
—
|
|
—
|
|
|||||||||||||||
|
Forfeited shares
|
(19
|
)
|
—
|
|
42
|
|
479
|
|
—
|
|
—
|
|
(521
|
)
|
—
|
|
|||||||||||||||
|
Exercise of stock options
|
11
|
|
—
|
|
—
|
|
—
|
|
(165
|
)
|
—
|
|
281
|
|
116
|
|
|||||||||||||||
|
Restricted stock grants
|
182
|
|
—
|
|
316
|
|
(4,804
|
)
|
—
|
|
—
|
|
4,488
|
|
—
|
|
|||||||||||||||
|
Stock-based compensation
|
—
|
|
—
|
|
—
|
|
3,378
|
|
—
|
|
—
|
|
—
|
|
3,378
|
|
|||||||||||||||
|
Net tax benefit related to stock-based compensation
|
—
|
|
—
|
|
26
|
|
—
|
|
—
|
|
—
|
|
—
|
|
26
|
|
|||||||||||||||
|
Other, net
|
(36
|
)
|
—
|
|
7
|
|
—
|
|
—
|
|
—
|
|
(921
|
)
|
(914
|
)
|
|||||||||||||||
|
Balance at September 30, 2015
|
30,949
|
|
$
|
322
|
|
$
|
742,334
|
|
$
|
(7,094
|
)
|
$
|
173,769
|
|
$
|
2,055
|
|
$
|
(29,818
|
)
|
$
|
881,568
|
|
||||||||
(1) The Company's common stock includes the elimination of
$4.6 million
(
168,931
shares) of Berkshire Hills Bancorp stock held by a subsidiary.
The accompanying notes are an integral part of these consolidated financial statements.
7
BERKSHIRE HILLS BANCORP, INC.
|
|
Nine Months Ended
September 30, |
|||||||
|
(In thousands)
|
2015
|
2014
|
||||||
|
Cash flows from operating activities:
|
|
|
|
|
||||
|
Net income
|
$
|
33,504
|
|
$
|
22,347
|
|
||
|
Adjustments to reconcile net income to net cash provided by operating activities:
|
|
|
|
|
||||
|
Provision for loan losses
|
12,295
|
|
11,070
|
|
||||
|
Net amortization of securities
|
2,282
|
|
1,380
|
|
||||
|
Change in unamortized net loan costs and premiums
|
(716
|
)
|
(2,260
|
)
|
||||
|
Premises and equipment depreciation and amortization expense
|
6,443
|
|
6,127
|
|
||||
|
Stock-based compensation expense
|
3,377
|
|
2,855
|
|
||||
|
Accretion of purchase accounting entries, net
|
(6,383
|
)
|
(4,989
|
)
|
||||
|
Amortization of other intangibles
|
2,722
|
|
3,816
|
|
||||
|
Write down of other real estate owned
|
480
|
|
160
|
|
||||
|
Excess tax loss from stock-based payment arrangements
|
(26
|
)
|
(101
|
)
|
||||
|
Income from cash surrender value of bank-owned life insurance policies
|
(2,401
|
)
|
(2,219
|
)
|
||||
|
Gain on sales of securities, net
|
(2,467
|
)
|
(482
|
)
|
||||
|
Net (increase) in loans held for sale
|
(5,060
|
)
|
(13,251
|
)
|
||||
|
Loss on disposition of assets
|
2,208
|
|
668
|
|
||||
|
Loss on sale of real estate
|
240
|
|
148
|
|
||||
|
Loss on termination of hedges
|
—
|
|
3,237
|
|
||||
|
Amortization of interest in tax-advantaged projects
|
8,577
|
|
1,869
|
|
||||
|
Net change in other
|
(4,236
|
)
|
(9,362
|
)
|
||||
|
Net cash provided by operating activities
|
50,839
|
|
21,013
|
|
||||
|
Cash flows from investing activities:
|
|
|
|
|
||||
|
Net decrease in trading security
|
424
|
|
403
|
|
||||
|
Proceeds from sales of securities available for sale
|
24,389
|
|
143,488
|
|
||||
|
Proceeds from maturities, calls and prepayments of securities available for sale
|
143,489
|
|
102,425
|
|
||||
|
Purchases of securities available for sale
|
(236,601
|
)
|
(524,809
|
)
|
||||
|
Proceeds from maturities, calls and prepayments of securities held to maturity
|
6,889
|
|
3,761
|
|
||||
|
Purchases of securities held to maturity
|
(62,074
|
)
|
(1,436
|
)
|
||||
|
Net change in loans
|
(327,813
|
)
|
(374,616
|
)
|
||||
|
Purchases of bank owned life insurance
|
554
|
|
—
|
|
||||
|
Proceeds from sale of Federal Home Loan Bank stock
|
306
|
|
5,213
|
|
||||
|
Purchase of Federal Home Loan Bank stock
|
(10,706
|
)
|
(9,576
|
)
|
||||
|
Net investment in limited partnership tax credits
|
(2,500
|
)
|
(2,884
|
)
|
||||
|
Proceeds from the sale of premises and equipment
|
1,932
|
|
2,315
|
|
||||
|
Purchase of premises and equipment, net
|
(3,961
|
)
|
(6,224
|
)
|
||||
|
Acquisitions, net of cash paid
|
74,324
|
|
423,416
|
|
||||
|
Proceeds from sale of other real estate
|
1,705
|
|
1,571
|
|
||||
|
Net cash used in investing activities
|
(389,643
|
)
|
(236,953
|
)
|
||||
|
(continued)
|
|
|
|
|
||||
8
|
|
Nine Months Ended
September 30, |
|||||||
|
(In thousands)
|
2015
|
2014
|
||||||
|
Cash flows from financing activities:
|
|
|
|
|
||||
|
Net increase (decrease) in deposits
|
393,762
|
|
249,507
|
|
||||
|
Proceeds from Federal Home Loan Bank advances and other borrowings
|
6,441,300
|
|
4,722,052
|
|
||||
|
Repayments of Federal Home Loan Bank advances and other borrowings
|
(6,458,567
|
)
|
(4,745,324
|
)
|
||||
|
Purchase of treasury stock
|
—
|
|
(2,468
|
)
|
||||
|
Exercise of stock options
|
116
|
|
1,052
|
|
||||
|
Excess tax loss from stock-based payment arrangements
|
26
|
|
101
|
|
||||
|
Common stock cash dividends paid
|
(16,016
|
)
|
(13,694
|
)
|
||||
|
Net cash provided by financing activities
|
360,621
|
|
211,226
|
|
||||
|
Net change in cash and cash equivalents
|
21,817
|
|
(4,714
|
)
|
||||
|
Cash and cash equivalents at beginning of year
|
71,754
|
|
75,539
|
|
||||
|
Cash and cash equivalents at end of year
|
$
|
93,571
|
|
$
|
70,825
|
|
||
|
Supplemental cash flow information:
|
|
|
|
|
||||
|
Interest paid on deposits
|
$
|
15,833
|
|
$
|
13,901
|
|
||
|
Interest paid on borrowed funds
|
7,069
|
|
7,719
|
|
||||
|
Income taxes paid, net
|
1,125
|
|
473
|
|
||||
|
Acquisition of non-cash assets and liabilities:
|
|
|
|
|
||||
|
Assets acquired
|
948,796
|
|
18,064
|
|
||||
|
Liabilities assumed
|
(762,261
|
)
|
(441,550
|
)
|
||||
|
Other non-cash changes:
|
|
|
|
|
||||
|
Other net comprehensive income
|
(4,524
|
)
|
8,028
|
|
||||
|
Real estate owned acquired in settlement of loans
|
2,747
|
|
3,975
|
|
||||
The accompanying notes are an integral part of these consolidated financial statements.
9
NOTE 1.
BASIS OF PRESENTATION
The accompanying unaudited consolidated financial statements have been prepared in accordance with accounting principles generally accepted in the United States of America (“U.S. GAAP”) and contain all adjustments, consisting solely of normal, recurring adjustments, necessary for a fair presentation of results for such periods.
In addition, these interim financial statements have been prepared in accordance with the instructions to Form 10-Q and Article 10 of Regulation S-X, and accordingly, certain information and footnote disclosures normally included in financial statements prepared according to U.S. GAAP have been omitted.
The results for any interim period are not necessarily indicative of results for the full year. These consolidated financial statements should be read in conjunction with the audited financial statements and note disclosures for Berkshire Hills Bancorp, Inc. (the “Company”) previously filed with the Securities and Exchange Commission in the Company’s Annual Report on Form 10-K for the year ended December 31, 2014.
Reclassifications
Certain items in prior financial statements have been reclassified to conform to the current presentation.
Recently Adopted Accounting Standards
In January 2014, the Financial Accounting Standard Board “FASB” issued Accounting Standard Updated “ASU” ASU No. 2014-01, “Accounting for Investments in Qualified Affordable Housing Projects.” ASU No. 2014-01 permits reporting entities to make an accounting policy election to account for investments in qualified affordable housing projects using the proportional amortization method if certain conditions are met. Under the proportional amortization method, an entity amortizes the initial cost of the investment in proportion to the tax credits and other tax benefits received and recognizes the net investment performance in the income statement as a component of income tax expense. This new guidance also requires new disclosures for all investors in these projects. ASU No. 2014-01 is effective for interim and annual reporting periods beginning after December 15, 2014. Upon adoption, the guidance must be applied retrospectively to all periods presented. However, entities that use the effective yield method to account for investments in these projects before adoption may continue to do so for these pre-existing investments. The Company has elected not to adopt the proportional amortization method, which had no impact on our consolidated financial statements.
Also in January 2014, the FASB issued ASU No. 2014-04, “Reclassification of Residential Real Estate Collateralized Consumer Mortgage Loans upon Foreclosure.” The objective of this guidance is to clarify when an in substance repossession or foreclosure occurs, that is, when a creditor should be considered to have received physical possession of residential real estate property collateralizing a consumer mortgage loan such that the loan receivable should be derecognized and the real estate property recognized. ASU No. 2014-04 states that an in substance repossession or foreclosure occurs, and a creditor is considered to have received physical possession of residential real estate property collateralizing a consumer mortgage loan, upon either (1) the creditor obtaining legal title to the residential real estate property upon completion of a foreclosure or (2) the borrower conveying all interest in the residential real estate property to the creditor to satisfy that loan through completion of a deed in lieu of foreclosure or through a similar legal agreement. Additionally, ASU No. 2014-04 requires interim and annual disclosure of both (1) the amount of foreclosed residential real estate property held by the creditor and (2) the recorded investment in consumer mortgage loans collateralized by residential real estate property that are in the process of foreclosure according to local requirements of the applicable jurisdiction. ASU No. 2014-04 is effective for interim and annual reporting periods beginning after December 15, 2014. The Company adopted the provisions of ASU No. 2014-04 effective January 1, 2015, which did not have a material effect on our consolidated financial statements. See Note 6. Loan Loss Allowance to the Consolidated Financial Statements for the disclosures required by ASU No. 2014-04.
In June 2014, the FASB issued ASU No. 2014-11 related to repurchase-to-maturity transactions, repurchase financing and disclosures. The pronouncement changes the accounting for repurchase-to-maturity transactions and linked repurchase financings to secured borrowing accounting, which is consistent with the accounting for other repurchase agreements. The pronouncement also requires two new disclosures. The first disclosure requires an entity to disclose information on transfers accounted for as sales in transactions that are economically similar to repurchase agreements. The second disclosure provides increased transparency about the types of collateral pledged in repurchase agreements and similar transactions accounted for as secured borrowings. The pronouncement is effective for annual periods, and interim periods within those annual periods, beginning after December 15, 2014. Early adoption is not permitted. As of March 31, 2015, the Company did not have any repurchase transactions, and therefore the adoption of this pronouncement did not have an impact on our consolidated financial statements.
In August 2014, the FASB issued ASU No. 2014-14 related to classification of certain government-guaranteed mortgage loans upon foreclosure. The objective of this guidance is to reduce diversity in practice related to how creditors classify government-
10
guaranteed mortgage loans, including FHA or VA guaranteed loans, upon foreclosure. Some creditors reclassify those loans to real estate consistent with other foreclosed loans that do not have guarantees; others reclassify the loans to other receivables. The amendments in this guidance require that a mortgage loan be derecognized and that a separate other receivable be recognized upon foreclosure if the following conditions are met: (1) The loan has a government guarantee that is not separable from the loan before foreclosure; (2) At the time of foreclosure, the creditor has the intent to convey the real estate property to the guarantor and make a claim on the guarantee, and the creditor has the ability to recover under that claim; and (3) At the time of foreclosure, any amount of the claim that is determined on the basis of the fair value of the real estate is fixed. Upon foreclosure, the separate other receivable should be measured based on the amount of the loan balance (principal and interest) expected to be recovered from the guarantor. The pronouncement is effective for interim and annual reporting periods beginning after December 15, 2014. The Company adopted the provisions of ASU No. 2014-14 effective January 1, 2015, which did not have a material effect on our consolidated financial statements.
Future Application of Accounting Pronouncements
In May 2014, the FASB issued ASU No. 2014-09 related to the recognition of revenue from contracts with customers. The new revenue pronouncement creates a single source of revenue guidance for all companies in all industries and is more principles-based than current revenue guidance. The pronouncement provides a five-step model for a company to recognize revenue when it transfers control of goods or services to customers at an amount that reflects the consideration to which it expects to be entitled in exchange for those goods or services. The five steps are (1) identify the contract with the customer, (2) identify the separate performance obligations in the contract, (3) determine the transaction price, (4) allocate the transaction price to the separate performance obligations and (5) recognize revenue when each performance obligation is satisfied. The standard is effective for public entities for interim and annual reporting periods beginning after December 15, 2016; early adoption is not permitted. However, in July 2015, the FASB voted to approve deferring the effective date by one year (i.e., interim and annual reporting periods beginning after December 15, 2017). Early adoption is permitted, but not before the original effective date (i.e., interim and annual reporting periods beginning after December 15, 2016). For financial reporting purposes, the standard allows for either full retrospective adoption, meaning the standard is applied to all of the periods presented, or modified retrospective adoption, meaning the standard is applied only to the most current period presented in the financial statements with the cumulative effect of initially applying the standard recognized at the date of initial application. The Company is currently evaluating the provisions of ASU No. 2014-09, and will be closely monitoring developments and additional guidance to determine the potential impact the new standard will have on our consolidated financial statements.
In February 2015, the FASB issued ASU No. 2015-02, “Amendments to the Consolidation Analysis.” This ASU affects reporting entities that are required to evaluate whether they should consolidate certain legal entities. Specifically, the amendments: (1) Modify the evaluation of whether limited partnerships and similar legal entities are variable interest entities (“VIEs”) or voting interest entities; (2) Eliminate the presumption that a general partner should consolidate a limited partnership; (3) Affect the consolidation analysis of reporting entities that are involved with VIEs, particularly those that have fee arrangements and related party relationships; and (4) Provide a scope exception from consolidation guidance for reporting entities with interests in legal entities that are required to comply with or operate in accordance with requirements that are similar to those in Rule 2a-7 of the Investment Company Act of 1940 for registered money market funds. ASU No. 2015-02 is effective for interim and annual reporting periods beginning after December 15, 2015. The adoption of this pronouncement is not expected to have a material impact on our consolidated financial statements.
In April 2015, the FASB issued ASU No. 2015-05, “Customer’s Accounting for Fees Paid in a Cloud Computing Arrangement.” This ASU provides guidance to customers about whether a cloud computing arrangement includes a software license. If a cloud computing arrangement includes a software license, the customer should account for the software license element of the arrangement consistent with the acquisition of other software licenses. If a cloud computing arrangement does not include a software license, the customer should account for the arrangement as a service contract. The new guidance does not change the accounting for a customer’s accounting for service contracts. ASU No. 2015-05 is effective for interim and annual reporting periods beginning after December 15, 2015. The adoption of this pronouncement is not expected to have a material impact on our consolidated financial statements.
In September 2015, the FASB issued ASU No. 2015-16, “Business Combinations: Simplifying the Accounting for Measurement-Period Adjustments.” This ASU eliminates the requirement to retrospectively adjust the financial statements for measurement-period adjustments that occur in periods after a business combination is consummated. Measurement period adjustments are calculated as if they were known at the acquisition date, but are recognized in the reporting period in which they are determined. Additional disclosures are required about the impact on current-period income statement line items of adjustments that would have been recognized in prior periods if prior-period information had been revised. The guidance is effective for annual periods beginning after December 15, 2015 and is to be applied prospectively to adjustments of provisional amounts that occur after the effective date. Early application is permitted. The adoption of this pronouncement is not expected to have a material impact on our consolidated financial statements.
11
NOTE 2.
ACQUISITION
Hampden Bancorp, Inc.
On April 17, 2015, the Company acquired all of the outstanding common shares of Hampden Bancorp, Inc. (“Hampden”). Hampden, as a holding company, had
one
banking subsidiary (“Hampden Bank”) that had
ten
branches primarily serving western Massachusetts. As a result of the transaction, Hampden merged into Berkshire Hills Bancorp, and Hampden Bank merged into Berkshire Bank. This business combination increases Berkshire’s market share in its franchise and the goodwill recognized results from the expected synergies and earnings accretion from this combination, including future cost savings related to Hampden’s operations.
On the acquisition date, Hampden had
5.167 million
outstanding common shares, net of
209 thousand
shares held by Berkshire Bank. Hampden shareholders received
4.186 million
Berkshire common shares based on an exchange ratio of
0.81
shares of Berkshire common stock for each Hampden share. The merger qualifies as a reorganization for federal income tax purposes, and as a result, Hampden common shares exchanged for Berkshire common shares are transferred on a tax-free basis. The
4.355 million
shares of Berkshire common stock issued in this exchange were valued at
$27.38
per share based on the closing price of Berkshire posted on April 17, 2015. Excluding the
169 thousand
shares issued to Berkshire Bank, this resulted in a consideration value of
$114.6 million
. The Hampden shares held by Berkshire Bank were valued at
$4.6 million
, and the value in excess of the carrying value was recorded as a
$2.2 million
non-recurring securities gain in the statement of income.
The results of Hampden’s operations are included in the Company's Consolidated Statement of Income from the date of acquisition. The assets and liabilities in the Hampden acquisition were recorded at their fair value based on management’s best estimate using information available as of the date of acquisition. Consideration paid, and fair values of Hampden’s assets acquired and liabilities assumed, along with the resulting goodwill, are summarized in the following tables:
|
(in thousands)
|
As Acquired
|
Fair Value Adjustments
|
As Recorded at Acquisition
|
|||||||
|
Consideration paid:
|
||||||||||
|
Berkshire Hills Bancorp common stock issued to Hampden common stockholders
|
$
|
114,604
|
|
|||||||
|
Fair value of Hampden shares previously owned by the Company prior to acquisition
|
4,632
|
|
||||||||
|
Total consideration paid
|
$
|
119,236
|
|
|||||||
|
Recognized amounts of identifiable assets acquired and liabilities assumed, at fair value:
|
||||||||||
|
Cash and short-term investments
|
$
|
83,134
|
|
$
|
—
|
|
|
$
|
83,134
|
|
|
Investment securities
|
72,439
|
|
(224
|
)
|
(a)
|
72,215
|
|
|||
|
Loans
|
501,870
|
|
(8,101
|
)
|
(b)
|
493,769
|
|
|||
|
Premises and equipment
|
4,449
|
|
775
|
|
(c)
|
5,224
|
|
|||
|
Core deposit intangibles
|
—
|
|
2,780
|
|
(d)
|
2,780
|
|
|||
|
Deferred tax assets, net
|
3,875
|
|
3,091
|
|
(e)
|
6,966
|
|
|||
|
Other assets
|
22,919
|
|
560
|
|
(f)
|
23,479
|
|
|||
|
Deposits
|
(482,130
|
)
|
(1,439
|
)
|
(g)
|
(483,569
|
)
|
|||
|
Borrowings
|
(117,135
|
)
|
(2,380
|
)
|
(h)
|
(119,515
|
)
|
|||
|
Other liabilities
|
(8,395
|
)
|
(124
|
)
|
(i)
|
(8,519
|
)
|
|||
|
Total identifiable net assets
|
$
|
81,026
|
|
$
|
(5,062
|
)
|
$
|
75,964
|
|
|
|
Goodwill
|
$
|
43,272
|
|
|||||||
Explanation of Certain Fair Value Adjustments
|
(a)
|
The adjustment represents the write down of the book value of investments to their estimated fair value based on fair values on the date of acquisition.
|
|
(b)
|
The adjustment represents the write down of the book value of loans to their estimated fair value based on current interest rates and expected cash flows, which includes an estimate of expected loan loss inherent in the portfolio. Loans that met the criteria and are being accounted for in accordance with ASC 310-30 had a book value of
$28.5 million
and have a fair value
$16.7 million
. Non-impaired loans accounted for under ASC 310-10 had a book value of
$473.4 million
and have a fair value of $
477.1 million
. ASC 310-30 loans have a
$4.0 million
fair value adjustment discount that is accretable in earnings over an estimated
five
year life using the effective yield as determined on the
|
12
date of acquisition. The effective yield is periodically adjusted for changes in expected cash flows. ASC 310-10 loans have a
$0.4 million
fair value adjustment premium that is amortized into expense over the remaining term of the loans using the effective interest method, or a straight-line method if the loan is a revolving credit facility.
(c) The amount represents the adjustment of the book value of buildings and equipment, to their estimated fair value based on appraisals and other methods. The adjustments will be depreciated over the estimated economic lives of the assets.
(d) The adjustment represents the value of the core deposit base assumed in the acquisition. The core deposit asset was recorded as an identifiable intangible asset and will be amortized using a straight-line method over the average life of the deposit base, which is estimated to be
nine
years.
(e) Represents net deferred tax assets resulting from the fair value adjustments related to the acquired assets and liabilities, identifiable intangibles, and other purchase accounting adjustments.
|
(f)
|
The amount consists of a
$0.2 million
fair value adjustment to write-down other real estate owned based on market report data, a
$0.3 million
write-down of mortgage servicing assets acquired based on valuation reports, a
$0.5 million
write-off of prepaid assets due to obsolescence, and a
$1.6 million
measurement period adjustment increase to current taxes receivable. These adjustments are not accretable into earnings in the statement of income.
|
(g) The adjustment is necessary because the weighted average interest rate of time deposits exceeded the cost of similar funding at the time of acquisition. The amount will be amortized using an accelerated method over the estimated useful life of
two
years.
(h) Adjusts borrowings to their estimated fair value, which is calculated based on the amount of prepayment penalties that would be incurred if the borrowings were exited with the Federal Home Loan Bank of Boston on the date of acquisition.
(i) Adjusts the book value of other liabilities to their estimated fair value at the acquisition date. The adjustment consists of a
$0.4 million
write-off of deferred revenue, a
$0.3 million
increase to post-retirement liabilities due to change-in-control provisions, and a
$0.2 million
increase related to non-level leases.
Except for collateral dependent loans with deteriorated credit quality, the fair values for loans acquired were estimated using cash flow projections based on the remaining maturity and repricing terms. Cash flows were adjusted by estimating future credit losses and the rate of prepayments. Projected monthly cash flows were then discounted to present value using a risk-adjusted market rate for similar loans. For collateral dependent loans with deteriorated credit quality, to estimate the fair value we analyzed the value of the underlying collateral of the loans, assuming the fair values of the loans were derived from the eventual sale of the collateral. Those values were discounted using market derived rates of return, with consideration given to the period of time and costs associated with the foreclosure and disposition of the collateral. There was no carryover of the seller’s allowance for credit losses associated with the loans that were acquired in the acquisition as the loans were initially recorded at fair value.
Information about the acquired loan portfolio subject to ASC 310-30 as of April 17, 2015 is, as follows (in thousands):
|
ASC 310-30 Loans
|
|||
|
Gross contractual receivable amounts at acquisition
|
$
|
28,505
|
|
|
Contractual cash flows not expected to be collected (nonaccretable discount)
|
(7,884
|
)
|
|
|
Expected cash flows at acquisition
|
20,621
|
|
|
|
Interest component of expected cash flows (accretable discount)
|
(3,950
|
)
|
|
|
Fair value of acquired loans
|
$
|
16,671
|
|
The goodwill, which is not amortized for book purposes, was assigned to our banking segment and is not deductible for tax purposes. The fair value of savings and transaction deposit accounts acquired in the Hampden acquisition was assumed to approximate the carrying value as these accounts have no stated maturity and are payable on demand. The fair value of time deposits was estimated by discounting the contractual future cash flows using market rates offered for time deposits of similar remaining maturities.
Direct acquisition and integration costs of the Hampden acquisition were expensed as incurred, and totaled
$9.6 million
during the nine months ending September 30, 2015 and there were
$0 million
for the same period of 2014.
13
Firestone Financial Corp.
On August 7, 2015, the Company acquired all of the outstanding common shares of Firestone Financial Corp. (“Firestone”). Firestone is located in Needham, Massachusetts and is engaged in providing equipment financing for amusement, vending, laundry, and fitness industries nationwide. Firestone continues to operate as a wholly-owned subsidiary of Berkshire Bank. This business combination increases Berkshire’s market share in its franchise and the goodwill recognized results from the expected synergies and earnings accretion from this combination, including future cost savings related to Firestone’s operations.
Based on the merger agreement, Firestone shareholders received
1.442 million
shares of Berkshire common stock and
$13.4 million
in cash. The
1.442 million
shares of Berkshire common stock issued for this transaction was valued at
$29.20
per share based on the closing price of Berkshire posted on August 7, 2015, resulting in a stock consideration value of
$42.1 million
. Additionally, the Company extinguished Firestone’s
$11.8 million
commercial loan from Berkshire Bank, resulting in a
$67.3 million
total consideration paid for the acquisition of Firestone.
The results of Firestone’s operations are included in the Company's Consolidated Statement of Income from the date of acquisition. The assets and liabilities in the Firestone acquisition were recorded at their fair value based on management’s best estimate using information available as of the date of acquisition. Consideration paid, and fair values of Firestone’s assets acquired and liabilities assumed, along with the resulting goodwill, are summarized in the following table:
|
Fair Value
|
As Recorded at
|
|||||||
|
(in thousands)
|
As Acquired
|
Adjustments
|
Acquisition
|
|||||
|
Consideration paid:
|
||||||||
|
Berkshire Hills Bancorp common stock issued to Firestone common stockholders
|
$
|
42,107
|
|
|||||
|
Cash paid to Firestone common stockholders
|
13,387
|
|
||||||
|
Total merger consideration (1)
|
$
|
55,494
|
|
|||||
|
Recognized amounts of identifiable assets acquired and liabilities assumed, at fair value:
|
||||||||
|
Cash and short-term investments
|
4,577
|
|
—
|
|
4,577
|
|
||
|
Loans
|
194,622
|
|
(2,668
|
)
|
(a)
|
191,954
|
|
|
|
Premises and equipment
|
1,356
|
|
(835
|
)
|
(b)
|
521
|
|
|
|
Deferred tax assets, net
|
162
|
|
2,850
|
|
(c)
|
3,012
|
|
|
|
Other assets
|
1,863
|
|
(1,002
|
)
|
(d)
|
861
|
|
|
|
Borrowings (1)
|
(159,312
|
)
|
|
|
(159,312
|
)
|
||
|
Other liabilities
|
(3,198
|
)
|
76
|
|
(e)
|
(3,122
|
)
|
|
|
Total identifiable net assets
|
40,070
|
|
(1,579
|
)
|
38,491
|
|
||
|
Goodwill
|
$
|
17,003
|
|
|||||
(1) Amounts exclude
$11.8 million
of Firestone's commercial loan with the Company, which was effectively settled upon acquisition.
Explanation of Certain Fair Value Adjustments
(a) The adjustment represents a write-down of the book value of loans to their estimated fair value based on current
interest rates and expected cash flows, which includes an estimate of expected loan loss inherent in the portfolio. Loans that met the criteria and are being accounted for in accordance with ASC 310-30 had a book value of
$5.4 million
and have a fair value
$1.5 million
. Non-impaired loans accounted for under ASC 310-10 had a book value of
$192.7 million
and have a fair value of
$190.4 million
. ASC 310-30 loans have a
$0.8 million
fair value adjustment discount that is accretable in earnings over an estimated
three
year life using the effective yield as determined on the date of acquisition. The effective yield is periodically adjusted for changes in expected cash flows. ASC 310-10 loans have a
$2.3 million
fair value adjustment discount that is amortized into earnings over the remaining term of the loans using the effective interest method.
(b) The adjustment is a write-off of capitalized costs associated with Firestone’s internally developed accounting
software, the development of which has been ceased due to pending conversion of Firestone’s accounting system to the Company’s existing system.
(c) Represents net deferred tax assets resulting from the fair value adjustments related to the acquired assets and
14
liabilities, identifiable intangibles, and other purchase accounting adjustments.
(d) The adjustment consists of a
$0.8 million
write-off of capitalized loan costs due to no future economic benefits, a
$117
thousand write-off of equipment held for sale due to an estimated zero resale value, and a
$75
thousand swap termination fee for prepayment of Firestone’s borrowings.
(e) The adjustment is a write-off of a deferred rent accrual.
The method to determine the fair value of the loans acquired from Firestone was consistent with the method used in the Hampden acquisition. Accordingly, there was no carryover of Firestone’s allowance for credit losses associated with the loans that were acquired as the loans were initially recorded at fair value.
Information about the acquired loan portfolio subject to ASC 310-30 as of August 7, 2015 is as follows (in thousands):
|
ASC 310-30 Loans
|
|||
|
Gross contractual receivable amounts at acquisition
|
$
|
5,369
|
|
|
Contractual cash flows not expected to be collected (nonaccretable discount)
|
(3,000
|
)
|
|
|
Expected cash flows at acquisition
|
2,369
|
|
|
|
Interest component of expected cash flows (accretable discount)
|
(827
|
)
|
|
|
Fair value of acquired loans
|
$
|
1,542
|
|
The goodwill, which is not amortized for book purposes, was assigned to our banking segment and is not deductible for tax purposes.
Direct acquisition and integration costs of the Firestone acquisition were expensed as incurred, and totaled
$1.5 million
during the nine months ending September 30, 2015 and there were
none
for the same period of 2014.
Pro Forma Information (unaudited)
The following table presents selected unaudited pro forma financial information reflecting the acquisitions of Hampden and Firestone assuming these acquisitions were completed as of January 1, 2014. The unaudited pro forma financial information includes adjustments for scheduled amortization and accretion of fair value adjustments recorded at the time of the acquisitions. These adjustments would have been different if they had been recorded on January 1, 2014, and they do not include the impact of prepayments. The unaudited pro forma financial information is presented for illustrative purposes only and is not necessarily indicative of the combined financial results of the Company, Hampden, and Firestone had the transaction actually been completed at the beginning of the periods presented, nor does it indicate future results for any other interim or full-year period. Pro forma basic and diluted earnings per common share were calculated using Berkshire’s actual weighted-average shares outstanding for the periods presented plus the
5.63 million
shares issued as a result of Hampden and Firestone acquisitions. The unaudited pro forma information is based on the actual financial statements of Berkshire, Hampden, and Firestone for the periods shown until the dates of acquisitions, at which time the Hampden and Firestone operations became included in Berkshire’s financial statements.
The unaudited pro forma information, for the nine months ended September 30, 2015 and 2014, set forth below reflects adjustments related to (a) amortization and accretion of purchase accounting fair value adjustments; (b) amortization of core deposit intangible; and (c) an estimated tax rate of
40.3 percent
. Direct acquisition expenses incurred by Berkshire during 2015 as noted above, and
$7.7 million
and
$1.5 million
recorded by Hampden and Firestone, respectively, are reversed for the purposes of this unaudited pro forma information. Also excluded during 2015, was a
$2.2 million
gain on Hampden stock that was held by Berkshire at the time of acquisition. Furthermore, the unaudited pro forma information does not reflect management’s estimate of any revenue-enhancing or anticipated cost-savings that could occur after September 30, 2015.
15
Information in the following table is shown in thousands, except earnings per share:
|
Pro Forma (unaudited)
|
||||||
|
Nine Months Ended September 30,
|
||||||
|
2015
|
2014
|
|||||
|
Net interest income
|
$
|
171,485
|
|
$
|
161,316
|
|
|
Non-interest income
|
41,490
|
|
36,455
|
|
||
|
Net income
|
41,341
|
|
31,079
|
|
||
|
Pro forma earnings per share:
|
||||||
|
Basic
|
$
|
1.36
|
|
$
|
1.02
|
|
|
Diluted
|
$
|
1.35
|
|
$
|
1.02
|
|
The Company has determined it is impractical to report the amounts of revenue and earnings of the acquired entities since the acquisition dates. Due to the integration of their operations with those of the organization, the Company does not record revenue and earnings separately for these operations. The revenue and earnings of these operations are included in the consolidated statement of income.
NOTE 3.
TRADING SECURITY
The Company holds a tax advantaged economic development bond that is being accounted for at fair value. The security had an amortized cost of
$12.1 million
and
$12.6 million
, and a fair value of
$14.6 million
and
$14.9 million
, at
September 30, 2015
and
December 31, 2014
, respectively. As discussed further in Note 13 - Derivative Financial Instruments and Hedging Activities, the Company has entered into a swap contract to swap-out the fixed rate of the security in exchange for a variable rate. The Company does not purchase securities with the intent of selling them in the near term, and there are
no
other securities in the trading portfolio at
September 30, 2015
.
16
The following is a summary of securities available for sale and held to maturity:
|
(In thousands)
|
Amortized Cost
|
Gross
Unrealized
Gains
|
Gross
Unrealized
Losses
|
Fair Value
|
||||||||||||
|
September 30, 2015
|
|
|
|
|
|
|
|
|
||||||||
|
Securities available for sale
|
|
|
|
|
|
|
|
|
||||||||
|
Debt securities:
|
|
|
|
|
|
|
|
|
||||||||
|
Municipal bonds and obligations
|
$
|
98,790
|
|
$
|
3,988
|
|
$
|
(552
|
)
|
$
|
102,226
|
|
||||
|
Government-guaranteed residential mortgage-backed securities
|
68,785
|
|
748
|
|
(113
|
)
|
69,420
|
|
||||||||
|
Government-sponsored residential mortgage-backed securities
|
893,307
|
|
12,317
|
|
(1,788
|
)
|
903,836
|
|
||||||||
|
Corporate bonds
|
51,996
|
|
268
|
|
(2,345
|
)
|
49,919
|
|
||||||||
|
Trust preferred securities
|
11,730
|
|
385
|
|
—
|
|
12,115
|
|
||||||||
|
Other bonds and obligations
|
3,189
|
|
8
|
|
—
|
|
3,197
|
|
||||||||
|
Total debt securities
|
1,127,797
|
|
17,714
|
|
(4,798
|
)
|
1,140,713
|
|
||||||||
|
Marketable equity securities
|
31,345
|
|
5,252
|
|
(1,680
|
)
|
34,917
|
|
||||||||
|
Total securities available for sale
|
1,159,142
|
|
22,966
|
|
(6,478
|
)
|
1,175,630
|
|
||||||||
|
Securities held to maturity
|
|
|
|
|
|
|
|
|
||||||||
|
Municipal bonds and obligations
|
95,833
|
|
1,897
|
|
(306
|
)
|
97,424
|
|
||||||||
|
Government-sponsored residential mortgage-backed securities
|
68
|
|
4
|
|
—
|
|
72
|
|
||||||||
|
Tax advantaged economic development bonds
|
36,934
|
|
1,342
|
|
—
|
|
38,276
|
|
||||||||
|
Other bonds and obligations
|
330
|
|
—
|
|
—
|
|
330
|
|
||||||||
|
Total securities held to maturity
|
133,165
|
|
3,243
|
|
(306
|
)
|
136,102
|
|
||||||||
|
Total
|
$
|
1,292,307
|
|
$
|
26,209
|
|
$
|
(6,784
|
)
|
$
|
1,311,732
|
|
||||
|
December 31, 2014
|
|
|
|
|
|
|
|
|
||||||||
|
Securities available for sale
|
|
|
|
|
|
|
|
|
||||||||
|
Debt securities:
|
|
|
|
|
|
|
|
|
||||||||
|
Municipal bonds and obligations
|
$
|
127,014
|
|
$
|
6,859
|
|
$
|
(174
|
)
|
$
|
133,699
|
|
||||
|
Government-guaranteed residential mortgage-backed securities
|
68,972
|
|
702
|
|
(206
|
)
|
69,468
|
|
||||||||
|
Government-sponsored residential mortgage-backed securities
|
755,893
|
|
7,421
|
|
(3,130
|
)
|
760,184
|
|
||||||||
|
Corporate bonds
|
55,134
|
|
120
|
|
(1,103
|
)
|
54,151
|
|
||||||||
|
Trust preferred securities
|
16,607
|
|
820
|
|
(1,212
|
)
|
16,215
|
|
||||||||
|
Other bonds and obligations
|
3,211
|
|
—
|
|
(52
|
)
|
3,159
|
|
||||||||
|
Total debt securities
|
1,026,831
|
|
15,922
|
|
(5,877
|
)
|
1,036,876
|
|
||||||||
|
Marketable equity securities
|
48,993
|
|
7,322
|
|
(1,373
|
)
|
54,942
|
|
||||||||
|
Total securities available for sale
|
1,075,824
|
|
23,244
|
|
(7,250
|
)
|
1,091,818
|
|
||||||||
|
Securities held to maturity
|
|
|
|
|
|
|
|
|
||||||||
|
Municipal bonds and obligations
|
4,997
|
|
—
|
|
—
|
|
4,997
|
|
||||||||
|
Government-sponsored residential mortgage-backed securities
|
70
|
|
4
|
|
—
|
|
74
|
|
||||||||
|
Tax advantaged economic development bonds
|
37,948
|
|
1,680
|
|
(34
|
)
|
39,594
|
|
||||||||
|
Other bonds and obligations
|
332
|
|
—
|
|
—
|
|
332
|
|
||||||||
|
Total securities held to maturity
|
43,347
|
|
1,684
|
|
(34
|
)
|
44,997
|
|
||||||||
|
Total
|
$
|
1,119,171
|
|
$
|
24,928
|
|
$
|
(7,284
|
)
|
$
|
1,136,815
|
|
||||
17
The amortized cost and estimated fair value of available for sale (“AFS”) and held to maturity (“HTM”) securities, segregated by contractual maturity at
September 30, 2015
are presented below. Expected maturities may differ from contractual maturities because issuers may have the right to call or prepay obligations. Mortgage-backed securities are shown in total, as their maturities are highly variable. Equity securities have no maturity and are also shown in total.
|
|
Available for sale
|
Held to maturity
|
||||||||||||||
|
|
Amortized
|
Fair
|
Amortized
|
Fair
|
||||||||||||
|
(In thousands)
|
Cost
|
Value
|
Cost
|
Value
|
||||||||||||
|
Within 1 year
|
$
|
—
|
|
$
|
—
|
|
$
|
4,404
|
|
$
|
4,404
|
|
||||
|
Over 1 year to 5 years
|
3,455
|
|
3,472
|
|
17,831
|
|
18,542
|
|
||||||||
|
Over 5 years to 10 years
|
58,026
|
|
56,329
|
|
13,312
|
|
13,548
|
|
||||||||
|
Over 10 years
|
104,224
|
|
107,656
|
|
97,550
|
|
99,536
|
|
||||||||
|
Total bonds and obligations
|
165,705
|
|
167,457
|
|
133,097
|
|
136,030
|
|
||||||||
|
Marketable equity securities
|
31,345
|
|
34,917
|
|
—
|
|
—
|
|
||||||||
|
Residential mortgage-backed securities
|
962,092
|
|
973,256
|
|
68
|
|
72
|
|
||||||||
|
Total
|
$
|
1,159,142
|
|
$
|
1,175,630
|
|
$
|
133,165
|
|
$
|
136,102
|
|
||||
Securities with unrealized losses, segregated by the duration of their continuous unrealized loss positions, are summarized as follows:
|
|
Less Than Twelve Months
|
Over Twelve Months
|
Total
|
|||||||||||||||||||||
|
|
Gross
|
|
Gross
|
|
Gross
|
|
||||||||||||||||||
|
|
Unrealized
|
Fair
|
Unrealized
|
Fair
|
Unrealized
|
Fair
|
||||||||||||||||||
|
(In thousands)
|
Losses
|
Value
|
Losses
|
Value
|
Losses
|
Value
|
||||||||||||||||||
|
September 30, 2015
|
|
|
|
|
|
|
|
|
|
|
|
|
||||||||||||
|
Securities available for sale
|
|
|
|
|
|
|
|
|
|
|
|
|
||||||||||||
|
Debt securities:
|
|
|
|
|
|
|
|
|
|
|
|
|
||||||||||||
|
Municipal bonds and obligations
|
$
|
291
|
|
$
|
14,940
|
|
$
|
261
|
|
$
|
6,982
|
|
$
|
552
|
|
$
|
21,922
|
|
||||||
|
Government-guaranteed residential mortgage-backed securities
|
25
|
|
2,624
|
|
88
|
|
8,697
|
|
113
|
|
11,321
|
|
||||||||||||
|
Government-sponsored residential mortgage-backed securities
|
363
|
|
116,232
|
|
1,425
|
|
138,261
|
|
1,788
|
|
254,493
|
|
||||||||||||
|
Corporate bonds
|
2,345
|
|
35,085
|
|
—
|
|
—
|
|
2,345
|
|
35,085
|
|
||||||||||||
|
Trust preferred securities
|
—
|
|
—
|
|
—
|
|
—
|
|
—
|
|
—
|
|
||||||||||||
|
Other bonds and obligations
|
—
|
|
138
|
|
—
|
|
42
|
|
—
|
|
180
|
|
||||||||||||
|
Total debt securities
|
3,024
|
|
169,019
|
|
1,774
|
|
153,982
|
|
4,798
|
|
323,001
|
|
||||||||||||
|
Marketable equity securities
|
395
|
|
2,745
|
|
1,285
|
|
9,509
|
|
1,680
|
|
12,254
|
|
||||||||||||
|
Total securities available for sale
|
3,419
|
|
171,764
|
|
3,059
|
|
163,491
|
|
6,478
|
|
335,255
|
|
||||||||||||
|
Securities held to maturity
|
|
|
|
|
|
|
|
|
|
|
|
|
||||||||||||
|
Municipal bonds and obligations
|
231
|
|
20,149
|
|
75
|
|
2,933
|
|
306
|
|
23,082
|
|
||||||||||||
|
Tax advantaged economic development bonds
|
—
|
|
—
|
|
—
|
|
—
|
|
—
|
|
—
|
|
||||||||||||
|
Total securities held to maturity
|
231
|
|
20,149
|
|
75
|
|
2,933
|
|
306
|
|
23,082
|
|
||||||||||||
|
Total
|
$
|
3,650
|
|
$
|
191,913
|
|
$
|
3,134
|
|
$
|
166,424
|
|
$
|
6,784
|
|
$
|
358,337
|
|
||||||
18
|
December 31, 2014
|
|
|
|
|
|
|
|
|
|
|
|
|
||||||||||||
|
Securities available for sale
|
|
|
|
|
|
|
|
|
|
|
|
|
||||||||||||
|
Debt securities:
|
|
|
|
|
|
|
|
|
|
|
|
|
||||||||||||
|
Municipal bonds and obligations
|
$
|
8
|
|
$
|
1,001
|
|
$
|
166
|
|
$
|
7,206
|
|
$
|
174
|
|
$
|
8,207
|
|
||||||
|
Government guaranteed residential mortgage-backed securities
|
46
|
|
7,122
|
|
160
|
|
16,727
|
|
206
|
|
23,849
|
|
||||||||||||
|
Government-sponsored residential mortgage-backed securities
|
236
|
|
30,672
|
|
2,894
|
|
167,473
|
|
3,130
|
|
198,145
|
|
||||||||||||
|
Corporate bonds
|
1,103
|
|
39,571
|
|
—
|
|
—
|
|
1,103
|
|
39,571
|
|
||||||||||||
|
Trust preferred securities
|
65
|
|
935
|
|
1,147
|
|
2,408
|
|
1,212
|
|
3,343
|
|
||||||||||||
|
Other bonds and obligations
|
—
|
|
—
|
|
52
|
|
3,035
|
|
52
|
|
3,035
|
|
||||||||||||
|
Total debt securities
|
1,458
|
|
79,301
|
|
4,419
|
|
196,849
|
|
5,877
|
|
276,150
|
|
||||||||||||
|
Marketable equity securities
|
1,039
|
|
9,902
|
|
334
|
|
4,755
|
|
1,373
|
|
14,657
|
|
||||||||||||
|
Total securities available for sale
|
2,497
|
|
89,203
|
|
4,753
|
|
201,604
|
|
7,250
|
|
290,807
|
|
||||||||||||
|
Securities held to maturity
|
|
|
|
|
|
|
|
|
|
|
|
|
||||||||||||
|
Tax advantaged economic development bonds
|
—
|
|
—
|
|
34
|
|
7,972
|
|
34
|
|
7,972
|
|
||||||||||||
|
Total securities held to maturity
|
—
|
|
—
|
|
34
|
|
7,972
|
|
34
|
|
7,972
|
|
||||||||||||
|
Total
|
$
|
2,497
|
|
$
|
89,203
|
|
$
|
4,787
|
|
$
|
209,576
|
|
$
|
7,284
|
|
$
|
298,779
|
|
||||||
The Company expects to recover its amortized cost basis on all debt securities in its AFS and HTM portfolios. Furthermore, the Company does not intend to sell nor does it anticipate that it will be required to sell any of its securities in an unrealized loss position as of
September 30, 2015
, prior to this recovery. The Company’s ability and intent to hold these securities until recovery is supported by the Company’s strong capital and liquidity positions as well as its historically low portfolio turnover. The following summarizes, by investment security type, the basis for the conclusion that the debt securities in an unrealized loss position within the Company’s AFS and HTM portfolios were not other-than-temporarily impaired at
September 30, 2015
:
AFS municipal bonds and obligations
At
September 30, 2015
,
18
of the total
122
securities in the Company’s portfolio of AFS municipal bonds and obligations were in unrealized loss positions. Aggregate unrealized losses represented
2.5%
of the amortized cost of securities in unrealized loss positions. The Company continually monitors the municipal bond sector of the market carefully and periodically evaluates the appropriate level of exposure to the market. At this time, the Company feels the bonds in this portfolio carry minimal risk of default and the Company is appropriately compensated for that risk. There were no material underlying credit downgrades during the quarter. All securities are performing.
AFS residential mortgage-backed securities
At
September 30, 2015
,
77
out of the total
253
securities in the Company’s portfolios of AFS residential mortgage-backed securities were in unrealized loss positions. Aggregate unrealized losses represented
0.7%
of the amortized cost of securities in unrealized loss positions. The Federal National Mortgage Association (“FNMA”), Federal Home Loan Mortgage Corporation (“FHLMC”) and Government National Mortgage Association (“GNMA”) guarantee the contractual cash flows of all of the Company’s residential mortgage-backed securities. The securities are investment grade rated and there were no material underlying credit downgrades during the quarter. All securities are performing.
AFS corporate bonds
At
September 30, 2015
,
3
out of
5
securities in the Company’s portfolio of AFS corporate bonds were in an unrealized loss position. The aggregate unrealized loss represents
6.3%
of the amortized cost of bonds in unrealized loss positions. The Company reviews the financial strength of all of these bonds and has concluded that the amortized cost remains supported by the expected future cash flows of these securities. None of the bonds are investment grade rated.
19
At
September 30, 2015
,
$2.3 million
of the total unrealized losses was attributable to a
$31.8 million
investment. The Company evaluated this security, with a Level 2 fair value of
$29.5 million
, for potential other-than-temporary impairment (“OTTI”) at September 30, 2015 and determined that OTTI was not evident based on both the Company’s ability and intent to hold the security until the recovery of its remaining amortized cost.
AFS other bonds and obligations
At
September 30, 2015
,
4
of the total
8
securities in the Company’s portfolio of other bonds and obligations were in unrealized loss positions. Aggregate unrealized losses represented
0.1%
of the amortized cost of securities in unrealized loss positions. The securities are investment grade rated and there were no material underlying credit downgrades during the quarter. All securities are performing.
Marketable Equity Securities
In evaluating its marketable equity securities portfolio for OTTI, the Company considers its ability to more likely than not hold an equity security to recovery. The Company additionally considers other various factors including the length of time and the extent to which the fair value has been less than cost and the financial condition and near term prospects of the issuer. Any OTTI is recognized immediately through earnings.
At
September 30, 2015
,
9
out of the total
25
securities in the Company’s portfolio of marketable equity securities were in an unrealized loss position. The unrealized loss represented
12.1%
of the amortized cost of the securities. The Company has the ability and intent to hold the securities until recovery of their cost basis and does not consider the securities other-than-temporarily impaired at
September 30, 2015
. As new information becomes available in future periods, changes to the Company’s assumptions may be warranted and could lead to a different conclusion regarding the OTTI of these securities.
Securities Held to Maturity
HTM Municipal bonds and obligations
At
September 30, 2015
,
17
of the total
105
securities in the Company’s portfolio of other bonds and obligations were in unrealized loss positions. Aggregate unrealized losses represented
1.3%
of the amortized cost of securities in unrealized loss positions. The securities are investment grade rated and there were no material underlying credit downgrades during the quarter. All securities are performing.
20
The Company’s loan portfolio is segregated into the following segments: residential mortgage, commercial real estate, commercial and industrial, and consumer. Residential mortgage loans include classes for 1-4 family owner occupied and construction loans. Commercial real estate loans include construction, single and multi-family, and other commercial real estate classes. Commercial and industrial loans include asset based lending loans, lease financing and other commercial business loan classes. Consumer loans include home equity, direct and indirect auto, and other. These portfolio segments each have unique risk characteristics that are considered when determining the appropriate level for the allowance for loan losses.
A substantial portion of the loan portfolio is secured by real estate in western Massachusetts, southern Vermont, northeastern New York, and in the Bank’s other New England lending areas. The ability of many of the Bank’s borrowers to honor their contracts is dependent, among other things, on the specific economy and real estate markets of these areas.
Total loans include business activity loans and acquired loans. Acquired loans are those loans acquired from Firestone Financial Corp., Hampden Bancorp, Inc., the New York branch acquisition, Beacon Federal Bancorp, Inc., The Connecticut Bank and Trust Company, Legacy Bancorp, Inc., and Rome Bancorp, Inc. The following is a summary of total loans:
|
|
September 30, 2015
|
December 31, 2014
|
|||||||||||||||||
|
(In thousands)
|
Business
Activities Loans
|
Acquired
Loans
|
Total
|
Business
Activities Loans
|
Acquired
Loans
|
Total
|
|||||||||||||
|
Residential mortgages:
|
|
|
|
|
|
|
|
|
|
|
|
|
|||||||
|
1-4 family
|
$
|
1,382,068
|
|
$
|
351,104
|
|
$
|
1,733,172
|
|
$
|
1,199,408
|
|
$
|
268,734
|
|
$
|
1,468,142
|
|
|
|
Construction
|
33,441
|
|
2,658
|
|
36,099
|
|
27,044
|
|
1,018
|
|
28,062
|
|
|||||||
|
Total residential mortgages
|
1,415,509
|
|
353,762
|
|
1,769,271
|
|
1,226,452
|
|
269,752
|
|
1,496,204
|
|
|||||||
|
Commercial real estate:
|
|
|
|
|
|
|
|
|
|
|
|
|
|||||||
|
Construction
|
203,858
|
|
43,508
|
|
247,366
|
|
169,189
|
|
4,201
|
|
173,390
|
|
|||||||
|
Single and multi-family
|
202,187
|
|
41,042
|
|
243,229
|
|
140,050
|
|
53,168
|
|
193,218
|
|
|||||||
|
Other commercial real estate
|
1,173,168
|
|
357,537
|
|
1,530,705
|
|
1,030,837
|
|
214,122
|
|
1,244,959
|
|
|||||||
|
Total commercial real estate
|
1,579,213
|
|
442,087
|
|
2,021,300
|
|
1,340,076
|
|
271,491
|
|
1,611,567
|
|
|||||||
|
Commercial and industrial loans:
|
|
|
|
|
|
|
|
|
|
|
|
|
|||||||
|
Asset based lending
|
330,706
|
|
—
|
|
330,706
|
|
341,246
|
|
—
|
|
341,246
|
|
|||||||
|
Other commercial and industrial loans
|
484,476
|
|
250,143
|
|
734,619
|
|
411,945
|
|
51,175
|
|
463,120
|
|
|||||||
|
Total commercial and industrial loans
|
815,182
|
|
250,143
|
|
1,065,325
|
|
753,191
|
|
51,175
|
|
804,366
|
|
|||||||
|
Total commercial loans
|
2,394,395
|
|
692,230
|
|
3,086,625
|
|
2,093,267
|
|
322,666
|
|
2,415,933
|
|
|||||||
|
Consumer loans:
|
|
|
|
|
|
|
|
|
|
|
|
|
|||||||
|
Home equity
|
299,250
|
|
57,313
|
|
356,563
|
|
252,681
|
|
65,951
|
|
318,632
|
|
|||||||
|
Auto and other
|
306,685
|
|
145,786
|
|
452,471
|
|
346,480
|
|
103,351
|
|
449,831
|
|
|||||||
|
Total consumer loans
|
605,935
|
|
203,099
|
|
809,034
|
|
599,161
|
|
169,302
|
|
768,463
|
|
|||||||
|
Total loans
|
$
|
4,415,839
|
|
$
|
1,249,091
|
|
$
|
5,664,930
|
|
$
|
3,918,880
|
|
$
|
761,720
|
|
$
|
4,680,600
|
|
|
The carrying amount of the acquired loans at
September 30, 2015
totaled
$1.2 billion
. A subset of these loans was determined to have evidence of credit deterioration at acquisition date, which is accounted for in accordance with ASC 310-30. These purchased credit-impaired loans presently maintain a carrying value of
$23.5 million
(and a note balance of
$45.3
million). These loans are evaluated for impairment through the periodic reforecasting of expected cash flows. Loans that were considered not impaired at the acquisition date had a carrying amount of
$1.2 billion
.
The carrying amount of the acquired loans at
December 31, 2014
totaled
$762 million
. A subset of these loans was determined to have evidence of credit deterioration at acquisition date, which is accounted for in accordance with ASC 310-30. These purchased
21
credit-impaired loans presently maintain a carrying value of
$13.8 million
(and a note balance of
$25.8
million). These loans are evaluated for impairment through the periodic reforecasting of expected cash flows. Loans that were considered not impaired at the acquisition date had a carrying amount of
$747.9 million
.
The following table summarizes activity in the accretable yield for the acquired loan portfolio that falls under the purview of ASC 310-30,
Accounting for Certain Loans or Debt Securities Acquired in a Transfer.
|
|
Three Months Ended September 30,
|
|||||||
|
(In thousands)
|
2015
|
2014
|
||||||
|
Balance at beginning of period
|
$
|
6,540
|
|
$
|
2,440
|
|
||
|
Acquisitions
|
684
|
|
—
|
|
||||
|
Sales
|
—
|
|
—
|
|
||||
|
Reclassification from nonaccretable difference for loans with improved cash flows
|
1,214
|
|
1,214
|
|
||||
|
Change in cash flows that do not affect nonaccretable difference
|
—
|
|
—
|
|
||||
|
Accretion
|
(967
|
)
|
(458
|
)
|
||||
|
Balance at end of period
|
$
|
7,471
|
|
$
|
3,196
|
|
||
|
Nine Months Ended September 30,
|
||||||||
|
(In thousands)
|
2015
|
2014
|
||||||
|
Balance at beginning of period
|
$
|
2,541
|
|
$
|
2,559
|
|
||
|
Acquisitions
|
4,178
|
|
—
|
|
||||
|
Sales
|
—
|
|
—
|
|
||||
|
Reclassification from nonaccretable difference for loans with improved cash flows
|
2,950
|
|
2,793
|
|
||||
|
Change in cash flows that do not affect nonaccretable difference
|
—
|
|
(149
|
)
|
||||
|
Accretion
|
(2,882
|
)
|
(2,007
|
)
|
||||
|
Balance at end of period
|
$
|
7,471
|
|
$
|
3,196
|
|
||
22
The following is a summary of past due loans at
September 30, 2015
and
December 31, 2014
:
Business Activities Loans
|
(in thousands)
|
30-59 Days
Past Due
|
60-89 Days
Past Due
|
90
Days or Greater Past
Due
|
Total Past
Due
|
Current
|
Total Loans
|
Past Due >
90 days and
Accruing
|
|||||||||||||||||||||
|
September 30, 2015
|
|
|
|
|
|
|
|
|
|
|
|
|
|
|
||||||||||||||
|
Residential mortgages:
|
|
|
|
|
|
|
|
|
|
|
|
|
|
|
||||||||||||||
|
1-4 family
|
$
|
1,943
|
|
$
|
1,288
|
|
$
|
3,986
|
|
$
|
7,217
|
|
$
|
1,374,851
|
|
$
|
1,382,068
|
|
$
|
1,134
|
|
|||||||
|
Construction
|
—
|
|
—
|
|
—
|
|
—
|
|
33,441
|
|
33,441
|
|
—
|
|
||||||||||||||
|
Total
|
1,943
|
|
1,288
|
|
3,986
|
|
7,217
|
|
1,408,292
|
|
1,415,509
|
|
1,134
|
|
||||||||||||||
|
Commercial real estate:
|
|
|
|
|
|
|
|
|
|
|
|
|
|
|
||||||||||||||
|
Construction
|
—
|
|
—
|
|
59
|
|
59
|
|
203,799
|
|
203,858
|
|
—
|
|
||||||||||||||
|
Single and multi-family
|
133
|
|
149
|
|
64
|
|
346
|
|
201,841
|
|
202,187
|
|
64
|
|
||||||||||||||
|
Other commercial real estate
|
1,109
|
|
2,077
|
|
4,530
|
|
7,716
|
|
1,165,452
|
|
1,173,168
|
|
221
|
|
||||||||||||||
|
Total
|
1,242
|
|
2,226
|
|
4,653
|
|
8,121
|
|
1,571,092
|
|
1,579,213
|
|
285
|
|
||||||||||||||
|
Commercial and industrial loans:
|
|
|
|
|
|
|
|
|
|
|
|
|
|
|
||||||||||||||
|
Asset based lending
|
—
|
|
—
|
|
—
|
|
—
|
|
330,706
|
|
330,706
|
|
—
|
|
||||||||||||||
|
Other commercial and industrial loans
|
1,535
|
|
509
|
|
7,740
|
|
9,784
|
|
474,692
|
|
484,476
|
|
161
|
|
||||||||||||||
|
Total
|
1,535
|
|
509
|
|
7,740
|
|
9,784
|
|
805,398
|
|
815,182
|
|
161
|
|
||||||||||||||
|
Consumer loans:
|
|
|
|
|
|
|
|
|
|
|
|
|
|
|
||||||||||||||
|
Home equity
|
563
|
|
275
|
|
2,416
|
|
3,254
|
|
295,996
|
|
299,250
|
|
1,030
|
|
||||||||||||||
|
Auto and other
|
966
|
|
131
|
|
471
|
|
1,568
|
|
305,117
|
|
306,685
|
|
5
|
|
||||||||||||||
|
Total
|
1,529
|
|
406
|
|
2,887
|
|
4,822
|
|
601,113
|
|
605,935
|
|
1,035
|
|
||||||||||||||
|
Total
|
$
|
6,249
|
|
$
|
4,429
|
|
$
|
19,266
|
|
$
|
29,944
|
|
$
|
4,385,895
|
|
$
|
4,415,839
|
|
$
|
2,615
|
|
|||||||
Business Activities Loans
|
(in thousands)
|
30-59 Days
Past Due
|
60-89 Days
Past Due
|
90
Days or Greater Past
Due
|
Total Past
Due
|
Current
|
Total Loans
|
Past Due >
90 days and
Accruing
|
|||||||||||||||||||||
|
December 31, 2014
|
|
|
|
|
|
|
|
|
|
|
|
|
|
|
||||||||||||||
|
Residential mortgages:
|
|
|
|
|
|
|
|
|
|
|
|
|
|
|
||||||||||||||
|
1-4 family
|
$
|
5,580
|
|
$
|
146
|
|
$
|
4,053
|
|
$
|
9,779
|
|
$
|
1,189,629
|
|
$
|
1,199,408
|
|
$
|
1,527
|
|
|||||||
|
Construction
|
666
|
|
410
|
|
—
|
|
1,076
|
|
25,968
|
|
27,044
|
|
—
|
|
||||||||||||||
|
Total
|
6,246
|
|
556
|
|
4,053
|
|
10,855
|
|
1,215,597
|
|
1,226,452
|
|
1,527
|
|
||||||||||||||
|
Commercial real estate:
|
|
|
|
|
|
|
|
|
|
|
|
|
|
|
||||||||||||||
|
Construction
|
—
|
|
2,000
|
|
720
|
|
2,720
|
|
166,469
|
|
169,189
|
|
—
|
|
||||||||||||||
|
Single and multi-family
|
178
|
|
156
|
|
458
|
|
792
|
|
139,258
|
|
140,050
|
|
—
|
|
||||||||||||||
|
Other commercial real estate
|
692
|
|
705
|
|
9,383
|
|
10,780
|
|
1,020,057
|
|
1,030,837
|
|
621
|
|
||||||||||||||
|
Total
|
870
|
|
2,861
|
|
10,561
|
|
14,292
|
|
1,325,784
|
|
1,340,076
|
|
621
|
|
||||||||||||||
|
Commercial and industrial loans:
|
|
|
|
|
|
|
|
|
|
|
|
|
|
|
||||||||||||||
|
Asset based lending
|
—
|
|
—
|
|
—
|
|
—
|
|
341,246
|
|
341,246
|
|
—
|
|
||||||||||||||
|
Other commercial and industrial loans
|
1,040
|
|
498
|
|
856
|
|
2,394
|
|
409,551
|
|
411,945
|
|
6
|
|
||||||||||||||
|
Total
|
1,040
|
|
498
|
|
856
|
|
2,394
|
|
750,797
|
|
753,191
|
|
6
|
|
||||||||||||||
|
Consumer loans:
|
|
|
|
|
|
|
|
|
|
|
|
|
|
|
||||||||||||||
|
Home equity
|
333
|
|
1,000
|
|
1,387
|
|
2,720
|
|
249,961
|
|
252,681
|
|
230
|
|
||||||||||||||
|
Auto and other
|
831
|
|
65
|
|
315
|
|
1,211
|
|
345,269
|
|
346,480
|
|
10
|
|
||||||||||||||
|
Total
|
1,164
|
|
1,065
|
|
1,702
|
|
3,931
|
|
595,230
|
|
599,161
|
|
240
|
|
||||||||||||||
|
Total
|
$
|
9,320
|
|
$
|
4,980
|
|
$
|
17,172
|
|
$
|
31,472
|
|
$
|
3,887,408
|
|
$
|
3,918,880
|
|
$
|
2,394
|
|
|||||||
23
Acquired Loans
|
(in thousands)
|
30-59 Days
Past Due
|
60-89 Days
Past Due
|
90
Days or Greater Past
Due
|
Total Past
Due
|
Acquired
Credit
Impaired
|
Total Loans
|
Past Due >
90 days and
Accruing
|
|||||||||||||||||||||
|
September 30, 2015
|
|
|
|
|
|
|
|
|
|
|
|
|
|
|
||||||||||||||
|
Residential mortgages:
|
|
|
|
|
|
|
|
|
|
|
|
|
|
|
||||||||||||||
|
1-4 family
|
$
|
1,339
|
|
$
|
322
|
|
$
|
2,101
|
|
$
|
3,762
|
|
$
|
2,647
|
|
$
|
351,104
|
|
$
|
388
|
|
|||||||
|
Construction
|
—
|
|
—
|
|
—
|
|
—
|
|
—
|
|
2,658
|
|
—
|
|
||||||||||||||
|
Total
|
1,339
|
|
322
|
|
2,101
|
|
3,762
|
|
2,647
|
|
353,762
|
|
388
|
|
||||||||||||||
|
Commercial real estate:
|
|
|
|
|
|
|
|
|
|
|
|
|
|
|
||||||||||||||
|
Construction
|
—
|
|
—
|
|
—
|
|
—
|
|
2,038
|
|
43,508
|
|
—
|
|
||||||||||||||
|
Single and multi-family
|
—
|
|
2,556
|
|
130
|
|
2,686
|
|
1,372
|
|
41,042
|
|
—
|
|
||||||||||||||
|
Other commercial real estate
|
728
|
|
—
|
|
1,195
|
|
1,923
|
|
14,200
|
|
357,537
|
|
—
|
|
||||||||||||||
|
Total
|
728
|
|
2,556
|
|
1,325
|
|
4,609
|
|
17,610
|
|
442,087
|
|
—
|
|
||||||||||||||
|
Commercial and industrial loans:
|
|
|
|
|
|
|
|
|
|
|
|
|
|
|
||||||||||||||
|
Asset based lending
|
—
|
|
—
|
|
—
|
|
—
|
|
—
|
|
—
|
|
—
|
|
||||||||||||||
|
Other commercial and industrial loans
|
2,446
|
|
630
|
|
1,137
|
|
4,213
|
|
2,954
|
|
250,143
|
|
624
|
|
||||||||||||||
|
Total
|
2,446
|
|
630
|
|
1,137
|
|
4,213
|
|
2,954
|
|
250,143
|
|
624
|
|
||||||||||||||
|
Consumer loans:
|
|
|
|
|
|
|
|
|
|
|
|
|
|
|
||||||||||||||
|
Home equity
|
299
|
|
335
|
|
785
|
|
1,419
|
|
117
|
|
57,313
|
|
37
|
|
||||||||||||||
|
Auto and other
|
1,179
|
|
189
|
|
892
|
|
2,260
|
|
138
|
|
145,786
|
|
106
|
|
||||||||||||||
|
Total
|
1,478
|
|
524
|
|
1,677
|
|
3,679
|
|
255
|
|
203,099
|
|
143
|
|
||||||||||||||
|
Total
|
$
|
5,991
|
|
$
|
4,032
|
|
$
|
6,240
|
|
$
|
16,263
|
|
$
|
23,466
|
|
$
|
1,249,091
|
|
$
|
1,155
|
|
|||||||
Acquired Loans
|
(in thousands)
|
30-59 Days
Past Due
|
60-89 Days
Past Due
|
90
Days or Greater Past
Due
|
Total Past
Due
|
Acquired
Credit
Impaired
|
Total Loans
|
Past Due >
90 days and
Accruing
|
|||||||||||||||||||||
|
December 31, 2014
|
|
|
|
|
|
|
|
|
|
|
|
|
|
|
||||||||||||||
|
Residential mortgages:
|
|
|
|
|
|
|
|
|
|
|
|
|
|
|
||||||||||||||
|
1-4 family
|
$
|
1,133
|
|
$
|
638
|
|
$
|
1,651
|
|
$
|
3,422
|
|
$
|
375
|
|
$
|
268,734
|
|
$
|
269
|
|
|||||||
|
Construction
|
—
|
|
—
|
|
—
|
|
—
|
|
—
|
|
1,018
|
|
—
|
|
||||||||||||||
|
Total
|
1,133
|
|
638
|
|
1,651
|
|
3,422
|
|
375
|
|
269,752
|
|
269
|
|
||||||||||||||
|
Commercial real estate:
|
|
|
|
|
|
|
—
|
|
|
|
|
|
|
|
||||||||||||||
|
Construction
|
—
|
|
—
|
|
691
|
|
691
|
|
1,296
|
|
4,201
|
|
—
|
|
||||||||||||||
|
Single and multi-family
|
277
|
|
—
|
|
572
|
|
849
|
|
5,477
|
|
53,168
|
|
—
|
|
||||||||||||||
|
Other commercial real estate
|
—
|
|
715
|
|
2,004
|
|
2,719
|
|
5,504
|
|
214,122
|
|
329
|
|
||||||||||||||
|
Total
|
277
|
|
715
|
|
3,267
|
|
4,259
|
|
12,277
|
|
271,491
|
|
329
|
|
||||||||||||||
|
Commercial and industrial loans:
|
|
|
|
|
|
|
|
|
|
|
|
|
|
|
||||||||||||||
|
Asset based lending
|
—
|
|
—
|
|
—
|
|
—
|
|
—
|
|
—
|
|
—
|
|
||||||||||||||
|
Other commercial and industrial loans
|
202
|
|
32
|
|
855
|
|
1,089
|
|
986
|
|
51,175
|
|
—
|
|
||||||||||||||
|
Total
|
202
|
|
32
|
|
855
|
|
1,089
|
|
986
|
|
51,175
|
|
—
|
|
||||||||||||||
|
Consumer loans:
|
|
|
|
|
|
|
|
|
|
|
|
|
|
|
||||||||||||||
|
Home equity
|
176
|
|
95
|
|
1,049
|
|
1,320
|
|
171
|
|
65,951
|
|
466
|
|
||||||||||||||
|
Auto and other
|
1,170
|
|
944
|
|
1,363
|
|
3,477
|
|
—
|
|
103,351
|
|
194
|
|
||||||||||||||
|
Total
|
1,346
|
|
1,039
|
|
2,412
|
|
4,797
|
|
171
|
|
169,302
|
|
660
|
|
||||||||||||||
|
Total
|
$
|
2,958
|
|
$
|
2,424
|
|
$
|
8,185
|
|
$
|
13,567
|
|
$
|
13,809
|
|
$
|
761,720
|
|
$
|
1,258
|
|
|||||||
24
The following is summary information pertaining to non-accrual loans at
September 30, 2015
and
December 31, 2014
:
|
|
September 30, 2015
|
December 31, 2014
|
||||||||||||||||||||||
|
(In thousands)
|
Business
Activities Loans
|
Acquired
Loans (1)
|
Total
|
Business
Activities Loans
|
Acquired
Loans (2)
|
Total
|
||||||||||||||||||
|
Residential mortgages:
|
|
|
|
|
|
|
|
|
|
|
|
|
||||||||||||
|
1-4 family
|
$
|
2,852
|
|
$
|
1,713
|
|
$
|
4,565
|
|
$
|
2,526
|
|
$
|
1,382
|
|
$
|
3,908
|
|
||||||
|
Construction
|
—
|
|
—
|
|
—
|
|
—
|
|
—
|
|
—
|
|
||||||||||||
|
Total
|
2,852
|
|
1,713
|
|
4,565
|
|
2,526
|
|
1,382
|
|
3,908
|
|
||||||||||||
|
Commercial real estate:
|
|
|
|
|
|
|
|
|
|
|
|
|
||||||||||||
|
Construction
|
59
|
|
—
|
|
59
|
|
720
|
|
—
|
|
720
|
|
||||||||||||
|
Single and multi-family
|
—
|
|
130
|
|
130
|
|
458
|
|
141
|
|
599
|
|
||||||||||||
|
Other commercial real estate
|
4,309
|
|
1,195
|
|
5,504
|
|
8,762
|
|
1,675
|
|
10,437
|
|
||||||||||||
|
Total
|
4,368
|
|
1,325
|
|
5,693
|
|
9,940
|
|
1,816
|
|
11,756
|
|
||||||||||||
|
Commercial and industrial loans:
|
|
|
|
|
|
|
|
|
|
|
|
|
||||||||||||
|
Other commercial and industrial loans
|
7,579
|
|
475
|
|
8,054
|
|
850
|
|
811
|
|
1,661
|
|
||||||||||||
|
Total
|
7,579
|
|
475
|
|
8,054
|
|
850
|
|
811
|
|
1,661
|
|
||||||||||||
|
Consumer loans:
|
|
|
|
|
|
|
|
|
|
|
|
|
||||||||||||
|
Home equity
|
1,386
|
|
748
|
|
2,134
|
|
1,157
|
|
583
|
|
1,740
|
|
||||||||||||
|
Auto and other
|
466
|
|
786
|
|
1,252
|
|
305
|
|
1,169
|
|
1,474
|
|
||||||||||||
|
Total
|
1,852
|
|
1,534
|
|
3,386
|
|
1,462
|
|
1,752
|
|
3,214
|
|
||||||||||||
|
Total non-accrual loans
|
$
|
16,651
|
|
$
|
5,047
|
|
$
|
21,698
|
|
$
|
14,778
|
|
$
|
5,761
|
|
$
|
20,539
|
|
||||||
_______________________________________
(1) At quarter end
September 30, 2015
, acquired credit impaired loans accounted for
$38.0 thousand
of non-accrual loans that are not presented in the above table.
(2) At
December 31, 2014
, acquired credit impaired loans accounted for
$1.2 million
of non-accrual loans that are not presented in the above table.
25
Loans evaluated for impairment as of
September 30, 2015
and
December 31, 2014
were as follows:
Business Activities Loans
|
(In thousands)
|
Residential
mortgages
|
Commercial
real estate
|
Commercial and
industrial loans
|
Consumer
|
Total
|
|||||||||||||||
|
September 30, 2015
|
|
|
|
|
|
|
|
|
|
|
||||||||||
|
Loans receivable:
|
|
|
|
|
|
|
|
|
|
|
||||||||||
|
Balance at end of period
|
|
|
|
|
|
|
|
|
|
|
||||||||||
|
Individually evaluated for impairment
|
$
|
3,440
|
|
$
|
13,082
|
|
$
|
7,234
|
|
$
|
596
|
|
$
|
24,352
|
|
|||||
|
Collectively evaluated
|
1,412,069
|
|
1,566,131
|
|
807,948
|
|
605,339
|
|
4,391,487
|
|
||||||||||
|
Total
|
$
|
1,415,509
|
|
$
|
1,579,213
|
|
$
|
815,182
|
|
$
|
605,935
|
|
$
|
4,415,839
|
|
|||||
Business Activities Loans
|
(In thousands)
|
Residential
mortgages
|
Commercial
real estate
|
Commercial and
industrial loans
|
Consumer
|
Total
|
|||||||||||||||
|
December 31, 2014
|
|
|
|
|
|
|
|
|
|
|
||||||||||
|
Loans receivable:
|
|
|
|
|
|
|
|
|
|
|
||||||||||
|
Balance at end of year
|
|
|
|
|
|
|
|
|
|
|
||||||||||
|
Individually evaluated for impairment
|
$
|
3,238
|
|
$
|
22,015
|
|
$
|
743
|
|
$
|
452
|
|
$
|
26,448
|
|
|||||
|
Collectively evaluated for impairment
|
1,223,214
|
|
1,318,061
|
|
752,448
|
|
598,709
|
|
3,892,432
|
|
||||||||||
|
Total
|
$
|
1,226,452
|
|
$
|
1,340,076
|
|
$
|
753,191
|
|
$
|
599,161
|
|
$
|
3,918,880
|
|
|||||
Acquired Loans
|
(In thousands)
|
Residential
mortgages
|
Commercial
real estate
|
Commercial and
industrial loans
|
Consumer
|
Total
|
|||||||||||||||
|
September 30, 2015
|
|
|
|
|
|
|
|
|
|
|
||||||||||
|
Loans receivable:
|
|
|
|
|
|
|
|
|
|
|
||||||||||
|
Balance at end of Period
|
|
|
|
|
|
|
|
|
|
|
||||||||||
|
Individually evaluated for impairment
|
$
|
734
|
|
$
|
5,841
|
|
$
|
—
|
|
$
|
543
|
|
$
|
7,118
|
|
|||||
|
Purchased credit-impaired loans
|
2,647
|
|
17,610
|
|
2,954
|
|
255
|
|
23,466
|
|
||||||||||
|
Collectively evaluated
|
$
|
350,381
|
|
$
|
418,636
|
|
$
|
247,189
|
|
$
|
202,301
|
|
$
|
1,218,507
|
|
|||||
|
Total
|
$
|
353,762
|
|
$
|
442,087
|
|
$
|
250,143
|
|
$
|
203,099
|
|
$
|
1,249,091
|
|
|||||
Acquired Loans
|
(In thousands)
|
Residential
mortgages
|
Commercial
real estate
|
Commercial and
industrial loans
|
Consumer
|
Total
|
|||||||||||||||
|
December 31, 2014
|
|
|
|
|
|
|
|
|
|
|
||||||||||
|
Loans receivable:
|
|
|
|
|
|
|
|
|
|
|
||||||||||
|
Balance at end of year
|
|
|
|
|
|
|
|
|
|
|
||||||||||
|
Individually evaluated for impairment
|
$
|
695
|
|
$
|
4,515
|
|
$
|
39
|
|
$
|
199
|
|
$
|
5,448
|
|
|||||
|
Purchased credit-impaired loans
|
375
|
|
12,277
|
|
986
|
|
171
|
|
13,809
|
|
||||||||||
|
Collectively evaluated for impairment
|
$
|
268,682
|
|
$
|
254,699
|
|
$
|
50,150
|
|
$
|
168,932
|
|
$
|
742,463
|
|
|||||
|
Total
|
$
|
269,752
|
|
$
|
271,491
|
|
$
|
51,175
|
|
$
|
169,302
|
|
$
|
761,720
|
|
|||||
26
The following is a summary of impaired loans at
September 30, 2015
:
Business Activities Loans
|
|
September 30, 2015
|
|||||||||||
|
(In thousands)
|
Recorded Investment
|
Unpaid Principal
Balance
|
Related Allowance
|
|||||||||
|
With no related allowance:
|
|
|
|
|
|
|
||||||
|
Residential mortgages - 1-4 family
|
$
|
1,111
|
|
$
|
1,111
|
|
$
|
—
|
|
|||
|
Commercial real estate - construction
|
2,000
|
|
2,000
|
|
—
|
|
||||||
|
Commercial real estate - single and multifamily
|
—
|
|
—
|
|
—
|
|
||||||
|
Other commercial real estate loans
|
3,529
|
|
3,529
|
|
—
|
|
||||||
|
Other commercial and industrial loans
|
115
|
|
115
|
|
—
|
|
||||||
|
Consumer - home equity
|
237
|
|
237
|
|
—
|
|
||||||
|
Consumer - other
|
1
|
|
1
|
|
—
|
|
||||||
|
With an allowance recorded:
|
|
|
|
|
|
|
||||||
|
Residential mortgages - 1-4 family
|
$
|
2,081
|
|
$
|
2,329
|
|
$
|
248
|
|
|||
|
Commercial real estate - construction
|
—
|
|
—
|
|
—
|
|
||||||
|
Commercial real estate - single and multifamily
|
—
|
|
—
|
|
—
|
|
||||||
|
Other commercial real estate loans
|
7,143
|
|
7,553
|
|
410
|
|
||||||
|
Other commercial and industrial loans
|
6,087
|
|
7,119
|
|
1,032
|
|
||||||
|
Consumer - home equity
|
226
|
|
248
|
|
22
|
|
||||||
|
Consumer - other
|
94
|
|
110
|
|
16
|
|
||||||
|
Total
|
|
|
|
|
|
|
||||||
|
Residential mortgages
|
$
|
3,192
|
|
$
|
3,440
|
|
$
|
248
|
|
|||
|
Commercial real estate
|
12,672
|
|
13,082
|
|
410
|
|
||||||
|
Commercial and industrial loans
|
6,202
|
|
7,234
|
|
1,032
|
|
||||||
|
Consumer
|
558
|
|
596
|
|
38
|
|
||||||
|
Total impaired loans
|
$
|
22,624
|
|
$
|
24,352
|
|
$
|
1,728
|
|
|||
27
Acquired Loans
|
|
September 30, 2015
|
|||||||||||
|
(In thousands)
|
Recorded Investment
|
Unpaid Principal
Balance
|
Related Allowance
|
|||||||||
|
With no related allowance:
|
|
|
|
|
|
|
||||||
|
Residential mortgages - 1-4 family
|
$
|
313
|
|
$
|
313
|
|
$
|
—
|
|
|||
|
Commercial real estate - construction
|
—
|
|
—
|
|
—
|
|
||||||
|
Commercial real estate - single and multifamily
|
—
|
|
—
|
|
—
|
|
||||||
|
Other commercial real estate loans
|
722
|
|
722
|
|
—
|
|
||||||
|
Other commercial and industrial loans
|
—
|
|
—
|
|
—
|
|
||||||
|
Consumer - home equity
|
—
|
|
—
|
|
—
|
|
||||||
|
With an allowance recorded:
|
|
|
|
|
|
|
||||||
|
Residential mortgages - 1-4 family
|
$
|
373
|
|
$
|
421
|
|
$
|
48
|
|
|||
|
Commercial real estate - construction
|
—
|
|
—
|
|
—
|
|
||||||
|
Commercial real estate - single and multifamily
|
2,868
|
|
2,910
|
|
42
|
|
||||||
|
Other commercial real estate loans
|
2,051
|
|
2,208
|
|
157
|
|
||||||
|
Consumer - home equity
|
329
|
|
367
|
|
38
|
|
||||||
|
Consumer - other
|
144
|
|
177
|
|
33
|
|
||||||
|
Total
|
|
|
|
|
|
|
||||||
|
Residential mortgages
|
$
|
686
|
|
$
|
734
|
|
$
|
48
|
|
|||
|
Commercial real estate
|
5,641
|
|
5,840
|
|
199
|
|
||||||
|
Commercial and industrial loans
|
—
|
|
—
|
|
—
|
|
||||||
|
Consumer
|
473
|
|
544
|
|
71
|
|
||||||
|
Total impaired loans
|
$
|
6,800
|
|
$
|
7,118
|
|
$
|
318
|
|
|||
28
The following is a summary of impaired loans at
December 31, 2014
:
Business Activities Loans
|
|
December 31, 2014
|
|||||||||||
|
(In thousands)
|
Recorded Investment
|
Unpaid Principal
Balance
|
Related Allowance
|
|||||||||
|
With no related allowance:
|
|
|
|
|
|
|
||||||
|
Residential mortgages - 1-4 family
|
$
|
2,528
|
|
$
|
2,528
|
|
$
|
—
|
|
|||
|
Commercial real estate - construction
|
16,990
|
|
16,990
|
|
—
|
|
||||||
|
Commercial real estate - single and multifamily
|
—
|
|
—
|
|
—
|
|
||||||
|
Other commercial real estate loans
|
102
|
|
102
|
|
—
|
|
||||||
|
Other commercial and industrial loans
|
743
|
|
743
|
|
—
|
|
||||||
|
Consumer - home equity
|
87
|
|
87
|
|
—
|
|
||||||
|
Consumer - other
|
—
|
|
—
|
|
—
|
|
||||||
|
With an allowance recorded:
|
|
|
|
|
|
|
||||||
|
Residential mortgages - 1-4 family
|
$
|
555
|
|
$
|
710
|
|
$
|
155
|
|
|||
|
Commercial real estate - construction
|
3,511
|
|
4,431
|
|
920
|
|
||||||
|
Commercial real estate - single and multifamily
|
490
|
|
492
|
|
2
|
|
||||||
|
Other commercial real estate loans
|
—
|
|
—
|
|
—
|
|
||||||
|
Other commercial and industrial loans
|
—
|
|
—
|
|
—
|
|
||||||
|
Consumer - home equity
|
194
|
|
248
|
|
54
|
|
||||||
|
Consumer - other
|
105
|
|
117
|
|
12
|
|
||||||
|
Total
|
|
|
|
|
|
|
||||||
|
Residential mortgages
|
$
|
3,083
|
|
$
|
3,238
|
|
$
|
155
|
|
|||
|
Commercial real estate
|
21,093
|
|
22,015
|
|
922
|
|
||||||
|
Commercial and industrial loans
|
743
|
|
743
|
|
—
|
|
||||||
|
Consumer
|
386
|
|
452
|
|
66
|
|
||||||
|
Total impaired loans
|
$
|
25,305
|
|
$
|
26,448
|
|
$
|
1,143
|
|
|||
29
Acquired Loans
|
|
December 31, 2014
|
|||||||||||
|
(In thousands)
|
Recorded Investment
|
Unpaid Principal
Balance
|
Related Allowance
|
|||||||||
|
With no related allowance:
|
|
|
|
|
|
|
||||||
|
Residential mortgages - 1-4 family
|
$
|
189
|
|
$
|
189
|
|
$
|
—
|
|
|||
|
Other commercial real estate loans
|
5,206
|
|
5,206
|
|
—
|
|
||||||
|
Other commercial and industrial loans
|
39
|
|
39
|
|
—
|
|
||||||
|
Consumer - home equity
|
—
|
|
—
|
|
—
|
|
||||||
|
With an allowance recorded:
|
|
|
|
|
|
|
||||||
|
Residential mortgages - 1-4 family
|
$
|
458
|
|
$
|
506
|
|
$
|
48
|
|
|||
|
Other commercial real estate loans
|
383
|
|
431
|
|
48
|
|
||||||
|
Consumer - home equity
|
124
|
|
199
|
|
75
|
|
||||||
|
Total
|
|
|
|
|
|
|
||||||
|
Residential mortgages
|
$
|
647
|
|
$
|
695
|
|
$
|
48
|
|
|||
|
Other commercial real estate loans
|
5,589
|
|
5,637
|
|
48
|
|
||||||
|
Other commercial and industrial loans
|
39
|
|
39
|
|
—
|
|
||||||
|
Consumer - home equity
|
124
|
|
199
|
|
75
|
|
||||||
|
Total impaired loans
|
$
|
6,399
|
|
$
|
6,570
|
|
$
|
171
|
|
|||
The following is a summary of the average recorded investment and interest income recognized on impaired loans as of
September 30, 2015
and
2014
:
Business Activities Loans
|
|
Nine Months Ended September 30, 2015
|
Nine Months Ended September 30, 2014
|
||||||||||||||
|
(in thousands)
|
Average Recorded
Investment
|
Cash Basis Interest
Income Recognized
|
Average Recorded
Investment
|
Cash Basis Interest
Income Recognized
|
||||||||||||
|
With no related allowance:
|
|
|
|
|
|
|
|
|
||||||||
|
Residential mortgages - 1-4 family
|
$
|
1,264
|
|
$
|
32
|
|
$
|
4,342
|
|
$
|
140
|
|
||||
|
Commercial real estate - construction
|
2,326
|
|
1
|
|
16,765
|
|
470
|
|
||||||||
|
Commercial real estate - single and multifamily
|
80
|
|
—
|
|
—
|
|
—
|
|
||||||||
|
Other commercial real estate loans
|
9,787
|
|
157
|
|
2,117
|
|
—
|
|
||||||||
|
Commercial and industrial loans
|
234
|
|
7
|
|
1,582
|
|
60
|
|
||||||||
|
Consumer - home equity
|
155
|
|
6
|
|
411
|
|
9
|
|
||||||||
|
Consumer - other
|
—
|
|
—
|
|
122
|
|
3
|
|
||||||||
|
With an allowance recorded:
|
|
|
|
|
|
|
|
|
||||||||
|
Residential mortgages - 1-4 family
|
$
|
1,795
|
|
$
|
60
|
|
$
|
396
|
|
$
|
3
|
|
||||
|
Commercial real estate - construction
|
—
|
|
—
|
|
3,776
|
|
30
|
|
||||||||
|
Commercial real estate - single and multifamily
|
—
|
|
—
|
|
—
|
|
—
|
|
||||||||
|
Other commercial real estate loans
|
7,725
|
|
199
|
|
593
|
|
4
|
|
||||||||
|
Commercial and industrial loans
|
3,610
|
|
103
|
|
—
|
|
|
|
||||||||
|
Consumer - home equity
|
248
|
|
—
|
|
—
|
|
—
|
|
||||||||
|
Consumer - other
|
113
|
|
3
|
|
||||||||||||
|
Total
|
|
|
|
|
|
|
|
|
||||||||
|
Residential mortgages
|
$
|
3,059
|
|
$
|
92
|
|
$
|
4,738
|
|
$
|
143
|
|
||||
|
Commercial real estate
|
19,918
|
|
357
|
|
23,251
|
|
504
|
|
||||||||
|
Commercial and industrial loans
|
3,844
|
|
110
|
|
1,582
|
|
60
|
|
||||||||
|
Consumer loans
|
516
|
|
9
|
|
533
|
|
12
|
|
||||||||
|
Total impaired loans
|
$
|
27,337
|
|
$
|
568
|
|
$
|
30,104
|
|
$
|
719
|
|
||||
30
Acquired Loans
|
|
Nine Months Ended September 30, 2015
|
Nine Months Ended September 30, 2014
|
||||||||||||||
|
(in thousands)
|
Average Recorded
Investment
|
Cash Basis Interest
Income Recognized
|
Average Recorded
Investment
|
Cash Basis Interest
Income Recognized
|
||||||||||||
|
With no related allowance:
|
|
|
|
|
|
|
|
|
||||||||
|
Residential mortgages - 1-4 family
|
$
|
423
|
|
$
|
—
|
|
$
|
1,046
|
|
$
|
8
|
|
||||
|
Commercial real estate - construction
|
169
|
|
—
|
|
—
|
|
—
|
|
||||||||
|
Commercial real estate - single and multifamily
|
1,824
|
|
5
|
|
5,575
|
|
146
|
|
||||||||
|
Other commercial real estate loans
|
593
|
|
60
|
|
—
|
|
—
|
|
||||||||
|
Other commercial and industrial loans
|
42
|
|
3
|
|
457
|
|
13
|
|
||||||||
|
Consumer - home equity
|
39
|
|
—
|
|
55
|
|
—
|
|
||||||||
|
Consumer - other
|
—
|
|
—
|
|
—
|
|
—
|
|
||||||||
|
With an allowance recorded:
|
|
|
|
|
|
|
|
|
||||||||
|
Residential mortgages - 1-4 family
|
$
|
409
|
|
$
|
13
|
|
$
|
164
|
|
$
|
4
|
|
||||
|
Commercial real estate - single and multifamily
|
2,878
|
|
82
|
|
—
|
|
—
|
|
||||||||
|
Other commercial real estate loans
|
1,266
|
|
77
|
|
—
|
|
—
|
|
||||||||
|
Other commercial and industrial loans
|
—
|
|
—
|
|
—
|
|
—
|
|
||||||||
|
Consumer - home equity
|
309
|
|
11
|
|
—
|
|
—
|
|
||||||||
|
Consumer - other
|
19
|
|
4
|
|
—
|
|
—
|
|
||||||||
|
Total
|
|
|
|
|
|
|
|
|
||||||||
|
Residential mortgages
|
$
|
832
|
|
$
|
13
|
|
$
|
1,210
|
|
$
|
12
|
|
||||
|
Other commercial real estate loans
|
6,730
|
|
224
|
|
5,575
|
|
146
|
|
||||||||
|
Commercial and industrial loans
|
42
|
|
3
|
|
457
|
|
13
|
|
||||||||
|
Consumer loans
|
367
|
|
15
|
|
55
|
|
—
|
|
||||||||
|
Total impaired loans
|
$
|
7,971
|
|
$
|
255
|
|
$
|
7,297
|
|
$
|
171
|
|
||||
Troubled Debt Restructuring Loans
The Company’s loan portfolio also includes certain loans that have been modified in a Troubled Debt Restructuring (TDR), where economic concessions have been granted to borrowers who have experienced or are expected to experience financial difficulties. These concessions typically result from the Company’s loss mitigation activities and could include reductions in the interest rate, payment extensions, forgiveness of principal, forbearance or other actions. Certain TDRs are classified as nonperforming at the time of restructure and may only be returned to performing status after considering the borrower’s sustained repayment performance for a reasonable period, generally
six months
. TDRs are evaluated individually for impairment and may result in a specific allowance amount allocated to an individual loan.
31
The following tables include the recorded investment and number of modifications identified during the
three and nine
months ended
September 30, 2015
and for the
three and nine
months ended September 30, 2014, respectively. The table includes the recorded investment in the loans prior to a modification and also the recorded investment in the loans after the loans were restructured. The modifications for the
three and nine
months ending
September 30, 2015
were attributable to interest rate concessions, maturity date extensions, modified payment terms, reamortization, and accelerated maturity. The modifications for the
three and nine
months ending
September 30, 2014
were attributable to concessions granted as ordered by bankruptcy court, interest rate concessions and maturity date extensions.
|
Three Months Ended September 30, 2015
|
|||||||||||
|
(Dollars in thousands)
|
Number of
Modifications |
Pre-Modification
Outstanding Recorded Investment |
Post-Modification
Outstanding Recorded Investment |
||||||||
|
Troubled Debt Restructurings
|
|
|
|
|
|
|
|||||
|
Commercial - Construction
|
—
|
|
$
|
—
|
|
$
|
—
|
|
|||
|
Commercial - Single and multifamily
|
2
|
|
307
|
|
307
|
|
|||||
|
Commercial - Other
|
—
|
|
—
|
|
—
|
|
|||||
|
Commercial and industrial - Other
|
—
|
|
—
|
|
—
|
|
|||||
|
Total
|
2
|
|
307
|
|
307
|
|
|||||
|
Nine Months Ended September 30, 2015
|
|||||||||||
|
(Dollars in thousands)
|
Number of
Modifications |
Pre-Modification
Outstanding Recorded Investment |
Post-Modification
Outstanding Recorded Investment |
||||||||
|
Troubled Debt Restructurings
|
|
|
|
|
|
|
|||||
|
Commercial - Construction
|
1
|
|
$
|
2,000
|
|
$
|
2,000
|
|
|||
|
Commercial - Single and multifamily
|
2
|
|
307
|
|
307
|
|
|||||
|
Commercial - Other
|
2
|
|
$
|
1,694
|
|
$
|
1,694
|
|
|||
|
Commercial and industrial - Other
|
5
|
|
8,192
|
|
8,192
|
|
|||||
|
Total
|
10
|
|
12,193
|
|
12,193
|
|
|||||
|
Three Months Ended September 30, 2014
|
|||||||||||
|
(Dollars in thousands)
|
Number of
Modifications |
Pre-Modification
Outstanding Recorded Investment |
Post-Modification
Outstanding Recorded Investment |
||||||||
|
Troubled Debt Restructurings
|
|
|
|
|
|
|
|||||
|
Residential - 1-4 Family
|
2
|
|
$
|
231
|
|
$
|
232
|
|
|||
|
Commercial - single and multifamily
|
—
|
|
—
|
|
—
|
|
|||||
|
Commercial - other
|
1
|
|
1,596
|
|
1,596
|
|
|||||
|
Total
|
3
|
|
$
|
1,827
|
|
$
|
1,828
|
|
|||
|
Nine Months Ended September 30, 2014
|
|||||||||||
|
(Dollars in thousands)
|
Number of
Modifications |
Pre-Modification
Outstanding Recorded Investment |
Post-Modification
Outstanding Recorded Investment |
||||||||
|
Troubled Debt Restructurings
|
|
|
|
|
|
|
|||||
|
Residential - 1-4 Family
|
5
|
|
$
|
600
|
|
$
|
598
|
|
|||
|
Commercial - single and multifamily
|
1
|
|
623
|
|
623
|
|
|||||
|
Commercial - other
|
7
|
|
6,400
|
|
6,400
|
|
|||||
|
Total
|
13
|
|
$
|
7,623
|
|
$
|
7,621
|
|
|||
32
The following table discloses the recorded investment and number of modifications for TDRs within the last three and nine months where a concession has been made, that then defaulted in the respective reporting period.
|
Modifications that Subsequently Defaulted
|
||||||
|
Three Months Ended September 30, 2015
|
||||||
|
|
Number of Contracts
|
Recorded Investment
|
||||
|
Troubled Debt Restructurings
|
|
|
|
|
||
|
Commercial and industrial - Other
|
2
|
|
$
|
5,742
|
|
|
|
Modifications that Subsequently Defaulted
|
||||||
|
Nine Months Ended September 30, 2015
|
||||||
|
|
Number of Contracts
|
Recorded Investment
|
||||
|
Troubled Debt Restructurings
|
|
|
|
|
||
|
Commercial - Other
|
1
|
|
$
|
668
|
|
|
|
Commercial and industrial - Other
|
2
|
|
$
|
5,742
|
|
|
|
Modifications that Subsequently Defaulted
|
||||||
|
Three Months Ended September 30, 2014
|
||||||
|
|
Number of Contracts
|
Recorded Investment
|
||||
|
Troubled Debt Restructurings
|
|
|
|
|
||
|
Commercial - Other
|
—
|
|
$
|
—
|
|
|
|
Modifications that Subsequently Defaulted
|
||||||
|
Nine Months Ended September 30, 2014
|
||||||
|
|
Number of Contracts
|
Recorded Investment
|
||||
|
Troubled Debt Restructurings
|
|
|
|
|
||
|
Commercial - Other
|
2
|
|
$
|
158
|
|
|
The following table presents the Company’s TDR activity for the
three and nine
months ended
September 30, 2015
and
2014
:
|
Three Months Ended September 30,
|
||||||||
|
(In thousands)
|
2015
|
2014
|
||||||
|
Balance at beginning of the period
|
$
|
25,716
|
|
$
|
15,113
|
|
||
|
Principal payments
|
(1,538
|
)
|
(339
|
)
|
||||
|
TDR status change (1)
|
—
|
|
(245
|
)
|
||||
|
Other reductions/increases (2)
|
(69
|
)
|
—
|
|
||||
|
Newly identified TDRs
|
307
|
|
1,828
|
|
||||
|
Balance at end of the period
|
$
|
24,416
|
|
$
|
16,357
|
|
||
|
Nine Months Ended September 30,
|
||||||||
|
(In thousands)
|
2015
|
2014
|
||||||
|
Balance at beginning of the period
|
$
|
16,714
|
|
$
|
10,822
|
|
||
|
Principal payments
|
(2,629
|
)
|
(1,299
|
)
|
||||
|
TDR status change (1)
|
—
|
|
(886
|
)
|
||||
|
Other reductions/increases (2)
|
(1,862
|
)
|
99
|
|
||||
|
Newly identified TDRs
|
12,193
|
|
7,621
|
|
||||
|
Balance at end of the period
|
$
|
24,416
|
|
$
|
16,357
|
|
||
33
_______________________________________
(1)
TDR status change classification represents TDR loans with a specified interest rate equal to or greater than the rate that the Company was willing to accept at the time of the restructuring for a new loan with comparable risk and the loan was on current payment status and not impaired based on the terms specified by the restructuring agreement.
(2)
Other reductions classification consists of transfer to other real estate owned and charge-offs and advances to loans.
The evaluation of certain loans individually for specific impairment includes loans that were previously classified as TDRs or continue to be classified as TDRs.
As of
September 30, 2015
, the Company maintained foreclosed residential real estate property with a fair value of
$785 thousand
. Additionally, residential mortgage loans collateralized by real estate property that are in the process of foreclosure totaled
$6.2 million
. As of
December 31, 2014
, foreclosed residential real estate property totaled
$1.3 million
.
Activity in the allowance for loan losses for the
nine
months ended
September 30, 2015
and
2014
was as follows:
|
Business Activities Loans
(In thousands)
|
Residential
mortgages
|
Commercial
real estate
|
Commercial and
industrial loans
|
Consumer
|
Unallocated
|
Total
|
||||||||||||||||||
|
September 30, 2015
|
|
|
|
|
|
|
|
|
|
|
|
|
||||||||||||
|
Balance at beginning of period
|
$
|
6,836
|
|
$
|
14,690
|
|
$
|
5,206
|
|
$
|
5,928
|
|
$
|
135
|
|
$
|
32,795
|
|
||||||
|
Charged-off loans
|
762
|
|
5,751
|
|
1,288
|
|
815
|
|
—
|
|
8,616
|
|
||||||||||||
|
Recoveries on charged-off loans
|
141
|
|
146
|
|
160
|
|
213
|
|
—
|
|
660
|
|
||||||||||||
|
Provision/(releases) for loan losses
|
1,155
|
|
5,176
|
|
3,955
|
|
(398
|
)
|
(164
|
)
|
9,724
|
|
||||||||||||
|
Balance at end of period
|
$
|
7,370
|
|
$
|
14,261
|
|
$
|
8,033
|
|
$
|
4,928
|
|
$
|
(29
|
)
|
$
|
34,563
|
|
||||||
|
Individually evaluated for impairment
|
248
|
|
410
|
|
1,032
|
|
38
|
|
—
|
|
1,728
|
|
||||||||||||
|
Collectively evaluated
|
7,122
|
|
13,851
|
|
7,001
|
|
4,890
|
|
(29
|
)
|
32,835
|
|
||||||||||||
|
Total
|
$
|
7,370
|
|
$
|
14,261
|
|
$
|
8,033
|
|
$
|
4,928
|
|
$
|
(29
|
)
|
$
|
34,563
|
|
||||||
|
Business Activities Loans
(In thousands)
|
Residential
mortgages
|
Commercial
real estate
|
Commercial and
industrial loans
|
Consumer
|
Unallocated
|
Total
|
||||||||||||||||||
|
September 30, 2014
|
|
|
|
|
|
|
|
|
|
|
|
|
||||||||||||
|
Balance at beginning of period
|
$
|
6,937
|
|
$
|
13,705
|
|
$
|
5,173
|
|
$
|
3,644
|
|
$
|
68
|
|
$
|
29,527
|
|
||||||
|
Charged-off loans
|
1,253
|
|
2,327
|
|
2,007
|
|
806
|
|
—
|
|
6,393
|
|
||||||||||||
|
Recoveries on charged-off loans
|
118
|
|
8
|
|
87
|
|
229
|
|
—
|
|
442
|
|
||||||||||||
|
Provision/(releases) for loan losses
|
(224
|
)
|
4,966
|
|
1,534
|
|
2,278
|
|
(26
|
)
|
8,528
|
|
||||||||||||
|
Balance at end of period
|
$
|
5,578
|
|
$
|
16,352
|
|
$
|
4,787
|
|
$
|
5,345
|
|
$
|
42
|
|
$
|
32,104
|
|
||||||
|
Individually evaluated for impairment
|
30
|
|
2,409
|
|
312
|
|
—
|
|
—
|
|
2,751
|
|
||||||||||||
|
Collectively evaluated
|
5,548
|
|
13,943
|
|
4,475
|
|
5,345
|
|
42
|
|
29,353
|
|
||||||||||||
|
Total
|
$
|
5,578
|
|
$
|
16,352
|
|
$
|
4,787
|
|
$
|
5,345
|
|
$
|
42
|
|
$
|
32,104
|
|
||||||
34
|
Acquired Loans
(In thousands)
|
Residential
mortgages
|
Commercial
real estate
|
Commercial and
industrial loans
|
Consumer
|
Unallocated
|
Total
|
||||||||||||||||||
|
September 30, 2015
|
|
|
|
|
|
|
|
|
|
|
|
|
||||||||||||
|
Balance at beginning of period
|
$
|
615
|
|
$
|
790
|
|
$
|
1,093
|
|
$
|
369
|
|
$
|
—
|
|
$
|
2,867
|
|
||||||
|
Charged-off loans
|
441
|
|
625
|
|
654
|
|
814
|
|
—
|
|
2,534
|
|
||||||||||||
|
Recoveries on charged-off loans
|
42
|
|
418
|
|
186
|
|
67
|
|
—
|
|
713
|
|
||||||||||||
|
Provision for loan losses
|
709
|
|
936
|
|
27
|
|
899
|
|
—
|
|
2,571
|
|
||||||||||||
|
Balance at end of period
|
$
|
925
|
|
$
|
1,519
|
|
$
|
652
|
|
$
|
521
|
|
$
|
—
|
|
$
|
3,617
|
|
||||||
|
Individually evaluated for impairment
|
48
|
|
199
|
|
—
|
|
71
|
|
—
|
|
318
|
|
||||||||||||
|
Purchased credit-impaired loans
|
—
|
|
—
|
|
—
|
|
—
|
|
—
|
|
—
|
|
||||||||||||
|
Collectively evaluated
|
877
|
|
1,320
|
|
652
|
|
450
|
|
—
|
|
3,299
|
|
||||||||||||
|
Total
|
$
|
925
|
|
$
|
1,519
|
|
$
|
652
|
|
$
|
521
|
|
$
|
—
|
|
$
|
3,617
|
|
||||||
|
Acquired Loans
(In thousands)
|
Residential
mortgages
|
Commercial
real estate
|
Commercial and
industrial loans
|
Consumer
|
Unallocated
|
Total
|
||||||||||||||||||
|
September 30, 2014
|
|
|
|
|
|
|
|
|
|
|
|
|
||||||||||||
|
Balance at beginning of period
|
$
|
625
|
|
$
|
2,339
|
|
$
|
597
|
|
$
|
235
|
|
$
|
—
|
|
$
|
3,796
|
|
||||||
|
Charged-off loans
|
1,087
|
|
1,287
|
|
422
|
|
1,004
|
|
—
|
|
3,800
|
|
||||||||||||
|
Recoveries on charged-off loans
|
171
|
|
1
|
|
101
|
|
51
|
|
—
|
|
324
|
|
||||||||||||
|
Provision for loan losses
|
818
|
|
5
|
|
725
|
|
994
|
|
—
|
|
2,542
|
|
||||||||||||
|
Balance at end of period
|
$
|
527
|
|
$
|
1,058
|
|
$
|
1,001
|
|
$
|
276
|
|
$
|
—
|
|
$
|
2,862
|
|
||||||
|
Individually evaluated for impairment
|
—
|
|
—
|
|
—
|
|
—
|
|
—
|
|
—
|
|
||||||||||||
|
Purchased credit-impaired loans
|
—
|
|
—
|
|
—
|
|
—
|
|
—
|
|
—
|
|
||||||||||||
|
Collectively evaluated
|
527
|
|
1,058
|
|
1,001
|
|
276
|
|
—
|
|
2,862
|
|
||||||||||||
|
Total
|
$
|
527
|
|
$
|
1,058
|
|
$
|
1,001
|
|
$
|
276
|
|
$
|
—
|
|
$
|
2,862
|
|
||||||
Credit Quality Information
Business Activities Loans Credit Quality Analysis
The Company monitors the credit quality of its portfolio by using internal risk ratings that are based on regulatory guidance. Loans that are given a Pass rating are not considered a problem credit. Loans that are classified as Special Mention loans are considered to have potential credit problems and are evaluated closely by management. Substandard and non-accruing loans are loans for which a definitive weakness has been identified and which may make full collection of contractual cash flows questionable. Doubtful loans are those with identified weaknesses that make full collection of contractual cash flows, on the basis of currently existing facts, conditions, and values, highly questionable and improbable. The Company assigns an internal risk rating at origination and reviews the rating annually, semiannually or quarterly depending on the risk rating. The rating is also reassessed at any point in time when management becomes aware of information that may affect the borrower’s ability to fulfill their obligations.
The Company risk rates its residential mortgages, including 1-4 family and residential construction loans, based on a
three
rating system: Pass, Special Mention and Substandard. Loans that are current within
59
days are rated Pass. Residential mortgages that are
60
-
89
days delinquent are rated Special Mention. Loans delinquent for
90
days or greater are rated Substandard and generally placed on non-accrual status. Home equity loans are risk rated based on the same rating system as the Company’s residential mortgages.
Ratings for other consumer loans, including auto loans, are based on a
two
rating system. Loans that are current within
119
days are rated Performing while loans delinquent for
120
days or more are rated Non-performing. Other consumer loans are placed on non-accrual at such time as they become Non-performing.
35
Acquired Loans Credit Quality Analysis
Upon acquiring a loan portfolio, our internal loan review function assigns risk ratings to the acquired loans, utilizing the same methodology as it does with business activities loans. This may differ from the risk rating policy of the predecessor bank. Loans which are rated Substandard or worse according to the rating process outlined below are deemed to be credit impaired loans accounted for under ASC 310-30, regardless of whether they are classified as performing or non-performing.
The Bank utilizes an
eleven
grade internal loan rating system for each of its acquired commercial real estate, construction and commercial loans as outlined in the Credit Quality Information section of this Note. The Company risk rates its residential mortgages, including 1-4 family and residential construction loans, based on a three rating system: Pass, Special Mention and Substandard. Residential mortgages that are current within
59
days are rated Pass. Residential mortgages that are
60
—
89
days delinquent are rated Special Mention. Residential mortgages delinquent for
90
days or greater are rated Substandard. Home equity loans are risk rated based on the same rating system as the Company’s residential mortgages. Other consumer loans are rated based on a two rating system. Other consumer loans that are current within
119
days are rated Performing while loans delinquent for
120
days or more are rated Non-performing. Non-performing other consumer loans are deemed to be credit impaired loans accounted for under ASC 310-30.
The Company subjects loans that do not meet the ASC 310-30 criteria to ASC 450-20 by collectively evaluating these loans for an allowance for loan loss. The Company applies a methodology similar to the methodology prescribed for business activities loans, which includes the application of environmental factors to each category of loans. The methodology to collectively evaluate the acquired loans outside the scope of ASC 310-30 includes the application of a number of environmental factors that reflect management’s best estimate of the level of incremental credit losses that might be recognized given current conditions. This is reviewed as part of the allowance for loan loss adequacy analysis. As the loan portfolio matures and environmental factors change, the loan portfolio will be reassessed each quarter to determine an appropriate reserve allowance.
Additionally, the Company considers the need for an additional reserve for acquired loans accounted for outside of the scope of ASC 310-30 under ASC 310-20. At acquisition date, the Bank determined a fair value mark with credit and interest rate components. Under the Company’s model, the impairment evaluation process involves comparing the carrying value of acquired loans, including the entire unamortized premium or discount, to the recorded reserve allowance. If necessary, the Company books an additional reserve to account for shortfalls identified through this calculation. Fair value marks are not bifurcated when evaluating for impairment.
A decrease in the expected cash flows in subsequent periods requires the establishment of an allowance for loan losses at that time for ASC 310-30 loans. At September 30, 2015, the allowance for loan losses related to acquired loans was
$3.6 million
using the above mentioned criteria.
The Company presented several tables within this footnote separately for business activity loans and acquired loans in order to distinguish the credit performance of the acquired loans from the business activity loans.
The following table presents the Company’s loans by risk rating at September 30, 2015 and December 31, 2014:
Business Activities Loans
Residential Mortgages
Credit Risk Profile by Internally Assigned Grade
|
|
1-4 family
|
Construction
|
Total residential mortgages
|
|||||||||||||||||||||
|
(In thousands)
|
September 30, 2015
|
December 31, 2014
|
September 30, 2015
|
December 31, 2014
|
September 30, 2015
|
December 31, 2014
|
||||||||||||||||||
|
Grade:
|
|
|
|
|
|
|
|
|
|
|
|
|
||||||||||||
|
Pass
|
$
|
1,376,794
|
|
$
|
1,195,209
|
|
$
|
33,441
|
|
$
|
26,634
|
|
$
|
1,410,235
|
|
$
|
1,221,843
|
|
||||||
|
Special mention
|
1,289
|
|
146
|
|
—
|
|
410
|
|
1,289
|
|
556
|
|
||||||||||||
|
Substandard
|
3,985
|
|
4,053
|
|
—
|
|
—
|
|
3,985
|
|
4,053
|
|
||||||||||||
|
Total
|
$
|
1,382,068
|
|
$
|
1,199,408
|
|
$
|
33,441
|
|
$
|
27,044
|
|
$
|
1,415,509
|
|
$
|
1,226,452
|
|
||||||
36
Commercial Real Estate
Credit Risk Profile by Creditworthiness Category
|
|
Construction
|
Single and multi-family
|
Other
|
Total commercial real estate
|
||||||||||||||||||||||||||||
|
(In thousands)
|
September 30, 2015
|
December 31, 2014
|
September 30, 2015
|
December 31, 2014
|
September 30, 2015
|
December 31, 2014
|
September 30, 2015
|
December 31, 2014
|
||||||||||||||||||||||||
|
Grade:
|
|
|
|
|
|
|
|
|
|
|
|
|
|
|
|
|
||||||||||||||||
|
Pass
|
$
|
201,626
|
|
$
|
166,295
|
|
$
|
199,989
|
|
$
|
137,533
|
|
$
|
1,115,729
|
|
$
|
959,836
|
|
$
|
1,517,344
|
|
$
|
1,263,664
|
|
||||||||
|
Special mention
|
—
|
|
—
|
|
—
|
|
—
|
|
4,196
|
|
6,933
|
|
4,196
|
|
6,933
|
|
||||||||||||||||
|
Substandard
|
2,232
|
|
2,894
|
|
2,198
|
|
2,517
|
|
53,170
|
|
63,995
|
|
57,600
|
|
69,406
|
|
||||||||||||||||
|
Doubtful
|
—
|
|
—
|
|
—
|
|
—
|
|
73
|
|
73
|
|
73
|
|
73
|
|
||||||||||||||||
|
Total
|
$
|
203,858
|
|
$
|
169,189
|
|
$
|
202,187
|
|
$
|
140,050
|
|
$
|
1,173,168
|
|
$
|
1,030,837
|
|
$
|
1,579,213
|
|
$
|
1,340,076
|
|
||||||||
Commercial and Industrial Loans
Credit Risk Profile by Creditworthiness Category
|
|
Asset based lending
|
Other
|
Total comm. and industrial loans
|
|||||||||||||||||||||
|
(In thousands)
|
September 30, 2015
|
December 31, 2014
|
September 30, 2015
|
December 31, 2014
|
September 30, 2015
|
December 31, 2014
|
||||||||||||||||||
|
Grade:
|
|
|
|
|
|
|
|
|
|
|
|
|
||||||||||||
|
Pass
|
$
|
330,706
|
|
$
|
341,246
|
|
$
|
447,981
|
|
$
|
404,846
|
|
$
|
778,687
|
|
$
|
746,092
|
|
||||||
|
Special mention
|
—
|
|
—
|
|
22,020
|
|
560
|
|
22,020
|
|
560
|
|
||||||||||||
|
Substandard
|
—
|
|
—
|
|
14,475
|
|
6,539
|
|
14,475
|
|
6,539
|
|
||||||||||||
|
Total
|
$
|
330,706
|
|
$
|
341,246
|
|
$
|
484,476
|
|
$
|
411,945
|
|
$
|
815,182
|
|
$
|
753,191
|
|
||||||
Consumer Loans
Credit Risk Profile Based on Payment Activity
|
|
Home equity
|
Auto and other
|
Total consumer loans
|
|||||||||||||||||||||
|
(In thousands)
|
September 30, 2015
|
December 31, 2014
|
September 30, 2015
|
December 31, 2014
|
September 30, 2015
|
December 31, 2014
|
||||||||||||||||||
|
Performing
|
$
|
297,864
|
|
$
|
251,524
|
|
$
|
306,219
|
|
$
|
346,175
|
|
$
|
604,083
|
|
$
|
597,699
|
|
||||||
|
Nonperforming
|
1,386
|
|
1,157
|
|
466
|
|
305
|
|
1,852
|
|
1,462
|
|
||||||||||||
|
Total
|
$
|
299,250
|
|
$
|
252,681
|
|
$
|
306,685
|
|
$
|
346,480
|
|
$
|
605,935
|
|
$
|
599,161
|
|
||||||
Acquired Loans
Residential Mortgages
Credit Risk Profile by Internally Assigned Grade
|
|
1-4 family
|
Construction
|
Total residential mortgages
|
|||||||||||||||||||||
|
(In thousands)
|
September 30, 2015
|
December 31, 2014
|
September 30, 2015
|
December 31, 2014
|
September 30, 2015
|
December 31, 2014
|
||||||||||||||||||
|
Grade:
|
|
|
|
|
|
|
|
|
|
|
|
|
||||||||||||
|
Pass
|
$
|
347,262
|
|
$
|
266,445
|
|
$
|
2,658
|
|
$
|
1,018
|
|
$
|
349,920
|
|
$
|
267,463
|
|
||||||
|
Special mention
|
510
|
|
638
|
|
—
|
|
—
|
|
510
|
|
638
|
|
||||||||||||
|
Substandard
|
3,332
|
|
1,651
|
|
—
|
|
—
|
|
3,332
|
|
1,651
|
|
||||||||||||
|
Total
|
$
|
351,104
|
|
$
|
268,734
|
|
$
|
2,658
|
|
$
|
1,018
|
|
$
|
353,762
|
|
$
|
269,752
|
|
||||||
37
Commercial Real Estate
Credit Risk Profile by Creditworthiness Category
|
|
Construction
|
Single and multi-family
|
Other
|
Total commercial real estate
|
||||||||||||||||||||||||||||
|
(In thousands)
|
September 30, 2015
|
December 31, 2014
|
September 30, 2015
|
December 31, 2014
|
September 30, 2015
|
December 31, 2014
|
September 30, 2015
|
December 31, 2014
|
||||||||||||||||||||||||
|
Grade:
|
|
|
|
|
|
|
|
|
|
|
|
|
|
|
|
|
||||||||||||||||
|
Pass
|
$
|
41,470
|
|
$
|
2,904
|
|
$
|
33,963
|
|
$
|
44,497
|
|
$
|
336,965
|
|
$
|
195,681
|
|
$
|
412,398
|
|
$
|
243,082
|
|
||||||||
|
Special mention
|
—
|
|
—
|
|
634
|
|
533
|
|
1,334
|
|
4,868
|
|
1,968
|
|
5,401
|
|
||||||||||||||||
|
Substandard
|
2,038
|
|
1,297
|
|
6,445
|
|
8,138
|
|
19,238
|
|
13,573
|
|
27,721
|
|
23,008
|
|
||||||||||||||||
|
Total
|
$
|
43,508
|
|
$
|
4,201
|
|
$
|
41,042
|
|
$
|
53,168
|
|
$
|
357,537
|
|
$
|
214,122
|
|
$
|
442,087
|
|
$
|
271,491
|
|
||||||||
Commercial and Industrial Loans
Credit Risk Profile by Creditworthiness Category
|
|
Asset based lending
|
Other
|
Total comm. and industrial loans
|
|||||||||||||||||||||
|
(In thousands)
|
September 30, 2015
|
December 31, 2014
|
September 30, 2015
|
December 31, 2014
|
September 30, 2015
|
December 31, 2014
|
||||||||||||||||||
|
Grade:
|
|
|
|
|
|
|
|
|
|
|
|
|
||||||||||||
|
Pass
|
$
|
—
|
|
$
|
—
|
|
$
|
240,826
|
|
$
|
45,757
|
|
$
|
240,826
|
|
$
|
45,757
|
|
||||||
|
Special mention
|
—
|
|
—
|
|
4,659
|
|
1,723
|
|
4,659
|
|
1,723
|
|
||||||||||||
|
Substandard
|
—
|
|
—
|
|
4,658
|
|
3,695
|
|
4,658
|
|
3,695
|
|
||||||||||||
|
Doubtful
|
—
|
|
—
|
|
40
|
|
—
|
|
40
|
|
—
|
|
||||||||||||
|
Total
|
$
|
—
|
|
$
|
—
|
|
$
|
250,143
|
|
$
|
51,175
|
|
$
|
250,143
|
|
$
|
51,175
|
|
||||||
Consumer Loans
Credit Risk Profile Based on Payment Activity
|
|
Home equity
|
Auto and other
|
Total consumer loans
|
|||||||||||||||||||||
|
(In thousands)
|
September 30, 2015
|
December 31, 2014
|
September 30, 2015
|
December 31, 2014
|
September 30, 2015
|
December 31, 2014
|
||||||||||||||||||
|
Performing
|
$
|
56,565
|
|
$
|
65,368
|
|
$
|
145,000
|
|
$
|
102,182
|
|
$
|
201,565
|
|
$
|
167,550
|
|
||||||
|
Nonperforming
|
748
|
|
583
|
|
786
|
|
1,169
|
|
1,534
|
|
1,752
|
|
||||||||||||
|
Total
|
$
|
57,313
|
|
$
|
65,951
|
|
$
|
145,786
|
|
$
|
103,351
|
|
$
|
203,099
|
|
$
|
169,302
|
|
||||||
The following table summarizes information about total loans rated Special Mention or lower as of September 30, 2015 and December 31, 2014. The table below includes consumer loans that are special mention and substandard accruing that are classified in the above table as performing based on payment activity.
|
|
September 30, 2015
|
December 31, 2014
|
||||||||||||||||||||||
|
(In thousands)
|
Business
Activities Loans
|
Acquired Loans
|
Total
|
Business
Activities Loans
|
Acquired Loans
|
Total
|
||||||||||||||||||
|
Non-Accrual
|
$
|
16,651
|
|
$
|
5,085
|
|
$
|
21,736
|
|
$
|
14,778
|
|
$
|
6,927
|
|
$
|
21,705
|
|
||||||
|
Substandard Accruing
|
62,370
|
|
32,408
|
|
94,778
|
|
66,995
|
|
23,839
|
|
90,834
|
|
||||||||||||
|
Total Classified
|
79,021
|
|
37,493
|
|
116,514
|
|
81,773
|
|
30,766
|
|
112,539
|
|
||||||||||||
|
Special Mention
|
27,911
|
|
7,665
|
|
35,576
|
|
9,113
|
|
8,800
|
|
17,913
|
|
||||||||||||
|
Total Criticized
|
$
|
106,932
|
|
$
|
45,158
|
|
$
|
152,090
|
|
$
|
90,886
|
|
$
|
39,566
|
|
$
|
130,452
|
|
||||||
38
A summary of time deposits is as follows:
|
(In thousands)
|
September 30,
2015 |
December 31,
2014 |
||||||
|
Time less than $100,000
|
$
|
559,789
|
|
$
|
515,570
|
|
||
|
Time $100,000 or more
|
1,380,424
|
|
940,176
|
|
||||
|
Total time deposits
|
$
|
1,940,213
|
|
$
|
1,455,746
|
|
||
In deposit balances contained on the balance sheet, the Company maintained brokered deposits of
$960.1 million
and
$430.8 million
at
September 30, 2015
and
December 31, 2014
, respectively. These brokered deposit balances include reciprocal deposits of
$181.5 million
and
$9.4 million
at
September 30, 2015
and
December 31, 2014
, respectively.
Borrowed funds at
September 30, 2015
and
December 31, 2014
are summarized, as follows:
|
|
September 30, 2015
|
December 31, 2014
|
||||||||||||
|
|
|
Weighted
|
|
Weighted
|
||||||||||
|
|
|
Average
|
|
Average
|
||||||||||
|
(dollars in thousands)
|
Principal
|
Rate
|
Principal
|
Rate
|
||||||||||
|
Short-term borrowings:
|
|
|
|
|
|
|
|
|
||||||
|
Advances from the FHLBB
|
$
|
1,095,300
|
|
0.30
|
%
|
$
|
890,900
|
|
0.24
|
%
|
||||
|
Other Borrowings
|
—
|
|
—
|
|
10,000
|
|
1.80
|
|
||||||
|
Total short-term borrowings:
|
1,095,300
|
|
0.30
|
|
900,900
|
|
0.23
|
|
||||||
|
Long-term borrowings:
|
|
|
|
|
|
|
|
|
||||||
|
Advances from the FHLBB
|
116,513
|
|
1.93
|
|
61,676
|
|
0.93
|
|
||||||
|
Subordinated borrowings
|
74,334
|
|
7.00
|
|
74,283
|
|
7.00
|
|
||||||
|
Junior subordinated borrowings
|
15,464
|
|
2.18
|
|
15,464
|
|
2.08
|
|
||||||
|
Total long-term borrowings:
|
206,311
|
|
3.78
|
|
151,423
|
|
4.03
|
|
||||||
|
Total
|
$
|
1,301,611
|
|
0.85
|
%
|
$
|
1,052,323
|
|
0.79
|
%
|
||||
Short term debt includes Federal Home Loan Bank of Boston (“FHLBB”) advances with an original maturity of less than one year and a short-term line-of-credit drawdown through a correspondent bank. The Bank also maintains a
$3.0 million
secured line of credit with the FHLBB that bears a daily adjustable rate calculated by the FHLBB. There was
no
outstanding balance on the FHLBB line of credit for the periods ended
September 30, 2015
and
December 31, 2014
.
The Bank is approved to borrow on a short-term basis from the Federal Reserve Bank of Boston as a non-member bank. The Bank has pledged certain loans and securities to the Federal Reserve Bank to support this arrangement.
No
borrowings with the Federal Reserve Bank of Boston took place for the periods ended
September 30, 2015
and
December 31, 2014
.
Long-term FHLBB advances consist of advances with an original maturity of more than one year. The advances outstanding at
September 30, 2015
include callable advances totaling
$11.0 million
, and amortizing advances totaling
$5.1 million
. The advances outstanding at
December 31, 2014
include callable advances totaling
$5.0 million
, and amortizing advances totaling
$5.1 million
. All FHLBB borrowings, including the line of credit, are secured by a blanket security agreement on certain qualified collateral, principally all residential first mortgage loans and certain securities.
39
A summary of maturities of FHLBB advances as of
September 30, 2015
and
December 31, 2014
is as follows:
|
|
September 30, 2015
|
December 31, 2014
|
||||||||||||
|
|
|
Weighted
|
|
Weighted
|
||||||||||
|
|
|
Average
|
|
Average
|
||||||||||
|
(in thousands, except rates)
|
Principal
|
Rate
|
Principal
|
Rate
|
||||||||||
|
Fixed rate advances maturing:
|
|
|
|
|
|
|
|
|
||||||
|
2015
|
$
|
903,308
|
|
0.28
|
%
|
$
|
940,900
|
|
0.24
|
%
|
||||
|
2016
|
252,647
|
|
0.62
|
|
1,519
|
|
0.88
|
|
||||||
|
2017
|
33,618
|
|
2.46
|
|
5,000
|
|
4.33
|
|
||||||
|
2018
|
1,039
|
|
2.62
|
|
—
|
|
—
|
|
||||||
|
2019 and beyond
|
21,201
|
|
2.80
|
|
5,157
|
|
3.85
|
|
||||||
|
Total FHLBB advances
|
$
|
1,211,813
|
|
0.46
|
%
|
$
|
952,576
|
|
0.28
|
%
|
||||
The Company does not have variable-rate FHLB advances for the periods ended
September 30, 2015
and
December 31, 2014
.
In September 2012, the Company issued
fifteen
year subordinated notes in the amount of
$75.0 million
at a discount of
1.15%
. The interest rate is fixed at
6.875%
for the first ten years. After
ten years
, the notes become callable and convert to an interest rate of three-month LIBOR rate plus
511.3%
basis points.
The Company holds
100%
of the common stock of Berkshire Hills Capital Trust I (“Trust I”) which is included in other assets with a cost of
$0.5 million
. The sole asset of Trust I is
$15.5 million
of the Company’s junior subordinated debentures due in 2035. These debentures bear interest at a variable rate equal to LIBOR plus
1.85%
and had a rate of
2.18%
and
2.08%
at
September 30, 2015
and
December 31, 2014
, respectively. The Company has the right to defer payments of interest for up to
five years
on the debentures at any time, or from time to time, with certain limitations, including a restriction on the payment of dividends to stockholders while such interest payments on the debentures have been deferred. The Company has not exercised this right to defer payments. The Company has the right to redeem the debentures at par value. Trust I is considered a variable interest entity for which the Company is not the primary beneficiary. Accordingly, Trust I is not consolidated into the Company’s financial statements.
The actual and required capital ratios were as follows:
|
September 30,
2015 |
Regulatory
Minimum to be Well Capitalized |
December 31,
2014 |
Regulatory
Minimum to be Well Capitalized |
|||||||||
|
Company (consolidated)
|
|
|
|
|
|
|
|
|
||||
|
Total capital to risk weighted assets
|
11.7
|
%
|
10.0
|
%
|
11.4
|
%
|
10.0
|
%
|
||||
|
Common Equity Tier 1 Capital to risk weighted assets
|
9.7
|
|
6.5
|
|
N/A
|
|
N/A
|
|
||||
|
Tier 1 capital to risk weighted assets
|
9.8
|
|
8.0
|
|
9.0
|
|
6.0
|
|
||||
|
Tier 1 capital to average assets
|
7.6
|
|
5.0
|
|
7.0
|
|
5.0
|
|
||||
|
Bank
|
|
|
|
|
|
|
|
|
||||
|
Total capital to risk weighted assets
|
11.0
|
%
|
10.0
|
%
|
10.8
|
%
|
10.0
|
%
|
||||
|
Common Equity Tier 1 Capital to risk weighted assets
|
9.8
|
|
6.5
|
|
N/A
|
|
N/A
|
|
||||
|
Tier 1 capital to risk weighted assets
|
9.8
|
|
8.0
|
|
9.3
|
|
6.0
|
|
||||
|
Tier 1 capital to average assets
|
7.6
|
|
5.0
|
|
7.2
|
|
5.0
|
|
||||
At each date shown, the Company and the Bank met the conditions to be classified as “well capitalized” under the relevant regulatory framework. To be categorized as well capitalized, an institution must maintain minimum total risk-based, Tier 1 risk-based, and Tier 1 leverage ratios as set forth in the table above.
40
Effective January 1, 2015, the Company and the Bank became subject to the Basel III rule that requires the Company and the Bank to assess their Common Equity Tier 1 Capital to risk weighted assets and the Company and the Bank each exceed the minimum to be well capitalized.
Accumulated other comprehensive income (loss)
Components of accumulated other comprehensive income is as follows:
|
(In thousands)
|
September 30,
2015 |
December 31,
2014 |
||||||
|
Other accumulated comprehensive income, before tax:
|
|
|
|
|
||||
|
Net unrealized holding gain on AFS securities
|
$
|
17,467
|
|
$
|
15,993
|
|
||
|
Net (loss) on effective cash flow hedging derivatives
|
(10,785
|
)
|
(3,299
|
)
|
||||
|
Net unrealized holding (loss) on pension plans
|
(3,692
|
)
|
(2,291
|
)
|
||||
|
Income taxes related to items of accumulated other comprehensive income:
|
|
|
|
|
||||
|
Net unrealized holding gain on AFS securities
|
(6,769
|
)
|
(6,077
|
)
|
||||
|
Net (loss) on effective cash flow hedging derivatives
|
4,346
|
|
1,330
|
|
||||
|
Net unrealized holding (loss) on pension plans
|
1,488
|
|
923
|
|
||||
|
Accumulated other comprehensive income
|
$
|
2,055
|
|
$
|
6,579
|
|
||
41
The following table presents the components of other comprehensive income for the
three and nine
months ended
September 30, 2015
and
2014
:
|
(In thousands)
|
Before Tax
|
Tax Effect
|
Net of Tax
|
|||||||||
|
Three Months Ended September 30, 2015
|
|
|
|
|
|
|
||||||
|
Net unrealized holding gains on AFS securities:
|
x
|
|
x
|
|
|
|
||||||
|
Net unrealized gains arising during the period
|
$
|
8,256
|
|
$
|
(3,204
|
)
|
$
|
5,052
|
|
|||
|
Less: reclassification adjustment for (gains) realized in net income
|
(49
|
)
|
18
|
|
(31
|
)
|
||||||
|
Net unrealized holding gain on AFS securities
|
8,207
|
|
(3,186
|
)
|
5,021
|
|
||||||
|
Net loss on cash flow hedging derivatives:
|
|
|
|
|
|
|
||||||
|
Net unrealized loss arising during the period
|
(4,369
|
)
|
1,761
|
|
(2,608
|
)
|
||||||
|
Less: reclassification adjustment for gains (losses) realized in net income
|
—
|
|
—
|
|
—
|
|
||||||
|
Net loss on cash flow hedging derivatives
|
(4,369
|
)
|
1,761
|
|
(2,608
|
)
|
||||||
|
Net unrealized holding loss on pension plans
|
|
|
|
|
|
|
||||||
|
Net unrealized gain arising during the period
|
—
|
|
—
|
|
—
|
|
||||||
|
Less: reclassification adjustment for gains (losses) realized in net income
|
65
|
|
(26
|
)
|
39
|
|
||||||
|
Net unrealized holding gain on pension plans
|
65
|
|
(26
|
)
|
39
|
|
||||||
|
Other comprehensive income
|
$
|
3,903
|
|
$
|
(1,451
|
)
|
$
|
2,452
|
|
|||
|
Three Months Ended September 30, 2014
|
|
|
|
|
|
|
||||||
|
Net unrealized holding loss on AFS securities:
|
|
|
|
|
||||||||
|
Net unrealized loss arising during the period
|
$
|
(3,613
|
)
|
$
|
1,377
|
|
$
|
(2,236
|
)
|
|||
|
Less: reclassification adjustment for (gains) realized in net income
|
(245
|
)
|
100
|
|
(145
|
)
|
||||||
|
Net unrealized holding loss on AFS securities
|
(3,858
|
)
|
1,477
|
|
(2,381
|
)
|
||||||
|
Net loss on cash flow hedging derivatives:
|
|
|
|
|
||||||||
|
Net unrealized gain arising during the period
|
980
|
|
(396
|
)
|
584
|
|
||||||
|
Less: reclassification adjustment for (gains) realized in net income
|
—
|
|
—
|
|
—
|
|
||||||
|
Net gain on cash flow hedging derivatives
|
980
|
|
(396
|
)
|
584
|
|
||||||
|
Net gain on terminated swap:
|
|
|
|
|
|
|
||||||
|
Net unrealized loss arising during the period
|
—
|
|
—
|
|
—
|
|
||||||
|
Less: reclassification adjustment for losses realized in net income
|
—
|
|
—
|
|
—
|
|
||||||
|
Net loss on terminated swap
|
—
|
|
—
|
|
—
|
|
||||||
|
Net unrealized holding loss on pension plans
|
|
|
|
|
|
|
||||||
|
Net unrealized loss arising during the period
|
(455
|
)
|
184
|
|
(271
|
)
|
||||||
|
Less: reclassification adjustment for gains (losses) realized in net income
|
—
|
|
—
|
|
—
|
|
||||||
|
Net unrealized holding loss on pension plans
|
(455
|
)
|
184
|
|
(271
|
)
|
||||||
|
Other comprehensive income
|
$
|
(3,333
|
)
|
$
|
1,265
|
|
$
|
(2,068
|
)
|
|||
42
|
(In thousands)
|
Before Tax
|
Tax Effect
|
Net of Tax
|
|||||||||
|
Nine Months Ended September 30, 2015
|
|
|
|
|
|
|
||||||
|
Net unrealized holding gains on AFS securities:
|
|
|
|
|
|
|
||||||
|
Net unrealized gains arising during the period
|
$
|
3,940
|
|
$
|
(1,580
|
)
|
$
|
2,360
|
|
|||
|
Less: reclassification adjustment for (gains) realized in net income
|
(2,466
|
)
|
888
|
|
(1,578
|
)
|
||||||
|
Net unrealized holding gain on AFS securities
|
1,474
|
|
(692
|
)
|
782
|
|
||||||
|
Net loss on cash flow hedging derivatives:
|
|
|
|
|
|
|
||||||
|
Net unrealized loss arising during the period
|
(7,486
|
)
|
3,017
|
|
(4,469
|
)
|
||||||
|
Less: reclassification adjustment for gains (losses) realized in net income
|
—
|
|
—
|
|
—
|
|
||||||
|
Net loss on cash flow hedging derivatives
|
(7,486
|
)
|
3,017
|
|
(4,469
|
)
|
||||||
|
Net unrealized holding loss on pension plans
|
|
|
|
|
|
|
||||||
|
Net unrealized loss arising during the period
|
(1,596
|
)
|
643
|
|
(953
|
)
|
||||||
|
Less: reclassification adjustment for gains (losses) realized in net income
|
194
|
|
(78
|
)
|
116
|
|
||||||
|
Net unrealized holding loss on pension plans
|
(1,402
|
)
|
565
|
|
(837
|
)
|
||||||
|
Other comprehensive income
|
$
|
(7,414
|
)
|
$
|
2,890
|
|
$
|
(4,524
|
)
|
|||
|
Nine Months Ended September 30, 2014
|
|
|
|
|
|
|
||||||
|
Net unrealized holding gains on AFS securities:
|
|
|
|
|
|
|
||||||
|
Net unrealized gain arising during the period
|
$
|
13,757
|
|
$
|
(5,197
|
)
|
$
|
8,560
|
|
|||
|
Less: reclassification adjustment for (gains) realized in net income
|
(482
|
)
|
193
|
|
(289
|
)
|
||||||
|
Net unrealized holding gains on AFS securities
|
13,275
|
|
(5,004
|
)
|
8,271
|
|
||||||
|
Net loss on cash flow hedging derivatives:
|
|
|
|
|
|
|
||||||
|
Net unrealized loss arising during the period
|
(3,147
|
)
|
1,295
|
|
(1,852
|
)
|
||||||
|
Less: reclassification adjustment for losses realized in net income
|
5,393
|
|
(2,201
|
)
|
3,192
|
|
||||||
|
Net loss on cash flow hedging derivatives
|
2,246
|
|
(906
|
)
|
1,340
|
|
||||||
|
Net loss on terminated swap:
|
|
|
|
|
|
|
||||||
|
Net unrealized loss arising during the period
|
—
|
|
—
|
|
—
|
|
||||||
|
Less: reclassification adjustment for losses realized in net income
|
3,237
|
|
(1,312
|
)
|
1,925
|
|
||||||
|
Net loss on terminated swap
|
3,237
|
|
(1,312
|
)
|
1,925
|
|
||||||
|
Net loss on pension plans:
|
|
|
|
|
|
|
||||||
|
Net unrealized loss arising during the period
|
(455
|
)
|
184
|
|
(271
|
)
|
||||||
|
Less: reclassification adjustment for losses realized in net income
|
—
|
|
—
|
|
—
|
|
||||||
|
Net loss pension plans
|
(455
|
)
|
184
|
|
(271
|
)
|
||||||
|
Other comprehensive income
|
$
|
18,303
|
|
$
|
(7,038
|
)
|
$
|
11,265
|
|
|||
43
The following table presents the changes in each component of accumulated other comprehensive income (loss), for the
three and nine
months ended
September 30, 2015
and
2014
:
|
(in thousands)
|
Net unrealized
holding gain
on AFS Securities
|
Net loss on
effective cash
flow hedging derivatives
|
Net loss
on
terminated swap
|
Net unrealized
holding loss
on pension plans
|
Total
|
|||||||||||||||
|
Three Months Ended September 30, 2015
|
|
|
|
|
|
|
|
|
|
|
||||||||||
|
Balance at Beginning of Period
|
$
|
5,677
|
|
$
|
(3,830
|
)
|
$
|
—
|
|
$
|
(2,244
|
)
|
$
|
(397
|
)
|
|||||
|
Other Comprehensive (Loss) Gain Before reclassifications
|
5,052
|
|
(2,608
|
)
|
—
|
|
—
|
|
2,444
|
|
||||||||||
|
Amounts Reclassified from Accumulated other comprehensive income
|
(31
|
)
|
—
|
|
—
|
|
39
|
|
8
|
|
||||||||||
|
Total Other Comprehensive (Loss) Income
|
5,021
|
|
(2,608
|
)
|
—
|
|
39
|
|
2,452
|
|
||||||||||
|
Balance at End of Period
|
$
|
10,698
|
|
$
|
(6,438
|
)
|
$
|
—
|
|
$
|
(2,205
|
)
|
$
|
2,055
|
|
|||||
|
Three Months Ended September 30, 2014
|
|
|
|
|
|
|
|
|
|
|
||||||||||
|
Balance at Beginning of Period
|
$
|
4,876
|
|
$
|
(610
|
)
|
$
|
—
|
|
$
|
10
|
|
$
|
4,276
|
|
|||||
|
Other Comprehensive Gain (Loss) Before reclassifications
|
(2,236
|
)
|
584
|
|
—
|
|
(271
|
)
|
(1,923
|
)
|
||||||||||
|
Amounts Reclassified from Accumulated other comprehensive income
|
(145
|
)
|
—
|
|
—
|
|
—
|
|
(145
|
)
|
||||||||||
|
Total Other Comprehensive Income (Loss)
|
(2,381
|
)
|
584
|
|
—
|
|
(271
|
)
|
(2,068
|
)
|
||||||||||
|
Balance at End of Period
|
$
|
2,495
|
|
$
|
(26
|
)
|
$
|
—
|
|
$
|
(261
|
)
|
$
|
2,208
|
|
|||||
|
Nine Months Ended September 30, 2015
|
|
|
|
|
|
|
|
|
|
|
||||||||||
|
Balance at Beginning of Period
|
$
|
9,916
|
|
$
|
(1,969
|
)
|
$
|
—
|
|
$
|
(1,368
|
)
|
$
|
6,579
|
|
|||||
|
Other Comprehensive (Loss) Before reclassifications
|
2,360
|
|
(4,469
|
)
|
—
|
|
(953
|
)
|
(3,062
|
)
|
||||||||||
|
Amounts Reclassified from Accumulated other comprehensive income
|
(1,578
|
)
|
—
|
|
—
|
|
116
|
|
(1,462
|
)
|
||||||||||
|
Total Other Comprehensive (Loss)
|
782
|
|
(4,469
|
)
|
—
|
|
(837
|
)
|
(4,524
|
)
|
||||||||||
|
Balance at End of Period
|
$
|
10,698
|
|
$
|
(6,438
|
)
|
$
|
—
|
|
$
|
(2,205
|
)
|
$
|
2,055
|
|
|||||
|
Nine Months Ended September 30, 2014
|
|
|
|
|
|
|
|
|
|
|
||||||||||
|
Balance at Beginning of Period
|
$
|
(5,776
|
)
|
$
|
(1,366
|
)
|
$
|
(1,925
|
)
|
$
|
10
|
|
$
|
(9,057
|
)
|
|||||
|
Other Comprehensive Gain (Loss) Before reclassifications
|
8,560
|
|
(1,852
|
)
|
—
|
|
(271
|
)
|
6,437
|
|
||||||||||
|
Amounts Reclassified from Accumulated other comprehensive income
|
(289
|
)
|
3,192
|
|
1,925
|
|
—
|
|
4,828
|
|
||||||||||
|
Total Other Comprehensive Income
|
8,271
|
|
1,340
|
|
1,925
|
|
(271
|
)
|
11,265
|
|
||||||||||
|
Balance at End of Period
|
$
|
2,495
|
|
$
|
(26
|
)
|
$
|
—
|
|
$
|
(261
|
)
|
$
|
2,208
|
|
|||||
44
The following table presents the amounts reclassified out of each component of accumulated other comprehensive income (loss) for the
three and nine
months ended
September 30, 2015
and
2014
:
|
|
|
|
Affected Line Item in the
|
|||||||
|
|
Three Months Ended September 30,
|
Statement where Net Income
|
||||||||
|
(in thousands)
|
2015
|
2014
|
is Presented
|
|||||||
|
Realized (gains) on AFS securities:
|
|
|
|
|
|
|||||
|
|
$
|
(49
|
)
|
$
|
(245
|
)
|
Non-interest income
|
|||
|
|
18
|
|
100
|
|
Tax expense
|
|||||
|
|
(31
|
)
|
(145
|
)
|
Net of tax
|
|||||
|
Realized losses on cash flow hedging derivatives:
|
|
|
|
|
|
|||||
|
|
—
|
|
—
|
|
Non-interest income
|
|||||
|
|
—
|
|
—
|
|
Tax expense
|
|||||
|
|
—
|
|
—
|
|
Net of tax
|
|||||
|
Amortization of realized gains on terminated swap:
|
|
|
|
|
|
|||||
|
|
—
|
|
—
|
|
Non-interest income
|
|||||
|
|
—
|
|
—
|
|
Tax expense
|
|||||
|
|
—
|
|
—
|
|
Net of tax
|
|||||
|
Realized loss on pension plans:
|
|
|
|
|
|
|||||
|
|
65
|
|
—
|
|
Non-interest income
|
|||||
|
|
(26
|
)
|
—
|
|
Tax expense
|
|||||
|
|
39
|
|
—
|
|
Net of tax
|
|||||
|
Total reclassifications for the period
|
$
|
8
|
|
$
|
(145
|
)
|
Net of tax
|
|||
|
|
|
|
Affected Line Item in the
|
|||||||
|
|
Nine Months Ended September 30,
|
Statement where Net Income
|
||||||||
|
(in thousands)
|
2015
|
2014
|
is Presented
|
|||||||
|
Realized (gains) on AFS securities:
|
|
|
|
|
|
|||||
|
|
$
|
(2,466
|
)
|
$
|
(482
|
)
|
Non-interest income
|
|||
|
|
888
|
|
193
|
|
Tax expense
|
|||||
|
|
(1,578
|
)
|
(289
|
)
|
Net of tax
|
|||||
|
Realized losses on cash flow hedging derivatives:
|
|
|
|
|
|
|||||
|
|
—
|
|
5,393
|
|
Non-interest income
|
|||||
|
|
—
|
|
(2,201
|
)
|
Tax expense
|
|||||
|
|
—
|
|
3,192
|
|
Net of tax
|
|||||
|
Amortization of realized gains on terminated swap:
|
|
|
|
|
|
|||||
|
|
—
|
|
3,237
|
|
Non-interest income
|
|||||
|
|
—
|
|
(1,312
|
)
|
Tax expense
|
|||||
|
|
—
|
|
1,925
|
|
Net of tax
|
|||||
|
Realized loss on pension plans:
|
|
|
|
|
|
|||||
|
|
194
|
|
—
|
|
Non-interest income
|
|||||
|
|
(78
|
)
|
—
|
|
Tax expense
|
|||||
|
|
116
|
|
—
|
|
Net of tax
|
|||||
|
Total reclassifications for the period
|
$
|
(1,462
|
)
|
$
|
4,828
|
|
Net of tax
|
|||
45
Earnings per share have been computed based on the following (average diluted shares outstanding are calculated using the treasury stock method):
|
|
Three Months Ended September 30,
|
Nine Months Ended September 30,
|
|||||||||||||
|
(In thousands, except per share data)
|
2015
|
2014
|
2015
|
2014
|
|||||||||||
|
Net income
|
$
|
14,701
|
|
$
|
11,988
|
|
$
|
33,504
|
|
$
|
22,347
|
|
|||
|
Average number of common shares issued
|
31,565
|
|
26,525
|
|
29,374
|
|
26,525
|
|
|||||||
|
Less: average number of treasury shares
|
1,201
|
|
1,360
|
|
1,229
|
|
1,400
|
|
|||||||
|
Less: average number of unvested stock award shares
|
471
|
|
418
|
|
460
|
|
404
|
|
|||||||
|
Average number of basic common shares outstanding
|
29,893
|
|
24,747
|
|
27,685
|
|
24,721
|
|
|||||||
|
Plus: dilutive effect of unvested stock award shares
|
114
|
|
68
|
|
98
|
|
59
|
|
|||||||
|
Plus: dilutive effect of stock options outstanding
|
62
|
|
46
|
|
64
|
|
55
|
|
|||||||
|
Average number of diluted common shares outstanding
|
30,069
|
|
24,861
|
|
27,847
|
|
24,835
|
|
|||||||
|
Earnings per share:
|
|
|
|
|
|
|
|
|
|||||||
|
Basic
|
$
|
0.49
|
|
$
|
0.48
|
|
$
|
1.21
|
|
$
|
0.90
|
|
|||
|
Diluted
|
$
|
0.49
|
|
$
|
0.48
|
|
$
|
1.20
|
|
$
|
0.90
|
|
|||
For the
nine
months ended
September 30, 2015
,
361 thousand
shares of restricted stock and
212 thousand
options were anti-dilutive and therefore excluded from the earnings per share calculations. For the
nine
months ended
September 30, 2014
,
345 thousand
shares of restricted stock and
291 thousand
options were anti-dilutive and therefore excluded from the earnings per share calculations.
A combined summary of activity in the Company’s stock award and stock option plans for the nine months ended September 30, 2015 is presented in the following table:
|
|
Non-vested Stock
|
|
|
||||||||||||
|
|
Awards Outstanding
|
Stock Options Outstanding
|
|||||||||||||
|
|
|
Weighted-
|
|
Weighted-
|
|||||||||||
|
Number of
|
Average
Grant Date
|
Number of
|
Average
Exercise
|
||||||||||||
|
(Shares in thousands)
|
Shares
|
Fair Value
|
Shares
|
Price
|
|||||||||||
|
December 31, 2014
|
424
|
|
$
|
24.33
|
|
282
|
|
$
|
20.42
|
|
|||||
|
Granted
|
182
|
|
26.44
|
|
—
|
|
—
|
|
|||||||
|
Stock options exercised
|
—
|
|
—
|
|
(11
|
)
|
10.52
|
|
|||||||
|
Stock awards vested
|
(126
|
)
|
23.78
|
|
—
|
|
—
|
|
|||||||
|
Forfeited
|
(19
|
)
|
24.91
|
|
—
|
|
—
|
|
|||||||
|
Expired
|
—
|
|
—
|
|
(1
|
)
|
25.09
|
|
|||||||
|
September 30, 2015
|
461
|
|
$
|
25.03
|
|
270
|
|
$
|
21.12
|
|
|||||
|
Exercisable options,
|
September 30, 2015
|
|
|
|
|
270
|
|
$
|
21.12
|
|
|||||
During the
nine
months ended
September 30, 2015
and
2014
, proceeds from stock option exercises totaled
$116 thousand
and totaled
$1.1 million
, respectively. During the
nine
months ended
September 30, 2015
, there were
126 thousand
shares issued in connection with vested stock awards. During the
nine
months ended
September 30, 2014
, there were
83 thousand
shares issued in connection with vested stock awards. All of these shares were issued from available treasury stock. Stock-based compensation expense totaled
$3.4 million
and
$2.9 million
during the
nine
months ended
September 30, 2015
and
2014
, respectively. Stock-based compensation expense is recognized over the requisite service period for all awards.
46
The Company has
two
reportable operating segments, Banking and Insurance, which are delineated by the consolidated subsidiaries of Berkshire Hills Bancorp, Inc. Banking includes the activities of the Bank and its subsidiaries, which provide retail and commercial banking, along with wealth management and investment services. Insurance includes the activities of Berkshire Insurance Group, Inc. (“BIG”), which provides retail and commercial insurance services. The only other consolidated financial activity of the Company is the Parent, which consists of the transactions of Berkshire Hills Bancorp, Inc. Management fees for corporate services provided by the Bank to BIG and the Parent are eliminated.
The accounting policies of each reportable segment are the same as those of the Company. The Insurance segment and the Parent reimburse the Bank for administrative services provided to them. Income tax expense for the individual segments is calculated based on the activity of the segments, and the Parent records the tax expense or benefit necessary to reconcile to the consolidated total. The Parent does not allocate capital costs. Average assets include securities available-for-sale based on amortized cost.
47
A summary of the Company’s operating segments was as follows:
|
(In thousands)
|
Banking
|
Insurance
|
Parent
|
Eliminations
|
Total Consolidated
|
|||||||||||||||
|
Three Months Ended September 30, 2015
|
|
|
|
|
|
|
|
|
|
|
||||||||||
|
Net interest income
|
$
|
57,867
|
|
$
|
—
|
|
$
|
7,168
|
|
$
|
(8,064
|
)
|
$
|
56,971
|
|
|||||
|
Provision for loan losses
|
4,240
|
|
—
|
|
—
|
|
—
|
|
4,240
|
|
||||||||||
|
Non-interest income
|
10,154
|
|
2,544
|
|
(193
|
)
|
193
|
|
12,698
|
|
||||||||||
|
Non-interest expense
|
46,465
|
|
2,042
|
|
871
|
|
—
|
|
49,378
|
|
||||||||||
|
Income before income taxes
|
17,316
|
|
502
|
|
6,104
|
|
(7,871
|
)
|
16,051
|
|
||||||||||
|
Income tax expense (benefit)
|
1,816
|
|
195
|
|
(661
|
)
|
—
|
|
1,350
|
|
||||||||||
|
Net income
|
$
|
15,500
|
|
$
|
307
|
|
$
|
6,765
|
|
$
|
(7,871
|
)
|
$
|
14,701
|
|
|||||
|
Average assets (in millions)
|
$
|
7,565
|
|
$
|
30
|
|
$
|
913
|
|
$
|
(914
|
)
|
$
|
7,541
|
|
|||||
|
Three Months Ended September 30, 2014
|
|
|
|
|
|
|
|
|
|
|
||||||||||
|
Net interest income (expense)
|
$
|
45,786
|
|
$
|
—
|
|
$
|
5,163
|
|
$
|
(6,000
|
)
|
$
|
44,949
|
|
|||||
|
Provision for loan losses
|
3,685
|
|
—
|
|
—
|
|
—
|
|
3,685
|
|
||||||||||
|
Non-interest income
|
12,009
|
|
2,632
|
|
6,693
|
|
(6,693
|
)
|
14,641
|
|
||||||||||
|
Non-interest expense
|
37,388
|
|
1,983
|
|
316
|
|
—
|
|
39,687
|
|
||||||||||
|
Income before income taxes
|
16,722
|
|
649
|
|
11,540
|
|
(12,693
|
)
|
16,218
|
|
||||||||||
|
Income tax expense (benefit)
|
4,426
|
|
252
|
|
(448
|
)
|
—
|
|
4,230
|
|
||||||||||
|
Net income
|
$
|
12,296
|
|
$
|
397
|
|
$
|
11,988
|
|
$
|
(12,693
|
)
|
$
|
11,988
|
|
|||||
|
Average assets (in millions)
|
$
|
6,249
|
|
$
|
27
|
|
$
|
766
|
|
$
|
(777
|
)
|
$
|
6,265
|
|
|||||
|
Nine Months Ended September 30, 2015
|
|
|
|
|
|
|
|
|
|
|
||||||||||
|
Net interest income
|
$
|
157,688
|
|
$
|
—
|
|
$
|
11,477
|
|
$
|
(14,064
|
)
|
$
|
155,101
|
|
|||||
|
Provision for loan losses
|
12,295
|
|
—
|
|
—
|
|
—
|
|
12,295
|
|
||||||||||
|
Non-interest income
|
33,663
|
|
7,997
|
|
5,037
|
|
(4,657
|
)
|
42,040
|
|
||||||||||
|
Non-interest expense
|
136,490
|
|
5,884
|
|
6,178
|
|
(1
|
)
|
148,551
|
|
||||||||||
|
Income before income taxes
|
42,566
|
|
2,113
|
|
10,336
|
|
(18,720
|
)
|
36,295
|
|
||||||||||
|
Income tax expense (benefit)
|
5,201
|
|
820
|
|
(3,230
|
)
|
—
|
|
2,791
|
|
||||||||||
|
Net income
|
$
|
37,365
|
|
$
|
1,293
|
|
$
|
13,566
|
|
$
|
(18,720
|
)
|
$
|
33,504
|
|
|||||
|
Average assets (in millions)
|
$
|
7,082
|
|
$
|
29
|
|
$
|
852
|
|
$
|
(852
|
)
|
$
|
7,111
|
|
|||||
|
Nine Months Ended September 30, 2014
|
|
|
|
|
|
|
|
|
|
|
||||||||||
|
Net interest income
|
$
|
134,740
|
|
$
|
—
|
|
$
|
3,304
|
|
$
|
(6,000
|
)
|
$
|
132,044
|
|
|||||
|
Provision for loan losses
|
11,070
|
|
—
|
|
—
|
|
—
|
|
11,070
|
|
||||||||||
|
Non-interest income
|
25,429
|
|
8,141
|
|
18,713
|
|
(18,713
|
)
|
33,570
|
|
||||||||||
|
Non-interest expense
|
116,932
|
|
6,192
|
|
1,185
|
|
—
|
|
124,309
|
|
||||||||||
|
Income before income taxes
|
32,167
|
|
1,949
|
|
20,832
|
|
(24,713
|
)
|
30,235
|
|
||||||||||
|
Income tax expense (benefit)
|
8,642
|
|
761
|
|
(1,515
|
)
|
—
|
|
7,888
|
|
||||||||||
|
Net income
|
$
|
23,525
|
|
$
|
1,188
|
|
$
|
22,347
|
|
$
|
(24,713
|
)
|
$
|
22,347
|
|
|||||
|
Average assets (in millions)
|
$
|
6,065
|
|
$
|
27
|
|
$
|
744
|
|
$
|
(747
|
)
|
$
|
6,089
|
|
|||||
48
As of
September 30, 2015
, the Company held derivatives with a total notional amount of
$1.2 billion
. That amount included
$300.0 million
in forward starting interest rate swap derivatives that were designated as cash flow hedges for accounting purposes. The Company also had economic hedges and non-hedging derivatives totaling
$847.0 million
and
$44.7 million
, respectively, which are not designated as hedges for accounting purposes and are therefore recorded at fair value. Economic hedges included interest rate swaps totaling
$746.0 million
, risk participation agreements with dealer banks of
$48.6 million
, and
$52.5 million
in forward commitment contracts.
As part of the Company’s risk management strategy, the Company enters into interest rate swap agreements to mitigate the interest rate risk inherent in certain of the Company’s assets and liabilities. Interest rate swap agreements involve the risk of dealing with both Bank customers and institutional derivative counterparties and their ability to meet contractual terms. The agreements are entered into with counterparties that meet established credit standards and contain master netting and collateral provisions protecting the at-risk party. The derivatives program is overseen by the Risk Management/Capital Committee of the Company’s Board of Directors. Based on adherence to the Company’s credit standards and the presence of the netting and collateral provisions, the Company believes that the credit risk inherent in these contracts was not significant at
September 30, 2015
.
The Company pledged collateral to derivative counterparties in the form of cash totaling
$12.3 million
and securities with an amortized cost of
$26.9 million
and a fair value of
$27.1 million
as of
September 30, 2015
. The Company does not typically require its commercial customers to post cash or securities as collateral on its program of back-to-back economic hedges. However certain language is written into the International Swaps Dealers Association, Inc. (“ISDA”) and loan documents where, in default situations, the Bank is allowed to access collateral supporting the loan relationship to recover any losses suffered on the derivative asset or liability. The Company may need to post additional collateral in the future in proportion to potential increases in unrealized loss positions.
Information about derivative assets and liabilities at
September 30, 2015
, follows:
|
|
|
Weighted
|
Weighted Average Rate
|
Estimated
|
|||||||||||
|
|
Notional
|
Average
|
|
Contract
|
Fair Value
|
||||||||||
|
|
Amount
|
Maturity
|
Received
|
pay rate
|
Asset (Liability)
|
||||||||||
|
|
(In thousands)
|
(In years)
|
|
|
(In thousands)
|
||||||||||
|
Cash flow hedges:
|
|
|
|
|
|
|
|
|
|
||||||
|
Forward-starting interest rate swaps on FHLBB borrowings
|
$
|
300,000
|
|
3.5
|
—
|
%
|
2.29
|
%
|
$
|
(10,785
|
)
|
||||
|
Total cash flow hedges
|
300,000
|
|
|
|
|
|
|
(10,785
|
)
|
||||||
|
Economic hedges:
|
|
|
|
|
|
|
|
|
|
||||||
|
Interest rate swap on tax advantaged economic development bond
|
12,130
|
|
14.2
|
0.56
|
%
|
5.09
|
%
|
(2,678
|
)
|
||||||
|
Interest rate swaps on loans with commercial loan customers
|
366,947
|
|
6.6
|
2.18
|
%
|
4.52
|
%
|
(19,214
|
)
|
||||||
|
Reverse interest rate swaps on loans with commercial loan customers
|
366,947
|
|
6.6
|
4.52
|
%
|
2.18
|
%
|
19,361
|
|
||||||
|
Risk Participation Agreements with Dealer Banks
|
48,562
|
|
15.5
|
|
|
|
|
(72
|
)
|
||||||
|
Forward sale commitments
|
52,478
|
|
0.2
|
|
|
|
|
(387
|
)
|
||||||
|
Total economic hedges
|
847,064
|
|
|
|
|
|
|
(2,990
|
)
|
||||||
|
Non-hedging derivatives:
|
|
|
|
|
|
|
|
|
|
||||||
|
Interest rate lock commitments
|
44,726
|
|
0.2
|
|
|
|
|
754
|
|
||||||
|
Total non-hedging derivatives
|
44,726
|
|
|
|
|
|
|
754
|
|
||||||
|
Total
|
$
|
1,191,790
|
|
|
|
|
|
|
$
|
(13,021
|
)
|
||||
49
Information about derivative assets and liabilities at
December 31, 2014
, follows:
|
|
|
Weighted
|
Weighted Average Rate
|
Estimated
|
|||||||||||
|
|
Notional
|
Average
|
|
Contract
|
Fair Value
|
||||||||||
|
|
Amount
|
Maturity
|
Received
|
pay rate
|
Asset (Liability)
|
||||||||||
|
|
(In thousands)
|
(In years)
|
|
|
(In thousands)
|
||||||||||
|
Cash flow hedges:
|
|
|
|
|
|
|
|
|
|
||||||
|
Forward-starting interest rate swaps on FHLBB borrowings
|
$
|
300,000
|
|
4.3
|
—
|
%
|
2.29
|
%
|
$
|
(3,299
|
)
|
||||
|
Total cash flow hedges
|
300,000
|
|
|
|
|
|
|
(3,299
|
)
|
||||||
|
Economic hedges:
|
|
|
|
|
|
|
|
|
|
||||||
|
Interest rate swap on tax advantaged economic development bond
|
12,554
|
|
14.9
|
0.52
|
%
|
5.09
|
%
|
(2,578
|
)
|
||||||
|
Interest rate swaps on loans with commercial loan customers
|
297,158
|
|
6.0
|
2.23
|
%
|
4.54
|
%
|
(12,183
|
)
|
||||||
|
Reverse interest rate swaps on loans with commercial loan customers
|
297,158
|
|
6.0
|
4.54
|
%
|
2.23
|
%
|
12,221
|
|
||||||
|
Risk participation agreements with dealer banks
|
45,842
|
|
16.6
|
|
|
|
|
(91
|
)
|
||||||
|
Forward sale commitments
|
42,366
|
|
0.2
|
|
|
|
|
(510
|
)
|
||||||
|
Total economic hedges
|
695,078
|
|
|
|
|
|
|
(3,141
|
)
|
||||||
|
Non-hedging derivatives:
|
|
|
|
|
|
|
|
|
|
||||||
|
Interest rate lock commitments
|
39,589
|
|
0.2
|
|
|
|
|
625
|
|
||||||
|
Total non-hedging derivatives
|
39,589
|
|
|
|
|
|
|
625
|
|
||||||
|
Total
|
$
|
1,034,667
|
|
|
|
|
|
|
$
|
(5,815
|
)
|
||||
Cash flow hedges
The effective portion of unrealized changes in the fair value of derivatives accounted for as cash flow hedges is reported in other comprehensive income and subsequently reclassified to earnings in the same period or periods during which the hedged transaction is forecasted to affect earnings. Each quarter, the Company assesses the effectiveness of each hedging relationship by comparing the changes in cash flows of the derivative hedging instrument with the changes in cash flows of the designated hedged item or transaction. The ineffective portion of changes in the fair value of the derivatives is recognized directly in earnings.
The Company has entered into
six
forward-starting interest rate swap contracts with a combined notional value of
$300.0 million
as of
September 30, 2015
. The six forward starting swaps will become effective in 2016. All have durations of three years. This hedge strategy converts the
one month
rolling FHLBB borrowings based on the FHLBB’s
one month
fixed interest rate to fixed interest rates, thereby protecting the Company from floating interest rate variability.
Amounts included in the Consolidated Statements of Income and in the other comprehensive income section of the Consolidated Statements of Comprehensive Income (related to interest rate derivatives designated as hedges of cash flows), were as follows:
50
|
|
Three Months Ended September 30,
|
Nine Months Ended September 30,
|
|||||||||||||
|
(In thousands)
|
2015
|
2014
|
2015
|
2014
|
|||||||||||
|
Interest rate swaps on FHLBB borrowings:
|
|
|
|
|
|
|
|
|
|||||||
|
Unrealized gain (loss) recognized in accumulated other comprehensive loss
|
$
|
(4,369
|
)
|
$
|
979
|
|
$
|
(7,486
|
)
|
$
|
(3,148
|
)
|
|||
|
Reclassification of unrealized loss from accumulated other comprehensive income to other non-interest income for termination of swaps
|
—
|
|
—
|
|
—
|
|
8,630
|
|
|||||||
|
Reclassification of unrealized deferred tax benefit from accumulated other comprehensive income to tax expense for terminated swaps
|
—
|
|
—
|
|
—
|
|
(3,611
|
)
|
|||||||
|
Net tax benefit (expense) on items recognized in accumulated other comprehensive income
|
1,761
|
|
(396
|
)
|
3,017
|
|
1,270
|
|
|||||||
|
Interest rate swaps on junior subordinated debentures:
|
|
|
|
|
|
|
|
|
|||||||
|
Unrealized loss recognized in accumulated other comprehensive income
|
—
|
|
—
|
|
—
|
|
(1
|
)
|
|||||||
|
Reclassification of unrealized loss from accumulated other comprehensive income to interest expense
|
—
|
|
—
|
|
—
|
|
204
|
|
|||||||
|
Net tax expense on items recognized in accumulated other comprehensive income
|
—
|
|
—
|
|
—
|
|
(80
|
)
|
|||||||
|
Other comprehensive gain (loss) recorded in accumulated other comprehensive income, net of reclassification adjustments and tax effects
|
$
|
(2,608
|
)
|
$
|
583
|
|
$
|
(4,469
|
)
|
$
|
3,264
|
|
|||
|
Net interest expense recognized in interest expense on junior subordinated notes
|
$
|
—
|
|
$
|
—
|
|
$
|
—
|
|
$
|
204
|
|
|||
Hedge ineffectiveness on interest rate swaps designated as cash flow hedges was immaterial to the Company’s financial statements during the
three and nine
months ended
September 30, 2015
and
2014
.
Amounts reported in accumulated other comprehensive income related to derivatives will be reclassified to interest expense as interest payments are made on the Company’s variable-rate liabilities. During the next twelve months, the Company does not anticipate any such reclassifications.
As a result of the branch acquisition, in the first quarter of 2014, the Company initiated and subsequently terminated all of its interest rate swaps, with various institutions, associated with FHLB advances with 3-month LIBOR based floating interest rates with an aggregate notional amount of
$30 million
, all of its interest rate swaps associated with
90
day rolling FHLB advances issued using the FHLB’s
3
-month fixed interest rate with an aggregate notional amount of
$145 million
and all of its forward-starting interest rate swaps associated with
90
day rolling FHLB advances issued using the FHLB’s 3-month fixed interest rate with an aggregate notional amount of
$235 million
. In the first quarter of 2014, the Company elected to extinguish
$215 million
of FHLB advances related to the terminated swaps. As a result the Company reclassified
$8.6 million
of losses from the effective portion of the unrealized changes in the fair value of the terminated derivatives from other comprehensive income to non-interest income as the forecasted transactions to the related FHLB advances will not occur.
51
Economic hedges
As of
September 30, 2015
, the Company has an interest rate swap with a
$12.1 million
notional amount to swap out the fixed rate of interest on an economic development bond bearing a fixed rate of
5.09%
, currently within the Company’s trading portfolio under the fair value option, in exchange for a LIBOR-based floating rate. The intent of the economic hedge is to improve the Company’s asset sensitivity to changing interest rates in anticipation of favorable average floating rates of interest over the
21
-year life of the bond. The fair value changes of the economic development bond are mostly offset by fair value changes of the related interest rate swap.
The Company also offers certain derivative products directly to qualified commercial borrowers. The Company economically hedges derivative transactions executed with commercial borrowers by entering into mirror-image, offsetting derivatives with third-party financial institutions. The transaction allows the Company’s customer to convert a variable-rate loan to a fixed rate loan. Because the Company acts as an intermediary for its customer, changes in the fair value of the underlying derivative contracts mostly offset each other in earnings. Credit valuation adjustments arising from the difference in credit worthiness of the commercial loan and financial institution counterparties totaled
$146.7 thousand
as of
September 30, 2015
. The interest income and expense on these mirror image swaps exactly offset each other.
The Company has risk participation agreements with dealer banks. Risk participation agreements occur when the Company participates on a loan and a swap where another bank is the lead. The Company gets paid a fee to take on the risk associated with having to make the lead bank whole on Berkshire’s portion of the pro-rated swap should the borrower default. Changes in fair value are recorded in current period earnings.
The Company utilizes forward sale commitments to hedge interest rate risk and the associated effects on the fair value of interest rate lock commitments and loans originated for sale. The forward sale commitments are accounted for as derivatives with changes in fair value recorded in current period earnings.
The Company uses the following types of forward sale commitments contracts:
|
•
|
Best efforts loan sales,
|
|
•
|
Mandatory delivery loan sales, and
|
|
•
|
To Be Announced (“TBA”) mortgage-backed securities sales.
|
A best efforts contract refers to a loan sale agreement where the Company commits to deliver an individual mortgage loan of a specified principal amount and quality to an investor if the loan to the underlying borrower closes. The Company may enter into a best efforts contract once the price is known, which is shortly after the potential borrower’s interest rate is locked.
A mandatory delivery contract is a loan sale agreement where the Company commits to deliver a certain principal amount of mortgage loans to an investor at a specified price on or before a specified date. Generally, the Company may enter into mandatory delivery contracts shortly after the loan closes with a customer.
The Company may sell TBA mortgage-backed securities to hedge the changes in fair value of interest rate lock commitments and held for sale loans, which do not have corresponding best efforts or mandatory delivery contracts. These security sales transactions are closed once mandatory contracts are written. On the closing date the price of the security is locked-in, and the sale is paired-off with a purchase of the same security. Settlement of the security purchase/sale transaction is done with cash on a net-basis.
Non-hedging derivatives
The Company enters into interest rate lock commitments (“IRLCs”) for residential mortgage loans, which commit the Company to lend funds to a potential borrower at a specific interest rate and within a specified period of time. IRLCs that relate to the origination of mortgage loans that will be held for sale are considered derivative financial instruments under applicable accounting guidance. Outstanding IRLCs expose the Company to the risk that the price of the mortgage loans underlying the commitments may decline due to increases in mortgage interest rates from inception of the rate lock to the funding of the loan. The IRLCs are free-standing derivatives which are carried at fair value with changes recorded in noninterest income in the Company’s consolidated statements of income. Changes in the fair value of IRLCs subsequent to inception are based on changes in the fair value of the underlying loan resulting from the fulfillment of the commitment and changes in the probability that the loan will fund within the terms of the commitment, which is affected primarily by changes in interest rates and the passage of time.
52
Amounts included in the Consolidated Statements of Income related to economic hedges and non-hedging derivatives were as follows:
|
|
Three Months Ended September 30,
|
Nine Months Ended September 30,
|
|||||||||||||
|
(In thousands)
|
2015
|
2014
|
2015
|
2014
|
|||||||||||
|
Economic hedges
|
|
|
|
|
|
|
|
|
|||||||
|
Interest rate swap on industrial revenue bond:
|
|
|
|
|
|
|
|
|
|||||||
|
Unrealized gain (loss) recognized in other non-interest income
|
$
|
(493
|
)
|
$
|
(84
|
)
|
$
|
(433
|
)
|
$
|
(815
|
)
|
|||
|
Interest rate swaps on loans with commercial loan customers:
|
|
|
|
|
|
|
|
|
|||||||
|
Unrealized (loss) gain recognized in other non-interest income
|
(7,698
|
)
|
391
|
|
(6,923
|
)
|
(1,341
|
)
|
|||||||
|
Reverse interest rate swaps on loans with commercial loan customers:
|
|
|
|
|
|
|
|
|
|||||||
|
Unrealized gain (loss) recognized in other non-interest income
|
7,698
|
|
(391
|
)
|
6,923
|
|
1,341
|
|
|||||||
|
Favorable (Unfavorable) change in credit valuation adjustment recognized in other non-interest income
|
52
|
|
59
|
|
109
|
|
70
|
|
|||||||
|
Risk Participation Agreements:
|
|
|
|
|
|
|
|
|
|||||||
|
Unrealized (loss) recognized in other non-interest income
|
(65
|
)
|
—
|
|
(42
|
)
|
—
|
|
|||||||
|
Forward Commitments:
|
|
|
|
|
|
|
|
|
|||||||
|
Unrealized (loss) recognized in other non-interest income
|
(387
|
)
|
(25
|
)
|
(300
|
)
|
(694
|
)
|
|||||||
|
Realized (loss) in other non-interest income
|
(493
|
)
|
(75
|
)
|
(80
|
)
|
(417
|
)
|
|||||||
|
Non-hedging derivatives
|
|
|
|
|
|
|
|
|
|||||||
|
Interest rate lock commitments
|
|
|
|
|
|
|
|
|
|||||||
|
Unrealized gain recognized in other non-interest income
|
$
|
754
|
|
$
|
383
|
|
$
|
2,113
|
|
$
|
1,420
|
|
|||
|
Realized gain in other non-interest income
|
819
|
|
711
|
|
1,760
|
|
1,746
|
|
|||||||
Assets and Liabilities Subject to Enforceable Master Netting Arrangements
Interest Rate Swap Agreements (“Swap Agreements”)
The Company enters into swap agreements to facilitate the risk management strategies for commercial banking customers. The Company mitigates this risk by entering into equal and offsetting swap agreements with highly rated third party financial institutions. The swap agreements are free-standing derivatives and are recorded at fair value in the Company’s consolidated statements of condition. The Company is party to master netting arrangements with its financial institution counterparties; however, the Company does not offset assets and liabilities under these arrangements for financial statement presentation purposes. The master netting arrangements provide for a single net settlement of all swap agreements, as well as collateral, in the event of default on, or termination of, any one contract. Collateral generally in the form of marketable securities is received or posted by the counterparty with net liability positions, respectively, in accordance with contract thresholds. The Company had net asset positions with its commercial banking counterparties totaling
$19.4 million
and
$12.3 million
as of
September 30, 2015
and
December 31, 2014
, respectively. The Company had net liability positions with its financial institution counterparties totaling
$32.6 million
and
$18.2 million
as of
September 30, 2015
and
December 31, 2014
, respectively. At
September 30, 2015
, the Company did not have a net liability position with its commercial banking counterparties, compared to a
$0.1 million
liability at
December 31, 2014
. The collateral posted by the Company that covered liability positions was
$32.6 million
and
$18.2 million
as of
September 30, 2015
and
December 31, 2014
, respectively.
53
The following table presents the assets and liabilities subject to an enforceable master netting arrangement as of
September 30, 2015
and
December 31, 2014
:
Offsetting of Financial Assets and Derivative Assets
|
Gross
Amounts of
|
Gross Amounts
Offset in the
|
Net Amounts
of Assets
Presented in the
|
Gross Amounts Not Offset in
the Statements of Condition
|
|||||||||||||||||||||
|
|
Recognized
|
Statements of
|
Statements of
|
Financial
|
Cash
|
|
||||||||||||||||||
|
(in thousands)
|
Assets
|
Condition
|
Condition
|
Instruments
|
Collateral Received
|
Net Amount
|
||||||||||||||||||
|
September 30, 2015
|
|
|
|
|
|
|
|
|
|
|
|
|
||||||||||||
|
Interest Rate Swap Agreements:
|
|
|
|
|
|
|
|
|
|
|
|
|
||||||||||||
|
Institutional counterparties
|
$
|
40
|
|
$
|
—
|
|
$
|
40
|
|
$
|
—
|
|
$
|
—
|
|
$
|
40
|
|
||||||
|
Commercial counterparties
|
19,361
|
|
—
|
|
19,361
|
|
—
|
|
—
|
|
19,361
|
|
||||||||||||
|
Total
|
$
|
19,401
|
|
$
|
—
|
|
$
|
19,401
|
|
$
|
—
|
|
$
|
—
|
|
$
|
19,401
|
|
||||||
Offsetting of Financial Liabilities and Derivative Liabilities
|
Gross
Amounts of
|
Gross Amounts
Offset in the
|
Net Amounts
of Liabilities
Presented in the
|
Gross Amounts Not Offset in
the Statements of Condition
|
|||||||||||||||||||||
|
|
Recognized
|
Statements of
|
Statements of
|
Financial
|
Cash
|
|
||||||||||||||||||
|
(in thousands)
|
Liabilities
|
Condition
|
Condition
|
Instruments
|
Collateral Pledged
|
Net Amount
|
||||||||||||||||||
|
September 30, 2015
|
|
|
|
|
|
|
|
|
|
|
|
|
||||||||||||
|
Interest Rate Swap Agreements:
|
|
|
|
|
|
|
|
|
|
|
|
|
||||||||||||
|
Institutional counterparties
|
$
|
(32,622
|
)
|
$
|
—
|
|
$
|
(32,622
|
)
|
$
|
20,391
|
|
$
|
12,231
|
|
$
|
—
|
|
||||||
|
Commercial counterparties
|
—
|
|
—
|
|
—
|
|
—
|
|
—
|
|
—
|
|
||||||||||||
|
Total
|
$
|
(32,622
|
)
|
$
|
—
|
|
$
|
(32,622
|
)
|
$
|
20,391
|
|
$
|
12,231
|
|
$
|
—
|
|
||||||
Offsetting of Financial Assets and Derivative Assets
|
Gross
Amounts of
|
Gross Amounts
Offset in the
|
Net Amounts
of Assets
Presented in the
|
Gross Amounts Not Offset in
the Statements of Condition
|
|||||||||||||||||||||
|
|
Recognized
|
Statements of
|
Statements of
|
Financial
|
Cash
|
|
||||||||||||||||||
|
(in thousands)
|
Assets
|
Condition
|
Condition
|
Instruments
|
Collateral Received
|
Net Amount
|
||||||||||||||||||
|
December 31, 2014
|
|
|
|
|
|
|
|
|
|
|
|
|
||||||||||||
|
Interest Rate Swap Agreements:
|
|
|
|
|
|
|
|
|
|
|
|
|
||||||||||||
|
Institutional counterparties
|
$
|
23
|
|
$
|
—
|
|
$
|
23
|
|
$
|
—
|
|
$
|
—
|
|
$
|
23
|
|
||||||
|
Commercial counterparties
|
12,270
|
|
—
|
|
12,270
|
|
—
|
|
—
|
|
12,270
|
|
||||||||||||
|
Total
|
$
|
12,293
|
|
$
|
—
|
|
$
|
12,293
|
|
$
|
—
|
|
$
|
—
|
|
$
|
12,293
|
|
||||||
Offsetting of Financial Liabilities and Derivative Liabilities
|
Gross
Amounts of
|
Gross Amounts
Offset in the
|
Net Amounts
of Liabilities
Presented in the
|
Gross Amounts Not Offset in
the Statements of Condition
|
|||||||||||||||||||||
|
|
Recognized
|
Statements of
|
Statements of
|
Financial
|
Cash
|
|
||||||||||||||||||
|
(in thousands)
|
Liabilities
|
Condition
|
Condition
|
Instruments
|
Collateral Pledged
|
Net Amount
|
||||||||||||||||||
|
December 31, 2014
|
|
|
|
|
|
|
|
|
|
|
|
|
||||||||||||
|
Interest Rate Swap Agreements:
|
|
|
|
|
|
|
|
|
|
|
|
|
||||||||||||
|
Institutional counterparties
|
$
|
(18,232
|
)
|
$
|
58
|
|
$
|
(18,174
|
)
|
$
|
14,984
|
|
$
|
3,190
|
|
$
|
—
|
|
||||||
|
Commercial counterparties
|
(50
|
)
|
—
|
|
(50
|
)
|
—
|
|
—
|
|
(50
|
)
|
||||||||||||
|
Total
|
$
|
(18,282
|
)
|
$
|
58
|
|
$
|
(18,224
|
)
|
$
|
14,984
|
|
$
|
3,190
|
|
$
|
(50
|
)
|
||||||
54
A description of the valuation methodologies used for assets and liabilities measured at fair value, as well as the general classification of such instruments pursuant to the valuation hierarchy, is set forth below. These valuation methodologies were applied to all of the Company’s financial assets and financial liabilities that are carried at fair value.
Recurring Fair Value Measurements
The following table summarizes financial assets and financial liabilities measured at fair value on a recurring basis as of
September 30, 2015
and
December 31, 2014
, segregated by the level of the valuation inputs within the fair value hierarchy utilized to measure fair value.
|
|
September 30, 2015
|
||||||||||||||
|
|
Level 1
|
Level 2
|
Level 3
|
Total
|
|||||||||||
|
(In thousands)
|
Inputs
|
Inputs
|
Inputs
|
Fair Value
|
|||||||||||
|
Trading security
|
$
|
—
|
|
$
|
—
|
|
$
|
14,587
|
|
$
|
14,587
|
|
|||
|
Available-for-sale securities:
|
|
|
|
|
|
|
|
|
|||||||
|
Municipal bonds and obligations
|
—
|
|
102,226
|
|
—
|
|
102,226
|
|
|||||||
|
Government guaranteed residential mortgage-backed securities
|
—
|
|
67,344
|
|
—
|
|
67,344
|
|
|||||||
|
Government-sponsored residential mortgage-backed securities
|
—
|
|
905,912
|
|
—
|
|
905,912
|
|
|||||||
|
Corporate bonds
|
—
|
|
49,919
|
|
—
|
|
49,919
|
|
|||||||
|
Trust preferred securities
|
—
|
|
12,115
|
|
—
|
|
12,115
|
|
|||||||
|
Other bonds and obligations
|
—
|
|
3,197
|
|
—
|
|
3,197
|
|
|||||||
|
Marketable equity securities
|
33,209
|
|
944
|
|
764
|
|
34,917
|
|
|||||||
|
Loans held for sale
(1)
|
—
|
|
14,882
|
|
—
|
|
14,882
|
|
|||||||
|
Derivative assets
|
—
|
|
19,361
|
|
754
|
|
20,115
|
|
|||||||
|
Derivative liabilities
|
365
|
|
32,809
|
|
22
|
|
33,196
|
|
|||||||
(1) Loans held for sale excludes
$10.6 million
of loans for sale held shown on the balance sheet that are held at lower of cost or market.
|
|
December 31, 2014
|
||||||||||||||
|
|
Level 1
|
Level 2
|
Level 3
|
Total
|
|||||||||||
|
(In thousands)
|
Inputs
|
Inputs
|
Inputs
|
Fair Value
|
|||||||||||
|
Trading security
|
$
|
—
|
|
$
|
—
|
|
$
|
14,909
|
|
$
|
14,909
|
|
|||
|
Available-for-sale securities:
|
|
|
|
|
|
|
|
|
|||||||
|
Municipal bonds and obligations
|
—
|
|
133,699
|
|
—
|
|
133,699
|
|
|||||||
|
Government guaranteed residential mortgage-backed securities
|
—
|
|
69,468
|
|
—
|
|
69,468
|
|
|||||||
|
Government-sponsored residential mortgage-backed securities
|
—
|
|
760,184
|
|
—
|
|
760,184
|
|
|||||||
|
Corporate bonds
|
—
|
|
54,151
|
|
—
|
|
54,151
|
|
|||||||
|
Trust preferred securities
|
—
|
|
14,667
|
|
1,548
|
|
16,215
|
|
|||||||
|
Other bonds and obligations
|
—
|
|
3,159
|
|
—
|
|
3,159
|
|
|||||||
|
Marketable equity securities
|
53,806
|
|
358
|
|
778
|
|
54,942
|
|
|||||||
|
Loans Held for Sale
|
—
|
|
19,493
|
|
—
|
|
19,493
|
|
|||||||
|
Derivative assets
|
—
|
|
12,328
|
|
625
|
|
12,953
|
|
|||||||
|
Derivative liabilities
|
417
|
|
18,259
|
|
93
|
|
18,769
|
|
|||||||
There were
no
transfers between levels during the
three and nine
months ended
September 30, 2015
or
2014
.
55
Trading Security at Fair Value.
The Company holds
one
security designated as a trading security. It is a tax advantaged economic development bond issued to the Company by a local nonprofit which provides wellness and health programs. The determination of the fair value for this security is determined based on a discounted cash flow methodology. Certain inputs to the fair value calculation are unobservable and there is little to no market activity in the security; therefore, the security meets the definition of a Level 3 security. The discount rate used in the valuation of the security is sensitive to movements in the 3-month LIBOR rate.
Securities Available for Sale
.
AFS securities classified as Level 1 consist of publicly-traded equity securities for which the fair values can be obtained through quoted market prices in active exchange markets. AFS securities classified as Level 2 include most
of the Company’s debt securities. The pricing on Level 2 was primarily sourced from third party pricing services, overseen by management, and is based on models that consider standard input factors such as dealer quotes, market spreads, cash flows, the U.S. Treasury yield curve, live trading levels, trade execution data, market consensus prepayment speeds, credit information and the bond’s terms and condition, among other things. The Company owns
one
privately owned equity security classified as Level 3. The security’s fair value is determined through unobservable issuer-provided financial information and a pricing model utilizing peer data.
Loans held for sale.
The Company elected the fair value option for all loans held for sale (HFS) originated for sale on or after May 1, 2012. Loans HFS are classified as Level 2 as the fair value is based on input factors such as quoted prices for similar loans in active markets.
|
|
|
|
Aggregate Fair Value
|
|||||||||
|
September 30, 2015
|
Aggregate
|
Aggregate
|
Less Aggregate
|
|||||||||
|
(In thousands)
|
Fair Value
|
Unpaid Principal
|
Unpaid Principal
|
|||||||||
|
Loans Held for Sale (1)
|
$
|
14,882
|
|
$
|
14,389
|
|
$
|
493
|
|
|||
(1) Loans held for sale excludes
$10.6 million
of loans for sale held shown on the balance sheet that are held at lower of cost or market.
|
|
|
|
Aggregate Fair Value
|
|||||||||
|
December 31, 2014
|
Aggregate
|
Aggregate
|
Less Aggregate
|
|||||||||
|
(In thousands)
|
Fair Value
|
Unpaid Principal
|
Unpaid Principal
|
|||||||||
|
Loans Held for Sale
|
$
|
19,493
|
|
$
|
18,885
|
|
$
|
608
|
|
|||
The changes in fair value of loans held for sale for the
three and nine
months ended
September 30, 2015
, were losses of
$44 thousand
and
$115 thousand
, respectively. The changes in fair value of loans held for sale for the
three and nine
months ended
September 30, 2014
, were gains of
$427 thousand
and
$467 thousand
, respectively. The changes in fair value are included in mortgage banking income in the Consolidated Statements of Income.
Derivative Assets and Liabilities.
Interest Rate Swap.
The valuation of the Company’s interest rate swaps is obtained from a third-party pricing service and is determined using a discounted cash flow analysis on the expected cash flows of each derivative. The pricing analysis is based on observable inputs for the contractual terms of the derivatives, including the period to maturity and interest rate curves.
The Company incorporates credit valuation adjustments to appropriately reflect both its own nonperformance risk and the respective counterparty’s nonperformance risk in the fair value measurements. In adjusting the fair value of its derivative contracts for the effect of nonperformance risk, the Company has considered the impact of netting and any applicable credit enhancements, such as collateral postings.
Although the Company has determined that the majority of the inputs used to value its interest rate derivatives fall within Level 2 of the fair value hierarchy, the credit valuation adjustments associated with its derivatives utilize Level 3 inputs, such as estimates of current credit spreads to evaluate the likelihood of default by itself and its counterparties. However, as of
September 30, 2015
, the Company has assessed the significance of the impact of the credit valuation adjustments on the overall valuation of its derivative positions and has determined that the credit valuation adjustments are not significant to the overall valuation of its derivatives. As a result, the Company has determined that its derivative valuations in their entirety are classified in Level 2 of the fair value hierarchy.
Interest Rate Lock Commitments.
The Company enters into IRLCs for residential mortgage loans, which commit the Company to lend funds to a potential borrower at a specific interest rate and within a specified period of time. The estimated fair value of commitments to originate residential mortgage loans for sale is based on quoted prices for similar loans in active markets. However, this value is adjusted by a factor which considers the likelihood that the loan in a lock position will ultimately close, and by the non-refundable costs of originating the loan. The closing ratio is derived from the Bank’s internal data and is adjusted using
56
significant management judgment. The costs to originate are primarily based on the Company’s internal commission rates that are not observable. As such, IRLCs are classified as Level 3 measurements.
Forward Sale Commitments
. The Company utilizes forward sale commitments as economic hedges against potential changes in the values of the IRLCs and loans originated for sale. To Be Announced (“TBA”) mortgage-backed securities forward commitment sales are used as the hedging instrument, are classified as Level 1, and consist of publicly-traded debt securities for which identical fair values can be obtained through quoted market prices in active exchange markets. The fair values of the Company’s best efforts and mandatory delivery loan sale commitments are determined similarly to the IRLCs using quoted prices in the market place that are observable. However, costs to originate and closing ratios included in the calculation are internally generated and are based
on management’s judgment and prior experience, which are considered factors that are not observable. As such, best efforts and mandatory forward commitments are classified as Level 3 measurements.
The table below presents the changes in Level 3 assets and liabilities that were measured at fair value on a recurring basis for the
three and nine
months ended
September 30, 2015
and
2014
.
|
|
Assets (Liabilities)
|
||||||||||||||
|
|
|
Securities
|
Interest Rate
|
|
|||||||||||
|
|
Trading
|
Available
|
Lock
|
Forward
|
|||||||||||
|
(In thousands)
|
Security
|
for Sale
|
Commitments
|
Commitments
|
|||||||||||
|
Three Months Ended September 30, 2015
|
|
|
|
|
|
|
|
|
|||||||
|
June 30, 2015
|
$
|
14,378
|
|
$
|
773
|
|
$
|
382
|
|
$
|
50
|
|
|||
|
Sale of AFS security
|
—
|
|
—
|
|
—
|
|
—
|
|
|||||||
|
Unrealized (loss) gain, net recognized in other non-interest income
|
351
|
|
—
|
|
1,366
|
|
—
|
|
|||||||
|
Unrealized gain included in accumulated other comprehensive loss
|
—
|
|
(9
|
)
|
—
|
|
(72
|
)
|
|||||||
|
Paydown of trading security
|
(142
|
)
|
—
|
|
—
|
|
—
|
|
|||||||
|
Transfers to held for sale loans
|
—
|
|
—
|
|
(994
|
)
|
—
|
|
|||||||
|
September 30, 2015
|
$
|
14,587
|
|
$
|
764
|
|
$
|
754
|
|
$
|
(22
|
)
|
|||
|
Nine Months Ended September 30, 2015
|
|
|
|
|
|
|
|
|
|||||||
|
December 31, 2014
|
$
|
14,909
|
|
$
|
2,326
|
|
$
|
625
|
|
$
|
(93
|
)
|
|||
|
Sale of AFS security
|
—
|
|
(1,327
|
)
|
—
|
|
—
|
|
|||||||
|
Unrealized (loss) gain, net recognized in other non-interest income
|
103
|
|
—
|
|
4,037
|
|
—
|
|
|||||||
|
Unrealized gain included in accumulated other comprehensive loss
|
—
|
|
(235
|
)
|
—
|
|
71
|
|
|||||||
|
Paydown of trading security
|
(425
|
)
|
—
|
|
—
|
|
—
|
|
|||||||
|
Transfers to held for sale loans
|
—
|
|
—
|
|
(3,908
|
)
|
—
|
|
|||||||
|
September 30, 2015
|
$
|
14,587
|
|
$
|
764
|
|
$
|
754
|
|
$
|
(22
|
)
|
|||
|
Unrealized gains (losses) relating to instruments still held at September 30, 2015
|
$
|
2,457
|
|
$
|
(6
|
)
|
$
|
754
|
|
$
|
(22
|
)
|
|||
57
|
|
Assets (Liabilities)
|
||||||||||||||
|
|
|
Securities
|
Interest Rate
|
|
|||||||||||
|
|
Trading
|
Available
|
Lock
|
Forward
|
|||||||||||
|
(In thousands)
|
Security
|
for Sale
|
Commitments
|
Commitments
|
|||||||||||
|
Three Months Ended September 30, 2014
|
|
|
|
|
|
|
|
|
|||||||
|
June 30, 2014
|
$
|
14,971
|
|
$
|
2,217
|
|
$
|
660
|
|
$
|
(163
|
)
|
|||
|
Purchase of Marketable Equity Security
|
—
|
|
—
|
|
—
|
|
—
|
|
|||||||
|
Unrealized (loss) gain, net recognized in other non-interest income
|
(91
|
)
|
—
|
|
769
|
|
240
|
|
|||||||
|
Unrealized gain included in accumulated other comprehensive loss
|
—
|
|
79
|
|
—
|
|
—
|
|
|||||||
|
Paydown of trading account security
|
(135
|
)
|
—
|
|
—
|
|
—
|
|
|||||||
|
Transfers to held for sale loans
|
—
|
|
—
|
|
(1,046
|
)
|
—
|
|
|||||||
|
September 30, 2014
|
$
|
14,745
|
|
$
|
2,296
|
|
$
|
383
|
|
$
|
77
|
|
|||
|
Nine Months Ended September 30, 2014
|
|
|
|
|
|
|
|
|
|||||||
|
December 31, 2013
|
$
|
14,840
|
|
$
|
1,964
|
|
$
|
258
|
|
$
|
19
|
|
|||
|
Purchase of Marketable Equity Security
|
—
|
|
—
|
|
—
|
|
—
|
|
|||||||
|
Unrealized (loss) gain, net recognized in other non-interest income
|
308
|
|
—
|
|
2,563
|
|
58
|
|
|||||||
|
Unrealized gain included in accumulated other comprehensive loss
|
—
|
|
332
|
|
—
|
|
—
|
|
|||||||
|
Paydown of trading account security
|
(403
|
)
|
—
|
|
—
|
|
—
|
|
|||||||
|
Transfers to held for sale loans
|
—
|
|
—
|
|
(2,438
|
)
|
—
|
|
|||||||
|
September 30, 2014
|
$
|
14,745
|
|
$
|
2,296
|
|
$
|
383
|
|
$
|
77
|
|
|||
|
Unrealized gains (losses) relating to instruments still held at September 30, 2014
|
$
|
—
|
|
$
|
(1,028
|
)
|
$
|
383
|
|
$
|
77
|
|
|||
58
Quantitative information about the significant unobservable inputs within Level 3 recurring assets and liabilities is as follows:
|
|
Fair Value
|
|
|
Significant
Unobservable Input
|
||||||||
|
(In thousands)
|
September 30, 2015
|
Valuation Techniques
|
Unobservable Inputs
|
Value
|
||||||||
|
Assets (Liabilities)
|
|
|
|
|
|
|
||||||
|
Trading Security
|
$
|
14,587
|
|
Discounted Cash Flow
|
Discount Rate
|
2.30
|
%
|
|||||
|
AFS Securities
|
764
|
|
Pricing Model
|
Median Peer Price/Tangible Book Value Percentage Multiple
|
96.87
|
%
|
||||||
|
Forward Commitments
|
(22
|
)
|
Historical Trend
|
Closing Ratio
|
89.36
|
%
|
||||||
|
|
|
|
Pricing Model
|
Origination Costs, per loan
|
$
|
2,500
|
|
|||||
|
Interest Rate Lock Commitment
|
754
|
|
Historical Trend
|
Closing Ratio
|
89.36
|
%
|
||||||
|
|
|
|
Pricing Model
|
Origination Costs, per loan
|
$
|
2,500
|
|
|||||
|
Total
|
$
|
16,083
|
|
|
|
|
|
|||||
|
|
Fair Value
|
|
|
Significant
Unobservable Input
|
||||||||
|
(In thousands)
|
December 31, 2014
|
Valuation Techniques
|
Unobservable Inputs
|
Value
|
||||||||
|
Assets (Liabilities)
|
|
|
|
|
|
|
||||||
|
Trading Security
|
$
|
14,909
|
|
Discounted Cash Flow
|
Discount Rate
|
2.60
|
%
|
|||||
|
AFS Securities
|
2,326
|
|
Discounted Cash Flow
|
Discount Rate
|
13.74
|
%
|
||||||
|
|
|
|
|
Credit Spread
|
11.06
|
%
|
||||||
|
Forward Commitments
|
(93
|
)
|
Historical Trend
|
Closing Ratio
|
91.07
|
%
|
||||||
|
|
|
|
Pricing Model
|
Origination Costs, per loan
|
$
|
2,500
|
|
|||||
|
Interest Rate Lock Commitment
|
625
|
|
Historical Trend
|
Closing Ratio
|
91.07
|
%
|
||||||
|
|
|
|
Pricing Model
|
Origination Costs, per loan
|
$
|
2,500
|
|
|||||
|
Total
|
$
|
17,767
|
|
|
|
|
|
|||||
59
Non-Recurring Fair Value Measurements
The Company is required, on a non-recurring basis, to adjust the carrying value or provide valuation allowances for certain assets using fair value measurements in accordance with GAAP. The following is a summary of applicable non-recurring fair value measurements. There are no liabilities measured at fair value on a non-recurring basis.
|
|
September 30, 2015
|
December 31, 2014
|
Three months ended September 30, 2015
|
Nine months ended September 30, 2015
|
Fair Value Measurement Date as of September 30, 2015
|
|||||||||||||
|
|
Level 3
|
Level 3
|
Total
|
Total
|
Level 3
|
|||||||||||||
|
(In thousands)
|
Inputs
|
Inputs
|
Gains (Losses)
|
Gains (Losses)
|
Inputs
|
|||||||||||||
|
Assets
|
|
|
|
|
|
|
||||||||||||
|
Impaired loans
|
$
|
21,396
|
|
$
|
5,820
|
|
$
|
14,737
|
|
$
|
15,576
|
|
September 2015
|
|||||
|
Capitalized mortgage servicing rights
|
5,028
|
|
3,757
|
|
—
|
|
—
|
|
August 2015
|
|||||||||
|
Other real estate owned
|
2,487
|
|
2,049
|
|
160
|
|
(125
|
)
|
October 2013 - August 2015
|
|||||||||
|
Total
|
$
|
28,911
|
|
$
|
11,626
|
|
$
|
14,897
|
|
$
|
15,451
|
|
||||||
Quantitative information about the significant unobservable inputs within Level 3 non-recurring assets is as follows:
|
|
Fair Value
|
|
|
|
||||||
|
(in thousands)
|
September 30, 2015
|
Valuation Techniques
|
Unobservable Inputs
|
Range (Weighted Average) (a)
|
||||||
|
Assets
|
|
|
|
|
|
|||||
|
Impaired loans
|
$
|
21,396
|
|
Fair value of collateral
|
Loss severity
|
0.17% to 39.08% (8.13%)
|
||||
|
|
|
|
|
Appraised value
|
$1.6 to $4,713.4 ($1,938.1)
|
|||||
|
Capitalized mortgage servicing rights
|
5,028
|
|
Discounted cash flow
|
Constant prepayment rate (CPR)
|
7.49% to 12.36% (10.23%)
|
|||||
|
|
|
|
|
Discount rate
|
10.00% to 15.00% (10.86%)
|
|||||
|
Other real estate owned
|
2,487
|
|
Fair value of collateral
|
Appraised value
|
$80 to $2,260.0 ($1,662.6)
|
|||||
|
Total
|
$
|
28,911
|
|
|
|
|
||||
|
(a)
|
Where dollar amounts are disclosed, the amounts represent the lowest and highest fair value of the respective assets in the population except for adjustments for market/property conditions, which represents the range of adjustments to individuals properties.
|
60
|
|
Fair Value
|
|
|
|
||||||
|
(in thousands)
|
December 31, 2014
|
Valuation Techniques
|
Unobservable Inputs
|
Range (Weighted Average) (a)
|
||||||
|
Assets
|
|
|
|
|
|
|||||
|
Impaired loans
|
$
|
5,820
|
|
Fair value of collateral
|
Loss severity
|
0.31% to 38.7% (12.65%)
|
||||
|
|
|
|
|
Appraised value
|
$5 to $1,600.0 ($912.7)
|
|||||
|
Capitalized mortgage servicing rights
|
3,757
|
|
Discounted cash flow
|
Constant prepayment rate (CPR)
|
7.83% to 19.00% (9.92%)
|
|||||
|
|
|
|
|
Discount rate
|
10.00% to 13.00% (10.43%)
|
|||||
|
Other real estate owned
|
2,049
|
|
Fair value of collateral
|
Appraised value
|
$57 to $700.0 ($462.6)
|
|||||
|
Total
|
$
|
11,626
|
|
|
|
|
||||
|
(a)
|
Where dollar amounts are disclosed, the amounts represent the lowest and highest fair value of the respective assets in the population except for adjustments for market/property conditions, which represents the range of adjustments to individuals properties.
|
There were no Level 1 or Level 2 nonrecurring fair value measurements for the periods ended
September 30, 2015
and
December 31, 2014
.
Impaired Loans.
Loans are generally not recorded at fair value on a recurring basis. Periodically, the Company records non-recurring adjustments to the carrying value of loans based on fair value measurements for partial charge-offs of the uncollectible portions of those loans. Non-recurring adjustments can also include certain impairment amounts for collateral-dependent loans calculated when establishing the allowance for credit losses. Such amounts are generally based on the fair value of the underlying collateral supporting the loan and, as a result, the carrying value of the loan less the calculated valuation amount does not necessarily represent the fair value of the loan. Real estate collateral is typically valued using appraisals or other indications of value based on recent comparable sales of similar properties or assumptions generally observable in the marketplace. However, the choice of observable data is subject to significant judgment, and there are often adjustments based on judgment in order to make observable data comparable and to consider the impact of time, the condition of properties, interest rates, and other market factors on current values. Additionally, commercial real estate appraisals frequently involve discounting of projected cash flows, which relies inherently on unobservable data. Therefore, nonrecurring fair value measurement adjustments that relate to real estate collateral have generally been classified as Level 3. Estimates of fair value for other collateral that supports commercial loans are generally based on assumptions not observable in the marketplace and therefore such valuations have been classified as Level 3.
Capitalized mortgage loan servicing rights
.
A loan servicing right asset represents the amount by which the present value of the estimated future net cash flows to be received from servicing loans exceed adequate compensation for performing the servicing. The fair value of servicing rights is estimated using a present value cash flow model. The most important assumptions used in the valuation model are the anticipated rate of the loan prepayments and discount rates. Adjustments are only recorded when the discounted cash flows derived from the valuation model are less than the carrying value of the asset. Although some assumptions in determining fair value are based on standards used by market participants, some are based on unobservable inputs and therefore are classified in Level 3 of the valuation hierarchy.
Other real estate owned (“OREO”).
OREO results from the foreclosure process on residential or commercial loans issued by the Bank. Upon assuming the real estate, the Company records the property at the fair value of the asset less the estimated sales costs. Thereafter, OREO properties are recorded at the lower of cost or fair value less the estimated sales costs. OREO fair values are primarily determined based on Level 3 data including sales comparables and appraisals.
61
Summary of Estimated Fair Values of Financial Instruments
The estimated fair values, and related carrying amounts, of the Company’s financial instruments follow. Certain financial instruments and all non-financial instruments are excluded from disclosure requirements. Accordingly, the aggregate fair value amounts presented herein may not necessarily represent the underlying fair value of the Company.
|
|
September 30, 2015
|
|||||||||||||||||||
|
|
Carrying
|
Fair
|
|
|
|
|||||||||||||||
|
(In thousands)
|
Amount
|
Value
|
Level 1
|
Level 2
|
Level 3
|
|||||||||||||||
|
Financial Assets
|
|
|
|
|
|
|
|
|
|
|
||||||||||
|
Cash and cash equivalents
|
$
|
93,571
|
|
$
|
93,571
|
|
$
|
93,571
|
|
$
|
—
|
|
$
|
—
|
|
|||||
|
Trading security
|
14,587
|
|
14,587
|
|
—
|
|
—
|
|
14,587
|
|
||||||||||
|
Securities available for sale
|
1,175,630
|
|
1,175,630
|
|
33,209
|
|
1,141,657
|
|
764
|
|
||||||||||
|
Securities held to maturity
|
133,165
|
|
136,102
|
|
—
|
|
—
|
|
136,102
|
|
||||||||||
|
FHLB bank stock and restricted securities
|
73,069
|
|
73,069
|
|
—
|
|
73,069
|
|
—
|
|
||||||||||
|
Net loans
|
5,626,750
|
|
5,686,036
|
|
—
|
|
—
|
|
5,686,036
|
|
||||||||||
|
Loans held for sale
|
25,472
|
|
25,472
|
|
—
|
|
25,472
|
|
—
|
|
||||||||||
|
Accrued interest receivable
|
20,436
|
|
20,436
|
|
—
|
|
20,436
|
|
—
|
|
||||||||||
|
Cash surrender value of bank-owned life insurance policies
|
124,278
|
|
124,278
|
|
—
|
|
124,278
|
|
—
|
|
||||||||||
|
Derivative assets
|
20,115
|
|
20,115
|
|
—
|
|
19,361
|
|
754
|
|
||||||||||
|
Assets held for sale
|
1,044
|
|
1,044
|
|
—
|
|
1,044
|
|
—
|
|
||||||||||
|
Financial Liabilities
|
|
|
|
|
|
|
|
|
|
|
||||||||||
|
Total deposits
|
$
|
5,507,329
|
|
$
|
5,509,851
|
|
$
|
—
|
|
$
|
5,509,851
|
|
$
|
—
|
|
|||||
|
Short-term debt
|
1,095,300
|
|
1,095,555
|
|
—
|
|
1,095,555
|
|
—
|
|
||||||||||
|
Long-term Federal Home Loan Bank advances
|
116,513
|
|
119,780
|
|
—
|
|
119,780
|
|
—
|
|
||||||||||
|
Subordinated borrowings
|
89,798
|
|
93,637
|
|
—
|
|
93,637
|
|
—
|
|
||||||||||
|
Derivative liabilities
|
33,196
|
|
33,196
|
|
365
|
|
32,809
|
|
22
|
|
||||||||||
62
|
|
December 31, 2014
|
|||||||||||||||||||
|
|
Carrying
|
Fair
|
|
|
|
|||||||||||||||
|
(In thousands)
|
Amount
|
Value
|
Level 1
|
Level 2
|
Level 3
|
|||||||||||||||
|
Financial Assets
|
|
|
|
|
|
|
|
|
|
|
||||||||||
|
Cash and cash equivalents
|
$
|
71,754
|
|
$
|
71,754
|
|
$
|
71,754
|
|
$
|
—
|
|
$
|
—
|
|
|||||
|
Trading security
|
14,909
|
|
14,909
|
|
—
|
|
—
|
|
14,909
|
|
||||||||||
|
Securities available for sale
|
1,091,818
|
|
1,091,818
|
|
53,806
|
|
1,035,686
|
|
2,326
|
|
||||||||||
|
Securities held to maturity
|
43,347
|
|
44,997
|
|
—
|
|
—
|
|
44,997
|
|
||||||||||
|
FHLB bank stock and restricted securities
|
55,720
|
|
55,720
|
|
—
|
|
55,720
|
|
—
|
|
||||||||||
|
Net loans
|
4,644,938
|
|
4,695,256
|
|
—
|
|
—
|
|
4,695,256
|
|
||||||||||
|
Loans held for sale
|
19,493
|
|
19,493
|
|
—
|
|
19,493
|
|
—
|
|
||||||||||
|
Accrued interest receivable
|
17,274
|
|
17,274
|
|
—
|
|
17,274
|
|
—
|
|
||||||||||
|
Cash surrender value of bank-owned life insurance policies
|
104,588
|
|
104,588
|
|
—
|
|
104,588
|
|
—
|
|
||||||||||
|
Derivative assets
|
12,953
|
|
12,953
|
|
—
|
|
12,328
|
|
625
|
|
||||||||||
|
Assets held for sale
|
1,280
|
|
1,280
|
|
—
|
|
1,280
|
|
—
|
|
||||||||||
|
Financial Liabilities
|
|
|
|
|
|
|
|
|
|
|
||||||||||
|
Total deposits
|
$
|
4,654,679
|
|
$
|
4,655,234
|
|
$
|
—
|
|
$
|
4,655,234
|
|
$
|
—
|
|
|||||
|
Short-term debt
|
900,900
|
|
900,983
|
|
—
|
|
900,983
|
|
—
|
|
||||||||||
|
Long-term Federal Home Loan Bank advances
|
61,676
|
|
63,283
|
|
—
|
|
63,283
|
|
—
|
|
||||||||||
|
Subordinated borrowings
|
89,747
|
|
93,441
|
|
—
|
|
93,441
|
|
—
|
|
||||||||||
|
Derivative liabilities
|
18,769
|
|
18,769
|
|
417
|
|
18,259
|
|
93
|
|
||||||||||
Other than as discussed above, the following methods and assumptions were used by management to estimate the fair value of significant classes of financial instruments for which it is practicable to estimate that value.
Cash and cash equivalents.
Carrying value is assumed to represent fair value for cash and cash equivalents that have original maturities of ninety days or less.
FHLB bank stock and restricted securities.
Carrying value approximates fair value based on the redemption provisions of the issuers.
Cash surrender value of life insurance policies.
Carrying value approximates fair value.
Loans, net.
The carrying value of the loans in the loan portfolio is based on the cash flows of the loans discounted over their respective loan origination rates. The origination rates are adjusted for substandard and special mention loans to factor the impact of declines in the loan’s credit standing. The fair value of the loans is estimated by discounting future cash flows using the current interest rates at which similar loans with similar terms would be made to borrowers of similar credit quality.
Accrued interest receivable.
Carrying value approximates fair value.
Deposits.
The fair value of demand, non-interest bearing checking, savings and money market deposits is determined as the amount payable on demand at the reporting date. The fair value of time deposits is estimated by discounting the estimated future cash flows using market rates offered for deposits of similar remaining maturities.
Borrowed funds.
The fair value of borrowed funds is estimated by discounting the future cash flows using market rates for similar borrowings. Such funds include all categories of debt and debentures in the table above.
Subordinated borrowings.
The Company utilizes a pricing service along with internal models to estimate the valuation of its junior subordinated debentures. The junior subordinated debentures re-price every
ninety
days.
Off-balance-sheet financial instruments.
Off-balance-sheet financial instruments include standby letters of credit and other financial guarantees and commitments considered immaterial to the Company’s financial statements.
63
Presented below is net interest income after provision for loan losses for the three months ended September 30, 2015 and 2014, respectively.
|
Three Months Ended September 30,
|
Nine Months Ended September 30,
|
|||||||||||||||
|
(In thousands)
|
2015
|
2014
|
2015
|
2014
|
||||||||||||
|
Net interest income
|
$
|
56,971
|
|
$
|
44,949
|
|
$
|
155,101
|
|
$
|
132,044
|
|
||||
|
Provision for loan losses
|
4,240
|
|
3,685
|
|
12,295
|
|
11,070
|
|
||||||||
|
Net interest income after provision for loan losses
|
$
|
52,731
|
|
$
|
41,264
|
|
$
|
142,806
|
|
$
|
120,974
|
|
||||
On October 27, 2015, the Company entered into a purchase and assumption agreement with 44 Business Capital, LLC and Parke Bank. The Company will acquire the business model of 44 Business Capital and certain other assets of Parke Bank's SBA 7(a) loan program operations. The Company will also purchase certain small business loans from Parke Bank.
The transaction is subject to receipt of required regulatory approvals and is expected to be completed during the first quarter of 2016. This merger agreement had no effect on the Company’s financial statements for the periods presented.
GENERAL
Management’s discussion and analysis of financial condition and results of operations is intended to assist in understanding the financial condition and results of operations of the Company. The following discussion and analysis should be read in conjunction with the Company’s consolidated financial statements and the notes thereto appearing in Part I, Item 1 of this document and with the Company’s consolidated financial statements and the notes thereto and Management’s Discussion and Analysis of Financial Condition and Results of Operations included in the 2014 Annual Report on Form 10-K. In the following discussion, income statement comparisons are against the same period of the previous year and balance sheet comparisons are against the previous fiscal year-end, unless otherwise noted. Operating results discussed herein are not necessarily indicative of the results for the year 2015 or any future period. In management’s discussion and analysis of financial condition and results of operations, certain reclassifications have been made to make prior periods comparable. Tax-equivalent adjustments are the result of increasing income from tax-advantaged securities by an amount equal to the taxes that would be paid if the income were fully taxable based on a 40.3% marginal income tax rate. In the discussion, references to earnings per share refer to diluted earnings per share unless otherwise specified.
Berkshire Hills Bancorp (“Berkshire” or “the Company”) is a Delaware corporation headquartered in Pittsfield, Massachusetts and the holding company for Berkshire Bank (“the Bank”) and Berkshire Insurance Group. Established in 1846, the Bank operates as a commercial bank under a Massachusetts trust company charter. Berkshire Bank operates under the brand America’s Most Exciting Bank®
Berkshire is a regional financial services company that seeks to distinguish itself over the long term based on the following attributes:
|
•
|
Strong growth from organic, de novo, product, and acquisition strategies
|
|
•
|
Solid capital, core funding, and risk management culture
|
|
•
|
Experienced executive team focused on earnings and stockholder value
|
|
•
|
Distinctive brand and culture as America’s Most Exciting Bank®
|
|
•
|
Diversified integrated financial service revenues
|
|
•
|
Positioned to be regional consolidator in attractive markets.
|
64
Shown below is a profile of the Company:
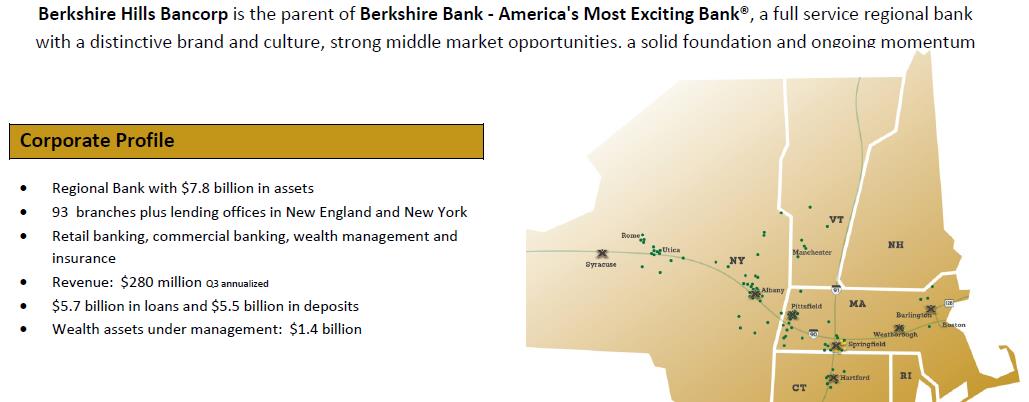
On April 17, 2015, Berkshire completed the acquisition of Springfield, MA based Hampden Bancorp, Inc. (“Hampden’). Hampden’s operations are included with Berkshire’s results as of the acquisition date. Hampden operated ten branches in the Springfield area and three of these branches were consolidated with existing Berkshire and Hampden branches in the second quarter of 2015. The Company now has 17 total branches in the Springfield area. On August 7, 2015, Berkshire Bank completed the acquisition of Firestone Financial Corp. (“Firestone”), a commercial specialty finance company providing secured installment loan equipment financing for small and medium-sized businesses. Berkshire issued approximately 4.2 million net shares as Hampden merger consideration and 1.4 million shares as Firestone merger consideration, and had a total of 30.9 million shares outstanding at September 30, 2015. The accounting for these acquisitions is discussed in Note 2 of the consolidated financial statements. On October 30, 2015, Berkshire announced an agreement to acquire assets related to the SBA lending operations of 44 Business Capital LLC; this transaction is expected to be completed in the first quarter of 2016 and is not expected to have a material impact on the Company’s financial condition when completed.
FORWARD-LOOKING STATEMENTS
Certain statements contained in this document that are not historical facts may constitute forward-looking statements within the meaning of Section 27A of the Securities Act of 1933, as amended (referred to as the Securities Act), and Section 21E of the Securities Exchange Act of 1934, as amended (referred to as the Securities Exchange Act), and are intended to be covered by the safe harbor provisions of the Private Securities Litigation Reform Act of 1995. You can identify these statements from the use of the words “may,” “will,” “should,” “could,” “would,” “plan,” “potential,” “estimate,” “project,” “believe,” “intend,” “anticipate,” “expect,” “target” and similar expressions. These forward-looking statements are subject to significant risks, assumptions and uncertainties, including among other things, changes in general economic and business conditions, increased competitive pressures, changes in the interest rate environment, legislative and regulatory change, changes in the financial markets, and other risks and uncertainties disclosed from time to time in documents that Berkshire Hills Bancorp files with the Securities and Exchange Commission, including the Annual Report on Form 10-K for the fiscal year ended December 31, 2014 and the Risk Factors in Item 1A of this report. Because of these and other uncertainties, Berkshire’s actual results, performance or achievements, or industry results, may be materially different from the results indicated by these forward-looking statements. In addition, Berkshire’s past results of operations do not necessarily indicate Berkshire’s combined future results. You should not place undue reliance on any of the forward-looking statements, which speak only as of the dates on which they were made. Berkshire is not undertaking an obligation to update forward-looking statements, even though its situation may change in the future, except as required under federal securities law. Berkshire qualifies all of its forward-looking statements by these cautionary statements.
APPLICATION OF CRITICAL ACCOUNTING POLICIES AND ACCOUNTING ESTIMATES, AND RECENT ACCOUNTING PRONOUNCEMENTS
The Company’s significant accounting policies are described in Note 1 to the consolidated financial statements in this Form 10-Q and in the most recent Form 10-K. Please see those policies in conjunction with this discussion. The accounting and reporting policies followed by the Company conform, in all material respects, to accounting principles generally accepted in the United States and to general practices within the financial services industry. The preparation of financial statements in conformity with accounting principles generally accepted in the United States requires management to make estimates and assumptions that affect
65
the amounts reported in the financial statements and accompanying notes. While the Company bases estimates on historical experience, current information and other factors deemed to be relevant, actual results could differ from those estimates.
The SEC defines “critical accounting policies” as those that require application of management’s most difficult, subjective or complex judgments, often as a result of the need to make estimates about the effect of matters that are inherently uncertain and may change in future periods. Please see those policies in conjunction with this discussion. Management believes that the following policies would be considered critical under the SEC’s definition:
Allowance for Loan Losses
. The allowance for loan losses represents probable credit losses that are inherent in the loan portfolio at the financial statement date and which may be estimated. Management uses historical information, as well as current economic data, to assess the adequacy of the allowance for loan losses as it is affected by changing economic conditions and various external factors, which may impact the portfolio in ways currently unforeseen. Although management believes that it uses appropriate available information to establish the allowance for loan losses, future additions to the allowance may be necessary if certain future events occur that cause actual results to differ from the assumptions used in making the evaluation. Conditions in the local economy and real estate values could require the Company to increase provisions for loan losses, which would negatively impact earnings.
Acquired Loans.
Loans that the Company acquired in business combinations are initially recorded at fair value with no carryover of the related allowance for credit losses. Determining the fair value of the loans involves estimating the amount and timing of principal and interest cash flows initially expected to be collected on the loans and discounting those cash flows at an appropriate market rate of interest. Going forward, the Company continues to evaluate reasonableness of expectations for the timing and the amount of cash to be collected. Subsequent decreases in expected cash flows may result in changes in the amortization or accretion of fair market value adjustments, and in some cases may result in the loan being considered impaired. For collateral dependent loans with deteriorated credit quality, the Company estimates the fair value of the underlying collateral of the loans. These values are discounted using market derived rates of return, with consideration given to the period of time and costs associated with the foreclosure and disposition of the collateral.
Income Taxes.
Significant management judgment is required in determining income tax expense and deferred tax assets and liabilities. The Company uses the asset and liability method of accounting for income taxes in which deferred tax assets and liabilities are established for the temporary differences between the financial reporting basis and the tax basis of the Company’s assets and liabilities. The realization of the net deferred tax asset generally depends upon future levels of taxable ordinary income, taxable capital gain income, and the existence of prior years’ taxable income, to which “carry back” refund claims could be made. A valuation allowance is maintained for deferred tax assets that management estimates are more likely than not to be unrealizable based on available evidence at the time the estimate is made. In determining the valuation allowance, the Company uses historical and forecasted future operating results, including a review of the eligible carry-forward periods, tax planning opportunities and other relevant considerations. In particular, income tax benefits and deferred tax assets generated from tax-advantaged commercial development projects are based on management’s assessment and interpretation of applicable tax law as it currently stands. These underlying assumptions can change from period to period. For example, tax law changes or variances in projected taxable ordinary income or taxable capital gain income could result in a change in the deferred tax asset or the valuation allowance. Should actual factors and conditions differ materially from those considered by management, the actual realization of the net deferred tax asset could differ materially from the amounts recorded in the financial statements. If the Company is not able to realize all or part of its net deferred tax asset in the future, an adjustment to the deferred tax asset in excess of the valuation allowance would be charged to income tax expense in the period such determination is made.
Goodwill and Identifiable Intangible Assets.
Goodwill and identifiable intangible assets are recorded as a result of business acquisitions and combinations. These assets are evaluated for impairment annually or whenever events or changes in circumstances indicate the carrying value of these assets may not be recoverable. When these assets are evaluated for impairment, if the carrying amount exceeds fair value, an impairment charge is recorded to income. The fair value is based on observable market prices, when practicable. Other valuation techniques may be used when market prices are unavailable, including estimated discounted cash flows and analysis of market pricing multiples. These types of analyses contain uncertainties because they require management to make assumptions and to apply judgment to estimate industry economic factors and the profitability of future business strategies. In the event of future changes in fair value, the Company may be exposed to an impairment charge that could be material.
Determination of Other-Than-Temporary Impairment of Securities.
The Company evaluates debt and equity securities within the Company’s available for sale and held to maturity portfolios for other-than-temporary impairment (“OTTI”), at least quarterly. If the fair value of a debt security is below the amortized cost basis of the security, OTTI is required to be recognized if any of the following are met: (1) the Company intends to sell the security; (2) it is “more likely than not” that the Company will be required to sell the security before recovery of its amortized cost basis; or (3) for debt securities, the present value of expected cash flows is not sufficient to recover the entire amortized cost basis. For all impaired debt securities that the Company intends to sell, or
66
more likely than not will be required to sell, the full amount of the loss is recognized as OTTI through earnings. Credit-related OTTI for all other impaired debt securities is recognized through earnings. Noncredit related OTTI for such debt securities is recognized in other comprehensive income, net of applicable taxes. In evaluating its marketable equity securities portfolios for OTTI, the Company considers its intent and ability to hold an equity security to recovery of its cost basis in addition to various other factors, including the length of time and the extent to which the fair value has been less than cost and the financial condition and near term prospects of the issuer. Any OTTI on marketable equity securities is recognized immediately through earnings. Should actual factors and conditions differ materially from those expected by management, the actual realization of gains or losses on investment securities could differ materially from the amounts recorded in the financial statements.
Fair Value of Financial Instruments.
The Company uses fair value measurements to record fair value adjustments to certain financial instruments and to determine fair value disclosures. Trading assets, securities available for sale, and derivative instruments are recorded at fair value on a recurring basis. Additionally, from time to time, the Company may be required to record at fair value other assets on a nonrecurring basis, or to establish a loss allowance or write-down based on the fair value of impaired assets. Further, the notes to financial statements include information about the extent to which fair value is used to measure assets and liabilities, the valuation methodologies used and its impact to earnings. For financial instruments not recorded at fair value, the notes to financial statements disclose the estimate of their fair value. Due to the judgments and uncertainties involved in the estimation process, the estimates could result in materially different results under different assumptions and conditions.
67
SELECTED FINANCIAL DATA
The following summary data is based in part on the consolidated financial statements and accompanying notes and other information appearing elsewhere in this or prior Form 10-Qs.
|
At or for the Three
Months Ended September 30,
|
At or for the Nine
Months Ended September 30,
|
||||||||||||||
|
|
2015
|
2014
|
2015
|
2014
|
|||||||||||
|
PER COMMON SHARE DATA
|
|
|
|
|
|
|
|
|
|||||||
|
Net earnings, diluted
|
$
|
0.49
|
|
$
|
0.48
|
|
$
|
1.20
|
|
$
|
0.90
|
|
|||
|
Adjusted earnings, diluted
(1)
|
0.54
|
|
0.46
|
|
1.55
|
|
1.32
|
|
|||||||
|
Total common book value
|
28.48
|
|
27.69
|
|
28.48
|
|
27.69
|
|
|||||||
|
Dividends
|
0.19
|
|
0.18
|
|
0.57
|
|
0.54
|
|
|||||||
|
Common stock price:
|
|
|
|
|
|
|
|
|
|||||||
|
High
|
29.81
|
|
25.11
|
|
29.81
|
|
27.28
|
|
|||||||
|
Low
|
26.68
|
|
22.37
|
|
24.27
|
|
22.06
|
|
|||||||
|
Close
|
27.54
|
|
23.49
|
|
27.54
|
|
23.49
|
|
|||||||
|
PERFORMANCE RATIOS
(2)
|
|
|
|
|
|||||||||||
|
Return on average assets
|
0.78
|
%
|
0.77
|
%
|
0.63
|
%
|
0.49
|
%
|
|||||||
|
Return on average common equity
|
6.90
|
|
6.95
|
|
5.71
|
|
4.31
|
|
|||||||
|
Net interest margin, fully taxable equivalent
|
3.37
|
|
3.20
|
|
3.29
|
|
3.27
|
|
|||||||
|
Fee income/Net interest and fee income
|
19.38
|
|
23.59
|
|
21.76
|
|
23.44
|
|
|||||||
|
ASSET QUALITY RATIOS
(3)
|
|
|
|
|
|
|
|
|
|||||||
|
Net charge-offs (period annualized)/average loans
|
0.26
|
%
|
0.28
|
%
|
0.26
|
%
|
0.30
|
%
|
|||||||
|
Allowance for loan losses/total loans
|
0.67
|
|
0.77
|
|
0.67
|
|
0.77
|
|
|||||||
|
CONDITION RATIOS
|
|
|
|
|
|
|
|
|
|||||||
|
Stockholders’ equity to total assets
|
11.30
|
%
|
10.97
|
%
|
11.30
|
%
|
10.97
|
%
|
|||||||
|
Investments to total assets
|
17.89
|
|
18.43
|
|
17.89
|
|
18.43
|
|
|||||||
|
Loans/deposits
|
103
|
|
100
|
|
103
|
|
100
|
|
|||||||
|
FINANCIAL DATA:
(In millions)
|
|
|
|
|
|
|
|
|
|||||||
|
Total assets
|
$
|
7,804
|
|
$
|
6,352
|
|
$
|
7,804
|
|
$
|
6,352
|
|
|||
|
Total earning assets
|
7,130
|
|
5,765
|
|
7,130
|
|
5,765
|
|
|||||||
|
Total loans
|
5,665
|
|
4,553
|
|
5,665
|
|
4,553
|
|
|||||||
|
Allowance for loan losses
|
38
|
|
35
|
|
38
|
|
35
|
|
|||||||
|
Total intangible assets
|
337
|
|
277
|
|
337
|
|
277
|
|
|||||||
|
Total deposits
|
5,507
|
|
4,563
|
|
5,507
|
|
4,563
|
|
|||||||
|
Total borrowings
|
1,302
|
|
1,041
|
|
1,302
|
|
1,041
|
|
|||||||
|
Total common stockholders’ equity
|
882
|
|
697
|
|
882
|
|
697
|
|
|||||||
|
FOR THE PERIOD:
(In thousands)
|
|
|
|
|
|
|
|
|
|||||||
|
Net interest income
|
$
|
56,971
|
|
$
|
44,949
|
|
$
|
155,101
|
|
$
|
132,044
|
|
|||
|
Non-interest income
|
12,698
|
|
14,641
|
|
42,040
|
|
33,570
|
|
|||||||
|
Provision for loan losses
|
4,240
|
|
3,685
|
|
12,295
|
|
11,070
|
|
|||||||
|
Non-interest expense
|
49,378
|
|
39,687
|
|
148,551
|
|
124,309
|
|
|||||||
|
Net income
|
14,701
|
|
11,988
|
|
33,504
|
|
22,347
|
|
|||||||
|
Adjusted Income (non-GAAP)
(1)
|
16,151
|
|
11,369
|
|
43,081
|
|
32,697
|
|
|||||||
(1)
Adjusted income and adjusted earnings are non-GAAP financial measures that the Company believes provide investors with information that is useful in understanding our financial performance and condition.
(2) All performance ratios are annualized and are based on average balance sheet amounts, where applicable.
(3) Generally accepted accounting principles require that loans acquired in a business combination be recorded at fair value, whereas loans from business activities are recorded at cost. The fair value of loans acquired in a business combination includes expected loan losses, and there is no loan loss allowance recorded for these loans at the time of acquisition. Accordingly, the
68
ratio of the loan loss allowance to total loans is reduced as a result of the existence of such loans, and this measure is not directly comparable to prior periods. Similarly, net loan charge-offs are normally reduced for loans acquired in a business combination since these loans are recorded net of expected loan losses. Therefore, the ratio of net loan charge-offs to average loans is reduced as a result of the existence of such loans, and this measure is not directly comparable to prior periods. Other institutions may have loans acquired in a business combination, and therefore there may be no direct comparability of these ratios between and among other institutions.
AVERAGE BALANCES AND AVERAGE YIELDS/RATES
The following table presents average balances and an analysis of average rates and yields on an annualized fully taxable equivalent basis for the periods included.
|
|
Three Months Ended September 30,
|
Nine Months Ended September 30,
|
|||||||||||||||||||
|
|
2015
|
2014
|
2015
|
2014
|
|||||||||||||||||
|
($ In millions)
|
Average
Balance
|
Yield/Rate
(FTE basis)
|
Average
Balance
|
Yield/Rate
(FTE basis)
|
Average
Balance
|
Yield/Rate
(FTE basis)
|
Average
Balance
|
Yield/Rate
(FTE basis)
|
|||||||||||||
|
Assets
|
|
|
|
|
|
|
|
|
|
|
|
|
|
|
|
|
|||||
|
Loans:
|
|
|
|
|
|
|
|
|
|
|
|
|
|
|
|
|
|||||
|
Residential mortgages
|
$
|
1,664
|
|
3.74
|
%
|
$
|
1,413
|
|
3.86
|
%
|
$
|
1,566
|
|
3.92
|
%
|
$
|
1,391
|
|
3.99
|
%
|
|
|
Commercial real estate
|
1,949
|
|
4.47
|
|
1,579
|
|
4.26
|
|
1,828
|
|
4.35
|
|
1,496
|
|
4.29
|
|
|||||
|
Commercial and industrial loans
|
999
|
|
4.79
|
|
717
|
|
3.79
|
|
897
|
|
4.04
|
|
702
|
|
3.86
|
|
|||||
|
Consumer loans
|
814
|
|
3.29
|
|
763
|
|
3.34
|
|
801
|
|
3.25
|
|
731
|
|
3.46
|
|
|||||
|
Total loans (1)
|
5,426
|
|
4.14
|
|
4,472
|
|
3.91
|
|
5,092
|
|
4.01
|
|
4,320
|
|
4.00
|
|
|||||
|
Investment securities (2)
|
1,354
|
|
2.92
|
|
1,170
|
|
2.98
|
|
1,277
|
|
3.00
|
|
1,148
|
|
3.05
|
|
|||||
|
Short term investments & loans held for sale (3)
|
52
|
|
1.34
|
|
39
|
|
1.65
|
|
60
|
|
1.29
|
|
32
|
|
1.52
|
|
|||||
|
Total interest-earning assets
|
6,832
|
|
3.87
|
|
5,681
|
|
3.70
|
|
6,429
|
|
3.77
|
|
5,500
|
|
3.78
|
|
|||||
|
Intangible assets
|
330
|
|
|
|
278
|
|
|
|
303
|
|
|
|
278
|
|
|
|
|||||
|
Other non-interest earning assets
|
379
|
|
|
|
306
|
|
|
|
346
|
|
|
|
309
|
|
|
|
|||||
|
Total assets
|
$
|
7,541
|
|
|
|
$
|
6,265
|
|
|
|
$
|
7,078
|
|
|
|
$
|
6,087
|
|
|
|
|
|
Liabilities and stockholders’ equity
|
|
|
|
|
|
|
|
|
|
|
|
|
|
|
|
|
|||||
|
Deposits:
|
|
|
|
|
|
|
|
|
|
|
|
|
|
|
|
|
|||||
|
NOW
|
$
|
475
|
|
0.14
|
%
|
$
|
418
|
|
0.17
|
%
|
$
|
453
|
|
0.15
|
%
|
$
|
418
|
|
0.15
|
%
|
|
|
Money market
|
1,474
|
|
0.42
|
|
1,405
|
|
0.37
|
|
1,440
|
|
0.40
|
|
1,448
|
|
0.37
|
|
|||||
|
Savings
|
616
|
|
0.15
|
|
480
|
|
0.14
|
|
575
|
|
0.16
|
|
475
|
|
0.15
|
|
|||||
|
Time
|
1,795
|
|
0.90
|
|
1,407
|
|
0.91
|
|
1,591
|
|
0.91
|
|
1,210
|
|
1.01
|
|
|||||
|
Total interest-bearing deposits
|
4,360
|
|
0.55
|
|
3,710
|
|
0.52
|
|
4,059
|
|
0.54
|
|
3,551
|
|
0.53
|
|
|||||
|
Borrowings and notes (4)
|
1,198
|
|
0.81
|
|
992
|
|
0.89
|
|
1,197
|
|
0.81
|
|
1,010
|
|
0.92
|
|
|||||
|
Total interest-bearing liabilities
|
5,558
|
|
0.61
|
|
4,702
|
|
0.60
|
|
5,256
|
|
0.60
|
|
4,561
|
|
0.62
|
|
|||||
|
Non-interest-bearing demand deposits
|
1,011
|
|
|
|
824
|
|
|
|
952
|
|
|
|
785
|
|
|
|
|||||
|
Other non-interest earning liabilities
|
120
|
|
|
|
49
|
|
|
|
87
|
|
|
|
50
|
|
|
|
|||||
|
Total liabilities
|
6,689
|
|
|
|
5,575
|
|
|
|
6,295
|
|
|
|
5,396
|
|
|
|
|||||
|
Total stockholders’ equity (2)
|
852
|
|
|
|
690
|
|
|
|
783
|
|
|
|
691
|
|
|
|
|||||
|
Total liabilities and stockholders’ equity
|
$
|
7,541
|
|
|
|
$
|
6,265
|
|
|
|
$
|
7,078
|
|
|
|
$
|
6,087
|
|
|
|
|
69
|
|
Three Months Ended September 30,
|
Nine Months Ended September 30,
|
|||||||||||||||||||
|
|
2015
|
2014
|
2015
|
2014
|
|||||||||||||||||
|
Average
Balance
|
Yield/Rate
(FTE basis)
|
Average
Balance
|
Yield/Rate
(FTE basis)
|
Average
Balance
|
Yield/Rate
(FTE basis)
|
Average
Balance
|
Yield/Rate
(FTE basis)
|
||||||||||||||
|
Net interest spread
|
|
|
3.26
|
%
|
|
|
3.10
|
%
|
|
|
3.17
|
%
|
|
|
3.17
|
%
|
|||||
|
Net interest margin (5)
|
|
|
3.37
|
|
|
|
3.20
|
|
|
|
3.29
|
|
|
|
3.27
|
|
|||||
|
Cost of funds
|
|
|
0.51
|
|
|
|
0.51
|
|
|
|
0.51
|
|
|
|
0.53
|
|
|||||
|
Cost of deposits
|
|
|
0.45
|
|
|
|
0.43
|
|
|
|
0.43
|
|
|
|
0.43
|
|
|||||
|
Supplementary data
|
|
|
|
|
|
|
|
|
|
|
|
|
|
|
|
|
|||||
|
Total deposits (In millions)
|
$
|
5,371
|
|
|
|
$
|
4,535
|
|
|
|
$
|
5,011
|
|
|
|
$
|
4,337
|
|
|
|
|
|
Fully taxable equivalent income adj. (In thousands)
|
1,131
|
|
|
|
859
|
|
|
|
1,029
|
|
|
|
2,429
|
|
|
|
|||||
|
(1)
|
The average balances of loans include nonaccrual loans and deferred fees and costs.
|
|
(2)
|
The average balance for securities available for sale is based on amortized cost. The average balance of equity also reflects this adjustment.
|
|
(3)
|
Interest income on loans held for sale is included in loan interest income on the income statement.
|
|
(4)
|
The average balances of borrowings includes the capital lease obligation presented under other liabilities on the consolidated balance sheet.
|
|
(5)
|
Purchased loan accretion totaled $2.7 million and $1.2 million for the three months ended September 30, 2015 and 2014,
respectively. Purchased loan accretion totaled $5.2 million and $5.0 million for the nine months ended September 30, 2015 and 2014, respectively.
|
NON-GAAP FINANCIAL MEASURES
This document contains certain non-GAAP financial measures in addition to results presented in accordance with Generally Accepted Accounting Principles (“GAAP”). These non-GAAP measures are intended to provide the reader with additional supplemental perspectives on operating results, performance trends, and financial condition. Non-GAAP financial measures are not a substitute for GAAP measures; they should be read and used in conjunction with the Company’s GAAP financial information. A reconciliation of non-GAAP financial measures to GAAP measures is provided below. In all cases, it should be understood that non-GAAP operating measures do not depict amounts that accrue directly to the benefit of shareholders. An item which management deems to be non-operating and excludes when computing non-GAAP operating earnings can be of substantial importance to the Company’s results for any particular quarter or year. The Company’s non-GAAP earnings information set forth is not necessarily comparable to non-GAAP information which may be presented by other companies. Each non-GAAP measure used by the Company in this report as supplemental financial data should be considered in conjunction with the Company’s GAAP financial information.
The Company utilizes the non-GAAP measure of adjusted earnings in evaluating operating trends, including components for operating revenue and expense. These measures exclude amounts which the Company views as unrelated to its normalized operations, including securities gains/losses, losses recorded for hedge terminations, merger costs, restructuring costs, systems conversion costs, and out-of-period adjustments. Non-operating adjustments are presented net of an adjustment for income tax expense. This adjustment is determined as the difference between the GAAP tax rate and the effective tax rate applicable to operating income.
Charges related to merger and acquisition activity consist primarily of severance/benefit related expenses, contract termination costs, and professional fees. Systems conversion costs relate primarily to the Company’s operating systems conversion and related systems conversions costs. Restructuring costs primarily consist of costs and losses associated with the consolidation of branches and other operating facilities of the Company. Out-of-period accounting adjustments for interest income on acquired loans were recorded following systems conversions and merger related accounting activity and were deemed non-operating. Non-operating expenses include variable rate compensation related to non-operating items.
70
The Company calculates adjusted earnings per share based on its measure of earnings from ongoing operations. The Company views these amounts as important to understanding its operating trends, particularly due to the impact of accounting standards related to merger and acquisition activity. Analysts also rely on these measures in estimating and evaluating the Company’s operating performance. Management also believes that the computation of non-GAAP earnings and earnings per share may facilitate the comparison of the Company to other companies in the financial services industry. The efficiency ratio is adjusted for non-core revenue and expense items and for tax preference items. The Company adjusts certain equity related measures to exclude intangible assets due to the importance of these measures to the investment community.
The following table summarizes the reconciliation of non-GAAP items recorded for the time periods and dates indicated:
RECONCILIATION OF NON-GAAP FINANCIAL MEASURES
|
|
|
At or for the Quarters Ended
|
At or for the Nine Months Ended
|
|||||||||||
|
|
|
September 30,
|
September 30,
|
September 30,
|
September 30,
|
|||||||||
|
(in thousands)
|
|
2015
|
2014
|
2015
|
2014
|
|||||||||
|
Net income (GAAP)
|
|
$
|
14,701
|
|
$
|
11,988
|
|
$
|
33,504
|
|
$
|
22,347
|
|
|
|
Adj: Gain on sale of securities, net
|
|
(49
|
)
|
(245
|
)
|
(2,467
|
)
|
(482
|
)
|
|||||
|
Adj: Loss on termination of hedges
|
|
—
|
|
—
|
|
—
|
|
8,792
|
|
|||||
|
Adj: Merger and acquisition expense
|
|
2,987
|
|
—
|
|
11,927
|
|
3,689
|
|
|||||
|
Adj: Restructuring and conversion expense
|
|
374
|
|
238
|
|
4,566
|
|
3,041
|
|
|||||
|
Adj: Out-of-period adjustment (1)
|
|
—
|
|
—
|
|
—
|
|
1,381
|
|
|||||
|
Adj: Income taxes
|
|
(1,862
|
)
|
(612
|
)
|
(4,449
|
)
|
(6,071
|
)
|
|||||
|
Total adjusted income (non-GAAP)
|
(A)
|
$
|
16,151
|
|
$
|
11,369
|
|
$
|
43,081
|
|
$
|
32,697
|
|
|
|
Total revenue (GAAP)
|
|
$
|
69,669
|
|
$
|
59,590
|
|
$
|
197,141
|
|
$
|
165,614
|
|
|
|
Adj: Gain on sale of securities, net
|
|
(49
|
)
|
(245
|
)
|
(2,467
|
)
|
(482
|
)
|
|||||
|
Adj: Loss on termination of hedges
|
|
—
|
|
—
|
|
—
|
|
8,792
|
|
|||||
|
Adj: Out-of-period adjustment (1)
|
|
—
|
|
—
|
|
—
|
|
1,381
|
|
|||||
|
Total operating revenue (non-GAAP)
|
(B)
|
$
|
69,620
|
|
$
|
59,345
|
|
$
|
194,674
|
|
$
|
175,305
|
|
|
|
Total non-interest expense (GAAP)
|
|
$
|
49,378
|
|
$
|
39,687
|
|
$
|
148,551
|
|
$
|
124,310
|
|
|
|
Less: Total non-operating expense (see above)
|
|
(3,361
|
)
|
(238
|
)
|
(16,493
|
)
|
(6,730
|
)
|
|||||
|
Operating non-interest expense (non-GAAP)
|
(C)
|
$
|
46,017
|
|
$
|
39,449
|
|
$
|
132,058
|
|
$
|
117,580
|
|
|
|
(in millions, except per share data)
|
|
|
|
|
|
|||||||||
|
Total average assets
|
(D)
|
$
|
7,541
|
|
$
|
6,265
|
|
$
|
7,078
|
|
$
|
6,087
|
|
|
|
Total average stockholders’ equity
|
(E)
|
852
|
|
690
|
|
783
|
|
691
|
|
|||||
|
Total average tangible stockholders’ equity
|
(F)
|
522
|
|
412
|
|
480
|
|
412
|
|
|||||
|
Total tangible stockholders’ equity, period-end (2)
|
(G)
|
545
|
|
420
|
|
545
|
|
420
|
|
|||||
|
Total common shares outstanding, period-end (thousands)
|
(H)
|
30,949
|
|
25,173
|
|
30,949
|
|
25,173
|
|
|||||
|
Average diluted shares outstanding (thousands)
|
(I)
|
30,069
|
|
24,861
|
|
27,847
|
|
24,835
|
|
|||||
|
Adjusted earnings per share, diluted
|
(A/I)
|
$
|
0.54
|
|
$
|
0.46
|
|
$
|
1.55
|
|
$
|
1.32
|
|
|
|
Tangible book value per share, period-end
|
(G/H)
|
$
|
17.61
|
|
$
|
16.67
|
|
$
|
17.61
|
|
$
|
16.67
|
|
|
|
Performance ratios
(3)
|
|
|
|
|
|
|
|
|||||||
|
Adjusted return on assets
|
(A/D)
|
0.86
|
%
|
0.73
|
%
|
0.81
|
%
|
0.72
|
%
|
|||||
|
Adjusted return on equity
|
(A/E)
|
7.58
|
|
6.59
|
|
7.34
|
|
6.31
|
|
|||||
|
Adjusted return on tangible equity (4)
|
(A/F)
|
12.78
|
|
11.76
|
|
12.43
|
|
11.31
|
|
|||||
|
Efficiency ratio
|
(C-L)/(B+J+M)
|
60.35
|
|
62.89
|
|
61.63
|
|
63.41
|
|
|||||
71
|
|
|
At or for the Quarters Ended
|
At or for the Nine Months Ended
|
|||||||||||
|
|
|
September 30,
|
September 30,
|
September 30,
|
September 30,
|
|||||||||
|
|
2015
|
2014
|
2015
|
2014
|
||||||||||
|
Supplementary data
(in thousands)
|
|
|
|
|
|
|
|
|||||||
|
Tax benefit - tax-advantaged commercial project investments (5)
|
(J)
|
$
|
4,029
|
|
$
|
555
|
|
$
|
12,098
|
|
$
|
1,664
|
|
|
|
Non-interest income charge - tax-advantaged commercial project investments (6)
|
(K)
|
(2,851
|
)
|
(417
|
)
|
(8,554
|
)
|
(1,251
|
)
|
|||||
|
Net income on tax-advantaged commercial project investments
|
(J+K)
|
1,178
|
|
138
|
|
3,543
|
|
413
|
|
|||||
|
Intangible amortization
|
(L)
|
887
|
|
1,236
|
|
2,722
|
|
3,816
|
|
|||||
|
Fully taxable equivalent income adjustment
|
(M)
|
1,131
|
|
859
|
|
3,088
|
|
2,429
|
|
|||||
_______________________________________
|
(1)
|
The out of period adjustment shown above relates to interest income earned on loans acquired in bank acquisitions.
|
|
(2)
|
Total tangible stockholders’ equity is computed by taking total stockholders’ equity less the intangible assets at period-end.
|
|
(3)
|
Ratios are annualized and based on average balance sheet amounts, where applicable. Quarterly data may not sum to year-to-date data due to rounding.
|
|
(4)
|
Adjusted return on tangible equity is computed by dividing the total adjusted income adjusted for the tax-affected amortization of intangible assets, assuming a 40% marginal rate, by tangible equity.
|
|
(5)
|
The tax benefit is the direct reduction to the income tax provision due to tax credits and deductions generated from investments in historic rehabilitation, low-income housing, new market projects, and renewable energy projects.
|
|
(6)
|
The non-interest income charge is the reduction to the tax-advantaged commercial project investments, which are incurred as the tax credits are generated.
|
SUMMARY
Berkshire recorded growth in adjusted earnings per share in the third quarter and first nine months of 2015 compared to 2014. Adjusted earnings per share exclude non-operating charges. Adjusted earnings per share have increased sequentially in each quarter since the first quarter of 2014. This improvement reflects growth in income from business activities together with the benefit of business combinations including the purchase of New York branches in 2014 and the acquisition of Hampden and Firestone in 2015. Improved adjusted earnings also reflect economies resulting from restructuring activities as well as positive operating leverage based on increased market and wallet share in the Company’s footprint. Profitability and efficiency metrics related to adjusted earnings in the most recent quarter were the strongest since the middle of 2013. Dividends per share increased by 6% year-over-year due to a dividend increase granted in January 2015. Total shares outstanding increased by 23% in 2015 due to the shares issued as merger consideration. GAAP earnings and earnings per share increased year-over-year for both the third quarter and year-to-date, and included the impact of non-operating charges consisting primarily of merger, acquisition, and restructuring costs.
Total assets increased by 20% to $7.8 billion during the first nine months of 2015 due to growth from acquisitions and business activities. Asset performance remained strong and capital and liquidity metrics were supported with stock issuances and deposit growth. Third quarter financial highlights included:
|
•
|
6% increase in adjusted earnings per share compared to prior quarter
|
|
•
|
14% annualized organic increase in loans
|
|
•
|
9% annualized organic increase in commercial loans
|
|
•
|
3% increase in deposits
|
|
•
|
3.37% net interest margin
|
|
•
|
60.4% efficiency ratio
|
|
•
|
0.86% adjusted ROA (0.78% GAAP ROA)
|
|
•
|
0.31% non-performing assets/assets
|
|
•
|
0.26% net loan charge-offs/average loans
|
72
In 2015, Berkshire has produced strong quarterly growth in adjusted earnings per share, including margin expansion and core profitability improvement. The Company has posted organic loan growth while maintaining its financial and risk management disciplines. Berkshire has completed the acquisitions and integrations of Hampden and Firestone and has begun to benefit from related EPS accretion. The Company has invested in developing its teams in wealth management, private banking, and small business banking. During the third quarter, a leader was recruited for the development of Berkshire’s indirect auto lending business. After quarter-end, Berkshire announced an agreement to acquire SBA lending operations. In 2015, the Company has improved its retail offerings, including introducing Apple Pay™ convenience to its customers, and its employees participated in the biggest Week of Community Service in the Company’s history. The Company has consolidated seven retail offices, or 7% of the total, in 2015. To strengthen its recognition, it enhanced its America’s Most Exciting Bank
®
branding throughout its offices. During the most recent quarter, the Company announced several executive promotions, including the promotion of Richard Marotta to President of the Bank and Sean Gray to Chief Operating Officer of the Bank.
COMPARISON OF FINANCIAL CONDITION AT SEPTEMBER 30, 2015 AND DECEMBER 31, 2014
Summary:
Total assets increased by $1.3 billion, or 20%, to $7.8 billion in the first nine months of 2015, including $688 million in assets resulting from the Hampden acquisition and $201 million in assets resulting from the Firestone acquisition. Excluding these acquisitions, organic asset growth totaled $414 million, or 6%, primarily due to loan growth from business activities. Deposits grew by $853 million, or 18%, including $484 million from the Hampden acquisition. Excluding Hampden, all other deposit growth totaled $369 million, or 8%, primarily due to increased time deposits. Berkshire issued $157 million in net common stock as merger consideration for Hampden and Firestone, which accounted for most of the $172 million increase in equity. Most other balance sheet categories also increased due to these business combinations, including goodwill which increased by $60 million. Most capital ratios improved due to the accretive benefit from the acquisitions which were mostly financed with common stock. Liquidity was supported by deposit growth. Tangible book value per share increased by 2% to $17.61 from $17.20, and total book value per share increased by 1% to $28.48 from $28.17. The acquisitions were targeted to improve future capital generation through increased profitability and earnings per share accretion.
Securities:
Total securities increased by $191 million to $1.40 billion in the first nine months of 2015, including $72 million in balances acquired from Hampden. Some of the Hampden balances were restructured to increase yield and most of the securities growth was in municipal bonds ($63 million) and mortgage-backed securities ($137 million) which consisted primarily of collateralized mortgage obligations. Investments in bank capital instruments were reduced as a result of new regulatory requirements that increased the required capital support for these investments. The Company reduced its investment in equity securities and trust preferred securities by $23 million. The Company continues to focus on loan growth as a primary operating objective; it utilizes the securities portfolio to provide additional income and to accomplish its overall balance sheet and asset liability management objectives. Longer duration municipal securities were designated as held to maturity as part of the Company’s balance sheet strategies to manage the market price risk reflected in its equity capital. The overall portfolio yield of 2.92% in the most recent quarter was down slightly from 3.00% in the fourth quarter of 2014 due to ongoing yield compression and changes in mix.
Long term interest rates dipped in the most recent quarter, with the rate on the ten year U.S. Treasury bond ending at 2.06%, compared to 2.35% at the start of the quarter and to 2.17% at the start of the year. The quarter-end bond portfolio duration decreased to 4.0 years from 4.9 years at the start of the quarter and from 4.3 years at the start of the year as expected lives of mortgage related securities shortened following the recent dip in interest rates. The improved securities prices resulting from the rate decrease resulted in a slightly higher unrealized gain on investment securities, which totaled $19 million, or 1.5% of cost, at period-end, compared to $18million or 1.6% of cost at the start of the year . There were no material changes in measures of asset quality of securities during the first nine months of 2015 and no impairments of securities recognized during this period. During the first quarter of 2015, the Company realized a $1.4 million net loss on bonds due primarily to the sale of a pooled trust preferred security which was reported with a $1.0 million unrealized loss at year-end 2014. The bond losses were offset by $1.4 million in net gains realized on the sale of equity securities. During the second quarter, the Company recognized a $2.2 million gain on its existing investment in Hampden common stock as a result of the acquisition. This stock was converted to Berkshire stock which is held as an investment security by a Bank subsidiary and is eliminated at the consolidated level.
Loans
. Berkshire generated 9% annualized total organic loan growth in the first nine months of 2015, while also integrating the acquired Hampden and Firestone portfolios. These acquisitions added $686 million in loan balances, while net organic growth totaled $299 million, including $143 million in residential mortgages and $198 million in commercial loans.
Berkshire continues to focus on strategic commercial loan growth to increase earnings, market share, and business relationships. Organic commercial loan growth, excluding loans acquired in business combinations, was 11% annualized for the year-to-date, including 14% annualized growth of commercial real estate and 5% growth of commercial and industrial loans. The Company
73
has pursued a strategy to adjust the commercial portfolio based on the acquired balances and to improve the portfolio yield in light of market pricing factors. As a result, most organic commercial growth has been in commercial real estate loans for the year-to-date in 2015. Additionally, commercial real estate demand has been strong in the Company’s markets and commercial real estate growth has also included a $35 million organic increase in construction balances due to improved economic conditions and seasonality.
As a result of its activities, the Company has increased the commercial portfolio to 54% of total loans, from 52% at the start of the year. The yield on the portfolio has increased to 4.58% in the most recent quarter from 4.20% in the prior quarter and 4.11% in the fourth quarter of 2014. Excluding the accretion on loans acquired in business combinations, the yield increased to 4.21% in the most recent quarter, compared to 3.97% in the prior quarter and 3.90% in the fourth quarter of 2014. The increase in the third quarter included the benefit of the acquired Firestone loans. These are equipment loans to small specialized businesses in a national portfolio which have higher lending spreads that reflect the additional administration that is characteristic of this business line. Berkshire has also emphasized the development of its SBA loan program and has achieved a leading position as an originator of SBA guaranteed loans in several of its regional markets. After quarter-end, Berkshire announced an agreement to acquire the lending team of 44 Business Capital, a nationally ranked SBA originator that will further contribute to the growth and diversification of Berkshire’s SBA lending business.
Organic mortgage growth from business activities was 13% annualized, with most of the growth occurring in the third quarter. Long term interest rates dipped in the first quarter of the year, spurring higher refinancing demand which was primarily targeted for sale. The market swung more toward a purchase market in the late spring and summer, due to higher rates and seasonal factors. Purchase loans include more jumbo loans which are frequently held for investment due to their limited secondary market. Third quarter growth also included mortgages purchased from area banks, and was net of seasoned loans sold. The portfolio yield decreased to 3.74% from 4.08% in the prior quarter and to 3.88% in the fourth quarter of 2014. Consumer loans decreased at a 7% organic annualized rate for the year-to-date, reflecting continued run-off of lower coupon indirect superprime auto loans based on the Company’s strategy to improve overall lending yields. In the most recent quarter, Berkshire recruited an auto lending leader with extensive northeast experience in building prime indirect auto lending relationships and a goal to build market share throughout the Company’s footprint. The third quarter consumer loan yield improved to 3.29% from 3.24% in the prior quarter and compared to 3.35% in the fourth quarter of 2014.
The Hampden loan portfolio, acquired in the second quarter, consists largely of Springfield area loans and included $130 million of residential mortgages, $281 million of commercial loans, and $82 million of consumer loans. The overall loan portfolio yield improved to 4.14% in the third quarter, compared to 4.02% in the prior quarter and to 3.96% in the fourth quarter of 2014. Excluding purchased loan accretion, the loan yield increased to 3.94% from 3.86% and 3.82% in the above periods respectively. As a result of the growth in real estate related loans in the most recent quarter, the overall duration of the loan portfolio increased modestly. At period-end, loans repricing within one year measured 32% of total loans, while loans repricing in one to five years measured 28% and loans repricing over five years measured 40%. The comparable measures at the start of the year were 37%, 24%, and 39% respectively.
Asset Quality
.
Asset quality metrics remained favorable and generally continued to improve in the first nine months of 2015. Annualized net loan charge-offs measured 0.26% of average loans during this period. Period-end non-performing assets were 0.31% of total assets, compared to 0.37% at the start of the year. These assets increased by $3.6 million from 0.27% of assets at midyear primarily due to one commercial and industrial loan that was unrelated to this year’s business combinations.
Due to accounting principles for business combinations, the acquired loans are marked to fair value at acquisition and all are recorded as accruing, despite payment status. Accordingly, charge-off and accrual measures reflect this accounting and are not fully comparable to prior periods. At September 30, 2015, the total contractual balance of purchased credit impaired loans was $45 million, with a carrying balance of $23 million, or 52% of the contractual amount. The $22 million total discount included a $7.5 million accretable balance that was expected to be recorded to income during the estimated remaining lives of these loans.
Accruing delinquent loans decreased to 0.47% of total loans from 0.52% in the first nine months of the year, and accruing loans over 90 days past due remained unchanged at 0.10%. Loans identified as troubled debt restructurings totaled $24 million at period-end including $12 million which were newly identified in the first nine months of the year related to a small number of commercial loans. Loans which became non-accruing totaled $10 million in the third quarter, which was slightly elevated from the general run rate range of $4 - 9 million experienced for a number of recent quarters.
Loan Loss Allowance
. The determination of the allowance for loan losses is a critical accounting estimate. The Company considers the allowance for loan losses appropriate to cover probable losses which can be reasonably estimated in the loan portfolio as of the balance sheet date. Under accounting standards for business combinations, acquired loans are recorded at fair value with no
74
loan loss allowance on the date of acquisition. A loan loss allowance is recorded by the Company for the emergence of new probable and estimable losses on acquired loans which were not impaired as of the acquisition date. Because of the accounting for acquired loans, some measures of the loan loss allowance are not comparable to periods prior to the acquisition date or to peer measures.
The total loan loss allowance increased by $2.5 million to $38.2 million in the first nine months of 2015, including the impact of increased loans from business activities as well as changes in commercial risk ratings. The ratio of the allowance to total loans decreased to 0.67% from 0.76% including the impact of loans acquired in business combinations. For loans from business activities, this ratio decreased to 0.78% from 0.84%. At period-end, the allowance provided 2.9X coverage of annualized third quarter net charge-offs and 176% coverage of period-end non-accrual loans.
The credit risk profile of the Company’s loan portfolio is described in the Loan Loss Allowance note in the consolidated financial statements. The Company’s risk management process focuses primary attention on loans with higher than normal risk, which includes loans rated special mention and classified (substandard and lower). These loans are referred to as criticized loans. Criticized loans were 1.9% of total assets at the nine month-end, compared to 2.0% of assets at the start of the year. The Company views its potential problem loans as those loans from business activities which are rated as classified and continue to accrue interest. These loans have a possibility of loss if weaknesses are not corrected. Classified loans acquired in business combinations are recorded at fair value and are classified as performing at the time of acquisition and therefore have not generally been viewed as potential problem loans. Potential problem loans decreased to $62 million from $67 million for the year-to-date. The Company’s evaluation of its credit risk profile also compares the amount of criticized assets to the total of the Bank’s Tier 1 Capital plus the loan loss allowance. This ratio declined to 26% from 28% during the first nine months of 2015.
Deposits.
Total deposits increased by $853 million, or 18%, for the year-to-date, including $484 million in acquired balances from Hampden. Excluding these acquired balances, total deposits increased by $369 million, or 8%. This was largely due to a $322 million increase in brokered time deposits which was used to fund organic loan growth and to replace more expensive borrowings previously used to fund the Firestone loans. Business activities resulted in 2% annualized year-to-date growth of non-maturity deposits, which was led by a 6% annualized advance in demand deposits. Checking balances are targeted by the Company as a core element of its relationship development and cross sale goals for fee based products.
The Hampden deposit portfolio consisted largely of Springfield area accounts and increased Berkshire’s estimated market share to a top four position in that market. These acquired deposits included $97 million in demand deposits, $51 million in NOW accounts, $62 million in money market accounts, $120 million in savings balances, and $154 million in time account balances. The average cost of Hampden’s deposits in the first quarter of 2015, before its acquisition, was approximately 0.57%. The average cost of Berkshire’s combined deposits increased slightly to 0.45% in the third quarter, compared to 0.44% in the fourth quarter of 2014 due to the increase in time deposits. Period-end brokered time deposits totaling $779 million had an average cost of 0.64% and an 8.5 month average maturity.
In 2015, the Company has consolidated seven branches and entered an agreement for the sale of its Tennessee branch in the second half of the year. The Company does not expect that its branch consolidations will have any material impact on its deposit balances. The Company ended its participation in the Massachusetts Depositors Insurance Fund (“DIF”) at mid-year 2014 and the one year transitional coverage of existing balances expired early in July 2015. Hampden Bank’s participation in this fund terminated with no transitional coverage as of the Hampden merger date. Normal FDIC insurance coverage remains in place for the Bank’s deposits. The Company initiated limited offerings of reciprocal money market and NOW accounts to large institutional and municipal customers. Money market and NOW accounts included $181 million of reciprocal balances at the end of the third quarter, compared to $9 million at the start of the quarter. Balances in various deposit account categories shifted in the third quarter in part due to shifts in customer holdings based on the introduction of these reciprocal accounts.
New federal regulatory liquidity coverage ratios for the largest banks became effective in 2015, with the potential of increasing competition for retail deposits and reducing competition for large corporate deposits. The Company believes that it may have competitive advantage in the event of interest rate increases due to the comparative stability of some of its more rural deposit markets. The ratio of loans/deposits was 103% at period-end, compared to 101% at the start of the year, including the impact of the Firestone acquisition.
Borrowings, Derivative Financial Instruments and Hedging Activities.
Berkshire uses borrowings as a supplement to deposits to fund asset growth. Total borrowings increased by $249 million to $1.30 billion in the first nine months of 2015, including $120 million in acquired Hampden borrowings and $159 million in acquired Firestone borrowings. The Company initially repaid the Firestone secured bank borrowings with short term FHLBB advances and then replaced some of these advances with time deposits raised in the third quarter.
75
A major portion of borrowings is managed on a short term basis under collateralized borrowing arrangements provided through the Federal Home Loan Bank of Boston and is routinely renewed in the normal course of business. Berkshire is using its expanded systems capability to upgrade its collateral support related to existing and acquired loans to facilitate expanded liquidity from the Federal Home Loan Bank. The Bank’s unused borrowing capacity with the FHLBB stood at $480 million at period-end, compared to $541 million at mid-year and to $246 million at the start of the year. The weighted average cost of borrowings was 0.81% in the third quarter of 2015, compared to 0.85% in the fourth quarter of 2014.
The notional amount of derivatives increased by $157 million to $1.19 billion during the first nine months of 2015, due primarily to a $70 million increase in commercial loan interest rate swaps matched by $70 million in back-to-back swaps with national counterparties. This increase was related to growth in lending activities and customer demand for fixed rate protection against expected future interest rate increases. The net unrealized loss on derivatives increased to $13 million from $6 million due to the decrease in interest rates and interest rate expectations near the end of the third quarter. As a result, the fair value liability for the Company’s fixed payment swaps on FHLBB borrowings increased to $11 million from $3 million. The amount of this loss has varied significantly due to the unusually high volatility of long term interest rates in recent periods reflecting uncertainty about domestic and foreign monetary policy.
Stockholders’ Equity.
Stockholders’ equity increased by $172 million in the first nine months of the year, including $115 in stock consideration issued for the Hampden acquisition and $42 million in stock consideration issued for the Firestone acquisition. Retained earnings contributed $17 million and stock compensation added another $4 million. Total shares outstanding increased by 5.8 million to 30.9 million including 4.2 million shares issued as Hampden merger consideration and 1.4 million shares issued as Firestone merger consideration.
The measure of tangible equity excludes goodwill and other intangible assets and is an alternative measure of the Company’s capital position. Due to the $60 million year-to-date increase in goodwill as a result of the acquisitions, tangible equity increased by $112 million to $545 million over this period. The ratio of tangible equity/assets increased to 7.3% from 7.0% during the first nine months of 2015. The Company generally targets to maintain this measurement within a range of 7-8% and also considers its return on tangible equity as a source of capital strength for improving its condition and supporting its growth. Both business combinations were estimated to be accretive to this measure due to the common stock which provided most of the merger consideration. The ratio of equity/assets increased to 11.3% from 10.9%. The Bank’s risk based capital ratio improved to 11.0% from 10.8%.
Period-end tangible book value per share measured $17.61 and increased by 2% from $17.20 at the start of the year, as retained earnings more than offset the acquisition related dilution. Period-end book value per share measured $28.48, which was a 1% increase over $28.17 at year-end 2014.
COMPARISON OF OPERATING RESULTS FOR THE THREE MONTHS AND NINE MONTHS ENDED SEPTEMBER 30, 2015 AND 2014
Summary.
Berkshire’s results in 2015 included the Hampden operations acquired on April 17, 2015 and the Firestone operations acquired on August 7, 2015. As a result, many measures of revenue, expense, income, and average balances increased compared to prior periods, and per share measures were affected by new shares issued for merger consideration. Results in 2014 included New York branch operations acquired on January 17, 2014.
As noted previously, Berkshire uses a non-GAAP measure of adjusted net income to supplement its evaluation of its operating results. Adjusted net income excludes certain amounts not viewed as related to ongoing operations. These non-operating items consist primarily of merger, acquisition, conversion, and restructuring expenses, together with gains recorded on securities and investments in acquired banks. Berkshire views its net merger related costs as part of the economic investment for its acquisitions.
Third quarter adjusted net income per share increased by 17% to $0.54 in 2015 from $0.46 in 2014. For the first nine months of the year, this measure increased by 17% to $1.55 from $1.32. This improvement was due to positive operating leverage driven by revenue growth from acquisitions and business activities, as well as reflecting the benefit of restructuring activities. Third quarter 2015 adjusted earnings per share increased by 6% compared to the prior quarter, demonstrating continued operating earnings momentum and including the benefit of contributions from the acquired Hampden and Firestone operations.
Third quarter GAAP net income per share was $0.49 in 2015 compared to $0.48 in 2014. For the first nine months of 2015, GAAP net income per share was $1.20 in 2015 and $0.90 in 2014. GAAP results included non-operating charges from current year acquisitions, the branch acquisition in January 2014, and restructuring charges in both years.
76
Quarterly adjusted EPS and profitability metrics have improved sequentially in all consecutive quarters since the beginning of 2014. Adjusted return on equity improved to 7.6% in the most recent quarter and adjusted return on assets improved to 0.86%. The GAAP metrics were 6.9% and 0.78% for these measures, respectively, in the most recent quarter and included the impact of net non-operating charges.
Revenue.
Total third quarter net revenue increased by $10 million, or 17%, to $70 million in 2015 compared to $60 million in 2014. This growth included contributions from acquired operations. Berkshire’s goal is to produce positive operating leverage from revenue growth as it develops revenue synergies in its expanded footprint and from integrated product sales that improve wallet share, while further developing efficiencies in its operations. Annualized third quarter 2015 net revenue measured $9.27 per share, decreasing from $9.76 per share in the prior quarter and $9.59 per share in the third quarter of 2014 due to the additional shares issued as merger consideration.
Net Interest Income.
Third quarter 2015 net interest income increased over the prior quarter by $4.3 million, or 8%, and by $12 million, or 27%, over the third quarter of 2014. This increase was primarily due to organic and acquired loan volume growth and also benefited from Berkshire’s strategies to improve the asset mix, resulting in the highest loan yield in the last five quarters. The Company’s efforts have been focused on the commercial loan portfolio, which has grown by 28% year-to-date with a 9% increase in yield. The 17% year-to-date increase in net interest income similarly reflected these efforts.
The 3.37% third quarter net interest margin was the highest in the last five quarters. The yield on earning assets increased to 3.87% from 3.70% over this period due to the increase in loan yield to 4.14% from 3.91%. The third quarter cost of funds was flat at 0.51% in 2015 compared to 2014 as a modest increase in deposit costs was offset by lower borrowings costs.
Loan interest income includes purchased loan accretion, which consists mostly of recoveries on the collection of purchased credit impaired loans. This accretion total $2.7 million in the most recent quarter, compared to $2.2 million in the prior quarter and to $1.2 million in the third quarter of 2014. The Company also evaluates its net interest margin excluding accretion which can be volatile and is expected to decline over time. The net interest margin excluding accretion rose to 3.22% in the most recent quarter, compared to 3.16% in the prior quarter and to 3.12% in the third quarter of the prior year. This further reflected the improved commercial loan yield discussed above. Measured before accretion, third quarter commercial loan yields improved year over year to 4.21% from 3.87%, bringing the total loan yield up to 3.94% from 3.87%. Improved loan yields also reflected a modest increase in the duration of the loan portfolio in recent periods.
Non-Interest Income.
Non-interest income decreased year over year in the third quarter due to changes in other non-interest income which will be discussed below. Non-interest income is primarily composed of fee income, which decreased year over year by $0.2 million, or 1%, in the third quarter and increased by $2.7 million, or 7%, for the first nine months. Fee income included the contribution of Hampden operations after the acquisition. Hampden reported fees of $0.6 million in the first quarter prior to acquisition. The nine month increase in Berkshire’s fee income was primarily due to a $2.5 million increase in loan and mortgage banking fees related to the impact of lower long term interest rates in the first half of 2015.
Berkshire is focused on increasing the contribution of fee revenues through product development and via increased market share and wallet share. The Company closely manages cross sales and referrals among business lines and is also investing in staff to improve product penetration in newer markets. Fee income sources include loan fees, mortgage banking, deposit services, wealth management, and insurance. Loan fee income includes commercial loan interest rate swap fees and gains on the sale of seasoned loans. Mortgage banking fees are from the origination and sale of residential mortgages and are recognized when held for sale applications are rate-locked. Mortgage volume and gain on sale margins increased when rates dipped in the first half of 2015 and then subsided in the most recent quarter. Deposit related fees include overdraft charges and card processing charges. Overdraft fees totaled $2.6 million and $7.1 million in the third quarter and first nine months of 2015, compared to $2.7 million and $7.6 million in the same periods of 2014. For these periods, card related income was $2.4 million and $6.5 million in 2015, compared to $2.2 million and $6.2 million in 2014. Third quarter annualized deposit fees were 0.49% of average deposits in 2015, compared to 0.57% in 2014. This reflected the impacts of the Hampden acquisition and lower overall overdraft utilization by customers.
The category of other non-interest income consists primarily of revenue recorded on bank owned life insurance, including mortality payments, together with securities capital gains distributions. This revenue, including miscellaneous income, totaled $1.7 million and $4.1 million for the third quarter and first nine months of 2015, compared to $0.8 million and $2.3 million for the same periods of the prior year. This category is stated net of charges to reduce the carrying value of tax-advantaged investments in commercial redevelopment projects. For the above periods, these charges totaled $2.8 million and $8.6 million in 2015, and $0.4 million and $1.3 million in 2014. These charges are more than offset by tax benefits, which are further discussed in the later section on income tax expense. Nine month non-interest income also included a second quarter $2.2 million gain recorded on Hampden stock and a first quarter 2014 $8.8 million in charge for the termination of hedges following the New York branch acquisition. These acquisition related amounts were viewed as non-operating by the Company and are excluded from its calculation of adjusted net income.
77
Loan Loss Provision.
The provision for loan losses increased year over year by $0.6 million in the third quarter and by $1.2 million in the first nine months of 2015 compared to 2014. The provision for loan losses is a charge to earnings in an amount sufficient to maintain the allowance for loan losses at a level deemed adequate by the Company as an estimate of the probable and estimable loan losses in the portfolio as of period-end. The level of the allowance is a critical accounting estimate and the level of the allowance was included in the discussion of financial condition. The amount of the provision exceeded net charge-offs in all periods shown, as the amount of the allowance has risen gradually based on loan portfolio growth and reflecting the ongoing improvement in loan performance and credit quality.
Non-Interest Expense.
Non-interest expense increased year over year in the third quarter and for the first nine months due primarily to non-operating merger charges as well as the addition of the Hampden and Firestone operations. The Company evaluates its operations based on its measure of operating expense net of non-operating charges as disclosed previously in the reconciliation of non-GAAP measures. Third quarter operating non-interest expense increased year-over-year by $6.6 million, or 17%. This increase included amounts invested in staff to further develop fee revenue business, including hires in wealth management, small business lending, and indirect auto lending. Quarter-end full time equivalent staff totaled 1,169 positions, including 51 positions added with Firestone in the third quarter. For the year-to-date, full time equivalent staff increased by 78 positions, or 7%, including the positions added by the Hampden operations. The positive operating leverage resulting from revenue growth and expense management resulted in an improvement in the third quarter efficiency ratio (measured on adjusted income) to 60.4% in 2015 from 62.9% in 2014. The annualized ratio of operating expense to average assets decreased to 2.44% from 2.52% for these respective periods. Ongoing operating expense has benefited from the $7.7 million in non-operating restructuring and conversion costs recorded since the beginning of 2014, including the consolidation of 11 branches over that period. Non-core charges recorded in 2015 (measured before tax) included $10.1 million for the Hampden acquisition, $1.8 million for the Firestone acquisition, and $4.6 million for branch and facilities restructuring expenses.
Income Tax Expense.
Berkshire’s increased financing of tax-advantaged commercial development projects contributed $0.12 per share towards earnings in the first nine months of 2015, compared to $0.02 in the same period of 2014. Berkshire reinvested a portion of this benefit into professionals and projects targeted towards future revenue generation. Due to its regional reach and resources, the Company has expanded its tax-advantaged investments in redevelopment projects with commercial relationship partners in its communities. This financing results in a charge to non-interest income which is more than offset by the tax benefits recorded as a reduction in income tax expense. The charge to non-interest income represents a reduction in the carrying value of the Company’s project investments; this charge was previously discussed in the Non-Interest Income section. The tax benefits include tax credits along with a tax deduction on the amount of the charge. The total tax benefit recognized for these projects was $12.1 million in the first nine months of 2015, compared to $1.7 million in the same period of the prior year.
The Company’s effective tax rate in 2014 was 26% for the year , as well as for the third quarter and first nine months. This included ongoing tax rate components described in the notes to the financial statement included in the 2014 Form 10-K. Due to the increased tax credit projects described above, the effective tax rate decreased to 8% in the third quarter and first nine months of 2015. The Company evaluates its effective tax rate on operating earnings. In the most recent quarter, this rate was 17%, including a 16% benefit from tax credit related investments.
Hampden Bancorp Acquisition.
The Hampden acquisition was completed on April 17, 2015. Hampden was a community bank headquartered in Springfield, Massachusetts and serving the Springfield area. This in-market merger was targeted to benefit all constituencies, bringing additional products and services to the Hampden customers, providing revenue synergies and cost efficiencies to the combined operations, and boosting Berkshire’s Springfield deposit share in the Springfield Metropolitan Statistical Area to the top 4 position based on most recent data. Berkshire is the largest Massachusetts based bank now serving the Springfield market. Berkshire consolidated 3 of the Hampden branches in the second quarter and now operates a total of 17 branches in that market, including 7 former Hampden offices.
The total acquisition cost was $115 million and Berkshire issued 4.2 million common shares as merger consideration, net of 169 thousand shares held by Berkshire. Merger related costs included $8.4 million in pre-tax merger related costs recorded by Hampden and $11.6 million recorded by Berkshire through September 30, 2015. The Company believes that it is on plan to achieve its cost saves goal within a year of the closing date. The Company has also consolidated three Hampden branches and recorded non-operating restructuring charges in 2015 for these consolidations. The Company estimates that Hampden’s operations in the most recent quarter contributed to improvements in its operating profitability ratios and that these operations will provide additional accretion to earnings after all cost savings are complete.
Due to the stock issued as merger consideration, the Company estimates that the Hampden acquisition improved the ratio of tangible equity/tangible assets and also contributed positively to regulatory capital ratios. The Company continues to target tangible
78
book value dilution payback within approximately 3 years from the merger date based on future merger related operating EPS accretion. The Company also continues to target double digit long run return on the equity invested in this acquisition.
Firestone Financial Acquisition.
The Firestone acquisition was completed on August 7, 2015. Based in Needham, Massachusetts, Firestone is a longstanding profitable commercial specialty finance company providing secured installment loan equipment financing for small and medium-sized businesses. Firestone lends nationally, financing fitness equipment, carnival rides and games, amusement and video entertainment, gaming, vending, laundry, and ATM machines. This acquisition provides revenue diversification to Berkshire and increased opportunities for cross sales of existing Berkshire products and services. This business is viewed as complementary to Berkshire’s existing specialized financing businesses, including asset based lending and SBA loan programs. Firestone is being operated as a subsidiary of Berkshire Bank and is maintaining its existing operations with a goal of expanding its programs based on Berkshire’s increased capital and financing capabilities.
Nine month 2015 financial results included $1.8 million in non-operating Firestone merger related charges. The merger consideration paid to shareholders was $55 million, consisting of approximately 75% stock and 25% cash and the Company issued 1.442 million shares as consideration. The Company is targeting that this acquisition will be accretive to adjusted earnings per share and profitability metrics, as well as to capital ratios. The Company’s goal is that Firestone’s operations will produce a double digit return on its equity investment and tangible book value dilution will be repaid from Firestone’s operating earnings accretion in 2.5 years.
Results of Segment and Parent Operations
. Berkshire Hills Bancorp (“the Parent”) has two subsidiary operating segments - banking and insurance. Results in the banking segment generally followed the levels and trends of consolidated results, which have been previously discussed. In the insurance segment, nine month net income increased as expense reductions exceeded the modest decrease in revenues. For the Parent, operating results primarily reflected changes in the operations of its bank subsidiary.
Total Comprehensive Income.
Total comprehensive income includes net income together with other comprehensive income. Other comprehensive income consists primarily of changes in the net fair value of available for sale securities and derivative hedges, net of related income taxes. Due to the decrease in interest rates in the first nine months of 2015, the unrealized securities gain increased but this was more than offset by an increase in the unrealized loss on derivative securities. As a result, total comprehensive income of $29 million was lower than net income which totaled $34 million. For the first nine months of 2014, interest rates also decreased and produced an unrealized securities gain but the Company also had an unrealized gain on its derivatives as a result of changes made in the structure of its swaps. As a result, total comprehensive income of $34 million exceeded net income which totaled $22 million.
Liquidity and Cash Flows.
During the first nine months of 2015, increased deposits were the primary source of funds and net loan growth was the primary use of funds. Berkshire generally plans that over the medium term, deposit growth will be the primary source of funds and loan growth will be the primary use of funds. The Bank is diversifying its deposit sources including institutional and wholesale sources as part of the expansion of its liquidity management program and to provide additional options for managing its funds costs and asset liability objectives. In select cases, the Bank provides insured brokered reciprocal deposits to large institutional accounts to supplement its deposit insurance protection in place of its previous participation in the Depositors Insurance Fund.
The Bank is also expanding its use of short term institutional borrowings and FHLBB borrowings will continue to be a significant source of liquidity for daily operations and borrowings targeted for specific asset/liability purposes. The Company also uses interest rate swaps in managing its funds sources and uses. As of September 30, 2015, the Bank had approximately $480 million in borrowing availability with the Federal Home Loan Bank. This was increased from $246 million at the start of the year due to additional collateral that was pledged to the FHLBB, together with the collateral provided through the Hampden acquisition.
Berkshire Hills Bancorp had a cash balance totaling $27 million as of September 30, 2015 which was on deposit with Berkshire Bank. The primary long run routine sources of funds for the Parent are expected to be dividends from Berkshire Bank and Berkshire Insurance Group, as well as cash from the exercise of stock options. The Bank paid $20 million in dividends to the Parent in the first nine months of 2015. The Parent has a $10 million revolving line of credit provided by a correspondent bank. The primary long run uses of funds by the Parent include the payment of cash dividends on common stock and debt service. The Parent's cash includes cash acquired from Hampden Bancorp in 2015.
Capital Resources.
Please see the “Stockholders’ Equity” section of the Comparison of Financial Condition for a discussion of stockholders’ equity together with the “Stockholders’ Equity” note to the consolidated financial statements. At September 30, 2015, the regulatory capital ratios of the Bank and the Company continued to be consistent with the requirements to be classified as “Well Capitalized.” Additional information about regulatory capital is contained in the notes to the consolidated financial
79
statements and in the 2014 Form 10-K.
Berkshire views its earnings and related internal capital generation as a primary source of capital to support dividends and growth of the franchise. Additionally, the Company generally uses the issuance of common stock as the primary source of consideration for bank acquisitions, and such acquisitions may result in net increases or decreases in its capital ratios. Berkshire’s long term objective is to generate a double digit annual return on equity, and the Company evaluates lending, investment, and acquisition decisions with this objective as a benchmark. The Company also evaluates its return on tangible equity as an indicator of its capital generation to support ongoing balance sheet growth. The Risk Management/Capital Committee of Berkshire’s Board of Directors is responsible for assisting the Board in planning for future capital needs and for ensuring compliance with regulations pertaining to capital structure and levels. The Company believes that the market for its stock is an additional capital resource over the long run and that Berkshire’s common stock is a significant resource available as merger consideration in the event of future acquisitions and business combinations. Additionally, the Company continues to monitor market conditions for other forms of regulatory capital such as preferred stock or subordinated debt, which are additional potential future capital resources to the Company and/ or the Bank. The Company has an ongoing process to enhance its internal processes for evaluating capital adequacy under various scenarios including stressed conditions. The Company issued approximately 4.2 million net shares as merger consideration for the acquisition of Hampden Bancorp on April 17, 2015. The Company issued approximately 1.4 million shares for the acquisition of Firestone Financial on August 7, 2015. Most of the Company’s capital ratios improved as a result of these acquisitions.
Off-Balance Sheet Arrangements and Contractual Obligations.
In the normal course of operations, Berkshire engages in a variety of financial transactions that, in accordance with generally accepted accounting principles are not recorded in the Company’s financial statements. These transactions involve, to varying degrees, elements of credit, interest rate, and liquidity risk. Such transactions are used primarily to manage customers’ requests for funding and take the form of loan commitments and lines of credit. Further information about the Company’s off-balance sheet arrangements is contained in the Company’s 2014 Form 10-K and information relating to payments due under contractual obligations is presented in the 2014 form 10-K. Changes in the fair value of derivative financial instruments and hedging activities are included on the balance sheet and information related to these matters is reported in the related footnote to the consolidated financial statements, and was included in management’s discussion of changes in financial condition. Aside from the completion of the Hampden Bancorp acquisition on April 17, 2015, there have been no significant changes in off-balance sheet arrangements and contractual obligations since year-end 2014. Berkshire is modifying certain Hampden off-balance sheet arrangements and contractual obligations as a result of the merger. As a result of its restructuring activities, including branch consolidations, certain facilities leases have been terminated during the first nine months of 2015. On October 30, 2015, the Company announced that Berkshire Bank has entered into an agreement to acquire various assets related to the SBA lending operations of 44 Business Capital LLC. The obligations related to this agreement are not viewed as material by the Company.
Fair Value Measurements.
The Company records fair value measurements of certain assets and liabilities, as described in the related note in the financial statements. There were no significant changes in the fair value measurement methodologies at September 30, 2015 compared to December 31, 2014. The Company compares the carrying value to fair value for major categories of financial assets and liabilities. The biggest difference relates to loans, which had an estimated fair value premium of $50 million (1.1% of loans) at period-end, compared to $50 million (1.1% of loans) at the start of the year.
There were no material changes to the way that the Company measures market risk in the first nine months of 2015. For further discussion about the Company’s Quantitative and Qualitative Aspects of Market Risk, please review Item 7A of the Report 10-K filed for the fiscal year ended December 31, 2014. Berkshire’s objective is to maintain a neutral or asset sensitive interest rate risk profile, as measured by the sensitivity of net interest income to market interest rate changes. The Company measures this sensitivity primarily by evaluating the impact of ramped and shocked interest rate changes on net interest income in the one year, two year, and three year time horizons, including parallel shifts and yield curve twists. The Company also evaluates its equity at risk from interest rate changes through discounted cash flow analysis. This measure assesses the present value changes to equity based on long term impacts of rate changes beyond the time horizons evaluated for net interest income at risk.
As of September 30, 2015, there were no significant changes in the Company’s methodologies for measuring the sensitivity of net interest income to changes in market interest rates. The Company remains modestly asset sensitive in most interest rate parallel shift scenarios. Increases in interest rates which result from a parallel shift in the yield curve generally result in higher interest income in most future periods compared to the base scenario of unchanged interest rates. Interest income is positively affected up to 5% in the third year compared to this base scenario depending on the timing and magnitude of the interest rate increase. This
80
reflects the repricing of assets in an upward rate environment, together with the benefit of the fixed payment swaps. The Company’s position tends to be initially asset sensitive as prime and LIBOR indexed loans are expected to react quickly to rate changes while modeled deposit rate changes are expected to react less quickly. If interest rates remain unchanged or if the yield curve flattens due to higher short term rates, the Company’s net interest income could be negatively impacted in the initial effective period of the swaps due to the contracted fixed payments, together with the ongoing effects of asset yield compression which have pressured industry margins in recent years. Through its pricing disciplines and mix of business, Berkshire’s goal is to manage its balance sheet to support the net interest margin in the event that interest rates do not rise as anticipated by management during the effective period of the swaps.
In addition to modeling market risk in relation to net interest income, the Company also models net income at risk in various interest rate scenarios. Various sources of fee income, including interest rate swap income and mortgage banking revenue, are sensitive to interest rates. Other components of revenue and expense are also considered and net income estimates include the impact of income taxes on modeled changes. Management considers the risks to net income in evaluating its overall asset liability management and strategies.
The Company also estimates the sensitivity of the economic value of its equity to interest rate shocks. The Company seeks to avoid having excess long term earnings at risk when interest rates rise in the future, as anticipated. At September 30, 2015, the Company estimated that the economic value of equity, including estimates related to Hampden, would decrease by approximately 11% in the event of a 200 basis point upward interest rate shock, which was within the Company’s policy limits. This reflected the impact of fixed rate assets on medium and long term modeled net interest income if interest rates increase. This estimate is subject to numerous assumptions and uncertainties and is not intended as a projection of future operating results. The sensitivity of equity at risk in the modeled scenario increased modestly from 9% at year-end 2014. Equity at risk is not expected to be materially impacted by the Firestone acquisition.
In a prolonged low rate environment, Berkshire has a number of business strategies to support its net interest income and margin objectives. These include changes in volumes and mix of interest bearing assets and liabilities, some of which are discussed above. The Company also evaluates its pricing strategies on an ongoing basis, and considers its investment, borrowings, and derivatives strategies in managing its income and risk profile. Due to the limitations and uncertainties relating to model assumptions, the modeled computations should not be relied on as projections of income. Further, the computations do not reflect any actions that management may undertake in response to changes in interest rates.
a) Disclosure controls and procedures.
The principal executive officers, including the principal financial officer, based on their evaluation of disclosure controls and procedures (as defined in Exchange Act Rules 13a-15(e) and 15d-15(e)) as of the end of the period covered by this Quarterly Report on Form 10-Q, have concluded that the Company’s disclosure controls and procedures were effective.
b) Changes in internal control over financial reporting.
There were no changes in the Company’s internal control over financial reporting that occurred during the last fiscal quarter that have materially affected, or are reasonably likely to materially affect, the Company’s internal control over financial reporting.
81
As of September 30, 2015, neither the Company nor the Bank was involved in any pending legal proceedings believed by management to be material to the Company’s financial condition or results of operations. Periodically, there have been various claims and lawsuits involving the Bank, such as claims to enforce liens, condemnation proceedings on properties in which the Bank holds security interests, claims involving the making and servicing of real property loans and other issues incident to the Bank’s business. However, neither the Company nor the Bank is a party to any pending legal proceedings that it believes, in the aggregate, would have a material adverse effect on the financial condition or operations of the Company.
In addition to the other information set forth in this report, you should carefully consider the factors discussed in Part I, “Item 1A. Risk Factors” in our Annual Report on Form 10-K for the year ended December 31, 2014, which could materially affect our business, financial condition or future results. The risks described in this form are not the only risks that we face. Additional risks and uncertainties not currently known to us or that we currently deem to be immaterial also may materially adversely affect our business, financial condition and/or operating results. As a result of the closing of the Hampden Bancorp acquisition on April 17, 2015, the risks related to the failure to complete that acquisition are no longer relevant. The risks related to the acquisition of Firestone Financial were described in the registration statement filed pursuant to Rule 424(b) by Berkshire on July 2, 2015. The risks related to the failure to complete that acquisition are no longer relevant. The off balance sheet contractual obligations related to the Company’s pending asset acquisition related to 44 Business Capital are not viewed as material and the related risk factors are not viewed as material. There have been no other material changes in the Company’s Risk Factors during the first nine months of 2015.
(a)
No Company unregistered securities were sold during the quarter ended September 30, 2015.
(b)
Not applicable.
(c)
The following table provides certain information with regard to shares repurchased by the Company in the second quarter of 2015.
|
Total number of
|
Average price
|
Total number of shares
purchased as part of
publicly announced
|
Maximum number of
shares that may yet
be purchased under
|
||||||||||
|
Period
|
shares purchased
|
paid per share
|
plans or programs
|
the plans or programs
|
|||||||||
|
July 1-31, 2015
|
—
|
|
$
|
—
|
|
—
|
|
18,113
|
|
||||
|
August 1-31, 2015
|
—
|
|
—
|
|
—
|
|
18,113
|
|
|||||
|
September 1-30, 2015
|
—
|
|
—
|
|
—
|
|
18,113
|
|
|||||
|
Total
|
—
|
|
$
|
—
|
|
—
|
|
18,113
|
|
||||
On March 26, 2013, the Company announced that its Board of Directors authorized a new stock repurchase program, pursuant to which the Company may repurchase up to 500,000 shares of the Company’s common stock, which represents approximately 2.0% of the Company’s issued and outstanding shares. The timing of the purchases will depend on certain factors, including but not limited to, market conditions and prices, available funds, and alternative uses of capital. The stock repurchase program may be carried out through open-market purchases, block trades, negotiated private transactions and pursuant to a trading plan adopted in accordance with Rule 10b5-1 under the Securities Exchange Act of 1934. Any repurchased shares will be recorded as treasury shares. The program will continue until it is completed or terminated by the Board of Directors. The Company has no intentions to terminate this program or to cease any future potential purchases.
None.
Not applicable.
None.
82
|
2.1
|
|
Agreement and Plan of Merger, dated as of November 3, 2014, by and between Berkshire Hills Bancorp, Inc. and Hampden Bancorp, Inc. (1)
|
|
2.2
|
Agreement and Plan of Merger, dated as of May 21, 2015, by and among Firestone Financial Corp., Berkshire Hills Bancorp, Inc., Berkshire Bank, Jacob Acquisition LLC, and David S. Cohen, solely in his capacity as the representative of the Firestone security holders (15)
|
|
|
3.1
|
|
Certificate of Incorporation of Berkshire Hills Bancorp, Inc. (2)
|
|
3.2
|
|
Amended and Restated Bylaws of Berkshire Hills Bancorp, Inc.(3)
|
|
4.1
|
|
Form of Common Stock Certificate of Berkshire Hills Bancorp, Inc. (2)
|
|
4.2
|
|
Note Subscription Agreement by and among Berkshire Hills Bancorp, Inc. and certain subscribers dated September 20, 2012 (4)
|
|
10.1
|
|
Amended and Restated Employment Agreement by and among Berkshire Bank, Berkshire Hills Bancorp, Inc. and Michael P. Daly (5)
|
|
10.2
|
|
Amended and Restated Supplemental Executive Retirement Agreement between Berkshire Bank and Michael P. Daly (6)
|
|
10.3
|
|
Three Year Executive Change in Control Agreement by and among Berkshire Bank, Berkshire Hills Bancorp, Inc. and George F. Bacigalupo (7)
|
|
10.4
|
|
Three-Year Executive Change in Control Agreement by and among Berkshire Bank, Berkshire Hills Bancorp, Inc. and Josephine Iannelli (7)
|
|
10.5
|
|
Amended and Restated Three Year Change in Control Agreement by and among Berkshire Bank, Berkshire Hills Bancorp, Inc. and Richard M. Marotta (8)
|
|
10.6
|
|
Amended and Restated Three Year Change in Control Agreement by and among Berkshire Bank, Berkshire Hills Bancorp, Inc. and Sean A. Gray (9)
|
|
10.7
|
|
Form of Split Dollar Agreement entered into with Michael P. Daly, Sean A. Gray, and Richard M. Marotta (10)
|
|
10.8
|
|
Berkshire Hills Bancorp, Inc. 2011 Equity Incentive Plan (11)
|
|
10.9
|
|
Berkshire Hills Bancorp, Inc. 2013 Equity Incentive Plan (12)
|
|
10.10
|
|
Legacy Bancorp, Inc. Amended and Restated 2006 Equity Incentive Plan (13)
|
|
10.11
|
|
Berkshire Bank 2014 Executive Short Term Incentive Plan (14)
|
|
10.12
|
|
Form of Amended and Restated Director Retirement Agreement between Berkshire Bank (as successor to Hampden Bank) and Richard Suski
|
|
11.0
|
|
Statement re: Computation of Per Share Earnings is incorporated herein by reference to Part II, Item 8, “Financial Statements and Supplementary Data”
|
|
31.1
|
|
Certification of Chief Executive Officer pursuant to Section 302 of the Sarbanes-Oxley Act of 2002
|
|
31.2
|
|
Certification of Chief Financial Officer pursuant to Section 302 of the Sarbanes-Oxley Act of 2002
|
|
32.1
|
|
Certification of Chief Executive Officer pursuant to Section 906 of the Sarbanes-Oxley Act of 2002
|
|
32.2
|
|
Certification of Chief Financial Officer pursuant to Section 906 of the Sarbanes-Oxley Act of 2002
|
|
101
|
|
Interactive data files pursuant to Rule 405 of Regulation S-T: (i) the Consolidated Statements of Condition, (ii) the Consolidated Statements of Income, (iii) the Consolidated Statements of Comprehensive Income, (iv) the Consolidated Statements of Changes in Stockholders’ Equity, (v) the Consolidated Statements of Cash Flows, and (vi) the Notes to Consolidated Financial Statements tagged as blocks of text and in detail.
|
_______________________________________
|
(1)
|
Incorporated by reference from the Exhibits to the Form 8-K filed on November 4, 2014.
|
|
(2)
|
Incorporated herein by reference from the Exhibits to Form S-1, Registration Statement and amendments thereto, initially filed on March 10, 2000, Registration No. 333-32146.
|
|
(3)
|
Incorporated herein by reference from the Exhibits to the Form 8-K as filed on April 28, 2015.
|
|
(4)
|
Incorporated by reference from the Exhibits to the Form 8-K as filed on September 26, 2012.
|
|
(5)
|
Incorporated herein by reference from the Exhibits to the Form 8-K as filed on January 6, 2009.
|
|
(6)
|
Incorporated herein by reference from the Exhibits to Form 10-K as filed on March 16, 2009.
|
|
(7)
|
Incorporated herein by reference from the Exhibits to the Form 10-K as filed on March 17, 2014.
|
|
(8)
|
Incorporated herein by reference from the Exhibits to the Form 10-K as filed on March 16, 2010.
|
|
(9)
|
Incorporated herein by reference from the Exhibits to the Form 10-K as filed on March 16, 2011.
|
(10) Incorporated herein by reference from the Exhibit to the Form 8-K as filed on January 19, 2011.
(11) Incorporated herein by reference from the Appendix to the Proxy Statement as filed on March 24, 2011.
(12) Incorporated herein by reference from the Appendix to the Proxy Statement as filed on April 2, 2013.
83
(13) Incorporated herein by reference from the Exhibits to the Form 8-K filed by Legacy Bancorp, Inc. on December 22, 2010.
(14) Incorporated herein by reference from Exhibits to the Form 10-K as filed on March 16, 2015.
(15) Incorporated herein by reference from Exhibits to the Form 8-K as filed on May 22, 2015.
84
SIGNATURES
Pursuant to the requirements of the Securities Exchange Act of 1934, the registrant has duly caused this report to be signed on its behalf by the undersigned thereunto duly authorized.
|
|
BERKSHIRE HILLS BANCORP, INC.
|
|
|
|
|
|
|
|
|
|
|
Dated: November 9, 2015
|
By:
|
/s/ Michael P. Daly
|
|
|
Michael P. Daly
|
|
|
|
Chief Executive Officer
|
|
|
|
|
|
|
|
|
|
|
Dated: November 9, 2015
|
By:
|
/s/ Josephine Iannelli
|
|
|
Josephine Iannelli
|
|
|
|
Senior Executive Vice President, Chief Financial Officer
|
|
85
TABLE OF CONTENTS
Part IItem 1. Consolidated Financial Statements (unaudited)Note 1. Basis Of PresentationNote 2. AcquisitionNote 3. Trading SecurityNote 4. Securities Available For Sale and Held To MaturityNote 5. LoansNote 6. Loan Loss AllowanceNote 7. DepositsNote 8. Borrowed FundsNote 9. Stockholders EquityNote 10. Earnings Per ShareNote 11. Stock-based Compensation PlansNote 12. Operating SegmentsNote 13. Derivative Financial Instruments and Hedging ActivitiesNote 14. Fair Value MeasurementsNote 15. Net Interest Income After Provision For Loan LossesNote 16. Subsequent EventsItem 2. Management S Discussion and Analysis Of Financial Condition and Results Of OperationsItem 3. Quantitative and Qualitative Disclosures About Market RiskItem 4. Controls and ProceduresPart IIItem 1. Legal ProceedingsItem 1A. Risk FactorsItem 2. Unregistered Sales Of Equity Securities and Use Of ProceedsItem 3. Defaults Upon Senior SecuritiesItem 4. Mine Safety DisclosuresItem 5. Other InformationItem 6. Exhibits